Embed Size (px)
Citation preview
Sensors 2015, 15, 11312-11362; doi:10.3390/s150511312
sensors ISSN 1424-8220
www.mdpi.com/journal/sensors
Review
The Elderly’s Independent Living in Smart Homes: A Characterization of Activities and Sensing Infrastructure Survey to Facilitate Services Development
Qin Ni *, Ana Belén García Hernando † and Iván Pau de la Cruz †
Departamento de Ingeniería Telemática y Electrónica, Universidad Politécnica de Madrid,
Carretera de Valencia km. 7, Madrid 28031, Spain; E-Mails: [email protected] (A.B.G.H);
[email protected] (I.P.C.)
† These authors contributed equally to this work.
* Author to whom correspondence should be addressed; E-Mail: [email protected];
Tel.: +34-63-414-9296.
Academic Editor: Panicos Kyriacou
Received: 2 March 2015 / Accepted: 8 May 2015 / Published: 14 May 2015
Abstract: Human activity detection within smart homes is one of the basis of unobtrusive
wellness monitoring of a rapidly aging population in developed countries. Most works in
this area use the concept of “activity” as the building block with which to construct
applications such as healthcare monitoring or ambient assisted living. The process of
identifying a specific activity encompasses the selection of the appropriate set of sensors, the
correct preprocessing of their provided raw data and the learning/reasoning using this
information. If the selection of the sensors and the data processing methods are wrongly
performed, the whole activity detection process may fail, leading to the consequent failure
of the whole application. Related to this, the main contributions of this review are the
following: first, we propose a classification of the main activities considered in smart home
scenarios which are targeted to older people’s independent living, as well as their
characterization and formalized context representation; second, we perform a classification of
sensors and data processing methods that are suitable for the detection of the aforementioned
activities. Our aim is to help researchers and developers in these lower-level technical aspects
that are nevertheless fundamental for the success of the complete application.
OPEN ACCESS
Sensors 2015, 15 11313
Keywords: activity monitoring; activity characterization; sensors; data processing; smart
home; independent living; e-health services development
1. Introduction
Recent advances in sensing, networking and ambient intelligence technologies have resulted in a rapid
emergence of smart environments. Among these, the so-called Smart Home (SH) has gained a lot of
attention for the provision of enhanced quality of life within the home. The smart home concept was
formalized by Lutolf [1], who primarily focused on the integration of different services within a home
environment by using a common communication system. More recently, Satpathy [2] proposed a smart
home concept more centered on helping the residents live independently and comfortably with the help
of mechanical and digital devices. This definition is closer to our current understanding of SHs.
One of the motivations for smart home research is the significant worldwide increase of an aging
population. In fact, according to the World Health Organization (WHO), the world’s elderly population
(defined as people aged 60 and older) has increased drastically in the past decades and will reach about
2 billion in 2050 [3]. In Europe, the proportion of the EU27 elderly population above 65 years of age is
foreseen to rise to 30% in 2060 [4].
The elderly have specific health issues that have to be considered. A significant proportion of elderly
population suffer or may suffer with higher probability from age-related conditions such as Parkinson’s
disease, diabetes, cardiovascular disease, Alzheimer’s disease, different chronic diseases and limitations
in physical functions. For them, SH technologies may help to enhance quality of life, prolong
independent living and reduce caregivers’ necessary time and healthcare costs in general, without losing
the safety that a continuous and unobtrusive monitoring provides. Thus the benefits of these technologies
are not only for the older adults, but also their families, caregivers and society in general. This is what
is sometimes known as Ambient Assisted Living (AAL).
Research objectives in this area range from low-level data acquisition by sensors up to high-level data
integration and inference of knowledge through both data-driven and knowledge-driven approaches.
Many recent works are related to activity recognition as a means of extracting higher-level information.
There are different types of activities, but the common ground to all of them is that they should be
recognizable as such by a non-technician (e.g., “preparing a meal”, “taking a bath” or “watch television
while sitting on the sofa”). If human activities are correctly and automatically identified, a wide range
of applications and services become possible, such as detection of health emergencies, early disease
detection, professional advice on routine lifestyle, health status monitoring and help in treatment
prescription. Some concrete examples of applications can be found in [5] (a mobile emergency response
system), [6] (a fall detection system) and [7] (which deals with monitoring activities of daily life and
recommending services for active lifestyle).
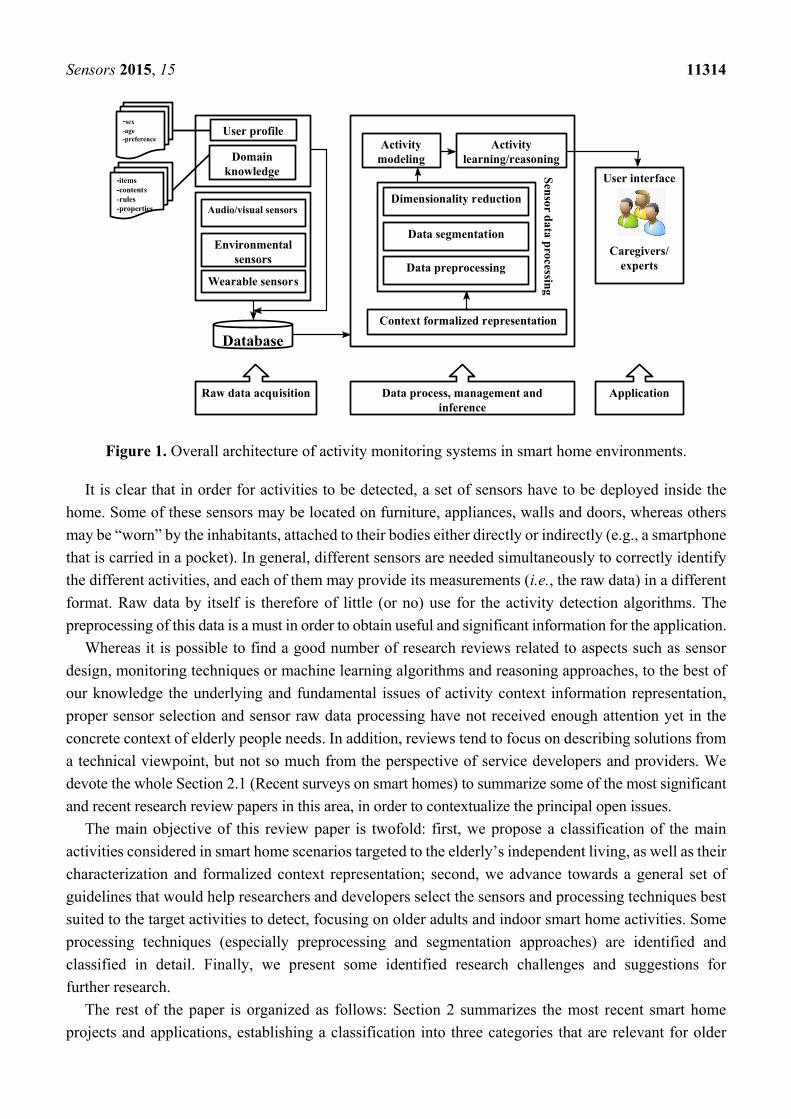
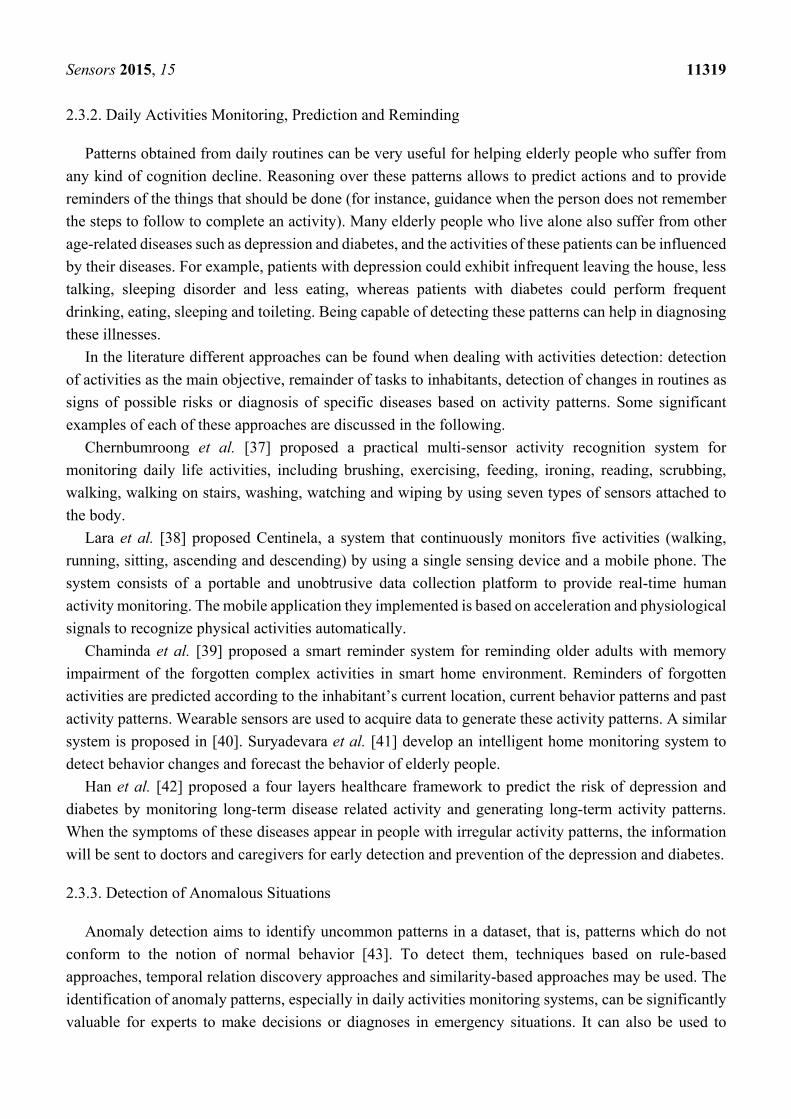
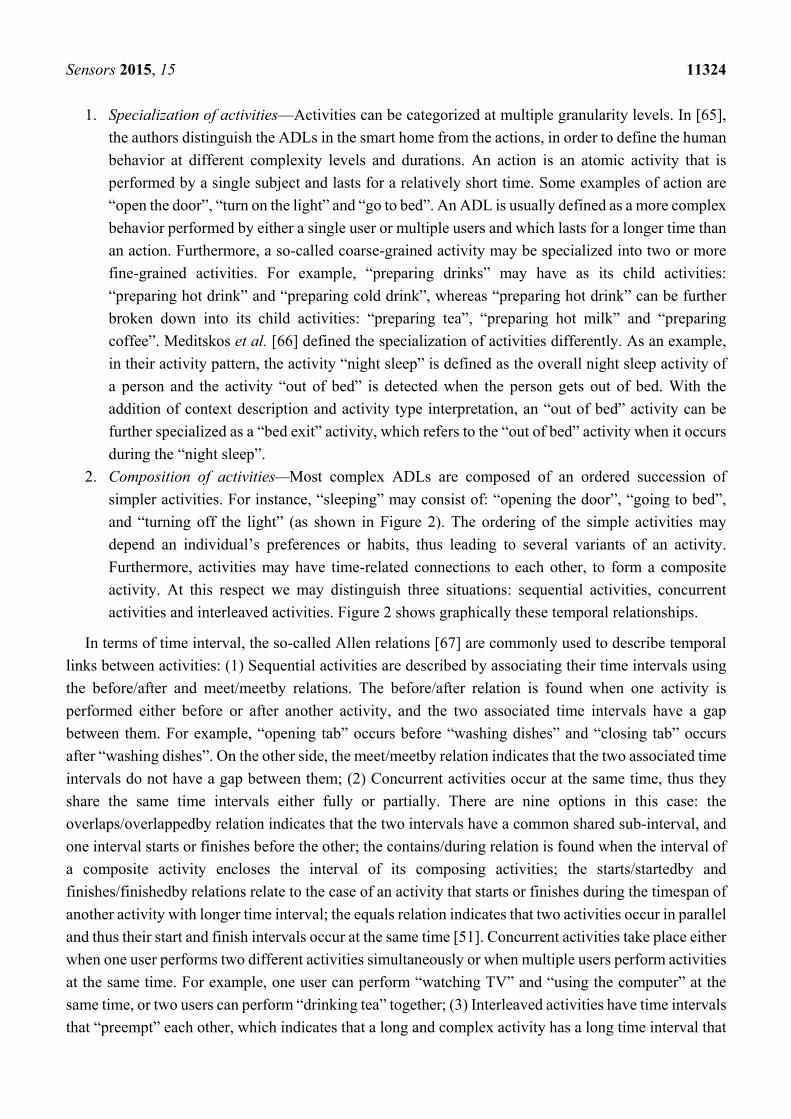
Figure 1 shows the general structure of activity-based AAL systems. Three stages are identified:
raw-data acquisition, sensor data processing to obtain context information and learning/reasoning
methods to identify activities and provide caregivers and experts with useful and significant information.
Sensors 2015, 15 11314
Figure 1. Overall architecture of activity monitoring systems in smart home environments.
It is clear that in order for activities to be detected, a set of sensors have to be deployed inside the
home. Some of these sensors may be located on furniture, appliances, walls and doors, whereas others
may be “worn” by the inhabitants, attached to their bodies either directly or indirectly (e.g., a smartphone
that is carried in a pocket). In general, different sensors are needed simultaneously to correctly identify
the different activities, and each of them may provide its measurements (i.e., the raw data) in a different
format. Raw data by itself is therefore of little (or no) use for the activity detection algorithms. The
preprocessing of this data is a must in order to obtain useful and significant information for the application.
Whereas it is possible to find a good number of research reviews related to aspects such as sensor
design, monitoring techniques or machine learning algorithms and reasoning approaches, to the best of
our knowledge the underlying and fundamental issues of activity context information representation,
proper sensor selection and sensor raw data processing have not received enough attention yet in the
concrete context of elderly people needs. In addition, reviews tend to focus on describing solutions from
a technical viewpoint, but not so much from the perspective of service developers and providers. We
devote the whole Section 2.1 (Recent surveys on smart homes) to summarize some of the most significant
and recent research review papers in this area, in order to contextualize the principal open issues.
The main objective of this review paper is twofold: first, we propose a classification of the main
activities considered in smart home scenarios targeted to the elderly’s independent living, as well as their
characterization and formalized context representation; second, we advance towards a general set of
guidelines that would help researchers and developers select the sensors and processing techniques best
suited to the target activities to detect, focusing on older adults and indoor smart home activities. Some
processing techniques (especially preprocessing and segmentation approaches) are identified and
classified in detail. Finally, we present some identified research challenges and suggestions for
further research.
The rest of the paper is organized as follows: Section 2 summarizes the most recent smart home
projects and applications, establishing a classification into three categories that are relevant for older
User interface
Caregivers/ experts
User profile
Domain knowledge
Database
-sex-age-preference
-items-contents-rules-properties
Context formalized representation
Activity modeling
Activity learning/reasoning
Dimensionality reduction
Data segmentation
Data preprocessing
Audio/visual sensors
Environmental sensors
Wearable sensors
Raw data acquisition Data process, management and inference
Application
Sen
sor data p
rocessing
Sensors 2015, 15 11315
adults’ independent living. Also in this context, a classification of the main activities considered in smart
home scenarios and their characterization and formalized context representation is proposed in Section 3.
A review of the different types of sensors used to monitor these activities as well as their main utility
and limitations is provided in Section 4. Section 5 is devoted to sensor data processing techniques,
together with their applicability to different scenarios related to the elderly’s independent living, whereas
Section 6 contains the description of some identified research challenges and possible future directions
in this area. Finally, we conclude this review in Section 7.
2. Smart Home Projects and Applications
The numerous research advancements achieved in the SH area have improved access to healthcare
services for the elderly. Various projects and applications have been developed throughout the world to
prolong independent living for this population segment. In this section, we review the most recent
surveys on SH, as well as the projects and applications tailored to the elderly’s specific requirements.
Even if this paper is not intended to dive deep into the complex matter of human factors, we cannot
ignore the fact that these are increasingly gaining importance in any information and communication
technologies (ICT) system. This is why we will conclude Section 2 with a brief summary on the
importance that human factors have for the success and acceptability of any SH deployment.
2.1. Recent Surveys on Smart Homes
A recent survey on smart homes, written by Alam et al. [8], gives a general overview of past
developments, present situations and future challenges. It reviews the smart home projects according to
their research objectives and three desired services: comfort, healthcare and security, and also describes
information about sensors, multimedia devices, communication protocols, and algorithms used for these
desired services. Another survey on ambient assisted living technologies for older adults is conducted
by Rashidi and Mihailidis [9], who summarized AAL technologies and tools in terms of smart homes,
assistive robotics, e-textile and wearable sensors, also exploring healthcare applications that focus on
activity recognition algorithms and context modelling.
Salih et al. [10] presented a review on ambient intelligence assisted healthcare monitoring,
summarizing wireless sensor networks technologies, communication technologies and applications.
Their research mainly focuses on ambient intelligence methods and data mining techniques used in
wearable and ambient sensor monitoring within smart home for older adults and patients with
chronic diseases.
Peetoom et al. [11] conducted a systematic investigation on current literature on monitoring
technologies to detect activities of daily life or significant events (e.g., falls and changes in health status)
for elderly people in-home. Their research identifies five main types of monitoring technologies: PIR
motion sensors, body-worn sensors, pressure sensors, video monitoring and sound recognition.
Additionally, the functionalities and outcomes of applying these technologies to prolong independent
living of elderly people are demonstrated. The results of their studies suggest positive effects, both to
residents and caregivers, of using monitoring technologies.
Khusainov et al. [12] presented a study on automated methods for real-time human wellness
monitoring and various algorithmic techniques on sensor data analysis to devise effective means of
Sensors 2015, 15 11316
addressing the demands of assisted living and clinical observation. Their survey reviews three areas of
sensor-based monitoring systems: sensor types, frameworks and applications; data collection, processing
and analysis; and research gaps, limitations and challenges.
Our review differs from the above in two significant aspects: firstly, we focus on activities and
applications useful for the elderly inside a SH, which guides the application taxonomy we use, and
furthermore, we propose a formalization of the description of the activities including properties and
context representation. Secondly, although our review does not include aspects such as hardware and
communications, it contains a deeper discussion and classification on signal processing techniques
(especially preprocessing and segmentation approaches).
Avci et al. [13] presented a survey about activity recognition for healthcare, wellbeing and sports
applications by using inertial sensors. This work is arranged according to the main steps involved in the
activity recognition process and the main techniques utilized in each of those. However, this survey only
deals with inertial sensors. Bulling et al. [14] give a comprehensive introduction on human activity
recognition, but similarly, they focus on a specific type of sensors (in this case body-worn inertial sensors).
2.2. Smart Home Projects
In this section, we conduct an investigation on the most significant smart home projects that aim at
enhancing assisted living for older people in the recent past. These SH projects fully simulate the smart
home environment including the deployment of a wide range of sensors. A chronological order is chosen
for this presentation, in order to give a clearer picture on how the expectations and research issues related
to SH have evolved with time. In the earliest projects presented, the main issues discussed were related
to physical and logical connectivity of devices. This kind of projects evolved to multidisciplinary
approaches very focused on improving the usability of the interaction of devices with the inhabitants.
This form of interaction demanded technologies with a high grade of abstraction such as those related to
Artificial Intelligence which, in turn, has fostered the evolution to more natural and personalized
interaction approaches. In addition, these technologies introduced the capacity of managing uncertainty,
a common issue in smart home solutions. In recent years the projects have no longer been focused on
the Smart Home as a final objective but rather as an enabling technology to achieve other purposes such
as independent living for seniors.
A summary on the widely reusable datasets collected by the different smart home projects is also
presented to make choosing between them easier for researchers.
GatorTech [15] is an early smart home project carried out at the University of Florida, which
integrated a set of sensors and devices to provide services such as voice recognition and inhabitants’
activity tracking. Outstanding early smart home projects also include the following: Adaptive Versatile
home (MavHome) [16] from the University of Texas at Arlington, PlaceLab [17] from the MIT and
Intelligent System Lab (ISL) [18] from the University of Amsterdam.
The CASAS smart home project [19], developed at Washington State University in 2007, is a
multi-disciplinary research project focused on creating an intelligent home environment by using
unobtrusive sensors and actuators. The research areas included in CASAS are assistive technology,
artificial intelligence, machine learning and activity recognition. This same team has developed in its
recent research the “smart home in a box” [20], which is a lightweight smart home design that is easy to
Sensors 2015, 15 11317
install and provides SH capabilities out of the box with no customization or training needed. These
capabilities include activity recognition, which provides real time activity labelling as sensor events
arrive in a stream, and activity discovery for unlabeled data by using an unsupervised learning algorithm.
SWEET-HOME [21] is a nationally supported French research project that aims to design a new
smart home system based on audio technology. This project has three main goals: providing an
audio-based interaction technology that lets the users have full control over their home environment,
detecting distress situations and easing the social inclusion of the elderly and frail population. An
interesting research direction of their smart home system is the context-aware decision process, which
uses a dedicated Markov Logic Network approach to enhance the ability of coping with uncertain events
inferred from real sensor data [22].
A recent smart home project is “Unobtrusive Smart Environments for Independent Living”
(USEFIL), an FP7 project which started in 2011. It aims to provide an advanced and affordable
health-care assistance in a smart home environment, adopting a three-layer architecture and an
unobtrusive sensor network to support a Decision Support System (DSS) for providing inputs to
monitoring apps by user-friendly interaction [23]. A limited set of sensors and devices, such as a wrist
wearable unit, a camera, a microphone and a Kinect sensor, are used in a SH setting to identify the basic
physical activities (lying, sitting, walking, standing, cycling, running, ascending and descending stairs)
of elderly people [24]. A low cost off-the-self system and open source platforms are developed to
facilitate the generation of applications addressing the gap between advanced technologies and
aging population.
Qing and Mohan proposed a Smarter and Safer Home solution at CSIRO to enhance elderly people’s
quality of life [25]. To achieve this, a number of environmental sensors are placed in various locations
within smart home, acting as non-intrusive monitoring devices for identifying human behaviors. Based
on this project, Zhang et al. [26] proposed a Smart Assistive Living (SAL) platform to enable elderly
people to remain at their homes independently as long as possible. Sensors placed in smart home are
expected to provide a continuous data stream to a server. Extracting and analyzing these data using
machine learning mechanisms are helpful to perform diagnosis and decision making by clinical experts
and health caregivers.
These smart home projects provide a large amount of datasets, some of which are publicly available
and can be used by researchers to conduct further studies. Among the publicly available datasets listed
in the “Home Dataset” [27], those collected by MIT, the University of Amsterdam and Washington State
University are widely used in Smart Home research. Moreover, the dataset provided by MIT [17] with
more than 900 sensor inputs, including those coming from motion, switch and RFID sensors, is, to the
best of our knowledge, by far the largest dataset collected from a real-world environment. In addition to
data from embedded sensors, the dataset provided by [28] contains acceleration and gesture data.
The benchmark dataset described in [29] is also widely used and contains data collected from a set of
nine inertial sensors attached to different parts of the body. Concretely, there is motion data related to
33 fitness activities recorded from 17 volunteers.

Sensors 2015, 15 11318
2.3. Smart Home Applications Suited to Elderly People
There is not a single way of classifying the SH applications that may enhance older adults’ quality of
life and health status. We propose here a division into three main categories and summarize some of the
most significant recent work found in the literature inside each of them. These categories are: “Specific
health monitoring”, “Daily activities monitoring, prediction and reminding”, and “Detection of
anomalous situations”. We also note that these categories are not mutually exclusive: the same
application may contain ingredients that fit into more than one of them.
2.3.1. Specific Health Monitoring
On occasions older adults need specific monitoring of either vital signs or daily activities in order to
assess if a medical condition is being correctly controlled. Other possible aims of this application are to
detect early when an illness is developing or to react quickly when a sudden change in medical
parameters occurs. In the following we summarize information from some projects focused on this type
of functionality and related with specific diseases such as diabetes and stroke patients.
Pulkkinen et al. [30] described a platform for monitoring daily activities by using different types of
sensors for elderly people with diabetes at home and help detecting if the patients are following the
recommended exercise and diet routines. Data obtained from the sensors for a long period of time can
be used to distinguish the user’s life patterns, helping doctors to design treatment plans and, after that,
providing the patient with automatic notifications. Chatterjee et al. [31] built an in-home activity
monitoring system to detect the daily routines of elderly people with diabetes by using environmental
sensors and body wearable sensors. Daily messages based on previous behaviors, a tailored health
newsletter that summarizes biological parameters and blood glucose level prediction are sent to the users
and caregivers to determine the health status.
Chiang et al. [32] developed a set of wireless sensor network devices to support physical therapy to
be carried out by elderly stroke patients in smart home environments. Stroke patients usually have to
repeat specific movements or postures during their rehabilitation, as indicated by their physiotherapists.
Thus, the system described by Chiang et al. is aimed at measuring both static postures and dynamic
movements, and to record them as routines. As an example of vital signs monitoring, Sardini and
Serpelloni [33] developed a t-shirt with embedded sensors to take measurements that include heart rate,
respiratory rate and body temperature of the patient. The acquired data can be wirelessly sent to
caregivers and then analyzed continuously by healthcare experts to perform proper evaluation and assess
sudden changes in the health status of the patient.
Apart from health monitoring systems developed in laboratory environments, some commercially
available solutions also exist. Those solutions have a broader scope in healthcare management but are
usually less integrated with the home. To mention a few, Genesis by Honeywell [34], TeleStation by
Philips [35] and HealthBuddy by Bosch [36] fall into this category.
Sensors 2015, 15 11319
2.3.2. Daily Activities Monitoring, Prediction and Reminding
Patterns obtained from daily routines can be very useful for helping elderly people who suffer from
any kind of cognition decline. Reasoning over these patterns allows to predict actions and to provide
reminders of the things that should be done (for instance, guidance when the person does not remember
the steps to follow to complete an activity). Many elderly people who live alone also suffer from other
age-related diseases such as depression and diabetes, and the activities of these patients can be influenced
by their diseases. For example, patients with depression could exhibit infrequent leaving the house, less
talking, sleeping disorder and less eating, whereas patients with diabetes could perform frequent
drinking, eating, sleeping and toileting. Being capable of detecting these patterns can help in diagnosing
these illnesses.
In the literature different approaches can be found when dealing with activities detection: detection
of activities as the main objective, remainder of tasks to inhabitants, detection of changes in routines as
signs of possible risks or diagnosis of specific diseases based on activity patterns. Some significant
examples of each of these approaches are discussed in the following.
Chernbumroong et al. [37] proposed a practical multi-sensor activity recognition system for
monitoring daily life activities, including brushing, exercising, feeding, ironing, reading, scrubbing,
walking, walking on stairs, washing, watching and wiping by using seven types of sensors attached to
the body.
Lara et al. [38] proposed Centinela, a system that continuously monitors five activities (walking,
running, sitting, ascending and descending) by using a single sensing device and a mobile phone. The
system consists of a portable and unobtrusive data collection platform to provide real-time human
activity monitoring. The mobile application they implemented is based on acceleration and physiological
signals to recognize physical activities automatically.
Chaminda et al. [39] proposed a smart reminder system for reminding older adults with memory
impairment of the forgotten complex activities in smart home environment. Reminders of forgotten
activities are predicted according to the inhabitant’s current location, current behavior patterns and past
activity patterns. Wearable sensors are used to acquire data to generate these activity patterns. A similar
system is proposed in [40]. Suryadevara et al. [41] develop an intelligent home monitoring system to
detect behavior changes and forecast the behavior of elderly people.
Han et al. [42] proposed a four layers healthcare framework to predict the risk of depression and
diabetes by monitoring long-term disease related activity and generating long-term activity patterns.
When the symptoms of these diseases appear in people with irregular activity patterns, the information
will be sent to doctors and caregivers for early detection and prevention of the depression and diabetes.
2.3.3. Detection of Anomalous Situations
Anomaly detection aims to identify uncommon patterns in a dataset, that is, patterns which do not
conform to the notion of normal behavior [43]. To detect them, techniques based on rule-based
approaches, temporal relation discovery approaches and similarity-based approaches may be used. The
identification of anomaly patterns, especially in daily activities monitoring systems, can be significantly
valuable for experts to make decisions or diagnoses in emergency situations. It can also be used to

Sensors 2015, 15 11320
provide elderly people with memory impairments with reminders or audio signals if an anomalous
behavior is being detected.
As an important subset of the detection of anomalous situations we find fall detection applications.
Older adults are more prone to falls, and their consequences are in general more serious than for younger
people. This is the reason why it is possible to encounter a good number of proposals specifically focused
in fall detection for the elderly, as an important issue to facilitate their independence at home.
In [44], Phua et al. proposed an Erroneous-Plan Recognition (EPR) to detect faults in the daily
activities of elderly people with dementia, by using sensors deployed in the SH to monitor daily
activities. When an error is detected, timely audio or visual prompts are sent to the dementia patients to
replace some of their diminished memory and enhance their problem-solving abilities. Similar works
about anomaly detection for dementia patients can be found in [45–47].
Ordóñez et al. [48] developed an automated behavior analysis system for elderly people who live
alone at home. It captures measurements from various sensors, detects the activities of each user, and is
capable of detecting anomalous behavior that reflects changes in health status, by learning standard
behavior patterns. Gjoreski et al. [49] proposed a system to monitor users’ daily activity by
combining two accelerometers and an electrocardiogram (ECG) sensor. Measured acceleration data can
be analyzed in conjunction with the ECG signals to detect anomalies in the user’s behavior and
heart-related problems.
Regarding fall detection systems, Wu and Xue [50] developed a portable pre-impact fall detection
and injury prevention system with inertial sensors. By using the inertial frame velocity profile of the
body, they distinguish falls from non-fall activities as well as identify early falls by using a threshold
detection algorithm. The designed pre-impact detection device is embedded into a wearable belt that can
be worn by the older adult when they are performing daily activities. This system has been proved to
increase the confidence of independent living for elderly people.
Rimminen et al. [51] also proposed a fall detection system by using a near-field imaging floor sensor
and pattern recognition. The shape, size and magnitude of the patterns are used for classification, and
the result shows good performance on fall detection even on unclear falls (ending up sitting or on one’s
knees) and a good tolerance of daily activities. Zhuang et al. [52] described a fall detection system to
distinguish noise coming from falls from other noise in smart home environment. In their system they
only use a far-field microphone to identify various sounds. Then a Gaussian Mixture Models (GMM)
supervector is used to model each fall or noise segment by applying Euclidean distance to measure the
pairwise difference between audio segments. A Support Vector Machine built on a GMM supervector
kernel is used to classify audio segments into falls and various types of noise.
More generally, although also usable for detecting falls, Ghasemzadeh et al. [53] introduced a
physiological monitoring system, which collects acceleration and muscle activity signals to assess
standing balance. They use machine learning algorithms and statistical techniques to infer relevant
information from the correspondence between the accelerometer and the electromyogram (EMG)
sensors measurements.
Sensors 2015, 15 11321
2.4. Human Factors
Few applications and systems are as sensitive to human factors as the ones with which this paper
deals. Generally speaking, the consideration of human factors in technological systems consists in
integrating, from the very early stages of the design, the specific capabilities, limitations and preferences
of the human beings that are going to be involved with the application. In the case of Smart Home
applications related to the elderly (or any other population group), acceptability is probably the most
important factor to consider, not only for the older people themselves but also for their caregivers. Some
authors have identified a friendly design which includes these human factors as an important element to
improve the acceptance of the deployed solutions [54].
Design patterns are design solutions that have proven to be effective in some specific area or for a
specific set of functionalities. Upon completion of this survey we have not found in the literature any
design pattern oriented to encourage the acceptance of solutions for SH. However, users’ acceptance of
solutions should be a prerequisite for proper implementation. In fact, according to Gaul et al. [55], the
level of acceptance of technological solutions in the medical field is low, especially in the case of SH
solutions oriented to the elderly. This same paper states that existing solutions are technically viable but
lack a proper study of human factors, leading to acceptability problems. There are generic guidelines that
establish design principles for applying human factors in sensitive areas such as telecare [56]. However,
these guidelines do not provide design aids to develop solutions aligned with the factors described.
Even if general design patterns have not yet been proposed related to human factors in SH, it is fair
to mention that there are authors who have considered these issues into their software architectures to a
greater or lesser extent. For instance, Becker [57] performed a detailed review of the quality requirements
that AAL environments must comply with, as well as their related technologies and architectural models.
The conceptualization found in this paper is useful when dealing with the software architectural
requirements, although it is not easily transferable to a low-level design made by developers. For their
part, Vega et al. [58] identified the main challenges in the development of services based on smart
environments (considered as a generalization of SH) and proposed an architecture to deal with these.
The proposed architecture is based on the model-view controller paradigm commonly used in
programming. Unlike other approaches, the core functionality is fully specified in the documents
exchanged between the entities of the architecture, called Document-Contracts. This architecture facilitates
the development, maintenance and creation of new solutions for non-technical users because the behavior
of the system will be guided by the definition of these Document-Contracts in a high level language. It
can also be adapted to the specific technical conditions of each home without altering the basic
functionality of activities. However, the authors of [58] do not specify any design pattern to be used in
the definition of the activities.
3. Conceptualization and Formalization of Activities in Smart Home
A clear understanding of the target activities in SH and their specific characteristics is critical for
proper sensor selection and system design. In addition, accurate knowledge on the activities’ context,
such as location and involved objects, if included into the activity conceptualization, may enhance the
effectiveness of SH systems. In this section we firstly describe a taxonomy of SH activities in a manner
Sensors 2015, 15 11322
that is meaningful for our target population (the elderly). This leads to a proposal for the formalization
of activities, including their relationships with their context as well as with other activities. We then go
into deeper detail on the specific techniques and languages that have been proposed in the literature for
describing contextual information in a formalized manner. The whole section organized in this manner
presents information that grows in specificity and technical detail with each sub-section, paving the way
for Section 4, in which sensors capable of capturing the relevant information are tackled.
3.1. Taxonomy of Activities
In this sub-section, we propose a taxonomy applicable to activities that are related to healthcare,
wellbeing and independence in SH environments, with special emphasis on the elderly population. This
sub-section includes information of a very general and high-level nature, appropriate for being
significant and understandable to personnel which is expert in the interpretation of the medical and care
implications of specific activities (e.g., doctors) but not in the technical low-level aspects of the
SH deployment.
On one hand, Activities of Daily Life (ADLs) are defined as “the things we normally do in daily living
including any daily activity we perform for self-care such as feeding ourselves, bathing, dressing,
grooming work, homemaking and leisure” [59] by the medical community. ADLs are used in smart
home as an umbrella term encompassing self-care and domestic activities or tasks that the user
undertakes routinely. The capacity of performing ADLs at home without assistance from other people
can be considered as a reference for the estimation of the independent living level of the older adults [60].
Katz and Lawton define a range of ADLs [61] and Instrumental ADLs (IADLs) [62]. According to their
definitions, the ADLs can be subdivided into personal self-care activities, or basic ADLs (BADLs), and
domestic activities, or instrumental ADLs (IADLs). BADLs (a concept commonly used in current
literature related to SH, see for instance [63]) refer to the necessary self-care activities, such as bathing,
dressing, eating and drinking, functional mobility, using toilet and grooming. IADLs are activities which
are not strictly necessary but let an individual live independently in a community, for instance shopping,
housekeeping, managing money, preparing food, taking medication, using telephone and transportation.
On the other hand, ambulatory activities are related to either specific motions or postures of the
person. These activities can be subdivided into stationary activities, transitional activities and dynamic
activities. Stationary activities describe a posture such as sitting, standing or lying. Transitional activities
refer to the change from a stationary state to a dynamic state or vice versa, such as sit-to-stand,
stand-to-sit, stand-to-walk and sit-to-lie. Dynamic activities include a set of simple dynamic actions such
as walking, running, cycling and jogging. Ambulatory activity monitoring is very useful for detecting
the physical activity level, promoting health (e.g., doing exercise) and detecting hazardous situations
such as falling. Additionally, ambulatory activities can be useful for estimating the psychological
wellbeing of older adults. For example, Tartarisco et al. [64] proposed a system for prolonged stress
monitoring during normal activity performance in a smart home environment. They evaluated the
individual immediate stress level by analyzing both the ambulatory activity frequency and the heart rate
when the individual performs these ambulatory activities.
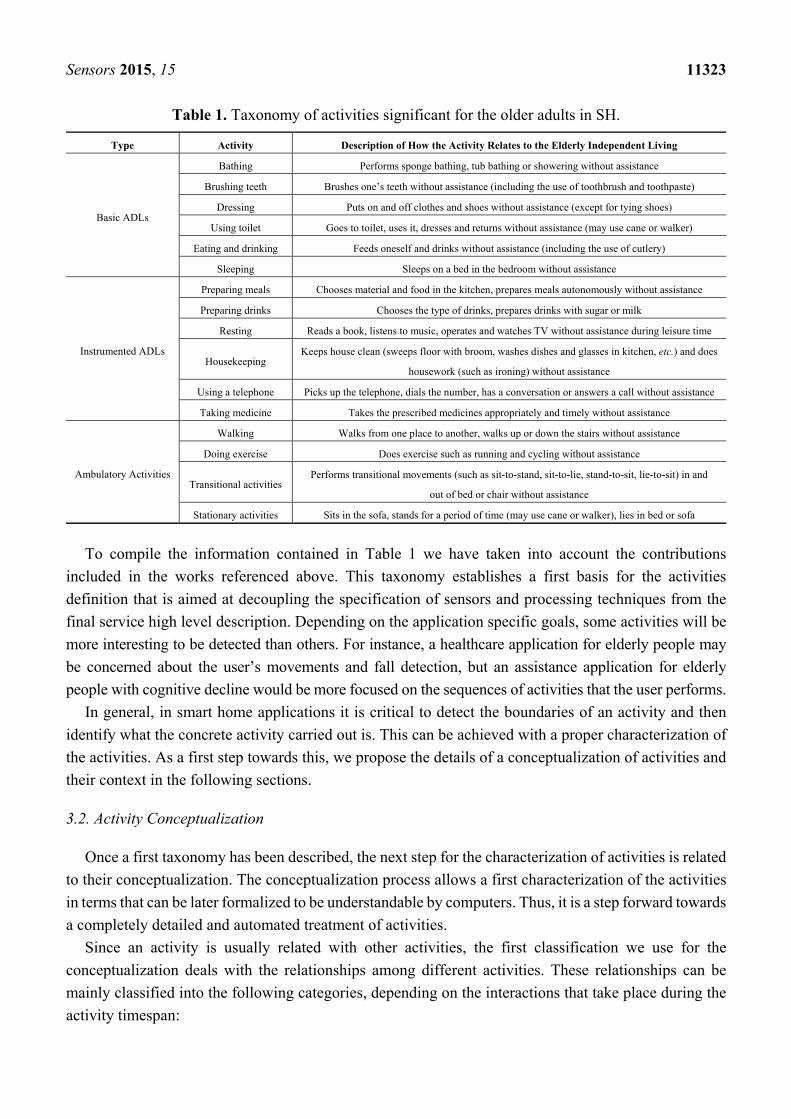
The classification and detailed description of the activities that are significant for the elderly
well-being and independent living in SH is included in Table 1.
Sensors 2015, 15 11323
Table 1. Taxonomy of activities significant for the older adults in SH.
Type Activity Description of How the Activity Relates to the Elderly Independent Living
Basic ADLs
Bathing Performs sponge bathing, tub bathing or showering without assistance
Brushing teeth Brushes one’s teeth without assistance (including the use of toothbrush and toothpaste)
Dressing Puts on and off clothes and shoes without assistance (except for tying shoes)
Using toilet Goes to toilet, uses it, dresses and returns without assistance (may use cane or walker)
Eating and drinking Feeds oneself and drinks without assistance (including the use of cutlery)
Sleeping Sleeps on a bed in the bedroom without assistance
Instrumented ADLs
Preparing meals Chooses material and food in the kitchen, prepares meals autonomously without assistance
Preparing drinks Chooses the type of drinks, prepares drinks with sugar or milk
Resting Reads a book, listens to music, operates and watches TV without assistance during leisure time
Housekeeping Keeps house clean (sweeps floor with broom, washes dishes and glasses in kitchen, etc.) and does
housework (such as ironing) without assistance
Using a telephone Picks up the telephone, dials the number, has a conversation or answers a call without assistance
Taking medicine Takes the prescribed medicines appropriately and timely without assistance
Ambulatory Activities
Walking Walks from one place to another, walks up or down the stairs without assistance
Doing exercise Does exercise such as running and cycling without assistance
Transitional activities Performs transitional movements (such as sit-to-stand, sit-to-lie, stand-to-sit, lie-to-sit) in and
out of bed or chair without assistance
Stationary activities Sits in the sofa, stands for a period of time (may use cane or walker), lies in bed or sofa
To compile the information contained in Table 1 we have taken into account the contributions
included in the works referenced above. This taxonomy establishes a first basis for the activities
definition that is aimed at decoupling the specification of sensors and processing techniques from the
final service high level description. Depending on the application specific goals, some activities will be
more interesting to be detected than others. For instance, a healthcare application for elderly people may
be concerned about the user’s movements and fall detection, but an assistance application for elderly
people with cognitive decline would be more focused on the sequences of activities that the user performs.
In general, in smart home applications it is critical to detect the boundaries of an activity and then
identify what the concrete activity carried out is. This can be achieved with a proper characterization of
the activities. As a first step towards this, we propose the details of a conceptualization of activities and
their context in the following sections.
3.2. Activity Conceptualization
Once a first taxonomy has been described, the next step for the characterization of activities is related
to their conceptualization. The conceptualization process allows a first characterization of the activities
in terms that can be later formalized to be understandable by computers. Thus, it is a step forward towards
a completely detailed and automated treatment of activities.
Since an activity is usually related with other activities, the first classification we use for the
conceptualization deals with the relationships among different activities. These relationships can be
mainly classified into the following categories, depending on the interactions that take place during the
activity timespan:
Sensors 2015, 15 11324
1. Specialization of activities—Activities can be categorized at multiple granularity levels. In [65],
the authors distinguish the ADLs in the smart home from the actions, in order to define the human
behavior at different complexity levels and durations. An action is an atomic activity that is
performed by a single subject and lasts for a relatively short time. Some examples of action are
“open the door”, “turn on the light” and “go to bed”. An ADL is usually defined as a more complex
behavior performed by either a single user or multiple users and which lasts for a longer time than
an action. Furthermore, a so-called coarse-grained activity may be specialized into two or more
fine-grained activities. For example, “preparing drinks” may have as its child activities:
“preparing hot drink” and “preparing cold drink”, whereas “preparing hot drink” can be further
broken down into its child activities: “preparing tea”, “preparing hot milk” and “preparing
coffee”. Meditskos et al. [66] defined the specialization of activities differently. As an example,
in their activity pattern, the activity “night sleep” is defined as the overall night sleep activity of
a person and the activity “out of bed” is detected when the person gets out of bed. With the
addition of context description and activity type interpretation, an “out of bed” activity can be
further specialized as a “bed exit” activity, which refers to the “out of bed” activity when it occurs
during the “night sleep”.
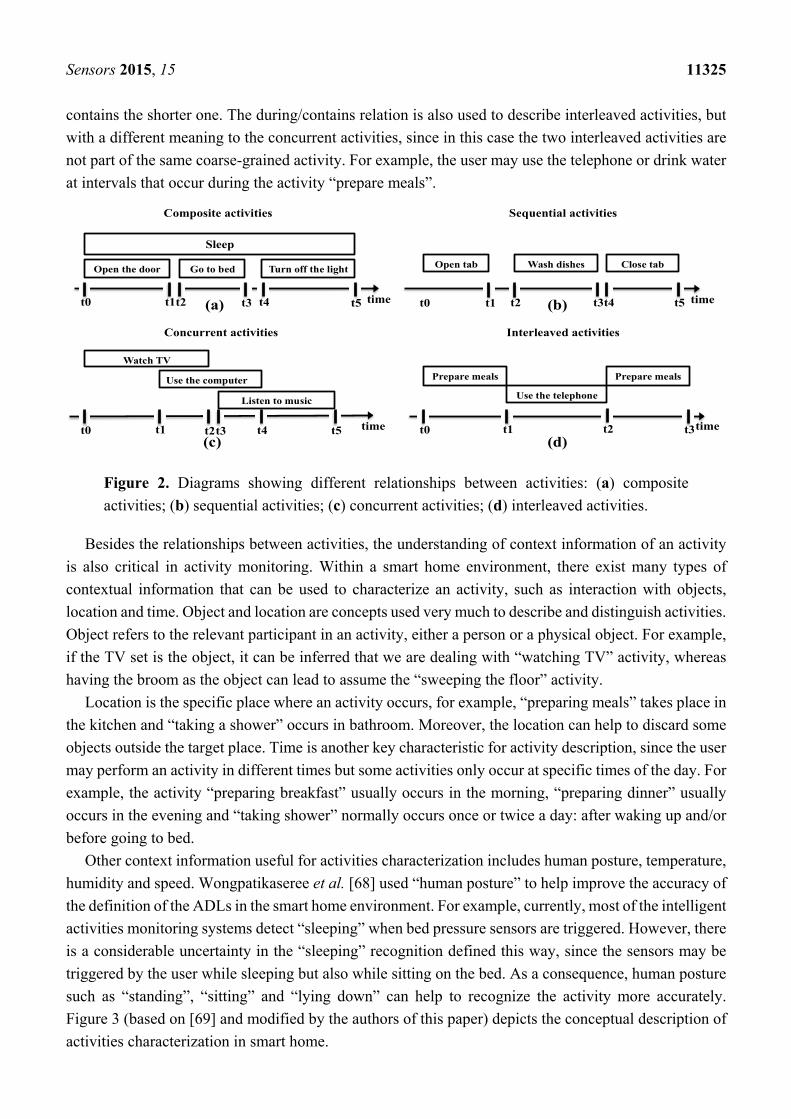
2. Composition of activities—Most complex ADLs are composed of an ordered succession of
simpler activities. For instance, “sleeping” may consist of: “opening the door”, “going to bed”,
and “turning off the light” (as shown in Figure 2). The ordering of the simple activities may
depend an individual’s preferences or habits, thus leading to several variants of an activity.
Furthermore, activities may have time-related connections to each other, to form a composite
activity. At this respect we may distinguish three situations: sequential activities, concurrent
activities and interleaved activities. Figure 2 shows graphically these temporal relationships.
In terms of time interval, the so-called Allen relations [67] are commonly used to describe temporal
links between activities: (1) Sequential activities are described by associating their time intervals using
the before/after and meet/meetby relations. The before/after relation is found when one activity is
performed either before or after another activity, and the two associated time intervals have a gap
between them. For example, “opening tab” occurs before “washing dishes” and “closing tab” occurs
after “washing dishes”. On the other side, the meet/meetby relation indicates that the two associated time
intervals do not have a gap between them; (2) Concurrent activities occur at the same time, thus they
share the same time intervals either fully or partially. There are nine options in this case: the
overlaps/overlappedby relation indicates that the two intervals have a common shared sub-interval, and
one interval starts or finishes before the other; the contains/during relation is found when the interval of
a composite activity encloses the interval of its composing activities; the starts/startedby and
finishes/finishedby relations relate to the case of an activity that starts or finishes during the timespan of
another activity with longer time interval; the equals relation indicates that two activities occur in parallel
and thus their start and finish intervals occur at the same time [51]. Concurrent activities take place either
when one user performs two different activities simultaneously or when multiple users perform activities
at the same time. For example, one user can perform “watching TV” and “using the computer” at the
same time, or two users can perform “drinking tea” together; (3) Interleaved activities have time intervals
that “preempt” each other, which indicates that a long and complex activity has a long time interval that
Sensors 2015, 15 11325
contains the shorter one. The during/contains relation is also used to describe interleaved activities, but
with a different meaning to the concurrent activities, since in this case the two interleaved activities are
not part of the same coarse-grained activity. For example, the user may use the telephone or drink water
at intervals that occur during the activity “prepare meals”.
Figure 2. Diagrams showing different relationships between activities: (a) composite
activities; (b) sequential activities; (c) concurrent activities; (d) interleaved activities.
Besides the relationships between activities, the understanding of context information of an activity
is also critical in activity monitoring. Within a smart home environment, there exist many types of
contextual information that can be used to characterize an activity, such as interaction with objects,
location and time. Object and location are concepts used very much to describe and distinguish activities.
Object refers to the relevant participant in an activity, either a person or a physical object. For example,
if the TV set is the object, it can be inferred that we are dealing with “watching TV” activity, whereas
having the broom as the object can lead to assume the “sweeping the floor” activity.
Location is the specific place where an activity occurs, for example, “preparing meals” takes place in
the kitchen and “taking a shower” occurs in bathroom. Moreover, the location can help to discard some
objects outside the target place. Time is another key characteristic for activity description, since the user
may perform an activity in different times but some activities only occur at specific times of the day. For
example, the activity “preparing breakfast” usually occurs in the morning, “preparing dinner” usually
occurs in the evening and “taking shower” normally occurs once or twice a day: after waking up and/or
before going to bed.
Other context information useful for activities characterization includes human posture, temperature,
humidity and speed. Wongpatikaseree et al. [68] used “human posture” to help improve the accuracy of
the definition of the ADLs in the smart home environment. For example, currently, most of the intelligent
activities monitoring systems detect “sleeping” when bed pressure sensors are triggered. However, there
is a considerable uncertainty in the “sleeping” recognition defined this way, since the sensors may be
triggered by the user while sleeping but also while sitting on the bed. As a consequence, human posture
such as “standing”, “sitting” and “lying down” can help to recognize the activity more accurately.
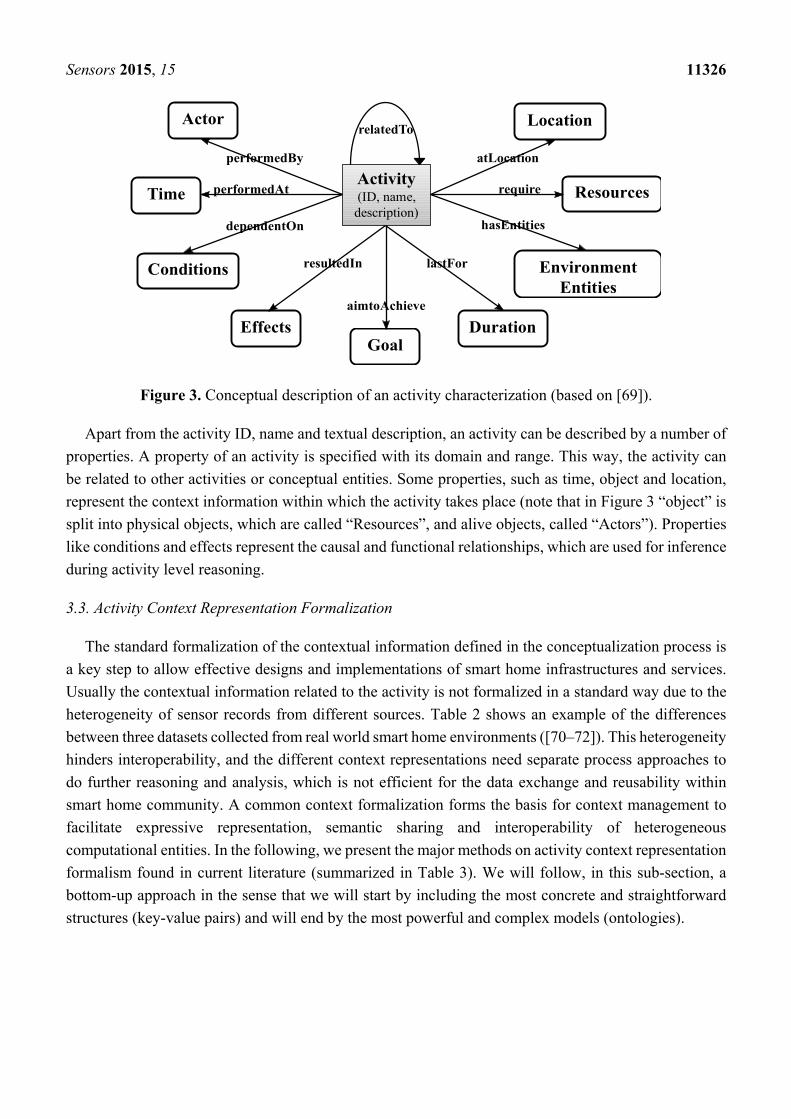
Figure 3 (based on [69] and modified by the authors of this paper) depicts the conceptual description of
activities characterization in smart home.
Open the door Go to bed Turn off the light
Sleep
(a)
(d) (c)
(b) time
time time
time t0 t1 t2 t3 t4 t5
Close tab Wash dishes Open tab
Use the computer
Listen to music
Watch TV
t0 t1 t2 t3 t4 t5
Composite activities Sequential activities
Concurrent activities Interleaved activities
t0 t1 t2 t3 t4 t5
Prepare meals
Use the telephone
Prepare meals
t0 t1 t2 t3
Sensors 2015, 15 11326
Figure 3. Conceptual description of an activity characterization (based on [69]).
Apart from the activity ID, name and textual description, an activity can be described by a number of
properties. A property of an activity is specified with its domain and range. This way, the activity can
be related to other activities or conceptual entities. Some properties, such as time, object and location,
represent the context information within which the activity takes place (note that in Figure 3 “object” is
split into physical objects, which are called “Resources”, and alive objects, called “Actors”). Properties
like conditions and effects represent the causal and functional relationships, which are used for inference
during activity level reasoning.
3.3. Activity Context Representation Formalization
The standard formalization of the contextual information defined in the conceptualization process is
a key step to allow effective designs and implementations of smart home infrastructures and services.
Usually the contextual information related to the activity is not formalized in a standard way due to the
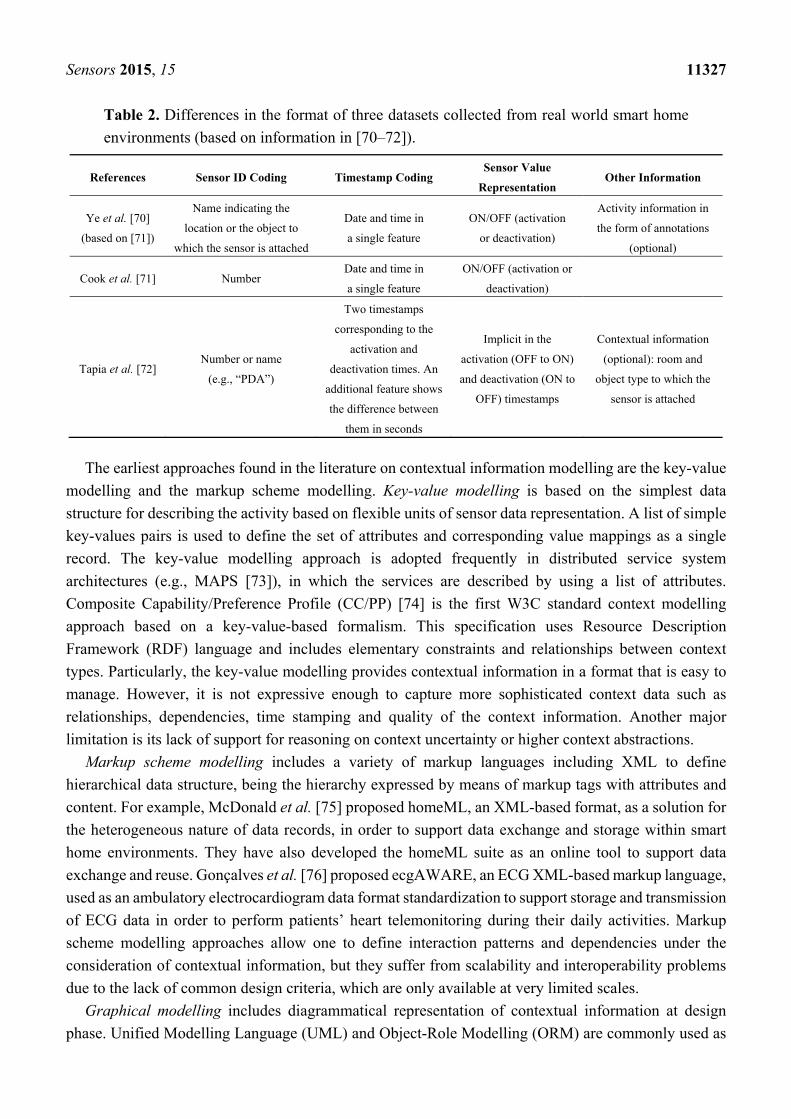
heterogeneity of sensor records from different sources. Table 2 shows an example of the differences
between three datasets collected from real world smart home environments ([70–72]). This heterogeneity
hinders interoperability, and the different context representations need separate process approaches to
do further reasoning and analysis, which is not efficient for the data exchange and reusability within
smart home community. A common context formalization forms the basis for context management to
facilitate expressive representation, semantic sharing and interoperability of heterogeneous
computational entities. In the following, we present the major methods on activity context representation
formalism found in current literature (summarized in Table 3). We will follow, in this sub-section, a
bottom-up approach in the sense that we will start by including the most concrete and straightforward
structures (key-value pairs) and will end by the most powerful and complex models (ontologies).
Activity(ID, name, description)
Time
Conditions
EffectsGoal
Actor Location
Environment Entities
Duration
Resources
performedBy atLocation
require
hasEntities
lastFor
aimtoAchieve
resultedIn
dependentOn
performedAt
relatedTo
Sensors 2015, 15 11327
Table 2. Differences in the format of three datasets collected from real world smart home
environments (based on information in [70–72]).
References Sensor ID Coding Timestamp Coding Sensor Value
Representation Other Information
Ye et al. [70]
(based on [71])
Name indicating the
location or the object to
which the sensor is attached
Date and time in
a single feature
ON/OFF (activation
or deactivation)
Activity information in
the form of annotations
(optional)
Cook et al. [71] Number Date and time in
a single feature
ON/OFF (activation or
deactivation)
Tapia et al. [72] Number or name
(e.g., “PDA”)
Two timestamps
corresponding to the
activation and
deactivation times. An
additional feature shows
the difference between
them in seconds
Implicit in the
activation (OFF to ON)
and deactivation (ON to
OFF) timestamps
Contextual information
(optional): room and
object type to which the
sensor is attached
The earliest approaches found in the literature on contextual information modelling are the key-value
modelling and the markup scheme modelling. Key-value modelling is based on the simplest data
structure for describing the activity based on flexible units of sensor data representation. A list of simple
key-values pairs is used to define the set of attributes and corresponding value mappings as a single
record. The key-value modelling approach is adopted frequently in distributed service system
architectures (e.g., MAPS [73]), in which the services are described by using a list of attributes.
Composite Capability/Preference Profile (CC/PP) [74] is the first W3C standard context modelling
approach based on a key-value-based formalism. This specification uses Resource Description
Framework (RDF) language and includes elementary constraints and relationships between context
types. Particularly, the key-value modelling provides contextual information in a format that is easy to
manage. However, it is not expressive enough to capture more sophisticated context data such as
relationships, dependencies, time stamping and quality of the context information. Another major
limitation is its lack of support for reasoning on context uncertainty or higher context abstractions.
Markup scheme modelling includes a variety of markup languages including XML to define
hierarchical data structure, being the hierarchy expressed by means of markup tags with attributes and
content. For example, McDonald et al. [75] proposed homeML, an XML-based format, as a solution for
the heterogeneous nature of data records, in order to support data exchange and storage within smart
home environments. They have also developed the homeML suite as an online tool to support data
exchange and reuse. Gonçalves et al. [76] proposed ecgAWARE, an ECG XML-based markup language,
used as an ambulatory electrocardiogram data format standardization to support storage and transmission
of ECG data in order to perform patients’ heart telemonitoring during their daily activities. Markup
scheme modelling approaches allow one to define interaction patterns and dependencies under the
consideration of contextual information, but they suffer from scalability and interoperability problems
due to the lack of common design criteria, which are only available at very limited scales.
Graphical modelling includes diagrammatical representation of contextual information at design
phase. Unified Modelling Language (UML) and Object-Role Modelling (ORM) are commonly used as
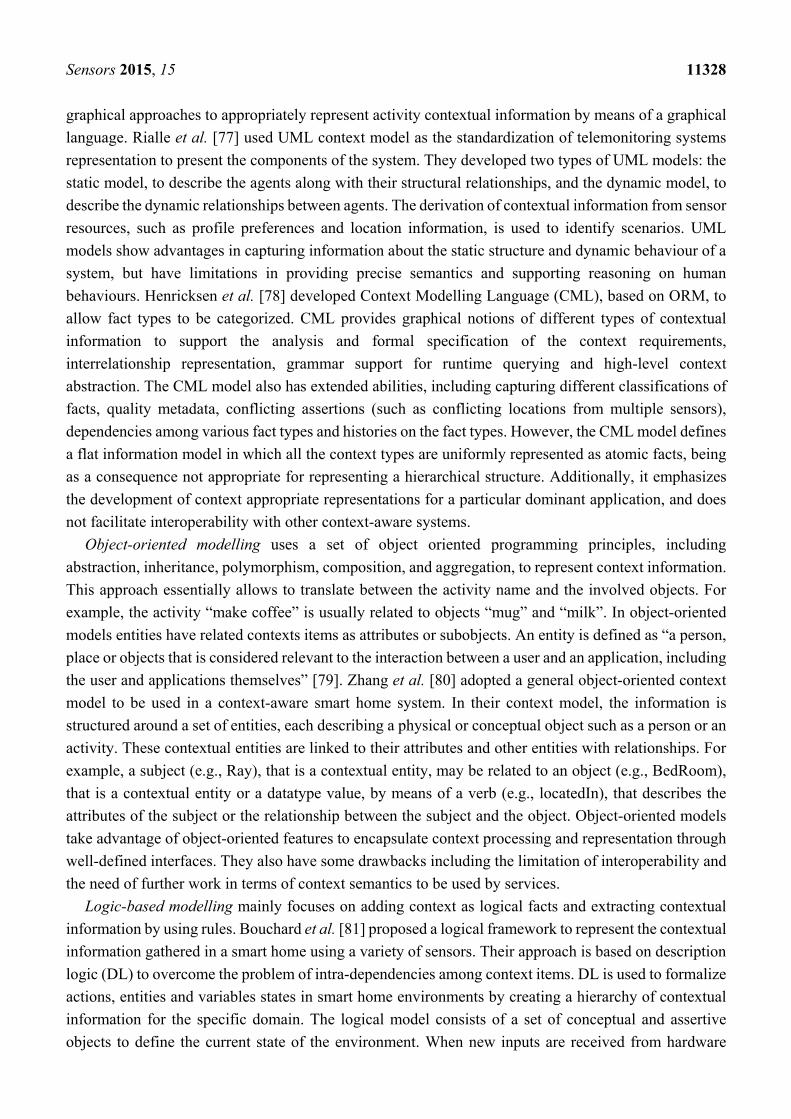
Sensors 2015, 15 11328
graphical approaches to appropriately represent activity contextual information by means of a graphical
language. Rialle et al. [77] used UML context model as the standardization of telemonitoring systems
representation to present the components of the system. They developed two types of UML models: the
static model, to describe the agents along with their structural relationships, and the dynamic model, to
describe the dynamic relationships between agents. The derivation of contextual information from sensor
resources, such as profile preferences and location information, is used to identify scenarios. UML
models show advantages in capturing information about the static structure and dynamic behaviour of a
system, but have limitations in providing precise semantics and supporting reasoning on human
behaviours. Henricksen et al. [78] developed Context Modelling Language (CML), based on ORM, to
allow fact types to be categorized. CML provides graphical notions of different types of contextual
information to support the analysis and formal specification of the context requirements,
interrelationship representation, grammar support for runtime querying and high-level context
abstraction. The CML model also has extended abilities, including capturing different classifications of
facts, quality metadata, conflicting assertions (such as conflicting locations from multiple sensors),
dependencies among various fact types and histories on the fact types. However, the CML model defines
a flat information model in which all the context types are uniformly represented as atomic facts, being
as a consequence not appropriate for representing a hierarchical structure. Additionally, it emphasizes
the development of context appropriate representations for a particular dominant application, and does
not facilitate interoperability with other context-aware systems.
Object-oriented modelling uses a set of object oriented programming principles, including
abstraction, inheritance, polymorphism, composition, and aggregation, to represent context information.
This approach essentially allows to translate between the activity name and the involved objects. For
example, the activity “make coffee” is usually related to objects “mug” and “milk”. In object-oriented
models entities have related contexts items as attributes or subobjects. An entity is defined as “a person,
place or objects that is considered relevant to the interaction between a user and an application, including
the user and applications themselves” [79]. Zhang et al. [80] adopted a general object-oriented context
model to be used in a context-aware smart home system. In their context model, the information is
structured around a set of entities, each describing a physical or conceptual object such as a person or an
activity. These contextual entities are linked to their attributes and other entities with relationships. For
example, a subject (e.g., Ray), that is a contextual entity, may be related to an object (e.g., BedRoom),
that is a contextual entity or a datatype value, by means of a verb (e.g., locatedIn), that describes the
attributes of the subject or the relationship between the subject and the object. Object-oriented models
take advantage of object-oriented features to encapsulate context processing and representation through
well-defined interfaces. They also have some drawbacks including the limitation of interoperability and
the need of further work in terms of context semantics to be used by services.
Logic-based modelling mainly focuses on adding context as logical facts and extracting contextual
information by using rules. Bouchard et al. [81] proposed a logical framework to represent the contextual
information gathered in a smart home using a variety of sensors. Their approach is based on description
logic (DL) to overcome the problem of intra-dependencies among context items. DL is used to formalize
actions, entities and variables states in smart home environments by creating a hierarchy of contextual
information for the specific domain. The logical model consists of a set of conceptual and assertive
objects to define the current state of the environment. When new inputs are received from hardware
Sensors 2015, 15 11329
sensors, the agent updates the state of the environment and creates an action structure, representing the
changes that happened to the environment. Another logic-based approach is based on event calculus
(EC). This approach is a highly developed logical theory of actions that is able to describe dynamically
environment state changing in sorted first-order logic. In addition, it has the capability of incorporating
a temporal dimension during the description process. Chen et al. [82] proposed a formalized framework
using EC as the representation approach for the specification of smart home knowledge domain. EC
completes the formalization of the domain by using fluents, events, and predicates. Fluents represent any
property related to the state of a smart home, events represent any change in a property state and
predicates identify the relationships between fluents and events for further formalisation of the domain.
In their EC-based framework, they model sensor activations as events and object states as fluents.
Additionally they develop a set of high-level logic-based models to represent compound activities, such
that the occurrences and effects of compound activities can be formalised in the same way as with
primitive actions. This model has clear and elegant semantics in describing contextual information and
could serve as a proper way to represent facts, expressions and rules to do further inference and derive
new facts from existing action observations. Nevertheless, this model has limitations including its
incapability of representing context information uncertainty and its inflexibility to represent multiple
users’ activity habits.
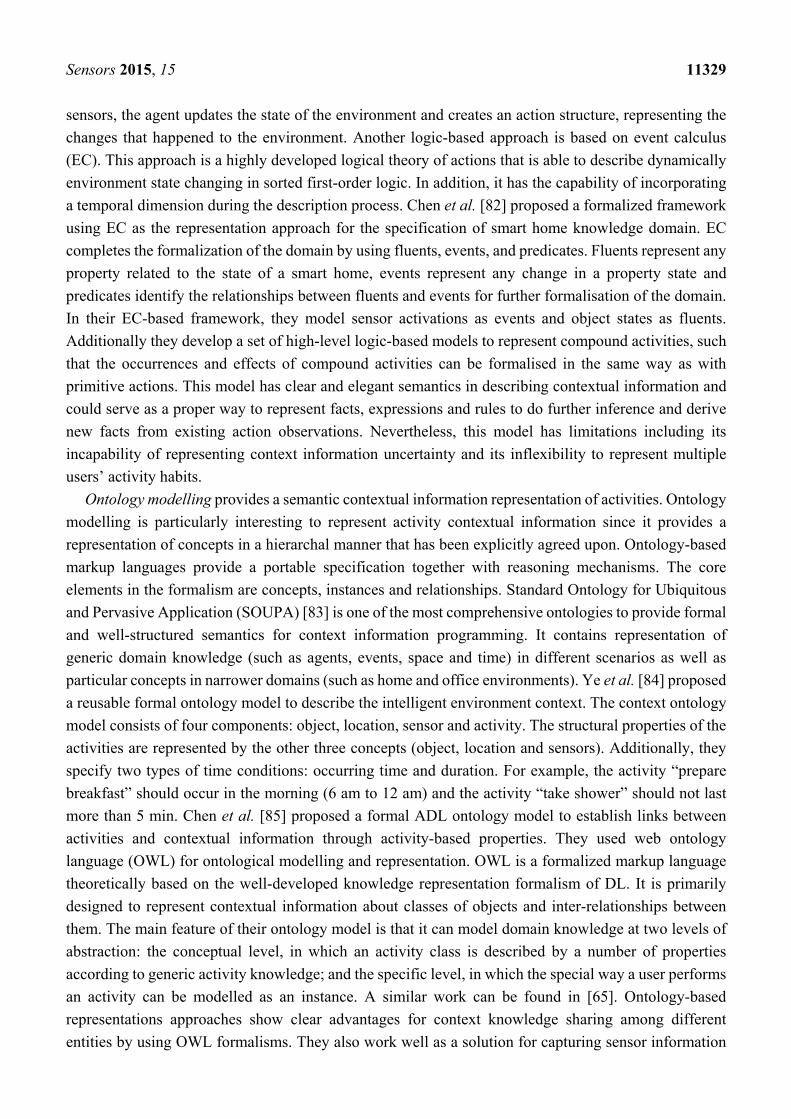
Ontology modelling provides a semantic contextual information representation of activities. Ontology
modelling is particularly interesting to represent activity contextual information since it provides a
representation of concepts in a hierarchal manner that has been explicitly agreed upon. Ontology-based
markup languages provide a portable specification together with reasoning mechanisms. The core
elements in the formalism are concepts, instances and relationships. Standard Ontology for Ubiquitous
and Pervasive Application (SOUPA) [83] is one of the most comprehensive ontologies to provide formal
and well-structured semantics for context information programming. It contains representation of
generic domain knowledge (such as agents, events, space and time) in different scenarios as well as
particular concepts in narrower domains (such as home and office environments). Ye et al. [84] proposed
a reusable formal ontology model to describe the intelligent environment context. The context ontology
model consists of four components: object, location, sensor and activity. The structural properties of the
activities are represented by the other three concepts (object, location and sensors). Additionally, they
specify two types of time conditions: occurring time and duration. For example, the activity “prepare
breakfast” should occur in the morning (6 am to 12 am) and the activity “take shower” should not last
more than 5 min. Chen et al. [85] proposed a formal ADL ontology model to establish links between
activities and contextual information through activity-based properties. They used web ontology
language (OWL) for ontological modelling and representation. OWL is a formalized markup language
theoretically based on the well-developed knowledge representation formalism of DL. It is primarily
designed to represent contextual information about classes of objects and inter-relationships between
them. The main feature of their ontology model is that it can model domain knowledge at two levels of
abstraction: the conceptual level, in which an activity class is described by a number of properties
according to generic activity knowledge; and the specific level, in which the special way a user performs
an activity can be modelled as an instance. A similar work can be found in [65]. Ontology-based
representations approaches show clear advantages for context knowledge sharing among different
entities by using OWL formalisms. They also work well as a solution for capturing sensor information
Sensors 2015, 15 11330
in terms of heterogeneity, interoperability and usability with user-friendly graphic tools (e.g., protégé [86]).
However, there are current limitations of this domain ontology models that must be tackled: they require
solid knowledge engineering skills; they do not support time-related reasoning, they are normally
computationally expensive in context reasoning; they have limited ability to deal with uncertain and
changing context of objects.
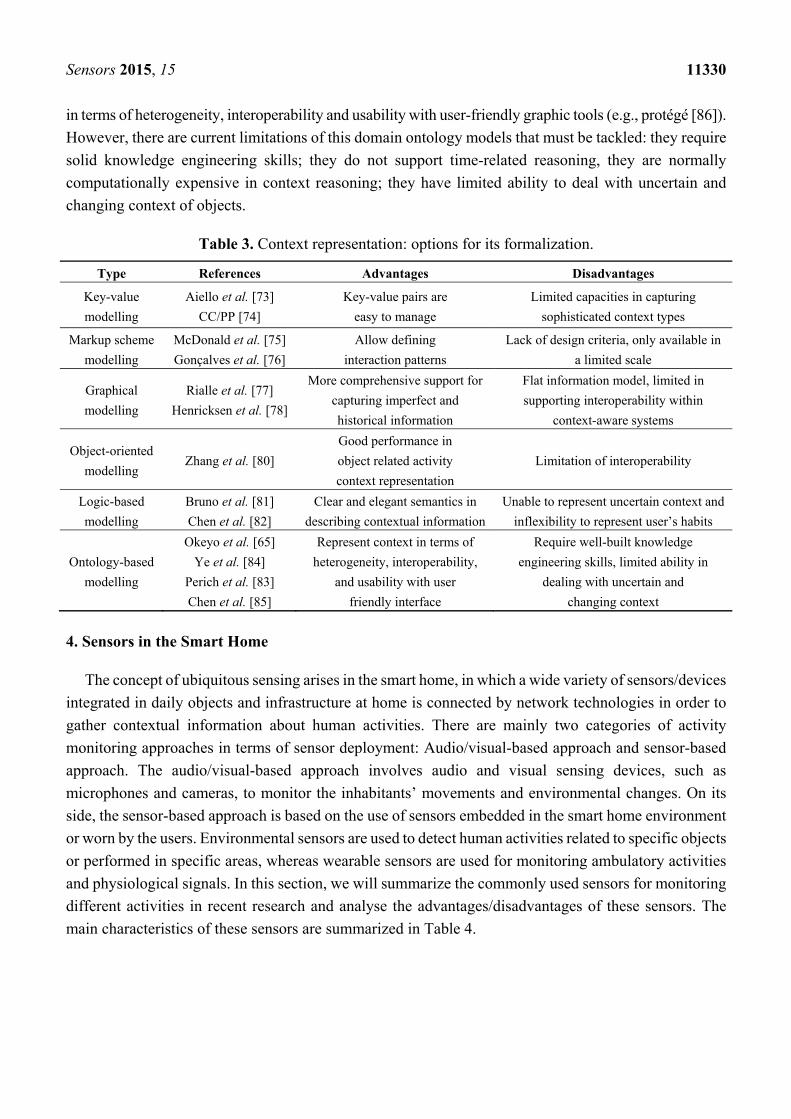
Table 3. Context representation: options for its formalization.
Type References Advantages Disadvantages
Key-value
modelling
Aiello et al. [73]
CC/PP [74]
Key-value pairs are
easy to manage
Limited capacities in capturing
sophisticated context types
Markup scheme
modelling
McDonald et al. [75]
Gonçalves et al. [76]
Allow defining
interaction patterns
Lack of design criteria, only available in
a limited scale
Graphical
modelling
Rialle et al. [77]
Henricksen et al. [78]
More comprehensive support for
capturing imperfect and
historical information
Flat information model, limited in
supporting interoperability within
context-aware systems
Object-oriented
modelling Zhang et al. [80]
Good performance in
object related activity
context representation
Limitation of interoperability
Logic-based
modelling
Bruno et al. [81]
Chen et al. [82]
Clear and elegant semantics in
describing contextual information
Unable to represent uncertain context and
inflexibility to represent user’s habits
Ontology-based
modelling
Okeyo et al. [65]
Ye et al. [84]
Perich et al. [83]
Chen et al. [85]
Represent context in terms of
heterogeneity, interoperability,
and usability with user
friendly interface
Require well-built knowledge
engineering skills, limited ability in
dealing with uncertain and
changing context
4. Sensors in the Smart Home
The concept of ubiquitous sensing arises in the smart home, in which a wide variety of sensors/devices
integrated in daily objects and infrastructure at home is connected by network technologies in order to
gather contextual information about human activities. There are mainly two categories of activity
monitoring approaches in terms of sensor deployment: Audio/visual-based approach and sensor-based
approach. The audio/visual-based approach involves audio and visual sensing devices, such as
microphones and cameras, to monitor the inhabitants’ movements and environmental changes. On its
side, the sensor-based approach is based on the use of sensors embedded in the smart home environment
or worn by the users. Environmental sensors are used to detect human activities related to specific objects
or performed in specific areas, whereas wearable sensors are used for monitoring ambulatory activities
and physiological signals. In this section, we will summarize the commonly used sensors for monitoring
different activities in recent research and analyse the advantages/disadvantages of these sensors. The
main characteristics of these sensors are summarized in Table 4.
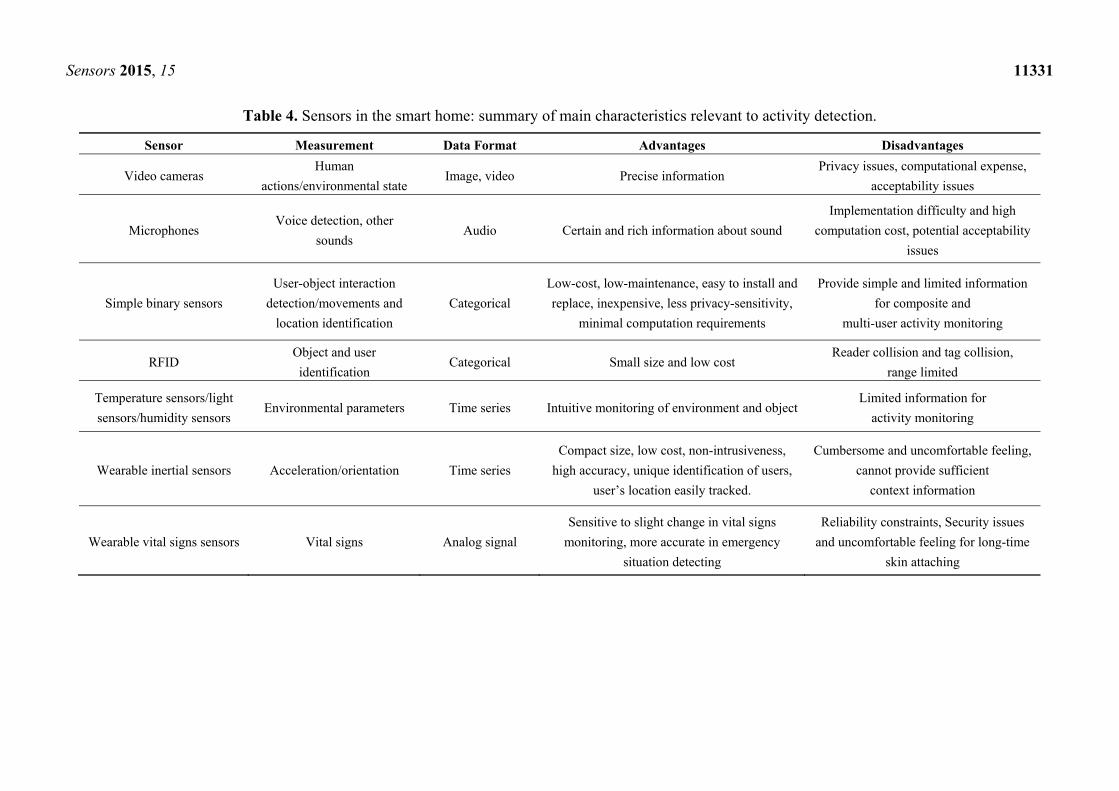
Sensors 2015, 15 11331
Table 4. Sensors in the smart home: summary of main characteristics relevant to activity detection.
Sensor Measurement Data Format Advantages Disadvantages
Video cameras Human
actions/environmental state Image, video Precise information
Privacy issues, computational expense,
acceptability issues
Microphones Voice detection, other
sounds Audio Certain and rich information about sound
Implementation difficulty and high
computation cost, potential acceptability
issues
Simple binary sensors
User-object interaction
detection/movements and
location identification
Categorical
Low-cost, low-maintenance, easy to install and
replace, inexpensive, less privacy-sensitivity,
minimal computation requirements
Provide simple and limited information
for composite and
multi-user activity monitoring
RFID Object and user
identification Categorical Small size and low cost
Reader collision and tag collision,
range limited
Temperature sensors/light
sensors/humidity sensors Environmental parameters Time series Intuitive monitoring of environment and object
Limited information for
activity monitoring
Wearable inertial sensors Acceleration/orientation Time series
Compact size, low cost, non-intrusiveness,
high accuracy, unique identification of users,
user’s location easily tracked.
Cumbersome and uncomfortable feeling,
cannot provide sufficient
context information
Wearable vital signs sensors Vital signs Analog signal
Sensitive to slight change in vital signs
monitoring, more accurate in emergency
situation detecting
Reliability constraints, Security issues
and uncomfortable feeling for long-time
skin attaching
Sensors 2015, 15 11332
Video cameras are low-cost devices that can provide very detailed and rich context information about
human actions and environmental states. A sequence of images is directly used to detect human activity
within their monitored areas. Video information can provide direct and clear information about the
objects within smart home, for example, the number of people. Thus video cameras have strong
advantages on multiple-users’ activity monitoring. However, they face difficulties including privacy
issues, high computational expense and environment dependency. On their part, microphones have as
advantages their ability of providing accurate information about users’ communications and sounds in
specific locations inside smart home. However, they suffer from implementation difficulties and high
computational costs associated to the audio processing algorithms necessary to distinguish different
sounds, especially when there are multiple residents inside the home. Microphones, although probably
to a lesser extent than video cameras, can also be perceived as privacy threats, since they can potentially
record private conversations. It is anyway worth mentioning that there are studies that show that the
acceptability of this technology is strongly influenced by the increase in freedom that caregivers’
perceive while preserving safety of their loved elderly [87] and the potential usefulness of voice-driven
interfaces inside home [88].
We firmly believe that the acceptance of the technology by the users is a critical issue in smart home
environments (as already stated in Section 2.4 above). That is the reason why our analysis is mainly
focused on sensors other than the audio/visual ones.
4.1. Environmental Sensors
Diverse sensors can be deployed in different home areas or attached on a range of objects to monitor
activities in smart home. Most ADLs are performed in specific locations and with specific user-object
interactions. For example, cooking activity usually takes place in the kitchen (specific space), and
telephoning involves interacting with the phone (specific interaction with an object). Thus the activity
can be recognized from user-object interactions combined with environment observation. For example,
if sensors indicate that the stove is on and that there is water usage in the kitchen, it can be strongly
suggested that the activity of preparing meals is taking place. Therefore, it is assumed that environmental
sensors data can constitute powerful information to observe the human behaviours within smart home.
In this section, we will summarize the commonly used sensors embedded in smart home for detecting
ADLs and discuss their advantages and disadvantages.
Simple binary sensors, including state-change sensors, motion sensors, contact switches and pressure
sensors, may be deployed on a range of objects in smart home environments for monitoring users’
movements and locations. A simple state-change sensor can be used to detect any change of the state of
an object which can be subsequently be used to reflect the user-object interactions. For example, a
state-change sensor attached to the handset of a telephone detects if the handset has been lifted from the
telephone base station. Motion sensors are used for detecting the inhabitant’s presence and location
throughout the house. Infrared presence sensor is the most commonly used type of motion sensor in
smart environments to detect users’ presence. Contact switches are usually installed on the doors of
rooms, fridge and cabinets for detecting specific interactions that the user performs with these objects.
Pressure sensors can be discreetly installed on objects such as sofas, beds, chairs and floors for tracking
Sensors 2015, 15 11333
movements and locations of the user. For example, the usage of pressure sensors on the floor in front of
the kitchen sink could serve for detecting the meal preparation activity with the help of other sensors.
In real-world scenarios using a single sensor type normally cannot provide enough information for
detecting activities, especially for some complex ones. Thus multiple sensors are needed to provide more
accurate information related to activity monitoring. Wilson and Atkeson [89] chose four kinds of binary
sensors (motion detectors, break-beam sensors, pressure sensors and contact switches) which can be
triggered by gross movement, point movement, gross manipulation and point manipulation for tracking
and monitoring activities. Ordónez et al. [90] monitored seven daily activities (leaving house, using
toileting, taking shower, sleeping, eating breakfast, having dinner, and drinking) by using three kinds of
sensors. Passive infrared sensors are used to detect motion in a specific area, reed switches are used to
detect open/close states of doors and cupboards, and float sensors are used to measure the toilet being
flushed. These low-cost, easy-to-install and long-lived binary sensors exhibit the advantages of
unobtrusive user-object interaction monitoring in a privacy-preserving way. In addition, they are easy to
replace and the gathered data require minimal computation resources. The main drawback is that they
can only provide very limited information especially for composite and multi-user activity monitoring.
Radio-Frequency Identification (RFID) works as a combination of environmental sensor and
wearable sensor technologies. It consists of a reader worn by the user and an electronic tag attached to
an object. The tag responds to a unique identifier, electronically stored in memory, when interrogated
by a reader. In smart home both passive and active RFID tags may be used. A passive RFID tag does
not contain a power source and is usually attached to an object for detecting the interaction between a
user and the object. An active RFID tag contains a battery and is often carried by a user for personal
identification throughout the house. Fujinami et al. [91] inserted RFID tags into slippers to track the
long-term daily life activities of the elderly with dementia in a group home in Japan. Philipose et al. [92]
developed a system to monitor activities in a home environment by using RFID tags attached to the
objects. In this system, the activity information is presented with a probabilistic sequence of the used
objects. Kim et al. [93] proposed an indoor ubiquitous-healthcare system (U-healthcare) based on RFID
technology to accurately locate and monitor in real-time the elderly’s whereabouts. They analyse the
locations in association with the time slots and the length of time the user stays in the same place. Then,
the collected data is used to infer information such as movements and activity patterns, and determine
the elderly’s wellbeing. RFID has as obvious advantages its small size (it can be placed out of sight) and
low cost. Moreover, due to the unique identification, RFID is well suited for tracking multiple-users’
location and interactions in order to support activities monitoring of several people [94]. RFID also has
disadvantages, such as reader collision and tag collision. Reader collision is produced when the tag is
being read by several RFID readers simultaneously, being unable to answer to them. Tag collision
usually occurs when a large volume of tags are read by the RFID tag reader and this cannot distinguish
these signals. In addition, the problem of reliability and stability, especially when reading through liquid
and metals, is another limitation of RFID.
A variety of other sensors such as light sensors, temperature sensors, humidity sensors or power
sensors have been also deployed and used in smart home environments to help in the detection of
activities. Light sensors are used to measure the intensity of light in a specific location. Temperature
sensors are used to measure the temperature of the object and its surrounding environment. Humidity
sensors are used to detect the air humidity in a specific area. Power sensors are used to detect the usage
Sensors 2015, 15 11334
of electric devices. These sensors can perform intuitive monitoring of environment and object, but on
their own they only can provide very limited information for activity monitoring.
4.2. Wearable Sensors
Wearable sensors refer to sensors that are attached to human body either directly or indirectly, and
which usually provide a continuous flow of information. Their small size allows that they are embedded
into belts, clothes, glasses, wristwatches, shoes and mobile devices to make them easier to wear. These
sensors can be divided into inertial sensors and vital sign sensors (or biosensors). Wearable inertial
sensors can give accurate descriptive features of user’s movement and body posture. Vital signs collected
from wearable biosensors such as heart rate, blood pressure and skin temperature are critical for elderly
people’s health condition monitoring. In this part, we summarize the most commonly used wearable
sensors for monitoring ambulatory activities and vital signs.
4.2.1. Inertial Sensors
Accelerometers are the most frequently used sensors for ambulatory activity monitoring. They can
measure the value of acceleration along a sensitive axis and are particularly effective in monitoring
activities related to body motion such as doing exercise, walking, standing, sitting, or walking upstairs
and downstairs. Data collected from accelerometers has four attributes: time, acceleration from x-axis,
acceleration from y-axis and acceleration from z-axis. They can provide information to indicate human
movement responding to frequency and tilt, which is critical to assess the posture. Due to their small
size and relatively low cost, accelerometers can be embedded into wrist bands, watches, bracelets and
belts to monitor the user’s activities and wirelessly send data to mobile computing devices. The context
inferred from these data can be used for long-time continuous activities monitoring and emergency
situation recognition such as fall detection. Recent researches make a try to place accelerometers on
different body parts for identifying the optimal activity monitoring performance. For example, in [95],
Zhu and Sheng monitored eight daily activities (sitting, standing, lying, walking, sit-to-stand, stand-to-sit,
lie-to-sit, and sit-to-lie) in an indoor apartment environment. They use an accelerometer worn on the
right thigh of the user to collect motion data. Mannini and Rosenberger [96] used a single accelerometer
placed at the wrist or ankle of the user to collect raw data for long-time monitoring. Lei and Bourke [97]
placed four accelerometers on four different parts of the body (chest, left under-arm, waist and thigh) to
monitor and recognize five activities (standing, sitting, lying, walking and transition. Additional recent
research and experiments about different placements of accelerometers are detailed in Table 5.
Gyroscopes use a small vibrating mass inserted into the sensor for measuring angular velocity and
maintain orientation. The change of the angle compared to the initial known value can be detected over
a period of time. Gyroscopes have some limitations including output drift over time, output offsets when
the device is in static state, as well as the limitation of sensitivity to a particular range of angular
velocities. In the field of ambulatory activities monitoring, most researches are focusing on the usage of
accelerometer sensors or the combination of accelerometer and gyroscope sensors. Narayanan et al. [98]
used a triaxial accelerometer attached to the waist to measure timed up-and-go test, sit-to-stand with five
repetitions and alternate step test with the aim of estimating the fall risk of the elderly. Greene [99] utilize
accelerometers and gyroscopes attached to the user’s two legs to measure the timed up-and-go test in
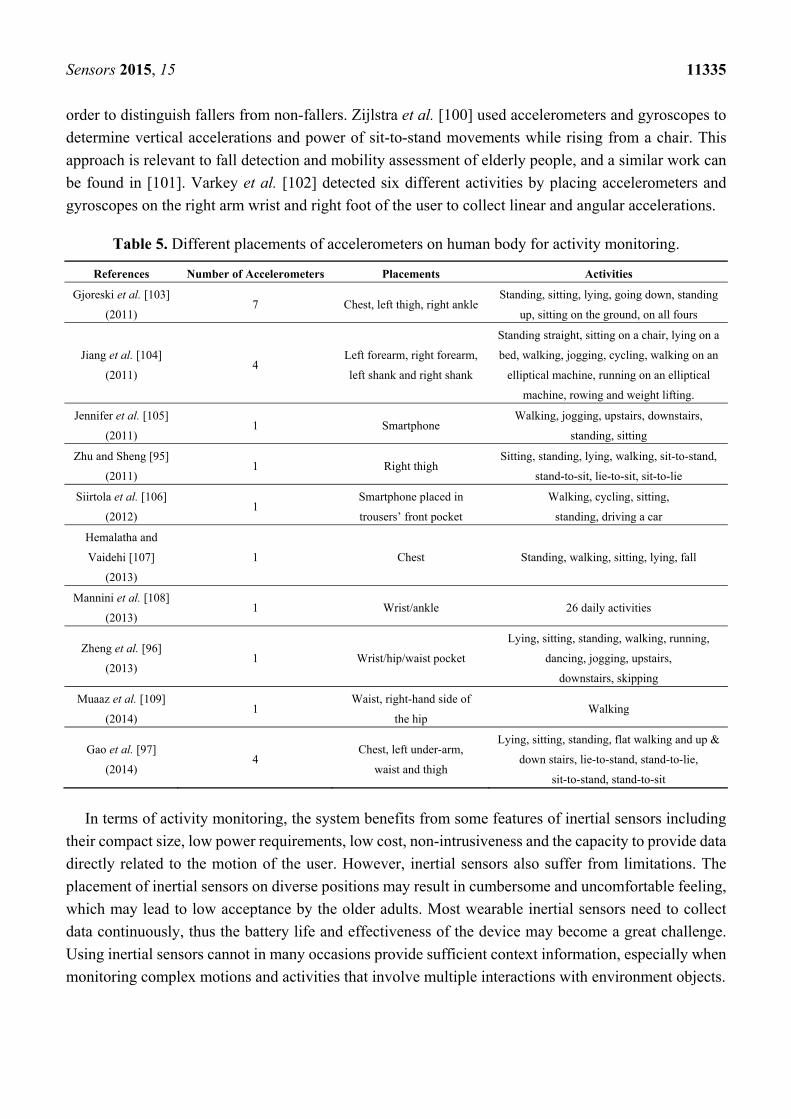
Sensors 2015, 15 11335
order to distinguish fallers from non-fallers. Zijlstra et al. [100] used accelerometers and gyroscopes to
determine vertical accelerations and power of sit-to-stand movements while rising from a chair. This
approach is relevant to fall detection and mobility assessment of elderly people, and a similar work can
be found in [101]. Varkey et al. [102] detected six different activities by placing accelerometers and
gyroscopes on the right arm wrist and right foot of the user to collect linear and angular accelerations.
Table 5. Different placements of accelerometers on human body for activity monitoring.
References Number of Accelerometers Placements Activities
Gjoreski et al. [103]
(2011) 7 Chest, left thigh, right ankle
Standing, sitting, lying, going down, standing
up, sitting on the ground, on all fours
Jiang et al. [104]
(2011) 4
Left forearm, right forearm,
left shank and right shank
Standing straight, sitting on a chair, lying on a
bed, walking, jogging, cycling, walking on an
elliptical machine, running on an elliptical
machine, rowing and weight lifting.
Jennifer et al. [105]
(2011) 1 Smartphone
Walking, jogging, upstairs, downstairs,
standing, sitting
Zhu and Sheng [95]
(2011) 1 Right thigh
Sitting, standing, lying, walking, sit-to-stand,
stand-to-sit, lie-to-sit, sit-to-lie
Siirtola et al. [106]
(2012) 1
Smartphone placed in
trousers’ front pocket
Walking, cycling, sitting,
standing, driving a car
Hemalatha and
Vaidehi [107]
(2013)
1 Chest Standing, walking, sitting, lying, fall
Mannini et al. [108]
(2013) 1 Wrist/ankle 26 daily activities
Zheng et al. [96]
(2013) 1 Wrist/hip/waist pocket
Lying, sitting, standing, walking, running,
dancing, jogging, upstairs,
downstairs, skipping
Muaaz et al. [109]
(2014) 1
Waist, right-hand side of
the hip Walking
Gao et al. [97]
(2014) 4
Chest, left under-arm,
waist and thigh
Lying, sitting, standing, flat walking and up &
down stairs, lie-to-stand, stand-to-lie,
sit-to-stand, stand-to-sit
In terms of activity monitoring, the system benefits from some features of inertial sensors including
their compact size, low power requirements, low cost, non-intrusiveness and the capacity to provide data
directly related to the motion of the user. However, inertial sensors also suffer from limitations. The
placement of inertial sensors on diverse positions may result in cumbersome and uncomfortable feeling,
which may lead to low acceptance by the older adults. Most wearable inertial sensors need to collect
data continuously, thus the battery life and effectiveness of the device may become a great challenge.
Using inertial sensors cannot in many occasions provide sufficient context information, especially when
monitoring complex motions and activities that involve multiple interactions with environment objects.
Sensors 2015, 15 11336
4.2.2. Vital Signs Sensors
Monitoring activities through vital signs provided by biosensors is recently gaining research interest.
In smart homes, some vital signs such as Electrocardiogram (ECG), heart rate, blood pressure, blood
glucose, oxygen saturation and respiratory rate are related to healthcare services. There are various
biosensors used to measure the wide range of vital signals: Electroencephalography (EEG) sensors for
monitoring electrical brain activity, Electrooculography (EOG) sensors for monitoring eye movement of
ocular activity, Electromyography (EMG) sensors for monitoring muscle activity. Electrocardiography
(ECG) sensors for monitoring cardiac activity, pressure sensors for monitoring blood pressure, CO2 gas
sensors for monitoring respiration, thermal sensors for monitoring body temperature and Galvanic Skin
Response (GSR) for monitoring skin sweating. These vital sign parameters can help monitor the user’s
health status during the execution of activities [110]. For example, regarding the brain electrical activity
monitoring, delta, alpha and beta waves are mainly used to detect sleep state, panic disorder, and sudden
unexplained nocturnal death syndrome. Ocular activity gives information on the state of the user by
detecting eye movements: rapid eye movements would indicate that the person is awake, and slowly
rolling eye movements would indicate that the user is in the state of transition from being awake to
sleeping. Muscle activity may occur in different parts of the body. For instance, a more intense activity
of chin muscles may represent swallowing or drinking. Cardiac activity mainly focuses on heart rate
monitoring, which gives indications of arrhythmias, and blood pressure monitoring, which shows
immediate changes of user’s health state such as nose bleeding. Respiration monitoring involves
measuring airflow though nose and mouth. Skin temperature is a typical way of detecting fever and skin
sweating is a good indicator of sport and housework activities.
Matthews et al. [111] designed a wearable physiological sensor suite (PSS) to monitor long-term state
for patients with cardiac or neurological conditions. This PSS measures four bioelectric signals: ECG,
EEG, EOG and EMG. Heart rate derived from ECG sensor (integrated into a belt) is used as an indicator
of health-threatening values, EOG sensor (integrated into a glass) is used to monitor eye blinking and
EMG sensor is placed on the subject’s bicep to monitor muscle activity. Tartarisco et al. [64] use ECG
sensor embedded into a wearable device to provide electrocardiographic signals for the evaluation of the
stress state of the user during the execution of daily activities. Based on the data collected from these
biosensors, services such as further disease prediction, anomaly detection and diagnosis decision-making
can be provided.
Biosensors, like other wearable sensors, have as advantages their low cost, low error levels,
non-intrusiveness and high accuracy. Besides, they are very sensitive to slight changes of physiological
signals, and thus they can support non-invasive alternatives for continuous healthcare monitoring in
smart home environments. The disadvantages of biosensors include reliability constrains and
uncomfortable feeling for long time skin attaching.
5. Sensor Data Processing
Raw data obtained from sensors has to be processed in order for it to be of any use during the later
phases (context identification, activity modelling, and learning/reasoning phase). Moreover, this
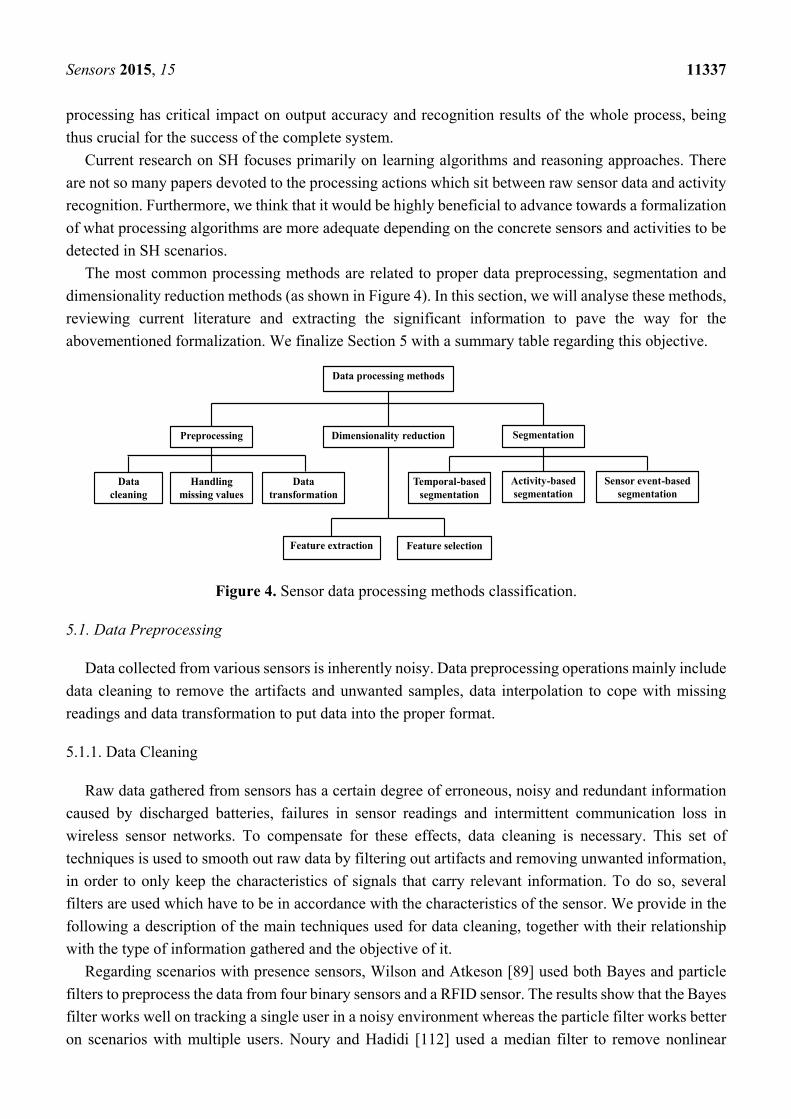
Sensors 2015, 15 11337
processing has critical impact on output accuracy and recognition results of the whole process, being
thus crucial for the success of the complete system.
Current research on SH focuses primarily on learning algorithms and reasoning approaches. There
are not so many papers devoted to the processing actions which sit between raw sensor data and activity
recognition. Furthermore, we think that it would be highly beneficial to advance towards a formalization
of what processing algorithms are more adequate depending on the concrete sensors and activities to be
detected in SH scenarios.
The most common processing methods are related to proper data preprocessing, segmentation and
dimensionality reduction methods (as shown in Figure 4). In this section, we will analyse these methods,
reviewing current literature and extracting the significant information to pave the way for the
abovementioned formalization. We finalize Section 5 with a summary table regarding this objective.
Figure 4. Sensor data processing methods classification.
5.1. Data Preprocessing
Data collected from various sensors is inherently noisy. Data preprocessing operations mainly include
data cleaning to remove the artifacts and unwanted samples, data interpolation to cope with missing
readings and data transformation to put data into the proper format.
5.1.1. Data Cleaning
Raw data gathered from sensors has a certain degree of erroneous, noisy and redundant information
caused by discharged batteries, failures in sensor readings and intermittent communication loss in
wireless sensor networks. To compensate for these effects, data cleaning is necessary. This set of
techniques is used to smooth out raw data by filtering out artifacts and removing unwanted information,
in order to only keep the characteristics of signals that carry relevant information. To do so, several
filters are used which have to be in accordance with the characteristics of the sensor. We provide in the
following a description of the main techniques used for data cleaning, together with their relationship
with the type of information gathered and the objective of it.
Regarding scenarios with presence sensors, Wilson and Atkeson [89] used both Bayes and particle
filters to preprocess the data from four binary sensors and a RFID sensor. The results show that the Bayes
filter works well on tracking a single user in a noisy environment whereas the particle filter works better
on scenarios with multiple users. Noury and Hadidi [112] used a median filter to remove nonlinear
Data processing methods
Dimensionality reduction Preprocessing
Feature selectionFeature extraction
Data transformation
Handling missing values
Data cleaning
Segmentation
Sensor event-based segmentation
Activity-based segmentation
Temporal-based segmentation
Sensors 2015, 15 11338
artifacts. They also use a “first order hold” (FOH) filter to remove redundancy in the dataset collected
from presence sensors placed in different areas in a smart home. Guettari et al. [113] also used a median
filter to avoid abnormal measurements of passive presence sensors used to detect human presence within
a smart home.
The 3D acceleration data collected from any accelerometer contains a constant component due to
gravity. The effect of gravity should be eliminated in order to obtain the real acceleration experimented
by the device. Khan et al. [114] applied a low-pass filter to isolate the constant gravity acceleration in
the time series dataset collected from accelerometers. Wang et al. [115] compared the noise reduction
performance of four filters (median filter, Kalman filter, low-pass filter and discrete wavelet package
shrinkage) on the acceleration signals captured by a nine-axis wireless body sensor network platform.
The results show that, in terms of signal-to-noise ratio (SNR) and correlation coefficient (R) between
filtered and reference signals, Kalman filter exhibits the greatest figures, followed by the median filter
and the discrete wavelet package shrinkage, the low-pass filter has the worst performance due to the
waveform delay it causes. The authors also found that window length has great impact on the real-time
performance of the median filter and the inappropriate choose of filter order and cut-off frequency would
lead to large waveform delay of low-pass filters.
ECG signals usually contain unwanted interference such as electrode noise, muscle artifacts and line
noise. Removing these unwanted interferences is helpful for accurate diagnosis and decision making.
Sen and Chandrakar [116] used an extended Kalman filter to remove noise from ECG signals. When
compared to median filter, the extended Kalman filter provides very low mean square error and very
high peak signal to noise ratio. In [117], since EOG signal information corresponding to basic eye
movements lies in the frequency range 0.5 Hz–35 Hz, the authors use a high-pass filter with cut-off
frequency = 0.5 Hz and a low-pass filter with cut-off frequency = 35 Hz to keep the interesting frequency
band. Bulling et al. [118] compared the performance of median filter, low-pass filter and wavelet
package shrinkage on real-time EOG signals. They conclude that the median filter provides the best
results without introducing any artificial signal changes. The selection of window size is again found to
be critical. It should be small enough to retain short signal pulses. Khushaba et al. [119] applied a
bandpass filter between 20 and 450 Hz on EMG signals to remove noise. In addition, a notch filter is
used to remove the 50 Hz power line interference.
There are two important issues related to datasets obtained from smart environments which may
highly impact on further data analysis and classification accuracy. These problems are called class
imbalance (i.e., classes which exhibit much more samples than others, causing uncompensation in
training) and class overlapping (i.e., a subset of the samples may be associated to several different classes
with similar probabilities, causing ambiguity) [99]. For overcoming this issue, Barnan et al. [120]
proposed a novel approach, named clustering-based under-sampling (ClusBUS), which they apply to the
CASAS smart home dataset to deal with the overlapping data points in the presence of imbalance class
distribution. Compared to conventional methods which interpret boundary points as noise, the ClusBUS
adopts an under-sampling method based on clustering, able to identify “interesting” clusters in the
instance space and ambiguous data regions where samples in the minority are embedded into the majority
class. The results show that ClusBUS can provide more importance to the minority class by discarding
majority samples from the ambiguous data regions. Goodwin et al. [121] also used under-sampling
technique to deal with the unknown classes in an acceleration dataset. In their experiment the majority
Sensors 2015, 15 11339
class consists of not labelled motor movement samples, and under-sampling is performed on them to
balance the dataset by discarding a proportion of the samples in this class.
5.1.2. Handling Missing Values
Data collected from sensor networks sometimes has missing values. For instance, almost 30% of the
readings are lost in typical RFID datasets. These missing readings can be interpolated with proper values.
Linear interpolation is the most commonly used technique to fill in the missing values. Parlak and
Marsic [122] used passive RFID tags to detect object motions for trauma resuscitation, where they face
the problem of irregular intervals tag readings produced by irregularities in data arrival and signal
transmission delay. The authors use linear interpolation to fill in the missing samples within each
window, being the number of interpolation points determined by the window size. Muaaz and
Mayrhofer [109] used a Personal Mobile Device (PMD) to measure parameters related to users’ walking.
The raw data is only collected when Android API is triggered, and thus the accelerometer sensor does
not provide data at equal intervals. They adopt linear interpolation techniques to reshape acceleration
data into equal intervals, and this reshaped data can also be oversampled to avoid relevant values loss.
Other interpolation techniques include nearest neighbour interpolation and cubic interpolation. For
instance, Shayei et al. [123] proposed to apply cubic spline interpolation on R-waves present in the ECG
signals to derive the respiratory signal. Their results show that the algorithm both reduces the
computational complexity and preserves the same performance level.
5.1.3. Data Transformation
In order to perform further data processing and analysis, data has to be put into the proper format. For
example, the values obtained directly from a temperature sensor are in numeric format, which cannot be
used in some data mining algorithms. Some of these algorithms need more suitable types of attributes
such as nominal or categorical values. The function of some of the data transformation methods is
precisely to convert raw data into appropriate attributes format in accordance to the system requirements.
Rodner and litz [124] used association rule mining approaches to model typical behaviours of inhabitants
for ambient assisted living systems. The data collected from a motion detector with integrated lux meter
has a format (timestamp [numeric], motion [binominal] and lux [numeric]) containing numeric data
which cannot be used in rule mining. The authors convert observed numeric values into nominal
attributes transforming, for example, the numeric lux values into categories such as “bright” or “dark”.
As another example, Sun and Zhang [125] transformed the raw analog signals collected from ECG to
digital attributes for further signal analysis.
Another commonly used data format transformation approach is data normalization, which is required
for obtaining a representation format of sensor output values that allows their quantitative or qualitative
direct comparison. Due to the enormous range of different possible scales, data normalization is
performed considering the following criteria [126]:
1. Nature of scale, which refers to the basic mathematical properties of the used scales.
2. Homogeneity, which refers to whether, or not, the sensors are measuring the same
physical phenomenon.
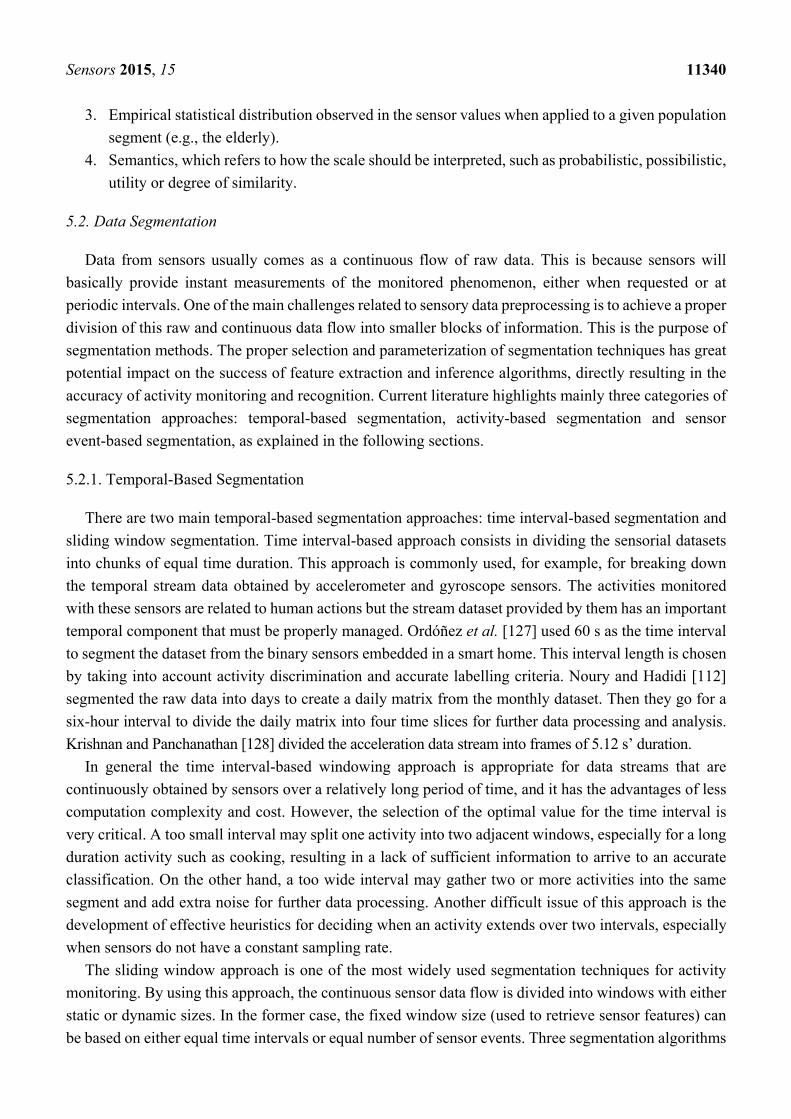
Sensors 2015, 15 11340
3. Empirical statistical distribution observed in the sensor values when applied to a given population
segment (e.g., the elderly).
4. Semantics, which refers to how the scale should be interpreted, such as probabilistic, possibilistic,
utility or degree of similarity.
5.2. Data Segmentation
Data from sensors usually comes as a continuous flow of raw data. This is because sensors will
basically provide instant measurements of the monitored phenomenon, either when requested or at
periodic intervals. One of the main challenges related to sensory data preprocessing is to achieve a proper
division of this raw and continuous data flow into smaller blocks of information. This is the purpose of
segmentation methods. The proper selection and parameterization of segmentation techniques has great
potential impact on the success of feature extraction and inference algorithms, directly resulting in the
accuracy of activity monitoring and recognition. Current literature highlights mainly three categories of
segmentation approaches: temporal-based segmentation, activity-based segmentation and sensor
event-based segmentation, as explained in the following sections.
5.2.1. Temporal-Based Segmentation
There are two main temporal-based segmentation approaches: time interval-based segmentation and
sliding window segmentation. Time interval-based approach consists in dividing the sensorial datasets
into chunks of equal time duration. This approach is commonly used, for example, for breaking down
the temporal stream data obtained by accelerometer and gyroscope sensors. The activities monitored
with these sensors are related to human actions but the stream dataset provided by them has an important
temporal component that must be properly managed. Ordóñez et al. [127] used 60 s as the time interval
to segment the dataset from the binary sensors embedded in a smart home. This interval length is chosen
by taking into account activity discrimination and accurate labelling criteria. Noury and Hadidi [112]
segmented the raw data into days to create a daily matrix from the monthly dataset. Then they go for a
six-hour interval to divide the daily matrix into four time slices for further data processing and analysis.
Krishnan and Panchanathan [128] divided the acceleration data stream into frames of 5.12 s’ duration.
In general the time interval-based windowing approach is appropriate for data streams that are
continuously obtained by sensors over a relatively long period of time, and it has the advantages of less
computation complexity and cost. However, the selection of the optimal value for the time interval is
very critical. A too small interval may split one activity into two adjacent windows, especially for a long
duration activity such as cooking, resulting in a lack of sufficient information to arrive to an accurate
classification. On the other hand, a too wide interval may gather two or more activities into the same
segment and add extra noise for further data processing. Another difficult issue of this approach is the
development of effective heuristics for deciding when an activity extends over two intervals, especially
when sensors do not have a constant sampling rate.
The sliding window approach is one of the most widely used segmentation techniques for activity
monitoring. By using this approach, the continuous sensor data flow is divided into windows with either
static or dynamic sizes. In the former case, the fixed window size (used to retrieve sensor features) can
be based on either equal time intervals or equal number of sensor events. Three segmentation algorithms
Sensors 2015, 15 11341
are of particular interest in current literature: Fixed-size Non-overlapping Sliding Window (FNSW),
Fixed-size Overlapping Sliding Window (FOSW) and Sliding Window And Bottom-up (SWAB) [129].
FNSW is a simple segmentation approach without any data overlap, thus the amount of windows can be
exactly calculated (if the complete time interval or the complete number of samples is known).
Van et al. [130] used FNSW to divide the stream dataset collected from a smart home environment, the
results showing good performance for recognizing the activities “leaving home”, “toileting”,
“showering”, “sleeping”, “having breakfast”, “having dinner” and “drinking”. However since this
algorithm works with a fixed window size, the data associated with a particular event such as a fall could
be split in different windows, resulting in important loss of information. FOSW is an improvement of
FNSW which introduces flexibility to solve some of its main limitations. FOSW includes data overlap
between adjacent windows, and the different overlapping percentages can be referred to as window
shifts. These values may vary from 0% to 100%. FOSW with 0% overlapping is equal to the FNSW
segmentation technique, whereas a 100% overlap is an extreme value with limited usefulness since in
this case windows would not slide at all, being the same data always included in all of them. Note that
FOSW with 0% overlap and fixed time-based size actually boils down to the time-interval based
segmentation approach. SWAB segmentation tries to combine the speed of the aforementioned simpler
sliding window algorithms with the more accurate segmentation that would stem from a complete offline
processing of the data stream. It does so by working with a buffer of samples that normally is wide
enough to contain several segments. This buffer is emptied “from the left” and refilled “to the right”
with a number of samples (or a time interval) that depends on the structure of the data.
Achumba et al. [131] set up an experiment to compare the classification accuracy of FOSW with
different window overlap values (0%, 25%, 50%, 75% and 90%) applied to acceleration data for
recognizing ambulatory activities. Their work determine that the optimal segmentation approach is
FOSW with 90% of window overlap and 12 s of window size, reaching a classification accuracy of
98.38%. They also found that SWAB segmentation scales linearly with the amount of data and produces
high quality approximations at the expense of more complex implementations (compared to FOSW
and FNSW).
Dynamic sliding window methods enable varying window sizes based on different sensor features
(such as sensor state change or location change of consecutive sensor data) and/or on typical activity
duration. Laguna et al. [132] proposed a dynamic sliding window approach by using significant events
to define the window boundaries. This approach adjusts dynamically not only the window sizes but also
the shift to apply at every step. Krishnan et al. [133] proposed and evaluated a combination of static and
dynamic sliding window sizes. They improve the sliding window approach with three modifications that
capture the relationship between sensor events within a window and between multiple windows. The
three modifications are oriented to calculate the size of the window to be used at each moment depending
on the sensor data, the environment and the monitored activity. In order to achieve this, they consider
the following information for the selection of the window size: time-based weighting, mutual
information-based weighting, activity probabilities in the previous window and previously detected
activity. The results on several real-world smart home datasets suggest that the adding of past contextual
information to the process leads to enhanced performance for streaming activity recognition.
The sliding window segmentation approach is especially beneficial when dealing with activities with
an important periodic component (such as walking and running) and also in the case of static activities
Sensors 2015, 15 11342
(e.g., sitting and standing). The computational complexity of the reasoning performed on segmented data
depends on the number of samples within each window, thus there is usually a tradeoff between
performance and accuracy of activity monitoring systems that use segmentation methods. In current
literature, a wide range of window sizes are adopted depending on the different monitored activities. [105]
uses sliding window segmentation with window size = 10 s to divide the dataset collected from an
accelerometer embedded into a smartphone. The results show an efficient accuracy on recognizing
activities such as walking, jogging, standing, sitting, walking upstairs and downstairs. The same window
size is used in [96]. In [106], a window size of 7 s is used on acceleration dataset to monitor ambulatory
activities such as walking, cycling, sitting and standing. Authors of [104] use a windows size of 6 s for
dataset collected from four accelerometers placed in different parts of the body. The smallest window
sizes, such as 4 s [108], 3.88 s [37,63], 2 s [108], 1.5 s [134], 1 s [97,103,135] and 0.08 s [136] are also
used to segment acceleration datasets. Intuitively, decreasing the window size allows for a faster
segmentation process and activity detection, but it would trigger the execution of learning algorithms
more frequently resulting in higher overhead. Banos et al. [137] evaluate different window sizes used
for activity recognition with a non-overlapping sliding windowing approach. These sizes range from
0.25 to 7 s in 0.25 s steps, and the concrete interval at each moment is chosen according to the values
used in previous activity recognition systems. As a result they proved that short windows normally result
in better recognition performance, and the 1 to 2 s interval exhibits the best trade-off between recognition
speed and accuracy from a global perspective. Generally, from previous work we may infer that activities
with high motion variability (e.g., household activities) normally require longer window sizes whereas
activities related to the observation of specific body parts (or the whole body) (e.g., walking, running,
cycling) benefit from shorter window sizes. As a final remark on these techniques, it is significant to
note that temporal-based segmentation works well on single user sequential datasets, but it has limited
ability on segmenting multi-user datasets containing concurrent and interleaved activities.
5.2.2. Activity-Based Segmentation
Activity-based segmentation consists in dividing the sensory data stream by identifying the start and
end points of each activity. As a consequence, the main issue to be tackled for these methods is the
correct identification of those boundary instants. Various methods are proposed in the literature to
identify the beginning and ending points of activities. Yoshizawa et al. [138] proposed a method to
identify these limits, distinguishing between static activities (such as standing and sitting) and
movement-related ones (such as walking and running). In their approach, a threshold is set for detecting
the changing points of static activities, and the analysis of variations in the frequency domain is used for
determining the beginning and ending points of movement-related activities. Similar work can be found
in [139], where the authors propose a model based on wavelet decomposition to separate into segments
the continuous data records collected from an accelerometer. This model detects frequency changes for
the location of three walking activities’ limits (walking, ascending stairs and descending stairs). Another
method to identify the beginning and ending points of an activity is achieved by asking the user to give
explicit feedback. In [140], volunteers in the experiments are asked to stand still for a few seconds
between two activities to identify these transition points. A similar method is used in [141], where the
subjects are asked to set the beginning and ending points of daily life activities such as cooking and
Sensors 2015, 15 11343
cleaning though a smart phone interface. Obviously, this method is only feasible in laboratory
environments. Moreover, the participants perform the activities following instructions from experts, thus
leading to potentially artificial behaviors (i.e., not totally equal to the ones that would be observed in
real life).
5.2.3. Sensor Event-Based Segmentation
Sensor event-based segmentation approaches are used for recognizing activities which consist of a
sequence of movements, events or actions that take place in a certain time order and that might be
interleaved with other activities’ events, for example, “household” or “meal preparation” activities.
Compared to temporal-based segmentation, in this case the events that form the activity may not be
distributed uniformly in time and may occur sporadically, thus the size of the windows is not fixed. For
sensors embedded in smart environments, Fahim et al. [142] divided the data streams into sequence
windows with equal number of sensor events, being the duration of each window dependent on the
duration of the individual events. Their approach considers the possibility that there may be no sensor
readings triggered in a period of time during the execution of activities, but it treats all the sensor events
with equal importance. To overcome that problem, Tapia et al. [72] proposed a method to explicitly
incorporate the activity time span calculated as the average duration taking into account all the activity
labels generated by Experience Sampling Method (ESM) and indirect observation. Hong and Nugent [143]
developed three algorithms to segment time series events by extracting into each segment the
consecutive sensor events associated with a complete activity. Their first proposal is based on the
location perspective of activities, by assuming that “if two conjunctive sensor events are part of an
activity, the locations indicated by two sensors should both belong to the set of locations that the activity
can be performed in, otherwise the sensors contribute to the different activities”. The second
segmentation approach they describe is model-based, and is based on modelling each activity in terms
of sensor activation to determine if two consecutive sensor readings are involved in the same set of
activities. Their third proposed algorithm is based on the predominant sensor associated with an activity,
being the predominant sensor the most important one during the activity time span.
In order to segment concurrent datasets, segmentation approaches based on similarity measurements
between sensor events have obtained more research attention. Ye et al. [84] developed a semantic-driven
online sensor data segmentation method based on temporal, spatial and object semantics of sensor
events. These semantics are used to evaluate the semantic similarity between two adjacent sensor events
and to consequently divide, in a dynamic manner, a sequence of raw sensor events into segments. Each
segment will then be mapped to one activity. Stevenson et al. [70] proposed a real-time multi-user
segmentation mechanism based on sensor and activity semantics to partition a continuous sensor
sequence into fragments. In this case the segmentation is done by using event patterns obtained from the
semantic dissimilarity among sensor events. Temporal knowledge described in the generic ontological
models is used to evaluate the semantic similarity between consecutive sensor events and control the
time interval of fragments. Compared to the static sliding window approaches, their segmentation
approach can detect the boundary of concurrent activities more accurately, as well as produce a smaller
number of partitions better adjusted to real activities.
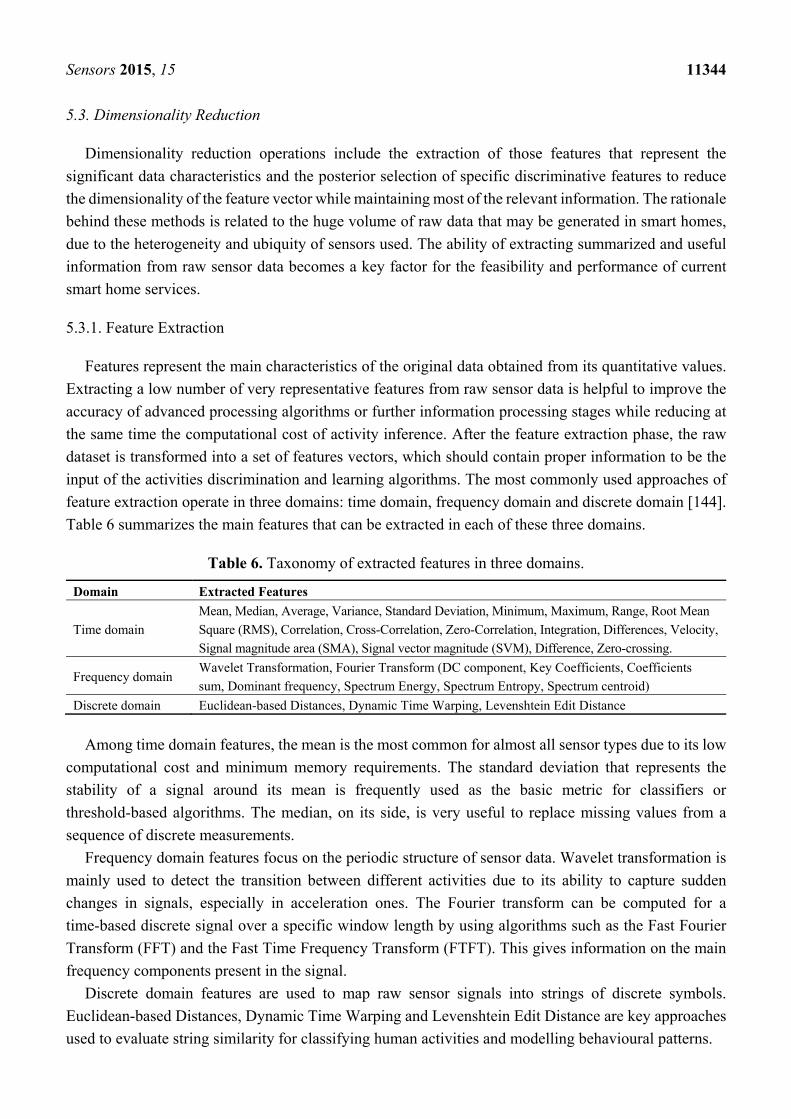
Sensors 2015, 15 11344
5.3. Dimensionality Reduction
Dimensionality reduction operations include the extraction of those features that represent the
significant data characteristics and the posterior selection of specific discriminative features to reduce
the dimensionality of the feature vector while maintaining most of the relevant information. The rationale
behind these methods is related to the huge volume of raw data that may be generated in smart homes,
due to the heterogeneity and ubiquity of sensors used. The ability of extracting summarized and useful
information from raw sensor data becomes a key factor for the feasibility and performance of current
smart home services.
5.3.1. Feature Extraction
Features represent the main characteristics of the original data obtained from its quantitative values.
Extracting a low number of very representative features from raw sensor data is helpful to improve the
accuracy of advanced processing algorithms or further information processing stages while reducing at
the same time the computational cost of activity inference. After the feature extraction phase, the raw
dataset is transformed into a set of features vectors, which should contain proper information to be the
input of the activities discrimination and learning algorithms. The most commonly used approaches of
feature extraction operate in three domains: time domain, frequency domain and discrete domain [144].
Table 6 summarizes the main features that can be extracted in each of these three domains.
Table 6. Taxonomy of extracted features in three domains.
Domain Extracted Features
Time domain
Mean, Median, Average, Variance, Standard Deviation, Minimum, Maximum, Range, Root Mean
Square (RMS), Correlation, Cross-Correlation, Zero-Correlation, Integration, Differences, Velocity,
Signal magnitude area (SMA), Signal vector magnitude (SVM), Difference, Zero-crossing.
Frequency domain Wavelet Transformation, Fourier Transform (DC component, Key Coefficients, Coefficients
sum, Dominant frequency, Spectrum Energy, Spectrum Entropy, Spectrum centroid)
Discrete domain Euclidean-based Distances, Dynamic Time Warping, Levenshtein Edit Distance
Among time domain features, the mean is the most common for almost all sensor types due to its low
computational cost and minimum memory requirements. The standard deviation that represents the
stability of a signal around its mean is frequently used as the basic metric for classifiers or
threshold-based algorithms. The median, on its side, is very useful to replace missing values from a
sequence of discrete measurements.
Frequency domain features focus on the periodic structure of sensor data. Wavelet transformation is
mainly used to detect the transition between different activities due to its ability to capture sudden
changes in signals, especially in acceleration ones. The Fourier transform can be computed for a
time-based discrete signal over a specific window length by using algorithms such as the Fast Fourier
Transform (FFT) and the Fast Time Frequency Transform (FTFT). This gives information on the main
frequency components present in the signal.
Discrete domain features are used to map raw sensor signals into strings of discrete symbols.
Euclidean-based Distances, Dynamic Time Warping and Levenshtein Edit Distance are key approaches
used to evaluate string similarity for classifying human activities and modelling behavioural patterns.
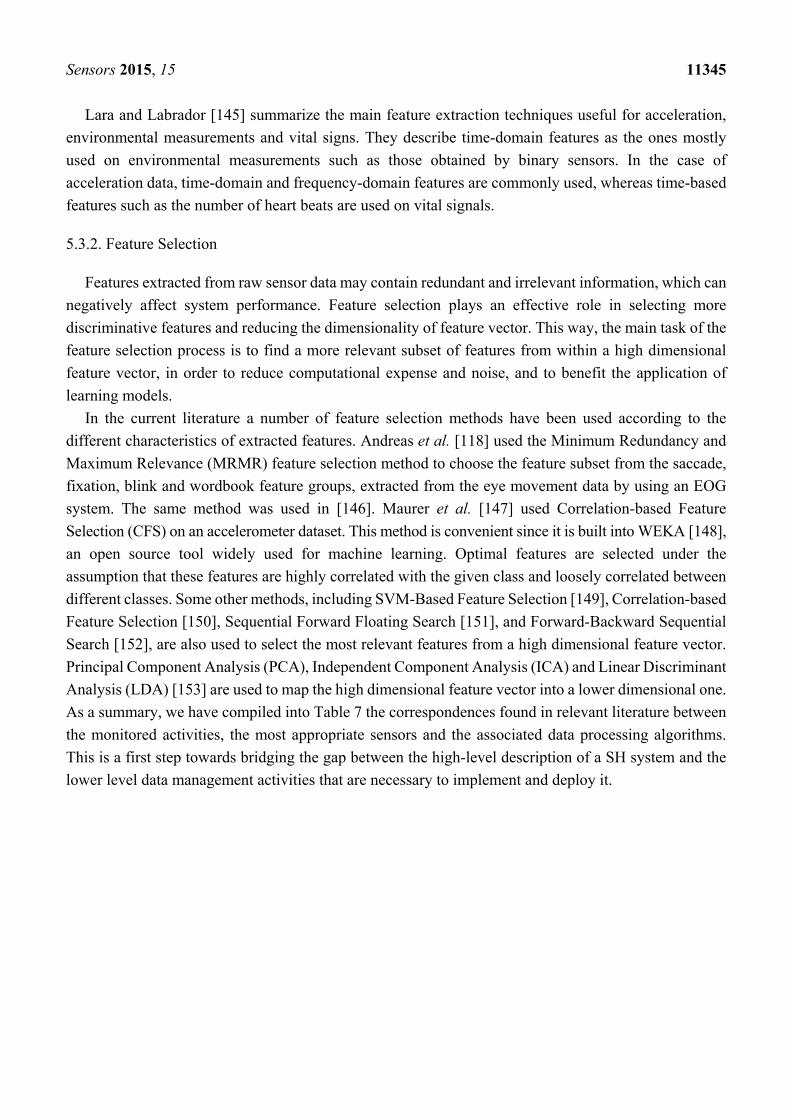
Sensors 2015, 15 11345
Lara and Labrador [145] summarize the main feature extraction techniques useful for acceleration,
environmental measurements and vital signs. They describe time-domain features as the ones mostly
used on environmental measurements such as those obtained by binary sensors. In the case of
acceleration data, time-domain and frequency-domain features are commonly used, whereas time-based
features such as the number of heart beats are used on vital signals.
5.3.2. Feature Selection
Features extracted from raw sensor data may contain redundant and irrelevant information, which can
negatively affect system performance. Feature selection plays an effective role in selecting more
discriminative features and reducing the dimensionality of feature vector. This way, the main task of the
feature selection process is to find a more relevant subset of features from within a high dimensional
feature vector, in order to reduce computational expense and noise, and to benefit the application of
learning models.
In the current literature a number of feature selection methods have been used according to the
different characteristics of extracted features. Andreas et al. [118] used the Minimum Redundancy and
Maximum Relevance (MRMR) feature selection method to choose the feature subset from the saccade,
fixation, blink and wordbook feature groups, extracted from the eye movement data by using an EOG
system. The same method was used in [146]. Maurer et al. [147] used Correlation-based Feature
Selection (CFS) on an accelerometer dataset. This method is convenient since it is built into WEKA [148],
an open source tool widely used for machine learning. Optimal features are selected under the
assumption that these features are highly correlated with the given class and loosely correlated between
different classes. Some other methods, including SVM-Based Feature Selection [149], Correlation-based
Feature Selection [150], Sequential Forward Floating Search [151], and Forward-Backward Sequential
Search [152], are also used to select the most relevant features from a high dimensional feature vector.
Principal Component Analysis (PCA), Independent Component Analysis (ICA) and Linear Discriminant
Analysis (LDA) [153] are used to map the high dimensional feature vector into a lower dimensional one.
As a summary, we have compiled into Table 7 the correspondences found in relevant literature between
the monitored activities, the most appropriate sensors and the associated data processing algorithms.
This is a first step towards bridging the gap between the high-level description of a SH system and the
lower level data management activities that are necessary to implement and deploy it.
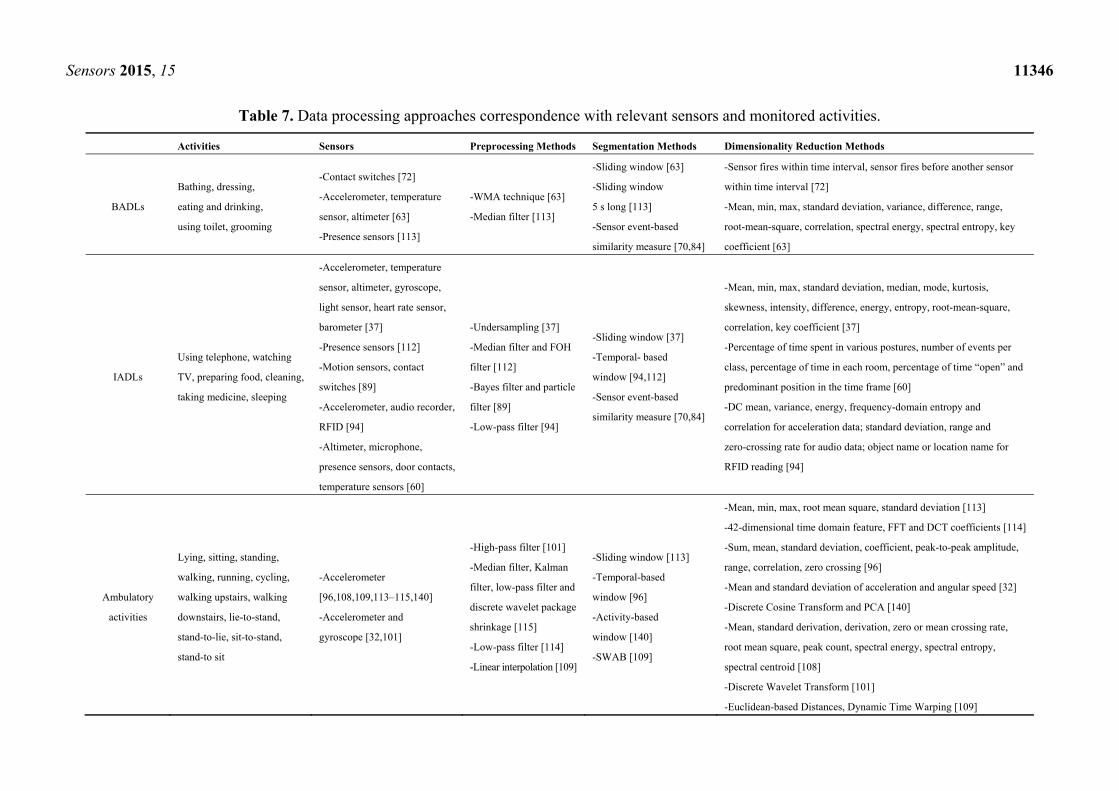
Sensors 2015, 15 11346
Table 7. Data processing approaches correspondence with relevant sensors and monitored activities.
Activities Sensors Preprocessing Methods Segmentation Methods Dimensionality Reduction Methods
BADLs
Bathing, dressing,
eating and drinking,
using toilet, grooming
-Contact switches [72]
-Accelerometer, temperature
sensor, altimeter [63]
-Presence sensors [113]
-WMA technique [63]
-Median filter [113]
-Sliding window [63]
-Sliding window
5 s long [113]
-Sensor event-based
similarity measure [70,84]
-Sensor fires within time interval, sensor fires before another sensor
within time interval [72]
-Mean, min, max, standard deviation, variance, difference, range,
root-mean-square, correlation, spectral energy, spectral entropy, key
coefficient [63]
IADLs
Using telephone, watching
TV, preparing food, cleaning,
taking medicine, sleeping
-Accelerometer, temperature
sensor, altimeter, gyroscope,
light sensor, heart rate sensor,
barometer [37]
-Presence sensors [112]
-Motion sensors, contact
switches [89]
-Accelerometer, audio recorder,
RFID [94]
-Altimeter, microphone,
presence sensors, door contacts,
temperature sensors [60]
-Undersampling [37]
-Median filter and FOH
filter [112]
-Bayes filter and particle
filter [89]
-Low-pass filter [94]
-Sliding window [37]
-Temporal- based
window [94,112]
-Sensor event-based
similarity measure [70,84]
-Mean, min, max, standard deviation, median, mode, kurtosis,
skewness, intensity, difference, energy, entropy, root-mean-square,
correlation, key coefficient [37]
-Percentage of time spent in various postures, number of events per
class, percentage of time in each room, percentage of time “open” and
predominant position in the time frame [60]
-DC mean, variance, energy, frequency-domain entropy and
correlation for acceleration data; standard deviation, range and
zero-crossing rate for audio data; object name or location name for
RFID reading [94]
Ambulatory
activities
Lying, sitting, standing,
walking, running, cycling,
walking upstairs, walking
downstairs, lie-to-stand,
stand-to-lie, sit-to-stand,
stand-to sit
-Accelerometer
[96,108,109,113–115,140]
-Accelerometer and
gyroscope [32,101]
-High-pass filter [101]
-Median filter, Kalman
filter, low-pass filter and
discrete wavelet package
shrinkage [115]
-Low-pass filter [114]
-Linear interpolation [109]
-Sliding window [113]
-Temporal-based
window [96]
-Activity-based
window [140]
-SWAB [109]
-Mean, min, max, root mean square, standard deviation [113]
-42-dimensional time domain feature, FFT and DCT coefficients [114]
-Sum, mean, standard deviation, coefficient, peak-to-peak amplitude,
range, correlation, zero crossing [96]
-Mean and standard deviation of acceleration and angular speed [32]
-Discrete Cosine Transform and PCA [140]
-Mean, standard derivation, derivation, zero or mean crossing rate,
root mean square, peak count, spectral energy, spectral entropy,
spectral centroid [108]
-Discrete Wavelet Transform [101]
-Euclidean-based Distances, Dynamic Time Warping [109]
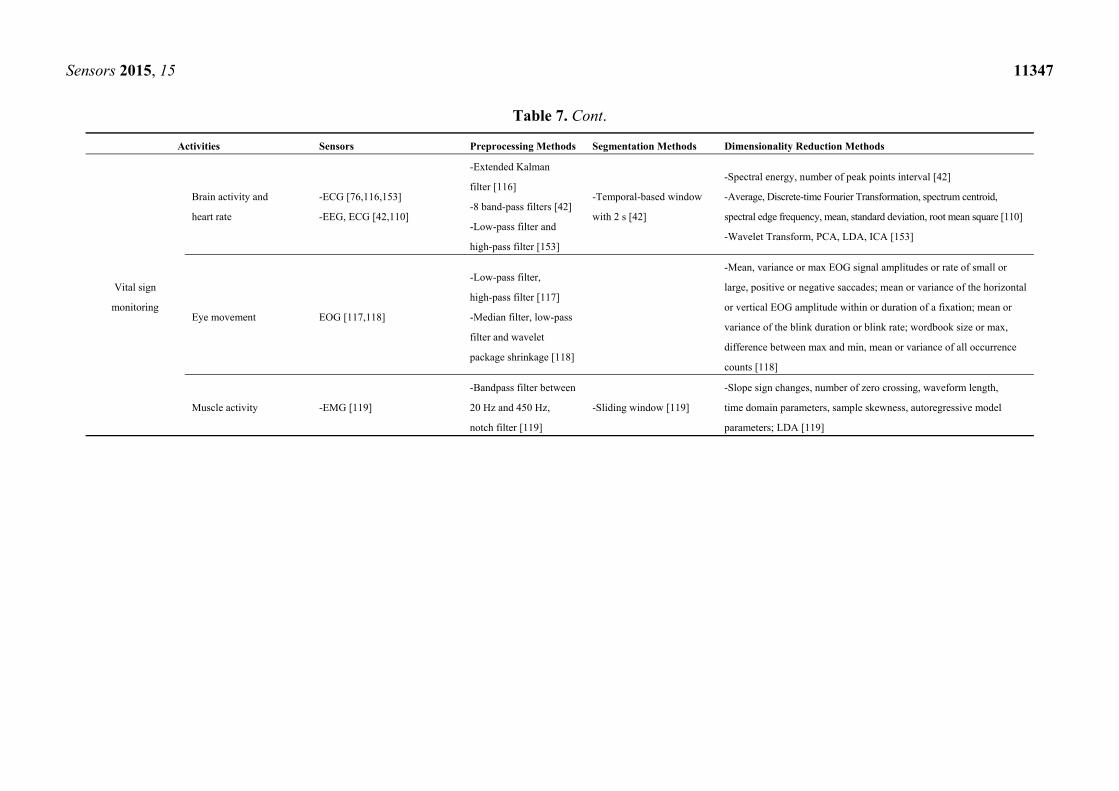
Sensors 2015, 15 11347
Table 7. Cont.
Activities Sensors Preprocessing Methods Segmentation Methods Dimensionality Reduction Methods
Vital sign
monitoring
Brain activity and
heart rate
-ECG [76,116,153]
-EEG, ECG [42,110]
-Extended Kalman
filter [116]
-8 band-pass filters [42]
-Low-pass filter and
high-pass filter [153]
-Temporal-based window
with 2 s [42]
-Spectral energy, number of peak points interval [42]
-Average, Discrete-time Fourier Transformation, spectrum centroid,
spectral edge frequency, mean, standard deviation, root mean square [110]
-Wavelet Transform, PCA, LDA, ICA [153]
Eye movement EOG [117,118]
-Low-pass filter,
high-pass filter [117]
-Median filter, low-pass
filter and wavelet
package shrinkage [118]
-Mean, variance or max EOG signal amplitudes or rate of small or
large, positive or negative saccades; mean or variance of the horizontal
or vertical EOG amplitude within or duration of a fixation; mean or
variance of the blink duration or blink rate; wordbook size or max,
difference between max and min, mean or variance of all occurrence
counts [118]
Muscle activity -EMG [119]
-Bandpass filter between
20 Hz and 450 Hz,
notch filter [119]
-Sliding window [119]
-Slope sign changes, number of zero crossing, waveform length,
time domain parameters, sample skewness, autoregressive model
parameters; LDA [119]
Sensors 2015, 15 11348
6. Identified Research Challenges
We explore in this section the main research challenges that stem from the reviewed literature, related
to the enhancement of quality of life in SH for older people.
6.1. Accuracy and Robustness in Activity Recognition
Some human activities are quite complex to detect either because they are composed of many lower
level actions, or because these actions may be different for different people or different time. Most
research on this field is more focused on recognizing what activity is taking place rather than also
evaluating how correctly is the activity being carried out and other qualitative information. For example,
a system can detect that the activity “dressing” is occurring, but it is much more difficult to get the
information of whether the user performs this activity correctly or not. There are activities that have
similar characteristics, such as “drinking milk” and “drinking water”. However, the nutritional
implications of them are very different. In order to enhance the discrimination of similar activities several
researchers have tried to add more sensors to add accuracy to the activity monitoring.
In addition to the above, there are many other factors that can affect the accuracy and robustness of
the activity monitoring. For example, an activity can be performed in different ways by different users,
or even by the same user in different time periods. Therefore, the robustness of the system to recognize
the activity becomes a challenge. For addressing this issue, some researchers have tried to train
algorithms with a larger amount of sensor data to capture more features. Furthermore, a variety of
wearable devices have been developed to achieve real-time full-body activity monitoring. In summary a
clear understanding of what activity is being performed by the user in terms of accuracy and robustness
is still highly challenging.
6.2. High-Level and Long-Term Activity Monitoring
Most current work on activity monitoring and detection focuses on relatively short low-level activities
that are performed in seconds or minutes in laboratory environments. The monitoring of high-level
activities on larger time scales and in real-world scenarios is clearly more difficult in terms of the
obtention of the data and proper formalization of the activities. Yet, these high-level long-term real
activities monitoring is key for detecting behavioural patterns of elderly people.
At this respect there is a lack of formalization proposals for high-level activities and their required
sensors. Normally these activities contain several sub-activities that may be performed in different order
or even in parallel. It would be highly beneficial to define a high-level language for describing activities
that contain other activities with high flexibility. In addition, monitoring these activities requires more
seamless and efficient data gathering and processing techniques to maximize users’ acceptance and
minimize the burden posed on people. Making sensors more robust, less obtrusive and more comfortable
to wear also becomes a challenge when dealing with high-level and long-term activities monitoring.
6.3. Multi-User and Multi-Sensor Activity Monitoring
In most recent experiments, sensor data is collected and analysed from a single user activity in smart
home. However, in real life scenarios, activities can be performed by multiple users concurrently and
Sensors 2015, 15 11349
there may be interaction between them. Activity monitoring of multiple users is clearly more
challenging. The issues to be addressed include the design of appropriate sensors to capture the
interaction between multiple users, finding suitable methods to model this interaction, and inferring
useful information from these observations.
Not only multiple users, but also multiple sensors pose research challenges. To detect most activities
a single sensor cannot provide with enough information. Some works have been done to embed diverse
sensors in smart phones in order to promote applications for human movement monitoring. Anyway,
even if the physical sensors are already available, to process different sensor data in order to provide
sufficient accuracy for activity monitoring is still an open research issue.
6.4. Real World Data Collection
On many occasions elderly people activity monitoring is performed in laboratory environments. In
these cases, the experts design controlled experiments and the activities to be carried out depending on
the requirements of the research. Participants perform the activities following the experts’ guidelines.
For example, when detecting fall situations for elderly people, participants fall in a controlled manner as
specified for each devised scenario.
These experiments are helpful for experts to collect data and choose the appropriate methods to
process it, but in a real world scenario it is almost impossible to foresee the circumstances under which
some activities will occur. Moreover, elderly people may perform two or three activities at the same time
(such as drinking water while watching TV, short hand gestures while jogging and walking) and one
activity may be interrupted by another one (such as answering the telephone while preparing a meal).
Thus it is still a challenge to apply the algorithms to real world activity monitoring. There is also a lack
of benchmarks containing annotated reference datasets for researchers to apply, assess and compare the
results of their proposed approaches.
6.5. Heterogeneous Sensor Data Representation
Generally, the data collected from sensors in smart environments are heterogeneous in format,
structure and semantics, especially when multimodal sensors and different types of sensor are used to
obtain the raw data. These datasets are difficult to share and reuse due to the lack of formalised
descriptions of them. Some researchers have tried to develop high-level descriptive sensor data models
to address these problems. These models are used to support semantic sensor data management and
intelligent processing. In the future, knowledge descriptive sensor data modelling and standardization are
needed to advance towards a commonly accepted framework for heterogeneous sensor data representation.
6.6. Imbalanced and Overlapping Data Classes
During the phase of processing sensor data, researchers usually encounter the problems of imbalanced
class distribution and class overlapping, especially in real-time scenarios. For instance, when performing
long-time monitoring for elderly people with diabetes, sleeping, eating and drinking occur frequently,
but walking may occur less frequently. The class imbalance problem occurs when the number of
instances of one class (minority class) is extremely low compared to other ones (majority class). This
Sensors 2015, 15 11350
problem often exits when multiple data classes are defined and multiple sensors datasets exist. The class
overlapping problem means that the characteristics of the examples for training algorithms are very
similar for two or more classes, rendering it difficult to distinguish between these classes.
Imbalanced class and overlapping class issues have great impact on classification tasks and
recognition accuracy. To deal with this issue, some researchers have adopted sampling-based algorithms
as part of the data preprocessing in order to level majority and minority classes. A balanced dataset is
obtained by oversampling the minority class (duplicating some of the available samples) and
undersampling the majority class (discarding redundant samples). However, this method may result in
useful information being lost. Therefore, determining a proper class distribution is still a problem to be
solved for human activity monitoring and modelling in real world environments.
6.7. Meaningful Feature Extraction
As previously described, the automatic detection of activities from raw sensor data needs proper
preprocessing methods and feature extraction. The preprocessing methods mainly focus on eliminating
noise from the information (cleaning, completing and normalizing data). Feature extraction aims on one
hand to choose the essential features that are relevant for the activity detection task and, on the other
hand, to support dimensionality reduction for more robust modelling and processing. Current feature
extraction approaches are normally based on time or frequency analysis. However, if it were possible to
have an approach based on heuristics obtained from a deep understanding of the activities, better
accuracy and robustness would be obtained since meaningful criteria would be considered. A more
thorough research on proper feature extraction methods based on the nature of human activities could
be a promising future research trend.
6.8. Consideration of Human Factors
E-Health solutions are generally regarded as socio-technical systems since, in addition to its
technological nature, many people interact with them during the provision of the service. Thus, the
service must meet the expectations and needs of all the involved people, if it has to be of any practical
use. Human factors directly affect the acceptance of the service by these people.
Although efforts have been made to identify and formalize the different areas that conform the human
factors, these have not been yet adequately addressed from a formal point of view. Besides, human
factors are by nature technically difficult to address. In many cases their proper consideration requires a
good understanding of not only people’s capabilities and limitations but also their personal,
socioeconomic and cultural context. Even with this understanding, it is often difficult to translate it into
the formal terms required by the information and communication technologies to be used inside SH. All
this hinders research and innovation when developing new solutions.
To address this issue research initiatives are required which are aimed at creating design patterns and
low level guidelines to promote the integration of the human factors-related functional aspects. These
would constitute a set of very useful resources for developers which, if properly characterized, could be
easily particularized to each specific application, person and context.
Sensors 2015, 15 11351
7. Conclusions
We have presented a review of the main concepts, devices, techniques and models used for the
provision of services tailored to enhance independent living for the elderly in smart homes. This review
is aimed at making it easier for developers and service providers to construct and deploy complete
solutions. To achieve this, we have presented the review in a top-down approach, beginning with the
services provider vision. This way we have started with the services perspective, gone through
high-level concepts such as the activities, and finished with the description of sensors and the processing
of their data. In each of the sections we have paid special attention to the issues more related to the
provision of real services.
The taxonomy of activities that we have presented allows one to make the development of services
for the elderly independent of the final home devices configuration. This developer-centered approach
permits, as a plus, to specify solutions which are adequate for a wider range of final users. To do so, we
have comprehensively reviewed the main activities related to the elderly’s health found in the literature,
and classified them into types. This way, it also becomes easier to generalize the data processing
techniques that have to be applied for the detection of the activities.
Besides the activities classification, a review on the main approaches for their formalized description
has been conducted. If an adequate formalization is used, the services and the infrastructure may be
specified in a decoupled manner. We have not only presented the principal formalization techniques, but
also identified their potential shortcomings when applied to real deployments. One of the most
significant limitations found is related to the modelling and characterization of the relationships between
different activities. This is a critical issue because in real life it is uncommon to find activities that are
totally unrelated to others. Moreover, a correct identification of the activities that are related to a given
one may greatly enhance the precision of its detection. At this respect, we have proposed a first general
schema which has to be further developed in the future.
Based on the analysis made of the activities, we have described a classification of sensors that can be
deployed in smart homes, and summarized the data processing techniques applicable to the sensor data
collected from them. We have also presented a discussion of the advantages as well as the disadvantages
of the different sensors and their data processing techniques, to aid the researchers in the selection of the
proper methods according to the requirements.
Another relevant aspect of the presented work is the identification of some important research
challenges that should be tackled to enhance the performance, precision and robustness of the systems
considered. We hope that this description contributes to the definition of future research projects and the
subsequent advancement in this knowledge area.
After reviewing the relevant literature, and also considering our expertise in the development of smart
home solutions, we have come to the conviction that the precision when modelling the sensors
infrastructure together with their activity detection capacities is a crucial factor. Unlike other types of
systems, embedding technology into a home is critical because it raises important privacy issues.
The acceptance of the solutions inside the home will strongly depend on the correct adjustment to the
users’ necessities and the perceived effects they have on people’s daily lives. If a correct characterization
of these human factors is achieved from the very beginning of the solution development, it is much more
likely for it to succeed.

Sensors 2015, 15 11352
In close relation to the above, we find it crucial to correctly characterize and formalize the activities
carried out inside home in order to deploy useful final services. If a correct understanding exists on the
relationship between the deployed sensors and their activity detection possibilities, the design of the
solution and its deployment could be greatly enhanced and done more easily and faster.
As a last remark we highlight that, in most reviewed work, research teams have created ideal
conditions for the activity detection. These results are obviously interesting and add to the knowledge in
this area, however they should be considered as base elements with which a more advanced support for
people in real environments could be built and provided. The presence of more than one person
interacting in the same place, as well as the coexistence of interrelated activities, pose true challenges to
be studied in the following years.
Acknowledgments
Authors would like to thank the Department of Telematic and Electronic Engineering (DTE), of
Universidad Politécnica de Madrid, for its support to the open access publication of this research.
We also acknowledge the China Scholarship Council which has partially supported the research
described in this paper.
Conflicts of Interest
The authors declare no conflict of interest.
References
1. Lutolf, R. Smart home concept and the integration of energy meters into a home based system. In
Proceedings of the 7th International Conference on Metering Apparatus and Tariffs for Electricity
Supply, Glasgow, UK, 17–19 November 1992; pp. 277–278.
2. Satpathy, L. Smart Housing: Technology to Aid Aging in Place, New Opportunities and
Challenges. Master’s Thesis, Mississippi State University, Starkville, MS, USA, 2006.
3. 10 Facts on Ageing and the Life Course. Available online: http://www.who.int/features/factfiles/
ageing/en/ (accessed on 28 November 2014).
4. Giannakouris, K. Ageing characterises the demographic perspectives of the european societies.
Stat. Foc. 2008, 72, 2008.
5. Lloret, J.; Canovas, A.; Sendra, S.; Parra, L. A smart communication architecture for ambient
assisted living. IEEE Commun. Mag. 2015, 53, 26–33.
6. Aghajan, H.; Augusto, J.C.; Wu, C.; McCullagh, P.; Walkden, J.-A. Distributed vision-based
accident management for assisted living. In Pervasive Computing for Quality of Life Enhancement;
Springer: Berlin/Heidelberg, Germany, 2007; Volume 4541, pp. 196–205.
7. Ali, R.; Siddiqi, M.H.; Lee, S.; Kang, B.H. KARE: A hybrid reasoning approach for promoting
active lifestyle. In Proceedings of the 9th International Conference on Ubiquitous Information
Management and Communication, Bali, Indonesia, 8–10 January 2015.
8. Alam, M.R.; Reaz, M.B.I.; Ali, M.A.M. A review of smart homes—Past, present, and future.
IEEE Trans. Syst. Man Cybern. C Appl. Rev. 2012, 42, 1190–1203.
Sensors 2015, 15 11353
9. Rashidi, P.; Mihailidis, A. A survey on ambient-assisted living tools for older adults. IEEE J.
Biomed. Health Inform. 2013, 17, 579–590.
10. Salih, A.; Abraham, A. A review of ambient intelligence assisted healthcare monitoring. IJCISIM
2013, 5, 741–750.
11. Peetoom, K.K.; Lexis, M.A.; Joore, M.; Dirksen, C.D.; De Witte, L.P. Literature review on
monitoring technologies and their outcomes in independently living elderly people. Disabil. Rehabil.
Assist. Technol. 2014, 9, 1–24.
12. Khusainov, R.; Azzi, D.; Achumba, I.E.; Bersch, S.D. Real-time human ambulation, activity, and
physiological monitoring: Taxonomy of issues, techniques, applications, challenges and limitations.
Sensors 2013, 13, 12852–12902.
13. Avci, A.; Bosch, S.; Marin-Perianu, M.; Marin-Perianu, R.; Havinga, P. Activity recognition using
inertial sensing for healthcare, wellbeing and sports applications: A survey. In Proceedings of the
23rd international conference on Architecture of computing systems (ARCS), Hannover, Germany,
22–23 February 2010; pp. 1–10.
14. Bulling, A.; Blanke, U.; Schiele, B. A tutorial on human activity recognition using body-worn
inertial sensors. ACM Comput. Surv. 2014, 46, 33:1–33:33.
15. Helal, S.; Mann, W.; El-Zabadani, H.; King, J.; Kaddoura, Y.; Jansen, E. The gator tech smart
house: A programmable pervasive space. Computer 2005, 38, 50–60.
16. Cook, D.J.; Youngblood, M.; Heierman III, E.O.; Gopalratnam, K.; Rao, S.; Litvin, A.; Khawaja, F.
Mavhome: An agent-based smart home. In Proceedings of the IEEE International Conference on
Pervasive Computing and Communications (PerCom), San Diego, CA, USA, 18–22 March 2013;
pp. 521–524.
17. Logan, B.; Healey, J.; Philipose, M.; Tapia, E.M.; Intille, S. A long-term evaluation of sensing
modalities for activity recognition. In Ubiquitous Computing; Springer: Berlin/Heidelberg,
Germany, 2007; Volume 4717, pp. 483–500.
18. Van Kasteren T.L.M.; Englebienne G.; Kröse B.J.A. Activity recognition using semi-markov
models on real world smart home datasets. J. Ambient Intell. Smart Environ. 2010, 2, 311-325.
19. Chen, C.; Dawadi, P. Casasviz: Web-based visualization of behavior patterns in smart
environments. In Proceedings of the International Conference on Pervasive Computing and
Communications Workshops (PERCOM Workshops), Seattle, WA, USA, 21–25 March 2011;
pp. 301–303.
20. Cook, D.J.; Crandall, A.S.; Thomas, B.L.; Krishnan, N.C. CASAS: A smart home in a box.
Computer 2013, 46, 62–69.
21. Vacher, M.; Istrate, D.; Portet, F.; Joubert, T.; Chevalier, T.; Smidtas, S.; Meillon, B.;
Lecouteux, B.; Sehili, M.; Chahuara, P. The sweet-home project: Audio technology in smart homes
to improve well-being and reliance. In Proceedings of the Annual International Conference on
Engineering in Medicine and Biology Society, EMBC, Boston, MA, USA, 30 August–3 September
2011; pp. 5291–5294.
22. Chahuara, P.; Portet, F.; Vacher, M. Making context aware decision from uncertain information in
a smart home: A markov logic network approach. In Ambient Intelligence; Springer International
Publishing AG: Cham, Switzerland, 2014; Volume 8309, pp. 78–93.

Sensors 2015, 15 11354
23. Antoniou, P.E.; Konstantinidis, E.I.; Billis, A.S.; Bamidis, P.D. Integrating the usefil assisted
living platform; observation from the field. In Proceedings of the 6th European Conference of the
International Federation for Medical and Biological Engineering, Dubrovnik, Croatia, 7–11
September 2014; Springer International Publishing AG: Cham, Switzerland, 2014; pp. 657–660.
24. Billis, A.S.; Papageorgiou, E.I.; Frantzidis, C.; Konstantinidis, E.I.; Bamidis, P.D. Towards a
hierarchically-structured decision support tool for improving seniors’ independent living: The
usefil decision support system. In Proceedings of the 6th International Conference on PErvasive
Technologies Related to Assistive Environments, Island of Rhodes, Greece, 29–31 May 2013;
p. 27.
25. Zhang, Q.; Karunanithi, M.; Rana, R.; Liu, J. Determination of activities of daily living of
independent living older people using environmentally placed sensors. In Proceedings of the 35th
Annual International Conference on Engineering in Medicine and Biology Society (EMBC),
Osaka, Japan, 3–7 July 2013; pp. 7044–7047.
26. Zhang, Q.; Su, Y.; Yu, P. Assisting an elderly with early dementia using wireless sensors data in
smarter safer home. In Service Science and Knowledge Innovation; Springer: Berlin/Heidelberg,
Germany, 2014; Volume 426, pp. 398–404.
27. List of Home Datasets. Available online: http://boxlab.wikispaces.com/List+of+Home+Datasets
(accessed on 12 May 2015).
28. Roggen, D.; Calatroni, A.; Rossi, M.; Holleczek, T.; Forster, K.; Troster, G.; Lukowicz, P.;
Bannach, D.; Pirkl, G.; Ferscha, A. Collecting complex activity datasets in highly rich networked
sensor environments. In Proceedings of the 7th International Conference on Networked Sensing
Systems (INSS), Kassel, Germany, 15–18 June 2010; pp. 233–240.
29. Baños, O.; Damas, M.; Pomares, H.; Rojas, I.; Tóth, M.A.; Amft, O. A benchmark dataset to
evaluate sensor displacement in activity recognition. In Proceedings of the 2012 ACM Conference
on Ubiquitous Computing, Pittsburgh, PA, USA, 5–8 September 2012; pp. 1026–1035.
30. Pulkkinen, T.; Son, Y.-S.; Lee, J.; Lee, Y.-H.; Sallinen, M.; Park, J.-H. Progressive monitoring and
treatment planning of diabetes mellitus in smart home environment. In Proceedings of the
International Conference on Consumer Electronics (ICCE), Las Vegas, NV, USA, 11–14 January
2013; pp. 206–207.
31. Chatterjee, S.; Dutta, K.; Xie, H.; Byun, J.; Pottathil, A.; Moore, M. Persuasive and pervasive
sensing: A new frontier to monitor, track and assist older adults suffering from type-2 diabetes. In
Proceedings of the 46th Hawaii International Conference on System Sciences (HICSS), Wailea,
HI, USA, 7–10 January 2013; pp. 2636–2645.
32. Chiang, S.Y.; Kan, Y.C.; Tu, Y.C.; Lin, H.C. A preliminary activity recognition of wsn data on
ubiquitous health care for physical therapy. In Recent Progress in Data Engineering and Internet
Technology; Springer: Berlin/Heidelberg, Germany, 2013; Volume 156, pp. 461–467.
33. Sardini, E.; Serpelloni, M. T-shirt for vital parameter monitoring. In Sensors; Springer: New York,
NY, USA, 2014; Volume 162, pp. 201–205.
34. Honeywell Genesis Series Cable. Available online: http://www.honeywellcable.com (accessed on
12 May 2015).
35. Telestation-Philips Telehealth. Available online: http://www.telehealth.philips.com (accessed on
12 May 2015).
Sensors 2015, 15 11355
36. Bosch Healthcare. Available online: http://www.bosch-telehealth.com (accessed on 12 May 2015).
37. Chernbumroong, S.; Cang, S.; Yu, H. A practical multi-sensor activity recognition system for
home-based care. Decis. Support Syst. 2014, 66, 61–70.
38. Lara, O.D.; Pérez, A.J.; Labrador, M.A.; Posada, J.D. Centinela: A human activity recognition
system based on acceleration and vital sign data. Pervasive Mob. Comput. 2012, 8, 717–729.
39. Chaminda, H.T.; Klyuev, V.; Naruse, K. A smart reminder system for complex human activities.
In Proceedings of the 14th International Conference on Advanced Communication Technology
(ICACT), PyeongChang, Korea, 19–22 February 2012; pp. 235–240.
40. Hussain, M.; Ali, T.; Khan, W.A.; Afzal, M.; Lee, S.; Latif, K. Recommendations service for
chronic disease patient in multimodel sensors home environment. Telemed. E Health 2015, 21,
185–199.
41. Suryadevara, N.K.; Mukhopadhyay, S.C.; Wang, R.; Rayudu, R.K. Forecasting the behavior of an
elderly using wireless sensors data in a smart home. Eng. Appl. Artif. Intel. 2013, 26, 2641–2652.
42. Han, Y.; Han, M.; Lee, S.; Sarkar, A.M.; Lee, Y.-K. A framework for supervising lifestyle diseases
using long-term activity monitoring. Sensors 2012, 12, 5363–5379.
43. Chandola, V.; Banerjee, A.; Kumar, V. Anomaly detection: A survey. ACM Comput. Surv. 2009,
41, 15:1–15:58.
44. Phua, C.; Foo, V.-F.; Biswas, J.; Tolstikov, A.; Maniyeri, J.; Huang, W.; That, M.-H.; Xu, D.;
Chu, A.-W. 2-layer erroneous-plan recognition for dementia patients in smart homes. In
Proceedings of the 11th International Conference on e-Health Networking, Applications and
Services, Sydney, Australia, 16–18 December 2009; pp. 21–28.
45. Lotfi, A.; Langensiepen, C.; Mahmoud, S.M.; Akhlaghinia, M.J. Smart homes for the elderly
dementia sufferers: Identification and prediction of abnormal behaviour. J. Ambient Intell.
Humaniz. Comput. 2012, 3, 205–218.
46. Vogt, J. Requirements Elicitation and System Specification of Assistive Systems for People with
Mild Dementia. Ph.D. Thesis, University of Basel, Basel, Switzerland, 2013.
47. Riboni, D.; Bettini, C.; Civitarese, G.; Janjua, Z.H.; Helaoui, R. Extended report: Fine-grained
recognition of abnormal behaviors for early detection of mild cognitive impairment. 2015,
arXiv:1501.05581. Available online: http://arxiv.org/abs/1501.05581 (accessed on 14 May 2015).
48. Ordóñez, F.J.; de Toledo, P.; Sanchis, A. Sensor-based bayesian detection of anomalous living
patterns in a home setting. Pers. Ubiquit. Comput. 2014, 19, 259–270.
49. Gjoreski, H.; Rashkovska, A.; Kozina, S.; Lustrek, M.; Gams, M. Telehealth using ecg sensor and
accelerometer. In Proceedings of the 37th International Convention on Information and
Communication Technology, Electronics and Microelectronics (MIPRO), Opatija, Croatia, 26–30
May 2014; pp. 270–274.
50. Wu, G.E.; Xue, S. Portable preimpact fall detector with inertial sensors. IEEE Trans. Neural Syst.
Rehabil. Eng. 2008, 16, 178–183.
51. Rimminen, H.; Lindstrom, J.; Linnavuo, M.; Sepponen, R. Detection of falls among the elderly by
a floor sensor using the electric near field. IEEE Trans. Inf. Technol. Biomed. 2010, 14, 1475–1476.
Sensors 2015, 15 11356
52. Zhuang, X.; Huang, J.; Potamianos, G.; Hasegawa-Johnson, M. Acoustic fall detection using
gaussian mixture models and gmm supervectors. In Proceedings of the IEEE International
Conference on Acoustics, Speech and Signal Processing, TaiPei, Taiwan, 19–24 April 2009;
pp. 69–72.
53. Ghasemzadeh, H.; Jafari, R.; Prabhakaran, B. A body sensor network with electromyogram and
inertial sensors: Multimodal interpretation of muscular activities. IEEE Trans. Inf. Technol. Biomed.
2010, 14, 198–206.
54. Coughlin, J.F.; D’Ambrosio, L.A.; Reimer, B.; Pratt, M.R. Older adult perceptions of smart home
technologies: Implications for research, policy & market innovations in healthcare. In Proceedings
of the 29th Annual International Conference of Engineering in Medicine and Biology Society,
Lyon, France, 23–26 August 2007; pp. 1810–1815.
55. Gaul, S.; Ziefle, M. Smart home technologies: Insights into generation-specific acceptance
motives. In HCI and Usability for e-Inclusion; Springer: Berlin/Heidelberg, Germany, 2009;
Volume 5889, pp. 312–332.
56. Niman, B.V.; Rodríguez-Ascaso, A.; Brown, S.; Sund, T. User experience design guidelines for
telecare (e-health) services. Interactions 2007, 14, 36–40.
57. Becker, M. Software Architecture Trends and Promising Technology for Ambient Assisted Living
Systems. Available online: http://www.researchgate.net/profile/Martin_Becker3/publication/
30815935_Software_Architecture_Trends_and_Promising_Technology_for_Ambient_Assisted_
Living_Systems/links/02e7e5252637478996000000.pdf (accessed on 24 March 2015).
58. Vega-Barbas, M.; Pau, I.; Martín-Ruiz, M.L.; Seoane, F. Adaptive software architecture based on
confident hci for the deployment of sensitive services in smart homes. Sensors 2015, 15,
7294–7322.
59. MedicineNet. Available online: http://www.medicinenet.com (accessed on 12 May 2015).
60. Fleury, A.; Vacher, M.; Noury, N. SVM-based multimodal classification of activities of daily
living in health smart homes: Sensors, algorithms, and first experimental results. IEEE Trans. Inf.
Technol. Biomed. 2010, 14, 274–283.
61. Katz, S.; Akpom, C.A. A measure of primary sociobiological functions. Int. J. Health Serv. 1976,
6, 493–508.
62. Lawton, M.P.; Brody, E.M. Assessment of older people: Self-maintaining and instrumental
activities of daily living. Nurs. Res. 1970, 19, 179–186.
63. Chernbumroong, S.; Cang, S.; Atkins, A.; Yu, H. Elderly activities recognition and classification
for applications in assisted living. Expert Syst. Appl. 2013, 40, 1662–1674.
64. Tartarisco, G.; Baldus, G.; Corda, D.; Raso, R.; Arnao, A.; Ferro, M.; Gaggioli, A.; Pioggia, G.
Personal health system architecture for stress monitoring and support to clinical decisions.
Comput. Commun. 2012, 35, 1296–1305.
65. Okeyo, G.; Chen, L.; Wang, H. Combining ontological and temporal formalisms for composite
activity modelling and recognition in smart homes. Future Gener. Comput. Syst. 2014, 39, 29–43.
66. Meditskos, G.; Dasiopoulou, S.; Kompatsiaris, I. MetaQ: A knowledge-driven framework for
context-aware activity recognition combining SPARQL and OWL 2 activity patterns. Pervasive Mob.
Comput. 2015, doi:10.1016/j.pmcj.2015.01.007.
67. Allen, J.F. Maintaining knowledge about temporal intervals. ACM Commun. 1983, 26, 832–843.

Sensors 2015, 15 11357
68. Wongpatikaseree, K.; Ikeda, M.; Buranarach, M.; Supnithi, T.; Lim, A.O.; Tan, Y. Activity
recognition using context-aware infrastructure ontology in smart home domain. In Proceedings of
the 2012 Seventh International Conference on Knowledge, Information and Creativity Support
Systems (KICSS), Melbourne, Australia, 8–10 November 2012; pp. 50–57.
69. Chen, L.; Nugent, C. Ontology-based activity recognition in intelligent pervasive environments.
Int. J. Web Inf. Syst. 2009, 5, 410–430.
70. Ye, J.; Stevenson, G.; Dobson, S. KCAR: A knowledge-driven approach for concurrent activity
recognition. Pervasive Mob. Comput. 2015, 19, 47–70.
71. Cook, D.; Schmitter-Edgecombe, M.; Crandall, A.; Sanders, C.; Thomas, B. Collecting and
disseminating smart home sensor data in the casas project. In Proceedings of the CHI Workshop
on Developing Shared Home Behavior Datasets to Advance HCI and Ubiquitous Computing
Research, Boston, MA, USA, 4–9 April 2009.
72. Tapia, E.M.; Intille, S.S.; Larson, K. Activity recognition in the home using simple and ubiquitous
sensors. In Pervasive Computing; Springer: Berlin/Heidelberg, Germany, 2004; Volume 3001,
pp. 158–175.
73. Aiello, F.; Fortino, G.; Gravina, R.; Guerrieri, A. A java-based agent platform for programming
wireless sensor networks. Comput. J. 2011, 54, 439–454.
74. World Wide Web Consortium. Composite Capability/Preference Profiles (CC/PP): Structure and
Vocabularies 1.0. Available online: http://www.w3.org/TR/2004/REC-CCPP-struct-vocab-20040115
(accessed on 15 January 2004).
75. McDonald, H.; Nugent, C.D.; Finlay, D.D.; Moore, G.; Burns, W.; Hallberg, J. Assessing the
impact of the homeml format and the homeml suite within the research community. J. UCS 2013,
19, 2559–2576.
76. Gonçalves, B.; Pereira Filho, J.G.; Andreão, R.V. ECGWARE: An ECG Markup Language for
Ambulatory Telemonitoring and Decision Making Support. In Proceedings of the International
Conference on Health Informatics, Funchal, Portugal, 28–31 January 2008; pp 37–43.
77. Rialle, V.; Lamy, J.-B.; Noury, N.; Bajolle, L. Telemonitoring of patients at home: A software
agent approach. Comput. Meth. Prog. Bio. 2003, 72, 257–268.
78. Henricksen, K.; Indulska, J. A software engineering framework for context-aware pervasive
computing. In Proceedings of the Second IEEE Annual Conference on Pervasive Computing and
Communications, 14–17 March 2004; pp. 77–86.
79. Perera, C.; Zaslavsky, A.; Christen, P.; Georgakopoulos, D. Context aware computing for the
internet of things: A survey. IEEE Commun. Surv. Tut. 2014, 16, 414–454.
80. Zhang, D.; Gu, T.; Wang, X. Enabling context-aware smart home with semantic web technologies.
Int. J. Hum. Welf. Robotic Syst. 2005, 6, 12–20.
81. Bouchard, B.; Giroux, S.; Bouzouane, A. A smart home agent for plan recognition of
cognitively-impaired patients. J. Comput. 2006, 1, 53–62.
82. Chen, L.; Nugent, C.; Mulvenna, M.; Finlay, D.; Hong, X.; Poland, M. Using event calculus for
behaviour reasoning and assistance in a smart home. In Smart Homes and Health Telematics;
Springer: Berlin/Heidelberg, 2008; Volume 5120, pp. 81–89.
Sensors 2015, 15 11358
83. Chen, H.; Perich, F.; Finin, T.; Joshi, A. SOUPA: Standard ontology for ubiquitous and pervasive
applications. In Proceedings of the First Annual International Conference on Mobile and
Ubiquitous Systems: Networking and Services, Boston, MA, USA, 22–26 August 2004; pp. 258–267.
84. Ye, J.; Stevenson, G.; Dobson, S. USMART: An unsupervised semantic mining activity
recognition technique. ACM Trans. Inter. Intel. Syst. 2014, 4, 16:1–16:27.
85. Chen, L.; Nugent, C.D.; Wang, H. A knowledge-driven approach to activity recognition in smart
homes. IEEE Trans. Knowl. Data Eng. 2012, 24, 961–974.
86. Musen, M.A. Protégé ontology editor. In Encyclopedia of Systems Biology; Springer: New York,
NY, USA, 2013; pp. 1763–1765.
87. Rialle, V.; Ollivet, C.; Guigui, C.; Hervé, C. What do family caregivers of Alzheimer’s disease
patients desire in smart home technologies? 2009, arXiv preprint arXiv:0904.0437. Available
online: http://arxiv.org/ftp/arxiv/papers/0904/0904.0437.pdf (accessed on 14 May 2015).
88. Portet, F.; Vacher, M.; Golanski, C.; Roux, C.; Meillon, B. Design and evaluation of a smart home
voice interface for the elderly: Acceptability and objection aspects. Pers. Ubiquitous Comput.
2013, 17, 127–144.
89. Wilson, D.H.; Atkeson, C. Simultaneous tracking and activity recognition (STAR) using many
anonymous, binary sensors. In Pervasive Computing; Springer: Berlin/Heidelberg, Germany,
2005; Volume 3468, pp. 62–79.
90. Ordónez, F.J.; de Toledo, P.; Sanchis, A. Activity recognition using hybrid generative/
discriminative models on home environments using binary sensors. Sensors 2013, 13, 5460–5477.
91. Fujinami, T.; Miura, M.; Takatsuka, R.; Sugihara, T. A study of long term tendencies in residents’
activities of daily living at a group home for people with dementia using rfid slippers. In Toward
Useful Services for Elderly and People with Disabilities; Springer: Berlin Heidelberg, Germany,
2011; Volume 6719, pp. 303–307.
92. Philipose, M.; Fishkin, K.P.; Perkowitz, M.; Patterson, D.J.; Fox, D.; Kautz, H.; Hahnel, D.
Inferring activities from interactions with objects. IEEE Pervasive Comput. 2004, 3, 50–57.
93. Kim, S.-C.; Jeong, Y.-S.; Park, S.-O. RFID-based indoor location tracking to ensure the safety of
the elderly in smart home environments. Pers. Ubiquitous Comput. 2013, 17, 1699–1707.
94. Wang, L.; Gu, T.; Tao, X.; Chen, H.; Lu, J. Recognizing multi-user activities using wearable
sensors in a smart home. Pervasive Mob. Comput. 2011, 7, 287–298.
95. Zhu, C.; Sheng, W. Motion-and location-based online human daily activity recognition.
Pervasive Mob. Comput. 2011, 7, 256–269.
96. Zheng, Y.; Wong, W.K.; Guan, X.; Trost, S. Physical activity recognition from accelerometer data
using a multi-scale ensemble method. In Proceedings of the 25th Conference on Innovative
Applications of Artificial Intelligence, Bellevue, Washington, DC, USA, 14–18 July 2013.
97. Gao, L.; Bourke, A.K.; Nelson, J. Evaluation of accelerometer based multi-sensor versus
single-sensor activity recognition systems. Med. Eng. Phys. 2014, 36, 779–785.
98. Narayanan, M.R.; Redmond, S.J.; Scalzi, M.E.; Lord, S.R.; Celler, B.G.; Lovell, N.H. Longitudinal
falls-risk estimation using triaxial accelerometry. IEEE Trans. Biomed. Eng. 2010, 57, 534–541.
99. Greene, B.R.; Donovan, A.O.; Romero-Ortuno, R.; Cogan, L.; Scanaill, C.N.; Kenny, R.A.
Quantitative falls risk assessment using the timed up and go test. IEEE Trans. Biomed. Eng. 2010,
57, 2918–2926.
Sensors 2015, 15 11359
100. Zijlstra, W.; Bisseling, R.W.; Schlumbohm, S.; Baldus, H. A body-fixed-sensor-based analysis of
power during sit-to-stand movements. Gait Posture 2010, 31, 272–278.
101. Kau, L.-J.; Chen, C.-S. A smart phone-based pocket fall accident detection system. In Proceedings
of the 2014 IEEE International Symposium on Bioelectronics and Bioinformatics (ISBB),
Chung Yuan, Taiwan, 11–14 April 2014; pp. 1–4.
102. Varkey, J.P.; Pompili, D.; Walls, T.A. Human motion recognition using a wireless sensor-based
wearable system. Pers. Ubiquitous Comput. 2012, 16, 897–910.
103. Gjoreski, H.; Gams, M. Accelerometer data preparation for activity recognition. In Proceedings of
the International Multiconference Information Society, Ljubljana, Slovenia, 10–14 October 2011;
pp. 10–14.
104. Jiang, M.; Shang, H.; Wang, Z.; Li, H.; Wang, Y. A method to deal with installation errors of
wearable accelerometers for human activity recognition. Physiol. Meas. 2011, 32, 347–358.
105. Kwapisz, J.R.; Weiss, G.M.; Moore, S.A. Activity recognition using cell phone accelerometers.
ACM SIGKDD Explor. 2011, 12, 74–82.
106. Siirtola, P.; Röning, J. User-independent human activity recognition using a mobile phone: Offline
recognition vs. Real-time on device recognition. In Distributed Computing and Artificial
Intelligence; Springer: Berlin/Heidelberg, Germany, 2012; Volume 151, pp. 617–627.
107. Hemalatha, C.S.; Vaidehi, V. Frequent bit pattern mining over tri-axial accelerometer data streams
for recognizing human activities and detecting fall. Proc. Comput. Sci. 2013, 19, 56–63.
108. Mannini, A.; Intille, S.S.; Rosenberger, M.; Sabatini, A.M.; Haskell, W. Activity recognition using
a single accelerometer placed at the wrist or ankle. Med. Sci. Sports Exerc. 2013, 45, 2193–2203.
109. Muaaz, M.; Mayrhofer, R. An analysis of different approaches to gait recognition using cell phone
based accelerometers. In Proceedings of the 11th International Conference on Advances in Mobile
Computing & Multimedia, Vienna, Austria, 2–4 December 2013; p. 293.
110. Ou, Y.-Y.; Hsia, C.-C.; Wang, J.-F.; Kuan, T.-W.; Hsieh, C.-H. SVM-based IADL score
correlation and classification with EEG/ECG signals. In Proceedings of the 2013 International
Conference on Orange Technologies (ICOT), Tainan, Taiwan, 12–16 March 2013; pp. 197–200.
111. Matthews, R.; McDonald, N.J.; Hervieux, P.; Turner, P.J.; Steindorf, M.A. A wearable
physiological sensor suite for unobtrusive monitoring of physiological and cognitive state. In
Proceedings of the 29th Annual International Conference of the IEEE Engineering in Medicine
and Biology Society, Lyon, France, 23–26 August 2007; pp. 5276–5281.
112. Noury, N.; Hadidi, T. Computer simulation of the activity of the elderly person living
independently in a health smart home. Comput. Meth. Prog. Biomed. 2012, 108, 1216–1228.
113. Guettari, T.; Boudy, J.; Benkelfat, B.E.; Chollet, G.; Baldinger, J.L.; Dore, P.; Istrate, D. Thermal
signal analysis in smart home environment for detecting a human presence. In Proceedings of the
1st International Conference on Advanced Technologies for Signal and Image Processing (ATSIP),
Sousse, Tunisia, 17–19 March 2014; pp. 334–339.
114. Khan, A.M.; Siddiqi, M.H.; Lee, S.-W. Exploratory data analysis of acceleration signals to select
light-weight and accurate features for real-time activity recognition on smartphones. Sensors 2013,
13, 13099–13122.
Sensors 2015, 15 11360
115. Wang, W.-Z.; Guo, Y.-W.; Huang, B.-Y.; Zhao, G.-R.; Liu, B.-Q.; Wang, L. Analysis of filtering
methods for 3D acceleration signals in body sensor network. In Proceedings of the International
Symposium on Bioelectronics and Bioinformatics (ISBB), Suzhou, China, 3–5 November 2011;
pp. 263–266.
116. Sen, N.; Chandrakar, C. Development of a novel ECG signal denoising system using extended
kalman filter. Development 2014, 3, 7200–7208.
117. Champaty, B.; Jose, J.; Pal, K.; Thirugnanam, A. Development of eog based human machine
interface control system for motorized wheelchair. In Proceedings of the 2014 Annual International
Conference on Emerging Research Areas: Magnetics, Machines and Drives (AICERA/iCMMD),
Kottayam, India, 24–26 July 2014; pp. 1–7.
118. Bulling, A.; Ward, J.A.; Gellersen, H.; Troster, G. Eye movement analysis for activity recognition
using electrooculography. IEEE Trans. Pattern Anal. Mach. Intell. 2011, 33, 741–753.
119. Khushaba, R.N.; Kodagoda, S.; Takruri, M.; Dissanayake, G. Toward improved control of
prosthetic fingers using surface electromyogram (EMG) signals. Expert Syst. Appl. 2012, 39,
10731–10738.
120. Das, B.; Krishnan, N.C.; Cook, D.J. Handling imbalanced and overlapping classes in smart
environments prompting dataset. In Data Mining for Service; Springer: Berlin/Heidelberg,
Germany, 2014; Volume 3, pp. 199–219.
121. Goodwin, M.S.; Intille, S.S.; Albinali, F.; Velicer, W.F. Automated detection of stereotypical
motor movements. J. Autism Dev. Disord. 2011, 41, 770–782.
122. Parlak, S.; Marsic, I. Detecting object motion using passive RFID: A trauma resuscitation case
study. IEEE Trans. Instrum. Meas. 2013, 62, 2430–2437.
123. Shayei, A.; Ehsani, S.P.; Shabany, M. Efficient implementation of real-time ecg derived respiration
system using cubic spline interpolation. In Proceedings of the 2013 IEEE International Symposium
on Circuits and Systems (ISCAS), Beijing, China, 19–23 May 2013; pp. 1083–1086.
124. Rodner, T.; Litz, L. Data-driven generation of rule-based behavior models for an ambient assisted
living system. In Proceedings of the IEEE 3rd International Conference on Consumer Electronics,
Berlin, Germany, 8–11 September 2013; pp. 35–38.
125. Sun, X.; Zhang, Y. Design and implementation of portable ecg and body temperature monitor,
Computer. In Proceedings of the 2014 International Symposium on Consumer and Control (IS3C),
TaiChung, Taiwan, 10–12 June 2014; pp. 910–913.
126. Mitchell, H.B. Sensor value normalization. In Multi-Sensor Data Fusion; Springer: Berlin/
Heidelberg, Germany, 2007; pp. 97–112.
127. Ordóñez, F.J.; Iglesias, J.A.; de Toledo, P.; Ledezma, A.; Sanchis, A. Online activity recognition
using evolving classifiers. Expert Syst. Appl. 2013, 40, 1248–1255.
128. Krishnan, N.C.; Panchanathan, S. Analysis of low resolution accelerometer data for continuous
human activity recognition. In Proceedings of the 2008 IEEE International Conference on
Acoustics, Speech and Signal Processing, Las Vegas, NV, USA, 30 March–4 April 2008;
pp. 3337–3340.
129. Keogh, E.; Chu, S.; Hart, D.; Pazzani, M. An online algorithm for segmenting time series. In
Proceedings of the 2001 IEEE International Conference on Data Mining, San Jose, CA, USA, 29
November–2 December 2001; pp. 289–296.
Sensors 2015, 15 11361
130. Van Kasteren, T.; Noulas, A.; Englebienne, G.; Kröse, B. Accurate activity recognition in a home
setting. In Proceedings of the 10th International Conference on Ubiquitous Computing, Seoul,
South Korea, 21–24 September 2008; pp. 1–9.
131. Achumba, I.E.; Bersch, S.; Khusainov, R.; Azzi, D.; Kamalu, U. On time series sensor data
segmentation for fall and activity classification. In Proceedings of the 14th IEEE International
Conference on e-Health Networking, Applications and Services (Healthcom), Beijing, China,
10–13 October 2012; pp. 427–430.
132. Laguna, J.O.; Olaya, A.G.; Borrajo, D. A dynamic sliding window approach for activity
recognition. In User Modeling, Adaption and Personalization; Springer: Berlin/Heidelberg,
Germany, 2011; Volume 6787, pp. 219–230.
133. Krishnan, N.C.; Cook, D.J. Activity recognition on streaming sensor data. Pervasive Mob. Comput.
2014, 10, 138–154.
134. Cheng, J.; Amft, O.; Lukowicz, P. Active capacitive sensing: Exploring a new wearable sensing
modality for activity recognition. In Pervasive Computing; Springer: Berlin/Heidelberg, Germany,
2010; Volume 6030, pp. 319–336.
135. Reddy, S.; Mun, M.; Burke, J.; Estrin, D.; Hansen, M.; Srivastava, M. Using mobile phones to
determine transportation modes. ACM Trans. Sens. Netw. 2010, 6, 13:1–13:27.
136. Berchtold, M.; Budde, M.; Gordon, D.; Schmidtke, H.; Beigl, M. SPAR: Service-based personal
activity recognition for mobile phones. Available online: http://digisrv-1.biblio.etc.tu-bs.de:8080/
docportal/servlets/MCRFileNodeServlet/DocPortal_derivate_00010205/SPAR.pdf (accessed on
31 May 2010).
137. Banos, O.; Galvez, J.-M.; Damas, M.; Pomares, H.; Rojas, I. Window size impact in human activity
recognition. Sensors 2014, 14, 6474–6499.
138. Yoshizawa, M.; Takasaki, W.; Ohmura, R. Parameter exploration for response time reduction in
accelerometer-based activity recognition. In Proceedings of the 2013 ACM conference on
Pervasive and ubiquitous computing, Zurich, Switzerland, 8–12 September 2013; pp. 653–664.
139. Nyan, M.N.; Tay, F.E.H.; Seah, K.H.W.; Sitoh, Y.Y. Classification of gait patterns in the
time–frequency domain. J. Biomech. 2006, 39, 2647–2656.
140. He, Z.; Jin, L. Activity recognition from acceleration data based on discrete consine transform and
SVM. In Proceedings of the 2009 IEEE International Conference on Systems, Man and
Cybernetics, San Antonio, TX, USA, 11–14 October 2009; pp. 5041–5044.
141. Dernbach, S.; Das, B.; Krishnan, N.C.; Thomas, B.L.; Cook, D.J. Simple and complex activity
recognition through smart phones. In Proceedings of the 8th International Conference on Intelligent
Environments (IE), Guanajuato, Mexico, 26–29 June 2012; pp. 214–221.
142. Fahim, M. Evolutionary learning models for indoor and outdoor human activity recognition. Ph.D.
Thesis, Kyung Hee University, Seoul, Korea, 2014.
143. Hong, X.; Nugent, C.D. Segmenting sensor data for activity monitoring in smart environments.
Pers. Ubiquitous Comput. 2013, 17, 545–559.
144. Figo, D.; Diniz, P.C.; Ferreira, D.R.; Cardoso, J.M.P. Preprocessing techniques for context
recognition from accelerometer data. Pers. Ubiquitous Comput. 2010, 14, 645–662.
145. Lara, O.D.; Labrador, M.A. A survey on human activity recognition using wearable sensors.
IEEE Commun. Surv. Tut. 2013, 15, 1192–1209.
Sensors 2015, 15 11362
146. Chen, C.; Das, B.; Cook, D.J. A data mining framework for activity recognition in smart
environments. In Proceedings of the 6th International Conference on Intelligent Environments,
Kuala Lumpur, Malaysia, 19–21 July 2010; pp. 80–83.
147. Maurer, U.; Smailagic, A.; Siewiorek, D.P.; Deisher, M. Activity recognition and monitoring using
multiple sensors on different body positions. In Proceedings of the International Workshop on
Wearable and Implantable Body Sensor Networks, Boston, MA, USA, 3–5 April 2006; p. 116.
148. Waikato Environment for Knowledge Analysis. Available online: http://www.cs.waikato.ac.nz/
ml/weka (accessed on 12 May 2015).
149. Bron, E.; Smits, M.; van Swieten, J.; Niessen, W.; Klein, S. Feature selection based on SVM
significance maps for classification of dementia. In Machine Learning in Medical Imaging;
Springer International Publishing AG: Cham, Switzerland, 2014; Volume 8679, pp. 272–279.
150. Zhang, M.; Sawchuk, A.A. A feature selection-based framework for human activity recognition
using wearable multimodal sensors. In Proceedings of the 6th International Conference on Body
Area Networks, Beijing, China, 7–10 November 2011; pp. 92–98.
151. Gupta, P.; Dallas, T. Feature selection and activity recognition system using a single tri-axial
accelerometer. IEEE Trans. Biomed. Eng. 2014, 6, 1780–1786.
152. Muhammad, S.A.; Klein, B.N.; Van Laerhoven, K.; David, K. A feature set evaluation for activity
recognition with body-worn inertial sensors. In Constructing Ambient Intelligence; Springer:
Amsterdam, The Netherlands, 2012; Volume 277, pp. 101–109.
153. Giri, D.; Acharya, U.R.; Martis, R.J.; Sree, S.V.; Lim, T.-C.; Ahamed, T.; Suri, J.S. Automated
diagnosis of coronary artery disease affected patients using IDA, PCA, ICA and discrete wavelet
transform. Knowl. Based Syst. 2013, 37, 274–282.
© 2015 by the authors; licensee MDPI, Basel, Switzerland. This article is an open access article
distributed under the terms and conditions of the Creative Commons Attribution license
(http://creativecommons.org/licenses/by/4.0/).