Embed Size (px)
Citation preview

1
The efficiency of electroflocculaters at
processing restaurant waste water to reduce
pollution
Supervisor Dr. Desmond O’Toole
Student name Billy Chow Wing Yuet
Student ID. 50489534
Year 2006

2
TABLE OF CONTENTS
Abstract P.3-4
Introduction P.5-10
Materials and Methods P.11-20
Results and Discussions P.21-44
Conclusion P.45
Acknowledgements P.46
References P.47-49
3
ABSTRACT
ABSTRACT
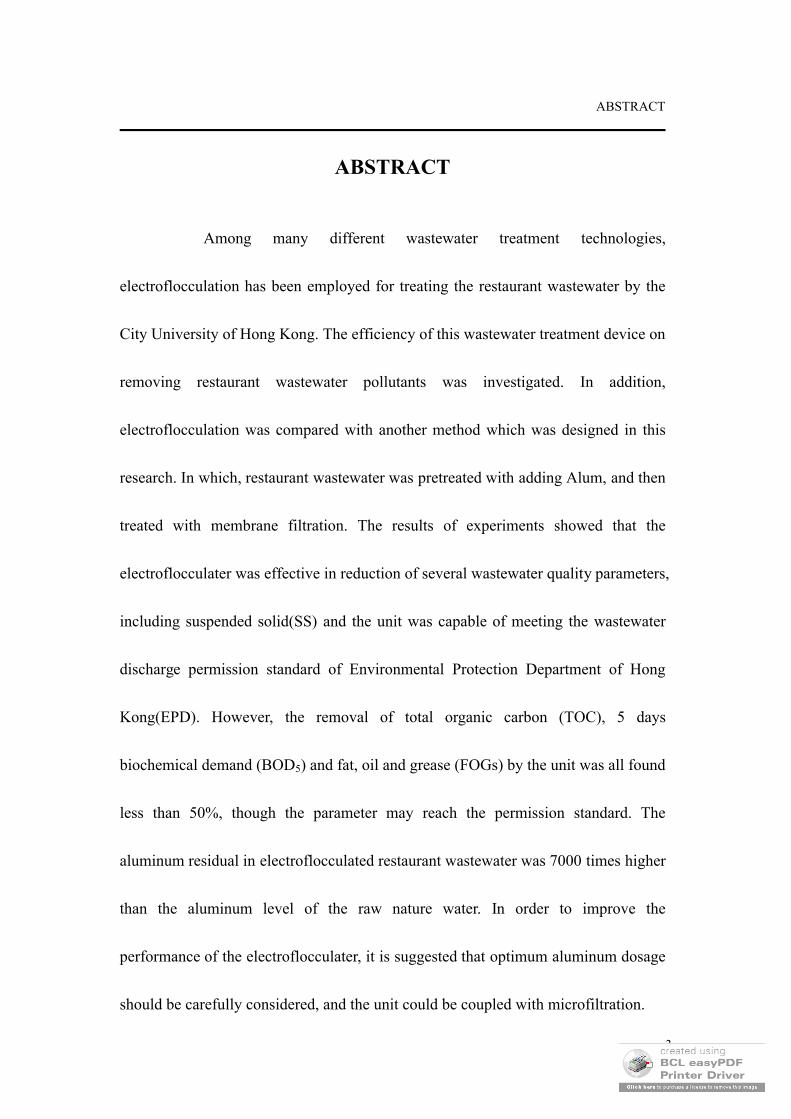
Among many different wastewater treatment technologies,
electroflocculation has been employed for treating the restaurant wastewater by the
City University of Hong Kong. The efficiency of this wastewater treatment device on
removing restaurant wastewater pollutants was investigated. In addition,
electroflocculation was compared with another method which was designed in this
research. In which, restaurant wastewater was pretreated with adding Alum, and then
treated with membrane filtration. The results of experiments showed that the
electroflocculater was effective in reduction of several wastewater quality parameters,
including suspended solid(SS) and the unit was capable of meeting the wastewater
discharge permission standard of Environmental Protection Department of Hong
Kong(EPD). However, the removal of total organic carbon (TOC), 5 days
biochemical demand (BOD5) and fat, oil and grease (FOGs) by the unit was all found
less than 50%, though the parameter may reach the permission standard. The
aluminum residual in electroflocculated restaurant wastewater was 7000 times higher
than the aluminum level of the raw nature water. In order to improve the
performance of the electroflocculater, it is suggested that optimum aluminum dosage
should be carefully considered, and the unit could be coupled with microfiltration.
4
ABSTRACT
This research demonstrated that optimum Alum dosage followed by membrane
filtration may reduce the TOC and SS in restaurant wastewater by over 99%.
5
INTRODUCTION
INTRODUCTION
Overview of restaurants and its waste effluent in Hong Kong:
According to the statistics from Food and Environmental Hygiene
Department, there are around 10,000 restaurants in Hong Kong at 2004, including
general restaurants, light refreshment restaurants, marine restaurants and factory
canteens. Over half a million ton of water is consumed and turned into wastewater
each month, which contains high oil content, salt content, bacteria, suspended solids
and dissolved organic substances, by the food industry. If the wastewater is
discharged directly down the drain, it will increase the workload of sewage treatment
plants and consequently lower its efficiency. An Electroflocculater is relatively small
in size and an economical wastewater treatment system, which is able to reduce
pollutants in a huge volume of wastewater within a short period of time. This makes
it suitable for a city which is lack of area like Hong Kong.
Background of coagulation:
Traced back to thousands of years ago, the Egyptians have used
coagulation since 2000 BC (Faust and Aly 1998). Municipal water treatment using
coagulation dates from around 1757. Various chemicals have been used for
coagulation, in which, Alum, which is known to early Romans of 2000BC, is still the
6
INTRODUCTION
most commonly used coagulant. This old technique inspired the invention of the latest
nowadays electroflocculater. Nevertheless, the chemistry behind the coagulation
process is rather complex. And a lot of models have been suggested to explain the
phenomenon.
Chemistry of electroflocculation:
The chemistry of electroflocculation involves two parts –
electro-coagulation and electro-flotation.
Electro-coagulation:
The chemical coagulation of turbid and colored surface waters involves
the interaction of particulates with a destabilizing agent. In this research, the
destabilizing agent was aluminum ions which were electrically dissolved into
wastewater (see equation (1)). The essential purpose of coagulation is to aggregate the
pollutant particles into larger size flocs.
Primary reaction:
Al(s) → Al 3+(aq) + e- (1)
Secondary reactions:
2Cl-(aq) + 2e- → Cl2(aq) (2)
2H2O(l) + 4e- → O2(g) + 4H+(aq) at acidic condition (3)
4OH-(aq) + 4e- → 2H2O(aq) + O2(g) at alkaline condition (4)
The chemical equations (1) – (4) can conclude the main reaction in the
electroflocculater (Chen, Chen and Cheng 2002).

7
INTRODUCTION
Electro-flotation:
After the pollutants have been coagulated and destabilized, they will
then be floated to the wastewater surface by the gas bubble produced in equation (3)
and (4). While the wastewater is acidic, equation (3) reaction will proceed. On the
contrary, equation (4) will proceed when the wastewater is alkaline.
The basic setup of the electroflocculater:
The electrochemical reactor consists of a number of aluminum anodes
(act as sacrificial electro-plates) and stainless steel cathodes which are connected in
dipolar mode. Fig 1 illustrates the setup of the whole system.
The restaurant wastewater, after the treatment of the grease trap, enters
the reactor from the bottom and flows upward through the narrow spaces between
the electrodes. During electrolysis, aluminum dissolves and coagulates with the
pollutants. At the same time, gas bubbles which are generated at the electrodes will
assist in the flotation of flocs.

8
INTRODUCTION
Fig.1. Systematic figure of the electroflocculater
A DC current supply provides the electrical power. The current can be
adjusted in the range of 0-1000A, and the potential difference between the electrodes
can then be varied from 0 – 18V. The voltage will vary automatically according to
the wastewater conductivity.
Literature review:
Most studies seem to agree that an electroflocculater can remove a vast
variety of pollutants in wastewater. Robinson (2000) suggested that
electroflocculation can typically remove 99% of bacteria in wastewater from
agricultural industry by physically destroying it. It was also found that
electroflocculation efficiently reduced the color, turbidity, bacteria count and BOD5
of domestic wastewater, over 99% in most of the cases. The application of

9
INTRODUCTION
electroflocculation on treating monosodium glutamate fermentation wastewater had
been investigated (Chen, Chen and Cheng 2002).The experimental results showed
that electroflocculation can efficiently remove the organic and color of MSG
fermentation wastewater. In addition, the anionic polymer acts as a better floatation
agent than both cationic and nonionic polymers.
However, there were also some reports which were not in line with the
above studies. Nielson and Smith (2005) suggested that the electroflocculater cannot
effectively remove soluble compound such as COD and BOD, although it showed
satisfactory result in removing suspended solids.
The purpose of this research:
Although much work has been done to date, few studies have specifically
reported on the performance of electroflocculater on treating restaurant wastewater.
Therefore, it is suggested that more investigation need to be conducted to ascertain
the efficiency of electroflocculater on treating restaurant wastewater, which has a
characteristic of high oil content and dissolved organic substances.
The purpose of this study was to ascertain the efficiency of
electroflocculater on reducing pollutants in restaurant wastewater. The
electroflocculater chosen to be investigated which was located at phase II of City
10
INTRODUCTION
University of Hong Kong.
This system was setup to treat the restaurant wastewater, which had been
pre-treated by an oil trap, produced by the canteen of the University. Facilities
Management Office of the university provided information showed that about
100,000 m3 of wastewater was generated each year from the catering outlets.
Therefore, it was necessary to thoroughly examine the quality of the wastewater after
electroflocculation. Seven major parameters were selected to determine the quality of
the electroflocculated wastewater — pH, turbidity, conductivity, TOC, BOD5, FOGs
and aluminum concentration. In addition, the efficiency of the electroflocculation
would be compared with another wastewater treatment method (hybrid method) –
chemical dosage of aluminum sulfate followed by membrane filtration.

11
MATERIALS AND METHODS
MATERIALS AND METHODS
Sampling technique
Wastewater samples were collected 1 time per week at the phase II
electroflocculater of City University of Hong Kong. 1 liter of wastewater sample was
collected respectively from the inlet and the outlet of the system. During sampling,
one liter volume glass bottle was used and it was autoclaved beforehand. Wastewater
sample would then being measured immediately in laboratory after wastewater
sample collection.
pH measurement
Instruments: pH-meter (HANNA HI8484; calibrated with pH 4 and pH 7 buffers
respectively)
Shake the 1L non-electroflocculated wastewater (inlet) evenly inside the
glass bottle, and then pour 30ml wastewater into a 50ml beaker. Temperature of the
30ml wastewater of was measured with a thermometer in a 50ml beaker. Then,
measured temperate result would be used to adjust the measuring temperature of the
pH-meter. The pH-electrode was then immersed into the 30ml wastewater sample
with a magnetic stir bar swirling. The pH reading was taken until the pH-meter give
a steady readout. The previous steps were repeated to measure the pH of the
12
MATERIALS AND METHODS
electroflocculated wastewater from the electroflocculated wastewater (outlet).
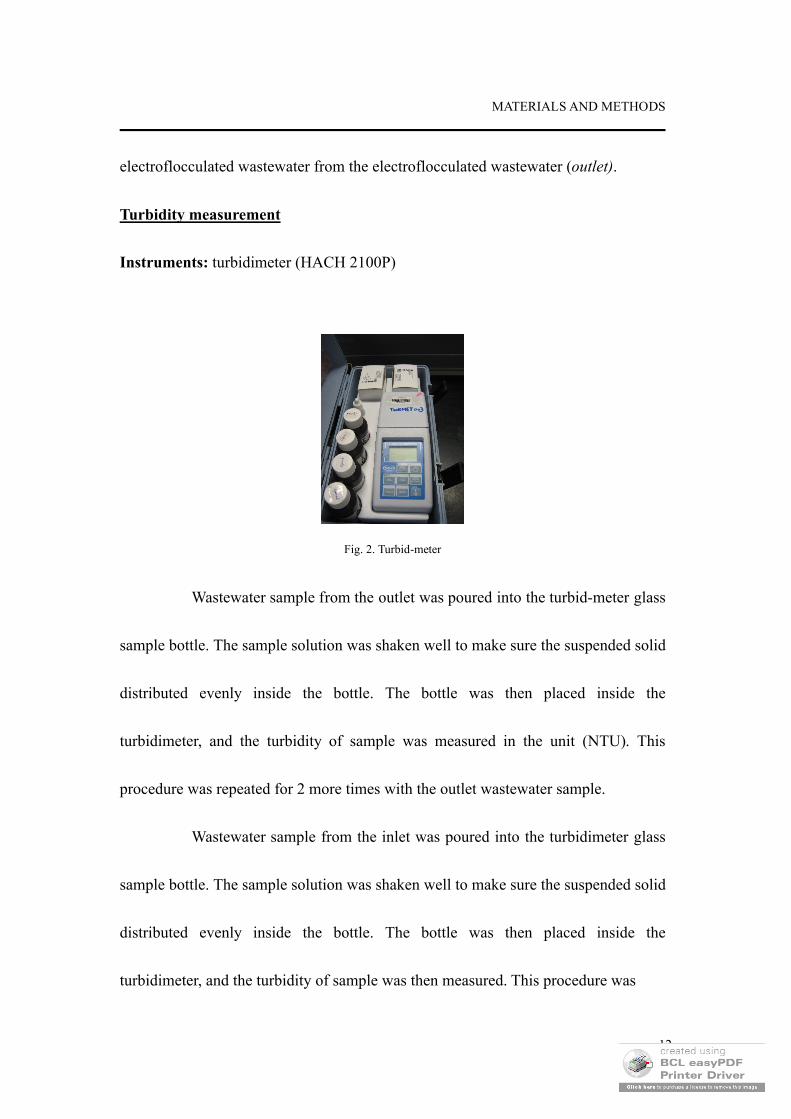
Turbidity measurement
Instruments: turbidimeter (HACH 2100P)
Fig. 2. Turbid-meter
Wastewater sample from the outlet was poured into the turbid-meter glass
sample bottle. The sample solution was shaken well to make sure the suspended solid
distributed evenly inside the bottle. The bottle was then placed inside the
turbidimeter, and the turbidity of sample was measured in the unit (NTU). This
procedure was repeated for 2 more times with the outlet wastewater sample.
Wastewater sample from the inlet was poured into the turbidimeter glass
sample bottle. The sample solution was shaken well to make sure the suspended solid
distributed evenly inside the bottle. The bottle was then placed inside the
turbidimeter, and the turbidity of sample was then measured. This procedure was

13
MATERIALS AND METHODS
repeated for 2 more times with the inlet wastewater sample.
Conductivity measurement
Instruments: bench-top conductivity meter (Cole-Parmer’s 19000-00-05; calibrated
with 0.01M KCL)
The electrode of the conductivity meter was immersed into 50ml 0.0
1M KCL solution for calibration. After 15 minutes, the readout of the conduct
ivity meter was adjusted to 1413μS and the temperature was set to 20℃.
50ml of the outlet wastewater sample was poured into a 100ml beaker.
The electrode of the conductivity meter was immersed into the solution. During
measuring, the solution was stirred until stable reading was displayed. This
procedure was repeated for 2 times more.
50ml of the inlet wastewater sample was poured into a 100ml beaker. The
electrode of the conductivity meter was immersed into the solution. During
measuring, the solution was stirred until stable reading was displayed. This
procedure was repeated for 2 times more.

14
MATERIALS AND METHODS
Total organic carbon measurement (TOC)
Instruments: TOC analyzer (Shimadzu TOC 5000A)
Fig. 3. TOC analyzer
Respective 50ml of the sample from the inlet and outlet was filtered with
suction filtration. Then the wastewater sample was filled into a TOC test-tube and
being measured. Distilled water was used as blank.

15
MATERIALS AND METHODS
Bio-oxygen demand(BOD5)
Instruments: Dissolved oxygen-meter (YIS model 58)
Fig. 4. Dissolved oxygen-meter
Reagents: a) Phosphate buffer solution (dissolve 8.5g KH2PO4, 21.75g K2HPO4,
33.4g Na2HPO4.7H2O, and 1.7g NH4Cl in about 500mL distilled water
and dilute to 1L. The pH should be 7.2 without further adjustment.)
b) Magnesium sulfate solution (dissolves 22.5g MgSO4.7H2O in distilled
water and diluted to 1L)
c) Calcium chloride solution (dissolves 27.5g CaCl2 in distilled water and
dilute to 1L)
d) Ferric chloride solution (dissolves 0.25g FeCl3.6H2O in distilled water
and dilute to 1L)
16
MATERIALS AND METHODS
Preparation of nutrient solution
1mL each of phosphate buffer, MgSO4, CaCl2, and FeCl3 solutions were
added into 1L of distilled water. The solution was then pumped with air for 1 hour to
saturate its oxygen gas concentration.
To fill in six 300ml BOD5 bottles according to table 1:
Table 1. Different dilution of inlet wastewater
Bottle 1 Bottle 2 Bottle 3
wastewater sample
from inlet
10 ml( original
concentration)
10ml( previously
diluted by 10 fold)
10ml(previously dilute
by 100 fold)
Nutrient solution 290ml 290ml 290ml
Table 2. Different dilution of outlet wastewater
Bottle 4 Bottle 5 Bottle 6
wastewater sample
from outlet
10 ml( original
concentration)
10ml( previously
diluted by 10 fold)
10ml(previously dilute
by 100 fold)
Nutrient solution 290ml 290ml 290ml
The initial DO of the solutions in the six BOD5 bottles was measured with
dissolved oxygen-meter. Then, the BOD5 bottles were incubated in 20℃ for 5 days.
The final DO of the solutions in the six BOD5 bottles was measured with
Dissolved oxygen-meter and recorded.

17
MATERIALS AND METHODS
Fat, oil and grease(FOG) content
Instruments: quick fit for distillation, 1 L separating funnel
Reagents: conc. HCl, n-hexane (Lab-scan, 99% n-hexane), anhydrous sodium
sulfate
10ml conc. HCl was respectively introduced into 1L wastewater sample
from outlet and inlet of the electroflocculater in glass sampling bottles.
1L of the acidified inlet wastewater sample was poured into a 1L
separating funnel, followed by 50ml of n-hexane. Stopper the separating funnel with
a glass cork, and then shake it vigorously for about 5 minutes. Meanwhile, the
built-up pressure inside the separating funnel should be released by opening the tap
of the funnel. The separating funnel was then settled with a funnel ring holder like
fig.1 for about 30 minutes until two immiscible liquid layers were formed. The
n-hexane layer was discharged into a 250ml beaker. Excess anhydrous NaSO4 power
was added into the solution until the turbid solution turned into clear. This was
repeated with another 50ml n-hexane solution to extract the same sample.

18
MATERIALS AND METHODS
Fig.5. Setup of the separating funnel.
A 250ml round bottom flask with several anti-bumping granules was
previously weighted. Then, the two beaker of n-hexane extract was filtered into the
round bottom flask through a filter paper.
Fig. 6 . Setup of the distillation quick fit.
Assemble the quick fit according to fig. 6 and start the distillation. The
19
MATERIALS AND METHODS
distillate which came out at 69℃ was n-hexane; therefore, the remaining solution was
the yellowish extracted oil from the wastewater. The heating was ceased when the
distillate temperature started to rise over 69℃. The round bottom flask was weighted
again. As a result, the amount of oil in the 1L wastewater sample could then be calculated
by the weight difference.
The above procedure was repeated to determine the oil content of the
wastewater sample from the outlet of the electroflocculater.
Aluminum concentration measurement:
Reagent: conc. HCl, conc. HNO3
Instrument: ICP-MS, 50ml volumetric flask
Firstly, 5ml conc. HCl and 5ml conc. HNO3 was introduced into the 50ml
inlet wastewater. Then, the solution was boiled for 15 minutes. 1ml of the solution
was pipette into a 50ml volumetric flask and was diluted to the mark with DI water.
The diluted solution was then measure with ICP-MS.
The outlet wastewater was repeated with the same procedure. And, the
acid blank was also measured.

20
MATERIALS AND METHODS
Conventional coagulation using Alum followed by 0.20um membrane
filtration(hybrid method):
Reagent: Al2(SO4)3.18H2O (Hjax Chemicals)
Apparatus: 0.20μm membrane(sterile-E0)
1g of Al2(SO4)3.18H2O was added into the inlet wastewater. Continues
swirling was necessary for help the aluminum sulfate to dissolve. The pH was
maintained in the range 6.5-7.5. When the pH is low, calcium oxide was added. On
the other hand, when pH is high, dilute HCl (0.1M) was added to adjust the pH back
into the range. Then, the solution was kept standstill for 1 hour.
After the coagulation process, the solution was filtered with 0.20μm membrane. The
TOC and turbidity of it was then measured.

21
RESULTS AND DISCUSSIONS
RESULTS AND DISCUSSIONS
Effect of electroflocculater on pH of wastewater:
Table 3. Result of the pH change after electroflocculation
pH
sample Inlet Outlet pH change (%)
1 6.03 6.09 -0.995
2 5.83 5.91 -1.372
3 6.47 6.86 -6.028
4 6.43 6.81 -5.910
5 6.07 6.02 0.824
6 6.26 6.42 -2.556
average 6.18 6.35 -2.673
The average pH of outlet wastewater was 6.35, which was very close to
the average pH of the inlet wastewater. Although no significant changes in average
pH values, it was noticed that, in sample 1, 2, 3, 4 and 6, the electroflocculater
tended to neutralize and raise the pH of the wastewater. (In table 3, the –ve sign in
pH change means increase in %)
22
RESULTS AND DISCUSSIONS
pH of sample 1 to 6
5
5.5
6
6.5
7
1 2 3 4 5 6
Sample
pH Inlet
outlet
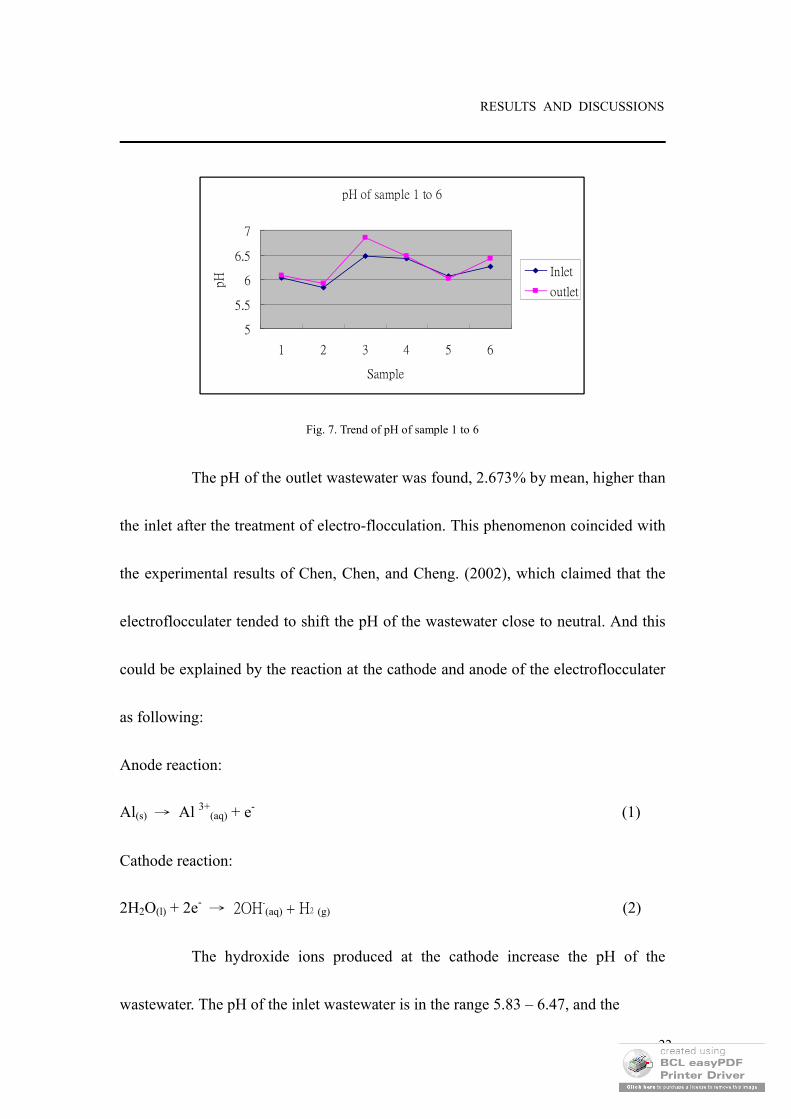
Fig. 7. Trend of pH of sample 1 to 6
The pH of the outlet wastewater was found, 2.673% by mean, higher than
the inlet after the treatment of electro-flocculation. This phenomenon coincided with
the experimental results of Chen, Chen, and Cheng. (2002), which claimed that the
electroflocculater tended to shift the pH of the wastewater close to neutral. And this
could be explained by the reaction at the cathode and anode of the electroflocculater
as following:
Anode reaction:
Al(s) → Al 3+(aq) + e- (1)
Cathode reaction:
2H2O(l) + 2e- → 2OH-
(aq) + H2 (g) (2)
The hydroxide ions produced at the cathode increase the pH of the
wastewater. The pH of the inlet wastewater is in the range 5.83 – 6.47, and the

23
RESULTS AND DISCUSSIONS
electroflocculater, in average, raises the pH of it by 2.673 %( see table 3). This allow
the outlet wastewater to reach the discharge standard (pH 6 - pH 10).
The pH of the inlet wastewater would not affect the efficiency of
electroflocculater on removing FOG, SS and COD (Chen, Chen and Cheng 2002),
except the pH < 4 or > 9. Since the pH of restaurant wastewater is already at the
optimum range, it is believed that the performance of the electroflocculater on
lowering other pollutants is independent of inlet wastewater pH. This would be an
advantage that it saves an effort on adjusting the pH of the system.
Effect of electroflocculater on conductivity of wastewater:
Table 4. Result of conductivity change after electroflocculation
Conductivity
sample Inlet(μS) Outlet(μS) Decrease of conductivity (%)
1 2070 780 62.32
2 690 463 32.10
3 670 549 18.06
4 883 288 67.39
5 1162 374 67.80
average 1095 490.8 49.70
The average conductivity of inlet wastewater was 1095μS. It was found
that the electroflocculater can lower the conductivity of wastewater by 49.70%. This

24
RESULTS AND DISCUSSIONS
parameter can indirectly show the removal efficiency of electroflocculater on
decreasing the high NaCl(s) level in restaurant wastewater. Since directive
measurement on NaCl(s) concentration would be extremely inconvenient, so this
method is relatively fast and easy. In this research, it was found that the
electroflocculater could remove 49.70% of salts in average (see table 4).
0
20
40
60
80
0 200 400 600 800 1000 1200 1400
inlet wastewater condutivity(μs)
TO
C r
emoval
(%)
Fig. 8. Change on TOC remval rate upon increase of conductivity
The electroflocculater could alter the potential difference between the
electrodes in reactor varied from 0 to 18V. And the voltage varied automatically
according to the wastewater conductivity. It was found that when the conductivity
was high, the electroflocculater gave a better performance on removing TOC (see
graph 2)

25
RESULTS AND DISCUSSIONS
Efficiency on removing suspended solid (SS):
The ability of electroflocculater on reducing the SS was examined with
the parameter – turbidity. The average turbidity of inlet wastewater was 228 NTU
and the electroflocculater could effectively remove 85.05% SS. The average turbidity
of outlet wastewater was obtained equal to 32.07 NTU. (see table 2)
Table 5. Result of turbidity change after electroflocculation
Turbidity
Sample Inlet(NTU) Outlet(NTU) Removal efficiency (%)
1 150 30.0 80.00
2 276 10.7 96.12
3 205 15.1 92.63
4 249 49.6 80.08
5 276 23.1 91.63
6 212 63.9 69.86
Average 228 32.07 85.05
In that study, the amount of SS was examined with turbid meter.
The results showed that the electroflocculater can successfully lower the
turbidity of wastewater by 85.05 %( Table4). The average turbidity of discharged
treated restaurant wastewater was 32.7NTU, which met the permission standard
of EPD (75NTU).

26
RESULTS AND DISCUSSIONS
Rose of SS concentration of discarded wastewater upon temperature drop:
A problem is figured out upon the electroflocculater upon SS
removal. The turbidity of outlet wastewater soars when temperature dropps (see
fig. 2).
Turbidity of wastewater along temp. change
R2 = 0.9975
0
20
40
60
80
100
0510152025
Temp. (℃)T
urb
idity
(N
TU
)
Fig. 9. Turbidity change when temperature drops
A sample of outlet wastewater was investigated. 50ml of the sample
was placed in the fringe, the turbidity of the sample increased by 31.92% when
its temperature dropped gradually by 12℃. This could be explained that the
retention time of wastewater inside the electroflocculater is not long enough.
Thus, the dissolved organic substances do not have enough time to form flocs
through electro-coagulation and being removed as sludge.
After discard, since the aluminum derivatives and flocs are still
reacting, when the temperature drops, the solubility of flocs decreases and is
27
RESULTS AND DISCUSSIONS
then being speeded up to be precipitated out. It is believed that while the
discharged wastewater from the outlet of the system flows along the narrow and
cold water pipe, especially in winter when the temperature is usually around
10℃ in Hong Kong, this effect would be much more predominant. This may
lead to the turbidity rise over the permission standard of EPD.
In order to improve the performance for the electroflocculater on
removing SS, it was suggested that the retention time of the wastewater inside
the system should be increased by lowering the flow rate. This provides
optimum time for electro-coagulation and electro-flotation.
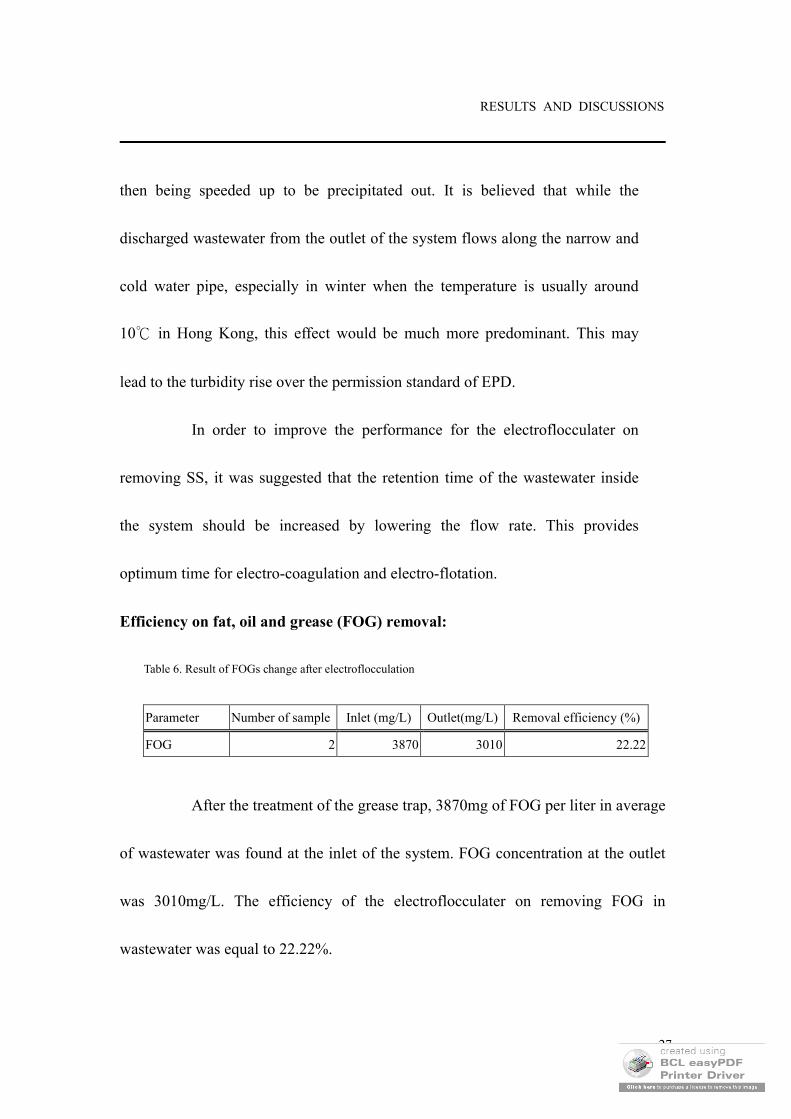
Efficiency on fat, oil and grease (FOG) removal:
Table 6. Result of FOGs change after electroflocculation
After the treatment of the grease trap, 3870mg of FOG per liter in average
of wastewater was found at the inlet of the system. FOG concentration at the outlet
was 3010mg/L. The efficiency of the electroflocculater on removing FOG in
wastewater was equal to 22.22%.
Parameter Number of sample Inlet (mg/L) Outlet(mg/L) Removal efficiency (%)
FOG 2 3870 3010 22.22

28
RESULTS AND DISCUSSIONS
In this research, the standard method of Jackson (1993) on
determining FOGs content was employed. However, there was an amendment.
Freon-113 was replaced with another extraction solvent (n-hexane). Thus, FOGs
was defined as n-hexane extractable substances. It was necessary to not use
Freon-133 as extraction solvent because it was CFCs which had been proved
causing damage to the ozone layer. Besides, a vast volume of solvent would be
used in each experiment.
Fig.10. n-hexane extracted FOGs of outlet wastewater from distillation
Before the restaurant wastewater flowed onto the electroflocculater, it
was expected that a large proportion of the oily substances would had been
removed by the grease trap. However, the FOGs measured at the inlet
wastewater were still high, the average was 3870 mg/L. Fig.10 showed the
n-hexane extracted FOGs from distillation. On the other hand, the

29
RESULTS AND DISCUSSIONS
electroflocculater did not remove the FOGs successfully; the removal efficiency
was only 22.22% by mean. And, the FOGs concentration at the outlet of the
system was 3010mg/L, which was much higher than the permission standard of
the EPD(100mg/L).This result was inconsistent with the previous research
(Robinson 1999), which claimed that electroflocculater can remove over 99.9%
of FOGs.
This large in differences could be attributed to the nature and amount
of FOGs in the wastewater. In the research of the Robinson (1999), the
wastewater which was examined was industrial wastewater. However, in the
current experiment, the wastewater was restaurant wastewater. In restaurant
wastewater, the FOGs mostly came from animals, fryers and plant sources,
which were relatively much more emulsified. In fig.11, it showed the feature of
restaurant wastewater. It could be noticed that no distinguishable layer was
found, though the FOGs level was very high.
Fig.11. Outlet wastewater (left) inlet wastewater (right)

30
RESULTS AND DISCUSSIONS
It is suggested that FOGs could induced sewer system blockages,
because FOGs naturally stick to the wall of metal, plastic and ceramic sewer
piping.
Efficiency on removing total organic carbon (TOC):
Table 7. Result of TOC change after electroflocculation
TOC
Sample Inlet(mg/L) Outlet(mg/L) Removal efficiency (%)
1 284.6 193.3 32.08
2 329.8 191.6 41.90
3 442.2 269.9 38.96
4 547.0 365.9 33.11
5 613.4 192.2 68.67
6 1034 375.6 63.68
Average 541.8 264.8 46.40
In table 6, it showed that the average TOC concentration at the inlet
wastewater was 541.83mg/L, and the electroflocculater could remove 46.40% of
TOC in the wastewater, in average. An average of 264.75mg/L total organic
substances was remaining inside the electroflocculated wastewater, and was
discarded at the outlet.
31
RESULTS AND DISCUSSIONS
The relationship between TOC of inlet wastewater and TOC
removal efficiency
R2 = 0.5147
0
20
40
60
80
0 200 400 600 800 1000 1200
TOC at inlet(ppm)
TO
C r
emova
l
effi
cien
t(%
)
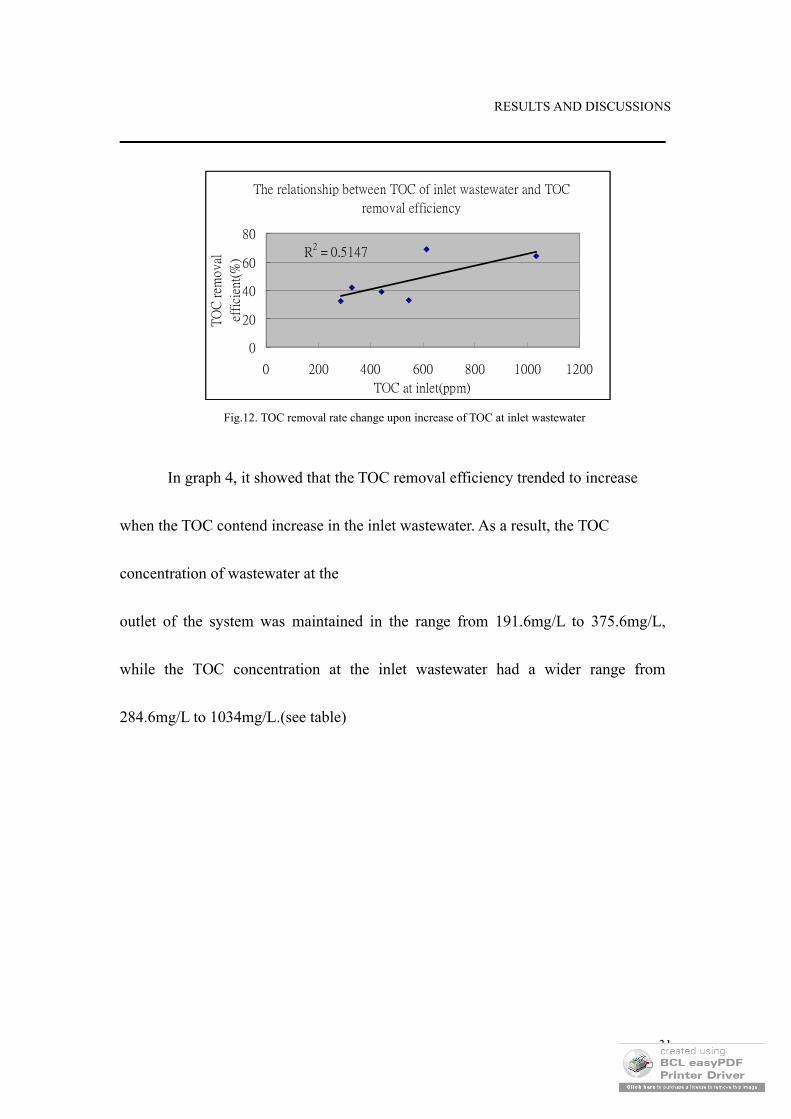
Fig.12. TOC removal rate change upon increase of TOC at inlet wastewater
In graph 4, it showed that the TOC removal efficiency trended to increase
when the TOC contend increase in the inlet wastewater. As a result, the TOC
concentration of wastewater at the
outlet of the system was maintained in the range from 191.6mg/L to 375.6mg/L,
while the TOC concentration at the inlet wastewater had a wider range from
284.6mg/L to 1034mg/L.(see table)

32
RESULTS AND DISCUSSIONS
Efficiency on removing BOD5:
Table 8. Result of dissolved oxygen change after electroflocculation
Inlet outlet
Sample before(mg-O2/L) after(mg-O2/L) before(mg-O2/L) after (mg-O2/L)
1 9.2 6.3 9.1 7.7
2 9.1 6.6 9.2 7.6
Average 9.15 6.45 9.15 7.65
Bio-oxygen demand was calculated with the following equation:
BOD5 = (B1-B2)/P
Whereas
B1 = average of initial DO
B2 = average of finial DO
P = dilution factor (P was taken to 0.03333 in this experiment)
Table 9. Result of BOD5 change after electroflocculation
Inlet(mg/L) Outlet(mg/L) removal rate
BOD5 810.1 450 44.45%
Since the dilution chosen was tenfold, the BOD5 had been multiplied by
ten. The mean BOD5 of the inlet wastewater was 810.1mg/L. And, the
electroflocculater could remove 44.45% of bio-degradable dissolved organic
substances in wastewater. The mean BOD5 of the outlet wastewater was 450mg/L,
which was lower than the discharge limit of the EPD (1200mg/L). Although it
33
RESULTS AND DISCUSSIONS
reached the permission standard of EPD, the removal efficiency (44.45%) was not
satisfactory. Poor BOD5 and TOC removal was not abnormal in electro- flocculation,
as Nielson and Smith (2005), reported BOD5 removals of no more than 50-60% and
COD removals of only 35% when using electroflocculation technology to treat Gold
Bar wastewater. In some cases, it was not rare that the restaurant produced
wastewater with BOD5 over 3000mg/L. Then, the electroflocculater would possible
to produce effluent with BOD5 beyond the EPD permission standard, with that low
BOD5 removal efficiency.
Effect on aluminum concentration:
The aluminum concentration of inlet and outlet wastewater was
measured with ICP-MS. Since the aluminum ions may be bound tightly to the
organic substances, the wastewater samples were therefore treated with wet
digestion. In this processes, the wastewater sample was refluxed with a solution
of conc. HCL and conc. HNO3. The purpose was to digest all the organic
substances and release the aluminum ions out, for accurate analysis with the
ICP-MS.
34
RESULTS AND DISCUSSIONS
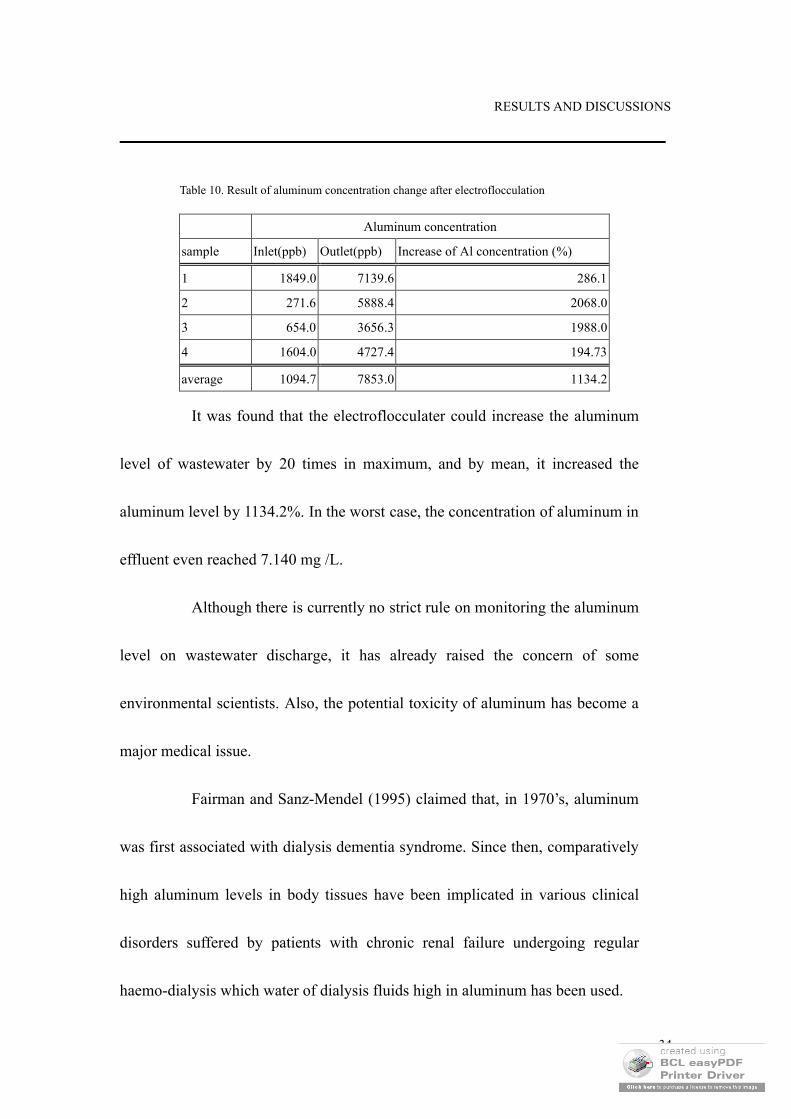
Table 10. Result of aluminum concentration change after electroflocculation
Aluminum concentration
sample Inlet(ppb) Outlet(ppb) Increase of Al concentration (%)
1 1849.0 7139.6 286.1
2 271.6 5888.4 2068.0
3 654.0 3656.3 1988.0
4 1604.0 4727.4 194.73
average 1094.7 7853.0 1134.2
It was found that the electroflocculater could increase the aluminum
level of wastewater by 20 times in maximum, and by mean, it increased the
aluminum level by 1134.2%. In the worst case, the concentration of aluminum in
effluent even reached 7.140 mg /L.
Although there is currently no strict rule on monitoring the aluminum
level on wastewater discharge, it has already raised the concern of some
environmental scientists. Also, the potential toxicity of aluminum has become a
major medical issue.
Fairman and Sanz-Mendel (1995) claimed that, in 1970’s, aluminum
was first associated with dialysis dementia syndrome. Since then, comparatively
high aluminum levels in body tissues have been implicated in various clinical
disorders suffered by patients with chronic renal failure undergoing regular
haemo-dialysis which water of dialysis fluids high in aluminum has been used.

35
RESULTS AND DISCUSSIONS
Moreover, Alzheimer’s disease has been demonstrated a positive relationship
with aluminum level in daily intake by epidemiological studies (WHO 1998). If
aluminum is unlimitedly discharged into the environment and enters the food
chains, it would harm human beings in certain extends.
In addition, aluminum has been proved toxic to aquatic organism. In
the river and lakes of U.S.A. and Canada, the decline in fish numbers, and in
some cases the elimination of entire fish populations, has been linked to the
subsequent increase in aluminum level (Fairman and Sanz-Mendel 1995). It was
identified that the Al(OH)2+ and Al(OH)2+ species was toxic to fishes. The
mechanism could be attributed to two main factors. Firstly, at aluminum
concentration (>0.5mg/L), colloidal aluminum hydroxide species could clog fish
gill and inhibit proper respiratory function. Secondly, at aluminum concentration
(<0.2mg/L), aluminum alters the passive permeability to ions of fish gills. As a
result, it disrupted the normal osmo-regulatory balance.
In nature, it has been reported that the normal aluminum
concentration was 0.001-0.05mg/L (WHO 1998). In this research, it is believed
that the negative effect on the environment would be serious when the
electroflocculated effluent, which contains possibly 7, 000 times aluminum level
36
RESULTS AND DISCUSSIONS
higher than in nature, is discharged into the harbors and seas without proper
monitoring. The aquatic ecological system could be severely damaged.
0
1
2
3
4
0 20 40 60 80
TOC removal(%)
log (
Al in
crea
se %
)
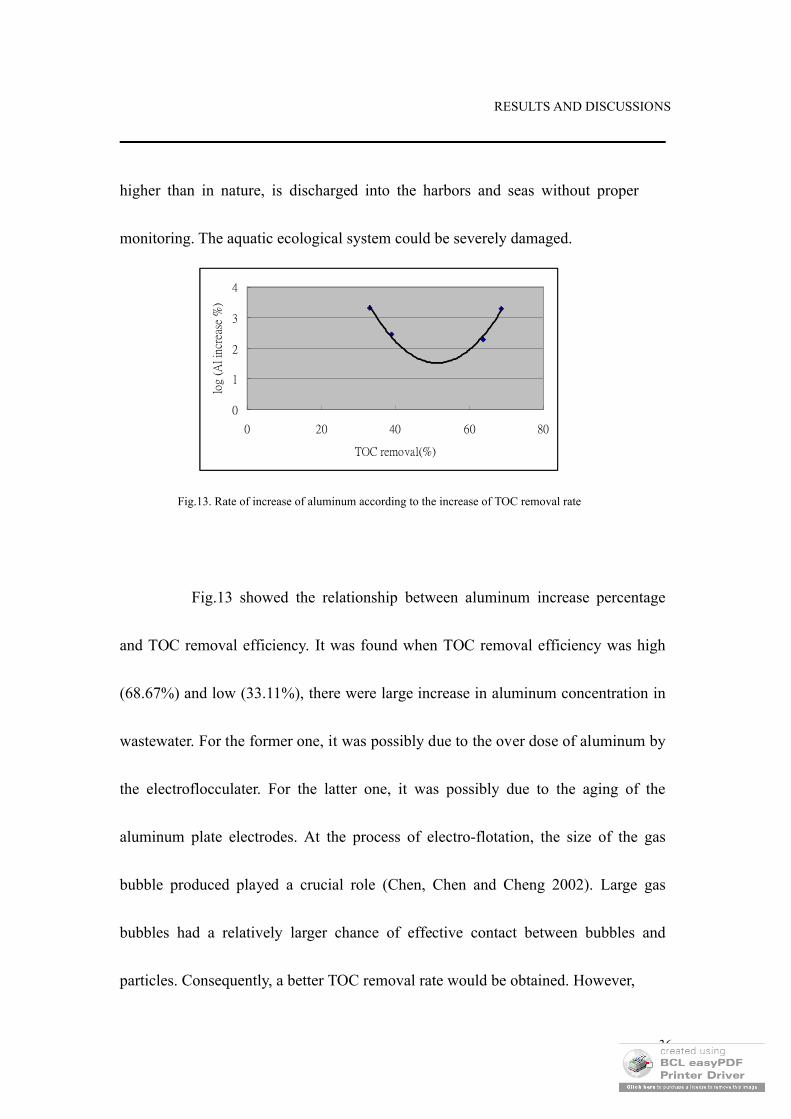
Fig.13. Rate of increase of aluminum according to the increase of TOC removal rate
Fig.13 showed the relationship between aluminum increase percentage
and TOC removal efficiency. It was found when TOC removal efficiency was high
(68.67%) and low (33.11%), there were large increase in aluminum concentration in
wastewater. For the former one, it was possibly due to the over dose of aluminum by
the electroflocculater. For the latter one, it was possibly due to the aging of the
aluminum plate electrodes. At the process of electro-flotation, the size of the gas
bubble produced played a crucial role (Chen, Chen and Cheng 2002). Large gas
bubbles had a relatively larger chance of effective contact between bubbles and
particles. Consequently, a better TOC removal rate would be obtained. However,

37
RESULTS AND DISCUSSIONS
while the aluminum plate electrode became old, rough surface was resulted from
corrosion. Thus, small gas bubbles would be produced and low TOC removal
percentage was obtained. This also leaded to large amount of aluminum residue left
inside the effluent and caused large high aluminum increase percentage.
At 2004, according to economic information, the aluminum price was
about HK$16/kg. Since the FMO of City University of Hong Kong reported that
100,000 m3 of wastewater was generated each year and the aluminum remaining in
the effluent was around 7mg/L. Therefore, 714 tons of aluminum would be
discharged into the sea and wasted. It is estimated that HK$10, 000 of aluminum
would be lost per year by discharging the metal ions with effluent, due to the
inefficient pollutant removal.

38
RESULTS AND DISCUSSIONS
Conventional coagulation using Alum followed by 0.20um membrane filtration
(hybrid method):
Table 11. Result of the turbidity change after coagulation with Alum and membrane filtration
Sample before(NTU) after(NTU) Removal efficiency (%)
1 184 1 99.46
2 205 0.35 99.83
3 212 2.57 98.79
4 249 0.88 99.65
5 276 0.73 99.74
average 225.2 1.106 99.49
Table 11 showed that the hybrid method of chemically dosage of
aluminum sulfate could on average lower the turbidity of the restaurant wastewater by
99.50%. This removal rate was higher than the electroflocculater which could only
remove 85.05% of SS.
The high efficiency of this method could be attributed to the 0.20μm
membrane. With these tiny pores on the membrane, only 0.5% of the SS in restaurant
wastewater is capable of passing through. In some cases, the turbidity of treated

39
RESULTS AND DISCUSSIONS
water was lower than 0.5 which even reached the physical standard (<2NTU) of
drinking water.
Table 12. . Result of the turbidity change after coagulation with Alum and membrane filtration
Sample Before(mg/L) after(mg/L) Removal efficiency (%)
1 284.6 193.3 32.08
2 442.2 1.528 99.65
3 462 22.97 95.01
4 613 515.4 15.92
5 1034 811.4 21.53
average 567.2 309.0 52.842
The result showed that this method could remove 15.92 – 99.65% of TOC
in restaurant water, and the mean removal efficiency was 52.84%, which was better
than the electroflocculater 46.40% by mean.
The large fluctuation of removal efficiency on dissolved organic substance
of this method was caused by the amount of dosage of aluminum sulfate in restaurant
wastewater. Gao, Yang, Zhang and Hu (2004) reported that the dosage of aluminum

40
RESULTS AND DISCUSSIONS
sulfate in a rate of 90mg/L of oilfield wastewater could successfully remove >80% of
TOC. Thus, the low removal efficiency at sample 5
Fig.14. Comparison on Alum and Ferric coagulation on
TOC removal (Gao Y.X., M. Yang, Y. Zhang, and J.Y. Hu 2004)
was due to the high TOC(1034mg/L) in restaurant wastewater. In consequence, the
added aluminum sulfate was insufficient to precipitate out the dissolved organic
substances. Moreover, higher TOC contend needed longer coagulation time (>1hour).
To improve the method, the optimum dosage of aluminum sulfate should previously
be determined. Different amounts of aluminum sulfate were added into the restaurant
wastewater, then, a calibration curve will be plotted according to the increase in
turbidity. The dosage which would bring the highest increase of turbidity is the
optimum dosage. The aluminum residual would also need to be considered. The lower
the residual, the better dosage rate will be obtained.
The pH needs to be keep within the range of 6.5-7.5 to obtain better

41
RESULTS AND DISCUSSIONS
efficiency of coagulation with aluminum ions of TOC. If the pH is out of this range,
the flocs forming would be unstable. As a result, large flocs are not enhanced to be
formed. It is suggested that, at alkaline condition, stable Al(OH)3 is formed. Therefore,
the function of aluminum ions as coagulant would be lost. On the contrary, at acidic
conditions, the aluminum ions are too soluble and not intend to bind with pollutants.
The efficiency of electroflocculater on removing other pollutants:
Although the capability of the electroflocculater on removing other
pollutants, such as nitrates, phosphates and sulfates, were not being measured in the
research. The WHO (1995) reported that the electro-coagulation method reduced
those parameters by 77.5% for nitrates, 83.3% for phosphates and 20% for sulfates at
the optimum electro-current (40 mA) used for coagulation.
In addition, Huang, Su, Huang, Ho and Tsal (2000) suggested that
coagulation triggered with aluminum ions was a good method on removing heavy
metal ions, such as Cu, Zn, Pb, Cr,Co, in wastewater. The mechanism is that the
heavy metal ions would be absorbed into the flocs during coagulation. It is believed
that the electroflocculater could help on removing significant percentage of heavy
metal in restaurant wastewater, though unlike industrial wastewater, restaurant
wastewater only contains trace amount of heavy metal ions.

42
RESULTS AND DISCUSSIONS
Comparing the electroflocculation with membrane filtration:
Membrane filtration could be divided into micro-filtration, ultra-filtration,
nanofiltration, utrafiltration, reverse osmosis and nanofiltration. Their characteristics
are shown in table 13. In which reverse osmosis could separate particle size down to
less than 0.001μm.
Table 13. Characteristic of the four membranes - RO, NF. UF and MF (Zhou and Smith 2002)
Zhou and Smith (2002) suggested that even ultrafiltration and
microfiltration was already good enough for solid-liquid separation. However, both of
them were inefficient in dissolved organic substance removal, the typical removal rate
was <15%. Reverse osmosis performance in removing pollutants would be better than
any ordinary treatment system. Since it could filter particle size down to less than
0.001μm, with this range, all dissolved organic substances and even ammonium could
be filtered by the membrane. Also, unlike electroflocculation, membrane filtration
would not leave coagulant in effluent. However, reverses osmosis is far too expensive
to be used in wastewater treatment.
In this research, electroflocculater which could typically remove over 50%

43
RESULTS AND DISCUSSIONS
of dissolved organic and inorganic substances as well as over 85% of suspended solid.
It is believed that electroflocculater could become the mainstream wastewater
treatment system, because it is relatively economy.
Suggestions on improving the performance of electroflocculater:
According to the result of hybrid method of this research, this best
optimum result was that >99 % of SS and TOC in restaurant wastewater were
removed. The reason could possibly be that the optimum dosage of alum is achieved,
as a result, relatively large flocs could then be entirely filtered by the 0.20μm
membrane. However, this method has a very serious disadvantage, that is, the
coagulation time is too long (>1hour). The restaurant is producing huge amount of
wastewater throughout the whole day, and it is impossible to provide such a large
area to build a buffering tank for the coagulation process.
To improve, it is suggest that the two treatment method-
electroflocculation and membrane filtration could be employed at the same time.
Shon ,Guo, Vigneswaran, Ngo and Kim (2004) suggested that microfiltration with a
flocculation pretreatment could increase the TOC removal efficiency by twofold.
Thus, the best pollutant removal result is expected to obtain when electroflocculater
coupled with microfiltration.

44
RESULTS AND DISCUSSIONS
Suggestions for future study on electroflocculater:
It is suggested that the optimum dosage of aluminum by the
electroflocculater and the method on reducing aluminum residual in effluent is
needed to be studied.
In addition, the performance of electroflocculation-microfiltration
combined method on wastewater treatment would also be an interesting study area.

45
CONCLUSION
CONCLUSION
The present study finds out that the electroflocculater can remove both
TOC and BOD5 by nearly 50%. The SS removal efficiency achieves good result, in
which the turbidity is reduced by 85.05%. A disadvantage is that the aluminum
residual concentration is very high at wastewater effluent which is 7000 times higher
than nature raw water. It is suggested that, in order to improve the performance of the
wastewater treatment system, the electroflocculater can be coupled with
microfiltration.
46
ACKNOWLEDGEMENTS
ACKNOWLEDGEMENTS
This project was supported and directed by Dr. Desmond O’Toole. The
author thanks him for his advice and takes care of, like a kindly grandfather.
Additional big thanks to Eric for his technical support on TOC analyzing, and Mr.
Chan for his technical support on ICP-MS. Also, thanks Celia for her materials
support, and Mr. Kam of Kingston’ Sun for the providing of wastewater samples.
Finally, special thanks to the people who had helped me in the laboratory of City
University of Hong Kong.
47
REFERENCES
REFERENCES
Ballard, B.D.,and A. A. MacKay.(2005).Estimating the Removal of Anthropogenic
Organic Chemicals from Raw Drinking Water by Coagulation Flocculation. Journal
of Environmental Engeneering.108-118.
Chen, G., X. Chen,and P.L. Yue.(2000). Electrocoagulation and Electroflotation of
Restaurant Wastewater. Journal of Environmental Engineering.126 (9), 858-863.
Chen, W.J., T.N. Chen, and Y.C. Cheng. (2002). Polyelectrolyte Conditioning For
Iron-hydroxide-containing Sludge Produced From Electroflocculation Of
Fermentation Wastewater. Journal of Environmental Science and Health. A37 (7),
1277 - 1293.
Ciaradelli, G., and N. Ranieri.(2001).The Treatment and Reuse of Wastewater in the
Textile Industry by Means of Ozonation and Electroflocculation. Water Research.
35(2),567-572.
Crump, J. A., G.O. Okoth, L. Slutsker, D.O. Ogaja, B.H. Keswick, and S.P.
Luby.(2004). Effect of point-of-use disinfection, flocculation and combined
flocculation disinfection on drinking water quality in western Kenya. Journal of
Applied Microbiology, 97, 225–231.
El-Masry, M. H., O. M. Sadek, and W. K. Mekhemer. (2004). Purification of Raw
Surface Water Using Electro-coagulation Method. Water, Air, and Soil Pollution.158,
373–385.
Fairman, B., and A. Sanz-Medel.(1995). Quality Assurance for Environmental
Analysis, Netherlands. Elsevier Science B. V.
Faust. S. D., and O. M. Aly. (1998). Determination of Aluminum species in Natural
Water. Chemistry of Water Treatment. 2nd ed., Chelsea, Ann Arbor Press, 215-233.
Gao, Y.X., M. Yang, Y. Zhang, and J.Y. Hu.(2004). Treatment of Oilfield
Wastewater by Fenton’s Process. Water Science and Technology. 49( 4),103–108 .

48
REFERENCES
Holt, P.K., G. W. Barton, and C. A. Mitchell.(2004) The Future for
Electrocoagulation as a Localized Water Treatment Technology. Chemosphere. 1-14.
Huang, S. D., P. G. Su, S. P. Huang, Y. L. Ho, and T. Y. Tsal.(2000).Adsorbing
Colloid Flotation with Polyaluminum Chloride: A Powerful Technique for Removing
Heavy Metals from Wastewater. Separation Science and Technology,
35(8).1223–1232.
Jackson, G. B. (1993). Applied Water and Spentwater Chemistry: A Laboratory
Manual. New York, Van Nostrand Reinhold.
Nielson, K., and D. W. Smith. (2005). Ozone-enhanced Electroflocculation in
Municipal Wastewater Treatment. J. Environ. Eng. Sci.. 4, 65-76.
Robinson, V. (1999). Electroflocculation in The Treatment of Polluted watered.
Australian Water & Wastewater Association, Albury, NSW.181 - 188.
Roussy, J., M. V. Vooren,and E. Guibal.(2004). Chitosan for the Coagulation and
Flocculation of Mineral Colloids. Journal of Dispersion Science and
Technology.25(5),663–677.
Shon, H. K., W. S. Guo, S. Vigneswaran, H. H. Ngo, and I. S. Kim.(2004).Effect of
Flocculation in Membrane-Flocculation Hybrid System in Water Reuse. Separation of
Science and Technology.39(8),1871–1883.
Sorochenko, V. F. (2003).Effect of Aluminum Ion on Coagulation of Dispersive
Systems in Plant Wastewaters. Chemistry and Technology of Fuel and Oil.
39(4),221-231.
World Health Organization. (1995). Guidelines for Drinking Water Quality. WHO
Office, Geneva.
World Health Organization. (1998). Guidelines for Drinking-water Quality, 2nd
ed.WHO Office, Geneva
49
REFERENCES
Zhou, H.,and D.W. Smith.(2002). Advanced Technologies in Water and Wastewater
Treatment. J. Environ. Eng. Sci. 1, 247–264.