Embed Size (px)
Citation preview

The Effects of Welfare and IDA Program Rules on the Asset Holdings of Low-Income Families
A Report in the Series Poor Finances Assets and Low-Income Households
September 2007
Signe-Mary McKernan Caroline Ratcliffe
The Urban Institute
and
Yunju Nam
Center for Social Development Washington University in St Louis
This report was prepared for and funded by the US Department of Health and Human Services Office of the Assistant Secretary for Planning and Evaluation (DHHSASPE) under Order Number GS23F8198H HHSP233200400131U to the Urban Institute and its collaborators at the Center for Social Development (CSD) at Washington University in St Louis and the New America Foundation This report was prepared between September 2004 and July 2007 John Tambornino Linda Mellgren and Jeremiacuteas Alvarez at DHHS were project officers Signe-Mary McKernan of the Urban Institute was overall project director and Michael Sherraden directed the work at CSD Views expressed are those of the authors and do not represent official positions of the Department of Health and Human Services the Urban Institute its trustees or its sponsors
Acknowledgments
The report has benefited from helpful comments and suggestions from Jeremiacuteas Alvarez Alana Landy Gretchen Lehman Ann McCormick Linda Mellgren Don Oellerich and Canta Pian of ASPE and John Tambornino of the Administration for Children and FamiliesDHHS William Margrabe at the Urban Institute provided excellent research assistance
This report is part of a series entitled Poor Finances Assets and Low-Income Households produced in a partnership between the Urban Institute Center for Social Development and New America Foundation We thank the team members at the Center for Social Development and New America Foundation for their positive and productive partnership
ii
CONTENTS
Introduction to the Series iv Why Assets Are Important v Income and Assets in Public Policy v Asset Policy for Low-Income Households vi
Executive Summary ES-1 Key Findings ES-2 Conclusions ES-3
I Introduction 1
II Background 2
III Literature 4
Effect of Means-Tested Program Rules on Asset Holdings 4
Why Empirical Analyses May Not Find an Effect of Asset Tests on Asset Holdings 5
Effect of IDA Program Rules on Asset Holdings 7
IV Study Population 8
V Data 9
Survey of Income and Program Participation 9
IDAs 13
EITC and Minimum Wage 16
VI Methodology 17
VII Results 19
Empirical Results Liquid Asset Holdings 19
Empirical Results Vehicle Ownership 24
Empirical Results Net Worth 27
Empirical Results Years since the Program Rule Was Implemented 29
VIII Conclusion 30
IX References 32
X Appendix Tables 34
XI Appendix Program Rules Data Documentation 42
iii
Poor Finances Assets and Low-Income Households
INTRODUCTION TO THE SERIES
Economic security throughout the life course is intrinsically linked to both income and asset ownership The majority of current social policies focus primarily on income supports and social services However building assets can also help individuals families and communities expand their economic horizons
America has a longstanding history of promoting ownership as reflected in existing policies to promote home and business ownership investment and saving New opportunities for people to save and become asset owners will likely increase the number of individuals and families able to build assets and improve the economic security of all Americans Greater inclusivity and accessibility of traditional approaches to expanding ownership may make it easier for lower and middle income families to save Still while theory and evidence suggest that improved asset-based policies may promote development of low-income individuals and families and perhaps communities and society as a whole research in this area of asset development is in its infancy There is still much to learn
Poor Finances Assets and Low-Income Households is a series of reports on poverty asset building and social policy The purpose of the series is to assess the nascent state of knowledge and policy development and to synthesize recent progress in these areas Specifically the reports in the series will
bull evaluate what is known regarding the measures distributions determinants and effects of asset holding
bull develop a portrait of the assets of low-income households bull develop conceptual frameworks for viewing assets and liabilities bull assess the strengths and weaknesses of data sources on assets and liabilities bull chart directions for future research bull examine the effects of means-tested program policies on asset building and bull inform subsequent discussions of public policy
While this series of reports focuses on asset accumulation and asset-based policies for low-income individuals and families the conceptual frameworks developed are not limited to low-income populations This broad approach is an effective way to identify the overall critical issues that relate to asset holding for all populations Where appropriate however various reports point out when the framework specifically applies to low-income minority and single-parent households This distinction is important because these subgroups are particularly vulnerable to low asset accumulation The definition of low-income used in the series of reports is necessarily imprecise The reports reflect a broad literature synthesis and definitions of low
iv
income are not uniform across studies surveys or public programs However low incomes can be broadly thought of as affecting households in the bottom income quintiles
This report ldquoThe Effects of Welfare and IDA Program Rules on the Asset Holdings of Low-Income Familiesrdquo examines the effects of a comprehensive set of 13 welfare Food Stamp individual development account (IDA) earned income tax credit (EITC) and minimum wage program rules on the asset holdings of low-education single mothers and families Low education was used as a proxy for low income to address fluctuations in income over time This report finds empirical evidence of an association between asset limits and IDA program rules and the asset holdings of low-education single mothers and families
Why Assets Are Important
In describing why assets are important it is useful to begin by distinguishing income from assets Incomes are flows of resources They are what people receive as a return on their labor or use of their capital or as a public program transfer Most income is spent on current consumption Assets are stocks of resources They are what people accumulate and hold over time Assets provide for future consumption and are a source of security against contingencies As investments they also generate returns that generally increase aggregate lifetime consumption and improve a householdrsquos well-being over an extended time horizon
The dimensions of poverty and its relative distribution among different social classes are significantly different when approached from an assets perspective as opposed to an income perspective Those with a low stock of resources to draw on in times of need are asset poor This asset poverty may leave them vulnerable to unexpected economic events and unable to take advantage of the broad opportunities a prosperous society offers Many studies have found that the rate of asset poverty exceeds the poverty rate as calculated by the traditional measure which is based on an income standard Many US households have little financial cushion to sustain them in the event of a job loss illness or other income shortfall Also social and economic development of these households may be limited by a lack of investment in education homes businesses or other assets To the extent that low resource holdings limit the potential for social and economic development understanding how those with limited assets can build up their asset base is likely to be an important policy issue
Income and Assets in Public Policy
Outside of education traditional social programs that assist low-income populations have focused mainly on income and social services that fulfill basic consumption needs which have been essential to the well-being of families and children An asset-based approach could complement this traditional approach and could shift the focus to the long-term development of individuals families and communities This focus provides a broader picture of the dynamics of poverty among the low-income population
v
Asset-based policy has many potential meanings These include policies to promote the accumulation and preservation of financial wealth tangible property human capital social capital political participation and influence cultural capital and natural resources While all of these meanings have value this series of reports focuses on building financial wealth and tangible nonfinancial assets for household social and economic development
The United States and many other countries already have large asset-based policies In many cases these operate through the tax and employer-based systems so that public transfers occur via tax benefits (eg home mortgage interest deduction tax breaks for contributions to a variety of retirement accounts tax-preferred education accounts and College Savings Plans and benefits for other emerging policies such as Medical Savings Accounts) These asset-based policies have grown rapidly in recent years and today represent a significant proportion of overall federal expenditures and tax subsidies
Asset Policy for Low-Income Households
Low-income individuals and families frequently do not participate in existing asset-based mechanisms The reasons may be threefold First this population is less likely to own homes investments or retirement accounts where most asset-based policies are targeted Second with little or no federal income tax liability the low-income have little or no tax incentives or other incentives for asset accumulation Third asset limits in means-tested transfer policies have the potential to discourage saving by the low-income population In many respects this population does not have access to the same structures and incentives for asset accumulation The potential of asset building to promote long-term development of low-income households motivates this series of reports Poor Finances Assets and Low-Income Households attempts to serve as a central resource that provides a comprehensive assessment and critique of the current and emerging knowledge base regarding asset building for low-income individuals and families
vi
The Poor Finances Team
Center for Social Development at Washington University The Urban Institute New America Foundation
Michael Sherraden Yunju Nam
Sondra G Beverly Mark R Rank
Mark Schreiner Trina R Williams Shanks
Min Zhan Jin Huang
Eunhee Han
Reid Cramer Ray Boshara
Signe-Mary Mckernan Caroline Ratcliffe
Robert Lerman Henry Chen
Adam Carasso Eugene Steuerle Elizabeth Bell
vii
EXECUTIVE SUMMARY
Savings and assets can cushion families against sudden income losses and can bolster long-term economic gains These savings however can make a low-income family ineligible for benefits from means-tested programs when they encounter economic difficulties Most means-tested programs restrict eligibility to families with assets that fall below a set threshold and thus may have the unintended consequence of discouraging low-income families from saving
In recent years federal and state governments have implemented programs and program rules to encourage savings among low-income families Specifically they have relaxed asset rules for the Temporary Assistance for Needy Families (TANF) program and the Food Stamp Program (FSP) and have supported individual development account (IDA) programs This report examines the relationship between means-tested program rules and asset holding We examine the effects of state specific TANF Food Stamp IDA EITC program rules and minimum wage requirements on low-education single mothers and low-education familiesrsquo liquid asset holdings vehicle asset holdings and net worth
Our analysis spans a 13 year period from 1991 through 2003 thereby capturing a time of significant change to the AFDCTANF and Food Stamp programs as well as the introduction of IDA programs It also captures asset holdings during weak and strong economic times Individual-level data for the analysis come from multiple panels of the Survey of Income and Program Participation (SIPP) and state program rules data come from a variety of sources including the Urban Institutersquos Welfare Rules Database the Center for Social Developmentrsquos and Corporation for Enterprise Developmentrsquos information on IDA programs and the United States Department of Agriculture (USDA) Food and Nutrition Service (FNS)
The empirical model uses the variation across states and in the timing of different state rules to examine the relationship between 13 specific program rules and asset holdings These program rules (defined in table 3) are
bull AFDCTANF Program Rules unrestricted asset limit vehicle asset limit restricted account asset limit and maximum monthly benefit for a family of three1
bull Food Stamp Program Rules vehicle asset limit and expanded categorical eligibility
bull IDA Program Rules maximum match rate maximum amount qualified for match and eligibility beyond welfare recipients
bull EITC Rules and Minimum Wage Requirements state EITC amount percentage of the state EITC that is refundable the state minimum wage for federally covered categories and the state minimum wage for non-federally covered categories
1 Restricted accounts limit withdrawals to only certain types of activities such as education homeownership or business start-up Unrestricted accounts do not have these restrictions and include savings and checking accounts
ES-1
We estimate fixed effect regression models to measure the relationship between the program rules and asset holdings We estimate the models on two populations for six asset holding outcomes and using two different specifications of the program rules The two populations are low-education (high school degree or less) single mother families and a broader population of all low-education families The six asset holding outcomes are (1) presence of liquid assets (2) value of liquid assets (3) vehicle ownership (4) vehicle equity (5) net worth (excluding housing) and (6) net worth (including housing) The two program rule specifications are (1) the primary results which capture the relationship between detailed measures of state program rules and the asset holding outcomes and (2) an alternate specification which captures the relationship between the number of years since a broad program change was implemented and the asset holding outcomes Below we highlight the statistically significant relationships that make up the key findings from the two specifications
Key Findings
Key findings from the primary results which measure precise program rules include the following
bull More generous unrestricted asset limits are not associated with increased liquid asset holdings for either low-education single mothers or families
bull More generous restricted account asset limits are associated with increased liquid asset holdings for low-education single mothers and families
bull More generous Food Stamp vehicle asset limits are associated with increased vehicle asset holdings for low-education single mothers
bull Expanded categorical eligibility in the Food Stamp Program is associated with increased vehicle asset holdings for low-education single mothers and families
bull More generous IDA program rules are associated with increased liquid asset holdings and net worth
bull A more generous state EITC amount is negatively associated with liquid asset holdings but the percentage of the state EITC that is refundable is positively associated with liquid asset holdings
bull A more generous state minimum wage for federally covered categories (ie covered by the Fair Labor Standards Act) is associated with increased liquid asset holdings vehicle asset holdings and net worth
Key findings from the alternate specification results which measure the number of years since broad program rules were implemented include
ES-2
bull The number of years since unrestricted asset limits became more generous (greater than $1000) is associated with increased liquid asset holdings for low-education single mothers and families
bull The number of years since restricted asset account limits became available is positively but not statistically significantly associated with increased liquid asset holdings for either low-education single mothers or families
bull Mixed results but some evidence that number of years since both more generous Food Stamp Program vehicle asset limits and expanded categorical eligibility are associated with increased vehicle asset holdings
bull The number of years since a state-sponsored IDA program became available is associated with increased liquid asset holdings for low-education families
Conclusions
The results of this study suggest that various state program rules adopted since the mid-1990s especially those aimed at asset building are positively related to low-education single mothersrsquo and familiesrsquo asset holdings The analysis suggests that more lenient asset limits in means-tested programs and more generous IDA program rules may have positive effects on asset holdings These results suggest that maintaining and expanding these programs may help promote asset ownership among economically vulnerable populations
Findings from the primary model suggest that not every asset-building program rule has the same effect For example more generous IDA rules are positively related to liquid asset holdings and net worth and more lenient limits on restricted accounts are positively related to liquid assets while relaxed asset limits on unrestricted accounts have no significant relationship with any type of asset holdings The different incentive structures and program operations may produce distinct outcomes restrictions on withdrawals and incentives which are built into IDA and restricted asset account limits may motivate low-education single mothers and families to save and help them resist the temptation to spend Accordingly asset-building program rules could be designed carefully to achieve policy goals
Findings from the alternate specification which measures the years since the more generous rules were implemented corroborate the IDA rule findings but not the unrestricted versus restricted asset limit findings This is the first study (known to the authors) to look at the net relationships of restricted and unrestricted asset limits The results are suggestive but not conclusive that restricted account asset limits have different effects on asset building than unrestricted asset limits Additional research on this topic could shed further light on the role that unrestricted asset limits restricted account asset limits and IDA programs play in asset building
This study also shows that other non-TANF and IDA-related program rules are related to the asset holdings of low-education single mothers and families For example Food Stamp
ES-3
Program vehicle asset limits and expanded categorical eligibility are positively related to vehicle assets and net worth These findings suggest that potential program interactions and indirect effects of program rules on non-target populations are potentially important and could be considered further in future research
ES-4
I INTRODUCTION
Savings and assets can cushion families against sudden income losses and can bolster long-term economic gains These savings however can make a low-income family ineligible for benefits from means-tested programs when they encounter economic difficulties Most means-tested programs restrict eligibility to families with assets that fall below a set threshold thereby providing benefits only to those most in need If asset restrictions have the unintended consequence of discouraging low-income families from saving asset tests may run counter to the often cited government goal of promoting self-sufficiency
In recent years federal and state governments have implemented programs and program rules to encourage savings and thus promote self-sufficiency among low-income families Specifically they have relaxed asset rules for the Temporary Assistance for Needy Families (TANF) program and the Food Stamp Program (FSP) and have supported Individual Development Account (IDA) programs Despite the potential importance of these policy changes few studies have examined rules that limit saving and asset accumulation for government benefit recipients and what research does exist shows mixed results This report examines the effects of means-tested program rules on asset building and provides findings on the following research questions
1 What are the effects of specific TANF Food Stamp IDA EITC program rules and minimum wage requirements on liquid asset holdings
2 What are the effects of specific TANF Food Stamp IDA EITC program rules and minimum wage requirements on vehicle asset holdings
3 What are the effects of specific TANF Food Stamp IDA EITC program rules and minimum wage requirements on net worth
To address these research questions we examine several measures of asset holdings including liquid asset holdings2 vehicle ownership and equity and net worth (with and without housing equity) Our data come from the 1990 1992 1993 1996 and 2001 Survey of Income and Program Participation (SIPP) panels which provide asset data from 1991 through 2003mdasha period of significant change for the TANF and Food Stamp Programs as well as the introduction of IDA programs This time period also allows us to capture asset holdings during weak and strong economic times The state program rules data come from a variety of sources including the Urban Institutersquos Welfare Rules Database the Center for Social Developmentrsquos and Corporation for Enterprise Developmentrsquos information on IDA programs and the United States Department of Agriculture (USDA) Food and Nutrition Service (FNS)
2 Liquid assets include checking accounts interest-earning accounts such as savings accounts savings bonds IRA and Keogh accounts and stocks
1
We estimate the effect of 13 specific program rules and requirements on the asset holdings of low-education (high school degree or less) families and low-education single mothers While our population of interest is low-income families we use education to specify the target population rather than income as a way to hold the study population more constant over this time period This is especially important given that this analysis spans a 13 year period from the early 1990s to the 2000s With changes in the economy over time defining the population based on income can result in significant changes to the study population over time while defining the population based on educational attainment results in a more constant study population In essence we use low education to capture a more permanent measure of income status
This paper contributes to the literature in two important ways First we examine a comprehensive set of 13 program rules hypothesized to affect asset holdings (eg welfare program rules FSP rules IDA program rules and EITC rules) while most studies examine a more limited set of program rules Second our analysis is the first to examine both restricted and unrestricted asset account limits for TANF eligibility
Below we begin by providing background on state program rules and a brief discussion of the relevant literature This is followed by a description of the study population and data used for the analysis including the individual-level SIPP data the state-level program rule data and the economic data Next we present the methodology followed by the results The last section discusses the studyrsquos conclusions
II BACKGROUND
Both federal and state governments started to introduce asset-building policies for low-income households during the 1990s Examples include the relaxation of asset limits in means-tested programs and the introduction of IDA programs The Family Support Act of 1988 permitted states to apply to the federal government for waivers to raise the Aid to Families with Dependent Children (AFDC) programrsquos asset limits Without a federal waiver states could not raise these limits above the federal limits of $1000 on liquid assets and $1500 on vehicle assets (Powers 1998) The 1996 welfare reform legislation which replaced AFDC with TANF abolished the federal asset limits for welfare allowing states to create their own limits (Savner and Greenberg 1995 Corporation for Enterprise Development 2002)
Taking advantage of the federal policy changes many states increased AFDCTANF limits imposed on liquid assets in unrestricted accounts and vehicle assets In addition some states created restricted account programs Restricted accounts have separate and higher asset limits than unrestricted accounts but withdrawals are limited to only certain types of activities such as education homeownership or business start-up (Savner and Greenberg 1995
2
Corporation for Enterprise Development 2002) By 2003 for example 25 states exempted at least one vehicle and 28 states had introduced restricted accounts
In comparison to AFDCTANF asset limits in the Food Stamp Program were liberalized more slowly Liquid asset limits remained unchanged during the 1980s and 1990s (at $3000 and $2000 for households with and without an elderly member respectively) Also the federal vehicle asset limit increased by only $150 (in nominal dollars) during this period although the federal government did allow a few states to ease vehicle asset limits (via waivers)3 The federal government took significant steps to liberalize FSP liquid asset and vehicle asset limits in 2001 and 2002 (Corporation for Enterprise Development 2002 Pavetti et al 2002 Super and Dean 2001)
During the 1990s federal and state governments also began to adopt IDA programs which are asset-building programs targeted at low-income households IDAs are matched saving accounts created to encourage low-income low-wealth households to accumulate assets for their long-term economic development IDA programs create accounts for participants to save for specific purposes such as higher education home ownership and business start-up In addition IDA programs provide matching funds at the time of withdrawal (ie matched withdrawals) if savings will be used for one of pre-set goals (Corporation for Enterprise Development 2002 Sherraden 1991 Sherraden 2001)
Recognizing the potential effectiveness of IDA programs (based on privately funded IDA programs such as the American Dream Demonstration project) some states instituted IDA programs through legislation executive orders or administrative decision-making during the mid-1990s (Warren and Edwards 2005) State IDA initiatives were facilitated by subsequent federal legislation The welfare-to-work law of 1997 permitted grantees to use TANF funds for IDA programs Further the Assets for Independence Act (AFIA) of 1998 created the first federally-funded national demonstration programs for IDAs AFIA mandates the Office of Community Services in the Department of Health and Human Services (HHS) to award five-year grants to nonprofit organizations and to government or financial institutions partnering with nonprofits for IDA programs (Corporation for Enterprise Development 2002)
Although IDA programs have been growing rapidly since the mid 1990s an important question is whether there are sufficient numbers of IDA programs to capture the effect of these program rules on asset holdings using nationally representative survey data such as the Survey of Income and Program Participation (SIPP) used for this report Our investigation finds that it is not possible to obtain a reliable estimate of IDA participation or the number of IDA programs in
3 In January 1999 for example three states had federal waivers that allowed them to exempt one vehicle when determining FSP eligibility
3
the United States4 so this issue remains a potential limitation of this study The robustness of the IDA program findings in this report suggests that IDA programs may be important
III LITERATURE
Effect of Means-Tested Program Rules on Asset Holdings
There is limited empirical research on the effect of means-tested program rules on asset building Hurst and Ziliak (2006) Nam (forthcoming) Powers (1998) and Sullivan (2006) examine the effect of AFDCTANF asset limits on asset holdings In addition a study by Gruber and Yelowitz (1999) examines Medicaid asset-related rules and net worth All of these studies use quasi-experimental methods to identify the effects of program rules on asset building In addition a relatively new literature uses both experimental and non-experimental methods to examine the impact of IDA programs on asset building These studies include Schreiner et al (2005) US Department of Health and Human Services Interim Report to Congress on the Assets for Independence Program (2004) Stegman and Faris (2005) and Mills et al (2006) We discuss these literatures below and present summaries of the studies in appendix tables A-1 and A-2
Researchers have examined the effect of AFDCTANF program rules on liquid assets bank account ownership home ownership and vehicle ownership and equity5 The findings from this literature are mixed Of four empirical studies two studies find that relaxing AFDCTANF program rules did not increase householdsrsquo liquid asset holdings or net worth (Hurst and Ziliak 2006 Sullivan 2006) while two others find that they did increase householdsrsquo liquid asset holdings (Nam forthcoming) or net worth (Powers 1998) Sullivan (2006) uses data from the 1992 1993 and 1996 SIPP panels to examine how the dollar value of AFDCTANF limits of vehicle assets and countable assets (the sum of liquid assets and vehicle values that exceed the vehicle asset limit) affect single mothersrsquo liquid assets and net worth (excluding housing) He finds no evidence that relaxing these program rules increases liquid asset holdings or net worth Consistent with this finding Hurst and Ziliak (2006) using the 1994 and 2001 waves of the Panel Study of Income Dynamics (PSID) find that changes in AFDCTANF countable asset limits and vehicle asset limits do not affect the liquid assets or net worth (including housing) of female-headed households with children
Powers (1998) and Nam (forthcoming) on the other hand find that AFDCTANF program changes increase single mothersrsquo asset holdings Using 1978 and 1983 data from the National Longitudinal Survey of Young Women Powers (1998) finds that an increase of $1 in
4 This was confirmed by an IDA expert Karen Edwards at the Center for Social Development IDA Program participation is not captured in nationally representative data sources such as the Survey of Income and Program participation (SIPP) and no known data source captures all IDA programs in the country 5 Liquid assets in these studies are defined as the sum of dollar values in checking and saving accounts saving bonds stocks and other financial investments
4
countable asset limits for AFDC families raised a female headrsquos net worth (excluding vehicle equity) by 25 cents Although Powersrsquo analysis is based on data from nearly three decades ago this study is able to exploit the change in federal AFDC asset test policy that occurred in 1981 to identify the effect of a change in asset limits Using more recent data from the 1994 and 2001 waves of the PSID Nam (forthcoming) finds that increasing statersquos AFDCTANF countable assets limits leads to higher bank account ownership and higher liquid asset holdings among female-headed households with children
Nam (forthcoming) and Hurst and Ziliak (2006) use the same data but come to different conclusions by using different program rule measures Nam (forthcoming) expands on Hurst and Ziliakrsquos analysis by estimating models that measure the length of time since states adopted new asset limits These ldquolength of timerdquo measures capture the fact that states introduced new asset tests at different times and that it may take time for a target population to learn about and adapt to program rule changes Nam (forthcoming) finds that the earlier a state raised its countable asset limit the more likely are female-headed households with children to have positive savings andor a bank account Nam (forthcoming) and Hurst and Ziliak (2006) also examine different measures of savings which may explain why the results of these studies differ with regard to the effect of higher asset limits on savings Nam examines a nonlinear measure of saving (natural logarithm) and finds that the amount of saving is significantly higher for those living in states with higher asset limits while Hurst and Ziliak examine a linear measure and find no effect of asset limits on savings
The research on the effect of AFDCTANF program rules on vehicle ownership is also mixed The same studies by Sullivan (2006) and Hurst and Ziliak (2006) find evidence that relaxing asset limits leads to higher vehicle ownership while Nam (forthcoming) finds no evidence that vehicle ownership increases when asset limits are relaxed6 The different results between Nam (forthcoming) and the other two studies may be explained by different sample selection and model specifications In addition to these analyses of AFDCTANF program rules a study by Gruber and Yelowitz (1999) examines the effect of Medicaid program rules on household wealth Using data from the Consumer Expenditure Survey and the SIPP (1984 and 1993 panels) they find that Medicaid eligibility and Medicaid asset tests lower householdsrsquo net worth
Why Empirical Analyses May Not Find an Effect of Asset Tests on Asset Holdings
Researchers have descriptively examined the assets of potential welfare recipients as a way to understand why asset tests may not affect liquid asset holdings Hurst and Ziliak (2006) examine 6 Sullivan (2006) examines the possible interaction between AFDCTANF and Food Stamp asset rules with an alternative asset policy measure by setting a statersquos countable and vehicle asset limits as the lower limit of each type across these two programs The results of this analysis are consistent with his main findingmdashrelaxing vehicle asset limits increases vehicle ownership while relaxing countable asset limits does not show any significant impact
5
the liquid asset holdings among likely welfare recipients defined as single mothers with less than 16 years of schooling They conclude that the majority of likely welfare recipients are not influenced by increases in asset limits because most have asset holdings that are below the original limits For example the median liquid asset holdings of likely welfare recipients were zero in 1989 1994 and 2001 Similarly Sullivanrsquos (2006) study shows relatively low liquid assets among potential welfare recipients However Sullivan suggests that the vehicle asset limit in place under AFDC might have been more binding than liquid asset limits because vehicle ownership is more common among potential welfare recipients Among single mothers with a high school degree or less 58 percent owned a vehicle and the mean vehicle equity value was $1862 (p 84) almost 25 percent higher than the amount of the former AFDC vehicle asset limit of $1500 After removing those who graduated from high school from the data Sullivan found vehicle ownership and equity to be somewhat lower among single mothers without a high school degreemdash43 percent owned a vehicle with a mean vehicle equity value of $1153 (p 84)
Blank and Ruggles (1996) use SIPP data to show that the percentage of months for which single mothers were ineligible for AFDC benefits increased only slightly when assets were taken into account (from 570 percent when only income was considered to 602 percent when both income and assets were considered)7 While some likely welfare recipients own liquid assets high enough to be disqualified by old AFDC asset tests the relatively low liquid asset holdings of potential welfare recipients (below the old AFDC asset limits) might help to explain why some studies in the literature find that increasing asset limits does not lead to higher asset holdings
While the data show that potential welfare recipients hold low levels of assets it is still possible that these asset limits are impacting low-income familiesrsquo asset holdings Current and potential welfare recipients may save at suboptimal levels because they misunderstand program rules In fact qualitative interviews with TANF recipients in Virginia and Maryland suggest that welfare recipients were misinformed about program rules and that this misinformation led to lower asset holdings (OBrien 2006) Most of the recipients in the OrsquoBrien study believed that TANF asset limits were much lower than the actual limits In addition several of the interviewees reported spending down their bank accounts before applying for cash assistance Thus TANF asset limits may be affecting familiesrsquo asset holdings even though their asset holdings are well below asset limits
7 Results from Blank and Ruggles (1996) suggest that AFDC asset limits had only a small effect on AFDC benefit receipt because asset limits affect the AFDC eligibility of only a small fraction of single mothers To date the literature has only descriptively examined how AFDCTANF asset limits affect TANF participation To improve our understanding of how asset limits affect welfare participation future work could examine this relationship in a multivariate framework
6
Effect of IDA Program Rules on Asset Holdings
What do we know about the effect of IDA program rules on asset holdings Current research provides some evidence that IDA programs increase low-income householdsrsquo asset holdings Although the majority of these studies show positive effects of IDA programs on asset accumulation (Schreiner et al 2005 US Department of Health and Human Services 2004 Stegman and Faris 2005 Mills et al 2006) some questions remain unanswered due to limitations in study designs and sample representation In addition we still know little about IDA programsrsquo long-term effects on net worth and liquid assets
Several studies based on IDA monitoring data conclude that low-income households can save in individual development accounts because a majority of participants made deposits into their IDAs and a substantial proportion succeeded in making matched withdrawals (Schreiner et al 2005 US Department of Health and Human Services 2004 Losby and Robinson 2004)8 Stegman and Faris (2005) estimate that the median participant in an IDA program saved $117 more than heshe would have saved without American Dream Demonstration (ADD) participation based on their simulated results using ADD Account Monitoring data and a comparable low-income low-asset sample drawn from the Survey of Consumer Finance9
Controlling for selection into an IDA program with a controlled field experiment Mills et al (2006) find that the IDA program raised homeownership rates by almost 10 percentage points over four years for black renters but reduced their financial assets and business ownership possibly indicating the need to liquidate assets to afford down payments and housing transition costs The IDA program had no effects on homeownership for white renters but their business equity rose Overall the IDA program had no statistically significant effect on net worth which may be explained by the short four-year time frame of the study and the initial costs associated with home purchase and other asset investments
Two qualitative studies produce results consistent with those found in the quantitative research described above In-depth interviews with program participants show that low-income
8 According to American Dream Demonstration Account Monitoring data (ADD-AM) the majority of program participants (53 percent) saved at least $100 in their ADD accounts the average net deposits were $537 and average monthly deposits were $21 and about 35 percent made matched withdrawals The average value of matched withdrawals (including matches) was $2711 (Schreiner et al 2005) Another large-scale demonstration authorized by the Assets For Independence Act (AFIA) and some smaller-scale studies produced similar results based on their own IDA account monitoring data (US Department of Health and Human Services 2004 Losby and Robinson 2004 Schreiner et al 2002) Account monitoring studies however have drawbacks in their methodology First these studies do not have information on non-IDA assets and therefore do not measure whether deposits into IDAs are true savings or substitutions of savings that would have gone into other savings vehicles Second assets accumulated in IDAs may not be attributed purely to IDA effects because participants may have saved in the absence of the IDA 9 In assessing the effect of ADD on low-income householdsrsquo asset accumulation Stegman and Faris (2005) assume that ADD participants save solely into IDAs during the program participation period They justify their assumption based on the strong incentive built in to the programs (100 to 700 percent return) and that it likely convinced participants that ADD was the most desirable saving tool available to them
7
IDA participants were able to save despite continuous financial challenges (eg layoffs) The majority of participants succeeded in saving in IDAs and a substantial proportion of them did so regularly These studies also show the role of program components other than matches many interviewees valued financial education classes and social supports from IDA staff members and fellow participants (Hogan et al 2004 Shobe and Christy-McMullin 2005)
Despite promising results in early IDA evaluation studies it remains unclear whether IDA programs have positive long-term impacts on non-IDA assets especially net worth and liquid assets in non-IDA accounts It also remains unanswered whether IDA effects observed can be generalized to the low-income population because IDA applicants may differ from low-income households in terms of their level of motivation to save and other unobservable characteristics
IV STUDY POPULATION
Our population of interest for the Poor Finances series of reports has been low-income populations In this study we define two key study populationsmdashlow-education single (ie unmarried) mothers who may or may not be cohabiting10 and a broader population of low-education families that includes both single and married parent families11 We examine low-education populations rather than low-income populations because low-education is a more permanent and exogenous measure of income status Using education rather than income to specify the target population results in a more constant study population over time which is important as our analysis spans 13 years With changes in the economy over time defining the population based on income can result in significant changes to the study population from year to year while defining the population based on educational attainment results in a more constant study population over time
For this study low-education is defined as having no education beyond high school Our population of single mothers has a high school degree or less and for married-couple families both persons in the couple have to have a high school degree or less to be defined as low education To focus our analysis on the working-age population we restrict the study population to single mothers ages 18 through 54 Low-education families are included if one or both of the adults (head and spouse) are ages 18 through 54 The study populations are selected based on characteristics at the time of the survey Our focus on the less educated is designed to limit our analysis to disadvantaged populations likely to participate in means-tested programs Low-education single mothers are of special interest because they are a group likely to be potential 10 While our sample of single mothers includes mothers with a cohabiting partner only the assets of the single mother are considered in the analysis We think that it is unlikely that assets (unlike income) are shared between cohabiting partners Also most welfare programs consider the parent(s) and child as the filing unit so the assets of the cohabiting partner may not be considered in eligibility and benefit determination 11 Families are defined using the US Census Bureaursquos definition of a family which is two or more people who are living together and are related by blood marriage or adoption
8
welfare participants while low-education families are of interest because they represent the group of potential participants for the Food Stamp Program and IDA programs
V DATA
Survey of Income and Program Participation
The individual-level data come from the 1990 1992 1993 1996 and 2001 SIPP panels Each SIPP panel contains a nationally representative (noninstitutional) sample of between 20000 and 37000 households and when combined provides data from 1991 through 2003 This 13 year period captures a time of significant change to the AFDCTANF and Food Stamp programs as well as the introduction of IDA programs It also captures asset holdings during weak and strong economic times including part of the July 1990 to March 1991 recession the March 2001 to November 2001 recession (National Bureau of Economic Research 2005) and the economic boom of the late 1990s
SIPP respondents are interviewed every four months about the previous four months a period referred to as a ldquowaverdquo SIPP monthly data are collected as part of the ldquocorerdquo questionnaire which is administered in each wave The SIPP also includes ldquotopical modulesrdquo which collect supplemental information on a variety of topics and are administered periodically The core questionnaire collects information about family structure income from assets program participation and educational attainment Asset and liability data come from the asset and liability topical module which has been administered once a year in recent panels The asset and liability topical module asks respondents about asset holdings and liabilities at the time of interview12
One limitation in using the SIPP (or other nationally representative surveys) to capture asset holdings is that it captures only assets held in formal transaction accounts such as checking or savings accounts It does not capture cash held under a mattress for example Thus our analysis is capturing the effect of programs on assets held in the formal financial sector
The key dependent variablesmdashliquid assets vehicle ownership and equity and net worth (including and excluding housing)mdashare calculated from the asset and liability topical modules They are calculated on an annual basis and are based on all waves where asset data are available in the five panels used in this analysis This includes waves 4 and 7 of the 1990 1992 and 1993 panels waves 3 6 9 and 12 of the 1996 panel and waves 3 6 and 9 of the 2001 panel 12 For a detailed discussion of the SIPP asset data including data quality issues see another report in the Poor Finances series by Ratcliffe et al (2007) Ratcliffe et al assess the quality of 19 data sets for providing information on low-income householdsrsquo assets and liabilities and identify the SIPP along with the Panel Study of Income Dynamics (PSID) and Survey of Consumer Finances (SCF) as being the strongest data sets Sample attrition and response rates are among the data quality issues discussed For example response rates are between 68 and 87 percent in the SIPP (varies across panels) 50 percent over the full panel of the PSID (94 to 98 percent between waves) and 68 percent in the SCF
9
Unfortunately the net worth analysis does not include data from wave 7 of the 1990 and 1992 panels or wave 4 of the 1993 panel because the full asset and liability topical module is not available in these waves and the full module is needed to calculate net worth (but not liquid assets or vehicle ownership)
Our measure of liquid assets includes checking accounts interest-earning accounts such as savings accounts savings bonds IRA and Keogh accounts and stocks Families are classified as owning a vehicle if the value of the familys cars is greater than zero and vehicle equity is measured as the difference between the family car value and car debt13 Our measure of net worth that includes housing is the sum of home equity vehicle equity business equity value of checking and savings accounts value of interest earning assets stock and mutual fund equity other real estate equity other assets IRAKeogh accounts and retirementthrift accounts less unsecured debt Our alternate net worth measure simply excludes home equity because of potential measurement error issues in trying to value homes
To control for changes in the economy the SIPP data are supplemented with annual state-level economic data on (1) unemployment rates (2) per capita income and (3) employment-population ratios
Table 1 presents demographic and economic characteristics of low-education single mothers and low-education families as well as state economic conditions of the two samples The average age of the single mother sample is 327 while the average age of the head of household of the low-education family sample is 373 There are other differences between the two populations Compared with all low-education families low-education single mothers are more likely to be black or Hispanic (535 percent versus 347 percent) are more likely to have no high school degree (360 percent versus 261 percent) and have more children (an average of 19 versus 11) The state economic indicators are virtually identical across the two populations14
Table 2 shows that low-education single mothers consistently have fewer assets than the population of all low-education families Among single mothers 333 percent have liquid assets and 483 percent own a vehicle while the corresponding statistics for low-education families are 589 and 752 percent respectively The value of liquid asset holdings vehicle equity and net worth are also lower among low-education single mothers than low-education families As mentioned above our focus on single mothers allows us examine a population that is most likely affected by TANF asset limits (as well as FSP asset limits and IDA programs) while our analysis of all low-education families provides an understanding of how these programs affect a
13 The SIPP collects information on vehicle makes models and years and then uses Blue Book prices to calculate the vehicle values 14 State economic conditions can vary across the two populations if the populations are not equally distributed across states
10
Table 1 Sample Characteristics of Low-Education Single Mothers and Families Age 18ndash54 1991ndash2003 SIPP
Mothers Families
Benefit ReceiptPercentage receiving AFDCTANF 283 78
Percentage receiving Food Stamps 422 158
Demographic and Economic ControlsAge (years) 327 373
Black (01) 339 170
Hispanic (01) 196 177
Education less than high school (01) 360 261
Number of children in family () 19 11
Number of adults in family () 12 17
Metro area (01) 780 740
State unemployment rate () 58 58
State per-capita income ($person) $26423 $26311
State employment population ratio 047 047
Sample Size 15635 77664
Note Age raceethnicity and education variables are for mothers in the single mothers sample and for the highest education person (of the head or spouse taking the male if both are equally educated) in the families sample The state employment to population ratio is the total state employment divided by the states population All dollar values expressed in year 2000 dollars as calculated using the implicit price deflator for personal consumption expenditures
Table 2 Asset Holdings of Low-Education Single Mothers and FamiliesAge 18ndash54 1991ndash2003 SIPP
Mothers Families
Liquid Asset HoldingsPercentage holding liquid assets (liquid asset gt0) 333 589Sample size 15635 77664
Liquid asset amountMean(Standard deviation)
$258($7)
$2630($26)
25th percentile $0 $050th percentile $0 $9875th percentile $51 $1469Sample size 15158 75341
Vehicle Asset HoldingsPercentage owning at least one vehicle 483 752Sample size 15635 77664
Vehicle equity amountMean(Standard deviation)
$1140($17)
$3301($16)
25th percentile $0 $050th percentile $0 $160375th percentile $1603 $5260Sample size 15144 75305
Net Worth (Including Home Equity)Mean(Standard deviation)
$5113($320)
$27177($1195)
25th percentile $0 $050th percentile $0 $436875th percentile $3350 $33796Sample size 12048 58418
Net Worth (Excluding Home Equity)Mean(Standard deviation)
$1117($62)
$8526($409)
25th percentile $0 $050th percentile $0 $150275th percentile $1738 $8141Sample size 12059 58433
Note Sample size varies because statistics for asset holding amounts exclude observations in the top 3 percentiles of liquid assets and vehicle equity and the top and bottom 3 percentiles of net worth All dollar values expressed in year 2000 dollars as calculated using the implicit price deflator for personal consumption expenditures
broader population of families (those who are less disadvantaged yet are potential participants for the Food Stamp Program and IDA programs)
Welfare and Food Stamps
The 13 specific state program rules hypothesized to affect asset holdings are the explanatory variables for the analysis They include four welfare rules two Food Stamp Program rules three IDA rules and four minimum wage and EITC measures These variables are measured from 1991 through 2003 Table 3 provides definitions for the variables and table 4 presents their descriptive statistics We describe the data sources below and the appendix provides more detailed specifics for each rule
The four welfare rules capture three asset limit rules and the maximum monthly welfare benefit They are measured using the Urban Institutersquos Welfare Rules Database (WRD) and related databases15 The WRD was built using AFDC state plans and waiver terms and conditions prior to 1997 and caseworker manuals and state regulations from 1997 to the present much of these data were verified by state staff The WRD and related databases are supplemented with information from the Urban Institutersquos Transfer Income Model (TRIM3)16 and the First Annual TANF Report to Congress as necessary
The two Food Stamp Program (FSP) rules measure vehicle asset exemption (at least one vehicle exempt from asset rules) and expanded categorical eligibility Expanded categorical eligibility extends categorical eligibility for food stamps to units that receive TANF services (not just TANF cash benefits) These rules come from Food and Nutrition Service (FNS) State Options Reports FNS waivers and other documentation the Center on Budget and Policy Priorities and the Federal Register Many of these data sources were identified in consultation with the US Department of Agriculturersquos Economic Research Services (ERS) and FNS and have been provided to us by these agencies
IDAs
The three IDA program rulesmdashmaximum match rate maximum match allowed for saving and eligibility beyond welfare recipientsmdashare measured using the Center for Social Developmentrsquos (CSD) 2005 Survey on State IDA programs CSDrsquos State IDA Policy Information and other sources listed in the Appendix The survey data are collected directly from state officials and personnel working on the state IDA programs 15 The official Welfare Rules Database (WRD) measures data from 1996 forward We use the more general term ldquorelated databasesrdquo when measuring state program rules from the non-official WRD which captures some program rules prior to 1996 16 TRIM3 is a microsimulation model developed at the Urban Institute (under primary funding from Department of Health and Human Services) that simulates major governmental tax transfer and health programs that affect the US population This model undergoes constant development and is updated annually to capture the latest changes in tax and transfer programs It is information on state programs that we have incorporated into this study
13
Table 3 Program Rule Variable Definitions
Program Rule Variable DescriptionAFDCTANF
(1) Unrestricted asset limit
The dollar value of any asset the state counts toward the limit (eg savings and checking accounts bonds stocks and vehicle values that exceed the vehicle asset limit) that a family may hold and still be eligibile for welfare benefits
(2) Vehicle asset limit for recipients at least one vehicle At least one vehicle per unit exempt from asset limit
(3) Restricted account asset limit The dollar value excluded from asset limits of savings account assets earmarked for specfic purposes (eg IDAs post secondary education)
(4) Maximum monthly benefit for family of 3 Maximum monthly benefit for a family of 3 with no income
Food Stamp Program (FSP)(1) FSP vehicle asset limit at least one vehicle At least one vehicle per unit exempt from asset limit
(2) Expanded categorical eligibility State uses expanded categorical eligibility - receipt of TANF services (with or without cash assistance) makes unit automatically eligible for food stamps
IDA(1) Maximum match rate The number of dollars a state will contribute to a familys IDA
account for every dollar the family contributes
(2) Maximum amount qualified for match The maximum amount a state will match in a familys IDA account
(3) Eligibility beyond welfare recipients State does not require participants in the state IDA program to already be enrolled in the states welfare program
Minimum Wage and EITC(1) State EITC The maximum EITC offered by the state
(2) Percentage of state EITC refundable The percentage of the state EITC that is refundable obtained by dividing the refundable amount by the maximum EITC amount offered by the state
(3) State minimum wage for FLSA covered categories Higher of the state or federal minimum wage(4) State minimum wage for non-FLSA covered categories State minimum wage for non-federally covered categories
Table 4 State AFDCTANF Food Stamp and Related Program RulesNumber of States with Rule and Mean Value of Rule by Year
Program Rule Variable 1991 1993 1995 1997 1999 2001 2003AFDCTANF
(1) Unrestricted asset limit (Mean Asset limit) ($) $1199 $1139 $1353 $2366 $2730 $2652 $2587(2) Vehicle asset limit (Mean asset limit) ($) $1798 $5150 $5745 $9967 $10748 $10562 $10333(3) Vehicle asset limit at least one vehicle ( of states) 0 0 2 19 22 24 25(4) Restricted account asset limit (Mean asset limit) ($) $0 $25 $380 $2336 $3416 $4191 $5247(5) Restricted account asset limit ( of states) 0 1 4 14 20 23 28(6) Maximum monthly benefit for family of 3 $45960 $44048 $42324 $40352 $40242 $39384 $38581
Food Stamp Program (FSP)(1) FSP vehicle asset limit at least one vehicle ( of states) 0 0 1 3 3 2 30(2) Expanded categorical eligibility ( of states) 0 0 0 0 0 38 36
IDA(1) State IDA programs ( of states) 0 0 0 4 9 24 24(2) Maximum match rate (Mean) ($) $000 $000 $000 $016 $036 $110 $110(3) Maximum amount qualified for match (Mean) ($) $0 $0 $0 $443 $700 $6292 $6263(4) Eligibility beyond welfare recipients ( of states) 0 0 0 3 7 20 19
EITC and Minimum Wage(1) State EITC ($) $3830 $4639 $9228 $12366 $15518 $20566 $22217(2) Percentage of state EITC refundable 43 43 65 87 135 181 204(3) State minimum wage for FLSA covered categories ($) $514 $495 $476 $510 $540 $527 $518(4) State minimum wage for non-FLSA covered categories ($) $304 $302 $290 $303 $325 $318 $313
Note Means include 0s All dollar values expressed in year 2000 dollars as calculated using the implicit price deflator for personal consumption expenditures
The following four criteria are used to define IDA programs (1) matches savings when withdrawn for pre-defined purposes17 (2) is funded at least partially from state government including those from TANF and welfare-to-work programs (excludes programs funded solely by private foundations) (3) is established through state legislation or administrative rule-making and (4) is actually implemented The second and third criteria are used because we cannot identify the universe of IDA programs without these restrictions There are numerous community programs (mostly small and short-lived) under IDA title In addition the money in these nonstate programs cannot be exempted from asset tests for most public assistance programs
EITC and Minimum Wage
We measure the earned income tax credit (EITC) with two program rules the maximum state EITC (measured at the end of the phase-in range) and the percentage of the state EITC that is refundable These variables are measured using Neumark and Wascher (2001) among other sources listed in the appendix
The minimum wage is measured with two variablesmdashthe applicable minimum wage for federally covered categories of workers and the state minimum wage for non-federally covered categories In 1999 72 percent of all workers were federally covered that is covered by the Fair Labor Standards Act (FLSA) Workers in non-federally covered categories include most workers in small businesses or in businesses where no interstate commerce is involved workers in seasonal or recreational jobs workers delivering newspapers or engaged in fishing operations many workers in private households and executive administrative and professional employees (US Department of Labor 2001) The minimum wage measures come from the US Department of Labor ldquoHistory of Federal Minimum Wage Ratesrdquo and Nelsonrsquos Monthly Labor Review among other sources The analysis controls for other federal asset-related policies such as the Saverrsquos Credit and Federal EITC with year fixed effects
State welfare food stamp and related program rules are summarized throughout our observation period in table 4 From 1991 to 2003 states became more generous in terms of asset limits IDA program rules and the EITC though mean unrestricted asset limits peaked in 1999 and declined slightly each year after due to inflation The number of states adopting IDA programs also increased over this period As of 2003 24 states supported IDAs of which 16 states allowed the participation of non-welfare families States expanded their EITC programs over time as shown in mean state EITC values and the percentage of statesrsquo EITC that is refundable
From 1991 to 2003 states became more restrictive in their AFDCTANF benefit levels The inflation-adjusted maximum AFDCTANF benefit level declined throughout the observation
17 Some states call their saving-incentive programs for low-income families IDA programs even though the program does not match savings
16
period This decline was attributable both to benefits not keeping up with inflation and states actually reducing the nominal benefit amount
VI METHODOLOGY
The methodology is designed to measure the effect of minimum wage requirements and AFDCTANF Food Stamp IDA and EITC program rules on asset holdings Familiesrsquo asset holdings are measured with six separate variables (1) presence of liquid assets (2) value of liquid assets (3) vehicle ownership (4) vehicle equity (5) net worth (excluding housing) and (6) net worth (including housing) States implemented different rule changes to their AFDCTANF Food Stamp IDA EITC and minimum wage programs at different times from 1991 through 2003 and the model uses this variation across states and time to identify the effect of program rules on asset holdings A benefit of this 13 year time period is that it captures familiesrsquo asset holding during both weak and strong economic times including the economic boom of the late 1990s and the 1991 and 2001 recessions (National Bureau of Economic Research 2005)
Identifying the effect of program rules on asset holdings requires disentangling the effect of state and federal rules from other factors that affect asset holdings such as economic conditions (eg unemployment rate) and unobservable state characteristics (eg public sentiment towards welfare recipients) If for example public sentiment towards welfare recipients affects both a statersquos welfare asset limits and the likelihood individuals in that state consider welfare to be an option and in turn their asset holdings (eg they begin to save for an economic crisis because welfare is believed to be less available) then omitting public sentiment would produce biased estimates The model captures unobservable state and time differences with state fixed effects (which control for differences across states) and year fixed effects (which control for differences across years)18
The model details are presented below for one of the asset holding measuresmdashpresence of liquid asset holdings This is followed by a more general discussion of the models estimated for the other five asset holding measures We estimate a linear probability model for ldquofamily has liquid asset holdingsrdquo (Y) for family i in state s in year t
ist sst2ist1st5st4st3st2st1ist ν μSXMWEITCIDA FSP WP α Y ++++++++++= tβ
β β β β δ δ τ
WPst represents the vector of state-level specific AFDCTANF program rules in state s in year t Similarly FSPst IDAst EITCst and MWst represent the vectors of state-level specific Food Stamp IDA EITC and minimum wage program rules in state s in year t respectively
18 If public sentiment towards welfare recipients does not change over time then the state fixed effects would fully capture this
17
The vector Xist represents family composition and demographic characteristics of family i in state s in year t including age age-squared race and ethnicity (black Hispanic)19 educational attainment (less than high school)20 number of children in family number of adults in family and live in metropolitan area Age of the family head reflects the ability and motivation of the family head to save at hisher stage in the life cycle (Modigliani and Brumberg 1954) and is expected to have a positive sign for our sample of working-aged families Race and ethnicity measure different saving environments and behaviors among different racial and ethnic groups (Shapiro 2004) while education captures financial literacy as well as permanent income (Hubbard et al 1995) The household composition variables capture consumption needs of a family as well as the number of potential earners (Bird and Hagstrom 1999) The indicator of living in a metro area reflects familiesrsquo need for a vehicle and accessibility to banking facilities
The vector Sst represents state-level nonprogram rule variables in year t (ie unemployment rate per capita income and employment-population ratio) We control for economic conditions because they can affect familiesrsquo employment and income as well as statesrsquo policy choices (Plotnick and Winters 1985) Finally μs is the state fixed-effect τt is the year fixed effect and νist is the random error term We estimate a linear probability model with weights to correct for heteroscedasticity based on the SIPP individual and family weights To account for potential serial correlation in the error term we cluster our standard errors by state as recommended by Bertrand et al (2004)
The analysis of ldquovehicle ownershiprdquo also uses a linear probability model as described above The models estimated for ldquovalue of liquid assetsrdquo and ldquovehicle equityrdquo are designed to take account of the fact that a relatively large fraction of families in our sample do not hold liquid assets (41 to 67 percent) or own a vehicle (25 to 52 percent) Specifically we estimate a Tobit model Finally our analyses of net worth (including and excluding housing) are based on weighted ordinary least squares models All five models include the same set of explanatory variables that are in the ldquohave liquid assetsrdquo model as well as the state and year fixed effects21
Our main models examine the contemporaneous relationship between family asset holdings and state program rules However it is likely that there are longer-run changes that result from behavioral responses to the program rule change As a result we carry out additional specifications that examine the number of years the program rules have been in place
19 The omitted category is non-black non-Hispanic 20 The omitted category is high school education 21 In the Tobit models the standard errors are not clustered by state
18
VII RESULTS
This section presents results from our multivariate analysis of the effects of state program rules on the asset holdings of low-education (high school degree or less) single mother families and a broader population of all low-education families
State means-tested social program rules could affect asset holdings through four hypothesized effects (1) asset test effectmdashasset tests associated with means-tested social programs could discourage asset holding in order to qualify for benefits (2) precautionary savings effectmdashthe need to save in case of emergency could be reduced if families know that program benefits will provide a minimum level of consumption in an emergency (Hubbard et al 1995) (3) income effectmdashby providing additional income (such as benefits and program matches) from which to save social programs could increase asset holdings and (4) substitution effectmdashprogram rules that affect only specific types of asset holdings could encourage families to substitute one type of asset for another type (eg generous vehicle asset exemptions could encourage families to substitute liquid assets for vehicle assets) Given these potentially offsetting effects the overall hypothesized effect of many social program rules on specific types of asset holdings is ambiguous (as shown in table 5)
Below we discuss our empirical findings on the relationships between specific state program rules and liquid asset holdings vehicle asset holdings and net worth The primary results (summarized in table 6) suggest that (1) more generous restricted account asset limits and IDA program rules are positively associated with liquid asset holdings (2) more generous food stamp vehicle asset limits and expanded categorical eligibility are positively associated with vehicle asset holdings (3) a more generous state EITC amount is negatively associated with liquid asset holdings but the percentage of the state EITC that is refundable is positively associated with liquid asset holdings and (4) a more generous state minimum wage is positively associated with liquid asset holdings vehicle asset holdings and net worth22 These findings are most consistent with the asset test and income hypothesized effects
Empirical Results Liquid Asset Holdings
Of the 13 state program rules hypothesized to affect asset holdings five rules have a statistically significant relationship with liquid asset holdings These rules are restricted account asset limit maximum amount qualified for match in an IDA account the state EITC amount the percentage of the state EITC that is refundable and the state minimum wage for federally covered categories In addition all of the demographic controls and most of the economic controls are important determinants of liquid assets holdings (table 7) Nearly all of these significant variables have estimated coefficients that are in the hypothesized direction
22 These general findings hold in an alternate specification that includes controls for state lifetime and intermittent time limit rules
19
Table 5 Hypothesized Effects of State Program Rules on Asset Holding by Outcome
Hypothesized Effect on
Program Rule VariableLiquid Assets
Vehicle Assets
Net Worth
AFDCTANF T P I S Overall T P I S Overall T P I S Overall(1) Unrestricted asset limit +- (+) +- (+) +- (+)(2) Vehicle asset limit for recipients at least one vehicle + - (-)(+) +- + (+) +- (-)(+)(3) Restricted account asset limit +- + - (-)(+) + - (-)(+) +- + + (+)(4) Maximum monthly benefit for family of 3 - + (+)(-) - + (+)(-) - - + (+)(-)
Food Stamps(1) FSP vehicle asset limit at least one vehicle + - (-)(+) + + + (+) (-)(+)(2) Expanded categorical eligibility + - + (+)(-) + - + (+)(-) + - + (+)(-)
IDA(1) Maximum match rates + (+) + - (-)(+) + (+)(2) Maximum amount qualified for match + (+) + - (-)(+) + (+)(3) Eligibility beyond welfare recipients + - (+)(-) + - (-)(+) + - (+)(-)
Minimum Wage and EITC(1) State EITC - + (+)(-) + (+) - + (+)(-)(2) Percentage of state EITC refundable - + (+)(-) + (+) - + (+)(-)(3) State minimum wage for FLSA covered categories + (+)(-) + (+)(-) + (+)(-)(4) State minimum wage for non-FLSA covered categories + (+)(-) + (+)(-) + (+)(-)
T = Asset test effectP = Precautionary savings effectI = Income effectS = Substitution effect (substitute one type of asset for another)
Table 6 Results SummaryStatistically Significant Relationships between State Rules and Asset Holding
Relationship with
Program Rule VariableLiquid Assets
Vehicle Assets
Net Worth
AFDCTANF(1) Unrestricted asset limit(2) Vehicle asset limit for recipients at least one vehicle(3) Restricted account asset limit (+) (-)(4) Maximum monthly benefit for family of 3
Food Stamps(1) FSP vehicle asset limit at least one vehicle (+) (-)(2) Expanded categorical eligibility (+) (+)
IDA(1) Maximum match rates (+)(2) Maximum amount qualified for match (+) (-)(3) Eligibility beyond welfare recipients (+)(-)
Minimum Wage and EITC(1) State EITC (-)(2) Percentage of state EITC refundable (+)(3) State minimum wage for FLSA covered categories (+) (+) (+)(4) State minimum wage for non-FLSA covered categoriesNote Results based on primary models presented in tables 7-9
Table 7 The Effect of State Program Rules on Liquid Asset Holdingsof Low-Education Single Mothers and Families Age 18ndash54 1991ndash2003 SIPP
Linear ProbabilityInd Liquid Assets gt 0
TobitLn (Liquid Assets)
Mothers Families Mothers Families
AFDCTANFLn (unrestricted account asset limit) ($) -0005 -0003 0019 -0034
[0017] [0015] [0229] [0075]Vehicle asset limit at least one vehicle (01) 0023 0014 0403 0125
[0020] [0013] [0315] [0104]Restricted account asset limit ($10000) 0030 0025 0538 0261
[0018] [0012] [0256] [0085]Ln (maximum monthly benefit for a family of 3) ($) 0023 -0035 0007 -0316
[0092] [0091] [1434] [0441]Food Stamps
Vehicle asset limit at least one vehicle (01) -0005 0007 -0311 0071[0020] [0013] [0330] [0110]
Expanded categorical eligibility (01) -0011 0007 -0230 0092[0023] [0015] [0336] [0112]
IDAMaximum match rate ($) 0008 0005 0058 0058
[0017] [0013] [0191] [0062]Maximum amount qualified for match ($10000) 0010 0011 0104 0089
[0008] [0005] [0147] [0050]+Eligibility beyond welfare recipients (01) -0026 -0005 -0225 0004
[0039] [0031] [0449] [0147]EITC and Minimum Wage
State EITC ($100) -0008 -0002 -0117 -0022[0003] [0002] [0056] [0018]
Percentage of state EITC refundable (0-1) 0045 0023 1003 0214[0029] [0012]+ [0492] [0158]
State minimum wage for FLSA covered categories ($) 0016 0009 0410 0222[0023] [0016] [0279] [0093]
State minimum wage for non-FLSA categories ($) 0006 -0002 0059 -0047[0013] [0007] [0219] [0073]
Demographic and Economic ControlsAge (years) 0022 0026 0478 0410
[0005] [0002] [0057] [0017]Age-squared (years-squared)100 -0021 -0028 -0541 -0445
[007] [003] [083 ] [023]Black (01) -0237 -0260 -3340 -3253
[0014] [0011] [0154] [0059]Hispanic (01) -0150 -0150 -1829 -1668
[0031] [0017] [0182] [0062]Education less than high school (01) -0203 -0231 -3518 -3068
[0013] [0006] [0142] [0049]Number of children in family () -0028 -0027 -0696 -0435
[0006] [0003] [0065] [0017]Number of adults in family () 0020 0104 0298 1405
[0012]+ [0003] [0132] [0026]Metro area (01) 0026 0027 0335 0403
[0015]+ [0009] [0167] [0051]State unemployment rate () 0019 0018 0253 0203
[0008] [0005] [0129] [0042]State per-capita income ($person) 0000 0000 0000 0000
[0000]+ [0000] [0000] [0000]State employment population ratio 0713 0929 6594 10445
[1012] [0434] [11153] [3647]
Sample Size 15635 77664 15158 75341
Note and + indicate statistical significance at the 1 5 and 10 percent levels respectively Standard errors in brackets All regressions weighted and include state and year fixed effects All dollar values are in year 2000 dollars Standard errors adjusted for clustering by state in linear probability models Sample size varies because tobit models exclude observations in top 3 percentiles of liquid asset values
Welfare and Food Stamps One specific state welfare program rule has a statistically significant relationship with liquid asset holdingsmdashthe restricted account asset limit The results suggest that a more generous restricted account asset limit increases liquid asset holdings for both low-education single mothers and low-education families as might be expected because restricted accounts (savings accounts earmarked for specific purposes such as IDAs) are typically held as liquid assets This finding is consistent with both the asset test and income effects hypotheses Restricted accounts often receive a match for dollars saved The income from this match could provide an incentive to increase savings in order to obtain the match and thus is hypothesized to increase liquid asset holdings
The estimated coefficients suggest that a $10000 increase in the restricted account asset limit increases the probability that a low-education family holds liquid assets by 25 percentage points holding all the other variables in the model constant (table 7 column 2)23 This $10000 increase may seem large to consider but is reflective of the variation in state policy Typical state restricted account asset limits vary from $0 to $10000 to no limit (Rowe and Versteeg 2005 120ndash21) To put the small magnitude of this relationship in context consider that 589 percent of low-education families hold liquid assets (table 2) Thus a $10000 increase in the restricted account asset limit is associated with an increase from 589 to 614 percent in the percentage of low-education families who hold liquid assets (an increase of about 4 percent) If only a small fraction of the low-income (education) population has the option of joining an IDA program or holding another type of restricted asset account then the true magnitude of this relationship for families may be larger than what we capture here
An increase in the restricted account asset limit not only increases the likelihood low-education families hold liquid assets but also the amount of liquid assets they hold The estimated Tobit coefficients suggest that a $10000 increase in the restricted account asset limit increases the amount of liquid asset holdings by 179 percent for low-education single mothers and 154 percent for low-education families (table 7 columns 3 and 4)24
The empirical results suggest that liquid asset holdings are not significantly associated with unrestricted asset limits welfare benefit levels vehicle exemptions or expanded categorical eligibility program rules
Individual Development Accounts The empirical results suggest that a more generous maximum amount qualified for match in IDA programs is associated with increased liquid asset
23 Note that throughout this report results are presented as percentage point changes for the liquid assets and vehicle assets outcomes (linear probability models) percent change for the natural logarithm of amount of liquid assets and vehicle equity outcomes (Tobit models) and as dollar changes for the net worth outcomes (OLS models) 24 To calculate marginal effects for the Tobit coefficients the coefficients are multiplied by the cumulative normal distribution function which gives the probability of being above the limit (ie holding the asset) The cumulative normal distribution is approximated by the fraction of the sample holding liquid assets (and owning a vehicle when interpreting Tobit vehicle equity coefficients)
23
holdings for low-education families Increasing the maximum amount qualified for a match by $10000 is associated with a 11 percentage point increase in the probability that low-education families hold liquid assets (table 7 column 2) It is also associated with a 52 percent increase in the amount of liquid assets held by these families (table 7 column 4) These findings are consistent with the income effect hypothesis We find no statistically significant relationship between two other IDA program rulesmdashmatch rates and program eligibility beyond welfare recipientsmdashand liquid asset holdings
EITC and Minimum Wage We find mixed evidence of the relationship between the state EITC and liquid asset holdings Higher state EITC amounts are associated with reduced liquid asset holdings This relationship is consistent with the precautionary savings hypothesis where families are hypothesized to save less in anticipation of a tax refund On the other hand we also find evidence that liquid asset holdings increase as the percentage of the state EITC that is refundable increases This relationship is consistent with the income effect hypothesis
The results also provide limited evidence that the state minimum wage for federally covered categories increases the amount of liquid assets held The results suggest that a $1 increase in the minimum wage increases low-education familiesrsquo liquid asset holdings by 131 percent (table 7)
Demographic and Economic Controls Liquid asset holdings are found to increase with age until approximately the late 40s or early 50s and decrease with age thereafter for low-education single mothers and families This turning point is slightly earlier than in the general population where asset holdings tend to peak in the 55ndash64 age group and decline thereafter (Carasso and McKernan forthcoming) The results also suggest that liquid asset holdings (1) are lower for blacks and Hispanics than whites (2) are lower for those with no high school degree than those with a high school degree (3) decrease with the number of children in the family and increase with the number of adults in the family and (4) are higher for families living in metropolitan areas than non-metropolitan areas
Empirical Results Vehicle Ownership
Three of the 13 state program rules hypothesized to affect asset holdings have a statistically significant relationship to vehicle ownership Similar to the liquid asset holding models all of the demographic controls are important determinants of vehicle ownership as are some of the economic controls
Welfare and Food Stamps The results suggest that none of the TANF program rules but both Food Stamp Program rules have a statistically significantly relationship to vehicle asset holdings (see table 8)
24
Table 8 The Effect of State Program Rules on Vehicle Asset Holdingsof Low-Education Single Mothers and Families Age 18ndash54 1991ndash2003 SIPP
Linear ProbabilityInd Owns Vehicle
TobitLn (Vehicle Equity)
Mothers Families Mothers Families
AFDCTANFLn (unrestricted account asset limit) ($) -0005 -0016 0102 -0077
[0022] [0011] [0251] [0071]Vehicle asset limit at least one vehicle (01) -0012 0012 -0163 -0058
[0025] [0011] [0340] [0098]Restricted account asset limit ($10000) -0003 0014 0181 0098
[0022] [0010] [0279] [0080]Ln (maximum monthly benefit for a family of 3) ($) 0104 0050 1080 0644
[0091] [0037] [1442] [0402]Food Stamps
Vehicle asset limit at least one vehicle (01) 0039 -0010 0854 -0065[0020]+ [0009] [0354] [0103]
Expanded categorical eligibility (01) 0022 0018 0819 0354[0019] [0014] [0364] [0104]
IDAMaximum match rate ($) 0002 0009 -0057 -0014
[0019] [0006] [0211] [0059]Maximum amount qualified for match ($10000) -0002 0002 -0097 0020
[0010] [0004] [0165] [0047]Eligibility beyond welfare recipients (01) 0023 -0013 0239 -0049
[0040] [0013] [0495] [0139]EITC and Minimum Wage
State EITC ($100) -0001 -0002 -0065 -0009[0004] [0002] [0065] [0018]
Percentage of state EITC refundable (0-1) -0007 -0004 0492 0093[0051] [0016] [0567] [0152]
State minimum wage for FLSA covered categories ($) 0021 0011 0446 0149[0020] [0007]+ [0308] [0088]+
State minimum wage for non-FLSA categories ($) 0005 -0006 0058 -0049[0014] [0006] [0233] [0068]
Demographic and Economic ControlsAge (years) 0058 0037 0991 0443
[0006] [0002] [0063] [0016]Age-squared (years-squared)100 -0069 -0043 -1205 -0511
[008] [003] [091] [021]Black (01) -0258 -0264 -3492 -2855
[0016] [0015] [0164] [0054]Hispanic (01) -0193 -0113 -2721 -1149
[0042] [0038] [0202] [0058]Education less than high school (01) -0189 -0156 -2820 -1754
[0010] [0008] [0146] [0044]Number of children in family () -0018 -0012 -0315 -0180
[0006] [0003] [0065] [0016]Number of adults in family () 0045 0110 0518 1213
[0013] [0004] [0143] [0025]Metro area (01) -0024 -0031 -0555 -0366
[0013]+ [0010] [0177] [0048]State unemployment rate () -0005 -0002 -0200 -0104
[0010] [0004] [0140] [0039]State per-capita income ($person) 0000 0000 0000 0000
[0000] [0000] [0000] [0000]State employment population ratio -0700 0074 -12119 0517
[0807] [0351] [12276] [3450]
Sample Size 15635 77664 15144 75305
Note and + indicate statistical significance at the 1 5 and 10 percent levels respectively Standard errors in brackets All regressions weighted and include state and year fixed effects All dollar values are in year 2000 dollars Standard errors adjusted for clustering by state in linear probability models Sample size varies because tobit models exclude observations in top 3 percentiles of vehicle equity values
Low-education single mothers and families in states with expanded categorical eligibility for the Food Stamp Program have significantly higher vehicle equity than those who live in states without expanded categorical eligibility Our results suggest that expanded categorical eligibility is associated with increased vehicle equity of 396 and 266 percent respectively for low-education single mothers and families The positive relationship between expanded categorical eligibility and vehicle asset holdings is consistent with the hypothesized income effectmdashadditional program benefits help with the purchase or maintenance of a vehicle These results are also consistent with the hypothesized asset test effects Expanded categorical eligibility results in more lenient asset tests because families that receive TANF services (not just TANF cash benefits) also qualify for food stamps even if the Food Stamp Program has more stringent asset tests Many states use categorical eligibility as a backdoor way to ease vehicle asset limits These more lenient asset tests for recipients of TANF services are hypothesized to increase vehicle asset holdings
Also consistent with the asset test hypothesis exempting at least one vehicle when counting assets for Food Stamp Program eligibility is associated with a 39 percentage point increase in vehicle ownership and 412 percent increase in vehicle equity for low-education single mothers While we find evidence that state Food Stamp Program vehicle exemptions increase vehicle ownership we find no evidence that exempting at least one vehicle from the TANF program increases vehicle ownership which is contrary to Sullivan (2006) We also find no statistically significant evidence that the unrestricted asset limit restricted account asset limit and maximum monthly benefit are related to vehicle ownership for low-education single mothers or families
Individual Development Accounts The results provide no statistically significant evidence state IDA program rules are related to vehicle ownership Specifically we find no evidence that the maximum match rate maximum amount qualified for match or program eligibility beyond welfare recipients are significantly associated with vehicle ownership Since IDA accounts generally cannot be used to purchase a vehicle it is not surprising that IDA program rules are not found to increase vehicle ownership or equity If these IDA programs cause families to shift resources from vehicles into savings then we could find a negative relationship
EITC and Minimum Wage The results suggest that a one dollar increase in the state minimum wage for federally covered categories is associated with a 11 percentage point increase in vehicle ownership and 112 percent increase in vehicle equity for low-education families This result is consistent with a positive income effect from an increased minimum wage We find no evidence that the EITC is related to vehicle ownership or equity
26
Demographic and Economic Controls Similar to the models for liquid asset holdings all the demographic controls are statistically significant determinants of vehicle asset holdings in the expected directions and the economic controls are weaker determinants of vehicle holdings
Empirical Results Net Worth
Asset tests measure liquid assets and vehicle ownership so there is likely to be a strong relationship between asset tests and the level of these holdings We also consider net worth because asset-related program rules could cause families to shift their assets from one type of asset (those considered in asset tests) to another type of asset (those not counted in asset tests such as homes) or could cause changes in debt levels (eg if a family borrows money to buy a car in response to more lenient vehicle exemptions)
We examine two measures of net worthmdashnet worth including home equity and net worth excluding home equity We measure net worth including home equity because for families who own a home the home is likely to be one of their most valuable assets We measure net worth excluding home equity because of potential measurement issues in trying to value homes We expect to see potentially larger effects of state program rules on net worth excluding home equity because net worth excluding home equity is more likely to be affected by family saving and debt behavior while net worth including home equity is more likely to be driven by housing market values which are outside family control Seven of the 13 state program rules hypothesized to affect asset holdings have a statistically significantly relationship to net worth though not all of these relationships appear robust (see table 9)
Welfare and Food Stamps The results suggest that expanded categorical eligibility in the Food Stamp Program increases the net worth (excluding home equity) of low-education single mothers by $401 This finding is consistent with our finding that expanded categorical eligibility increases vehicle equity and is supported by the asset test and income effects hypotheses The similar increases in vehicle equity for low-education single mothers associated with the food stamp vehicle asset limit and for low-education families associated with expanded categorical eligibility did not translate into increased net worth
We find some although limited evidence that more generous restricted asset account limits are negatively associated with net worth We find a significant negative relationship for only low-income familiesrsquo net worth including home equity so this unexpected finding is for only one of the four regressions and for the population (families) less likely to be affected by TANF policy
Individual Development Accounts The results provide some evidence that IDA program rules are associated with net worth The maximum match rate is positively associated with net worth (both including and excluding home equity) for low-education single mothers Each $1 increase in the match rate (say from 1-to-1 to 2-to-1) is associated with a $923 increase
27
Table 9 The Effect of State Program Rules on Net Worthof Low-Education Single Mothers and Families Age 18ndash54 1991ndash2003 SIPP
OLSNet Worth (Incl Home)
OLSNet Worth (Excl Home)
Mothers Families Mothers Families
AFDCTANFLn (unrestricted account asset limit) ($) 83235 374659 -129330 21290
[572425] [875387] [153100] [458079]Vehicle asset limit at least one vehicle (01) 698300 -8868 337621 -767295
[554448] [1085683] [204335] [532082]Restricted account asset limit ($10000) 58247 -1467249 53852 -255392
[481887] [616863] [156300] [319877]Ln (maximum monthly benefit for a family of 3) ($) 790272 3375655 -180010 -2860396
[2155237] [5149317] [878282] [3038589]Food Stamps
Vehicle asset limit at least one vehicle (01) -1003734 -679250 -103082 523147[532799]+ [1326024] [179768] [398805]
Expanded categorical eligibility (01) 130008 -1935735 400737 -562603[509791] [1339433] [171744] [550317]
IDAMaximum match rate ($) 923236 55033 418419 -158881
[366248] [789064] [166492] [305179]Maximum amount qualified for match ($10000) 80520 -743448 -162481 -167199
[362484] [1121859] [89171]+ [204149]Eligibility beyond welfare recipients (01) -2435173 1751237 -111635 1547555
[875235] [1435979] [375277] [689218]EITC and Minimum Wage
State EITC ($100) -175713 -31936 -33051 68244[146332] [362888] [58934] [83896]
Percentage of state EITC refundable (0-1) 1243977 -1904144 387571 105357[1085700] [2047966] [487863] [455972]
State minimum wage for FLSA covered categories ($) -723728 1547971 -36487 894999[516067] [1259613] [222914] [444097]
State minimum wage for non-FLSA categories ($) -164022 395526 57775 -130717[334910] [848403] [139045] [385812]
Demographic and Economic ControlsAge (years) -1843 41767 98821 119709
[171064] [174031] [37301] [98165]Age-squared (years-squared)100 522337 1631693 -94436 286438
[279783]+ [256210] [55516]+ [150866]+Black (01) -4091780 -1858041 -749221 -7010925
[513409] [1291941] [110482] [352584]Hispanic (01) -2698324 -1215563 -467142 -4759374
[803012] [2244725] [166676] [633731]Education less than high school (01) -2902650 -1255014 -503650 -4587349
[372118] [769951] [69953] [194034]Number of children in family () -34828 707296 -158200 -124761
[133748] [306504] [33896] [128471]Number of adults in family () 1684587 10693570 304064 2800188
[425792] [550108] [110487] [218325]Metro area (01) 114116 755987 84313 131794
[552452] [1001636] [128294] [374556]State unemployment rate () -113282 184080 -72342 -299412
[312119] [487584] [80991] [284619]State per-capita income ($person) 0867 0125 0133 -0147
[0301] [0654] [0116] [0247]State employment population ratio 513800 95699975 5674903 20781823
[22441499] [55461453]+ [9079566] [22233837]
Sample Size 12048 58418 12059 58433
Note and + indicate statistical significance at the 1 5 and 10 percent levels respectively Standard errors in brackets All regressions weighted and include state and year fixed effects All dollar values are in year 2000 dollars Standard errors adjusted for clustering by state Sample sizes vary because top and bottom three percentiles of net worth are dropped
in net worth including home equity and a $418 increase in net worth excluding home equity An increase in the maximum match qualified for a match is weakly negatively associated with a decrease in net worth (excluding home equity) for low-education single mothers Extending eligibility beyond welfare recipients is related to a reduction of $2435 and $1116 in the net worth (including and excluding home equity respectively) of single mothers This reduction in the net worth of single mothers when eligibility is extended beyond welfare recipients might result from IDA programs with a set amount of funds having fewer funds to target to the more disadvantaged welfare population Consistent with this hypothesis extending eligibility beyond welfare recipients is associated with an increase in net worth (excluding home equity) for low-education families
EITC and Minimum Wage We also find evidence that a higher minimum wage for federally covered categories is related to increases in the net worth of low-education families This finding is consistent with the hypothesized income effect We find no evidence that the EITC is related to net worth
Empirical Results Years since the Program Rule Was Implemented
To examine the timing of program rule changes we estimate an alternate specification that measures the number of years since the program rule was implemented (similar to Nam forthcoming) rather than a precise measure of the rule It may be that program participants and potential participants understand only blunt measures of rules such as whether a participant may have a restricted asset account and not the amount she is allowed to hold in it It may also be that information on the rules takes time to filter down to participants and affect saving behavior This alternate specification captures blunt rule changes (such as whether restricted asset accounts are available) and the timing of the blunt rule change (the number of years since it is available)
Some results from the years-since-program-rule-implemented specification are similar to those from our primary specificationmdashwhich captures more precise program rule measuresmdashwhile other results differ TANF restricted asset account limits (as measured by the number of years since restricted asset account limits became available in the state) are not significantly related to liquid asset holdings though the specific measure of the restricted account asset limit was significantly positively related in the primary specification The unrestricted asset limit (as measured by years since the unrestricted asset limit was greater than $1000 in the state) is positively and statistically significantly associated with increases in liquid asset holdings while the specific measure of the unrestricted asset limit was in general not positively or significantly related to liquid asset holdings in the primary specification IDA programs continue to be significantly related to asset holdings and suggest that the number of years since a state-sponsored IDA program became available in the state is associated with an increase in liquid asset holdings We find mixed results for the relationship between the years since at least one vehicle was exempted in determining eligibility in the food stamp program but do find some
29
evidence that both this variable and the years since expanded categorical eligibility was put in place variable are associated with increased vehicle asset holdings Detailed results are presented in appendix tables A3ndashA5
VIII CONCLUSION
The results of this study suggest that various state program rules adopted since the mid-1990s especially those aimed at asset building are positively related to low-education single mothersrsquo and familiesrsquo asset holdings The analysis suggests that more lenient asset limits in means-tested programs and more generous IDA program rules may have positive effects on asset holdings These results suggest that maintaining and expanding these programs may help promote asset ownership among economically vulnerable populations
Findings from the primary models suggest that not every asset-building program rule has the same effect For example more lenient limits on restricted accounts are positively related to liquid assets while relaxed asset limits on unrestricted accounts have no significant relationship with any type of asset holdings More generous IDA rules on the other hand are positively related to both liquid asset holdings and net worth The different incentive structures and program operations may have produced distinct outcomes restrictions on withdrawals and incentives which are built into IDA and restricted asset account limits may have motivated low-education single mothers and families to save and helped them resist the temptation to spend Accordingly asset-building program rules could be designed carefully to achieve policy goals
Findings from an alternate specification that measures the years since the programs or broad measures of more generous rules were implemented corroborate the IDA rule findings but not the unrestricted versus restricted asset limit findings This is the first study (known to the authors) to look at the net relationships of restricted and unrestricted asset limits The results are suggestive but not conclusive that restricted account asset limits have different effects on asset building than unrestricted asset limits do Additional research on this topic could shed further light on the role that unrestricted asset limits restricted account asset limits and IDA programs play in asset building
This study also shows that other non-asset related program rules have a relationship with the asset holdings of low-education single mothers and families For example vehicle asset limits and expanded categorical eligibility in the Food Stamp Program are positively related to vehicle assets and net worth These findings suggest that potential program interactions and indirect effects of program rules on non-target areas are potentially important and could continue to be considered in future research
The mixed results of this study and previous studies of the effects of asset limits indicate that further research on how people respond to the complex and contradictory incentive structure presented by asset limits and asset-building programs would be helpful This additional
30
knowledge would make a meaningful contribution to the policy discussion and could lead to more effective asset policies for low-income people
31
IX REFERENCES
Bertrand Marianne Esther Duflo and Sendhil Mullainathan 2004 ldquoHow Much Should We Trust Differences-in-Differences Estimatesrdquo Quarterly Journal of Economics 119(1) 249ndash75
Bird Edward J and Paul A Hagstrom 1999 ldquoThe Wealth Effects of Income Insurancerdquo Review of Income and Wealth 45(3) 339ndash52
Blank Rebecca and Patricia Ruggles 1996 ldquoWhen Do Women Use Aid to Families with Dependent Children and Food Stampsrdquo Journal of Human Resources 31(1) 57ndash89
Carasso Adam and Signe-Mary McKernan Forthcoming The Balance Sheets of Low-Income Households What We Know about Their Assets and Liabilities A Report in the Series Poor Finances Assets and Low-Income Households Washington DC Office of the Assistant Secretary for Planning and Evaluation US Dept of Health and Human Services
Corporation for Enterprise Development 2002 State Asset Development Report Card Washington DC Corporation for Enterprise Development
Gruber Jonathan and Aaron Yelowitz 1999 ldquoPublic Health Insurance and Private Savingsrdquo Journal of Political Economy 107(6) 1249ndash74
Hogan M Janice Catherine Solheim Susan Wolfgram Busisiwe Nkosi and Nicola Rodrigues 2004 ldquoThe Working Poor From the Economic Margins to Asset Buildingrdquo Family Relations 53(2) 229ndash36
Hubbard R Glenn Jonathan Skinner and Stephen P Zeldes 1995 ldquoPrecautionary Saving and Social Insurancerdquo Journal of Political Economy 103(2) 360ndash99
Hurst Erik and James P Ziliak 2006 ldquoDo Welfare Asset Limits Affect Houshold Saving Evidence from Welfare Reformrdquo Journal of Human Resources 41(1) 46ndash71
Losby Jan L and Jill R Robinson 2004 Michigan IDA Partnership Year 3 Program Evaluation Report Washington DC ISED Solution
Mills Gregory William G Gale Rhiannon Patterson and Emil Apostolov 2006 What Do Individual Development Accounts Do Evidence from a Controlled Experiment Washington DC Brookings Institution
Modigliani Franco and Richard E Brumberg 1954 ldquoUtility Analysis and the Consumption Function An Interpretation of Cross-Section Datardquo In Post-Keynesian Economics edited by K K Kurihara (388-436) New Brunswick NJ Rutgers University Press
Nam Yunju Forthcoming ldquoWelfare Reform Asset Limits and Financial Asset Accumulation among Low-Income Householdsrdquo Social Science Quarterly
National Bureau of Economic Research 2005 ldquoBusiness Cycle Expansions and Contractionsrdquo Cambridge MA National Bureau of Economic Research httpwwwnberorgcycles
Neumark David and William Wascher 2001 ldquoUsing the EITC to Help Poor Families New Evidence and a Comparison with the Minimum Wagerdquo National Tax Journal 54(2) 281ndash317
OBrien Bourke 2006 Ineligible to Save Asset Limits and Savings Behavior of Welfare Recipients Washington DC New America Foundation
Pavetti La Donna Kathleen Maloy and Liz Schott 2002 ldquoPromoting Medicaid and Food Stamp Participation Establishing Eligibility Procedures That Support Participation and Meet Familiesrsquo Need Reference No 8661-403rdquo Mathematica 282-98-0021 (4June)
32
Plotnick Robert D and Richard F Winters 1985 ldquoA Politico-Economic Theory of Income Redistributionrdquo American Political Science Review 79(2) 458ndash73
Powers Elizabeth T 1998 ldquoDoes Means-Testing Welfare Discourage Saving Evidence from a Change in AFDC Policy in the United Statesrdquo Journal of Public Economics 68(1) 33ndash53
Ratcliffe Caroline Henry Chen Trina R Williams Shanks Yunju Nam Mark Schreiner Min Zhan and Michael Sherraden 2007 Assessing Asset Data on Low-Income Households Current Availability and Options for Improvement A Report in the Series Poor Finances Assets and Low-Income Households Washington DC Office of the Assistant Secretary for Planning and Evaluation US Dept of Health and Human Services
Rowe Gretchen and Jeffrey Versteeg 2005 ldquoState TANF Policies as of July 2003rdquo In Welfare Rules Databook Assessing the New Federalism Washington DC The Urban Institute
Savner Steve and Mark Greenberg 1995 The CLASP Guide to Welfare Waivers 1992ndash1995 Washington DC Center for Law and Social Policy
Schreiner Mark Margaret Clancy and Michael Sherraden 2002 Saving Performance in the American Dream Demonstration Center for Social Development St Louis Washington University
Schreiner Mark Michael Sherraden Margaret Clancy Lissa Johnson Jami Curley Min Zhan Sondra G Beverly and Michael Grinstein-Weiss 2005 ldquoAssets and the Poor Evidence from Individual Development Accountsrdquo In Inclusion in the American Dream Assets Poverty and Public Policy edited by M W Sherraden (185-215) New York Oxford University Press
Shapiro Thomas M 2004 The Hidden Cost of Being African-American How Wealth Perpetuates Inequality New York Oxford University Press
Sherraden Michael 1991 Assets of the Poor Armonk NY ME Sharpe mdashmdashmdash 2001 ldquoAsset-Building Policy and Programs for the Poorrdquo In Assets for the Poor edited
by Thomas M Shapiro and Edward N Wolff (302ndash56) New York NY Russell Sage Foundation
Shobe M A and K Christy-McMullin 2005 ldquoSavings Experiences Past and Present Narratives from Low-Income African American Womenrdquo Affilia 20(2) 222ndash37
Stegman Michael A and Robert Faris 2005 ldquoThe Impacts of IDA Programs on Family Savings and Asset Holdingsrdquo In Inclusion in the American Dream Assets Poverty and Public Policy edited by M W Sherraden (216-237) New York Oxford University Press
Sullivan James X 2006 ldquoWelfare Reform Saving and Vehicle Ownership Do Asset Limits and Vehicle Exemptions Matterrdquo Journal of Human Resources 41(1) 72ndash105
Super David and Stacy Dean 2001 New State Options to Improve the Food Stamp Vehicle Rule Washington DC Center on Budget and Policy Priorities
US Department of Health and Human Services Office of Community Service 2004 Interim Report to Congress Assets for Independence Demonstration Program Washington DC Office of Community Service Department of Health and Human Services
US Department of Labor Bureau of Labor Statistics Local Area Unemployment Statistics 2001 ldquoTable 4 Civilian Labor Force and Unemployment by State and Selected Areas Not Seasonally Adjustedrdquo Washington DC Bureau of Labor Statistics Department of Labor httpwwwblsgovnewsreleaselaust04htm
33
Warren Naomi and Karen Edwards 2005 Status of State Supported IDA Programs in 2005 CSD Policy Report 05-03 St Louis MO Center for Social Development Washington University in St Louis
34
X APPENDIX TABLES
34
Appendix Table A-1 A Selection of Reported Effects of Means-Tested Social Programs on Asset AccumulationAuthor Data SampleStudy
PopulationMethod Outcome Key Explanatory
VariablesFindings Effect
Blank and Ruggles (1996)
1986 and 1987 Survey of Income and Program Participation (SIPP)
All spells of single-motherhood (currently unmarried women caring for children)
Descriptive The percentage of families ineligible for welfare due to asset holding
NA The percentage of months for which single mothers were ineligible increased from 57 (based only on income eligibility) to 602 (both on income and asset eligibilities)
NA
Gruber and Yelowitz (1999)
1984 and 1993 SIPP and the Consumer Expenditure Survey (CEX)
All households with household head 18ndash64 and no member over 64 (regressions have more than 40000 observations)
Instrumental variables regression Control variables capture gender age race education marital status state and year fixed effects and state-year interactions
Log of net worth and log of consumption
Current and future Medicaid-eligible dollars dummy for whether state has an asset test interacted with Medicaid dollars
Medicaid eligibility has a significant negative effect on wealth and a strong positive association with expenditures Medicaid effects are much stronger with an asset test In 1993 Medicaid lowered eligible householdsrsquo wealth by 163 percent
Empirically MedicaidmdashyesMedicaid asset testmdashyes
Hubbard Skinner and Zeldes (1995)
Potential and actual social program recipients
Theoretical and dynamic programming models
Theoretically social insurance programs with asset tests discourage precautionary saving (this effect wouldbe present even in absence of asset test) and imply an implicit tax of 100 percent on wealth in the event of an earnings downturn or large medical expense
Theoreticallyprogrammdashyesasset testmdashyes
Hurst and Ziliak (2006)
Panel Study of Income Dynamics (PSID)
281 at-risk female household heads with children plus comparison groups
Regression analysis with comparison groups and individual and state fixed effects
Change in household liquid assets between 1994 and 2001
Changes in state liquid asset limits vehicle limits and time limits between 1994ndash2001
Subjectsrsquo savings have not responded economically or statistically to welfare reform induced changes in liquid asset limits vehicle limits or time limits Low asset accumulation is not caused by asset limits but may be because of the consumption floor guaranteed by means-tested programs A $1000 increase in liquid assets limits increased asset ownership by no more than$40 A $1000 increase in asset limits increased car ownership by 146 percent
EmpiricallyAFDCTANF asset testmdashno liquid assetsmdashnovehicle ownershipmdashyes
(continued on following page)
Appendix Table A-1 -- A Selection of Reported Effects of Means-Tested Social Programs on Asset Accumulation (continued)Author Data SampleStudy
PopulationMethod Outcome Key Explanatory
VariablesFindings Effect
Nam (forthcoming)
1994 and 2001 PSID
277 at-risk female household heads with children plus comparison groups
Difference-in-difference approach
The change in liquid asset holding between 1994-2001 vehicle ownership and bank account ownership
State liquid asset limit amount and years since asset test changed
The earlier a state raised its countable asset limit the more likely welfare recipients were to accumulate liquid assets and to possess bank accounts
Empirically AFDCTANF years since asset test changed - yes
Neumark and Powers (1998)
1984 SIPP 675 male household heads 60ndash64 likely to be eligible for SSI
Difference-in-difference approach Identifies the effects of SSI from the differencemdashbetween states that do and do not supplement SSImdashin the difference in saving between those likely and unlikely to receive SSI
Change in net wealth excluding housing between waves 4 and 7
State supplemental SSI benefits
High SSI benefits reduce saving among households with heads approaching SSI eligibility who are likely to end up participating in the program a $100 increase in SSI benefits decreases savings by $281
Empirically SSImdashyes
OBrien (2006) Qualitative interview data from a convenient sample
8 TANF participants in Alexandria VA and 10 welfare-to-work program participants in Gaithersburg MD
Qualitative interview analysis
TANF recipients decision about TANF application
NA (1) The existence of asset limits -- or just as importantly the perception that these limits exist -- negatively impact the savings behavior of TANF recipients (2) Nearly every individual feared having a bank account would jeopardized their eligibility for public assistance (p 5) (3) Welfare recipients perceive TANF eligibility policies to be more stringent than theyactually are (4) The decision to apply for public assistance is typically an option of last resort -- after savings have dried up
Qualitativelymdashyes
Powers (1998) National Longitudinal Survey of Youth Young Women
229 single mothers in both 1978 and 1983
OLS regressions Change in total net wealth (excluding vehicles) between 1978 and 1983
Changes in asset limits and asset test characteristics between 1978 and 1983
Between 1978 and 1984 subjects in most states saved approximately 25 cents for each $1 increase in AFDC asset limits
EmpiricallyAFDC asset testmdashyes
Sullivan (2006) 1992 1993 and 1996 SIPP
5221 single mothers with high school degrees or less
Probit regression for vehicle ownership and OLS regression for vehicle equity
Indicators for vehicle ownership and liquid asset ownership
Indicators for whether each state has a vehicle limit real dollar value of the vehicle limit and real dollar value of total asset limit
Asset restrictions do have an effect on vehicle assets but no effect on liquid assets Subjects in a state with a $1500 vehicle asset exemption are 12 percent less likely to own a car than subjects in a state with a full vehicle exemption Each $1000 increase in vehicle exemption results in a 23 percent increase in car ownership
Empirically AFDCTANF asset testmdashyesvehicle ownershipmdashyes liquid assetsmdashno
Source Data SampleStudy Population Method Outcome Key Explanatory Variables
Findings
HoganSolheim Wolfgram Nkosi and Rodrigues (2004)
Qualitative data from Family Assets for Independence in Minnesota (FAIM)
25 participants in FAIM (income lt200 poverty)
Qualitative Saving for asset building (saving in IDAs)
NA (1) Despite continuous financial vulnerability (eg job layoff and illness) majority of participants succeeded in saving in IDAs (2) 75 of participants saved $30 per month (maximum monthly deposit) over a period of severalyears (3) Social supports from FAIM outreach staff or fellow financial education class participants helped participants stay in IDA programs especially among those without supports from family and friends (4) Some reported that they learned budgeting record keeping and planned saving skills from the required financial education class
Mills Gale Patterson and Apostolov (2006)
ADD Experiment (ADD-E) Data
Treatment group (N=412) or control group (N=428) randomly assigned from a pool of qualified applicants (income less than 150 poverty line and currently employed) Only those who completed a survey at enrollment and a 4-year followup survey were included
Desriptive OLS and Probit
Home ownership home equity business equity and liquid assets
ADD participation (treatment vs control)
The IDA program (1) Raised homeownership rates by almost 10 percentage points over 4 years for black renters but reduced financial assets and business ownership (2) Had no effects on homeownership for white renters but their business equity rose (3) Overall had no statistically significant effect on net worth
Office of Community Services DHHS (2004)
Asset For Independence Act (AFIA) Evaluation Program tracking
All IDA accounts opened by the end of the programs 4th year 12252 TANF eligible for with income lt200 of poverty level with net worth lt$10000 were included
Descriptive Saving performance in ADD acounts (savings in ADD accounts matched withdrawal)
NA (1) Average IDA balance was $592 per account (2) Among 5237 withdrawals from IDA accounts 67 were matched withdrawals
Schreiner et al (2005)
American Dream Demonstration (ADD) Account Monitoring Data
Program participants at 14 ADD programs across the United States (family income of less than 200 of poverty)
Descriptive Probit (the probability of having at least $100 of net deposit in ADD account) and OLS (average monthly net deposit)
Saving performance in ADD acounts (savings in ADD accounts and whether participant made a matched withdrawal)
NA for descriptive analysis Demographics income welfare experience assets and liabilities at the time of enrollment and program characteristics for multivariate analyses
(1) About 53 saved at least $100 in ADD account and average net deposits were $537 (average monthly deposits were $21) (2) About 35 made matched withdrawal and the average value of matched withdrawals (including matches) was $2711 (3) Income and welfare receipt experience at the time of enrollment are not significantly associated with the probability of saving at least $100 after controlling demographic and other factors(4) Program characteristics (financial education and match rate) are significantly associated with the probability of saving and average monthly net deposit
Appendix Table A-2 A Selection of Reported Effects of IDAs on Asset Accumulation
(continued on following page)
Source Data SampleStudy Population Method Outcome Key Explanatory Variables
Findings
Shobe and Christy-McMullin (2005)
Qualitative data from a North Carolina IDA program
9 low-income African American women
Qualitative Saving for asset building (saving in IDAs)
NA (1) Participants believed that IDAs gave low-income families opportunities for asset ownership taught savings and investments skills provided personalized supports and helped them solve their credit problems (2) A majority of interviewees reported that they saved extra beyond their IDA savings (maximum matchable savings=$1000)
Stegman and Faris (2005)
American Dream Demonstration (ADD) Account Monitoring Data and the Survey of Consumer Finances (SCF)
ADD program participants and SCF households with similar characteristics to ADD enrollees
Simulation (Compare actual savings in ADD accounts and predicted savings without ADD using estimaton based on the SCF sample
ADDs saving effect [(ADD balance - predicted annualized savings)years in ADD]
NA (1)The median ADD participant has saved $117 more than heshe would have saved without ADD participation under an assumption of no shuffling (no transferred funds to ADD accounts from other accounts) (2) ADDs saving effect is larger among whites ($ 257 in median) than Blacks ($56) and Hispanics ($175) (3) Under an assumption of 50 of shuffling (50 of savings in other accounts transferred to ADD accounts) the median saving effect of ADD is $40
Appendix Table A-2 - A Selection of Reported Effects of IDAs on Asset Accumulation (continued)
Appendix Table A-3 The Effect of the Number of Years since State Program Rules Implemented onLiquid Asset Holdings of Low-Education Single Mothers and Families Age 18ndash54 1991ndash2003 SIPP
Linear ProbabilityInd Liquid Assets gt 0
TobitLn (Liquid Assets)
Mothers Families Mothers Families
AFDCTANFYears since unrestricted limit gt $1000 0005 0006 0117 0072
[0005] [0003]+ [0065]+ [0021]Years since at least one vehicle exempted 0005 0003 0084 0027
[0005] [0003] [0057] [0019]Years since restricted account asset limits available 0002 0001 0004 0000
[0004] [0003] [0050] [0017]Ln (maximum monthly benefit for a family of 3) ($) 0025 -0040 -0459 -0455
[0085] [0096] [1391] [0431]Food Stamps
Years since at least one vehicle exempted -0002 -0002 -0088 -0050[0006] [0006] [0127] [0046]
Years since expanded categorical eligibility in place -0008 0001 -0197 0003[0012] [0006] [0153] [0050]
IDAYears since IDAs available -0001 0006 -0011 0077
[0006] [0002] [0069] [0023]EITC and Minimum Wage
State EITC ($100) -0008 -0001 -0101 -0011[0003] [0002] [0056]+ [0018]
Percentage of state EITC refundable (0-1) 0032 0014 0661 0126[0028] [0011] [0464] [0150]
State minimum wage for FLSA covered categories ($) 0002 0000 0215 0117[0025] [0015] [0308] [0103]
State minimum wage for non-FLSA categories ($) 0014 0004 0228 0057[0014] [0007] [0205] [0068]
Sample Size 16126 79946 15632 77552
Note and + indicate statistical significance at the 1 5 and 10 percent levels respectively Standard errors in brackets All regressions weighted and include state and year fixed effects and all the same control variables shown in tables 6-8 All dollar values are in year 2000 dollars Standard errors adjusted for clustering by state in linear probability models Sample size varies because Tobit models exclude observations in top 3 percentiles of liquid asset values
Appendix Table A-4 The Effect of the Number of Years since State Program Rules Implemented onVehicle Asset Holdings of Low-Education Single Mothers and Families Age 18ndash54 1991ndash2003 SIPP
Linear ProbabilityInd Owns Vehicle
TobitLn (Vehicle Equity)
Mothers Families Mothers Families
AFDCTANFYears since unrestricted limit gt $1000 0006 0001 0140 0009
[0005] [0002] [0071] [0020]Years since at least one vehicle exempted -0006 0001 -0080 -0039
[0005] [0002] [0063] [0018]Years since restricted account asset limits available -0006 0000 -0089 0010
[0005] [0002] [0054] [0016]Ln (maximum monthly benefit for a family of 3) ($) 0019 0035 -0150 0669
[0091] [0040] [1415] [0397]+Food Stamps
Years since at least one vehicle exempted 0007 -0008 0248 -0011[0008] [0003] [0140]+ [0043]
Years since expanded categorical eligibility in place 0001 0008 0161 0136[0008] [0006] [0163] [0047]
IDAYears since IDAs available 0008 0001 0088 0002
[0004]+ [0003] [0075] [0022]EITC and Minimum Wage
State EITC ($100) 0001 -0003 -0031 -0015[0004] [0002]+ [0065] [0018]
Percentage of state EITC refundable (0-1) -0029 -0009 0060 0076[0047] [0014] [0538] [0145]
State minimum wage for FLSA covered categories ($) 0020 0007 0322 0099[0027] [0008] [0341] [0098]
State minimum wage for non-FLSA categories ($) 0004 0000 -0032 -0019[0012] [0007] [0223] [0064]
Sample Size 16126 79946 15622 77551
Note and + indicate statistical significance at the 1 5 and 10 percent levels respectively Standard errors in brackets All regressions weighted and include state and year fixed effects and all the same control variables shown in tables 6-8 All dollar values are in year 2000 dollars Standard errors adjusted for clustering by state in linear probability models Sample size varies because Tobit models exclude observations in top 3 percentiles of vehicle equity values
Appendix Table A-5 The Effect of the Number of Years since State Program Rules Implemented on Net Worth of Low-Education Single Mothers and Families Age 18ndash54 1991ndash2003 SIPP
OLSNet Worth (Incl Home)
OLSNet Worth (Excl Home)
Mothers Families Mothers Families
AFDCTANFYears since unrestricted limit gt $1000 39415 -119859 -37755 -64708
[110132] [260957] [48927] [97772]Years since at least one vehicle exempted 56871 311429 -24583 -67465
[112276] [228548] [28883] [94778]Years since restricted account asset limits available -208872 -664437 -62127 -47318
[105423]+ [225764] [46375] [69909]Ln (maximum monthly benefit for a family of 3) ($) -1184869 3955821 -232479 -2005675
[2480576] [5904362] [647066] [2828470]Food Stamps
Years since at least one vehicle exempted -429264 -493249 18707 266732[241194]+ [488580] [59928] [130271]
Years since expanded categorical eligibility in place 18334 -334684 124412 -45878[255493] [554868] [95175] [186113]
IDAYears since IDAs available -157138 273132 -31199 232677
[127507] [234935] [35112] [119981]+EITC and Minimum Wage
State EITC ($100) -178564 93694 -25277 63584[140591] [298133] [52703] [71747]
Percentage of state EITC refundable (0-1) 498854 -1650928 197228 433134[1370837] [1941355] [447923] [484404]
State minimum wage for FLSA covered categories ($) -336495 2999611 165254 900510[605204] [1494072]+ [340985] [527808]+
State minimum wage for non-FLSA categories ($) -165479 922522 75745 60509[303291] [738619] [106221] [361086]
Sample Size 12496 60524 12507 60536
Note and + indicate statistical significance at the 1 5 and 10 percent levels respectively Standard errors in brackets All regressions weighted and include state and year fixed effects and all the same control variables shown in tables 6-8 All dollar values are in year 2000 dollars Standard errors adjusted for clustering by state Sample sizes vary because top and bottom three percentiles of net worth are dropped
XI APPENDIX PROGRAM RULES DATA DOCUMENTATION
42
General Notes Our analysis uses yearly program rule data Since AFDCTANF and Food Stamp Program variables are available on a monthly basis we use the July values of those variables for the entire year State IDA data come from annual sources
AFDCTANF Rules 1 Unrestricted Asset Limit for Recipients
Sources Welfare Rules Database (WRD) Transfer Income Model (TRIM3) ldquoRules of Simulated Programsrdquo
httptrimurbanorgT3Welcomephp Assumptions
bull One adult and two children in family bull If the asset limit is broken down by liquid and illiquid asset limits liquid asset
limit will be chosen bull Unit does not include anyone age 60 or over bull Recipient has signed a self-sufficiency pact (Missouri only) bull Recipient cooperates with case plan (Oregon JOBSJOBS Plus only) bull No limit = highest capped value in a given year
2 Vehicle Asset Limit for Recipients At Least One Vehicle Exempt
Sources Welfare Rules Database (WRD) and Urban Institute databases First Annual TANF Report to Congress (August 1998) ldquoSpecific Provisions of
State Programsrdquo Values 01 (noyes)
3 Restricted Account Asset Limit for Recipients
Sources Welfare Rules Database (WRD) Assumptions
bull One adult and two children in family bull New Mexico (1999-2003) does not restrict amounts saved for postsecondary
education or business capitalization but caps the amount being saved for a home purchase We code this as no limit on restricted assets
bull Amounts listed as variable or determined by counties are treated as missing for Colorado (1999-2003) and Florida (2002-2003)
bull Wisconsin (2003) refers only to WISCAP IDA program the only one of three IDA programs for which data were available
bull No limit = highest capped value in a given year 4 Maximum Monthly Benefit for Family of Three
Sources Welfare Rules Database (WRD)
43
Transfer Income Model (TRIM3) ldquoRules of Simulated Programsrdquo httptrimurbanorgT3Welcomephp
Assumption One adult and two children in family Note Values come from TRIM3 (1986-1995) and the WRD (1996-2000)
Food Stamp Program Rules 1 FSP Vehicle Asset Limit At Least One Vehicle Exempt
Sources Center on Budget and Policy Priorities (2001-2005) FNS State Options Reports1 FNS waiver documentation
Values 01 (noyes) Assumptions
bull Ignores special provisions for vehicles used to earn a living (for example taxicabs and delivery trucks)
bull Monthly data January 1996-June 2001 October 2001 February 2002 February 2003 January 2004 January 1996-September 2001 (Connecticut) February 1996-December 2003 (Montana) Missing values filled in with data from closest month with nonmissing data
Notes An option to apply vehicle rules from TANF or other low-income programs if
they were more liberal than the standard FSP rules was extended to all states as of July 2001 On the basis of waiver documentation three states are coded as exempting one vehicle per unit before then Connecticut (January 1996 through September 2001) Michigan (January 1996 through September 1999) and Montana (February 1996 through December 2003) All other states are coded as zero for January 1996 through June 2001
2 Expanded Categorical Eligibility
Sources FNS State Options Reports Federal Register (2000) FNS ldquoLetter to Regions on Categorical Eligibilityrdquo (1999)
Values 01 (noyes) Assumptions
bull Monthly data January 1996-June 1999 April 2002 February 2003 October 2003 September 2004 Missing values filled in with data from closest month with nonmissing data
Notes all states coded as 0 January 1996-June 1999
1 FNS State Options reports refers to US Department of Agriculture 2002c 2003a 2003b and 2004b
44
State IDA Program Rules 1 Maximum Match Rate
Assumption
bull No IDA = 0 2 Maximum Savings Amount Qualified for Match
Notes Over entire participation period Assumption
bull No IDA = 0 bull No limit = highest capped value in a given year
3 Eligibility Beyond AFDCTANF Recipients
Values 01 (noyes) Assumption
bull No IDA = 0
Sources for all IDA variables CSD 2005 Survey on State IDA Programs CSDrsquos State IDA Policy Information (httpgwbwebwustleducsdpolicystateshtm) Welfare Rules Database (WRD) TANF Annual Report (1999-2004) Specific Provisions of State Program CFEDrsquos IDA directory from IDA network (httpwwwcfedorgfocusmparentid=31ampsiteid=374ampid=374)
Notes A state IDA program is defined as a saving program that (1) matches savings
when withdrawn for pre-defined purposes (2) is funded at least partially from state government (programs funded solely with private foundations are excluded) (3) is established through state legislation or administrative rule-making and (4) is actually implemented
Other Policies
1 State EITC
Sources David Neumark and William Wascher (June 2001) ldquoUsing the EITC to Help Poor Families New Evidence and a Comparison with the Minimum Wagerdquo National Tax Journal Vol 54 (2)
Nicholas Johnson (December 2001) Center on Budget and Policy Priorities ldquoA Hand Up How State Earned Income Tax Credits Help Working Families Escape Poverty in 2001rdquo httpwwwcbpporg12-27-01sfppdf
45
Nicholas Johnson Bob Zahradnik and Joseph Llobrera (April 2003) ) Center on Budget and Policy Priorities ldquoState Income Tax Burdens On Low-Income Families In 2002rdquo httpwwwcbpporg4-11-03sfphtm
Nicholas Johnson Joseph Llobrera and Bob Zahradnik (March 2003) Center on Budget and Policy Priorities ldquoA Hand Up How State Earned Income Tax Credits Help Working Families Escape Poverty in 2003rdquo httpwwwcbpporg3-3-03sfphtm
State of Minnesota (January 2000) ldquoThe Federal Earned Income Tax Credit and The Minnesota Working Family Creditrdquo
State of Minnesota (January 2004) ldquoThe Federal Earned Income Tax Credit and The Minnesota Working Family Creditrdquo
httparchivelegstatemnusdocs2004mandated040054pdf State of Minnesota (February 2006) ldquoThe Federal Earned Income Tax Credit and
The Minnesota Working Family Creditrdquo httpwwwhouselegstatemnushrdpubsfeicwfcpdf
State of Minnesota (1999) Working Family Credit for Tax Year 1998 httpwwwtaxesstatemnustaxesindividprior_years1998algorithmswfc2calcpdf
State of Minnesota (2000) Working Family Credit for Tax Year 1999 httpwwwtaxesstatemnustaxesindividprior_years1999algorithmswfcpdf
State of Minnesota (2001) Working Family Credit for Tax Year 2000 httpwwwtaxesstatemnustaxesindividprior_years2000algorithmswfcpdf
State of Minnesota (2002) Working Family Credit for Tax Year 2001 httpwwwtaxesstatemnusindividprior_years2001algorithmswfcalgopdf
State of Minnesota (2003) Working Family Credit for Tax Year 2002 httpwwwtaxesstatemnusindividprior_years2002algorithms wfcalgopdf
State of Minnesota (2004) Working Family Credit for Tax Year 2003 ttpwwwtaxesstatemnustaxesindividprior_years2003 algorithmswfc_formula_03pdf
Assumptions
bull Family of one adult and two or more qualifying children bull Maximum state EITC benefit (generally at end of phase-in range) bull Marylandrsquos EITC (1998-2003) is equal to the value of its non-refundable
EITC Notes Minnesotarsquos EITC (1999-2003) varies from other states as the state does not offer
a percentage of the Federal EITC Minnesota offers an EITC composed of varying percentages of earnings dependent on recipient income level
2 Percentage of State EITC Refundable
Sources David Neumark and William Wascher (June 2001) ldquoUsing the EITC to Help Poor Families New Evidence and a Comparison with the Minimum Wagerdquo National Tax Journal Vol 54 (2)
Nicholas Johnson (December 2001) Center on Budget and Policy Priorities ldquoA Hand Up How State Earned Income Tax Credits Help Working Families Escape Poverty in 2001rdquo
State of Minnesota (January 2000) ldquoThe Federal Earned Income Tax Credit and The Minnesota Working Family Creditrdquo
46
Assumptions
bull Maryland (1998-2000) has both a refundable and non-refundable EITC For these observations the variable is equal to the value of the refundable EITC divided by the value of the non-refundable EITC
3 Applicable Minimum Wage for Federally (FLSA) Covered Categories Sources US Department of Labor ldquoHistory of Federal Minimum Wage Ratesrdquo httpwwwdolgovesaminwagecharthtm
Richard Nelson (1985-2001) Monthly Labor Review Council of State Governments The Book of States Vols 27 28 30 31 33 Labor Commission of Utah ldquoMinimum Wagerdquo
httpwwwlaborstateutusUtah_Antidiscrimination___LaboEmployment_Standardsminwageminwagehtm
Jim Mosley (3 May 1990) St Louis Post-Dispatch ldquoState Minimum Wage To Take Effect Aug 28rdquo pg 8A
Larry Tye (2 April 1991) Boston Globe ldquoMinimum Wage Increases To $425rdquo pg 3
Notes This wage is the higher of the state or federal minimum wage In general it is the
minimum wage covering the majority of workers in a state for the majority of the month Although not all state minimum wages cover FLSA-covered occupations it is assumed that if a state has a higher minimum wage than the federal level that state minimum wage is effective for FLSA-covered workers (which was the case in 1999 and 2000)
4 State Minimum Wage for Non-FLSA Covered Categories Sources Richard Nelson (1985-2001) Monthly Labor Review Council of State Governments The Book of States Vols 27 28 30 31 33
Labor Commission of Utah ldquoMinimum Wagerdquo httpwwwlaborstateutusUtah_Antidiscrimination___LaboEmployment_Standardsminwageminwagehtm
Wage and Hour Administration of Alaska ldquoMinimum Wage Standard and Overtime Hoursrdquo httpwwwlaborstateakuslsswhacthtm
Industrial Welfare Commission of California ldquoSummary of Interim Wage Ordermdash2000rdquo httpwwwdircagovIwcSummaryInterimWageorder2000html
Connecticut General Assembly ldquoWagesrdquo httpwwwcgactgov2001pubChap558htm
Office of Labor Law Enforcement of Delaware ldquoMinimum Wagerdquo httpwwwdelcodestatedeustitle19c009indexhtm
Department of Employment Services of the District of Columbia ldquoMinimum Wagesrdquo httpwwwdoesdcgovdoescwpviewa1234q539346asp
State Legislature of Iowa ldquoIowa Code 2003 Section 91D1rdquo httpwwwlegisstateiausIACODE200391D1html
Massachusetts General Laws ldquoMinimum Fair Wagesrdquo httpwwwmassgovlegislawsmglgl-151-tochtm
State Legislature of Minnesota ldquoLabor Standards and Wagesrdquo httpwwwrevisorlegstatemnusstats177
47
New Hampshire General Court ldquoMinimum Wage Lawrdquo httpwwwgencourtstatenhusrsahtmlNHTOCNHTOC-XXIII-279htm
Jim Mosley (3 May 1990) St Louis Post-Dispatch ldquoState Minimum Wage To Take Effect Aug 28rdquo pg 8A
Larry Tye (2 April 1991) Boston Globe ldquoMinimum Wage Increases To $425rdquo pg 3
Assumptions
bull A state minimum wage at or below the federal minimum wage for the majority of a statersquos state-month observations from 1986-2003 is assumed to cover Non-FLSA workers in that state at all times Otherwise it is assumed to cover only FLSA workers in which case the Non-FLSA minimum wage is 0 This assumption is based on the similarities between the exceptions to state minimum wage coverage in states with a higher-than-federal minimum wage and the exceptions to FLSA minimum wage coverage
Notes The state minimum wage is often used to cover workers who are not covered by
the FLSA 28 percent of workers in 1999 In most states (82 percent of our state-month observations) the state minimum wage is less than or equal to the federal minimum wage suggesting non-FLSA coverage For some states with a state minimum wage higher than the federal minimum wage the higher wage covers FLSA workers only The FLSA does not cover most workers in small businesses or in businesses where no interstate commerce is involved workers in seasonal or recreational jobs workers delivering newspapers or engaged in fishing operations many workers in private households and executive administrative and professional employees
48
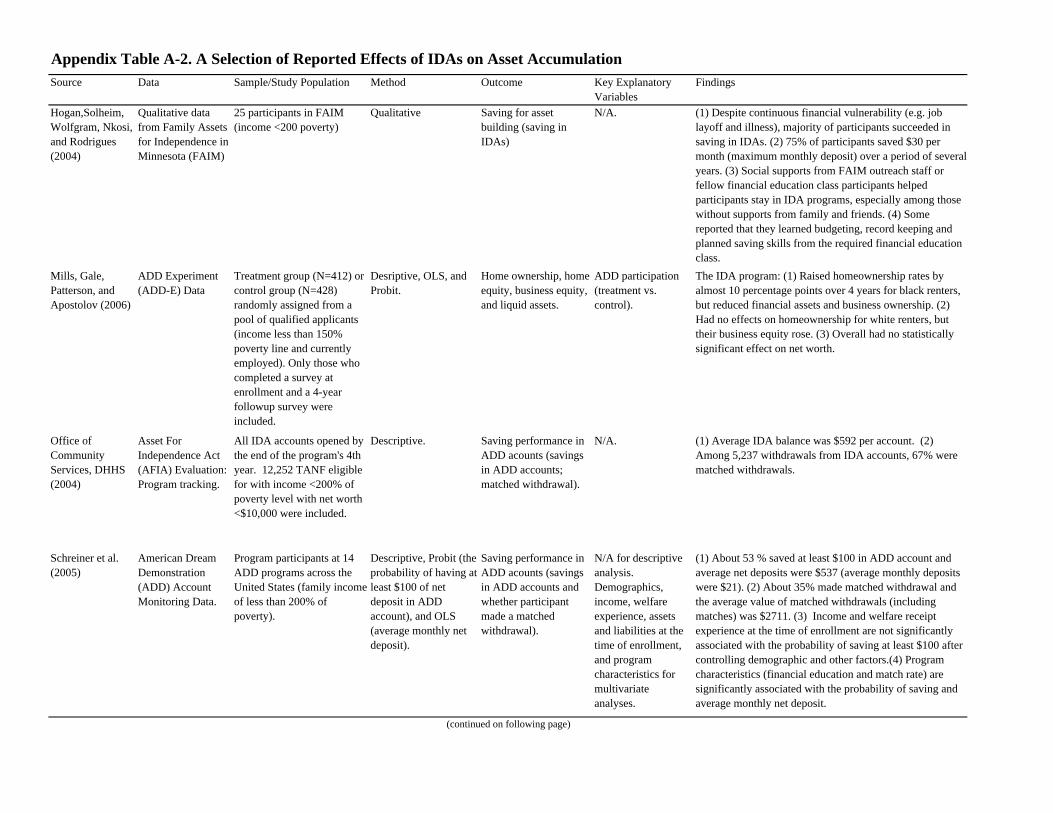
Source Data SampleStudy Population Method Outcome Key Explanatory Variables
Findings
Shobe and Christy-McMullin (2005)
Qualitative data from a North Carolina IDA program
9 low-income African American women
Qualitative Saving for asset building (saving in IDAs)
NA (1) Participants believed that IDAs gave low-income families opportunities for asset ownership taught savings and investments skills provided personalized supports and helped them solve their credit problems (2) A majority of interviewees reported that they saved extra beyond their IDA savings (maximum matchable savings=$1000)
Stegman and Faris (2005)
American Dream Demonstration (ADD) Account Monitoring Data and the Survey of Consumer Finances (SCF)
ADD program participants and SCF households with similar characteristics to ADD enrollees
Simulation (Compare actual savings in ADD accounts and predicted savings without ADD using estimaton based on the SCF sample
ADDs saving effect [(ADD balance - predicted annualized savings)years in ADD]
NA (1)The median ADD participant has saved $117 more than heshe would have saved without ADD participation under an assumption of no shuffling (no transferred funds to ADD accounts from other accounts) (2) ADDs saving effect is larger among whites ($ 257 in median) than Blacks ($56) and Hispanics ($175) (3) Under an assumption of 50 of shuffling (50 of savings in other accounts transferred to ADD accounts) the median saving effect of ADD is $40
Appendix Table A-2 - A Selection of Reported Effects of IDAs on Asset Accumulation (continued)
Appendix Table A-3 The Effect of the Number of Years since State Program Rules Implemented onLiquid Asset Holdings of Low-Education Single Mothers and Families Age 18ndash54 1991ndash2003 SIPP
Linear ProbabilityInd Liquid Assets gt 0
TobitLn (Liquid Assets)
Mothers Families Mothers Families
AFDCTANFYears since unrestricted limit gt $1000 0005 0006 0117 0072
[0005] [0003]+ [0065]+ [0021]Years since at least one vehicle exempted 0005 0003 0084 0027
[0005] [0003] [0057] [0019]Years since restricted account asset limits available 0002 0001 0004 0000
[0004] [0003] [0050] [0017]Ln (maximum monthly benefit for a family of 3) ($) 0025 -0040 -0459 -0455
[0085] [0096] [1391] [0431]Food Stamps
Years since at least one vehicle exempted -0002 -0002 -0088 -0050[0006] [0006] [0127] [0046]
Years since expanded categorical eligibility in place -0008 0001 -0197 0003[0012] [0006] [0153] [0050]
IDAYears since IDAs available -0001 0006 -0011 0077
[0006] [0002] [0069] [0023]EITC and Minimum Wage
State EITC ($100) -0008 -0001 -0101 -0011[0003] [0002] [0056]+ [0018]
Percentage of state EITC refundable (0-1) 0032 0014 0661 0126[0028] [0011] [0464] [0150]
State minimum wage for FLSA covered categories ($) 0002 0000 0215 0117[0025] [0015] [0308] [0103]
State minimum wage for non-FLSA categories ($) 0014 0004 0228 0057[0014] [0007] [0205] [0068]
Sample Size 16126 79946 15632 77552
Note and + indicate statistical significance at the 1 5 and 10 percent levels respectively Standard errors in brackets All regressions weighted and include state and year fixed effects and all the same control variables shown in tables 6-8 All dollar values are in year 2000 dollars Standard errors adjusted for clustering by state in linear probability models Sample size varies because Tobit models exclude observations in top 3 percentiles of liquid asset values
Appendix Table A-4 The Effect of the Number of Years since State Program Rules Implemented onVehicle Asset Holdings of Low-Education Single Mothers and Families Age 18ndash54 1991ndash2003 SIPP
Linear ProbabilityInd Owns Vehicle
TobitLn (Vehicle Equity)
Mothers Families Mothers Families
AFDCTANFYears since unrestricted limit gt $1000 0006 0001 0140 0009
[0005] [0002] [0071] [0020]Years since at least one vehicle exempted -0006 0001 -0080 -0039
[0005] [0002] [0063] [0018]Years since restricted account asset limits available -0006 0000 -0089 0010
[0005] [0002] [0054] [0016]Ln (maximum monthly benefit for a family of 3) ($) 0019 0035 -0150 0669
[0091] [0040] [1415] [0397]+Food Stamps
Years since at least one vehicle exempted 0007 -0008 0248 -0011[0008] [0003] [0140]+ [0043]
Years since expanded categorical eligibility in place 0001 0008 0161 0136[0008] [0006] [0163] [0047]
IDAYears since IDAs available 0008 0001 0088 0002
[0004]+ [0003] [0075] [0022]EITC and Minimum Wage
State EITC ($100) 0001 -0003 -0031 -0015[0004] [0002]+ [0065] [0018]
Percentage of state EITC refundable (0-1) -0029 -0009 0060 0076[0047] [0014] [0538] [0145]
State minimum wage for FLSA covered categories ($) 0020 0007 0322 0099[0027] [0008] [0341] [0098]
State minimum wage for non-FLSA categories ($) 0004 0000 -0032 -0019[0012] [0007] [0223] [0064]
Sample Size 16126 79946 15622 77551
Note and + indicate statistical significance at the 1 5 and 10 percent levels respectively Standard errors in brackets All regressions weighted and include state and year fixed effects and all the same control variables shown in tables 6-8 All dollar values are in year 2000 dollars Standard errors adjusted for clustering by state in linear probability models Sample size varies because Tobit models exclude observations in top 3 percentiles of vehicle equity values
Appendix Table A-5 The Effect of the Number of Years since State Program Rules Implemented on Net Worth of Low-Education Single Mothers and Families Age 18ndash54 1991ndash2003 SIPP
OLSNet Worth (Incl Home)
OLSNet Worth (Excl Home)
Mothers Families Mothers Families
AFDCTANFYears since unrestricted limit gt $1000 39415 -119859 -37755 -64708
[110132] [260957] [48927] [97772]Years since at least one vehicle exempted 56871 311429 -24583 -67465
[112276] [228548] [28883] [94778]Years since restricted account asset limits available -208872 -664437 -62127 -47318
[105423]+ [225764] [46375] [69909]Ln (maximum monthly benefit for a family of 3) ($) -1184869 3955821 -232479 -2005675
[2480576] [5904362] [647066] [2828470]Food Stamps
Years since at least one vehicle exempted -429264 -493249 18707 266732[241194]+ [488580] [59928] [130271]
Years since expanded categorical eligibility in place 18334 -334684 124412 -45878[255493] [554868] [95175] [186113]
IDAYears since IDAs available -157138 273132 -31199 232677
[127507] [234935] [35112] [119981]+EITC and Minimum Wage
State EITC ($100) -178564 93694 -25277 63584[140591] [298133] [52703] [71747]
Percentage of state EITC refundable (0-1) 498854 -1650928 197228 433134[1370837] [1941355] [447923] [484404]
State minimum wage for FLSA covered categories ($) -336495 2999611 165254 900510[605204] [1494072]+ [340985] [527808]+
State minimum wage for non-FLSA categories ($) -165479 922522 75745 60509[303291] [738619] [106221] [361086]
Sample Size 12496 60524 12507 60536
Note and + indicate statistical significance at the 1 5 and 10 percent levels respectively Standard errors in brackets All regressions weighted and include state and year fixed effects and all the same control variables shown in tables 6-8 All dollar values are in year 2000 dollars Standard errors adjusted for clustering by state Sample sizes vary because top and bottom three percentiles of net worth are dropped
XI APPENDIX PROGRAM RULES DATA DOCUMENTATION
42
General Notes Our analysis uses yearly program rule data Since AFDCTANF and Food Stamp Program variables are available on a monthly basis we use the July values of those variables for the entire year State IDA data come from annual sources
AFDCTANF Rules 1 Unrestricted Asset Limit for Recipients
Sources Welfare Rules Database (WRD) Transfer Income Model (TRIM3) ldquoRules of Simulated Programsrdquo
httptrimurbanorgT3Welcomephp Assumptions
bull One adult and two children in family bull If the asset limit is broken down by liquid and illiquid asset limits liquid asset
limit will be chosen bull Unit does not include anyone age 60 or over bull Recipient has signed a self-sufficiency pact (Missouri only) bull Recipient cooperates with case plan (Oregon JOBSJOBS Plus only) bull No limit = highest capped value in a given year
2 Vehicle Asset Limit for Recipients At Least One Vehicle Exempt
Sources Welfare Rules Database (WRD) and Urban Institute databases First Annual TANF Report to Congress (August 1998) ldquoSpecific Provisions of
State Programsrdquo Values 01 (noyes)
3 Restricted Account Asset Limit for Recipients
Sources Welfare Rules Database (WRD) Assumptions
bull One adult and two children in family bull New Mexico (1999-2003) does not restrict amounts saved for postsecondary
education or business capitalization but caps the amount being saved for a home purchase We code this as no limit on restricted assets
bull Amounts listed as variable or determined by counties are treated as missing for Colorado (1999-2003) and Florida (2002-2003)
bull Wisconsin (2003) refers only to WISCAP IDA program the only one of three IDA programs for which data were available
bull No limit = highest capped value in a given year 4 Maximum Monthly Benefit for Family of Three
Sources Welfare Rules Database (WRD)
43
Transfer Income Model (TRIM3) ldquoRules of Simulated Programsrdquo httptrimurbanorgT3Welcomephp
Assumption One adult and two children in family Note Values come from TRIM3 (1986-1995) and the WRD (1996-2000)
Food Stamp Program Rules 1 FSP Vehicle Asset Limit At Least One Vehicle Exempt
Sources Center on Budget and Policy Priorities (2001-2005) FNS State Options Reports1 FNS waiver documentation
Values 01 (noyes) Assumptions
bull Ignores special provisions for vehicles used to earn a living (for example taxicabs and delivery trucks)
bull Monthly data January 1996-June 2001 October 2001 February 2002 February 2003 January 2004 January 1996-September 2001 (Connecticut) February 1996-December 2003 (Montana) Missing values filled in with data from closest month with nonmissing data
Notes An option to apply vehicle rules from TANF or other low-income programs if
they were more liberal than the standard FSP rules was extended to all states as of July 2001 On the basis of waiver documentation three states are coded as exempting one vehicle per unit before then Connecticut (January 1996 through September 2001) Michigan (January 1996 through September 1999) and Montana (February 1996 through December 2003) All other states are coded as zero for January 1996 through June 2001
2 Expanded Categorical Eligibility
Sources FNS State Options Reports Federal Register (2000) FNS ldquoLetter to Regions on Categorical Eligibilityrdquo (1999)
Values 01 (noyes) Assumptions
bull Monthly data January 1996-June 1999 April 2002 February 2003 October 2003 September 2004 Missing values filled in with data from closest month with nonmissing data
Notes all states coded as 0 January 1996-June 1999
1 FNS State Options reports refers to US Department of Agriculture 2002c 2003a 2003b and 2004b
44
State IDA Program Rules 1 Maximum Match Rate
Assumption
bull No IDA = 0 2 Maximum Savings Amount Qualified for Match
Notes Over entire participation period Assumption
bull No IDA = 0 bull No limit = highest capped value in a given year
3 Eligibility Beyond AFDCTANF Recipients
Values 01 (noyes) Assumption
bull No IDA = 0
Sources for all IDA variables CSD 2005 Survey on State IDA Programs CSDrsquos State IDA Policy Information (httpgwbwebwustleducsdpolicystateshtm) Welfare Rules Database (WRD) TANF Annual Report (1999-2004) Specific Provisions of State Program CFEDrsquos IDA directory from IDA network (httpwwwcfedorgfocusmparentid=31ampsiteid=374ampid=374)
Notes A state IDA program is defined as a saving program that (1) matches savings
when withdrawn for pre-defined purposes (2) is funded at least partially from state government (programs funded solely with private foundations are excluded) (3) is established through state legislation or administrative rule-making and (4) is actually implemented
Other Policies
1 State EITC
Sources David Neumark and William Wascher (June 2001) ldquoUsing the EITC to Help Poor Families New Evidence and a Comparison with the Minimum Wagerdquo National Tax Journal Vol 54 (2)
Nicholas Johnson (December 2001) Center on Budget and Policy Priorities ldquoA Hand Up How State Earned Income Tax Credits Help Working Families Escape Poverty in 2001rdquo httpwwwcbpporg12-27-01sfppdf
45
Nicholas Johnson Bob Zahradnik and Joseph Llobrera (April 2003) ) Center on Budget and Policy Priorities ldquoState Income Tax Burdens On Low-Income Families In 2002rdquo httpwwwcbpporg4-11-03sfphtm
Nicholas Johnson Joseph Llobrera and Bob Zahradnik (March 2003) Center on Budget and Policy Priorities ldquoA Hand Up How State Earned Income Tax Credits Help Working Families Escape Poverty in 2003rdquo httpwwwcbpporg3-3-03sfphtm
State of Minnesota (January 2000) ldquoThe Federal Earned Income Tax Credit and The Minnesota Working Family Creditrdquo
State of Minnesota (January 2004) ldquoThe Federal Earned Income Tax Credit and The Minnesota Working Family Creditrdquo
httparchivelegstatemnusdocs2004mandated040054pdf State of Minnesota (February 2006) ldquoThe Federal Earned Income Tax Credit and
The Minnesota Working Family Creditrdquo httpwwwhouselegstatemnushrdpubsfeicwfcpdf
State of Minnesota (1999) Working Family Credit for Tax Year 1998 httpwwwtaxesstatemnustaxesindividprior_years1998algorithmswfc2calcpdf
State of Minnesota (2000) Working Family Credit for Tax Year 1999 httpwwwtaxesstatemnustaxesindividprior_years1999algorithmswfcpdf
State of Minnesota (2001) Working Family Credit for Tax Year 2000 httpwwwtaxesstatemnustaxesindividprior_years2000algorithmswfcpdf
State of Minnesota (2002) Working Family Credit for Tax Year 2001 httpwwwtaxesstatemnusindividprior_years2001algorithmswfcalgopdf
State of Minnesota (2003) Working Family Credit for Tax Year 2002 httpwwwtaxesstatemnusindividprior_years2002algorithms wfcalgopdf
State of Minnesota (2004) Working Family Credit for Tax Year 2003 ttpwwwtaxesstatemnustaxesindividprior_years2003 algorithmswfc_formula_03pdf
Assumptions
bull Family of one adult and two or more qualifying children bull Maximum state EITC benefit (generally at end of phase-in range) bull Marylandrsquos EITC (1998-2003) is equal to the value of its non-refundable
EITC Notes Minnesotarsquos EITC (1999-2003) varies from other states as the state does not offer
a percentage of the Federal EITC Minnesota offers an EITC composed of varying percentages of earnings dependent on recipient income level
2 Percentage of State EITC Refundable
Sources David Neumark and William Wascher (June 2001) ldquoUsing the EITC to Help Poor Families New Evidence and a Comparison with the Minimum Wagerdquo National Tax Journal Vol 54 (2)
Nicholas Johnson (December 2001) Center on Budget and Policy Priorities ldquoA Hand Up How State Earned Income Tax Credits Help Working Families Escape Poverty in 2001rdquo
State of Minnesota (January 2000) ldquoThe Federal Earned Income Tax Credit and The Minnesota Working Family Creditrdquo
46
Assumptions
bull Maryland (1998-2000) has both a refundable and non-refundable EITC For these observations the variable is equal to the value of the refundable EITC divided by the value of the non-refundable EITC
3 Applicable Minimum Wage for Federally (FLSA) Covered Categories Sources US Department of Labor ldquoHistory of Federal Minimum Wage Ratesrdquo httpwwwdolgovesaminwagecharthtm
Richard Nelson (1985-2001) Monthly Labor Review Council of State Governments The Book of States Vols 27 28 30 31 33 Labor Commission of Utah ldquoMinimum Wagerdquo
httpwwwlaborstateutusUtah_Antidiscrimination___LaboEmployment_Standardsminwageminwagehtm
Jim Mosley (3 May 1990) St Louis Post-Dispatch ldquoState Minimum Wage To Take Effect Aug 28rdquo pg 8A
Larry Tye (2 April 1991) Boston Globe ldquoMinimum Wage Increases To $425rdquo pg 3
Notes This wage is the higher of the state or federal minimum wage In general it is the
minimum wage covering the majority of workers in a state for the majority of the month Although not all state minimum wages cover FLSA-covered occupations it is assumed that if a state has a higher minimum wage than the federal level that state minimum wage is effective for FLSA-covered workers (which was the case in 1999 and 2000)
4 State Minimum Wage for Non-FLSA Covered Categories Sources Richard Nelson (1985-2001) Monthly Labor Review Council of State Governments The Book of States Vols 27 28 30 31 33
Labor Commission of Utah ldquoMinimum Wagerdquo httpwwwlaborstateutusUtah_Antidiscrimination___LaboEmployment_Standardsminwageminwagehtm
Wage and Hour Administration of Alaska ldquoMinimum Wage Standard and Overtime Hoursrdquo httpwwwlaborstateakuslsswhacthtm
Industrial Welfare Commission of California ldquoSummary of Interim Wage Ordermdash2000rdquo httpwwwdircagovIwcSummaryInterimWageorder2000html
Connecticut General Assembly ldquoWagesrdquo httpwwwcgactgov2001pubChap558htm
Office of Labor Law Enforcement of Delaware ldquoMinimum Wagerdquo httpwwwdelcodestatedeustitle19c009indexhtm
Department of Employment Services of the District of Columbia ldquoMinimum Wagesrdquo httpwwwdoesdcgovdoescwpviewa1234q539346asp
State Legislature of Iowa ldquoIowa Code 2003 Section 91D1rdquo httpwwwlegisstateiausIACODE200391D1html
Massachusetts General Laws ldquoMinimum Fair Wagesrdquo httpwwwmassgovlegislawsmglgl-151-tochtm
State Legislature of Minnesota ldquoLabor Standards and Wagesrdquo httpwwwrevisorlegstatemnusstats177
47
New Hampshire General Court ldquoMinimum Wage Lawrdquo httpwwwgencourtstatenhusrsahtmlNHTOCNHTOC-XXIII-279htm
Jim Mosley (3 May 1990) St Louis Post-Dispatch ldquoState Minimum Wage To Take Effect Aug 28rdquo pg 8A
Larry Tye (2 April 1991) Boston Globe ldquoMinimum Wage Increases To $425rdquo pg 3
Assumptions
bull A state minimum wage at or below the federal minimum wage for the majority of a statersquos state-month observations from 1986-2003 is assumed to cover Non-FLSA workers in that state at all times Otherwise it is assumed to cover only FLSA workers in which case the Non-FLSA minimum wage is 0 This assumption is based on the similarities between the exceptions to state minimum wage coverage in states with a higher-than-federal minimum wage and the exceptions to FLSA minimum wage coverage
Notes The state minimum wage is often used to cover workers who are not covered by
the FLSA 28 percent of workers in 1999 In most states (82 percent of our state-month observations) the state minimum wage is less than or equal to the federal minimum wage suggesting non-FLSA coverage For some states with a state minimum wage higher than the federal minimum wage the higher wage covers FLSA workers only The FLSA does not cover most workers in small businesses or in businesses where no interstate commerce is involved workers in seasonal or recreational jobs workers delivering newspapers or engaged in fishing operations many workers in private households and executive administrative and professional employees
48

Assumptions
bull Maryland (1998-2000) has both a refundable and non-refundable EITC For these observations the variable is equal to the value of the refundable EITC divided by the value of the non-refundable EITC
3 Applicable Minimum Wage for Federally (FLSA) Covered Categories Sources US Department of Labor ldquoHistory of Federal Minimum Wage Ratesrdquo httpwwwdolgovesaminwagecharthtm
Richard Nelson (1985-2001) Monthly Labor Review Council of State Governments The Book of States Vols 27 28 30 31 33 Labor Commission of Utah ldquoMinimum Wagerdquo
httpwwwlaborstateutusUtah_Antidiscrimination___LaboEmployment_Standardsminwageminwagehtm
Jim Mosley (3 May 1990) St Louis Post-Dispatch ldquoState Minimum Wage To Take Effect Aug 28rdquo pg 8A
Larry Tye (2 April 1991) Boston Globe ldquoMinimum Wage Increases To $425rdquo pg 3
Notes This wage is the higher of the state or federal minimum wage In general it is the
minimum wage covering the majority of workers in a state for the majority of the month Although not all state minimum wages cover FLSA-covered occupations it is assumed that if a state has a higher minimum wage than the federal level that state minimum wage is effective for FLSA-covered workers (which was the case in 1999 and 2000)
4 State Minimum Wage for Non-FLSA Covered Categories Sources Richard Nelson (1985-2001) Monthly Labor Review Council of State Governments The Book of States Vols 27 28 30 31 33
Labor Commission of Utah ldquoMinimum Wagerdquo httpwwwlaborstateutusUtah_Antidiscrimination___LaboEmployment_Standardsminwageminwagehtm
Wage and Hour Administration of Alaska ldquoMinimum Wage Standard and Overtime Hoursrdquo httpwwwlaborstateakuslsswhacthtm
Industrial Welfare Commission of California ldquoSummary of Interim Wage Ordermdash2000rdquo httpwwwdircagovIwcSummaryInterimWageorder2000html
Connecticut General Assembly ldquoWagesrdquo httpwwwcgactgov2001pubChap558htm
Office of Labor Law Enforcement of Delaware ldquoMinimum Wagerdquo httpwwwdelcodestatedeustitle19c009indexhtm
Department of Employment Services of the District of Columbia ldquoMinimum Wagesrdquo httpwwwdoesdcgovdoescwpviewa1234q539346asp
State Legislature of Iowa ldquoIowa Code 2003 Section 91D1rdquo httpwwwlegisstateiausIACODE200391D1html
Massachusetts General Laws ldquoMinimum Fair Wagesrdquo httpwwwmassgovlegislawsmglgl-151-tochtm
State Legislature of Minnesota ldquoLabor Standards and Wagesrdquo httpwwwrevisorlegstatemnusstats177
47
New Hampshire General Court ldquoMinimum Wage Lawrdquo httpwwwgencourtstatenhusrsahtmlNHTOCNHTOC-XXIII-279htm
Jim Mosley (3 May 1990) St Louis Post-Dispatch ldquoState Minimum Wage To Take Effect Aug 28rdquo pg 8A
Larry Tye (2 April 1991) Boston Globe ldquoMinimum Wage Increases To $425rdquo pg 3
Assumptions
bull A state minimum wage at or below the federal minimum wage for the majority of a statersquos state-month observations from 1986-2003 is assumed to cover Non-FLSA workers in that state at all times Otherwise it is assumed to cover only FLSA workers in which case the Non-FLSA minimum wage is 0 This assumption is based on the similarities between the exceptions to state minimum wage coverage in states with a higher-than-federal minimum wage and the exceptions to FLSA minimum wage coverage
Notes The state minimum wage is often used to cover workers who are not covered by
the FLSA 28 percent of workers in 1999 In most states (82 percent of our state-month observations) the state minimum wage is less than or equal to the federal minimum wage suggesting non-FLSA coverage For some states with a state minimum wage higher than the federal minimum wage the higher wage covers FLSA workers only The FLSA does not cover most workers in small businesses or in businesses where no interstate commerce is involved workers in seasonal or recreational jobs workers delivering newspapers or engaged in fishing operations many workers in private households and executive administrative and professional employees
48