1
ANU College of Engineering & Computer Science The effects of welding sequence on sheet metal assemblies By Adam Nagy-Sochacki * , STAMP Group, [email protected]. Supervisor: Mathew Doolan . 1 Introduction During the manufacturing process variations will occur that affect the accuracy of the final part; the acceptable limits for these variations of the part are specified as tolerances. When the parts are assembled together, the variations stack-up to form the final assembly variation. A variety of tolerance stacking techniques are used to combine the part tolerances to determine the final assembly tolerance; similarly, part tolerances can be determined based on the desired final assembly tolerance. However, these techniques only apply to rigid bodies. In 1980, Takezawa’s research showed that flexible or compliant parts, such as sheet metal panels, do not follow the traditional rigid body assembly rules. Moreover, part variations could be absorbed through the assembly process[1]. 1.1 Previous research Prior research investigated the influence of clamp sequences on the dimensional variation of a long slender profile[2]. It was found that the sequence should be selected that shifts the deviations from nominal outwards. This is an appropriate rule for structure that are similar in design; but it is not applicable to a loop structure, such as the window frame of a large closure panel, 1.2 Aim The aim of this work is to understand the influence of welding sequence on an idealised loop structure. This structure and process simulates the window frame and the subsequent welding process. 2 Procedure The procedure of this work is described by the following flow diagram. 4 Results and Discussion Below are two graphs that show the primary results of this study. The first illustrates the simulation data, along with a fitted curve. Each data set represents a different welding sequence for the 28 welds that exist around the inside of the frame. Based on this data, Monte Carlo simulations were performed; the results of which can be seen in figure 3 and 4, corresponding to different initial input distributions. 5 Future Work Developing on this work, further studies will be conducted to understand the relationship between the component design and assembly process. In particular, the rigidity of the components and the influence of clamp location, and clamp and weld sequence. For an assembly to satisfy all functional goals, localised areas may need to be within a desired specification. Consequently, the focus here will then be on controlling the variation that influences the functional characteristics of the assembly, rather than the overall shape. It is hoped that by further developing rules for clamp and weld sequencing, a more effective toolkit for the production engineer can be formulated. Ultimately, reducing dimensional variation during sheet metal assembly and allowing for quicker setup of production lines. 6 Acknowledgments This work is being conducted through Stamping Technologies in Automotive Manufacturing Processes (STAMP), a current collaboration between the Australian National University, Deakin University and Ford Motor Company Australia. Funding provided through ARC linkage. 7 References [1] Takezawa, N., 1980, “An improved Method for Establishing the Process wise Quality Standard,” Reports of Statistical and Applied Research. Japanese Union of Scientists and Engineers (JUSE), Vol. 27, No.3, September, pp. 63-76. [2] Matuszyk, T. 2008, “Shape Characterisation of Sheet Metal Assembly Variation with a view to Quality Assesment and Dimensional Control,” PhD Dissertation, The Australian National University. 4 Conclusion The welding sequence has shown to influence the resulting dimensional output of the loop structure. While this work illustrates just two sequences. It is evident that the selection of the most appropriate welding sequence depends on the initial input distribution of parts. Furthermore, localised part deformations can occur, despite an overall improvement to the components shape. * School of Engineering, College of Engineering & Computer Science, Australian National University School of Engineering, College of Engineering & Computer Science, Australian National University For the first simulation a normal input distribution, with a mean and standard deviation of 3 and 0.5 respectively, was generated. It can be seen in figure 3, that from the same input distribution, different final distributions exist when different sequences are used. For this input distribution, sequence 1 was able to provide a 10% reduction in the mean of the twisted assembly shape over sequence 2. Figure 5 & 6, show the final simulation results for each sequence when performed on a part with an initial three degrees of twist. Although sequence 1 provided a greater overall shape improvement; there was a greater amount of localised deformation in one the assembles structure corners. Figure 2, Twist mapping Figure 3, Monte Carlo simulation results , input (m=3, sd=0.5) Figure 1, Simulation procedure Figure 5, Sequence 1 shape deviation contour Figure 6, Sequence 2 shape deviation contour Figure 4, Monte Carlo simulation results, input (m=-1, sd=0.5) Conversely, a change in the input distribution, can also show sequence 2 to be the most beneficial sequence for selection. Although difficult to see in figure 4, this is the same percentage reduction as in the case above. However, comparing the two cases also showed that sequence 1 had the most beneficial impact on reducing variation in both instances, providing a minor decrease in the standard deviation for the new data.

The effects of welding sequence on sheet metal assembliesThe effects of welding sequence on sheet metal assemblies ... subsequent welding process. 2 Procedure The procedure of this

  • Upload
    others

  • View
    7

  • Download
    0

Embed Size (px)

Citation preview

ANU College ofEngineering & Computer Science

The effects of welding sequence on sheet metal assembliesBy Adam Nagy-Sochacki*, STAMP Group, [email protected]. Supervisor: Mathew Doolan†.

1 IntroductionDuring the manufacturing process variations will occur that affect the accuracy of the finalpart; the acceptable limits for these variations of the part are specified as tolerances.When the parts are assembled together, the variations stack-up to form the final assemblyvariation. A variety of tolerance stacking techniques are used to combine the parttolerances to determine the final assembly tolerance; similarly, part tolerances can bedetermined based on the desired final assembly tolerance. However, these techniquesonly apply to rigid bodies. In 1980, Takezawa’s research showed that flexible or compliantparts, such as sheet metal panels, do not follow the traditional rigid body assembly rules.Moreover, part variations could be absorbed through the assembly process[1].

1.1 Previous researchPrior research investigated the influence of clamp sequences on the dimensional variationof a long slender profile[2]. It was found that the sequence should be selected that shiftsthe deviations from nominal outwards. This is an appropriate rule for structure that aresimilar in design; but it is not applicable to a loop structure, such as the window frame of alarge closure panel,

1.2 AimThe aim of this work is to understand the influence of welding sequence on an idealisedloop structure. This structure and process simulates the window frame and thesubsequent welding process.

2 ProcedureThe procedure of this work is described by the following flow diagram.

4 Results and DiscussionBelow are two graphs that show the primary results of this study. The first illustrates thesimulation data, along with a fitted curve. Each data set represents a different weldingsequence for the 28 welds that exist around the inside of the frame. Based on this data,Monte Carlo simulations were performed; the results of which can be seen in figure 3 and4, corresponding to different initial input distributions.

5 Future WorkDeveloping on this work, further studies will be conducted to understand the relationshipbetween the component design and assembly process. In particular, the rigidity of thecomponents and the influence of clamp location, and clamp and weld sequence. For anassembly to satisfy all functional goals, localised areas may need to be within a desiredspecification. Consequently, the focus here will then be on controlling the variation thatinfluences the functional characteristics of the assembly, rather than the overall shape.

It is hoped that by further developing rules for clamp and weld sequencing, a moreeffective toolkit for the production engineer can be formulated. Ultimately, reducingdimensional variation during sheet metal assembly and allowing for quicker setup ofproduction lines.

6 AcknowledgmentsThis work is being conducted through Stamping Technologies in AutomotiveManufacturing Processes (STAMP), a current collaboration between the AustralianNational University, Deakin University and Ford Motor Company Australia. Fundingprovided through ARC linkage.

7 References[1] Takezawa, N., 1980, “An improved Method for Establishing the Process wise QualityStandard,” Reports of Statistical and Applied Research. Japanese Union of Scientistsand Engineers (JUSE), Vol. 27, No.3, September, pp. 63-76.

[2] Matuszyk, T. 2008, “Shape Characterisation of Sheet Metal Assembly Variation with aview to Quality Assesment and Dimensional Control,” PhD Dissertation, The AustralianNational University.

4 ConclusionThe welding sequence has shown toinfluence the resulting dimensional outputof the loop structure. While this workillustrates just two sequences. It is evidentthat the selection of the most appropriatewelding sequence depends on the initialinput distribution of parts. Furthermore,localised part deformations can occur,despite an overall improvement to thecomponents shape.

* School of Engineering, College of Engineering & Computer Science, Australian National University† School of Engineering, College of Engineering & Computer Science, Australian National University

For the first simulation a normal input distribution, with a mean and standard deviation of3 and 0.5 respectively, was generated. It can be seen in figure 3, that from the same inputdistribution, different final distributions exist when different sequences are used. For thisinput distribution, sequence 1 was able to provide a 10% reduction in the mean of thetwisted assembly shape over sequence 2.

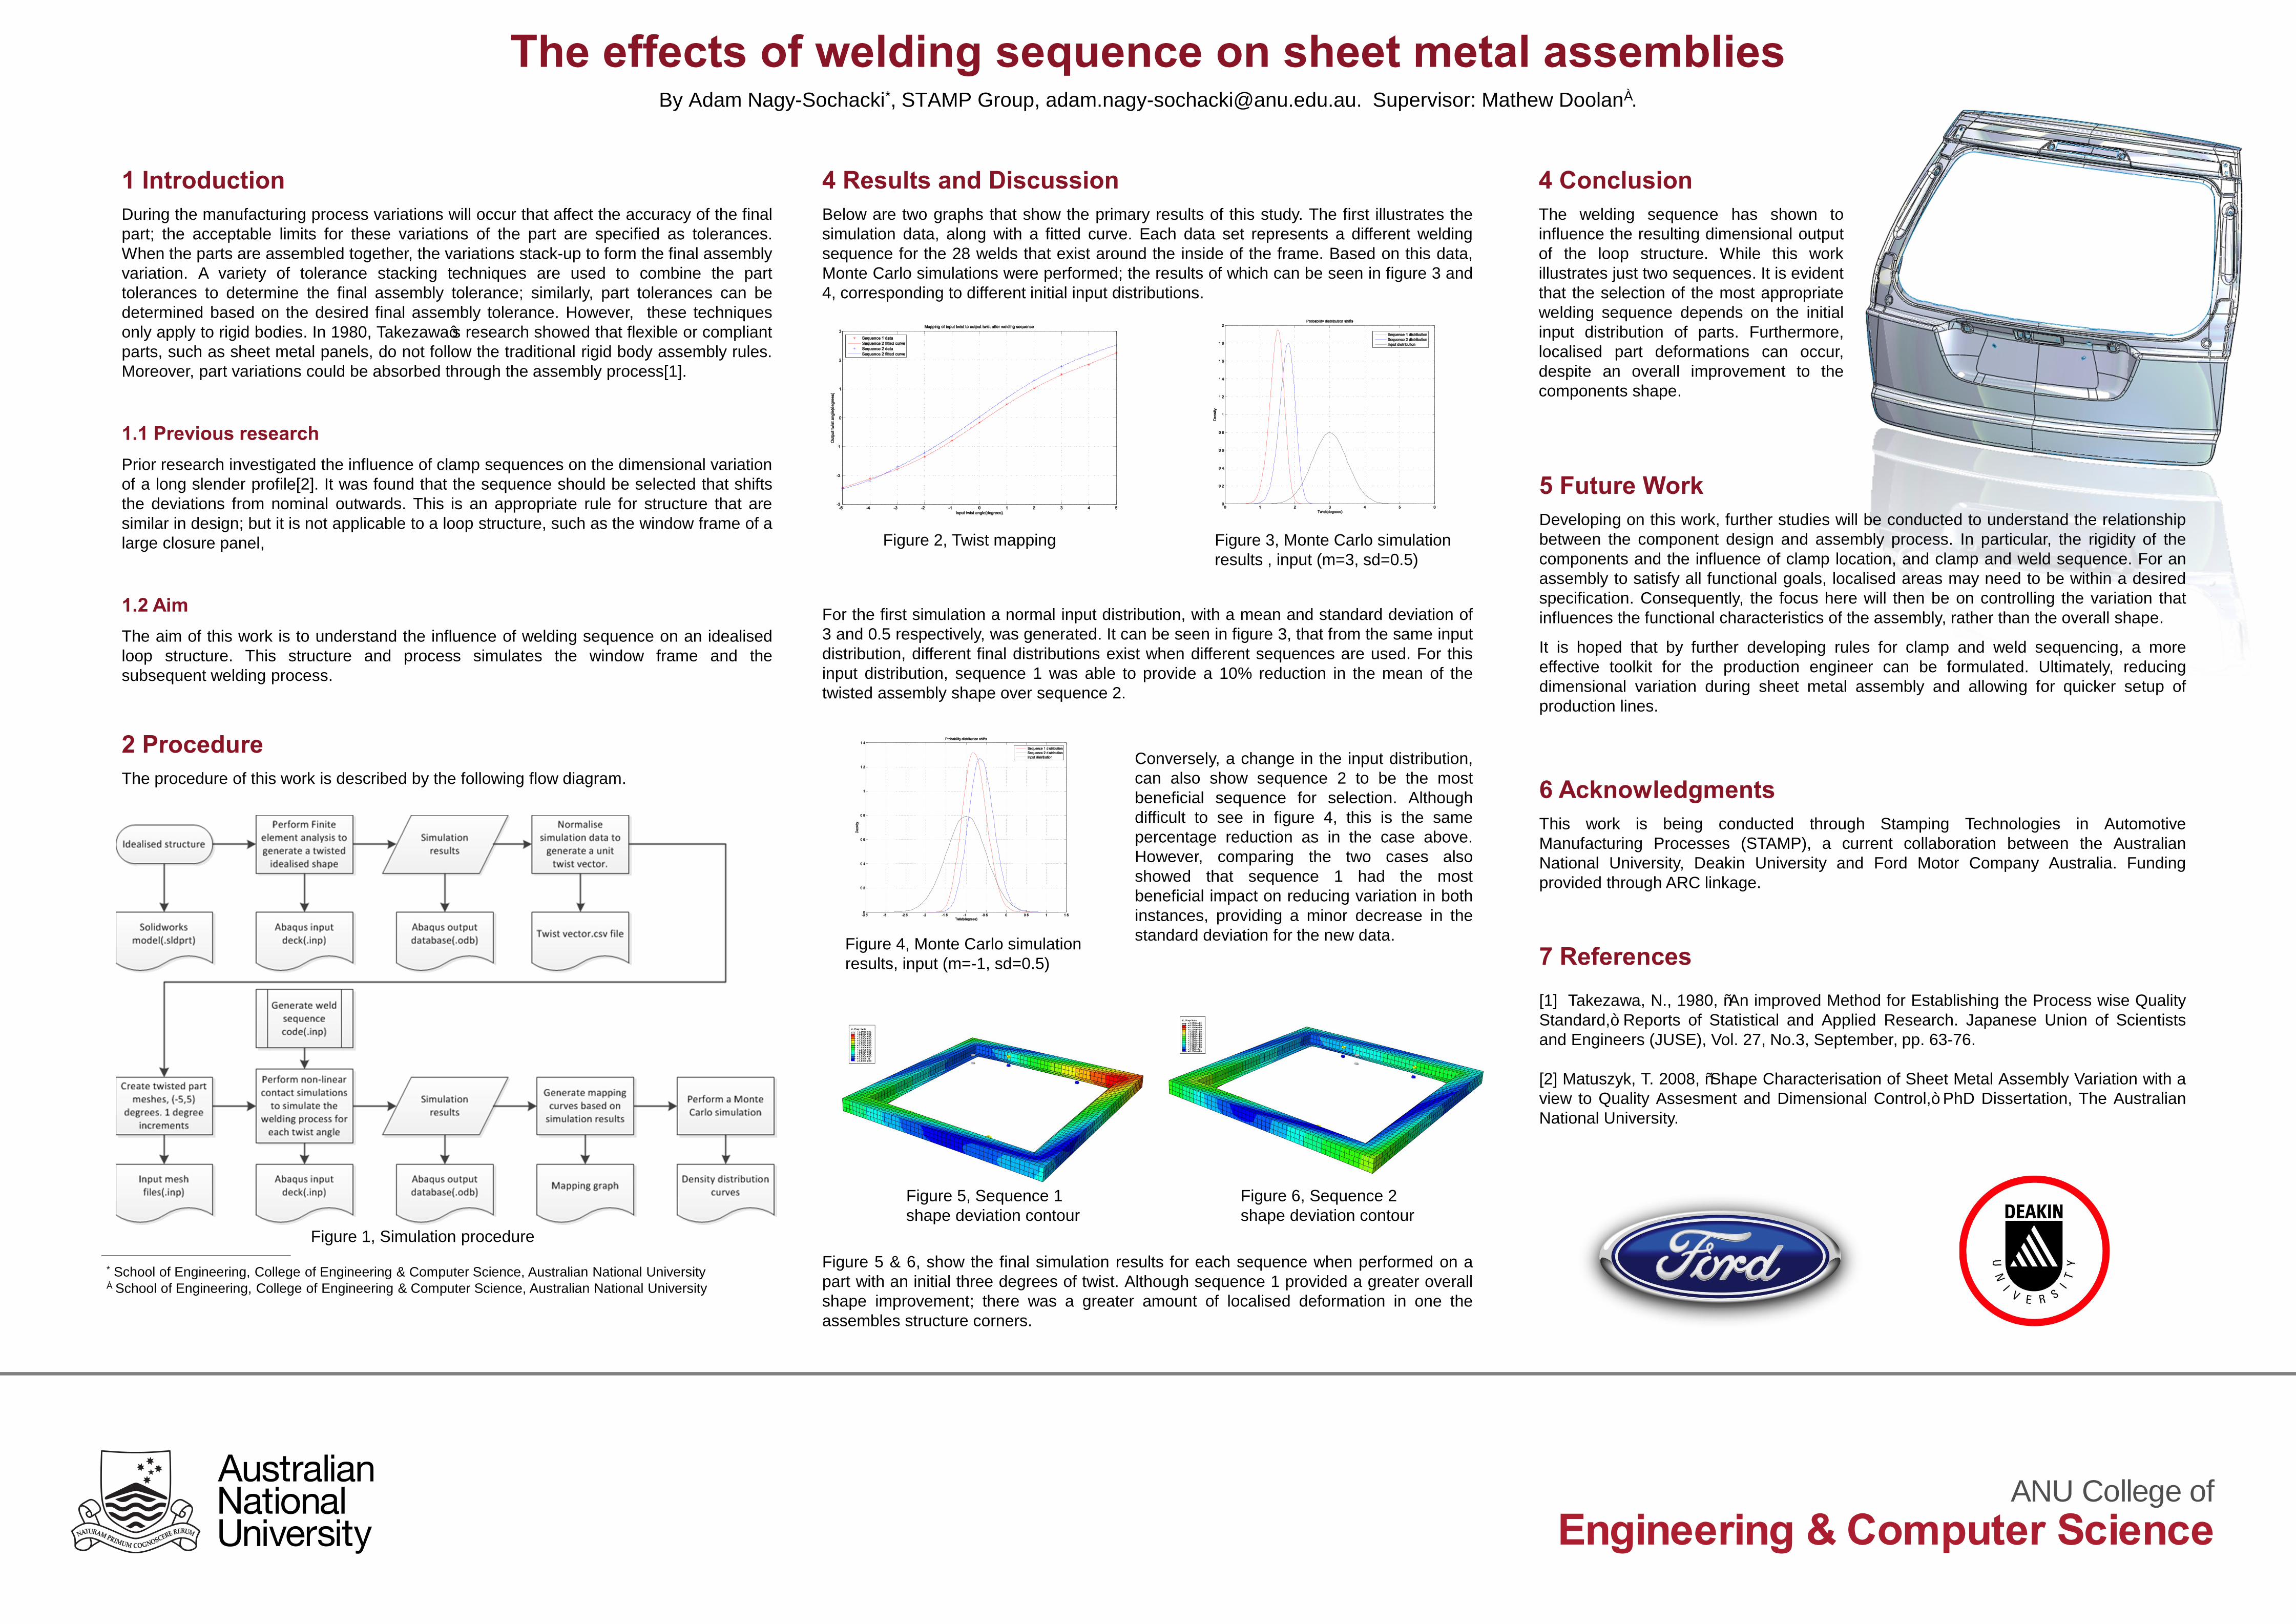
Figure 5 & 6, show the final simulation results for each sequence when performed on apart with an initial three degrees of twist. Although sequence 1 provided a greater overallshape improvement; there was a greater amount of localised deformation in one theassembles structure corners.

Figure 2, Twist mapping Figure 3, Monte Carlo simulation results , input (m=3, sd=0.5)

Figure 1, Simulation procedure

Figure 5, Sequence 1 shape deviation contour

Figure 6, Sequence 2 shape deviation contour

Figure 4, Monte Carlo simulation results, input (m=-1, sd=0.5)

Conversely, a change in the input distribution,can also show sequence 2 to be the mostbeneficial sequence for selection. Althoughdifficult to see in figure 4, this is the samepercentage reduction as in the case above.However, comparing the two cases alsoshowed that sequence 1 had the mostbeneficial impact on reducing variation in bothinstances, providing a minor decrease in thestandard deviation for the new data.