Embed Size (px)
Citation preview
The effects of visual complexity for Japanese kanjiprocessing with high and low frequencies
Katsuo Tamaoka · Sachiko Kiyama
Published online: 22 March 2012
© Springer Science+Business Media B.V. 2012
Abstract The present study investigated the effects of visual complexity for kanji
processing by selecting target kanji from different stroke ranges of visually simple
(2–6 strokes), medium (8–12 strokes), and complex (14–20 strokes) kanji with high
and low frequencies. A kanji lexical decision task in Experiment 1 and a kanji
naming task in Experiment 2 were administered to native Japanese speakers. Results
of both experiments showed that visual complexity inhibited the processing of low-
frequency kanji, whereas such consistent, inhibitory effects of visual complexity
were not observed in the processing of high-frequency kanji. Kanji with medium
complexity were processed faster than simple and complex kanji in high frequency.
Keywords Japanese kanji · Kanji frequency · Strokes · 13th stroke boundary ·
Visual complexity
Introduction
Unlike English which uses a sequence of simple alphabetic characters, Japanese
kanji vary in complexity from simple like the kanji 王 (king) to complex like the
kanji題 (title). The visual complexity of kanji seems to affect speed and accuracy of
their processing. However, the facilitation/inhibition direction of effects regarding
visual complexity on cognitive processing of kanji is not clear. For many years of
kanji experiments, visual complexity has been treated as one characteristic of kanji
which ought to be controlled prior to running experiments without knowing its
K. Tamaoka (&) · S. Kiyama
Graduate School of Languages and Cultures, Nagoya University, Furo-cho, Chikusa-ku,
Nagoya-shi, Aichi-ken 464-8601, Japan
e-mail: [email protected]; [email protected]
S. Kiyama
e-mail: [email protected]
123
Read Writ (2013) 26:205–223
DOI 10.1007/s11145-012-9363-x
actual effects (e.g., Hino & Lupker, 1998; Hino, Lupker, Ogawa, & Sears, 2003;
Ogawa & Saito, 2006; Tamaoka, 2005, 2007; Tamaoka & Hatsuzuka, 1998;
Tamaoka & Taft, 2010). The question, then, remains whether visual complexity
facilitates or inhibits kanji processing.
Three assumptions on kanji visual complexity
Visual complexity is fundamentally understood as the bottom-up processing from
simple visual features to a single kanji, further to a two-kanji compound, and finally
to access the meanings of kanji or compounds (e.g., Taft, 1991; Taft & Zhu, 1997;
Tamaoka & Hatsuzuka, 1998). There are three possible assumptions on the effects
of visual complexity.
The first assumption is that visual complexity facilitates kanji processing. An
early kanji study by Kawai (1966) measured kanji visual complexity by counting
lines and points. For instance, a kanji 二 (two) is counted as 2, consisting of two
lines, while a kanji 人 (human) is counted as 3 having two lines and one crossing
point. Using this measuring approach, Kawai found a high correlation of r = .76
(n = 50, p \ .001) between kanji printed-frequency (hear after, kanji frequency)
and visual complexity among 50 kanji randomly selected from a list of 1,965. The
same 50 kanji, however, showed an even higher correlation of r = .93 (n = 50,
p \ .001) between kanji frequency and traditional stroke numbers (the way in
which kanji are drawn by a Japanese traditional writing brush). Despite Kawai’s
efforts, stroke count had a stronger correlation with kanji frequency than the line-
and-point measure. Furthermore, Kawai tested accuracy of kanji pronunciations
among 80 mature native Japanese speakers, and found that the more complex kanji
were read more accurately than the less complex ones when kanji frequency is held
constant. Consequently, Kawai (1966) concluded that visual complexity facilitated
kanji processing from orthography to phonology.
The second assumption is that the difficulty of kanji processing increases up to a
certain point of visual complexity while it decreases after the critical point. As
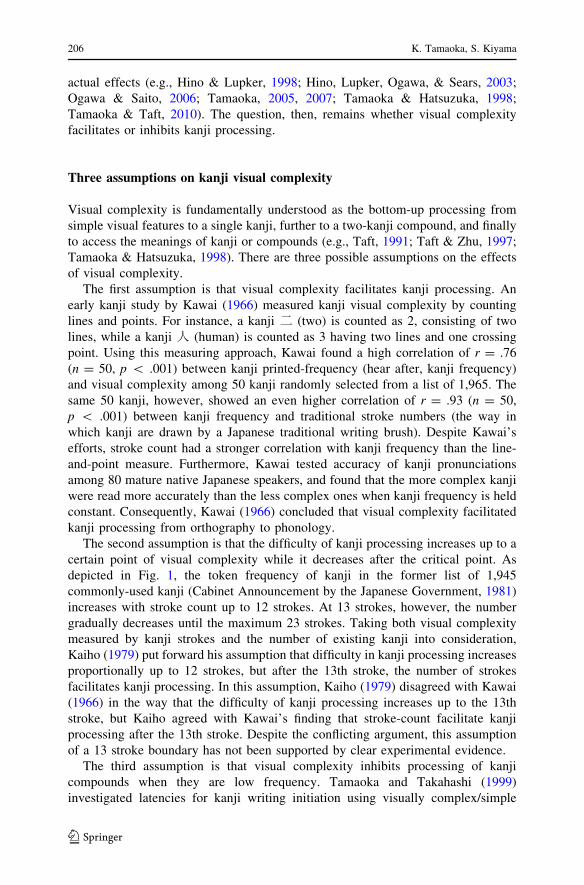
depicted in Fig. 1, the token frequency of kanji in the former list of 1,945
commonly-used kanji (Cabinet Announcement by the Japanese Government, 1981)
increases with stroke count up to 12 strokes. At 13 strokes, however, the number
gradually decreases until the maximum 23 strokes. Taking both visual complexity
measured by kanji strokes and the number of existing kanji into consideration,
Kaiho (1979) put forward his assumption that difficulty in kanji processing increases
proportionally up to 12 strokes, but after the 13th stroke, the number of strokes
facilitates kanji processing. In this assumption, Kaiho (1979) disagreed with Kawai
(1966) in the way that the difficulty of kanji processing increases up to the 13th
stroke, but Kaiho agreed with Kawai’s finding that stroke-count facilitate kanji
processing after the 13th stroke. Despite the conflicting argument, this assumption
of a 13 stroke boundary has not been supported by clear experimental evidence.
The third assumption is that visual complexity inhibits processing of kanji
compounds when they are low frequency. Tamaoka and Takahashi (1999)
investigated latencies for kanji writing initiation using visually complex/simple
206 K. Tamaoka, S. Kiyama
123
two-kanji compoundwords with high and low frequencies. Initiation times for writing
behavior indicated kanji visual complexity (number of strokes) inhibited retrieving
orthographic representations of two kanji from the mental lexicon when stimuli were
low frequency. This tendency was not observed in high frequency kanji. Likewise,
Leong, Cheng, and Mulcahy (1987) found that three major factors of simple/complex
orthography, high/low printed frequency, and skilled/less skilled reading ability
influence the processing of Chinese characters. Although Leong et al. (1987) used
Chinese characters, those with less visual complexity (i.e., simple orthography) were
processed faster than those with greater visual complexity (i.e., complex orthography)
regardless of printed-frequency and skilled/less skilled reading ability. Complex
characters with low frequency by less skilled readers were especially slow in
processing. As such, Leong et al. (1987) found inhibitory effects of visual complexity
on Chinese characters with high frequency as well as with low frequency.
It is well-depicted by various studies (e.g., Hino & Lupker, 1998; Tamaoka &
Hatsuzuka, 1995 for Japanese kanji, and Taft, Huang & Zhu, 1994; Taft & Zhu, 1995;
Wu, Chou, & Liu, 1994; Zhou & Marslen-Wilson, 1994 for Chinese characters) that
kanji frequency per se strongly affects kanji processing. However, neither the first
assumption of facilitation effects (Kawai, 1966) nor the second assumption of the 13th
stroke boundary (Kaiho, 1979) tookword frequency into consideration. Therefore, the
present study set high and low word frequencies up as an experimental condition to
investigate the effects of visual complexity on Japanese kanji processing.
The sense-determinative and sense-discriminative functionsfor kanji processing
The theoretical framework for the effects of visual complexity was put forward for
interpreting the processing of the Chinese characters from the linguistic perspective
by Wang (1973, 1981) and from the psycholinguistic perspective by Leong (1986).
0
20
40
60
80
100
120
140
160
180
200
220
1 2 3 4 5 6 7 8 9 10 11 12 13 14 15 16 17 18 19 20 21 22 23
Number of strokes
Simple
Medium
Complex
Num
ber
of k
anji
Fig. 1 Stroke distribution of the 1,945 commonly-used Japanese kanji
The effects of visual complexity 207
123
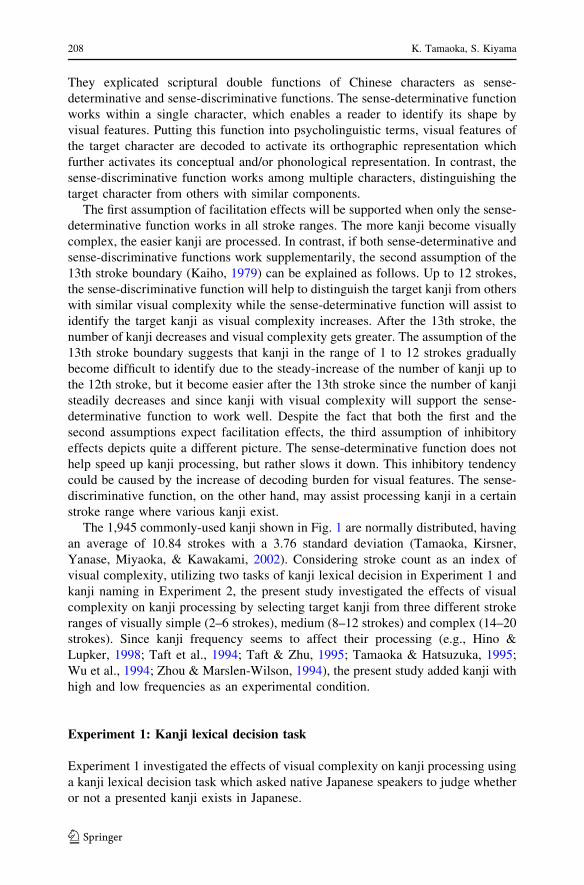
They explicated scriptural double functions of Chinese characters as sense-
determinative and sense-discriminative functions. The sense-determinative function
works within a single character, which enables a reader to identify its shape by
visual features. Putting this function into psycholinguistic terms, visual features of
the target character are decoded to activate its orthographic representation which
further activates its conceptual and/or phonological representation. In contrast, the
sense-discriminative function works among multiple characters, distinguishing the
target character from others with similar components.
The first assumption of facilitation effects will be supported when only the sense-
determinative function works in all stroke ranges. The more kanji become visually
complex, the easier kanji are processed. In contrast, if both sense-determinative and
sense-discriminative functions work supplementarily, the second assumption of the
13th stroke boundary (Kaiho, 1979) can be explained as follows. Up to 12 strokes,
the sense-discriminative function will help to distinguish the target kanji from others
with similar visual complexity while the sense-determinative function will assist to
identify the target kanji as visual complexity increases. After the 13th stroke, the
number of kanji decreases and visual complexity gets greater. The assumption of the
13th stroke boundary suggests that kanji in the range of 1 to 12 strokes gradually
become difficult to identify due to the steady-increase of the number of kanji up to
the 12th stroke, but it become easier after the 13th stroke since the number of kanji
steadily decreases and since kanji with visual complexity will support the sense-
determinative function to work well. Despite the fact that both the first and the
second assumptions expect facilitation effects, the third assumption of inhibitory
effects depicts quite a different picture. The sense-determinative function does not
help speed up kanji processing, but rather slows it down. This inhibitory tendency
could be caused by the increase of decoding burden for visual features. The sense-
discriminative function, on the other hand, may assist processing kanji in a certain
stroke range where various kanji exist.
The 1,945 commonly-used kanji shown in Fig. 1 are normally distributed, having
an average of 10.84 strokes with a 3.76 standard deviation (Tamaoka, Kirsner,
Yanase, Miyaoka, & Kawakami, 2002). Considering stroke count as an index of
visual complexity, utilizing two tasks of kanji lexical decision in Experiment 1 and
kanji naming in Experiment 2, the present study investigated the effects of visual
complexity on kanji processing by selecting target kanji from three different stroke
ranges of visually simple (2–6 strokes), medium (8–12 strokes) and complex (14–20
strokes). Since kanji frequency seems to affect their processing (e.g., Hino &
Lupker, 1998; Taft et al., 1994; Taft & Zhu, 1995; Tamaoka & Hatsuzuka, 1995;
Wu et al., 1994; Zhou & Marslen-Wilson, 1994), the present study added kanji with
high and low frequencies as an experimental condition.
Experiment 1: Kanji lexical decision task
Experiment 1 investigated the effects of visual complexity on kanji processing using
a kanji lexical decision task which asked native Japanese speakers to judge whether
or not a presented kanji exists in Japanese.
208 K. Tamaoka, S. Kiyama
123
Participants
Participants in Experiment 1 comprised 42 undergraduate and graduate students (22
females and 20 males) at Nagoya University in Japan, all native speakers of
Japanese. Ages ranged from 18 years and 7 months to 38 years and 9 months. The
average age was 21 years and 1 month with a standard deviation of 3 years and
8 months on the respective day of testing.
Kanji stimuli
As target stimuli, 24 kanji consisting of 12 high and 12 low printed-frequencies
were selected from each of three kanji stroke ranges of 2–6, 8–12, and 14–20
(72 kanji in total) out of the 1,945 commonly-used basic kanji taught from the first
to the ninth grades of formal schooling to assure that all the participants would be
acquainted with them. A lexical decision task (determining whether or not a kanji is
correct by pressing a ‘Yes’ or a ‘No’ key) was administered using these 72 target
kanji for correct ‘Yes’ responses with another 72 pseudo-kanji for correct ‘No’
responses. All stimuli are listed in “Appendix 1” for real kanji and “Appendix 2” for
pseudo-kanji.
As shown in Table 1, eight different features controlled 72 target kanji. The
experimental condition of visual complexity as measured by the number of kanji
strokes (#1 in Table 1) was controlled by selecting kanji from the three different
specific ranges. This feature showed a significant main effect of three visual
complexity groups of simple, medium, and complex [F(2, 69) = 368.907,
p \ .001]. Another experimental condition of high and low kanji frequency was
manipulated by three different indexes (#2–4). First, Kokuritsu Kokugo Kenkyujyo(National Institute for Japanese Language and Linguistics) in 1976 calculated kanji
frequencies of appearance for 1,000 kanji (#2) from three major newspapers, Asashi,Yomiuri, and Mainichi, during the year 1966, showing a significant difference
between two groups of high and low kanji frequencies [tL(35.683) = 8.926,
p\ .0011]. Second, Yokoyama, Sasahara, Nozaki, and Long (1998) published kanji
frequency data based on all the kanji in the Tokyo edition of the Asahi newspaperprinted in 1993 (#3), again showing a significant difference between high and low
kanji frequency groups [tL(36.009) = 8.771, p\ .001]. Third, CD-ROM versions of
the Tokyo edition of the Asahi newspaper in 1993 (#4) also showed a significant
difference between high and low kanji frequency groups [tL(36.009) = 8.357,
p \ .001]. Three different kanji frequency indexes showed a great difference in the
experimental condition of kanji frequency.
There were four control conditions (#5–#8). The school grade in which the target
kanji are taught was also taken into consideration. The assignment of the first 1,006
basic kanji to each school grade follows the Japanese language curriculum as
outlined by the Japanese Ministry of Education in 1989. Since the remaining
1 Levene’s test rejected a homogeneous variance assumption in two kanji high and low frequency groups,
so that a t test with no assumption of homogeneity of variance was used to analyze the data. This t test ismarked by L and hereafter the same.
The effects of visual complexity 209
123

939 basic kanji are taught in Grades 7–9; these are all recorded with the numeral ‘7’.
Using these figures, the averages of school grades were calculated (#5). Visual
complexity did not show a main effect [F(2, 69) = 0.480, p = .621, ns]. Thus, thethree visual complexity groups of target kanji have no differences among the grades
in which they are taught at school. In contrast, the difference between the high and
low kanji frequency groups showed a significant difference [tL(64.598) = 8.870,
p \ .001], indicating that high frequency kanji were taught at higher grades than
were low frequency kanji. Kanji assignment to the four levels of the former version
of the Japanese Language Proficiency Test (#6) was used to control three visual
complexity conditions, with no main effect apparent [F(2, 69) = 0.009, p = .991,
ns], but showing a significant difference between high and low frequency
[tL(52.900) = 9.410, p \ .001]. The number of kanji On- and Kun-reading
homophones (#7) was counted according to how many kanji out of the 1,945 basic
kanji shared the same sound (Tamaoka, Kirsner, Yanase, Miyaoka, & Kawakami,
2002). There was no significant main effect of visual complexity [F(2, 69) = 1.564,
p = .217, ns], and no significant difference between high and low frequency
[t(70) = 0.058, p = .954, ns.]. Radical frequency (#8) counted how many of the
1,945 basic kanji share the same radical (Tamaoka, et al., 2002). Again, no
significant main effect of visual complexity was found [F(2, 69) = 2.057, p = .136,
ns], and there was no significant difference between high and low frequency
[t(70) = 1.011, p = .315, ns.]. Overall, visual complexity was well-controlled in
these four kanji features. However, kanji frequency was associated with the other
features of school grade and the Japanese language proficiency (JLP) test level.
Basically, high frequency kanji were allocated at the earlier school grades and the
easier level of the JLP test.
Procedure
All real and pseudo kanji were randomly presented one-by-one to participants in the
center of a computer screen 600 ms after the appearance of an eye fixation point
marked by ‘*’. Stimulus randomization was operated with each participant, so that
Table 1 Features of kanji with visual complexity of simple, medium, and complex
# Kanji features Simple (n = 24) Medium (n = 24) Complex (n = 24)
M SD M SD M SD
1 Number of strokes 4.79 1.06 9.67 1.31 15.71 1.73
2 Kanji frequency in 1976 0.45 0.69 0.73 0.87 0.60 0.77
3 Kanji frequency in 1993 6,421 11,201 14,890 16,749 11,558 15,883
4 Kanji frequency in CD 1993 10,140 18,180 21,937 25,978 15,916 21,849
5 School grades 5.08 2.10 5.46 1.72 5.58 1.67
6 JLPT-test 1.63 0.71 1.61 0.72 1.64 0.66
7 Number of homophones 17.92 17.00 16.17 15.25 11.04 8.13
8 Radical frequency 25.75 30.29 40.83 34.38 43.25 32.39
M means, SD standard deviations
210 K. Tamaoka, S. Kiyama
123
each was presented with a different order of stimulus items. The participants were
instructed to respond as quickly and as accurately as possible in deciding whether or
not the kanji exists in Japanese, by pressing the ‘Yes’ or ‘No’ response key. After
the response, the participant pressed the space key to initiate the next presentation.
With an interval of 600 ms, the eye fixation point ‘*’ appeared for 600 ms, after
which a new kanji stimulus was shown to the participant. Participants repeated this
process until all the real kanji and pseudo kanji were presented in the font of MS
Gothic. Each response (i.e., reaction) time and its result of correct or incorrect were
automatically recorded by computer. Sixteen practice trials were given to
participants before the commencement of actual testing.
Analysis and results
Prior to the analysis of reaction times for both correct ‘Yes’ and ‘No’ responses,
extremes among kanji lexical decision times (responses slower than 300 ms or
longer than 3,000 ms) were recorded as missing values. Responses outside of 2.5
standard deviations at both high and low ranges were replaced by boundaries
indicated by 2.5 standard deviations from the individual means of participants in
each category. Only correct ‘Yes’ and ‘No’ responses were used for the analysis of
reaction times.
The means of correct ‘Yes’ reaction times and error rates for kanji lexical
decisions are reported in Table 2. The data were analyzed using a linear mixed
effects (LME) methodology (Baayen, 2008; Baayen, Davidson, & Bates, 2008). A
two-way 3 (visual complexity; simple, medium, or complex) 9 2 (kanji frequency;
high or low) ANOVA was conducted on reaction times. The main effects of visual
complexity [F(2, 141.261) = 31.546, p \ .001] and kanji frequency [F(1,1,368.486) = 307.566, p \ .001] were significant. Their interaction [F(2,3,065.211) = 60.381, p \ .001] was also significant.
Further analyseswere conducted on high and low kanji frequency separately. For kanji
with high frequency, a LME one-way ANOVA for visual complexity showed a
significant main effect [F(2, 1,578.199) = 6.324, p \ .01]. Multiple comparisons
by the LSD method showed the significances of medium (M = 482 ms) \ simple
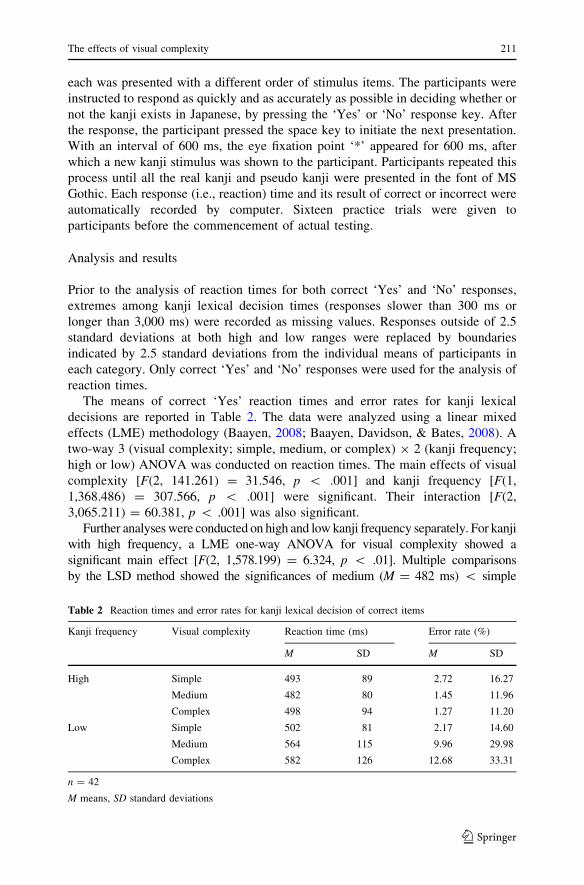
Table 2 Reaction times and error rates for kanji lexical decision of correct items
Kanji frequency Visual complexity Reaction time (ms) Error rate (%)
M SD M SD
High Simple 493 89 2.72 16.27
Medium 482 80 1.45 11.96
Complex 498 94 1.27 11.20
Low Simple 502 81 2.17 14.60
Medium 564 115 9.96 29.98
Complex 582 126 12.68 33.31
n = 42
M means, SD standard deviations
The effects of visual complexity 211
123
(M= 493ms)= complex (M= 498ms). Likewise, the same one-wayANOVA for kanji
with low frequency also showed the significant main effect [F(2, 2,235.100) = 58.945,
p \ .001]. Multiple comparisons by the LSD method indicated simple (M =
502 ms)\medium (M= 564ms)\ complex (M= 582 ms)]. Results of reaction times
are depicted in Fig. 2.
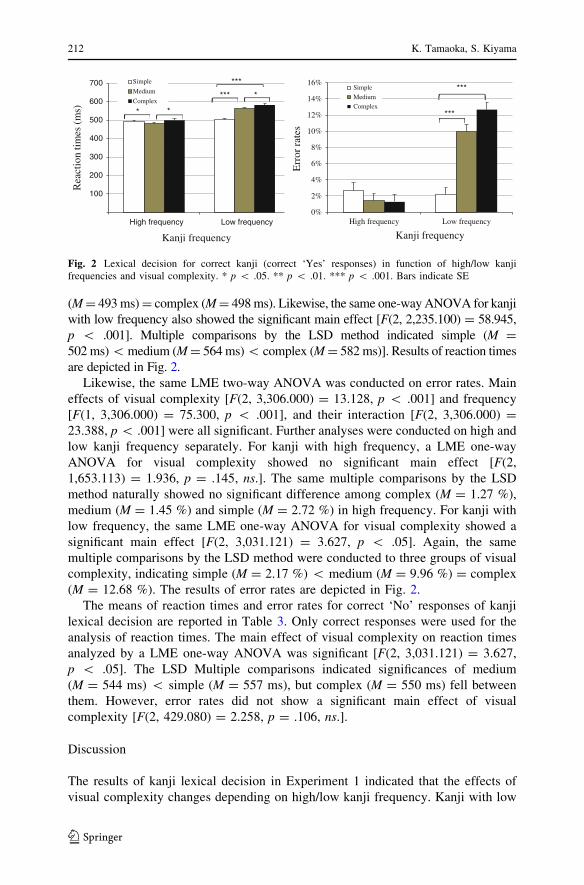
Likewise, the same LME two-way ANOVA was conducted on error rates. Main
effects of visual complexity [F(2, 3,306.000) = 13.128, p \ .001] and frequency
[F(1, 3,306.000) = 75.300, p \ .001], and their interaction [F(2, 3,306.000) =
23.388, p\ .001] were all significant. Further analyses were conducted on high and
low kanji frequency separately. For kanji with high frequency, a LME one-way
ANOVA for visual complexity showed no significant main effect [F(2,1,653.113) = 1.936, p = .145, ns.]. The same multiple comparisons by the LSD
method naturally showed no significant difference among complex (M = 1.27 %),
medium (M = 1.45 %) and simple (M = 2.72 %) in high frequency. For kanji with
low frequency, the same LME one-way ANOVA for visual complexity showed a
significant main effect [F(2, 3,031.121) = 3.627, p \ .05]. Again, the same
multiple comparisons by the LSD method were conducted to three groups of visual
complexity, indicating simple (M = 2.17 %) \ medium (M = 9.96 %) = complex
(M = 12.68 %). The results of error rates are depicted in Fig. 2.
The means of reaction times and error rates for correct ‘No’ responses of kanji
lexical decision are reported in Table 3. Only correct responses were used for the
analysis of reaction times. The main effect of visual complexity on reaction times
analyzed by a LME one-way ANOVA was significant [F(2, 3,031.121) = 3.627,
p \ .05]. The LSD Multiple comparisons indicated significances of medium
(M = 544 ms) \ simple (M = 557 ms), but complex (M = 550 ms) fell between
them. However, error rates did not show a significant main effect of visual
complexity [F(2, 429.080) = 2.258, p = .106, ns.].
Discussion
The results of kanji lexical decision in Experiment 1 indicated that the effects of
visual complexity changes depending on high/low kanji frequency. Kanji with low
100
200
300
400
500
600
700
High frequency Low frequency
Simple
Medium
Rea
ctio
n ti
mes
(m
s)
Kanji frequency
*
0%
2%
4%
6%
8%
10%
12%
14%
16%
High frequency Low frequency
Simple
Medium
Complex
Err
or r
ates
Kanji frequency
***
****
*
***
***Complex
Fig. 2 Lexical decision for correct kanji (correct ‘Yes’ responses) in function of high/low kanjifrequencies and visual complexity. * p \ .05. ** p \ .01. *** p \ .001. Bars indicate SE
212 K. Tamaoka, S. Kiyama
123
frequency showed a clear inhibitory trend from simple to complex in both reaction
times and error rates. Thus, Experiment 1 did not support the first assumption of
facilitation effects (Kawai, 1966). On the other hand, kanji with high frequency
showed a different trend. For the reaction time data, kanji with the medium range
from 8 to 12 strokes were faster to process than those with the simple and complex
stroke ranges. In contrast, the error rate data for kanji with low frequency showed a
flat trend from simple to complex. Despite the second assumption of inhibitory
effects in the medium range (Kaiho, 1979), the reversal prediction of facilitation
effects was observed in Experiment 1. The third assumption of inhibitory effects
proposed by Tamaoka and Takahashi (1999) and Leong et al. (1987) was supported
by reaction times and error rates of kanji with low frequency. However, as observed
by initiation latency times for writing behavior (Tamaoka & Takahashi, 1999), kanji
with high frequency showed a different trend from those with low frequency; kanji
in the medium range complexity were more quickly processed than simple and
complex ones.
Experiment 2: Kanji naming task
Experiment 2 investigated the effects of visual complexity on kanji processing using
a kanji naming task asking native Japanese speakers to pronounce kanji presented to
them.
Participants
Participants in Experiment 2 comprised 40 undergraduate and graduate students
(21 females and 19 males) at Nagoya University in Japan, all native speakers of
Japanese. Ages ranged from 18 years and 4 months to 34 years and 6 months. The
average age was 20 years and 11 months with a standard deviation of 3 years and
4 months on the respective day of testing.
Kanji stimuli
Since pseudo kanji cannot be pronounced, Experiment 2 used only the real kanji
(kanji items for correct ‘Yes’ responses) in Experiment 1.
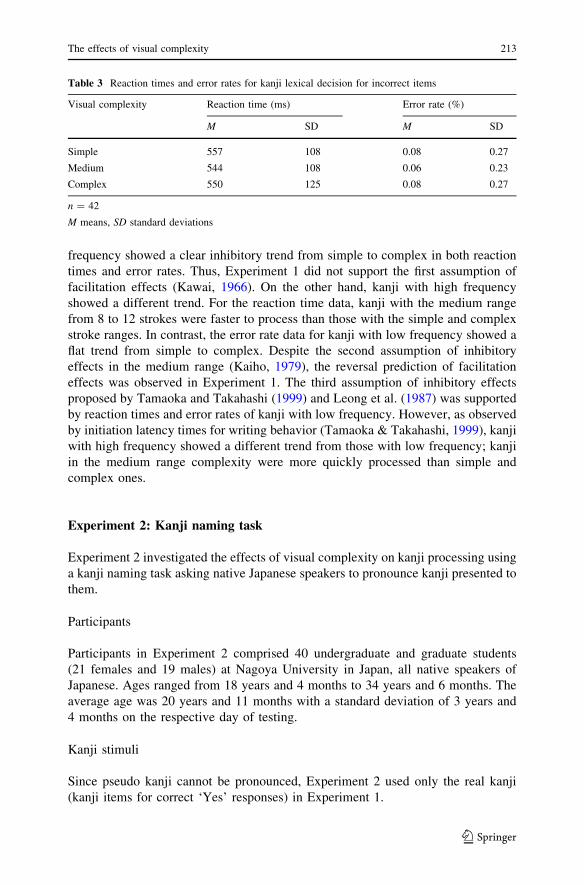
Table 3 Reaction times and error rates for kanji lexical decision for incorrect items
Visual complexity Reaction time (ms) Error rate (%)
M SD M SD
Simple 557 108 0.08 0.27
Medium 544 108 0.06 0.23
Complex 550 125 0.08 0.27
n = 42
M means, SD standard deviations
The effects of visual complexity 213
123
Procedure
Real kanji were randomly presented to participants in the center of a computer
screen 600 ms after the appearance of an eye fixation point marked by ‘*’. Stimulus
randomization was operated with each participant, so that each was presented with a
different order of stimulus items. Participants were instructed to pronounce the kanji
presented to them as quickly and as accurately as possible. After the response, an
experimenter pressed the space key to initiate the next presentation. With an interval
of 600 ms, the eye fixation point ‘*’ appeared for 600 ms, after which a new kanji
stimulus was shown to the participant. Participants repeated this process until all the
real kanji were presented. The naming latency of each kanji pronunciation was
recorded by computer, with correct or incorrect response results input by the
experimenter. Ten practice trials were given to participants before the commence-
ment of actual testing.
Analysis and results
Prior to the analysis of reaction times, extremes among kanji naming times
(responses slower than 300 ms or longer than 3,000 ms) were recorded as missing
values. Responses outside of 2.5 standard deviations at both high and low ranges
were replaced by boundaries indicated by 2.5 standard deviations from the
individual means of participants in each category. The means of correct naming
latencies and error rates was reported in Table 4. Only correct responses were used
for the analysis of reaction times.
The data were analyzed using a linear mixed effects methodology. A two-way, 3
(visual complexity; simple, medium, or complex) 9 2 (kanji frequency; high or low)
ANOVA was conducted on naming latencies for kanji naming. Both the main
effects of visual complexity [F(2, 318.527) = 7.633, p \ .001] and frequency [F(1,1,988.158) = 204.905, p \ .001] were significant. Their interaction [F(2,2,488.992) = 18.987, p \ .001] was also significant.
Further analyses were conducted on high and low kanji frequency separately. For
kanji with high frequency, a LME one-way ANOVA for visual complexity showed
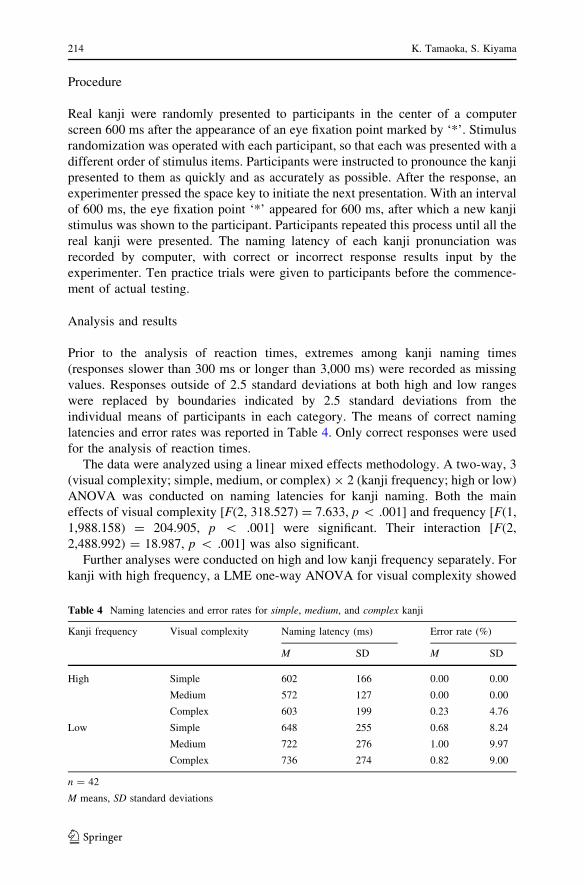
Table 4 Naming latencies and error rates for simple, medium, and complex kanji
Kanji frequency Visual complexity Naming latency (ms) Error rate (%)
M SD M SD
High Simple 602 166 0.00 0.00
Medium 572 127 0.00 0.00
Complex 603 199 0.23 4.76
Low Simple 648 255 0.68 8.24
Medium 722 276 1.00 9.97
Complex 736 274 0.82 9.00
n = 42
M means, SD standard deviations
214 K. Tamaoka, S. Kiyama
123
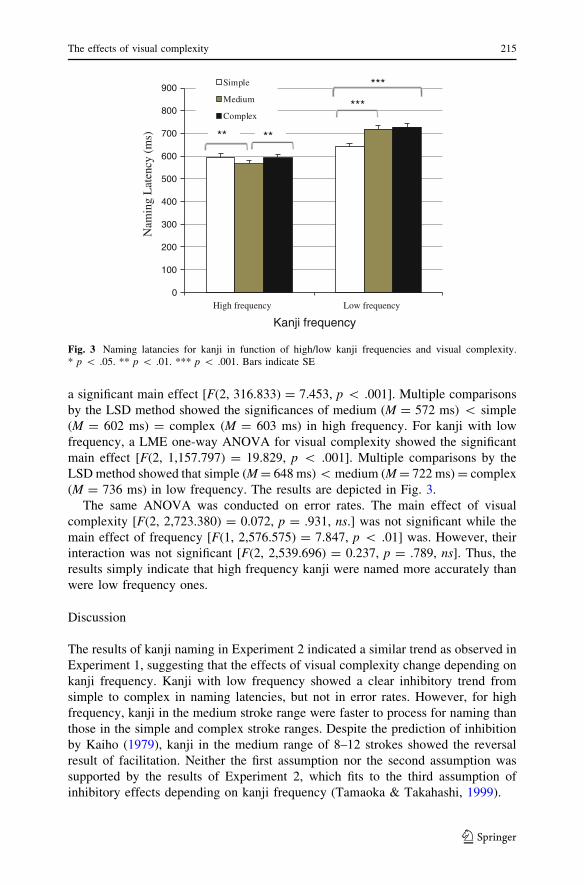
a significant main effect [F(2, 316.833) = 7.453, p \ .001]. Multiple comparisons
by the LSD method showed the significances of medium (M = 572 ms) \ simple
(M = 602 ms) = complex (M = 603 ms) in high frequency. For kanji with low
frequency, a LME one-way ANOVA for visual complexity showed the significant
main effect [F(2, 1,157.797) = 19.829, p \ .001]. Multiple comparisons by the
LSDmethod showed that simple (M= 648 ms)\medium (M= 722 ms)= complex
(M = 736 ms) in low frequency. The results are depicted in Fig. 3.
The same ANOVA was conducted on error rates. The main effect of visual
complexity [F(2, 2,723.380) = 0.072, p = .931, ns.] was not significant while the
main effect of frequency [F(1, 2,576.575) = 7.847, p \ .01] was. However, their
interaction was not significant [F(2, 2,539.696) = 0.237, p = .789, ns]. Thus, theresults simply indicate that high frequency kanji were named more accurately than
were low frequency ones.
Discussion
The results of kanji naming in Experiment 2 indicated a similar trend as observed in
Experiment 1, suggesting that the effects of visual complexity change depending on
kanji frequency. Kanji with low frequency showed a clear inhibitory trend from
simple to complex in naming latencies, but not in error rates. However, for high
frequency, kanji in the medium stroke range were faster to process for naming than
those in the simple and complex stroke ranges. Despite the prediction of inhibition
by Kaiho (1979), kanji in the medium range of 8–12 strokes showed the reversal
result of facilitation. Neither the first assumption nor the second assumption was
supported by the results of Experiment 2, which fits to the third assumption of
inhibitory effects depending on kanji frequency (Tamaoka & Takahashi, 1999).
0
100
200
300
400
500
600
700
800
900
High frequency Low frequency
Simple
Medium
Complex
Nam
ing
Lat
ency
(m
s)
Kanji frequency
** **
***
***
Fig. 3 Naming latancies for kanji in function of high/low kanji frequencies and visual complexity.* p \ .05. ** p \ .01. *** p \ .001. Bars indicate SE
The effects of visual complexity 215
123

General discussion
Without clarifying the effects of visual complexity, it is usually treated as one
characteristic of kanji which ought to be controlled prior to running experiments (e.g.,
Hino & Lupker, 1998; Hino et al., 2003; Ogawa& Saito, 2006; Tamaoka, 2005, 2007;
Tamaoka & Hatsuzuka, 1998; Tamaoka & Taft, 2010). The present study, therefore,
conducted two experiments of kanji lexical decision in Experiment 1 and kanji
naming in Experiment 2 on the kanji processing in function of simple/medium/
complex visual complexity and high/low frequency. As suggested by previous studies
(e.g., Hino & Lupker, 1998; Tamaoka & Hatsuzuka, 1995 for Japanese kanji, and and
Taft et al., 1994; Taft &Zhu, 1995;Wu et al., 1994; Zhou&Marslen-Wilson, 1994 for
Chinese characters), kanji frequency played a major function for kanji processing.
Similar to the findings of Tamaoka and Takahashi (1999) on the initiation times for
kanji writing behavior, the results of both experiments in the present study supported
the third assumption of visual complexity effects depending on kanji frequency.
Results of the present study related to the three assumptions
A clear incline was observed among kanji with low frequency. Visual complexity
affected speed and accuracy of kanji processing in the inhibitory direction; the
heavier its complexity becomes, the slower kanji is processed. The sense-
determinative function seems not to work well among kanji with low frequency;
rather, the present result among low frequency kanji is simply explained by the idea
that decoding from complex features takes longer than simpler ones. This clear
inhibitory trend from simple to complex was supported by the study on Chinese
characters by Leong et al. (1987) as well as Japanese kanji by Tamaoka and
Takahashi (1999). Thus, the results of the present study rejected the first assumption
of the linear facilitation trend of visual complexity proposed by Kawai (1966).
Kanji with high frequency showed that kanji in the medium complexity of the
8–12 stroke range were more quickly processed than those in the simple 2–6 and the
complex 14–20 stroke-range complexity. The 13th stroke boundary of the second
assumption (Kaiho, 1979) predicted the kanji in the medium stroke range to be
difficult to process due to the need to distinguish the target kanji from many other
kanji in the same stroke range, but after the 13th stroke, kanji processing becomes
easier with the help of the sense-determinative function generated by visually-
complex kanji features. However, despite this expectation, the present study among
kanji with high frequency indicated a different pattern: that is, kanji in the medium
range were processed faster than kanji in the simple range of below 6 strokes and
kanji in the complex range of over 14 strokes, but the ranges of simple and complex
did not differ from one another. Indeed, the 13th stroke boundary showed a clear
difference in processing of kanji with high frequency, but its trends of processing
speed indicated the opposite direction. As such, the results of the experiments
refuted the assumption of the 13th stroke boundary put forward by Kaiho (1979).
It is rather unanticipated that kanji of the medium stroke range with high
frequency were processed more quickly than the simple and the complex items with
216 K. Tamaoka, S. Kiyama
123
high frequency. The question rose what caused the discrepancy in the findings with
high-frequency kanji between the medium, and the simple/complex items.
The present study found no difference for kanji lexical decision and naming
between the simple and complex kanji in high frequency. Instead of an explanation
using the functions of sense-discrimination and sense-determination (Leong, 1986;
Wang, 1973, 1981), the straight-forward and simple explanation for this trend is that
frequently-used kanji are processed holistically as a whole single unit, which
eliminates the influence of kanji visual complexity. In contrast, kanji with low
frequency required bottom-up processing from small figures to kanji via construct-
ing units, resulting in inhibitory effects depending on visual complexity. Yet, the
question still remains why kanji with the medium 8–12 stroke range were processed
faster than simple and complex kanji in high frequency.
Explanation for the facilitation effects on processing of kanjiin the 8–12 medium range strokes
Although the results in the present study did not support Kaiho’s original 13th
stroke boundary, a distinct difference in kanji processing seems to be created around
this boundary. One of potential characteristics of kanji visual complexity in the
medium range influencing kanji processing could be a smaller unit which constructs
a whole kanji. Visual units of radicals are used for classifying kanji in a kanji
dictionary. In fact, radicals produce various kanji especially in the medium 8–12
stroke range. For example, a frequently-used radical 木 (tree) constructs 8 stroke
kanji of 板 (board), 杯 (cup) and 林 (grove), 9 stoke kanji of 柱 (post), 枯 (blight)
and 柿 (persimmon), 10 stroke kanji of 桜 (cherry blossom), 株 (stock), and 桃
(peach), 11 stroke kanji of 梓 (Japanese cherry birch), 梢 (treetop), and 梗 (hard
branch), and 12 stroke kanji of 検 (examine), 棟 (ridge) and 棒 (bar). In the present
study, both Experiments 1 and 2 indicated that kanji in the medium stroke range
facilitated processing.
Regarding kanji radicals, two possible frequencies may be related to kanji
processing. First, the radical (token) frequency indicates how often each radical
occurs in written materials. Second, radical neighborhood size refers to how
frequently a specific radical constructs kanji. If kanji in the medium stroke range are
likely to be characterized as those with high radical frequency and high
neighborhood size, it should be assumed that high radical frequency and high
radical neighborhood size should facilitate kanji processing according to the results
of the present study. Two studies on Chinese characters (Feldman & Siok, 1997;
Taft & Zhu, 1997), not Japanese kanji, indicated Chinese characters with lower
radical neighborhood size showed higher error rates and slower processing speed
than those with higher radical neighborhood size. Taft and Zhu (1997) explained
that in the case of high radical neighborhood size, a specific radical constructing a
target character received higher activations from multiple characters embedded in
the same radical, which strengthens the connection with the target character and
results in the facilitation effects. Although the experiments by Feldman and Siok
(1997) and Taft and Zhu (1997) were conducted on Chinese characters, they can
The effects of visual complexity 217
123
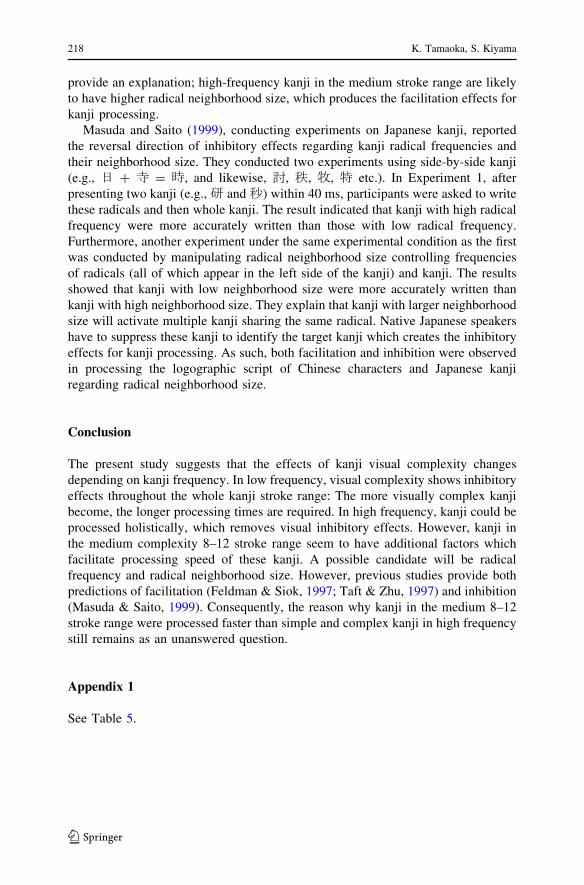
provide an explanation; high-frequency kanji in the medium stroke range are likely
to have higher radical neighborhood size, which produces the facilitation effects for
kanji processing.
Masuda and Saito (1999), conducting experiments on Japanese kanji, reported
the reversal direction of inhibitory effects regarding kanji radical frequencies and
their neighborhood size. They conducted two experiments using side-by-side kanji
(e.g., 日 + 寺 = 時, and likewise, 討, 秩, 牧, 特 etc.). In Experiment 1, after
presenting two kanji (e.g., 研 and 秒) within 40 ms, participants were asked to write
these radicals and then whole kanji. The result indicated that kanji with high radical
frequency were more accurately written than those with low radical frequency.
Furthermore, another experiment under the same experimental condition as the first
was conducted by manipulating radical neighborhood size controlling frequencies
of radicals (all of which appear in the left side of the kanji) and kanji. The results
showed that kanji with low neighborhood size were more accurately written than
kanji with high neighborhood size. They explain that kanji with larger neighborhood
size will activate multiple kanji sharing the same radical. Native Japanese speakers
have to suppress these kanji to identify the target kanji which creates the inhibitory
effects for kanji processing. As such, both facilitation and inhibition were observed
in processing the logographic script of Chinese characters and Japanese kanji
regarding radical neighborhood size.
Conclusion
The present study suggests that the effects of kanji visual complexity changes
depending on kanji frequency. In low frequency, visual complexity shows inhibitory
effects throughout the whole kanji stroke range: The more visually complex kanji
become, the longer processing times are required. In high frequency, kanji could be
processed holistically, which removes visual inhibitory effects. However, kanji in
the medium complexity 8–12 stroke range seem to have additional factors which
facilitate processing speed of these kanji. A possible candidate will be radical
frequency and radical neighborhood size. However, previous studies provide both
predictions of facilitation (Feldman & Siok, 1997; Taft & Zhu, 1997) and inhibition
(Masuda & Saito, 1999). Consequently, the reason why kanji in the medium 8–12
stroke range were processed faster than simple and complex kanji in high frequency
still remains as an unanswered question.
Appendix 1
See Table 5.
218 K. Tamaoka, S. Kiyama
123
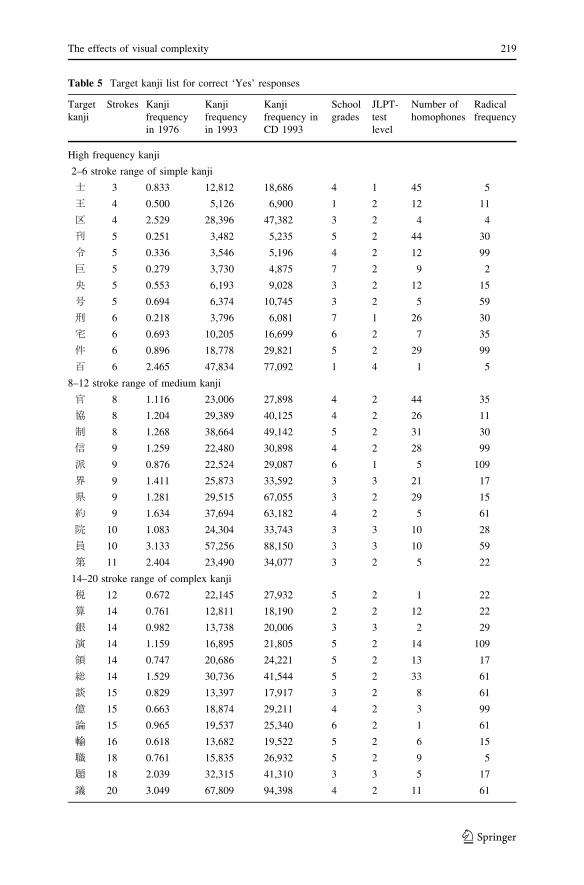
Table 5 Target kanji list for correct ‘Yes’ responses
Target
kanji
Strokes Kanji
frequency
in 1976
Kanji
frequency
in 1993
Kanji
frequency in
CD 1993
School
grades
JLPT-
test
level
Number of
homophones
Radical
frequency
High frequency kanji
2–6 stroke range of simple kanji
士 3 0.833 12,812 18,686 4 1 45 5
王 4 0.500 5,126 6,900 1 2 12 11
区 4 2.529 28,396 47,382 3 2 4 4
刊 5 0.251 3,482 5,235 5 2 44 30
令 5 0.336 3,546 5,196 4 2 12 99
巨 5 0.279 3,730 4,875 7 2 9 2
央 5 0.553 6,193 9,028 3 2 12 15
号 5 0.694 6,374 10,745 3 2 5 59
刑 6 0.218 3,796 6,081 7 1 26 30
宅 6 0.693 10,205 16,699 6 2 7 35
件 6 0.896 18,778 29,821 5 2 29 99
百 6 2.465 47,834 77,092 1 4 1 5
8–12 stroke range of medium kanji
官 8 1.116 23,006 27,898 4 2 44 35
協 8 1.204 29,389 40,125 4 2 26 11
制 8 1.268 38,664 49,142 5 2 31 30
信 9 1.259 22,480 30,898 4 2 28 99
派 9 0.876 22,524 29,087 6 1 5 109
界 9 1.411 25,873 33,592 3 3 21 17
県 9 1.281 29,515 67,055 3 2 29 15
約 9 1.634 37,694 63,182 4 2 5 61
院 10 1.083 24,304 33,743 3 3 10 28
員 10 3.133 57,256 88,150 3 3 10 59
第 11 2.404 23,490 34,077 3 2 5 22
14–20 stroke range of complex kanji
税 12 0.672 22,145 27,932 5 2 1 22
算 14 0.761 12,811 18,190 2 2 12 22
銀 14 0.982 13,738 20,006 3 3 2 29
演 14 1.159 16,895 21,805 5 2 14 109
領 14 0.747 20,686 24,221 5 2 13 17
総 14 1.529 30,736 41,544 5 2 33 61
談 15 0.829 13,397 17,917 3 2 8 61
億 15 0.663 18,874 29,211 4 2 3 99
論 15 0.965 19,537 25,340 6 2 1 61
輸 16 0.618 13,682 19,522 5 2 6 15
職 18 0.761 15,835 26,932 5 2 9 5
題 18 2.039 32,315 41,310 3 3 5 17
議 20 3.049 67,809 94,398 4 2 11 61
The effects of visual complexity 219
123

Table 5 continued
Target
kanji
Strokes Kanji
frequency
in 1976
Kanji
frequency
in 1993
Kanji
frequency in
CD 1993
School
grades
JLPT-
test
level
Number of
homophones
Radical
frequency
Low frequency kanji
2–6 stroke range of simple kanji
寸 3 0.041 363 539 6 1 1 12
才 3 0.356 644 837 2 2 21 79
厄 4 0.000 67 98 7 1 5 4
孔 4 0.019 102 151 7 1 60 9
冗 4 0.020 212 292 7 1 20 3
尺 4 0.013 219 292 6 1 6 14
凶 4 0.021 499 743 7 1 26 4
皿 5 0.029 486 692 3 2 0 8
芋 6 0.000 47 67 7 1 0 36
迅 6 0.000 132 177 7 1 8 49
壮 6 0.053 417 600 7 1 33 5
缶 6 0.028 654 1,138 7 2 44 1
8–12 stroke range of medium kanji
奔 8 0.012 156 215 7 1 3 15
侯 9 0.000 66 84 7 – 60 99
姻 9 0.000 91 119 7 1 10 32
幽 9 0.012 95 146 7 1 14 4
峠 9 0.020 107 208 7 1 0 13
倹 10 0.000 36 51 7 1 29 99
蚊 10 0.018 81 112 7 1 0 7
殉 10 0.010 81 131 7 1 11 5
栓 10 0.000 81 140 7 1 26 75
惰 12 0.000 46 68 7 1 5 70
蛮 12 0.010 74 112 7 1 4 7
塀 12 0.000 114 215 7 1 11 46
14–20 stroke range of complex kanji
寡 14 0.000 84 102 7 1 31 35
嫡 14 0.000 98 125 7 1 2 32
概 14 0.071 230 327 7 1 8 75
遵 15 0.000 6 7 7 1 11 49
墾 16 0.000 21 36 7 1 11 46
儒 16 0.000 48 65 7 1 6 99
嬢 16 0.034 108 151 7 1 20 32
錠 16 0.291 125 303 7 1 20 29
隷 16 0.000 126 144 7 – 12 1
爵 17 0.000 65 69 7 – 6 1
擬 17 0.012 121 215 7 1 11 79
韻 19 0.000 48 55 7 1 10 3
220 K. Tamaoka, S. Kiyama
123
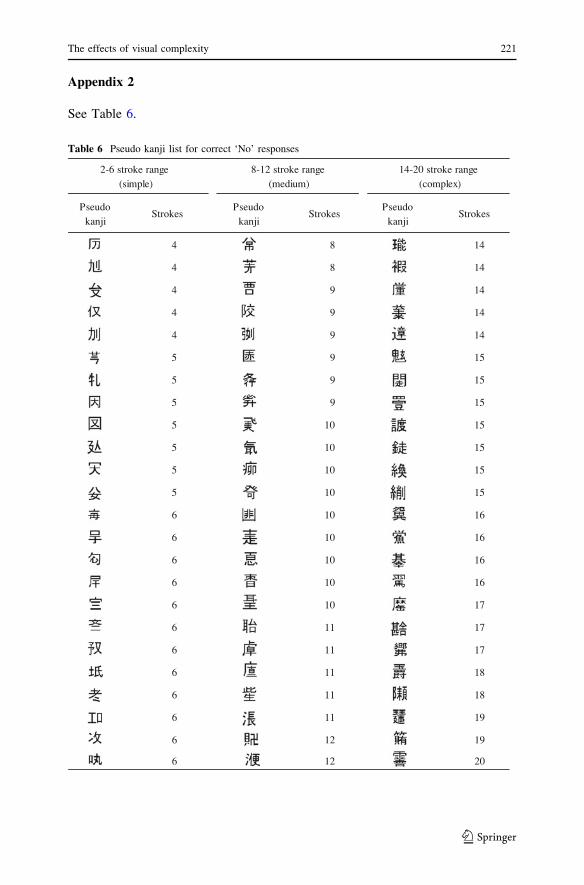
Appendix 2
See Table 6.
Table 6 Pseudo kanji list for correct ‘No’ responses
Pseudokanji
StrokesPseudo
kanjiStrokes
Pseudokanji
Strokes
4 8 14
4 8 14
4 9 14
4 9 14
4 9 14
5 9 15
5 9 15
5 9 15
5 10 15
5 10 15
5 10 15
5 10 15
6 10 16
6 10 16
6 10 16
6 10 16
6 10 17
6 11 17
6 11 17
6 11 18
6 11 18
6 11 19
6 12 19
6 12 20
2-6 stroke range(simple)
8-12 stroke range(medium)
14-20 stroke range(complex)
The effects of visual complexity 221
123
References
Hepburn style romanization with no vowel repeated for a long vowel is used fordescribing Japanese authors’ and publishers’ names while the same style withvowel repeated for a long vowel is used for Japanese article titles and journalnames
Baayen, R. H. (2008). Analyzing linguistic data: A practical introduction to statistics using R. New York:
Cambridge University Press.
Baayen, R. H., Davidson, D. J., & Bates, D. M. (2008). Mixed-effects modeling with crossed random
effects for subjects and items. Journal of Memory and Language, 59, 390–412.Cabinet Announcement by the Japanese Government. (1981). Shoowa 56-nen Naikaku Kokuji Dai-1-goo-
Jyooyookanji-hyoo [1981 Cabinet announcement No. 1-the list of commonly-used 1,945 kanji].
Feldman, L. B., & Siok, W. W. T. (1997). The role of component function in visual recognition of Chinese
characters. Journal of Experimental Psychology: Learning, Memory, and Cognition, 23, 776–781.Hino, Y., & Lupker, S. J. (1998). The effects of word frequency for Japanese kana and kanji words in
naming and lexical decision: Can the dual-route model save the lexical-selection account? Journalof Experimental Psychology: Human Perception and Performance, 24, 1431–1453.
Hino, Y., Lupker, S. J., Ogawa, T., & Sears, C. R. (2003). Masked repetition priming and word frequency
effects across different types of Japanese scripts: An examination of the lexical activation account.
Journal of Memory and Language, 48, 33–66.Kaiho, H. (1979). Kanji jyoohoo kisei o megutte [Regarding the mechanism of kanji information].
Keiryoo Kokugogaku [Mathematical Linguistics], 11, 331–340.Kawai, Y. (1966). Kanji no butsuriteki fukuzatsusei to yomi no gakushuu [Physical complexity of kanji
characters and learning to read them]. Kyooiku Shinrigaku kenkyuu [Journal of EducationalPsychology], 14, 1–10.
Kokuritsu Kokugo Kenkyujyo [National Institute for Japanese Language and Linguistics]. (1976). Gendaishinbun no kanji [Japanese kanji characters in modern newspapers]. Tokyo: Shuei Shuppan.
Leong, C. K. (1986). What does accessing a morphemic script tell us about reading and reading disorders
in an alphabetic script? Annals of Dyslexia, 36, 82–102.Leong, C. K., Cheng, P.-W., & Mulcahy, R. (1987). Automatic processing of morphemic orthography.
Language and Speech, 30, 181–196.Masuda, H., & Saito, H. (1999). Two types of radical frequency effects on Japanese kanji character
recognition. Psychologia, 42, 222–242.Ogawa, T., & Saito, H. (2006). Semantic activation in visual recognition of Japanese two-kanji compound
words: Interference and facilitatory effects of neighbors. Psychologia, 49, 162–177.Taft, M. (1991). Reading and the mental lexicon. Hillsdale, NJ: Erlbaum.
Taft, M., Huang, J., & Zhu, X. P. (1994). The influence of character frequency on word recognition
responses in Chinese. In H.-W. Chang, J.-T. Huang, C.-W. Hue, & O. J. L. Tzeng (Eds.), Advancesin the study of Chinese language processing, Vol. 1 (pp. 59–73). Taipei, Taiwan: Department of
Psychology, National Taiwan University.
Taft, M., & Zhu, X. P. (1995). The representation of bound morphemes in the lexicon: A Chinese study.
In L. B. Feldman (Ed.),Morphological aspects of language processing (pp. 293–316). Hillsdale, NJ:Lawrence Erlbaum Associates.
Taft, M., & Zhu, X. (1997). Submorphemic processing in reading Chinese. Journal of ExperimentalPsychology: Learning, Memory, and Cognition, 23, 761–775.
Tamaoka, K. (2005). The effect of morphemic homophony on the processing of Japanese two-kanji
compound words. Reading and Writing, 18, 281–302.Tamaoka, K. (2007). Rebounding activation caused by lexical homophony in the processing of Japanese
two-kanji compound words. Reading and Writing, 20, 413–439.Tamaoka, K., & Hatsuzuka, M. (1995). Kanji niji jyukugo no shori ni okeru kanji shiyoo hindo no eikyoo
[The effects of Kanji printed-frequency on processing Japanese two-morpheme compound words].
The Science of Reading, 39, 121–137.Tamaoka, K., & Hatsuzuka, M. (1998). The effects of morphological semantics on the processing of
Japanese two-kanji compound words. Reading and Writing, 10, 293–322.
222 K. Tamaoka, S. Kiyama
123

Tamaoka, K., Kirsner, K., Yanase, Y., Miyaoka, Y., & Kawakami, M. (2002). A Web-accessible database
of characteristics of the 1,945 basic Japanese kanji. Behavior Research Methods, Instruments, &Computers, 34, 260–275.
Tamaoka, K., & Taft, M. (2010). The sensitivity of native Japanese speakers to On and Kun kanji
readings. Reading and Writing, 23, 957–968.Tamaoka, K., & Takahashi, N. (1999). Kanji niji jyukugo no shoji koodoo ni okeru goi shiyoo hindo
oyobi shojiteki fukuzatsusei no eikyoo [The effects of word frequency and orthographic complexity
on the writing process of Japanese two-morpheme compound words]. Japanese Journal ofPsychology, 70, 45–50.
Wang, W. S.-Y. (1973). The Chinese language. Scientific American, 228, 50–60.Wang, W. S.-Y. (1981). Language structure and optimal orthography. In O. J. L. Tzeng & H. Spinger
(Eds.), The perception of print: Reading research in experimental psychology (pp. 223–236).
Hillsdale, NJ: Lawrence Erlbaum Associates.
Wu, J.-T., Chou, T.-L., & Liu, I.-M. (1994). The locus of the character/word frequency effect. In H.-W.
Chang, J.-T. Huang, C.-W. Hue, & O. J. L. Tzeng (Eds.), Advances in the study of Chinese languageprocessing, Vol. 1 (pp. 31–58). Taipei, Taiwan: Department of Psychology, National Taiwan
University.
Yokoyama, S., Sasahara, H., Nozaki, H., & Long, E. (1998). Shinbun denshi media no kanji: Asahishinbun CD-ROM ni yoru kanji hindo hyoo [Japanese kanji in the newspaper media: Kanjifrequency index from the Asahi newspaper on CD-ROM]. Tokyo: Sanseido.
Zhou, X., & Marslen-Wilson, W. (1994). Words, morphemes and syllables in the Chinese mental lexicon.
Language and Cognitive Processes, 9, 393–422.
The effects of visual complexity 223
123


![[Kanji] 1006 Kanji voi Doaremon.pdf](https://img.pdfslide.us/doc/110x75/55cf8aab55034654898cd172/kanji-1006-kanji-voi-doaremonpdf.jpg)