Embed Size (px)
Citation preview
The effects of viewing angle, camera angle, and sign ofsurface curvature on the perception of three-dimensionalshape from texture
Department of Psychology, The Ohio State University,Columbus, OH, USAJames T. Todd
Department of Psychology, The Ohio State University,Columbus, OH, USALore Thaler
Department of Information and Knowledge Systems,Radboud University, Nijmegen, The NetherlandsTjeerd M. H. Dijkstra
Department Physics of Man, Helmholtz Institute,Utrecht University, Utrecht, The NetherlandsJan J. Koenderink
Department Physics of Man, Helmholtz Institute,Utrecht University, Utrecht, The NetherlandsAstrid M. L. Kappers
Computational models for determining three-dimensional shape from texture based on local foreshortening or gradients ofscaling are able to achieve accurate estimates of surface relief from an image when it is observed from the same visualangle with which it was photographed or rendered. These models produce conflicting predictions, however, when an imageis viewed from a different visual angle. An experiment was performed to test these predictions, in which observers judgedthe apparent depth profiles of hyperbolic cylinders under a wide variety of conditions. The results reveal that the apparentpatterns of relief from texture are systematically underestimated; convex surfaces appear to have greater depth thanconcave surfaces, large camera angles produce greater amounts of perceived depth than small camera angles, and theapparent depth-to-width ratio for a given image of a surface is greater for small viewing angles than for large viewing angles.Because these results are incompatible with all existing computational models, a new model is presented based on scalingcontrast that can successfully account for all aspects of the data.
Keywords: shape from texture, three-dimensional shape, shape perception, vision, texture gradients, scaling,foreshortening, viewing geometry, scene geometry
Citation: Todd, J. T., Thaler, L., Dijkstra, T. M. H., Koenderink, J. J., & Kappers, A. M. L. (2007). The effects of viewing angle,camera angle, and sign of surface curvature on the perception of three-dimensional shape from texture. Journal of Vision,7(12):9, 1–16, http://journalofvision.org/7/12/9/, doi:10.1167/7.12.9.
Introduction
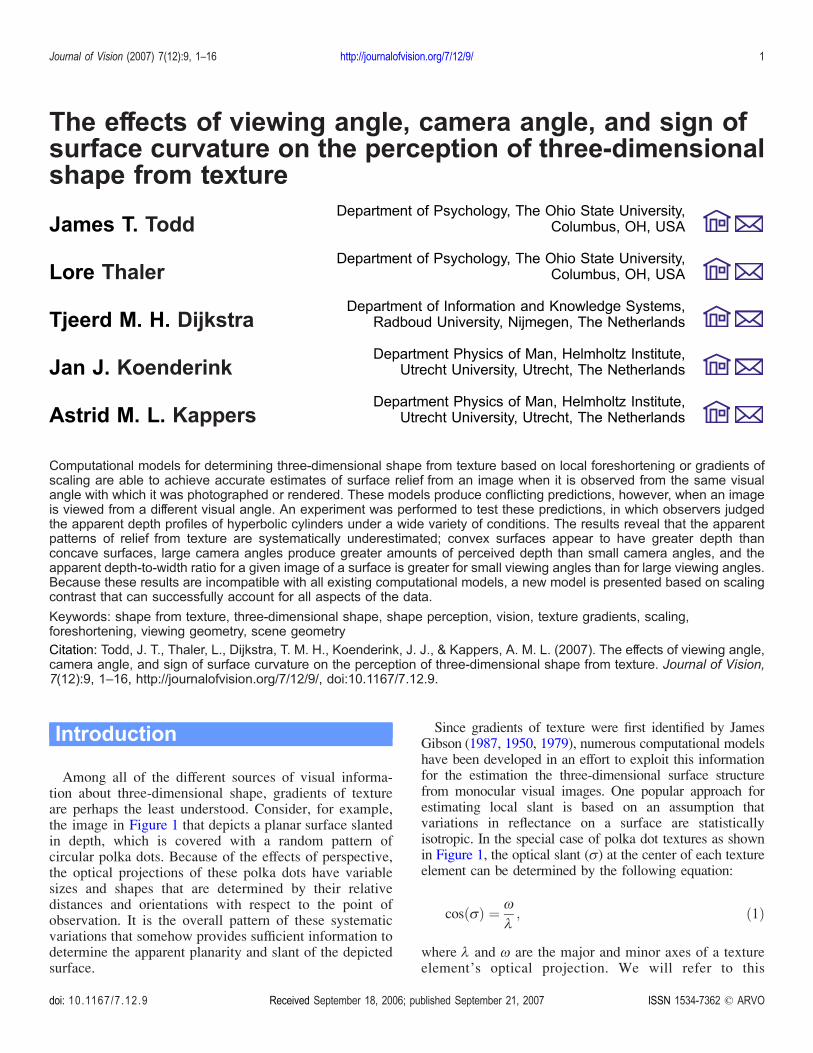
Among all of the different sources of visual informa-tion about three-dimensional shape, gradients of textureare perhaps the least understood. Consider, for example,the image in Figure 1 that depicts a planar surface slantedin depth, which is covered with a random pattern ofcircular polka dots. Because of the effects of perspective,the optical projections of these polka dots have variablesizes and shapes that are determined by their relativedistances and orientations with respect to the point ofobservation. It is the overall pattern of these systematicvariations that somehow provides sufficient information todetermine the apparent planarity and slant of the depictedsurface.
Since gradients of texture were first identified by JamesGibson (1987, 1950, 1979), numerous computational modelshave been developed in an effort to exploit this informationfor the estimation the three-dimensional surface structurefrom monocular visual images. One popular approach forestimating local slant is based on an assumption thatvariations in reflectance on a surface are statisticallyisotropic. In the special case of polka dot textures as shownin Figure 1, the optical slant (A) at the center of each textureelement can be determined by the following equation:
cos Að Þ ¼ 5
1; ð1Þ
where 1 and 5 are the major and minor axes of a textureelement’s optical projection. We will refer to this
Journal of Vision (2007) 7(12):9, 1–16 http://journalofvision.org/7/12/9/ 1
doi: 10 .1167 /7 .12 .9 Received September 18, 2006; published September 21, 2007 ISSN 1534-7362 * ARVO
approach as the analysis of texture foreshortening becausethat is the term that is typically used in the literature todescribe the ratio 5/1. Similar computations can also beperformed for less regular isotropic textures from thedistribution of edge orientations in each local image region(Aloimonos, 1988; Blake & Marinos, 1990; Blostein &Ahuja, 1989; Marinos & Blake, 1990; Witkin, 1981) orfrom the relative anisotropy of their local amplitude spectra(Bajcsi & Lieberman, 1976; Brown & Shvayster, 1990;Krumm & Shafer, 1992; Sakai & Finkel, 1994; Super &Bovik, 1995).An alternative approach that comes closer to Gibson’s
original conception is to estimate surface slant bymeasuring the changes of optical texture across differentlocal neighborhoods of an image, based on an assumptionthat the texture on a physical surface is statisticallyhomogeneous. As was first demonstrated by Purdy(1958), the optical slant (A) in a given local region canbe determined by the following equation
tan Að Þ ¼ 2ð11 j 12Þ%ð11 þ 12Þ ; ð2Þ
where % is the projected distance between neighboringoptical texture elements in the direction that slant is beingestimated, and 11 and 12 are the projected lengths of thosetexture elements in a perpendicular direction (see Figure 2).In the limit of an infinitesimally small %, the right side ofEquation 2 equals the normalized depth gradient (Purdy,1958, Equation 14; Garding, 1992, Equation 33). Similarcomputations can also be performed on less regular texturesfrom the affine correlations between the amplitude spectra inneighboring image regions (Clerc & Mallat, 2002; Malik &Rosenholtz, 1994, 1997) or from the systematic changes inthe distributions of edges (Garding, 1992, 1993).
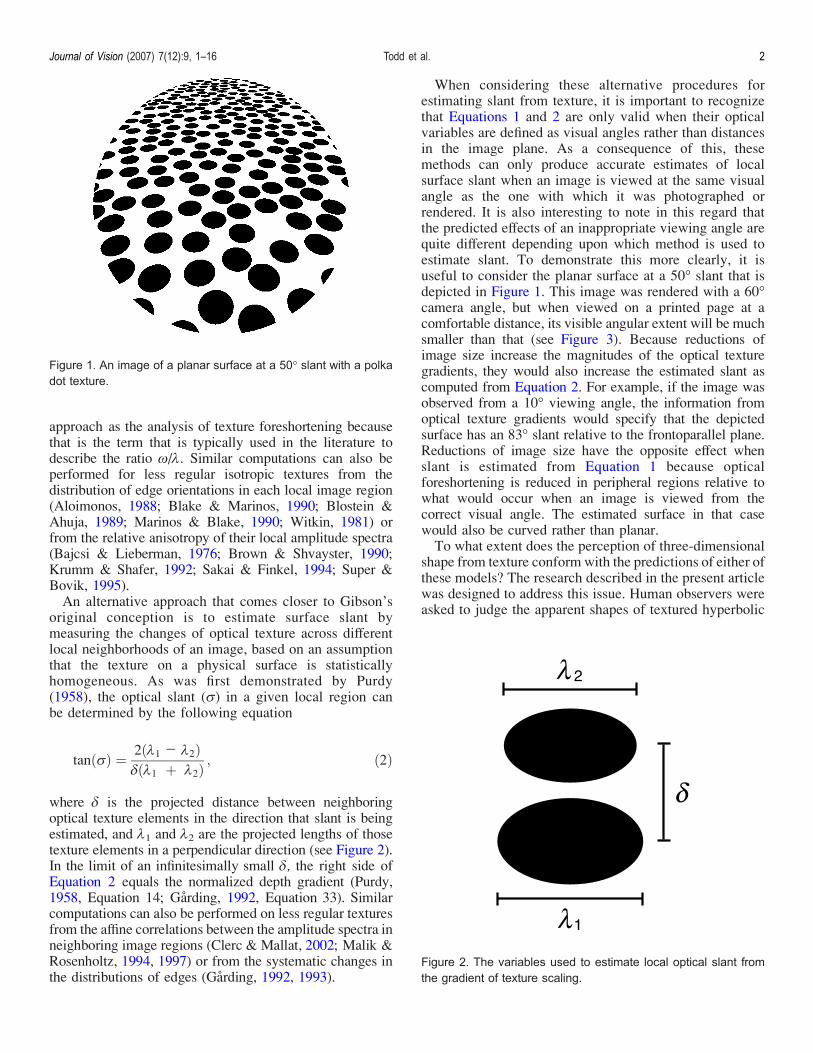
When considering these alternative procedures forestimating slant from texture, it is important to recognizethat Equations 1 and 2 are only valid when their opticalvariables are defined as visual angles rather than distancesin the image plane. As a consequence of this, thesemethods can only produce accurate estimates of localsurface slant when an image is viewed at the same visualangle as the one with which it was photographed orrendered. It is also interesting to note in this regard thatthe predicted effects of an inappropriate viewing angle arequite different depending upon which method is used toestimate slant. To demonstrate this more clearly, it isuseful to consider the planar surface at a 50- slant that isdepicted in Figure 1. This image was rendered with a 60-camera angle, but when viewed on a printed page at acomfortable distance, its visible angular extent will be muchsmaller than that (see Figure 3). Because reductions ofimage size increase the magnitudes of the optical texturegradients, they would also increase the estimated slant ascomputed from Equation 2. For example, if the image wasobserved from a 10- viewing angle, the information fromoptical texture gradients would specify that the depictedsurface has an 83- slant relative to the frontoparallel plane.Reductions of image size have the opposite effect whenslant is estimated from Equation 1 because opticalforeshortening is reduced in peripheral regions relative towhat would occur when an image is viewed from thecorrect visual angle. The estimated surface in that casewould also be curved rather than planar.To what extent does the perception of three-dimensional
shape from texture conformwith the predictions of either ofthese models? The research described in the present articlewas designed to address this issue. Human observers wereasked to judge the apparent shapes of textured hyperbolic
Figure 1. An image of a planar surface at a 50- slant with a polkadot texture.
Figure 2. The variables used to estimate local optical slant fromthe gradient of texture scaling.
Journal of Vision (2007) 7(12):9, 1–16 Todd et al. 2
cylinders from monocular images presented at differentviewing angles that could be the same or different as thecamera angles with which the images were rendered.
Methods
Subjects
Four of the authors participated in the experiment(A.K., J.K., J.T., and L.T.), and they all had normal orcorrected-to-normal visual acuity.
Apparatus
The experiment was conducted using a Dell Dimension8300 PC with an ATI Radeon 9800 PRO graphics card.
Images could be viewed with a visual angle of either 20-or 60-. Those viewed at a 20- angle had horizontal andvertical extents of 30.0 cm and were presented on astandard CRT. Those that were viewed at a 60- angle hadhorizontal and vertical extents of 121.9 cm and were backprojected onto a translucent display screen using an LCDprojector. Both types of display had a spatial resolution of1,280 � 1,024 pixels, and the stimulus images werepresented within an area of 1,024 � 1,024 pixels. Thedisplays were monocularly viewed with an eye patch, anda chin rest was used to constrain head movements.
Stimuli
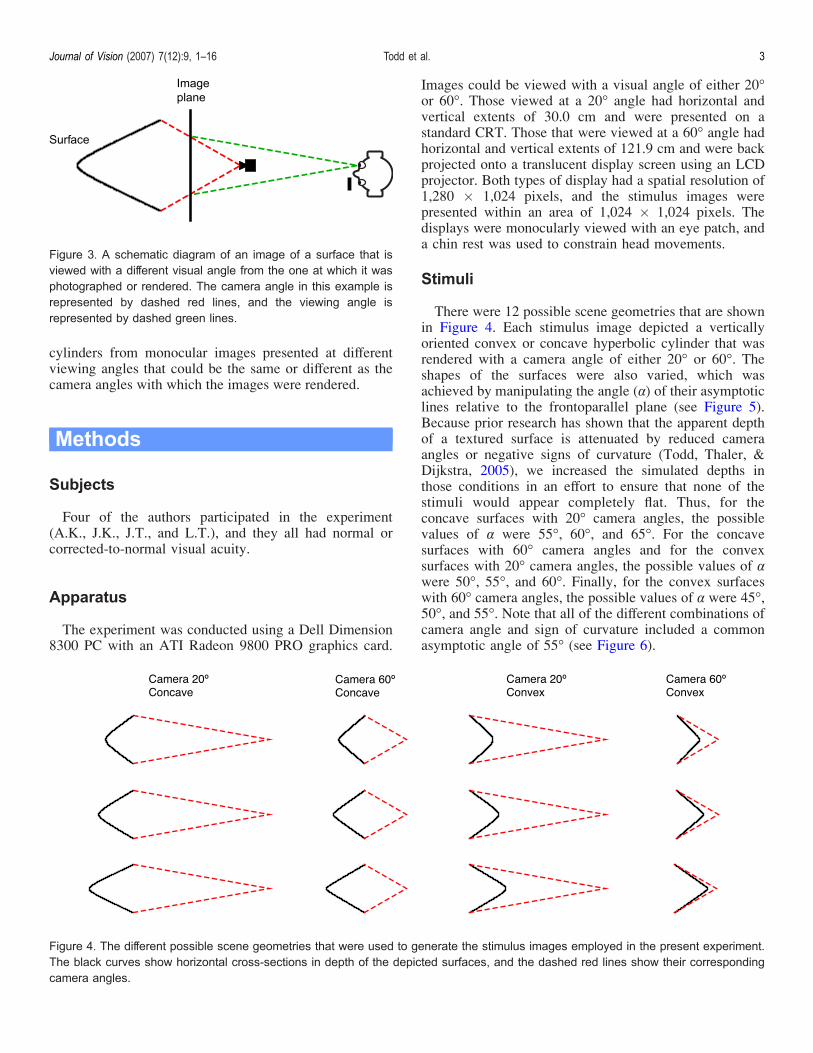
There were 12 possible scene geometries that are shownin Figure 4. Each stimulus image depicted a verticallyoriented convex or concave hyperbolic cylinder that wasrendered with a camera angle of either 20- or 60-. Theshapes of the surfaces were also varied, which wasachieved by manipulating the angle (!) of their asymptoticlines relative to the frontoparallel plane (see Figure 5).Because prior research has shown that the apparent depthof a textured surface is attenuated by reduced cameraangles or negative signs of curvature (Todd, Thaler, &Dijkstra, 2005), we increased the simulated depths inthose conditions in an effort to ensure that none of thestimuli would appear completely flat. Thus, for theconcave surfaces with 20- camera angles, the possiblevalues of ! were 55-, 60-, and 65-. For the concavesurfaces with 60- camera angles and for the convexsurfaces with 20- camera angles, the possible values of !were 50-, 55-, and 60-. Finally, for the convex surfaceswith 60- camera angles, the possible values of ! were 45-,50-, and 55-. Note that all of the different combinations ofcamera angle and sign of curvature included a commonasymptotic angle of 55- (see Figure 6).
Figure 3. A schematic diagram of an image of a surface that isviewed with a different visual angle from the one at which it wasphotographed or rendered. The camera angle in this example isrepresented by dashed red lines, and the viewing angle isrepresented by dashed green lines.
Figure 4. The different possible scene geometries that were used to generate the stimulus images employed in the present experiment.The black curves show horizontal cross-sections in depth of the depicted surfaces, and the dashed red lines show their correspondingcamera angles.
Journal of Vision (2007) 7(12):9, 1–16 Todd et al. 3
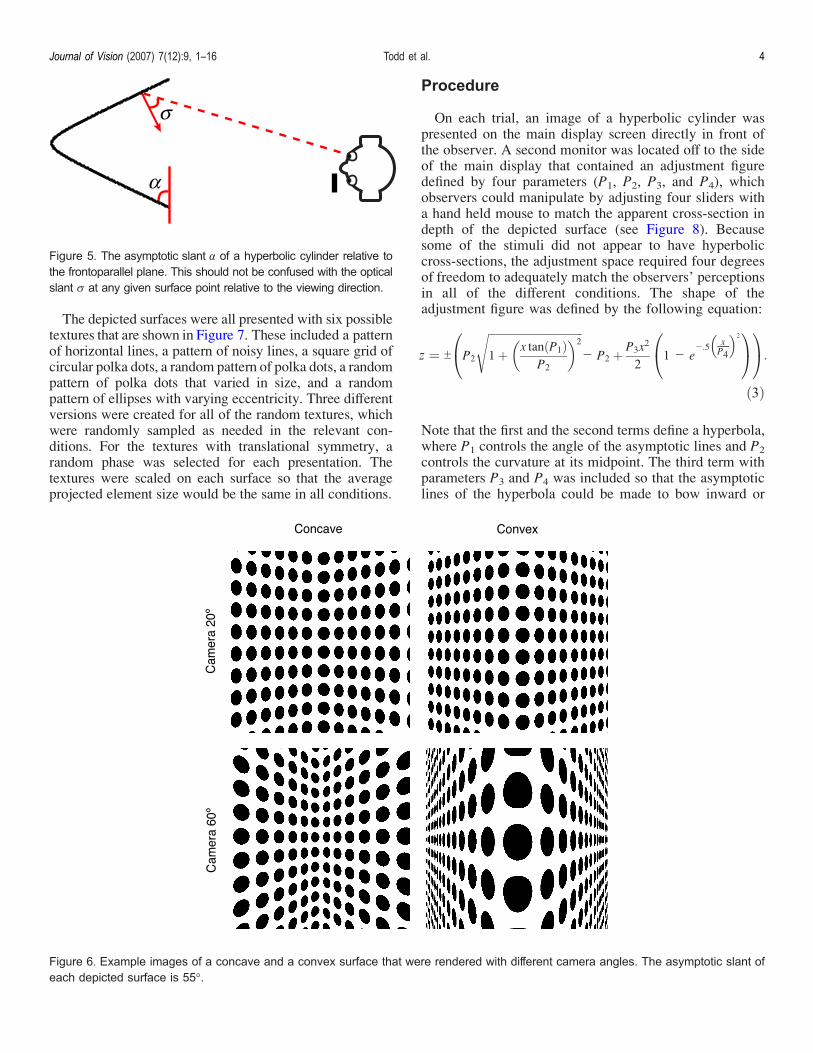
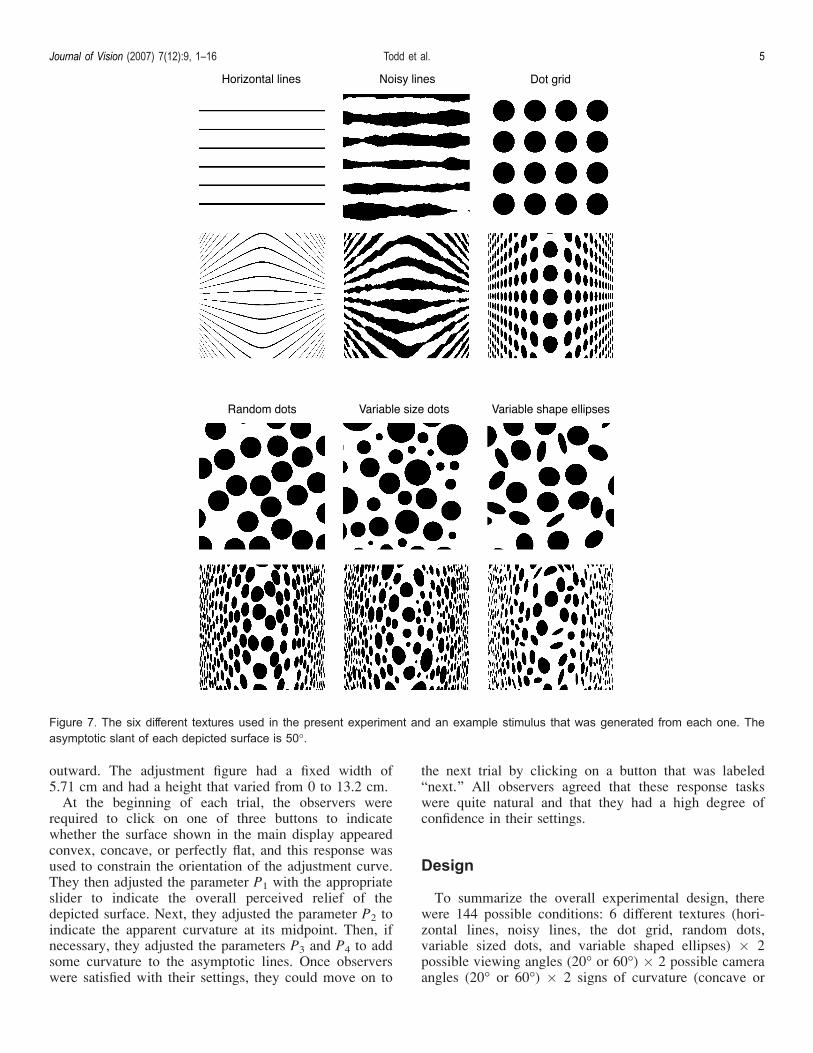
The depicted surfaces were all presented with six possibletextures that are shown in Figure 7. These included a patternof horizontal lines, a pattern of noisy lines, a square grid ofcircular polka dots, a random pattern of polka dots, a randompattern of polka dots that varied in size, and a randompattern of ellipses with varying eccentricity. Three differentversions were created for all of the random textures, whichwere randomly sampled as needed in the relevant con-ditions. For the textures with translational symmetry, arandom phase was selected for each presentation. Thetextures were scaled on each surface so that the averageprojected element size would be the same in all conditions.
Procedure
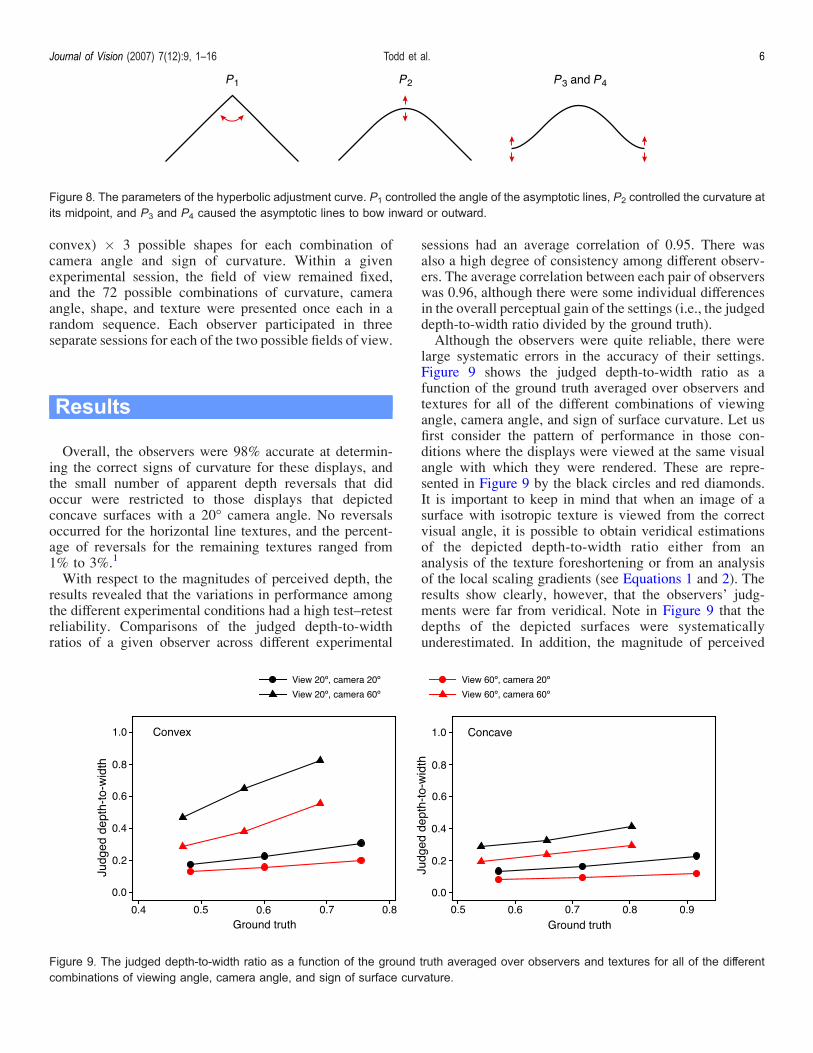
On each trial, an image of a hyperbolic cylinder waspresented on the main display screen directly in front ofthe observer. A second monitor was located off to the sideof the main display that contained an adjustment figuredefined by four parameters (P1, P2, P3, and P4), whichobservers could manipulate by adjusting four sliders witha hand held mouse to match the apparent cross-section indepth of the depicted surface (see Figure 8). Becausesome of the stimuli did not appear to have hyperboliccross-sections, the adjustment space required four degreesof freedom to adequately match the observers’ perceptionsin all of the different conditions. The shape of theadjustment figure was defined by the following equation:
z ¼ T P2
ffiffiffiffiffiffiffiffiffiffiffiffiffiffiffiffiffiffiffiffiffiffiffiffiffiffiffiffiffiffiffiffiffiffiffi1þ x tan P1ð Þ
P2
� �2s
j P2 þ P3x2
21 j e
j:5xP4
� �20@
1A
0@
1A:
ð3Þ
Note that the first and the second terms define a hyperbola,where P1 controls the angle of the asymptotic lines and P2
controls the curvature at its midpoint. The third term withparameters P3 and P4 was included so that the asymptoticlines of the hyperbola could be made to bow inward or
Figure 5. The asymptotic slant ! of a hyperbolic cylinder relative tothe frontoparallel plane. This should not be confused with the opticalslant A at any given surface point relative to the viewing direction.
Figure 6. Example images of a concave and a convex surface that were rendered with different camera angles. The asymptotic slant ofeach depicted surface is 55-.
Journal of Vision (2007) 7(12):9, 1–16 Todd et al. 4
outward. The adjustment figure had a fixed width of5.71 cm and had a height that varied from 0 to 13.2 cm.At the beginning of each trial, the observers were
required to click on one of three buttons to indicatewhether the surface shown in the main display appearedconvex, concave, or perfectly flat, and this response wasused to constrain the orientation of the adjustment curve.They then adjusted the parameter P1 with the appropriateslider to indicate the overall perceived relief of thedepicted surface. Next, they adjusted the parameter P2 toindicate the apparent curvature at its midpoint. Then, ifnecessary, they adjusted the parameters P3 and P4 to addsome curvature to the asymptotic lines. Once observerswere satisfied with their settings, they could move on to
the next trial by clicking on a button that was labeledBnext.[ All observers agreed that these response taskswere quite natural and that they had a high degree ofconfidence in their settings.
Design
To summarize the overall experimental design, therewere 144 possible conditions: 6 different textures (hori-zontal lines, noisy lines, the dot grid, random dots,variable sized dots, and variable shaped ellipses) � 2possible viewing angles (20- or 60-) � 2 possible cameraangles (20- or 60-) � 2 signs of curvature (concave or
Figure 7. The six different textures used in the present experiment and an example stimulus that was generated from each one. Theasymptotic slant of each depicted surface is 50-.
Journal of Vision (2007) 7(12):9, 1–16 Todd et al. 5
convex) � 3 possible shapes for each combination ofcamera angle and sign of curvature. Within a givenexperimental session, the field of view remained fixed,and the 72 possible combinations of curvature, cameraangle, shape, and texture were presented once each in arandom sequence. Each observer participated in threeseparate sessions for each of the two possible fields of view.
Results
Overall, the observers were 98% accurate at determin-ing the correct signs of curvature for these displays, andthe small number of apparent depth reversals that didoccur were restricted to those displays that depictedconcave surfaces with a 20- camera angle. No reversalsoccurred for the horizontal line textures, and the percent-age of reversals for the remaining textures ranged from1% to 3%.1
With respect to the magnitudes of perceived depth, theresults revealed that the variations in performance amongthe different experimental conditions had a high test–retestreliability. Comparisons of the judged depth-to-widthratios of a given observer across different experimental
sessions had an average correlation of 0.95. There wasalso a high degree of consistency among different observ-ers. The average correlation between each pair of observerswas 0.96, although there were some individual differencesin the overall perceptual gain of the settings (i.e., the judgeddepth-to-width ratio divided by the ground truth).Although the observers were quite reliable, there were
large systematic errors in the accuracy of their settings.Figure 9 shows the judged depth-to-width ratio as afunction of the ground truth averaged over observers andtextures for all of the different combinations of viewingangle, camera angle, and sign of surface curvature. Let usfirst consider the pattern of performance in those con-ditions where the displays were viewed at the same visualangle with which they were rendered. These are repre-sented in Figure 9 by the black circles and red diamonds.It is important to keep in mind that when an image of asurface with isotropic texture is viewed from the correctvisual angle, it is possible to obtain veridical estimationsof the depicted depth-to-width ratio either from ananalysis of the texture foreshortening or from an analysisof the local scaling gradients (see Equations 1 and 2). Theresults show clearly, however, that the observers’ judg-ments were far from veridical. Note in Figure 9 that thedepths of the depicted surfaces were systematicallyunderestimated. In addition, the magnitude of perceived
Figure 8. The parameters of the hyperbolic adjustment curve. P1 controlled the angle of the asymptotic lines, P2 controlled the curvature atits midpoint, and P3 and P4 caused the asymptotic lines to bow inward or outward.
Figure 9. The judged depth-to-width ratio as a function of the ground truth averaged over observers and textures for all of the differentcombinations of viewing angle, camera angle, and sign of surface curvature.
Journal of Vision (2007) 7(12):9, 1–16 Todd et al. 6
depth was much larger for convex surfaces than forconcave surfaces, and it was also much larger for the 60-camera angles than for the 20- camera angles (see alsoTibau, Willems, Van Den Berg, & Wagemans, 2001;Todd et al., 2005). None of these effects would bepredicted based on current computational analyses fordetermining three-dimensional shape from texture.Another interesting finding that should be noted in
Figure 9 is the differences in apparent depth that wereobtained between 20- viewing angles (black symbols) andthe 60- viewing angles (red symbols) when all other factorswere held constant. If the three-dimensional shape of adepicted surface was estimated from local scaling gradientsas described by Equation 2, then the judged depth-to-widthratio obtained with a 20- viewing angle should be 3.27times larger than what would be obtained if the sameimage was viewed at a 60- angle (see Purdy, 1958). Theopposite effect would occur if shape was computed fromlocal texture foreshortening as described by Equation 1,although qualitative distortions in the estimated shapewould be expected for reductions in image size if theoptical texture elements become elongated in the directionof surface slant (e.g., see lower left panel of Figure 6).Which of these predictions is more consistent with humanperception? The judged depth-to-width ratios in thepresent experiment were on average 1.55 times larger forthe 20- viewing angles than for the 60- viewing angles.Thus, the direction of the effect is consistent with whatwould be expected from an analysis of local scalinggradients, but the magnitude is much smaller. Similarfindings have also been reported by Backus and Saunders(2006) for the perceived three-dimensional slants obtainedfrom linear perspective, although the magnitude of theeffect they obtained is much smaller than the one reportedhere. This is most likely due to the large visual angles weemployed because the optical distortions produced byvariations of image size increase with retinal eccentricity.
Scaling contrast
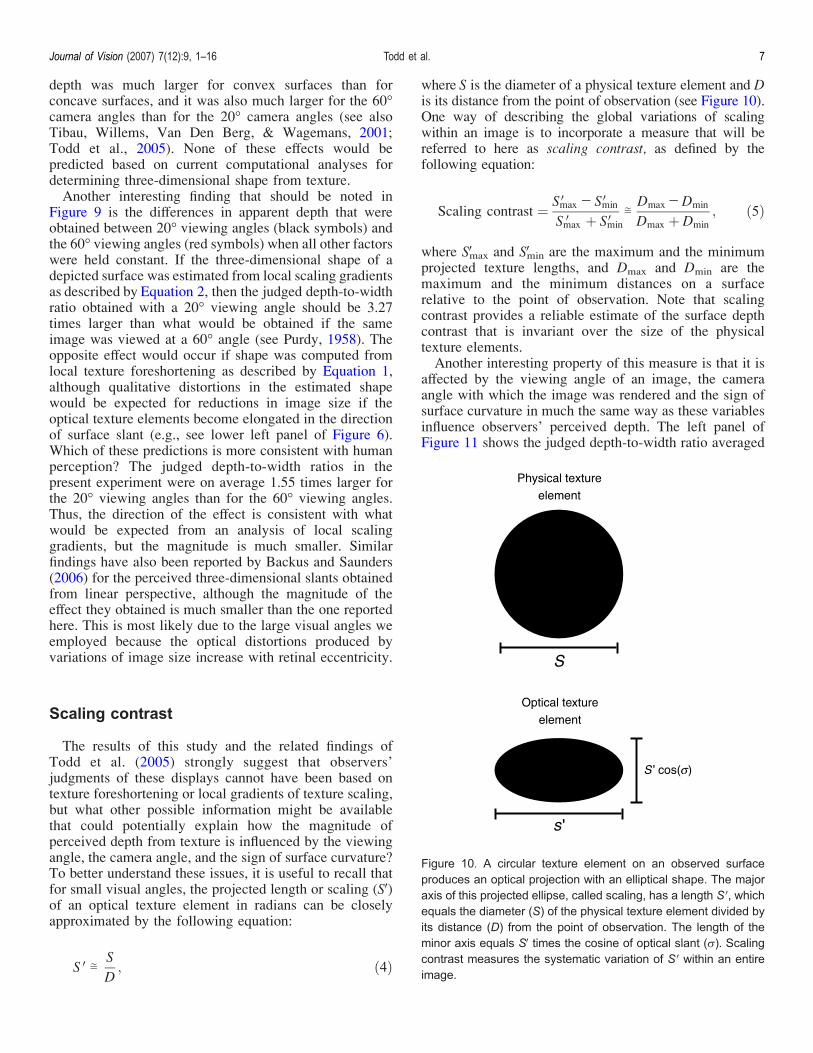
The results of this study and the related findings ofTodd et al. (2005) strongly suggest that observers’judgments of these displays cannot have been based ontexture foreshortening or local gradients of texture scaling,but what other possible information might be availablethat could potentially explain how the magnitude ofperceived depth from texture is influenced by the viewingangle, the camera angle, and the sign of surface curvature?To better understand these issues, it is useful to recall thatfor small visual angles, the projected length or scaling (SV)of an optical texture element in radians can be closelyapproximated by the following equation:
S V;S
D; ð4Þ
where S is the diameter of a physical texture element and Dis its distance from the point of observation (see Figure 10).One way of describing the global variations of scalingwithin an image is to incorporate a measure that will bereferred to here as scaling contrast, as defined by thefollowing equation:
Scaling contrast ¼ SmaxV j SminVSmaxV þ SminV
;DmaxjDmin
Dmax þ Dmin
; ð5Þ
where SVmax and SVmin are the maximum and the minimumprojected texture lengths, and Dmax and Dmin are themaximum and the minimum distances on a surfacerelative to the point of observation. Note that scalingcontrast provides a reliable estimate of the surface depthcontrast that is invariant over the size of the physicaltexture elements.Another interesting property of this measure is that it is
affected by the viewing angle of an image, the cameraangle with which the image was rendered and the sign ofsurface curvature in much the same way as these variablesinfluence observers’ perceived depth. The left panel ofFigure 11 shows the judged depth-to-width ratio averaged
Figure 10. A circular texture element on an observed surfaceproduces an optical projection with an elliptical shape. The majoraxis of this projected ellipse, called scaling, has a length SV, whichequals the diameter (S) of the physical texture element divided byits distance (D) from the point of observation. The length of theminor axis equals SVtimes the cosine of optical slant (A). Scalingcontrast measures the systematic variation of SVwithin an entireimage.
Journal of Vision (2007) 7(12):9, 1–16 Todd et al. 7
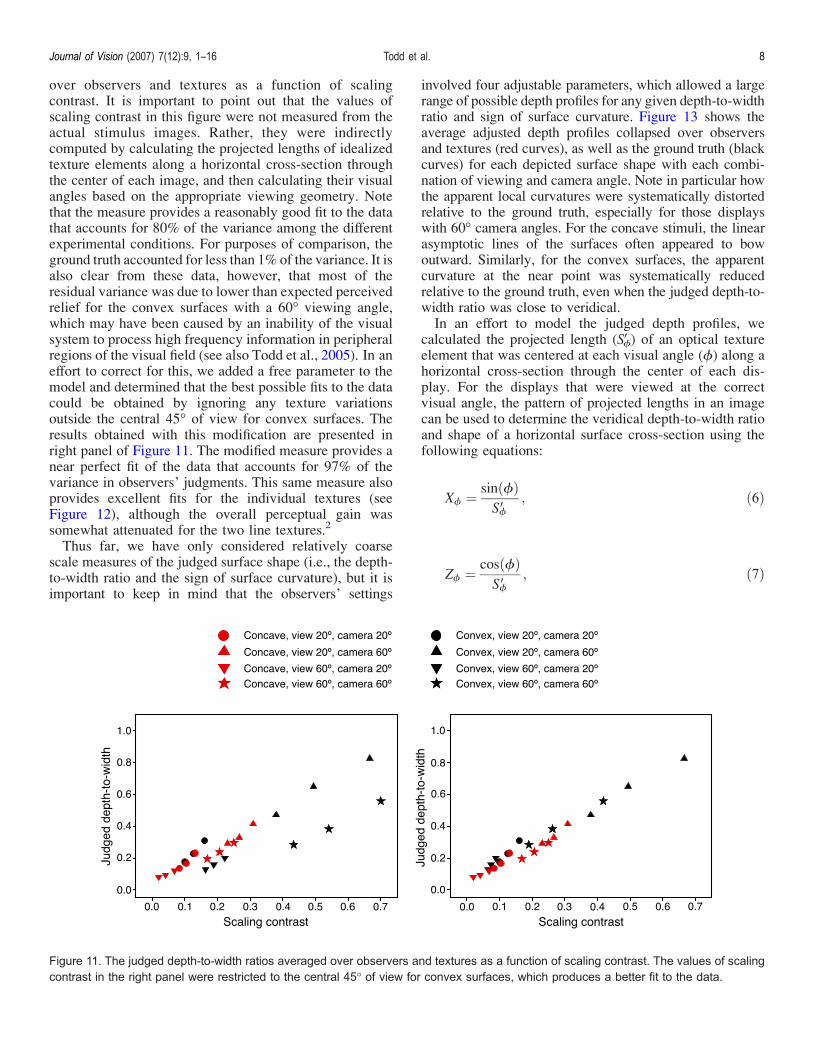
over observers and textures as a function of scalingcontrast. It is important to point out that the values ofscaling contrast in this figure were not measured from theactual stimulus images. Rather, they were indirectlycomputed by calculating the projected lengths of idealizedtexture elements along a horizontal cross-section throughthe center of each image, and then calculating their visualangles based on the appropriate viewing geometry. Notethat the measure provides a reasonably good fit to the datathat accounts for 80% of the variance among the differentexperimental conditions. For purposes of comparison, theground truth accounted for less than 1% of the variance. It isalso clear from these data, however, that most of theresidual variance was due to lower than expected perceivedrelief for the convex surfaces with a 60- viewing angle,which may have been caused by an inability of the visualsystem to process high frequency information in peripheralregions of the visual field (see also Todd et al., 2005). In aneffort to correct for this, we added a free parameter to themodel and determined that the best possible fits to the datacould be obtained by ignoring any texture variationsoutside the central 45- of view for convex surfaces. Theresults obtained with this modification are presented inright panel of Figure 11. The modified measure provides anear perfect fit of the data that accounts for 97% of thevariance in observers’ judgments. This same measure alsoprovides excellent fits for the individual textures (seeFigure 12), although the overall perceptual gain wassomewhat attenuated for the two line textures.2
Thus far, we have only considered relatively coarsescale measures of the judged surface shape (i.e., the depth-to-width ratio and the sign of surface curvature), but it isimportant to keep in mind that the observers’ settings
involved four adjustable parameters, which allowed a largerange of possible depth profiles for any given depth-to-widthratio and sign of surface curvature. Figure 13 shows theaverage adjusted depth profiles collapsed over observersand textures (red curves), as well as the ground truth (blackcurves) for each depicted surface shape with each combi-nation of viewing and camera angle. Note in particular howthe apparent local curvatures were systematically distortedrelative to the ground truth, especially for those displayswith 60- camera angles. For the concave stimuli, the linearasymptotic lines of the surfaces often appeared to bowoutward. Similarly, for the convex surfaces, the apparentcurvature at the near point was systematically reducedrelative to the ground truth, even when the judged depth-to-width ratio was close to veridical.In an effort to model the judged depth profiles, we
calculated the projected length (SV7) of an optical textureelement that was centered at each visual angle (7) along ahorizontal cross-section through the center of each dis-play. For the displays that were viewed at the correctvisual angle, the pattern of projected lengths in an imagecan be used to determine the veridical depth-to-width ratioand shape of a horizontal surface cross-section using thefollowing equations:
X7 ¼ sinð7ÞS7V
; ð6Þ
Z7 ¼ cosð7ÞS7V
; ð7Þ
Figure 11. The judged depth-to-width ratios averaged over observers and textures as a function of scaling contrast. The values of scalingcontrast in the right panel were restricted to the central 45- of view for convex surfaces, which produces a better fit to the data.
Journal of Vision (2007) 7(12):9, 1–16 Todd et al. 8
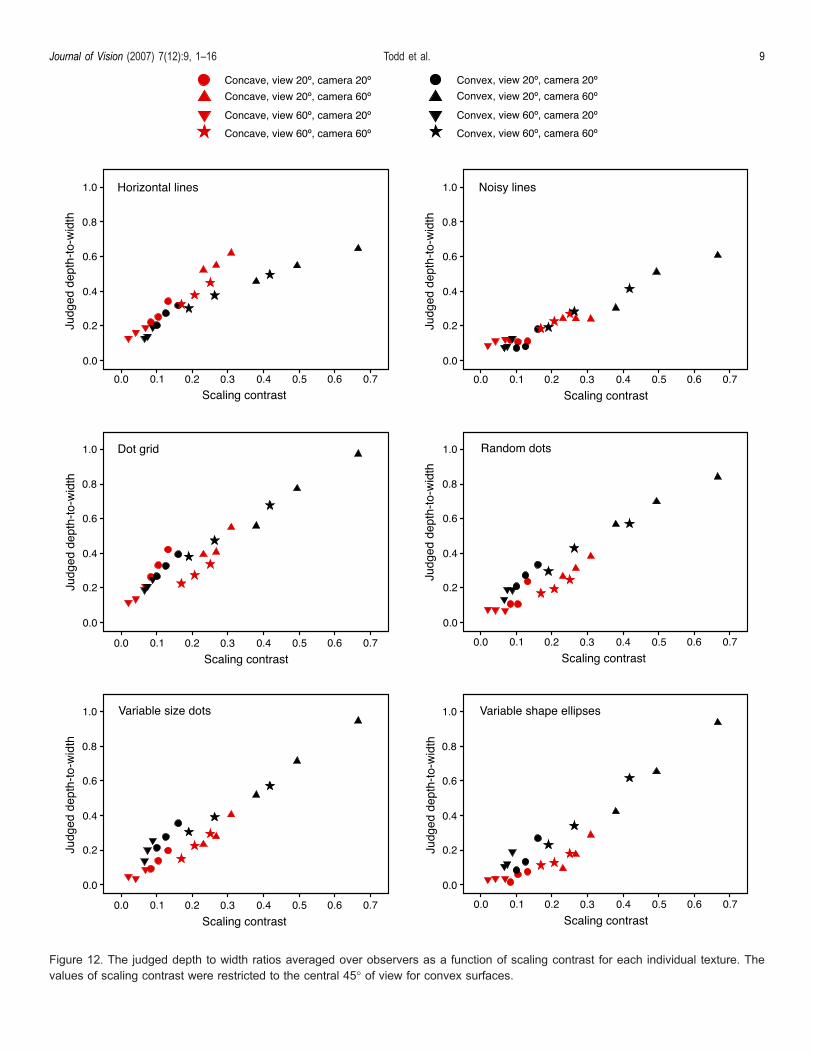
Figure 12. The judged depth to width ratios averaged over observers as a function of scaling contrast for each individual texture. Thevalues of scaling contrast were restricted to the central 45- of view for convex surfaces.
Journal of Vision (2007) 7(12):9, 1–16 Todd et al. 9
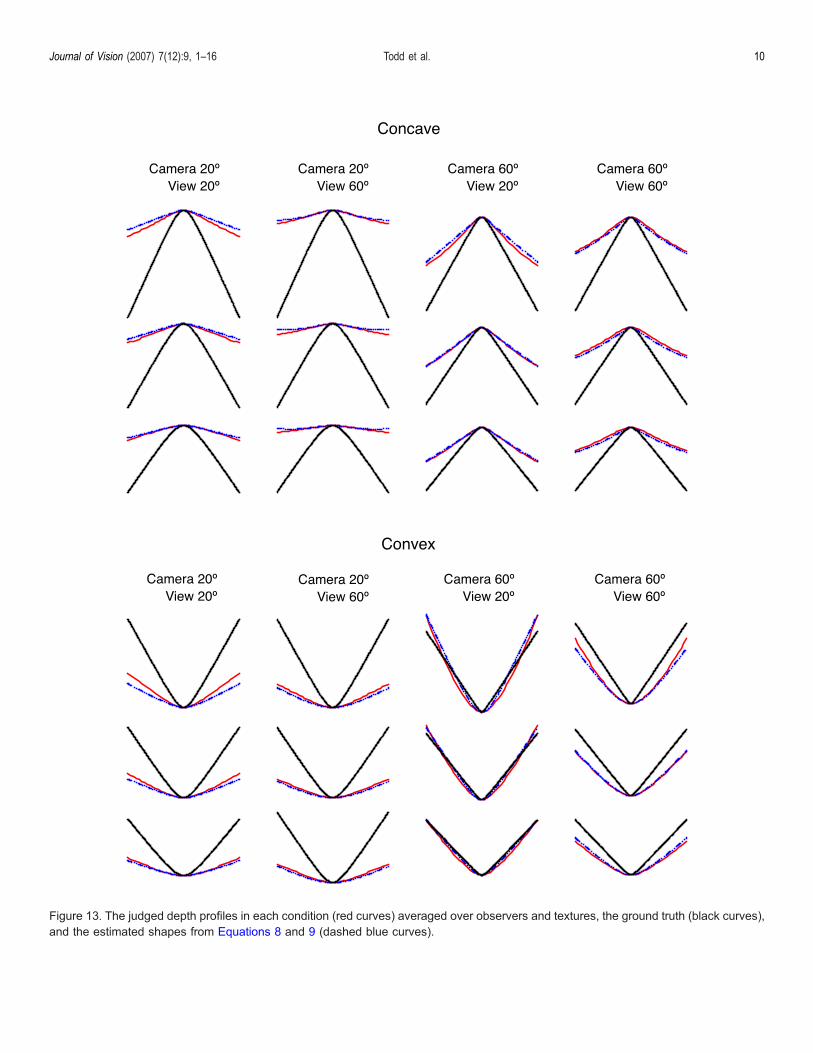
Figure 13. The judged depth profiles in each condition (red curves) averaged over observers and textures, the ground truth (black curves),and the estimated shapes from Equations 8 and 9 (dashed blue curves).
Journal of Vision (2007) 7(12):9, 1–16 Todd et al. 10
where X7 defines the horizontal position of each pointalong the surface cross-section, and Z7 defines its positionin depth. It is clear from Figure 13, however, thatobservers did not adopt that strategy. We have triedseveral different procedures to model the judged shapesfrom the spatial variations of SV7, and the best fits to thedata were obtained using the following equations:
X7 ¼ 7
7max
; ð8Þ
Z7 ¼ kSmaxV j S7VSmaxV þ SminV
: ð9Þ
Note in this analysis that the depth (Z7) of each point ona cross-section varies from 0 to the value of scalingcontrast times a constant k. The horizontal position ofeach point (X7) is linearly scaled with visual angle and isnormalized by the maximum visual angle (7max) so thatthe range of positions varies between j1 and 1. Analternative procedure that produces fits only slightlyworse than those obtained using Equation 8 is to scale X7
with respect to position in the image plane (i.e., X7 = XV7/XVmax).The dashed blue curves in Figure 13 show the
estimated surface cross-sections based on Equations 8and 9. It is important to keep in mind that there were onlytwo free parameters in this analysis to maximize thegoodness of fit among all of the different conditions.Equation 9 contains a depth scaling parameter (k), whichwas assigned a fixed value of 2.5 for the generation ofeach curve. The other free parameter is the restricted 45-range of visual angles that was considered for the analysisof convex surfaces (see Figure 9). Note in Figure 13 howclosely the estimated shapes approximate the observers’settings in all of the different conditions. This model canaccount for the apparent depth-to-width ratios of thedepicted surfaces, the apparent outward bowing of thesurface asymptotic lines for convex surfaces, andthe attenuated curvature at the near point for convexsurfaces.
Discussion
There have been many previous studies reported in theliterature that have attempted to assess which localattributes of texture (e.g., length, width, area, density, orforeshortening) are most informative for the perception ofthree-dimensional shape. One popular paradigm foraddressing this issue is to place different texture cues in
conflict with one another, either within static monocularimages (Attneave & Olson, 1966; Braunstein & Payne,1969; Cutting & Millard, 1984; Phillips, 1970; Rosenholtz& Malik, 1997; Todd & Akerstrom, 1987) or stereoscopicdisplays in which the texture information can also be inconflict with binocular disparity (Buckley, Frisby, &Blake, 1996; Cumming, Johnston, & Parker, 1993; Frisby& Buckley, 1992). The displays presented at inappropriateviewing angles in this study can be considered as a type ofcue conflict paradigm because the information providedby scaling gradients and by foreshortening in thosedisplays were inconsistent with one another. Anothertechnique for investigating this issue is to manipulate therelative reliability of the cues by adding random variationsto some local texture properties but not others (e.g., Knill,1998a, 1998b). The variable size dot texture used in thepresent experiment (see Figure 7) is a good example ofthis type of manipulation. To the extent that they matter,the size variations should impact the analysis of texturescaling but have little or no effect on the analysis offoreshortening.Following a spate of research on this topic in the late
1990s, many researchers concluded that texture foreshort-ening is the primary source of information for theperception of three-dimensional shape from texture,except perhaps in the special case of linear perspectivewhere an image contains a pattern of converging contours(for a review, see Knill, 1998b). However, more recentresearch has provided a growing body of evidence thatcasts doubt on this hypothesis (Li & Zaidi, 2000, 2001;Saunders & Backus, 2006; Todd, Oomes, Koenderink, &Kappers, 2004; Todd et al., 2005; Zaidi & Li, 2002), andthe results of the present experiment are particularlydamaging to it.If perceived three-dimensional shape were based on
texture foreshortening, then reducing the visual angle withwhich an image is viewed should cause a correspondingreduction in perceived depth, but the actual empiricalresults are in the opposite direction (see Figure 9). It isimportant to point out that there have been severalprevious studies that have investigated the effects ofviewing angle on perceived surface relief (Backus &Saunders, 2006; Farber & Rosinski, 1978; Lumsden,1983; Nichols & Kennedy, 1993; Smith, 1967), althoughnone of the previous discussions of this issue haveconsidered the theoretical significance of that manipula-tion for the analysis of texture foreshortening. Althoughthe size of the effect may vary, all of these studies agreethat when the viewing angle for a fixed visual image isdecreased, there is a corresponding increase in themagnitude of perceived depth.In principle, when an image of a surface with isotropic
texture is observed from the correct visual angle, ananalysis of the optical foreshortening field is capable ofproducing a veridical estimate of the depicted three-dimensional shape. However, the empirical evidence onhuman perception demonstrates quite clearly that
Journal of Vision (2007) 7(12):9, 1–16 Todd et al. 11
observers’ judgments of depth from texture are system-atically underestimated (e.g., Backus & Saunders, 2006;Tibau et al., 2001; Todd & Akerstrom, 1987; Todd et al.,2004, 2005). This could potentially be explained by aperceptual bias or by the effects of conflicting flatnesscues (e.g., see Backus & Saunders, 2006; Knill &Saunders, 2003), but neither of these influences canaccount for why convex surfaces appear to have greaterrelief than concave surfaces, or why the overall perceptualgain is influenced by the camera angle with which animage is rendered (see Figure 6).A reviewer of an earlier draft of this manuscript
suggested that these latter effects could perhaps beexplained if the effects of biases or flatness cues system-atically vary as a function of optical slant. Prior resultshave shown that differences among large surface slants aremore reliably discriminated than are comparable differ-ences among smaller slants (Knill, 1998a; Knill &Saunders, 2003). Thus, it might be reasonable to speculate
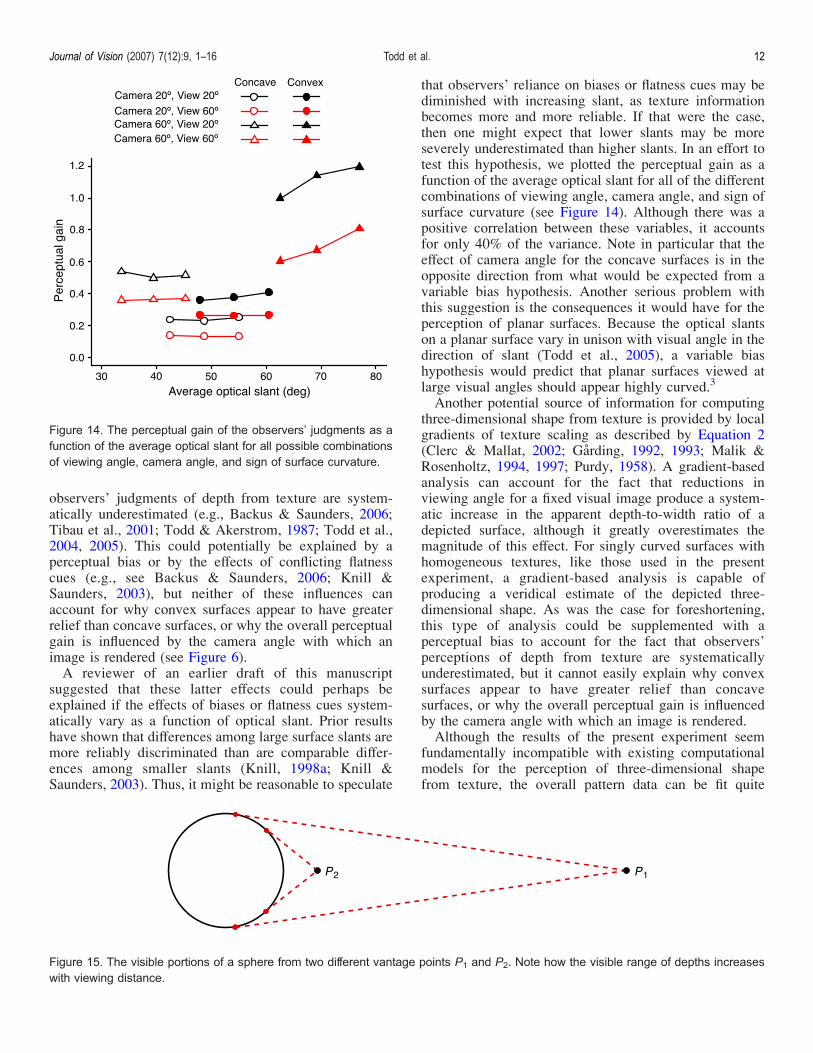
that observers’ reliance on biases or flatness cues may bediminished with increasing slant, as texture informationbecomes more and more reliable. If that were the case,then one might expect that lower slants may be moreseverely underestimated than higher slants. In an effort totest this hypothesis, we plotted the perceptual gain as afunction of the average optical slant for all of the differentcombinations of viewing angle, camera angle, and sign ofsurface curvature (see Figure 14). Although there was apositive correlation between these variables, it accountsfor only 40% of the variance. Note in particular that theeffect of camera angle for the concave surfaces is in theopposite direction from what would be expected from avariable bias hypothesis. Another serious problem withthis suggestion is the consequences it would have for theperception of planar surfaces. Because the optical slantson a planar surface vary in unison with visual angle in thedirection of slant (Todd et al., 2005), a variable biashypothesis would predict that planar surfaces viewed atlarge visual angles should appear highly curved.3
Another potential source of information for computingthree-dimensional shape from texture is provided by localgradients of texture scaling as described by Equation 2(Clerc & Mallat, 2002; Garding, 1992, 1993; Malik &Rosenholtz, 1994, 1997; Purdy, 1958). A gradient-basedanalysis can account for the fact that reductions inviewing angle for a fixed visual image produce a system-atic increase in the apparent depth-to-width ratio of adepicted surface, although it greatly overestimates themagnitude of this effect. For singly curved surfaces withhomogeneous textures, like those used in the presentexperiment, a gradient-based analysis is capable ofproducing a veridical estimate of the depicted three-dimensional shape. As was the case for foreshortening,this type of analysis could be supplemented with aperceptual bias to account for the fact that observers’perceptions of depth from texture are systematicallyunderestimated, but it cannot easily explain why convexsurfaces appear to have greater relief than concavesurfaces, or why the overall perceptual gain is influencedby the camera angle with which an image is rendered.Although the results of the present experiment seem
fundamentally incompatible with existing computationalmodels for the perception of three-dimensional shapefrom texture, the overall pattern data can be fit quite
Figure 14. The perceptual gain of the observers’ judgments as afunction of the average optical slant for all possible combinationsof viewing angle, camera angle, and sign of surface curvature.
Figure 15. The visible portions of a sphere from two different vantage points P1 and P2. Note how the visible range of depths increaseswith viewing distance.
Journal of Vision (2007) 7(12):9, 1–16 Todd et al. 12
closely with a relatively simple analysis of scalingcontrast. It should also be pointed out, however, thattexture scaling is inversely related to the density of opticaltexture perpendicular to the direction of slant, and that thecontrast of density is formally equivalent to the contrast ofscaling. Thus, another reasonable hypothesis from thesedata is that the judged relative depths were determinedfrom an analysis of texture density or spatial frequency inthe appropriate direction (see also Thaler, Todd, &Dijkstra, 2007; Todd et al., 2005). These hypotheses canaccount for all of the different stimulus factors thatinfluenced the observers’ perceptions. They can accuratelypredict the relative magnitude of apparent depth overchanges in the viewing angle, the camera angle, the signof surface curvature, and the depicted surface depth. Inaddition, they can also predict the apparent outwardbowing of the surface asymptotic lines for convexsurfaces, and the attenuated curvature at the near pointfor convex surfaces.Despite the impressive performance of the scaling
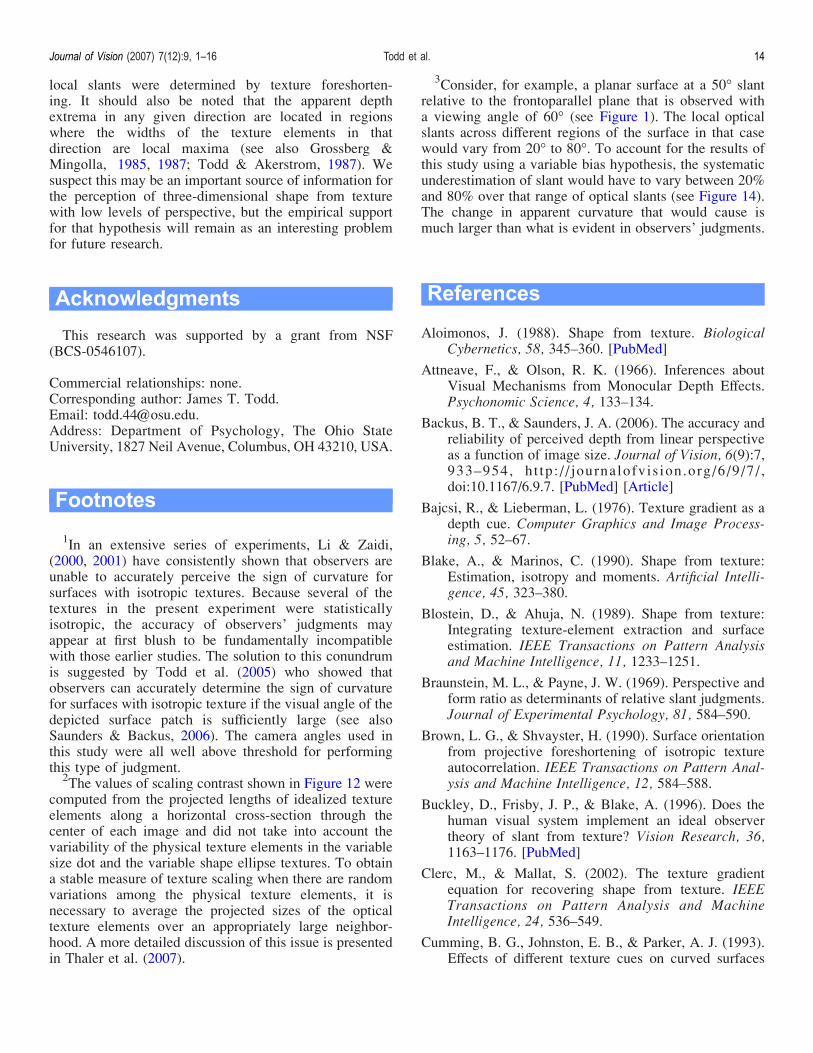
contrast model for explaining the results of this study,there is an important limitation of the model that deservesto be highlighted. To exploit variations in texture scalingfor determining apparent three-dimensional shape, thescaling variations must be large enough to be reliablydetected. For surfaces that are planar or asymptoticallyplanar, like the ones used in the present experiment, thevariations in scaling can be arbitrarily large. That is notthe case, however, for surfaces that are more continuouslycurved. To demonstrate this more clearly, it is useful toconsider the optical projection of a sphere, as is schemati-cally represented in Figure 15. As the viewing distance toa sphere becomes smaller and smaller, the increase inscaling contrast is limited because more and more of thesurface becomes self-occluded.If texture scaling is the primary source of information
for the perceived three-dimensional shape of anyparticular surface configuration, then its apparent reliefshould be greatly reduced or eliminated when the surfaceis rendered under orthographic projection to remove all
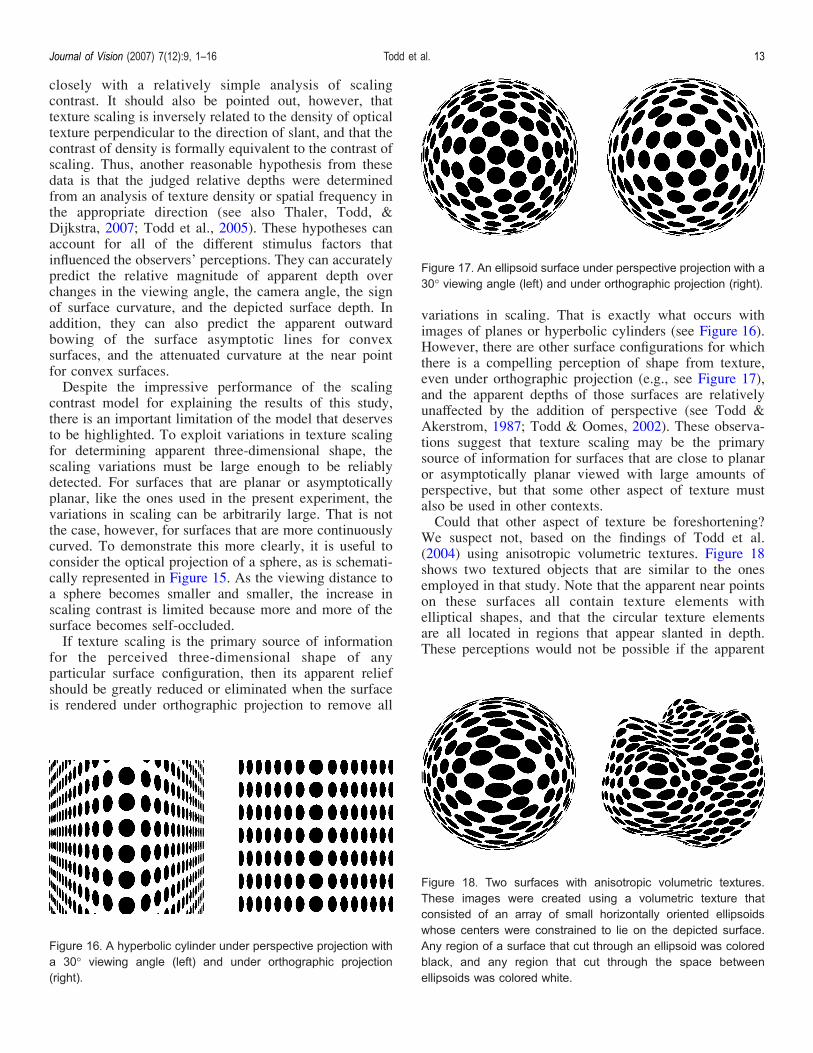
variations in scaling. That is exactly what occurs withimages of planes or hyperbolic cylinders (see Figure 16).However, there are other surface configurations for whichthere is a compelling perception of shape from texture,even under orthographic projection (e.g., see Figure 17),and the apparent depths of those surfaces are relativelyunaffected by the addition of perspective (see Todd &Akerstrom, 1987; Todd & Oomes, 2002). These observa-tions suggest that texture scaling may be the primarysource of information for surfaces that are close to planaror asymptotically planar viewed with large amounts ofperspective, but that some other aspect of texture mustalso be used in other contexts.Could that other aspect of texture be foreshortening?
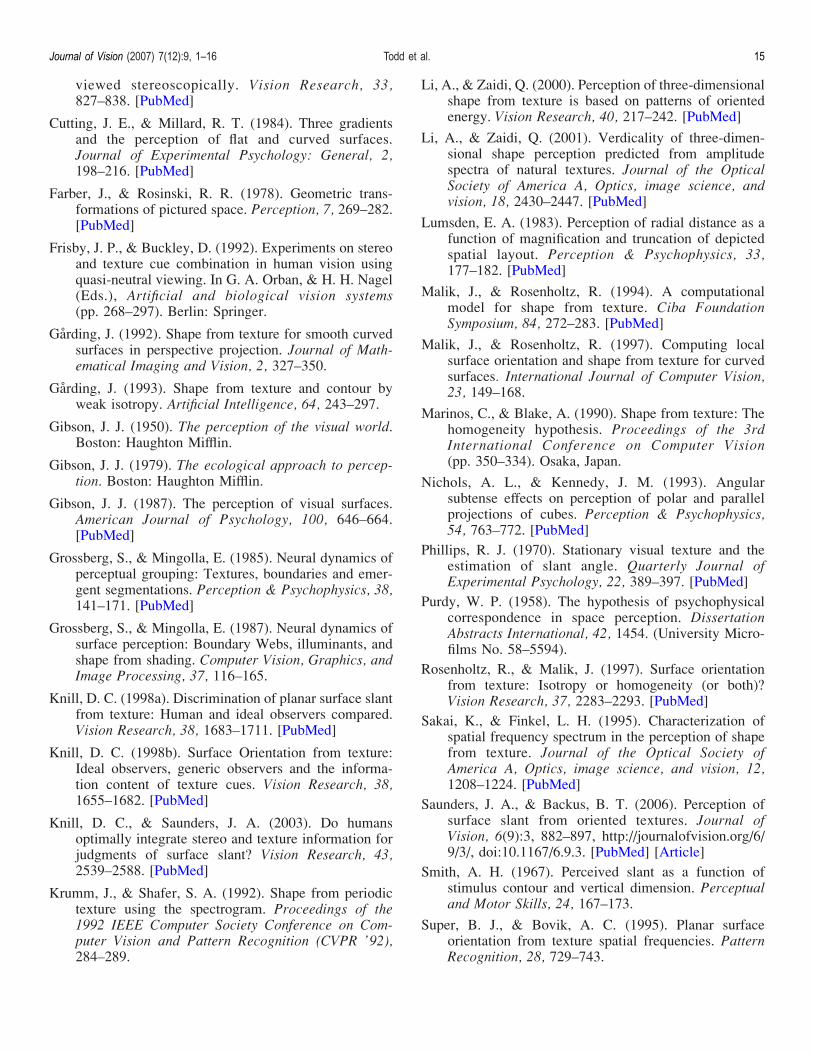
We suspect not, based on the findings of Todd et al.(2004) using anisotropic volumetric textures. Figure 18shows two textured objects that are similar to the onesemployed in that study. Note that the apparent near pointson these surfaces all contain texture elements withelliptical shapes, and that the circular texture elementsare all located in regions that appear slanted in depth.These perceptions would not be possible if the apparent
Figure 16. A hyperbolic cylinder under perspective projection witha 30- viewing angle (left) and under orthographic projection(right).
Figure 17. An ellipsoid surface under perspective projection with a30- viewing angle (left) and under orthographic projection (right).
Figure 18. Two surfaces with anisotropic volumetric textures.These images were created using a volumetric texture thatconsisted of an array of small horizontally oriented ellipsoidswhose centers were constrained to lie on the depicted surface.Any region of a surface that cut through an ellipsoid was coloredblack, and any region that cut through the space betweenellipsoids was colored white.
Journal of Vision (2007) 7(12):9, 1–16 Todd et al. 13
local slants were determined by texture foreshorten-ing. It should also be noted that the apparent depthextrema in any given direction are located in regionswhere the widths of the texture elements in thatdirection are local maxima (see also Grossberg &Mingolla, 1985, 1987; Todd & Akerstrom, 1987). Wesuspect this may be an important source of information forthe perception of three-dimensional shape from texturewith low levels of perspective, but the empirical supportfor that hypothesis will remain as an interesting problemfor future research.
Acknowledgments
This research was supported by a grant from NSF(BCS-0546107).
Commercial relationships: none.Corresponding author: James T. Todd.Email: [email protected]: Department of Psychology, The Ohio StateUniversity, 1827 Neil Avenue, Columbus, OH 43210, USA.
Footnotes
1In an extensive series of experiments, Li & Zaidi,
(2000, 2001) have consistently shown that observers areunable to accurately perceive the sign of curvature forsurfaces with isotropic textures. Because several of thetextures in the present experiment were statisticallyisotropic, the accuracy of observers’ judgments mayappear at first blush to be fundamentally incompatiblewith those earlier studies. The solution to this conundrumis suggested by Todd et al. (2005) who showed thatobservers can accurately determine the sign of curvaturefor surfaces with isotropic texture if the visual angle of thedepicted surface patch is sufficiently large (see alsoSaunders & Backus, 2006). The camera angles used inthis study were all well above threshold for performingthis type of judgment.
2The values of scaling contrast shown in Figure 12 were
computed from the projected lengths of idealized textureelements along a horizontal cross-section through thecenter of each image and did not take into account thevariability of the physical texture elements in the variablesize dot and the variable shape ellipse textures. To obtaina stable measure of texture scaling when there are randomvariations among the physical texture elements, it isnecessary to average the projected sizes of the opticaltexture elements over an appropriately large neighbor-hood. A more detailed discussion of this issue is presentedin Thaler et al. (2007).
3Consider, for example, a planar surface at a 50- slant
relative to the frontoparallel plane that is observed witha viewing angle of 60- (see Figure 1). The local opticalslants across different regions of the surface in that casewould vary from 20- to 80-. To account for the results ofthis study using a variable bias hypothesis, the systematicunderestimation of slant would have to vary between 20%and 80% over that range of optical slants (see Figure 14).The change in apparent curvature that would cause ismuch larger than what is evident in observers’ judgments.
References
Aloimonos, J. (1988). Shape from texture. BiologicalCybernetics, 58, 345–360. [PubMed]
Attneave, F., & Olson, R. K. (1966). Inferences aboutVisual Mechanisms from Monocular Depth Effects.Psychonomic Science, 4, 133–134.
Backus, B. T., & Saunders, J. A. (2006). The accuracy andreliability of perceived depth from linear perspectiveas a function of image size. Journal of Vision, 6(9):7,933–954, ht tp : / / journalofvis ion.org/6/9/7/ ,doi:10.1167/6.9.7. [PubMed] [Article]
Bajcsi, R., & Lieberman, L. (1976). Texture gradient as adepth cue. Computer Graphics and Image Process-ing, 5, 52–67.
Blake, A., & Marinos, C. (1990). Shape from texture:Estimation, isotropy and moments. Artificial Intelli-gence, 45, 323–380.
Blostein, D., & Ahuja, N. (1989). Shape from texture:Integrating texture-element extraction and surfaceestimation. IEEE Transactions on Pattern Analysisand Machine Intelligence, 11, 1233–1251.
Braunstein, M. L., & Payne, J. W. (1969). Perspective andform ratio as determinants of relative slant judgments.Journal of Experimental Psychology, 81, 584–590.
Brown, L. G., & Shvayster, H. (1990). Surface orientationfrom projective foreshortening of isotropic textureautocorrelation. IEEE Transactions on Pattern Anal-ysis and Machine Intelligence, 12, 584–588.
Buckley, D., Frisby, J. P., & Blake, A. (1996). Does thehuman visual system implement an ideal observertheory of slant from texture? Vision Research, 36,1163–1176. [PubMed]
Clerc, M., & Mallat, S. (2002). The texture gradientequation for recovering shape from texture. IEEETransactions on Pattern Analysis and MachineIntelligence, 24, 536–549.
Cumming, B. G., Johnston, E. B., & Parker, A. J. (1993).Effects of different texture cues on curved surfaces
Journal of Vision (2007) 7(12):9, 1–16 Todd et al. 14
viewed stereoscopically. Vision Research, 33,827–838. [PubMed]
Cutting, J. E., & Millard, R. T. (1984). Three gradientsand the perception of flat and curved surfaces.Journal of Experimental Psychology: General, 2,198–216. [PubMed]
Farber, J., & Rosinski, R. R. (1978). Geometric trans-formations of pictured space. Perception, 7, 269–282.[PubMed]
Frisby, J. P., & Buckley, D. (1992). Experiments on stereoand texture cue combination in human vision usingquasi-neutral viewing. In G. A. Orban, & H. H. Nagel(Eds.), Artificial and biological vision systems(pp. 268–297). Berlin: Springer.
Garding, J. (1992). Shape from texture for smooth curvedsurfaces in perspective projection. Journal of Math-ematical Imaging and Vision, 2, 327–350.
Garding, J. (1993). Shape from texture and contour byweak isotropy. Artificial Intelligence, 64, 243–297.
Gibson, J. J. (1950). The perception of the visual world.Boston: Haughton Mifflin.
Gibson, J. J. (1979). The ecological approach to percep-tion. Boston: Haughton Mifflin.
Gibson, J. J. (1987). The perception of visual surfaces.American Journal of Psychology, 100, 646–664.[PubMed]
Grossberg, S., & Mingolla, E. (1985). Neural dynamics ofperceptual grouping: Textures, boundaries and emer-gent segmentations. Perception & Psychophysics, 38,141–171. [PubMed]
Grossberg, S., & Mingolla, E. (1987). Neural dynamics ofsurface perception: Boundary Webs, illuminants, andshape from shading. Computer Vision, Graphics, andImage Processing, 37, 116–165.
Knill, D. C. (1998a). Discrimination of planar surface slantfrom texture: Human and ideal observers compared.Vision Research, 38, 1683–1711. [PubMed]
Knill, D. C. (1998b). Surface Orientation from texture:Ideal observers, generic observers and the informa-tion content of texture cues. Vision Research, 38,1655–1682. [PubMed]
Knill, D. C., & Saunders, J. A. (2003). Do humansoptimally integrate stereo and texture information forjudgments of surface slant? Vision Research, 43,2539–2588. [PubMed]
Krumm, J., & Shafer, S. A. (1992). Shape from periodictexture using the spectrogram. Proceedings of the1992 IEEE Computer Society Conference on Com-puter Vision and Pattern Recognition (CVPR ’92),284–289.
Li, A., & Zaidi, Q. (2000). Perception of three-dimensionalshape from texture is based on patterns of orientedenergy. Vision Research, 40, 217–242. [PubMed]
Li, A., & Zaidi, Q. (2001). Verdicality of three-dimen-sional shape perception predicted from amplitudespectra of natural textures. Journal of the OpticalSociety of America A, Optics, image science, andvision, 18, 2430–2447. [PubMed]
Lumsden, E. A. (1983). Perception of radial distance as afunction of magnification and truncation of depictedspatial layout. Perception & Psychophysics, 33,177–182. [PubMed]
Malik, J., & Rosenholtz, R. (1994). A computationalmodel for shape from texture. Ciba FoundationSymposium, 84, 272–283. [PubMed]
Malik, J., & Rosenholtz, R. (1997). Computing localsurface orientation and shape from texture for curvedsurfaces. International Journal of Computer Vision,23, 149–168.
Marinos, C., & Blake, A. (1990). Shape from texture: Thehomogeneity hypothesis. Proceedings of the 3rdInternational Conference on Computer Vision(pp. 350–334). Osaka, Japan.
Nichols, A. L., & Kennedy, J. M. (1993). Angularsubtense effects on perception of polar and parallelprojections of cubes. Perception & Psychophysics,54, 763–772. [PubMed]
Phillips, R. J. (1970). Stationary visual texture and theestimation of slant angle. Quarterly Journal ofExperimental Psychology, 22, 389–397. [PubMed]
Purdy, W. P. (1958). The hypothesis of psychophysicalcorrespondence in space perception. DissertationAbstracts International, 42, 1454. (University Micro-films No. 58–5594).
Rosenholtz, R., & Malik, J. (1997). Surface orientationfrom texture: Isotropy or homogeneity (or both)?Vision Research, 37, 2283–2293. [PubMed]
Sakai, K., & Finkel, L. H. (1995). Characterization ofspatial frequency spectrum in the perception of shapefrom texture. Journal of the Optical Society ofAmerica A, Optics, image science, and vision, 12,1208–1224. [PubMed]
Saunders, J. A., & Backus, B. T. (2006). Perception ofsurface slant from oriented textures. Journal ofVision, 6(9):3, 882–897, http://journalofvision.org/6/9/3/, doi:10.1167/6.9.3. [PubMed] [Article]
Smith, A. H. (1967). Perceived slant as a function ofstimulus contour and vertical dimension. Perceptualand Motor Skills, 24, 167–173.
Super, B. J., & Bovik, A. C. (1995). Planar surfaceorientation from texture spatial frequencies. PatternRecognition, 28, 729–743.
Journal of Vision (2007) 7(12):9, 1–16 Todd et al. 15

Thaler, L., Todd, J. T., & Dijkstra, T. M. (2007). Theeffects of phase on the perception of 3D shape fromtexture: Psychophysics and modeling. VisionResearch, 47, 411–427. [PubMed]
Tibau, S., Willems, B., Van Den Berg, E., & Wagemans, J.(2001). The role of the center of projection in theestimation of slant from texture of planar surfaces.Perception, 30, 185–193. [PubMed]
Todd, J. T., & Akerstrom, R. A. (1987). Perception ofthree dimensional form from patterns of opticaltexture. Journal of Experimental Psychology: HumanPerception and Performance, 2, 242–255. [PubMed]
Todd, J. T., & Oomes, A. H. (2002). Generic and non-generic conditions for the perception of surface shapefrom texture. Vision Research, 42, 837–850. [PubMed]
Todd, J. T., Oomes, A. H., Koenderink, J. J., & Kappers,A. M. (2004). The Perception of doubly curvedsurfaces from anisotropic textures. PsychologicalScience, 15, 40–46. [PubMed]
Todd, J. T., Thaler, L., & Dijkstra, T. M. (2005). Theeffects of field of view on the perception of 3D slantfrom texture. Vision Research, 45, 1501–1517.[PubMed]
Witkin, A. P. (1981). Recovering surface shape andorientation from texture. Artificial Intelligence, 17,17–45.
Zaidi, Q., & Li, A. (2002). Limitations on shapeinformation provided by texture cues. VisionResearch, 42, 815–835. [PubMed]
Journal of Vision (2007) 7(12):9, 1–16 Todd et al. 16