Embed Size (px)
Citation preview
3
Xq
Malte Hemsing
Fadi Baker
The Effects of Tight Budgetary
Control on Managerial Behaviour in the Swedish Public Sector: Emphasizing Motivation, Commitment,
Satisfaction, and Stress
Business Administration
Master’s Thesis 15 ECTS
Term: Spring 2013 Supervisor: Johan Quist

3
Abstract
This thesis study is about the effects of tight budgetary control on managerial
behaviour in the Swedish public sector. Managerial behaviour represents the four
variables; motivation, organizational commitment, stress, and satisfaction. As
previous research mostly investigated the effects of tight budgetary control on
organizational performance in the private sector, this study can be seen as one of the
first that focus on managerial behaviour and is based on the public sector. For the
data collection process, an online questionnaire was created that has been distributed
via email to the different participants. Moreover, the study is based on a sample of 62
managers from different municipalities and universities throughout Sweden.
The result of the thesis research study revealed that the majority of the local
managers in the Swedish public sector actually experience tight budgetary control.
Furthermore, the statistical test of the created hypotheses showed that the
behavioural factors, both, organizational commitment and stress were respectively
negatively and positively related with tight budgetary control. However, for the
behavioural variables of motivation and satisfaction no significant results have been
found.
Keywords: Tight budgetary control, motivation, organization commitment, stress,
satisfaction.
4
Table of Contents 1. Chapter: Background ................................................................................................. 6
1.1. Introduction ............................................................................................... 6 1.2. The Central Government and the local Governmental Organizations ...... 8 1.3. Fiscal Policy and Public Budgeting in Sweden ...................................... 10 1.4. Problem definition: ................................................................................. 11 1.5. Research Questions ................................................................................. 12 1.6. Methods: ................................................................................................. 13
2. Chapter: Literature Review ....................................................................................... 14
2.1. Budget Definition .................................................................................... 14 2.2. Budgets as Control Mechanism .............................................................. 15
2.2.1. Budget Control ............................................................................................. 17
2.2.2. Tight Budgetary Control ............................................................................. 18
2.3. Managerial behaviour ............................................................................. 19 2.4. Motivation ............................................................................................... 20 2.5. Organizational Commitment ................................................................... 21 2.6. Stress ....................................................................................................... 23 2.7. Job Satisfaction ....................................................................................... 24
3. Chapter: Research Methodology ............................................................................. 26
3.1. Research Approach ................................................................................. 26 3.1.1. Quantitative Research Approach ............................................................... 26
3.2. Data Collection Method .......................................................................... 27 3.2.1. Sampling ........................................................................................................ 27
3.2.2. Response Rate .............................................................................................. 28
3.2.3. Questionnaire ................................................................................................ 29
3.3. Research Model and Hypotheses Formulation ....................................... 30 3.3.1. Hypotheses Formulation ............................................................................ 31
3.4. Process of Analysing the Data and Testing the Hypotheses ................... 33 3.5. Reflection and Limitations of the Data Collection Process .................... 34
4. Chapter: Results and Analysis ................................................................................. 35
4.1. Reliability Analysis and Index creation .................................................. 35 4.2. Overview of the Descriptive Statistics .................................................... 36 4.3. Do the respondents really experience TBC? ........................................... 37 4.4. MANOVA and Hypotheses Testing with SPSS ..................................... 40
5. Chapter: Discussion ................................................................................................. 47
5
6. Chapter: Conclusion ................................................................................................ 50 7. References: ............................................................................................................... 52 8. Appendix .................................................................................................................. 58
8.1. Survey Questionnaire: ............................................................................ 58 8.2. Detailed description of Index Creation ................................................... 69
8.2.1. Tight Budget Control Index ....................................................................... 69
8.2.2. Motivation Index .......................................................................................... 69
8.2.3. Commitment Index ...................................................................................... 70
8.2.4. Satisfaction Index ......................................................................................... 70
8.2.5. Stress Index ................................................................................................... 70
6
1. Chapter: Background
The background part of the Thesis will first give an overall introduction to the topic and highlight how the current economic situation is highly appropriate to discuss the topic of Tight Budgetary Control. Second, as the Thesis focus on the Swedish public sector, an overview about the Swedish government system, as well as an overview about the historical and current economic situation in Sweden is given and the Swedish budgeting process is discussed. Third, the main problem is defined, the research questions are identified and a first overview of the methods for data and literature collection is stated.
1.1. Introduction
Since many years, budgets are used throughout private and public organizations to
set objectives and to control and align managers’ behaviour. Depending on whether
the organization is operating in the private or public sector, the budget is established
in order to fulfil certain requirements. Considering the performance requirement for
the budget, the private sector is profit orientated, whereas the public sectors budget
achievements are evaluated based on services provided by the organization.
However, as the thesis has its main focus on the public sector, one can emphasis that
public organizations recognized major challenges in the way their budgets were
affected over the recent years (Nutt 2005).
The Financial Crisis of 2008, as well as the current Euro-crisis heavily impacted the
financial and economic situation of most European countries and forced them to
rapidly adapt their financial and budgetary policies according to austerity plans and
rising deficits. As the new policies required major cuts in public budgets, in order to
decrease deficits and governmental debt levels, there has been major needs for
effective governance and budgetary control to ensure sound governmental financial
management and probity (Oecd.org 2013).
However, these governmental austerity policies not only affect the general public
with the burden of decreased public services provided to the population, increased
unemployment rates, and more poverty, but also have an effect on budgetary control
measures and how freely mangers of public organization are able to spend
government budgets. Furthermore, this means that managers of public, as well as
7
private organizations, are probably closer monitored how to spend the budget in
times of austerity or economically difficult situations. As the technical term of setting
a budget is considered as the budgetary process, accountants view the process of
monitoring how the budget is spend as budgetary control (Banks & Giliberti 2008).
Budgetary control represents a widely applied mechanism to assess the performance
of managers and to communicate the objectives, strategy, and planning process, how
an organization is able to obtain the desired outcome while closely monitoring
expenditure. Hence, it is also often used as a tool to form cultivate and supportive
behaviour of managers, that is aligned with the organizational objectives.
Nevertheless, the level of participation and support depends on the budgeting
approach of the organization’s top management (Banks & Giliberti 2008).
Organizations can apply two types of behavioural budgeting. On the one hand,
management is able to apply an authoritarian approach, which builds upon a
hierarchical structure with many layers of control and supervision to enforce that
organizational requirements are implemented according to the desire of top
management. This approach to budgeting is widely known as “top-down” approach,
where top management decides on budget targets and closely monitors managerial
implementation. In the case at hand, this approach can also be considered, taking the
previous research of Van der Stede (2001) into account, as a tight budgetary control
approach.
On the other hand, the “bottom-up” approach relies on the participation of
individuals by taking active participation in the budgeting process. However, this
approach is often considered to increase individuals’ motivation and could be related
to a loose budgetary control approach, which has been described by Van der Stede
(2001).
Nevertheless, during the last 20 years, many researchers in the area of accounting
were engaged in intensive empirical investigations into the relationship between
participative budget setting and its resulting performance. However, especially in the
field of tight budgetary control (TBC) many areas of research remained to be
discovered. Van der Stede (2001), who investigated as one of the first the different
8
measures of tight budgetary control, delivered quite interesting results how to
determine whether a firm uses either a tight or loose budgetary control approach.
Based on the findings of Van der Stede (2001) and the current economic situation in
Europe, still struggling the remains of the Financial Crisis and Euro Crisis, gives an
opportunity for this thesis to investigate how managerial behaviour is influenced by
economic difficult times and expected implementation of tight budgetary control
mechanism in the public sector.
In the remainder of this thesis, the study will focus on the following topics of
interest. The first chapter will discuss the background information, the problem
definition as well as the research questions for this thesis. The second chapter will
critically review existing literature about the topic and highlight the different variables
more specifically. The third chapter about the methodology describes the nature of
the research approach, the development of the survey questionnaire, and the
hypothesis development process. The fourth chapter will analyse the collected data
and statistically test the developed hypotheses. The fifth chapter discuss critically the
result of the analysis and makes a comparison to previous research findings. The last
chapter will summarize the findings of the thesis in the conclusion and gives
recommendation for further research in this area.
1.2. The Central Government and the local Governmental Organizations
In order to better understand the Swedish government system, which is necessary to
get a general overview how different public organizations or government institutions
are effected by TBC, the thesis will elaborate on the Swedish governmental system.
The Swedish governmental system includes three levels; the national government, the
regional government, and the local government. Moreover, as Sweden has become a
member of the European Union, there has been an additional European
governmental level, which has acquired increasing importance during the last years.
9
At the national government level, the Swedish population is represented by the
Riksdag, which is the Swedish parliament and has legislative power. Moreover, the
Riksdag represents the governmental body that acts as the main decision-making
body and is elected every four years by the Swedish population. As the main
decision-making body the Riksdag makes decisions about the laws that have to be
adopted by the government, determines the central government budget, evaluates the
work of the public agencies and the government, cooperates with the EU, and
creates foreign policies. However, the decisions and policies, which are discussed and
declared by the Riksdag, have to be implemented by the government. Furthermore,
the different governmental agencies support the government, which are different
ministries as for example the Ministry of Education and Science, which is in turn
responsible for university sector. Thus, universities underlie national responsibility
(Regeringskansliet 2013).
The governance body that follows after the national level is the regional level, it has
to be mentioned that Sweden is divided into 21 regional counties. Each of these
regions has a regional government that embodies the county councils and the county
administrative boards. The responsibility of the regional institution is for example the
health care system and the regional hospitals, just to mention one area
(Regeringskansliet 2013).
Considering the local government level, Sweden is divided into 290 local
municipalities. Each of the municipalities represents an elected council that is in
charge for the decisions on a municipal level. The different municipalities play an
important role in the Swedish governmental system due to the fact that they are
responsible for a wide range of decisions, which affect local services and facilities
including infrastructure, water supply, schools, elderly care and children care.
Furthermore, the municipalities are authorized to envy income tax on the local
residents and are able to charge for local services. Hence, the local municipalities are
able to select from a wide spectrum which services to provide. Nevertheless, they are
still committed to offer certain basic services (Regeringskansliet 2013).
10
1.3. Fiscal Policy and Public Budgeting in Sweden
Nowadays, the Swedish economy seems to be one of the strongest in Europe and
due to the fact that Sweden does not belong to the Euro currency area, the economy
is also not as heavily affected by the current Euro-crisis. However, the following part
will give an overview how suddenly the economy can change based on historical facts
and the Swedish budgeting process, as well as the current economic situation in
Sweden is discussed.
In the late 1980s, Sweden recognized the largest budget surpluses among all OECD
countries. But only few years later, in the 1990s, the country experienced the largest
deficit from all OECD countries and at the same time government debt almost
doubled. However, Sweden managed to balance out the deficit by the end of the
1990s and was recognized from then on as a stable country with significant surpluses
until the financial crisis hit the Swedish economy. The result of the financial crisis has
been a deficit of around 1 percent of the Gross Domestic Product (GDP), which was
turned into a small surplus by 2011 due to subdued economic developments.
However, in the course of the Euro-crisis, also the Swedish economy had to suffer,
which was reflected in a decrease in net lending and a small deficit for 2012 that is
also expected to be reflected in the result of 2013. Nevertheless, forecasts predict the
deficit to be recovered by 2014 (Regeringskansliet 2013).
The Swedish budgeting process includes two annual presentations, where the
Swedish Finance Minister presents the Fiscal Policy Bill and the Government’s
Budget Bill in front of the Riksdag. The two documents differ mainly in content. The
Fiscal Policy Bill, which is presented in spring, includes proposed guidelines for
budget policy and economic policy for the next couple of years. The Budget Bill, in
turn, which is presented in autumn, transfers these suggested guidelines into a central
government budget for the coming year. This means that the Budget Bill includes
detailed expenditure distributions for the different public areas. However, one of the
most important decisions of the Riksdag is regarding the proposed Budget Bill and
its revenue and expenditure distribution because after the Riksdag has agreed to the
Budget Bill, the Government is able to use the central government budget.
Moreover, the Government is supported by around 390 government agencies that
help to implement the decisions of the Riksdag. Furthermore, the government
11
budget is distributed to the public sector, which includes the central government,
county councils, and the municipalities. Nevertheless, the central government closely
monitors on which part of the public sector the money is spend (Regeringskansliet
2013).
Considering the tax system in Sweden it can be mentioned that the municipalities are
not solely dependent on the central government budget due to the fact that the local
municipalities are entitled to envy income tax. Hence, it could be that different
municipalities recognize slightly different tax rates, which in turn can be used to
increase local municipality budgets (Regeringskansliet 2013).
1.4. Problem definition:
As most countries experience the fifth year of economic recession due to the events
of the global financial crisis of 2008 and European debt crisis, the overall condition
of financial markets have been stabilized. Nevertheless, the international situation is
still frightening, as Euro countries recognize weak economic growth and the United
States reflects a slowdown in economic health (Regeringskansliet 2013).
These events heavily affect the performance of the Swedish economy by reflecting
rising unemployment rates and low economic growth in 2012(Regeringskansliet
2013). However, as economist expected that the current situation will continue
through 2013 and 2014, the central government is expected to cut budgets and to
apply a TBC system. The increase in control of public spending is expected to affect
local governments throughout Sweden and local politicians and leaders of
municipalities are required to adjust budgets for public services. However, local
politicians, public department managers, and board members of the local
municipalities, will be affected by increased control how public spending is
distributed, which in turn, is expected to influence managerial behaviour.
As previous researchers, such as Van der Stede (2001), have highlighted in their
findings that management control system should be adopted to changing
environmental events, they noticed that times of financial distress and economic
12
downturns are most likely closely related to the implementation of TBC systems.
Furthermore, the implementation of TBC system is expected to have an effect on
managerial dysfunctional behaviour and managerial short-term orientation. The cause
for the expectation of such negative consequences is that employees, mostly on the
managerial level, are only evaluated whether or not they achieve budget targets (Van
der Stede 2000).
Considering the current economic situation and the above described effects of
governmental intervention, as well as the expected effect on managerial behaviour
increases the importance for research in this area. Hence, this Master Thesis will
carefully investigate the Effects of Tight Budgetary Control on Managerial Behaviour
in the Swedish Public Sector and will pay special intention into the investigation of
four behavioural variables. These four behavioural variables are motivation,
organizational commitment, stress, and satisfaction.
1.5. Research Questions
In order to answer the problem statement of this thesis and to give some reasonable
advise how the relationship between TBC and the four behavioural variables, which
are motivation, organizational commitment, stress, and satisfaction, can be described,
the study attempts to answer the following main research question and the identified
sub-research questions.
Main Research Question:
• What is the effect of using TBC on managerial behaviour?
Sub – Research Questions:
• How does TBC affect managerial motivation?
• What is the impact of using TBC on managerial organizational commitment?
• Does the implantation of TBC increases managerial stress?
13
• What is the effect of TBC on managerial satisfaction?
1.6. Methods:
In order to answer the proposed research questions about the effects of TBC on
managerial behaviour in the Swedish public sector, the thesis will make use of
primary data and academic literature.
The first part of the thesis, which is based on a theoretical approach will review
existing literature about budgetary control and the four behavioural variables;
motivation, organizational commitment, stress, and satisfaction. In this part, the
study mainly relies on the use of academic literature, which has been collected
through the search of academic databases and Internet search engines, such as
Google. The collected literature mainly consists of academic journals, academic
education literature, and governmental reports about budgeting and forecast for the
Swedish economy, which were found on the Swedish government website.
For the second part of the thesis, the study relies on the use of primary source data.
The primary data has been collected through the distribution of an online survey,
which was sent to politicians, department managers, and leaders in different Swedish
municipalities.
However, detailed description of the data collection process and about the
development of the survey questionnaire can be found in the methodology section.
14
2. Chapter: Literature Review
In the following section, the study will review existing literature about budgets, budgets as control
mechanism, budgetary control, tight budgetary control, and discuss the four behavioural variables
motivation, organizational commitment, stress, and satisfaction.
2.1. Budget Definition
Based on the financial literature, a budget is a financial plan that is used to help
coordinate business activities, whereas cash is budgeted most often (Harrison &
Horngren 2008).
According to Argyris (1953), budgets represent accounting techniques, which are
created in order to control costs through people. These accounting techniques have a
large impact on the behaviour of most people within an organization due to the fact
that not achieving certain budget objective often involve punishment, where in turn,
meeting these budget targets reflect great rewards for employees. Comparing the
view on budgets from Argyris (1953) with more recent literature by Drake and
Fabozzi (2010), who also emphasize the importance of budgets as “most successful
management techniques” to control managers and to align them to organizational
objectives, which can have a quite rewarding impact if the budgeting process is well
understood, shows that the interpretation has remained quite the same over the last
years. However, as budgets are present within each definition process, creation
process, or implement process of an organizational policy, they can have a huge
direct effect on the behaviour of employees; thus it is highly interesting to further
investigate them.
Furthermore, Argyris (1953) mentioned in his research that a negative association of
human behaviour towards the implementation of budgets could be explained by
keeping the following points in mind.
1) Budgets are evaluation techniques. Because they try to create goals against which
to measure employees’ performance, they naturally are complained about.

15
2) Budgets represent one of the few evaluation methods, which are always in writing
and consequently concrete. Hence, supervisors could use them once in a while as
“whipping posts”, which means that they use them in a way to complain about
certain totally unrelated issues.
3) Budgets can be seen as pressure devises. Hence, they can create the same
unfavourable reactions as any other pressure mean could produce.
This means if top management carefully considers the three points mentioned above
and formulate budgets in a way that subordinates are able to interpret them in the
correct manner, and are not forced to apply dysfunctional behaviour to enforce
budget objectives, they are most likely to stimulate the achievement of organizational
and behavioural goals. According to Tyales (1998) budgets can have a motivational
effect on managers but only if managers think that they are also most likely to
achieve the budget objectives. Also Raghunandan et al. (2012) agree with the fact that
social and behavioural aspects are an integral part of the budgeting process and that
organizations have to carefully consider those effects as budget achievement heavily
depend on the commitment of managers and employees.
2.2. Budgets as Control Mechanism
Previous literature has concentrated on different kinds of measurements, which are
used to control different kind of issues. Drucker (1964) emphasized a distinction
between “controls” and “control” and mentioned that more “controls” do not
necessarily leads towards more “control”.
„Controls deal with facts, that is, the events of the past. Control deals with expectations, that is,
with the future. Controls are analytical and operational, concerned with what was and what is.
Control is normative, concerned with what ought to be, with significance rather than meaning.“
(Drucker 1964; 286).
This means that “Controls” is concerned with measurement and information,
whereas “Control” refers to giving directions. However, the expression “control” is
16
used and described in many different ways. There are authors that describe the
expression in a narrowly way that mostly consider the process of measurement and
feedback. Other authors, such as Merchant (1985), follow a rather wider definition
based on a behavioural sense that embraces everything that ensures that employees in
an organization implement strategies as previously determined. Moreover, Ouchi
(1979) and Merchant (1998) adopted an approach that identifies control mechanism
in three specific categories:
1) Behavioural control
2) Clan and social control
3) Output control
Behavioural control refers to the control of certain behavioural actions of employees.
This control approach is only effective if managers are aware of the behaviour that is
beneficial and also are able to influence the outcome of the action. This means that
managers have to observe individuals while they are working (Merchant 1998).
Clan and social control is the same as personal or cultural control. However, personal
control is defined as supporting the employees to execute their task in the right way
by forming the individual’s innate natural tendencies to act accordingly and to
control themselves. Cultural control is based on the shared values, beliefs, and norms
of the employees of an organization, which in turn, affect the action of them. Means,
which are used to align those values of individuals in an organization, are for example
the Code of Conduct or group incentive systems (Merchant 1998).
Output control can be achieved by implementing performance measures in order to
decrease inappropriate behaviour, set performance objectives, evaluate performance,
and to either punish or reward goal achievements. This is necessary due to the fact
that there could be a conflict of interest between the individuals and the
organization; hence to align the interest of both parties, control mechanism are
necessary (Macintosh & Quattrone 2010).
Management accounting control systems are the most often applied control forms in
organizations. However, there are a variety of explanations why management
accounting control systems recognize such a high rate of implementation throughout
businesses.
17
First, as most organizations are involved in a variety of different activities, they have
to find a common measure to express the result of all their different operations.
Second, the accounting measures produce all relevant liquidity and profitability
measures, which are requested by stakeholders of the firm in order to judge the
overall financial performance of the organization. Third, financial output control is
even recommended in uncertain conditions when other activities are unclear, for
example by considering market developments (Macintosh & Quattrone 2010).
Management accounting control systems are divided into two main components. The
first one reflects the formal planning process, which in turn includes long-term
planning and budgeting in order to set objectives. The second one involves the
establishment of the so-called responsibility center, which include centers for
revenue, cost, profit, and investments. The above mentioned two components can be
used as control mechanism by considering derivations from the pre-set performance
objectives, based on which managers’ performance can be evaluated.
2.2.1. Budget Contro l
Budgetary control can be explained as the process of using budgets as control
mechanism to evaluate managers’ performance by considering deviations from
budget figures to actual figures. Accordingly, budgetary control is a system that uses
budgets as a controlling and planning tool. Furthermore, the Chartered Institute of
Management Accountants of England and Welse, defined the process of budgetary
control in the following way:
“Budgetary control is the establishment of budgets relating to the responsibilities of executives of a
policy and the continuous comparison of the actual with the budgeted results, either to secure by
individual action the objective of the policy or to provide a basis for its revision.”
The advantage of using budgetary control is that top management is able to detect
derivation from the plan and is able to react accordingly in order to increase
efficiency throughout business activities (Venkatasivakumar 2009).
18
2.2.2. Tight Budgetary Contro l
In this section of the literature review, the study will discuss and highlight existing
research about the main topic TBC.
However, the previous research about TBC and the effect on the variables of
interest; motivation, organizational commitment, stress, and satisfaction is either
really limited or not existing. Some of the existing research of TBC is related to the
performance of the organization.
Dahlan et al (2007) investigated the relationship between TBC on firms’ performance
and also included the effect of two contingent variables, which were business strategy
and the external environment. Utilising regression analysis, Dahlan et al. (2007)
experienced a positive relationship between TBC and firm performance by using a
prospector strategy. Moreover, the external environment and a defender strategy did
not indicate a moderation effect on the relationship between firms’ performance and
TBC.
Existing literature have stated many different definitions of budget control systems
and researchers have invested considerable time into investigating this topic.
However, TBC has been rather less interesting until few years ago.
Anthony and Govindarajan (1998) described TBC based on managers’ performance
evaluation of attaining budgetary objectives during an accounting period. This means
that TBC emphasize budget attainment. Merchant (1998), in turn, rather relates tight
budget control to the impact of decision making, which highlights that tight control
has a severe impact on decision making than loose control. Furthermore, he
emphasized that TBC is positively related to a high degree of certainty that
individuals act in the interest of the organization.
One of the well-known researchers, who achieved extensive contribution for his
findings in the field of TBC, is Van der Stede. Van der Stede (2001) investigated,
which variables actually are related to TBC. Based on a collection of different
variables, which were mentioned within previous research in this area, he found
significant results that the following variables determine TBC if top management:
(1) Puts much emphasis on meeting the budget;
19
(2) Does not easily accept budget revisions during the year;
(3) Has a detailed interest in specific budget line-items;
(4) Does not lightly tolerate deviations from interim budget targets; and,
(5) Is intensively engaged in budget-related communications.
These five measurements, which Van der Stede considered as fundamental
determines of TBC, will also be used within this study in order to determine whether
a firm is applying loose or TBC.
2.3. Managerial behaviour
Previous literature about managerial behaviour state many different ways how to
define managerial behaviour. Managerial behaviour as a term is most often used as a
concept in behavioural science. This includes almost all activities and actions of an
organism within the concept of behaviour. However, to thoroughly describe
managerial behaviour it is necessary to primarily define answers to two distinct
questions. First of all, it has to be described who the managers are and secondly
which important indicators actually define or impact their behaviour (Das 1982).
A manager is mostly defined as a person that coordinates, organize, plans, and
controls, business organizations and the different activities within the organization
and its employees. Hence, the expression or term can be interpreted as a multi-
meaning concept. Furthermore, managers are mostly considered to have a distinct
status in an organization and besides the expression, there are many other terms used
interchangeable such as senior officer, executive, superintendent, etc (Das 1982).
In order to define managerial behaviour the interpretation process seems to be more
complex, due to the fact that several questions have to be answered. First of all, the
personal demands of the managerial job function, the different success factor for
managerial performance, and the different managerial tasks have to be understood to
better define managerial behaviour (Das 1982).
20
According to Campell et al. (1970) managerial behaviour is defined based on a
multifunctional relationship between motivation, ability, and opportunity. However,
most of the former research in this area has considered the effect of leadership on
subordinates’ behaviour by considering motivation, commitment, and other related
job attitudes. For instance, Singh and Pestonjee (1974) found evidence that
supervisory behaviour has significant impact on the subordinates’ job satisfaction.
2.4. Motivation
Motivation is a basic psychological process. It is the process of stimulating people to
give everything they can to work and to achieve an organization goal. Luthan (1998)
defines motivation as “a process that starts with a physiological deficiency or need that activates
behaviour or a drive that is aimed at a goal incentive”. Work motivation, in turn, describes “a
person’s desire to work hard and work well – to the arousal, direction, and persistence of effort in
work settings” (Rainey, 1997, p. 201).
There are many ways of stimulating people, who work for an organization and to
make them more satisfied, as well as to increase their commitment to work for the
organization. However, monetary compensation is not the only motivator even
though if it is the most commonly used one. There are also other incentives, which
represent non-monetary rewards that can also serve as motivators. For instance,
benefits such as promotions, safety environments and a good relationship with
managers or owners (Tremblay et al. 2009). Naka (1992) investigated the relationship
between motivation and the level of difficulty that managers face to achieve budget
goals. In his findings, he states evidence that there is a negative relationship between
managerial motivation and the difficulty to achieve the organizational budgets.
Luthan (1998) states that motivation should not be thought of as the only
psychological component that has an impact on behaviour. Former articles stated
that behaviour is the reflection of motivation; hence a widespread thought has been
as if one increases employee motivation, it immediately is reflected in good employee
behaviour (Roberts 2006).
21
Furthermore, other researchers’ findings suggest that public service employees are
more greatly influenced by non-monetary rewards than monetary rewards such as
salary. Wright (2007) explains, “the importance employees place on contributing to the public
sector mission of their organizations may provide intrinsic rewards that compensate for the low levels
of extrinsic rewards commonly associated with public sector work” (Wright 2007; p. 54).
Buelens and Broeck (2007) conducted an analysis of the differences in work
motivation between public and private sector organizations. In the study they
surveyed 3,314 private sector and 409 public sector employees in Belgium. They
found that public sector employees were more strongly motivated by their
commitment to work in a supporting stainable working environment than their
private sector counterparts.
Further research investigated whether preventive and detective controls have
different effects on employee performance and motivation, the results disclose that
detective controls with immediate response are equally as effective in improving
employees’ performance on the controlled dimension, and preventive controls
reduce self-motivation for the task relative to all other conditions (Margaret et al.
2012).
2.5. Organizational Commitment
Organizational commitment can refer to identification, involvement and loyalty
(Buchanan 1974). According to this, identification refers to the adoption of
organizational goals and values by a person who is working for an organization.
Involvement refers to a person’s participation in the companies’ activities and to act
as a decision maker or to be directly involved in the company’s strategy formulation
process and their objectives. Loyalty refers to the concern and commitment toward
his or her organization (Buchanan 1974).
Organizational commitment has interested and attracted many researchers to
examine whether employee’s commitment has a positive or negative effect on
performance (Mowday et al. 1979). For many years, organizational commitment has
22
been an often used case study, as it was considered to positively influence
performance (Larson & Fukami, 1984; Van Maanen 1975). Therefore it is believed
that employees who are committed to their organization will perform better than
employees that are less committed. Some other researchers studied and investigated
employees’ commitment in the private and public sector, and the results which have
been found in these studies are mixed and show some differences in organizational
commitment between employees in the private sector and employees in the public
sector. However, employees working in the public sector are less committed than
employees working in the private sector (Gortner et al. 1987). Hoy and Sousa (1984)
found that more participation in decision-making will increase employee’s loyalty in
the public sector.
Several studies use organizational commitment as an intervening variable to predict
the relationship between budgetary participation and performance. Managers’ or
employees’ loyalty is one of the most significant factors that directors in particular
must have in mind. Commitment is usually measured with the loyalty questionnaires
and can cause serious negative consequences when not in a high level because less
commitment means less performance (Aziri 2011).
Meyer and Allen (2004) state that committed employees will work harder to achieve
the organization’s goals and reduce costly turnover. Carol & James (1996) studied
organizational commitment in many public sector areas, and the results show
organizational commitment of public employees working in some public sector areas
are not that different from that of employees in other sectors.
Papinczak (2012) investigated the perception of job satisfaction relating to affective
organizational commitment, he found that affective commitment impacts
significantly on factors considered important by employees, such as absenteeism,
work performance and staff retention. Another study have been performed by
Radiah (2012), who focused on the public sector and the result of the study shows a
positive effect between budget participation and managerial performance, and a
positive effect between budget participation, organization commitment, and
managerial performance.
23
2.6. Stress
Stress can affect anyone at work and the effect on employees’ physical and mental
health can be quite costly (Ganster & Loghan 2005). Stress is a natural reaction to
too much pressure and can make employees feel nervous, depressed, and angry or
out of control it depends on the employees’ mental, physical or behavioral situation
(Health &Safety Executive UK). Stress has been also viewed as dysfunctional for
organizations and their employees (Kahn et al. 1964). Organizations in public and
private sector are responsible for setting the atmosphere for their employees.
However, more stability at work increases employees productivity and reduces job
related tension and stress (Health &Safety Executive UK). Nevertheless, the financial
crisis increased unemployment rates throughout different sectors, which created
increased job related tension and stress for managers and employees, as they always
had to live with the fear that they could be the next whose placement will be
terminated.
Beehr et al. (2000) state in their findings that there is a negative relationship between
occupational stress and employees’ performance that can have a huge impact on the
individual psychology.
According to Simmons (2000), there are two types of stress, positive stress which is
referred to as stress that has motivational characteristics and negative stress which is
seen as having the opposite effect, and these two types are connected and cannot be
separated. Simmons referred to these two kinds of stress in a metaphor; they are
mixed together like water in a bathtub. Where positive stress is like cold water and
negative stress is like hot water. When hot and cold water is filled into a bathtub it
will be combined and the water temperature will be determined by the quantity of
hot and cold water, whereas a balance is always the better solution to keep the stress
in the middle (Simmons 2000).
If we asked ourselves what stress exactly means, there is a nice definition by Morrow
(2002) “Stress is the body's reaction to a change that requires a physical, mental or
emotional adjustment or response”.
24
According to Rose (2003), there is a tendency to create high levels of stress regarding
time, for instance working for many hours can reduces employees productivity and
decrease their performance while increasing the managerial stress level.
Kanji and Parvesh (2009) studied and investigated the psychosocial system for work
well-being on measuring work stress by causal pathway, and they described four
psychosocial work conditions for a worker at work through the four components
given below:
• Job support: Job resources, encouragement, social support, career opportunities and job
security (both organisational and peer support).
• Job demand: Workload, performance demands, task requirements, mental burden,
human contestability and emotional and social changes.
• Job control: Structure of workflow, autonomy, handling work assignments, and learning
and feedback.
• Job environment: Positive working environment, understand their role in the
organization, management of organizational change.
2.7. Job Satisfaction
What is job satisfaction and how can we define the meaning of job satisfaction?
Previous literature state many different ways how to interpret the meaning of job
satisfaction and all the different authors have different definition for the term.
Hoppock (1935) defined job satisfaction as “any combination of psychological,
physiological, and environmental circumstances that causes a person truthfully to say,
“I am satisfied with my job” (p. 47). According to Mitchell and Lasan (1987), job
satisfaction represents the most important and most frequently studied attitude that
reflects organizational behaviour. Considering job satisfaction, it is important to
understand the possible reasons that lead to job satisfaction and dissatisfaction.
Herzberg et al. (1957) identified several characteristics of satisfied/dissatisfied
employees. They indicated that morale is high when people begin and start their first
jobs. However, morale decreases during the next coming years and remains at a
25
relatively low level until workers are in their late twenties or early thirties. These
findings conclude that workers begin with high morale, which drops during the first
few years and remains low for a number of years thereafter. Nevertheless, other
studies figured out that by increasing motivation, it is possible to also stimulate job
satisfaction (McNeese-Smith 1997).
Thomas & Kelly studied whether job satisfaction–job performance relationship
varies across cultures and they found that the satisfaction-performance relationship is
stronger in low-power-distance cultures, which means cultural differences can affect
either positively or negatively the relationship (Thomas & Kelly 2009).
Mateja & Brigita (2012) investigated job satisfaction of nurses and identifying factors
of job satisfaction in 4 Slovenian Hospitals, and they found some significant
differences between leaders and employees, as nurse leaders had high job satisfaction
compared with nurses and job satisfaction increases with the level of education.
26
3. Chapter: Research Methodology
The following section about the applied research methodology will provide an overview how the
research process for this Master Thesis is performed. More specifically, the research approach, which
is used, is highlighted, the data collection process is emphasised, and the research model, as well as
the process of formulating the research hypotheses is discussed.
3.1. Research Approach
As the thesis makes use of primary data, which is collected through the use of a
survey questionnaire, and the research questions will be reformulated into research
hypotheses, the study will consider a quantitative research approach.
3.1.1. Quanti tat ive Research Approach
Quantitative research approaches rely on sophisticated and systematic procedures of
testing, verifying, and proving research hypotheses. The main aim of a quantitative
research approach is to test whether a common prediction or generalization of a
theory is true or not. However, in the data collection process a quantitative approach
relies on predetermined response classifications, such as in survey questionnaires or
structured interviews with which statistical methods can be used in the data
interpretation process (Bryman & Bell 2011).
The research approach for the data collection for this thesis is based on a quantitative
approach. As the before mentioned research questions are reformulated into research
hypotheses, this presents the first step towards a quantitative approach. Furthermore,
primary data is collected through the use of an online email survey, which is also
intended to be the base for the statistical analysis and interpretation process.
Even though, the research study about the effect of TBC on managerial behaviour
represents a new field of investigation, the aim of the study is to collect standardized
information about different sectors of the public Swedish market. The findings or
27
outcomes of the study should be standardized and comparable to provide a base for
further investigation in this field. As this study is considered to provide first insights
into the effect of TBC on managerial behaviour, it should be a starting-point for
further studies in this area and could be extended to be tested in other countries.
Hence a quantitative approach for this research is preferred over a qualitative
approach, which is often more common for investigation into new research areas.
3.2. Data Collection Method
The data collection process represents an important step for any kind of research
method. An inappropriate data collection process is able to heavily impact the
research outcome and could lead to an invalid research result.
3.2.1. Sampling
The sampling population of the research study comprised managers working in a
municipality institution or a university in Sweden. The survey questionnaires were
sent, via e-mail, to the local managers in the different municipalities or universities in
Sweden. Moreover, the email addresses of the different local managers in the
different municipalities were extracted from the websites from the different
municipalities or universities. A list of all the different municipalities and universities
can be seen below, as well as how many managers were contacted in the data
collection period from the 23th of April until the 06th of May.
28
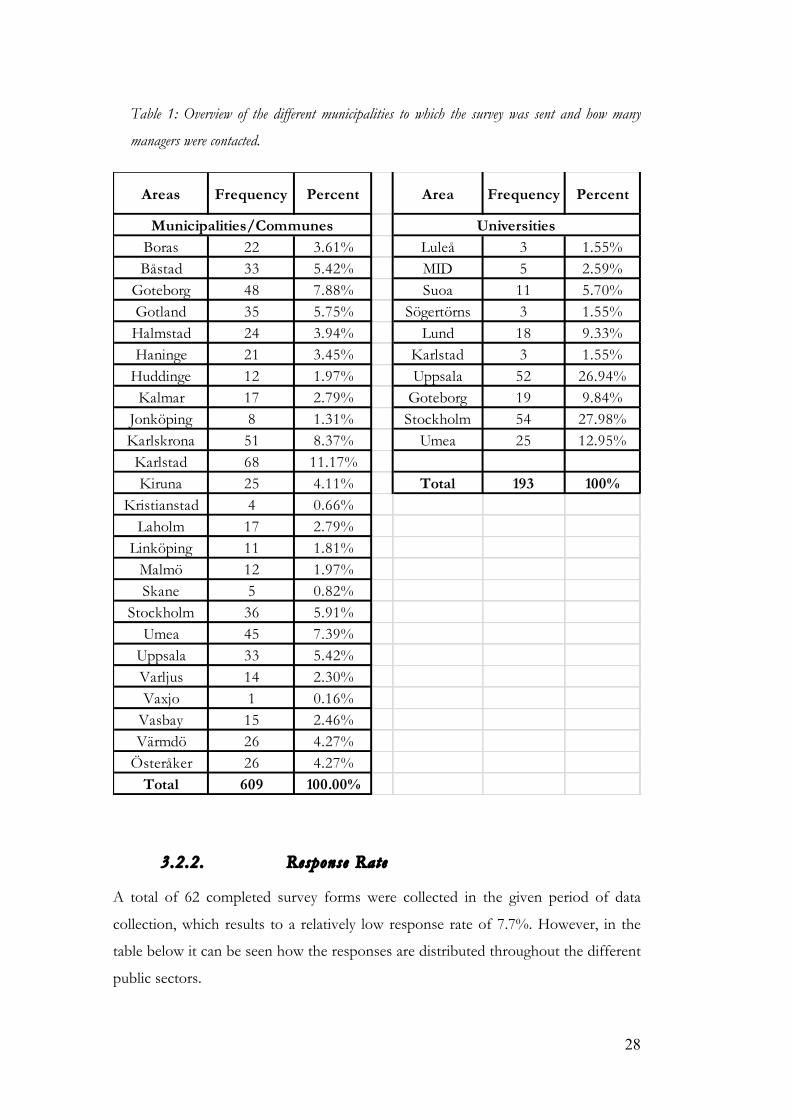
Table 1: Overview of the different municipalities to which the survey was sent and how many
managers were contacted.
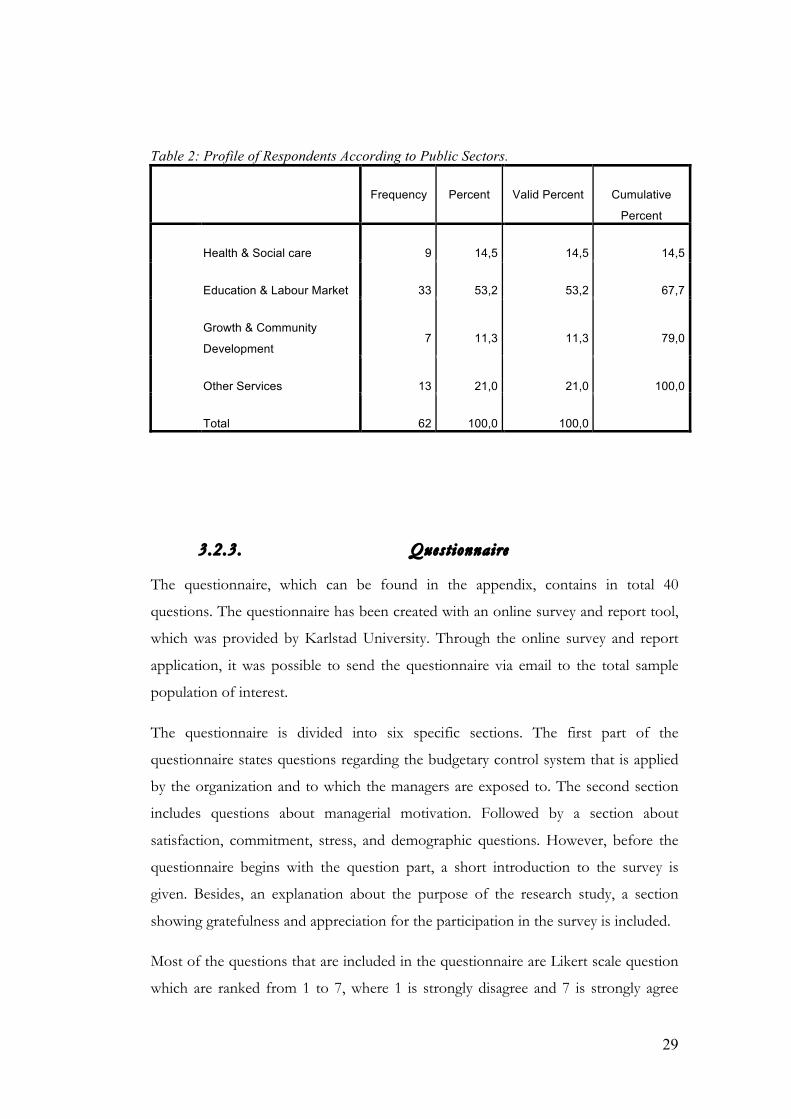
3.2.2. Response Rate
A total of 62 completed survey forms were collected in the given period of data
collection, which results to a relatively low response rate of 7.7%. However, in the
table below it can be seen how the responses are distributed throughout the different
public sectors.
Areas Frequency Percent Area Frequency Percent
Boras 22 3.61% Luleå 3 1.55%Båstad 33 5.42% MID 5 2.59%Goteborg 48 7.88% Suoa 11 5.70%Gotland 35 5.75% Sögertörns 3 1.55%Halmstad 24 3.94% Lund 18 9.33%Haninge 21 3.45% Karlstad 3 1.55%Huddinge 12 1.97% Uppsala 52 26.94%Kalmar 17 2.79% Goteborg 19 9.84%Jonköping 8 1.31% Stockholm 54 27.98%Karlskrona 51 8.37% Umea 25 12.95%Karlstad 68 11.17%Kiruna 25 4.11% Total 193 100%
Kristianstad 4 0.66%Laholm 17 2.79%Linköping 11 1.81%Malmö 12 1.97%Skane 5 0.82%
Stockholm 36 5.91%Umea 45 7.39%Uppsala 33 5.42%Varljus 14 2.30%Vaxjo 1 0.16%Vasbay 15 2.46%Värmdö 26 4.27%Österåker 26 4.27%Total 609 100.00%
Municipalities/Communes Universities
29
Table 2: Profile of Respondents According to Public Sectors.
Frequency Percent Valid Percent Cumulative
Percent
Health & Social care 9 14,5 14,5 14,5
Education & Labour Market 33 53,2 53,2 67,7
Growth & Community
Development 7 11,3 11,3 79,0
Other Services 13 21,0 21,0 100,0
Total 62 100,0 100,0
3.2.3. Quest ionnaire
The questionnaire, which can be found in the appendix, contains in total 40
questions. The questionnaire has been created with an online survey and report tool,
which was provided by Karlstad University. Through the online survey and report
application, it was possible to send the questionnaire via email to the total sample
population of interest.
The questionnaire is divided into six specific sections. The first part of the
questionnaire states questions regarding the budgetary control system that is applied
by the organization and to which the managers are exposed to. The second section
includes questions about managerial motivation. Followed by a section about
satisfaction, commitment, stress, and demographic questions. However, before the
questionnaire begins with the question part, a short introduction to the survey is
given. Besides, an explanation about the purpose of the research study, a section
showing gratefulness and appreciation for the participation in the survey is included.
Most of the questions that are included in the questionnaire are Likert scale question
which are ranked from 1 to 7, where 1 is strongly disagree and 7 is strongly agree
30
with the question at hand. Likert scale questions were chosen for the questionnaire
due to the fact that the questions ask the participants about their feelings or opinions.
Furthermore, a 7 point scale were preferred over a 5 point scale based on the fact
that a 7 point scale increases the granularity, which in turn leads to better decision-
making in the end and also increases the validity of comparing means and standard
deviations.
In order to increase the validity of the survey questions, the questionnaire includes
questions, which were previously used in literature about the topic of interest. Hence,
the first part of the questionnaire about the applied budgetary control system, which
is experienced by the respondents, is based on the “Measures of Tight Budgetary
Control” that were developed by Van der Stede (2001).
The questionnaire part, which includes the questions about organizational
commitment, were based on Mowday et al. (1979) measuring questions that were
defined in the research about “Measuring organizational commitment”.
The survey questions regarding stress were previously defined in a study about ”Job
and life attitudes of male executives” by Judge et al. (1994).
The survey questions that were used in the question part about managerial
motivation were previously identified by Tremblay et al. (2009), who investigated
managerial motivation and how managers respond to intrinsic and extrinsic
motivational means.
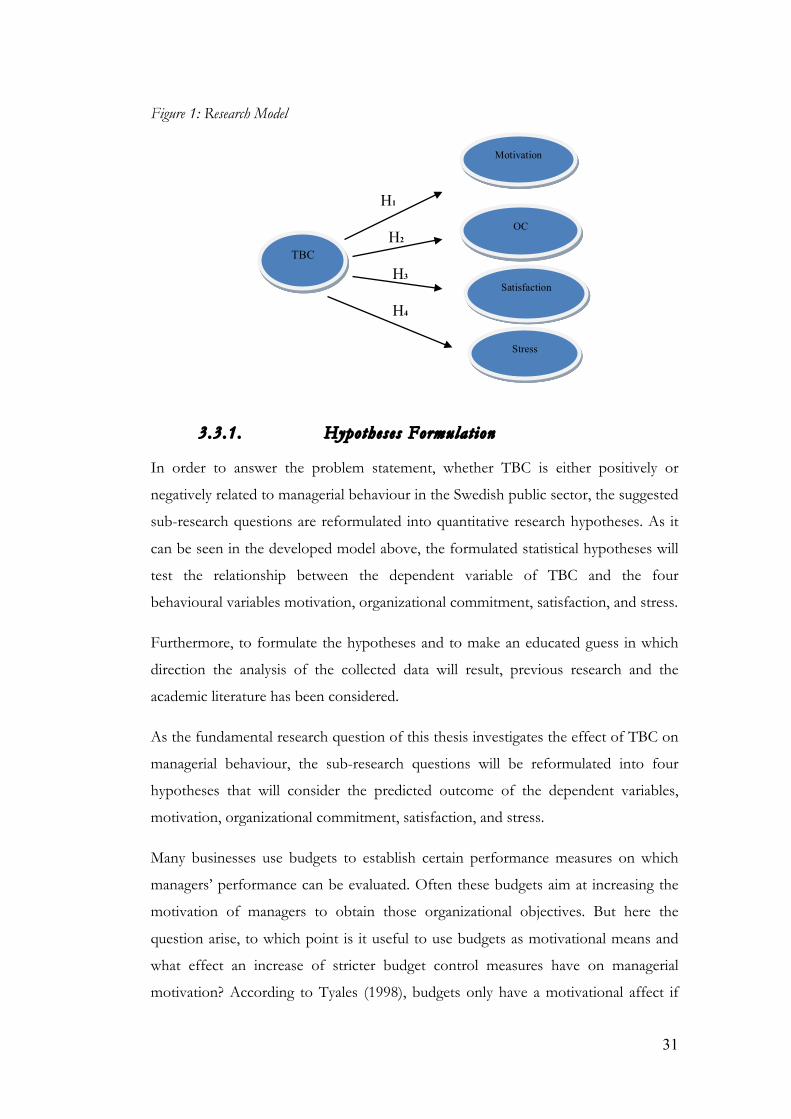
3.3. Research Model and Hypotheses Formulation
The investigated research model contains five variables: four dependent variables,
which are motivation, organizational commitment, stress, and, satisfaction and one
independent variable, which is TBC.
The different hypotheses, which the research study will investigate, are itemized
below:
31
Figure 1: Research Model
H1
H2 H3 H4
3.3.1. Hypotheses Formulat ion
In order to answer the problem statement, whether TBC is either positively or
negatively related to managerial behaviour in the Swedish public sector, the suggested
sub-research questions are reformulated into quantitative research hypotheses. As it
can be seen in the developed model above, the formulated statistical hypotheses will
test the relationship between the dependent variable of TBC and the four
behavioural variables motivation, organizational commitment, satisfaction, and stress.
Furthermore, to formulate the hypotheses and to make an educated guess in which
direction the analysis of the collected data will result, previous research and the
academic literature has been considered.
As the fundamental research question of this thesis investigates the effect of TBC on
managerial behaviour, the sub-research questions will be reformulated into four
hypotheses that will consider the predicted outcome of the dependent variables,
motivation, organizational commitment, satisfaction, and stress.
Many businesses use budgets to establish certain performance measures on which
managers’ performance can be evaluated. Often these budgets aim at increasing the
motivation of managers to obtain those organizational objectives. But here the
question arise, to which point is it useful to use budgets as motivational means and
what effect an increase of stricter budget control measures have on managerial
motivation? According to Tyales (1998), budgets only have a motivational affect if
TBC
Motivation
Satisfaction
OC
Stress
32
managers believe that they are most likely to achieve the forecasted objectives. If this
is not the case, budgets can have most likely the opposite effect on managerial
motivation. Furthermore, according to the study about “Motivation and Casual
Inferences in Budgetary Control” by Naka (1992), there is evidence that motivation
is negatively related to the difficulty of achieving organizational budgets.
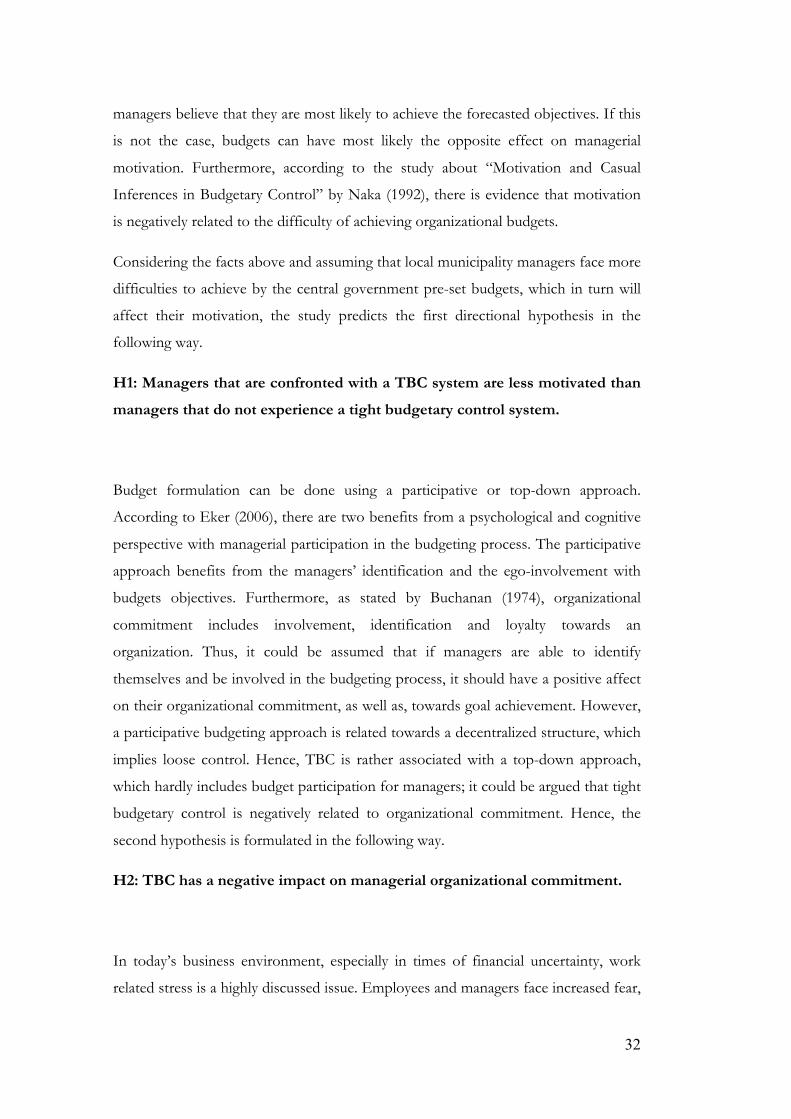
Considering the facts above and assuming that local municipality managers face more
difficulties to achieve by the central government pre-set budgets, which in turn will
affect their motivation, the study predicts the first directional hypothesis in the
following way.
H1: Managers that are confronted with a TBC system are less motivated than
managers that do not experience a tight budgetary control system.
Budget formulation can be done using a participative or top-down approach.
According to Eker (2006), there are two benefits from a psychological and cognitive
perspective with managerial participation in the budgeting process. The participative
approach benefits from the managers’ identification and the ego-involvement with
budgets objectives. Furthermore, as stated by Buchanan (1974), organizational
commitment includes involvement, identification and loyalty towards an
organization. Thus, it could be assumed that if managers are able to identify
themselves and be involved in the budgeting process, it should have a positive affect
on their organizational commitment, as well as, towards goal achievement. However,
a participative budgeting approach is related towards a decentralized structure, which
implies loose control. Hence, TBC is rather associated with a top-down approach,
which hardly includes budget participation for managers; it could be argued that tight
budgetary control is negatively related to organizational commitment. Hence, the
second hypothesis is formulated in the following way.
H2: TBC has a negative impact on managerial organizational commitment.
In today’s business environment, especially in times of financial uncertainty, work
related stress is a highly discussed issue. Employees and managers face increased fear,
33
uncertainty, and higher levels of work related stress due to potential layoffs or budget
cuts. Emmanuel et al. (2004) emphasize that managerial performance evaluation,
which is highly based on budget achievement, bears the tension of increased work
related stress that in turn can cause dysfunctional behaviour and data manipulation.
Based on these assumptions above, the following hypothesis is developed.
H3: Managers that experience a TBC are more stressed than managers who
do not experience a TBC.
Brownell (1983) has been one of the first researchers who found a positive
relationship between budgetary participation and managerial job satisfaction.
Moreover, considering the fact that budgetary participation increases managerial job
satisfaction, whereas, budgetary participation is only possible if loose budgetary
control is applied, it could be argued that TBC has rather the opposite effect on
managerial job satisfaction. Hence, the study will formulate the next directional
hypothesis in the following way.
H4: Managers, who experience TBC, are less satisfied than managers that do
not experience a TBC.
3.4. Process of Analysing the Data and Testing the Hypotheses
For each of the five different sections of the questionnaire, an index variable is
created that will represent a reliable measurement for the variables in question.
Descriptive statistics are used to reflect the central tendency of the different variables
of TBC, motivation, organizational commitment, stress, and satisfaction. From the
descriptive statistics it will be possible to derive first conclusions about the different
shapes of the variables and in which direction the average response of the
participants and the resulting outcome could lead. Based on frequency tables it will
be possible to judge whether the respondents only think that they experience TBC or
if they indeed face TBC at their organization. Finally, the four developed hypothesis
will be tested based on a Multivariate Analysis of Variances (MANOVA). In
34
statistical theory a MANOVA is often applied instead of conducting two or more
ANOVASs. To put it in a different way, a MANOVA is mostly used to detect
differences in the average values of the dependent variables. Statistically, it is of
advantage to apply a MANOVA compared of using a series of ANOVAs as the
likelihood of a TYPE I Error is reduced, which means that the null hypothesis is
supported, but rejected, what in turn means that there is prove of different mean
values, which is actually not true. Moreover, the effect on every dependent variable
might not be significant, but in combination they might have an effect. In the case at
hand the MANOVA is appropriate due to the fact that the effect from the four
dependent variables; motivation, organizational commitment, stress, and satisfaction,
want to be investigated on the independent variable TBC that measures the
managerial impact of TBC. Furthermore, it is expected that some of the dependent
variables are correlated. Thus the MANOVA test is applied to test the different
hypotheses in the analysis part (Garson 2012).
3.5. Reflection and Limitations of the Data Collection Process
Reflecting on the data collection process, it can be emphasized that some
improvements or different procedure should be applied in future research studies.
The study recognized a relatively low response rate to the online survey. This was
probably due to the many questions the questionnaire included and the small amount
of time managers are able to offer to such a survey at this organizational level.
However, it was necessary to include already 16 questions about TBC to be able to
obtain a reliable measurement for TBC. Nevertheless, as not all questions were used
for analysis purposes, it is advisable to clearly investigate which analysis should be
conducted before developing the questionnaire.
35
4. Chapter: Results and Analysis
In this section the collected data from the survey questionnaire is analysed. However, first the
process of creating an index measure for the different variables is highlighted. Second, an overview
about the descriptive statistics is given. Third, the question whether the respondents experience
tight budgetary control, indeed, is investigated. Lastly, a Multivariate Analysis of Variance
(MANOVA) is conducted in order to test the research hypotheses.
4.1. Reliability Analysis and Index creation
Due to the fact that the survey questionnaire was divided into different sections;
questions that measured TBC, motivation, organizational commitment, satisfaction,
and stress, the data included some variables, which measured the same thing. In
order to get an appropriate single measurement for each section, it was necessary to
conduct a reliability analysis to determine the Cronbach’s Alpha, which measures the
internal consistence between the different questions and to conclude which questions
should be combined to obtain an appropriate index measure for each of the
following sections; TBC, motivation, organizational commitment, satisfaction, and
stress. Furthermore, as some of the survey questionnaire questions were based on a
reverse scale, these questions were recoded to be in line with the other questions.
Taking the TBC index as an example how the five different indices were created, all
16 survey questions regarding TBC were considered and a reliability analysis in order
to determine the Cronbach’s Alpha was conducted. The reliability analysis
determined a Cronbach’s Alpha value of 83 percent. According to Nunnaly (1978),
an Alpha value between 70% and 80% for surveys are appropriate. Hence, the index
for TBC was calculated based on all survey questions.
However, for the motivational index, organizational commitment index, and stress
index, the reliability analysis was not as easy. For these indices it was necessary to
exclude some questionnaire questions to increase internal consistence between the
measurement questions. Hence, the study excluded question Q20 and Q21 from the
motivational index, question Q26 and Q28 for the organizational commitment index,
and question Q37 from the stress index. Finally, a Cronbach’s Alpha of 88,9 percent
36
for motivation, 76,3 percent for organizational commitment, 79,6 percent for
satisfaction, and 69,2 percent for stress, were obtained from the reliability analysis (a
more comprehensive description can be found in the appendix).
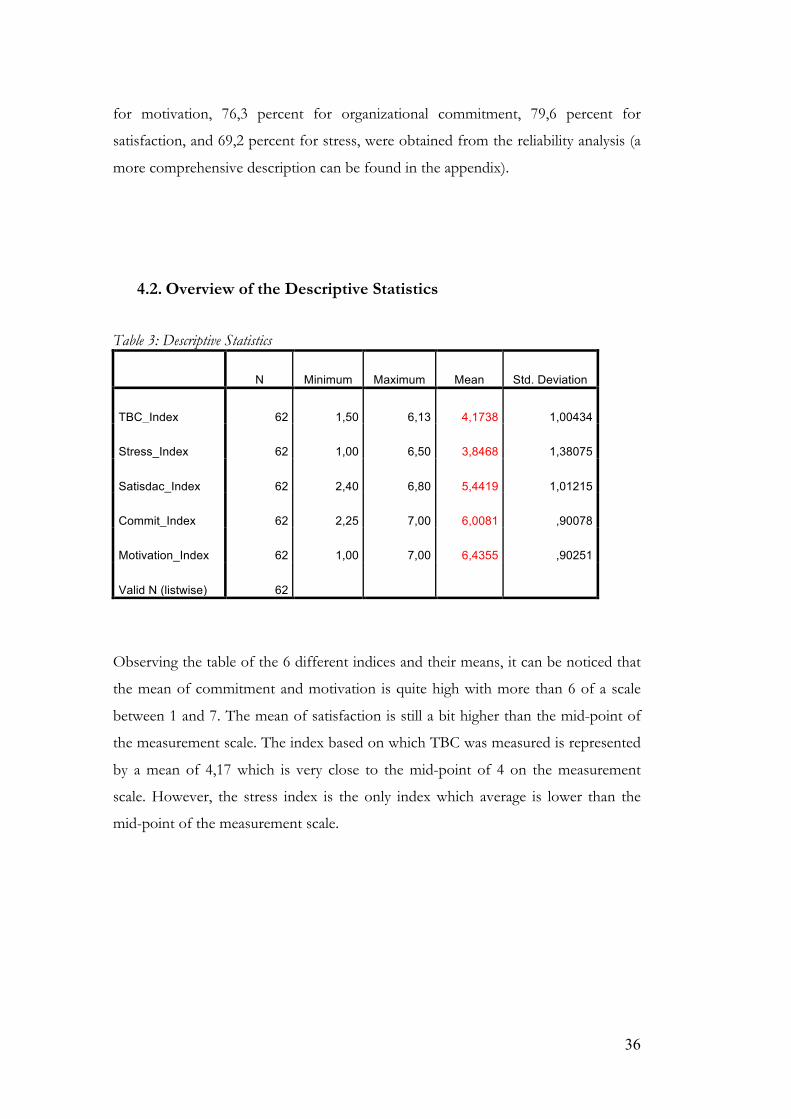
4.2. Overview of the Descriptive Statistics
Table 3: Descriptive Statistics
N Minimum Maximum Mean Std. Deviation
TBC_Index 62 1,50 6,13 4,1738 1,00434
Stress_Index 62 1,00 6,50 3,8468 1,38075
Satisdac_Index 62 2,40 6,80 5,4419 1,01215
Commit_Index 62 2,25 7,00 6,0081 ,90078
Motivation_Index 62 1,00 7,00 6,4355 ,90251
Valid N (listwise) 62
Observing the table of the 6 different indices and their means, it can be noticed that
the mean of commitment and motivation is quite high with more than 6 of a scale
between 1 and 7. The mean of satisfaction is still a bit higher than the mid-point of
the measurement scale. The index based on which TBC was measured is represented
by a mean of 4,17 which is very close to the mid-point of 4 on the measurement
scale. However, the stress index is the only index which average is lower than the
mid-point of the measurement scale.

37
Table 4: Frequency Table of Response Distribution
In wich Sector are you working
Health & Social
care
Education &
Labour Market
Growth &
Community
Development
Other Services
Count Count Count Count
Do you experience TBC No 0 13 1 4
Yes 9 20 6 9
The frequency table depicts the frequencies of responses according to the public
sector and whether they experience TBC or not. However, the question if the
respondents experience TBC or not, has been asked in the questionnaire before the
respondents had to answer the questions from van der Stede (2001) based on which
TBC is measured. From a total of 9 respondents from the health care sector, all
experience TBC according to their opinions. Moreover, from the education sector, to
which the majority of respondents belong, 20 respondents experienced a TBC
system and 13 respondents did not. From the respondents working in the growth
and community development sector, 6 respondents have the opinion that their
organization applies a TBC system and only one respondent has the opposite
opinion. From all respondents that are working in other public sectors, 9
respondents experience TBC and 4 answered that they did not experience TBC.
However, this results in a total of 44 respondents or 70,1%, who answered that they
experience TBC at their organization.
4.3. Do the respondents really experience TBC?
The questionnaire (see appendix), which has been used for the data collection
process for this study, includes in the beginning one question (Q2) that asked the
respondents whether they experience TBC in their organization or not. Below the
38
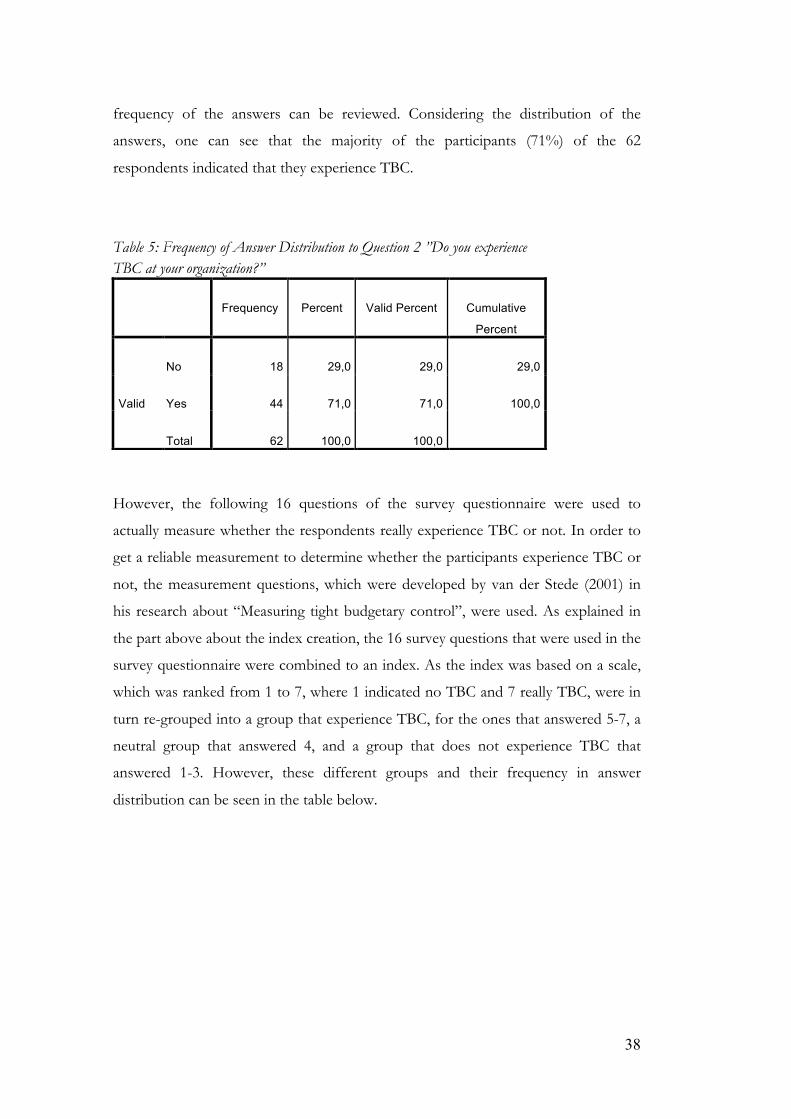
frequency of the answers can be reviewed. Considering the distribution of the
answers, one can see that the majority of the participants (71%) of the 62
respondents indicated that they experience TBC.
However, the following 16 questions of the survey questionnaire were used to
actually measure whether the respondents really experience TBC or not. In order to
get a reliable measurement to determine whether the participants experience TBC or
not, the measurement questions, which were developed by van der Stede (2001) in
his research about “Measuring tight budgetary control”, were used. As explained in
the part above about the index creation, the 16 survey questions that were used in the
survey questionnaire were combined to an index. As the index was based on a scale,
which was ranked from 1 to 7, where 1 indicated no TBC and 7 really TBC, were in
turn re-grouped into a group that experience TBC, for the ones that answered 5-7, a
neutral group that answered 4, and a group that does not experience TBC that
answered 1-3. However, these different groups and their frequency in answer
distribution can be seen in the table below.
Table 5: Frequency of Answer Distribution to Question 2 ”Do you experience TBC at your organization?”
Frequency Percent Valid Percent Cumulative
Percent
Valid
No 18 29,0 29,0 29,0
Yes 44 71,0 71,0 100,0
Total 62 100,0 100,0
39
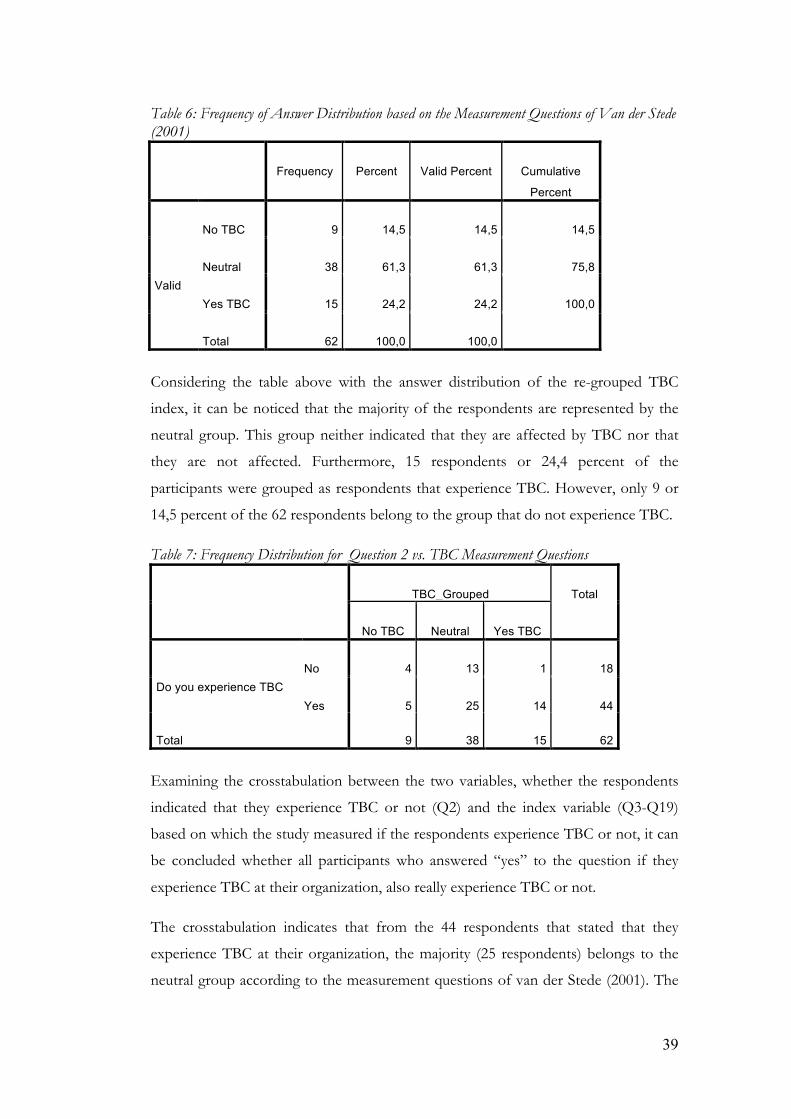
Table 6: Frequency of Answer Distribution based on the Measurement Questions of Van der Stede (2001)
Frequency Percent Valid Percent Cumulative
Percent
Valid
No TBC 9 14,5 14,5 14,5
Neutral 38 61,3 61,3 75,8
Yes TBC 15 24,2 24,2 100,0
Total 62 100,0 100,0
Considering the table above with the answer distribution of the re-grouped TBC
index, it can be noticed that the majority of the respondents are represented by the
neutral group. This group neither indicated that they are affected by TBC nor that
they are not affected. Furthermore, 15 respondents or 24,4 percent of the
participants were grouped as respondents that experience TBC. However, only 9 or
14,5 percent of the 62 respondents belong to the group that do not experience TBC.
Table 7: Frequency Distribution for Question 2 vs. TBC Measurement Questions
TBC_Grouped Total
No TBC Neutral Yes TBC
Do you experience TBC No 4 13 1 18
Yes 5 25 14 44
Total 9 38 15 62
Examining the crosstabulation between the two variables, whether the respondents
indicated that they experience TBC or not (Q2) and the index variable (Q3-Q19)
based on which the study measured if the respondents experience TBC or not, it can
be concluded whether all participants who answered “yes” to the question if they
experience TBC at their organization, also really experience TBC or not.
The crosstabulation indicates that from the 44 respondents that stated that they
experience TBC at their organization, the majority (25 respondents) belongs to the
neutral group according to the measurement questions of van der Stede (2001). The
40
group that experience TBC according to van der Stede (2001) and also answered
“yes” to the question “Do you experience TBC”, represents a total of 14
respondents. One respondent, who actually experienced TBC even answered “no” to
the question “Do you experience TBC”. Moreover, from the group that does not
experience TBC, 4 answered that they also think that they experience TBC at their
organization and 5 answered that their actually think that they face TBC.
Nevertheless, the cosstabulation depicts that the majority of people who think that
they face TBC at their organization also are represented in either the neutral group or
the group that really experience TBC according to the measurements of van der
Stede (2001).
4.4. MANOVA and Hypotheses Testing with SPSS
As mentioned before, to test the developed hypotheses for this study a MANOVA
analysis is performed. The results of the analysis and the effect on the different
hypotheses are stated below.
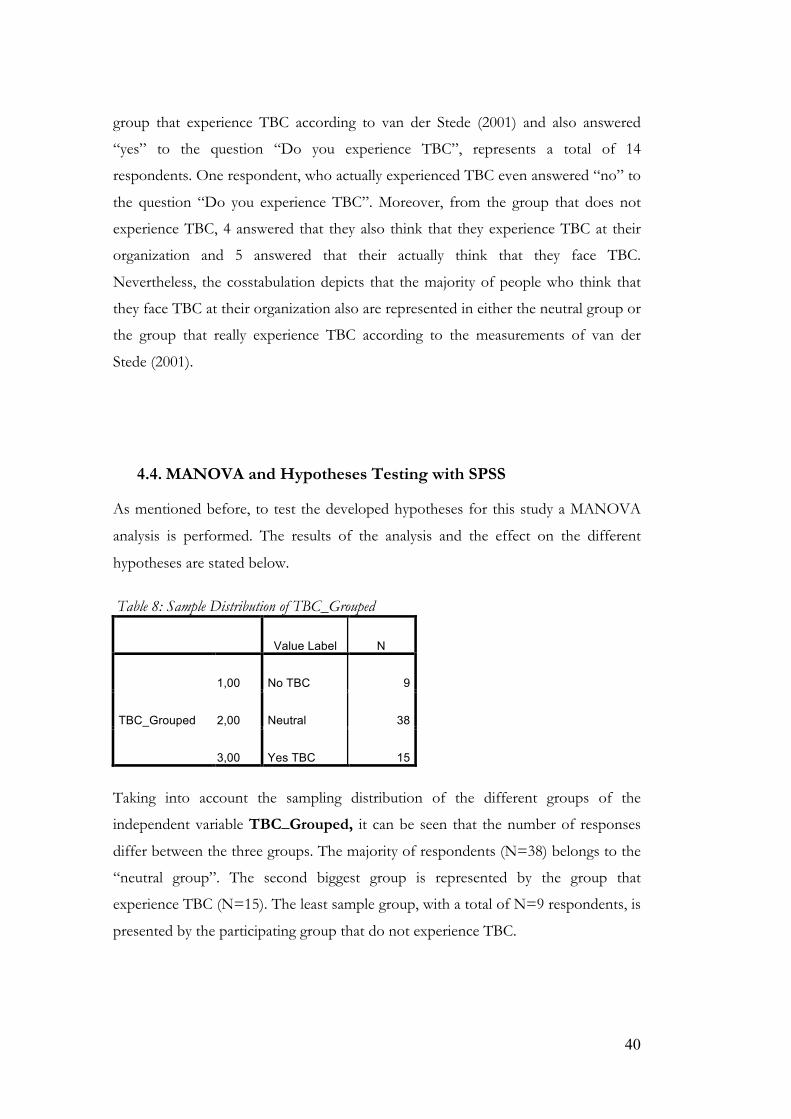
Table 8: Sample Distribution of TBC_Grouped
Value Label N
TBC_Grouped
1,00 No TBC 9
2,00 Neutral 38
3,00 Yes TBC 15
Taking into account the sampling distribution of the different groups of the
independent variable TBC_Grouped, it can be seen that the number of responses
differ between the three groups. The majority of respondents (N=38) belongs to the
“neutral group”. The second biggest group is represented by the group that
experience TBC (N=15). The least sample group, with a total of N=9 respondents, is
presented by the participating group that do not experience TBC.
41
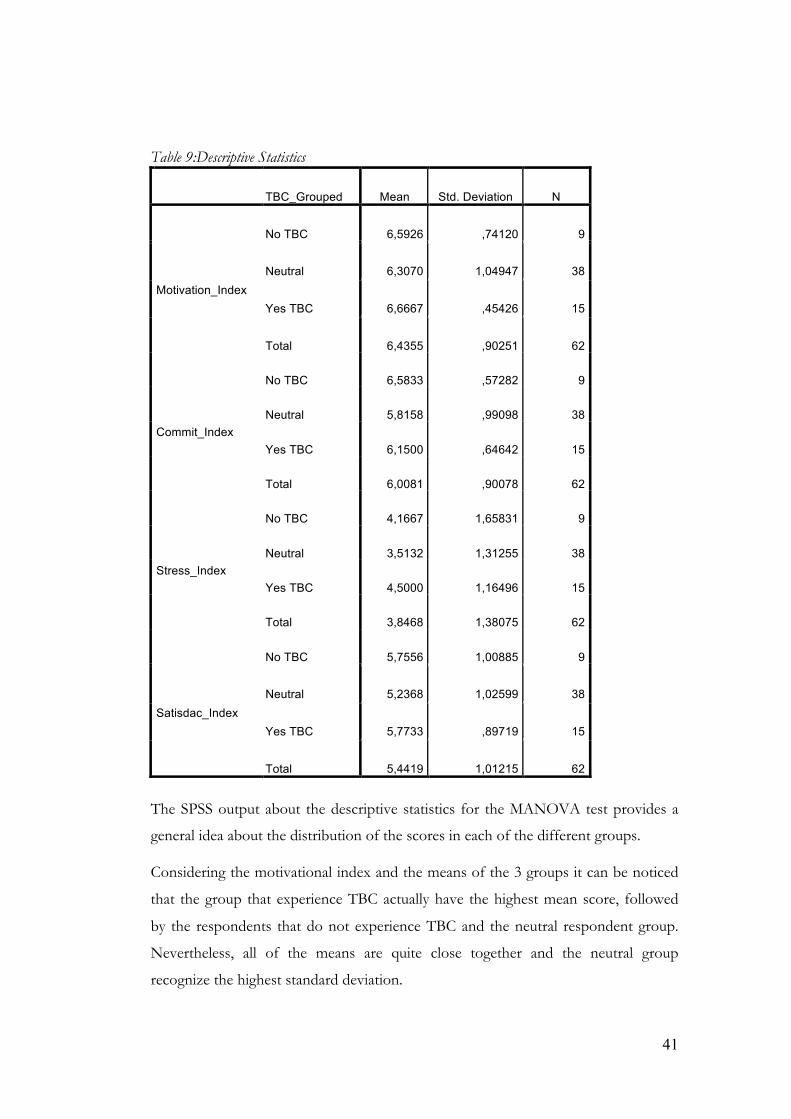
Table 9:Descriptive Statistics
TBC_Grouped Mean Std. Deviation N
Motivation_Index
No TBC 6,5926 ,74120 9
Neutral 6,3070 1,04947 38
Yes TBC 6,6667 ,45426 15
Total 6,4355 ,90251 62
Commit_Index
No TBC 6,5833 ,57282 9
Neutral 5,8158 ,99098 38
Yes TBC 6,1500 ,64642 15
Total 6,0081 ,90078 62
Stress_Index
No TBC 4,1667 1,65831 9
Neutral 3,5132 1,31255 38
Yes TBC 4,5000 1,16496 15
Total 3,8468 1,38075 62
Satisdac_Index
No TBC 5,7556 1,00885 9
Neutral 5,2368 1,02599 38
Yes TBC 5,7733 ,89719 15
Total 5,4419 1,01215 62
The SPSS output about the descriptive statistics for the MANOVA test provides a
general idea about the distribution of the scores in each of the different groups.
Considering the motivational index and the means of the 3 groups it can be noticed
that the group that experience TBC actually have the highest mean score, followed
by the respondents that do not experience TBC and the neutral respondent group.
Nevertheless, all of the means are quite close together and the neutral group
recognize the highest standard deviation.
42
Examining the mean distribution of the commitment index, the highest mean can be
noticed for the group that actually does not experience TBC, which is followed by
the group that experience TBC and lastly the neutral group with again the highest
standard deviation.
Considering the Stress index, the highest mean value can be recognized with the
group that experience TBC. The second highest mean value can be seen with the
group that does not face a TBC system and the lowest mean represents the neutral
group.
The mean score for the satisfaction index is almost the same for the group that
experience TBC and for the group that does not experience a TBC system, whereas
the mean for the group that does not experience TBC is slightly lower. However, the
lowest mean is recognized in this case with the neutral group.
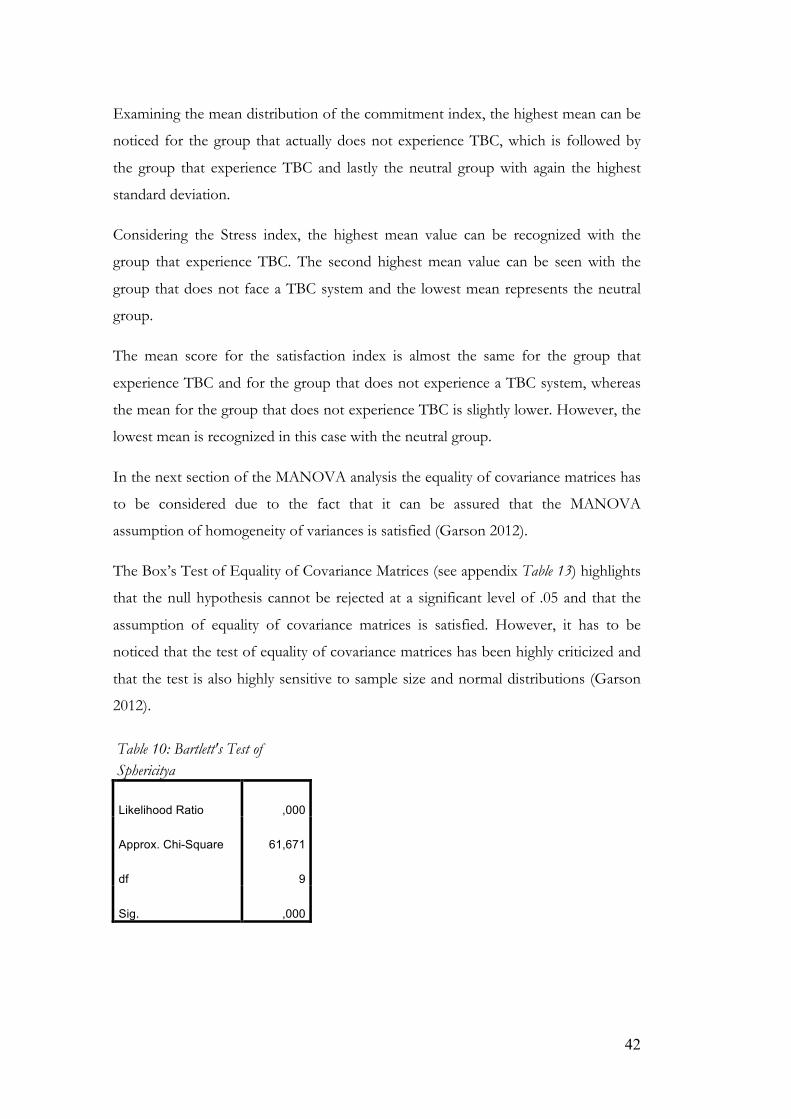
In the next section of the MANOVA analysis the equality of covariance matrices has
to be considered due to the fact that it can be assured that the MANOVA
assumption of homogeneity of variances is satisfied (Garson 2012).
The Box’s Test of Equality of Covariance Matrices (see appendix Table 13) highlights
that the null hypothesis cannot be rejected at a significant level of .05 and that the
assumption of equality of covariance matrices is satisfied. However, it has to be
noticed that the test of equality of covariance matrices has been highly criticized and
that the test is also highly sensitive to sample size and normal distributions (Garson
2012).
Table 10: Bartlett's Test of Sphericitya
Likelihood Ratio ,000
Approx. Chi-Square 61,671
df 9
Sig. ,000
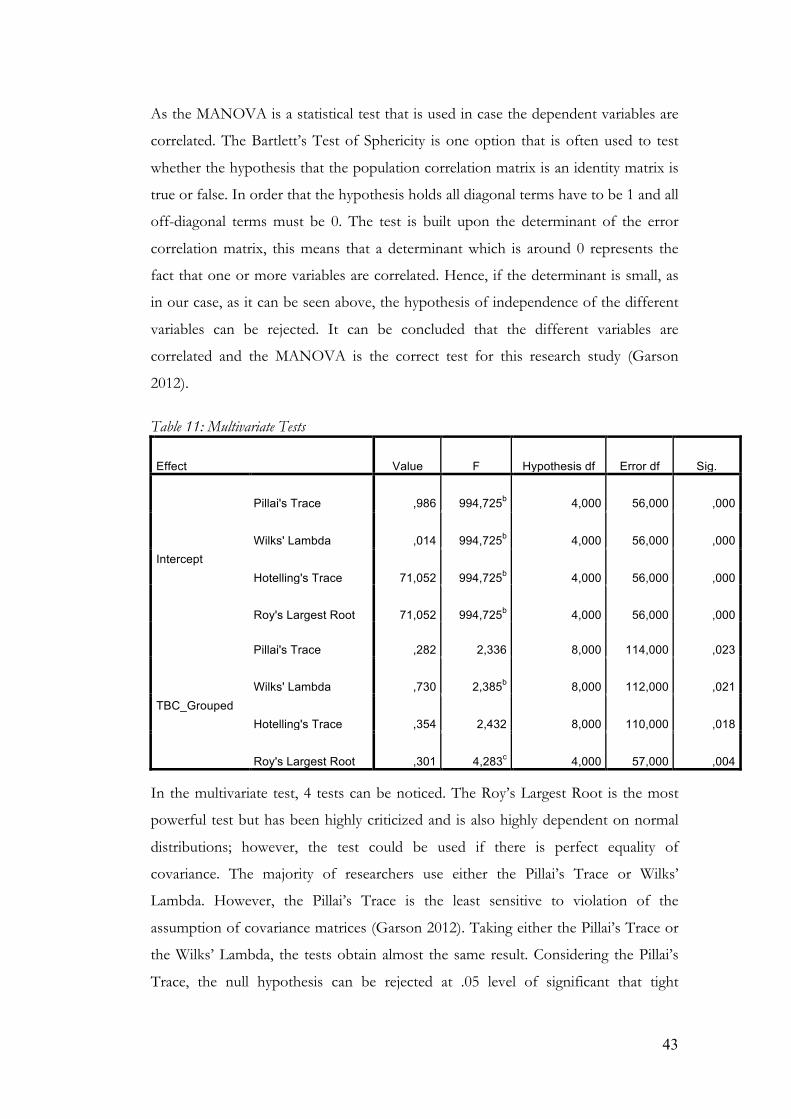
43
As the MANOVA is a statistical test that is used in case the dependent variables are
correlated. The Bartlett’s Test of Sphericity is one option that is often used to test
whether the hypothesis that the population correlation matrix is an identity matrix is
true or false. In order that the hypothesis holds all diagonal terms have to be 1 and all
off-diagonal terms must be 0. The test is built upon the determinant of the error
correlation matrix, this means that a determinant which is around 0 represents the
fact that one or more variables are correlated. Hence, if the determinant is small, as
in our case, as it can be seen above, the hypothesis of independence of the different
variables can be rejected. It can be concluded that the different variables are
correlated and the MANOVA is the correct test for this research study (Garson
2012).
Table 11: Multivariate Tests
Effect Value F Hypothesis df Error df Sig.
Intercept
Pillai's Trace ,986 994,725b 4,000 56,000 ,000
Wilks' Lambda ,014 994,725b 4,000 56,000 ,000
Hotelling's Trace 71,052 994,725b 4,000 56,000 ,000
Roy's Largest Root 71,052 994,725b 4,000 56,000 ,000
TBC_Grouped
Pillai's Trace ,282 2,336 8,000 114,000 ,023
Wilks' Lambda ,730 2,385b 8,000 112,000 ,021
Hotelling's Trace ,354 2,432 8,000 110,000 ,018
Roy's Largest Root ,301 4,283c 4,000 57,000 ,004
In the multivariate test, 4 tests can be noticed. The Roy’s Largest Root is the most
powerful test but has been highly criticized and is also highly dependent on normal
distributions; however, the test could be used if there is perfect equality of
covariance. The majority of researchers use either the Pillai’s Trace or Wilks’
Lambda. However, the Pillai’s Trace is the least sensitive to violation of the
assumption of covariance matrices (Garson 2012). Taking either the Pillai’s Trace or
the Wilks’ Lambda, the tests obtain almost the same result. Considering the Pillai’s
Trace, the null hypothesis can be rejected at .05 level of significant that tight
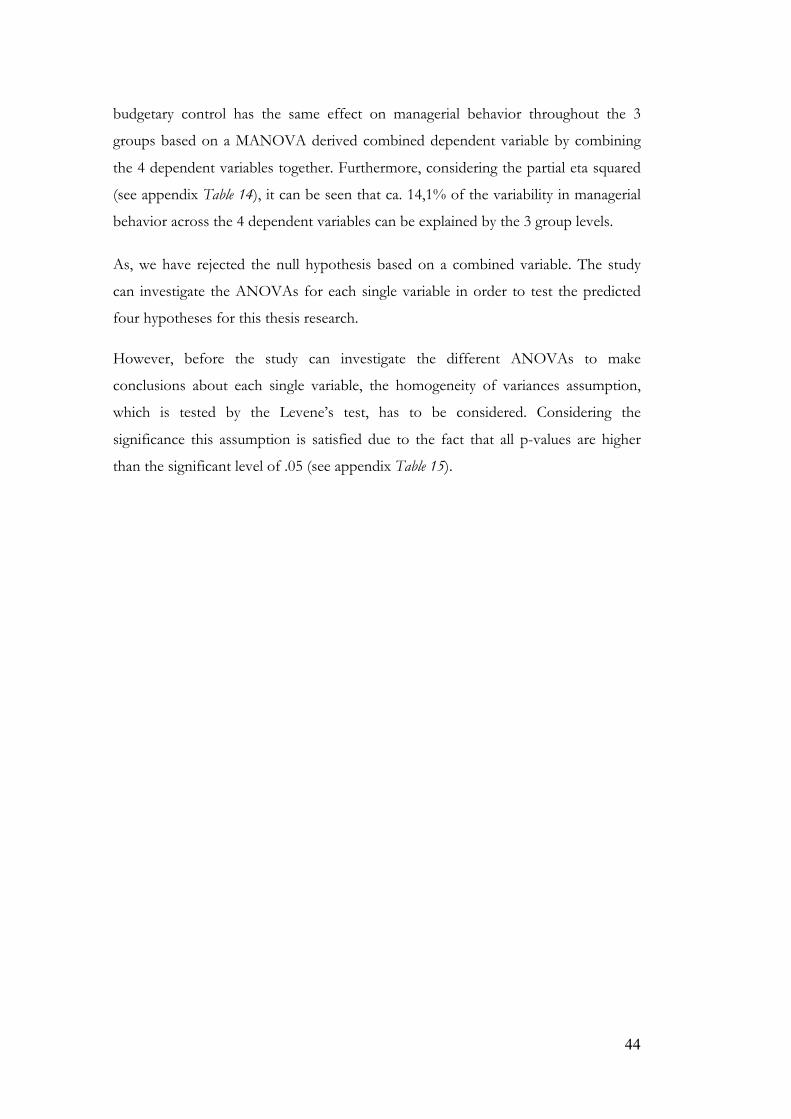
44
budgetary control has the same effect on managerial behavior throughout the 3
groups based on a MANOVA derived combined dependent variable by combining
the 4 dependent variables together. Furthermore, considering the partial eta squared
(see appendix Table 14), it can be seen that ca. 14,1% of the variability in managerial
behavior across the 4 dependent variables can be explained by the 3 group levels.
As, we have rejected the null hypothesis based on a combined variable. The study
can investigate the ANOVAs for each single variable in order to test the predicted
four hypotheses for this thesis research.
However, before the study can investigate the different ANOVAs to make
conclusions about each single variable, the homogeneity of variances assumption,
which is tested by the Levene’s test, has to be considered. Considering the
significance this assumption is satisfied due to the fact that all p-values are higher
than the significant level of .05 (see appendix Table 15).
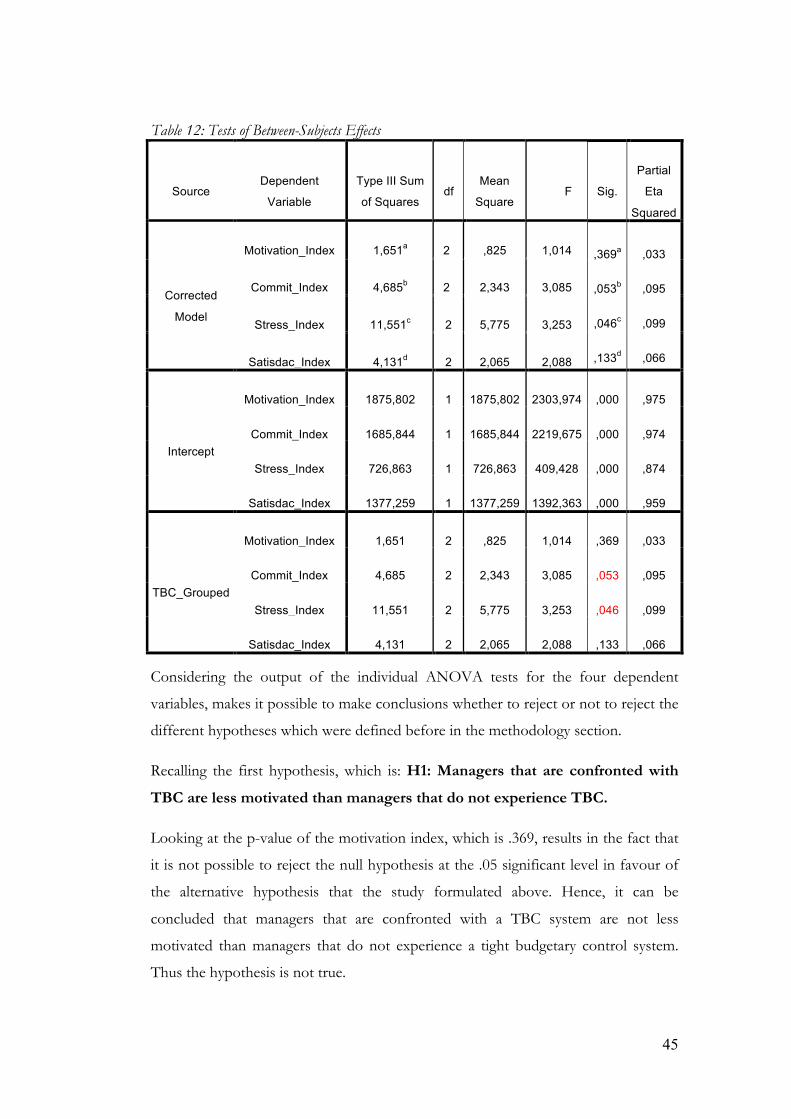
45
Table 12: Tests of Between-Subjects Effects
Source Dependent
Variable
Type III Sum
of Squares df
Mean
Square F Sig.
Partial
Eta
Squared
Corrected
Model
Motivation_Index 1,651a 2 ,825 1,014 ,369a
,053b
,046c
,133d
,033
,095
,099
,066
Commit_Index 4,685b 2 2,343 3,085
Stress_Index 11,551c 2 5,775 3,253
Satisdac_Index 4,131d 2 2,065 2,088
Intercept
Motivation_Index 1875,802 1 1875,802 2303,974 ,000 ,975
Commit_Index 1685,844 1 1685,844 2219,675 ,000 ,974
Stress_Index 726,863 1 726,863 409,428 ,000 ,874
Satisdac_Index 1377,259 1 1377,259 1392,363 ,000 ,959
TBC_Grouped
Motivation_Index 1,651 2 ,825 1,014 ,369 ,033
Commit_Index 4,685 2 2,343 3,085 ,053 ,095
Stress_Index 11,551 2 5,775 3,253 ,046 ,099
Satisdac_Index 4,131 2 2,065 2,088 ,133 ,066
Considering the output of the individual ANOVA tests for the four dependent
variables, makes it possible to make conclusions whether to reject or not to reject the
different hypotheses which were defined before in the methodology section.
Recalling the first hypothesis, which is: H1: Managers that are confronted with
TBC are less motivated than managers that do not experience TBC.
Looking at the p-value of the motivation index, which is .369, results in the fact that
it is not possible to reject the null hypothesis at the .05 significant level in favour of
the alternative hypothesis that the study formulated above. Hence, it can be
concluded that managers that are confronted with a TBC system are not less
motivated than managers that do not experience a tight budgetary control system.
Thus the hypothesis is not true.
46
Continuing with the second hypothesis, this was formulated in the following way:
H2: TBC has a negative impact on managerial organizational commitment.
The result of the ANOVA output for the commitment index shows a two-tailed p-
value of .053. As the study investigates a one-tailed alternative hypothesis, this means
that the p-value has to be divided by 2, in order to consider only one half of a normal
distribution. After dividing the p-value by 2, which result in a one-tailed p-value of
.0265, which indicates that the alternative hypothesis is supported and significant.
Thus, it can be stated that H2 is true.
The third hypothesis about the managerial stress factor, was formulated as stated:
H3: Managers that experience TBC are more stressed than managers who do
not experience TBC.
The ANOVA test for the hypothesis about the stress index resulted in a two-tailed p-
value of .046, which is already significant at an alpha level of .05. Again, dividing the
two-tailed p-value by 2 gives a one-tailed p-value of .023. It can be concluded that
there is significant support for the alternative hypothesis. Thus, the formulated
hypothesis H3 is true. This means that managers who experience TBC are more
stressed compared to managers that do not experience TBC.
The last hypothesis which was formulated for the thesis research, was H4 which is
formulated in the following way: H4: Managers, who experience TBC, are less
satisfied than managers that do not experience TBC.
The result of the ANOVA test indicates a p-value of .133 for the two-tailed test.
Dividing this value by 2 in order to obtain the one-sided p-value results in a value of
.0633, which is not significant at an alpha level of .05. Hence, the null hypothesis
cannot be rejected in favour of the alternative hypothesis that is stated above. It can
be concluded that H4 is not true.
47
5. Chapter: Discussion
The aim of the thesis is to give insight how TBC effects managerial behaviour in the
Swedish public sector, whereas managerial behaviour includes four specific variables.
The behavioural variables to which the study refers to mainly shape managerial
behaviour are motivation, organizational commitment, stress, and satisfaction.
However, it is analysed in this study how each of the behavioural variables is affected
by a TBC system. Considering the economic situation, as many countries still
suffering the after-effect of the financial crisis as well as the Euro-crisis, the findings
could be quite valuable, as TBC systems are widely applied in times of financial
distress or economic difficulty. Furthermore, this research study about the effect of
TBC on managerial behaviour in the public market can be seen as one of the first
studies in this area. Previous research about TBC mostly investigated the relationship
between TBC and performance and was based on the private sector. Anthony and
Govindarajan (1998) and Merchant (1998) were one of the firsts who introduced the
topic of TBC in academic literature. Dahlan et al. (2007) investigated the effect of
TBC on firm‘ performance and stated in their findings a positive relationship.
However, main contribution to TBC research were delivered by the findings of van
der Stede (2001) who investigated the measures of TBC, which are widely applied in
this study as well. Based on previous research of TBC and the four behavioural
variables, it has been presumed that TBC has a negative effect on motivation,
commitment, and satisfaction, and in turn a positive effect on stress.
For the analysis, data from 62 public sector managers from different universities and
municipalities were collected. The respondents were asked questions about the
applied TBC system and their current level of motivation, organizational
commitment, stress, and satisfaction.
The result of the analysis indicated that the majority of the respondents when they
were asked whether they experience the applied organizational budgetary control
system as tight or not, 71% of the participants indicated that they experience a TBC
system at their organization. This result was also mainly reflected as the study
measured whether they indeed experience a TBC system in accordance with the TBC
measurements, which were identified by van der Stede (2001). Even though, the
majority of the respondents were regrouped to the neutral group the second highest
48
sample population belonged to the group that experience TBC at their organization.
Nevertheless, it can be argued that part of the neutral group actually experience TBC
but is not totally aware of it. Furthermore, it has to be mentioned, as the study
focuses on the Swedish public sector, that the Swedish economy is relatively healthy
compared with other European countries such as Greece, Spain, or Portugal.
Taking into account the result of TBC on motivation, the outcome indicates that the
null hypothesis cannot be rejected in favour of the predicted alternative hypothesis.
Hence, it can be concluded that managers that face TBC are not less motivated than
other managers that do not face TBC at their organization. Comparing the result
with Buelens and Broeck (2007) findings that public sector employees are more
stronger motivated by commitment to stainable work environments, which are
probably more prevalent in the public sector than in the private sector, could explain
the result of this study. Nevertheless, studies that resulted from research in the
private sector indicated that motivation has a negative affect to the difficulty of
achieving organizational budgets (Naka 1992).
Considering the outcome of the effect of TBC on managerial organizational
commitment it can be concluded that there is a negative relationship between TBC
and organizational commitment of managers. This means that managers that
experience TBC are less committed to their organization than managers that do not
face TBC. Since Meyer and Allen (2004) found out in their study that committed
employees work harder in order to achieve organizational objectives, the findings of
this study urgently suggest that top managers should find a way to balance budgetary
control and organizational commitment to increase performance of their managers.
The result about the impact of TBC on managerial stress indicates a positive relation
between the two variables. This means, as previously presumed, that if budgetary
control increases, also managerial stress increases. As previously stated TBC system
are mostly applied in times of financial difficulty where managers anyway already fear
that their work placement could be terminated, which in turn increases stress. If this
would not be enough, the implementation of a TBC system that even puts more
pressure on employees and makes organizational budget achievement more difficult,
additionally increases perceived stress by managers. Hence, a negative relationship
between TBC and managerial stress can be noticed.
49
Further results of this study indicate that not as previously predicted, satisfaction
does not have a negative relationship with the implementation of TBC. The null
hypothesis cannot be rejected in favour of the alternative hypothesis, which was
created for this research study. The result shows that there is no significant
difference between managers that face TBC or that do not face TBC and the effect
on satisfaction. As the alternative hypothesis is derived from a previous study by
Brownwell (1983), who found evidence that budgetary participation is positively
related to job-satisfaction, this research study does not indicate significant evidence
to support Brownwell (1983). Further, it can be argued that budgetary participation is
not significantly correlated with TBC and managers are still able to participate to a
certain degree in the budget formulation process.
50
6. Chapter: Conclusion
The impacts of TBC on managerial behaviour were investigated in this study. The
sample population for this study comprised managers working in different areas in
the public sector in Sweden. According to the aim of the study, a survey
questionnaire with five sections was created (tight budget control experience,
managerial motivation, organizational commitment, stress and managerial satisfaction
scales) and this questionnaire was sent to 800 managers via electronic mail. 62
managers responded to the questionnaire. The response rate was 7.7%. In the
analysis of the data, reliability analysis, descriptive statistics, and MANOVA analysis
were used through the SPSS system.
The results of this study provide a number of contributions to management and
accounting literature by focusing on the public sector in Sweden. First, the study
suggests that the majority of managers working in the public sector actually
experience TBC. Second, the first hypothesis, which tested the effect of TBC on
motivation and stated a negative relationship between the variables, did not result in
a significant relationship and the null hypothesis could not be rejected. Third, the
alternative hypothesis that investigated a negative relationship between TBC and
organizational commitment resulted in a significant relationship between the
variables. This means that the second hypothesis is true. Fourth, the study’s results
find evidence for a positive relationship between managerial stress and TBC. Finally,
the fourth hypothesis that considered the relationship between TBC and satisfaction
was not supported, which means that managers that face TBC are not necessarily less
satisfied than managers that do not face TBC at their organization.
However, the stated results of this research study have to be considered with care, as
the study lacks certain limitation due to small sample size of only 62 respondents.
Moreover, the sample distribution between the different groups is quite disperse,
which can also influence the findings of this study. Another weakness that the
research study recognizes is the fact that due to the anonymous responses of the
participants, it has not been possible to make differences between managers that
work for universities and are affected by budgetary constraints set by the national
government, and managers that work for local municipalities, which underlie the
51
responsibility of municipality councils that are able to slightly leverage their local
budgets by increasing local income taxes.
Nevertheless, this study can be considered as a starting point for further research in
this area and could be expanded for research consideration in other countries, which
are more heavily effected by economic downturns than the Swedish economy. But
also the consideration of other variables such as public satisfaction could be an
option.
52
7. References:
Angela Morrow (2001). RN, former About.com Guide Updated January 19, 2011.
http://dying.about.com/od/glossary/g/stress.htm
Argyris, C. (1953). Human Problems with Budgets. Harvard Business Review, 31(1): 97-
110.
Aziri B. (2011). Job satisfaction: A Literature review. Management research and Practice
Vol. 3 Issue 4. PP: 77-86.
Banks, A. and Giliberti, J. (2008). Budgeting. 3rd ed. London: McGraw-Hill.
Beehr A. T, Jex M.S., Stacy A. B., & Murray A.M. (2000). Work Stressors and
Coworker Support as Predictors of Individual Strain and Job Performance. Journal
of Organizational Behavior, Vol. 21, No. 4 , p 391-405.
Brownell, P. (1983). Leadership Style, Budgetary Participation and Managerial
Behavior, Accounting, Organizations and Society, 8, 4: 307-321.
Bryman, A. & Bell, E. (2011). Business Research Methods. 3rd Edition. New York:
Oxford University Press Inc.
Buchanan, B. (1974). “Building Organizational Commitment: The Socializaion of
Managers in Work Organizations,” Administrative Science Quarterly, 19/4: 533.
Buelens, M., & Van den Broeck, H. (2007). An analysis of differences in work
motivation between public and private sector organizations. Public Administration
Review, 67(1), 65-74. Retrieved March 24, 2009, doi:10.1111/j.1540-
6210.2006.00697.
Campbell, P.J., Dunnette, M.D., Lawler, E.L., and Weick, K.F., (1970). Managerial
Behaviour, Performance and Effectiveness. McGraw Hill Book Campany, New York.
Carol S. Steinhaus; James L. Perry (1996). Organizational Commitment: Does Sector
Matter? Public Productivity & Management Review, Vol. 19, No. 3., pp. 278-288.
Dahlan, M. et al. (2007). Thight Budgetary Control, Business Strategy, External
Environment and Firm Performance. Vol 6 (NO. 2), p.81-97. Available at:
53
http://myais.fsktm.um.edu.my/10640/1/Pages_from_Vol._6_No._2-
_page_81_to_97.pdf [Accessed: 3rd April 2013].
Das, G. (1982). Defining Managerial Behaviour: Some Indicators. Indian Journal of
Industrial Relations, Vol. 17 ( No. 4).
Drake Peterson Pamela, and Fabozzi J. Frank (2010), The Basics of Finance: An Introduction to Financial Markets, Business Finance, and Portfolio Management, John Wiley and Sons Inc., Hoboken, New Jersey.
Einar & Torvald (2012). Working onboard – Job perception, organizational
commitment and job satisfaction in the cruise sector- Tourism Management Volume
33, Issue 3, Pages 592–597.
Eker, M. (2006). The Impact of Budget Participation on Managerial Performance via
Organizational Commitment: A Study on the Top 500 Firms in Turkey. Ankara
Üniversitesi SBF Dergisi . http://dergiler.ankara.edu.tr/dergiler/42/1345/15581.pdf
Emmanuel, C., Otley, D. and Merchant, A. (2004). Accounting for Management Control.
2nd ed. London: Thompson Learning.
Ganster & Loghan (2005). An experimental evaluation of a control intervention to
alleviate job-related stress. Journal of Management. 31:90.
Garson, G. D. (2012). General Linear Models: Multivariate GLM &
MANOVA/MANCOVA. Asheboro, NC: Statistical Associates Publishers.
Gortner, H.,Mahler, J, &Nicholson, J. (1987). Organization theory: Apublicperspective.
Chicago: Dorsey.
Harrison, W. & Horngren, C (2008). Financial Accounting. 7th Edition. New Jersey:
Pearson Prentice Hall.
Heavey, Halliday, Gilbert and Murphy (2011). Enhancing performance Bringing trust,
commitment and motivation together in organisations. The Braybrooke Press Ltd. Journal of
General Management. Vol. 36 No. 3 p 1-18.
Health and Safety Executive (2001). Help on Work-related Stress: A Short Guide.
INDG281 Rev1 2001.Sudbury: HSE Books.
54
Herzberg, F., Mausner, B., Peterson, R. O., & Capwell, D. F. (1957). Job attitudes:
Review of research and opinion. Pittsburgh, PA: Psychological Service of
Pittsburgh.
Hoppock, R. (1935). Job satisfaction. New York: Harper and Brothers. p 47.
Hoy, W. K., & Sousa, D. A. (1984). Delegation: The neglected aspect of participation
in decision making. Alberta Journal of Educational Research, 30, p320-331.
Kanjia, Gopal K. and Parvesh, Choprab K. (2009). Psychosocial system for work
well-being: On measuring work stress by causal pathway. Total Quality Management
Vol. 20, No. 5, May 2009, 563–580.
Judge, T. A., Boudreau, J. W., & Bretz, R. D. (1994). Job and life attitudes of male
executives. Journal of Applied Psychology, 79, 767-782.
Kahn, R. L., Wolfe, D. M., Quinn, R. P., Snoek, J. D., & Rosenthal, R. A. (1984).
Organizational stress: Studies in role conflict and ambiguity. New York: Wiley.
Larson, E. W., & Fukami, C. V. ( 1984). Relationships between worker behavior and
commitment to the organization and union. Paper presented at the annual meeting of the
Academy of Management, Boston.
Luthans, F. (1998). Organisational Behaviour. 8th ed. Boston: Irwin McGraw-Hill.
Macintosh, N. & Quattrone, P. (2010). Management Accounting and Control Systems: An
Organizational and Sociological Approach. West Sussex: John Wiley & Sons. p34-112.
Merchant, K. A., (1998). Modern Management Control Systems. Upper Saddle River,
Prentice Hall.
Merchant, K. (1985). Accounting, Organizations & Society. Management Journal Review.
Jan1985, Vol. 10 Issue 1, p67-85. 19p.
Meyer, John P. and Allen, Natalie J. (2004). TCM Employee Commitment Survey
Academic Users Guide. Department of Psychology The University of Western Ontario P 1-
16.
55
Margaret, Scott, E. & David (2012). The Effects of Preventive and Detective
Controls on Employee Performance and Motivation. Contemporary Accounting
Research Vol. 29 No. 2 (Summer 2012) pp. 432–452.
McNeese-Smith D.K. (1997). The influence of manager behavior on nurse’s job satisfaction, productivity and commitment. Journal of Nursing Administration, 27, 47-55.
Mitchell, T. R., & Larson, J. R., Jr. (1987). People in organizations: An introduction to
organizational behavior. 3rd ed.. New York, NY: McGraw-Hill.
Mateja Lorber', Brigita Skela Savic. (2012). Job satisfaction of nurses and identifying factors of
job satisfaction in Slovenian Hospitals. PUBLIC HEALTH doi:
10.3325/cmJ.2012.S3.2B3.
Mowday, R. T., Steers, R. M., & Porter, L. W (1979). The measurement of
organizational commitment. Journal of Vocational Behavior, 14,p224-247.
Naka, Y. (1992). Motivation and causal inferences in the budgetary control. [report] Barrel -
Otaru University of Commerce Academic Collections. Available at:
http://hdl.handle.net/10252/4177
Nutt, P. (2005). Comparing Public and Private Sector Decision-Making Practices.
Journal of Public Administration Research and Theory, p.JPART 16:289–318. Available
at:
http://faculty.cbpp.uaa.alaska.edu/afgjp/PADM610/Comparing%20Public%20a
nd%20Private%20D-M.pdf [Accessed: 12th May 2013].
Oecd.org (2013). Newsroom - Organisation for Economic Co-operation and Development.
[online] Available at:
http://www.oecd.org/newsroom/aidtopoorcountriesslipsfurtherasgovernmentsti
ghtenbudgets.htm [Accessed: 12 May 2013].
Papinczak T. (2012). Perceptions of job satisfaction relating to affective organisation
commitment. Medical Education. Volume 46, Issue 10, pages 953–962.
Radiah Othman. (2012). Budgetary participation: How it affects performance and commitment.
Accountancy Business and the Public Interest .p 53-73.
56
Rainey, Hal G. (1997). Understanding and managing public organizations. 2d ed. San
Francisco, CA: Jossey-Bass Publishers.
Regeringskansliet - Government Offices of Sweden (2013) The Central Government
Budget Process. [online] Available at:
http://www.government.se/sb/d/10494/a/102211 [Accessed: 11 Apr 2013].
Rose, M. (2003). Good deal, bad deal? Job satisfaction in occupations. Work
Employment and Society , Vol. 17, No. 3, 2003, pp. 503-530.
Raghunandan, M., Ramgulam, N. and Raghunandan-Mohammed, K. (2012). Examining the Behavioural Aspects of Budgeting with particular emphasis on Public Sector/Service Budgets. International Journal of Business and Social Science, Vol. 3 (No. 14 [Special Issue – July 2012]), p.110-117.
Roberts, B. W. (2006). Personality development and organizational behavior. Research in Organizational Behavior, 27: 1-40.
Singh, A.P. and Pestonjee, D.M. (1974). Supervisory Behaviour and Job Satisfaction.
Indian Journal of Industrial Relations. 9, 1774.
Simmons, B. L. (2000). Eustress at work: Accentuating the positive. Unpublished Ph.D.,
Oklahoma State University, United States – Oklahoma.
Shaukat , A. (2008). Research Methodology: Back to Basics. Czech Management Center,
[online] Available at:
http://www.journal.au.edu/abac_journal/jan98/article5.html [Accessed: 13 May
2013].
Tayles, M. (ACCA - The Global Body for Professional Accountants )(1998). Budget
control. [online] Available at:
http://www2.accaglobal.com/archive/sa_oldarticles/studentaccountant1/43925
[Accessed: 9 May 2013].
Thomas W. H., Kelly L. Sorensen and Frederick H. K. Yim (2009). Does the Job
Satisfaction�Job Performance Relationship Vary Across Cultures? Journal of Cross-
Cultural Psychology. 2009 40: 761.
57
Tremblay, M., Blanchard, ., Taylor, S. and Pelletier, L. (2009). Work Extrinsic and
Intrinsic Motivation Scale: Its Value for Organizational Psychology Research.
Canadian Journal of Behavioural Science, Vol. 41 ( No. 4), p. 213–226. Available at:
http://www.selfdeterminationtheory.org/SDT/documents/2009_TremblayBlanc
hardetal_CJBS.pdf.
Van Maanen, J. (1975). Police socialization: A longitudinal examination of job
attitudes in an urban police department. Administration Science Quarterly, 20, 207-
228.
Van der Stede, W. (2000). The relationship between two consequences of budgetary
controls: budgetary slack creation and managerial short-term orientation.
Accounting, Organizations and Society 25: 609-622.
Van der Stede, W. (2001) Measuring 'tight budgetary control'. Management accounting
research, 12 (1). 119-137. ISSN 1044-5005.
Venkatasivakumar, V. (2009). Cost Accounting and Financial Management: For CA
Integrated Professional Competence Course (IPCC). 2nd ed. New Delhi: Person
Education South Asia.
Wright, B. (2007). Public service and motivation: does mission matter? Public
Administration Review, 67(1), 54-64. Retrieved March 24, 2009.
Yeager, S., Rabin, J., & Vocino, T. (1985). Feedback and administrative behavior in the
public sector. Public Administration Review, 45(5), 570. Retrieved March 24, 2009, from
Business Source Premier database.

58
8. Appendix
8.1. Survey Questionnaire:
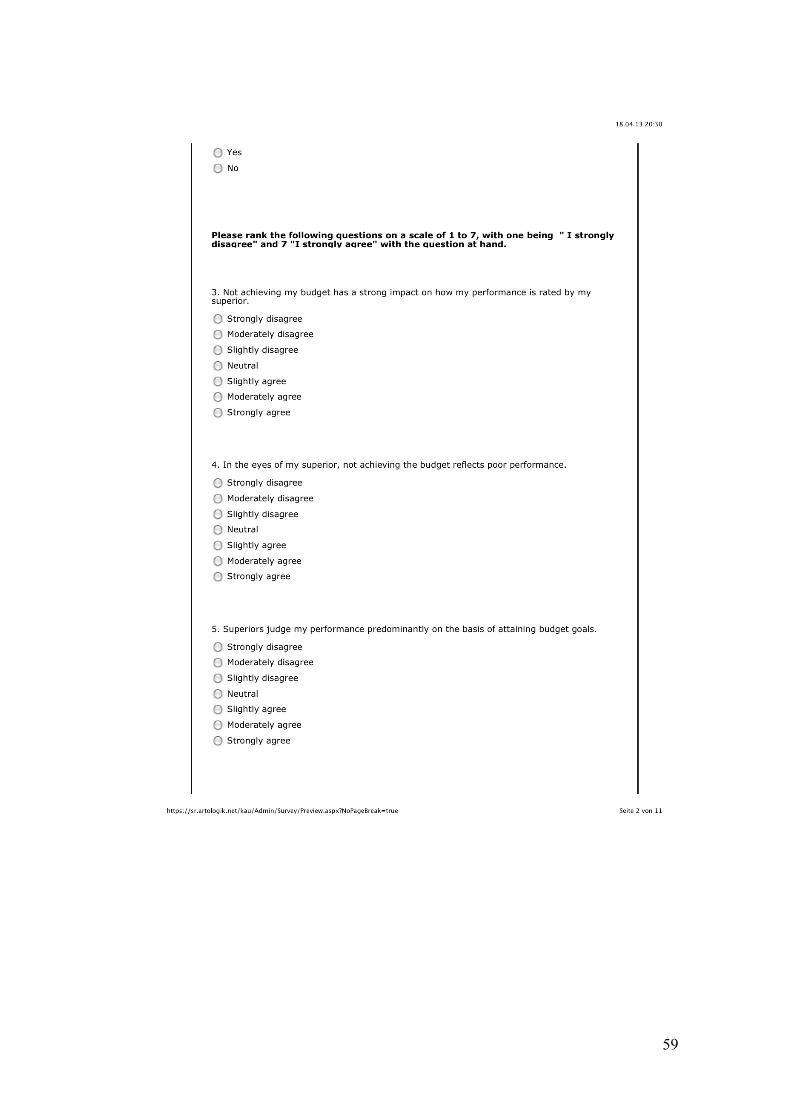
59
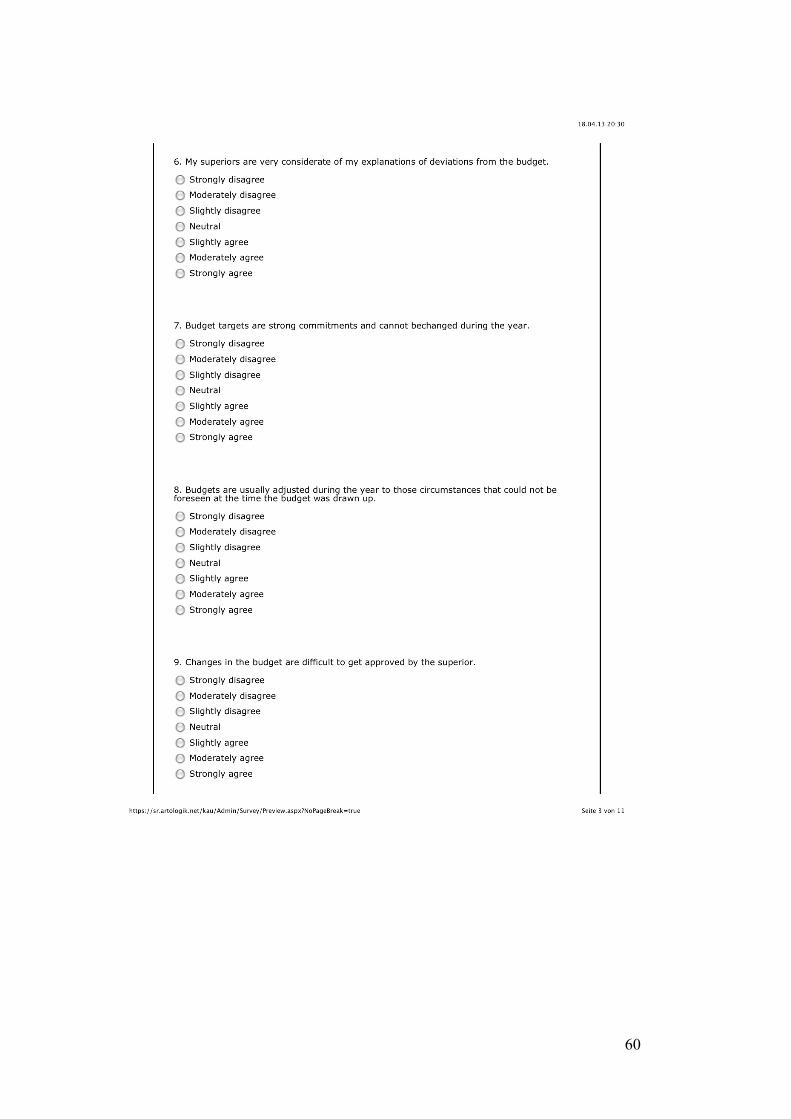
60
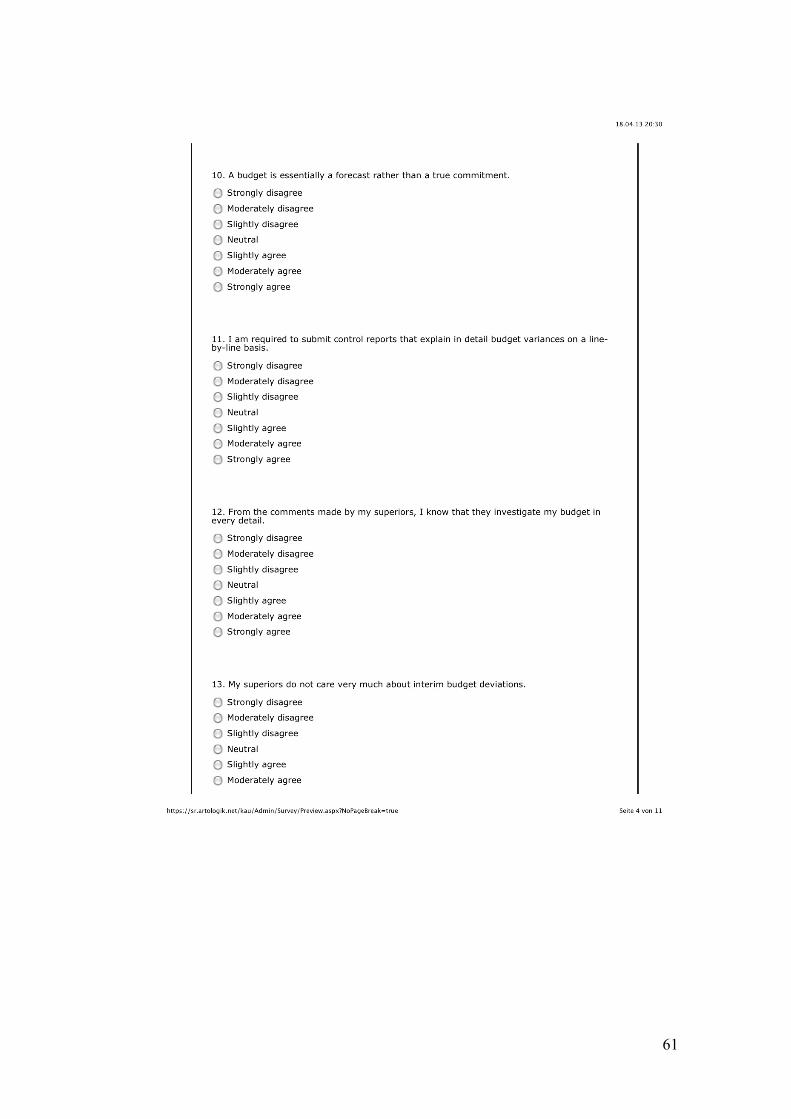
61
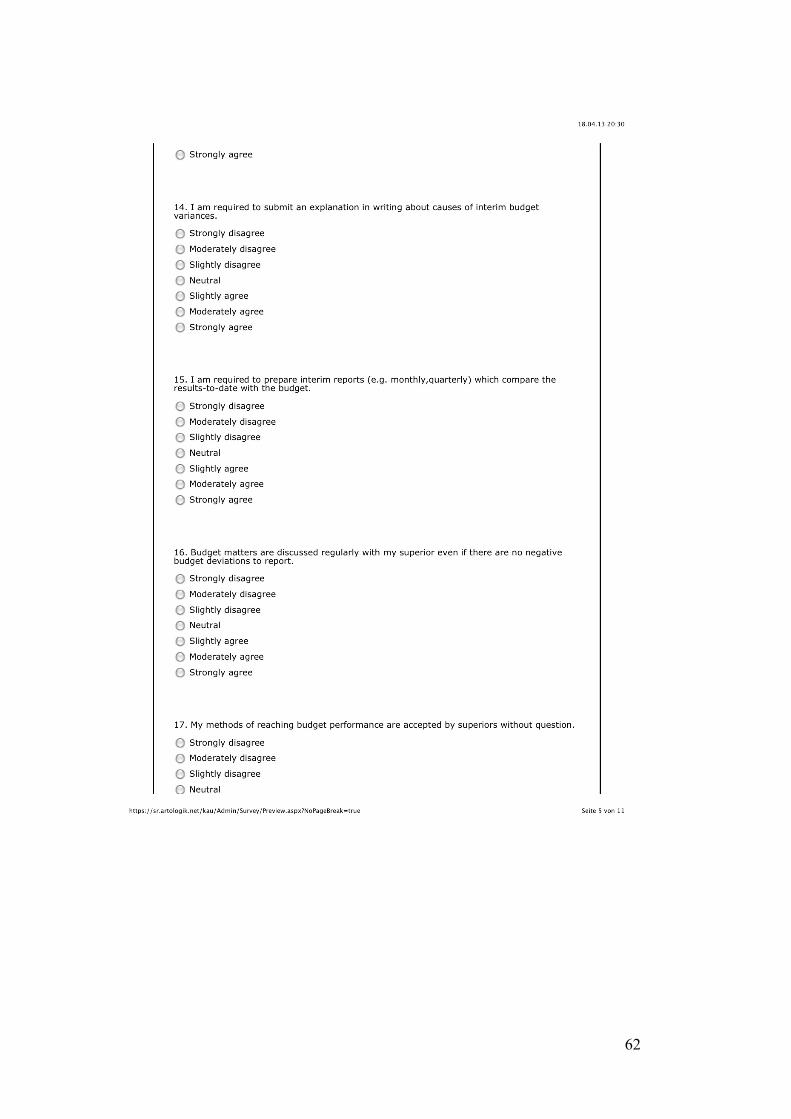
62
63
64
65
66
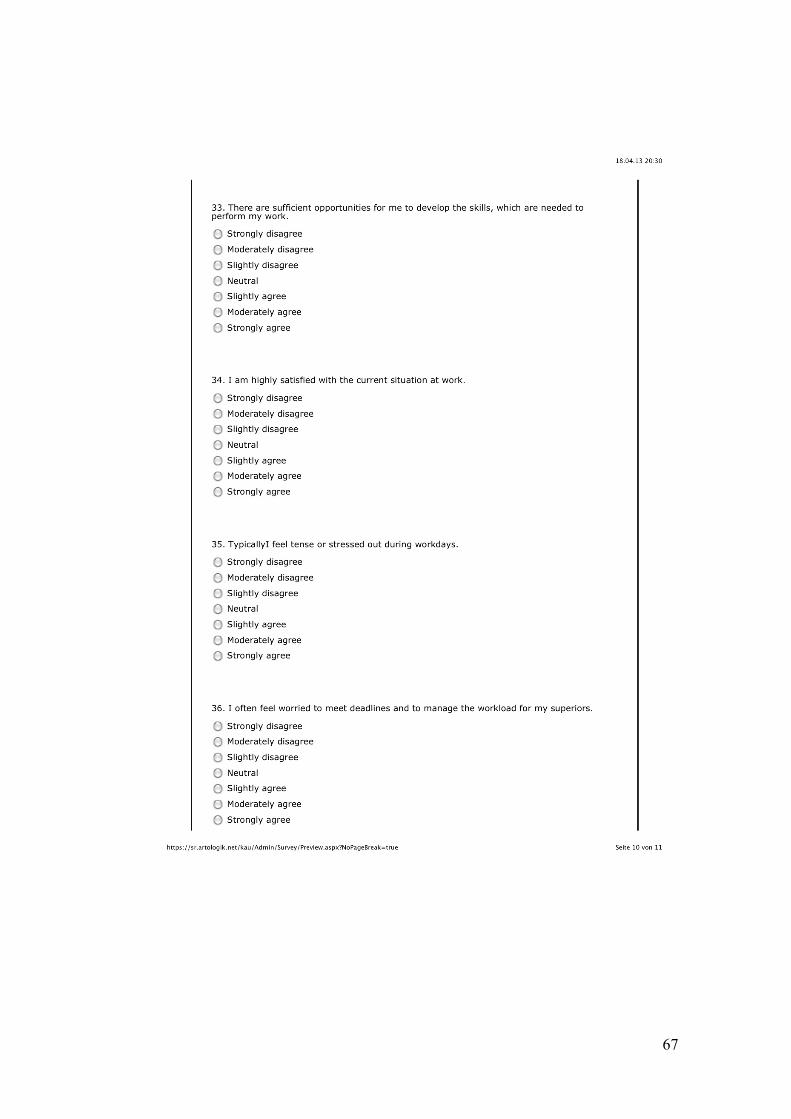
67
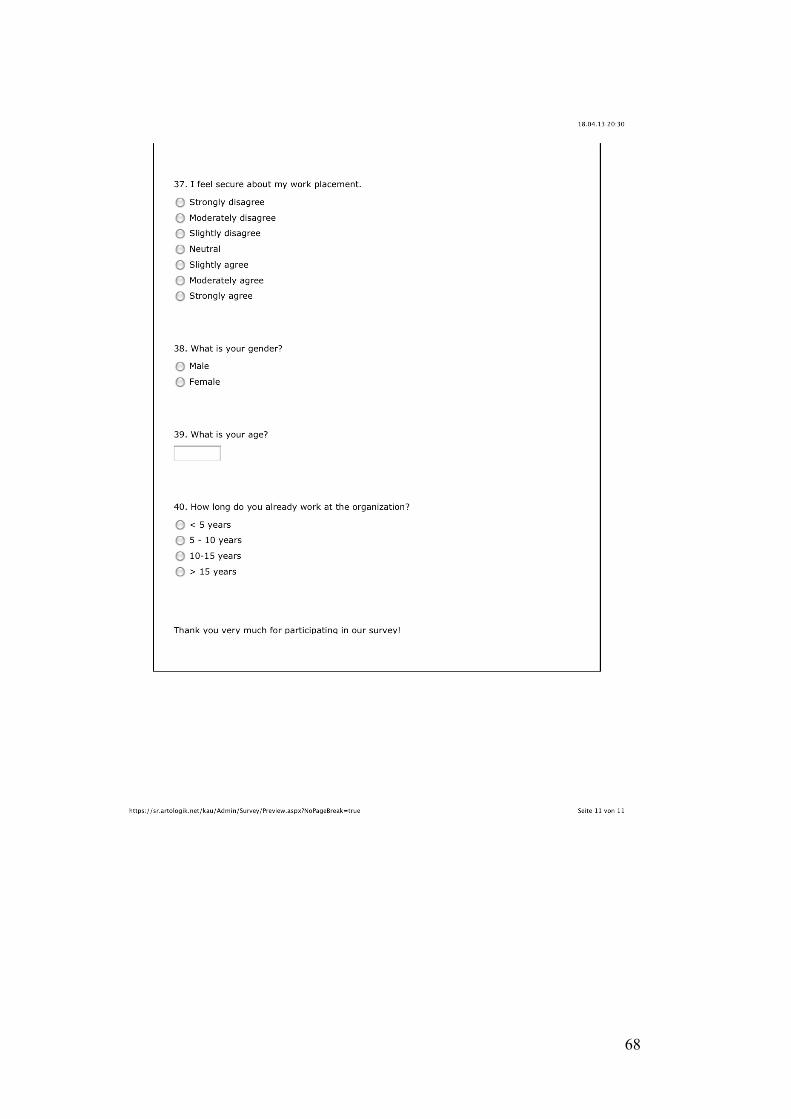
68
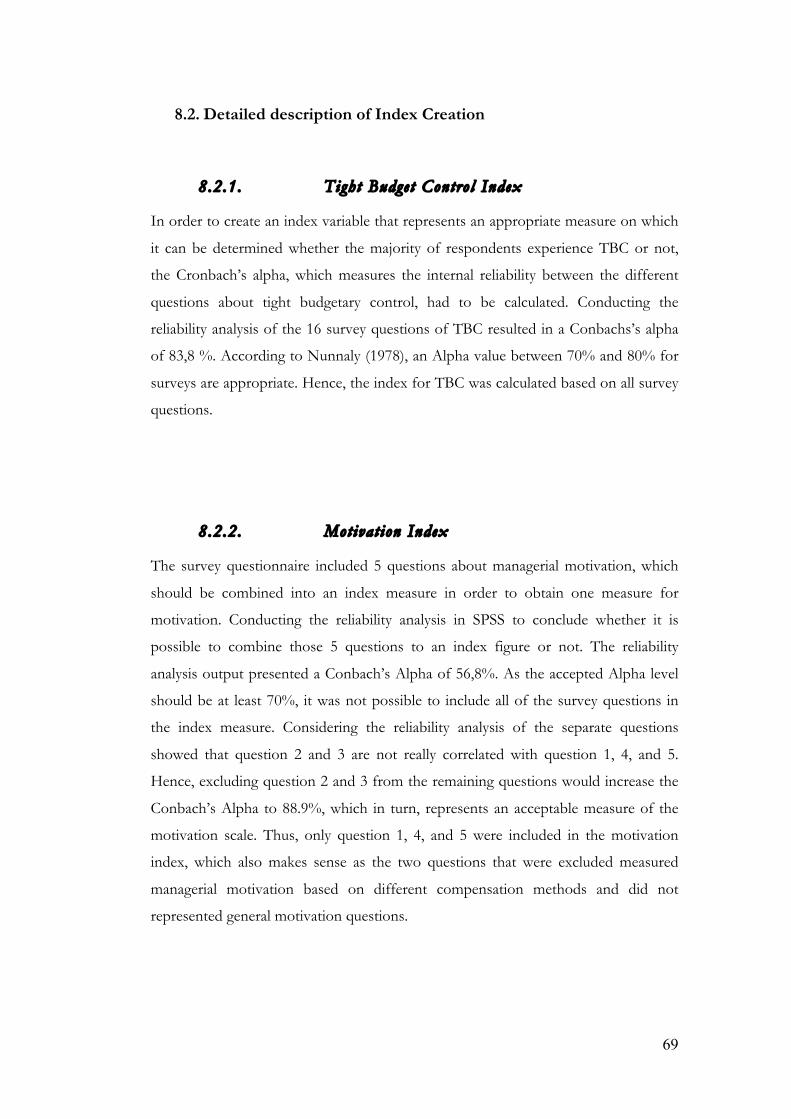
69
8.2. Detailed description of Index Creation
8.2.1. Tight Budget Contro l Index
In order to create an index variable that represents an appropriate measure on which
it can be determined whether the majority of respondents experience TBC or not,
the Cronbach’s alpha, which measures the internal reliability between the different
questions about tight budgetary control, had to be calculated. Conducting the
reliability analysis of the 16 survey questions of TBC resulted in a Conbachs’s alpha
of 83,8 %. According to Nunnaly (1978), an Alpha value between 70% and 80% for
surveys are appropriate. Hence, the index for TBC was calculated based on all survey
questions.
8.2.2. Motivat ion Index
The survey questionnaire included 5 questions about managerial motivation, which
should be combined into an index measure in order to obtain one measure for
motivation. Conducting the reliability analysis in SPSS to conclude whether it is
possible to combine those 5 questions to an index figure or not. The reliability
analysis output presented a Conbach’s Alpha of 56,8%. As the accepted Alpha level
should be at least 70%, it was not possible to include all of the survey questions in
the index measure. Considering the reliability analysis of the separate questions
showed that question 2 and 3 are not really correlated with question 1, 4, and 5.
Hence, excluding question 2 and 3 from the remaining questions would increase the
Conbach’s Alpha to 88.9%, which in turn, represents an acceptable measure of the
motivation scale. Thus, only question 1, 4, and 5 were included in the motivation
index, which also makes sense as the two questions that were excluded measured
managerial motivation based on different compensation methods and did not
represented general motivation questions.
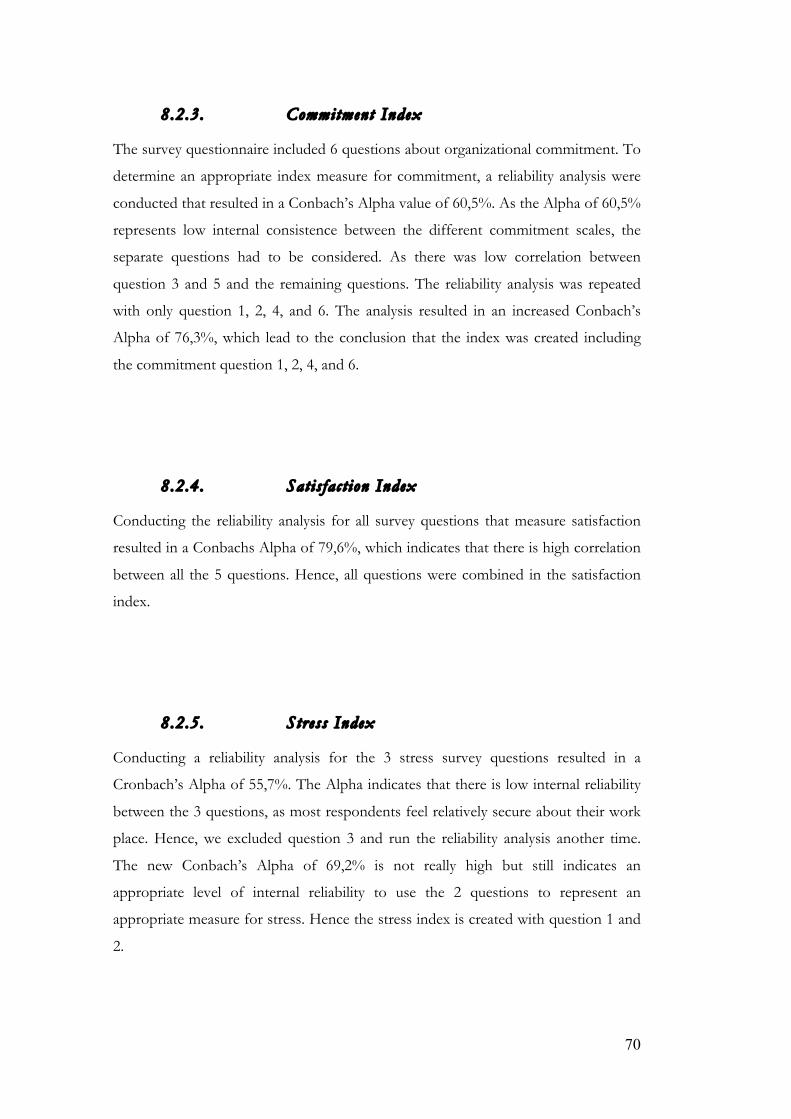
70
8.2.3. Commitment Index
The survey questionnaire included 6 questions about organizational commitment. To
determine an appropriate index measure for commitment, a reliability analysis were
conducted that resulted in a Conbach’s Alpha value of 60,5%. As the Alpha of 60,5%
represents low internal consistence between the different commitment scales, the
separate questions had to be considered. As there was low correlation between
question 3 and 5 and the remaining questions. The reliability analysis was repeated
with only question 1, 2, 4, and 6. The analysis resulted in an increased Conbach’s
Alpha of 76,3%, which lead to the conclusion that the index was created including
the commitment question 1, 2, 4, and 6.
8.2.4. Satis fac t ion Index
Conducting the reliability analysis for all survey questions that measure satisfaction
resulted in a Conbachs Alpha of 79,6%, which indicates that there is high correlation
between all the 5 questions. Hence, all questions were combined in the satisfaction
index.
8.2.5. Stress Index
Conducting a reliability analysis for the 3 stress survey questions resulted in a
Cronbach’s Alpha of 55,7%. The Alpha indicates that there is low internal reliability
between the 3 questions, as most respondents feel relatively secure about their work
place. Hence, we excluded question 3 and run the reliability analysis another time.
The new Conbach’s Alpha of 69,2% is not really high but still indicates an
appropriate level of internal reliability to use the 2 questions to represent an
appropriate measure for stress. Hence the stress index is created with question 1 and
2.
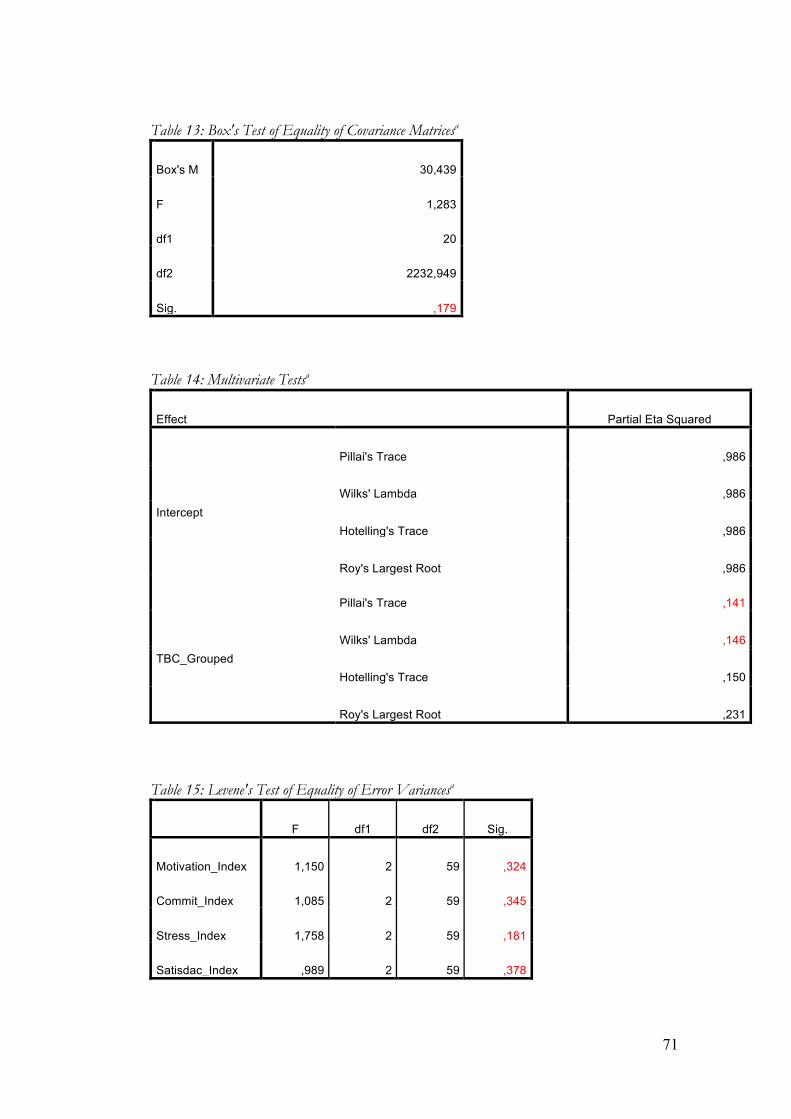
71
Table 13: Box's Test of Equality of Covariance Matricesa
Box's M 30,439
F 1,283
df1 20
df2 2232,949
Sig. ,179
Table 14: Multivariate Testsa
Effect Partial Eta Squared
Intercept
Pillai's Trace ,986
Wilks' Lambda ,986
Hotelling's Trace ,986
Roy's Largest Root ,986
TBC_Grouped
Pillai's Trace ,141
Wilks' Lambda ,146
Hotelling's Trace ,150
Roy's Largest Root ,231
Table 15: Levene's Test of Equality of Error Variancesa
F df1 df2 Sig.
Motivation_Index 1,150 2 59 ,324
Commit_Index 1,085 2 59 ,345
Stress_Index 1,758 2 59 ,181
Satisdac_Index ,989 2 59 ,378

72