Embed Size (px)
Citation preview

For comments, suggestions or further inquiries please contact:
Philippine Institute for Development Studies
The PIDS Discussion Paper Seriesconstitutes studies that are preliminary andsubject to further revisions. They are be-ing circulated in a limited number of cop-ies only for purposes of soliciting com-ments and suggestions for further refine-ments. The studies under the Series areunedited and unreviewed.
The views and opinions expressedare those of the author(s) and do not neces-sarily reflect those of the Institute.
Not for quotation without permissionfrom the author(s) and the Institute.
The Research Information Staff, Philippine Institute for Development Studies3rd Floor, NEDA sa Makati Building, 106 Amorsolo Street, Legaspi Village, Makati City, PhilippinesTel Nos: 8924059 and 8935705; Fax No: 8939589; E-mail: [email protected]
Or visit our website at http://www.pids.gov.ph
September 1997
The Effects of the Five PercentUniform Tariff on Agriculture
Loreli C. de Dios
DISCUSSION PAPER SERIES NO. 97-19

al liLii •
.........,.,,:_.................._,,,T............,...,_.p;_._,,_..........._...........:.c.:.:,::-:._:_::_:_:`_,_:_,:_:_:_:_:,:_`:_:_:,:_:_:_:_:_:_:_:_c_:_:,:_:_:_:_:_:_:_:_:_:,:.........;:_.,_;_:,:,:,_..............>..........................
:_,::,ili__ii:!i!i:_ii!ii_:!i__iiii_,_:iiii:i:,:__i:#!!,i,!_!i,ii._._iiii!ii__,:',!,:iii.i,_.,_i:i:_ _::#!i_iiiii!ii__:___:_i:i__#_ii_,_#_i_,i_ ::,_:#_i__:_i_iiii,!ilii!iiliii_!,.__ 4i!,!i,i_i,]_:i:],::,:,ii,_i_i_ii,i_,i::_,]ili,]:::]i::I_:::::::::::::::::::::::::::::::::::::::._::-:---,::-'._'-:-.,...................::.'.::.................:>--:c-_{'_'._':a'::_,::i:.' -:-.-:.-',::::.............:....... .;::--,:.". -_":.......:: '": _.......:.-.-,--.-,v.;-'-,'-:,,'-:i:::!:::a::::::
::::::::::::::::::::::::::::::::::::::::::::::::::::::::::::::::::::::::::::::::::::::::::: :" ',, ? ,._, ' ," ::::i:" ': ..;:? ========================================:::::::::::::::::::::::::::::::::::::::::::
I!!I!i!iiii t iN®i',i',i',i',ii',i]iiiii',iiiiili_:_gi:#::#:_::_i5=':,:i1::y_:_*i::_:::_::_:=:i:=!_:_:_ii_.:.::i_:_!ig!_:.:_i_ii=::::_::_::%.a:.,::a::_:'::::!r:':'i..............iiiii..................!!_J::::_:::.!:i:_is_!!}!::::_:_:_:_::,!i}!:::_{!!:,`_._I1!!!_::_a*_:_?:,.:_ii_i_!:s_::_1:_?:%?.::_ii_'>_ii!"_%i/_a:<itii_:_::i_'l_%i/i_
THE EFFECTS OF THEFIVE PERCENT UNIFORM TARIFF
ON AGRICULTURE
Loreh C. de DiosEconomist V
Philippine Institute forDevelopment StudiesMakatl, Metro Manila
FINAL RE PORTJULY 31, 1997

TABLE OF CONTENTS
I. Introduction
I1. Methodology
II1. Past Estimates of Agricultural Intervention
IV. Current Policy Environment
V. PSE Estimates
VI. Corn Producers
A. Policy Environment
B. Previous Results
C. DRC Results
VII. Implications of Commitments to the WTO, AFTA & APEC
VIII. Conclusions
ACKNOWLEDGEMENT
I gratefully acknowledge the methodological guidance of Dr. Erlinda M. Medalla,comments of Dr. Cristina David, Dr. Leonardo Gonzales and Dr. Intal, insights from EdQuitoriano and Kathleen Guimbatan and data support from BAS Director Dr. Romeo Recide andMODE; and to Ross Quisao for his patient and persistent research assistance.

EFFECTS ON AGRICULTURE OF
A FIVE-PERCENT UNIFORM TARIFF
I. INTRODUCTION
In providing the most basic of man's needs, the agricultural sector is undoubtedlyessential to any economy. In the Philippines this importance has been manifested inits significant contribution to national product and export earnings, as well as theemployment of a large proportion of workers. At the same time, however themajority of poor families are found iri the rural areas, and a highly uneven farm sizestructure has evolved in which a few large farms coexist with numerous small ones.
Compounding this situation is the fact that the sector is particularly subject touncertainty created by natural factors, resulting in price and output fluctuations.Protective and supportive policies have thus been adopted over the years to meetthis and other, sometimes conflicting, objectives of food sufficiency, stable prices,increased farm incomes and export competitiveness.
Food is a crucial concern of any government faced with a growing population.
Although it has always been a priority in the Philippines, food sufficiency is arecurring problem. While the attention given to staple crops has been consistent,the generally erratic performance and low productivity of the whole sector havebeen attributed to government policies that have either been inadequate,
inappropriate, or both. The declining share of agriculture in national product issaid to be a reflection of the lopsided growth strategy pursued in the past.
Having realized the need to correct such biases, the government has undertakenpolicy reform in many important areas. In trade the direction is towardsliberalization and institutional reform: removal of export taxes, quantitative
restrictions and monopoly control, lower and less dispersed tariffs. This trend isreinforced by other developments such as our accession to the GATT andcommitments to the AFTA and APEC. But the proposed 5% uniform tariff, to be
implemented by 2003, seems to overshadow these other moves in terms somewould consider drastic (i.e., level and coverage), although it serves as the ultimateindication of the government's willingness to carry out the liberalization efforts tothe fullest.
Agriculture is highly sensitive to these moves, for the reasons of food security,poverty and inequity, which are precisely the issues that called for protective andsupportive policies in the first place. In this context, this paper thus seeks todetermine how agriculture would be affected by the above pronouncements, givenour commitments and concerns. The question "How will agriculture be affected bya uniform tariff regime?" however, presupposes [a] that tariffs are a major policyinstrument in agriculture, and [b] that agriculture will fall under a uniform tariffregime just like the rest of the economy.

Before the question may be addressed, this paper therefore first seeks to estat_lishthe extent of policy intervention in agriculture, to define exactly how much and inwhat areas intervention has taken place. Total intervention is the desired point of
analysis, considering the importance of budgetary support and nontariff protectionin agriculture. Then we examine the future policy directions in agriculture givenour commitments to the WTO, AFTA and the APEC.
The effects of a uniform tariff on agriculture will then be determined by focusingon three linked sectors: corn, livestock, and meat processing, the latter two beingundertaken in a separate paper. This choice is in view of the following: theimportance of corn as a feed ingredieht; the shortage of corn as a perennialproblem, despite past programs aimed at self-sufficiency;the restrictiveness of tradepolicy with respect'to corn; the constraints of infrastructure deficienciesthat areparticularly felt in corn production; the growing significanceof livestock as asource of value-added in agriculture; and the need to examine the implications onthe processed food sector. Corn producers will therefore serve as a casestudy of thecompetitiveness of agriculture under the present tariff structure and the uniform 5%tariff.
II. METHODOLOGY
A. Producer Subsidy Equivalent
Government intervention includes all actions such as taxes, tariffs, quotas, subsidies,
special concessions, rules and regulations, foreign exchange controls, price setting,marketing monopolies, and other forms which alter the incentive structure foreconomic agents. For agricultural commodities, support prices, price ceilings, levieson producers, and subsidies on inputs and credit are the common forms.
The Producer Subsidy Equivalent (PSE)concept is used to show how much policyintervention has taken place in agriculture. It isan indicator of the value of transfersfrom domestic consumers and taxpayers to producers resulting from a given set of
policies in a certain year (OECD 1987).Thus it is an aggregatemeasure of the totalmonetary value of the assistance to output and inputs associated with agriculturalpolicies, and captures the transfers from both government expenditures and pricedistortions.
Th policies are classified into the following categories:direct income support orfinancial outlays to producers; price intervention, measured by a price gap;andindirect budgetary transfers. The latter consist of input assistance (taxor subsidiesfor the use of variable or purchased inputs), marketing assistance(programs whichchange processing costs), and infrastructure support (programs with long_termeffectson farm structure, producer knowledge, and productivity) (USDA 1992).Total PSE is the sum of income transfers, direct payments and indirect budgetary

support, while percentage PSE is the proportion of this total to the value of outputto producers. Some policies are implemented as integrated packages of differentinstruments, making it difficult to categorize them properly.
Total TransfersPercentage PSE = Value to Producers
Q(P_-Ph) + D + IQP,t + D
where Q is production quantity, P_ is.producer price, Pbis world price converted todomestic currency, D is direct government payments, and I is indirect transfers.Value to producers is the commodity's market value plus any direct governmentpayments.
Viewed in another manner, the PSE is the payment that would have to be made to
compensate farmers for the loss of income resulting from the removal of a given setof domestic agricultural policy measures (GATT 1987). The first calculations ofPSEs was undertaken by the FAO in 1973. Since 1982 the OECD has beenapplying the measure to its members' main farm commodities, and its estimateswere accepted as the most authoritative source of information on agriculturalsupport and were therefore used in the Uruguay Round negotiations.
There has been general agreement to include only price subsidies in calculatinggovernment support to agriculture for the purpose of monitoring reductions insuch assistance under the GATT. However Anderson (1995) argues for thecontinued estimation of PSEs. First, since the nominated tariff equivalents ofprevious nontariff measures have been set by some countries at excessively highlevels relative to the actual, even if reduced over time, those tariffs may not result inlower PSEs, and the extent of reform is likely to be minor; government assistance
to agriculture is likely to be reduced by only about one-sixth during the 1990s andmost of that has occurred already. Second, the reductions which were requiredunder the UR exclude several support measures which may be important, and thesewill not be monitored by the WTO, making reinstrumentation into less overtforms possible. Third, transparency is more important the more covert the formsof intervention used.
B. Domestic Resource Costs
Intervention may alter output returns, intermediate input costs, as well as thereturns from using resources in an activity. To evaluate the performance ofproducers within the policy environment, the domestic resource cost (DRC) isused. It is the ratio between the cost of domestic resources (evaluated at accountingprices) and net foreign exchange earnings (value of traded output less that of tradedinputs). When compared with the social exchange rate (SER), which represents theopportunity cost of domestic resoucces used in all activities producing tradeable

goods, it enables one to determine allocative efficiencyand comparative advantageof an activity.
For a detailed discussion of the calculation of the DRC, the reader is referred to the
Technical Appendix in Vol. II of the study Tecson, Medalla, et al. (1995).
C. Net Present Value
The effects of the uniform tariff will be gaugedby assessingthe financial viability ofproducers under the old and the new (uniform)tariff regime, through the use of thenet present value (NPV) concept, which discounts net benefits to the present.
III. PAST ESTIMATES OF AGRICULTURAL INTERVENTION
The level of intervention in agriculture has already been documented by someanalysts in the past. M.S.J. de Leon (1983)estimated government expenditures inagriculture for the period 1955-80,adopting the methodology from earlier researchdone by Capule (undated) which disaggregatednational government expendituresinto the various policy instruments. He found that expenditures grew significantlyover the period, but declined starting in the mid-1970s.Expenditure policies haveaimed at increased productivity and more equitable income distribution, butgovernment priorities within agriculture changed.There was greater emphasis onirrigation investment, the shares of research and extension remained stable, that ofsocial development programs rose significantly, while environmental managementand conservation expenditures also increased. Budgetary outlays for pricing andmarketing programs declined (from a peak of 43%to 2.2%), although expendituresfrom other fund sources such as borrowings may havebeen substantial. Resea'rchand extension continued to have stable shares (between 20-30%)and that of socialdevelopment programs increased dramatically (from 2 -35%).
In an unpublished study, Seligman identified and quantified intervention into a PSEestimate (1987)covering the period 1977-86.Shefound that the budget increased by30% on the average for the period. The bulk of expenditures were in the form ofindirect subsidies (50%),agrarian reform, land and resource conservation andmanagement (24°/0,and support and extension (15%).Research and developmenthad a mere 2% share. As expected, rice received the most support, followed by logs,sugar, coconut, banana, and corn. Income transfers from protection were enjoyedmostly by sugar; corn and chicken followed but-by a large difference. Banana,-coconut, fisheries, mangoes, and pineapple were heavily penalized.
The PSE value in nominal terms was surprisingly negativefor the whole ofagriculture, indicating that the income transfer from budgetary support could notoffset the policy distortions on prices of specific agricultural activities. PSEs werehigh for sugar, corn, and chicken, and this was due to the large income transfers

from protection, again showing that the different policies affectingpricingdominated the PSE estimates.
Her PSE for importables totaled P47.9 billion for the period 1977-86,while that ofexportables was @125.8 billion (@77.9billion total). Income transfers were P39.4billion and -P119.6 billion respectively (P80.2 billion total), while budgetarytransfers were P6.9 billion and P13.1 billion (P20.1billion total). Average PSE forthe whole period was 10.3%of border prices, which is minimal compared to the50%average tariff. By commodity, cotton, sugar, chicken, and corn received thehighest subsidy, while shrimps and prawns, coconut, banana, abaca, and tobacco
were penalized.
Habito and Manasan (1992) reviewed the pattern of national governmentexpenditures on agriculture, forestry, fishing and hunting for the period 1975-89.As a proportion of GNP, direct government outlays on agriculture (which summedup to P15.5 billion in 1972prices)experienced alternating highs and lows duringthe period, sometimes owing to reversals in priorities, other times the natural resultof changes in the overall macroeconomic environment. Irrigation expendituresfollowed the same pattern, while that on agrarian reform exhibited a very strongdownward trend up to 1985,and a large increase during the Aquino administration.Expenditure on farm prices and incomes has been dominated by nationalgovernment transfers to the NFA, and showed the same erratic tendency except fora real positive growth during the crisis years.
A bias index for government expenditure was also computed by the same authors,defined as the ratio of the sector's share to total government expenditure andsector's share to total GDP. For the period the bias index consistently remainedbelow unity and never exceeded 0.5, indicating a bias against the sector. It alsomoved with the overall fiscal expansion and contraction.
The same study estimated the longrun impact of government expenditure onagriculture to be small but significant. The shortrun impact was not alwaysstatistically significant.
In the same year, a study on foodcrop policies was published by the ADB and thePhilippine government, dealing with sector-specificincentive policies whichinfluence profitability of farming, government expenditures which promoteproductivity, the effects of macroeconomic and intersectoral policy environment,and the appropriate institutional arrangements ft_rthe implementation ofgovernment interventions.
The section on public expenditure made use of the Habito and Manasan findingsdescribed above as well as those of David (1991).In the 1960sthe Philippines hadamong the highest levels of rural development in Asia[At the end of the 1970sthiscommitment of resources to agriculture declined sharply, particularly in irrigation

and price and income support. At the start of the 1980sthis was revived butsubsequently reduced in the middle and then restored inthe later half of the decade.
In relation to the allocation of budgetary resources, the report noted that spendingon rural programs such as rural infrastructure and education, is as important asagricultural development expenditures. Furthermore, researchand irrigation shouldhave increased allocations.
David (1996) also estimated public expenditures for 1987-94,and obtained atotal ofP67.67 billion over the 8-yearperiod. Price intervention, rural credit, fertilizer andseed subsidies should have had favorable impacts in the short-term. However, shefound that the policy and institutional reforms and the recovery of publicexpenditures have had a limited impact for the following reasons:trade policyreforms in agriculture have been slow and the incentive problem was exacerbatedby the failure to effect a real depreciation of the exchange rate to complement tradeliberalization since the late 1980s;increased public expenditure for the sector wasallocated mostly for redistributive and market regulation purposes, rather thanproductivity-enhancing investments; uncertainties generated by slowimplementation of land distribution under CARP discouragedinvestment, and theprohibition of private land transfers and tenancy under the program eroded thecollateral value of land and distorted land and labor market arrangements.
Contractionary policies of the early 1980saffected agricukure to the extent thatpublic expenditures shares in GVA in the mid-1980s equaled 1955levels.Publicsupport to agriculture was thus low compared to the rest of Asia (David 1992), withthe Philippine ratio of agriculture expenditures to GDP the lowest among .A_SEANin 1988. Even the ratio of agricultural research expenditures to GVA in agricultureis now the lowest among major Asian countries at present, unlike in the 1960_aridearly 1970swhen is was above the developing country average.Increases in publicexpenditures in the late 1980swent to agrarian reform, environmental protection,price and other support services rather than long-term productivity-enhancinginvestments.
More unfortunate is the realization that "misguided and inadequate governmentpolicies and programs have contributed to the erosion of the country's competitiveadvantage in agriculture" (David 1995).Policy and institutional reforms and therecovery of public expenditures in the late 1980shad a limited impact. The GATT-UR could accelerate reforms and strengthen support services,but the high bindingtariffs, the current method of administering theYia'inimun-/accessrequirement-s,and-the short term perspective in safety-net design may reduce the potential positiveimpact of GATT.
i
A greater number of studies have measured and analyzed the extent of protection inthe whole economy using either the legal rates or the price-comparison approach.Medalla and Power (1979)found little evidence that the import control system wasstrongly dominating the tariff and tax systcm in 1974and therefore estin.a_ed

implicit tariffs using statutory rates instead. Protection levels between 1969 and1974 increased for about half of the tradable food sectors in the input-output table,and decreased for the other half. However, about a fourth of the sectors received
negative protection in 1974. Effective protection rates (EPRs) based on tariffs andtaxes indicated persistence of the bias in favor of manufacturing over other sectors,as well as a penalty on exports.
David (1983) confirmed that price intervention policies have been significantlybiased against agriculture, due to the policy objective of promoting industrializationvia tariff protection before the 1970s, and increasing regulations during the 1970s.Public expenditure policies have tended to promote agriculture through extension,research, and irrigation primarily, bu_ the policy structure was mainly influencedby the general objective of promoting industrialization.
Her estimates of nominal protection rates from 1960 to 1980 show an average foragriculture that was much lower than the Medalla and Power estimates formanufacturing, excluding the major processed agricultural products. This sheexplained by citing the large share of exportable and nontraded agriculturalcommodities. For example, other crops and fishery, whose high tariffs are not fullyrealized, are in fact exported and penalized by a 4% export tax. Furthermore,export commodities received less protection than import competing commodities.Protection also declined over time and even became negative for export products inthe 1970s. Quantitative restrictions, direct government involvement in marketing,export taxes and quotas, special levies, and price controls were the most importantforms of price intervention then.
David's methodology consisted of comparing actual domestic prices of agricuituraloutputs and inputs with the FOB unit value (for exportables) or CIF unit importvalue (for importables) converted at the official exchange rate. Prices were definedat a "comparable point in the marketing chain to insure that the observed
divergence" was due to the interventions and were not real marketing costs.
Her EPR estimates showed an incentive structure that was significantly biasedagainst agriculture, again consistent with earlier conclusions of Power (1971) andBautista and Power (1979). Price intervention policies undervalued agriculturalproduction in the 1970s through low product and high input prices. However,unlike in manufacturing, the cost of protection was shouldered directly by farmersbecause of low farm prices. The DRC estimates moreover showed that the majoragricultural activities demonstrated comparative-Sdvantage, which would hav_ beenmore effective in the absence of the policy biases.
The World Bank (1983) assessed the impact of government market interventions on
the performance of the agricultural sector for a 15-year period, by updating David'sestimates of NPRs for selected commodities to 1982. For border prices, the trendvalue was used. The most apparent feature was the general decline in protection,with many becoming ncgative by 1975. One _actor was the long-ternl impact of

attempts to increase the stability of agricultural prices, through national marketingagencies, price control and defensive buying and selling operations. These depressedproducer's incentives, especially in the major export crops (p.21).Levies reducedprice peaks but these were not compensated for during low price periods, orimplicit taxes for imported goods were minimized when prices were high but lowworld prices were not passed on to users. Incentives to investment in marketing andstorage facilities were lessened by the narrow margins between retail and controlledfarm prices.
Overall a bias in the incentives structure against agriculture compared tomanufacturing was created by price intervention policies, as shown by the EPR.Value added in manufacturing was prbtected by 44% in contrast to agriculturewhich was implicitly taxed or negatively protected. Although not as high as inmanufacturing, agroprocessing received high protection (except for milling andcoconut product) through depressed prices of raw materials. Net EPR, which takesexchange rate distortions into account, was also generallynegative in agriculture,poultry being the only exception.
In Seligman's unpublished study (1987),she calculated implicit protection rates forselected commodities from 1978-86using domestic wholesale prices and SingaporeCIF unit import values. Her results show that for importables, price differentialswere positive although not much greater than the averagetariff. For exportables,the her estimates varied from double the tariff rate to negativeor positive but muchlower than the tariff. This implies penalties for the latter products, specificallybecause of the export tax.
In an official report to the Senate in 1989, the Department of Agriculture statedthat the trade policy reforms failed to correct the anti-agriculture bias of previouspolicies, with the agricultural sector still lessprotected compared to industry andprocessed agriculture having the least incentives.
A World Bank project directed by Krueger, Schiffand Valdes (1990)compared thepolitical economy of agricultural pricing policies in 18countries. Each countryfollowed a common methodology for quantifying the direct and total effects ofgovernment interventions on agricultural prices, namely the deviation of actualdomestic prices from those that would have prevailed under sectoral and generalfree trade. The non-intervention prices were obtained by looking at the relativeborder prices at the free trade equilibrium exchange rate, adiusted for marketingcosts. This exchange rate was estimated under assumptions of current account -balance and no restrictions on foreign trade. The effectson output, consumption,trade, intersectoral transfers, government budgets, and income distribution werealso analyzed.
The Philippine Casewas handled by Intal and Power (1990),who compared thedifferent phases of pricing interventions by the government in agriculture. During ..the American colonial period from 1910to 1934,this was minimal. From the

Commonwealth period until the 1960s, intervention focused on the food sector.Such intervention intensified and widened in scope during the 1970s.Among theprincipal findings is that the various types of direct and indirect interventionresulted in substantial reductions in sugar and coconut production, a very smallnegative effect on rice output, and a notable increase in corn output. Furthermore,direct intervention in producer prices of sugar and coconuts had net negative effectsthat were worsened by indirect intervention.
Nominal protection rates were thus computed for four major commodities: rice,corn, sugar and coconut from 1960-86.For rice, the average NPR from directinterventions showed much variation during the whole period: positive high ratesat the start of the 1970s, then negative up to 1981and positive again afterwards. Incontrast, corn production was protected throughout. Sugar on the whole receivednegative protection between 1972and 1981.Explicit and implicit taxation of copraincreased during the 1970sand early 1980s, reducing the ratio of producer towholesale prices.
The same study also found that government expenditures increased markedly inrelation to agricultural output, but as a share of total expenditures, did not showmuch change. This is attributed to the declining share of gross value added in cropsand livestock to GNP. Although the government spent more on agriculture than itearned in taxes, the implicit taxation of agriculture rendered the net expenditure onagriculture inadequate (i3. 112).
Balisacan,Clarete and Cortez (1992)updated to 1988price comparisons previouslycomputed as the ratio of domestic wholesale to Hong Kong unit import values.They reported that food items appear to have the lowest implicit protectioncompared to agriculture and non-agriculture, and the difference evenwidened inthe 1970s.However the trade policy bias seemsto have diminished through theyears (Clarete 1992).
By comparing domestic wholesale prices and border prices of selectedfoodproducts from 1986 to 1992,Sarris (1995)found that the nominal rates ofprotection are considerably higher than tariff rates for most of the period. (TheBalisacan, Clarete and Cortez estimates for 1986-88are in line with thisobservation). This indicates that quantitative controls rather than book ratesdetermine domestic prices. He also noted that the long history of high protectionto agriculture has not resulted in excess production, but instead an unsatisfactoryperformance opposite the signals given to it. Th-e-indirecttaxation through theovervalued exchange rate or support to non-agriculture have been singled out asexplanations.
The fact that tariffs that were bound for major importables under GATT are muchhigher than book rates supports this view, since the previous levelsof protectionwere higher than that conferred by tariffs. Sarris suggestsa reexamination ofr_lative protection levels between agriculture and non-agricukure. This is based on

the common perception that agriculture has been given much lower protectionthroughout, aside from the above observation, as well as the fact that most non-agricultural imports have already been liberalized.
IV. CURRENT POLICY ENVIRONMENT
Several studies have thus examined the numerous forms of policy interventiondirectly and indirectly affecting agriculture. Budgetaryexpenditures have been
consistently appropriated for assistance to producers in the form of marketing,credit, input subsidies, irrigation, disaster relief, research, technology dissemination,storage and other infrastructural requirements. These forms of interventioncontinue at present.
Price intervention policies have also been pursued as constantly, and these havecontributed to wide price differences. Tariffs have been shown to be less importantan instrument than quantitative import restrictions, export bans and taxes, statetrading and price control. From the start of the 1980s however, structuraladjustment programs were implemented which aimed to correct the distortionscreated by such policy instruments. The current liberalized environment is thus a
result of the removal of quantitative import restrictions, the lowering of the averagetariff and narrowing of its dispersion, the elimination of export taxes, as well as
price decontrol, tax policy, privatization and de-monopolization, and currencydevaluation. All these represent substantial changes from previous policy, althoughthe key reforms in agriculture were not implemented at the same time and theireffects are as a consequence yet to be recorded. ..
In the late 1980s most major importable products remained under QRs, prote'ctedby laws. The Magna Carta of Small Farmers (Republic Act 7607) reinforced this byrestricting imports of substitutes competing with the domestic product. It coveredmeat and meat products except beef, poultryand products, corn and its substitutes.
However in order to improve the competitiveness of local industries, a program "toreduce tariffs until these reach one uniform rate" was pursued through ExecutiveOrder 288 in December 1995 which modified tariffs on agricultural products. Atwo-tiered structure of 3% for raw materials and 10% for finished products was tobe fully implemented by the year 2003, after which the uniform rate of 5% advalorem was to take effect in 2004.
Furthermore in March 1996 Republic Act 8178 replaced QRs on agriculturalproducts with tariffs, with the exception of rice, which continues to be subject tosuch restrictions. It thus repealed all laws restricting imports, e.g. RA 1296 foronions, garlic, potatoes and cabbage, RA 2712 for coffee, PD1297 for ruminants,Section 23 of RA 7607 for corn and its substitutes, live poultry, poultry meat andproducts, live hogs, pork and pork products, and meat and meat products exceptbeef; Section 15 of RA7308 for seeds, Section 4 of RA4155 fo,: Virginia tobacco,

and PD1483 for cigar leaf tobacco. The maximum bound rates committed under theUruguay Round Final Act will be imposed on such products.
Executive Order 313 provided the interim tariffs for these sensitive agriculturalproducts, in lieu of import restrictions, sinceRA8178 could create initialadjustment difficulties for the producers. Minimum accessvolumes (MAVs)werealso set for those imported agricultural products that are allowed entry at a lowertariff. Under the EO some articles for which an MAV was determined have tworates of duty: an in-quota rate which applies to imports that are within the MAV,and an out-quota rate for those imports in excessof the MAV. The proceeds fromthe importation of products within the MAV were also earmarked for anAgricultural Competitiveness Enhancement Fund.
Other adjustment measures for agriculture have been prepared as "safetynets" toease the transition for those affected by the entry into force of the WTO. Amongthose already implemented are reduced tariffs on farm machinery, allowing rice aridcorn exports, anti-dumping and countervailing measures; the inclusion of incentivesfor key production areas in the Investment Priorities Plan, creation of a guaranteefund to help restore the collateral value of CARPable lands; exemption from the E-VAT of imported raw and processed meat and agri-processors, reduced tariffs onpackaging materials, increased budget for agricultural research and development,awarding cargo handling service contracts through periodic public bidding, efficientdelivery of extension services with the help of local governments.
Those that still need additional action are the following: the AgriculturalProductivity Enhancement Act; the SafeguardsMeasures Act; technical correctionsin the Philippine schedule for pork, poultry meat live poultry on the minimumaccessvolumes; amendments to the Agri-Agra Law to include provisions that'willenhance the farmers' credit-worthiness, improve their capacities to undertake viableprojects, extend institutional and market linkages,promote organization of farmersand reduce lending risks; a plant variety registration and protection bill; a decisionon what sanitary and phytosanitary (SPS)measures to implement, having alreadycompleted an inventory of Philippine SPS-relatedmeasures.
The government also adopted the Key Production Area approach for theagricultural sector in its Medium-Term Agricultural Development Plan for 1993-98.This approach focuses support on priority areaswhose "agro-climatic features andmarket conditions are favorable for producing, processing, and marketing specificproducts" (MTADP 1993),and encourages farmers and fishers to produce -crops/livestock/marine products only in areas that have the comparative advantage.Support is coursed through specific programs such as Project Self-Reliancewhichturns over the warehouses of the NFA to qualified farmer cooperatives andfederations. In addition, technology assistance,post-harvest and marketing facilities,and market matching are provided.

V. PSE ESTIMATES
The estimated level of policy intervention for the period 1990to 1995is given inTables la to 1£ The first component, income transfers, is based on the price gapsfor each important commodity, multiplied by their respective volumes ofproduction. [It is noted that the most representative world price of the commodityin its tradable form were chosen.] Only the major crops, livestock and poultry wereincluded, being the main target recipients; however, PSE was computed for thesector as a whole. Direct income support is in the form of crop insurance claimspaid to rice and corn farmers, lessthe farmers' share in premium payments.
Indirect transfers were quantified on _he basesof the General Appropriations Acts,which give the annual national government budget by purpose of expenditure, aswell as the expenditures of local government units. [Actual expenditures could notbe calculated due to the unavailability of data, but it is known that the actual isabout 98 per cent of the budget allocation.] The calculations include only thoseexpenditures of agencies directly involved in agriculture; several other relatedexpenditures such as on agrarian reform and on the environment and naturalresources are excluded. Also excluded are the amounts which were sourced outside
the government budget, e.g., credit assistancefrom the earnings of certaincorporations or outside financing from government financial institutions, officialdevelopment assistance, or the private sector.
The results show a total PSE ranging from P9.8 billion in 1990to P22.5billion in1995.As a percentage of gross value added (GVA) in agriculture, the PSE was 5.3,3.9, 5.8, 5.7, 6.2, and 6.6 percent annually from 1990to 1995.The percentage PSEhas correspondingly risen from 13.17in 1991to 27.47 in 1995.Thus the share hasgrown steadily from 1991, although the 1995increase was due largely to GATT-related adjustment measures. Yet this could be a low estimate considering thoseitems that have been excluded.
Total income transfers have ranged from P150 million to P323 million, and have
been about 1.2 to 1.5 per cent of total transfers except for 1991when it was 2.1 percent. This was substantially higher than the average annual proportion of 1.5percent.
Farmers who suffered crop losses due to calamities such as plant disease,pestinfestation, drought or typhoons claimed income support that dropped from 1.1percent of total PSE in 1990to, " - "share in premium payments froregistered in 1992 and 1994,i.e.
Indirect transfers consisted of e:assistance,the administration otextension, and other general items or expencmure wnlcn could not be aisaggregatedinto the above forms of support. Expenditures of local government units (LGUs) a_


(_):O
!;:o
i_


Ii


well as equities and subsidies to government corporations were also added to this.The total amounts of indirect transfers grew from P7.9 billion in 1991to P22.2billion in 1995;in 1990the figure was P9.6 billion.
Table 2 shows the breakdown of the indirect transfers. Infrastructure support hadthe highest shares throughout, due especially to irrigation projects. In fact this wasthe only other component that grew in 1995,aside from income support. The nextlargest expenditures were on the administration of price intervention measuresprincipally marketing boards and equity/subsidy to government corporations. This
was overtaken only in 1994 by input assistanceexpenditures, and mainly becauseofthe large equity/subsidy figure. Total indirect transfers grew substantially in 1995,despite the very small allotment for equity/subsidy to government corporations,and largely because of the increase in infrastructure support.
Excluding irrigation expenditures whose benefits do not accrue immediately,equities/subsidies to government corporations, as well as the catch_all"generaldevelopment support", the largest shares went to the administration of marketingsupport and research and extension. Furthermore it is heartening to note that thebudget for research and extension rose by almost 50percent, although this includesthe expenditures of state colleges and universities.
VI. CORN PRODUCERS
A. POLICY ENVIRONMENT
In establishing the effects on agriculture of a uniform tariff, we focus on cornbecause of its economic importance as a crop: one-third of farmers grow corn;while nearly one quarter of the population consume it as food; its real contributionto GVA in agriculture is 7 percent; and its strong linkage as a feed ingredient forlivestock and poultry, which in turn are high growth areas in agriculture. Thecountry has been self sufficient in white corn for food but not in yellow corn forfeed, and about 70% of total corn production is used as animal feed (DA 1994).
There has also been substantial government intervention in the sector. Policies upto 1991have consisted of trade measures, notably import licensing and a 20% tariff;grain stabilization reflected in the regulation of domestic market entry andoperations, and corn and livestock production programs. Direct marketintervention by the National Food Authority was meant to'stabilize supply anddemand for grains, given its mandate to buy palay and corn when the domesticprice was lower than a support price, in order to help the farmer recover hisproduction costs.
Prior to 1986 the NFA was the sole importer of corn, and afterwards anyone withan import permit was allowed to import; in 1994this licensing function was givento the DA. This direct intervention in the giains mark,:t "_:cur.erltly being phased

,TABLE 2 I [ I .............._.......... _- i.... I : _ _ ........ L_ .C_:-J. :B_T ALLOCATIONS BY PSE CATEGORIES (in million pesos) .... ;..............................................L............._ ......................................... F.... T [ I i-_-:- .... _ 19901 19911 1992! 1993: " -'i99_;..............1"9"95.................................._.................I...................._.................I................i ......................................
__iie-_-_-t-_ -I........i3-_,_0:......:_o.-00_T..........4-9:___'_-_-...._-°_0_:.........5o:_0_......_-_:0_6Equity/Subsidy to gov't corps. 66.970! i 244.5001 i 14.475
T...................- ....................!............... -.......................................................... _,............................ i
P-RICEINTERVENTION 1915.4211 1135.104 i 3235.229! 4025.-451!---4137_5-_,:4...... 5:-0-66.Quotas 4.3091 3.361' 3.229i 3.4301
Marketing boards 98-2.-_4:_ 135.687! 1700.000J. 2061.000'. 1462.263 2.500
Equity/Subsidy to gov't corps. 928.948', 996.056! 1532.000'= 1961.0211 2675.281 2,500, i 'i............] ,
INPUT ASSISTANCE ___ 521 500i ...... -8:3:4:;I-80_-----2-24-(_8-0_11---167-3:'1-23...... 5133.048 1679.299Fertilizer subsidies 14.265i 13.559] 1_6.309 [ 15.428 14.171 13.605
-- ' ' b-_.... -84-_-,'7ii 173.180 75.000Agricultural credit subsidies 14.5071 13.462: 14:(_7 ............ ;..................
Dispersal/breeding programs 78.694i 3_8_-.7_ 89.968.i 10.171 890.216 140.741Agricultural implements asst. I 41.500 ,--7.500Others 72 0341 131.385 i 1359.455_ 57.000 42.774: 1442.453
Equity/Subsidy to gov't corps. 342',000 637.000', 761.000 ti 1464.3131 4012.707
MARKETING ASSISTANCE 382.078'; 369.-,_57:-........9-1-3:iO6T-.... 5:/'-0:2-17_-......678:6"5"6":-"_-'-2"11"_82-5- Market development ....... _,................ _................. _............... _".......-'i'15:_,52............5"_'.96-4"
Storage subsidies 7.874i 13.750, 7.000 3.500; 37.205 18.()'0"0"Grading and inspection 12.207 i 10.2041 29.551. 49.497:----6"1'.8'83----"-2"1 .-5"1-6
Others 28.650 i 41 293i 597.555 225.456 , 72.163F 69.345Equity/Subsidy to gov't corps. 333.347 i 304.210i 279.000t 291.764i 385.953.' 49.000
IINFRASTRUCTURE SUPPORT 3600.2101 2763.068i 3137.432 3390 720! 4296.9091 13748.177Research and extension 496.628 583.314 602.194 648.302! 960.186_ 1413.413Irrigation projects 2307.133 1405.095 2461.864 2281.1751 2311.069i 3201.037Land improvements 3.788 2.555 I : 20.000
Others __744'880 499.708 25.374 370.4151 809.119. 9069.727Equity/Subsidy to gov't corps. 47.781 272.396__ 48._00_0 90.828_ 216.535_ 44.000
...........................................................................L......... _.........'G---EN-ERALDEV'T, SUPPORT 2685.494 2498.528 3471.019 3026.7331 2297.993. 4519.075
ITOTAL -"-9-307.-203 _ 76-55_337--1'3:29'i':5-8'8---t"2.7"3-8-.2_,-4116608.625' 20413.376
Total Equity/Subsidy 1719.046 2209.662 2864.5 3807.926 i 7304,951: 95.5Total excluding Equity/Subsidy 7588.157 5440.675 10427.088 8928.3181 9303,6741 . 20317.876
I : '....................................................................... _ ...................................
;OURCE: Computed from General Appropriations Acts for the ears indicated.

out however, hence it is not pursuing this as actively as in the previous decades,although even then budget limitations allowed it to procure only lessthan 3% oftotal corn production. With the MAV mechanism which was implemented startingin 1996,the NFA acted as cargo consolidator for small importers. The in-quotatariff is 35% from 1996 to 2000, and the out-quota rates go down from 100, 80, 80,65, and 65 annually for the period. Actual import volumes exceedthe MAV, whichwere 65080 metric tons in 1995and 134981metric tons in 1996.
At present the Grains Production Enhancement Program (GPEP) implementedfrom 1993-98 rationalizes production by focusing support on areaswhich have thecomparative advantage. Such areasare pinpointed to be Pangasinanin Region I,Cagayan, Isabela, and Quirino in II, Pampanga and Tarlac in III, BatangasandPalawan in IV, Albay and Camarines Sur in V, Zamboanga del Norte and del Sur inIX, Bukidnon in X, South Cotabato and Sarangani in XI, North Cotabato andSultan Kudarat in XII, and Lanao del Sur and Maguindanao in the ARMM.
Servicesare concentrated on increasing production and productivity (through seeds,fertilizer, HYVs, access to technology, and credit), reducing post-harvest losses(through less costly acquisition of equipment and facilities, and adequate transport),and maintaining equitable price levels.Marketing support is the most criticalcomponent, and the programs consist of the gradual takeover of selectedNFAwarehouses by qualified farmer cooperatives and federations; the small farmer'squedan which allows qualified farmers to store their produce in NFA warehouses
while waiting for better prices; allowing farmer organizations to sell their producein deficit areas using NFA warehouses and transport facilities for a fee;operating aCooperative trading center in Manila to provide them a ready market for theirproduce.
Corn production programs actually started as early as 1969,and had the majorobjectives of attaining corn productivity and self-sufficiency.Their limited success(Perez 1985)was due to the lack of adequate technology to combat pests, lack ofcredit, inadequate qualified technicians, low prices and the high cost of marketing.Even under the CPEP in 1990yields increased but the extent to which these can beachieved on a cost-effective basis was not known (Gonzales 1991).
The GPEP components are shown in Table 3 with their corresponding amounts.Irrigation support still takes up the largest proportion, followed by credit andmarketing support. The rest are insignificant by comparison. The componentsspecific to corn consist of [a] seed subsidy of on_lS-kilogi-am bag of hybrid cornseed for free for every hectare; [b] lower fertilizer prices through a deferred taxpayment and subsidy scheme for imported fertilizer; [c] research for better
production technology; [d] production, post-harvest and marketing loan availabilityat interest rates that are 25% lower than market rates; [e] easier acquisition of post-harvest facilities.

L'--

In 1995however the program suffered a setback caused by the decision to useCargill seeds for the seed subsidy. The supplied seeds instead resulted in stalk rot,resulting in large income losses for those farmers who availed of these free (Rimban1996),and causing them to perceive the government program as a failure. Thehybrid seeds required double the amounts of fertilizer and pesticides, but producedplants which could not survive Mindanao's wet and humid climate hence thesusceptibility to stalk rot. This was because hybrid seedsare "sensitive and site-specific, performing well in some and poorly in other locations," as admitted byCargill's local partner, the Ayala Agricultural Development Corporation (quotedin Rimban 1996).Promised yields were 5 tons per hectare but some farms onlyharvested 3.7 tons, and since they needed more of the costly fertilizer andpesticides, many farmers fell into debt'. This failure causedsome observers toconclude that production arrangements in which the producer is not given a clare likely to be unsuccessful.
However others deemed the program successfulin introducing the farmer to theuse of hybrid seeds. Nevertheless some point out many disadvantagesin hybridcorn production: the inability to replant, a tendency to be dependent on seedbreeders/suppliers most of whom are foreign companies whose rights willsubsequently be protected, an alteration of traditional farming practices, risk ofdisease, increased use of chemical inputs which could harm the soil, and further soildamage from more frequent planting. The high production costs result in highoutput prices which in turn make it an unprofitable activity in the faceof cheaperimports, causing them to shift to other crops.
B. PREVIOUS RESULTSJ
Numerous analysts have also studied the economics of corn production inparticular. Rodriquez (1982)showed the presence of comparative advantage, sincethe DRC he estimated DRC was below SER, although costs excluded marketing.
The corn marketing system in three regions were also assessedseparately under theAccelerated Agricultural Production Project of the Department of Agriculture andthe USAID (PCCI and DA, 1988, 1989,and 1992).The entire commodity systemfrom production to distribution and end-use wasstudied. In South Cotabato, theprimary research site, it was found that timely supply of yellow corn for feed was
insufficient during certain seasons;shipping serviceswere inadequate; import policywas inconsistent and uneven in implementationi-post-harVestfacilities and -
technologies were limited given the erratic weather and periodic harvest gluts; andfarm price of corn was low during peak harvest time.
The major findings were similar in North Mindanao. substantial shortages of whiteand yellow grain; insufficient, inefficient and damaged infrastructure and vehicles;insufficient post-harvest drying capacity during the rainy season; insufficient and
limited _:cess to timely/accurate marketing information; and inadequate working
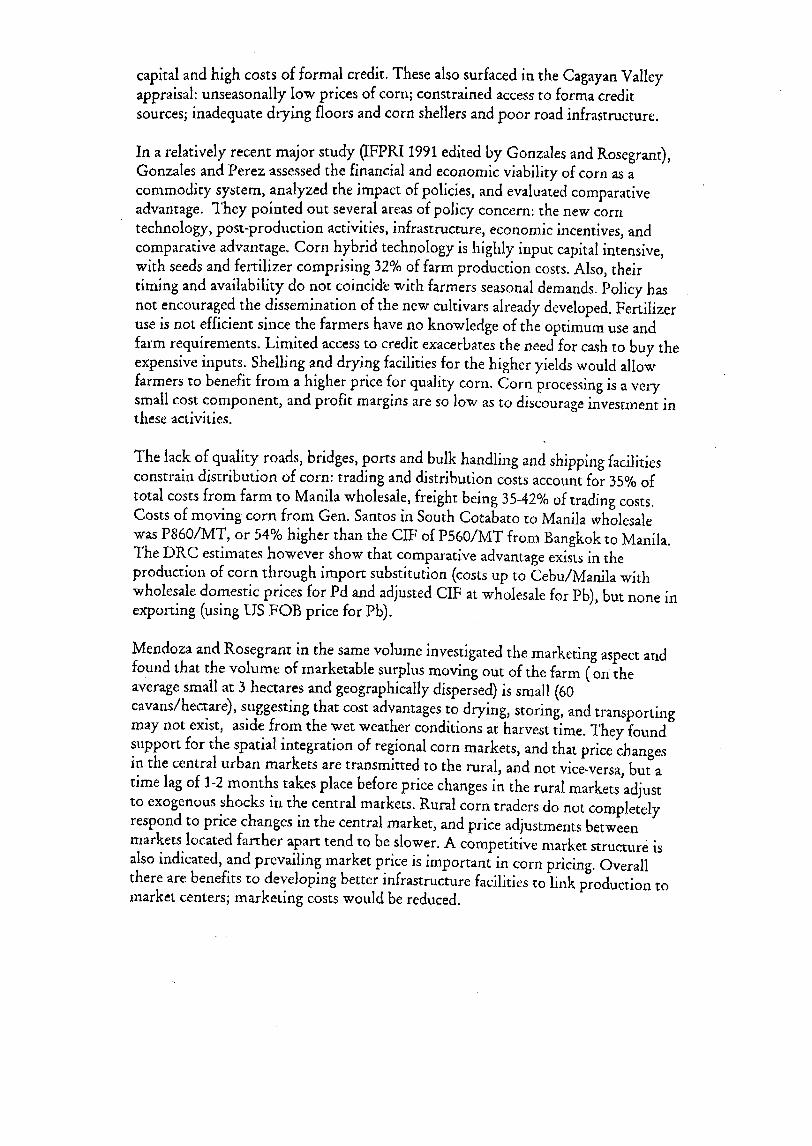
capital and high costs of formal credit. These also surfaced in the Cagayan Valleyappraisal: unseasonally low prices of corn; constrained access to forma creditsources; inadequate drying floors and corn shellers and poor road infrastructure.
In a relatively recent major study (IFPRI 1991 edited by Gonzales and Rosegrant),Gonzales and Perez assessed the financial and economic viability of corn as a
commodity system, analyzed the impact of policies, and evaluated comparativeadvantage. They pointed out several areas of policy concern: the new corntechnology, post-production activities, infrastructure, economic incentives, andcomparative advantage. Corn hybrid technology is highly input capital intensive,with seeds and fertilizer comprising 32% of farm production costs. Also, their
timing and availability do not coinci& with farmers seasonal demands. Policy hasnot encouraged the dissemination of the new cultivars already developed. Fertilizeruse is not efficient since the farmers have no knowledge of the optimum use and
farm requirements. Limited access to credit exacerbates the need for cash to buy theexpensive inputs. Shelling and drying facilities for the higher yields would allowfarmers to benefit from a higher price for quality corn. Corn processing is a very
small cost component, and profit margins are so low as to discourage investment inthese activities.
The lack of quality roads, bridges, ports and bulk handling and shipping facilitiesconstrain distribution of corn: trading and distribution costs account for 35% oftotal costs from farm to Manila wholesale, freight being 35-42% of trading costs.Costs of moving corn from Gen. Santos in South Cotabato to Manila wholesalewas P860/MT, or 54% higher than the CIF of P560/MT from Bangkok to Manila.The DRC estimates however show that comparative advantage exists in the
production of corn through import substitution (costs up to Cebu/Manila withwholesale domestic prices for Pd and adjusted CIF at wholesale for Pb), but none in
exporting (using US FOB price for Pb).
Mendoza and Rosegrantin the same volume investigated the marketing aspect andfound that the volume of marketable surplus moving out of the farm ( on theaverage small at 3 hectares and geographically dispersed) is small (60cavans/hectare), suggesting that cost advantages to drying, storing, and transportingmay not exist, aside from the wet weather conditions at harvest time. They foundsupport for the spatial integration of regional corn markets, and that price changesin the central urban markets are transmitted to the rural, and not vice-versa, but a
time lag of 1-2 months takes place before price changes in the rural markets adjustto exogenous shocks in the central markets. Rural corn traders do riot completelyrespond to price changes in the central market, and price adjustments betweenmarkets located farther apart tend to be slower. A competitive market structure isalso indicated, and prevailing market price is important in corn pricing. Overallthere are benefits to developing better infrastructure facilities to link production tomarket centers; marketing costs would be reduced.

Setboonsarng and Rosegrant next compared the Philippines with Thailand andfound that the high-cost situation here is caused by both higher production andmarketing costs. Land rent and inputs are costlier due to government policy andfactor endowments. However an adjustment of the exchange rate to equilibriumlevels would nearly eliminate these cost differences. The more important factor isthe marketing aspect, given the small size and dispersed nature of the corn market.Poor infrastructure, shipping regulations, price protection which reduce incentivesto efficiency all contribute to high costs.
Similarly, Gaspay's (1993)examination of the two countries revealed that the Thaifarmers have the physical efficiency advantage over their Filipino counterpartsbecause of their land abundance and better soil conditions, weaker domesticdemand, and superior transport infrastructure. Thailand has effectivelypromotedeconomic efficiency by allowing the price of corn to be determined by world priceswhile concentrating efforts on high-yielding seed development and distribution andthe appropriate rural infrastructure. This is better appreciated when we note thatcorn is more important for the Philippine economy than for the Thai, as itaccounts for a larger share of both production and harvested area, and that Filipinofarmers apply more fertilizer. Yet average yield in Thailand was 2.4 metric tons perhectare versus 1.3 metric tons here.
Thus while constraints in research and extension, seed distribution and farm
technology exist, evidence indicates that the serious structural problems are in post-harvest technology, transportation and marketing, due to underinvestment andrestrictive policies in these areas. Distortions in price and trade policy are the keyproblems (Rosegrant 1991).
Garrido (1993) echoed these findings when he reviewed the infrastructure 'capabilities and needs in major areas, concluding that infrastructure levels areinsufficient to support the requirements of the feed and livestock industry. Herecommended the upgrading of roads, deregulation of shipping rates, and theinstallation of bulk handling facilities in major ports. He estimated the level ofspending required for rural road improvement to be only 3% of the total nationalbudget.
C. DRC RESULTS
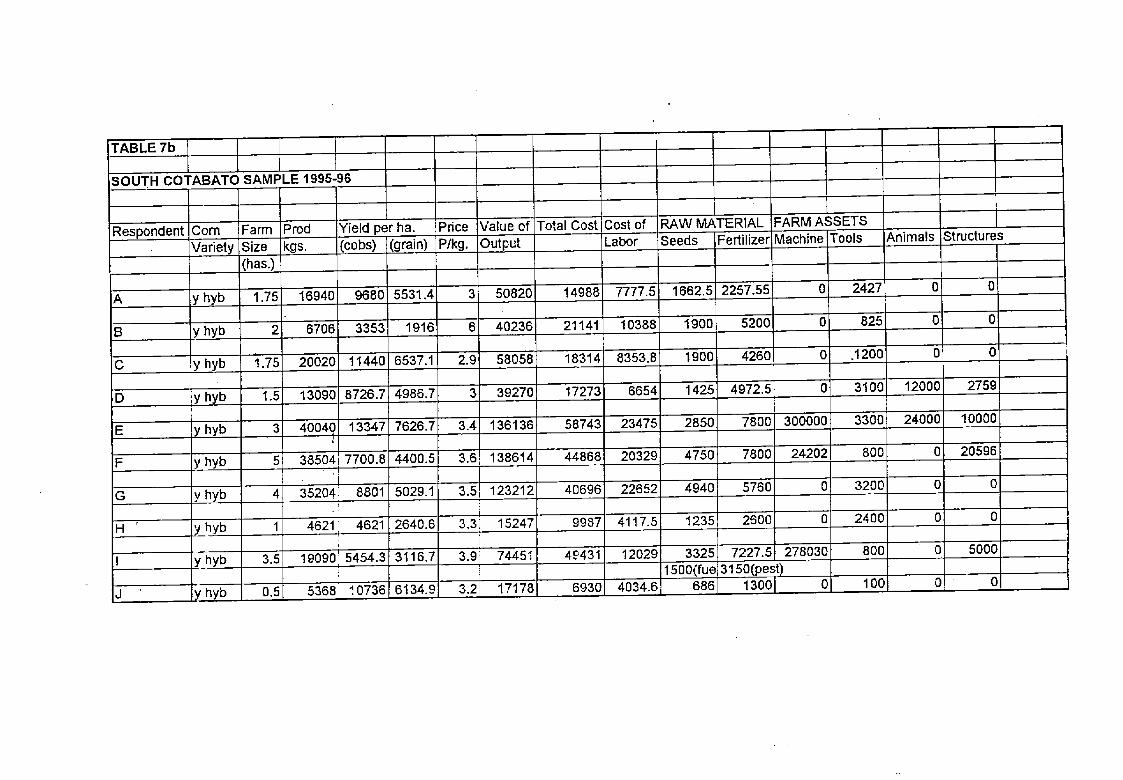
'Two sets of data are used to assessthe performance of corn producers in this study --the Bureau of Agricultural Statistics (BAS) 1991Cost and Returns Survey for Cornconsisting of 2500 respondents from all regions nationwide, and a 1995small surveyof 30 farmers conducted in the three major corn-producing areas (South Cotabato,Bukidnon and Isabela, in Southern Mindanao, Northern Mindanano, and CagayanValley, respectively). These three areas were identified to have comparativeadvantage under the Key Production Area approach of the.government, and are

major corn producers with an aggregate annual production of 988373 metric tons(Quitoriano 1996), representing about 41% of national production.
The BAS data yielded DRC/SERs which show comparative advantage in yellowcorn production (Table 4a). In general, average farm size is small, considering thatthe ideal is three to five hectares for a household. Production per hectare has notreached the potential 5 to 6 metric tons for the variety being planted nor the cornprogram target yields, but the national average of 2 metric tons is not too far fromthe Thai average of 2.55 in 1988. However, the dispersion from this average is wideand only seven regions are this productive. At least three of these regions - all inMindanao - also devote a larger farm area to corn, while two in Luzon are
efficiently using a smaller than averag_ area to yield higher-than-average volumes.
Prices varied between regions, and the national average was only p3.63 perkilogram. Noting that the average wholesale price per kilogram in the majortrading centers or markets was P5.04/kg, it immediately becomes obvious that themarketing margins may reach 40%, which is consistent with the Gonzales andPerez findings of 35% share of marketing in total costs. However, with an
estimated P0.83/kg. commercial marketing cost of corn in 1991 (NFA), the marginscould be only 20%.
DRCs evaluating value of output at book rates and excluding marketing costs areexpectedly lower than those which include costs up to the trader's warehouse.
Using PIP1, = 1.49 computed as the ratio between the domestic wholesale price forPs and US f.o.b, as border price, Pb, the DRC/SERs increase by 27 to 32
percentage points on the average. However, when evaluated using the farm pricefor Pd,the performance does not alter much because of the narrow price difference,and even improves for some areas whose farm price is lower than Pb- This onlyindicates that most of the inefficiencies stern from the marketing system which isthe major reason for high domestic wholesale prices.
Net present values or NPVs were calculated to find out how the farmers would fare
under the 5% uniform tariff. The result at the national level shows a worsening offof the already negative NPV. Only two regions exhibit a positive NPV under the
uniform tariff: Central Luzon and Eastern Visayas, despite the latter's low averageyield and the fact that it had a negative NPV previously. The common factor is therelatively high price which the farmers received for their output. At the currenttariff of 20%, at least five regions showed positive NPVs: Central Luzon aside fromSouthern Tagalog, North, South and Central M_indanao.
An examination of the cost of labor and raw materials across regions in Table 4bshows that Central Luzon farmers apply the most fertilizer and seeds per hectare,with Central Mindanao showing similar high levels. Both areas have the highestyield; the fertility of Mindanao soil enables farmers there to use less fertilizer thantheir Luzon counterparts although still above the national average. Northern andSouthern Mindanao farmers use seed_ less intensively and still show high yields.

II,
I
L
:..
:,_
r''1
..
...
j-
.,x
r"
cc
_r
I

TABLE,b," ,' .. .L ............... ' ............................... r ............
.Region t LABOR COST SEEDS ! FERTILIZER YIELD
' I 't Total T Mandays P/ha kg/ha P/ha , kg/ha - kg/ha
[ .. _! " I ..... :1"7._' -10-62,00"
Fhitippines! 268,_.....42.27_. ....._;6!....2_0_12___0_03189T- 50.84_ 342. 41 19i 1077,30. 3,56_ 2127.30
C;-a_a-n''"'_"_) ..................26431 42,90)_..........202.4()L__-..........16.5i!..................................1280.60; 4.27_,_...................1877.10CLuzon t 3564{ 45,601 709,32 20i 1737.00; 6.05i 2818,60
J-.............................. ;_............................. _...............
STagalog T 26841 39.95! 215.28! 15! 1086.50. 3.621 2181.90
Bi-c-_ { 1968! 42_.16-6_ 136.16j 161 621.00,__2.261 985.95WVisayas I __' 1297 32.461 121.44i 151 429.64i .1.431 790,88CVisayas { 1673 42.73[ 138,92i 13i 477.481 1.64! 835.77EVisayas l !388_I 36.92[ 85.56! 121 269,56,_1.12[ 74-5_6.46W-Mindanao i 19201 37.17[ 188.601 101 67.16,' 0.23[ 1081.70NMindanao ! 23381 35.87 139.841 10.64:1380.00 4.52 .......2--33_4_90SMindanao [ 29731 39,26 572.24 16i 1490.40 4,82 2602.90
CMindanao I 34641 44.67 755.32 20 i 1212.601 4.18 2811_-CAR I 1302i 35.53' 94.761-_7.5 _ 483.00! 1.67 862.18
I ' iI I i ,
SOURCE: BAS, 1991 Cost and Returns Survey for Corn. i i


II


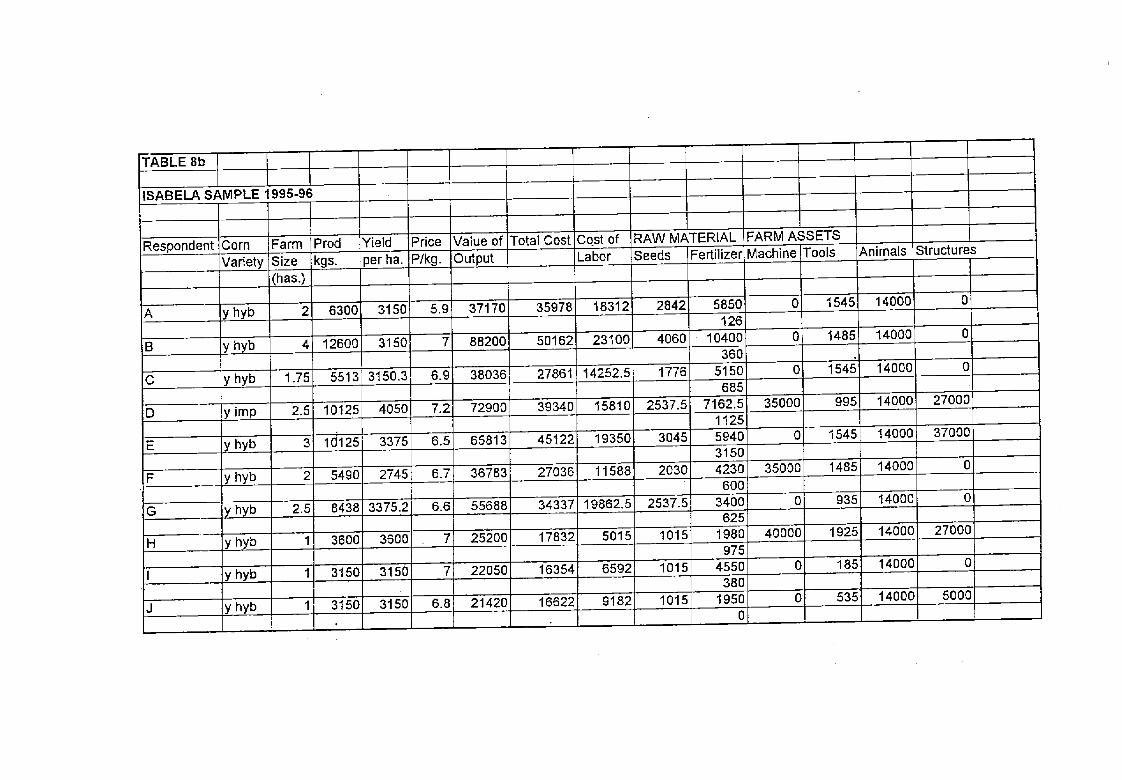

Half of the Bukidnon farmers instead turned in a worse performance under thethird scenario. Except for one or two, high yields per hectare correlated with betterresource use. The ownership of farm equipment also contributed to a betterperformance. All of the Isabela sample became uncompetitive when evaluated usingprice ratios whether or not transport was included. And this despite their above-national average yields, as well as heavy fertilizer use and ownership of one draftanimal each. NPVs &dine under the uniform tariff, and the drop is larger when
coming from a higher rate, i.e., 35% versus 20%. These results are generallyconsistent with the BAS-derived indicators, as well as the 1991IFPRI estimates ofDRC/EER for the same three areas shown in Table 9: corn farmers possessed a
comparative advantage whatever the ihput level or variety.
The sample distribution of farms based on size is roughly similar between the threeareas, although the selection of the informants was based on income. Yields perhectare hover around the 3 metric ton level in the Isabela sample, while those in theBukidnon area range widely from less than one to 4 metric tons. In the SouthCotabato sample the cobs conversion to grain result in much higher yields rangingfrom 2 to 6 metric tons.
Labor arrangements differ between areas, tenancy being dominant in Isabela andwage work and owner-cultivators more common in the other two areas. In SouthCotabato the pakyaw method is a common practice, given the higher croppingintensity, i.e., three-crops a year, which possibly contributes to the higher landvalues compared to the two other areas. There is also a more developed wagesystem, as a result of which man-days are shorter. Labor-intensive farm _:echnology,however still persists in all areas. The main labor costs are incurred in landpreparation, weeding, harvesting and shelling/hauling. There are a required numberof days to finish the tasks, since the crop suffers otherwise. Costs per hectare rangefrom P2700 to P6000 in the Mindanao survey areasand P3500to P6200 in Isabela,although these exclude family labor and post-harvest costs.
The majority of the sampled farmers were traditional white corn farmers andconsumers. They shifted to yellow corn production with the introduction of newvarieties under the government's MasaganangMaisan program in the 1970s,and thisaccelerated in the 1980swhen high-yielding varieties were promoted together withcredit and market support and the assurance by the NFA of price support. Thusfarmers started producing for cash rather than consumption (Quitoriano 1996),andalso shifted away from eating white corn as a stapie.
In order to be high-yielding however yellow corn depends on high-quality seedsand fertilizer, since productivity relies on climate and soil conditions rather than orirrigation. This results in high productiori costs because both inputs need to bepurchased instead of self-produced, and they are expensive.The intensity of inputuse depends on the finances of the farmer. Farmers who have the means use therequired amount of inputs needed to produce the highest possible yields. Such


means however are usually acquired not from farming but from other sources suchas a small business or family members working elsewhere.
Farmers who do not have cash to procure such inputs have to rely on credit usuallyfrom traders who are able to impose their prices at harvest time. In these cases, it isobvious that they are unable to choose the best price for their produce, and if thevalue is just enough to pay back their loan, then there is no marketable surpluswhich they could use as savings for the next crop. And so goes the cycle whicheffectively prevents them from making choices, and leads them to view prices asbehaving not in accordance with supply and demand but controlled by those whohave the scarce factor at their disposal.
Expensive farm credit is regarded by most respondents as the biggest constraintfacing most corn farmers: interest rates range from 10 to 15% per month on the costof seeds and fertilizer which is payable at the end of the cropping season. Farmershave had to rely on the informal lending sector for capital needs; the lack of
collateral (plus the inability to postpone their needs) disqualifies them from availingof formal sources of capital or choosing other traders.
Traders have thus filled the gap left by the government in the provision of capital,credit, or inputs to farmers who otherwise do not have the means or access to such
factors of production. Their activities are not limited to trading, but includefinancing, selling of supplies, rental operations of shelling, drying, transport, orstorage facilities. In some cases traders or moneylenders offer financing schemes tofarmers for them to shift to a particular crop which is more profitable. Betweentwo crops of similar profitability the farmer would choose that which is harvested
more frequently since this assures the household of more regular income(Quitoriano 1996). In the context of the market, traders are fulfilling the role ofinput-provider with the accompanying risks, whose returns are in the form of theability to "dictate" prices; with free entry however such returns are bound to be aresult of demand and supply.
Government efforts at assisting such farmers are apparently inadequate or non-
existent in the areas, except in South Cotabato where there is a two-year old croplending program through the Land Bank which allows up to P12000 per hectare at12% per annum interest. The impact of this on productivity is not yet evident since
the first loans are still being used to repay debts. Even the government's supportprice did not suffice since that marketing avenue was preempted by the conditionsof the credit arrangement between the farmer and the -trader which binds the. .
former to sell to the latter. Nevertheless the sampled farmers felt that the support-price mechanism and market intervention by the NFA served as a leverage againstprice manipulation by the trader, but now that these have been abolished, there is amore pronounced feeling of neglect.

VII. IMPLICATIONS OF COMMITMENTS TO THE WTO, AFTA, ANDAPEC
WTO .Gom_mitments_
Although the Philippines has unilaterally instituted trade reforms since the 1980s,being a signatory to the GATT starting in 1982 has reinforced the country's resolveto realize the link between freer trade and economic efficiency. The most
significant round of negotiations thus far has taken place in Uruguay, including; areas never taken up before, e.g. agriculture, services, textiles and clothing,
intellectual property rights and investment measures. Because the GATT governs.... the conduct of international trade among 118 countries which account for 90% of
total world trade, the inclusion of these areas was perceived to be a historic movethat would bring forth stable and transparent trading rules and reduce distortionscreated by domestic policy, in a systematic and comprehensive manner nototherwise possible.
In agriculture, the major areas of commitment under the Uruguay Round are" market access, the reduction of domestic subsidies, the reduction of export
subsidies, and the harmonization of sanitary and phytosanitary measures. Marketaccess consists of three main provisions: tariffication of all quantitative restrictions,the comprehensive binding of all tariffs on agricultural products, and the reductionof tariffs. Tariff equivalents of all nontariff barriers now replace the latter, whichare then added to existing tariffs.
Minimum access import volumes or tariff quotas for products that were protectedby Q Rs are to be set. That is agricultural imports should be allowed at specificvolumes upon which lower tariff rates are imposed, equivalent to the tariffs appliedbefore the implementation of the agreement. Volumes exceeding this "in-quota"amount are levied the higher rates which are the tariff-equivalent of the QRs. Aspecial safeguard provision allows an increase in tariffs of up to one-third theapplicable rate, when an import surge occurs as a result of the removal of the QRs.
Domestic subsidies should be quantified into an aggregate measure of support(AMS), to include those subsidies provided to agricultural producers either in theform of output or input price supports or income transfers that encourageproduction. It excludes specified domestic s_bsidies, as well as direct payments tofarmers, if the latter are made under productionqimiting programs and based.on afixed area/yield or cover less than 85% of base level production. This AMS is to bereduced by I3% over ten years starting in 1995. It is not product-specific, but coversboth national and sub-national subsidies. However, a de minimis provision exemptscountries whose specific AMS is below 10% of the total value of production of thecommodity.

Likewise, export subsidies are to be quantified and both coverage and totalbudgetary outlays reduced. Hence both the number of recipient agriculturalproducts and the total amount spent shall be decreased.
The agreement on sanitary and phytosanitary (SPS)measures allows trade controlswhich are necessary for the protection of human, animal, and plant life or health, ifthese are based on scientific principles and are applied on a nondiscriminatory basis.The use of international standards is encouraged but not required, and the use ofstricter national standards is allowed.
The Philippine government has complied with these provisions by issuing RA 8178in 1996,which tariffied existing quantitative restrictions on agricultural imports.The exception is rice, for which the country has invoked special treatment thatenables us to postpone our compliance with the agreement for ten years, althoughminimum accessvolumes equal to 1% of consumption and effective production-restraining measures have to be implemented.
The government has also already specified the bound tariffs in the schedule which itsubmitted to the GATT. An earlier schedule, EO 288, defined the tariffs ofagricukural products which had no Qlks; such rates are below their respectivebound levels. For those that were tariffied, EO 313set the tariffs at the maximumallowable bound levels. These schedules reach the year 2000.
The minimum accessvolumes (MAV) implementation rules and regulations havealready been determined since July 1996.In general the allocation criterion in theinitial year is market share while for the subsequent years new entrants are givenallocations from the incremental licenses authorized for the year. The followingschedule gives the minimum accessvolumes and in-quota tariffs.
Product Unit 1996 Initial 2003 2005 Final in_
in- quotaquota tarifftariff
Live bovine Head 12652 30 18980 9942 30Live swine Head 2570 30 2570 1285 30Live goat Head 51234 30 78494 40814 30Live poultry Head 563412 40 8879300 4651063 40
6
Beef flesh/chilled MT 4087 30 -'- 5305 2741 30Beef frozen MT 21131 30 130994 72046 30Pork fr/ch/ffz MT 33725 30 50595 26503 30Goat meat fr/ch/frz MT 695 30 1045 548 30Poultry meat, MT 15180 50 22040 11505 40fr/ch/frzPotatoes MT 965 50 1455 760 40Coffee MT 927 50 1391 745 40

Corn MT 134981 35 202475 106059 35Rice MT 61513 203096 113496
Sugar MT 39854 50 59783 31314 50"Source: GATT-UR, Schedule LXXV Part I Section I-B of the Philippines andAdministrative Order No.9, 1 July 1996, Department of Agriculture
The Philippines does not provide either domestic support and export subsidieswhich are both illegal under the WTO, hence no laws have been required todemonstrate compliance. In particular, the market price support for rice was 5.3%of production value. For corn, since the administered price was lower than theworld price, market price support was virtually non-existent although in absoluteterms it was 0.34% of production valu_ (GATT-UR Schedule of the Philippines,Part IV).
In the case of sanitary and phy-tosanitary measures, the country has already made aninventory vis&wis those required by the International Plant ProtectionConvention, the Codex Alimentarius Commission, and the International Office of
Epizootics. However there is a need to decide on what measures to implement, thatis whether to adopt those required by international bodies or make our own.GATT allows countries to have stricter-than_global standards, but there is also amove to harmonize standards.
In relation to the Trade-Related Aspects of Intellectual Property Rights which
provides that each country institute a protection system from intellectual propertyrights for plant varieties, none exist in the Philippines. At present, IPR protectionsystems cover non-agricultural products.
AFTA Commitments
The main instrument for making ASEAN a free trade area is the CommonEffective Preferential Tariff (CEPT) scheme, whose ultimate objective is to reducetariff rates among members to 5% or below. Its implementation was accelerated inJanuary 1996, in the following manner: [a] shortened time frame from 15 to 10years so that by the year 2003 all CEPT products have a 0-5% tariff; [b] includeunprocessed agricultural products; [c] phase out the Temporary Exclusion List by 1january 2000. These implied the phase-out of the PTA. [The harmonisation of tariffnomenclature, customs procedures, and valuation systems by the end of 1995 wasalso agreed upon.]
Hence for the items in the Normal Track with tariffsabove 20%, applied tariffsmust be 20% by 1998, and 0-5% by 2003, while items with tariffs at or below 20%
should have these reduced to 0-5% by 2000. For those in the Fast Track program,the applied tariffs must be 0-5% by 2000 and 1998, respectively. [The schedules aremerely indicative and do not preclude members from a faster/slower tariffreduction for each tariff line within the specified time frame.] Products from the

Temporary Exclusion List were to be incorporated into the Inclusion List in fiveequal annual instalments startirlg in January 1996.
Unprocessed agricultural products in the Immediate Inclusion List were to betransferred to either the Normal or Fast Tracks by January 1996.Non-tariffbarriers were also removed. Those from the TEL are to be transferred to theInclusion List by year 2003. Those in the SensitiveList (which includes corn) willbe treated differently, so that the time frame may be longer than 2003 and tariffs donot have to be reduced to 0_5%.However the tariff reduction commitment willhave to be deeper than the UR commitments. Thus the special mechanism shall bean improvement over the GATT offers so that tariffs on imports from ASEANwill be lower than those from outside'. There shall be only one mechanism: acommon ending tariff rate higher than 5%0by a target year; reciprocity rule; reviewof non-tariff barriers; review of quotas and state trading; 40% rule of origin;
safeguard through the CEPT emergency clause; and exclusion of rice.
For a product to be eligible for concessions under the AFTA-CEPT, threeconditions must be fulfilled: being in the Inclusion List of the exporting andimporting countries and having a tariff of 20% and below; having a program oftariff reduction; and being an ASEAN product with local content of 40%.
The effect of the accelerated CEPT is for the ASEAN average tariffs for CEPT
products (representing 89.03% of all tariff lines in ASEAN) to fall from 7.76%in1996to 2.95% by the year 2003. However since 7.11% or items which are in theTEL are to be phased in, the CEPT will cover nearly 98% of all tariff linesby 2000.The only excluded products will be those in the General Exception category andsensitive agricultural products (2.87%).
Non-tariff barriers are to be eliminated gradually within five years after theenjoyment of concessions. Such barriers have already been identified, focusing onthose that affect the most widely-traded products in the region. Their eliminationhowever varies depending on their nature. The objective is therefore to limit theirtrade-hampering effects or creating competition windows or market access.
The Philippine's Sensitive List of unprocessed agricultural products consists of liveswine, live poultry, fresh and processed meat of swine, poultry meat, potatoes,onions, garlic, manioc(cassava)starch, sweet potatoes, guavas, papayas, corn, grainsorghum, palm nuts and crude palm oil.
APEC Commitments
Open trade and investment in the APEC region by 2010/2020 also coincides withthe Philippines' own unilateral liberalization initiative. Tariffs, which alreadyaverage 15.57%at present, will be reduced further by the phasing down of MFNrates and towards uniform protection across sectors, so that a 5% tariff is the finaltarget by 2004. However sensitive agricultural products including rice are exempted ....

from this. Tariff quotas will also be gradually expanded according to WTOcommitments.
Most non-tariff import restrictions have already been tariffied. The remainderconsist of quantitative restrictions on rice, for food security reasons; importregulations maintained for reasons of health, safety, and national security, andresidual import licensing requirements under cover of the GATT Article onrestrictions for balance-of-payment reasons. The latter will be progressivelyeliminated. Transparency is also assured with the exchange of information.
Domestic laws on anti-dumping, agriculture and customs valuation have alreadybeen aligned with the WTO within the required timeframe.
The summary for 1996 and 2000 for agriculture is tabulated below. The figures forthe year 2000 exclude sensitive agricultural products under EO 313 and EO 328.
Average tariffs drop between the two years, demonstrating further the compliancewith commitments.
1996 2000
Bound tariff lines (%) 13.72 13.72Duty-free tariff lines (%) 0.00 0.00Ratio of tariff lines with quotas to all lines 19.41 0.00Simple average bound tariff rate 50.52 40.36Simple average applied tariff rate 27.43 9.91Average applied tariff rate for all lines subject 27.43 9.91to dutyImport-weighted average applied tariff rate 18.35 9.22Import-weighted average bound tariff rate 38.00 29.30Standard deviation of distribution of applied 24.40 7.20tariffs
Source: APEC, Manila Action Plan for APEC, Vol. II - Individual Action Plan(Philippines), Nov 1996.
Impact of These Commitments
The Agribusiness Systems Assistance Project (ASAP) and Department ofAgriculture (1994) has assessed the impact of the GATT-UR agreement on keyagricultural commodities, by identifying the winners and losers that result from the
implementation, although confined to the market access provisions only. Thecriterion used was the incremental impact of such provisions on production. About33 commodities were included in the assessment, sorted first according to trade-orientation, i.e. whether import-competing or export-oriented.
A formal economic model called the Country Projections and Policy AnalysisModel of Philippine Agriculture was used for the major products such as rice, corn,

pork, poultry meat, sugar, and coconut. The economic performance of theseproducts was projected with and without the implementation of the GATTcommitments. For the minor products, price analysiswas used to determinewhether imports would enter with the tariff quotas or not, or with the boundtariffs. For exportables, the assessment was based on the trading partners' tariffrates.
Those products put at risk by the Agreement are corn, sugar, garlic, onion, pork,and poultry. Favored products consist of coconut, seaweed,prawn, tuna, pineapple,mangoes, cashew, cut flowers, asparagus, papaya, banana, durian, and pili.Neutrally-affected are rice, cabbage, potato, coffee, beef, dairy, cotton, cassava,black pepper, pomelo, maguey, abaca,'salago, and tobacco. Most of the majorproducts are thus at risk, coconut being the only favored one (the impact on rice isneutral since it is not yet included).
The specific impact of the GATT-UR on corn wasfurther calculated by the ASAP(1996).The wide price gap was seen to persist if the QRs were to be simplytariffied. Domestic corn was forecast to be cheaper than out-quota imports but at adiminishing rate. If efficiency in domestic corn production and marketing does notimprove over time, then out-quota imports will become cheaper than domesticcorn towards the year 2004 as out-quota tariffs are reduced. The Philippines willnot progress from being a net importer to a net exporter if existing constraintsaggravating inefficiencies in the corn sector persist, e.g. inadequate infrastructureand services.
Furthermore, domestic corn utilization is projected to grow faster than domesticproduction as the supply restraint is lifted with tariffied QRs. The inflow of cornimports will cause the high domestic prices to fall and in turn, a reall0eation ofresources into higher-paying sectors. Without productivity improvements offsettingthe decline in corn harvests, total corn production will fall. However the built-inadjustment and competitiveness-enhancing measureswill enable domestic farmersto cope better.
David (1996) has evaluated the agreement and its implementation thus far,concluding that unless a drastic redirection of policies is made, the potentialbenefits, e.g., reduced distortions, increased transparency, increased governmentrevenue, decreased budgetary cost of administration, reduced rent seeking andbureaucratic corruption, will not he realized. The reasons she gives are [a] theexemption of rice, [b] the high binding tariffs, and [c] minimum accessvolumeswhich are much lower than import demand at the in-quota tariff.
Out-quota tariffs on corn are 100%which confer a higher effective rate ofprotection than before. In the past objections to a highly restrictive corn importpolicy were addressed by giving import allocations to a more organized and vocalsector of the feed/poultry/hog industry: prior to 1995import allocation-holders
....• paid only a20% book rate compared tothe 60-70°1onominal tariff, and after 1-995a

35% in-quota tariff compared to a 100%out-quota tariff. Moreover, the MAVimplementation procedures provide the larger feed-livestock-poultryproducers acost advantage over the small ones who have to rely on the domestic corn supply.
David further finds that the MAV implementing procedures tend to be counter tothe spirit of tariffication. They institutionalize rent-seeking since [a] import rightsare not bidded out but based first on historical market shares and then a more
complicated procedure of sharing between users; [b] the MAV will be increasedwhenever there is a perceived shortage; [c] NFA will be the import consolidator ofcorn although other allocation-holders are not obliged to use its services; [d]revenues from the MAV importation will be used for agricultural support for 9years, but project proponents should come from the private sector. Thusquantitative restrictions continue to be in effect;the role of government parastatalsis extended; rent-seeking is promoted; the budgetary process is fragmented; andpublic expenditure allocation is rendered inefficient.
David also emphasized (1996a) that the shift from QRs to tariffs should not lead togreater protection or distortions in price incentives. Public expenditure policiesshould be used to ease the burden of adjustment of the affectedsectors. Since thebinding tariffs were generally higher than the averageimplicit tariffs from 1990-94,adopting them as the applied tariffs was neither necessarynor desirable. The appliedtariffs should be lower, e.g. 60%,high enough to easethe transition but lower thanthe historical rate to indicate decisive efforts towards liberalization. This shouldthen decrease to 10% by 2005. In general a more uniform and lower level of tariffs
will be more efficient, more equitable and less susceptibleto rent-seeking.
Implications of the Commitments
Under the WTO we have reduced tariffs on non-sensitiveagricultural commodities,converted QRs to tariffs, bound these rates for the sensitive ones, and set minimum
accessvolumes. If we compare tariffs alone, the 5%uniform tariff is generallydeeper than the commitments to the WTO since the bound rates there range from5-50%.But since the more important agricultural commodities are subject to tariffquotas in which both the in-quota and out-quota rates are at much higher levelsthan the uniform tariff, although these are to be reduced gradually and someimports are guaranteed accesswith the MAVs, it seemsthat trade barriers for suchgoods have not been totally dismantled. However for corn the tariffs seem much
lower than the calculated difference between thedomestic wholesale price of. .P8.88/kg and landed cost of corn from the US at P3.25/kg: 173%versus 35% in-quota and 100% out-quota in 1996. Corn users thus enjoy a price advantage byimporting, and with progressive lowering of tariffs, they are more than willing toimport their requirements.
Within the AFTA, the average CEPT rates which are given as follows, will be" •lower than 5% after 2005,.although, the averagesin 2000are already.near.-the..

targeted rate. Since corn is in the Sensitive List however, it is treated differently sothat the time frame may be beyond 2003 and tariffs may not be reduced to the 0-5%
range.
Country 1996 1997 1998 1999 2000 2001 2002 2003Brunei 2.46 2,29 1.91 1.74 1,39 1.39 1.39 1.39Indonesia 11.63 10,61 8.84 7.91 5,81 5.70 5.00 4.25
Malaysia 5.93 5,14 4,42 3.67 2.90 2,83 2.83 2.83Philippine 9,17 8,33 7,16 6.53 5.42 4.90 4.89 3.73s
Singapore 0 0 0 0 0 0 0 0Thailand 14.10 12.69 10.15" 9.28 7.00 6.99 5.78 4.63ASEAN 7.76 7.00 5.79 5.19 3.97 3.88 3.47 2.95
Source: ASEAN Secretariat, AFTA Reader, Vol. III - New Time Frame:Acceleration of Tariff Reduction, September 1995.
Relative competitiveness within the ASEAN will depend on the importance of theregion as a source of raw materials and destination of our products. At present tradeis taking place but confined to a smaller number of products than would beexpected from countries which have the benefit of relative proximity, but this tradeis growing. With the low tariffs and absence of QRs within the CEPT, much largervolumes should be traded as a result. The extent to which producers will seriouslyconsider the ASEAN neighbors as a market or supplier will depend on the costs ofselling or buying from them relative to the rest of the world. For agriculturalcommodities whose tariffs are not reduced as much or as quickly, the likelihood ofincreased trade in these is even smaller. It is possible though that even with the .....
special treatment given to agriculture under AFTA and WTO, CEPT rates could belower than outside ASEAN so that it becomes advantageous to source-from withinthe region.
With respect to the APEC, since the procedure is concerted unilateralliberalization, then our own efforts at lowering tariffs, removing import quotas,and ensuring transparency would suffice as indicators of our commitment toliberalize. But since sensitive agricultural products again are exempted, althoughtariff quotas will be gradually expanded, the benefits of freer trade are also delayed.Governments are all similarly careful in lowering trade barriers in agriculturebecause of perceived high adjustment costs, even if these are short term.
VIII. CONCLUSION
We have established the presence of numerous forms of policy intervention whichrender a tariff change alone inconsequential if the uniform tariff is to be applied inagriculture. However we have also seen that in fact many agricultural commoditieswill continue to enjoy special treatment in the form of tariff quotas and a longertimeframe:, aside fiom the continuation of policy intervention as shown by our

commitments to the WTO and the AFTA. For instance the levels of government
spending on agriculture are likely to remain since these are allowed under theWTO; in fact the rise in the 1995 budget is due to several GATT-relatedexpenditures meant to assist those in transition.
The performance of corn producers was nevertheless examined under a 5%uniformtariff, and the results showed them to possess comparative advantage whenevaluated using tariffs alone, However when evaluated against import prices theyturned uncompetitive. This indicates that despite the large expenditures devoted tothe sector for several decades, such input, price, marketing, and infrastructure
support have not been effective in making producers ready to face imports.
The survey showed that indeed there are critical gaps in the government's assistanceprograms which have to be addressed, although they are in the right direction.Previous studies already confirmed that the lack of marketing infrastructureconstrains producers from realizing the comparative advantage they achieve at thefarm level. Yellow corn farming in the research areas is furthermore characterized
by credit dependency which preempts them from appropriating for themselves anysurpluses of production or benefits of better price offers. Sincefarmers respondrationally to price incentives, higher productivity would be achieved if credit wereless of a problem.
The different cost components would respond to a lowering of tariffs if there wereno other such constraints. However the arrangements that have evolved whichmake the farmer sell at a less favorable price or which just offsets his loan show thatthese other cor_straints are binding. For example hybrid' seedsare fertilizers are themajor cost items; at present these are subject to 3% tariffs, yet most farmers have toobtain these on credit at a high 10%monthly surcharge. Furthermore there are seedsubsidy programs which are supposed to make an impact on farmers' costs. Thesecost-reducing efforts would be effective if their availability did not require a muchscarcerresource,capital.
The large potential of corn as a feed ingredient is another linkage that should favorfarmers, given the high and growing unsatisfied demands for the commodity.However, according to feed industry sources, substitutability is high among thevarious feed ingredients, and feed millers simply pick the cheapest one and adjustthe mix to satisfy nutrient requirements. Hence there is still pressure to meet thislow-price requirement, aside from being locally available. Corn silage is gainingground as an alternative feed, with higher returns, but this is still concentrated inthe northern areas where there is a more developed livestock industry. Some largepoultry integrators have also responded to the problem of high corn costscausedbyexpensive transport by "going to the source", i.e., setting up farms where the cornis grown.
In consultations with corn farmers and users organized by the Department OfAgriCulture in 1993, the general sentiment was that the sector needed•protection

but there was disagreement about the method and whether it should be reduced.Constraints on production, post-harvest facilities, marketing and transportinfrastructure have created an unfavorable environment especially compared withother countries which even subsidize their producers. Such constraints should beaddressed adequately before protection is removed, although the latter should inturn be time-bound. Farmer's reactions to the uniform tariff were more focused onthe "when" rather than the level or uniformity, but they prefer one that will assure
them of profits and not merely break-even prices. Rational rates should be unifiedacross related tariff lines but differentiated across value-added lines.
Agriculture will undoubtedly be subject to the same liberalization pressures in thefuture. The fact that sensitive goods ale presently exempt should not cause
government to be complacent about providing or augmenting critical support. Thetariff quotas on corn for example are actually lower than the price difference,rendering imports cheaper than domestic corn even with 100% out-quota tariffs. Ithas been indicated that farmers still need support in critical areas such as credit and
marketing. Because these are already part of the support programs, it seemsintervention has not produced the desired results and is even considered lacking incertain areas.
Agriculture has historically been heavily protected, although the tariff structure wasfound to be biased against it relative to manufacturing. Yet it has performeddismally when compared to those in other cc,untries. The removal of quantitativerestrictions in 1996 and their replacement by tariffs were supposed to improve thesituation. But the differences between the domestic and landed cost of corn are
much higher than both in- and out-quota rates and if such differences persist, thenthey could only be attributed to high costs that trade policy changes alone cannotsolve.
The large expenditures devoted to the sector are meant to assist it to becomeproductive; import-competitiveness should follow suit. But the government is alsorightfully concerned with the other goals of food self-sufficiency and stable pricesand incomes. The current liberalization efforts are positive moves towardsaddressing all these objectives with the correct tools. It is however inevitable thatintervention will alter output returns, intermediate costs, as well as the returns
from using resources in a particular activity. In the case of our corn producers, suchintervention has still not achieved the desired impact.

The superior performance may also possibly be_due to the quality of seedswhichcould be better in high-yielding areas, if their prices are to be the indicators, as wellas the number of man-days devoted to the crop. Central Luzon farmers have thehighest total production cost because of their intensive input use, but since theyalso received among the highest prices for their produce their output valueSurpassed that of all other regions.
The same table shows that on the average42 man-days were spent on cornproduction from land preparation to bagging of the grain. It takes I14 days for thecrop to mature, and the first 30 days is the crucial period in which weeds are likelyto overtake the growth of the stalk. Hence the high labor requirements particularlyin weeding. There is pressure to comi31etetasks within the usual time, or the cropsuffers. The man-days devoted to the crop are shorter in Mindanao, where croppingis more intensive.
White corn, which used to be a staple in the Cagayan Valley, VisayasandMindanao, is grown in even smaller farms since it's cultivation is mainly forconsumption purposes. Yields are lower although this is as expectedfor traditionalvarieties, such lower productivity in turn resulting in smaller output and thenhigher prices. The reduced hectarage may be attributed to severalfactors amongwhich is the shift to other more profitable crops. DRC/SERs using book ratesshow comparative advantage (Table 5), but those using price ratios show theopposite, since they are above unity for all regions. NPVs are generallynegativealthough three regions show positive values with a uniform tariff.
Tables 6a and 6b, 7a and 7b, and 8a and 8b present the background informationabout each of the three survey areas and DRC/SERs results which were calculatedwith and without transport costs to the traders' warehouse. In South Cotabato cornis sold on the cob, while in Bukidnon and Isabelathey are sold as grain. Howeverthe farmers do not take on the burden of transporting their produce, since these arepicked up by traders who contracted to buy the output at the start of the plantingseason. Correspondingly, in including transport costs the output was assumed to bevalued at market prices of corn grain. In addition, three scenarios eachwere
computed: [i] at 20% tariffs, [ii] at 35%tariffs which is the in-quota rate for 1996,and [iii] using price ratios to approximate the influence of the various forms ofintervention on the domestic price.
The survey resuks are even more encouraging than the BAS-basedcalculations,with majority of respondents from all three ares_-exhibiting ratios lessthan unitywhen using tariffs to deflate output values. The results using book rateswere so lowin the South Cotabato sample that the use of Pd/Pb in evaluating value of outputmade only three respondents disadvantaged. A look at their averageyield shows ahigh productivity hence the positive performance. Furthermore there seemed to be
a threshold level of input use below which performance was likely to be adverselyaffected. Likewise, NPVs were positive and large for all but one who wasuncompetitive.

BIBLIOGRAPHY
Agribusiness Systems Assistance Program (1993), "Multisectoral Consultations on Cornand Livestock Trade and Pricing Policies", draft report submitted to the ASAPPolicy Team, June.
(1996), "The Impact of Trade Liberalization
and the Implementation of the GATT-UR on tile Corn, Pork, and PoultrySubsectors".
(1994), "UR Agricultural Trade Agreement:Implications for Philippine Agriculture "
Anderson, Kym (1995), "On Measuring the Extent of Agricultural Policy Intervention: A Review of the PSE and Related Indicators ", Policy Discussion Paper No. 95/5,Center for International Economic Studies, University of Adelaide, Australia,July.
ASEAN Secretariat (1993), AFTA Reader, Vol. I - Questions and Answers on file CEPTfor AFTA.
(1995), AFTA Reader, Vol.III - New TimeFrame: Acceleration of Tariff Reduction.
Asia-Pacific Economic Cooperation (1996), MAPA 1996: Manila Action PlanfoJ, APEC,Vol.II- Individual Action Plan (Philippines),. Fourth APEC Economic Leaders'Meeting, 24- 25 November.
Balisacan, A.M., R.L. Clarete, and A.M. Cortez (1992), " The Food Problem in thePhilippines: Situation, Issues and Policy Options ," IFPRI.
Bautista, R.M., J. Power and Associates (1979), Industrial Promotion Policies in thePhilippines, Philippine Institute for Development Studies.
Carl Bro International (1992), Study on Foodcrop_Policies in the Philippines, AsianDevelopment Bank of the Philippines, June.
Clarete, R.L.(1992), " Structural Adjustment and Agriculture: Developing a ResearchAnalytical Framework", WorkingPaper Series N0.92-21, Philippine Institute forDevelopment Studies, September.
David, C.C. (1996), "Agricultural Policy and the WTO Agreement:The Philippine Case",paper presented at the Conference on Food And Agricultural Policy Challenges forthe Asia-Pacific, Manila, 1-3 October.

2
(1995), "Economic Policies and Agricultural Incentives: the PhilippineCase", Discussion Paper Series No. 95-15, Philippine Institute for DevelopmentStudies, October.
_(1983), " Economic Policies and Philippine Agriculture, "Working Paper83-02, Philippine Institute for Development Studies.
(1992), "Philippine Agriculture: the Difficult Path to Recovery", PhilippineEconomic Journal, VoI.XXXI, pp.23-36.
De Leon, M.S.J. (1983), "Government Expenditures and Agricultural Policies in thePhilippines, 1955-1980", Working Paper No. 83-06, Philippine Institute forDevelopment Studies.
Depm"maentof Agriculture (1993), Medium-Term Agricultural Development Plan 1993-1998.
Dep artment of Agriculture (1989), Trade Liberalization and Philippine Agficultm-e", aReport of the Secretary of Agriculture to the Philippine Senate, January.
Garrido, J.R.(1993), " Philippine Rural Infrastructure and Options for Reducing Cornand Livestock Marketing and Dislxibution Costs", ASAP Policy Studies No. 93-20, Agribusiness System Assistance Program of the Philippine Department ofAgriculture and United States Agency for International Development, June.
Gaspay, M.S.(1993), "Comparing the Corn Economies of the Philippines and Thailand",Annex to Johnston,B.F., "Technological Potentials for Expanding Corn Productionin the Philippines: Lessons from Other LDCs", ASAP Publication No.2.01,Agribusiness System Assistance Program of the Plfilippine Department ofAgriculture and United States Agency for International Development, June.
GATT (1987),"Quantitative Measurement of Support: the PSE (Note by the Secretariat)",September.
GATT-UR (1995), Agriculture: Schedule of the Philippines, Part I Section I-A - MestFavored Nation Tariffs on Agricultural Products; Part I Section I-B - Tariff
Quotas; Part III- Non-Tariff Concessions; Part IV Section I - Domestic Suppu_c:Total AMS Co_mnitments.

Gonzales, L.A. and N.D. Perez (1991), "The Economics of Com Production in thePhilippines", in Rosegrant, M.W. and L.A.Gonzales, eds., The Philippine Corn/Livestock Sector:Performance and Policy Implications, International Food PolicyReseea'ch Institute, Wastfington D.C. and Department of Agriculture, Philippines,December.
Habito, C. and R. Manasan (1992), Agricultural Taxation in the Philippines, AgriculturalTaxation Studies No. 6, Food and Agriculture Organization, Rome.
Intal, P.S. Jr. and J.H. Power (1990), "Trade, Exchange Rate, and Agricultural PricingPolicies in the Philippines", World Bank, Washington D.C.
Krueger, A.M. Sctfiff, and A. Valdes (1990), The Political Economy of AgriculturalPricing Policies: Country Studies, Oxford University Press.
Malenab, V.L. et al. (1992), The Corn Marketing System: A RapidMarketing Appraisalin the Cagayan Valley, Accelerated Agricultural Production Project of the
Department of Agficultm'e and the United States Agency for InternationalDevelopment.
Manalaysay, R. et al. (1988), The Corn Marketing System: A RctpidMarketing Appraisalin the Southern Mindanao Region, AcceleratedAgricultural Production Project of
the Department of Agriculture and the United States Agency for InternationalDevelopment.
Medalla, E., G. Tecson, R.M. Bautista, J. Power and Associates (1995), Catching Up withAsia's Tigers, Philippine Institute for Development Studies.
Medalla, E. and J. Power (1979), " Estimating implicit Tariffs and Nominal Rates ofProtection", in Bautista, R.M., J. Power and Associates, Industrial PromotionPolicies in the Philippines, Philippine Institute for Development Studies.
Mendoza, M.S. and M.W. Rosegrant (1991), "Marketing of Corn in the Philippines:Market Integration and Dynamics of Price FiSnnafion", in Rosegrant, M.W. andL.A. Gonzales, eds., The Philippine Corn Sector: Performance andPolicy Implications, Agriculture, Philippines, December.
OECD (1987), National Policies and Agricultural Trade, OECD, Paris.
Quero, R. et a1.(1989), The Corn Marketing System: A Rapid Marketing Appraisal in the "Northern Mindanao Region, Accelerated Agricultural Production Project of theDepartment of Agriculture and the United States Agency for IntenaationalDevelopment.

Quitoriano, E. L.(1996), "Case Study of Yellow Corn Farming in the Philippines",MODE-PARD, August.
Rhnban, L. (1996), "High-Tech Seeds Ravage S. Cotabato Farmlands", Philippine DailyInquirer, December.
Rimban, L. (1996), "Hybrid Seeds from Thailand Caught in Middle of Corn Dilemma",Philippine Daily Inquirer, December.
Rimban L. (1996), " Multinational Finals Dictating RP Farming Processes", PhilippineDaily Inquirer, December.
Rodfiquez, A.S.A.(1982), "Comparative Advantage of Corn Production in thePlfilippines", University of the Philippine School of Economics, MA Thesis.
Sarris, A.H. (1995), "Philippine Agricultural Trade Policy After GATT Ratification:Issues and Options", FAO Project [Philippines: Assistance in Agricultural SectorPolicy], Food and Agriculture Organization, March.
Seligman, F.G. (1987), "Estimating the Producer Subsidy Equivalent", unpublished.
Setboonsamg, S. and M.W. Rosegrant (1991), '_Comparative Analysis of Production andMarketing of Corn hi the Philippines and Thailand", in Rosegrant, M.W. and L.A.
Gonzales, eds., The Philippine Corn Sector: Performance and PolicyImplications, International Food Policy Research Institute, Washington D.C. andDepartment of Agriculture, Philippines, December.
Webb, A.M. Lopez and R.Peun (1990), Estimates of Producer and Consumer SubsidyEquivalents: Government Intervention in Agriculture, 1982-1987, ERS Statistical
Bulletin No. 803, US Depa/lment of Agriculture, Washington D.C., April.
World Bank (1984), "Agriculture: Issues in Pricing Policy", Philippine Country SectorReport No. 4845-PH, Projects Department, Agricultur e Division II,East Asia andPacific Regional Office, July.