Embed Size (px)
Citation preview

UNF Digital Commons
UNF Graduate Theses and Dissertations Student Scholarship
1991
The Effects of Teacher Expectations of At-RiskStudents on Teacher Instructional BehaviorsMartha Kahler CastroUniversity of North Florida
This Master's Thesis is brought to you for free and open access by theStudent Scholarship at UNF Digital Commons. It has been accepted forinclusion in UNF Graduate Theses and Dissertations by an authorizedadministrator of UNF Digital Commons. For more information, pleasecontact Digital Projects.© 1991 All Rights Reserved
Suggested CitationCastro, Martha Kahler, "The Effects of Teacher Expectations of At-Risk Students on Teacher Instructional Behaviors" (1991). UNFGraduate Theses and Dissertations. 190.https://digitalcommons.unf.edu/etd/190

The Effects of Teacher Expectationsof At-Risk Students on
Teacher Instructional Behaviors
by
Martha Kahler Castro
A thesis submitted to the Division of Curriculumand Instruction in partial fulfillment of the requirements
for the degree of Master of Education in Elementary Education
University of North Florida
College of Education and Human Services
July, 1991

The thesis of Martha Kahler Castro is approved:
Committee Chairperson
Date
Accepted for the Division:
Signature deleted
Signature deleted
Signature deleted
Signature deleted

Table of Contents
List of Tables v
Abstract. v i
Chapter I. Introduction 1
Problem Delimitation 2
Definition of Terms 3
Chapter II. Review of the Literature 5
Factors Associated with Teacher Expectations 9
Teacher Expectations and Student Achievement. 1 4
Summary 1 9
Chapter III. Description of Procedures 21
Sample 21
Instrumentation 22
Data Analysis Procedures 24
Chapter IV. Results of Procedures 3 9
Chapter V. Conclusions and Recommendations .4 2
Conclusions 42
Recommendations for Further Study 4 5
iii

Appendix 5 0
References................................................................................................ 5 2
Vita 58
iv

List of Tables
Table 1. Behavior Frequency for Grades K and 1 25-26
Table 2. Behavior Frequency for Grades 4 and 5 27-28
Table 3. Behavior Frequency for Grades K, 1, 4, and
5 29 -30
Table 4. Percentages of Teacher Behaviors for
Grades K and 1 3 2 -3 3
Table 5. Percentages of Teacher Behaviors for
Grades 4 and 5 34 -35
Table 6. Percentages of Teacher Behaviors for
Grades K, 1, 4, and 5 36 -37
v

Abstract
This study investigated the degree to which teacher
expectations of at-risk students affect the teacher's
instructional behaviors. Four elementary teachers were
observed and videotaped for 20 minutes each during a language
arts lesson. The videotapes were analyzed using an instrument
consisting of ten behaviors from the Florida Performance
Measurement System that reflect Rosenthal's four factors of
teacher expectations, climate, input, output, and feedback. The
teacher's instructional behaviors were recorded each time the
behavior occurred during the 20 minute observation. The data
were analyzed to determine if a relationship exists between
the teacher's expectations for average or above average
students and at-risk students and the teacher's instructional
behaviors. The findings are displayed in two forms: raw score
numbers and percentages of the behavior occurrences. The
results of the study appear to indicate that teacher's
expectations of different ability level students affect the
vi

teacher's instructional behaviors.
vi i

Teacher Expectations
Chapter 1
Introduction
Studies have confirmed that the different expectations
teachers have of students, depending on their ability levels,
may affect student performance. This study investigated how
different expectations are manifested in teachers' classroom
behaviors. Although the study did not investigate specifically
how teacher expectations affect students' achievement, the
review of the literature does address that issue. Specifically
this study answered the question, (what are the effects of
teacher expectations on the teacher's instructional behaViOrS?)
Teacher {expectations influence student and teacher behavior,
and it is important to be aware of the interrelationships
between expectation and behavior.
Research confirms that student achievement is affected
by teacher expectations and behaviors which, in turn, are
affected by the teacher's perceptions of students' abilities and
achievement (Rosenthal & Jacobson, 1968). High teacher
1

Teacher Expectations
expectations result in a higher student performance while low
teacher expectations produce lowered student performance.
While researchers agree on the correlation of these variables,
they are in disagreement as to the degree to which student
performance is affected by teacher expectations.
The differing expectations teachers have of students are
manifested in teacher classroom behaviors (Cooper, 1979).
Students are aware of the differences in teachers' behavior
towards high and low achievers (Brattesani, Weinstern, &
Marshall, 1984). Since Slavin and Madden (1989) indicate that
one characteristic of at-risk students can be low achievement,
then teachers need to be aware of potential problems that may
occur as a result of their instructional behaviors.
Problem Delimitation
After reviewing the literature, this researcher
conducted teacher observations to determine whether there is
a relationship between teachers' expectations of average or
above average students and at-risk students and teachers'
2
Teacher Expectations
instructional behaviors. While the results of the study will
not have widespread implications because of the limited
number of participants, they will help educators become more
aware of the effects of teacher expectations on classroom
behavior and their relationship to student achievement.
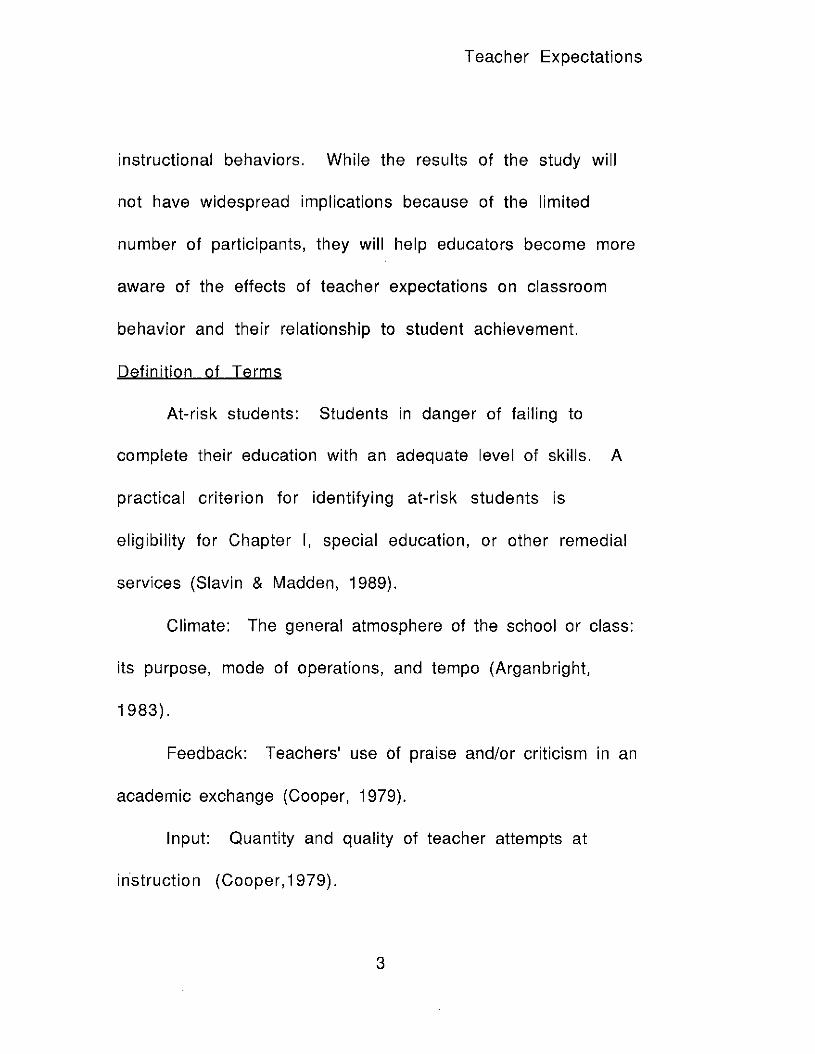
Definition of Terms
At-risk students: Students in danger of failing to
complete their education with an adequate level of skills. A
practical criterion for identifying at-risk students is
eligibility for Chapter I, special education, or other remedial
services (Slavin & Madden, 1989).
Climate: The general atmosphere of the school or class:
its purpose, mode of operations, and tempo (Arganbright,
1983) .
Feedback: Teachers' use of praise and/or criticism in an
academic exchange (Cooper, 1979).
Input: Quantity and quality of teacher attempts at
instruction (Cooper,1979).
3
Teacher Expectations
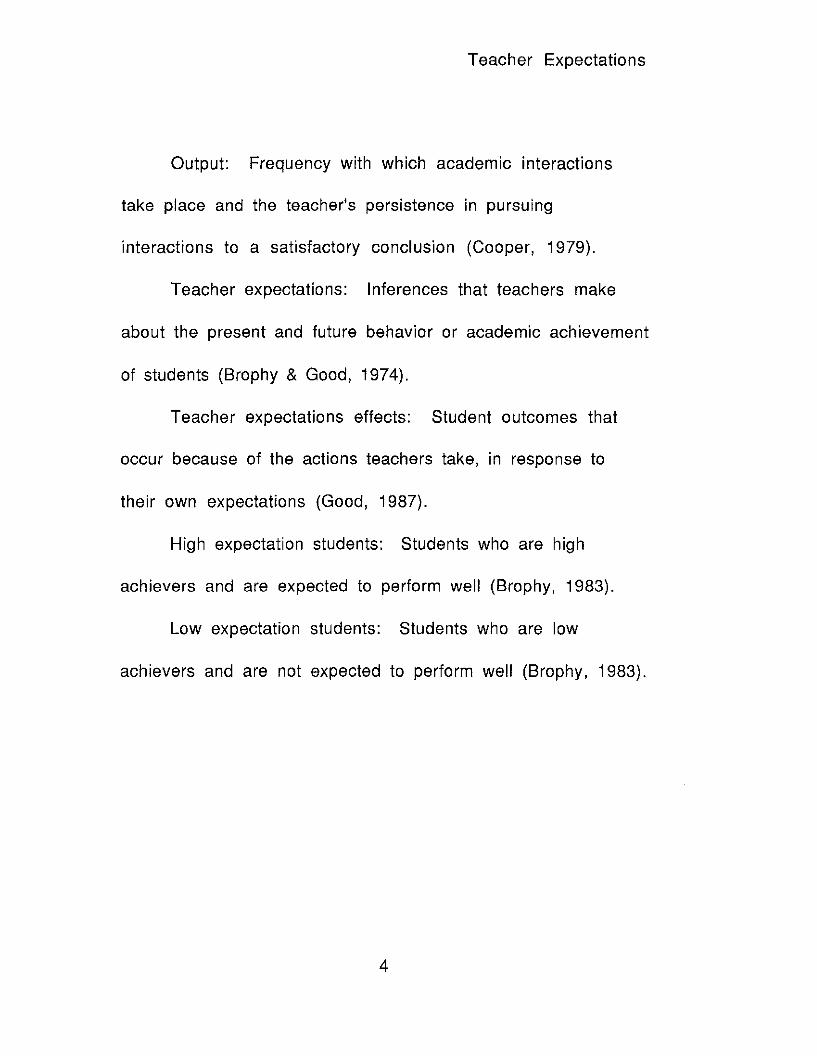
Output: Frequency with which academic interactions
take place and the teacher's persistence in pursuing
interactions to a satisfactory conclusion (Cooper, 1979).
Teacher expectations: Inferences that teachers make
about the present and future behavior or academic achievement
of students (Brophy & Good, 1974).
Teacher expectations effects: Student outcomes that
occur because of the actions teachers take, in response to
their own expectations (Good, 1987).
High expectation students: Students who are high
achievers and are expected to perform well (Brophy, 1983).
Low expectation students: Students who are low
achievers and are not expected to perform well (Brophy, 1983).
4

Teacher Expectations
Chapter 11
Review of the Literature
The first major study to address teacher expectations
and how they influence student achievement was Pygmalion in
the Classroom, conducted in 1968 by Rosenthal and Jacobson.
Teachers were told several of their students had been
identified as having potential for large achievement gains
during the school year. Actually, the students' names were
chosen at random. The purpose was to see whether teachers
had higher expectations for the identified students. Eight
months later the same students had greater gains on an IQ test
than did the nonidentified students. Rosenthal and Jacobson
concluded that the students had been treated differently
because of what teachers had been told.
Although subsequent research confirms that teacher
expectations do influence student achievement, several
questions have been raised concerning the validity of
Rosenthal and Jacobson's study. Elashoff and Snow (1971)
5

Teacher Expectations
conducted a case study of Rosenthal and Jacobson's study and
conclude that their report as a whole is inadequate:
Descriptions of design, basic data, and analysis are
incomplete. Inconsistencies between text and tables,
overly dramatic conclusions, oversimplified, inaccurate
or incorrect statistical discussions and analyses all
contribute to a generally misleading impression of the
study's results. (p. 6)
Crano and Mellon (1978) criticize the study because the
conclusions are based only on students' gains in first and
second grades. The students in the other four grades
participating in their study show no significant differences in
pre\post test scores. Another reservation about the results of
the study concerns the interpretability of achievement tests
at the primary grade levels (Good, 1981). Many questions were
raised concerning the interpretability of the tests.
Since the time of this controversial study, much
research has been conducted regarding teacher expectations
6

Teacher Expectations
and their effects on student achievement. The majority of the
studies have confirmed Rosenthal and Jacobson's results.
However, since there are many kinds of teacher expectations
that influence different teacher behaviors, the studies have
generated additional questions.
It is important for teachers to have expectations about
students, since these enable teachers to set realistic
academic goals and to provide individualized instruction
(Patriarca & Kragt, 1986). Such expectations are formed in a
number of ways. According to Arganbright (1983), teachers
form expectations of students' abilities through previously
acquired information and through encounters in the classroom.
Previously acquired information is gained from teachers'
perceptions of siblings, from permanent records, test scores,
other teachers, student's previous ability grouping, and from
expectations based upon the student's social class.
One criticism of such practices is that expectations so
acquired may result in inaccurate perceptions. However,
7

Teacher Expectations
Brophy (1983) found several studies indicating that most
teacher perceptions of students are accurate and are based on
the best available information. Most information in permanent
records is correct and so helps teachers form correct
expectations about students' abilities. This information,
combined with students' classroom performances, usually
results in accurate perceptions. Inaccurate ones are generally
corrected when more dependable information, such as student
achievement, becomes available, according to Brophy.
Patriarca and Kragt (1986) assessed the accuracy of
teachers' expectations of students' achievement, using the
Stanford Diagnostic Mathematics Test with ninth grade general
math students. Teachers identified for each test item whether
or not students had been taught that specific item. If the
students had been taught the item, the teachers were asked to
predict how well their high-, middle-, and low-achieving
students would score on the particular item. The results show
the teachers to have predicted accurately only 40% of the
8

Teacher Expectations
time, with high-achievers scoring less well and low-achievers
scoring higher than expected. Thus, research confirms that
teachers tend to overestimate the achievement of high ability
students and underestimate the achievement of low ability
students.
Factors Associated with Teacher Expectations
Cooper (1979) cites four factors or effects which
Rosenthal discovered to be associated with teacher
expectations: climate, input, output, and feedback. However,
research shows not all teachers are prone to expectancy
effects. The phenomenon depends on the teaching style and
subject matter (Cooper, 1979; Cooper & Tom, 1984).
The first factor Rosenthal associates with teacher
expectations is climate. Teachers appear to create warmer
environments with nonverbal behaviors for the high
expectation students. Teachers smiled and nodded their heads
more with high expectation students than with low
expectation students. The teachers also leaned towards these
9

Teacher Expectations
students and made more eye contact with them. Climate has
been found to be one of the most important variables in
mediating expectancy effects (Harris, Snodgrass, & Rosenthal,
1979).
Teachers' verbal input to students also reflects
performance expectations. "Slower" students have fewer
opportunities to answer questions and have less material to
learn than brighter students. Brophy and Good summarized 20
studies that assessed the frequency of teacher and student
interactions. Thirteen of these studies show teachers to
engage more often in academic contacts with students for
whom they hold high expectations than they do with those for
whom they hold low expectations. The remaining seven studies
report no differences in teacher behaviors (Cooper, 1979).
Verbal output, the third factor, is the teacher's
persistence in insuring the success of academic interactions.
Elements of verbal output include questioning techniques and
wait time. According to Cooper (1979), teachers extend more
1 0

Teacher Expectations
wait time to the high expectation students than they do to low
expectation students. These students are also given more
clues, more repetition, and more rephrasing of questions.
Braun, Neilsen, and Dykstra (1975) found that the lower
expectation students may not be given as many opportunities
to answer higher level questions as are high expectation
students. Teachers do not persist with the lower expectation
students as long as they do with the higher expectation
students, as evidenced by their providing the higher
expectation students with clues and prompts in response to
incorrect answers.
Rosenthal's fourth factor is feedback, as evidenced by
the teachers' use of praise and criticism. Research shows that
high expectation students are praised more and also praised
proportionately more per correct answer than are low
expectation students. Conversely, the low expectation
students are criticized more and given less detailed feedback
than are high expectation students (Brattensani, Weinstern, &
1 1

Teacher Expectations
Marshall, 1984; Brophy & Good, 1970; Cooper, 1979; Cooper &
Tom, 1984; Good, 1981).
Many students whose teachers have low expectations of
them are labelled "at-risk". According to Slavin and Madden
(1989), factors that contribute to a student's being identified
as at-risk include low achievement, grade retention, behavior
problems, poor attendance, low socioeconomic status, and
attendance at schools with a large number of poor students.
Teachers typically have lower expectations for students from
lower class backgrounds (Blumenfeld, Hamilton, Bossert,
Wessels, & Meece, 1983). Some researchers believe that the
roots of at-risk behavior begin in the elementary grades and
are manifested in low achievement patterns, a high
absenteeism rate, and low self-esteem (Donnelly, 1987).
While it is good for at-risk students to be identified so
that they may receive additional support from the school, such
identification may result in a student's being labelled
(Koehler, 1988). Teachers often resist the placement of low
12

Teacher Expectations
achievers or students with academic handicaps in their
classes. Developing lessons for these students takes time that
teachers could be spending with others more likely to profit
from the teacher's efforts. The at-risk students are then seen
as a burden (Madden & Slavin, 1983).
This viewpoint affects the way at-risk students are
treated by their teachers and their peers. The label itself may
be detrimental because previous studies indicate teacher
expectations to be lower for labelled than nonlabelled students
(Rolison & Medway, 1985; Toner & Hagan, 1983); and labels
such as Learning Disabled can be a stigma (Foster & Yseldyke,
1976; Good, 1987). Students with academic handicaps are
often rejected by their nonhandicapped peers both in and
outside the classroom. Regular class students reported
playing with "normal" children in their neighborhood more than
did special class students (Madden & Slavin, 1983). Palmer
(cited in Rolison & Medway, 1985) concludes that both labels
and previous performance influence teacher expectations,
13
Teacher Expectations
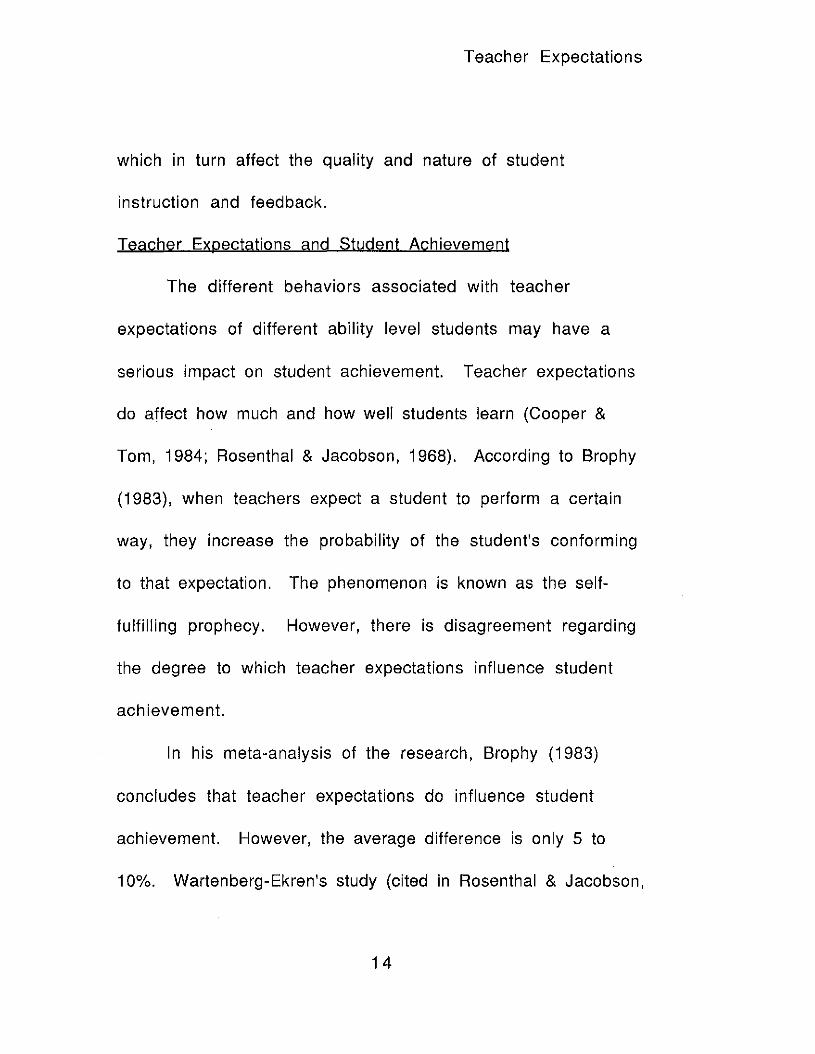
which in turn affect the quality and nature of student
instruction and feedback.
Teacher Expectations and Student Achievement
The different behaviors associated with teacher
expectations of different ability level students may have a
serious impact on student achievement. Teacher expectations
do affect how much and how well students learn (Cooper &
Tom, 1984; Rosenthal & Jacobson, 1968). According to Brophy
(1983), when teachers expect a student to perform a certain
way, they increase the probability of the student's conforming
to that expectation. The phenomenon is known as the self
fulfilling prophecy. However, there is disagreement regarding
the degree to which teacher expectations influence student
achievement.
In his meta-analysis of the research, Brophy (1983)
concludes that teacher expectations do influence student
achievement. However, the average difference is only 5 to
10%. Wartenberg-Ekren's study (cited in Rosenthal & Jacobson,
14

Teacher Expectations
1968) finds students' performance unaffected by teacher
expectancy, although students were subtly aware of being
treated differently.
In an attempt to measure teachers' expectations against
students' performance, O'Connell, Dusek, and Wheeler (1974)
compared the Stanford Achievement Test (SAT) results for two
second grade classes and two fourth grade classes with
teachers' rankings of the students on the basis of their
expected year-end performance in reading and math. This
ranking was intended as a measure of teacher expectancy for
students' performance. The researchers provided teachers
with a list of half the students, identifying them as
possessing the greatest potential for academic gains. The
remaining eight students were the control group. This design
was intended to measure the effects of teacher bias, as well
as to test the replicability of Rosenthal and Jacobson's study.
At the end of the year the researchers discovered teacher
expectancy effects to be strongly correlated to students'
15
Teacher Expectations
performance on the SAT. However, their study did not
replicate Rosenthal and Jacobson's findings because telling
teachers that students would perform well did not, itself,
alter the students' SAT performances. Instead, they found the
teachers' expectancies to be good predictors of the students'
performance.
In general, studies show both at-risk students and those
not at-risk to be aware of the differences in teachers'
treatment of high and low achievers. Students as young as
first grade are aware of these differences. Students describe
the low achievers in their class as recipients of more frequent
negative feedback and direction from the teacher, including
more work- and rule-oriented treatment. The students
observed that high achievers had more opportunities and
choices than did low achievers (Brattensani et aI., 1984).
Unfortunately, when teacher expectations are low, the
students' expectations reflect this. And when the students'
expectations are low, so is their achievement. So teachers and
16
Teacher Expectations
at-risk students often become locked in a vicious cycle. The
at-risk student who perceives school as boring, threatening,
non-productive, and a waste of time is likely to behave and
perform at a low level. The teacher then sees this student as
lacking drive, energy, and ambition. Efforts to motivate the
student fail, which, in turn, frustrate the teacher. Any visible
sign of the teacher's irritation reinforces the student's
original perceptions (Eschenmann, 1988). Beyond the direct
effect that differential teacher treatment might have on
student achievement, such treatment ultimately affects the
student's self-image and motivation. Consequently,
underachieving students attribute any successes they have to
luck, while attributing failure to their lack of ability, and so
are less likely to reattempt a failed task (Payne & Payne,
1989).
Researchers have examined group size as an influence on
teacher behavior toward high expectation and low expectation
students, depending on group size. Brophy (1983) concludes
17

Teacher Expectations
that data from whole class settings often give the impression
of teacher favoritism of high expectation over low expectation
students, while data gathered in small group settings show
few differences and reflect teacher attempts to work more
intensively with low expectation students.
The at-risk population is growing, both in raw numbers
and as a percentage of the total student population (Cardenas,
cited in Lennon, 1989). Because no single definition of "at
risk" exists, it is difficult to estimate accurately the size of
this group. The largest federal program addressing the needs
of low-achieving, disadvantaged students is Chapter I. A total
of five million students, or one in nine, receives Chapter I
services (Guttman & Henderson, cited in Slavin, 1989). With
the school age population increasing, one can expect the
number of at-risk students to continue to increase. Since the
national population aged 18 and under is expected to increase
by about four percent between the years 1988-2020, the total
number of students should rise from 63.6 million in 1988 to
18

Teacher Expectations
around 66.4 million in 2020 (Natriello, McDill, & Pallas, 1990).
Accordingly, the at-risk student population can be expected to
increase.
Summary
Analysis of the research confirms the importance of
teacher expectations on student achievement. Differential
teacher classroom behaviors are attributed to teachers'
perceptions of students' abilities and achievement. Much of
the research finds a correlation between teachers'
expectations and behaviors and student achievement. If
expectations are high, students perform well. If they are low,
students do not perform as well. Other research is conflicting
about the degree to which student performance is affected.
It is important to note that teacher expectations are not
necessarily bad. Teachers need to have a realistic idea of
student capabilities in order to teach effectively. Only when
these expectations become rigid and interfere with the
teachers' behavior do they become negative.
19

Teacher Expectations
All students need to feel challenged in the classroom.
Teachers tend not to challenge low achievers as much as they
do high achievers. Consequently, low achievers become
trapped in a pattern which is not conducive to effective
learning. With the number of at-risk students increasing, it is
important for teachers to realize potential problems that may
occur as a result of their classroom behaviors.
Because of the conflicting research, more study needs to
be conducted regarding teacher expectations and their effects
on student achievement. It is the researcher's belief that the
more educators are aware of these effects and their
implications in the classroom, the more students will benefit.
20

Teacher Expectations
Chapter III
Description of Procedures
Following an extensive review of the literature on
teacher expectations, the researcher developed procedures for
analyzing teacher instructional behaviors in light of the
expectations they reflected for individual students. The
researcher then observed and videotaped four elementary
teachers to obtain data reflective of teacher expectations.
The data collected were analyzed to determine whether a
relationship existed between teachers' expectations for
average or above average students and at-risk students and
teachers' instructional behaviors toward students so labelled.
Sample
The researcher requested volunteers among colleagues
from a rural school in a large school system in north Florida.
There were six volunteers: four from kindergarten through
third grade and two from grades four and five. Due to the
complexity of the data collection and analysis, only four
21

Teacher Expectations
teachers were observed. The four teachers observed were
chosen through blind selection. The selected teachers taught
grades kindergarten, first, fourth and fifth in heterogeneously
grouped classes. A total of 74 students were observed in the
four classes. The majority of the students in the identified
classrooms have a low socioeconomic background. The
teachers were each videotaped for 20 minutes during a
language arts lesson. Prior to the videotaping, the teacher
completed a seating chart for the observer. After the
videotaping, the regular classroom teacher identified on the
seating chart the average or above average students and the
at-risk students, using the definitions found in Chapter 1.
Eighteen students were identified as at-risk. The teachers
were not informed as to what the observer would be looking
for either prior to or during the experiment.
Instru mentation
Using Rosenthal's four factors or effects reflective of
teacher expectations, climate, input, output, and feedback, the
22

Teacher Expectations
researcher developed an instrument for analyzing the
videotapes of the teachers. (See Appendix A for a copy of this
instrument.) Based on expert advice from a classroom
management professor, 10 behaviors were chosen from the
Florida Performance Measurement System that reflect
Rosenthal's factors. The selected Florida Performance
Measurement System indicators of teachers' instructional
behaviors include the following:
1. Varying tone and volume of voice,
2. Smiling and nodding at the students,
3. Maintaining eye contact with students,
4. Nodding at students,
5. Questioning students with low order questions,
6. Questioning students with high order questions,
7. Probing students for corrective feedback,
8. Prompting students for corrective feedback,
9. Giving general praise to students,
10. Giving specific praise to students.
23

Teacher Expectations
Data Analysis Procedures
Using the instrument developed and the information
provided by the teachers regarding their expectations of
students' achievement, the researcher analyzed the videotapes.
The teachers' 10 instructional behaviors were in two
categories: interactions with average or above students and
interactions with at-risk students, and in grades kindergarten
and 1 and grades 4 and 5. The teachers' instructional
behaviors were recorded each time the behavior occurred
during the 20 minute observation.
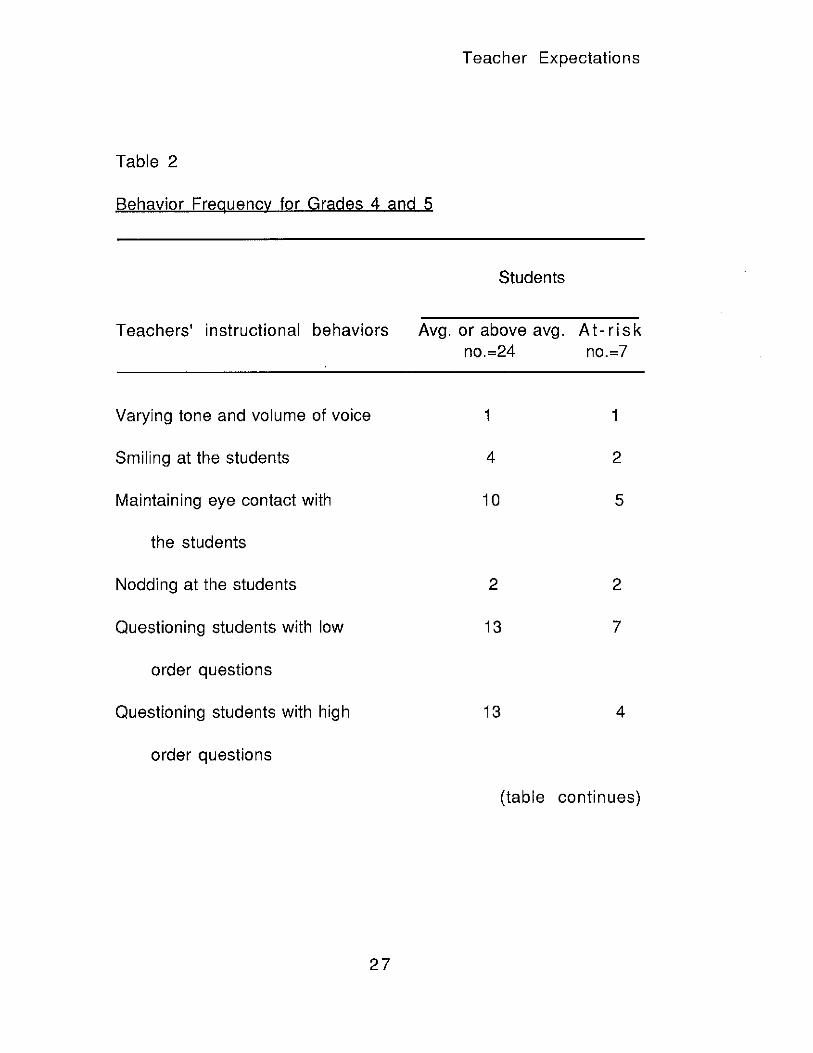
Table 1 on pages 25 and 26 contains raw score
numbers from kindergarten and first grade and Table 2 on
pages 27 and 28 contains raw score numbers from the fourth
and fifth grades. Table 3 on pages 29 and 30 records the
combined data from Tables 1 and 2. The data were initially
analyzed with only the raw score numbers.
24

Teacher Expectations
Table 1
Behavior Freguency for Grades K and 1
Students
Teachers' instructional behaviors Avg. or above avg. A t- r i s knO.=32 nO.=11
Varying tone and volume of voice 3 2
Smiling at the students 2 3
Maintaining eye contact with 9 6
the students
Nodding at the students 5 4
Questioning students with low 16 9
order questions
Questioning students with high 7 3
order questions
(table continues)
25

Teacher Expectations
Table 1
Behavior Freguency for Grades· K and 1
Students
Teachers' instructional behaviors Avg. or above avg. At-risknO.=32 nO.=11
Probing students for corrective 4 1
feedback
Prompting students for 2 4
corrective feedback
Giving general praise to students 6 3
Giving specific praise to 8 2
students
26
Teacher Expectations
Table 2
Behavior Freguency for Grades 4 and 5
Students
Teachers' instructional behaviors Avg. or above avg. At- ri s knO.=24 nO.=7
Varying tone and volume of voice 1 1
Smiling at the students 4 2
Maintaining eye contact with 10 5
the students
Nodding at the students 2 2
Questioning students with low 13 7
order questions
Questioning students with high 13 4
order questions
(table continues)
27

Teacher Expectations
Table 2
Behavior Freguency for Grades 4 and 5
Students
Teachers' instructional behaviors Avg. or above avg. At-risknO.=24 no.=?
Probing students for corrective 8 4
feedback
Prompting students for 2 5
corrective feedback
Giving general praise to students 13 8
Giving specific praise to 8 1
students
28

Teacher Expectations
Table 3
Behavior Frequency for Grades K, 1, 4. and 5
Students
Teachers' instructional behaviors Avg. or above avg. A t- ri s knO.=56 nO.=18
Varying tone and volume of voice 4 3
Smiling at the students 6 5
Maintaining eye contact with 19 11
the students
Nodding at the students 7 6
Questioning students with low 29 16
order questions
Questioning students with high 20 7
order questions
(table continues)
29

Teacher Expectations
Table 3
Behavior Freguency for Grades K. 1. 4. and 5
Students
Teachers' instructional behaviors Avg. or above avg. A t- r is knO.=56 nO.=18
Probing students for corrective 12 5
feedback
Prompting students for 4 9
corrective feedback
Giving general praise to students 19 11
Giving specific praise to 16 3
students
30


Teacher Expectations
Table 4
Percentages of Teacher Behaviors for Grades K and 1
Students
Teachers' instructional behaviors Avg. or above avg. At-risknO.=32 nO.=11
Varying tone and volume of voice 60% 40%
Smiling at the students 40% 60%
Maintaining eye contact with 60% 40%
the students
Nodding at the students 56% 44%
Questioning students with low 64% 36%
order questions
Questioning students with high 70% 30%
order questions
(table continues)
32

Teacher Expectations
Table 4
Percentages of Teacher Behaviors for Grades K and 1
Students
Teachers' instructional behaviors Avg. or above avg. At-risknO.=32 no.=11
Probing students for corrective 80% 20%
feedback
Prompting students for 33% 67%
corrective feedback
Giving general praise to students 67% 33%
Giving specific praise to 80% 20%
students
33

Teacher Expectations
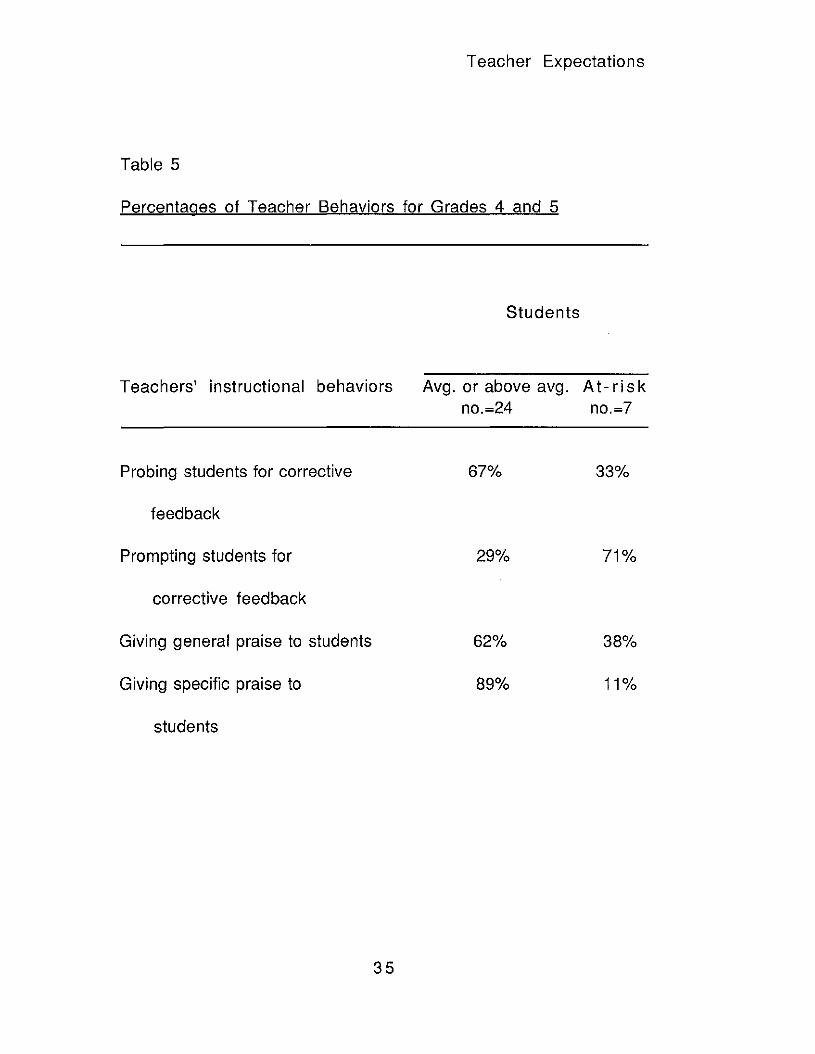
Table 5
Percentages of Teacher Behaviors for Grades 4 and 5
Students
Teachers' instructional behaviors Avg. or above avg. A t- ri s knO.=24 no=7
Varying tone and volume of voice 50% 50%
Smiling at the students 67% 33%
Maintaining eye contact with 67% 33%
the students
Nodding at the students 50% 50%
Questioning students with low 65% 35%
order questions
Questioning students with high 76% 24%
order questions
(table continues)
34
Teacher Expectations
Table 5
Percentages of Teacher Behaviors for Grades 4 and 5
Students
Teachers' instructional behaviors Avg. or above avg. A t- ri s knO.=24 nO.=7
Probing students for corrective 67% 33%
feedback
Prompting students for 29% 71%
corrective feedback
Giving general praise to students 62% 38%
Giving specific praise to 89% 11%
students
35

Teacher Expectations
Table 6
Percentages of Teacher Behaviors for Grades K, 1, 4, and 5
Students
Teachers' instructional behaviors Avg, or above avg, A t- r i s kno,=56 no,=18
Varying tone and volume of voice 57% 43%
Smiling at the students 55% 45%
Maintaining eye contact with 63% 37%
the students
Nodding at the students 54% 46%
Questioning students with low 64% 36%
order questions
Questioning students with high 74% 26%
order questions
(table continues)
36

Teacher Expectations
Table 6
Percentages of Teacher Behaviors for Grades K. 1, 4. and 5
Students
Teachers' instructional behaviors Avg. or above avg. A t- r is kno,=56 n.=18
Probing students for corrective 71% 29%
feedback
Prompting students for 31% 69%
corrective feedback
Giving general praise to students 63% 37%
Giving specific praise to 84% 16%
students
37

Teacher Expectations
A narrative summary of the findings may be found in
Chapter IV. Chapter V contains implications and
recommendations based upon the summary.
38

Teacher Expectations
Chapter IV
Results of Procedures
Four elementary teachers were observed and videotaped
for 20 minutes each during a language arts lesson. Of the 74
students in the four classes, teachers identified 18 of the
students as at-risk, using the definition in Chapter 1. The
videotapes were analyzed to determine if a relationship exists
between teachers' expectations for average or above average
students and at-risk students and the teachers' instructional
behaviors with those students.
The frequency and types of teacher interactions with
average or above average students and at-risk students are
recorded in Tables 1, 2, and 3. Table 1 reflects the data in raw
score numbers from observations of one kindergarten class and
one first grade class. Table 2 contains the data from one
fourth grade class and one fifth grade class. Table 3 combines
the data from the observations of all four teachers.
In order to compare the teachers' use of specific
39

Teacher Expectations
instructional behaviors with the two groups of students, the
average or above average students and the at-risk students,
the raw score numbers were converted to percentages, as
displayed in Tables 4, 5, and 6. Table 4 contains the
percentages of teacher behaviors from the kindergarten and
first grade classes and Table 5 contains the percentages of
teacher behaviors from the fourth and fifth grade classrooms.
Table 6 combines the instructional behaviors of all four
teachers.
The results of the study indicate a relationship appears
to exist between teachers' expectations of average or above
average students and at-risk students and teachers'
instructional behaviors. There was a greater difference in the
frequency of occurrences between those directed to the
average or above average students and those directed to the at
risk students in the following teachers' instructional
behaviors: giving specific and general praise to the students,
questioning students with high and low order questions,
40

Teacher Expectations
probing and prompting students for corrective feedback, and
maintaining eye contact with the students. Varying tone and
volume of voice, smiling at the students, and nodding at the
students had smaller differences in the frequency of
occurrences between those behaviors directed to the average
or above average students and those directed to at-risk
students. Prompting students for corrective feedback was the
only instructional behavior that occurred more frequently with
the at-risk students.
41
Teacher Expectations
Chapter V
Conclusions and Recommendations
Conclusions
Consistent with the review of the literature, this study
indicates that a relationship appears to exist between
teachers' expectations for average or above average students
and at-risk students and teachers' instructional behaviors.
The teachers' instructional behaviors indicate that teachers
interact with the average or above average students more than
the at-risk students in the areas of maintaining eye contact
with students, questioning students with low order and high
order questions, probing students for corrective feedback, and
giving general and specific praise to the students. Prompting
students for corrective feedback was the only teacher
instructional behavior that occurred more frequently with the
at-risk students. The differences were not as significant with
the teachers' instructional behaviors directed to the average
or above average students and those directed to at-risk
42
Teacher Expectations
students in the areas of varying tone and volume of voice,
smiling at the students, and nodding at the students.
However, there may be other factors that contribute to
the differences other than the teachers' expectations of the
different students. The main factor that may affect the
results of the research is the unequal number of average or
above average students and at-risk students in each class. The
ratio of average or above average students to at-risk students
in all four classes was 4:1. As a result, the at-risk students
perhaps only participated in the lesson proportionally to their
number in reference to the sample as a whole.
As a result of being videotaped, the teachers may have
altered their "normal" teaching style. One teacher who
participated in the study said that when she was being
videotaped she was less enthusiastic and did not smile as
much as she usually does. She was conscious of the camera
and did not want to appear as though she was "acting for the
camera".
43

Teacher Expectations
The teachers were videotaped the last two weeks of May,
approximately two weeks before the end of the school year.
This factor may account for the low enthusiasm of the
teachers towards all the students: the low instances of
variance in tone and volume of voice and the few occurrences
of smiling and nodding at the students.
It is important to note that the results of the study were
obtained from teachers' instructional behaviors in the language
arts area. The same results may not be found in other subject
areas. Therefore, it would be inappropriate to generalize the
results of the study to all curriculum areas.
There were factors in the kindergarten class and the
fifth grade class that may have influenced the outcome. In the
kindergarten class the lesson observed contained mostly
choral responses by the students. As a result, fewer individual
questions were asked, and student individual responses could
not be tallied. This is the only class that frequently used this
method.
44
Teacher Expectations
The fifth grade class had seven average or above average
students absent due to a field trip. Therefore, the at-risk
students had an increased opportunity to be questioned by the
teacher as there were less average or above average students
in the class.
It is important to note that the sample consisted of only
74 students. Eighteen of these students were identified as at
risk students. As this is a small sample, the results of the
study are tentative, and it would be inappropriate to make a
generalization based upon the results.
Recommendations for Further Study
It is recommended that the study be replicated using an
equal number of average or above average students and at-risk
students in the classrooms to be observed. This procedure
would insure that each group of students would have an equal
opportunity to participate in the lesson. If the study were
replicated using an equal number of average or above average
students and at-risk students, then further analysis of the
45

Teacher Expectations
data should be conducted. The data analysis should reflect the
frequency of the teachers' instructional behaviors relative to
the proportion of the number of average or above average
students and the number of at-risk students in the observed
classrooms.
Another recommendation is to observe several teachers
at the same grade level and/or several teachers teaching
similar lessons. Furthermore, observing other areas of the
curriculum may result in different outcomes than what was
obtained from the language arts area.
Using an increased sample is also recommended. The
results may be different with a greater number of
participants, and more generalizations may be possible.
It would be interesting to compare the frequency of
teachers' instructional behaviors in September and in May to
see if the differences are due to the time of the year or to the
teachers' expectations of the students. The frequency of the
following instructional behaviors may change as a result:
46

Teacher Expectations
varying tone and volume of voice, smiling at the students,
maintaining eye contact with the students, and nodding at the
students.
The final recommendation is to incorporate student
achievement into a study. It would be interesting to study the
effect of teacher expectations and teacher instructional
behaviors and their role in student achievement.
The results of the study appear to indicate that teachers'
expectations of different ability level students affect the
teachers' instructional behaviors. It is important for teachers
to be aware of this apparent relationship. As found in the
review of the literature, studies confirm both at-risk students
and average or above average students are aware of the
differences in teachers' treatment of high and low achievers.
Since this may affect student achievement, teachers need to
be informed of possible differences in their instructional
behaviors.
There are several ways to educate teachers about the
47

Teacher Expectations
relationship between teacher expectations and teacher
instructional behaviors. One way is through teacher education
institutions. Teacher inservice education within a school or
county can also educate the teachers.
Another method of making teachers aware of differences
in their instruction is by self-analysis. Teachers can
videotape a lesson and compare their interactions with
average or above average students and at-risk students. The
instrument found in Appendix A may be helpful to use.
As the literature review indicates that students are
aware of differences in teacher instructional behaviors,
teachers may want to survey their classes to see if their
students are aware of any differences in the teachers'
behaviors. Such surveys would draw to the teachers' attention
the way the students perceive the teachers' treatment of
themselves and their classmates.
Research indicates that teacher expectations influence
teachers' instructional behaviors and, in turn, may influence
48

Teacher Expectations
student achievement. It is important for teachers to be aware
of the effects their expectations may have on students. With
the school age population increasing, the number of at-risk
students is also expected to increase. Low achievement is one
characteristic of at-risk students. Teachers need to be
certain their expectations are not affecting the different
ability level students in a negative way.
49
Teacher Expectations
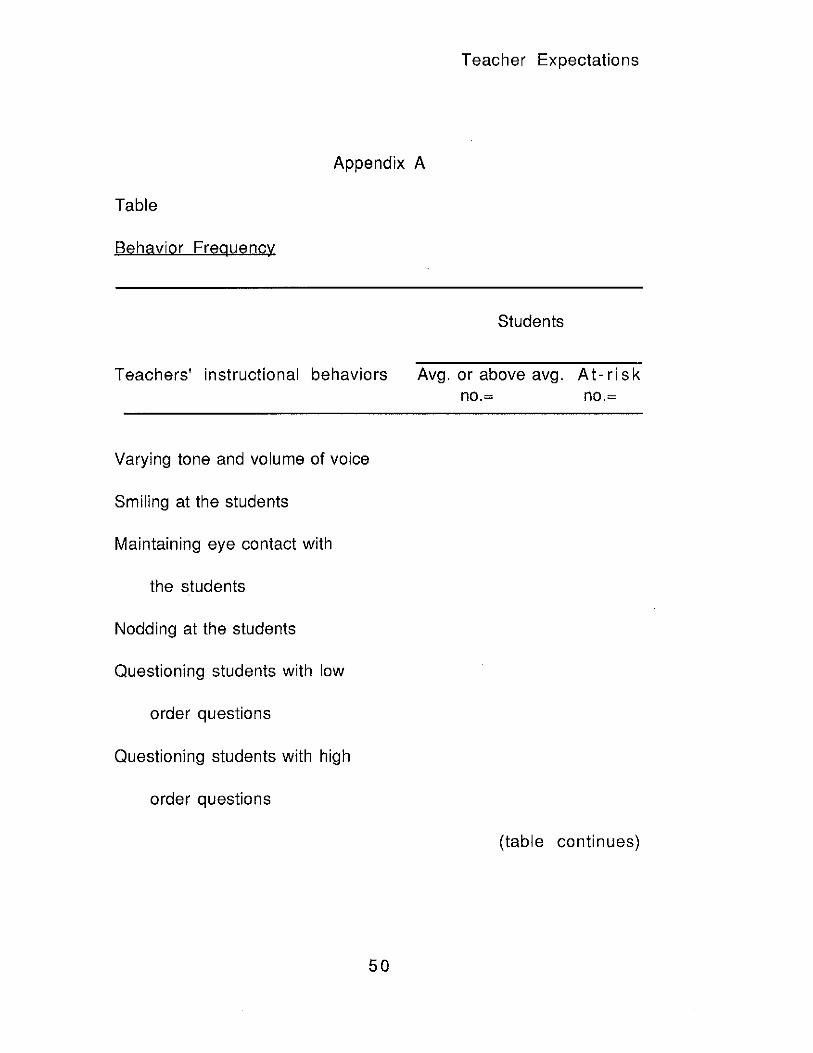
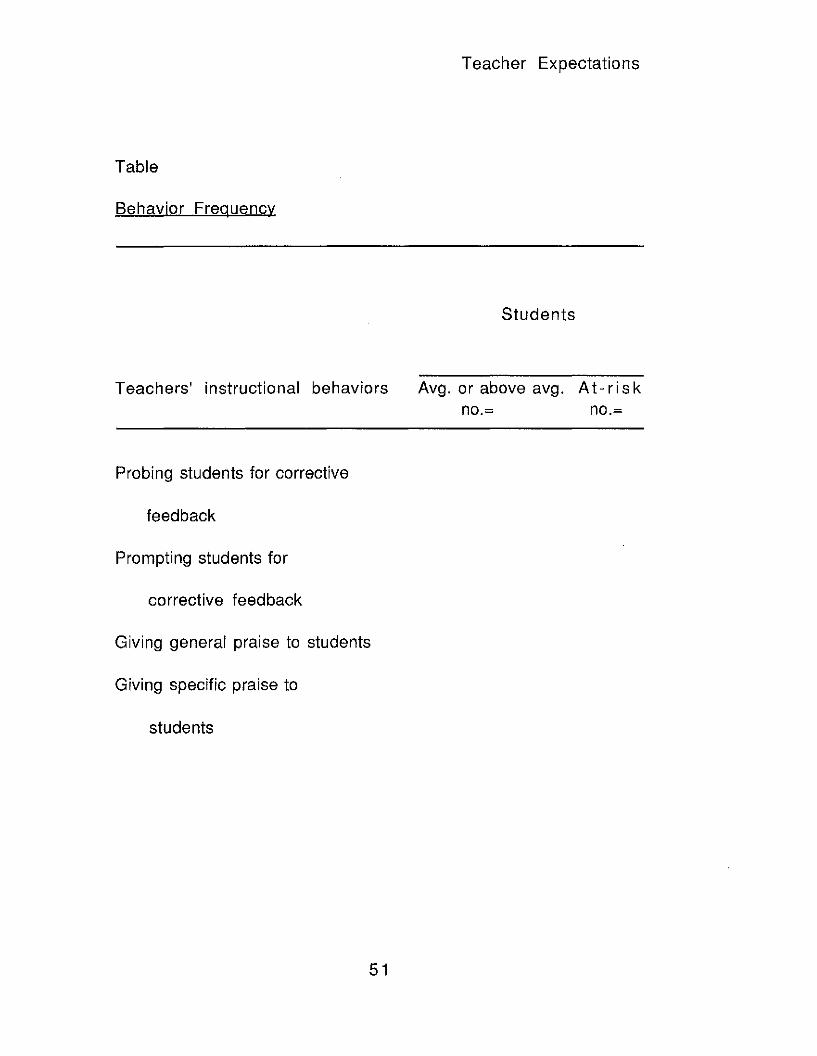
Appendix A
Table
Behavior Frequency
Students
Teachers' instructional behaviors Avg. or above avg. A t- ri s kno.= no.=
Varying tone and volume of voice
Smiling at the students
Maintaining eye contact with
the students
Nodding at the students
Questioning students with low
order questions
Questioning students with high
order questions
(table continues)
50
Teacher Expectations
Table
Behavior Freguency
Students
Teachers' instructional behaviors Avg. or above avg. A t- r is kno.= no.=
Probing students for corrective
feedback
Prompting students for
corrective feedback
Giving general praise to students
Giving specific praise to
students
51

Teacher Expectations
References
Arganbright, J. L. (1983). Teacher expectations-a critical
factor for student achievement. National Association of
Secondary School Principals, .6l.(464), 93-95.
Blumenfeld, P. C., Hamilton, V. L., Bossert, S. T., Wessels, K. &
Meece, J. (1983). Teacher talk and student thought:
socialization into the student role. In J. M. Levine & M. C.
Wang (Eds.), Teacher and student perceptions:
implications for learning (pp. 143-192). Hillsdale, N. J.:
Lawrence Erlbaum..
Brattesani, K. A, Weinstern, R. S., & Marshall, H. A (1984).
Student perceptions of differential teacher treatment as
moderators of teacher expectations effects. Journal of
Educational Psychology, 76, 236-247.
Braun, C., Neilsen, A & Dykstra, R. (1975). Teacher's
expectations: prime mover or inhibitor? The Elementary
School Journal, 76(3), 181-188.
Brophy, J. E. (1983). Research on the self-fulfilling prophecy
52

Teacher Expectations
and teacher expectations. Journal of Educational
Psychology, 75, 631-661.
Brophy, J. & Good, T. (1970). Teachers' communication of
differential expectations for children's classroom
performance: some behavioral data. Journal of
Educational Psychology,.6.1, 365-374.
Cooper, H. M. (1979). Pygmalion grows up: a model for teacher
expectation communication and performance influence.
Review of Educational Research,1a, 389-410.
Cooper, H. M. & Tom, D. Y. (1984). Teacher expectation
research: a review with implications for classroom
instruction. The Elementary School Journal, .8..5.(1), 76
89.
Crano, W. D. & Mellon, D. M. (1978). Causal influence of
teacher's expectations on children's academic
performance: a cross-lagged panel analysis. Journal of
Educational Psychology, 70(1), 39-49.
Donnelly, Margarita. (1987). At-risk students. (Report No.
53
Teacher Expectations
21). Eugene, Oregon: ERIC Clearinghouse of Educational
Management, (ERIC Document Reproduction Service NO.
ED 292 172).
Elashoff, J. D. & Snow, R. E. (1971). Pygmalion reconsidered.
Belmont, CA: Wadsworth.
Eschenmann, K. (1988). Structuring classrooms for success.
Vocational Education Journal, Q.3.(6) , 46-47.
Florida Performance Measurement System. (1982).
Tallahassee, FL: Department of Education.
Foster, G. & Yseldyke, M. (1976). Expectancy and halo effects
as result of artificially induced teacher bias.
Contemporary Educational Psychology, 1, 37-45.
Good, T. L. (1981). Teacher expectations and student
perceptions: a decade of research. Educational
Leadership, .a..8.(5), 415-422.
Good, T. L. (1987). Two decades of research on teacher
expectations: findings and future directions. Journal of
Teacher Education, .3..a(4), 32-47.
54

Teacher Expectations
Harris, M. J., Rosenthal, R., & Snodgrass, S. E. (1986). The
effects of teacher expectations, gender, and behavior on
pupil academic performance and self-concept. Journal of
Educational Research, 29.(3), 173-179.
Koehler, V. (1988, April). Teachers' beliefs about at-risk
students. Paper presented at the annual meeting of the
American Educational Research Association, New
Orleans.
Lennon, J. M. (1989). The at-risk child: early identification,
intervention, and evaluation of early childhood
strategies. Exit project, Indiana University,
Bloomington, Indiana.
Madden, N. A. & Slavin, R. A. (1983). Mainstreaming students
with mild handicaps: academic and social outcomes.
Review of Educational Research,.5..3., 519-569.
Natriello, G., McDill, E. L. & Pallas, A. M. (1990). Schooling
Disadvantaged Children. New York: Teachers College
Press.
55
Teacher Expectations
O'Connell, E. J., Dusek, J. B., & Wheeler, R. J. (1974). A follow
up study of teacher expectancy effects. Journal of
Educational Psychology,.6.6., 325-328.
Patriarca, L. A. & Kragt, D. M. (1986). Teacher expectations
and student achievement: the ghost of Christmas future.
Curriculum Review, .a.5.(5-6), 48-50.
Payne, B. D. & Payne, D. A. (1989). Sex, race, and grade
differences in the locus of control orientations of at
risk elementary students. Psychology in the Schools,
.2..6.(1), 84-88.
Rolison, M. A. & Medway, F. J. (1985). Teachers' expectations
and attributions for student achievement: effects of
label, performance pattern, and special education
intervention. American Educational Research Journal,
22, 561-573.
Rosenthal, R. & Jacobson, L. (1968). Pygmalion in the
classroom. New York: Holt, Rinehart, & Winston.
Slavin, R. E. (1989). Students at-risk of school failure: the
56
Teacher Expectations
problem and its dimensions. In R. E. Slavin, N. L. Karweit,
& N. A. Madden (Ed.), Effective Programs for Students At
Risk. Needham Heights, MA: Allyn & Bacon.
Slavin, R. E. & Madden, N. A. (1989). What works for students
at-risk: a research synthesis. Educational Leadership,
~(5), 4-13.
Toner, I. J. & Hagan, M. (1983, April). The effects of child age
and label on instructor expectation and performance.
Paper presented at the biennial meeting of the Society
for Research in Child Development.
57

Teacher Expectations
Vita
Martha Kahler Castro graduated from Clemson University
in Clemson, South Carolina in 1985 with a BA in elementary
education. She holds teaching certificates in South Carolina,
Georgia, and Florida. Currently she is a second grade teacher
in Jacksonville, Florida.
58