Embed Size (px)
Citation preview

The Effects of Taxes and Social
Spending on the Distribution of
Household Income in Mauritius
Pub
lic D
iscl
osur
e A
utho
rized
Pub
lic D
iscl
osur
e A
utho
rized
Pub
lic D
iscl
osur
e A
utho
rized
Pub
lic D
iscl
osur
e A
utho
rized

2

3
Table of Contents
Acknowledgments ......................................................................................................................................... 7
Executive Summary ...................................................................................................................................... 9
1. Introduction ......................................................................................................................................... 12
2. Methodology ....................................................................................................................................... 14
3. Taxes and Social Spending in Mauritius: A Bird’s-eye View ............................................................ 19
3.1 Direct Taxes and Transfers ......................................................................................................... 22
Direct Taxes ........................................................................................................................................ 22
Cash Transfers .................................................................................................................................... 25
3.2 Indirect Taxes and Subsidies....................................................................................................... 27
Value Added Tax ................................................................................................................................ 27
Excise Taxes ....................................................................................................................................... 28
Subsidies ............................................................................................................................................. 30
3.3 Public Spending on Education and Health .................................................................................. 32
Education ............................................................................................................................................ 32
Health .................................................................................................................................................. 35
4. Impact of the Net Fiscal System on Poverty and Inequality ............................................................... 40
Which taxes and transfers are equalizing and/or pro-poor? ................................................................ 40
Does the fiscal system reduce inequality? .......................................................................................... 42
Does the fiscal system reduce poverty? .............................................................................................. 43
What is the spending effectiveness of noncontributory pensions? ..................................................... 45
What is the incidence of taxes and transfers on prefiscal income along the distribution? .................. 45
5. A Microsimulation Tool for Policy Making ....................................................................................... 47
6. Conclusions and Policy Implications .................................................................................................. 50
References ................................................................................................................................................... 51
Annex A: Data Sources and Methodological Assumptions ........................................................................ 53
Main Data Source ............................................................................................................................... 53
Sample Selection ................................................................................................................................. 54
Methodological Assumptions ............................................................................................................. 54
Annex B: Additional Administrative Data .................................................................................................. 56

4
List of Figures Figure 2.1. Definitions of income concepts ................................................................................................ 15
Figure 2.2. Progressivity of taxes and transfers .......................................................................................... 17
Figure 3.1. Composition of tax revenues as a share of GDP in Mauritius and middle income countries, circa
2017 ............................................................................................................................................................ 20
Figure 3.2. Composition of public spending as a share of GDP in Mauritius and middle income countries,
circa 2017, selected functions ..................................................................................................................... 22
Figure 3.3. Lorenz and concentration curves for per capita market income and direct taxes and contributions
and share of personal income tax and contributions in market income by quintile. ................................... 24
Figure 3.4. Lorenz and concentration curves for per capita market income and cash transfers and share of
cash transfers in total market income by quintile........................................................................................ 26
Figure 3.5. Lorenz and concentration curves for per capita market income and VAT and share of VAT in
total market income by quintile. ................................................................................................................. 27
Figure 3.6. Lorenz and concentration curves for per capita market income and excise taxes and share of
excise taxes in total market income by quintile. ......................................................................................... 29
Figure 3.7. Lorenz and concentration curves for per capita market income and indirect subsidies and share
of indirect subsidies in total market income by quintile. ............................................................................ 31
Figure 3.8. Share of beneficiaries of free bus transport by quintile of per capita market income. ............. 32
Figure 3.9. Public education expenditures by educational level and distribution of school-age kids by
quintile of per capita income. ...................................................................................................................... 33
Figure 3.10. School attendance rates by educational level, type of provider and quintile of per capita market
income plus pension. ................................................................................................................................... 34
Figure 3.11. Lorenz and concentration curves for per capita market income and in-kind education transfer
and share of in-kind education transfer in total market income by quintile. ............................................... 35
Figure 3.12. Lorenz and concentration curves for per capita market income and in-kind health transfer and
share of in-kind health transfer in total market income by quintile. ........................................................... 36
Figure 3.13 Progressivity of Taxes and Transfers ...................................................................................... 38
Figure 4.1 Marginal Contribution of Taxes and Transfers to Changes in Poverty Headcount (national
poverty line) ................................................................................................................................................ 41
Figure 4.2 Marginal Contribution of Taxes and Transfers to Changes in Inequality (Gini coefficient) ..... 41
Figure 4.3 Change in inequality (Gini coefficient) from market to final income ....................................... 43
Figure 4.4 Change in poverty headcount from market to consumable income (PPP$4/day) ..................... 44
Figure 4.5. Incidence of Taxes and Transfers and Net Fiscal Benefit, by Decile of Per Adult Equivalent
Market Income ............................................................................................................................................ 46
Figure 5.1. Implementation of the Marshall Plan Social Contract .............................................................. 47
Figure 5.2. Lorenz and concentration curves for per adult equivalent prefiscal market income, negative
income tax allowance and Marshall Plan Social Contract scheme. ............................................................ 48

5
List of Tables Table 3.1 General Government Tax Revenues in Mauritius, 2017 ............................................................. 19
Table 3.2 General Government Spending in Mauritius, 2017 .................................................................... 21
Table 3.3 Personal Income Taxation Rate, Solidarity Levy Rate and Exemption Thresholds, 2016/17 and
2017/18 ....................................................................................................................................................... 23
Table 3.4: Revenues from excise tax by item, 2016/17 and 2017/18 ......................................................... 28
Table 3.5: Expenditures on subsidies by item, 2017/18.............................................................................. 30
Table 4.1 Inequality and poverty measures, by income aggregate ............................................................. 42
Table 5.1 Negative Income Tax Allowance and monthly salary thresholds. .............................................. 47
Table B 1.Macrovalidation: Model using National Accounts and the 2017 HBS ...................................... 56
Table B 2. Personal Income Tax Deductions .............................................................................................. 58
Table B 3. Contributions rate to National Pension Fund, National Saving Fund, and Training Levy........ 59
Table B 4. Insurable salary thresholds (MUR) ........................................................................................... 59
Table B 5. National Pension Fund contributions payable in respect of employees having attained retirement
age ............................................................................................................................................................... 60
Table B 6. Absolute poverty thresholds - Marshall Plan Social Contract ................................................... 60
Box 1. Measuring progressivity, redistributive and poverty reduction effect ............................................. 17
Box 2. Cash transfer programs .................................................................................................................... 25

6

7
Acknowledgments
This report has been prepared by Marco Ranzani (TTL, Economist, GPV01) with the excellent research
support of Jia Gao (Consultant, GPV01), Friedrich Bergmann (Consultant, GPV01), and Alex Giron
Gordillo (Consultant, GGOGT). The report has benefited from extensive discussions held in Mauritius with
government officials and staff at the Mauritius Revenue Authority and Statistics Mauritius. The team would
like to thank the Ministry of Finance and Economic Development, the Ministry of Social Security, National
Solidarity, and Environment and Sustainable Development, the Ministry of Social Integration and
Economic Empowerment, the Mauritius Social Registry Unit, the Ministry of Education, and Human
Resources, Tertiary Education and Scientific Research, and the Ministry of Health and Quality of Life. The
team would like to express its gratitude to Statistics Mauritius for the excellent support and collaboration
and, in particular, to Ms. Aimée Li Fa Cheung Kai Suet (Director of Statistics), Ms. Yasmin Cassimally
(Deputy Director of Statistics), Ms. Set Fong Cheung Tung Shing (Deputy Director of Statistics), Ms.
Chandranee Rughoobur (Statistician, Poverty Statistics), and Mr. Sanjev Bhonoo (Statistician, Household
Budget Survey). The team is grateful to the Mauritius Revenue Authority, in particular to Mr. Sudhamo Lal
(Director General) and Mr. Roshan Oree (Team Leader – Research, Policy and Planning Department). The
team also thanks Mr. Dayachund Bundhoo (National Consultant – United Nations Development
Programme) and Mr. Ajoy Nundoochan (National Professional Officer – World Health Organization) for
their kind support.
The team gratefully acknowledges the guidance and feedback of Pierella Paci (Practice Manager, GPV01),
Mark Lundell (Country Director, AFCS2), Carolin Geginat (Program Leader, AFCS2), and Erik von
Uexkull (Resident Representative, Mauritius), as well as the support of Martin Buchara (Program Assistant,
GPV01), Mariella Beugue (Program Assistant, AFMMU), and Rachel Ng Cheong (Temporary, AFMMU).
The team is grateful to the peer reviewers, Ruth Hill (Lead Economist, GPV07) and Gabriela Inchauste
(Lead Economist, GPV04), for their constructive suggestions.

8

9
Executive Summary
Overall, the net fiscal system of Mauritius reduces inequality and poverty. The Gini index of prefiscal
income (per adult equivalent) is estimated at 40.0 and declines considerably, to 34.4, after direct taxes and
cash transfers, 34.2 after indirect taxes and subsidies, and 30.6 after in-kind education and health transfers
are accounted for. The poverty headcount ratio (measured against the MUR 6,404 a month per adult
equivalent poverty line) declines by about 5.9 percentage points, from 15.1 percent to 9.2 percent, if, rather
than prefiscal income, one considers consumable income, which accounts for the effect of direct and
indirect taxes and transfers. Overall, households among the bottom 30 percent of the prefiscal income
distribution are net cash receivers, while the middle class and the most affluent households are net tax
payers. In terms of inequality and poverty reduction, the net fiscal system places Mauritius among the 5
top-performing middle-income countries on which data are available in the CEQ database.1
Direct taxes on personal income are progressive and reduce inequality. About 80 percent of the
incidence of the personal income tax (PIT) is borne by the richest 10 percent of the population, while the
poorest 40 percent of the population pay less than 1 percent of the PIT. Despite a flat tax of 15 percent, the
PIT is progressive thanks to a system of deductions and exemption thresholds that vary with household
composition. The progressivity has increased with the recently introduced additional tax bracket (up to
MUR 650,000 income) that is taxed at 10 percent. The PIT slightly decreases inequality; yet it does not
have any sizable effect on the poverty headcount ratio. The simulated impact of the negative income tax
allowance (NIT) show that the instrument is poverty and inequality reducing. The bottom 40 percent of the
income distribution (the bottom 40) receives 47 percent of the NIT, while less than 1 percent is received by
households in the top decile.
Cash transfer programs are progressive and pro-poor, except for the basic retirement pension (BRP).
With social protection accounting for about 23 percent of total public spending, the social protection system
includes both universal and targeted cash transfer programs. Social protection spending contributes to
reducing poverty and inequality. The reduction in inequality is estimated at 4.5 Gini points, with BRP
explaining the largest share of the reduction. BRP, which alone accounts for about 50 percent of social
protection spending, is a universal pension benefit that every Mauritian receives from age 60. Although
poverty and inequality reducing, BRP also reaches the most affluent households and represents an
ineffective use of public resources. The same effect on inequality could be achieved by spending 30 percent
of what is currently devoted to the BRP. Similarly, the same reduction in the distance between household
income and the poverty line could be obtained by spending only 12 percent of what is currently directed to
the BRP. By contrast, the Social Aid Program, which is targeted on households temporarily unable to earn
a livelihood, is pro-poor: over 85 percent is absorbed by households in the bottom 40. The Marshall Plan
Social Contract provides a monthly allowance to low-income households that appears to be well targeted:
about 94 percent of the cash transfers provided under this scheme are absorbed by households in the bottom
20 percent of the prefiscal income distribution, and no allowance is received by households in the top 60
percent. This targeted program generates a more equal distribution of income and is superior to untargeted
transfers such as noncontributory pensions because it is able to achieve the same degree of poverty and
inequality reduction with fewer resources.
1 See CEQ Standard Indicators (database), Commitment to Equity, Inter-American Dialogue, Washington, DC; Center
for Inter-American Policy and Research and Department of Economics, Tulane University, New Orleans,
http://commitmentoequity.org/datacenter.

10
Indirect taxes are unequalizing in the short term and result in a sizable increase in poverty. In
Mauritius, the value added tax (VAT) rate is 15 percent; excise duties on alcohol, tobacco, and petroleum
products account for about 80 percent of the revenues from this tax. VAT and excise duties account for
over 50 percent of total tax revenues. The share of VAT in total household prefiscal income is 42.6 percent
among the bottom 20 percent and 26.6 percent among the top 20 percent because low-income households
spend a larger share of their incomes on consumption relative to high-income households. Excises on
alcohol and tobacco are globally regressive because the share of expenditures on alcohol and tobacco
products in prefiscal income is significantly larger among the poorest households and declines with income.
Overall, the VAT and excise duties increase inequality by 0.9 Gini points, and the bulk of the unequalizing
effect is ascribable to excises on tobacco and alcohol (0.5 and 0.2 Gini points). However, these estimates
only capture short-term effects, and excises on alcohol and tobacco can have overall positive effects on the
welfare of low-income households through lower health-related expenditures and longer life expectancy.
In addition, poverty increases by 5 percentage points due to indirect taxes, particularly because of VAT and
excises on fuel and tobacco. In terms of consumable income, about 9 percent of individuals are fiscally
impoverished at the national poverty line. Thus, indirect taxes on consumption make some poor poorer and
some nonpoor poor.
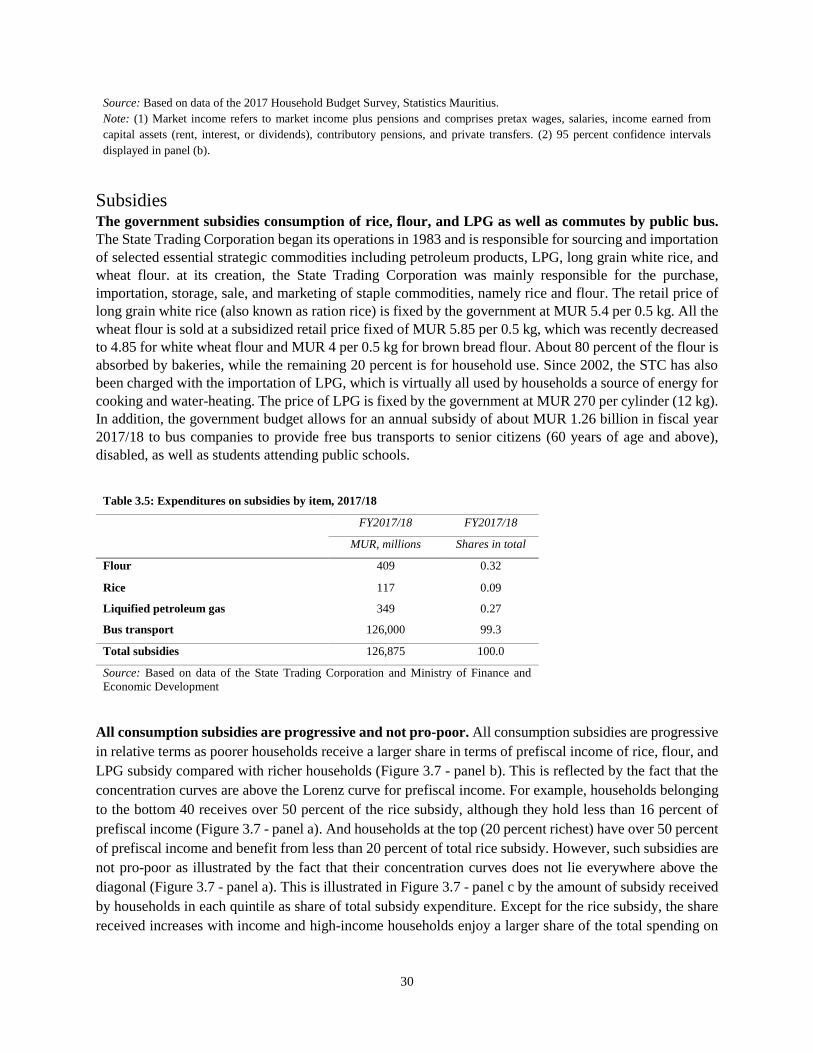
Consumption subsidies have a small positive effect on inequality and poverty reduction, but their
universal nature makes them less effective in targeting the poor. Subsidies on rice, flour, and liquified
petroleum gas (LPG) are progressive in relative terms as these represent a large share of prefiscal income
among poorer households compared with richer households. This is not the case in absolute terms. Free
public bus transport is globally progressive and pro-poor mainly because of the high prevalence of seniors
in the poorest households. However, given the universal nature and the relatively small budget size of these
subsidies relative to other fiscal instruments, their fiscal incidence is modest and ranges between 6 percent
of prefiscal income among households in the first decile and less than 0.2 percent in the highest decile of
the prefiscal income distribution.
Public education expenditure is progressive and pro-poor, except in tertiary education. Public
education spending is progressive in absolute terms, but the degree of progressivity declines at higher levels
of education. Low-income households have more children attending public primary and secondary schools
relative to more affluent households that opt out of the public education system. Therefore, public spending
on primary and secondary education is progressive and pro-poor. However, the net benefits of spending at
higher levels of the education system benefit the more well off. High-income households are
disproportionately benefiting from in-kind transfers at higher levels of education because of higher
attendance rates among their children.
Public health expenditure is progressive. Low-income households are more likely to access public health
care facilities relative to their affluent counterparts. About 25 percent of the population in the richest quintile
report that they typically use private health services, as opposed to only between 1.5 and 7.3 percent of the
population in the bottom and fourth quintiles, respectively. This makes public health expenditure
progressive in relative terms. However, there has been a general increase in access to private health care
that might pose a financial strain on the living standards of the poorest. In 2007, private health expenditure
surpassed public health expenditure, and the gap has expanded ever since. The main driver of out-of-pocket
expenditures are purchases of pharmaceutical products, followed by medical supplies and disposables. In
addition, the use of private hospitals is largely ascribable to the long waiting times to access health care in
public hospitals.

11
Two fiscal instruments merit attention: cash transfer programs and indirect subsidies. First, the cash
transfer system comprises a plethora of schemes that could be consolidated and more well targeted to
increase their effectiveness in reducing poverty and inequality. For example, the BRP, which is the first
source of social protection spending, could be made means-tested so that the per capita amount of resources
devoted to this noncontributory pension could be higher among the poor, and some of the resources could
be directed to targeted schemes. Similarly, subsidies on rice, flour, and LPG are progressive in relative
terms, but they are not pro-poor. Free public bus transport is globally progressive and pro-poor mainly
because of the high prevalence of seniors in the poorest households. The Social Register of Mauritius, a
large database of potential and actual program beneficiaries, could help rationalize and consolidate existing
programs as well as increase targeting performance. The means-tested antipoverty program introduced
under the Marshall Plan Social Contract currently reaches about 11,000 low-income households and could
be gradually expanded if more resources were freed up from untargeted schemes. In addition, subsidies
could be gradually phased out or targeted on households that benefit from the Marshall Plan through the
Social Register of Mauritius.
The microsimulation tool developed by the World Bank is a useful instrument that will allow a
number of potential policy changes to be simulated by simply altering a set of parameters in the fiscal
system. For example, changes in the tax rates, additional income tax brackets, and shifts in the basic salary
thresholds for the NIT or in the cash transfer amount provided under the Marshall Plan Social Contract
could be easily simulated within the model.

12
1. Introduction
Over the past decade, steady economic growth has placed Mauritius solidly among upper-middle-
income countries and has contributed to reducing poverty. At an average of about 3.6 percent, annual
per capita growth in gross domestic product (GDP) has been accompanied by a process of structural
transformation from traditional and low-skill sectors, such as agricultural and textiles, toward services. In
2017, per capita GDP of $22,356 (measured in current international dollars) is the third highest in Africa
and places Mauritius solidly in the upper-middle-income category. Measured against the $5.50-a-day 2011
purchasing power parity (PPP) line, consumption-based poverty declined from 20.3 percent in 2006/07 to
18.1 percent in 2012 and reached 12.1 percent in 2017, well below the average of 34.4 percent among
upper-middle-income countries.
Economic growth has been accompanied by an increase in income inequality that has recently started
to decline. Inequality in Mauritius has widened substantially over the last 15 years. The World Bank (2017)
shows that household income inequality has widened particularly in the aftermath of the global economic
downturn and terms-of-trade shock that hit Mauritius between 2008 and 2015. However, recent estimates
reveal a trend reversal. As measured by the Gini index, income inequality in Mauritius has declined from
38.6 in 2012 to 36.5 in 2017. This is comparable with the level of inequality in countries at a similar level
of economic development and moderate compared with the most unequal countries in the world, such as
South Africa (0.63), Botswana (0.61), and Namibia (0.59).2
Rising inequality in household income from labor has been the main culprit behind the growth in
overall income inequality. Skills shortages ascribable to the structural transformation of the economy have
been the single most important contributor to increasing inequality in earnings (World Bank 2017). The
economy has experienced a progressive shift from traditional and low-skill sectors to services, notably
professional, real estate, and financial services. This transformation has generated a considerable rise in the
demand for skilled workers that has not been matched by an equally rapid increase in the supply of skilled
workers, notwithstanding the substantial improvement in educational attainment among the population. As
a consequence, high-skilled workers benefited from considerably larger increases in wages compared with
low-skilled workers.
The government’s efforts to redistribute the benefits of growth have helped partially mitigate the
increases in labor income inequality. Estimates based on data from the labor force survey indicate that
the Gini coefficient based on household income from labor increased by 8 Gini points, from 0.42 in 2001
to 0.49 in 2015 (World Bank 2017). At the same time, inequality in household total income expanded by
only 6 Gini points, from 0.36 to 0.42 thanks to the effect of public transfers.3
The scope of this study is to investigate the effect of the fiscal system as a whole on the distribution of
income as of 2017 and to unpack the contribution of single fiscal instruments to poverty and
inequality. In a context characterized by tight fiscal space and expanding inequality, investigating the effect
of the net fiscal system as well as of individual fiscal instruments is of paramount importance. The challenge
2 Estimates are based on the latest available surveys from upper-middle-income countries. See Poverty and Equity
Data Portal (database), World Bank, Washington, DC, http://povertydata.worldbank.org/poverty/home/. 3 The Continuous MultiPurpose Household Survey does not allow a measure of disposable income to be derived
because information regarding the amount of taxes paid is not consistently collected over time, and no information is
available regarding the net value of owner-occupied dwellings.

13
facing Mauritius will be to boost inclusive economic growth, while preserving fiscal sustainability and
regaining competitiveness (IMF 2019). In this context, investigating the progressivity as well as the
inequality and poverty effect of the net fiscal system can help inform policy reforms aimed at ensuring that
tax collection and social spending are effectively used to promote equity and reduce poverty. The analysis
will provide answers to the following questions. How much income redistribution and poverty reduction is
being accomplished through fiscal policy? How equalizing and pro-poor are specific taxes and government
spending? How effective are taxes and government spending in reducing inequality and poverty?
14
2. Methodology
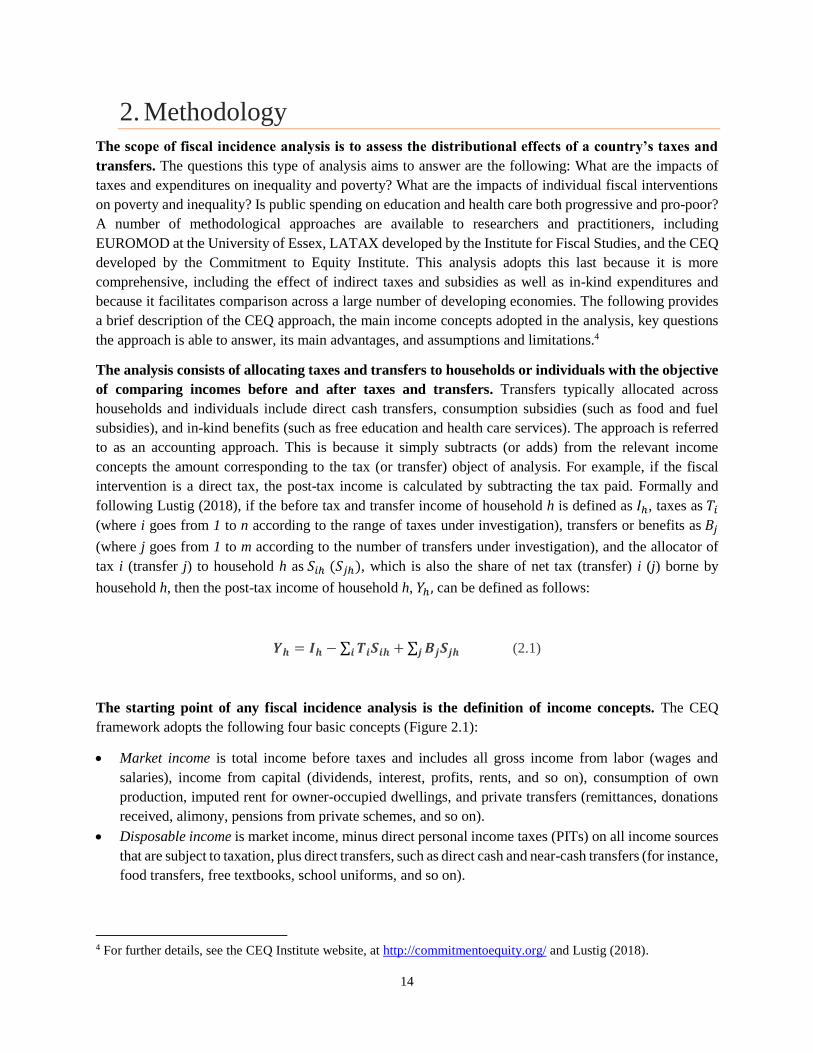
The scope of fiscal incidence analysis is to assess the distributional effects of a country’s taxes and
transfers. The questions this type of analysis aims to answer are the following: What are the impacts of
taxes and expenditures on inequality and poverty? What are the impacts of individual fiscal interventions
on poverty and inequality? Is public spending on education and health care both progressive and pro-poor?
A number of methodological approaches are available to researchers and practitioners, including
EUROMOD at the University of Essex, LATAX developed by the Institute for Fiscal Studies, and the CEQ
developed by the Commitment to Equity Institute. This analysis adopts this last because it is more
comprehensive, including the effect of indirect taxes and subsidies as well as in-kind expenditures and
because it facilitates comparison across a large number of developing economies. The following provides
a brief description of the CEQ approach, the main income concepts adopted in the analysis, key questions
the approach is able to answer, its main advantages, and assumptions and limitations.4
The analysis consists of allocating taxes and transfers to households or individuals with the objective
of comparing incomes before and after taxes and transfers. Transfers typically allocated across
households and individuals include direct cash transfers, consumption subsidies (such as food and fuel
subsidies), and in-kind benefits (such as free education and health care services). The approach is referred
to as an accounting approach. This is because it simply subtracts (or adds) from the relevant income
concepts the amount corresponding to the tax (or transfer) object of analysis. For example, if the fiscal
intervention is a direct tax, the post-tax income is calculated by subtracting the tax paid. Formally and
following Lustig (2018), if the before tax and transfer income of household h is defined as 𝐼ℎ, taxes as 𝑇𝑖
(where i goes from 1 to n according to the range of taxes under investigation), transfers or benefits as 𝐵𝑗
(where j goes from 1 to m according to the number of transfers under investigation), and the allocator of
tax i (transfer j) to household h as 𝑆𝑖ℎ (𝑆𝑗ℎ), which is also the share of net tax (transfer) i (j) borne by
household h, then the post-tax income of household h, 𝑌ℎ , can be defined as follows:
𝒀𝒉 = 𝑰𝒉 − ∑ 𝑻𝒊𝑺𝒊𝒉𝒊 + ∑ 𝑩𝒋𝑺𝒋𝒉𝒋 (2.1)
The starting point of any fiscal incidence analysis is the definition of income concepts. The CEQ
framework adopts the following four basic concepts (Figure 2.1):
• Market income is total income before taxes and includes all gross income from labor (wages and
salaries), income from capital (dividends, interest, profits, rents, and so on), consumption of own
production, imputed rent for owner-occupied dwellings, and private transfers (remittances, donations
received, alimony, pensions from private schemes, and so on).
• Disposable income is market income, minus direct personal income taxes (PITs) on all income sources
that are subject to taxation, plus direct transfers, such as direct cash and near-cash transfers (for instance,
food transfers, free textbooks, school uniforms, and so on).
4 For further details, see the CEQ Institute website, at http://commitmentoequity.org/ and Lustig (2018).

15
• Consumable income is derived from disposable income by adding indirect subsidies, such as food and
fuel subsidies, and subtracting indirect taxes, including the value added tax (VAT), excise taxes, and
sales taxes.
• Final income is consumable income, plus in-kind benefits, such as free education and health care
services, valued at the average cost of provision for the government (if implemented, copayments and
user fees are subtracted from the value of in-kind transfers).
Figure 2.1. Definitions of Income Concepts
Source: Inchauste and Lustig 2017.
One of the main advantages of including both taxes and public spending is the possibility of assessing
the effect of single taxes and transfers on the distribution of income, but also ascertaining whether or
not the net fiscal system as a whole is equalizing or unequalizing, pro-poor or pro-rich. For example, while
certain taxes might be unequalizing, revenues collected through these taxes might be used to finance social
spending and cash transfers that are sufficiently equalizing to make the system more equalizing than it
would be without the taxes. Lambert’s conundrum (2001), whereby a fiscal system with a regressive tax is
more equalizing than one without it, implies that the key is to account for the whole fiscal system to
determine whether or not a specific intervention increases or decreases inequality.5 In addition, after one
estimates the distributional impact of a system of taxes and transfers using microdata, it is possible to go
beyond the status quo and explore the impacts of specific sets of reforms to the system on the distribution
of different household income concepts through microsimulation models. The CEQ approach is designed
to provide answers to questions such as How much income redistribution and poverty reduction is being
5 Another possible explanation for the fact that a progressive tax is unequalizing is household reranking.

16
accomplished through fiscal policy? How equalizing and pro-poor are specific taxes and government
spending? How effective are taxes and government spending in reducing inequality and poverty? What is
the impact of fiscal reforms that change the size or progressivity of a particular tax or benefit? (Lustig
2018).
First, to assess whether the fiscal system reduces or increase inequality, the approach compares
inequality calculated using the different income concepts described above. For example, redistribution
obtained through direct taxes and transfers can be measured by comparing inequality indicators using
market and disposable income. Comparing disposable and consumable income inequality allows the extent
of redistribution achieved with indirect taxes and subsidies to be understood. Finally, in-kind transfers, such
as free health care and education services delivered by the government, can have an effect on inequality
that can be ascertained by comparing consumable and final income inequality. To assess the redistributive
effect of the entire fiscal system, one should compare market and final income inequality.
Second, it is interesting to assess the effect of the fiscal system on poverty. Similar to the case of the
method used to measure the effect on inequality, poverty indicators can be calculated and compared for the
four income concepts described above. Poverty measures typically include the poverty headcount, which
measures the share of the population with a consumption or income level below the poverty line, the poverty
gap ratio, which measures the depth of poverty, and the squared poverty gap ratio, which measures the
severity of poverty. In addition, it is possible to investigate which groups of the income distribution are
average net payers to the fiscal system or net receivers of transfers. However, even if a tax reduces poverty
and inequality and is progressive, it can push a considerable number of households below the poverty line
or make some households poorer than without the tax. This is because poverty measures are anonymous,
that is, they are not able to compare the postfiscal and prefiscal incomes of single individuals. Therefore,
the CEQ approach proposes the use of the marginal contribution of taxes or transfers to assess whether that
tax or transfer is equalizing or unequalizing. The marginal contribution is the difference between the
selected inequality indicator (such as the Gini coefficient) without and with the tax or transfers. The
marginal contribution answers the following question: what would the level of inequality be if the system
did not have a particular tax or transfer?
The CEQ approach is associated with specific assumptions, which are typically country specific and
mainly driven by data availability. There are also certain limitations that are common in this type of
analysis. However, the approach remains a valid baseline analysis to build on according to a country’s
preference and interests. To equip the reader with the information required to interpret the findings of the
analysis correctly, the main limitations are now listed. First, the CEQ approach does not account for
behavioral, life-cycle, or general equilibrium effects. However, market income is not claimed to be the true
counterfactual income under a scenario with no taxes and transfers; it is simply a first-order approximation
of the average incidence of fiscal policies. Second, consumer demand and labor supply are assumed to be
perfectly inelastic, that is, the entire tax burden is borne by consumers and workers. This is typically a
reasonable assumption (Martinez-Vazquez 2008). Third, the analysis does not account for the
intrahousehold distribution of consumption. Fourth, the analysis does not control for differences in the
quality of free education and health care services provided by the government. Fifth, the taxation of
corporate income and international trade, property taxes, and infrastructure spending, which are a
substantial part of a government budget, are excluded from the analysis. Sixth, the analysis is static and
does not capture dynamic trade-offs such as between consumption today and consumption in the future.
This might represent an important limitation whenever policy makers face a choice between certain types
17
of social spending that are able to increase household welfare directly and immediately, such as direct cash
transfers, and other types of spending that require time before the benefits trickle down to households, such
as investments in public education.
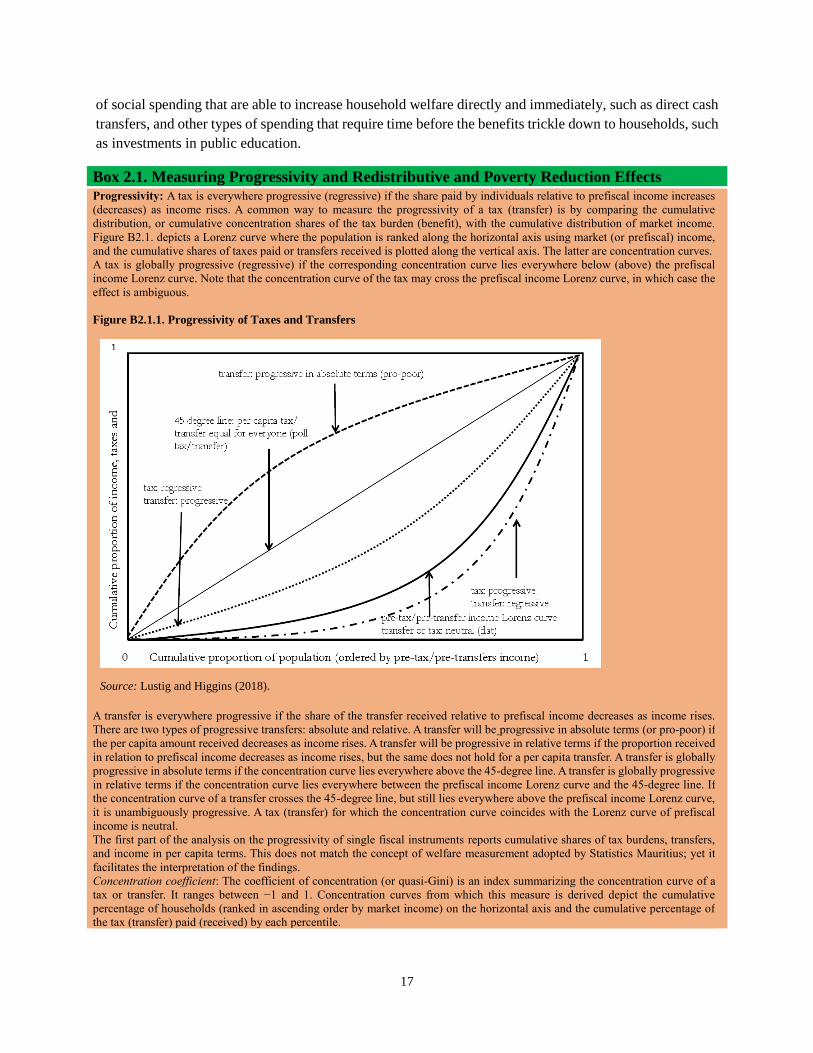
Box 2.1. Measuring Progressivity and Redistributive and Poverty Reduction Effects
Progressivity: A tax is everywhere progressive (regressive) if the share paid by individuals relative to prefiscal income increases
(decreases) as income rises. A common way to measure the progressivity of a tax (transfer) is by comparing the cumulative
distribution, or cumulative concentration shares of the tax burden (benefit), with the cumulative distribution of market income.
Figure B2.1. depicts a Lorenz curve where the population is ranked along the horizontal axis using market (or prefiscal) income,
and the cumulative shares of taxes paid or transfers received is plotted along the vertical axis. The latter are concentration curves.
A tax is globally progressive (regressive) if the corresponding concentration curve lies everywhere below (above) the prefiscal
income Lorenz curve. Note that the concentration curve of the tax may cross the prefiscal income Lorenz curve, in which case the
effect is ambiguous.
Figure B2.1.1. Progressivity of Taxes and Transfers
Source: Lustig and Higgins (2018).
A transfer is everywhere progressive if the share of the transfer received relative to prefiscal income decreases as income rises.
There are two types of progressive transfers: absolute and relative. A transfer will be progressive in absolute terms (or pro-poor) if
the per capita amount received decreases as income rises. A transfer will be progressive in relative terms if the proportion received
in relation to prefiscal income decreases as income rises, but the same does not hold for a per capita transfer. A transfer is globally
progressive in absolute terms if the concentration curve lies everywhere above the 45-degree line. A transfer is globally progressive
in relative terms if the concentration curve lies everywhere between the prefiscal income Lorenz curve and the 45-degree line. If
the concentration curve of a transfer crosses the 45-degree line, but still lies everywhere above the prefiscal income Lorenz curve,
it is unambiguously progressive. A tax (transfer) for which the concentration curve coincides with the Lorenz curve of prefiscal
income is neutral.
The first part of the analysis on the progressivity of single fiscal instruments reports cumulative shares of tax burdens, transfers,
and income in per capita terms. This does not match the concept of welfare measurement adopted by Statistics Mauritius; yet it
facilitates the interpretation of the findings.
Concentration coefficient: The coefficient of concentration (or quasi-Gini) is an index summarizing the concentration curve of a
tax or transfer. It ranges between −1 and 1. Concentration curves from which this measure is derived depict the cumulative
percentage of households (ranked in ascending order by market income) on the horizontal axis and the cumulative percentage of
the tax (transfer) paid (received) by each percentile.

18
Kakwani index: The Kakwani index is a commonly used measure of progressivity. For taxes, it is defined as the difference between
the concentration coefficient of the tax and the Gini for prefiscal income; for transfers, it is defined as the difference between the
Gini for prefiscal income and the concentration coefficient of the transfer. A Kakwani index for taxes will be positive (negative) if
a tax is globally progressive (regressive). A Kakwani index for transfers is positive if a transfer is progressive in relative terms.
Redistributive effect: The redistributive effect captures the marginal contribution of each fiscal instruments or the whole fiscal
system to the Gini coefficient of inequality. The marginal contribution is the difference between the Gini coefficient with and
without the tax or transfer. If positive, it captures a redistributive effect, and, so, a decline in the Gini.
Poverty reduction effect: The poverty reduction effect captures the marginal contribution of each fiscal instruments or the whole
fiscal system to a poverty indicator defined at a certain poverty line. The marginal contribution is the difference between the poverty
indicator with and without the tax or transfer. If positive, it captures a poverty reduction effect, and, so, a decline in poverty.

19
3. Taxes and Social Spending in Mauritius: A Bird’s-Eye
View
Tax revenues account for about 18.4 percent of GDP, as opposed to 25.5 percent for total government
spending. In fiscal year 2016/17, total tax revenues amounted to about MUR 84.2 billion, compared with
about MUR 115.2 billion of total government spending. In fiscal year 2016/17, tax revenues accounted for
about of 89.4 percent of total revenues, the rest being covered by social contributions (1.5 percent), other
revenues (6 percent), and capital grants (3.1 percent). General government debt stood at 68.9 percent of
GDP in 1017 and is estimated to fall to 66.7 percent in 2018. After four years of primary deficit, the year
2017 was the first with a primary surplus (0.5 percent of GDP) that turns into negative territory (−2.1
percent of GDP) because of interest paid on government debt. The total fiscal balance is estimated to have
deteriorated to −3.3 percent in 2018 and is forecast to hover around that figure in 2019.
Mauritius derives a considerable part of its tax revenues from indirect taxes. Of every dollar of tax
revenue, about 65 cents are collected through indirect taxes (Table 3.1). Indirect taxes in Mauritius account
for about 12 percent of GDP, a share roughly on par with that of other middle-income countries (Figure
3.1). VAT takes the lion’s share, at 36 percent of all tax revenues or 6.6 percent of GDP, followed by excise
duties, at 20.5 percent of tax revenues. The standard rate of VAT is 15 percent, and some goods and services
are either zero-rated or exempt. Excise taxes are applied to tobacco products, alcoholic beverages, motor
vehicles and motor cycles, petroleum products, plastic products, and other goods and services.
Table 3.1. General Government Tax Revenues in Mauritius, Fiscal Year 2016/17
Indicator MUR, millions Share of tax
revenues (%)
Share of
GDP (%)
Total tax revenues 84,148 100.0 18.4
Income tax, individuals 8,661 10.3 1.9
Income tax, companies and bodies, corporate tax 11,881 14.1 2.6
Deduction at source (tds) 1,236 1.5 0.3
Taxes on property 5,995 7.1 1.3
Value added tax 30,231 35.9 6.6
Taxes on specific goods (excise duties and environment taxes) 17,277 20.5 3.8
Taxes on specific services and gambling 3,543 4.2 0.8
License fees 2,524 3.0 0.6
Taxes on international trade and transactions 1,177 1.4 0.3
Other taxes 1,623 1.9 0.4
Source: Based on data of the Ministry of Finance and Economic Development, National Accounts, and Statistics Mauritius.
Income tax from individuals and corporate tax together account for about 24 percent of total tax
collection. In 2016/17, 58 percent of direct taxes were derived from corporate taxation and 42 from the
PIT. Direct taxes represent less than 5 percent of GDP, below the average of middle-income countries. In
Mauritius, thanks to the system of exemption thresholds and deduction allowances, only about 175,000 of
the working population of about 600,000 individuals file a tax return, and about 103,000 have a positive
taxable income, that is, pay a PIT.6 The analysis focuses on the major tax items, namely, the PIT, the VAT,
6 The Income Tax Act requires individuals earning more than MUR 300,000 a year to file an income tax return,

20
and specific excise duties on alcohol, tobacco, and fuel. Corporate taxes are not included given the difficulty
of attributing the tax burden to specific households.
Figure 3.1. Composition of Tax Revenues, Share of GDP, Mauritius and Middle-Income Countries, Circa 2017
Source: Based on data of World Revenue Longitudinal Data, International Monetary Fund.
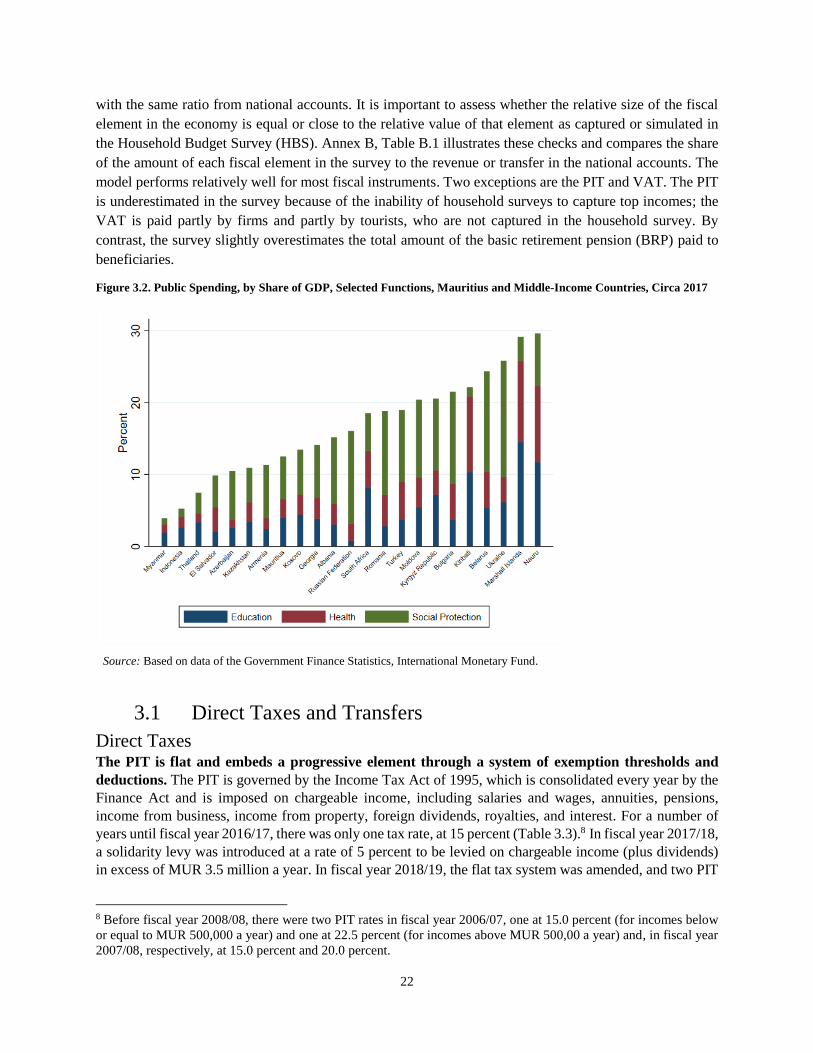
Social protection expenditure accounts for 23 percent of total government expenditure and 6 percent
of GDP, followed by education, at 4 percent of GDP. In 2016/17, about MUR 25.6 billion was devoted
to the social protection system, which consists of a number of cash transfer programs, ranging from non–
means-tested pensions to targeted interventions such as Social Aid and the recently introduced Marshal
Plan (Table 3.2). Education in Mauritius is universal and free at all grades. About 16 percent of total
government expenditures are devoted to the education system from preprimary schools to universities. The
expenditure is skewed toward primary and secondary schools, which make up over 80 percent of total
education expenditure. Compared with middle-income countries, the expenditure of the government of
Mauritius on education is only modestly below the average, whereas the amount allocated to health care
and social protection is substantially lower as a share of GDP relative to the average of middle-income
countries (Figure 3.2).
irrespective of whether they have a positive or negative taxable income. Because of the high income exemption
thresholds, many taxpayers are outside the tax net.

21
Table 3.2. General Government Spending, Mauritius, Fiscal Year 2016/17
Indicator MUR, millions Share of
total
spending
(%)
Share of
GDP (%)
Total spending 115,205 100.0 25.5
General public services 23,621 20.5 5.2
Defense - 0.0 0.0
Public order and safety 11,108 9.6 2.5
Economic affairs 17,344 15.1 3.8
Environmental protection 2,508 2.2 0.6
Housing and community amenities 2,886 2.5 0.6
Health care 11,529 10.0 2.6
Recreation, culture, and religion 1,390 1.2 0.3
Education 18,214 15.8 4.0
Social protection 26,604 23.1 5.9
Indirect subsidies
Flour 267
Rice 103
Liquified petroleum gas 108
Bus transport 1,260
Source: Based on data of Government Finance Statistics, International Monetary Fund.
In Mauritius, about 10 percent of total public expenditure and 2.6 percent of GDP are accounted for
by health care. In 2016, the lion’s share of public health expenditure was consumed by hospital services
(estimated expenditure, MUR 7.2 billion), followed by pharmaceutical products (MUR 1.0 billion), and
outpatient curative care services in primary care (MUR 673 million), while the rest was allocated to
governance and health system administration.7 However, public heath expenditure represents about 45
percent of total health expenditure, while the rest is spent in the private sector and is covered by private
insurance and out-of-pocket expenditures by households.
This fiscal incidence analysis covers over 60 percent of tax revenues and almost 50 percent of public
spending. The exercise analyzes the impacts of a large share of the direct taxes collected from individuals,
VAT, and excise taxes on the distribution of household income. These taxes contribute more than 60 percent
of the revenue side of the fiscal system. On the public expenditure side, the analysis covers social protection
spending, including noncontributory pensions, Social Aid, and other cash transfer schemes, in addition to
public spending on education and health care. This represents about 50 percent of the spending side. The
imbalance that results from covering a larger share of the revenue side is not unusual for this type of analysis
and is largely ascribable to the fact that a large part of public spending consists of public goods that cannot
easily be allocated to specific households. Taxes tend to increase poverty with respect to pretax income,
while transfers, particularly if well targeted, have a poverty reducing effect. Therefore, the imbalance in the
coverage of taxes and transfers is expected to show increasing poverty. The assumptions of the exercise are
assessed by comparing the ratio of the value of each fiscal element to total disposable income in the survey,
7 Primary care services include the prevention and treatment of common diseases and injuries, basic emergency
services, referrals to and coordination with other levels of care, primary maternity care and healthy child development,
specialized clinics, disease prevention and screening, health promotion, surveillance of communicable diseases,
reproductive health, and rehabilitation services.
22
with the same ratio from national accounts. It is important to assess whether the relative size of the fiscal
element in the economy is equal or close to the relative value of that element as captured or simulated in
the Household Budget Survey (HBS). Annex B, Table B.1 illustrates these checks and compares the share
of the amount of each fiscal element in the survey to the revenue or transfer in the national accounts. The
model performs relatively well for most fiscal instruments. Two exceptions are the PIT and VAT. The PIT
is underestimated in the survey because of the inability of household surveys to capture top incomes; the
VAT is paid partly by firms and partly by tourists, who are not captured in the household survey. By
contrast, the survey slightly overestimates the total amount of the basic retirement pension (BRP) paid to
beneficiaries.
Figure 3.2. Public Spending, by Share of GDP, Selected Functions, Mauritius and Middle-Income Countries, Circa 2017
Source: Based on data of the Government Finance Statistics, International Monetary Fund.
3.1 Direct Taxes and Transfers
Direct Taxes The PIT is flat and embeds a progressive element through a system of exemption thresholds and
deductions. The PIT is governed by the Income Tax Act of 1995, which is consolidated every year by the
Finance Act and is imposed on chargeable income, including salaries and wages, annuities, pensions,
income from business, income from property, foreign dividends, royalties, and interest. For a number of
years until fiscal year 2016/17, there was only one tax rate, at 15 percent (Table 3.3).8 In fiscal year 2017/18,
a solidarity levy was introduced at a rate of 5 percent to be levied on chargeable income (plus dividends)
in excess of MUR 3.5 million a year. In fiscal year 2018/19, the flat tax system was amended, and two PIT
8 Before fiscal year 2008/08, there were two PIT rates in fiscal year 2006/07, one at 15.0 percent (for incomes below
or equal to MUR 500,000 a year) and one at 22.5 percent (for incomes above MUR 500,00 a year) and, in fiscal year
2007/08, respectively, at 15.0 percent and 20.0 percent.

23
brackets were introduced: 10 percent on chargeable incomes up to MUR 650,000 a year and 15 percent on
incomes above that threshold. Although, for many years, PIT featured only one tax rate, an element of
progressivity was embedded in the system through exemptions and deductions. Exemptions thresholds vary
with the demographic composition of tax units, and deductions are allowed for expenditures on mortgage
interest, tuition fees for tertiary education among dependent children, medical insurance premiums, and
wages paid to household employees (introduced in fiscal year 2017/18) (Table 3.3). Exemption thresholds
and the amounts of deductions are periodically adjusted. The analysis uses the tax brackets, rates,
exemptions, and deductions as applied in fiscal year 2016/17.
Table 3.3 Personal Income Taxation Rate, Solidarity Levy Rate, and Exemption Thresholds, 2016/17 and
2017/18
Indicator FY2016/17 FY017/18
PIT 15% 15%
Solidarity Levy (over MUR 3.5 million) — 5%
Category A - individual with 0 dependents 295,000 300,000
Category B - individual with 1 dependent 405,000 410,000
Category C - individual with 2 dependents 465,000 475,000
Category D - individual with 3 or more dependents 505,000 520,000
Category E - individual with 4 or more dependents — 550,000
Category F - retired/disabled individual with 0 dependents 345,000 350,000
Category G - retired/disabled individual with 1 dependent 455,000 460,000
Source: Based on data of the Mauritius Revenue Authority.
The pension system is organized around three pillars. The zero pillar, which is a universal
noncontributory pension benefit; a mandatory first-pillar contributory system manages contributions made
by employees in private sectors; a mandatory second-pillar system, which is an individual savings account
for employees of statutory bodies and civil servants; and voluntary third-pillar schemes, such as private
occupational and personal pension plans, that vary and are discretionary. The zero pillar consists mainly of
a noncontributory benefit, the BRP, discussed in detail in Box 3.1. The first pillar is financed through the
National Pension Scheme, which provides for the payment of contributory pensions to employees in the
private sector who have contributed to the National Pensions Fund. All employees working for employers
with more than 10 employees had to join the scheme. The self-employed were also eligible to join the
scheme on a voluntary basis beginning in July 1980. Civil servants and parastatal employees are covered
by a separate scheme. Civil servants who joined before December 2012 participate in a defined benefit
scheme (the Civil Service Defined Benefit). Active employees contribute 6 percent of their earnings toward
this scheme, and the government is responsible for any deficit. The retirement age is being gradually
increased to age 65. Civil Service Defined Benefit pensions are adjusted annually the same way as civil
service salaries are adjusted. The defined benefit scheme was closed to civil servants who joined after
December 2012. New entrants are enrolled in a defined contribution system (the Civil Service Defined
Contribution) to which they contribute 6 percent of their earnings, while the government contributes 12
percent to individual pension accounts. Given that the vast majority of the system is contributory, pension
benefits are treated here as differed income and included in the calculation of prefiscal income.9 The second
pillar is based on the National Savings Fund with the objective of providing for the payment of a lump sum
to every employee upon retirement at the age of 60 or earlier, or to the beneficiary upon the death of the
9 The alternative would be to consider such pension benefits as government transfers and therefore add them to market
income at a second stage, together with other noncontributory transfers. However, this is not the case because most
pension benefits are defined contributions.

24
employee as well as setting up and implementing schemes such as loan schemes. This fund is compulsory
for all public and private sector employees.
Figure 3.3. Lorenz and Concentration Curves, by Quintile
a. Curves for direct taxes and market income b. Share of personal income tax in household market income
Source: Based on data of the 2017 Household Budget Survey, Statistics Mauritius.
Note: Market income refers to market income, plus pensions, and comprises pretax wages, salaries, income earned from capital
assets (rent, interest, or dividends), contributory pensions, and private transfers.
95 percent confidence intervals are displayed in panel b.
Employees and employers are liable to pay contributions to the social security system. Employees and
employers pay contributions to the National Pension Scheme and the National Savings Fund. In the first
case, each private sector employee ages 18–69 pays a contribution in the amount of 5 percent of the basic
salary (bonus, overtime pay, and allowances are excluded), and the employer contributes 8.5 percent.10
Different rates are applied to employees entitled to receive a pension (3 percent paid by employees and 6
percent paid by employers), as well as in the case of workers in the sugar industry (3.0 percent paid by
employees and 10.5 percent paid by employers) and household workers and agricultural workers with a
monthly remuneration below MUR 3,000 (6 percent paid by employers). Contributions to the National
Savings Fund are payable at the rate of 2.5 percent by employers (public, private, or parastatal) and 1
percent by private sector employees ages between 18 and retirement age. Civil servants pay a contribution
of 6 percent of their pensionable emoluments, and, since 2013, the government contributes 12 percent. Civil
servants ages 18–64 also contribute to a family pension scheme at the rate of 2 percent. In addition, every
private sector employer contributes 1.5 percent for employees under the National Pension Scheme and
employees ages 18–65 in the form of a training levy to support skills development.
The PIT is progressive. Direct taxes and social security contributions are reported by respondents in the
HBS and are used in the fiscal incidence analysis. As described in Box 2.1, progressivity is assessed based
on comparisons between Lorenz and concentration curves. The bottom 40 percent of the population account
for 15.9 percent of market income, but less than 1 percent of direct taxes (Figure 3.3, panel a). By contrast,
about 80 percent of the incidence is borne by the richest 10 percent of the population. On average, PITs are
virtually zero among households in the poorest quintiles (Figure 3.3, panel b), and the share increases to
10 Employees ages under 18 or those who have reached age 70 do not pay any contribution to the National Pensions
Fund.

25
2.6 percent among the richest households. This is a result of the progressivity of the tax system, which,
despite a flat tax at 15 percent, embeds exemption thresholds that vary with household composition and
deductions. The training levy and contributions to the civil service family protection scheme are progressive
and pro-poor, while contributions to pensions are slightly regressive because households at the top pay a
slightly smaller share of their prefiscal income relative to households in the middle of the distribution.
Cash Transfers The social protection system is comprehensive, and about 23 percent of total government
expenditures are allocated to it. The comprehensive social protection system consists of social assistance,
social insurance, and labor market programs. Social protection expenditure accounted for 23 percent of
total government expenditures and 6 percent of GDP in 2016/17. Noncontributory benefits include (1) basic
pensions, which cover the elderly, the handicapped, widows, and orphans, irrespective of their economic
status; (2) allowances such as social aid, food aid, and income support, unemployment hardship relief, and
the funeral grant, which are payable to the population at low incomes; and (c) inmates allowance and indoor
relief payable to Mauritians residing in government-subsidized institutions (see Box 3.1). In addition, the
enactment of the Social Integration and Empowerment Act in December 2016 introduced a targeted
antipoverty scheme, under which every adult on the Social Register of Mauritius who is living below the
absolute poverty line and has signed the Marshall Plan Social Contract is entitled to a monthly subsistence
allowance. However, the scheme had only been gradually phased in at the time of the survey; its effect is
simulated in section 5.
Social aid and basic noncontributory pensions, except for BRP, are progressive and pro-poor. The
BRP is the single most important component of the social protection system. The BRP alone contributes
about 50 percent of social protection spending. Although BRP is progressive in relative terms since it makes
up a larger share of prefiscal income among low-income households than among high-income ones, it is
not pro-poor because the per capita amount received does not decline as prefiscal income rises (Figure 3.4).
By contrast, the other basic noncontributory pensions, including the basic widow pension, the basic invalid
pension, and child and caregiver allowances, are progressive not only in relative terms, but also in absolute
terms, that is, they are pro-poor. The Social Aid Program, which is targeted at households temporarily
unable to earn a livelihood, is also progressive and pro-poor. Over 72 percent of this transfer is received by
the bottom 20 percent, and about 85 percent is absorbed by households in the bottom 40 percent of the
income distribution (the bottom 40). Other cash transfers, which include the unemployment hardship relief
and food aid, are progressive in relative terms, that is, their share in prefiscal income rise with income, but
not in absolute terms.
Box 3.1. Cash Transfer Programs
Basic Retirement Pensions
The BRP, also known as old-age pension, is payable to every Mauritian citizen ages 60 or above subject to certain residency
conditions.
Caregiver allowance
The Caregiver allowance is an additional allowance payable to old-age pensioners who
• Are totally blind
• Suffer from total paralysis
• Need the constant care of another person
Basic widow's pension
The basic widow's pension is payable to widows ages 15–59 who were married in a civil or religious ceremony.
Basic invalid's pension

26
The basic invalid’s pension is payable to any person ages 15–59 if it has been certified by a medical board that the person is
either permanently or substantially incapacitated to work 60 percent or more for at least 12 months.
basic orphan’s pension
The basic orphan’s pension is payable to all orphans ages under 15 or ages under 20 if they are in full-time education.
Guardian’s allowance
A guardian’s allowance is payable to the person looking after one or more orphans. However, only one allowance is payable per
guardian irrespective of the number of orphans under care.
Child allowance
The child allowance is payable for the children of beneficiaries of the BRP, basic widow’s pension, and basic invalid's pension in
respect of a child below age 15 or below age 20 if in full-time education. However, this allowance continues to be paid even after
discontinuation of pensions to the parents for any reason. The child allowance is payable for up to three dependent children.
Social Aid
The Social Aid is provided in cash or in kind to persons who are temporarily unable to earn an adequate livelihood and have
insufficient means to provide for themselves and their dependents. Any person is eligible who is temporarily unable to earn a living
as a result of the following:
• Any physical or mental disability
• Any sickness or accident certified by an approved medical practitioner
• Abandonment by a spouse
• Any sudden loss of employment that has lasted for not less than six months
Social Aid is complemented by the National Empowerment Foundation, which implements a number of programs, including
training, entrepreneurial support, and job search assistance, as well as an array of additional services targeted on poor households.
Income support for the purchase of rice and flour
The allowance is provided to all recipients of social aid and to beneficiaries of basic pensions through the National Pension Scheme
and their dependents if they are in low-income groups.
Inmate's allowance
The residents of government subsidized institutions are eligible for the allowance on condition that they were in receipt of a basic
pension or would have been entitled to a basic pension before their admission in such institutions.
Unemployment Hardship Relief
Unemployment Hardship Relief is payable to unemployed heads of household in which the household income is not sufficient to
meet the needs of the members.
Figure 3.4. Lorenz and Concentration Curves, Per Capita Market Income, Cash Transfers, and the Share of Cash
Transfers in Total Market Income, by Quintile
a. Lorenz and concentration curve, cash transfers and
market income
b. Share of cash transfers in household market income
Source: Based on data of the 2017 Household Budget Survey, Statistics Mauritius.
Note: Panel a: Market income refers to market income, plus pensions, and comprises pretax wages, salaries, income earned from
capital assets (rent, interest, or dividends), contributory pensions, and private transfers. (2) 95 percent confidence intervals are
displayed in panel b.

27
3.2 Indirect Taxes and Subsidies
Value Added Tax The standard VAT rate in Mauritius is 15 percent, except for zero-rated and exempt goods and
services. The standard VAT rate in Mauritius is 15 percent (VAT Tax Act 1998, as amended by the
Financial Act 2017), which is in line with the rate for personal income and business income tax. Certain
goods and services are zero-rated and others are exempt. Firms that produce or sell standard-rated or zero-
rated items are eligible for reimbursement of VAT if they have an excess credit on the VAT paid for inputs
in the production process. By contrast, firms producing or selling exempt items cannot reclaim the VAT
paid for the inputs used if they have an excess credit. However, as opposed to the case of zero-rate items,
the final consumer bears the burden on the VAT charged on previous stages of production and distribution
on exempt goods and services. In Mauritius, the main consumption items that are zero-rated are rice, wheat
flour, edible oils, milk, cream, cheese, sugar, tea, meat and fish. Among the exempt items, the most
commonly consumed are bread, cereal flours, vegetables, fruits, and eggs. VAT is regressive as its
concentration curve lies above the Lorenz curve for prefiscal income (Figure 3.5 – panel a). The bottom 40
pays about 17.2 percent of the VAT burden, compared to a share in prefiscal income of 15.7 percent. The
average share of VAT in total household prefiscal income is 32 percent, and it ranges between 42 percent
among the bottom 20 percent of households and 26 percent among those at the top (20 percent) (Figure 3.5
– panel b). This is not surprising since lower-income households typically spend a larger share of their
income on consumption relative to higher-income households. Therefore, the tax burden as a share of
income is highest for low-income households and falls as household income rises. Often times, exempting
and zero rating certain essential consumption goods that represent a larger share of the spending for lower-
income households than for higher-income households is used as a way to reduce the regressivity of VAT.
However, such preferential treatment to certain goods and/or services is not an efficient way to make VAT
less regressive because affluent households consume more of those goods than poor households do. Toder
et al (2012) show that a better approach to reduce the regressivity of VAT would be to provide a limited
cash payment, that is, a refundable tax credit or rebate, so that everyone receives the same benefit, yet this
translates into a larger share of income among low-income households.
Figure 3.5. Lorenz and concentration curves for per capita market income and VAT and share of VAT in total market
income by quintile.
a. Lorenz and concentration curve for VAT and market
income
b. Share of VAT in household market income by quintile

28
Source: Based on data of the 2017 Household Budget Survey, Statistics Mauritius.
Note: (1) Market income refers to market income plus pensions and comprises pretax wages, salaries, income earned from
capital assets (rent, interest, or dividends), contributory pensions, and private transfers. (2) 95 percent confidence intervals
displayed in panel (b).
Excise Taxes Excises on fuel, alcohol and tobacco products contribute about 80 percent of all revenues from this
tax. Excises are a type of indirect tax levied per unit of manufactured and specific imported goods.
According to data from the Mauritius Revenue Authority, excise duties on alcoholic beverages (28.4
percent), tobacco products (27.4 percent), and petroleum products (21.2 percent) account for almost 80
percent of revenues from excise taxes in fiscal year 2016/17 as well as 2017/18 (Table 3.4). The analysis
considers excise taxes on beer, wine and spirits, cigarettes and cigars, and fuel (including liquified
petroleum gas [LPG], kerosene, gasoline, and gasoil).11 The analysis captures the direct effect of excises,
in other words the effect of excises paid directly by households at the time of purchases of manufactured
and imported goods subject to such duty, as well as the indirect effects that excises on fuel can have on the
price of other products consumed by households, that is, the effect of a change in the excise levied on
gasoline on the price of bread since gasoline is used as an input in the production process of bread.12
Table 3.4: Revenues from excise tax, by item, 2016/17 and 2017/18
FY2016/17 FY2017/18 FY2016/17 FY2017/18
MUR, million Shares in total (%)
Spirits, liquors and alcoholic beverages 4,898 5,350 28.4 26.6
Tobacco products 4,735 5,333 27.4 26.5
Petroleum products 3,656 5,141 21.2 25.6
Motor vehicles & motor cycles 3,116 3,386 18.1 16.9
Plastic products 232 252 1.3 1.3
Sugar content 373 404 2.2 2.0
Miscellaneous excise 242 223 1.4 1.1
Total excise duties 17,252 20,089 100.0 100.0
Source: Based on data of the Mauritius Revenue Authority.
Excise taxes on alcohol and tobacco products are regressive. Households in the bottom 40 account for
15.7 percent of prefiscal income and 23 and 29 percent of excise taxes on alcoholic beverages and tobacco
respectively (Figure 3.6 – panel a). In the case of tobacco products, the bottom 40 bears 28 percent of total
tax burden that is as large as the contribution of households at the top 20 percent. By contrast, in the case
of excises on fuel, the bottom 40 accounts for only 15 percent of excises paid as opposed to 50 percent
among paid by household at the top 20 percent. Excises on alcohol and tobacco are globally regressive,
11 Due to issues with quantities reported, the following alcoholic beverages are excluded from the analysis: locally
bottled whisky, locally bottled wine, sparkling wine, and champagne. Expenditures on these items as a share of
prefiscal income are larger among poorer households, therefore the analysis might underestimate the regressivity of
excise taxes on alcoholic beverages. 12 The exercise does not attempt to correct for underreporting of alcohol and tobacco consumption as found by
Statistics Mauritius (2018).

29
whereas the effect of the excise tax on fuel is ambiguous since the concentration curve crosses the Lorenz
curve for prefiscal income. This is ascribable to the fact that the share of expenditures on alcohol and
tobacco products in prefiscal income is significantly larger among the poorest households and declines with
income (8.2 and 14.2 percent vs 2.7 and 2.9 percent, respectively at the bottom and at the top), whereas the
share on fuel is U-shaped: it is at 18.4 percent at the bottom, it declines to 15 percent in the second quintile
and it slowly increases with income among households in the third, fourth and fifth quintile (18.4 percent
at the bottom vs 15 percent at the top) (Figure 3.6 – panel b).13 Across the population, excise duties accounts
for between 40 percent of prefiscal income among households at the bottom 20 percent and 20 percent at
the top 20 percent.
However, increases in excise duties on alcohol and tobacco products are the most effective instrument
for reducing the negative health and economic effects associated with their consumption. It is worth
reminding the adverse economic effects of tobacco and alcohol consumption that can manifest in the
medium and long run. Such high costs on public finances might affect the assessment of progressivity of
such excise duties illustrated above. Consumption of tobacco and alcoholism are associated with shorter
life expectancy, more years of morbidity, and as a consequence higher medical cost. If the demand for
tobacco and alcoholic products is substantially elastic to price, higher taxes on tobacco, together with
smoking bans in private premises open to the public such as bars, cafés, and restaurants, have the potential
to reduce its consumption and therefore the negative economic effect on public finances. Evidence from
developing countries suggest that the aggregate net effect of an immediate reduction in income associated
with a price increase and of long-term benefits of reduced consumption can turn out to be positive
particularly among low-income households (Fuchs and Meneses 2017a; Fuchs and Meneses 2017b; Fuchs,
Del Carmen, and Kechia Mukong 2018; Fuchs, Icaza, and Paz 2019).
Figure 3.6. Lorenz and concentration curves for per capita market income and excise taxes and share of excise taxes in
total market income by quintile.
a. Lorenz and concentration curve for excise taxes and
market income
b. Share of excise taxes in household market income by
quintile
13 Excise duties on fuel includes the indirect effect of the tax on other products that use gasoil and gasoline as an
intermediate input. Considering only the direct effect of the excise on fuel, the gap between rich and poor households
in terms of excise tax paid as a share of their prefiscal income would be even larger and estimated at 9 percentage
points (11.7 percent vs 3.5 percent at the bottom).
30
Source: Based on data of the 2017 Household Budget Survey, Statistics Mauritius.
Note: (1) Market income refers to market income plus pensions and comprises pretax wages, salaries, income earned from
capital assets (rent, interest, or dividends), contributory pensions, and private transfers. (2) 95 percent confidence intervals
displayed in panel (b).
Subsidies The government subsidies consumption of rice, flour, and LPG as well as commutes by public bus.
The State Trading Corporation began its operations in 1983 and is responsible for sourcing and importation
of selected essential strategic commodities including petroleum products, LPG, long grain white rice, and
wheat flour. at its creation, the State Trading Corporation was mainly responsible for the purchase,
importation, storage, sale, and marketing of staple commodities, namely rice and flour. The retail price of
long grain white rice (also known as ration rice) is fixed by the government at MUR 5.4 per 0.5 kg. All the
wheat flour is sold at a subsidized retail price fixed of MUR 5.85 per 0.5 kg, which was recently decreased
to 4.85 for white wheat flour and MUR 4 per 0.5 kg for brown bread flour. About 80 percent of the flour is
absorbed by bakeries, while the remaining 20 percent is for household use. Since 2002, the STC has also
been charged with the importation of LPG, which is virtually all used by households a source of energy for
cooking and water-heating. The price of LPG is fixed by the government at MUR 270 per cylinder (12 kg).
In addition, the government budget allows for an annual subsidy of about MUR 1.26 billion in fiscal year
2017/18 to bus companies to provide free bus transports to senior citizens (60 years of age and above),
disabled, as well as students attending public schools.
Table 3.5: Expenditures on subsidies by item, 2017/18
Items FY2017/18 FY2017/18
MUR, millions Shares in total
Flour 409 0.32
Rice 117 0.09
Liquified petroleum gas 349 0.27
Bus transport 126,000 99.3
Total subsidies 126,875 100.0
Source: Based on data of the State Trading Corporation and Ministry of Finance and
Economic Development
All consumption subsidies are progressive and not pro-poor. All consumption subsidies are progressive
in relative terms as poorer households receive a larger share in terms of prefiscal income of rice, flour, and
LPG subsidy compared with richer households (Figure 3.7 - panel b). This is reflected by the fact that the
concentration curves are above the Lorenz curve for prefiscal income. For example, households belonging
to the bottom 40 receives over 50 percent of the rice subsidy, although they hold less than 16 percent of
prefiscal income (Figure 3.7 - panel a). And households at the top (20 percent richest) have over 50 percent
of prefiscal income and benefit from less than 20 percent of total rice subsidy. However, such subsidies are
not pro-poor as illustrated by the fact that their concentration curves does not lie everywhere above the
diagonal (Figure 3.7 - panel a). This is illustrated in Figure 3.7 - panel c by the amount of subsidy received
by households in each quintile as share of total subsidy expenditure. Except for the rice subsidy, the share
received increases with income and high-income households enjoy a larger share of the total spending on

31
consumption subsidies. For example, households in the top quintile benefit from about 21 percent of LPG
total subsidy compared with between 16.4 percent of households in the first quintile (Figure 3.7 - panel c).
Figure 3.7. Lorenz and concentration curves for per capita market income and indirect subsidies and share of indirect
subsidies in total market income by quintile.
a. Lorenz and concentration curve for indirect subsidies and
market income
b. Share of indirect subsidies in household market income by
quintile
c. Share of indirect subsidies in total subsidy spending by
quintile
Source: Based on data of the 2017 Household Budget Survey, Statistics Mauritius.
Note: (1) Market income refers to market income plus pensions and comprises pretax wages, salaries, income earned from
capital assets (rent, interest, or dividends), contributory pensions, and private transfers. (2) 95 percent confidence intervals
displayed in panel (b).
Free public bus is globally progressive and pro-poor mainly due to the high prevalence of seniors in
poorest households. Free bus transportation is progressive in relative terms as the share in terms of
prefiscal incomes is larger among households at the bottom than among households at the top (Figure 3.7 -
panel b). This is illustrated by the fact that the corresponding concentration curve lies everywhere above
the diagonal (Figure 3.7 - panel a). The bus subsidy is also pro-poor due to differences in the demographic
composition of households along the income distribution. On average, almost 6 in 10 members of
households at the bottom of the distribution benefit from free bus transport compared with 3.5 or 4 members
in households in richer quintiles. Seniors are predominantly found in low-income households: almost 2.4
in 10 members of the poorest households (bottom 20 percent) are 60 years of age or older as opposed to

32
about 1 or 1.5 in 10 among richer households (Figure 3.8). Disabled as well as students enrolled in public
(primary and secondary) schools are also concentrated in low-income households, whereas the incidence
of tertiary students is higher in households at the top of the distribution (on average 5 in 10 members are
enrolled in tertiary education as opposed to less than 1 in 10 at the bottom). Despite, the regressive sub-
component of the bus subsidy ascribable to the distribution of tertiary students across households, the
instrument remains pro-poor.
Figure 3.8. Share of beneficiaries of free bus transport by quintile of per capita market income.
Source: Based on data of the 2017 Household Budget Survey, Statistics Mauritius.
Note: Market income refers to market income plus pensions and comprises pretax wages, salaries, income earned from capital
assets (rent, interest, or dividends), contributory pensions, and private transfers.
3.3 Public Spending on Education and Health
Education Mauritius spends about 16 percent of total public expenditure and 4 percent of GDP on education,
mostly on primary and secondary education. Education in Mauritius is compulsory from age five up to
the age of sixteen and it is free of charge at all levels and grades. The education system comprises two years
at preprimary level, six at primary level with the Certificate of Primary Education (CPE), five at lower
secondary that lead to the Cambridge School Certificate (SC), and two at upper secondary (High School
Certificate – HSC). Upon completion of the HSC, students are eligible for post-secondary and tertiary
studies offered by polytechnics and tertiary education institutions. Prevocational Education was provided
in secondary schools for students that had failed the CPE examination as a second chance through a four-
year program aimed at filling their learning gap.14 As illustrated in Figure 3.9 (panel a), in 2017/18 over 50
cents on the dollar spent on education was directed to secondary education (54.8 percent), followed by
primary education that received 27 percent of public resources, tertiary (7.5 percent) and technical and
vocational education (2.9 percent).
14 With the Nine Year Continuous Basic Education (NYCBE) reform introduced in 2017 the CPE has been replaced
by the Primary School Achievement Certificate (PSAC). The last three years of basic education cover the lower
secondary cycle. At the end of grade 9, students will now take a national assessment, which marks the end of the
primary cycle before continuing with secondary education and obtaining the School Certificate (SC) at grade 11.

33
Figure 3.9. Public education expenditures by educational level and distribution of school-age kids by quintile of per capita
income.
a. Distribution of public education expenditures by
educational level, 2017/18
b. Share of children in different school age groups by
quintile of per capita market income, 2017
Source: Based on data of the 2017 Digest of Education Statistics and 2017 Household Budget Survey, Statistics Mauritius.
Note: (1) Other includes expenditure incurred by other Ministries to support education activities and training dispensed by all
Ministries/Departments in line with the concept of lifelong learning. (2) Market income refers to market income plus pensions
and comprises pretax wages, salaries, income earned from capital assets (rent, interest, or dividends), contributory pensions, and
private transfers.
Public spending on education in Mauritius does not have an ex-ante clear-cut fiscal effect for two
reasons. First, low-income households have a larger share of kids in primary (6 to 11) and secondary (12-
19) school age (Figure 3.9 – panel b). The share of primary school kids ranges from 31 percent in the bottom
20 percent to 12 percent at the top of the income distribution. Similarly, households at the top 20 percent
are home of about 12 percent of kids in secondary school age compared with 27 percent at the bottom of
the distribution. By contrast, the share of children between 20 and 24 years of age, therefore eligible to
enroll in tertiary education, are roughly equally distributed along the income distribution, with a slight peak
in the fourth quintile (23 percent). Such differences would push towards a disproportionate benefit from
public education spending for low-income households. Second, kids from low-income households are more
likely to be enrolled in public schools relative to their counterparts from affluent households, particularly
at the primary level, a fact that corroborates the first prediction (Figure 3.10 – panel a and b). Third, the
lack of substantial differences in the share of kids in tertiary education age coupled with the higher rates of
attendance in tertiary education among kids belonging to high-income households (Figure 3.10 – panel c)
push in the opposite direction.15 Although access to tertiary education in public institutions is provided free
of charge, net of registration fees, the opportunity cost in terms of foregone income flows associated with
having kids undertaking undergraduate courses might still represent a significant budget constraint among
low-income households. This means that public spending on tertiary education might favor proportionately
more high-income households.
15 Unfortunately, the HBS does not allow to separate out attendance of tertiary public and private institutions
1.7
27.0
54.8
2.9 0.97.5 5.3
Pre-primary Primary
Secondary Technical & Vocational
Special Education Needs Tertiary Education

34
Figure 3.10. School attendance rates by educational level, type of provider and quintile of per capita market income plus
pension.
a. School attendance rates – primary education b. School attendance rates – secondary education
c. School attendance rates – tertiary education
Source: Based on data of 2017 Household Budget Survey, Statistics Mauritius.
Note: (1) School attendance rates are calculated by dividing the number of students of a particular age group attending at a
certain level of education by the size of the population of that age group that officially correspond to a certain educational level.
(2) Market income refers to market income plus pensions and comprises pretax wages, salaries, income earned from capital
assets (rent, interest, or dividends), contributory pensions, and private transfers.
Overall, the benefit of public education expenditure is progressive and pro-poor. The bottom 40
captures 46 percent of total public education spending and only 16 percent of per capita prefiscal income.
This compares with only 15 percent of total public education spending and 47 percent of prefiscal income
that goes to the top 20 percent. This is ascribable to a disproportionate amount of public preprimary, primary
and secondary education spending received by the bottom 40. Low-income households receive 57, 52, and
52 percent of public preprimary, primary and secondary education spending, respectively (Figure 3.11 –
panel a). Public spending on preprimary, primary and secondary education is not only progressive in relative
terms but also in absolute terms. Public spending up to secondary education level is pro-poor as low-income
households have more kids attending public primary and secondary schools relative to more affluent
households that opt out of the public education system and therefore benefit from a per capita in-kind
transfer higher than that enjoyed by affluent households.
Public expenditure on tertiary education is progressive in relative terms but not pro-poor. Public
technical and vocational education as well as tertiary education is mainly captured by high-income

35
households (Figure 3.11 – panel a). For example, households at the top 20 percent receive almost 40 percent
of public spending on tertiary education as opposed to 19 percent of the bottom 40. Public expenditures on
technical and vocational education and on tertiary education are progressive in relative terms but are not
pro-poor. This means that high-income households are disproportionately benefiting from in-kind transfers
at high level of education relative to low-income households due to higher attendance rate of children
belonging to the richer households.
Figure 3.11. Lorenz and concentration curves for per capita market income and in-kind education transfer and share of
in-kind education transfer in total market income by quintile.
a. Lorenz and concentration curve for in-kind education
transfer and market income
b. Share of in-kind education transfer in household market
income by quintile
Source: Based on data of the 2017 Household Budget Survey, Statistics Mauritius.
Note: (1) Market income refers to market income plus pensions and comprises pretax wages, salaries, income earned from
capital assets (rent, interest, or dividends), contributory pensions, and private transfers. (2) 95 percent confidence intervals
displayed in panel (b).
Assessing the fiscal incidence of public education spending does not account for the quality of such
spending. The allocation of public education spending is based on a cost-of-production approach. Public
education spending obtained from administrative data is allocated to households captured in the HBS with
members attending public schools (and enrolled in university regardless of whether the provider is public
or private). In other words, the total cost of production is divided by the number of students attending public
schools estimated through the survey. The analysis assumes that the actual benefit received by households
equals the amount spent per capita. However, the quality of such spending, particularly the quality of
teachers and therefore of learnings, might not be the same across institutions and households’ willingness-
to-pay for public education might not be in line with public spending per student. This is a clear limitation
of the analysis.
Health Public health expenditure amounts to about 2.6 percent of GDP and 10 percent of public expenditure,
yet to only 45 percent of total health expenditure. The health care system is a mix of public and private
provision. Mauritius provides free health care provision in all government-owned health facilities. About
73 percent of the healthcare needs of the population are managed, free of user fees, at the point of use in
the public sector. The private sector to the remaining 27 percent of healthcare needs on a fee basis, either
through out-of-pocket payments or payments obtained from private health insurances. According to the

36
National Health Accounts (Ministry of Health 2017), general public expenditure on health was MUR 11.3
billion in 2016, whereas spending on health in the private sector, including out-of-pocket expenditure by
households, was estimated at almost MUR 14.0 billion. The largest share of public health expenditure is
absorbed by hospital services, with an estimated expenditure of MUR 7.2 billion in 2016, followed by MUR
1.0 billion on pharmaceutical products, and MUR 673 million on outpatient curative care services at the
primary care level (Ministry of Health 2017). In addition, some MUR 631 million were spent on governance
and health system administration. Out of pocket expenditures are spent on medication (MUR 4.0 billion),
consultation fees (MUR 2.8 billion), and private hospitals (MUR 2.1 billion) (Ministry of Health 2017).
Public health expenditure is progressive. Public spending on health is relatively well targeted not because
poorer people use health facilities more, but rather because they use public health services more than richer
people. The amount of public health expenditure in per capita terms received by households is about
constant along the distribution and this makes the concentration curve overlap with the diagonal (Figure
3.12 – panel a). The benefit enjoyed by low-income households as a share of their prefiscal income is
significantly larger compared to that received by high-income households (Figure 3.12 – panel b). This
makes the in-kind transfer globally progressive in relative terms, but not in absolute terms or pro-poor. This
is partly ascribable to larger use of public health care services at the bottom of the distribution as well as
by the larger size of households at the bottom. Households at the bottom of the prefiscal income distribution
are more likely to access public health care facilities relative to their affluent counterparts (Figure 3.12 –
panel c). About 25 percent of the population in the richest quintile report to typically use private health
services, as opposed to only between 1.5 and 7.3 percent of the population in the bottom and fourth quintile,
respectively.
Figure 3.12. Lorenz and concentration curves for per capita market income and in-kind health transfer and share of in-
kind health transfer in total market income by quintile.
a. Lorenz and concentration curve for in-kind health
transfer and market income
b. Share of in-kind health transfer in household market
income by quintile
c. Share of population that reports to typically use only
private health services by quintile

37
Source: Based on data of the 2017 Household Budget Survey, Statistics Mauritius.
Note: (1) Market income refers to market income plus pensions and comprises pretax wages, salaries, income earned from
capital assets (rent, interest, or dividends), contributory pensions, and private transfers. (2) 95 percent confidence intervals
displayed in panel (b).
However, the increase in access to private sector health care might pose financial strain on living
standards of the poorest. In 2007 private health expenditure surpassed public health expenditure and the
gap has expanded ever since. Private health expenditure is predominately out of pocket with only 3.4
percent paid for by private insurance (Nundoochan et al 2018). In addition, catastrophic heath expenditure
increased from 5.8 percent in 2001/02 to 8.8 percent in 2012.16 Households headed by a retired head and
those with at least one member aged 60 or over appear to be more likely to face catastrophic heath
expenditure However, the share of households pushed below the poverty line due to out of pocket
expenditures dropped from 0.4 percent in 2001/02 to 0.34 percent in 2012. The main driver of out of pocket
expenditures are purchases of pharmaceutical products followed by medical supplies and disposables. As
reported in Nundoochan et al (2018), many Mauritians perceive brand name medicines as more effective
than generic ones. Moreover, a survey on Medicine Prices in Mauritius finds that in the private sector the
cheapest generic medicines sale for 6 times their international price and brand medicines at nearly 20 times
their international reference prices (Nundoochan et al 2018). On average, in Mauritius brand medicines are
sold at three times the price of generic ones. Finally, use of private hospitals is largely ascribable to long
waiting time to access health care in public hospitals.
16 Catastrophic health expenditure is defined as household expenditure on health exceeding 40 percent of either total
nonfood expenditure or total expenditure minus subsistence spending, if subsistence expenditure is greater than or
equal to food expenditure. Average food expenditures of households with food shares in total expenditure from the
45th to 55th percentile was used as a proxy for subsistence food expenditure. Alternatively, under the budget share
approach, two thresholds (10 and 25 percent) of total household income are used to assess catastrophic health
expenditure.

38
Figure 3.13 Progressivity of Taxes and Transfers
Source: Based on data of the 2017 Household Budget Survey, Statistics Mauritius.
Note: Market income plus pensions comprises pretax wages, salaries, income earned from capital assets (rent, interest, or
dividends), contributory pensions, and private transfers.
To summarize, direct taxes, subsidies and transfers are progressive in relative terms, except for
indirect taxes. A common summary statistic used to measure progressivity is the Kakwani index (Kakwani
1977). In the case of taxes, the index is defined as the difference between the concentration coefficient of a
tax and the Gini for prefiscal income. If the index is positive (negative), a tax is globally progressive
(regressive). For transfers, if the difference between the Gini for prefiscal income and the concentration
coefficient of the transfer is positive (negative), the transfer is progressive (regressive) in relative terms.
Figure 3.13 provides a bird’s-eye view of the progressivity of each fiscal instrument analyzed in this study.
Direct taxes and contributions, except for contributions to pension benefits, are progressive as a larger share
is borne by richer households (purple bars). The progressivity component of the PIT lies in the system of
exemption thresholds and deductions allowances that are regularly updated. Similarly, the system of cash
transfers is overall and individually progressive (yellow bars). Social Aid stands out as the most progressive
program: about 85 percent is absorbed by households at the bottom 40. The most expensive (as a share of
budget) noncontributory transfer is the BRP. The BRP is progressive, but less progressive than Social Aid
since it is untargeted and even households at the top benefit from it. By contrast, indirect taxes, except for
the excise duty on fuel, are regressive (green bars). Among them, excises on tobacco and alcohol products,
are the most regressive because of the distributional pattern of consumption of these items. Poor and low-
income households have a larger percentage consumption of alcohol and tobacco and therefore bear the
largest share of the burden. However, this effect does not account for the long-term beneficial effect of
higher excises on alcohol and tobacco that might contribute to reduce consumption and therefore to lower
public health expenditure and to increase the number of years in good health. Indirect subsidies are
progressive, particularly the rice consumption subsidy and the subsidy to bus transport. Finally, in-kind
health and education transfers are also progressive (brown bars). However, the degree of progressivity is

39
higher for preprimary, primary and secondary education, whereas technical and vocational and tertiary
education are less so due to the large share of students that enroll at these levels and that make affluent
households benefit proportionally more from public educational expenditures at these levels.

40
4. Impact of the Net Fiscal System on Poverty and
Inequality
The previous section has investigated whether each single fiscal instrument from direct taxes to in-kind
transfer is progressive or regressive. However, as shown in Enami, Lustig, and Aranda (2018) and Enami
(2018a), a progressive fiscal instrument is not necessarily equalizing and poverty-reducing. Moreover, even
if a tax and transfer system is poverty-reducing and progressive, it can make a portion of the poor poorer
or push some nonpoor below the poverty line (Higgins and Lustig 2016). This section answers questions
regarding the redistributive (inequality) and poverty effect of each fiscal instrument individually as well as
of the net fiscal system in its complexity. To ascertain the effect of each intervention on inequality and
poverty, the analysis makes use of the marginal contribution of each intervention, which is defined as the
difference in the Gini coefficient (or poverty indicator) for an income aggregate that includes and excludes
a given intervention. If positive, it indicates a reduction in inequality (Gini coefficient) or in the poverty
headcount.
Which taxes and transfers are equalizing and/or pro-poor? Direct transfers decrease both poverty and inequality, whereas direct taxes only reduce inequality.
The poverty headcount rate measured against the national poverty line (at MUR 6,404 per day expressed in
adult equivalent) declines by 5.9 percentage points thanks to the fiscal system, in particular it goes down
by 9 percentage points with the system of direct transfers and modestly increases (by 1.6 percentage points)
due to the effect of direct taxes and contributions (Figure 4.1, purple and yellow bars, respectively). Among
cash transfers, the BRP is particularly effective in reducing poverty (-6.5 percentage points) followed by
the Basic Invalid Pension (-1.4 percentage points), whereas the effect of Social Aid is rather small (-0.3
percentage points). Among direct taxes, contributions paid to social security are moderately poverty
increasing (1.3 percentage points). The redistributive effect, captured by the change in the Gini coefficient
with and without a particular fiscal intervention, of cash transfers is sizable. The reduction in inequality is
estimated at 4.5 Gini points, with BRP alone contributing 3.1 Gini points to the decline. By contrast, direct
taxes increase inequality by 0.9 Gini point (Figure 4.2).
Indirect taxes are unequalizing in the short-term and result in sizable increase in poverty. VAT and
excise taxes exert an inequality increasing effect on the distribution of prefiscal income: inequality with
indirect taxes is 0.9 Gini points higher (Figure 4.2, green bars). The bulk of the unequalizing effect of
indirect taxes is ascribable to excise duties on tobacco and alcohol (0.5 and 0.2 Gini points), followed by
VAT (0.18 Gini points). These estimates only capture short-term effects, and excises on alcohol and tobacco
can have overall positive effect on the welfare of low-income households via lower health-related
expenditures and longer life expectancy. In addition, poverty increases by 5 percentage points due to
indirect taxes, and particularly because of VAT and excises on fuel and tobacco (Figure 4.1, brown bars).
When moving from disposable to consumable income, about 9 percent of individuals are fiscally
impoverished at the national poverty line. In other words, indirect taxes on consumption make some poor
poorer and some nonpoor poor.

41
Figure 4.1 Marginal Contribution of Taxes and Transfers to Changes in Poverty Headcount (national poverty line)
Source: Based on data of the 2017 Household Budget Survey, Statistics Mauritius.
Note: Market income plus pensions comprises pretax wages, salaries, income earned from capital assets (rent, interest, or
dividends), contributory pensions, and private transfers.
Figure 4.2 Marginal Contribution of Taxes and Transfers to Changes in Inequality (Gini coefficient)
Source: Based on data of the 2017 Household Budget Survey, Statistics Mauritius.
Note: Market income plus pensions comprises pretax wages, salaries, income earned from capital assets (rent, interest, or
dividends), contributory pensions, and private transfers.

42
Health in-kind transfers reduce poverty and inequality, the contribution of indirect subsidies is
positive yet negligible. In-kind health transfers contribute to both a considerable reduction in inequality
and poverty (Figure 4.1 and Figure 4.2, brown bars). The Gini coefficient without transfer would be 1.6
Gini points higher and the poverty headcount rate would be 3.1 percentage points higher. Although in-kind
education transfers also contribute to decrease prefiscal income inequality and poverty, the effect is rather
small with inequality decreasing by 0.7 Gini points and poverty by 1.1 percentage points. Similarly, because
of the untargeted nature, they contribute to a reduction in poverty by 0.5 percentage points (orange bars).
The equalizing effect is very modest and estimated at less than 0.3 Gini point.
Does the fiscal system reduce inequality? The net fiscal system reduces inequality. The Gini coefficient before any fiscal intervention is estimated
at 0.40 and declines to 0.31 after the combined effect of taxes, contributions, and social spending is
accounted for (Table 4.1). The largest reduction (-5.6 Gini points) in inequality takes place after the effect
of direct taxes and cash transfers is accounted for (moving from market to disposable income). This step
includes accounting for PITs and social security contributions as well as basic noncontributory pensions
and the social aid program. Indirect taxes, which comprise VAT and excise duties, together with indirect
subsidies have a minor inequality reducing effect. Moving from disposable to consumable income, the
estimated change in inequality is about -0.3 Gini point. The last step that accounts for the effect of in-kind
health and education transfers has a considerable reducing effect on inequality (-3.5 Gini points).
Table 4.1 Inequality and poverty measures, by income aggregate
Indicator Market
Income
Disposable
Income
Consumable
Income
Final
Income
Gini coefficient 0.400 0.344 0.342 0.306
National poverty line
Poverty incidence 15.1 6.2 9.2 -
Poverty gap 5.6 1.5 2.2 -
Poverty severity 3.1 0.6 0.9 -
US$4 a day 2005 PPP
Poverty incidence 6.5 1.2 1.8 -
Poverty gap 2.4 0.3 0.5 -
Poverty severity 1.3 0.1 0.2 -
Source: Based on data of the 2017 Household Budget Survey, Statistics Mauritius.
Note: Poverty rates are not calculated based on final income because households may not
be aware of the amounts spent on their behalf and may not value this spending as much
as a direct cash transfer. Hence, the analysis does not assume that this spending improves
their welfare by a corresponding amount.
The reduction in inequality associated with the net fiscal system is among the largest observed in
middle-income countries. The reduction of over 9 Gini points places Mauritius among the top 5 middle-
income countries, compared with an average reduction of -6.9 Gini points estimated in other middle-income
countries (Figure 4.3). In Argentina and South Africa, the decline in inequality estimated at -17 Gini points
when going from market income to final income is substantial. In virtually all middle and high income
countries in the CEQ database, the largest reduction in inequality is ascribable to the effect of in-kind health
and education transfers, followed by the effect of direct taxes and cash transfers. By contrast, the effect of

43
indirect taxes and indirect subsidies is only second order. With a share estimated at 57 percent, Mauritius
is among the top 5 countries in which about 50 percent of the reduction in inequality is ascribable to direct
taxes and transfers, while the average is estimated at around 35 percent. By contrast, the effect of in-kid
health and education transfers in Mauritius is estimated at about 37.5 percent of the total compared with an
average of about 60 percent in middle-income countries.
Figure 4.3 Change in inequality (Gini coefficient) from market to final income
Source: Based on data of the 2017 Household Budget Survey, Statistics Mauritius. See references for other countries.
Note: A negative sign indicates a reduction in the Gini coefficient when moving from market to final income.
Does the fiscal system reduce poverty? The headcount poverty rate declines by 6 percentage points thanks to the net fiscal system. Measured
against the 2012 relative poverty line (MUR 6,404), the fiscal system reduces poverty by almost 6
percentage points. At $4/day (2005 PPP), the overall poverty reducing effect is lower from 6.5 percent to
1.8 percent (-4.7 percentage points). Starting from a poverty headcount rate of 15.1 percent measured on
prefiscal income using the relative 2012 poverty line, direct taxes and cash transfers halve the number of
poor people to 6.2 percent (based on disposable income). The effect of indirect taxes (VAT and excise
duties) coupled with subsidies is slightly poverty increasing: +3 percentage points when measured against
the relative poverty line and +0.6 points at the $4/day line. This is ascribable to the small poverty reducing
effect of subsidies that is not sufficient to reverse the poverty increases impact of indirect taxes ascribable
to the large burden among the poor that consume larger shares of alcohol and tobacco products.

44
Figure 4.4 Change in poverty headcount from market to consumable income (PPP$4/day)
Source: Based on data of the 2017 Household Budget Survey, Statistics Mauritius. See references for other countries.
Note: A positive sign indicates a reduction in poverty headcount when moving from market to consumable income.
The substantial poverty reducing effect of the net fiscal system places Mauritius solidly among the
best performing countries. In middle and high income countries in the CEQ database, the poverty effect
of the fiscal system is in general mixed (Figure 4.4). In some countries like Ecuador, Iran, Panama, and
South Africa, the fiscal system leads to a reduction in income-based poverty headcount. In other countries
including Albania and Armenia, the estimated poverty headcount measured on an income aggregate that
accounts for the effect of the fiscal system is higher than on prefiscal income. For example, measured
against the $4 per day international line (2005 PPP), Armenia and Albania are clear examples of a poverty
increasing fiscal system: the estimated poverty headcount increases by about 7 percentage points when
moving from prefiscal to consumable income. Mauritius achieves a sizable reduction in poverty estimated
at about 4.7 percentage points (at $4/day 2005 PPP), which places the fiscal system of the country among
the most poverty reducing systems. Typically, the overall reduction in the poverty rate associated with the
fiscal system is ascribable to the positive and sizable effect of direct taxes and cash transfer programs which
the poverty increasing impact of indirect taxes and subsides. Mauritius is no exception. It is worth
mentioning that such changes in poverty do not imply that when the fiscal system as a whole reduces
poverty, there are not poor that become poorer or no nonpoor that fall below the poverty line as a
consequence of the fiscal system. It means that the number of poor based on post-fiscal income is lower
than that based on prefiscal income. In other words, the fiscal system is able to move out of poverty a larger
number of people compared to those that fall in poverty because of it. In the case of Mauritius, despite the

45
overall poverty reducing effect, because of indirect taxes about 9 percent of individuals are poor(er) than
without them.17 At the same time, about 12 percent of poor become nonpoor thanks to the effect of cash
transfers and an additional 9 percent thanks to the effect of in-kind transfers.
What is the spending effectiveness of noncontributory pensions? The inequality and poverty reducing effect obtained with the current system of noncontributory
pension could be achieved with considerably less resources. As explained in Enami (2018b), the
spending effectiveness indicator can be defined as the ratio of the minimum amount of a tax (transfer)
required to be collected (spent) to create the same inequality (or poverty) effect, if the tax (transfer) is
instead redistributed optimally. In the case of a transfer, the indicator shows how much less transfer is
required to achieve the same degree of inequality reduction if the transfer is spent in a way that maximizes
the reduction in inequality. A higher value of the indicator implies that a program is more effective in
reducing inequality.18 In the case of noncontributory pensions, the same reduction in inequality could be
achieved with considerably less resources. Precisely, the BRP achieves a reduction in inequality of about 3
Gini points and in the poverty gap, that is, the distance between income and poverty line of poor households,
of 2.8 percentage points. The same decline in the Gini index could be obtained by spending only 29 percent
of the amount currently spent and the same reduction in the poverty gap could be achieved with only 12
percent of the current BRP expenditure. Similarly, in the case of the Basic Widow Pension (plus Child
Allowance) and the Basic Invalid Pension (plus the caregiver Allowance), the same inequality reduction
and decline in the poverty gap could be obtained with 42 and 25 percent and 52 and 30 percent of the
resources that every year are directed to such programs, respectively.
What is the incidence of taxes and transfers on prefiscal income along the
distribution? The poorest derive a net benefit from the fiscal system driven by the progressive and pro-poor effect
of cash transfer programs. Direct taxes have a small impact in general on households’ prefiscal income:
the incidence ranges from less than 3 percent among the poorest to 11 percent among the most affluent
households, reflecting the progressive tax rate structure (Figure 4.5). The effect of direct transfers is highly
concentrated among the poor. The poorest households in Mauritius depend almost entirely on government
transfers through basic noncontributory pensions and Social Aid. Direct transfers change the first decile
income by 180 percent, while their effects on the second and third decile are considerably lower at 38 and
21 percent, respectively. Given lack of targeting of basic pensions, the middle class and even the richest
benefit to some extent from such transfers: the most affluent households receive on average 3.7 percent of
their prefiscal income in the forms of transfers. Indirect taxes have a sizable impact on incomes across the
distribution and particularly at the bottom. The poorest households pay on average some 28 percent of their
prefiscal income in indirect taxes as opposed to about 13-14 percent paid on average by the middle class
and the richest households. Indirect subsidies represent a very small share of households’ prefiscal income,
ranging from 6 at the bottom to about 0.2 percent at the top. Although they appear to be reaching the poorest,
also the middle class and the richest receive some of these subsidies. After direct taxes, direct transfers and
17 Higgins and Lustig (2016) propose an indicator known as “fiscal impoverishment headcount index,” which
measures the percentage of the population impoverished by the tax and transfer system as a proportion of the post-
fiscal poor. “Impoverished” households are those that were either (a) nonpoor before taxes and transfers and made
poor by the fiscal system or (b) poor before taxes and transfers and made even poorer by the fiscal system. 18 The spending effectiveness indicator can only be calculated for the taxes and transfers with a positive MC (and as
a result, the spending effectiveness of taxes on poverty reduction is undefined).

46
indirect taxes, households in the first, second, and third decile are net transfer receivers, while households
from the fourth decile to the top are net tax payers. The overall net benefit, including cash and in-kind health
and education transfers, is different. Households at the bottom 60 percent are net receivers, and the poorest
still receive the largest share in terms of their prefiscal income.
Figure 4.5. Incidence of Taxes and Transfers and Net Fiscal Benefit, by Decile of Per Adult Equivalent Market Income
Source: Based on data of the 2017 Household Budget Survey, Statistics Mauritius.
Note: Market income plus pensions comprises pretax wages, salaries, income earned from capital assets (rent, interest, or
dividends), contributory pensions, and private transfers.
-50
0
50
100
150
200
250
300
Poorest 2 3 4 5 6 7 8 9 Richest
Perc
ent
Decile of Per Adult Equivalent Market Income Plus Pensions
Direct Taxes Direct Transfers Indirect Taxes Indirect Subsidies
In-kind health In-kind education Net Cash Benefit Total Net Benefit

47
5. A Microsimulation Tool for Policy Making
The analysis of the distributional impact of taxes and social spending provides a static view of the
system as captured at the time of collection of household survey data. In the case of Mauritius, this
means taking a snapshot of the fiscal system as of 2017. However, it is possible to build a microsimulation
model that allows to assess ex-ante the distributional effect of changes in some of the parameters that
characterize the net fiscal system. This section discusses two fiscal instruments that were phased in over
the course of 2017 and therefore were not fully captured in the HBS. The first is known as the negative
income tax allowance (NIT) and the second is the empowerment scheme under the Marshall Plan Social
Contract, which is the main targeted anti-poverty program.
Table 5.1 Negative Income Tax Allowance and Monthly Salary Thresholds
Basic salary thresholds (MUR) Monthly Allowance
Less than or equal to 5000 1,000
Between 5001 and 7000 800
Between 7001 and 9000 500
Between 9001 and 9750 250
Between 9741 and 9900 100
Note: Eligibility Conditions: (i) Mauritian citizen; (ii) employee with basic salary is less than or equal to
MUR 9,900 per month, conditional on having total monthly earnings (excluding travelling) below MUR
20,000; (iii) if married, the net income of the employee’s spouse should not exceed MUR 390,000 in the
year; (iv) employee working for a minimum of 24 hours in a week over at least 3 days; (v) employee
whose employer has paid contributions on his behalf to the National Pensions Fund and the National
Savings Fund in respect of the month for which NIT is being claimed.
Figure 5.1. Implementation of the Marshall Plan Social Contract
Source: “An overview of UNDP-supported anti-poverty reforms in Mauritius”, UNDP.
Two fiscal instruments have been recently introduced: the NIT and the Marshall Plan Social
Contract. The NIT became effective on July 1, 2017 and consists of a tax credit for every employee whose
basic salary is less than or equal to MUR 9,900 per month (details are provided in Table 5.1). The Marshall
Plan Social Contract is a conditional cash transfer (CCT) type of contract designed to provide a cash

48
allowance to households identified as eligible under the Social Register of Mauritius (SRM), conditional
to: (i) education of children, (ii) economic empowerment of adults, (iii) family empowerment, and (iv)
family healthcare. Every adult on the Mauritius Social Register who has signed a Marshall Plan Social
Contract is entitled to a monthly subsistence allowance if household income falls below the poverty
thresholds identified in the 2016 Social Integration and Economic Empowerment Act (Figure 5.1 illustrates
the implementation mechanism). The absolute poverty thresholds are established at a minimum of MUR
2,720 for one adult up to a maximum threshold of MUR 9,520 for households with three adults and three
children (or more). The allowance is the difference between the poverty thresholds and household’s
verifiable income. Beneficiaries of the Marshall Plan Social Contract are also entitled to benefit from other
income support, namely the monthly child allowance, school materials, school premium, re-sit exam fees
and crèche voucher. The SRM is designed as a large database of potential and actual social welfare program
beneficiaries. It is the first effort to have a centralized database that can help manage Mauritius’ complex
social welfare system that is composed of a number of programs spread across several ministries and
institutions, featuring different eligibility thresholds based on ad hoc welfare assessments. Currently, some
11,000 households (and 40,000 individuals) are benefiting a subsistence allowance under the Marshall Plan
Social Contract; and 15,000 children attending school are benefiting from a monthly allowance for
educational purposes.
Figure 5.2. Lorenz and Concentration Curves for Per Adult Equivalent Prefiscal Market Income, Negative Income Tax
Allowance and Marshall Plan Social Contract Scheme
Source: Based on data of the 2017 Household Budget Survey, Statistics Mauritius.
The simulated impact of the NIT and the subsistence allowance provided under the Marshall Plan
Social Contract is poverty and inequality reducing. The concentration curve of the NIT indicates the
bottom 40 receives 47 percent of the allowance as opposed to less than 1 percent among households in the
top decile (Figure 5.2). The concentration curve crosses the 45-degree line from below because the poorest
households in Mauritius rarely have any working member and as such they cannot benefit from the
allowance. The Marshall Plan Social Contract provides a monthly allowance to low-income households
that appears to be well-targeted: about 94 percent of the cash transfers provided under this scheme is
absorbed by households in the bottom 20 percent of the prefiscal income distribution, and no allowance is
received by households in the top 60 percent. Both measures combined generate a more equal distribution
0
10
20
30
40
50
60
70
80
90
100
0 10 20 30 40 50 60 70 80 90 100
Cum
ula
tive s
hare
Percentile of pre-fiscal market income
Gross market income Marshall plan social contract
Negative income tax Disposable income

49
of income as illustrated by the yellow line in Figure 5.2 that is slightly shifted towards the 45-degree line
indicating perfect equality.
The microsimulation tool developed by the World Bank is a useful instrument that allows any future
policy change to be simulated by simply changing a few parameters of the fiscal system. For example,
change in the tax rates, additional income tax brackets as well as shifts in the basic salary thresholds for the
NIT or in the cash transfer amount provided under the Marshall Plan Social Contract can be easily simulated
within the model.

50
6. Conclusions and Policy Implications
The net fiscal system in Mauritius has a poverty and inequality reducing effect. The Gini index of
prefiscal income (per adult equivalent) is 40.0 and declines to 34.4 after direct taxes and cash transfers, and
further to 30.6 after indirect taxes and subsidies. The poverty headcount rate (measured against the MUR
6,404/month per adult equivalent poverty line) declines by about 5.9 percentage points from 15.1 to 9.2
percent after accounting for the effect of direct and indirect taxes and transfers. However, the effect is driven
by direct taxes and indirect transfers since indirect taxes have a poverty increasing effect. Overall,
households at the bottom 30 percent of the prefiscal income distribution are net cash transfer receivers,
while the middle class and the most affluent households are net tax payers.
The PIT is progressive and reduces inequality. Despite a flat tax rate at 15 percent, progressivity of the
PIT has been achieved through a mechanism that includes generous tax exemption thresholds and
deductions. The government has introduced an additional tax bracket (up to MUR 650,000 income is taxed
at 10 percent) since July 2018. This element introduces additional progressivity to the PIT instrument.
However, going forward it might be worth re-thinking the system of deductions and possibly replacing it
with a set of tax allowances. Tax allowances are subtracted from the amount of tax due, as opposed to tax
deductions, which are subtracted from taxable income. Therefore, tax allowances are a more equitable way
to grant discounts to taxpayers. With tax deductions, on one hand, the tax discount increases with the
marginal tax rate, hence benefiting high income individuals more than low income ones. With tax
allowances, on the other hand, the effect of the tax discount is the same for every tax payer, irrespective of
the marginal tax rate. For the same amount of tax allowance granted, individuals with a lower tax liability
would benefit more than individuals with a higher tax liability as a share of the tax due.
Noncontributory pensions, particularly the BRP, and indirect subsidies could become pro-poor if
targeted to low income households. Overall, social protection spending, with BRP alone accounting for
about 50 percent of the spending, contributes to reduce poverty and inequality with an estimated reduction
in inequality of 4.5 Gini points. However, BRP is a universal pension benefit that every Mauritian receives
from age 60. As such, BRP also reaches the most affluent households and represents an ineffective use of
public resources. Estimates indicate that the same degree of reduction in inequality and in the poverty gap
could be achieved with just 29 and 12 percent of the resources currently spent on BRP, respectively.
Similarly, subsidies on rice, flour and LPG are progressive in relative terms as they are a larger share of
prefiscal income among poorer households compared with richer households, but they are not pro-poor as
the per capita amount of such subsidies does not decline with income. Public bus subsidy is globally
progressive and pro-poor mainly due to the high prevalence of seniors in poorest households. Going
forward, the Social Register of Mauritius could help consolidate existing programs and introduce a targeted
approach to both a larger number of cash transfers program (for example, the BRP) and indirect subsidies.
The empowerment allowance recently introduced under the Marshall Plan Social Contract, which currently
reaches about 11,000 low-income households, could be an easy way to target some of the universal schemes
and ensure they only reach households that are in real need.

51
References
Enami, Ali. 2018a. “Measuring the Redistributive Impact of Taxes and Transfers in the Presence of
Reranking.” In Commitment to Equity Handbook. Estimating the Impact of Fiscal Policy on Inequality and
Poverty, edited by Nora Lustig, 116–74. New Orleans: CEQ Institute, Tulane University; Washington, DC:
Brookings Institution Press.
———. 2018b. “Measuring the Effectiveness of Taxes and Transfers in Fighting Inequality and Poverty.”
In Commitment to Equity Handbook. Estimating the Impact of Fiscal Policy on Inequality and Poverty,
edited by Nora Lustig, 207–18. New Orleans: CEQ Institute, Tulane University; Washington, DC:
Brookings Institution Press.
Enami, Ali, Nora Lustig, and Rodrigo Aranda. 2018. “Analytical Foundations: Measuring the
Redistributive Impact of Taxes and Transfers.” In Commitment to Equity Handbook. Estimating the Impact
of Fiscal Policy on Inequality and Poverty, edited by Nora Lustig, 56–115. New Orleans: CEQ Institute,
Tulane University; Washington, DC: Brookings Institution Press.
Fuchs, Alan, Giselle E. Del Carmen, and Alfred Kechia Mukong. 2018. “Long-Run Impacts of Increasing
Tobacco Taxes: Evidence from South Africa.” Policy Research Working Paper 8369, World Bank,
Washington, DC.
Fuchs, Alan, F. G. Icaza, and D. Paz. 2019. “Distributional Eefects of Tobacco Taxation. A Comparative
Analysis.” Poverty and Equity Global Practice Working Paper 196 (April).
Fuchs, Alan, and Francisco Jalles Meneses. 2017a. “Regressive or Progressive? The Effect of Tobacco
Taxes in Ukraine.” December 27, World Bank, Washington, DC.
Fuchs, Alan, and Francisco Jalles Meneses. 2017b. “Are Tobacco Taxes Really Regressive? Evidence from
Chile.” Policy Research Working Paper 7988, World Bank, Washington, DC.
Higgins, Sean, and Nora Lustig. 2016. “Can a Poverty-Reducing and Progressive Tax and Transfer System
Hurt the Poor?” Journal of Development Economics 122 (September): 63–75.
IMF (International Monetary Fund). 2019. “IMF Staff Completes 2019 Article IV Mission to Mauritius.”
Press Release 19/22, IMF, Washington, DC.
Inchauste, Gabriela, and Nora C. Lustig, eds. 2017. The Distributional Impact of Fiscal Policy: Evidence
from Eight Low- and Middle-Income Countries. Directions in Development: Poverty Series. Washington,
DC: World Bank.
Lambert, Peter J. 2001. The Distribution and Redistribution of Income, 3rd ed. Manchester: Manchester
University Press.
Lustig, Nora C., ed. 2018. Commitment to Equity Handbook. Estimating the Impact of Fiscal Policy on
Inequality and Poverty. New Orleans: CEQ Institute, Tulane University; Washington, DC: Brookings
Institution Press.
Lustig, Nora, and Sean Higgins. 2018. “The CEQ Assessment: Measuring the Impact of Fiscal Policy on
Inequality and Poverty.” In Commitment to Equity Handbook. Estimating the Impact of Fiscal Policy on

52
Inequality and Poverty, edited by Nora Lustig, 3–55. New Orleans: CEQ Institute, Tulane University;
Washington, DC: Brookings Institution Press.
Martinez-Vazquez, Jorge. 2008. “The Impact of Budgets on the Poor: Tax and Expenditure Benefit
Incidence Analysis.” In Public Finance for Poverty Reduction: Concepts and Case Studies from Africa and
Latin America, edited by Blanca Moreno-Dodson and Quentin Wodon, 113–62. Directions in
Development: Poverty Series. Washington, DC: World Bank.
Ministry of Health and Quality of Life. 2017. National Health Accounts 2017. Republic of Mauritius, Port
Louis.
Statistics Mauritius. 2018. Household Budget Survey 2017 and the Updated Consumer Price Index –
Methodological Report, Republic of Mauritius, Port Louis.
Toder, Eric, Jim Nunns, and Joseph Rosenberg 2012. “Implications of Different Bases for a VAT.”, Urban-
Brookings Tax Policy Center: Washington, DC.
UNDP (United Nations Development Programme). 2018. “An Overview of UNDP-Supported Anti-Poverty
Reforms in Mauritius.” Unpublished paper.
World Bank. 2017. “Mauritius: Addressing Inequality through More Equitable Labor Markets.” World
Bank, Washington, DC.

53
Annex A: Data Sources and Methodological Assumptions
Main Data Source The analysis makes use of data from the HBS conducted by Statistics Mauritius from January to December
2017. The 2017 HBS is the 10th HBS. The survey covers a nationally representative sample of 7,000
households, including all private noninstitutional and nonresident households in both the islands of
Mauritius and Rodrigues. The national sample comprised 2 separate samples, one of 6,520 for the island of
Mauritius and another one of 480 for Rodrigues. The sampling fraction used for Rodrigues was larger
because of the smaller number of households in the island.19
The 2017 HBS collects information on both income and consumption and is composed of the following
four modules:
(a) HBS 2 – Household schedule
(b) HBS 3 – Daily record of the household expenditure
(c) HBS 4 – Income schedule
(d) HBS 5 – Point of purchase questionnaire
Income from labor is collected at the individual level across all household members aged 16 and above who
report to be employed. Income from labor is defined as receipts (both in cash and in kind) that are regular
and recurring. Workers report income gross of taxes and social security contributions (except for the share
borne by employers) with detailed breakdown regarding regular wage and salary, overtime pay, bonuses,
allowances for employees and self-employed or income from businesses. Additional sources of income
covered by the survey are property income, transfer income, and other income such as value of goods
produced by households for their own consumption. The transfers income section is rather detailed and
allows to separately identify private and public transfers. Within the latter, the HBS allows respondents to
report the main contributory pensions and the main social protection schemes that include noncontributory
pensions (the basic retirement pension [BRP], the basic invalid’s pension, the basic widow's pension, and
so on), social aid, and other small government schemes (unemployment hardship relief, food aid, and so
on).
Consumption expenditures are captured through a 1-month long diary. The HBS expenditure data refer to
the cost of acquiring goods and services during the reference period. Consumption expenditures include (a)
value of purchases of goods and services intended for consumption by the household, (b) value of goods
and services which are either own-produced, received free or at reduced price by the household. These are
valued at prevailing market prices.
19 “For the 2017 round of HBS, the sample for island of Mauritius was further broken into a sample of 384 households
for relative development index (RDI) up to 0.67 and 6136 households for RDI greater than 0.67. This was done through
an increase in sample size (from 6,720 in 2012 to 7,000 in 2017) to cater for better poverty analysis. It is to be noted
that oversampling of low RDI did not affect the overall results of the survey, as it has been catered through the weight
done at the level of PSU. Each sample was selected through a 2-stage design with probability proportional to size. At
the first stage, Primary Sampling Units (PSUs) were selected with probability proportional to size; this was followed
by selection of households within the selected PSUs.” (Statistics Mauritius 2018).

54
Sample Selection From the full sample of 7,000 households, 12 households are dropped because are foreign households and
3 individuals are removed from the sample because they are nonrelatives. The final sample includes a total
of 6,988 households and 27,749 individuals.
Methodological Assumptions Information on direct and indirect taxes, transfers in cash and in-kind, and subsidies cannot always be
obtained directly from household budget surveys. The direct identification method makes use of
information directly from the survey. When direct identification is not possible, one can use the inference,
simulation, or imputation methods, or an alternate source of data. The methods one can use to allocate taxes
and transfers are described in detail in Lustig (2018). The method adopted for each category of taxes and
transfers are described below.
Personal Income Taxes and Social Security Contributions
The HBS provides information on PITs and social security contributions. The PIT paid through the PAYE
system for employees and through the CPS system for self-employed or small business owners is used as
reported in the survey to calculate the incidence of direct taxes and contributions. This study starts from
gross income as reported by respondents and grosses it up to account for contributions paid by employers
that are assumed to be shifted to employees as per the CEQ methodology. Consistent with other tax
incidence analyses, the assumption is that the economic burden of direct PITs is borne by the recipient of
income. The burden of payroll taxes is assumed to fall entirely on workers.
Indirect Taxes
The HBS provides detailed consumption data that allows us to estimate the burden of VAT as well as excise
duties on alcohol and tobacco products and fuel. Consumption taxes are assumed to be shifted forward to
consumers. Evasion of consumption taxes is not taken into account. The survey underestimates actual
alcohol and tobacco consumption relative to what is recorded in the National Accounts (Statistics Mauritius
2018), and no adjustment has been made. The assumption is that the extent of under-reporting is consistent
across the income distribution, that is, the survey provides the correct distribution of spending on alcohol
and tobacco, and only the expenditure amounts are underestimated.
To estimate the incidence of VAT, the statutory rate of 15 percent has been applied to all goods consumed
by households in the survey, except for exempt and zero-rated items. Retailers can claim VAT refunds for
inputs used in the production process, therefore the final burden on the consumer is simply the VAT rate at
the final point of sale. In the case of exempt goods, a final consumer pays no VAT directly. This means that
in exempt sectors, VAT only has an indirect effect on household welfare through the change in the
consumption price of an exempt good due to changes in the VAT paid on goods used as inputs, which a
producer in an exempt sector cannot reclaim. To capture this effect, this study makes use of the 2013
Input/Output table for exempt goods. In addition, the Input/Output matrix and a price shifting model are
used to estimate second round effects of indirect taxes, whereby these taxes result in higher costs in sectors
that use these goods as inputs. For VAT, the indirect effects are only considered in the case of exempt items,
since VAT refunds ensure that there is no cascading of nonexempt items.
In the case of excise duties on alcohol and tobacco products, the identification of quantities consumed in
the survey has been challenging and has led to the exclusion of a few alcohol products, namely locally
55
bottled whisky, locally bottled wine, sparkling wine, and champagne. Expenditures on these items as a
share of prefiscal income are larger among poorer households, therefore the analysis might underestimate
the regressivity of excise taxes on alcoholic beverages. In the case of the excise on fuel, in addition to the
direct effect, the study accounts for the indirect effect attributable to an increase in gasoline and gasoil price
ascribable to the excise duty on other products that use fuel as an input through the 2013 Input/Output
Matrix.
Direct Transfers
The HBS provides detailed information on the receipt of cash transfers, including noncontributory pensions
such as the BRP, Basic Widow Pension, Child allowance, Basic Invalid Pension, Carer Allowance, Social
Aid program, unemployment hardship relief, food aid. However, the HBS questionnaire was designed
between April and August 2016 and does not account for the empowerment scheme provided under the
Marshall Plan Social Contract following the promulgation of the Social Integration and Empowerment Act
in December 2016. For this reason, the fiscal incidence analysis does not account for that program and the
distributional effect of the scheme is simulated only in the last section as a part of the microsimulation tool
developed for the government.
Indirect Subsidies
In Mauritius, consumption subsidies are provided for purchase of rice, flour, and LPG. In addition, the
government provides free public transportation, through subsidies to bus companies, for all students
attending public school and senior citizens, aged 60 and above. The HBS contains detailed information
about expenditures and quantities of rice, flour and LPG that are purchased at the subsidized price. In the
case of the bus subsidies, the scaled down subsidy to bus companies has been distributed across all
households with senior citizens and students attending public schools.
Public Health and Education Expenditure
The approach to estimate the incidence of public spending on education and health followed in the study is
the so-called “benefit or expenditure incidence” or the government cost” approach. The costs per
beneficiary obtained from administrative fiscal data (disaggregated by island and type of service) are used
as the measure of total benefits. This approach is also known as the classic or nonbehavioral approach, and
it amounts to asking the following question: how much would the income of a household have to be
increased if it had to pay for the free or subsidized public service at the full cost to the government? Total
health and education expenditure are then scaled down since such method would overestimate the
redistributive effect, as the monetary value of the transfers received by households is obtained from the
budgetary cost of providing these transfers as reported in national accounts, while the totals of other taxes
and transfers are not “forced” to be equal to the values in national accounts and are typically smaller
according to the survey. In the case of health expenditures, the study adopts the actual consumption
approach by distributing the benefit across all households that do not report to typically use private health
care services. A sensitivity test based on reported information about purchase of a private health insurance
leads to similar estimates. In the case of education expenditures, the HBS provides information on school
attendance by level and type, public versus private institutions, up to secondary education. Therefore, scaled
down public preprimary, primary and secondary education expenditure has been distributed across
households with children attending public schools. For tertiary education, public expenditure has been
distributed across all households with children attending university.

Annex B: Additional Administrative Data
Table B.1. Macrovalidation: Model Using National Accounts and the 2017 HBS
Fiscal Instrument
National Accounts
2017* (MUR,
million)
HBS 2017
(MUR, million)
Total amount from
HBS
Total amount from
NA
Total amount from
HBS
Total amount from
NA
Disposable income
from NA
Disposable income
from HBS
Total Household Disposable Income 334,208 193,191 57.8
Direct Taxes and Contributions
Personal Income Tax 9,020 3,096 34.3 2.7 1.6
Social Security Contributions* 5,403 1,560 28.9 1.6 0.8
All direct taxes and contributions 14,423 4,656 32.3 4.3 2.4
Indirect Taxes
VAT 30,834 7,526 24.4 9.2 3.9
Excise fuel 4,399 1,812 41.2 1.3 0.9
Excise alcohol 5,124 1,120 21.9 1.5 0.6
Excise tobacco products 5,034 1,404 27.9 1.5 0.7
Total Excises 14,557 11,171 76.7 4.4 5.8
Total Indirect Taxes 45,390 18,697 41.2 13.6 9.7
All Taxes and Contributions 59,813 23,353 39.0 17.9 12.1
Social Protection Spending (excluding contributory pensions)
BRP 15,046 16,560 110.1 4.5 8.6
Basic widow's pension/child allowance 1,652 1,536 93.0 0.5 0.8
Basic invalid’s pension/caregiver allowance 2,177 1,968 90.4 0.7 1.0
Social Aid 909 335 36.8 0.3 0.2
Other transfers 1,570 774 49.3 0.5 0.4

57
Total Social Protection Spending 21,354 21,173 99.2 6.4 11.0
0.0
Indirect subsidies
Subsidy - Rice 110 51 46.5 0.0 0.0
Subsidy - Flour 337 16 4.7 0.1 0.0
Subsidy - LPG 229 68 29.9 0.1 0.0
Subsidy - Bus 1,260 728 57.8 0.4 0.4
Total Indirect subsidies 1,936 864 44.6 0.6 0.4
Social Spending - Health & Education
Health 10,879 7,164 65.9 3.3 3.7
Education 15,327 8,844 57.7 4.6 4.6
Total Social Spending (Health & Education) 26,206 16,008 61.1 7.8 8.3
Total Social Spending (excluding contributory pensions) 49,495 38,044 76.9 14.8 19.7
Source: Based on data of National Accounts, Mauritius Revenue Authority and the World Bank BOOST Initiative for Mauritius, and of the 2017 Household Budget Survey, Statistics
Mauritius.
Note: Figures are obtained as averages of values for FY2016/17 and FY2017/18, except for items noted by subsidy to bus companies that is for FY17/18. Social security contributions
from NA excludes CSPS and FPS contributions, and figures from the HBS only include employees’ contributions to the National Pensions Fund.

Table B 2. Personal Income Tax Deductions
Deductions 2016/17 2017/18
interest on mortgage loans full full
tertiary education tuition fee exemption per dependent children (max
3)
135,000 135,000
lump sum received as commutation of pension or retiring allowance 2mln 2mln
relief for healthy/medical insurance premium
category A
category E/F
up to 12,000 up to 15,000
relief for healthy/medical insurance premium
category B
category F/G
up to 12,000
for self and 1st dependent
up to 15,000
for self and 1st dependent
relief for healthy/medical insurance premium
category D
category E
up to 12,000
for self and 1st dependent
+
6,000 for 2nd and 3rd
dependent
up to 15,000
for self and 1st dependent
+
10,000 for 2nd and 3rd
dependent
relief for wages paid during a year to household employees N/A up to 30,000
Source: Mauritius Revenue Authority.

59
Table B 3. Contributions rate to National Pension Fund, National Saving Fund, and Training Levy
Insured person Employee
share
Employer
share
Government
share
Every prescribed employee in the Sugar Industry 3% 10.5% -
Every other prescribed employee (higher rate) 5% 8.5% -
An employee in domestic service or an agricultural worker whose
remuneration from all his employers does not exceed MUR 3,000, is not
required to pay the employee share of contribution which will be paid by
the government.
- 6% 3%
Every other employee other than a public officer or an employee entitled to
pension under pension law
3% 6% -
Every self-employed or nonemployed or prescribed person approved by
Minister may contribute in multiples of MUR 5 not below MUR 170 and
not exceeding MUR 990 for a month
- - -
National Savings Fund 1% 2.5%
Training Levy (except for household worker) 1.5%
Source: Mauritius Revenue Authority.
Table B 4. Insurable salary thresholds (MUR)
Pay period INSURABLE SALARY (Effective as from 01
July 2018)
MINIMUM WAGE MAXIMUM
WAGE Private
Household
employees
(only)
Employees in
other sectors
Daily 65 103 672
Weekly 391 618 4,032
Fortnightly 782 1,237 8,063
Half Monthly 848 1,340 8,735
Monthly 1,695 2,680 17,470
Source: Mauritius Revenue Authority.
Note: The National Pensions Fund and National Savings Fund are payable at the prescribed rate on an employee’s basic
wage/salary. Basic wage/salary includes yearly salary compensation but excludes bonus and any other allowance paid in cash or
given to the employee in kind. Training Levy is also applicable on the basic wage/salary of an employee. However, the above
ceilings do not apply and the employer is required to calculate the levy payable on the full basic wage/salary payable.

60
Table B 5. National Pension Fund contributions payable in respect of employees having attained retirement age
Details Contribution Payable
Employee has reached retirement age and is not in receipt of
Contributory Retirement Pension (CRP).
National Pensions Fund contributions (both
employer & employee shares) are payable in
respect of that employee until he/she elects to
receive his Contributory Retirement Pension
(CRP) or reaches final retirement age, whichever
is the earlier.
Employee has reached retirement age and receives Contributory
Retirement Pension
The National Pensions Fund contribution
(employer share only) is payable in respect of that
employee until he ceases to be employed or he
reaches final retirement age, whichever is the
earlier.
Employee has reached Final Retirement Age No National Pensions Fund contribution is
payable in respect of an employee who has
attained final retirement age.
Source: Mauritius Revenue Authority.
Note: (i) No National Savings Fund contributions are payable in respect of an employee who has reached retirement age whether
or not the employee receives Contributory Retirement Pension. (ii) No Training Levy is payable in respect of an employee after he
has attained final retirement age. Where an employee has not reached final retirement age, Training Levy is payable whether or not
the employee receives Contributory Retirement Pension.
Table B 6. Absolute poverty thresholds - Marshall Plan Social Contract
Equivalent adults in household (Adult) Monthly threshold (MUR)
One adult 2,720
One adult and one child 4,080
One adult and two children 5,440
One adult and three children 6,800
Two adults 5,440
Two adults and one child 6,800
Two adults and two children 8,160
Three adults and three children 9,520
Three adults 8,190
Three adults and one child 9,520
Three adults and two children 9,520
Three adults and three children 9,520
Source: Social Integration and Empowerment Act, 2016.