Embed Size (px)
Citation preview
1
A. Papakonstantinou
The Effects of Supply Chain Sustainability
Criteria on Selecting the Optimal Package
Design

2
3
The Effects of Supply Chain Sustainability
Criteria on Selecting the Optimal Package
Design
By
A. Papakonstantinou
in partial fulfilment of the requirements for the degree of
Master of Science
in Management of Technology
at the Delft University of Technology,
to be defended publicly on Friday August 25, 2017 at 10:00 AM.
Supervisor: Dr. J. Rezaei
Thesis committee: Prof. dr. L. Tavasszy, TU Delft
Dr. U. Pesch, TU Delft
Dr. A. Kana, TU Delft
This thesis is confidential and cannot be made public until August 24, 2018.
An electronic version of this thesis is available at http://repository.tudelft.nl/.

4
5
Abstract
In the packaging industry, there are certain criteria that characterize whether a package is sustainable or not.
Thus, the design of the product is decided by satisfying the aforementioned criteria. However, when the whole
supply chain is under study, the process is not so straightforward and the related science field is Sustainable
Supply Chain Management (SSCM). In this master thesis the effects of the food industry specific supply chain
sustainability criteria on the package design will be investigated. With a thorough literature review those criteria
are going to be identified, while with interviews data about the current package alternatives of certain products
will be collected. With these inputs a Multi Criteria Decision Making (MCDM) problem is formulated and will
be solved with the use of the Best-Worst Method (BWM). On the one hand, the BWM achieves the ranking of
the supply chain sustainability criteria by estimating their respective weights and on the other hand the selection
of the optimal design among the alternatives. The implementation of the analysis took place for three selected
products of the Kraft Heinz Company; the Heinz Tomato Ketchup, the Heinz Seriously Good Mayonnaise and
the Heinz Beans. The preferences of the supply chain members of these selected products were documented and
the optimal package designs were selected. It has to be underlined that equal importance was given to the
weights of the six different supply chain members and the three dimensions of sustainability. The dispenser
Sauce – O – Mat was selected as optimal for the sauces, while the Can for the beans. It was proved through
what-if scenarios that modifying the weights that that decision-maker assigns to the preferences of the supply
chain members and the importance of the dimensions of sustainability has an effect on the selection of the
optimal design. In the end, a decision-making tool was created that improves the selection process of package
alternatives in the food packaging industry.
Keywords: Sustainability, Sustainable Supply Chain Management, Sustainable Packaging, Food Packaging
Industry, Multi Criteria Decision-Making, Best-Worst Method
6
Acknowledgements
I would not have made it this far if I did not have the restless support of certain individuals. Starting from the
academia, I would like to thank the members of my graduation committee, Professor Tavasszy, Dr. Rezaei, Dr.
Pesch and Dr. Kana, for their precious guidance, recommendations and feedback. Their influence in the
trajectory of this thesis was striking. Furthermore, I would also like express my gratitude to the members of the
jury that awarded me with the scholarship of “SVM Packaging and the Environment” and also to the members
of Delft University Fund and of Stichting Verpakking en Milieu for their financial support. Moving on to the
industry, I would like to thank the Head of Packaging Europe, Mr. Guus Lueb, and the rest of the managers of
Kraft Heinz Company for their participation and cooperation in the research design. Without their inputs and
experience, a real life business problem in the food packaging industry could not have been approached and
solved.
There were also certain individuals outside the academia and industry that had significant influence in the
completion of this thesis. I would like to thank my father Chris, my mother Rania and my brother Kostas for the
love, care and support that they have showed me all these years. I would also like to specially thank my
girlfriend Maria for the love, support, patience and understanding that she showed me during these last stressful
months. These last months were also made great by the lovely group of friends that I have made in TU Delft;
Zeynep, Anthi, Panos, Darija, Anne and Makis, with whom I shared all these wonderful and memorable
experiences and with whom I wish to continue sharing my life events no matter the country that each one will be
living in. Lastly, I could never forget to mention my childhood friends from Athens who have been with me
since the very beginning; Artemis, Jim and John.
7
Contents Executive Summary .............................................................................................................................................. 13
1 Introduction ......................................................................................................................................................... 17
1.1 Problem Statement ...................................................................................................................................... 18
1.2 Research Objective ..................................................................................................................................... 19
1.3 Research Questions .................................................................................................................................... 20
1.4 Relevance to Management of Technology and Innovation ......................................................................... 20
1.5 Structure ...................................................................................................................................................... 22
2 Literature Review ............................................................................................................................................... 25
2.1 Basic Definitions .......................................................................................................................................... 26
2.2 Importance of Research and the Concept Map .......................................................................................... 27
2.3 The Four Pillars of Literature Review .......................................................................................................... 29
2.3.1 The Value of Sustainability ................................................................................................................... 29
2.3.2 Sustainable Supply Chain Management Findings and Definitions ...................................................... 30
2.3.3 Sustainable Packaging and Packaging Trends.................................................................................... 33
2.3.4 Food Packaging Industry ...................................................................................................................... 36
2.4 Integration of the Four Pillars and the Knowledge Gap .............................................................................. 39
2.5 Sustainable Packaging Criteria Selection ................................................................................................... 42
2.5.1 Methodology for Selecting the Sustainable Packaging Criteria ........................................................... 43
2.5.2 Environmental performance ................................................................................................................. 45
2.5.3 Economic performance ........................................................................................................................ 51
2.5.4 Social performance .............................................................................................................................. 56
2.5.5 Conceptual Framework ........................................................................................................................ 60
3 Methodology ....................................................................................................................................................... 65
3.1 Analysis of the Problem ............................................................................................................................... 65
3.2 Multi-Criteria Decision - Making Methods ................................................................................................... 66
3.2.1 Best-Worst Method ............................................................................................................................... 66
3.2.2 Method selection and the Roadmap Design ........................................................................................ 69
3.3 Research Design ......................................................................................................................................... 71
3.3.1 The Kraft Heinz Company .................................................................................................................... 71
3.3.2 Selection of Criteria .............................................................................................................................. 72
3.3.3 Selection of Total Products and Identification of Package alternatives ............................................... 73
3.3.4 Identification of Supply Chain Members - Calculation of Criteria Weights ........................................... 73
3.3.5 Assigning Scores to Package Alternatives ........................................................................................... 74
8
4 Analysis .............................................................................................................................................................. 75
4.1 Data Analysis Framework ........................................................................................................................... 75
4.2 Criteria Selection for the Application of BWM ............................................................................................. 77
4.3 Selection of Total Products and Alternative Package Designs ................................................................... 78
4.4 Calculation of Criteria Weights along the Supply Chain Members ............................................................. 79
4.4.1 Raw Material Suppliers ........................................................................................................................ 80
4.4.2 Packaging Material Suppliers ............................................................................................................... 82
4.4.3 Total Product Manufacturer .................................................................................................................. 84
4.4.4 Customers ............................................................................................................................................ 86
4.4.5 Consumers ........................................................................................................................................... 88
4.4.6 End-of-Life Companies ......................................................................................................................... 90
4.5 Calculation of criteria weights along the TBL .............................................................................................. 92
4.6 Scores of Alternative Package Designs ...................................................................................................... 94
4.7 Selection of the Optimal Package Designs ................................................................................................. 95
5 Results and Discussion ...................................................................................................................................... 99
5.1 Remarks on Creation of the Sustainable Packaging Criteria List ............................................................... 99
5.2 Criteria Weights along the Supply Chain Members .................................................................................. 101
5.3 Effects of Dimension Weights on Selection Process ................................................................................ 102
5.4 Effects of Preference Weights on Selection Process ................................................................................ 106
6 Conclusion ........................................................................................................................................................ 109
6.1 Answering the Research Questions .......................................................................................................... 109
6.2 Thesis Contribution ................................................................................................................................... 111
6.3 Practical Recommendations ..................................................................................................................... 112
6.4 Reflection .................................................................................................................................................. 114
6.5 Future Work ............................................................................................................................................... 115
Bibliography ......................................................................................................................................................... 117
Appendix.............................................................................................................................................................. 123
I. Reducing the Number of Criteria .................................................................................................................. 123
II. Total Products and the Package Alternatives ............................................................................................. 126
III. Example of BWM Survey ........................................................................................................................... 128
IV. Sustainable Packaging Criteria Definitions ................................................................................................ 129
V. Detailed Tables of Criteria Weights ............................................................................................................ 132
VI. Assigning Scores to Package Alternatives ................................................................................................ 138
VII. Final Scores of Package Alternatives ....................................................................................................... 140
VIII. Decision-Maker Scenario ......................................................................................................................... 141
9
Table of Figures Figure 1: The three dimensions of sustainability (Carter & Rogers, 2008) ........................................................... 26
Figure 2: Main Goal and Scope of the thesis ........................................................................................................ 28
Figure 3: Thesis Concept Map .............................................................................................................................. 28
Figure 4: Packaging Value Chain (EY, 2013) ....................................................................................................... 34
Figure 5: Packaging Material Flows and Key Players in the Supply Chain (SPC, 2006) ..................................... 35
Figure 6: SSCM Framework (Carter & Rogers, 2008) .......................................................................................... 40
Figure 7: Framework for guiding approach to design sustainable food packaging (Grönman, et al., 2013) ........ 41
Figure 8: The members in the supply chain of the decision-maker ...................................................................... 42
Figure 9: Conceptual Framework Development Process ..................................................................................... 45
Figure 10: The Sustainable Packaging Criteria among the TBL of Sustainability ................................................ 62
Figure 11: Conceptual Framework of the Food Packaging Industry ..................................................................... 63
Figure 12: Research Design Roadmap ................................................................................................................. 70
Figure 13: Best-Worst Method Implementation Framework ................................................................................. 76
Figure 14: Calculating Horizontally and Vertically the Criteria Weights ................................................................ 77
Figure 15: Raw Material Suppliers Environmental Criteria Weights ..................................................................... 81
Figure 16: Raw Material Suppliers Economic Criteria Weights ............................................................................ 81
Figure 17: Raw Material Suppliers Social Criteria Weights .................................................................................. 82
Figure 18: Packaging Material Suppliers Environmental Criteria Weights ........................................................... 83
Figure 19: Packaging Material Suppliers Economic Criteria Weights ................................................................... 83
Figure 20: Packaging Material Suppliers Social Criteria Weights ......................................................................... 84
Figure 21: Total Product Manufacturer Environmental Criteria Weights .............................................................. 85
Figure 22: Total Product Manufacturer Economic Criteria Weights ...................................................................... 85
Figure 23: Total Product Manufacturer Social Criteria Weights ............................................................................ 86
Figure 24: Customer Environmental Criteria Weights ........................................................................................... 87
Figure 25: Customer Economic Criteria Weights .................................................................................................. 87
Figure 26: Customer Social Criteria Weights ........................................................................................................ 88
Figure 27: Consumers Environmental Criteria Weights ........................................................................................ 89
Figure 28: Consumers Economic Criteria Weights ............................................................................................... 89
Figure 29: Consumers Social Criteria Weights ..................................................................................................... 90
Figure 30: End of Life Companies Environmental Criteria Weights ...................................................................... 91
Figure 31: End of Life Companies Economic Criteria Weights ............................................................................. 91
Figure 32: End of Life Companies Social Criteria Weights ................................................................................... 92
Figure 33: Supply Chain Environmental Criteria Weights ..................................................................................... 93
Figure 34: Supply Chain Environmental Criteria Weights ..................................................................................... 93
Figure 35: Supply Chain Social Criteria Weights .................................................................................................. 94
Figure 36: Final Scores for the Alternative Package Designs of Heinz Tomato Ketchup ..................................... 96
10
Figure 37: Final Scores for the Alternative Package Designs of Heinz Seriously Good Mayonnaise .................. 96
Figure 38: Final Scores for the Alternative Package Designs of Heinz Beans ..................................................... 97
Figure 39: Pyramid Chart for the prevailing alternatives of Ketchup................................................................... 103
Figure 40: Sensitivity Analysis for Ketchup between Environmental and Economic Performance .................... 104
Figure 41: Sensitivity Analysis for Ketchup between Environmental and Social Performance .......................... 104
Figure 42: Sensitivity Analysis for Ketchup between Economic and Social Performance .................................. 104
Figure 43: Pyramid Chart for the prevailing alternatives of Ketchup................................................................... 105
Figure 44: Pyramid Chart for the prevailing alternatives of Beans...................................................................... 106
Figure 45: Final Scenario Scores for the Alternative Package Designs of Heinz Tomato Ketchup ................... 107
Figure 46: Final Scenario Scores for the Alternative Package Designs of Heinz Mayonnaise .......................... 107
Figure 47: Final Scenario Scores for the Alternative Package Designs of Heinz Beans .................................... 108
Figure 48: Heinz Ketchup smaller-sized SOM Dispenser design suggestion ..................................................... 114
Figure 49: Heinz Tomato Ketchup Alternative Package Designs ....................................................................... 126
Figure 50: Heinz Seriously Good Mayonnaise Alternative Package Designs .................................................... 127
Figure 51: Heinz Beans Alternative Package Designs ....................................................................................... 127
Figure 52: Extract from the online BWM survey regarding the criteria in the environmental dimension of
sustainability ........................................................................................................................................................ 128
Figure 53: Scale that was used for the BWM surveys ........................................................................................ 128

11
Table of Tables Table 1: Drivers towards sustainable practices (Tay, Rahman, Aziz, & Sidek, 2015) .......................................... 30
Table 2: Barriers towards sustainable practices (Tay, Rahman, Aziz, & Sidek, 2015) ......................................... 31
Table 3: Factors in the internal organizational environment ................................................................................. 33
Table 4: Sustainable Packaging Criteria (GreenBlue, 2011) (Lewis, Fitzpatrick, Sonneveld, & Jordon, 2007) ... 35
Table 5: Full matrix of sustainability indicators in the US food system (Heller & Keoleian, 2003) ........................ 38
Table 6: Sustainable Packaging Criteria concerning Environmental Performance .............................................. 50
Table 7: Sustainable Packaging Criteria concerning Economic Performance ...................................................... 56
Table 8: Sustainable Packaging Criteria concerning Social Performance ............................................................ 60
Table 9: Final Sustainable Packaging Criteria for the Application of BWM .......................................................... 78
Table 10: Grading the sustainable packaging criteria regarding their environmental performance ................... 123
Table 11: Grading the sustainable packaging criteria regarding their economic performance ........................... 124
Table 12: Grading the sustainable packaging criteria regarding their social performance ................................. 125
Table 13: Detailed Criteria Weights for the Raw Material Suppliers ................................................................... 132
Table 14: Detailed Criteria Weights for the Packaging Material Suppliers ......................................................... 133
Table 15: Detailed Criteria Weights for the Total Product Manufacturer ............................................................ 133
Table 16: Detailed Criteria Weights for the Customers ....................................................................................... 134
Table 17: Detailed Criteria Weights for the Consumers – Environmental Dimension ........................................ 134
Table 18: Detailed Criteria Weights for the Consumers – Economic Dimension ................................................ 135
Table 19: Detailed Criteria Weights for the Consumers – Social Dimension ...................................................... 136
Table 20: Detailed Criteria Weights for the End of Life Companies.................................................................... 136
Table 21: Detailed Final Criteria Weights for the Supply Chain Members .......................................................... 137
Table 22: Package Alternatives Scores for Heinz Tomato Ketchup ................................................................... 138
Table 23: Package Alternatives Scores for Heinz Seriously Good Mayonnaise ................................................ 138
Table 24: Package Alternatives Scores for Heinz Beans ................................................................................... 139
Table 25: Final Scores of Package Alternatives ................................................................................................. 140
Table 26: What-if Scenario Final Criteria Weights .............................................................................................. 141
Table 27: What-if Scenario Final Scores of Package Alternatives...................................................................... 141

12
13
Executive Summary
The main axis of this thesis is enhancing sustainable development in the food packaging industry. This objective
is achieved by creating a decision-making tool that improves the selection process among alternative package
designs. The rising environmental concerns of consumers have brought the value of sustainability to the
forefront of the corporate agenda. The perspective of Triple Bottom Line (TBL) claims that sustainable
development has three dimensions, an economic, an environmental and a social one. Enterprises regard the
economic performance of sustainability as the most important of the three, since it can be argued that without
economic success, no supply chain will exist in the long run (Seuring & Müller, 2008a). Without the economic
payback, packaging developers will need to somehow be able to convince top management of the benefits of the
other two sustainability performances. However, a study conducted earlier this year revealed that a third of the
consumers are buying brands based on their social and environmental impact (Unilever, 2017). In this thesis the
three dimensions of sustainability are incorporated in the selection process by having equal importance.
In recent years the focus of research in sustainability has shifted from the corporate level to that of the whole
supply chain (Tay, et al., 2015). This is the reason why the assessment of a product‟s design should not be
according to product or company specific sustainability criteria, but rather according to criteria that ensure the
sustainability of the whole supply chain. The criteria according to which a product is characterized as
sustainable have already been documented. It is an undeniable fact that the package design could be chosen
according to these aforementioned criteria. However, these criteria are product or company specific and do not
ensure the sustainability of the whole supply chain. For this reason, in this thesis the preferences of all members
in the supply chain are taken into account with equal importance in the selection process.
The packaging level under study is the primary or consumer packaging. Even though the main task of packaging
is to protect and distribute the right product to the right end-user in a safe, cost-efficient and user-friendly way, it
is often regarded as a burden for the environment. However, several assessments of this kind have indicated that
the environmental impacts of packaging are relatively small compared to the environmental impacts of the
packed food products that they contain (Grönman, et al., 2013). The most severe environmental consequences of
packed foods are attributed to food losses and are mainly caused by overproduction and excess portion
quantities. The challenge in selecting the optimal package design is finding the perfect balance between the
product and the packaging. As a result, in this thesis, the total product perspective is adopted, or in other words,
product-package combinations are studied instead of solely the packages.
Through literature review a sustainable packaging criteria list was created from scratch. This list contains 32
criteria, which span across the TBL of sustainability, covering the whole supply chain and referring to the total
14
product perspective. A conceptual framework of the food packaging industry was also created depicting the
internal and external environment of the total product manufacturer. Next, specific product-package
combinations of the Kraft Heinz Company were selected and the various package alternatives were identified.
These products were the Heinz Tomato Ketchup, the Heinz Seriously Good Mayonnaise and the Heinz Beans.
The selection process of the alternatives can be approached by solving a Multi-Criteria Decision-Making
(MCDM) problem. By incorporating the TBL the problem becomes multi-dimensional, while by incorporating
the various supply chain members it also becomes a multi-actor problem. The MCDM method that was selected
for solving the problem at hand was the Best-Worst Method (BWM) developed by Dr. J. Rezaei. This method
achieves the estimation of the relative weights of the criteria that each supply chain member assigns. After the
decision-maker assigns scores to the package alternatives by describing their performance regarding each
criterion, the optimal package design can be selected.
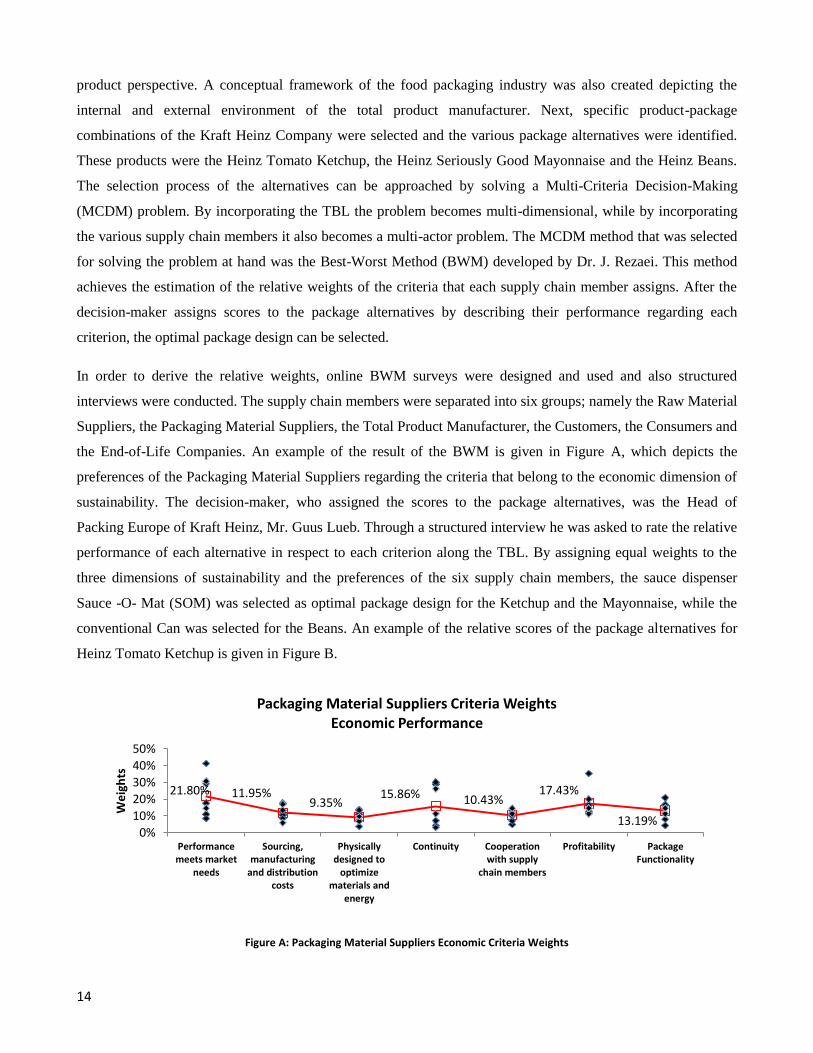
In order to derive the relative weights, online BWM surveys were designed and used and also structured
interviews were conducted. The supply chain members were separated into six groups; namely the Raw Material
Suppliers, the Packaging Material Suppliers, the Total Product Manufacturer, the Customers, the Consumers and
the End-of-Life Companies. An example of the result of the BWM is given in Figure A, which depicts the
preferences of the Packaging Material Suppliers regarding the criteria that belong to the economic dimension of
sustainability. The decision-maker, who assigned the scores to the package alternatives, was the Head of
Packing Europe of Kraft Heinz, Mr. Guus Lueb. Through a structured interview he was asked to rate the relative
performance of each alternative in respect to each criterion along the TBL. By assigning equal weights to the
three dimensions of sustainability and the preferences of the six supply chain members, the sauce dispenser
Sauce -O- Mat (SOM) was selected as optimal package design for the Ketchup and the Mayonnaise, while the
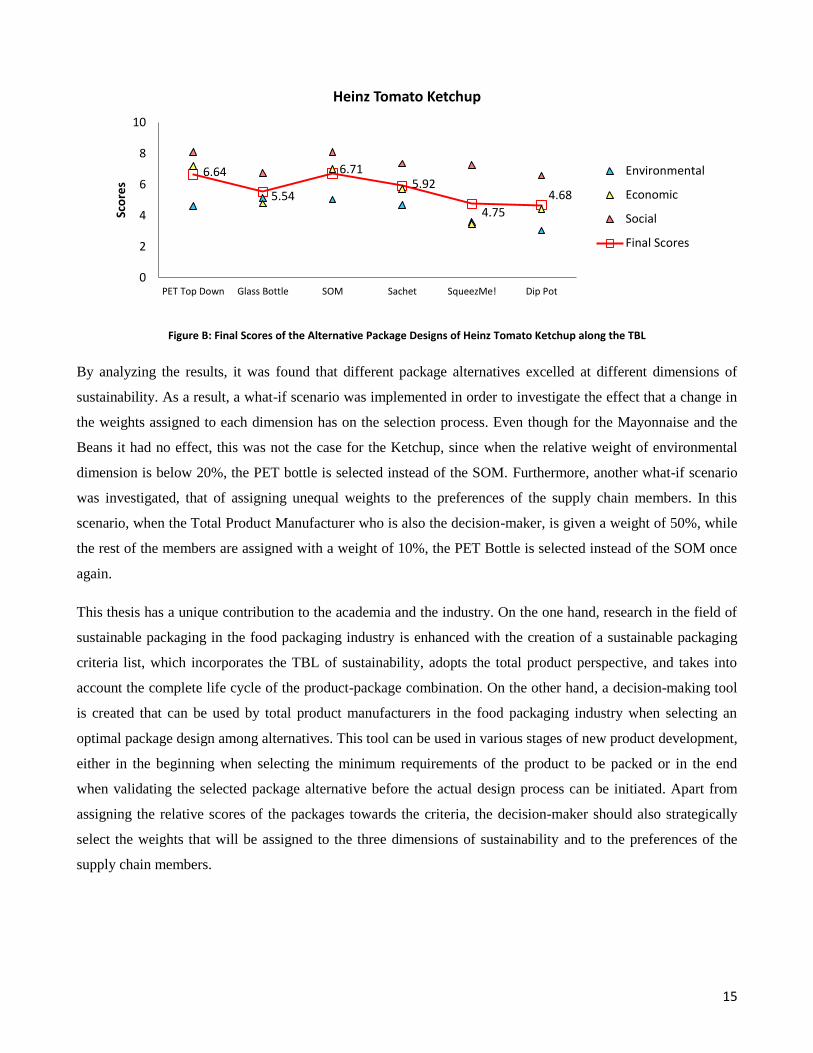
conventional Can was selected for the Beans. An example of the relative scores of the package alternatives for
Heinz Tomato Ketchup is given in Figure B.
Figure A: Packaging Material Suppliers Economic Criteria Weights
21.80% 11.95% 9.35%
15.86% 10.43% 17.43%
13.19% 0%
10%
20%
30%
40%
50%
Performancemeets market
needs
Sourcing,manufacturing
and distributioncosts
Physicallydesigned to
optimizematerials and
energy
Continuity Cooperationwith supply
chain members
Profitability PackageFunctionality
We
igh
ts
Packaging Material Suppliers Criteria Weights Economic Performance
15
Figure B: Final Scores of the Alternative Package Designs of Heinz Tomato Ketchup along the TBL
By analyzing the results, it was found that different package alternatives excelled at different dimensions of
sustainability. As a result, a what-if scenario was implemented in order to investigate the effect that a change in
the weights assigned to each dimension has on the selection process. Even though for the Mayonnaise and the
Beans it had no effect, this was not the case for the Ketchup, since when the relative weight of environmental
dimension is below 20%, the PET bottle is selected instead of the SOM. Furthermore, another what-if scenario
was investigated, that of assigning unequal weights to the preferences of the supply chain members. In this
scenario, when the Total Product Manufacturer who is also the decision-maker, is given a weight of 50%, while
the rest of the members are assigned with a weight of 10%, the PET Bottle is selected instead of the SOM once
again.
This thesis has a unique contribution to the academia and the industry. On the one hand, research in the field of
sustainable packaging in the food packaging industry is enhanced with the creation of a sustainable packaging
criteria list, which incorporates the TBL of sustainability, adopts the total product perspective, and takes into
account the complete life cycle of the product-package combination. On the other hand, a decision-making tool
is created that can be used by total product manufacturers in the food packaging industry when selecting an
optimal package design among alternatives. This tool can be used in various stages of new product development,
either in the beginning when selecting the minimum requirements of the product to be packed or in the end
when validating the selected package alternative before the actual design process can be initiated. Apart from
assigning the relative scores of the packages towards the criteria, the decision-maker should also strategically
select the weights that will be assigned to the three dimensions of sustainability and to the preferences of the
supply chain members.
6.64
5.54
6.71 5.92
4.75
4.68
0
2
4
6
8
10
PET Top Down Glass Bottle SOM Sachet SqueezMe! Dip Pot
Sco
res
Heinz Tomato Ketchup
Environmental
Economic
Social
Final Scores

16
17
1 Introduction
The rising environmental concerns of consumers have brought the value of sustainability to the forefront of the
corporate agenda. However, the biggest barrier to corporate sustainability is the economic environment. There is
no better answer to this statement rather than repeating what Wayne Balta, Vice President for corporate
environmental affairs and product safety at IBM, says: “If you think doing things for the environment is
expensive, then you should try ignoring it. You will find out how expensive it gets” (KPMG, 2011).
Sustainability is seen as a key business driver that can turn business opportunities to core competitive
advantages. However, in recent years the focus of research in sustainability has shifted from the corporate level
to that of the whole supply chain, and the discipline of Sustainable Supply Chain Management (SSCM) was
formed (Tay, Rahman, Aziz, & Sidek, 2015).
Companies that take part in any supply chain have different reasons for engaging in sustainable practises.
Whether it is the brand name, profit, compliance to regulations or environmental concerns, companies cannot
survive competition without engaging in acts of sustainability. Due to different incentives, they face different
drivers and barriers towards sustainable development. Every single of these companies plans its operations with
the aim of satisfying the actors and factors that are involved in the decision-making processes regarding
sustainability.
The supply chain that will be attempted to be analysed in this master thesis is that of a company in the food
packaging industry. When applied to packaging, sustainability involves the insertion of the goals of sustainable
development into the complete life cycle of the product. In the Netherlands, the largest association of packaging
companies is the Netherlands Packaging Centre (NVC), and their aim is to address the activities of packaging
throughout the supply chain of the packaged product and stimulate continuous improvement (NVC, 2016). More
specifically, the axis of the thesis will be the supply chain of a certain family of products in the food packaging
industry.
In the food packaging industry, there are certain criteria that characterize whether a package is sustainable or
not, and thus the design of the product is decided by satisfying the aforementioned criteria. However, when the
whole supply chain is under study, the process is not so straightforward. In this master thesis, the effects of the
industry specific supply chain sustainability criteria on the package design will be investigated.

18
1.1 Problem Statement
In this section, the topic will be further elaborated and all the arguments that are needed in order to reach the
stage of formulating the research objective will be presented. Carter and Jennings refer to SSCM as “the
strategic, transparent integration and achievement of an organization’s social, environmental and economic
goals in the systemic coordination of key inter-organizational business process for improving the long-term
economic performance of the individual company and the supply chain” (Carter & Rogers, 2008). From this
definition it can be implied that in order for a product to contribute to corporate sustainable development and to
the long-term economic performance of the whole supply chain, fulfilling the criteria that characterize it as
sustainable itself is not enough. In other words, designing a sustainable product does not imply a sustainable
supply chain. The product has to be designed according to the needs and expectations of the customers, the
stakeholders and all the members in the supply chain. In turn, these actors formulate and represent the
sustainability drivers and barriers in any supply chain in the food packaging industry, no matter which the
product under study is.
Regarding previous research that has been conducted, the general sustainability drivers and barriers have already
been documented in the article “A Review on Drivers and Barriers towards Sustainable Supply Chain
Practises” (Tay, Rahman, Aziz, & Sidek, 2015). In addition, industry specific attempts in documenting
sustainability drivers and barriers have also already been documented, with a notable representative being the
article “An integrative framework for sustainable supply chain management practices in the oil and gas
industry” focusing in the oil and gas (O&G) industry (Wan Ahmad, de Brito, Rezaei, & Tavasszy, 2017).
However, as it was mentioned before, at the industry or even the company level, each of these factors has a
different weight of importance on SSCM. One of the goals of this thesis will be to translate these drivers and
barriers to criteria, and then rank them according to their impact on the product design in the food packaging
industry.
The criteria according to which a product is characterized as sustainable have also been already documented.
There are two different approaches to these criteria, one published by the Sustainable Packaging Coalition (SPC)
in the U.S. and another by the Sustainable Packaging Alliance (SPA) in Australia. It is an undeniable fact that
the package design could be chosen according to these aforementioned criteria. The problem statement can be
underlined by the fact that partly these criteria are product specific and do not incorporate or ensure the
sustainability of the whole supply chain. After the criteria have been formulated in the chapter of Literature
Review, they will be compared to the ones published by the SPC and the SPA.
Summing things up, the knowledge gap that will be attempted to be bridged in this thesis, is the identification of
the sustainability drivers and barriers in the supply chain of companies in the food packaging industry, their
translation to sustainability criteria, the weight estimation and ranking of these criteria and last but not least, the
19
identification of how they affect the decision-making process of selecting the optimal package design among
other alternatives. As explained, the axis will be the supply chain of the food packaging industry and not just the
packaging producer, or in other words, the “converter” of raw materials to end-products. The terms “packaging”
and “package design” will be used interchangeably. However, every time they are used they will describe the
container of the food product and not the package of the shipment method or the parcel used in distribution. The
unit of analysis will be the total product, or in other words the product-package combination, since the
environmental impacts of packages have been found to be relatively small compared with the food items they
contain (Grönman, et al., 2013).
Completing this thesis will undoubtedly enhance the research in the field of sustainability in the food packaging
industry. Nevertheless, by choosing the package design according to the translated sustainability drivers and
barriers in the food packaging industry and not the product specific sustainability criteria, it can be implied that
progress is made towards a more sustainable supply chain in contrast with a more sustainable single product. In
the next sections, the research objectives and questions that derive from the problem statement are going to be
described.
1.2 Research Objective
Having presented the topic and the problem statement of the thesis, the research objectives can now be
formulated. The main goal of this thesis is promoting the value of sustainability in the whole supply chain. The
industry that was chosen for the research to take place is that of food packaging. The aforementioned
contribution to enhancing supply chain sustainability can be achieved by selecting the design of the package
based on the translated sustainability drivers and barriers of the whole supply chain and not based on the specific
sustainable characteristics of the package itself.
This is exactly what this thesis will attempt to prove. That by selecting the package design according to supply
chain sustainability criteria, sustainable development in the whole supply chain of the food packaging industry
is enhanced. In order to achieve the main goal several objectives will have to be reached. These objectives are
presented through the sub-research questions in the next section.
20
1.3 Research Questions
The following research questions can be formulated with the purpose of reaching the aforementioned objective:
Main Research Question: “How do the supply chain sustainability criteria in the food packaging industry and
their respective weights improve the selection process of the package design?”
Sub-research question 1: “What are the sustainability drivers and barriers of the supply chain of a company in
the food packaging industry and how can they be translated to product specification criteria?” The sub-
objective that will be achieved is the identification of the supply chain sustainability drivers and barriers of a
product-package combination producer and their translation to product specification criteria.
Sub-research question 2: “How do the different members of the supply chain of certain product-package
combinations in the food packaging industry value the identified supply chain sustainability criteria?” The sub-
objective that will be achieved is the estimation of the respective criteria weights that the different members in
the supply chain of certain products in the food packaging industry assign to the identified supply chain
sustainability criteria.
Sub-research question 3: “What are the alternative package designs of certain product-package combinations
and how do they score in relation to the maximum performance that can be achieved in the identified supply
chain sustainability criteria?” The sub-objective that will be achieved is the identification of the alternative
package designs of the product-package combinations under study, and their respective scores towards each
criterion.
Sub-research question 4: “How could a decision-making method be implemented in a multi-dimensional and
multi-actor setting in order to select the optimal package design according to the weights of the identified
supply chain sustainability criteria and the relative scores of the package alternatives?” The sub-objective that
will be achieved is the successful implementation of a Multi Criteria Decision-Making (MCDM) method for
selecting the optimal package design.
1.4 Relevance to Management of Technology and Innovation
This thesis is a partial fulfilment to the degree of Master of Science in Management of Technology (MOT), and
the topic derives from its specialization; Supply Chain Management. The scientific field of MOT is composed of
four main pillars. The first three pillars are a combination of Technology and Innovation on the one hand, and
Organization, Commercialization and Engineering Economics respectively on the other. The last pillar is
21
dedicated to Research and Reflection. Throughout the course of the lectures it was stressed that in a competitive
high-tech world, companies must constantly strive to improve their products and services and to reduce their
operational and new product development costs. By incorporating in their sustainability practices the three
perspectives that have been adopted in this thesis; namely those of the Triple Bottom Line of sustainability, of
the whole supply chain and of the total product, companies can achieve their individual and collective
sustainability targets. By achieving these targets, they can evolve their core competencies into core competitive
advantages. However, in order effectively achieve these targets most companies need to continuously acquire
new knowledge while on the same time apply strategic knowledge management and effective decision-making
processes to their businesses. The final product of this thesis is an innovative decision-making tool that can be
used by total product manufacturers in the food packaging industry when selecting the optimal package design
among alternatives. In this thesis it will be attempted to prove that by using this tool companies can improve
their selection process.
Within TU Delft, the faculty of Technology, Policy and Management (TPM) was found in 1997 and apart from
MOT offers two other Master of Science degrees; the Engineering Policy Analysis (EPA) and the System
Engineering Policy Analysis and Management (SEPAM). The most prevalent differentiating factor between
MOT and EPA thesis topics lie in the focus of the latter to the public sector since they often give high
importance on how political systems work. Furthermore, while MOT theses focus on managing innovations in
an organizational environment, EPA theses often adopt a system‟s perspective and use dynamic modeling
techniques so as to simulate system behavior and to design optimal strategies for improved system performance.
The thesis topics of SEPAM in comparison to MOT, apart from focusing on designing technological
innovations, they also adopt a system‟s perspective and have a focus on law and institutions by managing and
designing on the basis of applicable legislation, values and standards. Even though the specialization of Supply
Chain Management is shared among these three degrees, each one approaches it from a different perspective.
This thesis has a contribution to both the academia and the industry. As it has been mentioned, it incorporates,
combines and introduces three new perspectives in the development phase of package design. Apart from
adopting the TBL perspective, it gives equal importance to the social dimension, which is often neglected by
large multinationals. It also gives equal importance to the preferences of the various supply chain members that
cover the complete life cycle of the product-package combination. By studying the total product and not the
package itself, the view of sustainability is extended backwards from the manufacturer to the raw and packaging
material suppliers, and forward to the customers, consumers and the end-of-life companies. Furthermore, a
sustainable packaging criteria list is created from scratch and the food packaging industry is mapped through a
contextual framework. In addition, the preferences of the supply chain members regarding the aforementioned
criteria are documented and could be generalized for the whole industry. Moreover, by applying the BWM in a
22
multi-dimensional and multi-actor setting, the spectrum of BWM applications in expanded. The last contributing
point of this thesis is the creation of an innovative decision-making tool.
This innovative decision-making tool is created by exploiting existing knowledge, rather than exploring new
knowledge. In order to apply this tool, the firm needs to first create new knowledge through the exploitation of
explicit knowledge, and then to commercialize this knowledge with existing market knowledge (Popadiuk &
Choo, 2006). The approach of exploitation applies explicit knowledge that has been codified and formalized in
practice through the processes of “combination” (conversion from explicit to explicit knowledge) and
“internalization” (conversion from tacit to explicit knowledge) (Nonaka & Takeushi, 1995). Since the
introduction of this tool only causes minor changes in the field of sustainable package design and does not
involve a high degree of novelty, it can be characterized as an incremental process innovation. The market
knowledge stays at the same levels, while only small technological improvements take place. For a company to
make the tool more usable, they need to diffuse and systematize the aforementioned knowledge by increasing
proficiency through repeated practice and the formalization of knowledge. The total product manufacturer, or in
other words the decision-maker, needs to share information with the supply chain members with the use of a
transparent communication network.
However, it has to be underlined that the way to achieve sustained competitive advantage is not through
incremental or radical innovations but rather through producing and managing innovation streams over time
(Tushman, Anderson, & O‟Reilly, 1997). In other words, the creation of an innovative decision-making tool
such as this one will not guarantee competitive advantage in the long run. Even the introduction of an
incremental process innovation needs to have a responsible character. In order to introduce to the market a more
responsible innovation according to (Taebi, Correljé, Cuppen, Dignum, & Pesch, 2014) an interdisciplinary
approach must be undertaken in order to address societal and ethical aspects at the R&D stage of package
design. Furthermore, they suggest an ex ante assessment of stakeholder values, a timely and proactive
identification of potentially conflicting values, and giving special importance when assigning weights to the
preferences and demands of various minority groups of the general public. Combining the three perspectives
presented in this thesis together with the guidance towards responsible innovation, a step towards sustained
competitive advantage can be achieved.
1.5 Structure
In this section, the content of the chapters that compose this thesis will be elaborated. In Chapter 1 the reasons
behind the formulation of the topic were given and the problem that will be attempted to be solved was
documented. Moreover, the Research Objective was presented, from which the Main Research Question and the
23
Sub-Research Questions were derived. The answers to these questions will be given in the next chapters and will
contribute to reaching the objective. Finally, the relevance of the topic to Management of Technology was
underlined.
In Chapter 2 the literature review of the topic is presented. In the beginning the basic definitions are given and
then the four pillars of literature review are elaborated in separate sections. Next, the integration of the four
pillars takes place, which results in the formation of the main axis of the thesis. The sections that follow right
after are dedicated to documenting the sustainable packaging criteria along the Triple Bottom Line of
sustainability. After describing the process that was followed for selecting the relevant scientific articles, the
criteria are categorized and thoroughly elaborated. The chapter ends with depicting how the sustainable
packaging criteria are distributed along the TBL and with the creation of the contextual framework of the food
packaging industry.
In Chapter 3 the methodology that was followed in order to answer the research questions is described. At first,
the problem is analysed and its characteristics are defined. Then the method that was selected for its solution is
presented starting by describing Multi-Criteria Decision-Making methods and continuing with the elaboration of
the Best-Worst Method (BWM). The last part of the chapter is dedicated to the description of the research
design. After introducing the Kraft Heinz Company from where the product-package combinations are selected,
the research methods that were used for each part of the analysis and for each member of the supply chain are
presented.
In Chapter 4 the implementation of the BWM takes place and the outputs are presented. The chapter starts with
describing in detail the necessary steps that were undertaken for the implementation. After the reduction of the
number of criteria is presented, the total products whose supply chain would be analysed were selected. For
these product-package combinations the alternative package designs were identified. The next sections were
dedicated to the estimation of the criteria weights for each one of the six supply chain members that were
identified. After presenting the relative weights, the scores that the decision-maker assigned to each package
alternative are presented. The chapter ends with the presentation of the optimal package designs for each of the
three product-package combinations.
In Chapter 5 the outputs that were described in the previous chapter are critically evaluated. In the first section,
the sustainable packaging criteria list is evaluated and compared to the existing and already published ones. The
second section presents the differences in the preferences of the supply chain members that are represented by
the different weights that they assigned to each criterion. In the third section a what-if scenario is described that
investigates whether a change in the relative weights of the three dimensions has an effect on the selection of the
optimal package design. The last section of the chapter contains a second what-if scenario that investigates
24
whether a change in the relative weights of the preferences of the supply chain members has an effect on the
selection of the optimal package design.
In Chapter 6 which is the final chapter of this thesis, the closing remarks are situated. It begins by answering the
research questions and explaining why the research objective is met. The second section is dedicated to the
contribution of the thesis to the scientific community and the industry. The third section gives practical
recommendations to the decision-maker regarding the application of the created tool. In the fourth section
reflection on the methods used and assumptions that were made takes place. This thesis ends with suggestions
regarding future work that would contribute to enhancing sustainable development in the food packaging
industry.

25
2 Literature Review
After having completed an introduction to the research topic, in this chapter of the report the literature review
will be presented. Before starting, the process that was followed in order to access the relevant literature will be
described. Even though various search engines were used, such as Scopus, Google Scholar and Web of Science
among others, the one that was proved more effective was Science Direct. The reason behind the superiority of
this engine lies in the importance of the journals that can be accessed, the vast number of scientific papers that
are included in them, and finally its user friendly interface. In this search engine the researcher is able to limit
the number of results by adding more keywords and narrow down the scope after every attempt and also even
limit the search for articles of a particular scientific journal only.
The main keywords that were used were “Sustainable Packaging Assessment”, “Sustainable Supply Chain
Management”, “Sustainability Drivers and Barriers”, “Food Packaging Industry” and of course their
combination in pairs and in a triadic form. By using these keywords, the Journal of Operations Management was
discovered. This journal has high relevance with the research objectives of this master thesis and as a result, the
journal‟s impact on the literature review is striking. Furthermore, apart from searching scientific articles,
documents were also extracted from organizations and associations dedicated to sustainable packaging in order
to find the supply chain sustainability drivers and barriers that would be translated to sustainable packaging
criteria. Finally, from (Tay, et al., 2015) and (Wan Ahmad, et al,, 2017), the snowballing technique was
initiated, since these are the most recent articles that cover the idea behind the formulation of the problem that
this thesis attempts to tackle. In these articles, the supply chain sustainability drivers and barriers are elaborated
with the first covering a general perspective while the second a more detailed one since it is specialized in the
O&G industry.
In the first section of the chapter of Literature Review, the definitions of the terms used in the thesis are given.
Then, in the second, the concept map containing the various variables of the research topic will be presented and
the importance of research highlighted. In the third section the existing literature on the topic will be presented.
The already conducted research is split into the four main pillars which constitute the Literature Review;
Sustainability, Sustainable Supply Chain Management, Sustainable Packaging and Packaging Trends and
Sustainability in the Food Packaging Industry. Then the link between the value of sustainability, the scope of the
whole supply chain, sustainable packaging and the limitations of the food packaging industry is presented in the
fourth section, that of integration of the four pillars. In the same section, the knowledge gap is identified and the
potential contribution of this thesis proposal is underlined. The last, longer and more detailed section of the
chapter of Literature Review is dedicated to the creation of a sustainable packaging criteria list. This section
begins with describing the procedure that was followed for deriving the criteria list, continues with the
26
presentation of the criteria along the three dimensions of sustainability; namely the environmental, economic
and social, and lastly depicts a conceptual framework for the food packaging industry.
2.1 Basic Definitions
In this section three basic definitions are going to be given. These three terms constitute the foundations of this
thesis and their meaning has to be presented in detail. In the sections to follow, when these three terms are used,
these specific definitions will be implied.
Triple Bottom Line of Sustainability
The Triple Bottom Line (TBL) is a term that was first used by Elkington in his book “Cannibals with forks: The
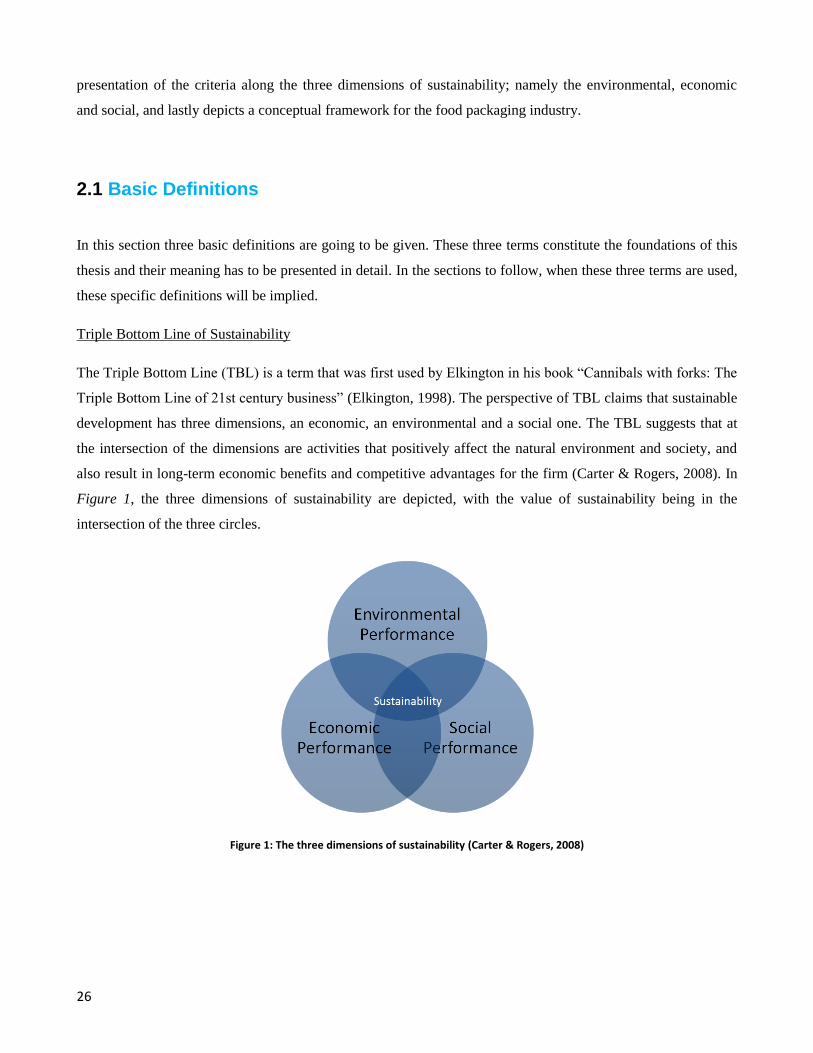
Triple Bottom Line of 21st century business” (Elkington, 1998). The perspective of TBL claims that sustainable
development has three dimensions, an economic, an environmental and a social one. The TBL suggests that at
the intersection of the dimensions are activities that positively affect the natural environment and society, and
also result in long-term economic benefits and competitive advantages for the firm (Carter & Rogers, 2008). In
Figure 1, the three dimensions of sustainability are depicted, with the value of sustainability being in the
intersection of the three circles.
Figure 1: The three dimensions of sustainability (Carter & Rogers, 2008)

27
Sustainable Supply Chain Management
In the 1980s the concept of Sustainable Supply Chain Management (SSCM) was born. Seuring, Sarkis and
Müller refer to SSCM as “the management of material, information and capital flows as well as cooperation
among companies along the supply chain while taking goals from all three dimensions of sustainable
development such as economic, environmental and social, into accounts which derive from customer and
stakeholder requirements” (Seuring & Müller, 2008b). This definition serves as a milestone for the enhanced
version of the definition of SSCM that was given by Carter and Rogers later in 2008 and was presented in
Section 1.2 Problem Statement. The selection of the package design in this thesis will take place according to
these three dimensions of sustainable development. SSCM in some scientific articles is also referred to as Green
Supply Chain Management (GSCM).
Packaging
Packaging should be considered as a system comprising of three levels (Garcia-Arca & Prado, 2008). The first
level is referred to as the primary one, or “Consumer Packaging”, and has the aim of protecting the product.
The next level is the secondary one, known as “Transport Packaging”, and is designed to contain and group
together several primary packages. The third level is the “Tertiary packaging”, which involves several primary
or secondary packages grouped together on a pallet or a road unit. In this thesis, when referring to the package
or the packaging the first level will be implied. Apart from three hierarchical levels, packaging also serves three
different functions (Johansson, Lorentzon, Olsmats, & Tiliander, 1997). The marketing function that is designed
to select alternatives in graphic design and formats for adapting to the current legislation and customer
requirements, the logistics or flow function designed to facilitate purchases, production or packing and
distribution, and lastly the environmental function which is related to reverse logistics. In order these functions
to be put together, the separation of packaging into the three aforementioned levels was essential.
2.2 Importance of Research and the Concept Map
The rising environmental concerns of consumers have brought the value of sustainability to the forefront of the
corporate agenda. Sustainability is seen as a key business driver that can turn business opportunities to core
competitive advantages. However, in recent years the focus of research in sustainability has shifted from the
corporate level to that of the whole supply chain (Tay, et al., 2015). This is the reason why the assessment of a
product‟s design should not be according to product or company specific sustainability criteria, but rather
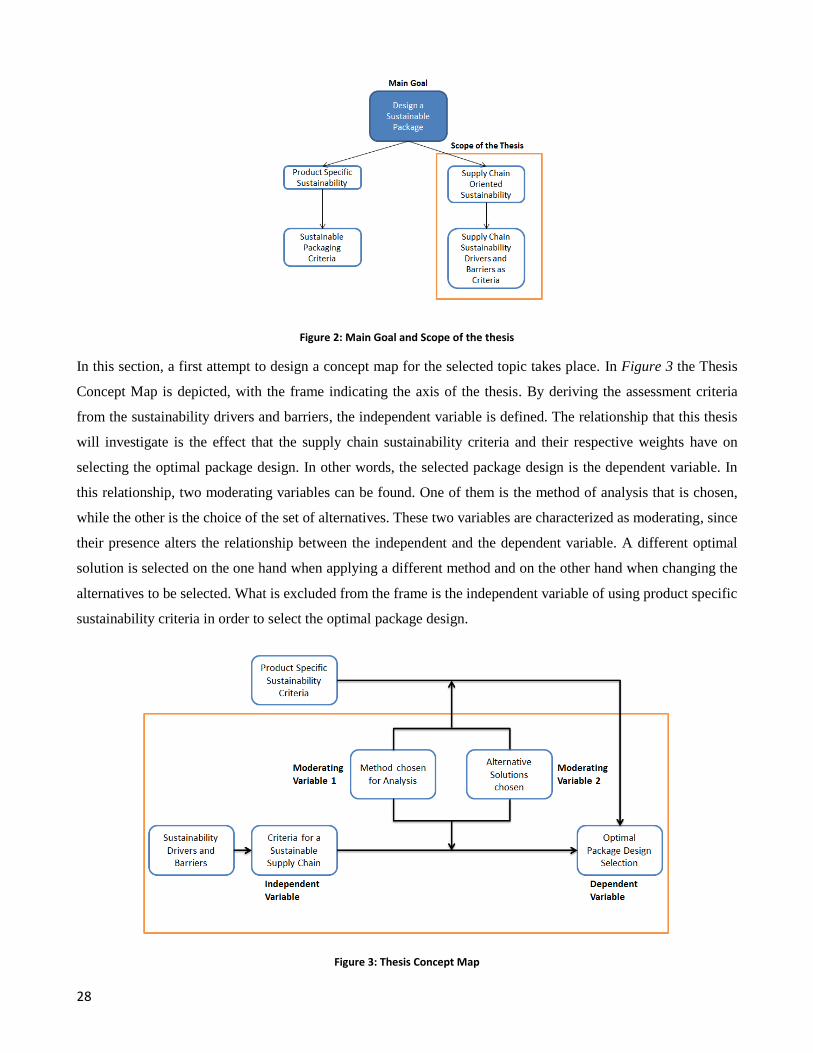
according to criteria that ensure the sustainability of the whole supply chain. In Figure 2, the way that the scope
of the thesis derives from the main goal is presented inside the orange frame.
28
Figure 2: Main Goal and Scope of the thesis
In this section, a first attempt to design a concept map for the selected topic takes place. In Figure 3 the Thesis
Concept Map is depicted, with the frame indicating the axis of the thesis. By deriving the assessment criteria
from the sustainability drivers and barriers, the independent variable is defined. The relationship that this thesis
will investigate is the effect that the supply chain sustainability criteria and their respective weights have on
selecting the optimal package design. In other words, the selected package design is the dependent variable. In
this relationship, two moderating variables can be found. One of them is the method of analysis that is chosen,
while the other is the choice of the set of alternatives. These two variables are characterized as moderating, since
their presence alters the relationship between the independent and the dependent variable. A different optimal
solution is selected on the one hand when applying a different method and on the other hand when changing the
alternatives to be selected. What is excluded from the frame is the independent variable of using product specific
sustainability criteria in order to select the optimal package design.
Figure 3: Thesis Concept Map
29
2.3 The Four Pillars of Literature Review
The existing literature is separated in the four main pillars of this thesis, starting from the most general towards
the most specific as follows; The Value of Sustainability, Sustainable Supply Chain Management Findings and
Definitions, Sustainable Packaging and Packaging Trends and Sustainability in the Food Packaging Industry. In
the next section, Section 2.4, the integration of the four pillars takes place.
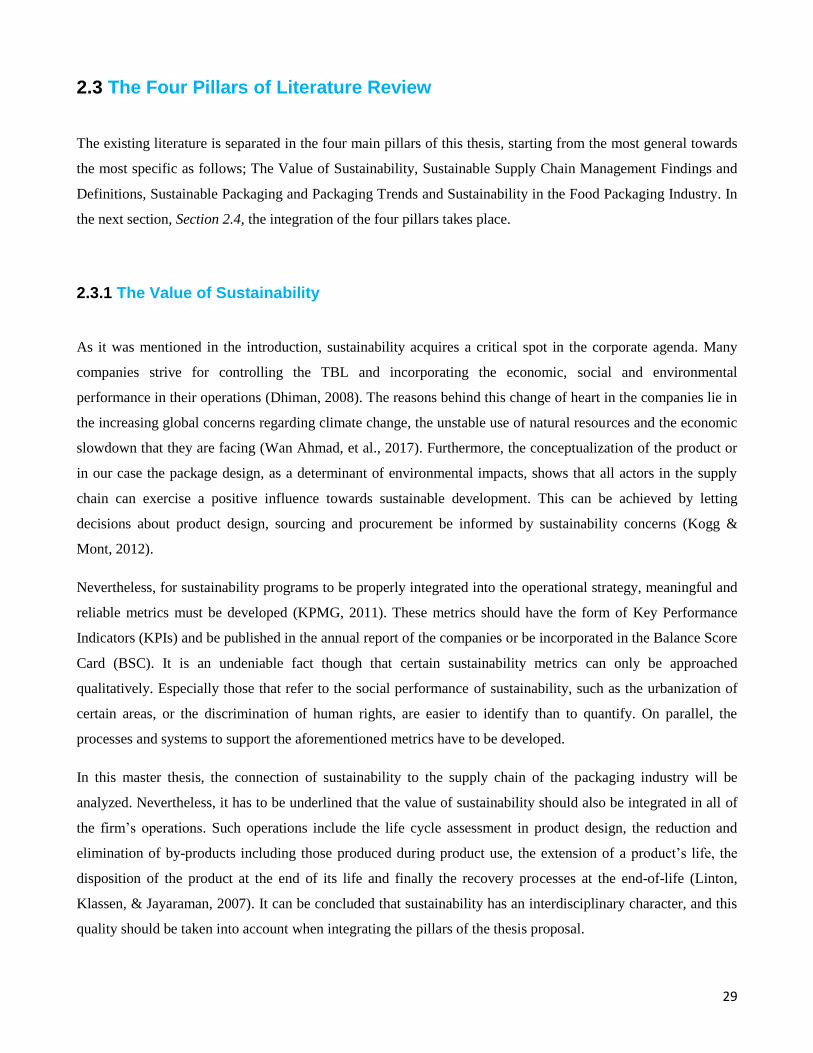
2.3.1 The Value of Sustainability
As it was mentioned in the introduction, sustainability acquires a critical spot in the corporate agenda. Many
companies strive for controlling the TBL and incorporating the economic, social and environmental
performance in their operations (Dhiman, 2008). The reasons behind this change of heart in the companies lie in
the increasing global concerns regarding climate change, the unstable use of natural resources and the economic
slowdown that they are facing (Wan Ahmad, et al., 2017). Furthermore, the conceptualization of the product or
in our case the package design, as a determinant of environmental impacts, shows that all actors in the supply
chain can exercise a positive influence towards sustainable development. This can be achieved by letting
decisions about product design, sourcing and procurement be informed by sustainability concerns (Kogg &
Mont, 2012).
Nevertheless, for sustainability programs to be properly integrated into the operational strategy, meaningful and
reliable metrics must be developed (KPMG, 2011). These metrics should have the form of Key Performance
Indicators (KPIs) and be published in the annual report of the companies or be incorporated in the Balance Score
Card (BSC). It is an undeniable fact though that certain sustainability metrics can only be approached
qualitatively. Especially those that refer to the social performance of sustainability, such as the urbanization of
certain areas, or the discrimination of human rights, are easier to identify than to quantify. On parallel, the
processes and systems to support the aforementioned metrics have to be developed.
In this master thesis, the connection of sustainability to the supply chain of the packaging industry will be
analyzed. Nevertheless, it has to be underlined that the value of sustainability should also be integrated in all of
the firm‟s operations. Such operations include the life cycle assessment in product design, the reduction and
elimination of by-products including those produced during product use, the extension of a product‟s life, the
disposition of the product at the end of its life and finally the recovery processes at the end-of-life (Linton,
Klassen, & Jayaraman, 2007). It can be concluded that sustainability has an interdisciplinary character, and this
quality should be taken into account when integrating the pillars of the thesis proposal.
30
2.3.2 Sustainable Supply Chain Management Findings and Definitions
In the last ten years there has been a shift in the focus towards sustainable development from the company level
to that of the whole supply chain (Linton, et al., 2007). This is the reason why in this report the criteria of
assessing the sustainability of a package design will not be company or product specific. The supply
management function has been recognized as a critical function in a company‟s sustainability work, since it
plays an important role in addressing environmental and social aspects upstream in the supply chain and also in
ensuring compliance with the existing sustainability criteria (Kogg & Mont, 2012).
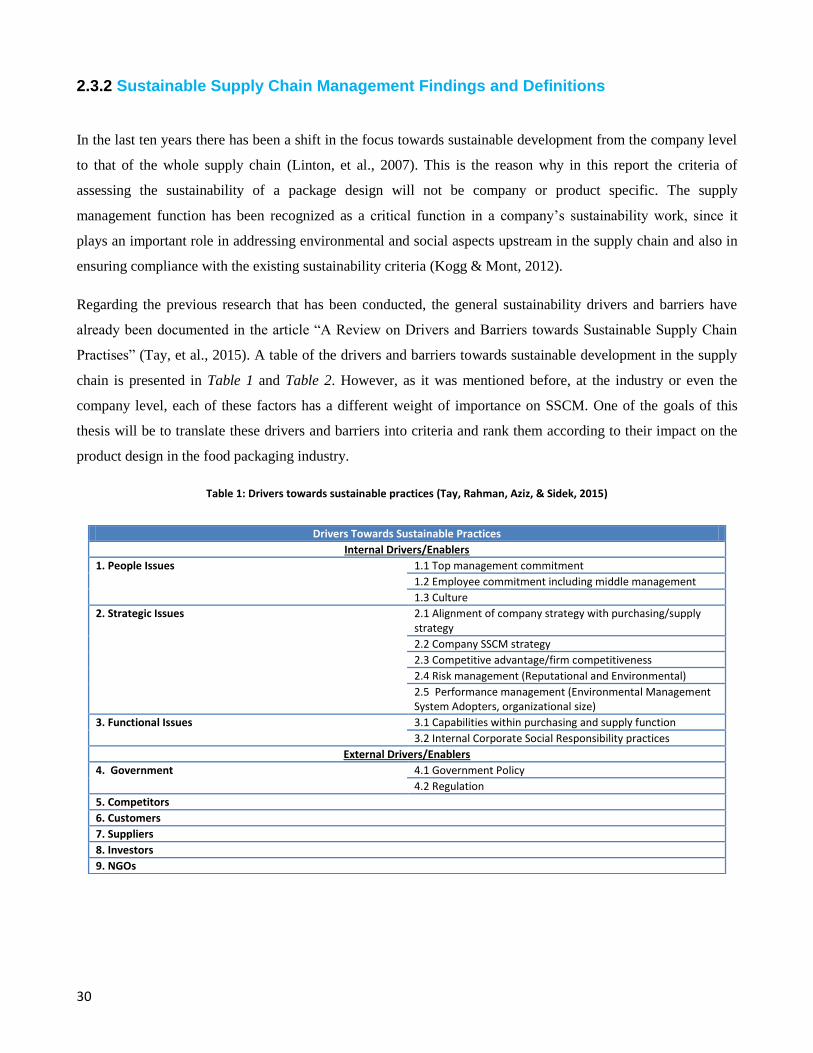
Regarding the previous research that has been conducted, the general sustainability drivers and barriers have
already been documented in the article “A Review on Drivers and Barriers towards Sustainable Supply Chain
Practises” (Tay, et al., 2015). A table of the drivers and barriers towards sustainable development in the supply
chain is presented in Table 1 and Table 2. However, as it was mentioned before, at the industry or even the
company level, each of these factors has a different weight of importance on SSCM. One of the goals of this
thesis will be to translate these drivers and barriers into criteria and rank them according to their impact on the
product design in the food packaging industry.
Table 1: Drivers towards sustainable practices (Tay, Rahman, Aziz, & Sidek, 2015)
Drivers Towards Sustainable Practices
Internal Drivers/Enablers
1. People Issues 1.1 Top management commitment
1.2 Employee commitment including middle management
1.3 Culture
2. Strategic Issues 2.1 Alignment of company strategy with purchasing/supply strategy
2.2 Company SSCM strategy
2.3 Competitive advantage/firm competitiveness
2.4 Risk management (Reputational and Environmental)
2.5 Performance management (Environmental Management System Adopters, organizational size)
3. Functional Issues 3.1 Capabilities within purchasing and supply function
3.2 Internal Corporate Social Responsibility practices
External Drivers/Enablers
4. Government 4.1 Government Policy
4.2 Regulation
5. Competitors
6. Customers
7. Suppliers
8. Investors
9. NGOs

31
Table 2: Barriers towards sustainable practices (Tay, Rahman, Aziz, & Sidek, 2015)
Barriers Towards Sustainable Practices
Internal Barriers
1. People Issues 1.1 Lack of management commitment
2. Strategic Issues 2.1 Resources (Cost)
2.2 Performance measurement (traditional accounting methods)
2.3 Organizational size (smaller firms)
2.4 Financial, Technical, Information, Managerial and Organizational Issues
3. Functional Issues 3.1 Purchasing and supply function (Lack of training, Lack of understanding of how to incorporate in purchasing, other SCM priorities)
3.2 Lack of corporate structures and processes
External Barriers
4. Government 4.1 Government policy
5. Competitors 5.1 Competitive pressures
6. Customers 6.1 Consumer desire for lower prices
6.2 Poor supplier commitment
7. Media 7.1 Green wash
8. Sectorial 8.1 Less regulated industries
9. Organization 9.1 Policy and Market Issues
10. Technology 10.1 ICT
The sustainability drivers above (Table 1) can first be separated into internal, referring to the inner environment
of the firm, and external, referring to the system where the firm belongs. To begin with the internal drivers, this
group of factors is company specific and different for every member of the supply chain. In turn, they can be
separated into three categories; those related to a firm‟s human resources (people issues), those related to
strategic and structural actions (strategic issues), and those related to operations and how the business is run
(functional issues). On the other hand, the external barriers are related to the other members of the supply chain
(customers, suppliers), the various stakeholders that are influenced by the firm‟s actions (investors, competitors)
and those actors whose policies have an impact on the firm (government, NGOs).
Similarly, the barriers (Table 2) are also split into internal and external. Even though the main categories of the
internal ones remain the same as those of the drivers, the external differ, since they are more industry specific.
Thus, the need of translating these factors into supply chain sustainability criteria is imminent before applying a
model to derive the effect they have on the package design.
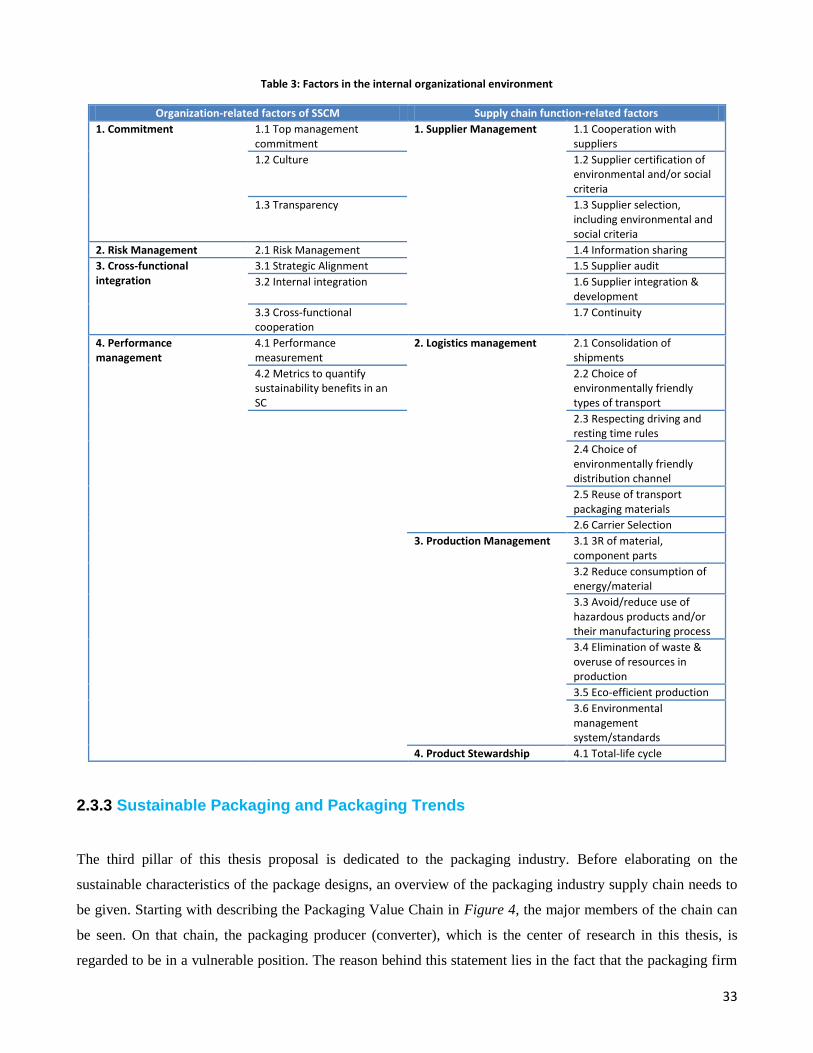
A similar approach was taken by (Wan Ahmad, et al., 2017) in their article “An integrative framework for
sustainable supply chain management practises in the oil and gas industry”, where in order to come up with a
sustainable framework, they reviewed the various factors that affect a company‟s decision to engage in
sustainable supply chain practises. They created an inventory of internal factors that are used by researchers in

32
SSCM, and which can be grouped in two main categories; organizational-related factors and supply chain
function-related factors. These factors are presented in Table 3.
These factors are defined as context related since they are able to explain the environment in which SSCM
strategy and decisions are made in a company (Wan Ahmad, et al., 2017). Even though these factors are specific
to the oil and gas industry, due to the fact that they refer to the internal environment only, they can also be
generalized for a company in the food packaging industry. If the external factors were taken into account, then
these factors would not be able to be applied in the case at hand, since the inter-company relations and the
respective regulations would differ greatly.
The challenging task of translating these factors into product specifications will be one of the initial tasks when
formulating the list of sustainable packaging criteria in Section 2.5. In order to achieve this, the criteria
published by SPC and SPA and which are presented in Section 2.3.3 will be used together with various measures
of sustainability in global supply chains as mentioned in the article “Sustainability optimization for global
supply chain decision-making” (Bhinge, Moserb, Moserb, Lanzab, & Dornfeld, 2015). In that article, a cradle-
to-gate approach is taken, or in other words, an approach on which the decision can depend on the
manufacturing site, all its suppliers, raw material source and transportation right until the customer gate. Their
approach is similar to the one adopted in this thesis since they analyse the supply chain and define several
measures and sub-measures across the TBL.
However, the need to take a multiple stakeholder perspective and boost transparency when assessing
sustainability in the supply chain is imminent (Fritz, Schöggl, & Baumgartner, 2017). Previous research has
already been conducted in the automotive and electronic industries where sustainability aspects for supply chain
data exchange were successfully identified. However, these findings cannot be used for this thesis since every
industry has certain sustainability criteria that are not only different in character but also may be ranked
differently according to their impact in decision-making. On that same article it is also mentioned that Elkington
underlined that the governance dimension could also be added to the TBL so as the framework of sustainable
development to be more complete (Fritz, et al., 2017). The same authors in a different article they also provide a
conceptual framework for supply chain sustainability assessment (Schöggl, Fritz, & Baumgartner, 2016).
33
Table 3: Factors in the internal organizational environment
Organization-related factors of SSCM Supply chain function-related factors
1. Commitment 1.1 Top management commitment
1. Supplier Management 1.1 Cooperation with suppliers
1.2 Culture 1.2 Supplier certification of environmental and/or social criteria
1.3 Transparency 1.3 Supplier selection, including environmental and social criteria
2. Risk Management 2.1 Risk Management 1.4 Information sharing
3. Cross-functional integration
3.1 Strategic Alignment 1.5 Supplier audit
3.2 Internal integration 1.6 Supplier integration & development
3.3 Cross-functional cooperation
1.7 Continuity
4. Performance management
4.1 Performance measurement
2. Logistics management 2.1 Consolidation of shipments
4.2 Metrics to quantify sustainability benefits in an SC
2.2 Choice of environmentally friendly types of transport
2.3 Respecting driving and resting time rules
2.4 Choice of environmentally friendly distribution channel
2.5 Reuse of transport packaging materials
2.6 Carrier Selection
3. Production Management 3.1 3R of material, component parts
3.2 Reduce consumption of energy/material
3.3 Avoid/reduce use of hazardous products and/or their manufacturing process
3.4 Elimination of waste & overuse of resources in production
3.5 Eco-efficient production
3.6 Environmental management system/standards
4. Product Stewardship 4.1 Total-life cycle
2.3.3 Sustainable Packaging and Packaging Trends
The third pillar of this thesis proposal is dedicated to the packaging industry. Before elaborating on the
sustainable characteristics of the package designs, an overview of the packaging industry supply chain needs to
be given. Starting with describing the Packaging Value Chain in Figure 4, the major members of the chain can
be seen. On that chain, the packaging producer (converter), which is the center of research in this thesis, is
regarded to be in a vulnerable position. The reason behind this statement lies in the fact that the packaging firm
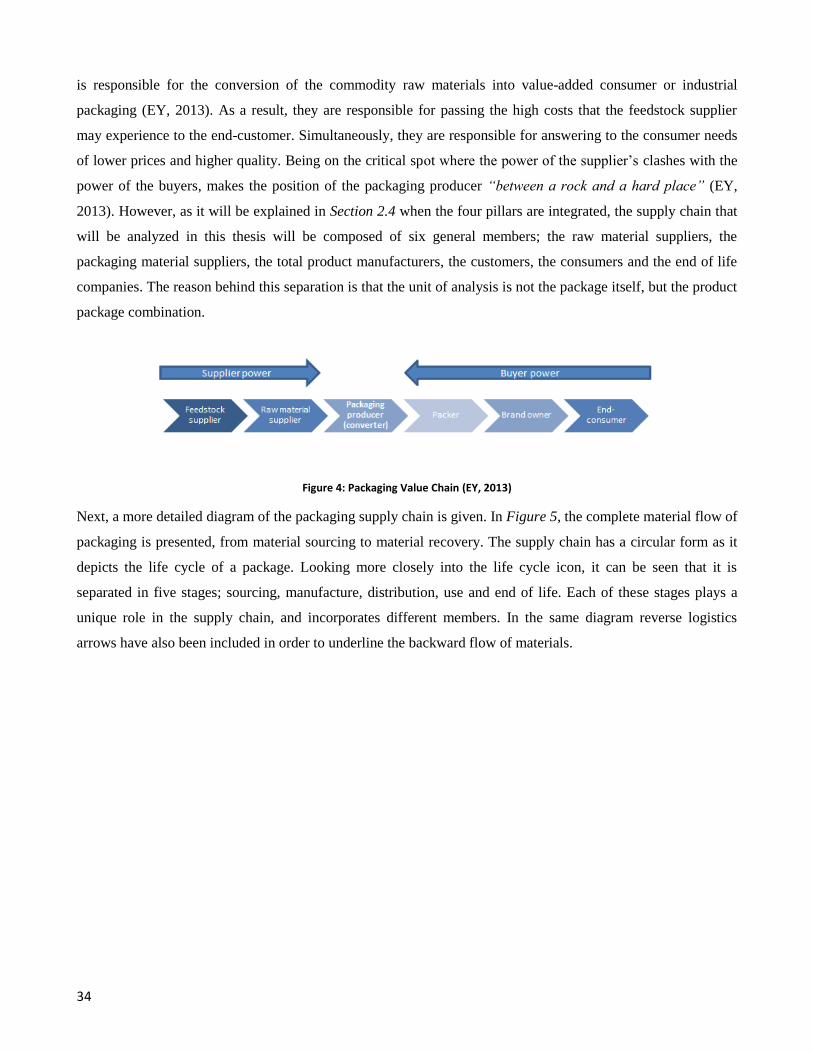
34
is responsible for the conversion of the commodity raw materials into value-added consumer or industrial
packaging (EY, 2013). As a result, they are responsible for passing the high costs that the feedstock supplier
may experience to the end-customer. Simultaneously, they are responsible for answering to the consumer needs
of lower prices and higher quality. Being on the critical spot where the power of the supplier‟s clashes with the
power of the buyers, makes the position of the packaging producer “between a rock and a hard place” (EY,
2013). However, as it will be explained in Section 2.4 when the four pillars are integrated, the supply chain that
will be analyzed in this thesis will be composed of six general members; the raw material suppliers, the
packaging material suppliers, the total product manufacturers, the customers, the consumers and the end of life
companies. The reason behind this separation is that the unit of analysis is not the package itself, but the product
package combination.
Figure 4: Packaging Value Chain (EY, 2013)
Next, a more detailed diagram of the packaging supply chain is given. In Figure 5, the complete material flow of
packaging is presented, from material sourcing to material recovery. The supply chain has a circular form as it
depicts the life cycle of a package. Looking more closely into the life cycle icon, it can be seen that it is
separated in five stages; sourcing, manufacture, distribution, use and end of life. Each of these stages plays a
unique role in the supply chain, and incorporates different members. In the same diagram reverse logistics
arrows have also been included in order to underline the backward flow of materials.
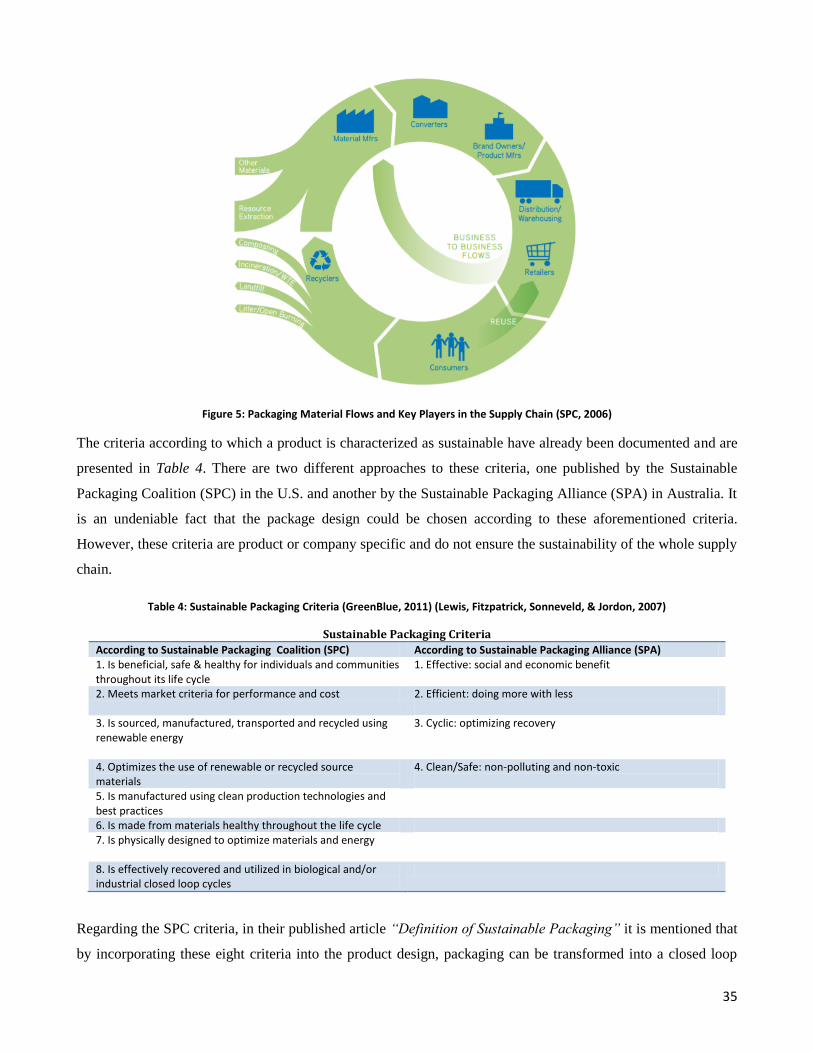
35
Figure 5: Packaging Material Flows and Key Players in the Supply Chain (SPC, 2006)
The criteria according to which a product is characterized as sustainable have already been documented and are
presented in Table 4. There are two different approaches to these criteria, one published by the Sustainable
Packaging Coalition (SPC) in the U.S. and another by the Sustainable Packaging Alliance (SPA) in Australia. It
is an undeniable fact that the package design could be chosen according to these aforementioned criteria.
However, these criteria are product or company specific and do not ensure the sustainability of the whole supply
chain.
Table 4: Sustainable Packaging Criteria (GreenBlue, 2011) (Lewis, Fitzpatrick, Sonneveld, & Jordon, 2007)
Sustainable Packaging Criteria
According to Sustainable Packaging Coalition (SPC) According to Sustainable Packaging Alliance (SPA) 1. Is beneficial, safe & healthy for individuals and communities throughout its life cycle
1. Effective: social and economic benefit
2. Meets market criteria for performance and cost 2. Efficient: doing more with less
3. Is sourced, manufactured, transported and recycled using renewable energy
3. Cyclic: optimizing recovery
4. Optimizes the use of renewable or recycled source materials
4. Clean/Safe: non-polluting and non-toxic
5. Is manufactured using clean production technologies and best practices
6. Is made from materials healthy throughout the life cycle 7. Is physically designed to optimize materials and energy
8. Is effectively recovered and utilized in biological and/or industrial closed loop cycles
Regarding the SPC criteria, in their published article “Definition of Sustainable Packaging” it is mentioned that
by incorporating these eight criteria into the product design, packaging can be transformed into a closed loop
36
flow of packing materials, or in other words a sustainable packaging system (GreenBlue, 2011). In this system,
every product provides benefit throughout its life cycle. Nevertheless, a sustainable system does not also imply
the existence of a sustainable supply chain. The main counter argument lies in the fact that from the supply
chain perspective, the needs and constraints of all actors are taken into account and need to be satisfied, such as
those of shareholders, partners, customers, government officials and competitors among others.
Regarding the SPA criteria, the authors of the article “Sustainable Packaging Redefined”, claim that pursuing
sustainability goals individually at the company level is not an efficient measure towards achieving overall
sustainability in the supply chain (Lewis, Fitzpatrick, Sonneveld, & Jordon, 2007). The reason behind this is that
this approach does not reflect on the complex role of packaging and the systems that supply chains are part of
(Lewis, et al., 2007). Even though the scope of this thesis agrees with the stance of SPA, the four criteria that
they propose are quite vague and can be interpreted in different ways according to the goals of the decision-
maker.
An interesting and informative book related to alternative packaging solutions, called “Paper and paperboard
innovations and developments for the packaging of food, beverages and other fast-moving consumer goods”
was published in 2013. This is the book where the ideas towards the selection of the alternative package designs
stem from. The proposals for the alternatives come from a range of innovations that enhance performance with
regard to consumers‟ valued product characteristics and packaging attributes (Coles R. , 2013). The most
striking packaging solutions mentioned, are Security Packaging, Smart or intelligent packaging, Active
packaging (AP), Modified atmosphere packaging (MAP), Biodegradable and compostable packaging. However,
in this thesis, certain products will be selected and their respective package alternatives evaluated according to
the sustainable packaging criteria that will be identified.
2.3.4 Food Packaging Industry
The history of modern food packaging is believed to have begun in the 19th century with the invention of
canning by Nicholas Appert (Brody, Bugusu, Han, Sand, & McHugh, 2008). Since then the industry has seen
great advances which have led to improved food quality and safety. These advances were mostly driven by
changing consumer preferences, which in turn have led to rising attention towards sustainable packaging, an
increase in the use of the packaging value chain relationships for competitive advantage, and the introduction of
the evolving role of food service packaging (Brody, et al., 2008).
The most commonly used approach that has been followed in estimating sustainability in the food packaging
industry, is the complete Life Cycle Assessment (LCA). It is an analytical method that is used to evaluate the
resource consumption and environmental burdens associated with a product, process or activity (Heller &

37
Keoleian, 2003). Even though the main task of packaging is to protect and distribute the right product to the
right end-user in a safe, cost-efficient and user-friendly way, it is often seen merely as a burden for the
environment. However, several assessments of this kind have indicated that the environmental impacts of
packaging are relatively small compared to the environmental impacts of the packed food products that they
contain (Grönman, et al., 2013). The most severe environmental consequences of packed foods are attributed to
food losses and are mainly caused by overproduction and excess portion quantities. As mentioned by (Grönman,
et al., 2013) the challenge in selecting the optimal package design is finding the perfect balance between the
product and the packaging. As a result, in this thesis, specific product-package combinations will be tracked and
analyzed.
In order to study and track the supply chain of a product-package combination, the complete life cycle has to be
identified. In their article (Heller & Keoleian, 2003), assess the sustainability of the U.S. food system and
suggest ways of how this complex system can be improved. They suggest that a product life cycle approach
provides a framework for studying the links between satisfying societal needs, the natural and economic
processes that are used for this reason, and lastly their corresponding environmental consequences. In their
analysis, they separate the life cycle of a product in the food industry in five stages, from the beginning until the
end of the supply chain. For each stage, they incorporate the stakeholders that take part in the supply, the
manufacturing and the distribution process of the product, and also those who are affected by its
commercialization and ownership. Furthermore, for each life cycle stage, a number of key performance
indicators are presented, separated among the TBL of sustainability. These indicators describe how
sustainability can be assessed according to the economic, social and environmental effects of the food product
under study. The corresponding findings regarding the U.S. food industry are summarized in Table 5.
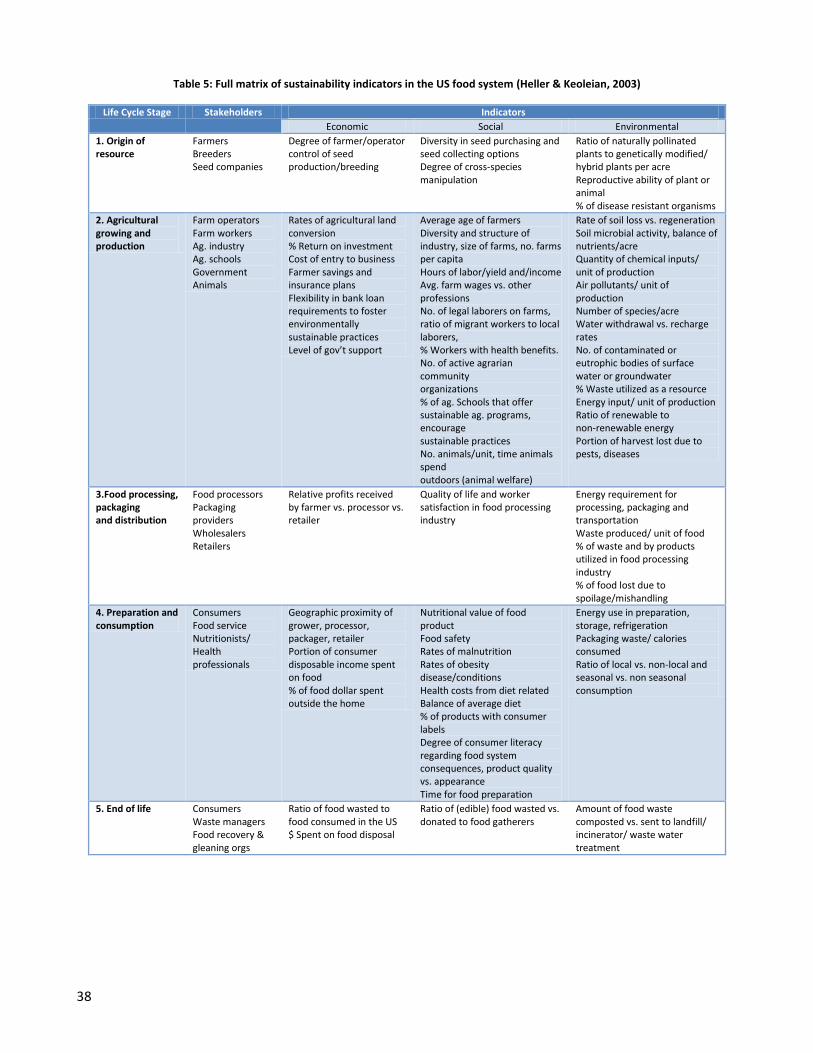
38
Table 5: Full matrix of sustainability indicators in the US food system (Heller & Keoleian, 2003)
Life Cycle Stage Stakeholders Indicators
Economic Social Environmental
1. Origin of resource
Farmers Breeders Seed companies
Degree of farmer/operator control of seed production/breeding
Diversity in seed purchasing and seed collecting options Degree of cross-species manipulation
Ratio of naturally pollinated plants to genetically modified/ hybrid plants per acre Reproductive ability of plant or animal % of disease resistant organisms
2. Agricultural growing and production
Farm operators Farm workers Ag. industry Ag. schools Government Animals
Rates of agricultural land conversion % Return on investment Cost of entry to business Farmer savings and insurance plans Flexibility in bank loan requirements to foster environmentally sustainable practices Level of gov’t support
Average age of farmers Diversity and structure of industry, size of farms, no. farms per capita Hours of labor/yield and/income Avg. farm wages vs. other professions No. of legal laborers on farms, ratio of migrant workers to local laborers, % Workers with health benefits. No. of active agrarian community organizations % of ag. Schools that offer sustainable ag. programs, encourage sustainable practices No. animals/unit, time animals spend outdoors (animal welfare)
Rate of soil loss vs. regeneration Soil microbial activity, balance of nutrients/acre Quantity of chemical inputs/ unit of production Air pollutants/ unit of production Number of species/acre Water withdrawal vs. recharge rates No. of contaminated or eutrophic bodies of surface water or groundwater % Waste utilized as a resource Energy input/ unit of production Ratio of renewable to non-renewable energy Portion of harvest lost due to pests, diseases
3.Food processing, packaging and distribution
Food processors Packaging providers Wholesalers Retailers
Relative profits received by farmer vs. processor vs. retailer
Quality of life and worker satisfaction in food processing industry
Energy requirement for processing, packaging and transportation Waste produced/ unit of food % of waste and by products utilized in food processing industry % of food lost due to spoilage/mishandling
4. Preparation and consumption
Consumers Food service Nutritionists/ Health professionals
Geographic proximity of grower, processor, packager, retailer Portion of consumer disposable income spent on food % of food dollar spent outside the home
Nutritional value of food product Food safety Rates of malnutrition Rates of obesity disease/conditions Health costs from diet related Balance of average diet % of products with consumer labels Degree of consumer literacy regarding food system consequences, product quality vs. appearance Time for food preparation
Energy use in preparation, storage, refrigeration Packaging waste/ calories consumed Ratio of local vs. non-local and seasonal vs. non seasonal consumption
5. End of life Consumers Waste managers Food recovery & gleaning orgs
Ratio of food wasted to food consumed in the US $ Spent on food disposal
Ratio of (edible) food wasted vs. donated to food gatherers
Amount of food waste composted vs. sent to landfill/ incinerator/ waste water treatment
39
2.4 Integration of the Four Pillars and the Knowledge Gap
In this section the four main pillars of the value of sustainability, SSCM, sustainable packaging and the food
packaging industry will be integrated. By expanding sustainability to all the operations of a firm in the food
packaging industry, it can be implied that sustainability stretches the concept of SSCM to look at optimizing
operations from a broader perspective (Linton, et al., 2007). As depicted in Figure 5 in the Packaging Material
Flow diagram of Section 2.3.3, the value of sustainability incorporates the entire production system and the post
production stewardship as opposed to just the production of a specific product.
Likewise, in this thesis, the supply chain sustainability criteria are going to be used for assessing the optimal
product design and as opposed to using the product specific ones. These criteria will be derived by first
translating the sustainability drivers and barriers of Table 1, Table 2 and Table 3 into quantifiable metrics. To
fulfill this cause, also Table 5 will be used, since it contains various metrics used in assessing sustainability of
the food industry. Then the criteria published by SPC and SPA that were presented in Table 3 will be checked
for incorporating the aspect of the whole supply chain and if not, will be corrected accordingly. In the end, a
final list with supply chain package design sustainability criteria will be created, that will cover the complete life
cycle of the product-package combination and enhance the value of sustainability in the supply chain of the
packaging industry. The detailed process of formulating the criteria list is presented in Section 2.5.1.
The definition of TBL, as presented in the beginning of this chapter in Section 2.1, is judged as incomplete by
many authors, who claim that it should be expanded (Carter & Rogers, 2008). They suggest that the terms of
risk management, transparency, strategy and culture should be added in the graph of TBL as it is depicted in
Figure 6. Starting with risk management, it is placed in the intersection of environmental and economic
performance and includes all the risk factors that a firm should strive to minimize as part of its sustainable
development. Next, in the intersection between economic and social performance lies transparency, or in other
words the opening of a company‟s operations to greater public scrutiny. It cannot be left unnoticed that the third
intersection is depicted with a question mark. This question mark symbolizes the fact that solely environmental
and social activities are costly undertakings and competitive firms do not engage in them unless it fits their
strategic and financial objectives (Carter & Rogers, 2008). Lastly, this framework also implies that strategy and
organizational culture should comply, co-exist and co-evolve with the sustainable practices of the firm. It is this
framework of SSCM that is going to be used in this thesis proposal, since it is a more complete version of TBL.
In addition it can be applied in the supply chain of the food packaging industry without any complications, and
thus the integration of the four pillars can be achieved.

40
Figure 6: SSCM Framework (Carter & Rogers, 2008)
In Figure 7, the framework proposed by (Grönman, et al., 2013) on how to design a sustainable food package is
depicted. This framework takes into consideration the whole life cycle of the product-package combination and
focuses on the key goals of packaging. The sequence of the steps is absolute, since this approach is constructed
in a way that introduces different criteria and different methods in certain order, a fact that that allows the
packaging designers to integrate different requirements in their work. It has to be underlined that in this thesis
only the primary packaging level is taken into account, and not the other two.
In their article, they came up with this framework after criticizing the already established methods regarding
package sustainability assessment. Firstly, regarding the sustainability Checklists that have been proposed, they
claim that they are very broad and require from the decision maker to possess complementary knowledge of the
specific product-package combination. Next, concerning the implementation of certain LCA tools, such as the
Pack-In Tool, it is claimed that there is a risk of oversimplification or mistakes in the interpretation of the
system boundaries or results. Lastly, with the LCA the package is differentiated from the product it contains and
is assessed as an independent product. This results in neglecting the environmental impacts of the contained
product, such as food losses.
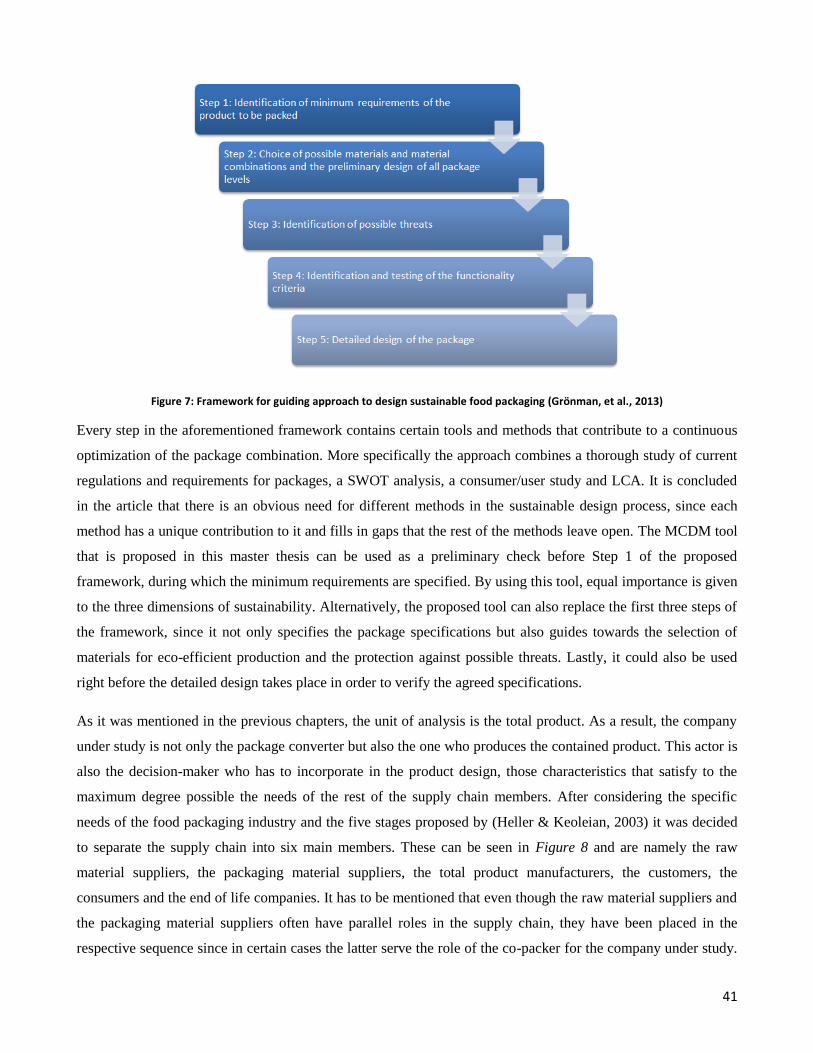
41
Figure 7: Framework for guiding approach to design sustainable food packaging (Grönman, et al., 2013)
Every step in the aforementioned framework contains certain tools and methods that contribute to a continuous
optimization of the package combination. More specifically the approach combines a thorough study of current
regulations and requirements for packages, a SWOT analysis, a consumer/user study and LCA. It is concluded
in the article that there is an obvious need for different methods in the sustainable design process, since each
method has a unique contribution to it and fills in gaps that the rest of the methods leave open. The MCDM tool
that is proposed in this master thesis can be used as a preliminary check before Step 1 of the proposed
framework, during which the minimum requirements are specified. By using this tool, equal importance is given
to the three dimensions of sustainability. Alternatively, the proposed tool can also replace the first three steps of
the framework, since it not only specifies the package specifications but also guides towards the selection of
materials for eco-efficient production and the protection against possible threats. Lastly, it could also be used
right before the detailed design takes place in order to verify the agreed specifications.
As it was mentioned in the previous chapters, the unit of analysis is the total product. As a result, the company
under study is not only the package converter but also the one who produces the contained product. This actor is
also the decision-maker who has to incorporate in the product design, those characteristics that satisfy to the
maximum degree possible the needs of the rest of the supply chain members. After considering the specific
needs of the food packaging industry and the five stages proposed by (Heller & Keoleian, 2003) it was decided
to separate the supply chain into six main members. These can be seen in Figure 8 and are namely the raw
material suppliers, the packaging material suppliers, the total product manufacturers, the customers, the
consumers and the end of life companies. It has to be mentioned that even though the raw material suppliers and
the packaging material suppliers often have parallel roles in the supply chain, they have been placed in the
respective sequence since in certain cases the latter serve the role of the co-packer for the company under study.
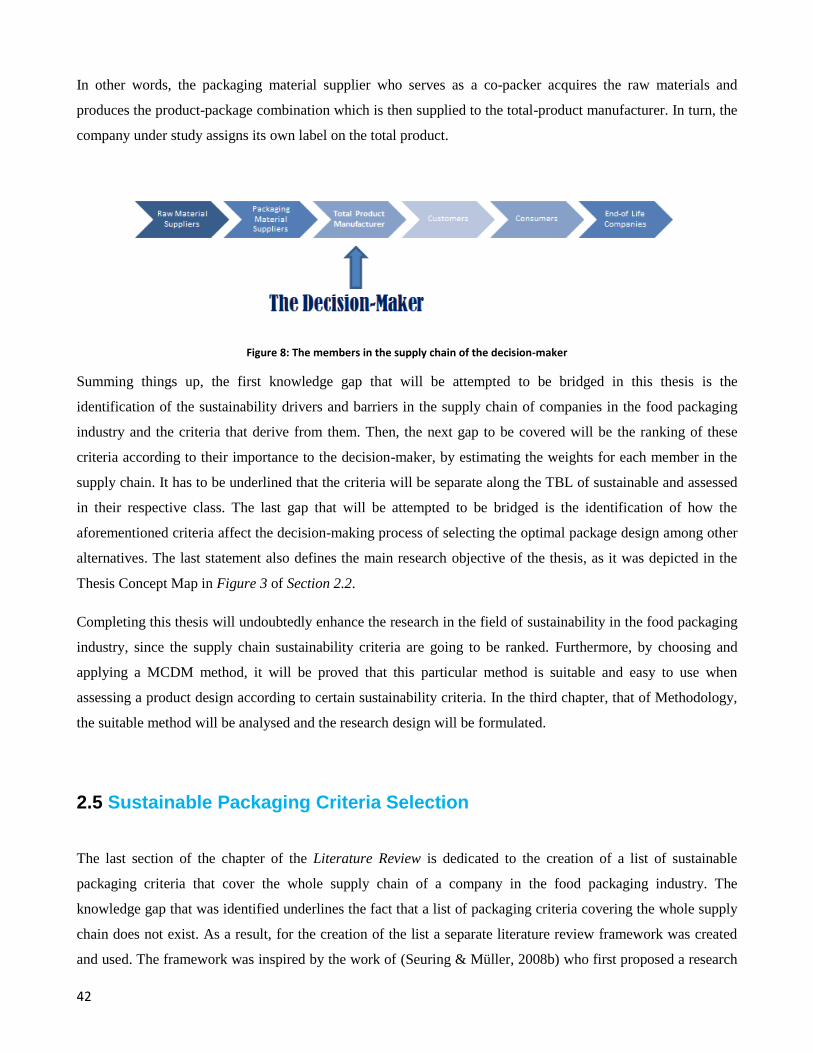
42
In other words, the packaging material supplier who serves as a co-packer acquires the raw materials and
produces the product-package combination which is then supplied to the total-product manufacturer. In turn, the
company under study assigns its own label on the total product.
Figure 8: The members in the supply chain of the decision-maker
Summing things up, the first knowledge gap that will be attempted to be bridged in this thesis is the
identification of the sustainability drivers and barriers in the supply chain of companies in the food packaging
industry and the criteria that derive from them. Then, the next gap to be covered will be the ranking of these
criteria according to their importance to the decision-maker, by estimating the weights for each member in the
supply chain. It has to be underlined that the criteria will be separate along the TBL of sustainable and assessed
in their respective class. The last gap that will be attempted to be bridged is the identification of how the
aforementioned criteria affect the decision-making process of selecting the optimal package design among other
alternatives. The last statement also defines the main research objective of the thesis, as it was depicted in the
Thesis Concept Map in Figure 3 of Section 2.2.
Completing this thesis will undoubtedly enhance the research in the field of sustainability in the food packaging
industry, since the supply chain sustainability criteria are going to be ranked. Furthermore, by choosing and
applying a MCDM method, it will be proved that this particular method is suitable and easy to use when
assessing a product design according to certain sustainability criteria. In the third chapter, that of Methodology,
the suitable method will be analysed and the research design will be formulated.
2.5 Sustainable Packaging Criteria Selection
The last section of the chapter of the Literature Review is dedicated to the creation of a list of sustainable
packaging criteria that cover the whole supply chain of a company in the food packaging industry. The
knowledge gap that was identified underlines the fact that a list of packaging criteria covering the whole supply
chain does not exist. As a result, for the creation of the list a separate literature review framework was created
and used. The framework was inspired by the work of (Seuring & Müller, 2008b) who first proposed a research
43
process of a structuring content analysis. First, the methodology that was followed for the creation of the list will
be described and then the development process of the concept map of the food packaging industry will be
presented. Then the literature for the formulation of the criteria will be summarized and elaborated along the
three dimensions of sustainability, namely the environmental, economic and social. This section ends with the
presentation of the framework and its validation.
2.5.1 Methodology for Selecting the Sustainable Packaging Criteria
The aforementioned content analysis is based on the idea that from a methodological point of view, literature
reviews can be comprehended as content analysis, where quantitative and qualitative aspects are mixed to assess
structural and content criteria (Seuring & Müller, 2008b). The process contains four main steps; namely the
material collection step, the descriptive analysis step, where formal aspects of the material are assessed, the
category selection step, where structural dimensions and analytic categories are selected and lastly the material
evaluation step where the collected material is analysed according to these dimensions and categories. For the
last two steps of the process, where material analysis takes place, (Seuring & Müller, 2008b) designed a
framework that contains a feedback loop for the revision of the structural dimensions and analytic categories.
This content analysis was modified and used as a development process for a conceptual framework more
recently by (Wan Ahmad, et al., 2017) in an article elaborating on the contextual factors of SSCM practises in
the O&G industry. Even though, the relation with the food packaging industry is scarce, the approach taken in
this paper is highly correlated to the perspective of this thesis, since it takes into account all three dimensions of
sustainability. Furthermore, the contextual factors described in this paper do not derive strictly from literature
regarding the O&G industry due to lack of related sources, but rather from literature dedicated to sustainable
development in the supply chain of various industries, including the O&G industry. (Wan Ahmad, et al. 2017)
managed to accurately depict in the form of a concept map the business and organizational environment of a
company in the O&G industry. It has to be noted that literature applicable only to the O&G industry was not
taken into consideration in any step of the criteria list formation process. The same goal will be attempted to be
reached in this thesis for a company in the food packaging industry. From the concept map of SSCM in the food
packaging industry, the criteria are going to be derived. For the aforementioned reasons, this article is regarded
as a milestone for the creation of the sustainable packaging criteria list.
Regarding the material collection step, studies and scientific articles related to the integration of the four pillars
of the master thesis were collected. The identification of the relevant studies was more detailed than in the
general literature review, since in this part the context from which the criteria would be derived was
investigated. The studies were identified through a structured keyword search (i.e. “sustainable”, “supply chain”,

44
“package”, “food”, “criteria”, “factors”) in four electronic databases namely Emerald, Elsevier, Springer and
Wiley. Furthermore, Science Direct and Google Scholar were also used as complementary search engines in this
part of the process and publications of organizations related to sustainable packaging were also used. Next, a
selection procedure was followed for the literature that was searched. Each individual study had to belong to at
least two of the four pillars of the main literature review, namely “The Value of Sustainability”, “Sustainable
Supply Chain Management Findings and Definitions”, “Sustainable Packaging and Packaging Trends”, “Food
Packaging Industry”. In other words, each study should individually contribute to the integration of the four
pillars of literature review.
As it was previously mentioned, apart from the sustainable packaging criteria published by the Sustainable
Packaging Coalition (GreenBlue, 2011) and the Sustainable Packaging Alliance (Lewis, et al., 2007) that were
presented in Table 4, there is no other study explicitly listing sustainable packaging criteria. For this reason,
drivers and barriers of sustainable development were identified for the supply chain of the food packaging
industry and translated into criteria. The next step in the development process of the conceptual framework is
dedicated to the separation of the identified criteria along the Triple Bottom Line of Sustainability. Certain
criteria could belong to more than one dimension; however assumptions were made and in each dimension,
namely environmental, economic and social, the argumentation behind the selection of the dimension is given.
The aforementioned criteria refer to the product-package combination and not the package itself, since the
environmental impacts of packages have been found to be relatively small compared with the food items they
contain (Grönman, et al., 2013). Furthermore, another reason for the unit of analysis in the formation of the
criteria list being the product-package combination is that more successful new product developments are those
that are implemented as a total concept with packaging forming an integral part of the whole (Coles, McDowell,
& Kirwan, 2003). Even though this thesis investigates the effects of these criteria on selecting the optimal sales
or primary packaging, the other two packaging levels should not be neglected. It is important to consider all
three levels of packaging together, namely also the secondary or grouping packaging and the transport or tertiary
packaging, so that a reduction in one component is not cancelled out by an increase in another (FDF & Incpen,
2017).
After having listed the respective criteria, the framework with the contextual factors of the food packaging
industry can be mapped. The framework that is created is then revised by experts at the Kraft Heinz Company
and academics, until everyone agrees that the contextual factors have all been mapped, the criteria are relevant
to selecting a product-package combination, and there are no studies that would add any more sustainable
packaging criteria to the list. A feedback loop is added to the conceptual framework development process so as
to ensure that the process is done in a correct way until the targets are met. In Kraft Heinz, the Head of
Packaging Europe Mr. Guus Lueb, who is also the decision-maker, validated this framework in a structured
interview. The development process is presented in Figure 9. The sources used for the creation of the criteria list
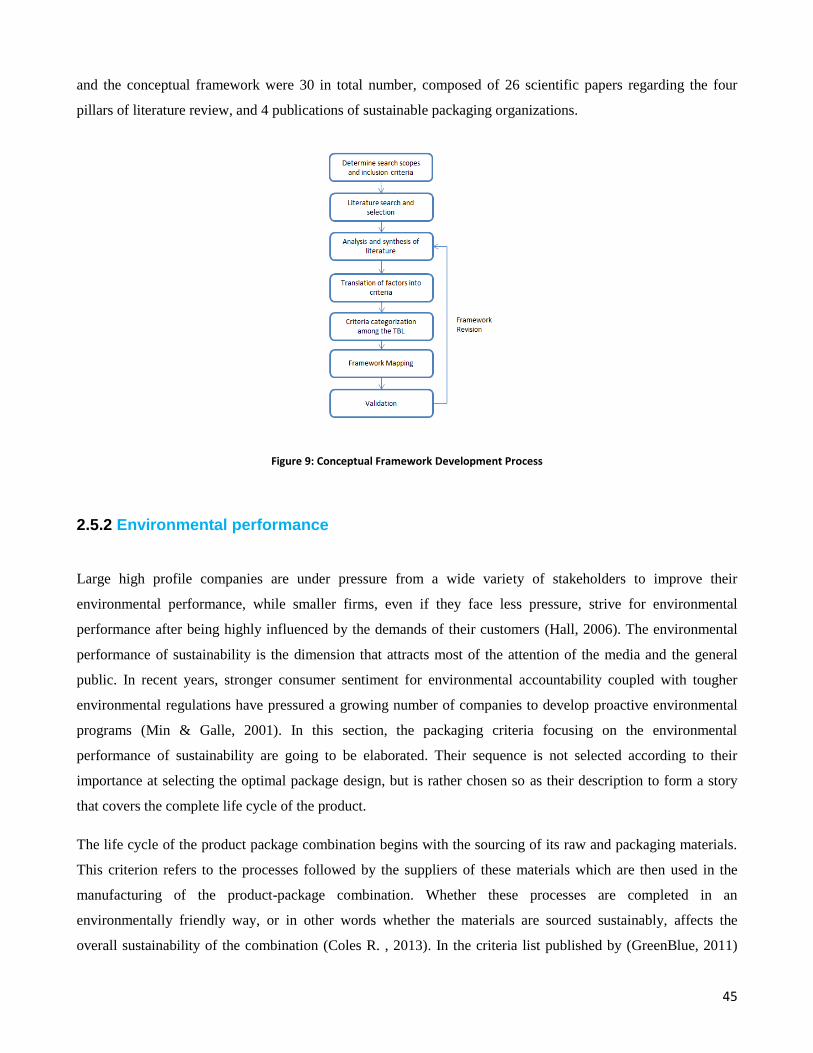
45
and the conceptual framework were 30 in total number, composed of 26 scientific papers regarding the four
pillars of literature review, and 4 publications of sustainable packaging organizations.
Figure 9: Conceptual Framework Development Process
2.5.2 Environmental performance
Large high profile companies are under pressure from a wide variety of stakeholders to improve their
environmental performance, while smaller firms, even if they face less pressure, strive for environmental
performance after being highly influenced by the demands of their customers (Hall, 2006). The environmental
performance of sustainability is the dimension that attracts most of the attention of the media and the general
public. In recent years, stronger consumer sentiment for environmental accountability coupled with tougher
environmental regulations have pressured a growing number of companies to develop proactive environmental
programs (Min & Galle, 2001). In this section, the packaging criteria focusing on the environmental
performance of sustainability are going to be elaborated. Their sequence is not selected according to their
importance at selecting the optimal package design, but is rather chosen so as their description to form a story
that covers the complete life cycle of the product.
The life cycle of the product package combination begins with the sourcing of its raw and packaging materials.
This criterion refers to the processes followed by the suppliers of these materials which are then used in the
manufacturing of the product-package combination. Whether these processes are completed in an
environmentally friendly way, or in other words whether the materials are sourced sustainably, affects the
overall sustainability of the combination (Coles R. , 2013). In the criteria list published by (GreenBlue, 2011)
46
that was presented in Table 4, the processes of sourcing, manufacturing, transportation and recycling were
regarded as a single criterion. However, for the purpose of creating a list with distinct criteria, they are taken
into account as completely different but interconnected activities. Most packaging material suppliers rely on
fuel-based energy for the extraction, collection and delivery of the materials and thus, a transition to renewable
energy will be a step towards sustainable development (GreenBlue, 2011). Examples of types of renewable
energy that could alternatively be used are passive and active solar energy, wind power, hydroelectric, biomass
in the forms of biofuels and bio-power, tidal and geothermal energy. In the list of supply chain function-related
factors of (Wan Ahmad, et al., 2017), the choice of environmentally friendly types of transport is underlined. A
barge supplier could be selected for example, instead of one who only uses the road network for the delivery of
the raw or packaging materials to the manufacturing sites. The energy issue in the sourcing activities is also
stressed by (Heller & Keoleian, 2003), who propose the estimation of environmental indicators related to
agricultural growing and production, such as the ratio of renewable to non-renewable energy used for the
collection of the raw and packaging materials and the energy input per unit of production. It has to be underlined
that green purchasing strategies as a part of the inbound logistics phase of supply chain management, is
elaborated in the social performance criterion of sustainability, namely “Suppliers and carriers are certified and
pass the environmental and social criteria” (Colicchia, Melacini, & Perotti, 2011). The criterion was placed in
the list of the social performance of sustainability firstly because the suppliers are required to also have social
certifications in addition to the environmental ones, and secondly, so as not to provoke confusion with the
criterion “Sourced in an environmentally friendly way” and achieve the creation of a list with distinct
sustainable packaging criteria.
The second environmental criterion, “Manufactured in an environmentally friendly way”, refers to the
manufacturing processes of the package and the production processes of the contained product. In other words,
it incorporates using clean, eco-efficient production technologies, best practices and renewable energy. Clean
production seeks to implement environmental practices and technologies to reduce the environmental impact of
manufacturing processes including any toxics used or emitted (GreenBlue, 2011). Similarly, eco-efficiency
strategies seek to reduce emissions, energy use, and waste during the manufacturing of the product-package
combination. It is underlined by (Wan Ahmad, et al., 2017), that eco-efficient production affects the
sustainability of the production system and on the same time affects the other supply chain functions. According
to (Zhu, Sarkis, & Lai, 2008), manufacturers believe that Green Supply Chain Management practices should be
multifaceted and incorporate Eco-design practices along with internal environmental management, green
purchasing, cooperation with customers and investment recovery. Additionally, this criterion incorporates the
reduction, avoidance or replacement of hazardous materials in the production process in order to achieve a more
sustainable supply chain (Haldórsson, Kotzab, & Skjøtt-Larsen, 2009).
47
Outbound supply chain is one of the major sources of environmental problems, with the most critical element
being the emissions during transportation (Colicchia, et al., 2011). The criterion “Transported in an
environmentally friendly way” refers to the processes followed by the distributors of the product-package
combination after its production. Distribution of the finished goods could take place internally with the
company‟s own transportation vehicles, or with the use of third party logistics groups. Nevertheless,
transportation is a significant source of fossil fuel consumption associated with packaging. Companies
experience direct cost benefit from improving fleet performance through optimized distribution and better fuel
efficiency (GreenBlue, 2011). The use of alternative fuels, hybrid vehicles and innovative technologies are steps
towards sustainable development. The sustainability in the supply chain is affected by the choice of
environmentally friendly distribution channels and also the type of transport that is selected (Haldórsson, et al.,
2009) (Wan Ahmad, et al., 2017). Possible approaches towards sustainable development in the supply chain are
firstly vehicle optimization in order to reduce the carbon footprint during physical distribution, secondly the
selection of greener transportation modes, such as the combined use of road and either rail or sea transportation
or even inland navigation, and thirdly the logistics optimization with the aim of reducing the travel distances
(Colicchia, et al., 2011).
The criterion “Recycled, reused, disposed in an environmentally friendly way” refers to the processes in the end
life of the product-package combination. More specifically, it refers to the use of renewable energy in recycling,
reuse or disposal of the package, and whether the process that is selected for the end of life of the product
package combination is environmentally friendly (GreenBlue, 2011). Furthermore, it also refers to its ability to
be easily recycled, reused or disposed that stems from the selection of its packaging materials, or in other words
how easy it is to be emptied and sorted. The product-package combination should be assessed for its
biodegradability, reusability and recyclability during the end of life phase along its value chain (Grönman, et al.,
2013). According to (Olander-Roese & Nilsson, 2009), packaging affects both business effectiveness and
efficiency aspects, with the first referring to boosting sales and the second referring to achieving convenient
return flows with the appropriate use of recovery, reuse and disposal processes, in order to reduce the
environmental impact of the product-package combination. Avoiding disposal by the use of incineration, open
burning, sea or sewer dumping and sanitary landfills are necessary measures towards sustainable development in
the supply chain.
The next criterion, “Uses recycled, renewable, reused sourced materials”, refers to the selection of the
packaging materials that are used in the manufacturing of the package. The use of recycled or bio-based,
renewable and reused materials from well-managed sources can contribute to sustainable material flows, to the
conservation of resources and to waste reduction (GreenBlue, 2011). Even though these materials ensure the
conservation of resources for future generations, it has to be investigated whether the inclusion of recycled
content produces unfavorable trade-offs or violates the European food contact legislation (FDF & Incpen, 2017).
48
For example, using recycled or reused sourced materials may increase the greenhouse gas emissions or may
require significantly more material to maintain the same package functionality. The capability of the production
process to use certain materials, to integrate reusable or remanufactured components and prevent waste can
influence the sustainability of the whole supply chain (Zhu, Sarkis, & Lai, 2008). In turn, the strategy used in the
production activity can have a strong effect on other interconnected supply chain functions (Wan Ahmad, et al.,
2017). In order to underline the differences between this and the sustainable packaging criterion that is
elaborated next, it has to be noted that the 3R materials that are used in the production process may be originated
from outside of the industrial closed loop cycle of the product-package combination under study.
An environmental performance sustainable criterion, closely related in context with the previous one, is the
“Recovered and utilized in industrial closed loop cycles”. This criterion refers to completing the life cycle of the
product-package combination by closing the loop (Seuring & Müller, 2008a). It incorporates the process of
effective recovery, which achieves the significant collection and recovery of material at the highest value that is
economically feasible (GreenBlue, 2011). An industrial closed loop cycle provides valuable resources for the
next generation of manufacturing or production, with the most prevalent recovery options being namely, the
biological, technical and energy recovery methods (GreenBlue, 2011). In other words, this criterion refers to
reusing packaging materials of end products for the production of a later batch. However, in order to set the base
for the implementation of effective recovery, the cooperation and vertical integration of the supply chain
members is imminent (Carter & Rogers, 2008) (Wolf, 2011), since coordinated efforts are needed for
establishing appropriate recovery and building collection infrastructures (FDF & Incpen, 2017) and for
introducing packaging that is designed for recovery (Envirowise & Incpen, 2008). Various studies in SSCM
underline a link between industrial ecology and closed loop supply chains. However, they do not take a reverse
logistics or remanufacturing perspective, since the focus is more on a rather forward supply chain (Seuring &
Müller, 2008b).
The next criterion, “Manages Environmental risk”, refers to minimizing the ecological impact of the product-
package combination. Risk, is defined as the probability of variation surrounding an anticipated outcome (Carter
& Rogers, 2008) and in this case refers to the degree that the processes in the complete life cycle of the product-
package combination do not violate the existing environmental policies. In other words, this criterion ensures
that toxic emissions are kept inside the control limits. A suggested indicator for measuring environmental
performance is the greenhouse gas emissions measured in CO2 equivalents over the total life cycle and
distribution chain of the packaging system (Svanes, Vold, Møller, Pettersen, Larsen, & Hanssen, 2010).
However, a carbon footprint is just one part of the data that would be covered by a Life-Cycle Assessment and
should not be used as a proxy for total environmental impact. The LCA measures overall environmental impact
an internationally agreed methodology developed by ISO (ISO 14040 and ISO 14044) guides its implementation
(Envirowise & Incpen, 2008). Risk management concerning sustainability had not been incorporated in
49
sustainable supply chain management studies until (Carter & Rogers, 2008) included it as a supporting facet of
the TBL. Since then, various authors have given increased attention to all three dimensions of sustainable risk
management, namely environmental, economic and social risk (Wolf, 2011). These dimensions are taken into
account as different sustainable packaging criteria in this thesis, and are elaborated thoroughly in each respective
performance of sustainability.
The criterion “Integration with the Environmental Management System” refers to how the introduction of the
product-package combination affects the current Environmental Management System (EMS). The EMS is a set
of processes and practices that enable an organization to reduce its environmental impacts and increase its
operating efficiency (EPA, 2017). An EMS consists of the knowledge base of the organization concerning
environmental issues and includes the intellectual assets of personnel, databases, environmental cost tracking
tools and impact assessment systems, making it an invaluable tool when seeking information (Handfield, Sroufe,
& Walton, 2005). The introduction of the new product-package combination should be in accordance with the
existing system (Zhu, Sarkis, & Lai, 2008). In case the organization has not already established an operating
EMS, ISO 14000 standards and beyond provide a framework on how an organization can develop and apply a
system that best fits their needs (Carter & Rogers, 2008).
Furthermore, another sustainable packaging criterion referring to the environmental performance of
sustainability is “Product Stewardship” and refers to how the product-package combination is managed
throughout its life cycle. In addition, it refers to the degree that sustainability can be assessed from the earliest
stages of its development until its end life and on parallel from the beginning until the end of the supply chain.
This can be estimated by the implementation of the Life Cycle Assessment (LCA). The LCA is a decision-
making tool that is developed for the integration of environmental concerns throughout the supply chain (Wan
Ahmad, et al., 2017). Product stewardship is also related to risk management, since it allows an organization to
swiftly recall a damaged product (Carter & Rogers, 2008) and to closed loop supply chains when packaging
materials are tracked in order to be reused (Seuring & Müller, 2008a).
Another packaging criterion found to be used thoroughly in the literature is “Uses healthy sourced materials”.
Referring to the concept of the total product this criterion incorporates the use of healthy materials during the
manufacturing of the package or the production of the contained product. Healthy materials are those that do not
release harmful substances to the environment throughout their complete life cycle (GreenBlue, 2011).
Examples of indicators that have been proposed for measuring the degree of healthiness of the sourced materials
are the quantity of chemical inputs and air pollutants per unit of production (Heller & Keoleian, 2003).
According to (Grönman, et al., 2013), the hygiene of the product should not be compromised during the
production and distribution chain, the product-package combination should not cause any risk of accidents along
the chain and the migration of materials and additives from the package into the food should be prevented. In
order to assess the healthiness of the sourced materials, their origin needs be traced and it has to be taken into
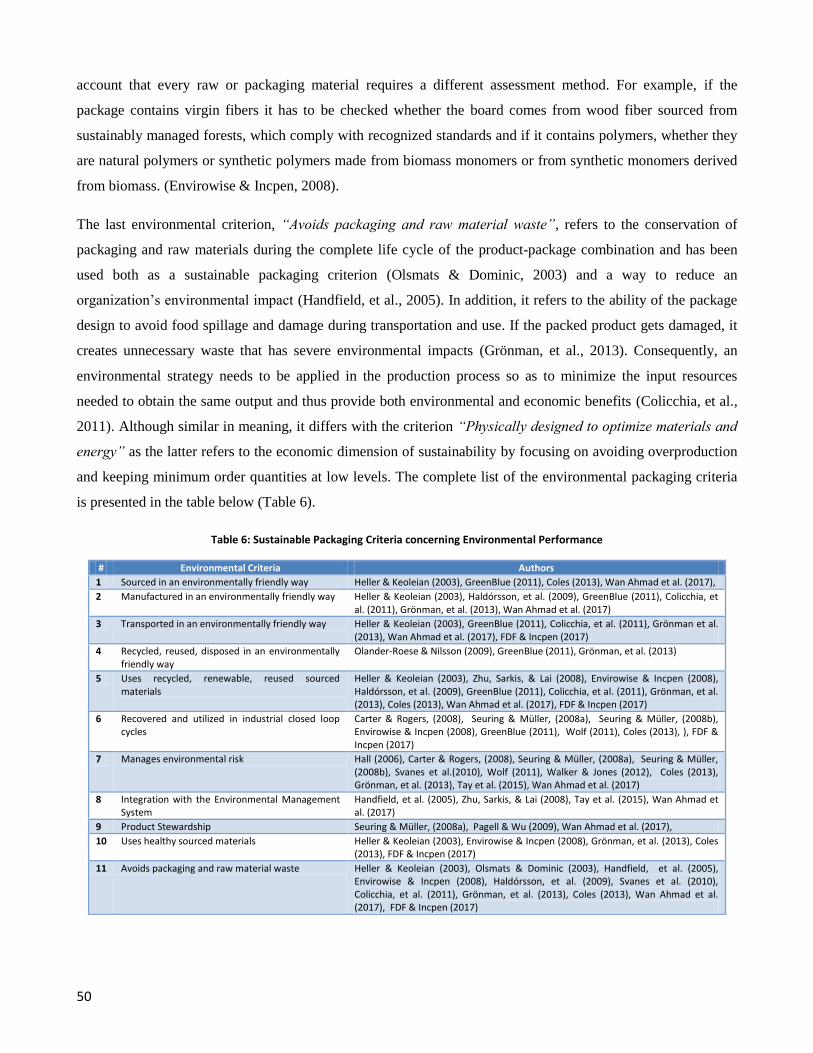
50
account that every raw or packaging material requires a different assessment method. For example, if the
package contains virgin fibers it has to be checked whether the board comes from wood fiber sourced from
sustainably managed forests, which comply with recognized standards and if it contains polymers, whether they
are natural polymers or synthetic polymers made from biomass monomers or from synthetic monomers derived
from biomass. (Envirowise & Incpen, 2008).
The last environmental criterion, “Avoids packaging and raw material waste”, refers to the conservation of
packaging and raw materials during the complete life cycle of the product-package combination and has been
used both as a sustainable packaging criterion (Olsmats & Dominic, 2003) and a way to reduce an
organization‟s environmental impact (Handfield, et al., 2005). In addition, it refers to the ability of the package
design to avoid food spillage and damage during transportation and use. If the packed product gets damaged, it
creates unnecessary waste that has severe environmental impacts (Grönman, et al., 2013). Consequently, an
environmental strategy needs to be applied in the production process so as to minimize the input resources
needed to obtain the same output and thus provide both environmental and economic benefits (Colicchia, et al.,
2011). Although similar in meaning, it differs with the criterion “Physically designed to optimize materials and
energy” as the latter refers to the economic dimension of sustainability by focusing on avoiding overproduction
and keeping minimum order quantities at low levels. The complete list of the environmental packaging criteria
is presented in the table below (Table 6).
Table 6: Sustainable Packaging Criteria concerning Environmental Performance
# Environmental Criteria Authors
1 Sourced in an environmentally friendly way Heller & Keoleian (2003), GreenBlue (2011), Coles (2013), Wan Ahmad et al. (2017),
2 Manufactured in an environmentally friendly way Heller & Keoleian (2003), Haldórsson, et al. (2009), GreenBlue (2011), Colicchia, et al. (2011), Grönman, et al. (2013), Wan Ahmad et al. (2017)
3 Transported in an environmentally friendly way Heller & Keoleian (2003), GreenBlue (2011), Colicchia, et al. (2011), Grönman et al. (2013), Wan Ahmad et al. (2017), FDF & Incpen (2017)
4 Recycled, reused, disposed in an environmentally friendly way
Olander-Roese & Nilsson (2009), GreenBlue (2011), Grönman, et al. (2013)
5 Uses recycled, renewable, reused sourced materials
Heller & Keoleian (2003), Zhu, Sarkis, & Lai (2008), Envirowise & Incpen (2008), Haldórsson, et al. (2009), GreenBlue (2011), Colicchia, et al. (2011), Grönman, et al. (2013), Coles (2013), Wan Ahmad et al. (2017), FDF & Incpen (2017)
6 Recovered and utilized in industrial closed loop cycles
Carter & Rogers, (2008), Seuring & Müller, (2008a), Seuring & Müller, (2008b), Envirowise & Incpen (2008), GreenBlue (2011), Wolf (2011), Coles (2013), ), FDF & Incpen (2017)
7 Manages environmental risk Hall (2006), Carter & Rogers, (2008), Seuring & Müller, (2008a), Seuring & Müller, (2008b), Svanes et al.(2010), Wolf (2011), Walker & Jones (2012), Coles (2013), Grönman, et al. (2013), Tay et al. (2015), Wan Ahmad et al. (2017)
8 Integration with the Environmental Management System
Handfield, et al. (2005), Zhu, Sarkis, & Lai (2008), Tay et al. (2015), Wan Ahmad et al. (2017)
9 Product Stewardship Seuring & Müller, (2008a), Pagell & Wu (2009), Wan Ahmad et al. (2017),
10 Uses healthy sourced materials Heller & Keoleian (2003), Envirowise & Incpen (2008), Grönman, et al. (2013), Coles (2013), FDF & Incpen (2017)
11 Avoids packaging and raw material waste Heller & Keoleian (2003), Olsmats & Dominic (2003), Handfield, et al. (2005), Envirowise & Incpen (2008), Haldórsson, et al. (2009), Svanes et al. (2010), Colicchia, et al. (2011), Grönman, et al. (2013), Coles (2013), Wan Ahmad et al. (2017), FDF & Incpen (2017)
51
2.5.3 Economic performance
This section is dedicated to the description of the sustainable packaging criteria corresponding to the economic
dimension of sustainability. It was found that organizations regard the economic performance of sustainability
as the most important of the three, since it can be argued that without economic success, no supply chain will
exist in the long run (Seuring & Müller, 2008a). Without the economic payback, packaging developers will need
to somehow be able to convince top management of the benefits of the other two sustainability performances
(Zhu, Sarkis, & Geng, 2005). The environmental and social practices should be coupled with economic
objectives in order to develop a clear, long-term strategy which will include supply chain management activities.
This way, a longer-lasting and less imitable set of processes is created (Carter & Rogers, 2008).
The first criterion regarding the economic performance of sustainability, “Performance meets market needs”
refers to the ability of the product-package combination to respond to customer and consumer needs. In other
words, the total product has the qualities needed to acquire a competitive position in the market and satisfy the
customers and the consumers. All members in the supply chain should strive for delivering the promised quality
product, and ideally the suppliers should communicate directly with the retailers, the wholesalers and the end
users regarding its specifications (Handfield, et al., 2005). Furthermore, the trends towards co-operation and
partnership approaches between customers and suppliers, mitigate the environmental pressures of the product
manufacturer along the value chain, and subsequently reduce the respective economic risk that new product
development encompasses (Hall, 2006). Meeting market needs is a necessary condition for the success of the
introduction of the product-package combination, since only then will consumers and customers be willing to
pay premium prices for green alternatives (Tay, et al., 2015).
The second criterion in this category is “Sourcing, manufacturing, distribution and recycling costs” and refers
to the operational costs of the product-package combination during its complete life cycle. More specifically, as
its name indicates, it is related to the expenses needed for its supply, production, transportation and disposal.
Managing the costs of packaging procurement, production, and product delivery together with the desired
functionality is an element of a profitable and sustainable business (GreenBlue, 2011). Organizations who strive
for reducing costs in the supply chain must carefully balance the fundamental technical requirements for food
safety and product integrity, together with the need to ensure an efficient logistics service (Coles, McDowell, &
Kirwan, 2003). It is an undeniable fact that the economic investment for environmental programs and the
uneconomic recycling and reusing of materials, are serious obstacles in sustainable development and green
purchasing programs (Min & Galle, 2001).
The third criterion, “Physically designed to optimize materials and energy”, refers to the selection of the
physical characteristics of the product-package combination that ensure the optimization of the used resources.
The criterion does not focus on the environmental perspective of conserving resources for future generations,
52
but rather on the economic efficiency and competitiveness of the product-package combination. Optimization is
related to the energy use over the life of the package, the impact of materials in all end-of-life scenarios, and the
appropriateness of the package design to facilitate material recovery (GreenBlue, 2011). By physical
optimization is meant that the product-package combination ensures material and energy efficiency also in
interactions with other associated support systems such as storage, transport and handling (Lewis, et al., 2007).
Along with the minimization of product losses, operational efficiency and optimization of material use should be
the main goals in sustainable package design for the development of the best performing product-package
combination (Grönman, et al., 2013).
The next criterion, “Gain employee’s and top management commitment”, refers to gaining the support of people
in the development phase of the product-package combination. More specifically, it includes the support of all
the employees along the organizational hierarchy that are involved in the sourcing, manufacturing and
transportation of the product. Commitment of top management to sustainability is crucial in ensuring that
initiatives to tackle the various obstacles are supported by the key decision-makers. Additionally, it is one of the
main drivers of SSCM (Wan Ahmad, et al., 2017). On one hand, gaining top management commitment to
environmental investments in new greener markets will provide the firm with the innovation to gain a
competitive advantage quickly, while on the other hand, lacking management commitment can be a major
reason behind failure of quality improvement efforts (Tay, et al., 2015). Furthermore, the commitment and
motivation of employees involved in the various activities in the supply chain of the product-package
combination will increase their productivity and performance and thus the quality of the finished goods. It is
noted in literature that entrepreneurs and employees have a supportive influence in green supply chain practices,
and a cross functional involvement together with top management, would result in a more effective response to
the challenges of sustainability (Evangelista, Sweeney, Ferruzzi, & Carrasco, 2010). The respective parties
should agree on the SSCM strategies in order to guarantee that all partners pursue the same strategic direction
(Wittstruck & Teuteberg, 2012).
Next, the criterion “Aligned with company’s characteristics” refers to the alignment of the development of the
product-package combination with the organization‟s general strategy. This strategy incorporates the vision and
mission of the company and also the future strategic plans. Strategic planning to implement sustainability in a
supply chain focuses on fund allocation specifically to implement sustainable practices (Faisal, 2010). In order
to create distinct sustainable packaging criteria, the factors of culture, structure and size fit were also
incorporated in this criterion. In other words, the product-package combination should be in accordance with the
organization‟s culture, business structure and size (Day & Lichtenstein, 2006). Sustainable development
requires an organizational culture in which committed employees would not need financial incentives in order to
act according to the environmental plan. Reward systems should be implemented and linked with employee‟s
outcomes, in those sustainability projects that have not reaped any benefits and face criticism inside the
53
organization (Pagell & Wu, 2009). Regarding the company‟s size, even though larger firms are more likely to
adopt sustainable practices, smaller firms can create competitive niches with disruptive innovations in
sustainable product designs (Pagell & Wu, 2009). As far as the last factor under study is concerned, that of
organizational structure, contingency theory suggests that there is no single organizational structure which is
inherently more efficient than all others (Walker & Jones, 2012), but nevertheless, new product development
should not be hampered by the existing organizational structure.
The next criterion, “Continuity”, refers to the alignment of the development of the product-package
combination with the existing operational practices. Furthermore, it indicates whether the new product
development strategy is cross-functional with the current supply chain processes and members. In other words,
it refers to the amount of changes that are necessary for a smooth implementation of the development plan. It is
underlined, that the new package design should be adapted to the existing production and handling processes
(Paine, 1991) (Grönman, et al., 2013). Furthermore, the introduction of the total product should enable the
integration of the suppliers to the current supply chain and should not have a disruptive character regarding the
flow of goods and information (Seuring & Müller, 2008a) (Seuring & Müller, 2008b). Continuity also refers to
supplier management in a sense that it ensures that all suppliers in the supply chain not only can stay in
business, but stay in business in a manner that helps to ensure a reasonable quality of life for the origin
suppliers, farmers and growers, for the present and into the future (Pagell & Wu, 2009) (Wolf, 2011).
Another sustainable packaging criterion found in the literature is “Boosts Competitiveness”. This criterion refers
to the way that the introduction of the product-package combination reacts to competitive pressures. It is
underlined that even though proactivity in green supply chain strategies can lead to firm competitiveness, it is
also accompanied with added environmental costs (Tay, et al., 2015). Additionally, this criterion refers to the
competitive advantage that the organization can gain from the development and introduction to the market of the
product-package combination. Packaging plays a vital role in food marketing and represents a significant key to
a brand‟s success and favors survival in a highly competitive marketplace (Coles, McDowell, & Kirwan, 2003).
Furthermore, it also refers to the ability of the product-package combination to overcome potential market entry
barriers. However, while competition has been found to be one of the external barriers of sustainable supply
chain management (Tay, et al., 2015), in the literature it was also found that green supply chain practices
implemented by competitors has no effect on the environmental initiatives undertaken by the incumbent firm
(Evangelista, et al., 2010).
The next criterion, “Cooperation with supply chain members”, refers to how the development of the product-
package combination achieves the cooperation of the various supply chain members. Cooperation with suppliers
can seriously reduce the environmental impacts along the value chain (Haldórsson, et al., 2009) (Zhu, Sarkis, &
Lai, 2008). The criterion also refers to the way that the suppliers and distributors could be integrated in the
operational activities and in the formation of relationships based on trust, efficiency, and long term commitment.
54
Information sharing among the supply chain members (Faisal, 2010) and fairness in the distribution of profits
(Heller & Keoleian, 2003) are also entailed in the definition of this criterion since they are enablers of
sustainable practices. Individual companies in the supply chain should align their internal processes with the
established sustainability standards and build up knowledge on SSCM, which should be then made available to
the network partners via adequate IT systems and interfaces (Wittstruck & Teuteberg, 2012).
The criterion “Profitability” refers to the ability of the product-package combination to deliver profits in
relation to the size of the business and incorporates its ability to manage the economic risk, ongoing growth and
prosperity. Aside the profitability of the product manufacturer, packaging affects the customer‟s (retailers and
wholesalers) direct product profitability for every product, since their profit is directly related to the operational
costs for opening packages, displaying and also selling the products (Coles, McDowell, & Kirwan, 2003). In
order to ensure the long-term economic profitability of all the supply chain partners, wealth should be
distributed across the entire chain (Wolf, 2011). Furthermore, this criterion also describes whether the
introduction of the total product is in accordance with the goals and pressures of the investors and the ability to
manage the economic risk that the development entails. Economic instability can on the one hand cause
financial or economic risks related to liquidity and solvency and on the other hand ruin commitment contracts
with suppliers and customers (Wan Ahmad, et al., 2017). Economic growth and prosperity are essential
components of sustainable development and ongoing profitability is a fundamental element of sustainable
business practice (GreenBlue, 2011). It has to be underlined that profit was not included in the list of sustainable
packaging criteria since it is the outcome of the successful introduction to the market and depends on the
incorporation of all the economic criteria in the package design.
The criterion “Product protection” refers to the main attribute of the package design, which is to prevent
mechanical damage during the transportation of the product (Paine, 1991). It also incorporates values of
enhancing the quality of the product and extending its trade and shelf life. In addition, it also incorporates two of
the main functions of the package, those of effective containment (Lockamy III, 1995), which depends on the
nature and form of the contained product, and preservation, which refers to the inhibition of chemical and
biochemical changes and also microbiological spoilage (Coles, McDowell, & Kirwan, 2003). In the design
phase an acceptable level of wastage has to be set so as to make sure that the package does neither over-protect
nor under-protect the contained food (Envirowise & Incpen, 2008). Furthermore, the package needs to provide a
defined level of barrier between the contents and the external environment so as to contain and protect the
product but also in some cases to protect the environment from them (FDF & Incpen, 2017). Lastly, the package
should protect the product from deterioration, which can be caused by moisture, temperature, gases, UV light,
other flavors and aromas and also ensure that the designed shelf-life at the designed temperature is achieved
(Grönman, et al., 2013).

55
The criterion “Package Functionality” refers to the overall functionality of the product-package combination.
Functionality may be estimated by the package‟s handleability during transportation, its efficiency in food
quantity utilization and in the prevention of theft (Olander-Roese & Nilsson, 2009). Moreover, it should provide
adequate stacking strength for storing, cushion the product against shocks during transportation and be easily
handled by carrying devices (FDF & Incpen, 2017). It should be convenient for use to the customers and also to
the consumers (Lockamy III, 1995) and should accommodate filling and packing (Paine, 1991). In addition, the
package should be flexible, easy to dismantle, be flattened when emptied and have easy opening and closing
functions (Grönman, et al., 2013).
The last criterion regarding the economic performance of sustainability is “Product integrity”. It refers to how
the product-package combination passes information to the customers and manages to differentiate the brand
(Paine, 1991). Moreover, it refers to its selling capability and its ability to underline the product‟s authenticity
(Olander-Roese & Nilsson, 2009). In addition, primary packaging for consumer goods should not give a false
impression of the nature, quantity or quality of the product, but rather help inform handling, choice and use of
the product and include the relevant information required by law (FDF & Incpen, 2017). Brand analysis could
be implemented by the package manufacturers to make sure the product-package combination is as active as
possible and for this reason, distinctive shapes are often used in order to enhance product and brand recognition
(Coles, McDowell, & Kirwan, 2003). In the table below, the sustainable packaging criteria of the economic
dimension of sustainability are summarized (Table 7).
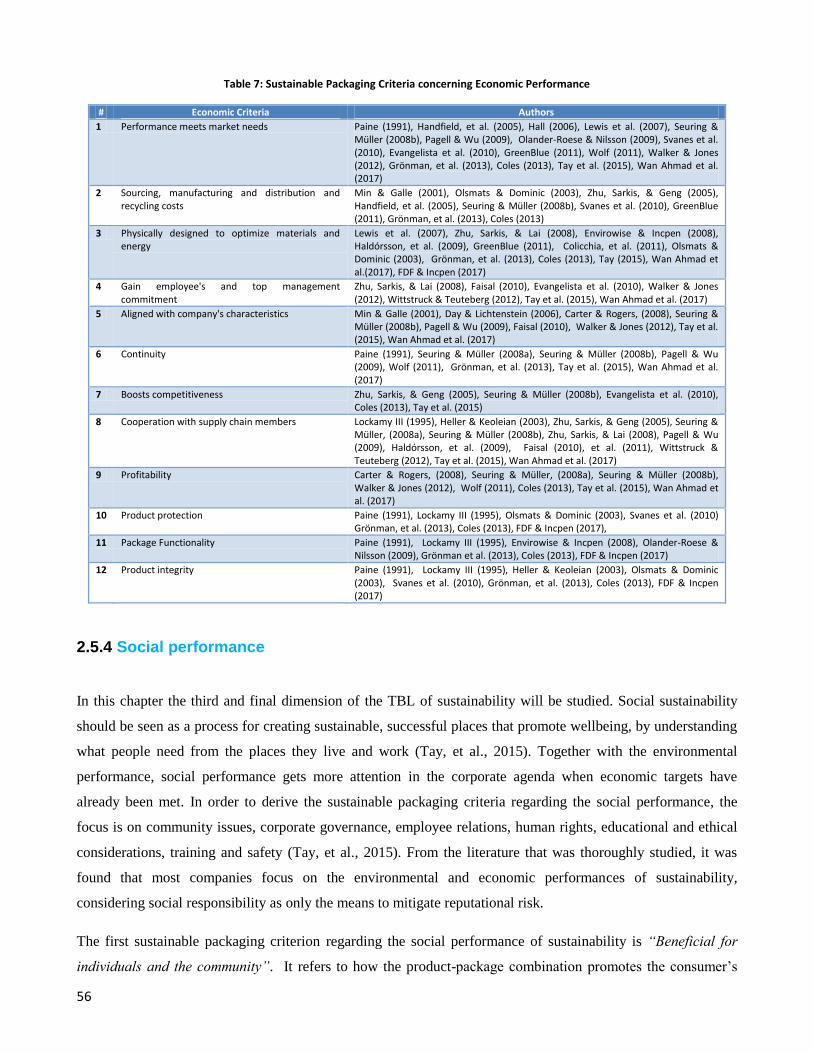
56
Table 7: Sustainable Packaging Criteria concerning Economic Performance
# Economic Criteria Authors
1 Performance meets market needs Paine (1991), Handfield, et al. (2005), Hall (2006), Lewis et al. (2007), Seuring & Müller (2008b), Pagell & Wu (2009), Olander-Roese & Nilsson (2009), Svanes et al. (2010), Evangelista et al. (2010), GreenBlue (2011), Wolf (2011), Walker & Jones (2012), Grönman, et al. (2013), Coles (2013), Tay et al. (2015), Wan Ahmad et al. (2017)
2 Sourcing, manufacturing and distribution and recycling costs
Min & Galle (2001), Olsmats & Dominic (2003), Zhu, Sarkis, & Geng (2005), Handfield, et al. (2005), Seuring & Müller (2008b), Svanes et al. (2010), GreenBlue (2011), Grönman, et al. (2013), Coles (2013)
3 Physically designed to optimize materials and energy
Lewis et al. (2007), Zhu, Sarkis, & Lai (2008), Envirowise & Incpen (2008), Haldórsson, et al. (2009), GreenBlue (2011), Colicchia, et al. (2011), Olsmats & Dominic (2003), Grönman, et al. (2013), Coles (2013), Tay (2015), Wan Ahmad et al.(2017), FDF & Incpen (2017)
4 Gain employee's and top management commitment
Zhu, Sarkis, & Lai (2008), Faisal (2010), Evangelista et al. (2010), Walker & Jones (2012), Wittstruck & Teuteberg (2012), Tay et al. (2015), Wan Ahmad et al. (2017)
5 Aligned with company's characteristics Min & Galle (2001), Day & Lichtenstein (2006), Carter & Rogers, (2008), Seuring & Müller (2008b), Pagell & Wu (2009), Faisal (2010), Walker & Jones (2012), Tay et al. (2015), Wan Ahmad et al. (2017)
6 Continuity Paine (1991), Seuring & Müller (2008a), Seuring & Müller (2008b), Pagell & Wu (2009), Wolf (2011), Grönman, et al. (2013), Tay et al. (2015), Wan Ahmad et al. (2017)
7 Boosts competitiveness Zhu, Sarkis, & Geng (2005), Seuring & Müller (2008b), Evangelista et al. (2010), Coles (2013), Tay et al. (2015)
8 Cooperation with supply chain members Lockamy III (1995), Heller & Keoleian (2003), Zhu, Sarkis, & Geng (2005), Seuring & Müller, (2008a), Seuring & Müller (2008b), Zhu, Sarkis, & Lai (2008), Pagell & Wu (2009), Haldórsson, et al. (2009), Faisal (2010), et al. (2011), Wittstruck & Teuteberg (2012), Tay et al. (2015), Wan Ahmad et al. (2017)
9 Profitability Carter & Rogers, (2008), Seuring & Müller, (2008a), Seuring & Müller (2008b), Walker & Jones (2012), Wolf (2011), Coles (2013), Tay et al. (2015), Wan Ahmad et al. (2017)
10 Product protection Paine (1991), Lockamy III (1995), Olsmats & Dominic (2003), Svanes et al. (2010) Grönman, et al. (2013), Coles (2013), FDF & Incpen (2017),
11 Package Functionality Paine (1991), Lockamy III (1995), Envirowise & Incpen (2008), Olander-Roese & Nilsson (2009), Grönman et al. (2013), Coles (2013), FDF & Incpen (2017)
12 Product integrity Paine (1991), Lockamy III (1995), Heller & Keoleian (2003), Olsmats & Dominic (2003), Svanes et al. (2010), Grönman, et al. (2013), Coles (2013), FDF & Incpen (2017)
2.5.4 Social performance
In this chapter the third and final dimension of the TBL of sustainability will be studied. Social sustainability
should be seen as a process for creating sustainable, successful places that promote wellbeing, by understanding
what people need from the places they live and work (Tay, et al., 2015). Together with the environmental
performance, social performance gets more attention in the corporate agenda when economic targets have
already been met. In order to derive the sustainable packaging criteria regarding the social performance, the
focus is on community issues, corporate governance, employee relations, human rights, educational and ethical
considerations, training and safety (Tay, et al., 2015). From the literature that was thoroughly studied, it was
found that most companies focus on the environmental and economic performances of sustainability,
considering social responsibility as only the means to mitigate reputational risk.
The first sustainable packaging criterion regarding the social performance of sustainability is “Beneficial for
individuals and the community”. It refers to how the product-package combination promotes the consumer‟s
57
well-being throughout its complete life cycle. More specifically, it refers to the benefits of packaging to
individuals and communities that can vary from the creation of meaningful, stable employment, to the
protection, preservation, safety, and transport of food products (GreenBlue, 2011). The packaging system should
add real value to the society by supporting informed and responsible consumption and by effectively containing
and protecting products as they move through the supply chain (Lewis, et al., 2007). In other words, all products
should deliver genuine social value to each member of the supply chain as well as commercial profit to the
manufacturer. Packaging should also facilitate the development of modern retail formats that offer consumers
availability of food from around the world throughout the whole year (Coles R. , 2013).
The next criterion, “Healthy and safe for individuals and the community” refers to how the product-package
combination contributes to the health and safety of the consumers throughout its complete life cycle. In other
words, it ensures that no harmful substances are released to the environment during its production phase, but
also that no toxic substances are present through its use and end of life phases (Wan Ahmad, et al., 2017). The
package should avoid or minimize the use of materials or additives that may migrate into food and be harmful to
human health or may pose risks to humans or ecosystems during recovery or disposal, and the use of heavy
metal additives (Lewis, et al., 2007). The preferred strategy of how to incorporate this criterion in the design is
by carefully selecting the safest materials available that achieve the required performance (GreenBlue, 2011).
The majority of authors mentioning the importance of healthy sourced materials focused in the avoidance or
reduction of hazardous materials in the manufacturing phase (Zhu, Sarkis, & Lai, 2008) (Haldórsson, et al.,
2009).
The next criterion, “Aligned with company’s corporate social responsibility” refers to the compatibility of the
introduction of the product-package combination with the Corporate Social Responsibilities (CSR) of the
organization. It was argued in literature that adoption of CSR in the commercial world has been limited due to
the lack of adequate conceptual resources to help managers integrate CSR into their corporate strategies and
operations (Meehan, Meehan, & Richards, 2006). The total product should contribute in the integration of CSR
with sustainable practices (Tay, et al., 2015). Integration of CSR practices in the food industry with sustainable
packaging can be achieved by organizing food donations to populations identified as being at disadvantage no
matter how far they are located, or by undertaking responsible marketing initiatives in relation to health, such as
the provision of nutrition and health information on the label and promotion of healthy behavior (Heller &
Keoleian, 2003).
The criterion “Manages Reputational Risk” refers to how the product-package combination manages the
organization‟s reputational risk. Risk management is defined as the firm‟s ability to manage the environmental,
economic and social risks that its practices incorporate and has been included as a contextual factor in the TBL
of sustainability (Carter & Rogers, 2008). Reputational risk is the outcome of unsuccessful implementation of
risk management, which in turn must be able to facilitate alignment and collaboration for risk avoidance and
58
reduction among supply chain partners (Wan Ahmad, et al., 2017). In other words, it refers to the ability of the
introduction of the product-package combination to avoid raising any opposition and conflict with NGOs and
other parties. In the article of (Hall, 2006), four stakeholders are recognized, that have a direct or indirect impact
on the credibility or the reputation of the firm. These are the regulatory stakeholders, which can either set
regulations or have the ability to convince governments to set standards, the organizational stakeholders that are
directly related to an organization and can have a direct financial impact on the company, the community
groups, environmental organizations, and other potential lobbies, who can mobilize public opinion in favor of or
against a firm‟s environmental policies and finally the media, which has the ability to influence society's
perception of a firm. These stakeholders can boycott or support a company‟s product, voice concerns and even
stop planned shipments.
The criterion “In accordance with governmental policies and regulations” refers to whether the product-package
combination violates the current laws and standards. It was found in literature that firms are strongly driven
towards SSCM practices by central governmental and regional environmental regulations (Min & Galle, 2001)
(Zhu, Sarkis, & Geng, 2005). In the twenty first century the majority of companies operate at a global level, in
several countries with different regulatory frameworks. This fact may cause considerable regulatory and
compliance-related risks that are caused by changes in laws, regulations and compliance mechanisms related to
legal, fiscal, safety and environmental matters (Wan Ahmad, et al., 2017). Regarding the European packaging
regulations, the European Packaging and Packaging Waste Directive sets the basic requirements for packaging
design and applies for any packaging sold in EU countries (European Commission, 2016). This directive was
introduced in order to prevent European Member States from implementing measures that would restrict free
trade of goods within the European Community or discriminate between types of packaging (Envirowise &
Incpen, 2008). Moreover, CEN, the European standards organization, has developed a set of standards to help
companies comply with the Essential Requirements based on a management system approach by incorporating
the procedures into an existing EN ISO 9000/14000 scheme (ISO, 1997).
The next criterion, “Transparency”, refers to the existence of quantifiable sustainability metrics that would
allow the estimation of the sustainability of the product-package combination (Faisal, 2010). Performance
measurement should be linked to an employee reward system that would give incentives towards sustainable
development processes (Pagell & Wu, 2009) (Walker & Jones, 2012). These metrics, as a part of internal SSCM
practices lead to increased transparency among the supply chain members (Wolf, 2011). Thus, this criterion also
refers to the degree of transparency in sourcing, manufacturing and distribution processes, not only among the
members of the supply chain, but also among individuals and the community. Transparency is also closely
linked to the traceability of the raw and packaging materials, from the beginning until the end of the supply
chain and throughout its complete life cycle (Heller & Keoleian, 2003).
59
The criterion, “Employee’s quality of life” refers to the degree that the worker‟s rights are valued and respected.
It also refers to how the introduction of the product-package combination affects the quality of life and
satisfaction of all the employees of the firms in the supply chain, along its complete life cycle (Heller &
Keoleian, 2003). It also incorporates the need for training and educating the employees, since these educational
programs are a dominant driver of SSCM (Seuring & Müller, 2008b). It has to be underlined, that the term
employees is not limited to those belonging in the organization that introduces the product, but refers also to
those who are part of the organizations along the supply chain, namely the farmers, factory workers, drivers,
shop assistants etc.
The criterion “Maximize consumer’s value” refers to the degree that the product-package combination covers
the needs and respects the rights of the consumers. More specifically for the case of the food packaging industry,
it refers to the ability of the supplied products to cover the total demand of the consumers. Furthermore, the
vendor of the product-package combination should take into account the portion of disposable income that the
consumer spends for purchase when deciding on the selling price (Heller & Keoleian, 2003). Packaging should
also lower the cost of many foods through economies of scale in mass production, efficiency in bulk distribution
and obtain cost savings from reduced product damage (Coles, McDowell, & Kirwan, 2003). Lastly, the
information on the product labels should be accurate, and respect the literacy levels of the respective consumer
groups. The marketing and consumer interface of packaging determines the overall effectiveness of a supply
chain and the degree to which consumer value is maximized (Olander-Roese & Nilsson, 2009).
The last packaging criterion in the social dimension of sustainability, “Suppliers and carriers are certified”,
refers to both the suppliers and the distributors of the product-package combination. The suppliers and carriers
need to have certain sustainability certifications and need to pass the environmental and social criteria specified
by the members of the supply chain and the regulatory standards (Wan Ahmad, et al., 2017) (Seuring & Müller,
2008a) (Seuring & Müller, 2008b). Encouraging the suppliers to adopt certain environmental and social
certifications is a step towards sustainable development (Haldórsson, et al., 2009) (Pagell & Wu, 2009).
Governmental agencies or the key members and alliances in the supply chain could subsidize part of the
expenses so as weaker members to acquire the certifications and even provide training programs to assist them
on succeeding on this purpose (Zhu, Sarkis, & Geng, 2005). This criterion could be split in two and be also
placed in the list of packaging criteria concerning the environmental performance. Nevertheless, it was decided
to be placed in the social performance of sustainability since it is hard to define the specifications of the
sustainability certifications that the members of the supply chain need to hold and secondly because the
selection of suppliers and carriers is a choice that greatly impacts the reputational risk of the company. Thus,
supplier and carrier evaluation and selection are processes on the jurisdiction of the each individual firm in the
supply chain. Once a supplier is environmentally certified with the ISO 14001, it means that he has implemented

60
a management system that documents the organization‟s environmental aspects and impacts, and identifies a
process of continuous improvement (Colicchia, et al., 2011).
Table 8: Sustainable Packaging Criteria concerning Social Performance
# Social Criteria Authors
1 Beneficial for individuals and the community Lewis et al. (2007), GreenBlue (2011), Coles (2013)
2 Healthy and safe for individuals and the community
Paine (1991), Heller & Keoleian (2003), Olsmats & Dominic (2003), Lewis et al. (2007), Zhu, Sarkis, & Lai (2008), Haldórsson, et al. (2009), Grönman, et al. (2013), Wan Ahmad et al. (2017), FDF & Incpen (2017)
3 Aligned with the organization's corporate social responsibilities
Heller & Keoleian (2003), Coles (2013), Tay et al. (2015)
4 Manages reputational risk Hall (2006), Carter & Rogers, (2008), Seuring & Müller, (2008b), Wolf (2011), Walker & Jones (2012), Tay et al. (2015), Wan Ahmad et al. (2017),
5 In accordance with governmental policies and regulations
Paine (1991), Min & Galle (2001), Heller & Keoleian (2003), Zhu, Sarkis, & Geng (2005), Seuring & Müller (2008b), Evangelista et al. (2010), Grönman, et al. (2013), Coles (2013) , Tay et al. (2015), FDF & Incpen (2017)
6 Transparency Handfield, et al. (2005), Carter & Rogers, (2008), Seuring & Müller (2008b), Pagell & Wu (2009), Faisal (2010), Wolf (2011), Coles (2013), Wan Ahmad et al. (2017)
7 Employee's quality of life Heller & Keoleian (2003), Seuring & Müller (2008b)
8 Maximize consumer value Heller & Keoleian (2003), Olander-Roese & Nilsson (2009), Coles (2013)
9 Suppliers and carriers are certified and pass the environmental and social criteria
Heller & Keoleian (2003), Zhu, Sarkis, & Geng (2005), Zhu, Sarkis, & Lai (2008), Seuring & Müller, (2008a), Seuring & Müller, (2008b), Pagell & Wu (2009), Haldórsson, et al. (2009), Wolf (2011), Colicchia, et al. (2011), Wan Ahmad et al. (2017)
2.5.5 Conceptual Framework
In the previous sub-sections, the various sustainable packaging criteria were identified, listed and also
categorized along the TBL of sustainability. In this section the framework proposed by (Carter & Rogers, 2008)
in Figure 6 of Section 2.4 will be enhanced by incorporating the sustainable packaging criteria that were
identified and also a conceptual framework will be proposed.
In the intersections of the circles are those criteria placed that their strict categorization in one of the three
dimensions was made through assumptions. It can be observed, that no criterion was placed in the intersection
of the three circles. This means that not dilemma was encountered during the criteria separation phase that
would necessitate the strict selection between the three dimensions. The triadic intersection has a symbolic
character and describes the value of sustainability in general, that can be enhanced by the coexistence of the
three dimensions. Starting with the intersection between the environmental and economic performance, the
criteria “Manages environmental risk” and “Physically designed to optimize materials and energy” are located.
The first one was placed there because it is related to corporate risk management, since minimizing the
ecological impact contributes in reducing variation of unexpected outcomes. The second one was placed in the
intersection because while a firm may reap the financial benefits of optimization in the use of materials and
energy, it also contributes in enhancing its environmental performance.
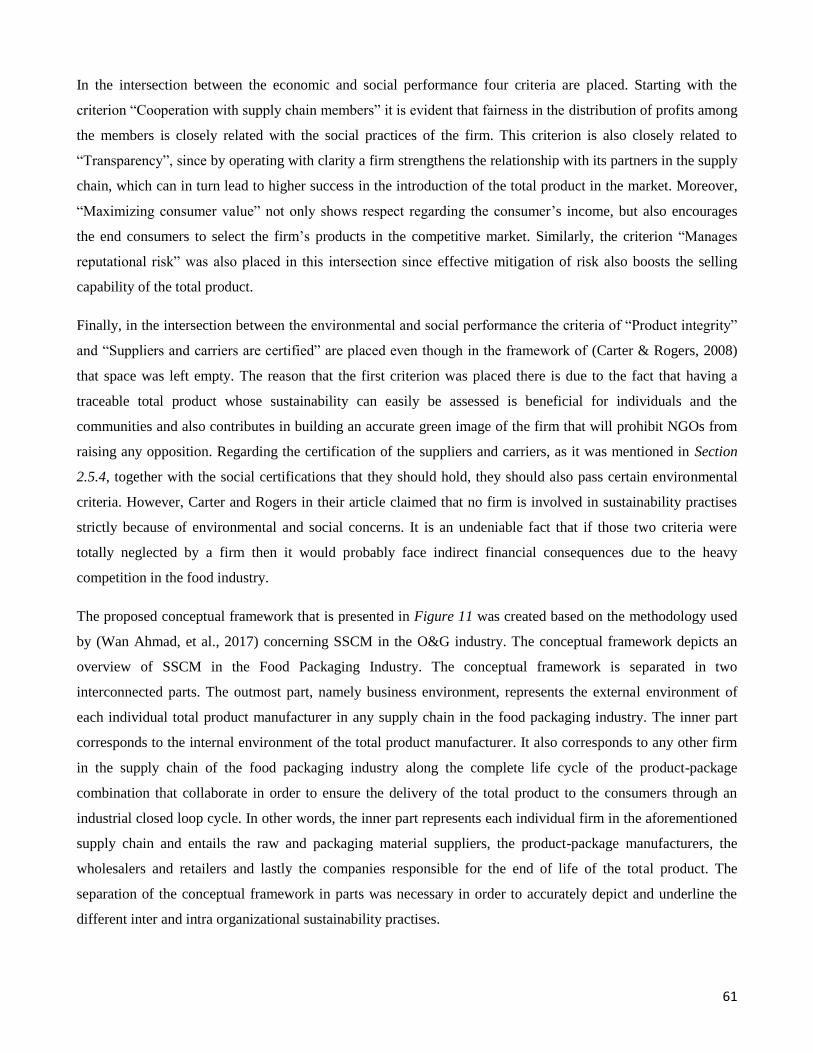
61
In the intersection between the economic and social performance four criteria are placed. Starting with the
criterion “Cooperation with supply chain members” it is evident that fairness in the distribution of profits among
the members is closely related with the social practices of the firm. This criterion is also closely related to
“Transparency”, since by operating with clarity a firm strengthens the relationship with its partners in the supply
chain, which can in turn lead to higher success in the introduction of the total product in the market. Moreover,
“Maximizing consumer value” not only shows respect regarding the consumer‟s income, but also encourages
the end consumers to select the firm‟s products in the competitive market. Similarly, the criterion “Manages
reputational risk” was also placed in this intersection since effective mitigation of risk also boosts the selling
capability of the total product.
Finally, in the intersection between the environmental and social performance the criteria of “Product integrity”
and “Suppliers and carriers are certified” are placed even though in the framework of (Carter & Rogers, 2008)
that space was left empty. The reason that the first criterion was placed there is due to the fact that having a
traceable total product whose sustainability can easily be assessed is beneficial for individuals and the
communities and also contributes in building an accurate green image of the firm that will prohibit NGOs from
raising any opposition. Regarding the certification of the suppliers and carriers, as it was mentioned in Section
2.5.4, together with the social certifications that they should hold, they should also pass certain environmental
criteria. However, Carter and Rogers in their article claimed that no firm is involved in sustainability practises
strictly because of environmental and social concerns. It is an undeniable fact that if those two criteria were
totally neglected by a firm then it would probably face indirect financial consequences due to the heavy
competition in the food industry.
The proposed conceptual framework that is presented in Figure 11 was created based on the methodology used
by (Wan Ahmad, et al., 2017) concerning SSCM in the O&G industry. The conceptual framework depicts an
overview of SSCM in the Food Packaging Industry. The conceptual framework is separated in two
interconnected parts. The outmost part, namely business environment, represents the external environment of
each individual total product manufacturer in any supply chain in the food packaging industry. The inner part
corresponds to the internal environment of the total product manufacturer. It also corresponds to any other firm
in the supply chain of the food packaging industry along the complete life cycle of the product-package
combination that collaborate in order to ensure the delivery of the total product to the consumers through an
industrial closed loop cycle. In other words, the inner part represents each individual firm in the aforementioned
supply chain and entails the raw and packaging material suppliers, the product-package manufacturers, the
wholesalers and retailers and lastly the companies responsible for the end of life of the total product. The
separation of the conceptual framework in parts was necessary in order to accurately depict and underline the
different inter and intra organizational sustainability practises.
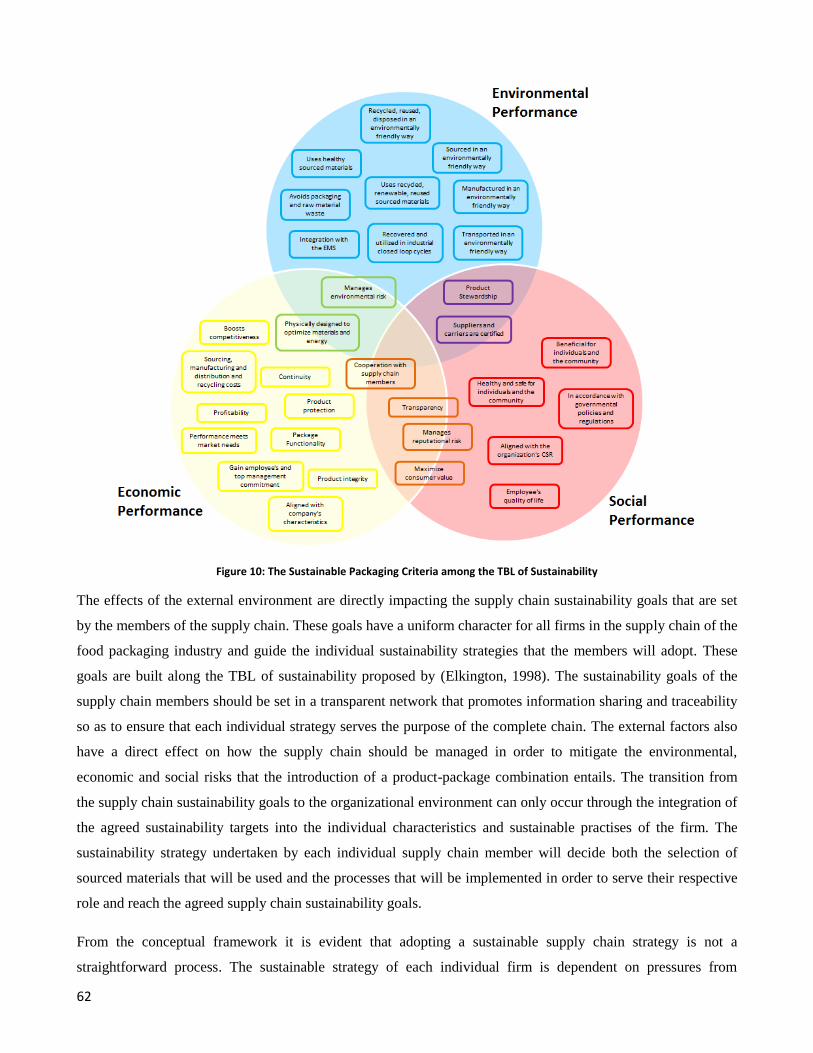
62
Figure 10: The Sustainable Packaging Criteria among the TBL of Sustainability
The effects of the external environment are directly impacting the supply chain sustainability goals that are set
by the members of the supply chain. These goals have a uniform character for all firms in the supply chain of the
food packaging industry and guide the individual sustainability strategies that the members will adopt. These
goals are built along the TBL of sustainability proposed by (Elkington, 1998). The sustainability goals of the
supply chain members should be set in a transparent network that promotes information sharing and traceability
so as to ensure that each individual strategy serves the purpose of the complete chain. The external factors also
have a direct effect on how the supply chain should be managed in order to mitigate the environmental,
economic and social risks that the introduction of a product-package combination entails. The transition from
the supply chain sustainability goals to the organizational environment can only occur through the integration of
the agreed sustainability targets into the individual characteristics and sustainable practises of the firm. The
sustainability strategy undertaken by each individual supply chain member will decide both the selection of
sourced materials that will be used and the processes that will be implemented in order to serve their respective
role and reach the agreed supply chain sustainability goals.
From the conceptual framework it is evident that adopting a sustainable supply chain strategy is not a
straightforward process. The sustainable strategy of each individual firm is dependent on pressures from
63
stakeholders, on the sustainability goals set by the members of the supply chain, on the preparedness of the
management in responding to sustainability challenges, on the transparent way that sustainable practises are
decided and implemented, and on the ease of integrating sustainable practises in the existing organizational
characteristics and processes. The sustainable supply chain strategies of the firms should be regularly refined
and verified by the rest of the supply chain members according to the agreed sustainability goals and to their
conformity with governmental policies and regulations. Thus, creating a sustainable supply chain strategy in the
organizational environment is an on-going process that has to be adapted to the needs of its supply chain and
responds to external influences.
Figure 11: Conceptual Framework of the Food Packaging Industry

64

65
3 Methodology
In this section the methodology that will be followed in order to reach the research objectives and answer the
research questions will be elaborated. First the problem will be analyzed in order to figure out its type and the
kind of solution that it needs. According to these findings, the research design will be presented. Next, the most
prevalent methods that match the problem characteristics will be compared. After the suitable method is found, a
roadmap explaining the thinking behind the formulation of the thesis will be presented. This methodology
section ends with presenting the research methods that will be implemented to gather the data that will be used
as inputs for the application of the methodology.
3.1 Analysis of the Problem
In order to analyze the problem under study, the research question that has to be answered needs to be
scrutinized. The research question investigates the way that the sustainable packaging factors of the whole
supply chain affect the design of the package in the food packaging industry and how the selection process can
be improved. As it was previously explained in the concept map and was achieved in the process of the creation
of the criteria list, these factors were translated to certain quantifiable criteria. According to these criteria,
various package design alternatives will be evaluated and the optimal one will be selected. Thus, it can be
implied that the process of taking a decision is involved. Also, due to the fact that various criteria have an
impact on the selection of the alternative, it can be concluded that it is a Multi-Criteria Decision-Making
(MCDM) problem. Furthermore, due to the existence of six members in the supply chain, it is also a Multi-
Actor problem and the existence of three dimensions also makes it a Multi-Dimensional problem.
After having analysed the type of the problem, it is time to think about the research design that will be chosen.
In the introduction, the research objectives were formulated, and from them, the various data that need to be
gathered can be extracted. Firstly, by using the related literature review, the various supply chain sustainability
drivers and barriers were translated to solid quantifiable criteria. Together with the sustainable packaging
criteria published by SPC and SPA, a final list was created which contains all the necessary supply chain
sustainability criteria. Secondly, the experts‟ opinions will be used in order to rank these criteria and reduce their
number by selecting the most important from them. Next, with the conduction of structured interviews a number
of product-package combinations will be selected and their alternative package designs will be chosen. Then,
relative scores will be assigned to each according to the decision-maker through a structured interview once
again. Finally, the members of the supply chain will be asked to complete a survey so as to assign weights to the
66
relative criteria. As a result the research design will be a combination of surveys, literature review and structured
interviews and can be characterized as descriptive. The goal of a descriptive study is to describe relevant aspects
of a phenomenon of interest from an industry-oriented perspective (Uma & Bougie, 2013). It can also be
concluded that this thesis incorporates elements of basic or fundamental research, since the findings are industry
oriented and can later be applied to a specific organizational setting.
3.2 Multi-Criteria Decision - Making Methods
Multi-Criteria Decision-Making (MCDM) or Multi-Criteria Decision Analysis (MCDA) is a sub-discipline
of operations research. In a MCDM problem, a number of alternatives are evaluated with respect to a number of
criteria in order to select the best alternatives (Rezaei J. , 2015). MCDM is divided into Multi-Objective
Decision Making (MODM) and Multi-Attribute Decision Making (or MADM) (Triantaphyllou, Shu, Sanchez,
& Ray, 1998). While MODM studies decision problems in which the decision space is continuous, the MADM
concentrates on problems with discrete decision spaces (Triantaphyllou, et al., 1998). There exist also other
categorizations of Multi-Criteria models, as for example they can be separated into three categories, the
outranking models, the utility based models and the miscellaneous models (Triantaphyllou, et al., 1998).
Using any method for solving a MCDM problem will not be an easy task since the majority of the criteria are
not directly quantifiable. In order to calculate the respective criteria weights various members of the supply
chain of certain product-package combinations will have to be contacted. With the use of surveys, the various
criteria could be ranked. Then, a number of sustainable package solutions would have to be identified, and their
respective scores according to the criteria would have to be estimated. By formulating the problem with the use
of optimization software, the optimal solution(s) can be found. The decision-making goal is to either find the
best option from a set of feasible alternatives, or to rank the alternatives (Rezaei, Nispeling, Sarkis, & Tavasszy,
2016).
3.2.1 Best-Worst Method
The MADM method that will be used in this thesis is the Best-Worst Method (BWM) that was developed by
Jafar Rezaei. The main reasons behind this selection are that in comparison to other existing MCDM methods
the BWM requires less comparison data and leads to more existent comparisons. Furthermore, this thesis aims to
expand the specter of applications of this particular method by applying it in a multi-dimensional and multi-
actor setting of the food packaging industry. According to his paper “Best-worst multi-criteria decision-making
67
method”, the most desirable and the least desirable criteria are identified first by the decision maker (Rezaei J. ,
2015). Pairwise comparisons are then conducted between each of these two criteria and the rest. Next, a
minimax problem is formulated and solved by the decision maker in order to determine the weights of different
criteria. Then, the weights of the alternatives with respect to different criteria are obtained using the same
process. The final scores of the alternatives are derived by aggregating the weights from different sets of criteria
and alternatives, and the best alternative is selected.
The BWM has been successfully implemented in the past in different cases and for different industries (Rezaei
J. , BWM Bibliographical Database, 2017). The implementation of BWM has been the topic of several scientific
papers with objectives of evaluating the medical tourism development strategy, the key success factors in
technological innovations and the service quality of airline industry among others. The BWM has covered topics
that range from water scarcity management in arid regions, to supplier selection, humanitarian supply chain
management, web service selection and many more. Moreover, BWM has also been applied in Ph.D. and Master
Theses in various research areas within the Delft University of Technology.
The aforementioned phases are described in the form of a stepwise process right below. The steps that are
followed in deriving the weights of the criteria are presented below (Rezaei J. , 2016):
1. Determine a set of decision criteria. In this step the decision-maker identifies criteria
that are used to make a decision.
2. Determine the best and the worst criteria.
3. Determine the preference of the best criterion over all the other criteria, using a number between 1 and
9. The scale is presented in Appendix III, with grade 1 indicating equal importance between two criteria,
grade 2 indicating that one criterion is slightly more important than the other, while grade 9 indicating
that one criterion is extremely more important than the other. The resulting best-to-others (BO) vector
would be: , where indicates the preference of the best criterion over
criterion . It is clear that .
4. Implement a similar approach for the worst criterion. The resulting others-to-worst (OW) vector would
be: , where indicates the preference of the criterion over the worst
criterion . It is also clear that .
68
5. Find the optimal weights
. The aim is to determine the optimal weights of the criteria
such that the maximum absolute difference | | and | | for all is
minimized. This can be translated to the following model:
{| | | |}
Subject to
∑
, for all (1)
Model (1) is equivalent to the following linear programming model:
Subject to
| |
| |
∑
, for all (2)
After having explained how BWM ranks the respective criteria, what needs to be underlined is how the optimal
solution is calculated. Next, the steps for choosing the optimal solution are presented (Rezaei, Nispeling, Sarkis,
& Tavasszy, 2016). Problem (2) is linear and has a unique solution. By solving this problem the optimal weights
and the optimal value of , called are obtained. The is defined as the consistency ratio of
the comparison system. The consistency ratio means that the closer is to a zero value the more consistent the
comparison system provided by the decision-maker is. Using BWM, the optimal weights of the criteria, are
obtained. With these weights and the normalized scores of the alternatives on the different criteria ; the
final score per alternative, ; can be calculated using expression (3):
∑
(3)
Where
{
{ }
(4)
69
From (4), a final score can be attributed for each of the alternatives under study. Scientific papers that have
already used BWM successfully for solving MCDM were consulted before considering evaluating this method
(Gupta & Barua, 2016) (Ren, Liang, & Chan, 2016).
3.2.2 Method selection and the Roadmap Design
The roadmap in Figure 12 describes the sequence of thinking on deciding to make this thesis. Starting with the
main goal of designing a sustainable package for the food packaging industry, it was decided that the scope of
the project would not be product or company specific but rather oriented for the whole supply chain of a total
product manufacturer in the food packaging industry. In order to achieve this it is hypothesized that by assessing
the sustainability of a package according to the sustainability drivers and barriers that are present in the supply
chain of a package manufacturer, a decision maker is able to select a package design that actually ensures the
sustainability of the whole supply chain.
After deciding on the type of criteria that are going to be used for the assessment, a suitable method was sought
for. Undoubtedly, the problem at hand is a MCDM problem. More specifically it is an MADM problem since
the alternative package solutions are discrete solutions and not continuous. Going a step further in defining the
type of the problem, a utility model is going to be used since maximizing utility according to the respective
criteria is the method of assessment. Concluding, the BWM was selected since it matches the characteristics of
the problem and also has several advantages compared to other utility based MADM methods.
In his paper, Rezaei mentions the following about BWM (Rezaei J. , 2015):
It requires fewer comparisons compared to matrix-based MCDM methods.
The final weights that derived are highly reliable as it provides more consistent comparisons.
It can be combined with other MCDM methods.
Only integers are used, making it much easier to use than other MCDM methods.
The BWM requires two types of inputs. These are the criteria mentioned before and the alternative solutions that
fit each specific problem. In this thesis, after having concluded which the criteria are and their respective
ranking, the decision-maker will be able to apply the BWM to solve his specific problem in a food packaging
company. In order to do so he will need to specify the discrete alternative package solutions. By applying the
proposed method in the food packaging industry the decision-maker can use as solutions the package
alternatives of specific products or even the current package design trends. If applied to a specific business case,
the specific designs of the firm‟s R&D department. In this thesis the decision-maker is the Head of Packaging
Europe of the Kraft Heinz Company, Mr. Guus Lueb. In Figure 12 the aforementioned roadmap is depicted.
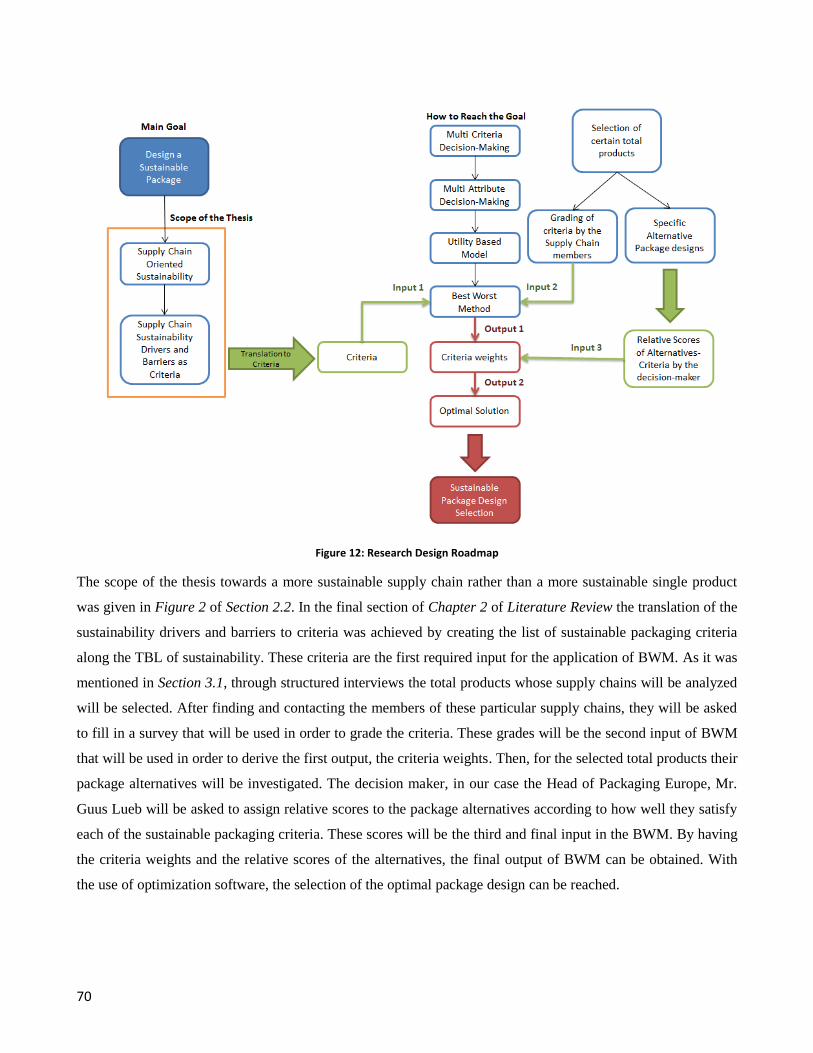
70
Figure 12: Research Design Roadmap
The scope of the thesis towards a more sustainable supply chain rather than a more sustainable single product
was given in Figure 2 of Section 2.2. In the final section of Chapter 2 of Literature Review the translation of the
sustainability drivers and barriers to criteria was achieved by creating the list of sustainable packaging criteria
along the TBL of sustainability. These criteria are the first required input for the application of BWM. As it was
mentioned in Section 3.1, through structured interviews the total products whose supply chains will be analyzed
will be selected. After finding and contacting the members of these particular supply chains, they will be asked
to fill in a survey that will be used in order to grade the criteria. These grades will be the second input of BWM
that will be used in order to derive the first output, the criteria weights. Then, for the selected total products their
package alternatives will be investigated. The decision maker, in our case the Head of Packaging Europe, Mr.
Guus Lueb will be asked to assign relative scores to the package alternatives according to how well they satisfy
each of the sustainable packaging criteria. These scores will be the third and final input in the BWM. By having
the criteria weights and the relative scores of the alternatives, the final output of BWM can be obtained. With
the use of optimization software, the selection of the optimal package design can be reached.
71
3.3 Research Design
The research methods that will be used for the completion of this master thesis will be summarized in this
section, and the scheduling of the tasks will be given. The first task has already taken place thorough literature
review that enabled the creation of a list composed of supply chain sustainable packaging criteria. The second
task is related to selecting specific product package combinations so as to analyze their supply chain, identify
package alternatives and contact their members with the aim of completing the BWM survey. The third task that
can be done on parallel with the surveys after selecting the product-package combinations is the identification of
the package alternatives. The forth task which can also be done on parallel with the surveys is the relative
scoring of the alternatives regarding the degree that they satisfy each of the criteria.
As it has been thoroughly explained, the focus of this thesis is undertaking a supply chain perspective. For this
reason, while progressing through the sequential steps of the research design, a company from the food
packaging sector will have to be selected, contacted and used as a source of information. One of the largest food
and beverage companies in the world, the Kraft Heinz Company (KHC) is going to be used in order to verify the
results that will come out of the literature review, to organize the interviews for the ranking of the criteria and
finally to identify the alternative package designs.
3.3.1 The Kraft Heinz Company
The Kraft Heinz Company will be the source of information and where the application of the MCDM method
will take place. According to the their annual report (KHC, 2016), the KHC manufactures and markets food and
beverage products, including condiments and sauces, cheese and dairy, meals, meats, refreshment beverages,
coffee, and other grocery products, throughout the world. They provide products for all occasions and its most
iconic brands include Heinz, Kraft, Oscar Mayer, Planters, Philadelphia, Velveeta, Lunchables, Maxwell House,
Capri Sun, and Ore-Ida. They control the whole supply chain of their branded products, including primary
packaging, and their main business driver is sustainability.
In their factories, they have incorporated certain sustainability processes that contribute to decreased energy
consumption (KHC, 2016). They achieved this by installing new technologies and more efficient equipment,
while on the same time optimizing business and manufacturing processes. The KHC also tries identifying and
initiating opportunities to improve energy efficiency, which in turn can directly and indirectly help reduce
greenhouse gas emissions. Furthermore, in every stage of their operations they try eliminating the various forms
of waste by finding ways to reduce, reuse or recycle, so as to divert solid waste from landfills. In addition, with
water being their vital resource for growing crops, they have implemented water conservation measures and
72
evaluations globally across a wide range of actions extending from recycling water, using drip irrigation and
installing new technologies to upgrade water treatment plants
The Benelux Headquarters of KHC is located in the Netherlands, and more specifically in Zeist (KHC, 2016). In
the same area, the European Supply Chain Hub is also located, the department where most of the interviews will
take place. In the Netherlands there are also located two of the largest European manufacturing sites. One of
them is Elst, a factory located in Gelderland, which is the primary production facility of Heinz sauces for
Western Europe. The other KHC manufacturing site is in Utrecht, where the production of the various Dutch
brands takes place. The most important and successful Dutch brands are the cordials Karvan Cévitam,
Roosvicee, the bread toppings Venz, De Ruijter and the cereals Brinta. Lastly, in Nijmegen the European
Innovation Centre ‟57 is located since KHC gives a lot of importance to innovation and quality.
3.3.2 Selection of Criteria
A large part of the analysis of this thesis involves the identification of the supply chain sustainability criteria. As
it was mentioned before, the selection of the criteria has already taken place in Section 2.5. The findings will
then be verified by the Head of Packaging Europe, Mr. Guus Lueb. After presenting to him the list of criteria
that will be used, through a structured interview feedback will be gained concerning their importance and
applicability for the food packaging industry and he will also validate the framework of Sub-Section 2.5.5. This
step will ensure that the list of criteria is relevant for their further application within the KHC and thus the
research design will not be led to a dead end. However, the criteria in the final vector should not be numerous,
since a high number of criteria would only make the comparison cumbersome for the experts. Since in this
thesis equal importance is given to the three dimensions of sustainability, in total there will be three criteria
vectors, one for each performance of sustainability. As a result, each respondent of the thesis will have to grade
three sets of criteria. Ideally the size of the vector should be: and for this reason the number of
criteria in each dimension will have to be reduced. The three final vectors do not need to have equal number of
criteria, since the criteria for each dimension are internally compared to each other. In other words, even if a
criterion in the environmental performance has a higher weight than the weight of a criterion in the economic
dimension, it does not mean that it is more important. The reduction of the criteria will be achieved by asking
experts in the academia and within KHC to rank the several criteria in the form of a survey. The detailed
description of how the reduction process took place is described in Section 4.2 in the chapter of Analysis.
73
3.3.3 Selection of Total Products and Identification of Package alternatives
The next step involves the planning of interviews with managers in the packaging department of KHC, with the
aim of discussing the logic behind the selection of certain product-package combinations and brainstorming. To
do so, two interviews were planned, , one with the Strategic Materials Planner Manager of the KHC, Mr.
Adriano Martins on the 11th of April 2017, and one with the decision-maker who is the Head of Packaging
Europe of the KHC, Mr. Guus Lueb on the 13th of the same month. After conducting these interviews it was
decided that three total products will be studied; namely the Heinz Tomato Ketchup, the Heinz Seriously Good
Mayonnaise and the Heinz Beans. Moreover, the various package alternatives of these three products were also
identified. The product and package alternatives selection process is described thoroughly in Section 4.3 of the
chapter of Analysis.
3.3.4 Identification of Supply Chain Members - Calculation of Criteria Weights
In Section 3.1 the problem that this thesis will solve was characterized as a multi criteria and multi attribute
decision making problem. Due to the fact that that it involves the whole supply chain, it is also a multi actor
problem. The inclusion of several actors is imminent since they have a different perspective towards the ranking
of the criteria, and the final ranking should be representative for the whole supply chain. Furthermore, due to the
focus of the thesis on specific product-package combinations and not solely on the package or the product, the
supply chain of certain Kraft Heinz “combinations” will be tracked and analyzed. The product-package
combinations will be different types of foods so as to cover the whole food packaging industry. For each supply
chain, the most influential actors in the packaging value chain described in Figure 8 of Section 2.4 will be
contacted, namely the Raw Material Suppliers, the Packaging Material Suppliers, the Total Product
Manufacturer, the Customers, the Consumers and the End of Life Companies. Surveys will be distributed to
them and they will be asked to rank the already identified sustainability criteria. In the end, the criteria weights
will be calculated along the three vectors of the three dimensions of sustainability.
To the Raw Material Suppliers and the Packaging Material Suppliers surveys were distributed and they were
asked to be filled in by their Quality Departments. In total the surveys were successfully completed by seven
Raw Material Suppliers and seven Packaging Material Suppliers. For the total product manufacturer slot, the
Head of Packaging Europe of KHC, Mr. Guus Lueb was interviewed and asked to fill in the BWM survey on the
29th of May 2017. For the customers, the request to get the contacts from KHC is still pending and as a result
this spot was covered by organizing two structured interviews with two demand planners. The first was Mr.
Luuk Oudendorp on the 2nd
of July 2017, a Category Demand Planner of KHC for the region of Benelux, while
the second was Mrs. Loes Albers on the 7th of July 2017, the Demand Planning Manager of KHC for the regions
74
of United Kingdom and Ireland. They were asked to represent the two largest retail chain stores in their
respective regions. Next, for the Consumers, the conventional sampling method was chosen since filling in the
BWM survey requires some expertise in the field of sustainability. In the end, thirty-five BWM surveys were
completed successfully. Lastly, since the KHC does not directly cooperate with a recycling company, there is a
pending request with the Verpakking en Milieu (foundation for packaging and the environment) to arrange a
meeting so as find contacts to represent the End-of-Life Companies. Due to the fact that the slot of the End-of-
Life Companies was open, it was asked by two managers of KHC to cover it. The first interview was with the
Process Improvement Manager of KHC, Mr. Chris Pinkney on the 3rd
of July 2017, who is responsible for the
write-offs of finished goods, and the second with the Strategic Materials Planner Manager, Mr. Adriano Martins
on the 4th of the same month, who is responsible for the disposal of the packages in the production plants. They
were both asked to represent an End-of-Life company that cooperates with KHC. The detailed information
regarding how the weights were calculated for each of the six members in the supply chain of the total products
under study is presented in different sections in Chapter 4.
3.3.5 Assigning Scores to Package Alternatives
In order select the optimal package design after the criteria weights have been calculated, scores have to be
assigned to each alternative package design of the three total products, in relation to each of the criteria in the
three dimensions of sustainability. The person that was selected for this highly-qualified task was the Head of
Packaging Europe of KHC, Mr. Guus Lueb. Through a structured interview on the 29th of May 2017 he was
asked to assign a score to each pair of package alternative-criterion, which indicates the degree that this
alternative satisfies the respective criterion. This procedure was conducted for the three products under study,
covering all the alternative package designs and all the identified criteria. The detailed description of this
process and presentation of the scores is described in Section 4.6 of the chapter of Analysis.
Concluding, the research design is composed of different research methods for gathering quantitative and
qualitative data. It incorporates criteria ranking surveys in order to acquire the expert‟s opinion for the reduction
of the number of criteria, online BWM surveys for the calculation of criteria weights for the Raw Material
Suppliers, the Packaging Material Suppliers and the Consumers, structured interviews with managers in the
KHC for participating in the BWM survey representing the Total Product Manufacturer, the Customers and the
End of Life Companies. In addition, the structured interview method was also used so as to assign the relative
scores of each package alternative with each criterion, while informal lobby interviews in the form of
discussions with managers in KHC so as to validate the framework of Section 2.5 and to select the products and
their package alternatives in a qualitative manner. All the aforementioned research methods are described in
detail in their respective section in the chapter of Analysis.
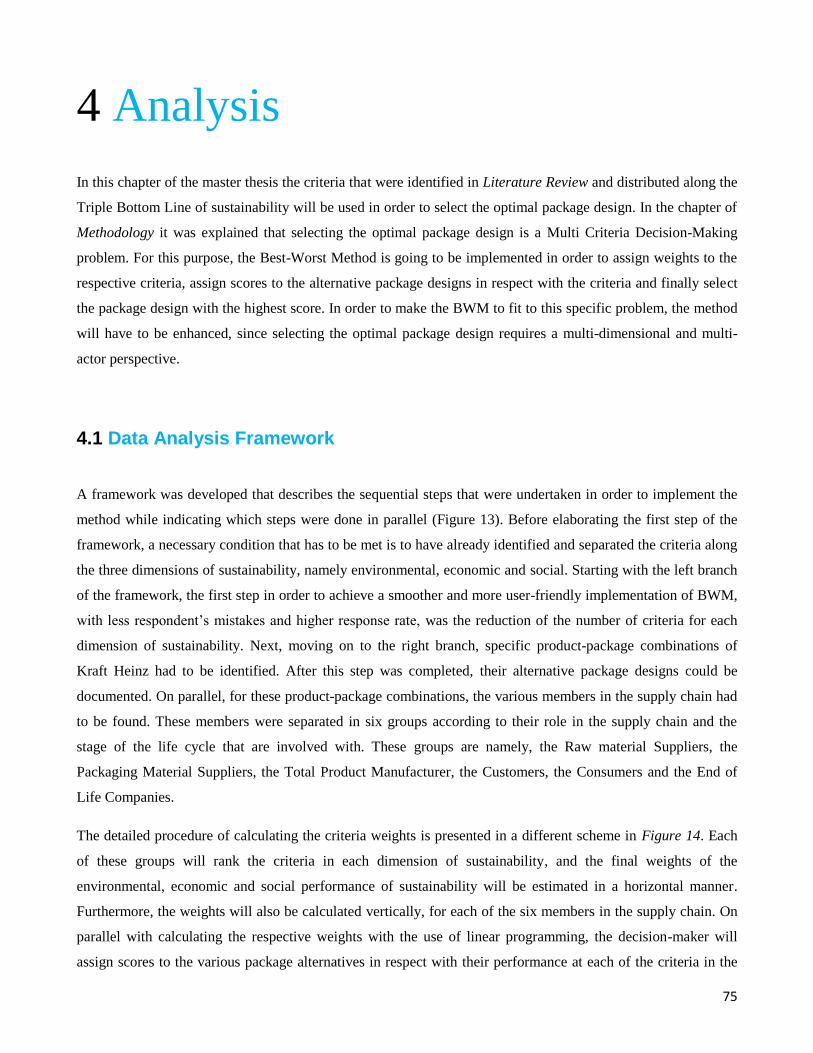
75
4 Analysis
In this chapter of the master thesis the criteria that were identified in Literature Review and distributed along the
Triple Bottom Line of sustainability will be used in order to select the optimal package design. In the chapter of
Methodology it was explained that selecting the optimal package design is a Multi Criteria Decision-Making
problem. For this purpose, the Best-Worst Method is going to be implemented in order to assign weights to the
respective criteria, assign scores to the alternative package designs in respect with the criteria and finally select
the package design with the highest score. In order to make the BWM to fit to this specific problem, the method
will have to be enhanced, since selecting the optimal package design requires a multi-dimensional and multi-
actor perspective.
4.1 Data Analysis Framework
A framework was developed that describes the sequential steps that were undertaken in order to implement the
method while indicating which steps were done in parallel (Figure 13). Before elaborating the first step of the
framework, a necessary condition that has to be met is to have already identified and separated the criteria along
the three dimensions of sustainability, namely environmental, economic and social. Starting with the left branch
of the framework, the first step in order to achieve a smoother and more user-friendly implementation of BWM,
with less respondent‟s mistakes and higher response rate, was the reduction of the number of criteria for each
dimension of sustainability. Next, moving on to the right branch, specific product-package combinations of
Kraft Heinz had to be identified. After this step was completed, their alternative package designs could be
documented. On parallel, for these product-package combinations, the various members in the supply chain had
to be found. These members were separated in six groups according to their role in the supply chain and the
stage of the life cycle that are involved with. These groups are namely, the Raw material Suppliers, the
Packaging Material Suppliers, the Total Product Manufacturer, the Customers, the Consumers and the End of
Life Companies.
The detailed procedure of calculating the criteria weights is presented in a different scheme in Figure 14. Each
of these groups will rank the criteria in each dimension of sustainability, and the final weights of the
environmental, economic and social performance of sustainability will be estimated in a horizontal manner.
Furthermore, the weights will also be calculated vertically, for each of the six members in the supply chain. On
parallel with calculating the respective weights with the use of linear programming, the decision-maker will
assign scores to the various package alternatives in respect with their performance at each of the criteria in the
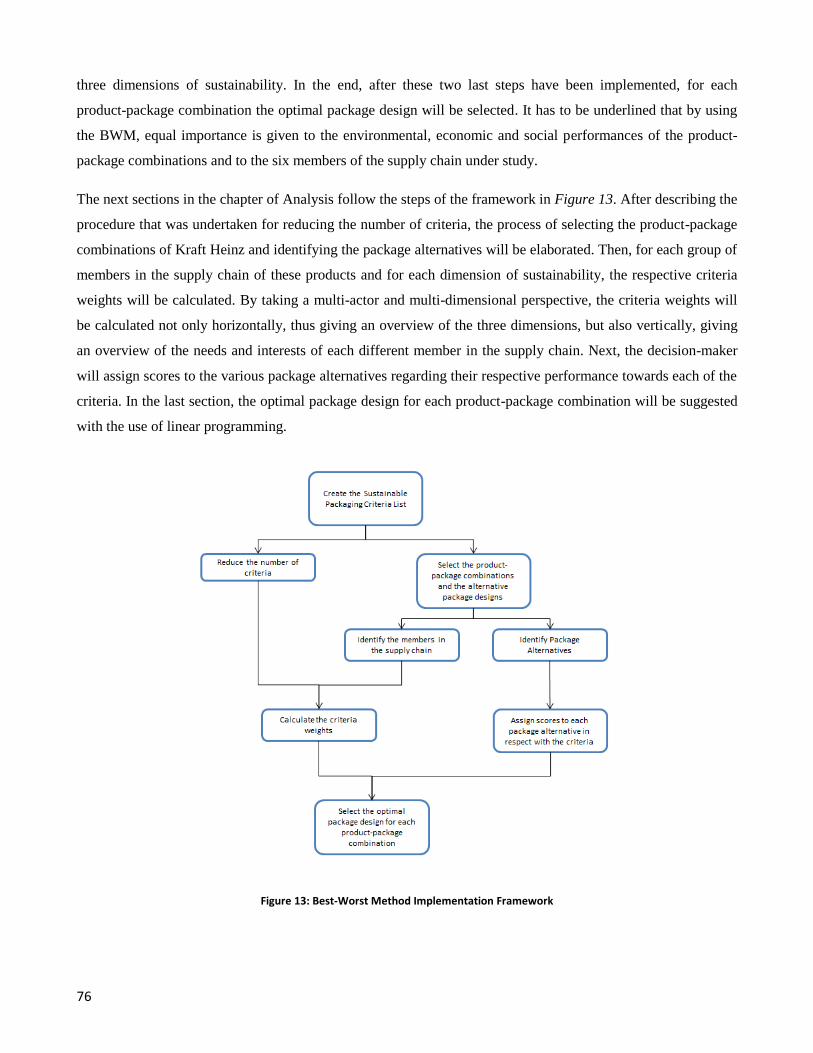
76
three dimensions of sustainability. In the end, after these two last steps have been implemented, for each
product-package combination the optimal package design will be selected. It has to be underlined that by using
the BWM, equal importance is given to the environmental, economic and social performances of the product-
package combinations and to the six members of the supply chain under study.
The next sections in the chapter of Analysis follow the steps of the framework in Figure 13. After describing the
procedure that was undertaken for reducing the number of criteria, the process of selecting the product-package
combinations of Kraft Heinz and identifying the package alternatives will be elaborated. Then, for each group of
members in the supply chain of these products and for each dimension of sustainability, the respective criteria
weights will be calculated. By taking a multi-actor and multi-dimensional perspective, the criteria weights will
be calculated not only horizontally, thus giving an overview of the three dimensions, but also vertically, giving
an overview of the needs and interests of each different member in the supply chain. Next, the decision-maker
will assign scores to the various package alternatives regarding their respective performance towards each of the
criteria. In the last section, the optimal package design for each product-package combination will be suggested
with the use of linear programming.
Figure 13: Best-Worst Method Implementation Framework
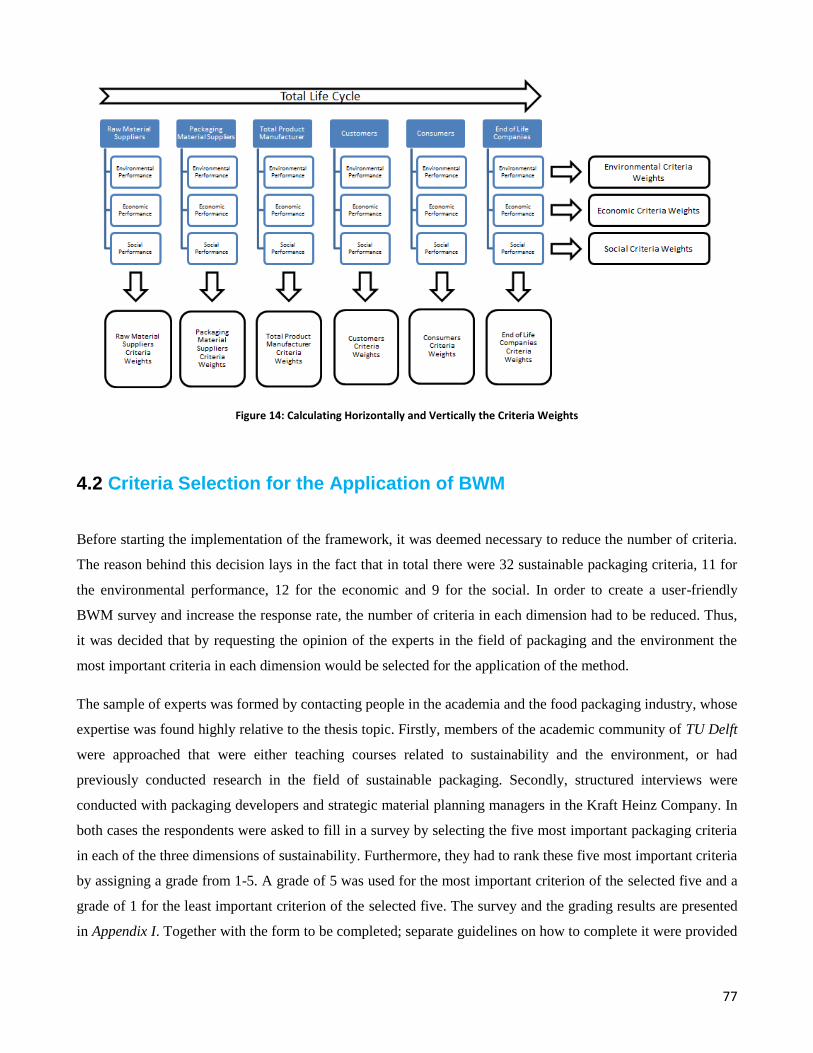
77
Figure 14: Calculating Horizontally and Vertically the Criteria Weights
4.2 Criteria Selection for the Application of BWM
Before starting the implementation of the framework, it was deemed necessary to reduce the number of criteria.
The reason behind this decision lays in the fact that in total there were 32 sustainable packaging criteria, 11 for
the environmental performance, 12 for the economic and 9 for the social. In order to create a user-friendly
BWM survey and increase the response rate, the number of criteria in each dimension had to be reduced. Thus,
it was decided that by requesting the opinion of the experts in the field of packaging and the environment the
most important criteria in each dimension would be selected for the application of the method.
The sample of experts was formed by contacting people in the academia and the food packaging industry, whose
expertise was found highly relative to the thesis topic. Firstly, members of the academic community of TU Delft
were approached that were either teaching courses related to sustainability and the environment, or had
previously conducted research in the field of sustainable packaging. Secondly, structured interviews were
conducted with packaging developers and strategic material planning managers in the Kraft Heinz Company. In
both cases the respondents were asked to fill in a survey by selecting the five most important packaging criteria
in each of the three dimensions of sustainability. Furthermore, they had to rank these five most important criteria
by assigning a grade from 1-5. A grade of 5 was used for the most important criterion of the selected five and a
grade of 1 for the least important criterion of the selected five. The survey and the grading results are presented
in Appendix I. Together with the form to be completed; separate guidelines on how to complete it were provided

78
to the respondents and also a list with the criteria definitions. The criteria definitions are presented in Appendix
IV.
In the end, the summation of the respective criteria grades of all respondents was calculated for each of three
dimensions of sustainability. Regarding the respondents of the academia, from the twenty-five invitations for
participation that were sent out, only five were completed successfully achieving a response rate of 20%.
Regarding the experts from the KHC, two one-hour meetings were scheduled with the Head of Packaging
Europe, Mr. Guus Lueb on the 13th of April of 2017, and the Strategic Material Planner Manager, Mr. Adriano
Martins two days earlier on the 11th of the same month. As it will be also mentioned in Section 4.3, during these
structured interviews the selection of the total products and their package alternatives took place. Since the final
total number of respondents was seven, the selection rule that was applied stated that if a criterion had a
summation of grades equal or greater than seven, then it would be included in the implementation of the BWM.
By applying the aforementioned rule, the following criteria were selected (Table 9).
Table 9: Final Sustainable Packaging Criteria for the Application of BWM
Sustainable Packaging Criteria
Environmental Performance Economic Performance Social Performance 1. Transported in an environmentally friendly way
1. Performance meets market needs
1. Beneficial for individuals and the community
2. Manufactured in an environmentally friendly way
2. Sourcing, manufacturing, distribution and recycling costs
2. Healthy and safe for individuals and the community
3. Recycled, reused, disposed in an environmentally friendly way
3. Physically designed to optimize materials and energy
3. Manages Reputational Risk
4. Uses recycled, renewable, reused sourced materials
4. Continuity 4. In accordance with governmental policies and regulations
5. Recovered and utilized in industrial closed loop cycles
5. Cooperation with supply chain members
5. Employee’s quality of life
6. Avoids packaging and raw material waste
6. Profitability 6. Suppliers and carriers are certified
7. Package Functionality
4.3 Selection of Total Products and Alternative Package Designs
On parallel with reducing the number of criteria, that task of selecting the total products that will be studied was
executed. As it was mentioned in Section 4.1, during the structured interviews with the Head of Packaging
Europe of KHC and the Strategic Material Planner Manager of KHC, Mr. Adriano Martins for selecting the
most important criteria that would be included in the application of BWM, also a discussion was made regarding
the products that would be selected. In the end, the three products that were chosen were the Heinz Tomato
79
Ketchup, the Heinz Seriously Good Mayonnaise and the Heinz Beans. These products and their corresponding
alternative package designs are depicted in Appendix II.
The criteria according to which these products were selected will be elaborated in this section. First of all, the
products had to be produced in one of the factories in Europe so as the responsible managers that would be
interviewed to be located in the Netherlands, either in the European Supply Chain Hub in Zeist, Utrecht area, or
the European Innovation Centre ‟57 in Nijmegen. Another reason for selecting the products from the European
factories was the fact that the members of their supply chain would most likely also be located in the same
continent. Secondly, a criterion was also set for the nature of the product-package combinations. It was decided
that two of the three products, namely the ketchup and the mayonnaise, will be of the same food type of sauces,
sharing the same form and qualities, and thus sharing the same alternative package designs and having the same
Packaging Material Suppliers in their chains. The third product, the beans, was selected for being a product that
shares nothing in common with the other two. A third criterion that was established and led to the selection of
these three products was the number of distinct alternative package designs. The ketchup and the mayonnaise
have six different packages, while the beans three and each one of these is designed for a specific use and for
serving specific needs. It has to be underlined that in these package alternatives the different variations in the
amount of the contained product are not taken into account. The last and fifth criterion that was taken into
account was the selection of products that are globally known and are the “cash cows” of KHC. These products
prevail in the competition in the respective market that they are introduced and this way the impact of the thesis
will be greater and a generalization of the findings for other similar products could be feasible.
4.4 Calculation of Criteria Weights along the Supply Chain Members
In this section, the results of the completed BWM surveys will be presented for each of the six members in the
supply chain of the selected product-package combinations. As it was explained in Section 3.3, the surveys were
completed by applying two different research methods, online surveys and structured interviews. The online
surveys were used for gathering data for the Raw material Suppliers, the Packaging Material Suppliers and the
Consumers. On the other hand, the structured interviews were used for the Total Product Manufacturer, and the
representatives of the Customers and the End-of-Life Companies, the two supply chain members that were
covered internally through the KHC. It has to be underlined that in the structured interviews the respondents
filled in the same survey. An example of the BWM survey is given in Appendix III while the definitions of the
criteria that were handed out together with the surveys are placed in Appendix IV.
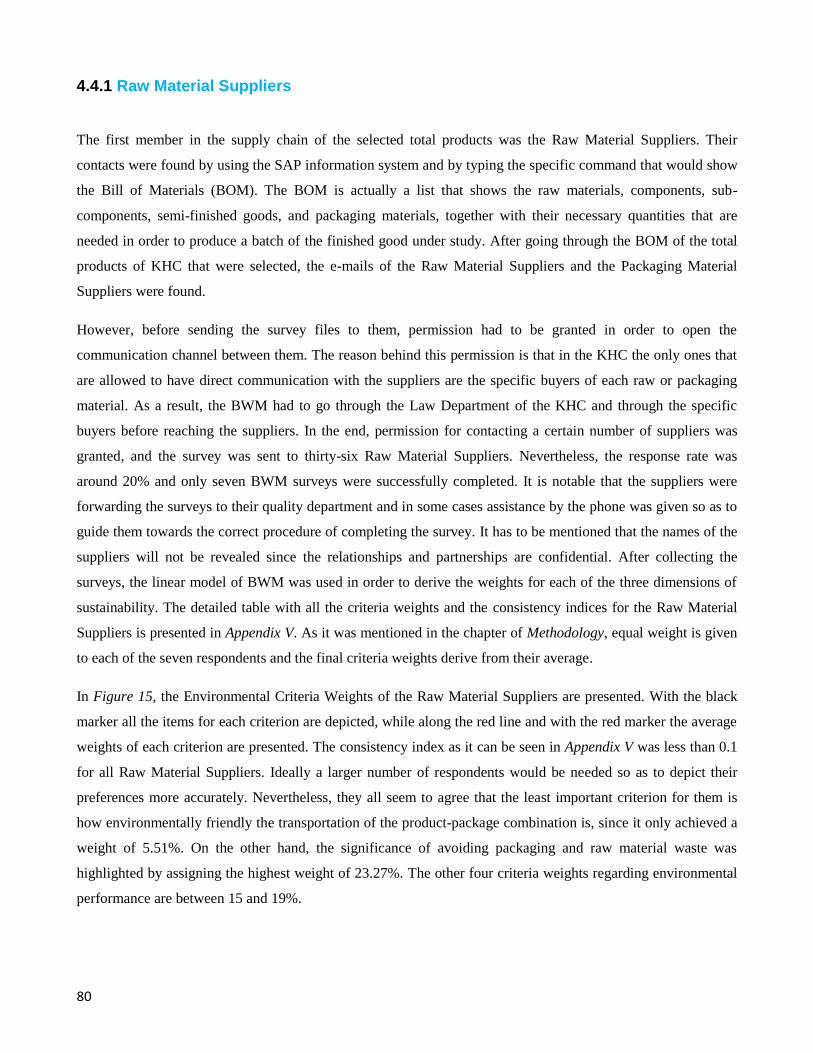
80
4.4.1 Raw Material Suppliers
The first member in the supply chain of the selected total products was the Raw Material Suppliers. Their
contacts were found by using the SAP information system and by typing the specific command that would show
the Bill of Materials (BOM). The BOM is actually a list that shows the raw materials, components, sub-
components, semi-finished goods, and packaging materials, together with their necessary quantities that are
needed in order to produce a batch of the finished good under study. After going through the BOM of the total
products of KHC that were selected, the e-mails of the Raw Material Suppliers and the Packaging Material
Suppliers were found.
However, before sending the survey files to them, permission had to be granted in order to open the
communication channel between them. The reason behind this permission is that in the KHC the only ones that
are allowed to have direct communication with the suppliers are the specific buyers of each raw or packaging
material. As a result, the BWM had to go through the Law Department of the KHC and through the specific
buyers before reaching the suppliers. In the end, permission for contacting a certain number of suppliers was
granted, and the survey was sent to thirty-six Raw Material Suppliers. Nevertheless, the response rate was
around 20% and only seven BWM surveys were successfully completed. It is notable that the suppliers were
forwarding the surveys to their quality department and in some cases assistance by the phone was given so as to
guide them towards the correct procedure of completing the survey. It has to be mentioned that the names of the
suppliers will not be revealed since the relationships and partnerships are confidential. After collecting the
surveys, the linear model of BWM was used in order to derive the weights for each of the three dimensions of
sustainability. The detailed table with all the criteria weights and the consistency indices for the Raw Material
Suppliers is presented in Appendix V. As it was mentioned in the chapter of Methodology, equal weight is given
to each of the seven respondents and the final criteria weights derive from their average.
In Figure 15, the Environmental Criteria Weights of the Raw Material Suppliers are presented. With the black
marker all the items for each criterion are depicted, while along the red line and with the red marker the average
weights of each criterion are presented. The consistency index as it can be seen in Appendix V was less than 0.1
for all Raw Material Suppliers. Ideally a larger number of respondents would be needed so as to depict their
preferences more accurately. Nevertheless, they all seem to agree that the least important criterion for them is
how environmentally friendly the transportation of the product-package combination is, since it only achieved a
weight of 5.51%. On the other hand, the significance of avoiding packaging and raw material waste was
highlighted by assigning the highest weight of 23.27%. The other four criteria weights regarding environmental
performance are between 15 and 19%.
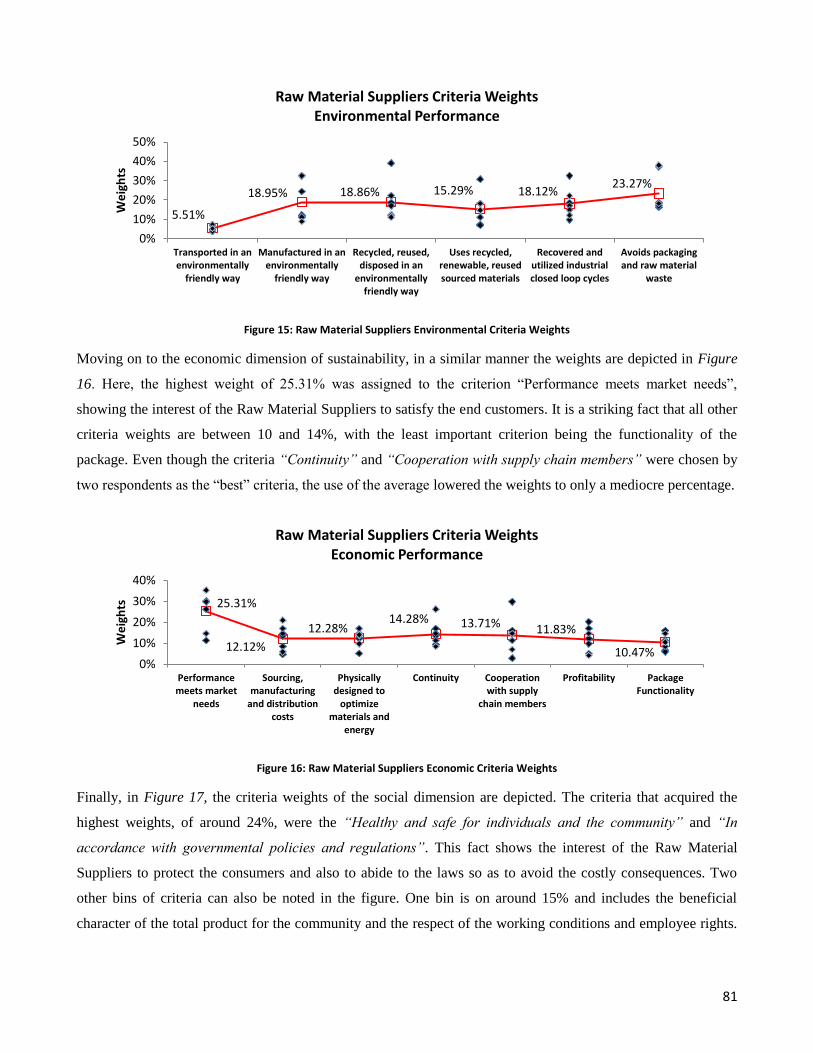
81
Figure 15: Raw Material Suppliers Environmental Criteria Weights
Moving on to the economic dimension of sustainability, in a similar manner the weights are depicted in Figure
16. Here, the highest weight of 25.31% was assigned to the criterion “Performance meets market needs”,
showing the interest of the Raw Material Suppliers to satisfy the end customers. It is a striking fact that all other
criteria weights are between 10 and 14%, with the least important criterion being the functionality of the
package. Even though the criteria “Continuity” and “Cooperation with supply chain members” were chosen by
two respondents as the “best” criteria, the use of the average lowered the weights to only a mediocre percentage.
Figure 16: Raw Material Suppliers Economic Criteria Weights
Finally, in Figure 17, the criteria weights of the social dimension are depicted. The criteria that acquired the
highest weights, of around 24%, were the “Healthy and safe for individuals and the community” and “In
accordance with governmental policies and regulations”. This fact shows the interest of the Raw Material
Suppliers to protect the consumers and also to abide to the laws so as to avoid the costly consequences. Two
other bins of criteria can also be noted in the figure. One bin is on around 15% and includes the beneficial
character of the total product for the community and the respect of the working conditions and employee rights.
5.51%
18.95% 18.86% 15.29% 18.12% 23.27%
0%
10%
20%
30%
40%
50%
Transported in anenvironmentally
friendly way
Manufactured in anenvironmentally
friendly way
Recycled, reused,disposed in an
environmentallyfriendly way
Uses recycled,renewable, reusedsourced materials
Recovered andutilized industrialclosed loop cycles
Avoids packagingand raw material
waste
We
igh
ts
Raw Material Suppliers Criteria Weights Environmental Performance
25.31%
12.12%
12.28% 14.28% 13.71% 11.83%
10.47% 0%
10%
20%
30%
40%
Performancemeets market
needs
Sourcing,manufacturing
and distributioncosts
Physicallydesigned to
optimizematerials and
energy
Continuity Cooperationwith supply
chain members
Profitability PackageFunctionality
We
igh
ts
Raw Material Suppliers Criteria Weights Economic Performance

82
The other bin, on around 10% incorporates mitigating risk and the necessity of having certified suppliers and
carriers.
Figure 17: Raw Material Suppliers Social Criteria Weights
4.4.2 Packaging Material Suppliers
For estimating the criteria weights for the Packaging Material Suppliers the same procedure as the one for the
Raw Material Suppliers was used. The contacts were found through the BOM and permission was granted from
certain buyers. As a result, only a specific number of the suppliers of the total products under study could
participate in the survey. The response rate was 30% since seven out of the twenty-three surveys were
completed. However, also in this case, the names of the suppliers will be kept hidden. The detailed estimated
weights are presented in Appendix V.
In Figure 18, the estimated weights regarding the environmental dimension of sustainability are depicted. From
the figure it can be seen that eco-efficient production attracts the most attention of the Packaging Material
Suppliers, as it acquired a weight of 24.20%. Furthermore, avoiding packaging and raw material waste is also a
criterion highly valued when deciding on the package design. The rest of the criteria had a weight that varied
from 10 to 17%, with the ability of the package to be recovered in industrial closed loop cycles acquiring the last
place.
14.67% 24.22% 9.93%
23.35% 16.73%
11.11%
0%10%20%30%40%50%60%70%
Beneficial forindividuals and the
community
Healthy and safefor individuals and
the community
Managesreputational risk
In accordance withgovernmentalpolicies andregulations
Employee's qualityof life
Suppliers andcarriers are
certified
We
igh
ts
Raw Material Suppliers Criteria Weights Social Performance
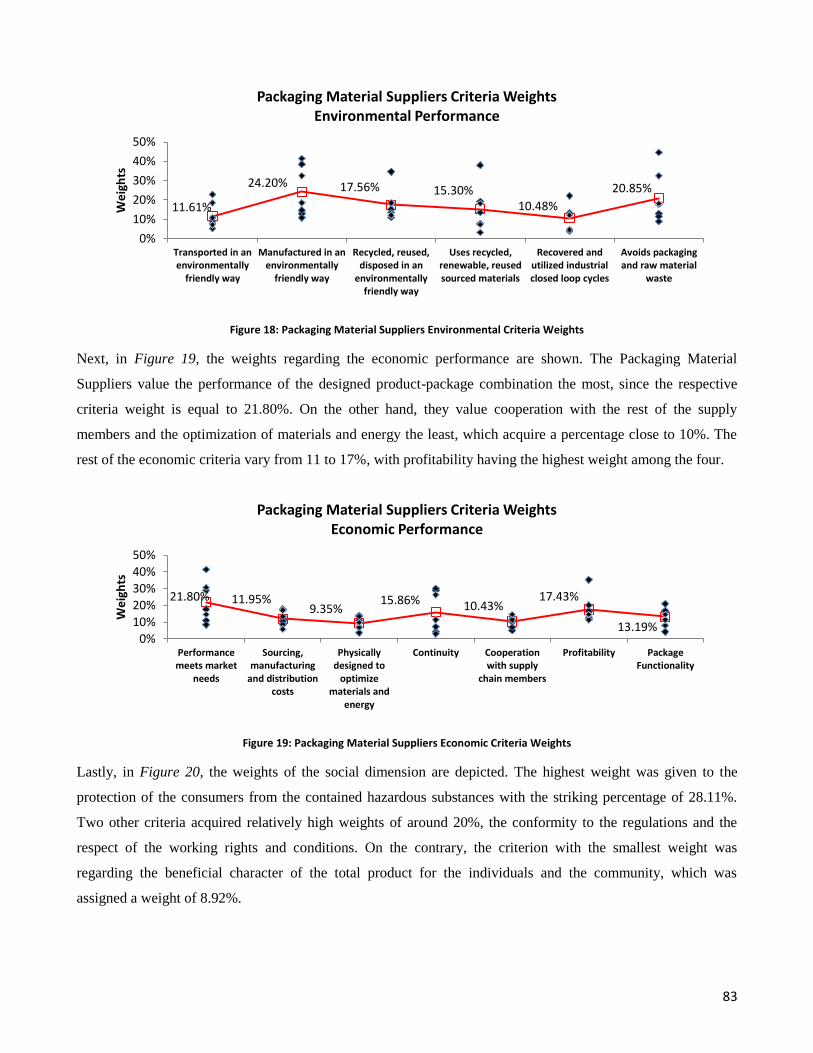
83
Figure 18: Packaging Material Suppliers Environmental Criteria Weights
Next, in Figure 19, the weights regarding the economic performance are shown. The Packaging Material
Suppliers value the performance of the designed product-package combination the most, since the respective
criteria weight is equal to 21.80%. On the other hand, they value cooperation with the rest of the supply
members and the optimization of materials and energy the least, which acquire a percentage close to 10%. The
rest of the economic criteria vary from 11 to 17%, with profitability having the highest weight among the four.
Figure 19: Packaging Material Suppliers Economic Criteria Weights
Lastly, in Figure 20, the weights of the social dimension are depicted. The highest weight was given to the
protection of the consumers from the contained hazardous substances with the striking percentage of 28.11%.
Two other criteria acquired relatively high weights of around 20%, the conformity to the regulations and the
respect of the working rights and conditions. On the contrary, the criterion with the smallest weight was
regarding the beneficial character of the total product for the individuals and the community, which was
assigned a weight of 8.92%.
11.61%
24.20% 17.56% 15.30% 10.48%
20.85%
0%
10%
20%
30%
40%
50%
Transported in anenvironmentally
friendly way
Manufactured in anenvironmentally
friendly way
Recycled, reused,disposed in an
environmentallyfriendly way
Uses recycled,renewable, reusedsourced materials
Recovered andutilized industrialclosed loop cycles
Avoids packagingand raw material
waste
We
igh
ts
Packaging Material Suppliers Criteria Weights Environmental Performance
21.80% 11.95% 9.35%
15.86% 10.43% 17.43%
13.19% 0%
10%
20%
30%
40%
50%
Performancemeets market
needs
Sourcing,manufacturing
and distributioncosts
Physicallydesigned to
optimizematerials and
energy
Continuity Cooperationwith supply
chain members
Profitability PackageFunctionality
We
igh
ts
Packaging Material Suppliers Criteria Weights Economic Performance

84
Figure 20: Packaging Material Suppliers Social Criteria Weights
4.4.3 Total Product Manufacturer
In order to estimate the criteria weights for the Total Product Manufacturer, the decision-maker, who is the Head
of Packaging Europe in the KHC, was contacted. A second one-hour structured interview was organized with
Mr. Guus Lueb, where he was asked to fill in the BWM survey. The second interview with Mr. Guus Lueb took
place in the European Innovation Centre ‟57 of KHC on the 29th of May 2017. Apart from filling the survey he
was also asked to fill in the table of assigning scores to the alternative package designs that will be presented in
Section 4.6. Since he holds the top position in the hierarchy in the packaging department of whole Europe, these
weights are regarded as absolute in order to represent the Total Product Manufacturer in the supply chain under
study.
In Figure 21, the criteria weights regarding the environmental performance of sustainability are gathered. It can
be noted that the most important criterion for KHC is having a specific package design that would avoid
packaging and raw material waste. It acquired a percentage of as high as 41.43%. In addition, attention is also
given to energy efficiency in transportation of the finished goods and the raw and packaging materials. On the
contrary, weights below 7% were assigned to the criteria related to closed loop cycles, energy efficiency in the
end-of-life stage and the use of recycled materials in production. Lastly, eco-efficient production was also
highlighted as an important criterion having a weight of 16.62%.
8.90%
28.11%
10.72%
20.24% 20.31% 11.72%
0%
10%
20%
30%
40%
Beneficial forindividuals and the
community
Healthy and safefor individuals and
the community
Managesreputational risk
In accordance withgovernmentalpolicies andregulations
Employee's qualityof life
Suppliers andcarriers are
certified
We
igh
ts
Packaging Material Suppliers Criteria Weights Social Performance

85
Figure 21: Total Product Manufacturer Environmental Criteria Weights
Then, in Figure 22, the economic criteria weights are depicted. The criterion that is valued the most by the
decision maker, having a weight of 27.24% is “Performance meets market needs”. The second place is shared
between two criteria that had exactly the same weight of 18.73% and are related to the incoming cash flows of
the firm. The first one is about reducing the operational costs, while the second is about maintaining a profitable
business. The economic criterion that is valued the least with a weight of 3.67% is continuity in the operational
activities, showing the interest of KHC to change their main process in favor of introducing a new sustainable
product-package combination.
Figure 22: Total Product Manufacturer Economic Criteria Weights
Lastly, in Figure 23, the social criteria weights of the Total Product Manufacturer are presented. Designing a
package that adds real value to the society by supporting informed and responsible consumption and by
effectively containing and protecting products acquired the highest weight of 34.53%. Furthermore, the second
most valued social criterion with a weight of 18.73% is the control of the reputational risk of the firm that is
jeopardized with the introduction of a new total product. The least important criterion for the decision maker
was regarding the necessary environmental and social certification of the distributors and suppliers of KHC.
24.93%
16.62%
6.23% 3.67%
7.12%
41.43%
0%
10%
20%
30%
40%
50%
Transported in anenvironmentally
friendly way
Manufactured in anenvironmentally
friendly way
Recycled, reused,disposed in an
environmentallyfriendly way
Uses recycled,renewable, reusedsourced materials
Recovered andutilized industrialclosed loop cycles
Avoids packagingand raw material
waste
We
igh
ts
Total Product Manufacturer Criteria Weights Environmental Performance
27.24%
18.73% 12.49%
2.84%
7.49%
18.73%
12.49%
0%
10%
20%
30%
Performancemeets market
needs
Sourcing,manufacturing
and distributioncosts
Physicallydesigned to
optimizematerials and
energy
Continuity Cooperationwith supply
chain members
Profitability PackageFunctionality
We
igh
ts
Total Product Manufacturer Criteria Weights Economic Performance

86
Figure 23: Total Product Manufacturer Social Criteria Weights
4.4.4 Customers
As it was mentioned in Section 3.3.4 of the chapter of Methodology, the weights for the group of Customers
were collected internally in KHC. A request was placed on the Sales Department of KHC to access the database
of the customers in the Benelux region. However, since it has to go through the Law Department as well, the
request is still pending. For this reason the weights were estimated by organizing structured interviews with
Demand Planners. The first structured interview with Mr. Luuk Oudendorp, who is a Category Demand Planner
of KHC for the Benelux region, took place on the 2nd
of July 2017. The second one was with Mrs. Loes Albers
on the 7th of the same month, a Demand Planning Manager for the regions of UK and Ireland. The reason behind
selecting demand planners from different business units was the fact that while the Ketchup and Mayonnaise are
marketed globally, the Heinz Beans are primarily marketed in the UK. Both interviews took place in Zeist,
Utrecht area, where the European Supply Chain Hub of KHC is located. Both interviewees were asked to
represent the largest retailer in their respective region.
In Figure 24, the environmental criteria weights are depicted. A striking trend that can be seen is that the three
most important criteria are related to how environmentally friendly various life cycle stages are. According to
the demand planners a retailer values the environmentally friendly processes that are undertaken during the
production of the product-package combination the most, as the relative weight is 31.98%. The second most
important environmental criterion for them, which acquired a weight of 22.88%, is regarding the eco-efficiency
during the end-of-life stage of the product, while the third during the transportation, with a weight of 17.44%.
The other three criteria have a weight close to 10%.
34.53%
14.39%
21.58%
14.39% 10.79%
4.32%
0%
10%
20%
30%
40%
Beneficial forindividuals and the
community
Healthy and safefor individuals and
the community
Managesreputational risk
In accordance withgovernmentalpolicies andregulations
Employee's qualityof life
Suppliers andcarriers are
certified
We
igh
ts
Total Product Manufacturer Criteria Weights Social Performance

87
Figure 24: Customer Environmental Criteria Weights
Moving on to the economic dimension of sustainability, in Figure 25 it can be seen that the first place, that of
the most important criterion for the retailers, is shared with an equal percentage between two criteria,
“Performance meets market needs” and “Profitability”. Both criteria acquired a percentage of 30%, which
indicates that retailers value having a successful business greatly, and that the most effective way that this target
can be achieved is by satisfying the needs of the consumers. The third criterion in ranking was “Package
Functionality” which managed to get a weight of 10.92%, while the rest of the criteria only acquired a single
digit weight.
Figure 25: Customer Economic Criteria Weights
Regarding the social criteria weights in Figure 26, again two criteria scored nearly equally and were assigned
with the highest weight of nearly 24%. Having a product that shows care for the well-being of the consumers,
while on the same time showing conformity to the current laws is the main aim of the retailers. However, due to
the very short number of respondents, there is a huge difference between the weights that the two demand
planners assigned in these two criteria. The reason behind this discrepancy is the subjective character of the
social dimension. The rest of criteria were equally valued and their weights varied from 12 to 14%.
17.44%
31.98%
22.88%
11.23% 8.88%
7.59%
0%
10%
20%
30%
40%
50%
Transported in anenvironmentally
friendly way
Manufactured in anenvironmentally
friendly way
Recycled, reused,disposed in an
environmentallyfriendly way
Uses recycled,renewable, reusedsourced materials
Recovered andutilized industrialclosed loop cycles
Avoids packagingand raw material
waste
We
igh
ts
Customers Criteria Weights Environmental Performance
30.65%
5.71% 4.34% 8.63% 9.32%
30.43%
10.92%
0%
10%
20%
30%
40%
50%
Performancemeets market
needs
Sourcing,manufacturing
and distributioncosts
Physicallydesigned to
optimizematerials and
energy
Continuity Cooperationwith supply
chain members
Profitability PackageFunctionality
We
igh
ts
Customers Criteria Weights Economic Performance
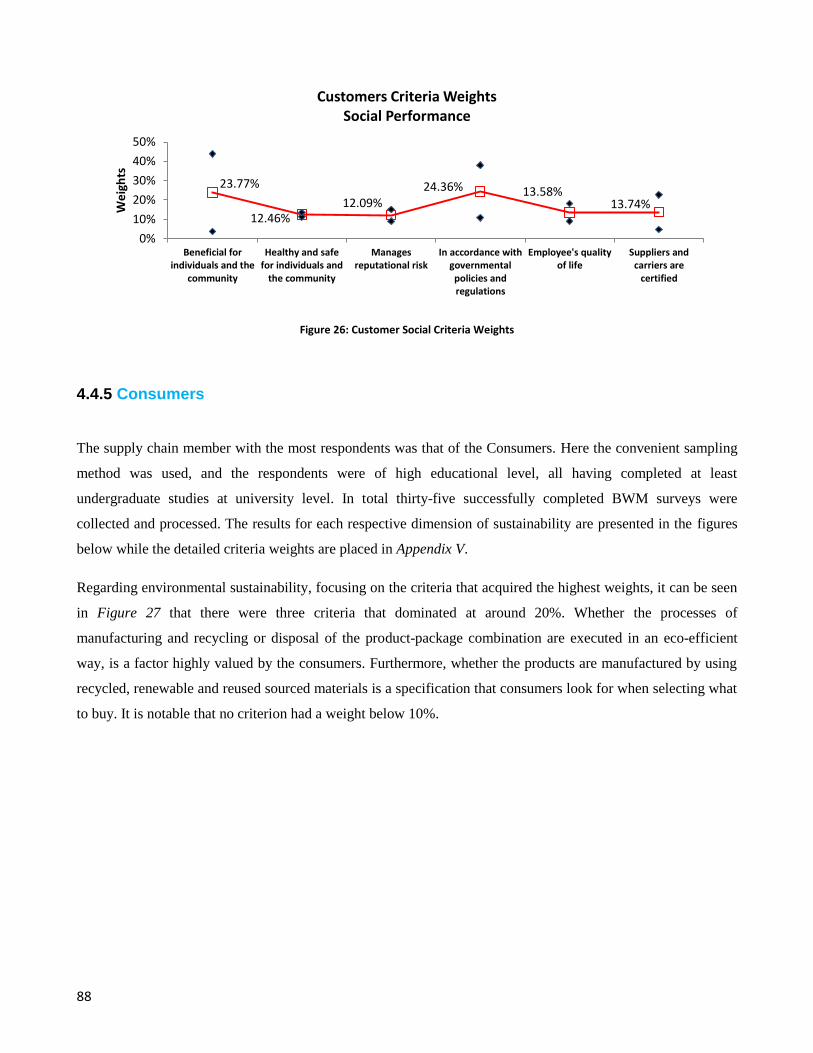
88
Figure 26: Customer Social Criteria Weights
4.4.5 Consumers
The supply chain member with the most respondents was that of the Consumers. Here the convenient sampling
method was used, and the respondents were of high educational level, all having completed at least
undergraduate studies at university level. In total thirty-five successfully completed BWM surveys were
collected and processed. The results for each respective dimension of sustainability are presented in the figures
below while the detailed criteria weights are placed in Appendix V.
Regarding environmental sustainability, focusing on the criteria that acquired the highest weights, it can be seen
in Figure 27 that there were three criteria that dominated at around 20%. Whether the processes of
manufacturing and recycling or disposal of the product-package combination are executed in an eco-efficient
way, is a factor highly valued by the consumers. Furthermore, whether the products are manufactured by using
recycled, renewable and reused sourced materials is a specification that consumers look for when selecting what
to buy. It is notable that no criterion had a weight below 10%.
23.77%
12.46% 12.09%
24.36% 13.58% 13.74%
0%
10%
20%
30%
40%
50%
Beneficial forindividuals and the
community
Healthy and safefor individuals and
the community
Managesreputational risk
In accordance withgovernmentalpolicies andregulations
Employee's qualityof life
Suppliers andcarriers are
certified
We
igh
ts
Customers Criteria Weights Social Performance

89
Figure 27: Consumers Environmental Criteria Weights
Furthermore, as far as the economic criteria weights are concerned (Figure 28), the most significant criterion for
the consumers is to satisfy their needs, with a weight of 20.17%. It is followed by the concern of the consumers
regarding the profitability of the companies that are involved in the complete life cycle of the product-package
combination, with a weight of 17.29%. The criterion that consumers seem to ignore and acquired the smallest
weight of 8.66% concerns the continuity aspect of introducing a new product in the market.
Figure 28: Consumers Economic Criteria Weights
Ending the subsection of consumers, the social criteria weights are presented in Figure 29. The criteria with a
remarkable weight of 27.94% and 22.17% respectively, are the absence of hazardous substances in the food
products on one hand, and the respect for consumer‟s well-being on the other. On the contrary the least preferred
criterion was regarding the reputational risk of the firm which is marketing the product. As far as the other
criteria are concerned, their weights vary from 10 to 16%.
10.71%
20.96%
19.15%
21.88%
11.60%
15.70%
0%10%20%30%40%50%60%
Transported in anenvironmentally
friendly way
Manufactured in anenvironmentally
friendly way
Recycled, reused,disposed in an
environmentallyfriendly way
Uses recycled,renewable, reusedsourced materials
Recovered andutilized industrialclosed loop cycles
Avoids packagingand raw material
waste
We
igh
ts
Consumers Criteria Weights Environmental Performance
20.17%
14.67%
15.60% 8.66% 11.38%
17.29%
12.22% 0%
10%20%30%40%50%60%
Performancemeets market
needs
Sourcing,manufacturing
and distributioncosts
Physicallydesigned to
optimizematerials and
energy
Continuity Cooperationwith supply
chain members
Profitability PackageFunctionality
We
igh
ts
Consumers Criteria Weights Economic Performance
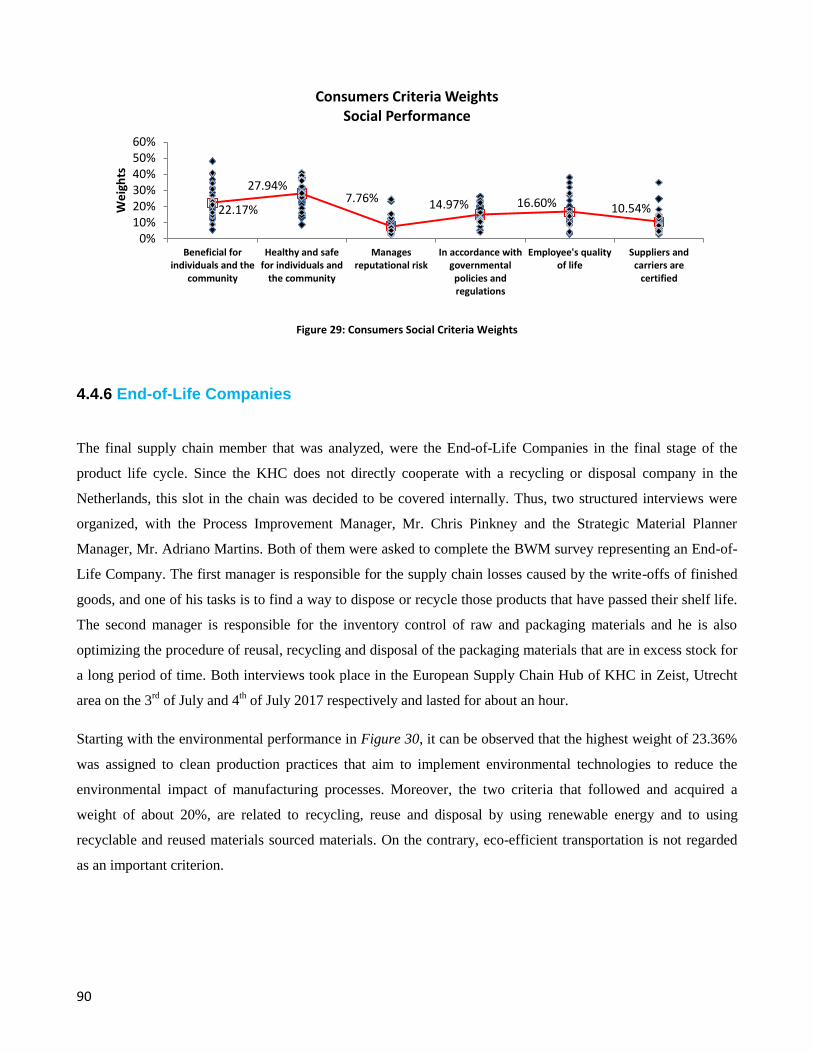
90
Figure 29: Consumers Social Criteria Weights
4.4.6 End-of-Life Companies
The final supply chain member that was analyzed, were the End-of-Life Companies in the final stage of the
product life cycle. Since the KHC does not directly cooperate with a recycling or disposal company in the
Netherlands, this slot in the chain was decided to be covered internally. Thus, two structured interviews were
organized, with the Process Improvement Manager, Mr. Chris Pinkney and the Strategic Material Planner
Manager, Mr. Adriano Martins. Both of them were asked to complete the BWM survey representing an End-of-
Life Company. The first manager is responsible for the supply chain losses caused by the write-offs of finished
goods, and one of his tasks is to find a way to dispose or recycle those products that have passed their shelf life.
The second manager is responsible for the inventory control of raw and packaging materials and he is also
optimizing the procedure of reusal, recycling and disposal of the packaging materials that are in excess stock for
a long period of time. Both interviews took place in the European Supply Chain Hub of KHC in Zeist, Utrecht
area on the 3rd
of July and 4th of July 2017 respectively and lasted for about an hour.
Starting with the environmental performance in Figure 30, it can be observed that the highest weight of 23.36%
was assigned to clean production practices that aim to implement environmental technologies to reduce the
environmental impact of manufacturing processes. Moreover, the two criteria that followed and acquired a
weight of about 20%, are related to recycling, reuse and disposal by using renewable energy and to using
recyclable and reused materials sourced materials. On the contrary, eco-efficient transportation is not regarded
as an important criterion.
22.17%
27.94% 7.76% 14.97% 16.60% 10.54%
0%10%20%30%40%50%60%
Beneficial forindividuals and the
community
Healthy and safefor individuals and
the community
Managesreputational risk
In accordance withgovernmentalpolicies andregulations
Employee's qualityof life
Suppliers andcarriers are
certified
We
igh
ts
Consumers Criteria Weights Social Performance
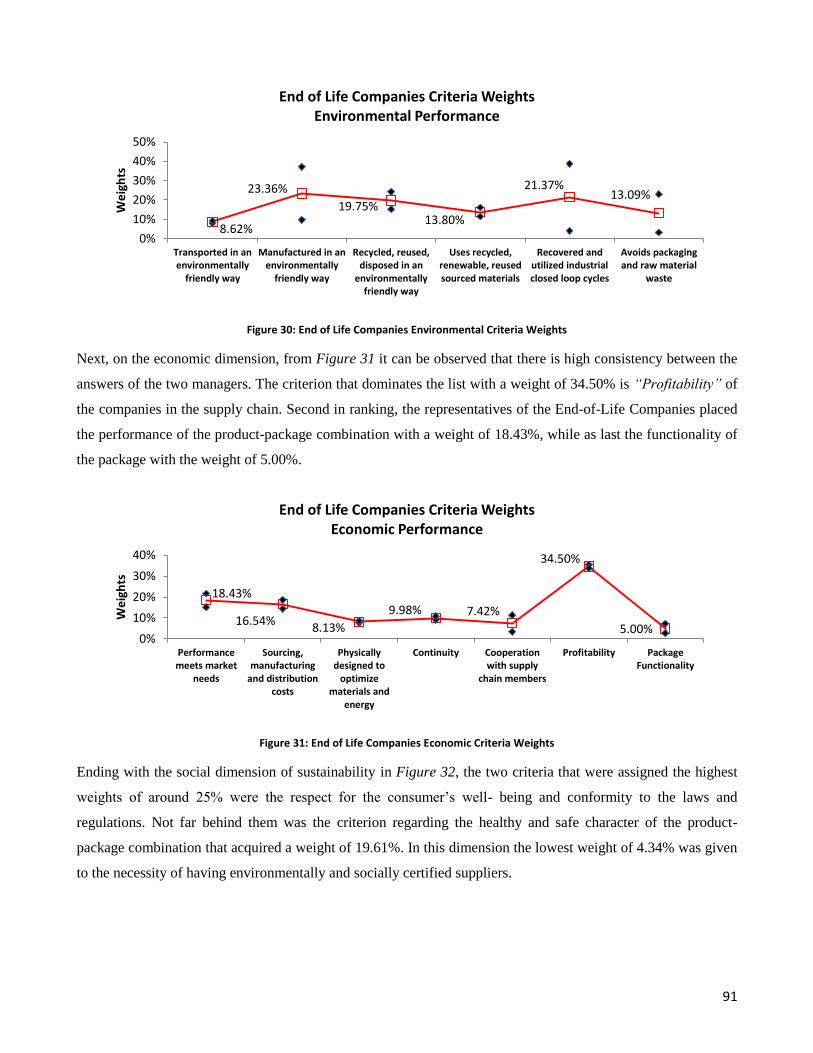
91
Figure 30: End of Life Companies Environmental Criteria Weights
Next, on the economic dimension, from Figure 31 it can be observed that there is high consistency between the
answers of the two managers. The criterion that dominates the list with a weight of 34.50% is “Profitability” of
the companies in the supply chain. Second in ranking, the representatives of the End-of-Life Companies placed
the performance of the product-package combination with a weight of 18.43%, while as last the functionality of
the package with the weight of 5.00%.
Figure 31: End of Life Companies Economic Criteria Weights
Ending with the social dimension of sustainability in Figure 32, the two criteria that were assigned the highest
weights of around 25% were the respect for the consumer‟s well- being and conformity to the laws and
regulations. Not far behind them was the criterion regarding the healthy and safe character of the product-
package combination that acquired a weight of 19.61%. In this dimension the lowest weight of 4.34% was given
to the necessity of having environmentally and socially certified suppliers.
8.62%
23.36%
19.75% 13.80%
21.37% 13.09%
0%
10%
20%
30%
40%
50%
Transported in anenvironmentally
friendly way
Manufactured in anenvironmentally
friendly way
Recycled, reused,disposed in an
environmentallyfriendly way
Uses recycled,renewable, reusedsourced materials
Recovered andutilized industrialclosed loop cycles
Avoids packagingand raw material
waste
We
igh
ts
End of Life Companies Criteria Weights Environmental Performance
18.43%
16.54% 8.13%
9.98% 7.42%
34.50%
5.00% 0%
10%
20%
30%
40%
Performancemeets market
needs
Sourcing,manufacturing
and distributioncosts
Physicallydesigned to
optimizematerials and
energy
Continuity Cooperationwith supply
chain members
Profitability PackageFunctionality
We
igh
ts
End of Life Companies Criteria Weights Economic Performance
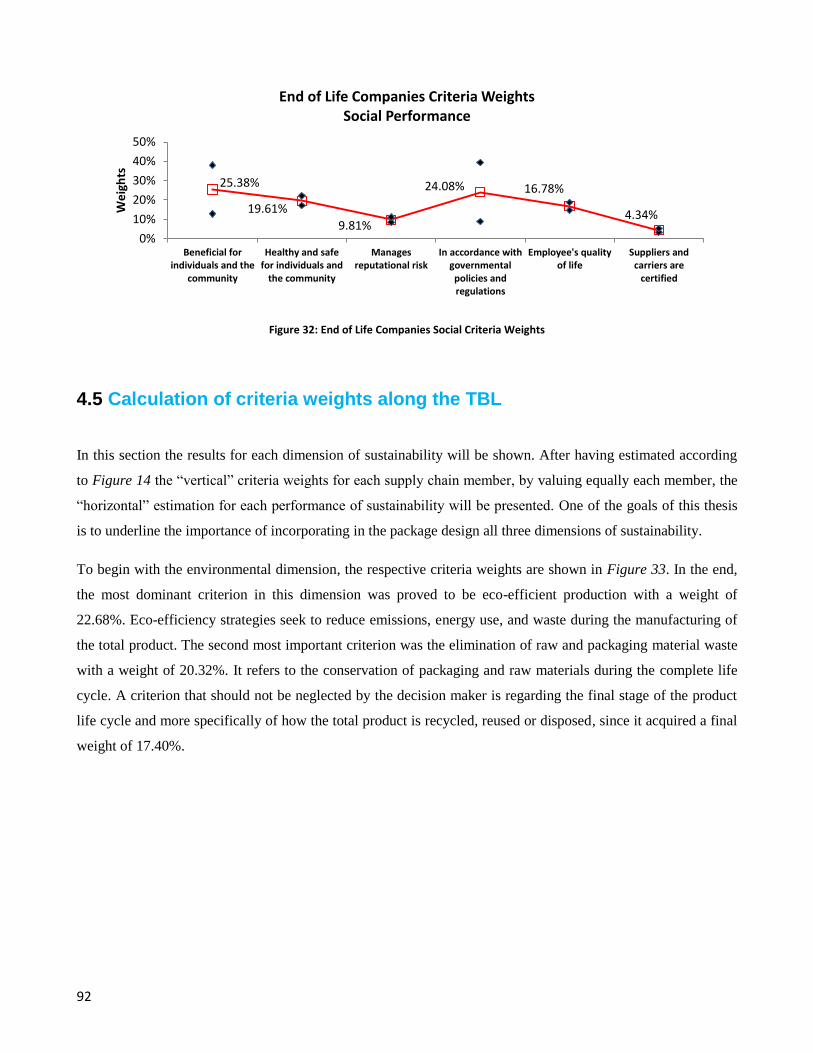
92
Figure 32: End of Life Companies Social Criteria Weights
4.5 Calculation of criteria weights along the TBL
In this section the results for each dimension of sustainability will be shown. After having estimated according
to Figure 14 the “vertical” criteria weights for each supply chain member, by valuing equally each member, the
“horizontal” estimation for each performance of sustainability will be presented. One of the goals of this thesis
is to underline the importance of incorporating in the package design all three dimensions of sustainability.
To begin with the environmental dimension, the respective criteria weights are shown in Figure 33. In the end,
the most dominant criterion in this dimension was proved to be eco-efficient production with a weight of
22.68%. Eco-efficiency strategies seek to reduce emissions, energy use, and waste during the manufacturing of
the total product. The second most important criterion was the elimination of raw and packaging material waste
with a weight of 20.32%. It refers to the conservation of packaging and raw materials during the complete life
cycle. A criterion that should not be neglected by the decision maker is regarding the final stage of the product
life cycle and more specifically of how the total product is recycled, reused or disposed, since it acquired a final
weight of 17.40%.
25.38%
19.61%
9.81%
24.08% 16.78%
4.34%
0%
10%
20%
30%
40%
50%
Beneficial forindividuals and the
community
Healthy and safefor individuals and
the community
Managesreputational risk
In accordance withgovernmentalpolicies andregulations
Employee's qualityof life
Suppliers andcarriers are
certified
We
igh
ts
End of Life Companies Criteria Weights Social Performance
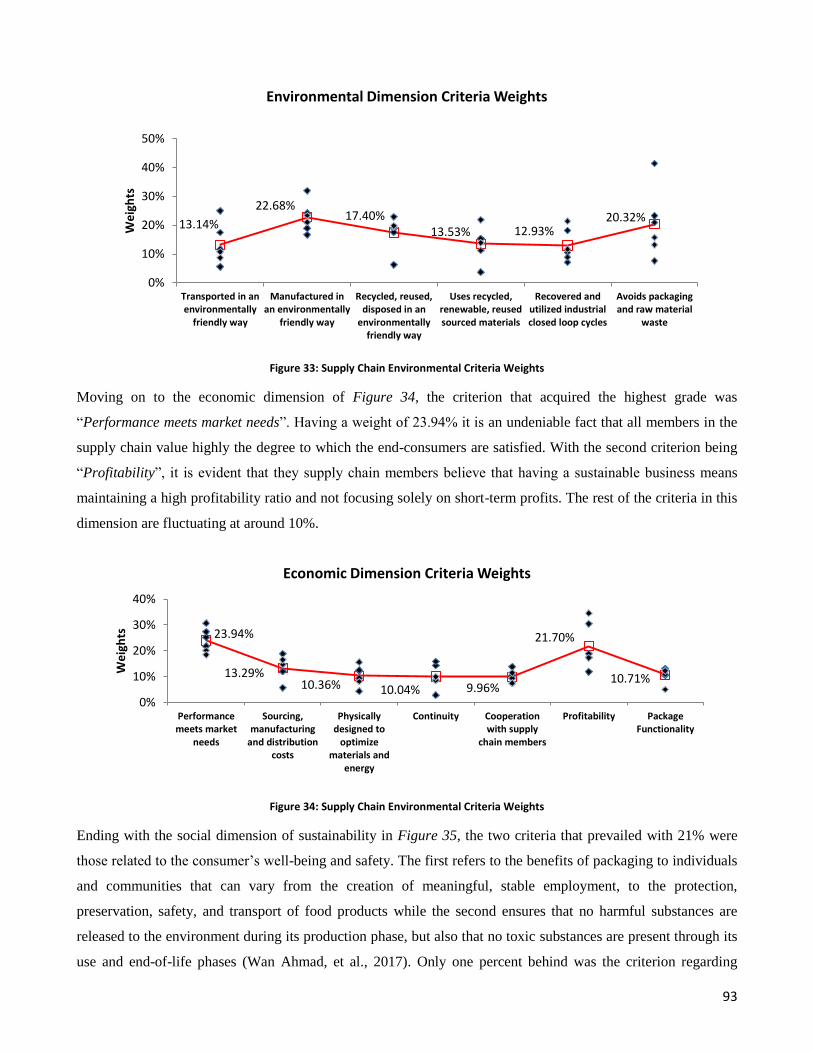
93
Figure 33: Supply Chain Environmental Criteria Weights
Moving on to the economic dimension of Figure 34, the criterion that acquired the highest grade was
“Performance meets market needs”. Having a weight of 23.94% it is an undeniable fact that all members in the
supply chain value highly the degree to which the end-consumers are satisfied. With the second criterion being
“Profitability”, it is evident that they supply chain members believe that having a sustainable business means
maintaining a high profitability ratio and not focusing solely on short-term profits. The rest of the criteria in this
dimension are fluctuating at around 10%.
Figure 34: Supply Chain Environmental Criteria Weights
Ending with the social dimension of sustainability in Figure 35, the two criteria that prevailed with 21% were
those related to the consumer‟s well-being and safety. The first refers to the benefits of packaging to individuals
and communities that can vary from the creation of meaningful, stable employment, to the protection,
preservation, safety, and transport of food products while the second ensures that no harmful substances are
released to the environment during its production phase, but also that no toxic substances are present through its
use and end-of-life phases (Wan Ahmad, et al., 2017). Only one percent behind was the criterion regarding
13.14%
22.68% 17.40%
13.53% 12.93% 20.32%
0%
10%
20%
30%
40%
50%
Transported in anenvironmentally
friendly way
Manufactured inan environmentally
friendly way
Recycled, reused,disposed in an
environmentallyfriendly way
Uses recycled,renewable, reusedsourced materials
Recovered andutilized industrialclosed loop cycles
Avoids packagingand raw material
waste
We
igh
ts
Environmental Dimension Criteria Weights
23.94%
13.29% 10.36% 10.04% 9.96%
21.70%
10.71%
0%
10%
20%
30%
40%
Performancemeets market
needs
Sourcing,manufacturing
and distributioncosts
Physicallydesigned to
optimizematerials and
energy
Continuity Cooperationwith supply
chain members
Profitability PackageFunctionality
We
igh
ts
Economic Dimension Criteria Weights
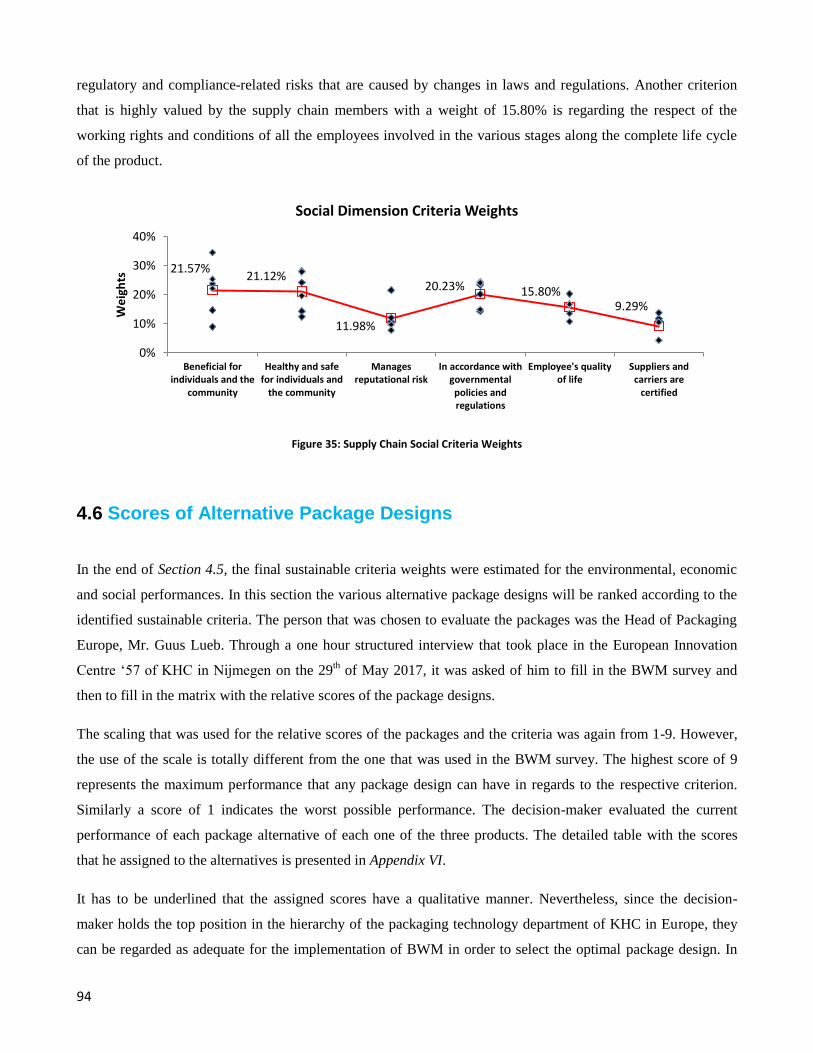
94
regulatory and compliance-related risks that are caused by changes in laws and regulations. Another criterion
that is highly valued by the supply chain members with a weight of 15.80% is regarding the respect of the
working rights and conditions of all the employees involved in the various stages along the complete life cycle
of the product.
Figure 35: Supply Chain Social Criteria Weights
4.6 Scores of Alternative Package Designs
In the end of Section 4.5, the final sustainable criteria weights were estimated for the environmental, economic
and social performances. In this section the various alternative package designs will be ranked according to the
identified sustainable criteria. The person that was chosen to evaluate the packages was the Head of Packaging
Europe, Mr. Guus Lueb. Through a one hour structured interview that took place in the European Innovation
Centre „57 of KHC in Nijmegen on the 29th of May 2017, it was asked of him to fill in the BWM survey and
then to fill in the matrix with the relative scores of the package designs.
The scaling that was used for the relative scores of the packages and the criteria was again from 1-9. However,
the use of the scale is totally different from the one that was used in the BWM survey. The highest score of 9
represents the maximum performance that any package design can have in regards to the respective criterion.
Similarly a score of 1 indicates the worst possible performance. The decision-maker evaluated the current
performance of each package alternative of each one of the three products. The detailed table with the scores
that he assigned to the alternatives is presented in Appendix VI.
It has to be underlined that the assigned scores have a qualitative manner. Nevertheless, since the decision-
maker holds the top position in the hierarchy of the packaging technology department of KHC in Europe, they
can be regarded as adequate for the implementation of BWM in order to select the optimal package design. In
21.57% 21.12%
11.98%
20.23% 15.80% 9.29%
0%
10%
20%
30%
40%
Beneficial forindividuals and the
community
Healthy and safefor individuals and
the community
Managesreputational risk
In accordance withgovernmentalpolicies andregulations
Employee's qualityof life
Suppliers andcarriers are
certified
We
igh
ts
Social Dimension Criteria Weights
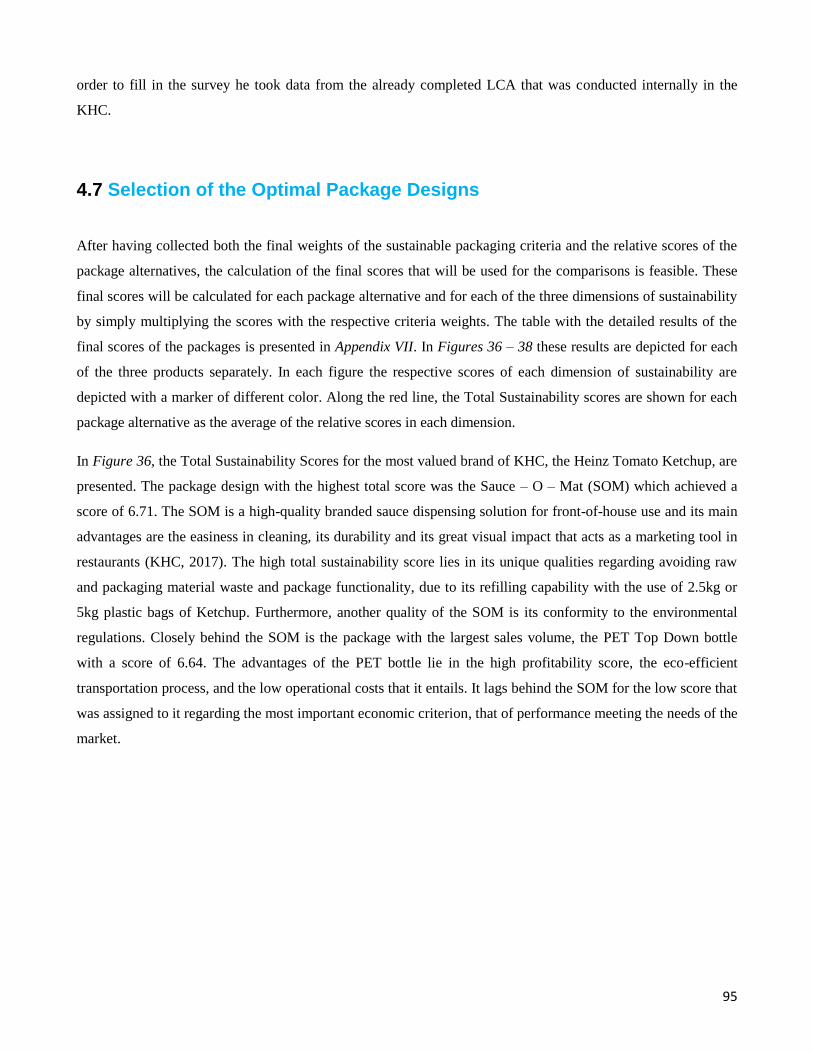
95
order to fill in the survey he took data from the already completed LCA that was conducted internally in the
KHC.
4.7 Selection of the Optimal Package Designs
After having collected both the final weights of the sustainable packaging criteria and the relative scores of the
package alternatives, the calculation of the final scores that will be used for the comparisons is feasible. These
final scores will be calculated for each package alternative and for each of the three dimensions of sustainability
by simply multiplying the scores with the respective criteria weights. The table with the detailed results of the
final scores of the packages is presented in Appendix VII. In Figures 36 – 38 these results are depicted for each
of the three products separately. In each figure the respective scores of each dimension of sustainability are
depicted with a marker of different color. Along the red line, the Total Sustainability scores are shown for each
package alternative as the average of the relative scores in each dimension.
In Figure 36, the Total Sustainability Scores for the most valued brand of KHC, the Heinz Tomato Ketchup, are
presented. The package design with the highest total score was the Sauce – O – Mat (SOM) which achieved a
score of 6.71. The SOM is a high-quality branded sauce dispensing solution for front-of-house use and its main
advantages are the easiness in cleaning, its durability and its great visual impact that acts as a marketing tool in
restaurants (KHC, 2017). The high total sustainability score lies in its unique qualities regarding avoiding raw
and packaging material waste and package functionality, due to its refilling capability with the use of 2.5kg or
5kg plastic bags of Ketchup. Furthermore, another quality of the SOM is its conformity to the environmental
regulations. Closely behind the SOM is the package with the largest sales volume, the PET Top Down bottle
with a score of 6.64. The advantages of the PET bottle lie in the high profitability score, the eco-efficient
transportation process, and the low operational costs that it entails. It lags behind the SOM for the low score that
was assigned to it regarding the most important economic criterion, that of performance meeting the needs of the
market.
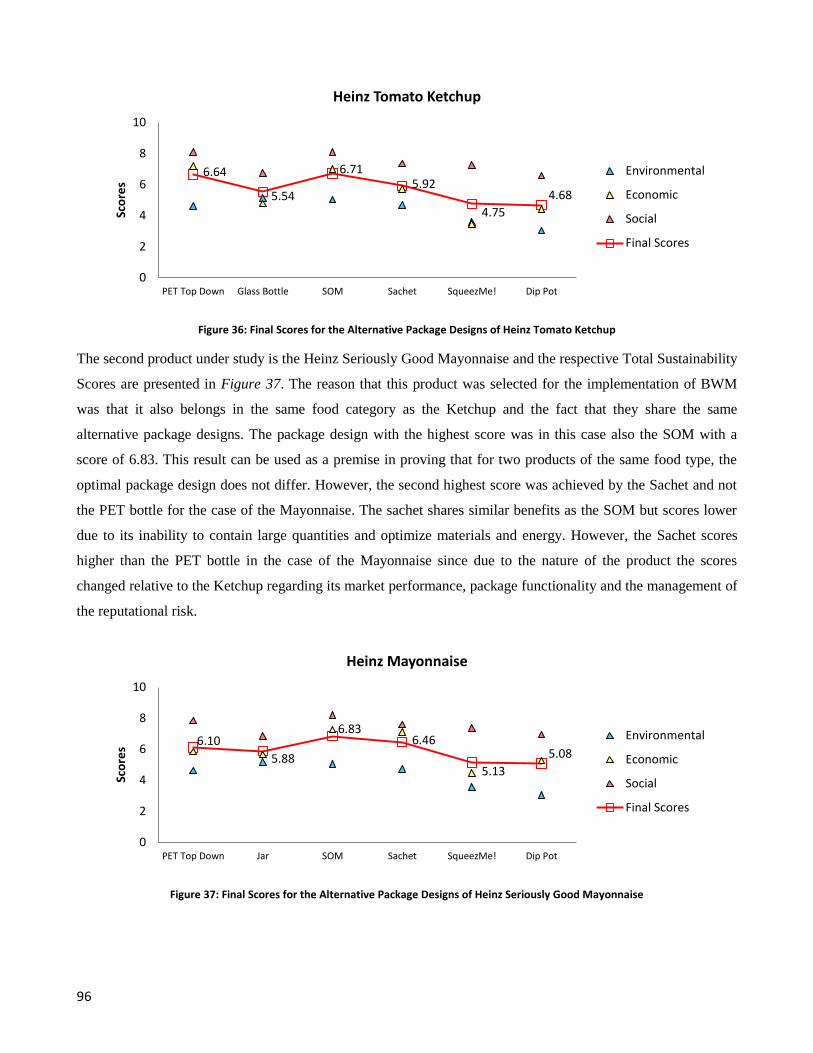
96
Figure 36: Final Scores for the Alternative Package Designs of Heinz Tomato Ketchup
The second product under study is the Heinz Seriously Good Mayonnaise and the respective Total Sustainability
Scores are presented in Figure 37. The reason that this product was selected for the implementation of BWM
was that it also belongs in the same food category as the Ketchup and the fact that they share the same
alternative package designs. The package design with the highest score was in this case also the SOM with a
score of 6.83. This result can be used as a premise in proving that for two products of the same food type, the
optimal package design does not differ. However, the second highest score was achieved by the Sachet and not
the PET bottle for the case of the Mayonnaise. The sachet shares similar benefits as the SOM but scores lower
due to its inability to contain large quantities and optimize materials and energy. However, the Sachet scores
higher than the PET bottle in the case of the Mayonnaise since due to the nature of the product the scores
changed relative to the Ketchup regarding its market performance, package functionality and the management of
the reputational risk.
Figure 37: Final Scores for the Alternative Package Designs of Heinz Seriously Good Mayonnaise
6.64
5.54
6.71 5.92
4.75
4.68
0
2
4
6
8
10
PET Top Down Glass Bottle SOM Sachet SqueezMe! Dip Pot
Sco
res
Heinz Tomato Ketchup
Environmental
Economic
Social
Final Scores
6.10
5.88
6.83 6.46
5.13
5.08
0
2
4
6
8
10
PET Top Down Jar SOM Sachet SqueezMe! Dip Pot
Sco
res
Heinz Mayonnaise
Environmental
Economic
Social
Final Scores
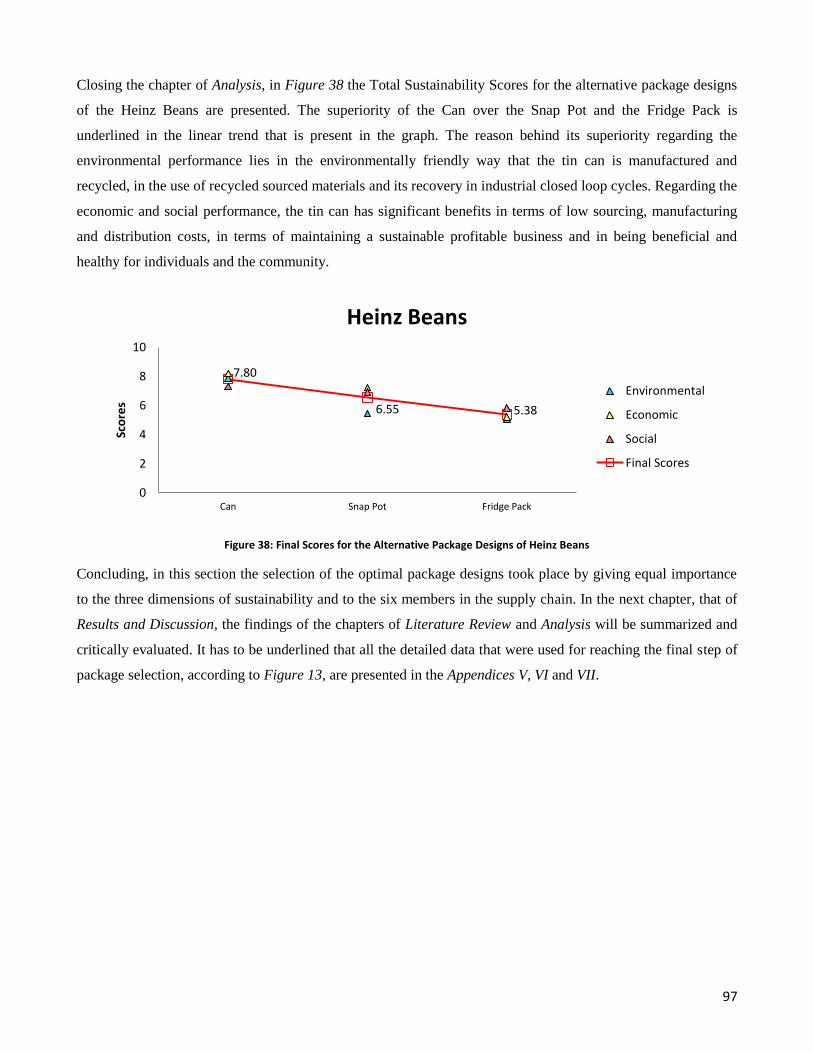
97
Closing the chapter of Analysis, in Figure 38 the Total Sustainability Scores for the alternative package designs
of the Heinz Beans are presented. The superiority of the Can over the Snap Pot and the Fridge Pack is
underlined in the linear trend that is present in the graph. The reason behind its superiority regarding the
environmental performance lies in the environmentally friendly way that the tin can is manufactured and
recycled, in the use of recycled sourced materials and its recovery in industrial closed loop cycles. Regarding the
economic and social performance, the tin can has significant benefits in terms of low sourcing, manufacturing
and distribution costs, in terms of maintaining a sustainable profitable business and in being beneficial and
healthy for individuals and the community.
Figure 38: Final Scores for the Alternative Package Designs of Heinz Beans
Concluding, in this section the selection of the optimal package designs took place by giving equal importance
to the three dimensions of sustainability and to the six members in the supply chain. In the next chapter, that of
Results and Discussion, the findings of the chapters of Literature Review and Analysis will be summarized and
critically evaluated. It has to be underlined that all the detailed data that were used for reaching the final step of
package selection, according to Figure 13, are presented in the Appendices V, VI and VII.
7.80
6.55 5.38
0
2
4
6
8
10
Can Snap Pot Fridge Pack
Sco
res
Heinz Beans
Environmental
Economic
Social
Final Scores

98
99
5 Results and Discussion
In this chapter the critical evaluation of the findings that were presented in the previous chapters will take place.
In Chapter 2, after a thorough Literature Review, the sustainable packaging criteria were documented along the
TBL. In Section 5.1 this list will be compared with the most prevalent published criteria lists in the literature. In
Section 4.4 the various weights that each supply chain member assigned to the criteria was estimated. However,
during the presentation of results the weights that the different members assigned to the same criteria have not
been compared. In Section 5.2, the comparison of the preferences of the six members will take place. After
having selected the optimal package design according to the Total Sustainability Score of each alternative, in
Section 5.3 the same process will take place for varying weights of each dimension of sustainability through a
what-if scenario. It is an undeniable fact the optimal design that was chosen varies relative to the criteria weights
that the decision maker assigns to the preferences of the supply chain members and the three dimensions of
sustainability. The what-if scenario of altering the weights will be analyzed in the final section of this chapter,
Section 5.4.
5.1 Remarks on Creation of the Sustainable Packaging Criteria List
In the chapter of Literature Review and in Tables 6 - 8 the sustainable packaging criteria were categorized and
documented along the TBL. These tables will be referred to in this section as the full criteria list. In Figure 10 of
Sub-Section 2.5.5 the criteria were also placed in the respective dimension circle and their intersections.
However, the list that was created from scratch by translating the supply chain sustainability drivers and barriers
to criteria has not been compared yet with the already established lists of the SPC and the SPA. The criteria that
these two lists contain were presented in Table 4 of Sub-Section 2.3.3.
By comparing the full criteria list with the published ones, it can be observed that all criteria of the SPC and
SPA have been included in the thorough criteria list that was created. Some of these criteria were included
unmodified, or “as – is”, in the new list such as the criterion “Recovered and utilized in industrial closed loop
cycles”, while other criteria were included after being split into sub-criteria. An example of such a separation of
criteria was the 3rd
criterion of the SPC, which stated that the package should be sourced, manufactured,
transported and recycled in an environmentally friendly way. In the full criteria list, the various environmentally
friendly processes were separated and studied separately. All the general and conceptual criteria published by
SPA were processed in a similar way by separating them. For example the criterion “Efficient – Doing more
with less” was represented in the full criteria list by three criteria; namely “Avoids raw and packaging material
100
waste”, “Sourcing, manufacturing and distribution costs”, “Physically designed to optimize materials and
energy”.
However numerous criteria of the full criteria list are not contained neither implied by the meaning or the
definitions of the published ones. Nevertheless, the fact that the two lists are limited to eight and four criteria
respectively, while the full criteria list has thirty-two, is not the only reason that a number of criteria are newly
introduced. What the lists of the SPC and SPA lack are the inclusion of the perspective of the whole supply
chain and the equal focus on the three dimensions of sustainability. Examples of newly introduced supply chain
criteria are “Cooperation with supply chain members”, “Continuity”, and “Transparency”. As it was also
mentioned in Chapter 2, these two lists neglect a huge aspect of the social dimension of sustainability in the
product design. For this reason, criteria such as the “Employee’s quality of life”, “Aligned with organization’s
Social Corporate Responsibilities” and “Manages reputational risks” had to be added in the full criteria list in
order to bridge the gap of giving equal importance to all three dimensions.
In Section 4.2, the full criteria list was reduced in number with the use of the expert‟s opinion so as a smoother
implementation of the BWM to take place. Comparing the final reduced criteria list with the two published lists
of the SPC and the SPA it can be observed that the only criterion that was omitted was “Uses healthy sourced
materials”. As it will be discussed also in Section 6.4, by using another group experts maybe other criteria
would have been selected for the reduced criteria list. Thus the weighting of the respective criteria would also be
different. By comparing the final weights for the three dimensions of Figures 33 – 35 and the ranking of the
criteria by the expert‟s in Appendix I several findings can be observed.
Regarding the environmental sustainability the expert‟s did not manage to grasp the perspective of the whole
supply chain since they did not indicate as first the eco-efficient production processes. On the other hand, they
indicated that the most important criterion for them was the elimination of raw and packaging material waste
which was second in the final weights that were estimated. Furthermore, as second most important criterion they
selected the use of recycled, renewable and reused sourced materials that only had a minor place in the final
weights. Moving to the economic sustainability, the expert‟s did not manage to adequately depict the
preferences of the supply chain members. They did not select the “Performance meets market needs” criterion
as the first one, while they considered that that lower operational costs are of outmost importance. Nevertheless
they highlighted the importance of maintaining a sustainable profitable business. Lastly, the expert‟s managed to
underline the key social criteria according to the final weights, which are centered towards being beneficial,
healthy and safe for individuals and the community and conformity to the laws and regulations.
101
5.2 Criteria Weights along the Supply Chain Members
In the chapter of Analysis for each member in the supply chain a separate figure was presented and described
regarding their individual preferences. However, the integration of the members in the supply chain has not yet
been elaborated and was only presented in Section 4.4 through three figures, one for each dimension of
sustainability. In this section the preferences of the supply chain members will be compared to each other. For
these comparisons, the average final weights that were calculated and presented in Appendix V will be used.
To start with, regarding the environmental criteria weights, the first thing that can be observed is a bell shaped
pattern for the environmentally friendly transportation along the members of the complete life cycle of the
product. Starting from a low weight for the Raw Material Suppliers, having its peak for the Total Product
Manufacturer, and then reaching a low point again for the case of the End of Life Companies. This bell shaped
pattern can be used as an indicator for the occurrence of loop cyclic effects in the supply chain of the food
packaging industry. On the contrary to the bell shape curve, the preference towards industrial closed loop cycles
is inverted and represented by a U-shaped curve reaching the peak at the Raw Material Suppliers, the bottom at
the Total Product Manufacturer and the peak again with the End of Life Companies. This fact shows that the
obstacles in successfully implementing closed loop cycles are set by the members in the supply chain that
belong to the middle stages of the life cycle. Another trend that can be observed is that the Raw and Packaging
Material Suppliers and also the decision-maker value highly the avoidance of raw and packaging material waste
by assigning a weight of over 20%. In contrast, the Customers, the Consumers and the End of Life Companies
limit this particular weight to close to 10%. It has to be underlined, that the importance of manufacturing by
using renewable energy and eco-efficient production systems is an important criterion in a uniform manner
throughout all the members in the complete life cycle of the product-package combination.
As far as the economic dimension of sustainability is concerned, the members of the supply chain seem to agree
that meeting the market needs of the end-users of the total product is of outmost importance. It is one of the
ways that a firm can withstand competition and gain a stable market share. Introducing a successful product is
due to the cooperation of all the members in the supply chain and all members gain from it. In addition, all
supply chain members agree with a percentage close to 20%, with the Customers and End-of-Life companies
raising this weight to up to 34%, that profitability is one of the most important indices of sustainability. It is
surprising that regarding the rest of the economic criteria, the supply chain members agree to assign a weight of
close to 10%, implying that they are necessary for a sustainable business but not as important as other criteria.
Lastly, the supply chain members seem to agree regarding the final social criteria weights. Apart from the group
of the Packaging Material Suppliers, the rest of the members seem to care about the beneficial character of the
product, since they assigned a weight of over 20%. The criterion that acquired the highest weight along the
members of the complete life cycle is related to the product being safe and healthy. The third criterion in ranking
102
but the one with the smallest range and the one that was chosen in a uniform manner, was the conformity to the
laws and regulations. A striking fact regarding the social dimension is related to the relatively high weight that
the Total Product Manufacturer assigned to managing the reputational risk in comparison to the rest of the
members. This fact shows that the firm that manufactures and markets the product under study is the one that
solely faces the consequences of an unsuccessful new product development and has to defend against the
opposition stemming from NGOs and other pressure groups.
5.3 Effects of Dimension Weights on Selection Process
In the chapter of Analysis in Section 4.6, the optimal package designs were selected for each of the three total
products that were studied. It was mentioned that according to the scope of the thesis equal importance is given
to the three dimensions of sustainability. Thus, the Total Sustainability Score was calculated from the average of
the three sustainability scores as it is depicted in Figures 36 – 38. In this section it will be investigated whether a
change in the relevant weights of each dimension, affects the selection process of the optimal package design.
The effect of the varying weights of the three dimensions on the selection process will be presented with the
creation of a what-if scenario. A pyramid chart will be used in order to highlight which two package alternatives
compete for being optimal for each product. Then, sensitivity analysis will take place that will show the limits
that the weights could reach without having a change in the selection process.
For the case of the Heinz Tomato Ketchup, the pyramid chart can be seen in Figure 39. Even though the SOM
had the highest Total Sustainability Score, it is the Glass Bottle that prevails regarding the environmental
performance. Having an easily recycled packaging material boosts the relative criteria scores in comparison to
the plastic ones. However, due to its poor performance relative to the rest of the criteria, the weight of
environmental performance has to be at 96% so as the Glass bottle to be chosen over the SOM. Regarding the
economic and social performance of sustainability, the Ketchup package alternative that prevails is the PET
Bottle, due it its operational effectiveness. However, in order for the PET Bottle to be chosen as the optimal
package design, the weight of environmental performance would have to be lower than 20%, while maintaining
equal weights in the economic and social dimensions at over 40%. It can be observed from Figure 39 that the
prevailing package alternatives are the SOM and the PET Bottle.
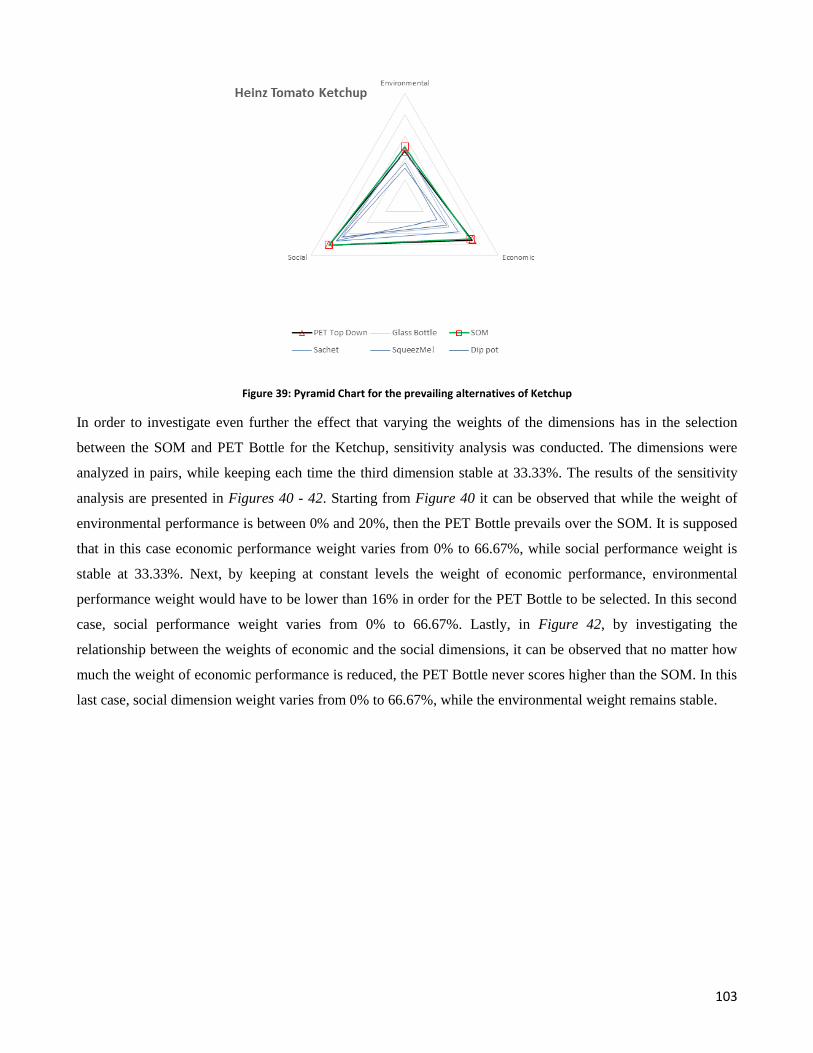
103
Figure 39: Pyramid Chart for the prevailing alternatives of Ketchup
In order to investigate even further the effect that varying the weights of the dimensions has in the selection
between the SOM and PET Bottle for the Ketchup, sensitivity analysis was conducted. The dimensions were
analyzed in pairs, while keeping each time the third dimension stable at 33.33%. The results of the sensitivity
analysis are presented in Figures 40 - 42. Starting from Figure 40 it can be observed that while the weight of
environmental performance is between 0% and 20%, then the PET Bottle prevails over the SOM. It is supposed
that in this case economic performance weight varies from 0% to 66.67%, while social performance weight is
stable at 33.33%. Next, by keeping at constant levels the weight of economic performance, environmental
performance weight would have to be lower than 16% in order for the PET Bottle to be selected. In this second
case, social performance weight varies from 0% to 66.67%. Lastly, in Figure 42, by investigating the
relationship between the weights of economic and the social dimensions, it can be observed that no matter how
much the weight of economic performance is reduced, the PET Bottle never scores higher than the SOM. In this
last case, social dimension weight varies from 0% to 66.67%, while the environmental weight remains stable.
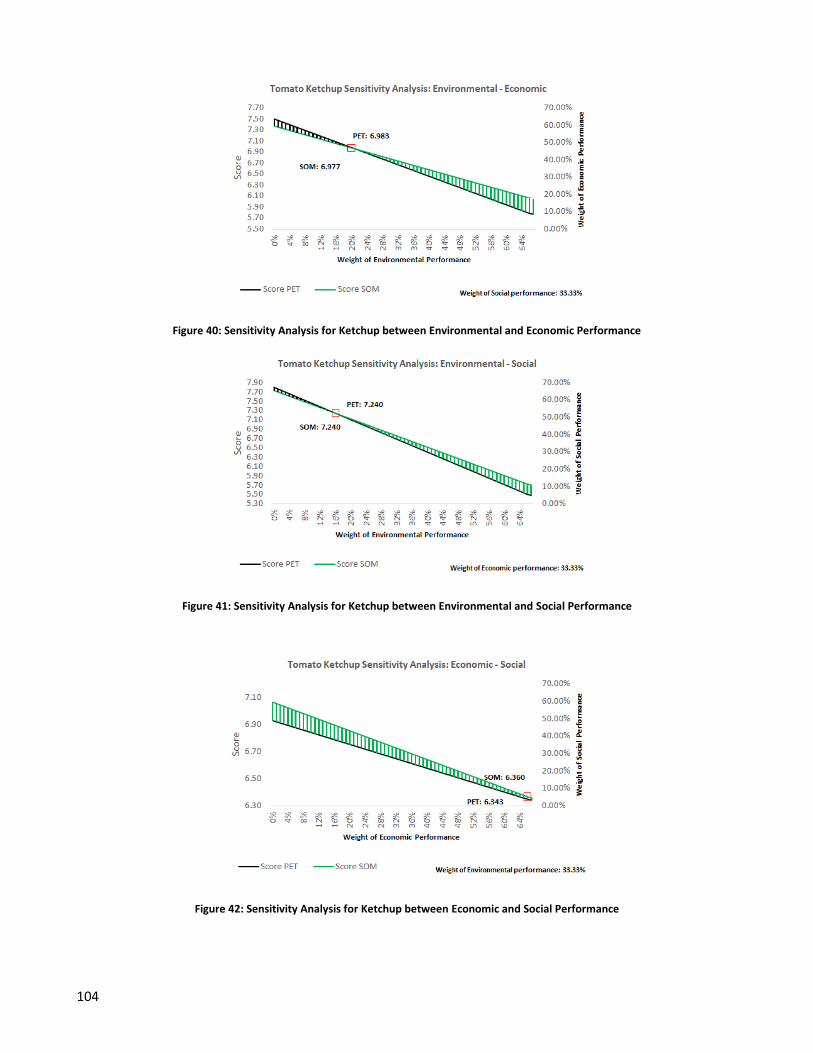
104
Figure 40: Sensitivity Analysis for Ketchup between Environmental and Economic Performance
Figure 41: Sensitivity Analysis for Ketchup between Environmental and Social Performance
Figure 42: Sensitivity Analysis for Ketchup between Economic and Social Performance
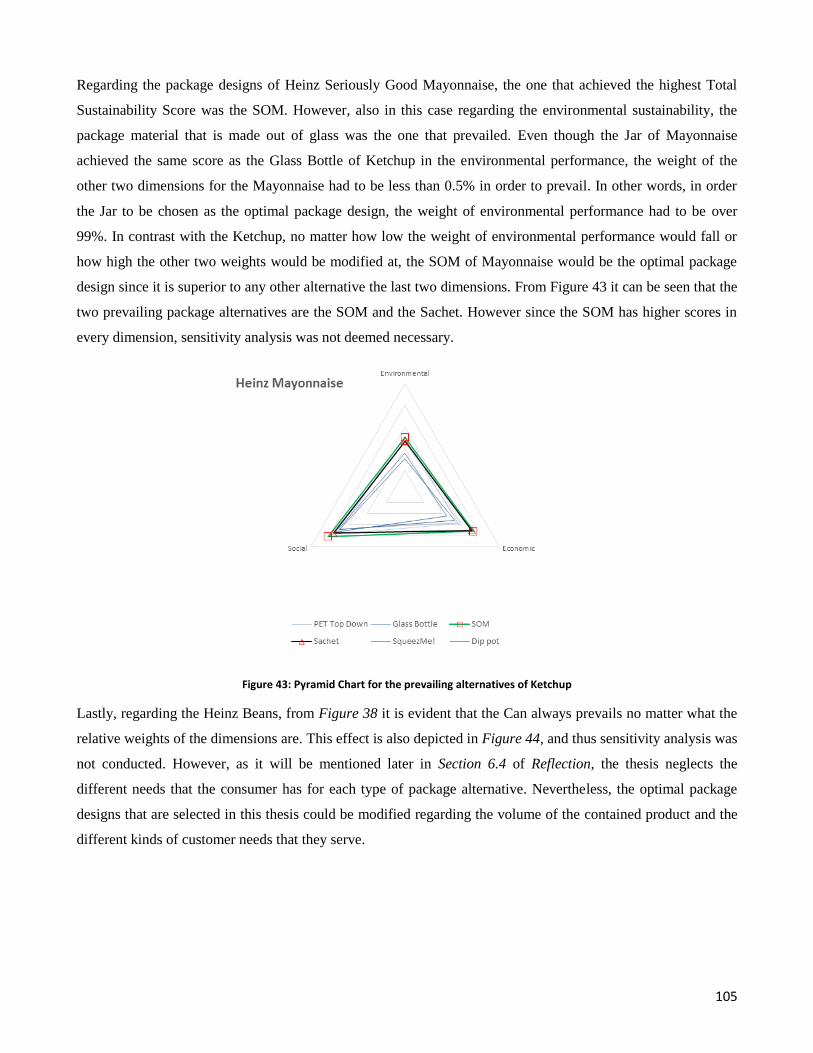
105
Regarding the package designs of Heinz Seriously Good Mayonnaise, the one that achieved the highest Total
Sustainability Score was the SOM. However, also in this case regarding the environmental sustainability, the
package material that is made out of glass was the one that prevailed. Even though the Jar of Mayonnaise
achieved the same score as the Glass Bottle of Ketchup in the environmental performance, the weight of the
other two dimensions for the Mayonnaise had to be less than 0.5% in order to prevail. In other words, in order
the Jar to be chosen as the optimal package design, the weight of environmental performance had to be over
99%. In contrast with the Ketchup, no matter how low the weight of environmental performance would fall or
how high the other two weights would be modified at, the SOM of Mayonnaise would be the optimal package
design since it is superior to any other alternative the last two dimensions. From Figure 43 it can be seen that the
two prevailing package alternatives are the SOM and the Sachet. However since the SOM has higher scores in
every dimension, sensitivity analysis was not deemed necessary.
Figure 43: Pyramid Chart for the prevailing alternatives of Ketchup
Lastly, regarding the Heinz Beans, from Figure 38 it is evident that the Can always prevails no matter what the
relative weights of the dimensions are. This effect is also depicted in Figure 44, and thus sensitivity analysis was
not conducted. However, as it will be mentioned later in Section 6.4 of Reflection, the thesis neglects the
different needs that the consumer has for each type of package alternative. Nevertheless, the optimal package
designs that are selected in this thesis could be modified regarding the volume of the contained product and the
different kinds of customer needs that they serve.
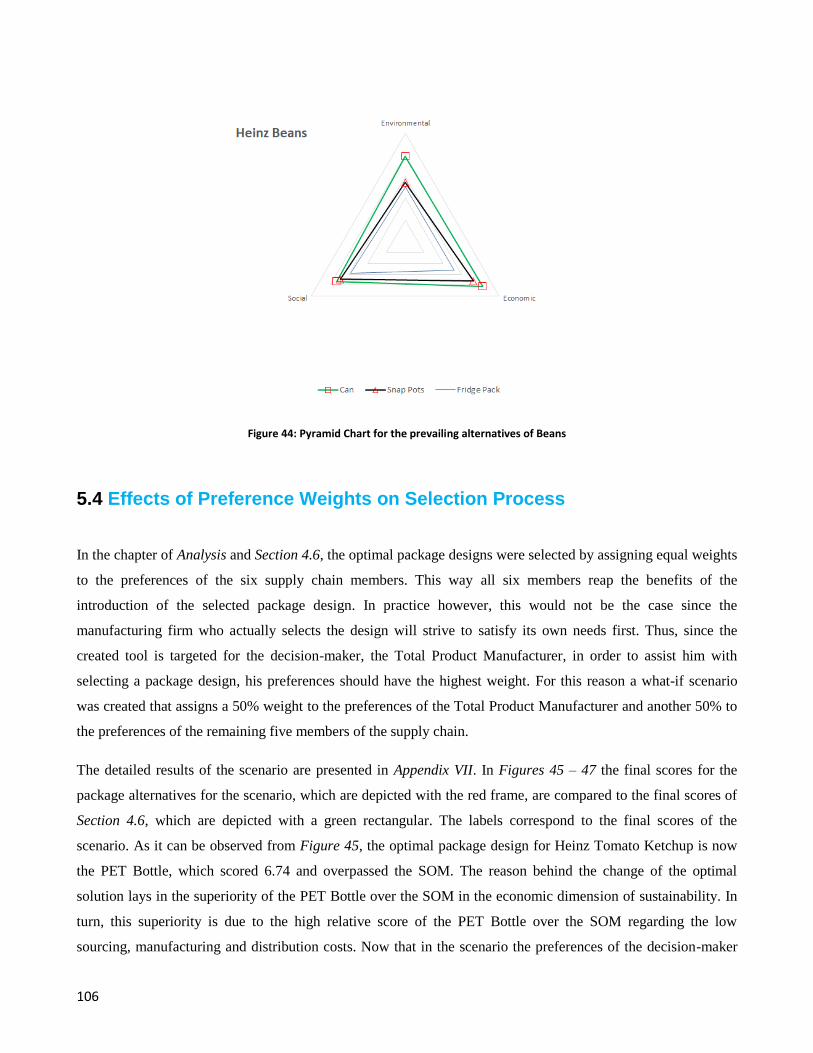
106
Figure 44: Pyramid Chart for the prevailing alternatives of Beans
5.4 Effects of Preference Weights on Selection Process
In the chapter of Analysis and Section 4.6, the optimal package designs were selected by assigning equal weights
to the preferences of the six supply chain members. This way all six members reap the benefits of the
introduction of the selected package design. In practice however, this would not be the case since the
manufacturing firm who actually selects the design will strive to satisfy its own needs first. Thus, since the
created tool is targeted for the decision-maker, the Total Product Manufacturer, in order to assist him with
selecting a package design, his preferences should have the highest weight. For this reason a what-if scenario
was created that assigns a 50% weight to the preferences of the Total Product Manufacturer and another 50% to
the preferences of the remaining five members of the supply chain.
The detailed results of the scenario are presented in Appendix VII. In Figures 45 – 47 the final scores for the
package alternatives for the scenario, which are depicted with the red frame, are compared to the final scores of
Section 4.6, which are depicted with a green rectangular. The labels correspond to the final scores of the
scenario. As it can be observed from Figure 45, the optimal package design for Heinz Tomato Ketchup is now
the PET Bottle, which scored 6.74 and overpassed the SOM. The reason behind the change of the optimal
solution lays in the superiority of the PET Bottle over the SOM in the economic dimension of sustainability. In
turn, this superiority is due to the high relative score of the PET Bottle over the SOM regarding the low
sourcing, manufacturing and distribution costs. Now that in the scenario the preferences of the decision-maker
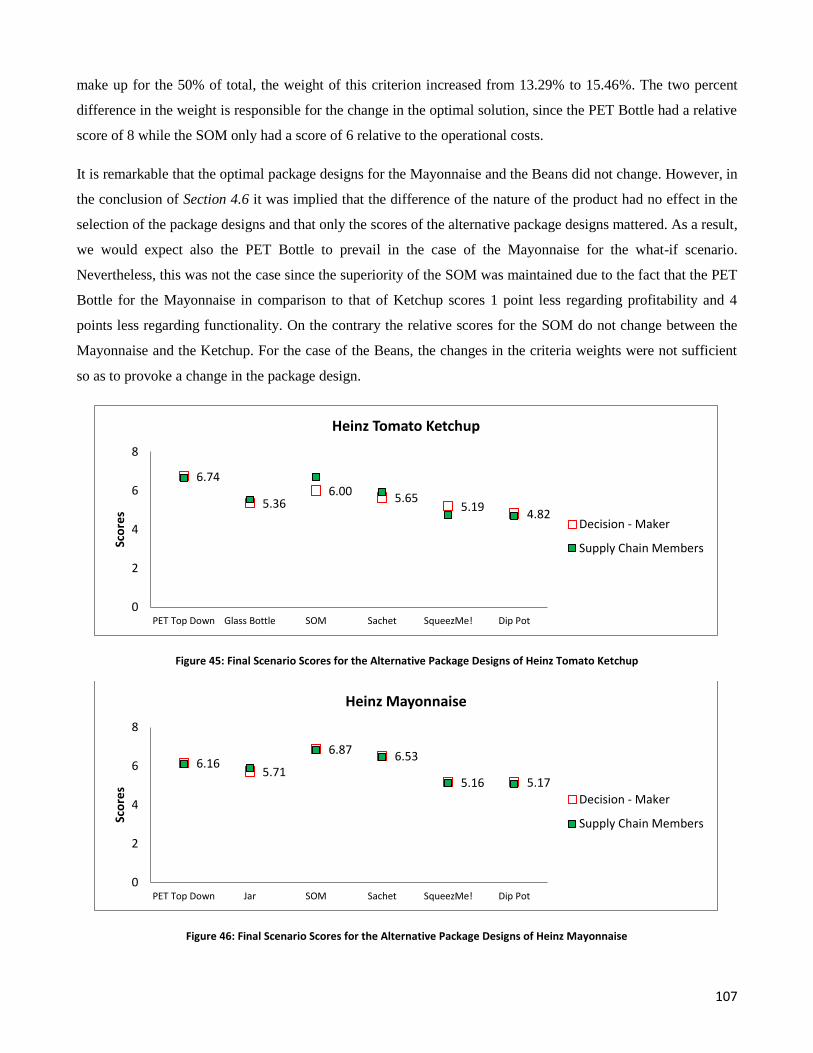
107
make up for the 50% of total, the weight of this criterion increased from 13.29% to 15.46%. The two percent
difference in the weight is responsible for the change in the optimal solution, since the PET Bottle had a relative
score of 8 while the SOM only had a score of 6 relative to the operational costs.
It is remarkable that the optimal package designs for the Mayonnaise and the Beans did not change. However, in
the conclusion of Section 4.6 it was implied that the difference of the nature of the product had no effect in the
selection of the package designs and that only the scores of the alternative package designs mattered. As a result,
we would expect also the PET Bottle to prevail in the case of the Mayonnaise for the what-if scenario.
Nevertheless, this was not the case since the superiority of the SOM was maintained due to the fact that the PET
Bottle for the Mayonnaise in comparison to that of Ketchup scores 1 point less regarding profitability and 4
points less regarding functionality. On the contrary the relative scores for the SOM do not change between the
Mayonnaise and the Ketchup. For the case of the Beans, the changes in the criteria weights were not sufficient
so as to provoke a change in the package design.
Figure 45: Final Scenario Scores for the Alternative Package Designs of Heinz Tomato Ketchup
Figure 46: Final Scenario Scores for the Alternative Package Designs of Heinz Mayonnaise
6.74
5.36 6.00
5.65 5.19
4.82
0
2
4
6
8
PET Top Down Glass Bottle SOM Sachet SqueezMe! Dip Pot
Sco
res
Heinz Tomato Ketchup
Decision - Maker
Supply Chain Members
6.16 5.71
6.87 6.53
5.16 5.17
0
2
4
6
8
PET Top Down Jar SOM Sachet SqueezMe! Dip Pot
Sco
res
Heinz Mayonnaise
Decision - Maker
Supply Chain Members
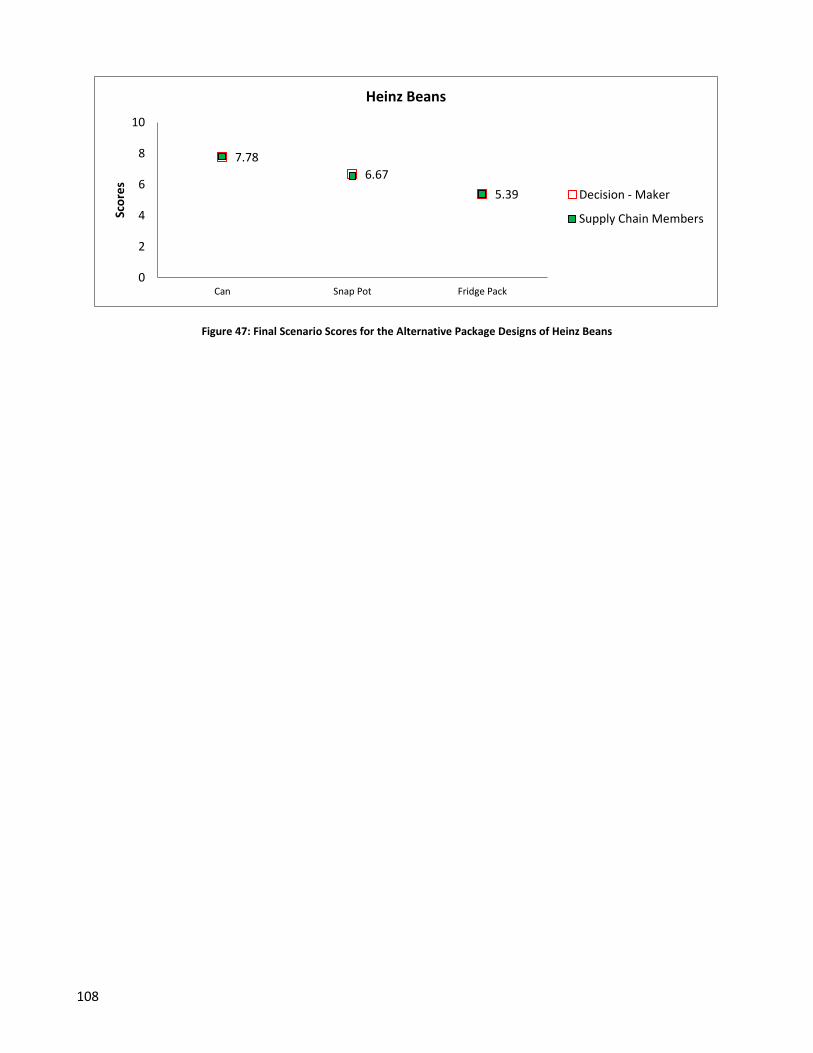
108
Figure 47: Final Scenario Scores for the Alternative Package Designs of Heinz Beans
7.78
6.67
5.39
0
2
4
6
8
10
Can Snap Pot Fridge Pack
Sco
res
Heinz Beans
Decision - Maker
Supply Chain Members
109
6 Conclusion
The chapter of Results and Discussion ended with the creation of the two what-if scenarios and by analyzing the
effects that the varying weights of dimensions and preferences have in the selection process. The last chapter of
the thesis is dedicated to answering the research questions that were highlighted in the chapter of Introduction,
presenting the contribution of the thesis and guiding the decision-maker towards the practical application of the
created tool. Furthermore, the limitations that were identified during the process of implementation will be
pointed out in the section of Reflection and suggestions regarding future work on the topic will be given.
6.1 Answering the Research Questions
After having completed and presented all the chapters in this thesis, the Main Research Question that was
introduced in Section 1.3 can now be elaborated and answered. The Main Research question that was identified
after examining the existing literature on the topic and identifying the knowledge gaps is: “How do the supply
chain sustainability criteria in the food packaging industry and their respective weights improve the selection
process of the package design?” In order to reach the climax of giving an answer to this question, the four Sub-
research questions will be answered.
Sub-research question 1: “What are the sustainability drivers and barriers of the supply chain of a company in
the food packaging industry and how can they be translated to product specification criteria?” In the first part
of Chapter 2, through Sections 2.1 – 2.4, the already conducted research in the fields of the four pillars of
literature review was thoroughly investigated. By integrating the four pillars, namely the Value of Sustainability,
Sustainable Supply Chain Management (SSCM), Sustainable Packaging Criteria and the Food Packaging
Industry the various drivers and barriers of the supply chain of a company in the food packaging industry were
identified and presented in Tables 1 – 3 and 5. In the second part of Chapter 2 in Section 2.5, after following a
different literature review methodology, the aforementioned factors were translated and documented into
product specification criteria. The output was a list of supply chain sustainability packaging criteria that is
presented in Tables 6 – 8, separated along the Triple Bottom Line (TBL) of sustainability. Furthermore, in
Figure 10 the criteria are visualized into the circles of the three dimensions of sustainability and their
intersections, while in Figure 11 a conceptual framework of the food packaging industry containing the
sustainability drivers and barriers is given.
110
Sub-research question 2: “How do the different members of the supply chain of certain product-package
combinations in the food packaging industry value the identified supply chain sustainability criteria?” Firstly,
three product-package combinations of the Kraft Heinz Company were selected. The selection process was
described in Chapter 4 in Section 4.3. Secondly, for these product-package combinations the various members
in the supply chain were identified according to Figure 14. Thirdly, with the use of the Multi-Criteria Decision-
Making method, the Best-Worst Method (BWM) a survey was created that was used in order to estimate the
weights that each member assigns to each criterion. The results of how they value the aforementioned criteria
were presented through Figures 15 – 32.
Sub-research question 3: “What are the alternative package designs of certain product-package combinations
and how do they score in relation to the maximum performance that can be achieved in the identified supply
chain sustainability criteria?” For the three selected product-package combinations their alternative package
designs were identified and presented in Appendix II. Then, through a structured interview with the Head of
Packaging Europe of the Kraft Heinz Company, Mr. Guus Lueb, scores were assigned to each package in
relation to each criterion. These scores were described in Section 4.6, presented in Appendix VI and indicate how
each different package performs in relation to the maximum performance for each criterion.
Sub-research question 4: “How could a decision-making method be implemented in a multi-dimensional and
multi-actor setting in order to select the optimal package design according to the weights of the identified
supply chain sustainability criteria and the relative scores of the package alternatives?” The Multi-Criteria
Decision-Making (MCDM) method, the Best-Worst Method (BWM) was selected according to Section 3.2 for
the selection of the optimal package design. It was successfully implemented according to the methodology
presented in Figure 14, for a Multi-Actor and Multi-Dimensional problem. After estimating the weights by
giving equal importance to the weights of the six members in the supply chain of the product-package
combinations and the three dimensions of sustainability, the optimal package designs were selected and
presented in Section 4.7.
Main Research Question: “How do the supply chain sustainability criteria in the food packaging industry and
their respective weights improve the selection process of the package design?” In Section 4.7 of the chapter of
Analysis, the optimal package designs were selected according to the identified criteria and to the respective
weights that the supply chain members assigned to them according to their preferences. With the
implementation of the Multi-Criteria Decision-Making (MCDM) method, the Best-Worst Method (BWM) the
effects of the criteria and their respective weights on the selection process were made evident in Figures 36 - 39.
In Section 5.1 of the chapter of Results and Discussion, the supply chain sustainability packaging criteria list
that was created in Chapter 2 and presented in Tables 3 – 6, was compared to the already published sustainable
packaging criteria lists of Table 4. It was proved that the already established lists do not incorporate the supply
chain perspective neither do they give equal importance to the three dimensions of sustainability. In Sections 5.3
111
and 5.4 what-if scenarios were created that measure the effect that variable weights have on selecting the
optimal package design. By incorporating the TBL of sustainability, the preferences of all the members in the
supply chain and the concept of the total product, the selection process of the optimal package design is
improved.
6.2 Thesis Contribution
Having answered the research questions, an overall evaluation of the thesis can be given. In Section 1.2 of the
chapter of Introduction, the main goal of this thesis was described as promoting the value of sustainability in the
whole supply chain. The industry that was selected to be investigated was that of food packaging. The main
assumption was that the aforementioned contribution to enhancing supply chain sustainability can be achieved
by selecting the design of the package based on translated sustainability drivers and barriers of the whole supply
chain and not based on specific sustainable characteristics of the package itself.
More importantly, the research objective that this thesis aims to reach can be described by the following
assumption: “That by selecting the package design according to supply chain sustainability criteria, sustainable
development in the whole supply chain of the food packaging industry is enhanced”. After creating a list of
supply chain sustainable packaging criteria along the three dimensions of sustainability, and after estimating the
average weights according to the preferences of the supply chain members towards these criteria, a tool is
created that can be used by product manufacturers in the food packaging industry when selecting the optimal
package design. Due to the inclusion of the sustainability drivers and barriers through the criteria and the needs
and interests of all the members in the supply chain through the weights, after the implementation of a MCDM
in order to select the optimal package design, sustainable development in the whole supply chain is enhanced.
The first point that differentiates the approach that was followed in this thesis with other sustainable research
projects conducted in the food packaging industry is the incorporation of three unique perspectives in the
selection process. Firstly, not only is the social dimension incorporated in the product design, but also it is
assigned an equal weight to it as to the environmental and economic dimensions. Furthermore, another point that
differentiates this thesis is the adoption of a supply chain perspective in product design. The preferences of all
members in the supply chain of products in the food packaging industry along the total life cycle are
incorporated in product design. Referring to the total product perspective, in this thesis the package and the
contained product are not regarded separately but rather as one entity, as a product-package combination sharing
mutual qualities. Incorporating these three perspectives in the selection process of the optimal package design in
the food packaging industry is a novel idea.
112
The inclusion of the three perspectives in the analysis made feasible the introduction of a second point in the
contribution of the thesis. This is the creation from scratch through literature review, of a supply chain
sustainable criteria list. The full list contains thirty-two criteria (Figure 10), while through expert‟s opinion the
number of criteria along the TBL was reduced and a more practical version was created with nineteen criteria
(Table 9). To this contributing point could also be added the creation of a conceptual framework of the food
packaging industry that is depicted in Figure 11 of Section 2.5.After the chapter of Analysis, the conceptual
framework is also enhanced with the estimation of the preferences of the supply chain members along the
complete life cycle of the total product in the food packaging industry.
In addition, a third contributing point can be recognised, that of the use of the innovative MCDM, the BWM, in
order to select the optimal package design in the food packaging industry. Never again had this method been
used for selecting the optimal package design in a simultaneously multi-actor and multi-dimensional problem.
As a result, the biographical database of Dr. Jafar Rezaei with the BWM applications could now be expanded
even further.
The fourth and final contributing point is regarding the creation of a decision making tool that can be used by
package manufacturers when evaluating the sustainability of alternative package designs in the food packaging
industry. Since the preferences of the supply chain members have already been documented and expressed
through relative weights, all that the decision-maker has to do is assign scores to the package alternatives in
relation to the sustainable packaging criteria that were identified.Concluding, this thesis has a contribution to
both the scientific community and the food packaging industry.
6.3 Practical Recommendations
In the section of Thesis Contribution, it was mentioned in the fourth and final point that a decision making tool
is created that can be used by package manufacturers when evaluating the sustainability of alternative package
designs in the food packaging industry. Thus, it can be implied that the targeted audience for this tool are
managers in the R&D department that are responsible for evaluating alternative food package designs. Since the
preferences of the supply chain members have already been documented and expressed through relative weights,
all that the decision-maker has to do is assign scores to the package alternatives in relation to the sustainable
packaging criteria that were identified.
In Section 2.4 and Figure 7 a framework was presented from the literature (Grönman, et al., 2013) that provides
guidelines on how to reach the final step of the detailed design of the package. Every step in the aforementioned
framework contains certain tools and methods that contribute to a continuous optimization of the package
combination. The decision making tool presented in this thesis could substitute the first step of the framework,
113
namely the “Identification of minimum requirements of the product to be packed”, since by selecting the
optimal package design according to the respective weights of the various supply chain members, the basic
targets to be met by the product-package combination are set. Alternatively, after the forth step has been
completed, namely “Identification and testing of the functionality criteria”, the most prevalent package designs
could be compared to each other before the initiation of the final step of “Detailed design of the package”. In
addition, even if this tool may not be sufficient to fully substitute the second step of the framework regarding the
choice of materials and material combinations and the preliminary design of all package levels, it can give
guidance as far as the first level of packaging, or in other words primary packaging, is concerned. Lastly, this
tool can be also used in order to assist the implementation of the third step of the framework “Identification of
possible threats” since by applying the tool the decision-maker can see which supply chain members will be
dissatisfied and might raise opposition.
As it was described in Sections 5.3 and 5.4, by modifying the weights that the decision-maker assigns to the
three dimensions of sustainability and the preferences of the six supply chain members, the selection process of
the optimal package design is altered. As a result, apart from assigning the relative scores of the packages
towards the criteria, the decision-maker should also strategically select the weights that will be assigned. It is an
undeniable fact that the total product manufacturer will first attempt to incorporate his own interests in the
design in order to keep up to the expectations of the stakeholders and then try to satisfy to the maximum degree
possible the preferences of the rest of the supply chain members.
Closing, the decision-making tool that was created in this thesis will be presented to the Head of Packaging
Europe of the Kraft Heinz Company, Mr. Guus Lueb, with the aim of using it when evaluating alternative food
package designs. In the end of the chapter of Analysis it was concluded that the SOM and the Can were the
prevailing package alternatives. It has to be investigated whether these packages can be modified regarding the
volume of the contained product in order satisfy the various needs of the consumers. Having a “PET Bottle-
sized” SOM Ketchup dispenser in your own fridge that could be refilled would be a viable consumer choice. In
Figure 48, such a small-sized dispenser is presented that could be refilled with Heinz Tomato Ketchup plastic
bags of the relevant size. The development of the technology that is required for the design of the suggested
package could be executed in-house in the R&D department of KHC at the Innovation Centre ‟57 in Nijmegen.
The changes are minor and are mainly regarding the size of the SOM dispenser. Moreover, regarding knowledge
creation for the diffusion of the decision-making tool, the methods of “internalization” and “combination”
should be used, converting tacit and explicit knowledge respectively, to explicit (Popadiuk & Choo, 2006). This
way the various supply chain members could use the tool to suggest a package alternative that meets their needs
or inform the decision-maker regarding their preferences.

114
Figure 48: Heinz Ketchup smaller-sized SOM Dispenser design suggestion
6.4 Reflection
In the course of writing this thesis various obstacles were identified. Some of them were easy to be confronted
simply by the use of assumptions, while others were impossible to tackle. In this section reflection on the
methods used will take place and the way that the various limitations were overcome will be elaborated.
To start with, the first problem was encountered when the various supply chain sustainability drivers and
barriers had to be translated to sustainable packaging criteria. These criteria had to be distinct in character with
each other, so as when a MCDM method were to be implemented, the respondents would be able to clearly
differentiate their meaning and assign accurate grades. For this reason, the initiative was taken and several
criteria that were close in meaning were merged. Furthermore, these criteria had to be separated along the three
dimensions of sustainability. The BWM was implemented in a Multi-Dimensional way, and as a result each
criterion could only belong to one dimension. Even though in Figure 10 certain criteria were placed in the
intersection of the circles, placing criteria in between the criteria vectors is impossible for the application of the
MCDM method. In this case also assumptions were made regarding which dimension each criterion belongs to.
The respective argumentation for the selection for each criterion was given in Section 2.5. However, placing a
controversial criterion in a different dimension could alter the weights that were assigned by the supply chain
members. Lastly, it has to be noted that if the number of criteria in each dimension was the same, then one
vector could be used for the application of the BWM.
The next limitation was faced when the opinion of the experts was consulted in order to reduce the number of
criteria. The opinion of seven experts was used and the reduced criteria list was created and presented in Section
4.2. Nevertheless, by using another group of experts maybe other criteria would have been selected for the
reduced criteria list. It was this list that was used for the implementation of the BWM and thus its effect on the
results is dominant. In Section 5.1 of the chapter Results and Discussion this list was compared to the full
criteria list of Section 2.5 and to the already published lists of sustainable packaging criteria that was presented
in Table 4.
115
Another limitation of this thesis was encountered when estimating the criteria weights for the six supply chain
members. A larger number of respondents would be needed in order for the samples to be representative.
Furthermore, the preferences of the Customers and the End-of-Life Companies were covered internally with
structured interviews with managers of the KHC. Ideally, their contacts should have been found and then they
should have been contacted so as to follow the standard procedure and complete the online BWM surveys like
the rest of the members did. An attempt was made to access their contacts but in the end the problem was
tackled by covering the slots internally in the KHC. Moreover, it has to be noted that regarding the preferences
of the Raw Material Suppliers and the Packaging Material Suppliers, due to the fact that the surveys were sent
through a corporate e-mail, their preferences might be manipulated so as to satisfy their supply chain partner, the
KHC.
In addition, the list of sustainable packaging criteria is limited to unquantifiable factors. A more accurate result
would come out of a criteria list that the package alternatives would be ranked according to certain attributes and
not based on the overall performance towards a criterion. In this case the comparison between the alternatives
would be much easier and more precise for the decision-maker. The last limitation was faced when selecting the
optimal package design. Even though the alternative package designs might be different in nature, they also
serve different needs of the customers and the consumers. As a result no matter what the output of the tool is, if
it does not serve the needs of market, the total product would not be selected in the end. Nevertheless, a
suggestion was made regarding designing a smaller sized SOM dispenser for private use.
6.5 Future Work
In the last section of the thesis, suggestions will be given for further research in the field of sustainability in the
food packaging industry. These suggestions are addressed to researchers, Master and Ph.D. level students,
managers in the food packaging industry and executives of R&D departments and aim at continuing or
improving the already conducted research of this thesis and extend its contribution. These suggestions for future
work are based on confronting the aforementioned limitations.
To start with, in this thesis the supply chain sustainability drivers and barriers were translated to sustainable
packaging criteria. A step further would be to translate these criteria into quantifiable product specifications.
This way, the relative scores of the package alternatives would be based on actual arithmetic comparisons and
not on scores regarding the relative maximum performance towards a criterion. Moreover, when estimating the
preferences of the supply chain members, representative samples should be used for more accurate and
consistent results.
116
Moreover, research regarding the weights that the Total Package Manufacturer assigns to the preferences of
each of the other members could also be conducted. It is an undeniable fact that the decision-maker values more
the preferences of those members that are placed a step forward and to the right side of the supply chain relative
to his position. A suggestion for future work would also be to expand the company specific benefits of using the
tool into a contribution for the whole food packaging industry. This could be achieved by not selecting the
optimal package design among company specific alternatives, but rather among current alternative packaging
trends of the food industry.
A topic that was regarded as out of scope of this thesis is comparing the created decision making tool with other
techniques for selecting optimal package designs. It could be compared with the LCA, the PIQET tool and other
existing checklists for selecting package alternatives. In addition, the BWM could be compared with other
MCDM methods, and their consistency ratios evaluated.
117
Bibliography 1. Bhinge, R., Moserb, R., Moserb, E., Lanzab, G., & Dornfeld, D. (2015). Sustainability
optimization for global supply chain decision-making. Procedia CIRP, 26, 323-328.
2. Brody, A. L., Bugusu, B., Han, J. H., Sand, C. K., & McHugh, T. H. (2008). Innovative Food
Packaging Solutions. Journal of Food Science, 107-116.
3. Carter, C., & Rogers, D. (2008). A framework of sustainable supply chain management:
moving toward new theory. International Journal of Physical Distribution and Logistics
Management, 38(5), 360-387.
4. Coles, R. (2013). Paper and paperboard innovations and developments for the packaging of
food,beverages and other fast-moving consumer goods. In N. Farmer, Trends in packaging of
food,beverages and other fast-moving consumer goods (pp. 187-220). Woodhead Publishing.
5. Coles, R., McDowell, D., & Kirwan, M. J. (2003). Food Packaging Technology. Oxford:
Blackwell Publishing.
6. Colicchia, C., Melacini, M., & Perotti, S. (2011). Benchmarking Supply Chain Sustainability:
Insights from a Field Study. Benchmarking: An International Journal, 18, 705-732.
7. Day, M., & Lichtenstein, S. (2006). Strategic supply management: The relationship between
supply management practices, strategic orientation and their impact on organizational
performance. Journal of Purchasing & Supply Management, 12, 313-321.
8. Dhiman, S. (2008). Product, People and Planet: The Triple-Bottom Line Sustainability
Imperative. The Journal of Global Business Issues, 51-57.
9. Elkington, J. (1998). Accounting for the Triple Bottom Line. Measuring Business Excellence,
2(3), 18-22.
10. Envirowise & Incpen. (2008). Packguide: A guide to sustainable eco-design. Harwell:
Envirowise.
11. EPA. (2017, March 28). Environmental Management Systems (EMS). Retrieved April 5, 2017,
from United States Environmental Protection Agency: https://www.epa.gov/ems
12. European Commission. (2016). Packaging and Packaging Waste: Current Legislation.
Retrieved February 21, 2017, from European Commision: Environment:
http://ec.europa.eu/environment/waste/packaging/legis.htm
13. Evangelista, P., Sweeney, E., Ferruzzi, G., & Carrasco, J. C. (2010). Green Supply Chains
Initiatives in Transport and Logistics service industry: an exploratory case study analysis. Proc.
the Logistics Research Network Conference Towards the Sustainable Supply Chain:
Balancing the needs of Business, Economy and the Environment.
118
14. EY. (2013). Unwrapping the packaging industry: Seven factors for success. Retrieved
December 22, 2016, from Ernst & Young Global Limited:
http://www.ey.com/Publication/vwLUAssets/Unwrapping_the_packaging_industry_%E2%80%
93_seven_factors_for_success/$FILE/EY_Unwrapping_the_packaging_industry_-
_seven_success_factors.pdf
15. Faisal, M. N. (2010). Sustainable Supply Chains: A Study of Interaction Among the Enablers.
Business Process Management Journal, 16, 508-529.
16. FDF & Incpen. (2017). Packaging for people, planet and profit - a sustainability checklist.
London: Food & Drink Federation.
17. Fritz, M., Schöggl, J.-P., & Baumgartner, R. J. (2017). Selected Sustainability aspects for
supply chain data exchange: Towards a supply chain-wide sustainability assessment. Cleaner
Production 141, 587-607.
18. Garcia-Arca, J., & Prado, P. J. (2008). Packaging design model from a supply chain approach.
Supply Chain Management: An international Journal, 375-380.
19. GreenBlue. (2011). Definition of Sustainable Packaging. Retrieved November 21, 2016, from
Sustainable Packaging Coalition: a project of GreenBlue:
http://sustainablepackaging.org/uploads/Documents/Definition%20of%20Sustainable%20Pack
aging.pdf
20. Grönman, K., Soukka, R., Järvi-Kääriäinen, T., Katajajuuri, J.-M., Kuisma, M., Koivupuro, H.
K., et al. (2013). Framework for Sustainable Food Packaging Design. Packaging Technology
and Science, 26, 187-200.
21. Gupta, H., & Barua, M. K. (2016). Identifying enablers of technological innovation for Indian
MSMEs using best-worst multi criteria decision making method. Technological Forecasting &
Social Change, 69-79.
22. Haldórsson, Á., Kotzab, H., & Skjøtt-Larsen, T. (2009). Supply Chain Management on the
Crossroad to Sustainability: A Blessing or a Curse? Logistics Research, 1, 83-94.
23. Hall, J. (2006). Environmental Supply Chain Innovation. In J. Sarkis, Greener Management
International (pp. 233-249). Springer London.
24. Handfield, R., Sroufe, R., & Walton, S. (2005). Integrating environmental management and
supply chain strategies. Business Strategy and the Environment, 14, 1-19.
25. Heller, M. C., & Keoleian, G. A. (2003). Assessing the sustainability of the US food system: a
life cycle perspective. Agricultural Systems, 1007 - 1041.
26. ISO. (1997). ISO 11683:1997 Packaging - Tactile warnings of danger - Requirements.
Retrieved February 21, 2017, from ISO: Online Browsing Platform:
https://www.iso.org/obp/ui/#iso:std:iso:11683:ed-2:v2:en
27. Johansson, K., Lorentzon, A., Olsmats, C., & Tiliander, L. (1997). Packaging Logistics.
Stockholm: Packforsk.
119
28. KHC. (2016). Locations in Europe. Retrieved January 20, 2017, from The Kraft Heinz
Company: http://www.kraftheinzcompany.eu/careers/locations-in-europe
29. KHC. (2016, March 3). SEC Filings. Retrieved January 20, 2017, from The Kraft Heinz
Company: http://files.shareholder.com/downloads/ABEA-3QV6OO/3565253846x0xS1637459-
16-100/1637459/filing.pdf
30. KHC. (2016). Sustainable Business Practises. Retrieved Janurary 20, 2017, from The Kraft
Heinz Company: http://www.kraftheinzcompany.com/sustainability.html
31. KHC. (2017). The Collection. Retrieved April 23, 2017, from Kraft Heinz Food Service:
http://www.kraftheinzfoodservice.co.uk/en/Collection
32. Kogg, B., & Mont, O. (2012). Environmental and social responsibility in supply chains: The
practise of choice. Ecological Economics, 154-163.
33. KPMG. (2011, April). Corporate Sustainability: a progress report. Retrieved December 12,
2016, from KPMG cutting through complexity:
http://www.sustainabilityexchange.ac.uk/files/corporate-sustainability-a-progress-report_1.pdf
34. Lewis, H., Fitzpatrick, L. V., Sonneveld, K., & Jordon, R. (2007, November). Sustainable
Packaging Redefined. Retrieved November 21, 2016, from Sustainable Packaging Alliance:
http://www.sustainablepack.org/database/files/newsfiles/Sustainable%20Packaging%20Redefi
ned%20Nov%20%202007.pdf
35. Linton, J., Klassen, R., & Jayaraman, V. (2007). Sustainable supply chains: An introduction.
Journal of Operations Management, 25(6), 1075-1082.
36. Lockamy III, A. (1995). A Conceptual Framework for Assessing Strategic Packaging .
International Journal of Logistics Management, 6(1), 51-60.
37. Meehan, J., Meehan, K., & Richards, A. (2006). Corporate social responsibility: the 3C-SR
model. International Journal of Social Economics, 33, 386-398.
38. Min, H., & Galle, W. P. (2001). Green purchasing practices of US firms. International Journal
of Operations & Production Management, 21, 1222-1238.
39. Nonaka, I., & Takeushi, H. (1995). The knowledge-creating company. New york: Oxford
University Press.
40. NVC. (2016). NVC Stimulates Use of World Standards on Packaging Environment. Retrieved
December 22, 2016, from Netherlands Packaging Centre:
http://www.en.nvc.nl/userfiles/files/NVC%20Position%20Paper%20world%20standards%20EN
G%281%29.pdf
41. Olander-Roese, M., & Nilsson, F. (2009). Competitive Advantage Through Packaging Design -
Propositions for Supply Chain Effectiveness and Efficiency. International Conference on
Engineering Design (pp. 279-288). Stanford: Stanford University.
42. Olsmats, C., & Dominic, C. (2003). Packaging Scorecard - a Packaging Performance
Evaluation Method. Packaging Technology and Science, 9-14.
120
43. Pagell, M., & Wu, Z. (2009). Building a More Complete Theory of Sustainable Supply Chain
Management Using Case Study of 10 Exemplars. Journal of Supply Chain Management, 45,
37-56.
44. Paine, F. (1991). The Packaging User's Handbook. Glasgow: Blackie Academic and
Professional.
45. Popadiuk, S., & Choo, C. W. (2006). Innovation and knowledge creation: How are these
concepts related? International Journal of Information Management, 26, 302-312.
46. Ren, J., Liang, H., & Chan, F. T. (2016). Urban Sewage sludge, sustainability, and transition
for Eco-City: Multi-criteria sustainability assessment of technologies based on best-worst
method. Technological Forecasting & Social Change.
47. Rezaei, J. (2015). Best-worst multi-criteria decision-making method. Omega 53, 49-57.
48. Rezaei, J. (2016). Best-worst multi-criteria decision-making method: Some properties and a
linear model. Omega 64, 126-130.
49. Rezaei, J. (2017, July 5). BWM Bibliographical Database. Retrieved July 8, 2017, from Best
Worst Method: A multi-criteria decision-making method: http://bestworstmethod.com/wp-
content/uploads/2015/06/BWM-bibliographical-database.pdf
50. Rezaei, J., Nispeling, T., Sarkis, J., & Tavasszy, L. (2016). A supplier selection life cycle
approach integrating traditional and environmental criteria using the best worst method.
Journal of Cleaner Production 35, 577-588.
51. Schöggl, J.-P., Fritz, M., & Baumgartner, R. (2016). Toward supply chain-wide sustainability
assessment: a conceptual framework and an aggregeation method to assess supply chain
performance. Journal of Cleaner Production 131, 822-835.
52. Seuring, S., & Müller, M. (2008a). Core issues in Sustainable Supply Chain Management: A
Delphi Study. Business Strategy and the Environment, 17, 455-466.
53. Seuring, S., & Müller, M. (2008b). From a literature review to a conceptual framework for
sustainable supply chain management. Journal of Cleaner Production, 16(15), 1699-1710.
54. SPC. (2006, December). design guidelines for sustainable packaging. Retrieved December
22, 2016, from Sustainable Packaging Coalition - GreenBlue:
http://www.sustainablepackaging.org/uploads/resources/design_guidelines_sp.pdf
55. Svanes, E., Vold, M., Møller, H., Pettersen, M. K., Larsen, H., & Hanssen, O. J. (2010).
Sustainable Packaging Design: a Holistic Methodology for Packaging Design. Packaging
Technology and Science, 23, 161-175.
56. Taebi, B., Correljé, A., Cuppen, E., Dignum, E., & Pesch, U. (2014). Responsible innovation as
an endorsement of public values: the need for interdisciplinary research. Journal of
Responsible Innovation, 1, 118-124.
121
57. Tay, M. Y., Rahman, A. A., Aziz, Y. A., & Sidek, S. (2015, October). A Review on Drivers and
Barriers towards Sustainable Supply Chain Practises. International Journal of Social Science
and Humanity, 5(10), 892-897.
58. Triantaphyllou, E., Shu, B., Sanchez, S. N., & Ray, T. (1998). Multi-Criteria Decision Making:
An Operations Research Approach. Encyclopedia of Electrical and Electronics Engineering,
15, 175-186.
59. Tushman, M. L., Anderson, P. C., & O’Reilly, C. (1997). Technological cycles, innovation
streams, and ambidextrous organizations: organizational renewal through innovation streams
and strategic change. In M. L. Tushman, & P. Anderson, Managing strategic innovation and
change: A collection of readings (pp. 3-23). New York: Oxford University Press.
60. Uma, S., & Bougie, R. (2013). Research Method for Business: A Skill building Approach. New
York: John Wiley & Sons.
61. Unilever. (2017, January 1). Report shows a third of consumers prefer sustainable brands.
Retrieved June 12, 2017, from Unilever - Press Releases:
https://www.unilever.com/news/press-releases/2017/report-shows-a-third-of-consumers-
prefer-sustainable-brands.html
62. Walker, H., & Jones, N. (2012). Sustainable Supply Chain Management Across the UK Private
Sector. Supply Chain Management: An international Journal, 17, 15-28.
63. Wan Ahmad, N. K., de Brito, M. P., Rezaei, J., & Tavasszy, L. A. (2017). An integrative
framework for sustainable supply chain management practises in the oild and gas industry.
Journal of Environmental Planning and Management, 577-601.
64. Wittstruck, D., & Teuteberg, F. (2012). Understanding the Success Factors of Sustainable
Supply Chain Management: Empirical Evidence from the Electrics and Electronics Industry.
Corporate Social Responsibility and Environmental Management, 19, 141-158.
65. Wolf, J. (2011). Sustainable Supply Chain Management Integration: A Qualitative Analysis of
the German Manufacturing Industry. Journal of Business Ethics, 102, 221-235.
66. Zhu, Q., Sarkis, J., & Geng, Y. (2005). Green supply chain management in China: pressures,
practises and performance. International Journal of Operations & Production Management, 24,
449-468.
67. Zhu, Q., Sarkis, J., & Lai, K. (2008). Confirmation of a Measurement Model for Green Supply
Chain Management Practises for Implementation. International Journal of Production
Economics, 111, 261-273.

122
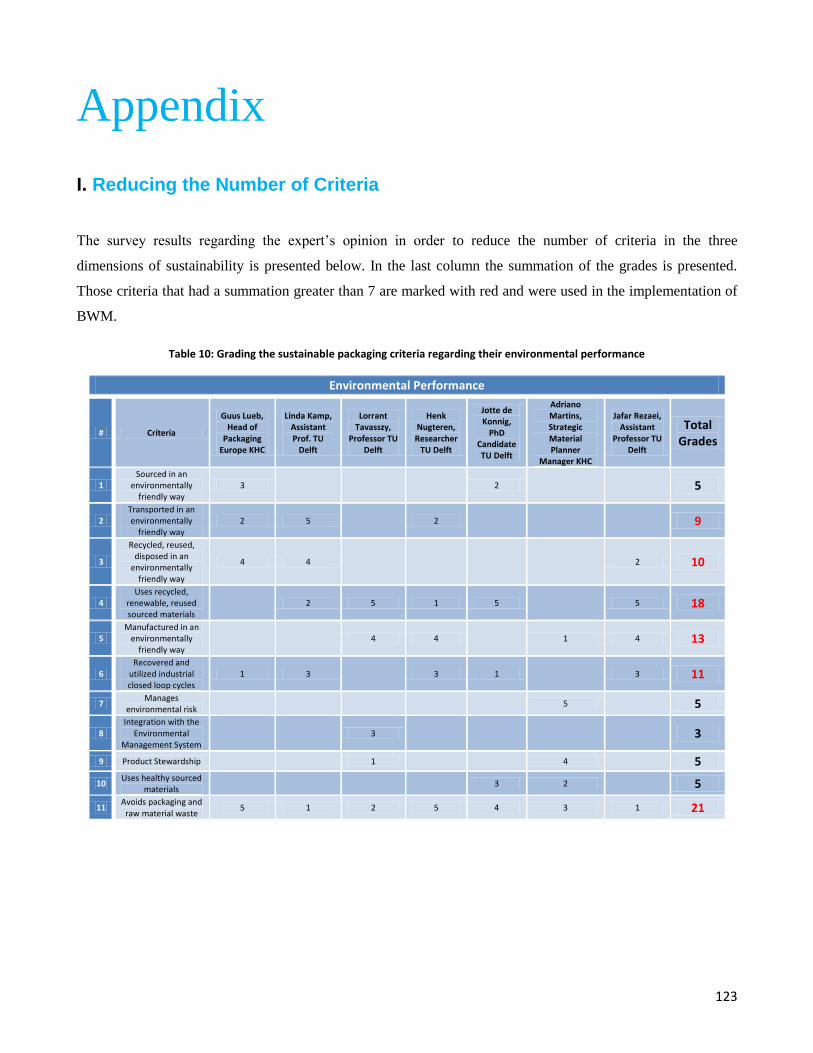
123
Appendix
I. Reducing the Number of Criteria
The survey results regarding the expert‟s opinion in order to reduce the number of criteria in the three
dimensions of sustainability is presented below. In the last column the summation of the grades is presented.
Those criteria that had a summation greater than 7 are marked with red and were used in the implementation of
BWM.
Table 10: Grading the sustainable packaging criteria regarding their environmental performance
Environmental Performance
# Criteria
Guus Lueb, Head of
Packaging Europe KHC
Linda Kamp, Assistant Prof. TU
Delft
Lorrant Tavasszy,
Professor TU Delft
Henk Nugteren, Researcher
TU Delft
Jotte de Konnig,
PhD Candidate TU Delft
Adriano Martins, Strategic Material Planner
Manager KHC
Jafar Rezaei, Assistant
Professor TU Delft
Total Grades
1 Sourced in an
environmentally friendly way
3
2 5
2 Transported in an environmentally
friendly way 2 5
2
9
3
Recycled, reused, disposed in an
environmentally friendly way
4 4
2 10
4 Uses recycled,
renewable, reused sourced materials
2 5 1 5
5 18
5 Manufactured in an
environmentally friendly way
4 4
1 4 13
6 Recovered and
utilized industrial closed loop cycles
1 3
3 1
3 11
7 Manages
environmental risk 5
5
8 Integration with the
Environmental Management System
3
3
9 Product Stewardship
1
4 5
10 Uses healthy sourced
materials 3 2
5
11 Avoids packaging and
raw material waste 5 1 2 5 4 3 1 21
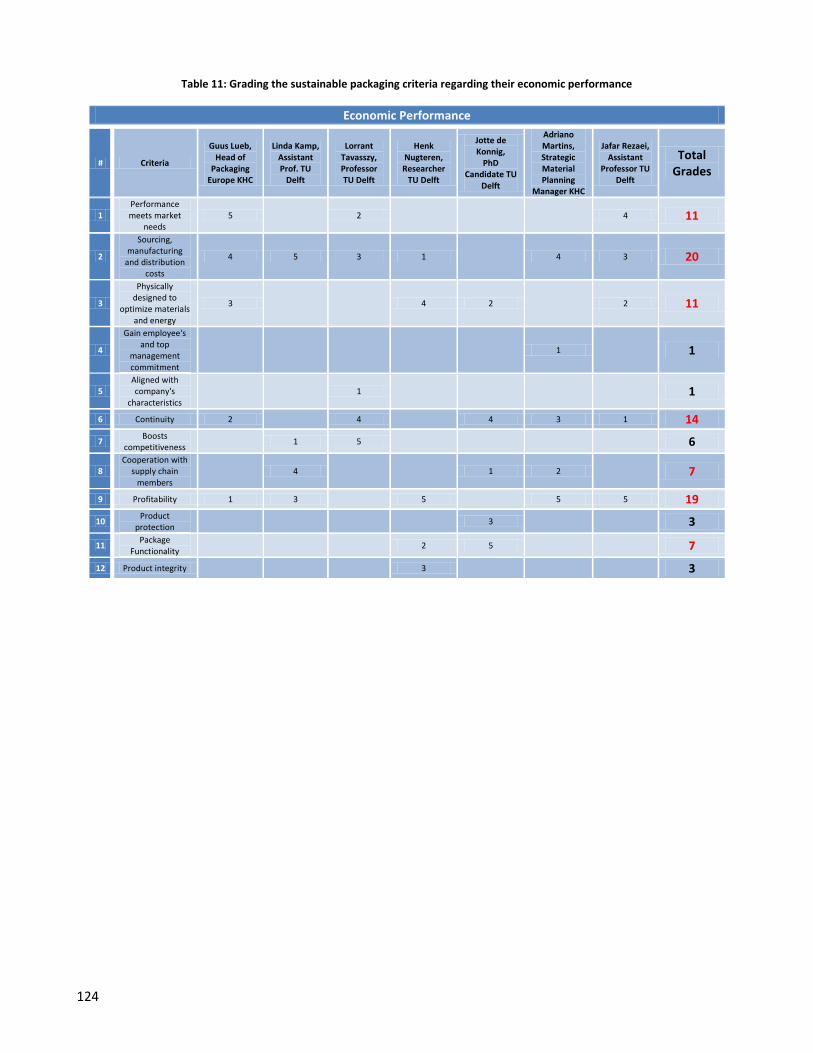
124
Table 11: Grading the sustainable packaging criteria regarding their economic performance
Economic Performance
# Criteria
Guus Lueb, Head of
Packaging Europe KHC
Linda Kamp, Assistant Prof. TU
Delft
Lorrant Tavasszy, Professor TU Delft
Henk Nugteren, Researcher
TU Delft
Jotte de Konnig,
PhD Candidate TU
Delft
Adriano Martins, Strategic Material Planning
Manager KHC
Jafar Rezaei, Assistant
Professor TU Delft
Total Grades
1 Performance meets market
needs 5
2
4 11
2
Sourcing, manufacturing
and distribution costs
4 5 3 1
4 3 20
3
Physically designed to
optimize materials and energy
3
4 2
2 11
4
Gain employee's and top
management commitment
1
1
5 Aligned with company's
characteristics
1 1
6 Continuity 2
4
4 3 1 14
7 Boosts
competitiveness 1 5
6
8 Cooperation with
supply chain members
4
1 2
7
9 Profitability 1 3
5
5 5 19
10 Product
protection 3
3
11 Package
Functionality 2 5
7
12 Product integrity
3 3

125
Table 12: Grading the sustainable packaging criteria regarding their social performance
Social Performance
# Criteria
Guus Lueb, Head of
Packaging Europe KHC
Linda Kamp, Assistant Prof. TU
Delft
Lorrant Tavasszy, Professor TU Delft
Henk Nugteren, Researcher
TU Delft
Jotte de Konnig,
PhD Candidate TU
Delft
Adriano Martins, Strategic Material Planning
Manager KHC
Jafar Rezaei, Assistant
Professor TU Delft
Total Grades
1 Beneficial for
individuals and the community
3 2 3 5 1
5 19
2
Healthy and safe for individuals
and the community
4 1 2 1 2 4 4 18
3
Aligned with the organization's
social corporate responsibilities
5
1
6
4 Manages
reputational risk 5
3 1 9
5
In accordance with
governmental policies and regulations
2 5 1 2
5 3 18
6 Transparency
3 3
7 Employee's
quality of life 3
3 4 2
12
8 Maximize
consumer value 1 4
5
9 Suppliers and carriers are
certified
4 4 5
2 15
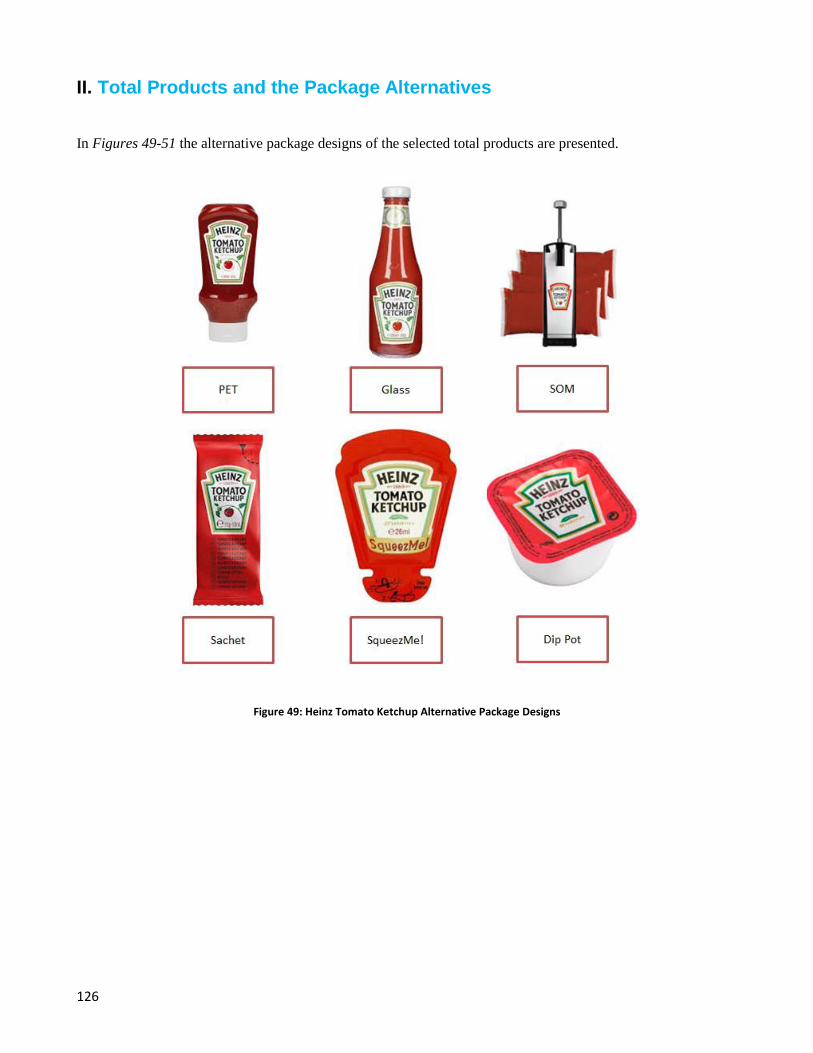
126
II. Total Products and the Package Alternatives
In Figures 49-51 the alternative package designs of the selected total products are presented.
Figure 49: Heinz Tomato Ketchup Alternative Package Designs
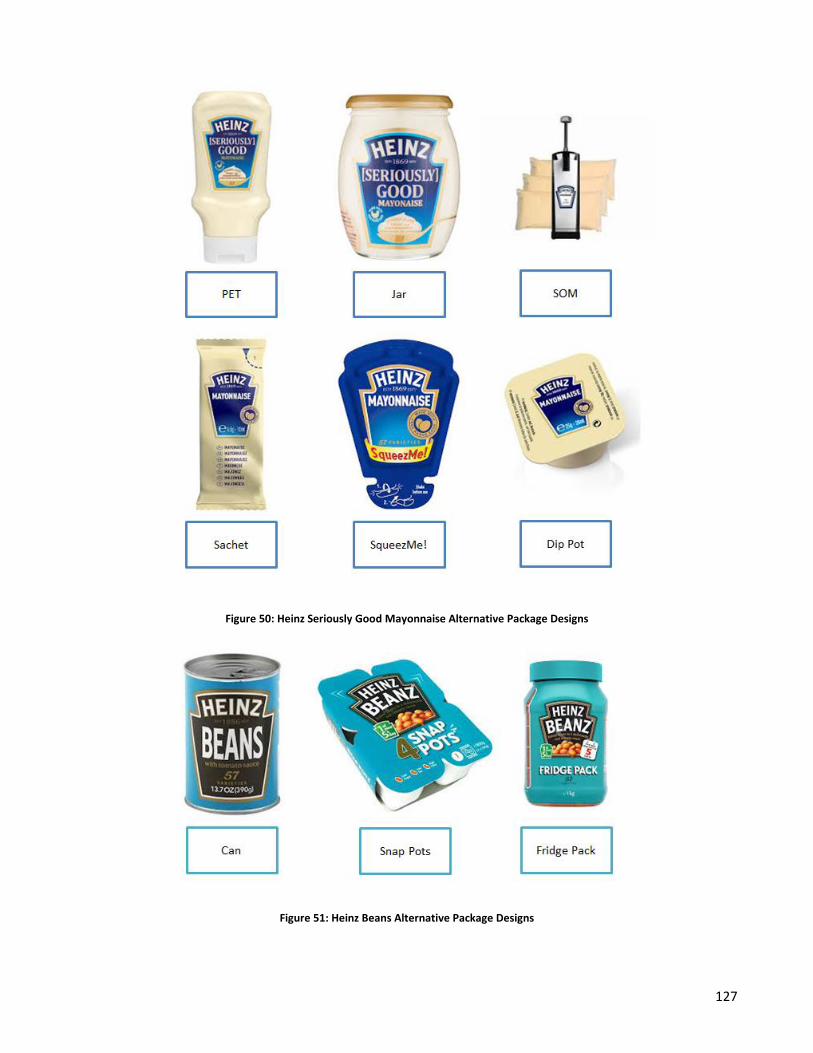
127
Figure 50: Heinz Seriously Good Mayonnaise Alternative Package Designs
Figure 51: Heinz Beans Alternative Package Designs
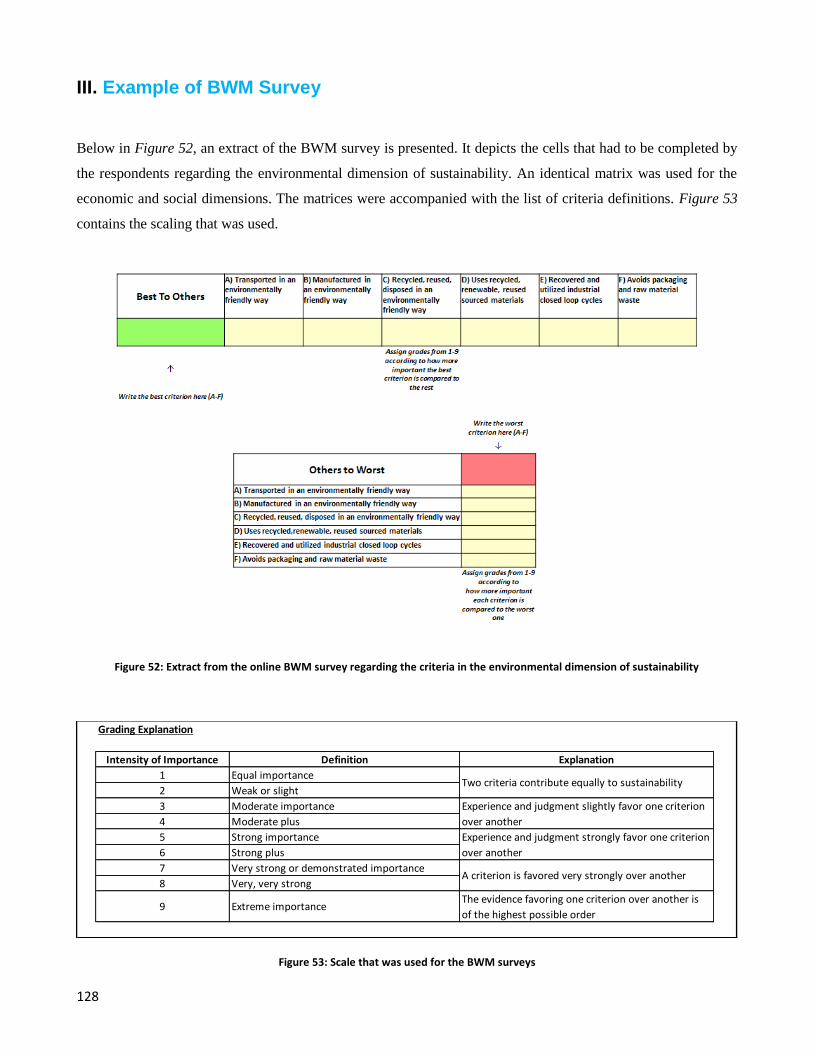
128
III. Example of BWM Survey
Below in Figure 52, an extract of the BWM survey is presented. It depicts the cells that had to be completed by
the respondents regarding the environmental dimension of sustainability. An identical matrix was used for the
economic and social dimensions. The matrices were accompanied with the list of criteria definitions. Figure 53
contains the scaling that was used.
Figure 52: Extract from the online BWM survey regarding the criteria in the environmental dimension of sustainability
Figure 53: Scale that was used for the BWM surveys
Grading Explanation
Intensity of Importance Definition Explanation
1 Equal importance
2 Weak or slight
3 Moderate importance
4 Moderate plus
5 Strong importance
6 Strong plus
7 Very strong or demonstrated importance
8 Very, very strong
9 Extreme importance
A criterion is favored very strongly over another
Experience and judgment strongly favor one criterion
over another
Two criteria contribute equally to sustainability
Experience and judgment slightly favor one criterion
over another
The evidence favoring one criterion over another is
of the highest possible order
129
IV. Sustainable Packaging Criteria Definitions
Environmental Dimension
A. Transported in an environmentally friendly way
This criterion refers to the processes followed by the distributors of the product-package combination after its
production and incorporates the use of alternative fuels, hybrid vehicles and innovative technologies.
B. Manufactured in an environmentally friendly way
This criterion refers to the manufacturing processes of the product-package combination and incorporates the
use of clean, eco-efficient production technologies, best practices and renewable energy.
C. Recycled, reused, disposed in an environmentally friendly way
This criterion refers to the processes in the end life of the product-package combination and incorporates the use
of renewable energy in recycling, reuse or disposal of the package.
D. Uses recycled, renewable, reused sourced materials
This criterion refers to the selection of the raw and packaging materials that are used in manufacturing and
incorporates the use of recycled or bio-based, renewable and reused materials from well-managed sources.
E. Recovered and utilized in industrial closed loop cycles
This criterion refers to completing the life cycle of the product-package combination and incorporates its ability
for effective recovery and other recovery options such as the biological, technical and technical recovery
methods.
F. Avoids packaging and raw material waste
This criterion refers to the conservation of packaging and raw materials during the complete life cycle of the
product-package combination and incorporates the ability of the package design to avoid food spillage during
transportation and use.
130
Economic Dimension
A. Performance meets market needs
This criterion refers to the ability of the product-package combination to respond to customer needs and
incorporates its ability to acquire a competitive position in the market and satisfy the consumers.
B. Sourcing, manufacturing, distribution and recycling costs
This criterion refers to the operational costs of the product-package combination during his complete life cycle
and incorporates the costs of its supply, production, transportation and disposal.
C. Physically designed to optimize materials and energy
This criterion refers to the selection of the physical characteristics of the product-package combination that
ensure the optimization of the used resources and incorporates the energy use over the life of the package, the
impact of materials in all end-of-life scenarios, and the appropriateness to facilitate material recovery.
D. Continuity
This criterion refers to the alignment of the development of the product-package combination with the existing
operational practices and incorporates the amount of changes that are necessary for a smooth implementation of
the development plan.
E. Cooperation with supply chain members
This criterion refers to how the development of the product-package combination achieves the cooperation of
the various supply chain members and incorporates the integration of suppliers and distributors in the
operational activities, the information sharing among the supply chain members and the fairness in the
distribution of profits.
F. Profitability
This criterion refers to the ability of the product-package combination to deliver profits in relation to the size of
the business and incorporates its ability to manage the economic risk, ongoing growth and prosperity.
G. Package Functionality
This criterion refers to the overall functionality of the product-package combination and incorporates the
qualities of handleability during transportation, efficiency in food quantity utilization and prevention of theft.

131
Social Dimension
A. Beneficial for individuals and the community
This criterion refers to how the product-package combination promotes the consumer‟s well-being throughout
its life cycle and incorporates the creation of meaningful, stable employment and the protection, preservation,
safety, and transport of the contained food.
B. Healthy and safe for individuals and the community
This criterion refers to how the product-package combination contributes to the health and safety of the
consumers throughout its life cycle and incorporates the assurance that no harmful substances are released to the
environment during its production phase and that no toxic substances are present through its use and end of life
phases.
C. Manages Reputational Risk
This criterion refers to how the product-package combination manages the organization‟s reputational risk and
incorporates its ability to avoid opposition from the stakeholders.
D. In accordance with governmental policies and regulations
This criterion refers to whether the product-package combination violates the current governmental policies and
regulations.
E. Employee’s quality of life
This criterion refers to the degree that the worker‟s rights are valued and incorporates the values of the respect
for the quality of life and satisfaction of the workers along its complete life cycle.
F. Suppliers and carriers are certified
This criterion refers to both the suppliers and the distributors of the product-package combination and
incorporates the need of having certain sustainability certifications and to pass the environmental and social
criteria specified by the members of the supply chain.
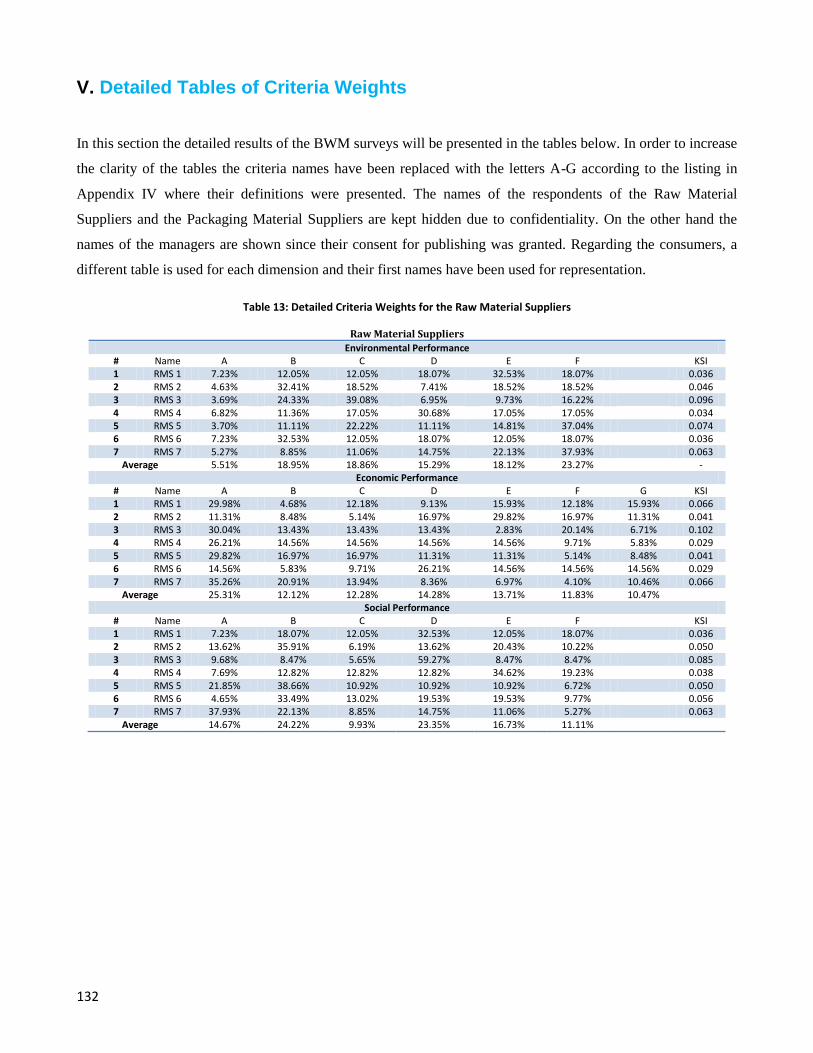
132
V. Detailed Tables of Criteria Weights
In this section the detailed results of the BWM surveys will be presented in the tables below. In order to increase
the clarity of the tables the criteria names have been replaced with the letters A-G according to the listing in
Appendix IV where their definitions were presented. The names of the respondents of the Raw Material
Suppliers and the Packaging Material Suppliers are kept hidden due to confidentiality. On the other hand the
names of the managers are shown since their consent for publishing was granted. Regarding the consumers, a
different table is used for each dimension and their first names have been used for representation.
Table 13: Detailed Criteria Weights for the Raw Material Suppliers
Raw Material Suppliers
Environmental Performance # Name A B C D E F KSI 1 RMS 1 7.23% 12.05% 12.05% 18.07% 32.53% 18.07% 0.036 2 RMS 2 4.63% 32.41% 18.52% 7.41% 18.52% 18.52% 0.046 3 RMS 3 3.69% 24.33% 39.08% 6.95% 9.73% 16.22% 0.096 4 RMS 4 6.82% 11.36% 17.05% 30.68% 17.05% 17.05% 0.034 5 RMS 5 3.70% 11.11% 22.22% 11.11% 14.81% 37.04% 0.074 6 RMS 6 7.23% 32.53% 12.05% 18.07% 12.05% 18.07% 0.036 7 RMS 7 5.27% 8.85% 11.06% 14.75% 22.13% 37.93% 0.063
Average 5.51% 18.95% 18.86% 15.29% 18.12% 23.27% - Economic Performance
# Name A B C D E F G KSI 1 RMS 1 29.98% 4.68% 12.18% 9.13% 15.93% 12.18% 15.93% 0.066 2 RMS 2 11.31% 8.48% 5.14% 16.97% 29.82% 16.97% 11.31% 0.041 3 RMS 3 30.04% 13.43% 13.43% 13.43% 2.83% 20.14% 6.71% 0.102 4 RMS 4 26.21% 14.56% 14.56% 14.56% 14.56% 9.71% 5.83% 0.029 5 RMS 5 29.82% 16.97% 16.97% 11.31% 11.31% 5.14% 8.48% 0.041 6 RMS 6 14.56% 5.83% 9.71% 26.21% 14.56% 14.56% 14.56% 0.029 7 RMS 7 35.26% 20.91% 13.94% 8.36% 6.97% 4.10% 10.46% 0.066
Average 25.31% 12.12% 12.28% 14.28% 13.71% 11.83% 10.47% Social Performance
# Name A B C D E F KSI 1 RMS 1 7.23% 18.07% 12.05% 32.53% 12.05% 18.07% 0.036 2 RMS 2 13.62% 35.91% 6.19% 13.62% 20.43% 10.22% 0.050 3 RMS 3 9.68% 8.47% 5.65% 59.27% 8.47% 8.47% 0.085 4 RMS 4 7.69% 12.82% 12.82% 12.82% 34.62% 19.23% 0.038 5 RMS 5 21.85% 38.66% 10.92% 10.92% 10.92% 6.72% 0.050 6 RMS 6 4.65% 33.49% 13.02% 19.53% 19.53% 9.77% 0.056 7 RMS 7 37.93% 22.13% 8.85% 14.75% 11.06% 5.27% 0.063
Average 14.67% 24.22% 9.93% 23.35% 16.73% 11.11%
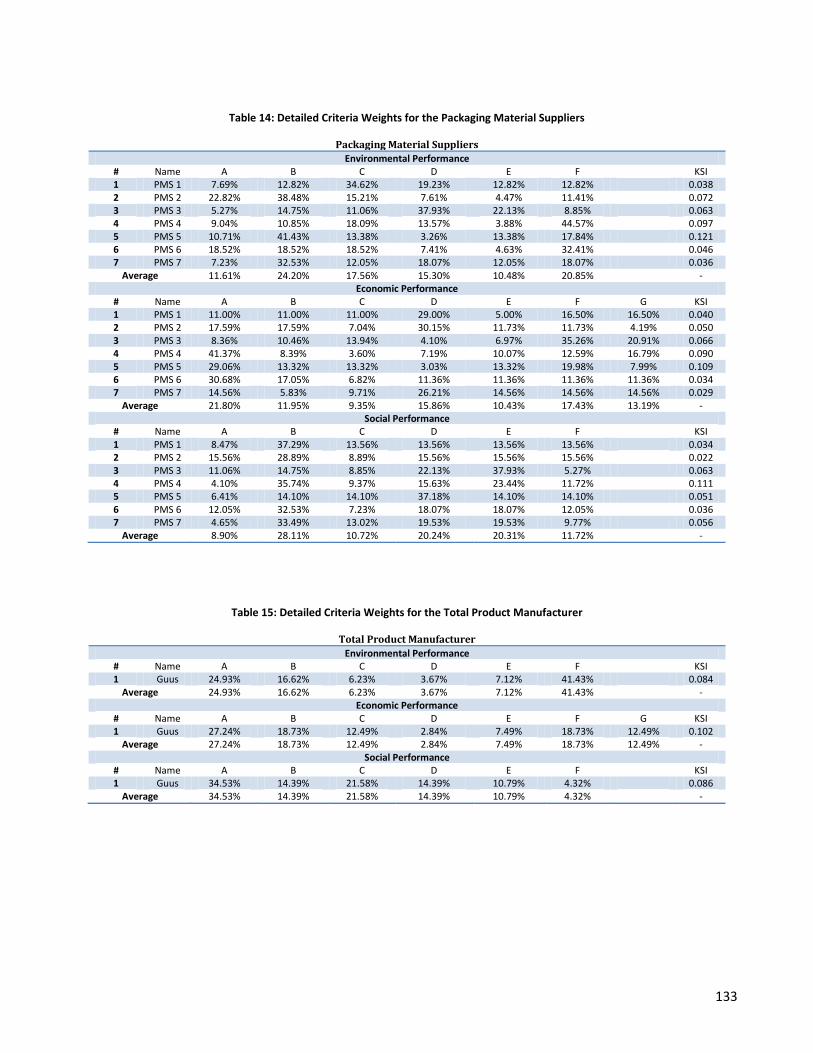
133
Table 14: Detailed Criteria Weights for the Packaging Material Suppliers
Packaging Material Suppliers
Environmental Performance # Name A B C D E F KSI 1 PMS 1 7.69% 12.82% 34.62% 19.23% 12.82% 12.82% 0.038 2 PMS 2 22.82% 38.48% 15.21% 7.61% 4.47% 11.41% 0.072 3 PMS 3 5.27% 14.75% 11.06% 37.93% 22.13% 8.85% 0.063 4 PMS 4 9.04% 10.85% 18.09% 13.57% 3.88% 44.57% 0.097 5 PMS 5 10.71% 41.43% 13.38% 3.26% 13.38% 17.84% 0.121 6 PMS 6 18.52% 18.52% 18.52% 7.41% 4.63% 32.41% 0.046 7 PMS 7 7.23% 32.53% 12.05% 18.07% 12.05% 18.07% 0.036
Average 11.61% 24.20% 17.56% 15.30% 10.48% 20.85% - Economic Performance
# Name A B C D E F G KSI 1 PMS 1 11.00% 11.00% 11.00% 29.00% 5.00% 16.50% 16.50% 0.040 2 PMS 2 17.59% 17.59% 7.04% 30.15% 11.73% 11.73% 4.19% 0.050 3 PMS 3 8.36% 10.46% 13.94% 4.10% 6.97% 35.26% 20.91% 0.066 4 PMS 4 41.37% 8.39% 3.60% 7.19% 10.07% 12.59% 16.79% 0.090 5 PMS 5 29.06% 13.32% 13.32% 3.03% 13.32% 19.98% 7.99% 0.109 6 PMS 6 30.68% 17.05% 6.82% 11.36% 11.36% 11.36% 11.36% 0.034 7 PMS 7 14.56% 5.83% 9.71% 26.21% 14.56% 14.56% 14.56% 0.029
Average 21.80% 11.95% 9.35% 15.86% 10.43% 17.43% 13.19% - Social Performance
# Name A B C D E F KSI 1 PMS 1 8.47% 37.29% 13.56% 13.56% 13.56% 13.56% 0.034 2 PMS 2 15.56% 28.89% 8.89% 15.56% 15.56% 15.56% 0.022 3 PMS 3 11.06% 14.75% 8.85% 22.13% 37.93% 5.27% 0.063 4 PMS 4 4.10% 35.74% 9.37% 15.63% 23.44% 11.72% 0.111 5 PMS 5 6.41% 14.10% 14.10% 37.18% 14.10% 14.10% 0.051 6 PMS 6 12.05% 32.53% 7.23% 18.07% 18.07% 12.05% 0.036 7 PMS 7 4.65% 33.49% 13.02% 19.53% 19.53% 9.77% 0.056
Average 8.90% 28.11% 10.72% 20.24% 20.31% 11.72% -
Table 15: Detailed Criteria Weights for the Total Product Manufacturer
Total Product Manufacturer
Environmental Performance # Name A B C D E F KSI 1 Guus 24.93% 16.62% 6.23% 3.67% 7.12% 41.43% 0.084
Average 24.93% 16.62% 6.23% 3.67% 7.12% 41.43% - Economic Performance
# Name A B C D E F G KSI 1 Guus 27.24% 18.73% 12.49% 2.84% 7.49% 18.73% 12.49% 0.102
Average 27.24% 18.73% 12.49% 2.84% 7.49% 18.73% 12.49% - Social Performance
# Name A B C D E F KSI 1 Guus 34.53% 14.39% 21.58% 14.39% 10.79% 4.32% 0.086
Average 34.53% 14.39% 21.58% 14.39% 10.79% 4.32% -

134
Table 16: Detailed Criteria Weights for the Customers
Customers
Environmental Performance # Name A B C D E F KSI 1 Luuk 25.85% 41.35% 8.62% 7.38% 12.92% 3.88% 0.103 2 Loes 9.04% 22.60% 37.14% 15.07% 4.84% 11.30% 0.081
Average 17.44% 31.98% 22.88% 11.23% 8.88% 7.59% - Economic Performance
# Name A B C D E F G KSI 1 Luuk 24.59% 8.20% 3.12% 6.15% 12.29% 38.63% 7.02% 0.105 2 Loes 36.72% 3.22% 5.56% 11.11% 6.35% 22.22% 14.82% 0.077
Average 30.65% 5.71% 4.34% 8.63% 9.32% 30.43% 10.92% - Social Performance
# Name A B C D E F KSI 1 Luuk 3.79% 11.36% 15.15% 37.88% 9.09% 22.73% 0.076 2 Loes 43.75% 13.55% 9.03% 10.84% 18.07% 4.76% 0.105
Average 23.77% 12.46% 12.09% 24.36% 13.58% 13.74% -
Table 17: Detailed Criteria Weights for the Consumers – Environmental Dimension
Consumers
Environmental Performance # Name A B C D E F KSI 1 Alex 3.69% 16.22% 39.08% 24.33% 6.95% 9.73% 0.096 2 Anthi 10.71% 17.86% 17.86% 36.83% 3.35% 13.39% 0.167 3 Artemis 15.97% 32.59% 23.96% 15.97% 1.92% 9.58% 0.153 4 Arun 4.08% 18.37% 28.57% 18.37% 12.24% 18.37% 0.082 5 Camila 4.13% 10.54% 14.06% 31.42% 8.43% 31.42% 0.107 6 Darija 15.27% 22.90% 4.58% 34.35% 11.45% 11.45% 0.115 7 Diana 10.18% 26.35% 20.36% 20.36% 2.40% 20.36% 0.144 8 Dionysis 36.36% 12.12% 18.18% 12.12% 12.12% 9.09% 0.242 9 George 10.58% 8.81% 5.18% 17.63% 44.58% 13.22% 0.083
10 Giorgos 3.41% 37.54% 11.95% 23.89% 13.65% 9.56% 0.102 11 Helen 3.41% 11.36% 25.57% 34.09% 8.52% 17.05% 0.085 12 Ismini 12.28% 22.81% 22.81% 12.28% 7.02% 22.81% 0.018 13 Jens 22.81% 22.81% 12.28% 12.28% 7.02% 22.81% 0.018 14 Jim 11.19% 9.79% 9.79% 51.75% 6.29% 11.19% 0.266 15 Katerina 11.06% 22.13% 37.93% 14.75% 5.27% 8.85% 0.063 16 Luigi 17.60% 36.87% 13.20% 10.56% 4.19% 17.60% 0.159 17 Makis 12.80% 23.78% 23.78% 23.78% 7.32% 8.54% 0.018 18 Marc 4.44% 42.52% 17.98% 10.79% 13.48% 10.79% 0.114 19 Maria 16.39% 33.81% 24.59% 12.30% 3.07% 9.84% 0.154 20 Marietta 9.49% 23.72% 14.36% 36.83% 3.75% 11.86% 0.106 21 Mary 2.63% 23.68% 14.47% 23.68% 11.84% 23.68% 0.092 22 Mattia 4.55% 14.77% 21.59% 14.77% 29.55% 14.77% 0.080 23 Michael 14.45% 14.45% 3.80% 21.67% 14.45% 31.18% 0.122 24 Niki 24.28% 12.14% 16.18% 36.42% 4.05% 6.94% 0.121 25 Nikos 3.87% 12.58% 12.58% 16.77% 15.48% 38.71% 0.116 26 Pamela 4.38% 40.17% 16.55% 12.41% 16.55% 9.93% 0.095 27 Panagiotis 9.52% 23.81% 26.19% 23.81% 7.14% 9.52% 0.024 28 Panos 4.31% 37.07% 14.66% 10.99% 21.98% 10.99% 0.069 29 Sagar 17.95% 25.83% 32.13% 11.97% 8.98% 3.15% 0.101 30 Sergio 12.41% 9.31% 30.55% 30.55% 12.41% 4.77% 0.067 31 Shen 2.77% 8.01% 39.14% 28.04% 14.02% 8.01% 0.169 32 Simone 3.88% 9.90% 19.81% 13.20% 33.40% 19.81% 0.062 33 Thanos 9.27% 11.58% 4.34% 23.17% 15.44% 36.20% 0.101 34 Tuty 4.34% 9.27% 11.58% 23.17% 15.44% 36.20% 0.101 35 Zeynep 20.52% 28.08% 20.52% 20.52% 2.16% 8.21% 0.130
Average 10.71% 20.96% 19.15% 21.88% 11.60% 15.70% -

135
Table 18: Detailed Criteria Weights for the Consumers – Economic Dimension
Consumers
Economic Performance # Name A B C D E F G KSI 1 Alex 6.93% 3.54% 39.92% 9.70% 15.66% 8.08% 16.17% 0.086 2 Anthi 7.16% 33.52% 16.70% 16.70% 10.02% 3.39% 12.52% 0.166 3 Artemis 24.78% 8.92% 22.30% 4.96% 11.15% 5.58% 22.30% 0.198 4 Arun 24.32% 13.51% 10.14% 10.14% 8.11% 13.51% 20.27% 0.162 5 Camila 23.49% 15.77% 10.51% 3.09% 7.88% 23.49% 15.77% 0.080 6 Darija 23.53% 9.80% 13.07% 7.84% 13.07% 19.61% 13.07% 0.157 7 Diana 11.11% 32.22% 8.89% 3.33% 14.81% 14.81% 14.81% 0.122 8 Dionysis 24.32% 8.11% 13.51% 10.14% 13.51% 20.27% 10.14% 0.162 9 George 12.36% 12.36% 9.27% 5.62% 32.58% 18.54% 9.27% 0.045
10 Giorgos 22.09% 9.20% 7.36% 12.27% 12.27% 18.40% 18.40% 0.147 11 Helen 10.16% 31.93% 6.39% 2.90% 7.98% 24.67% 15.97% 0.073 12 Ismini 20.31% 10.94% 20.31% 6.25% 10.94% 10.94% 20.31% 0.016 13 Jens 13.64% 9.09% 13.64% 5.45% 9.09% 24.55% 24.55% 0.027 14 Jim 39.11% 8.94% 8.94% 10.43% 7.82% 20.86% 3.91% 0.235 15 Katerina 35.26% 6.97% 13.94% 8.36% 20.91% 4.10% 10.46% 0.066 16 Luigi 9.37% 11.72% 15.63% 7.81% 15.63% 36.56% 3.28% 0.103 17 Makis 20.50% 22.36% 12.11% 8.07% 8.07% 24.22% 4.66% 0.019 18 Marc 8.77% 15.34% 7.67% 7.67% 7.67% 48.85% 4.04% 0.125 19 Maria 35.44% 17.50% 15.25% 9.15% 7.63% 3.59% 11.44% 0.103 20 Marietta 10.87% 13.58% 35.90% 2.91% 10.87% 18.11% 7.76% 0.184 21 Mary 19.15% 19.15% 19.15% 19.15% 9.57% 11.70% 2.13% 0.074 22 Mattia 16.74% 23.18% 16.74% 4.29% 16.74% 11.16% 11.16% 0.103 23 Michael 24.24% 12.12% 3.03% 18.18% 12.12% 18.18% 12.12% 0.121 24 Niki 17.28% 8.64% 11.52% 4.71% 29.06% 17.28% 11.52% 0.055 25 Nikos 41.54% 9.23% 9.23% 9.23% 9.23% 9.23% 12.31% 0.323 26 Pamela 15.33% 11.45% 15.33% 17.18% 3.70% 30.13% 6.87% 0.042 27 Panagiotis 24.94% 6.84% 22.53% 13.68% 4.02% 5.47% 22.53% 0.024 28 Panos 13.38% 7.64% 41.02% 8.92% 3.57% 17.83% 7.64% 0.125 29 Sagar 16.10% 12.44% 8.29% 2.44% 12.44% 24.88% 23.41% 0.088 30 Sergio 11.11% 27.78% 16.67% 11.11% 5.56% 16.67% 11.11% 0.056 31 Shen 33.45% 21.28% 10.64% 10.64% 7.09% 14.19% 2.70% 0.091 32 Simone 18.75% 18.75% 31.25% 6.25% 12.50% 3.12% 9.37% 0.062 33 Thanos 34.88% 7.03% 21.10% 10.55% 8.44% 3.94% 14.06% 0.073 34 Tuty 12.69% 12.69% 10.15% 3.98% 12.69% 39.32% 8.46% 0.114 35 Zeynep 22.88% 20.02% 8.01% 10.01% 5.72% 20.02% 13.35% 0.172
Average 20.17% 14.67% 15.60% 8.66% 11.38% 17.29% 12.22% -
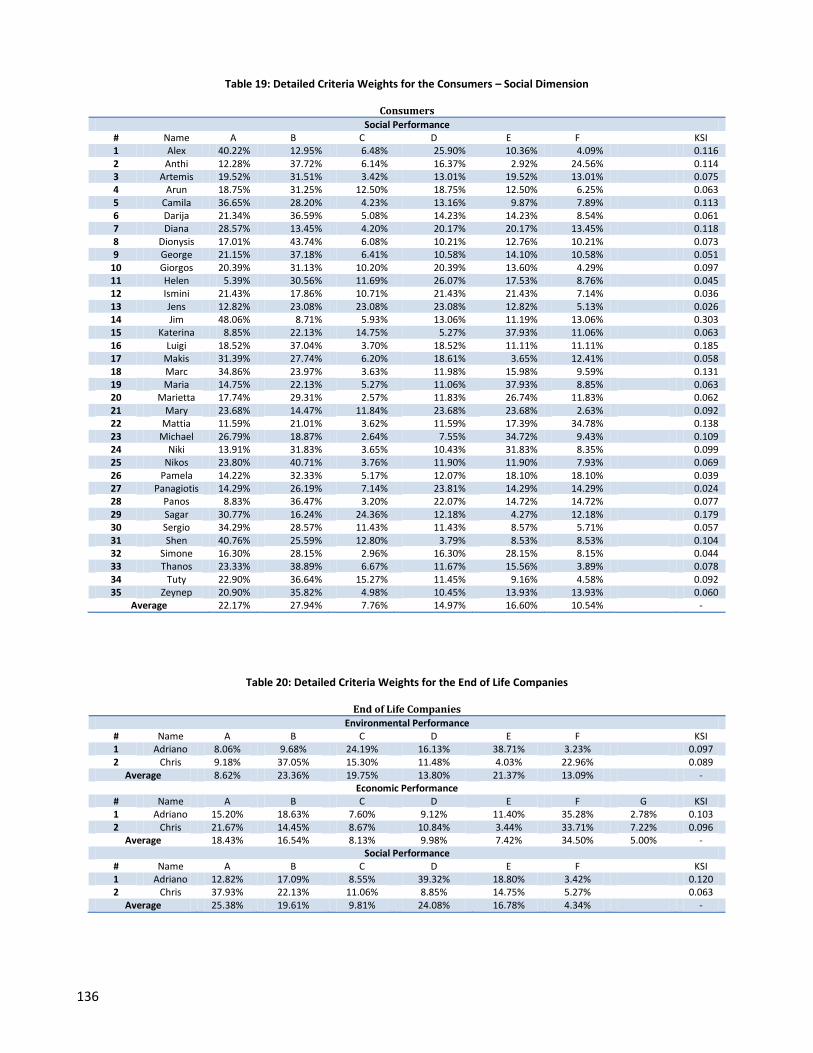
136
Table 19: Detailed Criteria Weights for the Consumers – Social Dimension
Consumers
Social Performance # Name A B C D E F KSI 1 Alex 40.22% 12.95% 6.48% 25.90% 10.36% 4.09% 0.116 2 Anthi 12.28% 37.72% 6.14% 16.37% 2.92% 24.56% 0.114 3 Artemis 19.52% 31.51% 3.42% 13.01% 19.52% 13.01% 0.075 4 Arun 18.75% 31.25% 12.50% 18.75% 12.50% 6.25% 0.063 5 Camila 36.65% 28.20% 4.23% 13.16% 9.87% 7.89% 0.113 6 Darija 21.34% 36.59% 5.08% 14.23% 14.23% 8.54% 0.061 7 Diana 28.57% 13.45% 4.20% 20.17% 20.17% 13.45% 0.118 8 Dionysis 17.01% 43.74% 6.08% 10.21% 12.76% 10.21% 0.073 9 George 21.15% 37.18% 6.41% 10.58% 14.10% 10.58% 0.051
10 Giorgos 20.39% 31.13% 10.20% 20.39% 13.60% 4.29% 0.097 11 Helen 5.39% 30.56% 11.69% 26.07% 17.53% 8.76% 0.045 12 Ismini 21.43% 17.86% 10.71% 21.43% 21.43% 7.14% 0.036 13 Jens 12.82% 23.08% 23.08% 23.08% 12.82% 5.13% 0.026 14 Jim 48.06% 8.71% 5.93% 13.06% 11.19% 13.06% 0.303 15 Katerina 8.85% 22.13% 14.75% 5.27% 37.93% 11.06% 0.063 16 Luigi 18.52% 37.04% 3.70% 18.52% 11.11% 11.11% 0.185 17 Makis 31.39% 27.74% 6.20% 18.61% 3.65% 12.41% 0.058 18 Marc 34.86% 23.97% 3.63% 11.98% 15.98% 9.59% 0.131 19 Maria 14.75% 22.13% 5.27% 11.06% 37.93% 8.85% 0.063 20 Marietta 17.74% 29.31% 2.57% 11.83% 26.74% 11.83% 0.062 21 Mary 23.68% 14.47% 11.84% 23.68% 23.68% 2.63% 0.092 22 Mattia 11.59% 21.01% 3.62% 11.59% 17.39% 34.78% 0.138 23 Michael 26.79% 18.87% 2.64% 7.55% 34.72% 9.43% 0.109 24 Niki 13.91% 31.83% 3.65% 10.43% 31.83% 8.35% 0.099 25 Nikos 23.80% 40.71% 3.76% 11.90% 11.90% 7.93% 0.069 26 Pamela 14.22% 32.33% 5.17% 12.07% 18.10% 18.10% 0.039 27 Panagiotis 14.29% 26.19% 7.14% 23.81% 14.29% 14.29% 0.024 28 Panos 8.83% 36.47% 3.20% 22.07% 14.72% 14.72% 0.077 29 Sagar 30.77% 16.24% 24.36% 12.18% 4.27% 12.18% 0.179 30 Sergio 34.29% 28.57% 11.43% 11.43% 8.57% 5.71% 0.057 31 Shen 40.76% 25.59% 12.80% 3.79% 8.53% 8.53% 0.104 32 Simone 16.30% 28.15% 2.96% 16.30% 28.15% 8.15% 0.044 33 Thanos 23.33% 38.89% 6.67% 11.67% 15.56% 3.89% 0.078 34 Tuty 22.90% 36.64% 15.27% 11.45% 9.16% 4.58% 0.092 35 Zeynep 20.90% 35.82% 4.98% 10.45% 13.93% 13.93% 0.060
Average 22.17% 27.94% 7.76% 14.97% 16.60% 10.54% -
Table 20: Detailed Criteria Weights for the End of Life Companies
End of Life Companies
Environmental Performance # Name A B C D E F KSI 1 Adriano 8.06% 9.68% 24.19% 16.13% 38.71% 3.23% 0.097 2 Chris 9.18% 37.05% 15.30% 11.48% 4.03% 22.96% 0.089
Average 8.62% 23.36% 19.75% 13.80% 21.37% 13.09% - Economic Performance
# Name A B C D E F G KSI 1 Adriano 15.20% 18.63% 7.60% 9.12% 11.40% 35.28% 2.78% 0.103 2 Chris 21.67% 14.45% 8.67% 10.84% 3.44% 33.71% 7.22% 0.096
Average 18.43% 16.54% 8.13% 9.98% 7.42% 34.50% 5.00% - Social Performance
# Name A B C D E F KSI 1 Adriano 12.82% 17.09% 8.55% 39.32% 18.80% 3.42% 0.120 2 Chris 37.93% 22.13% 11.06% 8.85% 14.75% 5.27% 0.063
Average 25.38% 19.61% 9.81% 24.08% 16.78% 4.34% -
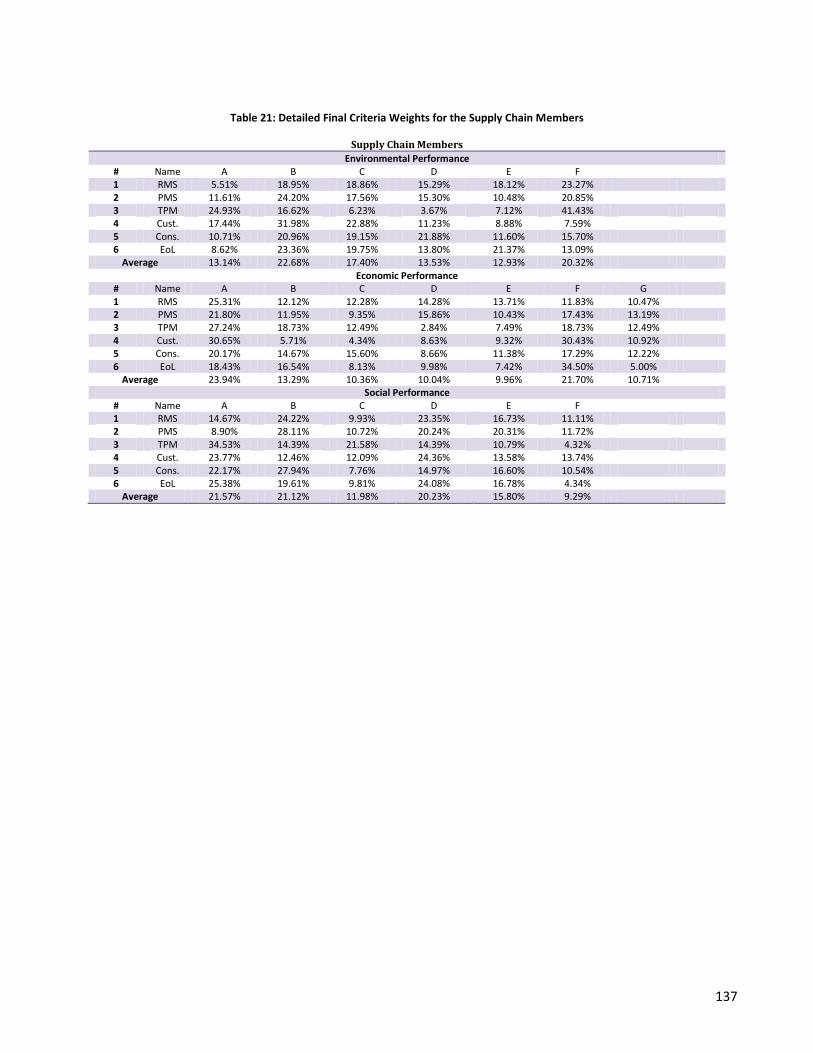
137
Table 21: Detailed Final Criteria Weights for the Supply Chain Members
Supply Chain Members
Environmental Performance # Name A B C D E F 1 RMS 5.51% 18.95% 18.86% 15.29% 18.12% 23.27% 2 PMS 11.61% 24.20% 17.56% 15.30% 10.48% 20.85% 3 TPM 24.93% 16.62% 6.23% 3.67% 7.12% 41.43% 4 Cust. 17.44% 31.98% 22.88% 11.23% 8.88% 7.59% 5 Cons. 10.71% 20.96% 19.15% 21.88% 11.60% 15.70% 6 EoL 8.62% 23.36% 19.75% 13.80% 21.37% 13.09%
Average 13.14% 22.68% 17.40% 13.53% 12.93% 20.32% Economic Performance
# Name A B C D E F G 1 RMS 25.31% 12.12% 12.28% 14.28% 13.71% 11.83% 10.47% 2 PMS 21.80% 11.95% 9.35% 15.86% 10.43% 17.43% 13.19% 3 TPM 27.24% 18.73% 12.49% 2.84% 7.49% 18.73% 12.49% 4 Cust. 30.65% 5.71% 4.34% 8.63% 9.32% 30.43% 10.92% 5 Cons. 20.17% 14.67% 15.60% 8.66% 11.38% 17.29% 12.22% 6 EoL 18.43% 16.54% 8.13% 9.98% 7.42% 34.50% 5.00%
Average 23.94% 13.29% 10.36% 10.04% 9.96% 21.70% 10.71% Social Performance
# Name A B C D E F 1 RMS 14.67% 24.22% 9.93% 23.35% 16.73% 11.11% 2 PMS 8.90% 28.11% 10.72% 20.24% 20.31% 11.72% 3 TPM 34.53% 14.39% 21.58% 14.39% 10.79% 4.32% 4 Cust. 23.77% 12.46% 12.09% 24.36% 13.58% 13.74% 5 Cons. 22.17% 27.94% 7.76% 14.97% 16.60% 10.54% 6 EoL 25.38% 19.61% 9.81% 24.08% 16.78% 4.34%
Average 21.57% 21.12% 11.98% 20.23% 15.80% 9.29%

138
VI. Assigning Scores to Package Alternatives
In the tables below the relative scores of the package alternatives are presented according to the decision-maker,
the Head of Packaging Europe, Mr. Guus Lueb. The total scores are also presented.
Table 22: Package Alternatives Scores for Heinz Tomato Ketchup
Heinz Tomato Ketchup
Environmental Performance # Name A B C D E F Total Scores 1 PET 7 6 3 3 3 5 4.61 2 Glass 3 4 6 8 7 4 5.15 3 SOM 6 5 4 6 3 6 5.04 4 Sachet 5 6 3 5 2 6 4.69 5 SqueezMe! 4 4 3 4 2 4 3.57 6 Dip Pot 4 3 2 3 2 4 3.03
Economic Performance # Name A B C D E F G Total Scores 1 PET 6 8 9 6 8 8 6 7.210 2 Glass 5 4 6 5 4 5 4 4.764 3 SOM 7 4 9 8 7 7 8 7.016 4 Sachet 4 5 7 7 5 8 4 5.713 5 SqueezMe! 4 3 4 4 2 4 2 3.454 6 PET 4 4 6 4 2 5 6 4.439
Social Performance # Name A B C D E F Total Scores 1 PET 8 8 8 8 8 9 8.09 2 Glass 4 8 7 9 6 6 6.72 3 SOM 8 8 7 9 8 8 8.08 4 Sachet 7 7 6 9 8 6 7.35 5 SqueezMe! 7 6 6 9 8 7 7.23 6 PET 6 6 5 9 6 7 6.58
Table 23: Package Alternatives Scores for Heinz Seriously Good Mayonnaise
Heinz Seriously Good Mayonnaise
Environmental Performance # Name A B C D E F Total Scores 1 PET 7 6 3 3 3 5 4.61 2 Jar 3 4 6 8 7 4 5.15 3 SOM 6 5 4 6 3 6 5.04 4 Sachet 5 6 3 5 2 6 4.69 5 SqueezMe! 4 4 3 4 2 4 3.57 6 Dip Pot 4 3 2 3 2 4 3.03
Economic Performance # Name A B C D E F G Total Scores 1 PET 3 8 9 6 8 7 2 5.85 2 Jar 6 4 6 5 4 6 8 5.65 3 SOM 8 4 9 8 7 7 8 7.26 4 Sachet 8 5 7 7 5 8 8 7.10 5 SqueezMe! 6 3 4 4 2 4 7 4.47 6 PET 7 4 6 4 2 5 7 5.26
Social Performance # Name A B C D E F Total Scores 1 PET 8 8 6 8 8 9 7.85 2 Jar 4 8 8 9 6 6 6.84 3 SOM 8 8 8 9 8 8 8.20 4 Sachet 7 7 8 9 8 6 7.59 5 SqueezMe! 7 6 7 9 8 7 7.35 6 PET 6 6 8 9 6 7 6.94
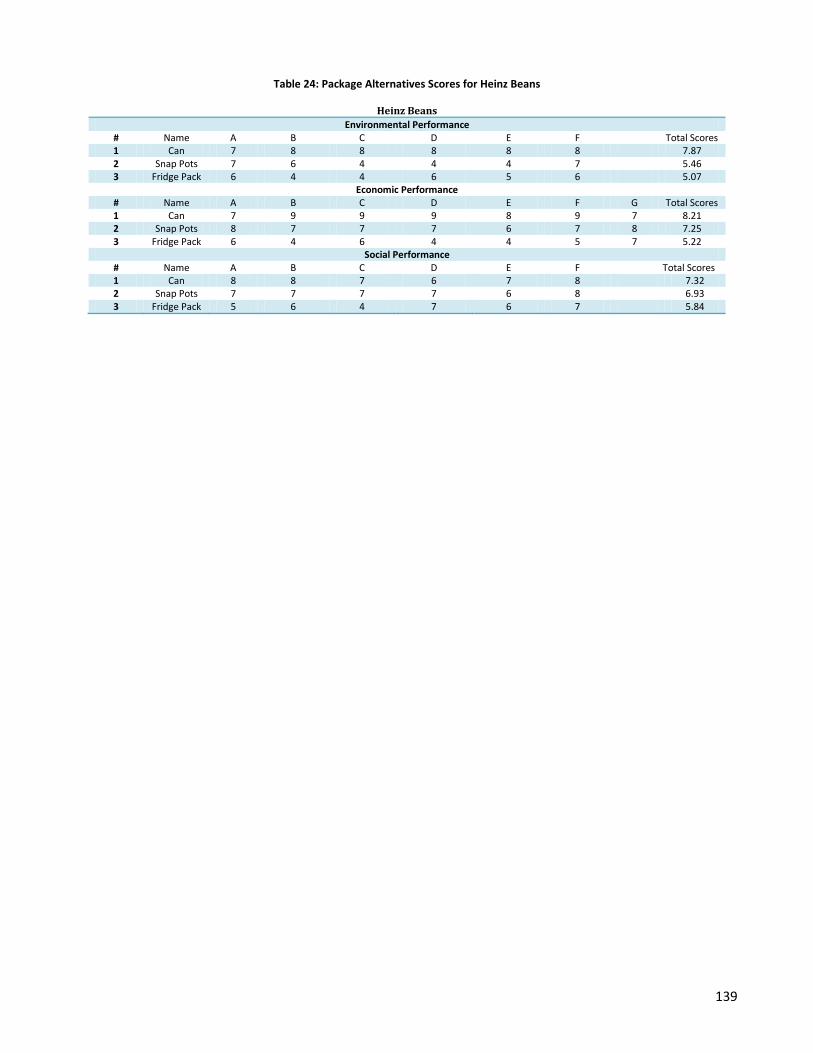
139
Table 24: Package Alternatives Scores for Heinz Beans
Heinz Beans
Environmental Performance # Name A B C D E F Total Scores 1 Can 7 8 8 8 8 8 7.87 2 Snap Pots 7 6 4 4 4 7 5.46 3 Fridge Pack 6 4 4 6 5 6 5.07
Economic Performance # Name A B C D E F G Total Scores 1 Can 7 9 9 9 8 9 7 8.21 2 Snap Pots 8 7 7 7 6 7 8 7.25 3 Fridge Pack 6 4 6 4 4 5 7 5.22
Social Performance # Name A B C D E F Total Scores 1 Can 8 8 7 6 7 8 7.32 2 Snap Pots 7 7 7 7 6 8 6.93 3 Fridge Pack 5 6 4 7 6 7 5.84
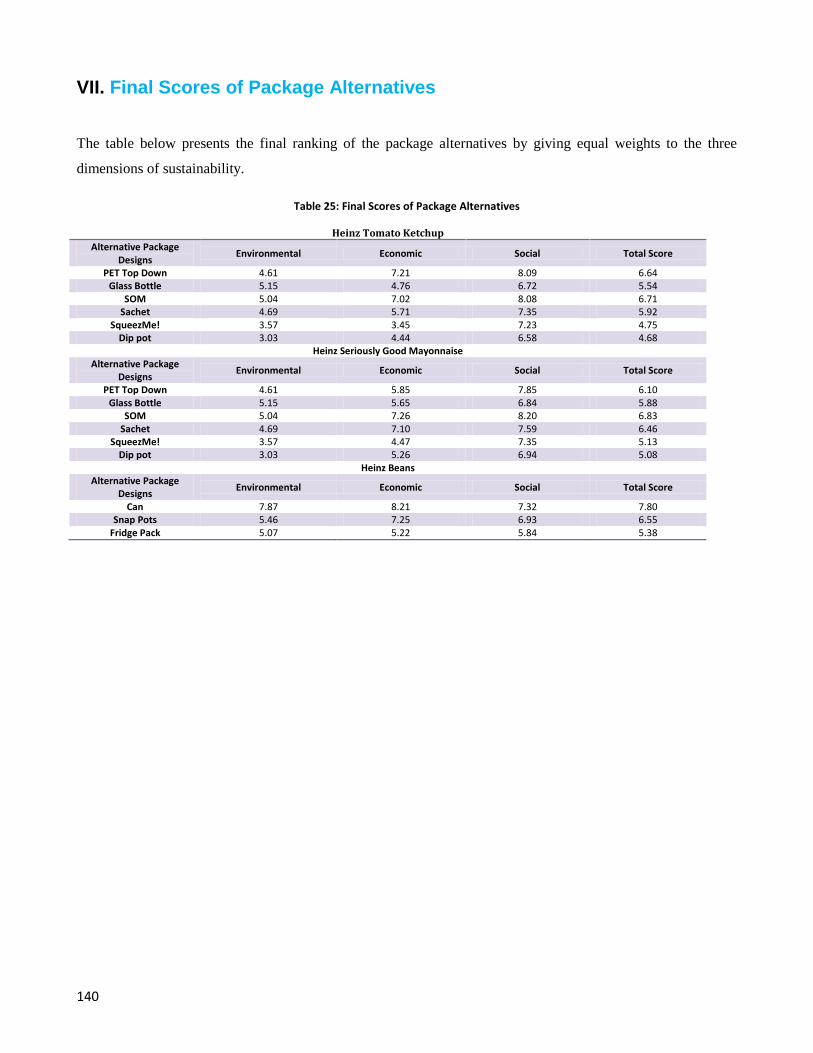
140
VII. Final Scores of Package Alternatives
The table below presents the final ranking of the package alternatives by giving equal weights to the three
dimensions of sustainability.
Table 25: Final Scores of Package Alternatives
Heinz Tomato Ketchup
Alternative Package Designs
Environmental Economic Social Total Score
PET Top Down 4.61 7.21 8.09 6.64 Glass Bottle 5.15 4.76 6.72 5.54
SOM 5.04 7.02 8.08 6.71 Sachet 4.69 5.71 7.35 5.92
SqueezMe! 3.57 3.45 7.23 4.75 Dip pot 3.03 4.44 6.58 4.68
Heinz Seriously Good Mayonnaise Alternative Package
Designs Environmental Economic Social Total Score
PET Top Down 4.61 5.85 7.85 6.10 Glass Bottle 5.15 5.65 6.84 5.88
SOM 5.04 7.26 8.20 6.83 Sachet 4.69 7.10 7.59 6.46
SqueezMe! 3.57 4.47 7.35 5.13 Dip pot 3.03 5.26 6.94 5.08
Heinz Beans Alternative Package
Designs Environmental Economic Social Total Score
Can 7.87 8.21 7.32 7.80 Snap Pots 5.46 7.25 6.93 6.55
Fridge Pack 5.07 5.22 5.84 5.38
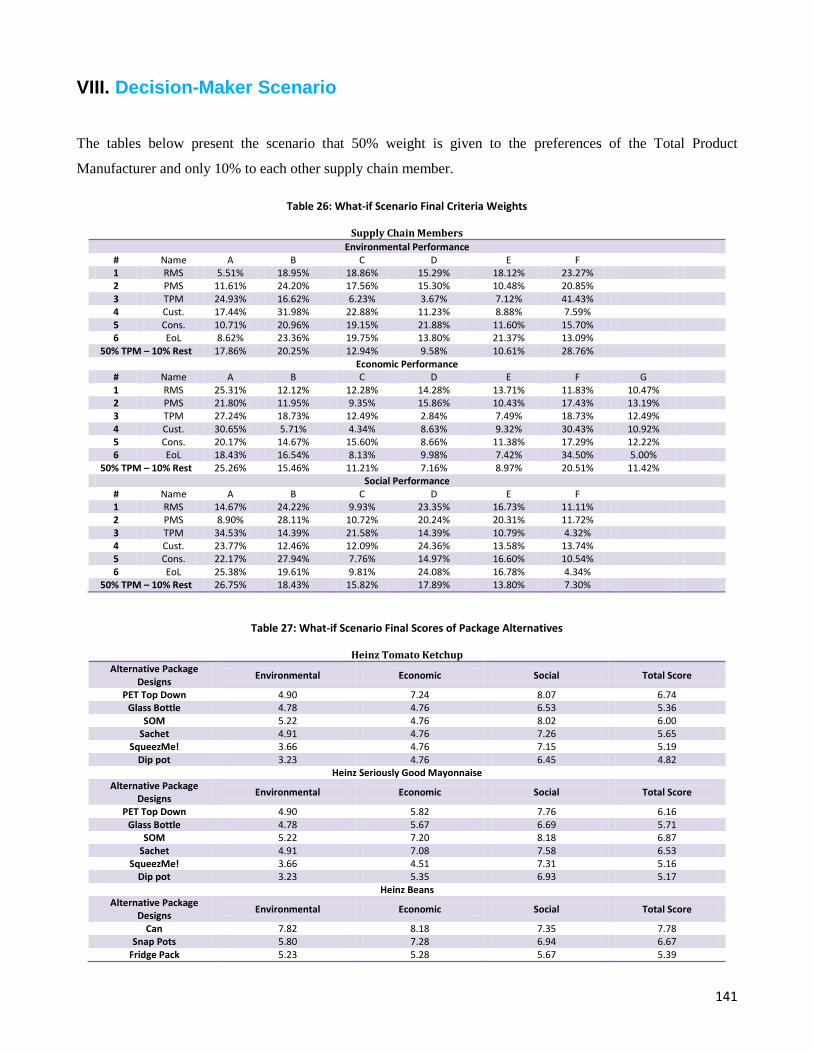
141
VIII. Decision-Maker Scenario
The tables below present the scenario that 50% weight is given to the preferences of the Total Product
Manufacturer and only 10% to each other supply chain member.
Table 26: What-if Scenario Final Criteria Weights
Supply Chain Members
Environmental Performance # Name A B C D E F 1 RMS 5.51% 18.95% 18.86% 15.29% 18.12% 23.27% 2 PMS 11.61% 24.20% 17.56% 15.30% 10.48% 20.85% 3 TPM 24.93% 16.62% 6.23% 3.67% 7.12% 41.43% 4 Cust. 17.44% 31.98% 22.88% 11.23% 8.88% 7.59% 5 Cons. 10.71% 20.96% 19.15% 21.88% 11.60% 15.70% 6 EoL 8.62% 23.36% 19.75% 13.80% 21.37% 13.09%
50% TPM – 10% Rest 17.86% 20.25% 12.94% 9.58% 10.61% 28.76% Economic Performance
# Name A B C D E F G 1 RMS 25.31% 12.12% 12.28% 14.28% 13.71% 11.83% 10.47% 2 PMS 21.80% 11.95% 9.35% 15.86% 10.43% 17.43% 13.19% 3 TPM 27.24% 18.73% 12.49% 2.84% 7.49% 18.73% 12.49% 4 Cust. 30.65% 5.71% 4.34% 8.63% 9.32% 30.43% 10.92% 5 Cons. 20.17% 14.67% 15.60% 8.66% 11.38% 17.29% 12.22% 6 EoL 18.43% 16.54% 8.13% 9.98% 7.42% 34.50% 5.00%
50% TPM – 10% Rest 25.26% 15.46% 11.21% 7.16% 8.97% 20.51% 11.42% Social Performance
# Name A B C D E F 1 RMS 14.67% 24.22% 9.93% 23.35% 16.73% 11.11% 2 PMS 8.90% 28.11% 10.72% 20.24% 20.31% 11.72% 3 TPM 34.53% 14.39% 21.58% 14.39% 10.79% 4.32% 4 Cust. 23.77% 12.46% 12.09% 24.36% 13.58% 13.74% 5 Cons. 22.17% 27.94% 7.76% 14.97% 16.60% 10.54% 6 EoL 25.38% 19.61% 9.81% 24.08% 16.78% 4.34%
50% TPM – 10% Rest 26.75% 18.43% 15.82% 17.89% 13.80% 7.30%
Table 27: What-if Scenario Final Scores of Package Alternatives
Heinz Tomato Ketchup
Alternative Package Designs
Environmental Economic Social Total Score
PET Top Down 4.90 7.24 8.07 6.74 Glass Bottle 4.78 4.76 6.53 5.36
SOM 5.22 4.76 8.02 6.00 Sachet 4.91 4.76 7.26 5.65
SqueezMe! 3.66 4.76 7.15 5.19 Dip pot 3.23 4.76 6.45 4.82
Heinz Seriously Good Mayonnaise Alternative Package
Designs Environmental Economic Social Total Score
PET Top Down 4.90 5.82 7.76 6.16 Glass Bottle 4.78 5.67 6.69 5.71
SOM 5.22 7.20 8.18 6.87 Sachet 4.91 7.08 7.58 6.53
SqueezMe! 3.66 4.51 7.31 5.16 Dip pot 3.23 5.35 6.93 5.17
Heinz Beans Alternative Package
Designs Environmental Economic Social Total Score
Can 7.82 8.18 7.35 7.78 Snap Pots 5.80 7.28 6.94 6.67
Fridge Pack 5.23 5.28 5.67 5.39

142