Embed Size (px)
Citation preview
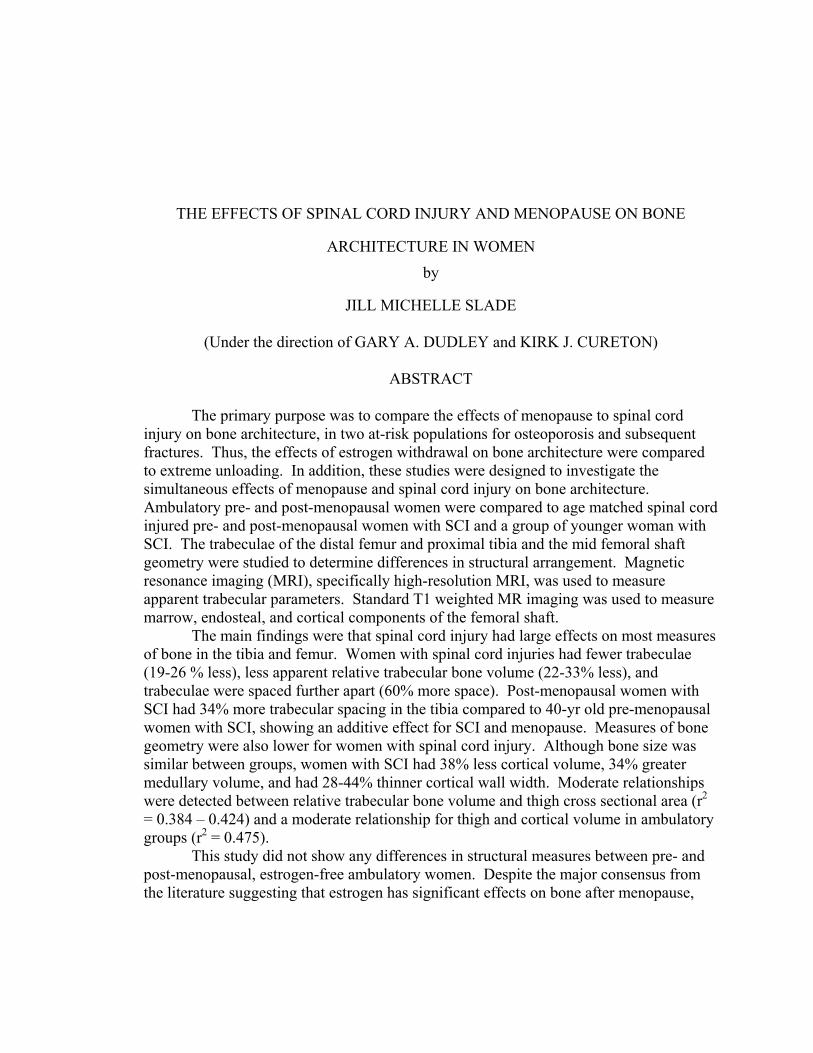
THE EFFECTS OF SPINAL CORD INJURY AND MENOPAUSE ON BONE
ARCHITECTURE IN WOMEN
by
JILL MICHELLE SLADE
(Under the direction of GARY A. DUDLEY and KIRK J. CURETON)
ABSTRACT
The primary purpose was to compare the effects of menopause to spinal cord injury on bone architecture, in two at-risk populations for osteoporosis and subsequent fractures. Thus, the effects of estrogen withdrawal on bone architecture were compared to extreme unloading. In addition, these studies were designed to investigate the simultaneous effects of menopause and spinal cord injury on bone architecture. Ambulatory pre- and post-menopausal women were compared to age matched spinal cord injured pre- and post-menopausal women with SCI and a group of younger woman with SCI. The trabeculae of the distal femur and proximal tibia and the mid femoral shaft geometry were studied to determine differences in structural arrangement. Magnetic resonance imaging (MRI), specifically high-resolution MRI, was used to measure apparent trabecular parameters. Standard T1 weighted MR imaging was used to measure marrow, endosteal, and cortical components of the femoral shaft.
The main findings were that spinal cord injury had large effects on most measures of bone in the tibia and femur. Women with spinal cord injuries had fewer trabeculae (19-26 % less), less apparent relative trabecular bone volume (22-33% less), and trabeculae were spaced further apart (60% more space). Post-menopausal women with SCI had 34% more trabecular spacing in the tibia compared to 40-yr old pre-menopausal women with SCI, showing an additive effect for SCI and menopause. Measures of bone geometry were also lower for women with spinal cord injury. Although bone size was similar between groups, women with SCI had 38% less cortical volume, 34% greater medullary volume, and had 28-44% thinner cortical wall width. Moderate relationships were detected between relative trabecular bone volume and thigh cross sectional area (r2
= 0.384 – 0.424) and a moderate relationship for thigh and cortical volume in ambulatory groups (r2 = 0.475).
This study did not show any differences in structural measures between pre- and post-menopausal, estrogen-free ambulatory women. Despite the major consensus from the literature suggesting that estrogen has significant effects on bone after menopause,

particularly trabecular bone, these studies did not show differences in bone structure in 40-50 year old pre-menopausal women compared to 50-63 year old estrogen-free women, approximately 8 years post-menopause. INDEX WORDS: Trabecular bone, Microarchitecture, Bone geometry, Cortical bone,
Spinal cord injury, Menopause, Estrogen loss, Unloading, Skeletal muscle, Magnetic resonance imaging
THE EFFECTS OF SPINAL CORD INJURY AND MENOPAUSE
ON BONE ARCHITECTURE IN WOMEN
by
Jill Michelle Slade B.S., Ohio University, 1998
M.A. University of Georgia, 2000
A Dissertation Submitted to the Graduate Faculty of the University of Georgia in Partial
Fulfillment of the Requirements for the Degree
DOCTOR OF PHILOSOPHY
ATHENS, GEORGIA
2003

2003
Jill Michelle Slade
ALL RIGHTS RESERVED
THE EFFECTS OF SPINAL CORD INJURY AND MENOPAUSE
ON BONE ARCHITECTURE IN WOMEN
by
JILL MICHELLE SLADE
Major Professor: Gary A. Dudley
Kirk J. Cureton
Committee: Michael Ferrara Richard D. Lewis Kevin K. McCully
Electronic Version Approved Maureen Grasso Dean of the Graduate School The University of Georgia August 2003
iv
ACKNOWLEDGEMENTS
The generosity of many contributed to the development and completion of this work.
This work never would have been started without Gary A. Dudley. Your work has
encouraged me for many years and I will always admire your approach to science and
your inquisition. Your persistence and diligence among individuals with spinal cord
injury and within the field of muscle biology is nothing but extraordinary. It has been my
pleasure to have the opportunity to spend my final years at UGA with you. Thank you
for all your patience and your support.
The work here required assistance from the Muscle Biology lab, C. Scott Bickel, Chris
Elder, Ed Mahoney, and Ashraf Gorgey. I cannot remember one occasion in which any
of you did not have time to help me with this project. Scott, you have been there from
the beginning of our adventures in bone. Thank you for your assistance and the endless
hours you gave up to help with this project. I have enjoyed working with you and
appreciate everything you have done with me and for me in the past three years.
The Shepherd Center provided financial support for this project and the project could not
have been completed without their patients. Leslie Van Hiel, thank you for your work on
this project and all the support you have given me over the last three years, I needed it!
The bone projects completed in the Muscle Biology lab at the University of Georgia
would be inexistent without the influence of Chris Modleskly. I am quite fortunate to
have the opportunity to build off your existing work here.
My committee members have all been supportive during my tenure here at UGA,
including this past year. Kevin McCully, you have always been excited and willing to
v
discuss new ideas, especially with respect to this project. I am grateful for all the time
you gave up at times when I really needed it. Kirk Cureton, you have always been
available for me regardless of time or work schedule. I appreciate your willingness to
serve as committee chair and to keep me on track to graduate. Thank you for all your
time and answers over the past five years. Mike Ferrara, I appreciate your enthusiasm
throughout the past year and appreciate your involvement on my committee. Your time
and input has been helpful. Rick Lewis, thank your for your willingness to be part of my
dissertation. Your insight into bone was much needed and is much appreciated.
I am blessed to have so many friends that provided me with support: Thanks to you
Nicole Puckett, Heather Heuntelman, Laura Hahn, Michelle Turk, Darby Petitt, Jennifer
Olive, and Emma Laing.
My family, you have always provided me with support in my academic endeavors and
have never questioned my endless years of schooling. K, I would not have made it
through these years without you. Simply put, you are the best. Mom and dad, thanks for
all your love and support every week, month, and year. M, you are my number one fan
and I will always be grateful for your support and cheers for as long as I can remember.
Mikey Hanaghan, who is just like family to me, thanks for putting up with my struggles
these past five years, I am lucky to have all your support. Lastly, of course, I know that
my nephews have all been “screaming” for me, thank you Alexander, Ethan, and Bobby.
Your innocence and laughter have provided the ultimate source of encouragement.
This work was funded by the Shepherd Center and the Biomedical and Health Science
Institute at the University of Georgia.
vi
TABLE OF CONTENTS
Page
ACKNOWLEDGEMENTS............................................................................................... iv
CHAPTER
I. INTRODUCTION................................................................................................1
Specific Aims...................................................................................................6
Hypotheses.......................................................................................................6
Significance of the Study .................................................................................7
Limitations of the Study...................................................................................8
II. REVIEW OF THE LITERATURE......................................................................9
Basic Anatomy and Physiology of Bone .........................................................9
Magnitude of Changes in Bone Under Different Conditions ........................12
Physiology of Primary Osteoporosis due to Estrogen Loss...........................21
Physiology of Secondary Osteoporosis due to Traumatic SCI......................22
Prevalence of Osteoporosis and Incidence of Fractures ................................24
Importance of Trabeculae and Bone Geometry .............................................25
Magnetic Resonance Imaging of Bone Structure ..........................................27
III. TRABECULAR BONE IS MORE DETERIORATED IN SPINAL CORD
INJURED VS ESTROGEN-FREE POSTMENOPAUSAL WOMEN .............32
Abstract ..........................................................................................................33
Introduction....................................................................................................34
Methods..........................................................................................................37
vii
Results............................................................................................................41
Discussion......................................................................................................43
IV. GEOMETRY OF THE MID FEMUR IS ALTERED AFTER
SPINAL CORD INJURY, BUT NOT EIGHT YEARS AFTER
MENOPAUSE IN ESTROGEN-FREE WOMEN ............................................65
Abstract ..........................................................................................................66
Introduction....................................................................................................67
Methods..........................................................................................................69
Results............................................................................................................72
Discussion......................................................................................................75
V. SUMMARY.......................................................................................................89
LITERATURE CITED ..................................................................................................91
1
CHAPTER I
INTRODUCTION
Estrogen loss and reduced physical activity and/or unloading have large
influences on bone loss. The difference in the magnitude of bone loss under these
conditions, has not thoroughly been evaluated. Studies have verified a direct influence of
estrogen withdrawal on bone (see Manolagas 2000). Research has also shown the large
influence of loading on bone mass (Rubin and Lanyon, 1985) as well as unloading of
bone that occurs with hindlimb suspension models, bed rest, and spinal cord injury (see
Giangregorio and Blimkie, 2002; Uebelhart et al., 1995). Following a complete spinal
cord injury (SCI), individuals experience what may be the most extreme form of
unloading. As there is no cure to repair the injured cord for persons afflicted with
complete SCI, persons suffering from SCI are immediately and permanently immobilized
below the level of injury.
Spinal cord injury affects approximately 500,000 individuals (Phillips et al.
1998). Improved treatment following spinal cord injury has prolonged the average life
span, but this population is faced with numerous secondary health complications. One of
these secondary health complications is osteoporosis, prevalent in affected regions (e.g.
lower limbs) in most all patients with complete loss of motor control (Claus-Walker and
Halstead 1982). Patients with complete lesions experience staggering losses in bone
mineral content, 20-25 % in the femoral shaft, composed primarily of cortical bone, and
~60% in the proximal tibia, an area with a high proportion of trabecular bone
2
(Biering-Sorensen et al. 1990). These losses contribute to the high fracture incidence and
risk associated with SCI, 5- and 23-fold increased fracture risk in the lower limb and
thigh, respectively (Vestergaard et al. 1998).
Skeletal structure in women following menopause is also threatened, with the
largest declines in bone reported to occur during the first five years following menopause.
Following menopause, withdrawal of estrogen results in greater resorption of bone
compared to bone formation resulting in bone loss (See Manolagas 2000; Seeman 2002).
Osteoporosis (bone mineral density greater than 2.5 standard deviations below a
reference sex and race matched 30-yr old value) and osteopenia (bone mineral density
between 1 and 2.5 standard deviations below the reference value) occurs in a large
percentage of Caucasian women over 50 years old (20-50%) (Looker et al., 1995). It is
predicted that 40% of post-menopausal able-bodied women (age ≥ 50 years) will
experience one or more fractures (Melton et al., 1992). Individuals with SCI also have
very high rates of osteoporosis. Fracture rate within the SCI population has been
reported to be as high as ~35% (Frisbie 1997; Krause 2000). Although the primary
mechanisms behind the loss of bone are different in spinal cord injury and menopause,
fracture incidence is similar between these two populations.
While areal bone mineral density (aBMD) has been thoroughly evaluated
following SCI and menopause and is the current surrogate measure of osteoporosis,
aBMD does not indicate structural changes in trabecular architecture or bone geometry.
In addition, there is an overlap in those that fracture and those that do not with similar
levels of aBMD (Cummings 1985). These differences may be explained by altered
architecture. Changes in trabecular structures are also important because lost structures
3
may not be regained (Parfitt 1987). Interestingly, the meaning of osteoporosis stresses
the importance of trabecular architecture: a disease characterized by low bone mass and
microarchitectural deterioration of bone tissue, leading to enhanced bone fragility and a
consequent increase in fracture risk (1991). Therefore both aBMD and structural changes
are important components that contribute to bone strength and health, although the
former has received more attention.
The trabecular architecture following menopause may be different compared to
the microarchitectural changes observed with SCI. Through the analysis of bone
specimen, Thomsen et al. (2002) reported that the horizontal trabeculae from lumber
vertebrae are preferentially affected by age shown as a greater relative decline in
horizontal compared to vertical trabeculae. This possibly occurs due to the continued
compressive load on vertical trabeculae. Following SCI, the trabeculae in all planes are
likely to be affected because there is an absence of loading throughout the affected
bone(s) for patients with a complete injury. Trabecular architecture in males with a
complete chronic SCI is diminished compared to age-, height-, weight-, and race-matched
ambulatory males (unpublished data). Trabecular number and trabecular bone volume
were 18-26% and ~20% lower for the distal femur and proximal tibia, respectively,
compared to an ambulatory group. In females with SCI, bone decrements may be further
exacerbated with menopause, which could expose them to more deteriorated bone then is
observed with either SCI or menopause. Recent evidence suggests this may occur. A
study by Garland et al. (Garland et al. 2001) showed that aBMD is significantly lower for
postmenopausal women with and without SCI at the knee. The effect of menopause and
SCI on bone architecture of females has not been determined.

4
Bone architecture can be measured by cutting sections from whole specimen,
through bone biopsies or in vivo, non-invasively by using imaging techniques such as
high resolution magnetic resonance imaging (hrMRI). The measurement of bone
architecture via hrMRI has recently been developed for the knee (Beuf et al. 2002), which
is ideal for SCI because this is the site of numerous fractures. This allows for the
acquisition and measurement of small structures (195 x 195 micrometers), approximately
the size of trabeculae (Beuf et al. 2002; Majumdar et al. 1996). Measuring these
components allows a direct measure of microarchitecture that is representative of a large
region (in comparison to biopsy techniques). In addition, changes over time can be
evaluated in the same area as the structures are left intact following imaging.
Importantly, MR images have also only recently been used to determine cortical bone
architecture (cortical volume and cortical widths as well as medullary cavity size)
(Woodhead et al. 2001). In a recent study, our laboratory found that cortical bone
geometry of the mid femur deteriorated after SCI (unpublished results). Males with long
term SCI had 23% less cortical volume compared to the control group and a specific loss
in posterior cortical width, the site of several skeletal muscle insertions. Cortical bone
parameters are important components in the calculation of several measures of bone
strength (for example, cross sectional moment of inertia).
The relation of muscle mass to bone has not been confirmed by examining muscle
cross sectional area from MR images. This relation is particularly important for
interventions that attempt to increase muscle size and bone structures through resistance
exercise. Muscle mass is diminished to ~50% of able-bodied individuals as early as 6
months following SCI (Castro et al. 1999a; Castro et al. 1999b). Most previous
5
interventions to alter bone after SCI through exercise or standing have not altered the size
of the affected muscle, which may explain the null or minimal changes in bone (BeDell et
al. 1996; Bloomfield et al. 1996; Leeds et al. 1990; Mohr et al. 1997). However, the
relationship between cortical bone volume and trabecular bone parameters has not been
reported in either ambulatory of SCI individuals.
Currently, the high-resolution imaging of trabeculae requires extensive scanning
time (~45 minutes to image the tibia and femur, barring any movement during the scan)
and analysis time. Similar to other MR imaging, movement is prohibited during
acquisition. Image quality also affects the accuracy of the analysis and requires a clear
image. If the image is not clear, the scan has to be redone or the data/subject discarded.
This increases scanning time and costs, and therefore, is an important facet to consider
when using hrMRI for measuring bone. Using standard T1 weighted MR imaging to
measure bone geometry is less expensive both in terms of time and money. The scan
takes ~5 – 10 minutes and the analyses programs are available through various software,
for example Xvessel or NIH Image. The analysis program for trabeculae is not available
for purchase at this time and is only available through a single research group. In
addition, the hrMRI also mandates a bilateral phase array coil. If the cortical bone
declines reflect changes that are also occurring at cancellous sites, perhaps the measures
of bone geometry in the cortical bone with standard MR imaging can be used to predict
the deterioration in the trabecular bone (bone volume fraction). The value of using
hrMRI compared to standard MR imaging warrants investigation.
6
Specific Aims
The specific aims of this project are:
1) To compare the effect of SCI and menopause on bone architecture in women,
specifically on trabecular bone and bone geometry in the femur and tibia
2) To determine if SCI and menopause have an additive effect on bone architecture
3) To determine the relationship between skeletal muscle and bone using MR imaging
4) To determine the benefit of using high-resolution MR imaging compared to standard
MR imaging.
Hypotheses
It is hypothesized that trabecular and cortical architecture are markedly
diminished following SCI and diminished following menopause in women. In addition,
it is hypothesized that menopause and SCI have an additive effect on bone architecture.
This will be reflected statistically in main effects for both menopause status and
ambulatory status without an interaction between ambulation and menopause.
Diminished trabecular architecure includes fewer trabeculae, thinner trabeculae,
greater trabecular spacing, and lower bone volume fraction. Diminished cortical
architecture includes less cortical volume, less cortical width (anterior, posterior, medial,
lateral), and greater medullary cavity width and volume.
The specific hypotheses related to bone architecture are as follows:
1. SCI pre and post-menopausal females have diminished trabecular architecture, and
cortical architecture compared to the ambulatory pre- and post-menopausal groups.
7
2. Ambulatory post-menopausal females have diminished trabecular and cortical
architecture compared to the ambulatory pre-menopausal group.
3. Post-menopausal women with SCI have diminished trabecular architecture and
cortical architecture compared to pre-menopausal with SCI.
4. For the SCI groups, there is a significant site affect for cortical bone differences in the
posterior site compared to the ambulatory groups.
5. Thigh muscle volume has a positive correlation with cortical bone volume of the
femur.
6. Thigh muscle cross sectional area is positively correlated to the trabecular bone
volume and number in the proximal tibia and distal femur.
7. Distal femur trabecular bone volume fraction is significantly related to cortical bone
cross sectional area in the femoral shaft.
Significance of the study
The individuals in this study are all at risk for osteoporosis: women, SCI, and
postmenopausal individuals. Furthermore, fracture rates are similar in post-menopausal
women and spinal cord injured individuals. The mechanism for bone decline following
SCI and menopause are markedly different (unloading vs. estrogen withdraw). Females
with a spinal cord injury who are post-menopause may also be prone to added risks of
fracture compared to their pre-menopausal counterpart. The significance of this study is
that it increases the understanding of bone biology under estrogen withdrawal that occurs
with menopause independently and in combination with the influence of unloading that
8
occurs following spinal cord injury. Trabeculae have not been studied in females with
SCI and have not been examined in relation to cortical bone and muscle size.
Limitations of the study
In vivo analysis of trabecular bone is just now emerging and continues to be
revised and improved. Currently, the slice thickness results in partial volume effects,
capturing only larger trabeculae and measures of anisotropy of the trabeculae can not be
measured at this site. Therefore, specific plane differences in trabeculae cannot be
directly determined. In vivo high resolution imaging currently can only be performed on
the calcaneous, radius and the knee. While these are optimal areas to evaluate for
individuals with SCI as they are associated with many fractures, post-menopausal women
typically incur fractures to the spine, hip, or radius. This is a known limitation with in
vivo hrMRI. High resolution MRI is extremely reliable, but the methodology is
associated with moderate measurement accuracy, particularly for trabecular thickness.
The design of the study is another limitation, as data from cross sectional study designs
are not as robust compared to repeated measures designs and therefore error variance due
to individual variation will be greater.

9
CHAPTER II
REVIEW OF THE LITERATURE
In this chapter, topics are reviewed that include basic bone anatomy, and changes to
bone, risks, and incidences of fractures after menopause and SCI as well as the
significance of bone architecture and the use of magnetic resonance imaging in bone.
1) Basic Anatomy and Physiology of Bone
2) Magnitude of Changes in Bone Under Different Conditions
3) Physiology of Primary Osteoporosis due to Estrogen Loss
4) Physiology of Secondary Osteoporosis due to Traumatic SCI
5) Prevalence of Osteoporosis and Incidence of Fractures
6) Importance of Trabeculae and Bone Geometry
7) Magnetic Resonance Imaging of Bone Structure
Basic Anatomy and Physiology of Bone
There are two principle types of bone: cortical and trabecular bone. Cortical bone
is more mineralized (~85%) compared to trabecular bone (15 –25%), which is associated
with the structure and architecture of each type (Baron 1999). The internal surface of
bone is the endosteal and the external the periosteal surface. Endosteal bone surface area
is substantially greater for trabecular bone, important because remodeling tends to occur
in bone close to marrow or endosteal bone (Frost 1999). The average turnover of bone
10
therefore is substantially greater for trabecular bone. Trabecular bone is generally
located in the ends of long bones and in flat bones whereas cortical bone is located
throughout the shaft of long bones and on the outer surfaces of flat bones and ends of
long bones. Specifically, the lumbar spine has 66%, the femoral neck and distal radius
have 25%, and the calcaneous has ~90% trabecular bone, the rest comprised of cortical
bone (Mundy 2002; Ouyang et al. 1998). Apparent trabecular measures can be
determined including number (app.Tb.N), relative bone volume (app.BV/TV), separation
or space between structures (app.Tb.S), and wall thickness (app.Tb.Th). Measures along
the shaft of long bones include volume of the medullary cavity, endosteal, and cortical
bone regions as well as widths of each region.
Bone change or remodeling occurs following maturation, where bone is broken
down by osteoclasts, formed by osteoblasts, and maintained by osteocytes. It is not clear
why remodeling occurs, but has been suggested to occur to repair fatigue damage and
prevent excessive aging and/or replace old bone (Manolagas 2000). During bone
maintenance, osteoblastic activity is approximately equivalent to osteoblastic activity and
bone levels are constant. During bone loss, osteoclastic activity may increase by
activating more cells or by increasing resorption depth. Bone maintenance and
adaptations primarily occur by a mechanism known as mechanotransduction.
Mechanotransduction is a process that transfers the mechanical strain or load on the bone
to the cells that stimulate bone growth (Bloomfield 2001; Duncan and Turner 1995; Frost
1987). Fluid movement within bone units (caniliculae) appears to be essential for
mechanotransduction. A load on the bone is sensed on bone cells (probably osteocytes),
which causes an ion shift or depolarization. This leads to a cascade of events, including
11
activation of signaling proteins and eventual activation of osteoblasts. During dynamic
loading, fluid is also shifted inside the bone. It has been suggested that fluid movement
or a change in pressure in vessels supplying bones may be an important and necessary
component in mechanotransduction. The muscle action on the bone appear to have a
significant effect on bone maintenance or bone losses and gains. However, the process of
mechanostransduction is influenced by several factors, thus even if loading and
mechanotransduction is occurring, bone may not be maintained.
A multitude of factors influence bone growth and remodeling, besides loading.
These include both modifiable and non-modifiable determinants. Among the modifiable
determinants, dietary intake and supplementation of calcium and vitamin D have shown
to contribute to bone health (Dawson-Hughes 1996; Dawson-Hughes et al. 1995; Lewis
and Modlesky 1998). Lifestyle behaviors, especially low activity levels and heavy
smoking are associated with lower levels of bone mass (Kahn 2001). Non-modifiable
factors such as race, sex, bone structure or frame and family history of osteoporosis may
have larger influences on bone. Females that are Caucasian or Asian, with small body
size and low body weight and those that have mothers with osteoporosis are probably at
the highest risk (1994). In addition, chronic corticosteroid use is linked with low bone
mass along with hyperthyroidism and other bone disorders. Estrogen has also been
shown to have effects on remodeling (Ito et al. 2002; Manolagas 2000) and may play a
key role in mechanotransduction and the bone’s responsiveness to loading (Cheng et al.
1997; Cheng et al. 1996; Kohrt et al. 1995). In summary, bone is primarily maintained
by loading and mechanotransduction, but is influenced by a variety of individual and
environmental factors, particularly estrogen.
12
Magnitude of Changes in Bone Under Different Conditions
Bone changes after Menopause
Skeletal structure in women following menopause is reported to undergo
substantial changes. Bone reaches a peak level between the ages of 20 and 30 and begins
a slow, age-related decline after ~30 years of age. The first years following menopause
are purported to be the years when bone loss is the greatest (Ahlborg et al. 2001; Lindsay
1988). According to the World Health Organization technical report on osteoporosis,
following menopause, estimated losses are approximately 1-3 % per year for cortical
bone and 3-5 % per year for trabecular bone following the first five years or more (1994).
Areal bone mineral density (aBMD) of the radius has been shown to decline by ~2.5 %
per year for the first five years following menopause, followed by ~1.2% decline per year
for the following 5-yr period (Ahlborg et al. 2001). This prospective study effectively
showed that the loss of aBMD in estrogen-free women during menopause was
accelerated during the first five years and then continued to decline with increasing age.
Bone loss at the proximal femur is affected similarly by menopause. The proximal femur
aBMD of 1238 healthy Caucasian women between the ages of 21–75 years was fit to
models revealing 2-4% loss of hip aBMD for the first year and ~ 9-13% loss in aBMD
over the first five years following menopause (Ravn et al. 1994). The subsequent five-
year modeled declines in aBMD ranged from 4-8% among various anatomic locations in
the hip and predicted losses in aBMD were ~17-30% over the 10-years since menopause.
All post-menopausal women were estrogen-free and otherwise healthy showing the
13
prominent effect of estrogen loss on aBMD. Pre-menopausal women were predicted to
lose only ~0.6%/yr in femoral neck aBMD.
Spine aBMD has been shown to decline ten times faster in postmenopausal
women (age = 59 years old) compared to pre-menopausal women (39 years old). The
lumbar region has approximately 60% trabecular bone and therefore may show more
rapid losses compared to areas comprised of less trabecular bone such as the
intertrochanteric region (50% trabecular bone), femoral neck (25% trabecular), or mid-
radius (5% trabecular) (Mundy 1999). Other data supporting rapid deterioration in bone
come from large scale studies that examined the proportion of women with osteopenic
levels of aBMD. Four percent of white females between 40-49 yrs have aBMD values 2
standard deviations below healthy values, compared to 26% for individuals 50-59 years
old, the age range of our post-menopausal groups (Looker et al., 1995). The groups
represent pre-menopausal women in the 40-49 age group and post-menopausal women in
the 50-59 age group. This shows that there are rapid changes that occur between these
two age groups who differ on menopause status.
Although most evidence suggests a rather aggressive loss in aBMD after
menopause, particularly in areas comprised primarily of trabecular bone, other data
suggest that decreases in aBMD can be large (~15% over 6 years for spine, femoral neck,
and total aBMD) or can be modest (1.5%, 8%, and 4% for spine, femoral neck, and total
aBMD, respectively) when measured for seven years after menopause (Patel et al. 2000).
Data have shown that post-menopausaul women can be categorized into slow,
intermediate, and fast losers (Christiansen et al. 1987; Falch and Sandvik 1990; Hansen et
al. 1991) showing a range of annual bone losses. In addition, data from the National
14
Health and Nutrition Examination Survey shows somewhat modest differences in aBMD
levels of the hip. The 50-59 year old group had 6.8 % and 5.8% lower aBMD at the
femoral neck and trochanter compared to the 40-49 year old group, revealing small
changes over a 10-yr period, approximately 0.6% per year (Looker et al. 1998). These
are data from various regions across the United States, which include over 3000
Caucasian females. Although estrogen loss can result in decreased bone, it appears that
not all women lose aBMD following menopause and those that do may show various
losses.
In women that show decrements in bone following menopause, bone has been
shown to decline in several regions, both axial and peripheral. Bone mineral content in
the arms, chest, pelvis, and legs showed changes over one year in early post-menopausal
women (Gotfredsen et al. 1986). Specific to the knee region, results have shown
significant difference in aBMD of the knee (9.8% lower) in pre- and post-menopausal
women (pre = 47.4 yrs, post = 59.4) implying a loss of bone mineral density at the knee
with menopause. Other anatomical regions experience greater loss in bone following
menopause, for example measures of aBMD at the hip showed greater loss when pre- and
post-menopausal women were compared (-29.2%) compared to the knee (-9.8%)
(Garland et al., 2001).
Specific losses and changes to trabeculae structures have mainly been studied
with scanning electron microscopy of tissue from cadavers. Less trabeculae in the
anterior portion of the vertebral body are associated with anterior crush fractures in older
adults (Oda et al. 1998). It was also shown that postmenopausal women with and without
vertebral fractures, matched on age, sex, race, and menopause status, had similar cortical
15
and trabecular volumes, but had ~ 18% lower thickness and density, and 20% more
separation between structures (Kleerekoper et al. 1985). Some evidence suggests that
early losses of trabecular bone are reflected as a greater relative loss of horizontal
trabeculae, compared to load bearing or vertical trabeculae (Mosekilde 1988; Oda et al.
1998; Thomsen et al. 2002). It has been shown that load bearing trabeculae may increase
in thickness to account for lost horizontal structures (Frost, 1999; Paritt, 1983; Atkinson
1967). This would reduce losses in strength, but generally would not compensate for
losses in strength due to the lost structures.
Although the ability to acquire in vivo measures of trabecular structures is in the
early stages of development, there are data that show difference in trabecular parameters
for pre- and post-menopausal women and for fracture vs. non-fracture individuals.
Differences in trabeculae have been reported for pre- and post-menopausal women for
apparent measures of trabecular bone in the calcaneous, comprised of ~90% trabecular
bone (Ouyang et al., 1997). Apparent trabecular bone volume fraction was 16% less,
thickness 11% less, and spacing 17.5 % greater in the calcaneous for the post-menopausal
group. The age difference between the pre- and post-menopausal groups was 26.5 years.
Such a large difference in age between groups suggests differences could be due to age
and/or menopause, however this cannot be determined. More deteriorated trabeculae in
the calcaneous and radius have also been reported for older women (72 years old) with
fractures compared to those without fractures (Link et al. 1998; Majumdar et al. 1999).
There is also evidence to suggest that changes in bone structure deterioration are
quite variable. Several patterns of trabecular changes may occur following menopause
(Laib et al. 1998). Measured with micro computed tomography, women within one year
16
of menopause showed variable responses in change. In some women, no measures were
detected to change within one year, whereas trabecular density, thickness, and spacing in
the distal radius (or one of these factors, but not all) showed deterioration. Furthermore,
other women showed changes in cortical width but no changes in trabecular parameters.
Thus, changes in trabecular structures can be detected in vivo, but may be quite variable
from person to person.
How well do measures of aBMD relate to architectural measures in post-
menopausal women? In a simplistic model of bone changes, lower aBMD would indicate
loss of both trabecular and cortical bone, thus measures of bone mass alone could be used
to predict structural losses. The findings discussed above would suggest that changes are
more complicated. Studies have shown both poor and good relations between aBMD and
trabeculae and therefore results have been conflicting as to whether trabecular measures
correlate well with aBMD (Link et al. 1998; Majumdar et al. 1999; Ouyang et al. 1998).
In one report investigators have shown that trabecular measures of the calcaneous did not
correlate well with aBMD in the femur (Link et al. 1998). Fifty women (with and
without hip fractures) were tested for these analyses, showing no relation between
app.Tb.Sp, app.Tb.Th, app.Tb.N and measures of hip aBMD and small-to-moderate
relationships between appBV/TV and femoral neck (r = 0.47), Ward’s triangle (r = 0.37),
and intertrochanteric (r = 0.34) aBMD. Correlations between structural measures of the
distal radius and radial aBMD were also poor (r = 0.42 for app.Tb.N and - 0.42 for
app.Tb.S, no significant relation to app.Tb. BV/TV) and no relation between any distal
radius structural and proximal femur aBMD measures (Majumdar et al. 1999). However,
the same laboratory showed stronger correlations (r = 0.60 – 0.72) between calcaneous

17
aBMD and calcaneal app. BV/TV (Ouyang et al. 1998). Since the calcaneous is ~90%
trabecular, the authors suggest that the significant relationship is not surprising. At this
time, the relation between aBMD and trabecular parameters is unclear.
Cortical bone may decrease ~1-3% per year for the first five years following
menopause (1994). Specific geometric changes to the medullary and cortical areas of the
bone have been reported to occur with aging. Both men and women lose endocoritcal
bone with age, also resulting in medullary expansion (Martin and Atkinson 1977; Ruff
and Hayes 1982, 1988; Smith and Walker 1964). Declines in endocortical bone alone
would result in thinning of the cortical wall and reduction in bending strength. Although
periosteal apposition has been shown to offset endocortical losses with age in men, this
has not been consistently shown in women (Martin and Atkinson 1977; Ruff and Hayes
1988). Some evidence has shown that while females lose endocortical bone, the
periosteal expansion offsets this loss (Ruff and Hayes 1982; Smith and Walker 1964). It
was first shown in women from radiographs (Smith and Walker 1964) and later
confirmed with cadaver femora from individuals from the American Southwest dated
back to prehistoric times (Ruff and Hayes 1982). In contrast, this finding has not been
confirmed in other studies (Martin and Atkinson 1977; Ruff and Hayes 1988). Martin
and Atkinson (1977) evaluated femora specimen of 37 men and women between the ages
of 2 and 82 years. Periosteal apposition failed to account for the loss of endocortical
bone. The contradictory findings from earlier and later work on periosteal apposition in
women is speculated to be due to differences in mechanical stress and strain between the
population of women studied in the American Southwest compared to women who lived
in more industrialized times. Recent findings show that men and women have different
18
age related changes in the mid shaft of long bones; women experience ~twice the
endocortical losses with age in the femoral shaft compared to men and fail to compensate
by any appreciable increases in periosteal apposition. Losses in endocortical bone occur
after the age of 35, but the timing of these changes is not clear and whether or not
estrogen plays a role is unknown.
Bone Changes after Spinal Cord Injury
Bone loss from unloading has been reported to occur following bedrest,
spaceflight, hind-limb suspension, and SCI (Bikle and Halloran 1999; Bloomfield 2001;
Giangregorio and Blimkie 2002; Uebelhart et al. 1995). Poor bone health persists for
most individuals with a complete spinal cord injury (Lazo et al. 2001). Distal femur and
proximal tibia aBMDs have been reported to be from 32-50% lower compared to able-
bodied individuals (Biering-Sorensen et al. 1988; Garland et al. 2001; Garland et al.
1992). Longitudinal data have confirmed cross sectional findings. Patients with
complete lesions, who have no motor control below the level of injury, experience
staggering losses in bone mineral content, roughly 20-25% in the femoral shaft,
composed primarily of cortical bone, and ~60% in the proximal tibia, an area with a high
proportion of trabecular bone (Biering-Sorensen et al. 1990).
Bone mass changes occur within 2 years of injury. About 70% of these losses
occur within the first year of injury, and the additional declines occur after 2 years before
reaching a lower steady state of bone (Biering-Sorensen et al. 1990). Declines are
localized to areas below the level of injury with SCI persons having normal levels of
bone mass found in the arms and spine (Biering-Sorensen et al. 1990). These findings
are from groups primarily comprised of men. But, loss in bone mineral density in women
19
with SCI appears to be similar (Garland et al. 2001). Bone mineral density specific to the
knee in women has also been shown to be ~ 40% lower for SCI vs. ambulatory women
(Garland et al. 2001). In addition, post-menopausal women with SCI have 13.5% lower
levels of BMD at the knee compared to pre-menopausal women with SCI.
Trabecular bone after SCI has received less attention than changes in aBMD, but
has shown rapid deterioration. Early work showed ~33% less iliac trabecular bone
volume six months after spinal cord injury (Minaire et al. 1974). However, the iliac may
not be the best region to study changes in bone and important information about
structures was not described in this study. Data from our laboratory on deteriorated
trabeculae in males with complete SCI showed that trabeculae were fewer in number,
occupied less relative volume and had greater spacing compared to age, height, weight,
and race matched individuals (femur = 26% less relative trabecular bone volume, 21%
fewer trabeculae, 7% thinner, 43% more spacing between structures; tibia = 18% less
relative trabecular bone volume, 19% fewer trabeculae, 32 % more spacing between
structures (unpublished data).
Shaft geometry of paralyzed bone was first examined using tibias from older male
cadavers (n = 4, age = 66 years) (Lee et al. 1997). The entire range of the shaft was
measured showing thinner cortical widths of ~ 20-40 % compared to ambulatory
controls. Tibial geometry has also been studied in vivo. Data have shown that cortical
bone loss in the tibial shaft is 12.5% over ~ 2 years in men with complete and incomplete
SCI (de Bruin et al. 2000a). These investigators also showed that bone cross sectional
area in the tibia was ~25-35% lower in men with complete SCI vs. able-bodied control
(de Bruin et al. 2000b). Results from our laboratory showed that males with long term
20
SCI have 23% less cortical volume, 54% and 44% greater medullary and endosteal
volumes, respectively, compared to able-bodied controls. In addition, data showed a
specific loss in posterior cortical width, the site of several skeletal muscle insertions.
Bone geometry of the mid femur has been previously been measured in women
with SCI by using radiographs to measure cortical width (Kiratli et al. 2000). Although
the technique is limited, these data showed that the inner diameter of the femoral
midshaft was 40% larger in women with SCI compared to controls and this value was
larger when compared to males with SCI who showed 27% greater inner cortical
diameter. These differences between genders resulted in lower measures of bending
strength for females with SCI compared to males. In summary, the cortical area seems to
be reduced and the medullary cavity expanded after SCI in men and women. Men also
show specific deteriorations in posterior regions of the shaft. It is unknown if the
changes that occur with SCI are similar to changes that occur after menopause and if
these changes include specific site changes.
Comparing Bone Changes due to Estrogen Loss vs. Unloading
Areal bone mineral density in six groups of women (young, middle-aged, and
postmenopausal, both ambulatory and spinal cord injured) have been compared (Garland
et al. 2001). These results show that women with SCI have 40% less aBMD at the knee
compared to ambulatory and that post-menopausal women with SCI have 13.5% less
aBMD at the knee compared to middle-aged pre-menopausal women with SCI. There
were no differences between ambulatory and SCI groups in spine aBMD. Results show
that aBMD is 11% lower in the knee of ambulatory pre- compared to post-menopausal
women. However, specific details on background characteristics of the ambulatory
21
women is not clear, especially time since menopause or estrogen use. These results
would suggest that unloading from SCI has larger effects on bone compared to loss of
estrogen from menopause.
Few studies have investigated differences in architecture between conditions of
unloading and estrogen loss. Trabecular bone has been examined in young rats without
estrogen and rats without loading (Ito et al. 2002). The loss of estrogen occurred by
ovariectomy and unloading was obtained by sciatic neurectomy. This study was
designed to compare microstructural deterioration due to immobilization vs. hormonal
alteration. Both conditions had more deteriorated tibial structures compared to sham
controls. The ovariectomized rats had less trabecular bone volume, thinner and fewer
trabeculae that were spaced further apart. Unloaded rats had lower cortical bone volume.
This suggests that estrogen has stronger effects on the structural parameters compared to
unloading, while the opposite is true for cortical bone. Similar studies have not been
conducted in full-grown animal models or humans. Overall, evidence is deficient for
bone architecture following estrogen loss compared to unloading.
Physiology of Primary Osteoporosis due to Estrogen Loss
Estrogen is lost following menopause, which is purported to be responsible for
rapid changes that occur to bone mass and structure in the early post-menopausal years.
The loss estrogen results in substantial increases in bone remodeling. Withdrawal of
estrogen results in greater bone resorption of compared to formation resulting in bone
loss, while the presence of “unloading” per se is not the cause of bone changes (See
Manolagas 2000 & Seeman 2003). Estrogen has direct effects on the three main types of
22
bone cells. Estrogen withdrawal results in increased bone cell activation, particularly in
osteoclasts, increased lifespan of osteoclasts and increased resorptive depths of
osteoclasts, while withdrawal decreases the lifespan of osteoblasts and osteocytes
(Manolagas 2000). Estrogen also influences bone lining cells. Estrogen promotes the
release of osteoclastic inhibitory factors that are released by bone lining cells (Parfitt et
al. 1996). When estrogen is removed, the inhibitory effect is also removed. Estrogen
also reduces the release of two osteoclastic release paracrine factors (interleukin-6 and
annexin-II), which are involved in osteoclast precursor production (Parfitt et al. 1996).
Substantial research has shown estrogen influences a number of cells involved in
remodeling, with the general outcome of removal of estrogen resulting in a negative
balance of bone turnover, leading to bone loss, especially in trabecular bone.
Physiology of Secondary Osteoporosis due to Traumatic SCI
The primary cause of deteriorated bone following SCI is diminished muscle
activity and the unloading that occurs in the absence of voluntary motor output in the
lower limbs. Loss of loading and muscle actions leads to rapid muscle atrophy following
spinal cord injury. In patients with acute SCI, average muscle cross sectional area in
affected regions was 45-80 % of able-bodied controls 6 months after injury (Castro et al.
1999b). In other studies, muscle cross sectional area of the quadriceps femoris was ~60%
of matched able-body controls 47 weeks post injury (Dudley et al. 1999) and muscle
cross sectional area of the thigh was ~50% of matched able-body controls for individuals
with long-term SCI (~8 years post injury) (unpublished observations). Muscle is an
important factor to consider when studying bone because fat free mass explains ~40-60%
23
of the variance in bone mineral density in young and older adults (Binder and Kohrt
2000). This makes a strong case for the influence of muscle atrophy and concurrent loss
of muscle action on bone deterioration.
Following SCI, there are acute changes in hormones associated with bone loss.
Although blood calcium concentrations are increased, parathyroid hormone is reduced
following SCI (Roberts et al. 1998). Serum alkaline phosphate is slightly elevated and
osteocalcin levels do not change, which together show that bone formation is maintained
following injury. Bone loss is due to the 10-fold increase in osteoclastic activity
(increases in serum total and free deoxypyrdinoline and N-telopeptide). However, these
are transient changes occurring while bone is remodeling and markers of formation and
resorption are not elevated after 2 years, when bone reaches a new, lower steady state. In
women with SCI, changes in estrogen could influence changes that occur in bone. There
are no reports associated with changes in estrogen levels following SCI in females.
Blood flow to bone is altered after SCI (Chantraine et al. 1979; Minaire et al.
1984; Uebelhart et al. 1995). Blood flow is decreased while venous stasis and
intramedullary pressure are increased (Chantraine et al. 1979). Because bone
maintenance includes stimulus that is transmitted through fluid, changes in fluid pressure
may greatly affect bone. Intramedullary pressure is increased ~2-fold following SCI.
These changes are thought to have negative influences on bone. However, findings from
rats that were hind-limb suspended with venous ligation vs. those suspended without
ligation suggest that increasing venous stasis and medullary pressure via ligation has
positive effects on bone (Bergula et al. 1999). It would therefore seem that increasing
intramedullary pressure and venous stasis would prevent or diminish bone loss associated
24
with unloading. What is clear at this time is that there are changes in pressure that occur
in the affected regions following SCI, but the role they play in bone changes has not been
elucidated. Though other factors may be involved with bone changes occurring
following SCI, the reduction in skeletal muscle mass and subsequent unloading appear to
be the primary factors contributing to bone decrements in following SCI.
Prevalence of Osteoporosis and Incidence of Fractures
Fractures in SCI persons with a complete injury occur most often in regions
comprised mostly of trabecular bone, such as the distal femur and proximal tibia (Comarr
et al. 1962; Freehafer 1995; Ragnarsson and Sell 1981). These fractures rarely occur
from high impact, but occur during low impact activities, for example transferring out of
wheelchairs (Comarr et al. 1962; Freehafer 1995; Ragnarsson and Sell 1981). Poor bone
health persists for most individuals with a complete spinal cord injury (Lazo et al. 2001).
In a sample of 30 individuals who had American Spinal Cord Injury Association rating of
A or B, 83% were osteoporotic, 10% osteopenic, and 7% had normal levels of BMD at
the femoral neck. The high incidence of osteopenia and osteoporosis is associated with a
5 and 24 fold greater fracture rate in the leg and femur when compared to able-bodied
individuals (Vestergaard et al. 1998). Fracture incidence within individuals with SCI has
been reported to be as low as 1.45%-6% (Comarr et al. 1962; Eichenholtz 1963;
Freehafer 1995; Ragnarsson and Sell 1981) or as high as 29 and 33% (Frisbie 1997;
Krause 2000). The large differences in reported fracture incidence is not readily
explained. Women with SCI have also been reported to have a higher incidence of
fracture compared to males with SCI, relative risk = 1.60 (Vestergaard et al. 1998).
25
Osteoporosis is common for persons with SCI; fracture risk is apparently increased and
up to one-third of people with SCI may fracture after their injury.
Osteoporosis and osteopenia occurs in a large percentage of Caucasian women
over 50 years old (20-50%) (Looker et al. 1995). Approximately 7 million older women
have been diagnosed with osteoporosis (Looker et al. 1995). An additional 12 – 17
million have a precluding condition of osteoporosis (osteopenia). It is predicted that 40%
of post-menopausal able-bodied women (age ≥ 50 years) will experience one or more
fractures (Melton et al. 1992). Although the primary mechanisms behind the loss of bone
are different in spinal cord injury and menopause, fracture incidence is similar between
these two populations.
Importance of Trabeculae and Bone Geometry
Examining architecture, both trabeculae and geometry, is important because many
report no direct relation between risk of fracture and the decrease in bone mass (Bell et
al. 1967; Cummings 1985; Dempster et al. 1986; Mann et al. 1992). Postmenopausal
women with and without vertebral fractures, matched on age, sex, race, and menopause
status, had similar cortical and trabecular volumes, but had ~ 18% lower thickness and
density, and 20% more separation between structures (Kleerekoper et al. 1985). Cortical
bone parameters are important components in the calculation of several measures of bone
strength (for example, cross sectional moment of inertia). For trabeculae, lost structures
or walls may not be re-established following deterioration (Parfitt 1987). Thinning of
structures will also have an adverse effect on strength of bone because the strength is
exponentially proportional to its radius (Bell et al. 1967). The length between structures
26
is proportional to the square of the distance between the supporting structures (Bell et al.
1967; Mosekilde and Danielsen 1987). Therefore, declines in structures will have effects
on bone that far outweigh the loss in mass alone.
The mechanotransduction theory of bone cell activation suggests that a force or
bending of the bone plays a critical role in bone formation (Duncan and Turner 1995;
Frost 1987). If connectivity of trabeculae were diminished, the deteriorated trabecular
wall, which is no longer connected, would not receive the mechanical stimulus necessary
for bone formation. Pharmacological treatments (selective estrogen modulators,
bisphosphonates) also seem unlikely to recover the structures as many work through
altering existing activity of osteoblasts and osteoclasts (decreasing activity, changing
lifespans of cells, or decreasing resorption depth) (see (Manolagas 2000; Seeman 2002).
In the case of lost structures, it seems plausible that the bone cells have also been lost and
therefore trabeculae may not be re-established.
However, limited animal data that suggest trabeculae may be responsive to
interventions and may contain the remarkable ability to increase not only in thickness, but
also in number. Rubin et al. (2002) showed that low strain, high frequency stimulation
evoking vertical oscillation on the tibia 20 minutes a day, 5 days per week for one year
created new trabeculae and increased thickness (Rubin et al. 2002). The finding that the
effect was specific to the loading direction strengthens the results of the study. An
increase in trabecular number, thickness and bone volume fraction was also reported
following re-ambulation in tail suspended young rats (Bourrin et al. 1995). A study in
humans showed increases in trabecular bone density following loading exercises of the
upper extremity (Simkin et al. 1987). This technique used scattered radiation, developed
27
within the investigator’s laboratory, and has not been used by others. In addition, this
study examined bone changes over five months, which may not be long enough to
examine true changes in bone remodeling. Bone remodeling typically occurs over a
cycle of ~6 - 10 months before a new steady state of bone is re-established (Kahn 2001)
and measures taken before adequate passage of time may not accurately reflect true
mineralized bone stages. Others have reported 100% recovery of calcaneas bone mineral
density, but not tibia bone mineral density for subjects exposed to 17 weeks of bedrest
followed by 6 months of reambulation (Leblanc et al. 1990). Regions within the
calcaneous and tibia have high proportions of trabecular bone, and the calcaneous could
be expected to respond to ambulation as it is directly loaded during walking and standing.
Other non-mechanical stimuli (bisphosphates and selective estrogen receptor modulator
therapy) have failed to promote recovery of trabeculae in the presence of increased bone
strength in aged rats (Bourrin et al. 2002). Because loss in mineral density cannot
completely explain fracture incidence and because there is a lack of human data to
support recovering trabeculae, loss of structures are critical to bone health.
Magnetic Resonance Imaging of Bone Structure
The most common way to evaluate geometry and microarchitecture of bones for
both humans and animals has been the use of histomorphometric analysis performed on a
biopsy of bone tissue or on a whole bone specimen in sacrificed animals and deceased
humans. While these allow unparallel measurement of bone architecture, the procedures
are invasive. Recent advances have led to in vivo analysis of bone geometry and
architecture.
28
While single photon and dual energy x-ray absortptiometry are commonly used to
evaluate bone, these measures typically do not differentiate between cortical bone and
trabecular bone and thus cannot provide architectural information about number, size,
spacing, or connectivity of trabeculae or the volume and distribution of endosteal and
cortical bone. Computer Tomography and MRI have both been used to assess bone
architecture and allow for unparallel imaging of anatomical regions. Because MRI does
not emit radiation, it is typically a better option for detailed scans, which may be 15
minutes or more in scanning length and for studies that assess change and therefore
mandate repeat or follow-up scans.
Bone geometry has been studied by several investigators (Adami et al. 1999;
Augat et al. 1996; Beck et al. 1992; de Bruin et al. 2000b; Duncan et al. 2002; Nelson et
al. 2000; Woodhead et al. 2001). Specifically MR imaging for the mid-femur has
examined for repeatability and accuracy (Woodhead et al. 2001). Venison femora were
evaluated for total bone and cortical cross sectional areas (CSA) and volumes (TV, CV)
and total and cortical width (TW, CW). For mid-femoral identification, femur length is
measured by examining a coronal scout image. Intra- and inter-observer repeatability are
associated with excellent reliability, represented by low coefficient of variation for
individuals with and without osteoporosis (cortical and total bone volume = 0.42 –
1.19%; total cross sectional area = 1.17%; total width = 0.87 –1.02%, cortical width =
3.88%). Mean differences between MRI and the gold standard were total volume (1.9%),
cortical volume (-1.2%), cross sectional area (-2.2%), cortical cross sectional area (2.3%),
total width (-1.4%), and cortical width (-0.4%). Mean difference in cortical width was
significantly different between gold standard and MRI (17% difference). However, this
29
is most likely explained by using only one slice for the measurement of cortical width
whereas the other parameters used the entire mid-third of the femur. DXA, however, was
inaccurate for measures of bone geometry in this study. Hip structural analysis has
recently been developed for DXA to determine cross sectional areas about the proximal
femur and to estimate trabebular bone fraction (Beck et al. 1993; Beck et al. 1996; Beck
et al. 1992). These improvements are encouraging for future use of DXA in
understanding bone structure.
Trabecular bone is best visualized using scanning electron miscroscopy. Direct
visualization of deep resorptive cavities, thinning trabeculae, and broken structures are
distinctly visualized in individuals with osteoporosis (Dempster et al. 1986; Kleerekoper
et al. 1985; Mosekilde 1999; Oda et al. 1998; Thomsen et al. 2002). The ability to
capture trabecule in vivo is most difficult because of the size of trabeculae. Currently,
only a few laboratories in the world are examining trabeculae structure in vivo (Boutry et
al. 2003; Majumdar et al. 1995; Ruegsegger 2001; Wehrli et al. 2001). The University of
California at San Francisco have used hrMRI to investigate differences in trabeculae in
numerous population: heart and kidney transplant patients, post-menopausal women with
hip fractures, individuals with knee osteoarthritis and individuals in drug trials (Beuf et
al. 2002; Link et al. 2000; Link et al. 2002; Majumdar et al. 1997). These procedures are
both valid (Majumdar et al. 1996); and reliable (Newitt et al. 2002; Ouyang et al. 1998)
and discriminate between those that do and do not fracture (Majumdar et al. 1997).
HrMRI is available for the calcaneous, knee, and distal radius. The knee area
includes the distal femur and proximal tibia, approximately 6 cm of both are acquired in
separate scans. The scanning time to collect 60 1-mm slices is ~15 minutes. The slice

30
thickness, time to repeat, and time to echo have been chosen to allow for reasonable scan
time and adequate signal to noise for measuring apparent structural parameters. The
image is acquired using a bilateral phased array coil that is place on the medial and lateral
sides of the knee, using the joint space on the lateral side as an anatomical landmark. For
adequate positioning of the coil, the leg is placed in a supportive custom built device,
which includes good support under the knee and on either side of the leg in order to
minimize motion during the scan. Once the image is acquired and saved, a 3-D low-pass
filter-based correction is applied to correct for inhomogeneous signal across the image
because of using the phased array surface coil (Wald et al. 1995). The first and last five
slices are removed to minimize artifacts from the end of the imaging coil. The images
are thresholded assuming a two phase model (bone, non-bone) (Majumdar et al. 1995).
Apparent trabecular bone volume (app. BV/TV) is determined by dividing pixels into
bone and non-bone and taking the number of pixels with a signal intensity corresponding
to bone (BV) divided by the total number of pixels (TV). This normalized value is Pp.
Mean intercept length (MIL) is used as a measure of trabecular thickness. MIL at a
specific angle is computed as the ratio between the total area of trabecular bone and half
the number of edges between bone and marrow that intersect the set of parallel rays
passing the image (Pl).
MIL (θ) = 2 Pp / Pl (θ)
The lines are rotated by 5 degrees through the image to determine the average apparent
trabecular thickness (app. Tb.Th). Apparent trabecular number (app. Tb.N) and apparent
trabecular spacing are calculated: app Tb.N = Pp / Tb.Th; app Tb.S = (1/Tb.N) – Tb.Th.
The spatial resolution used for the distal femur and proximal tibia imaging predispose the
31
images to partial volume effects. Therefore, smaller trabeculae may not be captured.
Other imitations are associated with imaging at this resolution. With decreasing
resolution, the bone volume fraction and trabecular thickness are overestimated and the
separation underestimated (Kothari et al. 1998). Apparent trabecular thickness is the
most inaccurate measure from hrMRI because of the thickness of the trabeculae in
relation to pixel size (true trabeculae: 78-200µm vs. pixel size: 196 µm) (Kothari et al.
1998).
Reproducibility of image acquisition and segmentation with quantification of
bone structure parameters is tight to excellent for the distal femur and proximal tibia
(Beuf et al. 2002). The coeffecient of variation for the femur and tibia are as follows;
femur: 5.4, 2.9, 2.7, and 5.7% for BV/TV, Tb.N, Tb.Th, and Tb.Sp, respectively, and 4.0,
3.3, 1.4, and 4.6% for the tibia. Also noted, the femur has more trabeculae, greater
trabecular bone volume, less separation between structures, and greater thickness
compared to the tibia, hypothesized to be due to different loading environments (Beuf et
al. 2002). In summary, hrMRI has successfully been developed for in vivo measurement
of bone structures, has been used in a number of populations with and without primary or
secondary osteoporosis, and is available for the knee, together which make possible
comparisons of trabeculae among post-menopausal women and women with SCI.
32
CHAPTER III
TRABECULAR BONE IS MORE DETERIORATED IN SPINAL CORD INJURED VS
ESTROGEN-FREE POST-MENOPAUSAL WOMEN1
Slade, Jill M., C. Scott Bickel, Chris Modlesky, Sharmila Majumdar, and Gary
A. Dudley. To be submitted to Osteoporosis International.
33
Abstract
Loading and estrogen are strong contributors to bone mass and health. We
compared the effects of unloading and estrogen loss on the trabecular bone of the knee in
women. This was accomplished by comparing women with complete spinal cord injury
(SCI) to estrogen-free post-menopausal women. Pre- and post-menopausal ambulatory
women (n = 17) were compared to pre- and post-menopausal women with SCI (n = 20).
Height, weight, and race were matched in each group, and post-menopausal women were
~ 12 years older than the pre-menopausal women (55 ± 5.8 yrs vs. 43 ± 3.8 yrs). High
resolution magnetic resonance imaging was used to compare groups on apparent
measures of trabecular bone volume, trabecular number, trabecular spacing, and
trabecular thickness in the distal femur and proximal tibia, regions with a high proportion
of trabecular bone. SCI groups had fewer, (19-26% less) and thinner trabeculae (6% less)
that were spaced further apart (60% more space between structures) and less trabecular
bone volume (22-33%) compared to the ambulatory groups. Post-menopausal women
with SCI also had greater trabecular spacing in the tibia compared to the 40-yr old pre-
menopausal women, showing an interaction between unloading and estrogen loss.
Middle-aged ambulatory women, not taking estrogen or medications that affect bone did
not show the deteriorated trabeculae that was evident in women with SCI, nor did they
show differences in distal femur and proximal tibia trabeculae compared to a pre-
menopausal group. We conclude that the effect of unloading on bone architecture is
greater than that of estrogen loss in middle-aged women.
34
Introduction
Estrogen loss and unloading have large influences on bone. The influence of
estrogen withdrawal on bone has been well documented (Manolagas 2000). Research
also has also shown the large influence of loading on bone mass (Rubin and Lanyon
1985) as well as unloading of bone that occurs with hindlimb suspension models, bed
rest, and spinal cord injury (Giangregorio and Blimkie 2002; Uebelhart et al. 1995).
Following a complete spinal cord injury (SCI), individuals experience the most extreme
form of unloading. As there is no cure to repair the injured cord after complete SCI,
people are immediately and permanently immobilized below their level of injury.
Osteoporosis is observed in nearly ~75% of patients with complete SCI (Claus-
Walker and Halstead 1982; Lazo et al. 2001). Several research groups have reported
differences in bone mineral density between able-bodied controls and individuals with
SCI; (Biering-Sorensen et al. 1990; Claus-Walker and Halstead 1982; Garland et al.
1992; Roberts et al. 1998). Over the first two years following injury, bone mineral
density declines from ~20 - 25% in skeletal areas composed of cortical bone such as the
femoral shaft to ~60% in areas comprised mainly of trabecular bone such as the proximal
tibia (Biering-Sorensen et al. 1990). Early work also showed ~33% less trabecular bone
volume 6 months after spinal cord injury (Minaire et al. 1974). The cause of diminished
bone following SCI is probably the atrophy of skeletal muscle and therefore loss of
voluntary contraction in the lower limbs. Research has shown a rapid loss of affected
skeletal muscle following injury. It is approximately 50% smaller in SCI persons
compared to able-bodied controls 6 months after injury (Castro et al. 1999). Following
35
SCI, there are also changes in intramedullary pressure that may contribute to bone loss
(Chantraine 1978).
Skeletal structure in women following menopause also is compromised. Losses
are 1-3 % per year for cortical bone and 3-5% per year for trabecular during the first five
years or so after cessation of menses (1994). Withdrawal of estrogen results in greater
bone resorption compared to bone formation leading to bone loss. “Unloading” per se is
not believed to be the cause of bone loss in post-menopausal able-bodied women (See
(Manolagas 2000; Seeman 2003). More women with SCI will also experience
menopause because of improved medical treatment. The mechanisms for bone loss are
purportedly different between conditions. Women with SCI who go through menopause
may experience two periods of bone loss, further increasing their high risk of fracture.
Post-menopausal women, those without estrogen, and women with SCI present an
interesting scenario of two at-risk populations for osteoporosis and fractures. Indeed,
osteoporosis in the hip occurs in 20% of women over 50 years of age and osteopenia
occurs in 34-50% of older women (Looker et al. 1995), contributing to a 40% lifetime
risk of fracture for females over 50 (Melton et al. 1992). Individuals with SCI have
alarmingly high rates of osteoporosis. This is associated with a 5- and 24-fold greater
fracture rate in the leg and femur when compared to able-bodied individuals (Vestergaard
et al. 1998). Up to 35% of the SCI population will experience a fracture in their lifetime
(Comarr et al. 1962; Eichenholtz 1963; Frisbie 1997; Krause 2000; Ragnarsson and Sell
1981). Studies reporting high rates of fracture in SCI are similar to the incidences
reported for postmenopausal women. Both post-menopausal women and individuals with
SCI have increased, yet similar rates of fractures.
36
Areal bone mineral density (aBMD) is the current gold standard measure of
osteoporosis. While aBMD has been evaluated following both menopause and spinal
cord injury, it does not indicate structural changes; most notably it does not indicate
trabecular bone architecture. Although osteoporosis is a disease characterized by low
bone mass and microarchtectureal deterioration of bone tissue (1991), studies have
primarily focused on changes in mass.
Advances in technology now allow in vivo assessment of trabecular bone, the
bone type particularly affected by menopause and SCI. High resolution magnetic
resonance imaging (MRI) is a non-invasive technique to measure trabeculae compared to
histomorphometric analysis from iliac biopsies and MRI can measure through a large
region (~ 6 x 10 x 10 cm). Measurement of bone architecture in vivo has recently been
developed for the knee (Beuf et al. 2002). This is ideal for SCI patients because the knee
is the site with the highest fracture rate.
The purpose of this study was to compare the effects of SCI and menopause on
trabecular bone of the knee. We hypothesized more diminished trabeculae in women
with SCI. In addition, we sought to determine the effect of menopause on trabeculae in
women with SCI, hypothesizing that trabeculae would be more deteriorated in post-
menopausal compared to pre-menopausal women with SCI. We also examined
differences in aBMD between the pre- and post-menopausal ambulatory groups. Lastly,
we tested the purported relationship between skeletal muscle and trabeculae.
37
Methods
Subjects
Five groups of women were recruited for this study: ambulatory pre- and post-
menopausal women, pre- and post-menopausal women with SCI and young pre-
menopausal women with SCI. Women were recruited from the local communities of
Athens and Atlanta and from the Shepherd Center, Atlanta, GA.
Four groups were matched for height, weight and race. The pre-menopausal
ambulatory and the older pre-menopausal SCI groups were matched for age and the
postmenopausal groups were matched for age and time since menopause. Pre-
menopausal women > 40 years of age were recruited to reduce the age differences
between pre- and post-menopausal groups. Post-menopausal women were recruited
approximately 5 years or more post menopause. Menopause was defined according to
the World Health Organization: 12 months after the cessation of normal menstrual cycles
(1981). Exclusionary criteria included fractures or hardware in both lower extremities,
heterotopic ossification in both lower extremities, long-term medication known to affect
bone (i.e. corticosteroids) and disorders known to influence bone, e.g. hyperthyroidism.
Post-menopausal women were not taking any medications known to effect bone (estrogen
replacement, hormone replacement, bisphosphonates, soy supplements, or estrovan) for
at least the previous five years. We recruited individuals that were not involved in heavy
loading activities. Women with spinal cord injury who were complete (American Spinal
Cord Injury Association rating of A) and were ≥ 2 years post injury were recruited. We
attempted to recruit only non-smoking women.
38
This study was approved by the Institution Review Boards at the University of
Georgia and Shepherd Center. All participants provided written informed consent prior
to enrollment in the study.
Microarchitecture of trabecular bone
Trabecular bone of the distal femur and proximal tibia was assessed using high
resolution MRI as done previously (Beuf et al. 2002; Majumdar et al. 1996). Specifically
images were acquired on a GE SIGNA 1.5 T echo-speed system. A 3D fast gradient-
echo sequence (TE/TR = 4.5/30ms; 40 degree flip angle) was used to obtain the high
resolution images (10 cm FOV) with a spatial reconstructed resolution of 195 x 195 x
1000 µm. A bilateral phased array coil (USA Instruments) was used to collect sixty
contiguous 1 mm slices in the axial plane starting with the distal end of the femur and
another block of 60 starting with the proximal end of the tibia. A 3-D low-pass filter for
inhomogeneous signal across the image was applied because of using the phased array
surface coil. Images were categorized into bone and non-bone (marrow) using a dual
phase limit threshold. Some voxels contained bone and non-bone. This was accounted
for by partial volume correction (Majumdar et al. 1997). Regions of interests were
manually identified and a set of parallel lines rotated by 5 degrees throughout the slice.
Parameters measured were apparent trabecular bone volume (app.BV/TV), number
(app.Tb.N, mm-1), thickness (app.Tb.Th, mm) and separation (app.Tb.S, mm). These
procedures are both valid (Majumdar et al. 1996), reliable (Newitt et al. 2002; Ouyang et
al. 1998) and discriminate between those that do and do not fracture (Majumdar et al.
1997).
39
Muscle morphology
MRI was used to examine skeletal muscle morphology of the thigh. Briefly, T1
weighted MR images were taken of one thigh with a 1.5T magnet. The whole-body coil
was used (TR/TE 500/14 ms, FOV (20-24 cm, 256 x 256 matrix). Transaxial images, 1-
cm thick and 0.5-cm apart, were taken from the knee joint to the hip joint. Skeletal
muscle cross sectional was calculated for the middle third of the femur. Images were
analyzed on specifically designed software (X-Vessel, East Lansing, MI) as previously
described (Kanaley et al. 2001). Images were segmented into fat (high intensity), muscle
(mid-intensity) and bone (low intensity). A preliminary segmentation of each two-
dimensional slice into fat and nonfat regions was obtained by simplex optimization of the
correlation between a Sobel-gradient image computed from the original image and the
corresponding gradient images computed from single-threshold fat-segmented images.
The first-pass segmentation corrected for inhomogeneous signal intensity across the
image. The image was then resegmented into three intensity components using a fuzzy c-
mean clustering algorithm. To determine thigh skeletal muscle cross sectional area
(CSA), manual selection of a pixel of skeletal muscle was done. This highlighted and
provided a total number of skeletal muscle pixels (without fat or bone) in the region of
interest. Quadriceps femoris CSA was determined by manually tracing the area in each
slice and creating a histogram of pixels across signal intensity. Pixels with signal
intensity values between 80 and 387 (mid-range) were counted as skeletal muscle. Pixel
number was converted to area by multiplying by the field of view (20-24 cm) and
dividing by the total number of pixels in the image. This value was multiplied divided by
40
the number of slices examined (~10 per person). Images were analyzed by a single
investigator and test-retest reliability was excellent (r = 0.998).
Areal bone mineral density
Dual energy X-ray Absorptiometry (DXA) of the whole body, hip (total, neck,
trochanteric, and total regions), and spine (L1-L4) was used to measure areal bone
mineral density (aBMD) in ambulatory women. T-scores were reported along with levels
of aBMD. A calibration step wedge, consisting of thermoplastic resin (68% fat) and
thermoplastic resin-aluminum steps (~10% fat) calibrated against stearic acid (100% fat)
and water (8.6% fat; Hologic, Inc.) was scanned prior to testing to calibrate fat mass and
fat-free soft tissue mass. A lumbar spine phantom consisting of calcium hydroxyapatite
embedded in a cube of thermoplastic resin (model DPA/QDR-1); Hologic x-caliber
anthropometric spine phantom) was scanned daily to ensure mineral accuracy.
Statistical analysis
Two-way analyses of variance (ambulatory vs. SCI and pre- vs. post- vs. young
menapause) was used to detect differences in age, height and weight (SPSS version 11).
One-way ANOVA was used to find differences in time since menopause and after spinal
cord injury. Two-way ANOVA also was used to analyze app.BV/TV, app.Tb.N,
app.Tb.S, and app.Tb.Th. Pearson’s r was used to evaluate the relation between thigh or
quadriceps skeletal muscle and trabeculae. One-way ANOVA was used to test
differences in aBMD between pre- and post-menopausal ambulatory women.
Significance was set at p < 0.05. Effect sizes using Cohen’s d (d) were calculated when
differences approached significance. Small, medium, and large effects are 0.20, 0.50,
and 0.80, respectively.
41
Results
Subjects
SCI subjects: Eight post-menopausal and 13 pre-menopausal women with SCI
volunteered for the study and met the criteria. One of the post-menopausal women
dropped from the study, one post-menopausal woman with SCI was a consistent outlier
on several dependent variables (approximately 3 SD above the mean), resulting in six
post-menopausal women with SCI. Height, body weight and time since injury were not
different between the SCI groups (Table 1) and were not different from the ambulatory
groups. Three of the women with SCI were current smokers (one in each group). Two
women in each SCI group were African American, all others were Caucasian.
Ambulatory subjects: Nine ambulatory post-menopausal and eight pre-
menopausal women were selected for the study. Height and body weight were not
different between these two ambulatory groups (Table 1). Time since menopause was
not different compared to the post-menopausal women with SCI (p = 0.633). No women
in the ambulatory groups were current smokers. Two women were African American in
the post-menopausal group and one in the pre-menopausal group; all others were
Caucasian.
Bone microarchitecture
All women completed the high-resolution scan of the tibia (Figure 3.1).
Approximately 25% of women did not complete the scan of the femur due to motion
artifact, five each of ambulatory, and SCI women (Figure 3.2). The apparent bone
parameters for the distal femur all showed the same effect. There were significant main
effects for ambulatory status (see Figures 3.1 & 3.3a-d). Women with SCI had 30.9 %

42
lower apparent trabecular bone volume fraction (0.212 ± 0.043 vs. 0.307 ± 0.029; F(1,26)
= 30.7, p < 0.001), 26.5 % fewer trabeculae (1.021 ± 0.169 mm-1 vs 1.390 ± 0.089 mm-1;
F(1,26) = 37.9, p < 0.001), trabeculae that were 61.7 % further apart (0.815 ± 0.168 mm
vs. 0.504 ± .060 mm; F(1,26) = 30.9, p < 0.001) and 6.8% thicker (0.206 ± 0.013 mm vs.
0.221 ± 0.009 mm; F(1,26) = 4.8, p = 0.039) in the distal femur compared to the
ambulatory group (Figure 3.2). There were no significant differences among the three
groups of spinal cord injured women (young-pre, older-pre, and post-menopausal). In
addition, there was no interaction and no main effect for menopause for any femoral
trabecular parameter.
Results from the proximal tibia are similar to the distal femur. Ambulatory status
had a significant effect on trabeculae (Figures 3.2 & 3.4a-d). Spinal cord injured groups
had 22.3 % less app.BV/TV (0.202 ± 0.044 vs. 0.260 ± 0.024; F(1,35) = 21.4, p < 0.001),
18.5 % less app.Tb.N (1.016 ± 0.170 mm-1 vs. 1.244 ± 0.134 mm-1; F(1,35) = 22.5, p =
0.001) and 5.8% less app.Tb.Th (0.196 ± 0.123 mm vs. 0.208 ± 0.006 mm; F(1,35 = 8.1,
p = 0.008) compared to the ambulatory groups (Figure 3.4a-d). There was a significant
ambulatory x menopause interaction for app.Tb.Sp (p = 0.042), thus simple effects were
examined. Analyses showed a significant effect of SCI in both pre- and post-menopausal
groups (p ≤ 0.031, 26 and 60% greater spacing for pre- and post-menopausal SCI vs. pre-
post-ambulatory) and a trend for a simple effect of menopause in SCI women (p = 0.059,
d = 1.44). Post-menopausal women with SCI had 33.6% greater app.Tb.S in the tibia
compared to pre-menopausal women with SCI (p = 0.020).
Average aBMD values were collected on four pre-menopausal women and all
nine post-menopausal women (Figure 3.5). The average aBMDs for the post-menopausal
43
ambulatory women were in the osteopenic range for trochanteric (t = -1.30 ± 0.72), total
hip (t = -1.22 ± 0.67), L1-L4 (t = -1.86 ± 1.19), and total body (t = -1.28 ± 1.02). Post-
menopausal women were significantly lower for trochanteric, total hip, and L1-L4
aBMD, and total body and showed a trend for lower aBMD the femoral neck BMD (p =
0.060, d = 1.15).
Muscle cross sectional area of the thigh and quadriceps was ~55 % lower between
the ambulatory groups and the groups with SCI (thigh ambulatory = 93 ± 20.3 cm2, SCI =
41 ± 18.3 cm2, p = 0.001; quadriceps ambulatory = 46 ± 9.6 cm2, SCI = 19 ± 8.6 cm2).
Trabecular bone parameters were correlated to skeletal muscle CSA in the thigh for SCI
groups (correlations with femur measures (n=14), r2 = 0.481, 0.408, 0.405 for
app.BV/TV, Tb.N and Tb.S; tibia (n = 19), r2 = 0.384, 0.325 and 0.282 for app.BV/TV
app.Tb.N, and app.Tb.S, respectively, p < 0.05) and ambulatory groups (correlations with
femur measures (n = 10), r2 = 0.427 and 0.405 for app.Tb.N and appTb.S; tibia (n = 15),
r2 = 0.424, 0.383, and 0.377 for app.BV/TV, Tb.N and Tb.S, p < 0.05).
Discussion
The main finding from this study was the substantial difference in trabeculae
between women with SCI and ambulatory women. Findings of large deterioration in
women with SCI are similar to other findings from our laboratory on trabeculae in men
with SCI compared to ambulatory men (femur = 26% less app.BV/TV, 21% less
app.Tb.N, 7% less app.Tb.Th, 43% more app.Tb.Sp; tibia = 19% less app.Tb.N, 18% less
app.BV/TV, 32 % more app.Tb.Sp (unpublished data). Hence unloading following SCI
appears to affect bone architecture of the knee quite similarly in men and women. The
range in age of the women (22-62 years) in the SCI group also shows that the effects of
44
SCI on bone architecture occur independent of chronological age. The reduced
microarchitecture coincides with the high rate of fracture in this population compared to
ambulatory individuals (Vestergaard et al. 1998). In the current study, seven of the 20
women with SCI (3 pre-menopausal and 4 post-menopausal) had experienced a fracture
to the lower extremity since the initial injury (3 distal femur, 2 proximal tibia, 1 each of
proximal femur and femoral shaft). This is in accordance with fracture incidence of 29
and 33% (Frisbie 1997; Krause 2000) but much higher than others who report fracture
rates of 1.45%-6% (Comarr et al. 1962; Eichenholtz 1963; Freehafer 1995; Ragnarsson
and Sell 1981). Women with SCI also have a higher incidence of fracture compared to
males with SCI, relative risk = 1.60 (Vestergaard et al. 1998).
The large bone losses in women with SCI are consistent with others which have
examined bone BMD loss in persons with SCI (Biering-Sorensen et al. 1990; Garland et
al. 2001; Garland et al. 1992). We detected significantly greater spacing in post-
menopausal women with SCI compared to pre-menopausal women with SCI. This is an
interesting finding which shows an interaction between menopause and SCI, suggesting
that lack of estrogen in the unloaded state has greater effects than each parameter alone.
Bone mineral density specific to the knee has been shown to be significantly lower in the
knee of post-menopausal women with SCI when compared to pre-menopausal women
with SCI (13.5% lower). However, these data are representative of groups that were not
matched closely in age and therefore differences could be the result of age or menopause.
In the current study the difference between the pre- and post-menopausal groups with
SCI was ~10 yrs compared to the 24-yr age difference in the study by Garland et al.
45
(2001) and thus makes a stronger case for the combined influence of estrogen and
unloading.
These data also show moderate correlations between trabecular bone and skeletal
muscle size for both ambulatory and SCI women. BMD has been reported to be related
to muscle mass in able-bodied individuals, with 40-60% of the variance in bone
explained by skeletal muscle mass (Binder and Kohrt 2000). These correlations suggest
that increasing skeletal muscle size may have a positive influence on trabecular
parameters. Evoking hypertrophy of the quadriceps may influence trabecular bone in the
distal femur and proximal tibia.
Our aBMD data show that aBMD was lower in post- compared to pre-menopausal
ambulatory women. These differences agree with reported differences and changes in
BMD following menopause (Ahlborg et al. 2001; Dawson-Hughes et al. 1995; Harris et
al. 1992; Lindsay et al. 1997). An unexpected finding was the lack of difference in
trabecular bone for the post- compared to pre-menopausal ambulatory women. Even
within the knee region, results have shown difference in BMD (9.8% lower) in pre- and
post-menopausal groups with mean ages similar to the current study (pre = 47.4 yrs, post
= 59.4) implying a loss of bone mineral density at the knee with menopause, thus either
altered cortical bone or trabecular bone in the knee. Other anatomical regions (hip, for
example) experience greater bone mass loss (vs. knee) following menopause (Garland et
al. 2001). However, in vivo high resolution imaging currently can only acquire limited
sites, the calcaneous, radius, and the knee. We chose to examine the knee in this study
because of the high prevalence of fracture incidence observed in this region for persons
with SCI (Comarr et al. 1962; Freehafer 1995; Ragnarsson and Sell 1981).
46
How can we explain the lack of differences in bone architecture between the pre-
and post-menopausal groups in this study? Changes in aBMD may not reflect structural
changes in trabeculae. The post-menopausal ambulatory women showed levels of aBMD
associated with osteopenia and osteoporosis for the total hip, trochanteric, lumbar and
total body regions as defined by the WHO (1994). Of the sites that were measured with
DXA, the lumbar spine has the highest trabecular composition (66% trabecular), which
was shown to be osteopenic for the post-menopausal group, while we did not show
differences in trabeculae of the knee. Results have been conflicting as to whether
trabecular measures correlate well with aBMD (Link et al. 1998; Majumdar et al. 1999;
Ouyang et al. 1998). In one report investigators have shown that trabecular measures of
the calcaneous did not correlate well with aBMD in the femur (Link et al. 1998).
Correlations between structural measures of the distal radius and radial aBMD were also
poor (r = 0.42 for app.Tb.N and - 0.42 for app.Tb.S, no significant relation to app.Tb.
BV/TV) and no there was no relation between any distal radius structural and proximal
femur aBMD measures (Majumdar et al. 1999). However, the same laboratory showed
stronger correlations (r = 0.60 – 0.72) between calcaneous BMD and calcaneal app.
BV/TV (Ouyang et al. 1998). Since the calcaneous is ~90% trabecular, 10% cortical, the
authors suggest that the significant relationship was not unexpected. Interestingly, Laib
et al. (1998) report various patterns in trabecular changes following menopause. Some
women lost trabecular thickness, some lost trabecular bone volume and number, while
others lost cortical thickness independently in the distal radius or were non-losers in the
first year following menopause (Laib et al. 1998). The disparity between our measures of
47
aBMD differences and trabecular differences is not readily explained, but could be
related to variable effects on trabeculae of estrogen among individuals.
Finally, it is also plausible that estrogen loss without a concomitant reduction of
loading or physical activity did not alter bone microstructure in the loaded plane. While
the axial plane is ideal to measure changes in architecture in groups with altered loading,
the influence of menopause on trabeculae may be more apparent in the horizontal
direction that could be measured in the coronal plane. Some evidence suggest that early
losses of trabecular bone are reflected as a greater relative loss of horizontal trabeculae,
compared to load bearing or vertical trabeculae (Oda et al. 1998; Thomsen et al. 2002).
Furthermore, it has been shown that load bearing trabeculae may increase in thickness to
account for lost horizontal structures (Atkinson 1967; Frost 1999; Parfitt et al. 1983).
The lack of differences thus may suffer from the selected plane that was imaged. To our
dismay, among the four measures of apparent trabecular measures presented in this study,
trabecular thickness is the least accurate due to the small size of trabeulae walls (78-200
µm) compared to pixel size (196 x 196 µm) and slice thickness (1000 µm) used in high
resolution MR scanning. This is noted as a limitation with the current technology
(Kothari et al. 1998).
The central purpose of this investigation was to compare the effects of menopause
verses SCI on trabecular bone of the knee. Clearly, unloading resulted in substantial
microarchitectural deterioration compared to estrogen loss. Differences in trabeculae
have been reported for pre- and post-menopausal for apparent measures of trabecular
bone in the calcaneous (Ouyang et al. 1998). Apparent trabecular bone volume fraction
was 16% less, thickness 11% less and spacing 17.5 % greater for the post-menopausal
48
group. The age differences between the groups was 26.5 yrs compared to the current
study of 10-12 yrs between pre- and post-menopausal groups and it is not clear if
important anthropometric characteristics were similar (height and weight). The young
age of women in the post-menopausal group in the present study (age ~55 yrs) may also
have contributed to the lack of differences in trabeculae. The reported differences in the
Ouyang et al. (1997) study are smaller than the measured differences in trabecular
parameters between ambulatory and SCI groups in the current study. This provides some
evidence that the effect of menopause compared to SCI may be smaller in magnitude.
However, comparing differences in calcaneus trabeculae to knee trabeculae should be
interpreted cautiously. It is evident from the two bones measured in this study that
trabeculae in different bones are affected to varying extents and it is well known that
trabeculae have different architecture in different bones (Ruegsegger 2001).
Microstructural deterioration due to immobilization vs. hormonal alteration was
compared in young rats. The trabecular bone in young ovariectormized rats (estrogen
free) or rats with sciatic neurectomy (unloaded) was deteriorated in tibial structures
compared to sham controls (Ito et al. 2002). Contrary to our findings in women, the
ovariectomized rats had 60 - 75% less trabecular bone volume, thinner and fewer
trabeculae that were spaced further apart compared to the unloaded rats. This suggests
that estrogen has stronger effects on the trabecular structural parameters compared to
unloading. Similar studies have not been conducted in full-grown animal models or
humans.
This study focused on trabecular bone in populations at risk for osteoporosis and
subsequent fractures. Examining microarchitecture is important because many have
49
reported no direct relationship between risk of fracture and the decrease in bone mass
(Bell et al. 1967; Cummings 1985; Dempster et al. 1986; Mann et al. 1992). In addition,
the lost structures may not be re-established because lamellar bone (ie. trabeculae) only
forms on existing bone (Parfitt 1987). In addition, the mechanotransduction theory of
bone cell activation suggests that a force or bending of the bone plays a critical role in
bone formation (Bloomfield 2001; Duncan and Turner 1995). If connectivity of
trabeculae were diminished, the deteriorated trabecular wall, which is no longer
connected, would not receive the mechanical stimulus necessary for bone formation.
Pharmacological treatments (selective estrogen modulators, bisphosphonates) also seem
unlikely to recover the structures as many work through altering existing activity of
osteoblasts and osteoclasts (decreasing activity, changing lifespans of cells, or decreasing
resorption depth) (see (Manolagas 2000; Seeman 2003). In the case of lost structures, it
seems plausible that the bone cells have also been lost and therefore trabeculae may not
be re-established. In contrast, limited data have shown increases in trabeculae following
interventions. Trabecular bone volume, thickness and number were increased following
low strain, high frequency stimulation in sheep (Rubin et al. 2002) and following re-
ambulation in tail suspended rats (Bourrin et al. 1995), and increased trabecular bone
density was increased following loading exercises in humans (Simkin et al. 1987).
Because loss in mineral density cannot completely explain fracture incidence and because
there are limited data to support recovering trabeculae, loss of structures are critical to
bone health.
In summary, this study showed decreased integrity of trabeculae about the knee in
SCI women between the ages of 22-63 compared to ambulatory women, hence unloading
50
had negative effects on trabeculae. In addition, there was an interaction between
menopause and spinal cord injury, such that the postmenopausal women with SCI had the
most deteriorated trabeculae in the tibia. Although menopause purportedly decreases
trabecular bone integrity, no differences were found regarding menopause in ambulatory
women. Because trabeculae loss is evident for individuals with SCI and fracture
incidence is high and it is unknown whether lost trabeculae can be re-established in
humans, studies should be undertaken to reverse bone loss in this population.
51
References
1. Manolagas SC. Birth and death of bone cells: basic regulatory mechanisms and implications for the pathogenesis and treatment of osteoporosis. Endocrine Reviews. 21(2): 115-137, 2000.
2. Rubin CT and Lanyon LE. Regulation of bone mass by mechanical strain magnitude. Calcified tissue international. 37(4): 411-417, 1985.
3. Giangregorio L and Blimkie CJ. Skeletal adaptations to alterations in weight-bearing activity: a comparison of models of disuse osteoporosis. Sports medicine 32(7), 2002.
4. Uebelhart D, Demiaux-Domenech B, Roth M and Chantraine A. Bone metabolism in spinal cord injured individuals and in others who have prolonged immobilisation. A review. Paraplegia 33: 669-673, 1995.
5. Claus-Walker J and Halstead LS. Metabolic and endocrine changes in spinal cord injury: IV. Compounded neurologic dysfunctions. Archives of physical medicine and rehabilitation. 63(12): 632-638, 1982.
6. Lazo MG, Shirazi P, Sam M, Giobbie-Hurder A, Blacconiere MJ and Muppidi M. Osteoporosis and risk of fracture in men with spinal cord injury. Spinal Cord 39: 208-214, 2001.
7. Biering-Sorensen F, Bohr HH and Schaadt OP. Longitudinal study of bone mineral content in the lumbar spine, the forearm and the lower extremities after spinal cord injury. European Journal of Clinical Investigation. 20(3): 330-335, 1990.
8. Garland DE, Stewart CA, Adkins RH, Hu SS, Rosen C, Liotta FJ and Weinstein DA. Osteoporosis after spinal cord injury. Journal of Orthopaedic Research 10: 371-378, 1992.
9. Roberts D, Lee W, Cuneo RC, Wittmann J, Ward G, Flatman R, McWhinney B and Hickman PE. Longitudinal study of bone turnover after acute spinal cord injury. Journal of Clinical Endocrinology & Metabolism 83: 415-422, 1998.
10. Minaire P, Neunier P, Edouard C, Bernard J, Courpron P and Bourret J. Quantitative histological data on disuse osteoporosis: comparison with biological data. Calcified Tissue Research. 17(1), 1974.

52
11. Castro MJ, Apple DF, Jr., Staron RS, Campos GE and Dudley GA. Influence of complete spinal cord injury on skeletal muscle within 6 mo of injury. J Appl Physiol 86: 350-358, 1999.
12. Chantraine A. Actual concept of osteoporosis in paraplegia. Paraplegia 16: 51-58, 1978.
13. Assessment of fracture risk and its application to screening for postmenopausal osteoporosis. Report of a WHO Study Group. World Health Organization technical report series. 843, 1994.
14. Seeman E. Reduced bone formation and increased bone resorption: rational targets for the treatment of osteoporosis. Osteoporosis international 14 Suppl 3: 2-8, 2003.
15. Looker AC, Johnston CC, Jr., Wahner HW, Dunn WL, Calvo MS, Harris TB, Heyse SP and Lindsay RL. Prevalence of low femoral bone density in older U.S. women from NHANES III. Journal of Bone and Mineral Research 10(5): 796-802, 1995.
16. Melton LJ, 3rd, Chrischilles EA, Cooper C, Lane AW and Riggs BL. Perspective. How many women have osteoporosis? Journal of Bone and Mineral Research 7(9): 1005-1010, 1992.
17. Vestergaard P, Krogh K, Rejnmark L and Mosekilde L. Fracture rates and risk factors for fractures in patients with spinal cord injury. Spinal Cord 36: 790-796, 1998.
18. Comarr AE, Hutchinson, R.H. and Bors E. Extremity fractures of patients with spinal cord injuries. American Journal of Surgery 103: 732-739, 1962.
19. Eichenholtz S. Management of long-bone fractures in paraplegic patients. Journal of Bone and Joint Surgery American 45: 299-310, 1963.
20. Frisbie JH. Fractures after myelopathy: the risk quantified. The Journal of Spinal Cord Medicine. 20(1): 66-69, 1997.
21. Krause JS. Aging after spinal cord injury: an exploratory study. Spinal Cord 38(2): 77-83, 2000.
53
22. Ragnarsson KT and Sell GH. Lower extremity fractures after spinal cord injury: a retrospective study. Archives of Physical Medicine and Rehabilitation 62: 418-423, 1981.
23. Consenus development conference: diagnosis, prophylaxis and treatment of osteoporosis. American Journal of Medicine 90: 107-110, 1991.
24. Beuf O, Ghosh S, Newitt DC, Link TM, Steinbach L, Ries M, Lane N and Majumdar S. Magnetic resonance imaging of normal and osteoarthritic trabecular bone structure in the human knee. Arthritis and Rheumatism 46: 385-393, 2002.
25. Research on the menopause. World Health Organization technical report series. 670, 1981.
26. Majumdar S, Newitt D, Mathur A, Osman D, Gies A, Chiu E, Lotz J, Kinney J and Genant H. Magnetic resonance imaging of trabecular bone structure in the distal radius: relationship with X-ray tomographic microscopy and biomechanics. Osteoporosis International 6: 376-385, 1996.
27. Majumdar S, Genant HK, Grampp S, Newitt DC, Truong VH, Lin JC and Mathur A. Correlation of trabecular bone structure with age, bone mineral density, and osteoporotic status: in vivo studies in the distal radius using high resolution magnetic resonance imaging. Journal of Bone and Mineral Research 12: 111-118, 1997.
28. Newitt DC, van Rietbergen B and Majumdar S. Processing and analysis of in vivo high-resolution MR images of trabecular bone for longitudinal studies: reproducibility of structural measures and micro-finite element analysis derived mechanical properties. Osteoporosis International 13: 278-287, 2002.
29. Ouyang X, Majumdar S, Link TM, Lu Y, Augat P, Lin J, Newitt D and Genant HK. Morphometric texture analysis of spinal trabecular bone structure assessed using orthogonal radiographic projections. Medical Physics 25: 2037-2045, 1998.
30. Kanaley JA, Sames C, Swisher L, Swick AG, Ploutz-Snyder LL, Steppan CM, Sagendorf KS, Feiglin D, Jaynes EB, Meyer RA and Weinstock RS. Abdominal fat distribution in pre- and postmenopausal women: The impact of physical activity, age, and menopausal status. Metabolism: Clinical and Experimental. 50(8): 976-982, 2001.
31. Freehafer AA. Limb fractures in patients with spinal cord injury. Archives of Physical Medicine and Rehabilitation 76: 823-827, 1995.
54
32. Garland DE, Adkins RH, Stewart CA, Ashford R and Vigil D. Regional osteoporosis in women who have a complete spinal cord injury. Journal of Bone and Joint Surgery 83-A: 1195-1200, 2001.
33. Binder EF and Kohrt WM. Relationships between body composition and bone mineral content and density in older women and men. Clinical Exercise Physiology 2: 84-91, 2000.
34. Ahlborg HG, Johnell O, Nilsson BE, Jeppsson S, Rannevik G and Karlsson MK. Bone loss in relation to menopause: a prospective study during 16 years. Bone. 28(3): 327-331, 2001.
35. Dawson-Hughes B, Harris SS, Krall EA, Dallal GE, Falconer G and Green CL. Rates of bone loss in postmenopausal women randomly assigned to one of two dosages of vitamin D. The American Journal of Clinical Nutrition. 61(5): 1140-1145, 1995.
36. Harris S, Dawson-Hughes B and Usda Human Nutrition Research Center on Aging TUBMA. Rates of change in bone mineral density of the spine, heel, femoral neck and radius in healthy postmenopausal women. Bone and mineral. 17(1): 87-95, 1992.
37. Lindsay R, Nieves J, Formica C, Henneman E, Woelfert L, Shen V, Dempster D and Cosman F. Randomised controlled study of effect of parathyroid hormone on vertebral-bone mass and fracture incidence among postmenopausal women on oestrogen with osteoporosis. Lancet. 350(9077): 550-555, 1997.
38. Link TM, Majumdar S, Augat P, Lin JC, Newitt D, Lu Y, Lane NE and Genant HK. In vivo high resolution MRI of the calcaneus: differences in trabecular structure in osteoporosis patients. Journal of Bone and Mineral Research 13: 1175-1182, 1998.
39. Majumdar S, Link TM, Augat P, Lin JC, Newitt D, Lane NE and Genant HK. Trabecular bone architecture in the distal radius using magnetic resonance imaging in subjects with fractures of the proximal femur. Osteoporosis International 10: 231-239, 1999.
40. Laib A, Hauselmann HJ and Ruegsegger P. In vivo high resolution 3D-QCT of the human forearm. Technology in Health Care 6: 329-337, 1998.
41. Oda K, Shibayama Y, Abe M and Onomura T. Morphogenesis of vertebral deformities in involutional osteoporosis. Age-related, three-dimensional trabecular structure. Spine. 23(9): 1050-1055, discussion 1056, 1998.
55
42. Thomsen JS, Ebbesen EN and Mosekilde LI. Age-related differences between thinning of horizontal and vertical trabeculae in human lumbar bone as assessed by a new computerized method. Bone 31: 136-142, 2002.
43. Atkinson PJ. Variation in trabecular structure of vertebrae with age. Calcified Tissue Research. 1(1), 1967.
44. Frost HM. On the trabecular "thickness"-number problem. Journal of Bone and Mineral Research 14(11): 1816-1821, 1999.
45. Parfitt AM, Mathews CH, Villanueva AR, Kleerekoper M, Frame B and Rao DS. Relationships between surface, volume, and thickness of iliac trabecular bone in aging and in osteoporosis. Implications for the microanatomic and cellular mechanisms of bone loss. Journal of clinical investigation 72: 1396-1409, 1983.
46. Kothari M, Keaveny TM, Lin JC, Newitt DC, Genant HK and Majumdar S. Impact of spatial resolution on the prediction of trabecular architecture parameters. Bone 22: 437-443, 1998.
47. Ruegsegger P. Imaging of bone structure. In: Bone Mechanics Handbook, edited by Cowin SC. New York: CRC Press, 2001, p. 9-1 - 9-24.
48. Ito M, Nishida A, Nakamura T, Uetani M and Hayashi K. Differences of three-dimensional trabecular microstructure in osteopenic rat models caused by ovariectomy and neurectomy. Bone 30: 594-598, 2002.
49. Bell GH, Dunbar O, Beck JS and Gibb A. Variations in strength of vertebrae with age and their relation to osteoporosis. Calcified Tissue Research. 1(1), 1967.
50. Cummings SR. Are patients with hip fractures more osteoporotic? Review of the evidence. American Journal of Medicine 78: 487-494, 1985.
51. Dempster DW, Shane E, Horbert W and Lindsay R. A simple method for correlative light and scanning electron microscopy of human iliac crest bone biopsies: qualitative observations in normal and osteoporotic subjects. Journal of Bone and Mineral Research 1(1): 15-21, 1986.
52. Mann T, Oviatt SK, Wilson D, Nelson D and Orwoll ES. Vertebral deformity in men. Journal of Bone and Mineral Research 7(11): 1259-1265, 1992.
56
53. Parfitt AM. Trabecular bone architecture in the pathogenesis and prevention of fracture. American Journal of Medicine 82: 68-72, 1987.
54. Bloomfield SA. Cellular and molecular mechanisms for the bone response to mechanical loading. International Journal of Sports Nutrition in Exercise and Metabolism 11 Suppl: S128-136, 2001.
55. Duncan RL and Turner CH. Mechanotransduction and the functional response of bone to mechanical strain. Calcified Tissue International. 57(5): 344-358, 1995.
56. Rubin C, Turner AS, Mèuller R, Mittra E, McLeod K, Lin W and Qin YX. Quantity and quality of trabecular bone in the femur are enhanced by a strongly anabolic, noninvasive mechanical intervention. Journal of Bone and Mineral Research 17(2): 349-357, 2002.
57. Bourrin S, Palle S, Genty C and Alexandre C. Physical exercise during remobilization restores a normal bone trabecular network after tail suspension-induced osteopenia in young rats. Journal of Bone and Mineral Research 10(5): 820-828, 1995.
58. Simkin A, Ayalon J and Leichter I. Increased trabecular bone density due to bone-loading exercises in postmenopausal osteoporotic women. Calcified Tissue International. 40(2): 59-63, 1987.
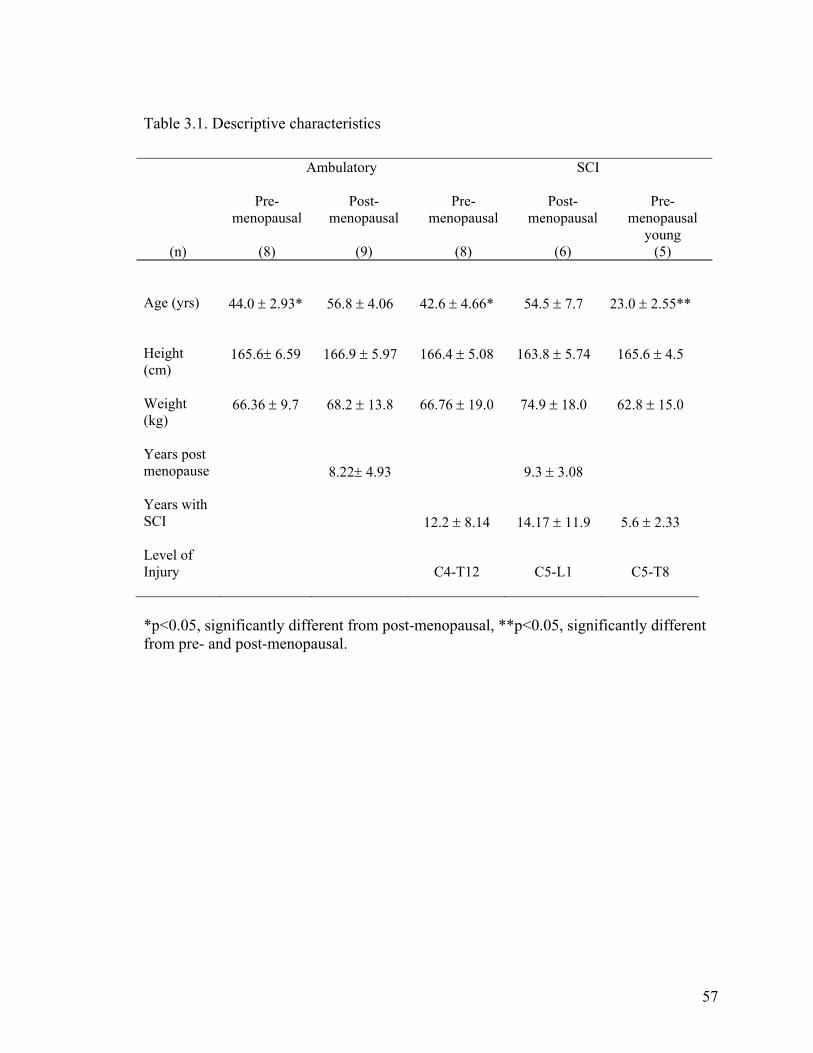
57
Table 3.1. Descriptive characteristics
*p<0.05, significantly different from post-menopausal, **p<0.05, significantly different from pre- and post-menopausal.
Ambulatory
SCI
(n)
Pre-menopausal
(8)
Post-menopausal
(9)
Pre-menopausal
(8)
Post-menopausal
(6)
Pre-menopausal
young (5)
Age (yrs)
44.0 ± 2.93* 56.8 ± 4.06 42.6 ± 4.66* 54.5 ± 7.7 23.0 ± 2.55**
Height (cm)
165.6± 6.59 166.9 ± 5.97 166.4 ± 5.08 163.8 ± 5.74 165.6 ± 4.5
Weight (kg)
66.36 ± 9.7 68.2 ± 13.8 66.76 ± 19.0 74.9 ± 18.0 62.8 ± 15.0
Years post menopause
8.22± 4.93
9.3 ± 3.08
Years with SCI
12.2 ± 8.14
14.17 ± 11.9
5.6 ± 2.33
Level of Injury
C4-T12
C5-L1
C5-T8
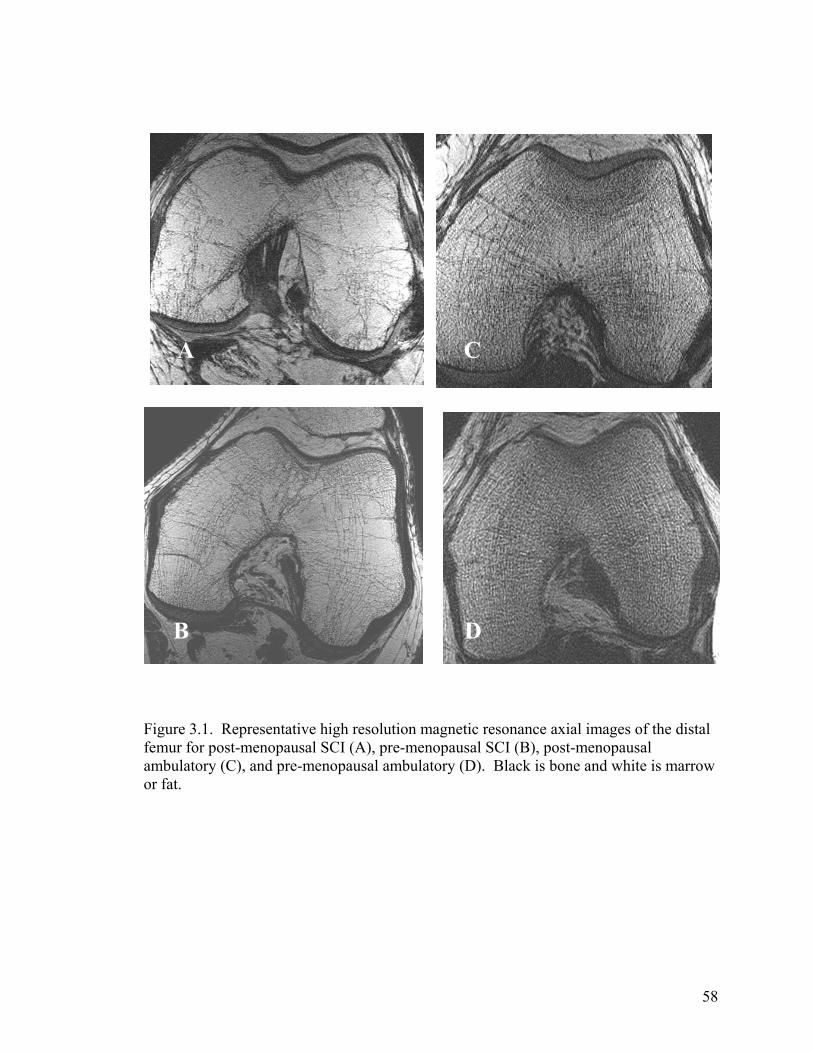
58
BD
Figure 3.1. Representative high resolution magnetic resonance axial images of the distal femur for post-menopausal SCI (A), pre-menopausal SCI (B), post-menopausal ambulatory (C), and pre-menopausal ambulatory (D). Black is bone and white is marrow or fat.
B D
A C
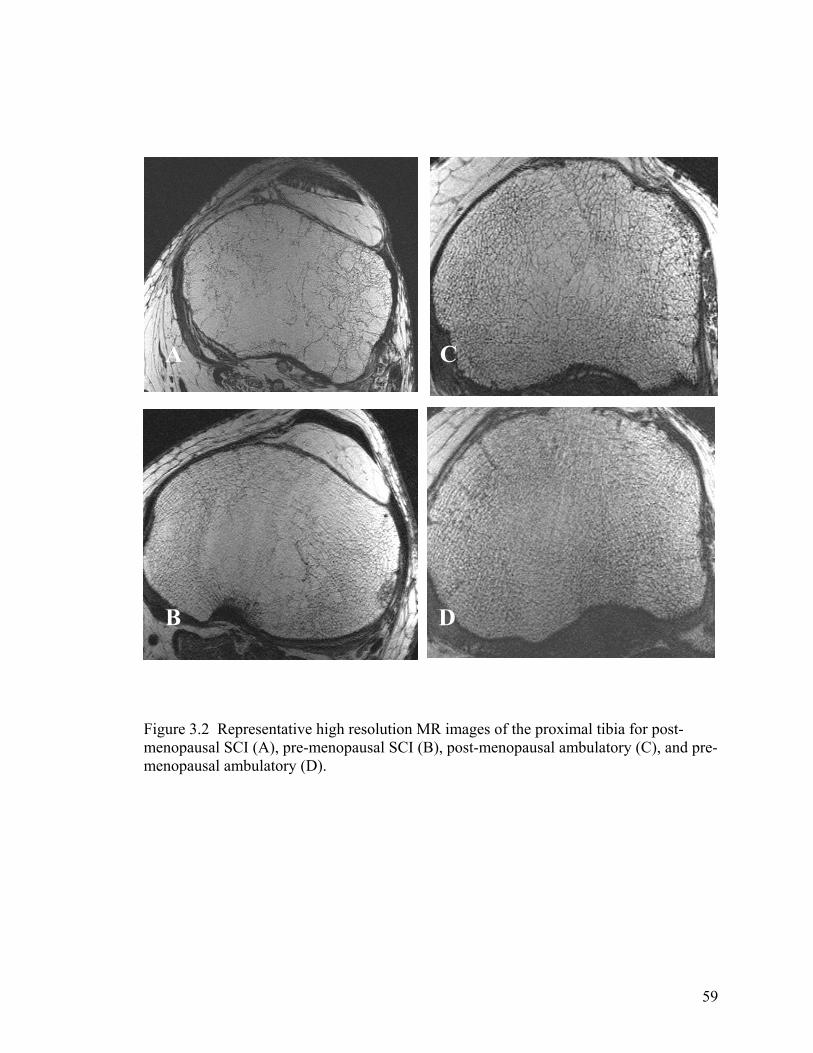
59
Figure 3.2 Representative high resolution MR images of the proximal tibia for post-menopausal SCI (A), pre-menopausal SCI (B), post-menopausal ambulatory (C), and pre-menopausal ambulatory (D).
AC
A C
B D
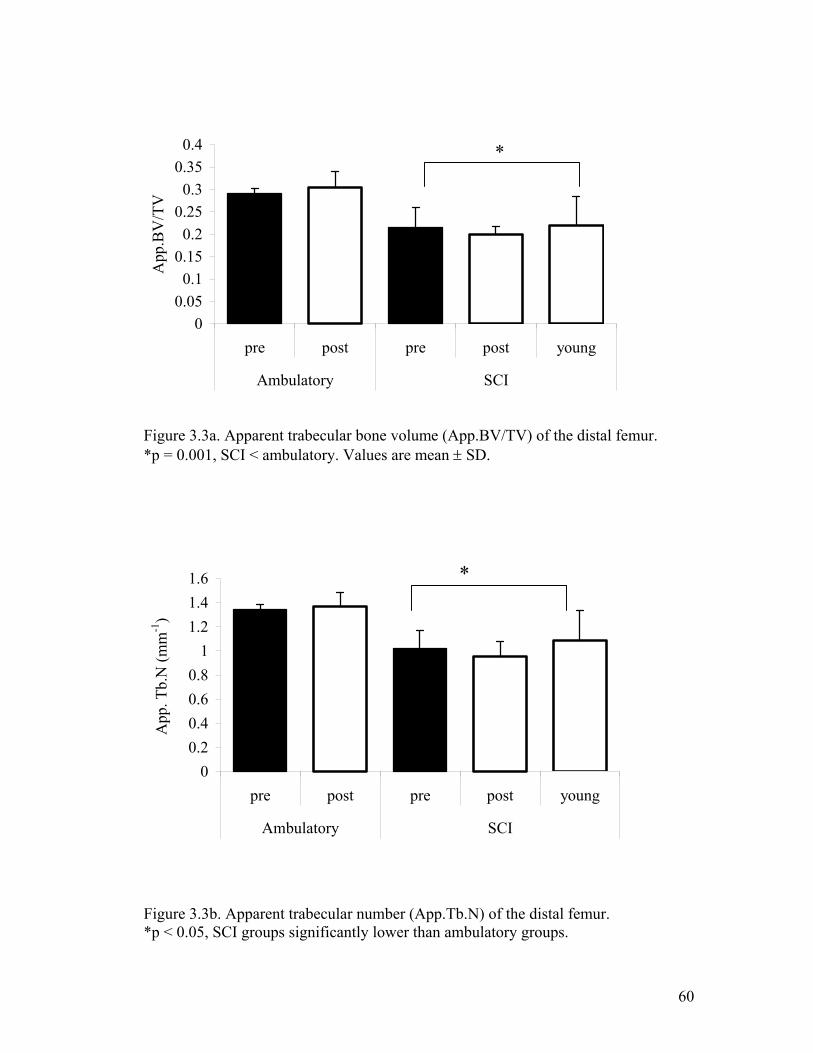
60
Figure 3.3a. Apparent trabecular bone volume (App.BV/TV) of the distal femur. *p = 0.001, SCI < ambulatory. Values are mean ± SD. Figure 3.3b. Apparent trabecular number (App.Tb.N) of the distal femur. *p < 0.05, SCI groups significantly lower than ambulatory groups.
00.05
0.10.15
0.20.25
0.30.35
0.4
pre post pre post young
Ambulatory SCI
App
.BV
/TV
*
00.20.40.60.8
11.21.41.6
pre post pre post young
Ambulatory SCI
App
. Tb.
N (m
m-1
)
*
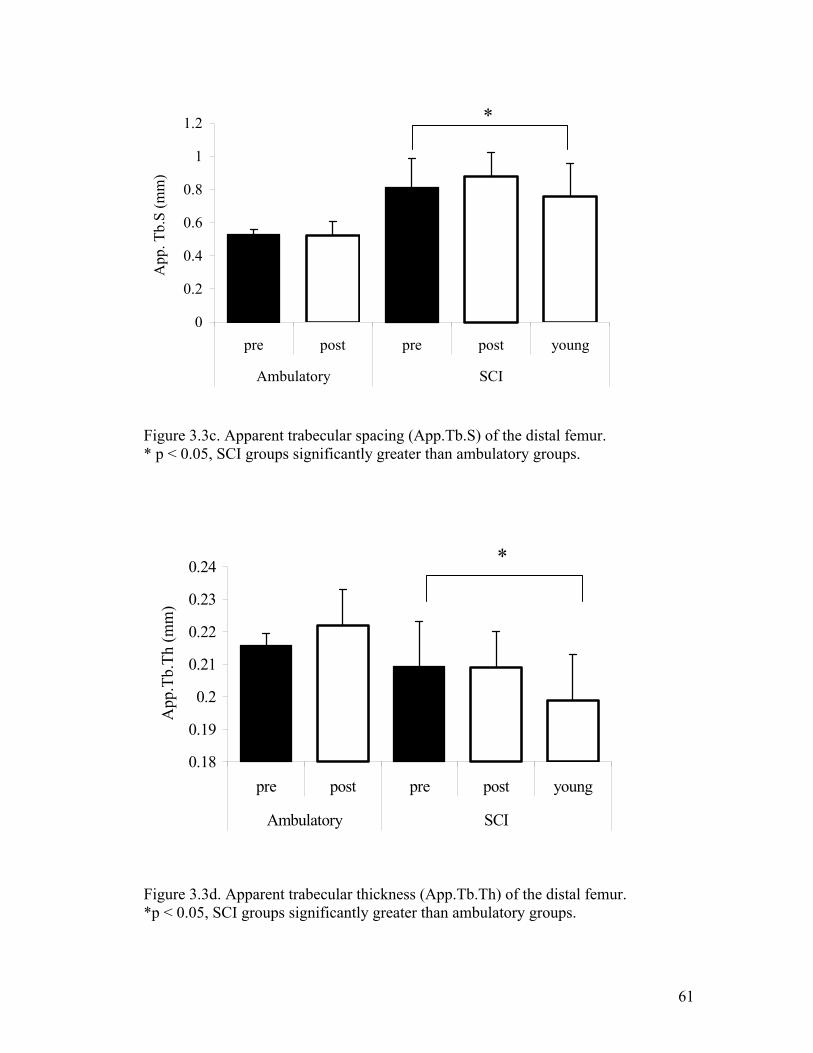
61
Figure 3.3c. Apparent trabecular spacing (App.Tb.S) of the distal femur. * p < 0.05, SCI groups significantly greater than ambulatory groups. Figure 3.3d. Apparent trabecular thickness (App.Tb.Th) of the distal femur. *p < 0.05, SCI groups significantly greater than ambulatory groups.
0
0.2
0.4
0.6
0.8
1
1.2
pre post pre post young
Ambulatory SCI
App
. Tb.
S (m
m)
*
0.18
0.19
0.2
0.21
0.22
0.23
0.24
pre post pre post young
Ambulatory SCI
App
.Tb.
Th (m
m)
*
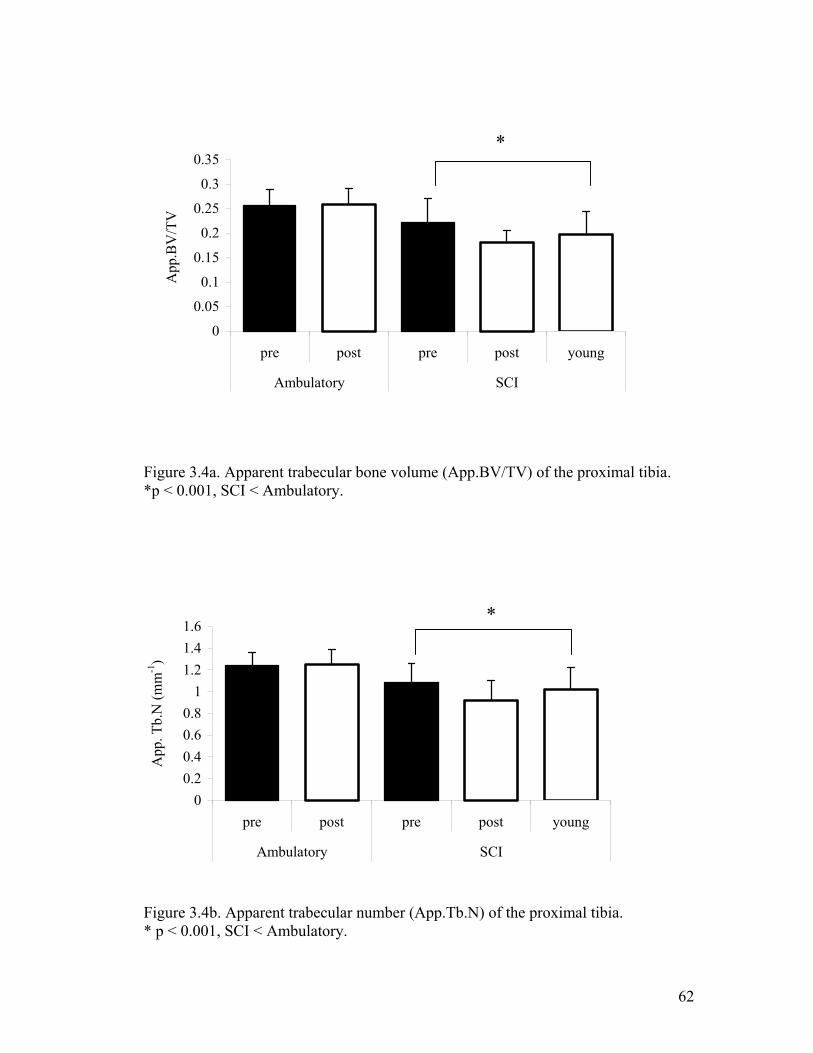
62
Figure 3.4a. Apparent trabecular bone volume (App.BV/TV) of the proximal tibia. *p < 0.001, SCI < Ambulatory. Figure 3.4b. Apparent trabecular number (App.Tb.N) of the proximal tibia. * p < 0.001, SCI < Ambulatory.
0
0.05
0.1
0.15
0.2
0.25
0.3
0.35
pre post pre post young
Ambulatory SCI
App
.BV
/TV
*
00.20.40.60.8
11.21.41.6
pre post pre post young
Ambulatory SCI
App
. Tb.
N (m
m-1
)
*
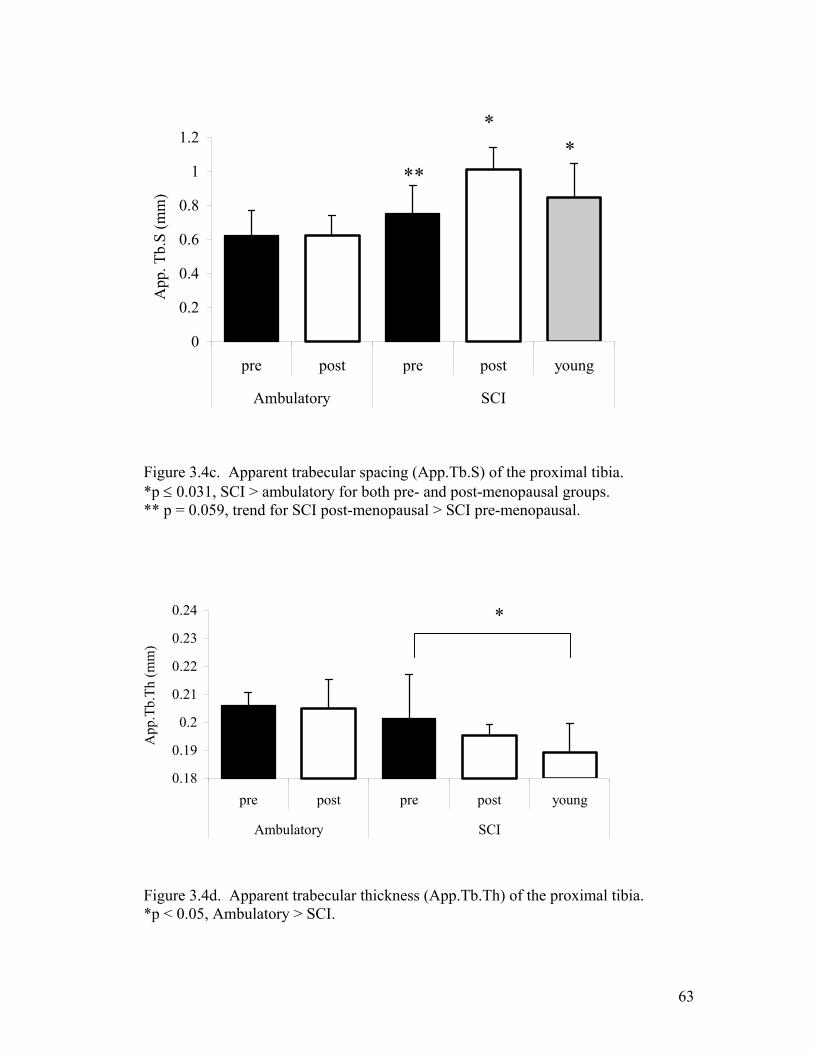
63
Figure 3.4c. Apparent trabecular spacing (App.Tb.S) of the proximal tibia. *p ≤ 0.031, SCI > ambulatory for both pre- and post-menopausal groups. ** p = 0.059, trend for SCI post-menopausal > SCI pre-menopausal. Figure 3.4d. Apparent trabecular thickness (App.Tb.Th) of the proximal tibia. *p < 0.05, Ambulatory > SCI.
0
0.2
0.4
0.6
0.8
1
1.2
pre post pre post young
Ambulatory SCI
App
. Tb.
S (m
m)
*
***
0.18
0.19
0.2
0.21
0.22
0.23
0.24
pre post pre post young
Ambulatory SCI
App
.Tb.
Th (m
m)
*
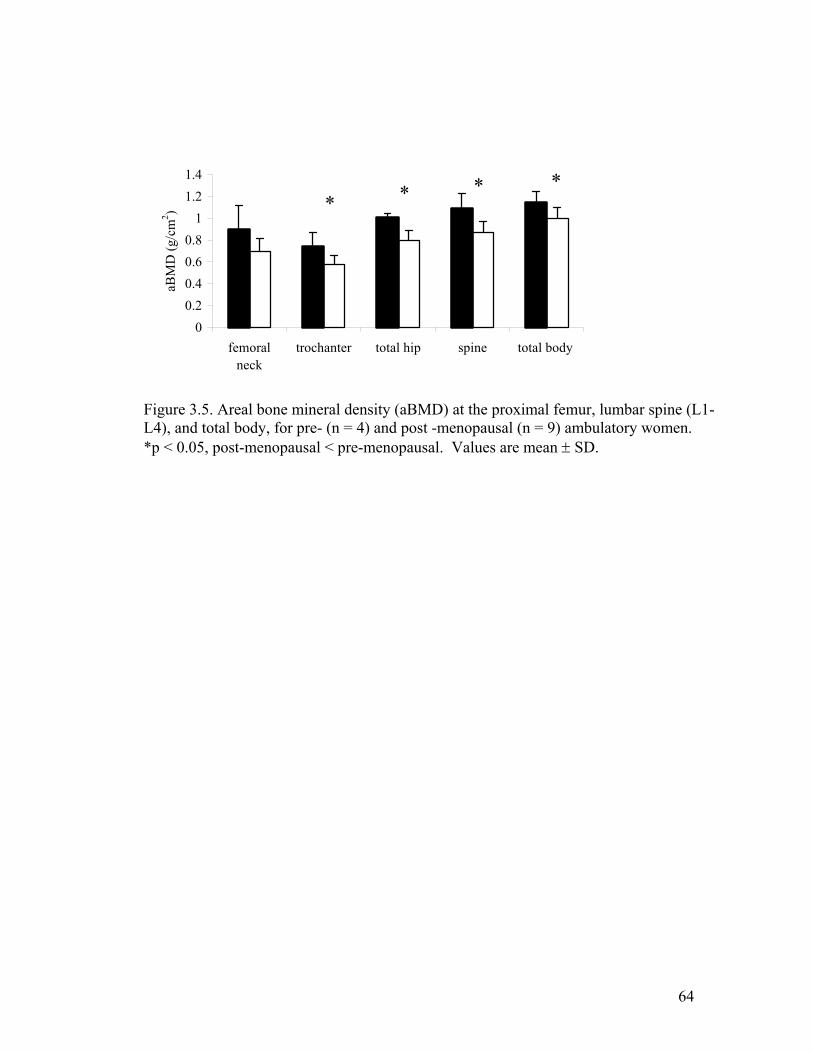
64
00.20.40.60.8
11.21.4
femoralneck
trochanter total hip spine total body
aBM
D (g
/cm
2 ) * * * *
Figure 3.5. Areal bone mineral density (aBMD) at the proximal femur, lumbar spine (L1-L4), and total body, for pre- (n = 4) and post -menopausal (n = 9) ambulatory women. *p < 0.05, post-menopausal < pre-menopausal. Values are mean ± SD.

65
CHAPTER IV
GEOMETRY OF THE MID FEMUR IS ALTERED AFTER SPINAL CORD
INJURY, BUT NOT EIGHT YEARS AFTER MENOPAUSE
IN ESTROGEN-FREE WOMEN 2
Slade, Jill M., C. Scott Bickel, Chris Modlesky, and Gary A. Dudley. To be submitted to
Bone.
66
Abstract
Bone geometry in the femoral shaft was measured in women with spinal cord
injury (SCI) and post-menopausal women to compare geometric parameters affected by
unloading vs. estrogen loss. Eighteen ambulatory women (7 pre-, 9 post-menopausal)
and 20 women with SCI (13 pre- and 7 post-menopausal) were examined for differences
in cortical, endosteal, and medullary volumes and widths using T1-weighted magnetic
resonance imaging. Post-menopausal women were not on estrogen replacement or other
medications known to affect bone and were ~ 8 years post-menopause. Cortical,
endosteal, and medullary volumes were 38% lower, ~50% higher, and 50% higher when
SCI groups were compared to ambulatory groups. Cortical width was 28-44% thinner in
the anterior, posterior, medial, and lateral sites, with the largest difference in the posterior
cortical wall. Endosteal width showed opposite, but similar effects. There were no
differences in the geometry of the femoral shaft in pre- and post-menopausal ambulatory
women. Large differences in mid-femoral geometry between ambulatory and SCI groups
are indicative of reduced bending strength, which are consistent with the high rate of
fracture in SCI women. Women without estrogen did not present with diminished shaft
structural geometry indicating that loading may have a stronger effect on mid-shaft
geometry than estrogen withdrawal.
67
Introduction
Numerous factors have been shown to influence bone health, both modifiable and
non-modifiable including sex, race, age, genetics, body size, hormones, diet, and loading.
Among the determinants of bone health, loading and estrogen loss have marked effects
on bone mass and structure. When loading and estrogen are removed, bone mass
typically declines and structures are modified (Giangregorio and Blimkie 2002;
Manolagas 2000; Uebelhart et al. 1995). Spinal cord injury (SCI) is the most dramatic
form of unloading, in which complete SCI results in the removal of motor control below
the level of injury. Menopause is associated with the loss of estrogen, experienced by
women who reach the age of 51.5 years. Both conditions are associated with increased
risk of osteoporosis and subsequent fractures (Biering-Sorensen et al. 1990; Looker et al.
1995; Vestergaard et al. 1998).
Among the changes in bone structure, cortical bone may decrease ~1-3% per year
for the first five years following menopause (1994), followed by a continued age-related
decline. Following SCI, areal bone mineral density (aBMD) in regions associated with
cortical bone such as the femoral shaft have been shown to decline by 20-25 % during the
first two years after injury (Biering-Sorensen et al. 1990). Geometric changes in women
that occur due to aging consist of expansion in the medullary cavity and deterioration in
endocortical areas of the bone and has been shown in the tibial and femoral shaft.
Although periosteal apposition offsets endocortical losses with age in men, this has not
effectively been shown in women (Martin and Atkinson 1977; Ruff and Hayes 1988).
Furthermore, it is not clear to what degree, if any, these changes are influenced by
estrogen loss.
68
We have observed changes in geometric properties of the femur in men with SCI,
namely, decreases in cortical volume and expansion in medullary and endosteal volumes
(unpublished findings). However, there are few data on the specific changes in bone
geometry that occur in women with SCI. Measures of bone architecture are important
because they can be used to predict bending strength (cross-sectional moment of inertia).
In addition bone geometry may help to explain differences in fracture risk as bone mass
does not completely discriminate between those who have and have not experienced
fractures (Bell et al. 1967; Cummings 1985; Dempster et al. 1986; Mann et al. 1992).
Imaging technology permits acquisition of bone architecture in vivo for both
trabecular (Majumdar et al. 1999) and cortical bone architecture (Adami et al. 1999;
Augat et al. 1996; Beck et al. 1992; de Bruin et al. 2000a; Duncan et al. 2002; Nelson et
al. 2000; Woodhead et al. 2001). Although bone turnover is greater in highly trabecular
regions and hence is more affected by significant changes in hormonal or loading status,
cortical bone changes may be affected to a lesser but similar extent. Relatively few
laboratories in the world have the imaging acquisition and analysis tools to make
structural measures of trabeculae (Boutry et al. 2003; Laib et al. 1998; Majumdar et al.
1996). The availability to accurately measure bone geometry in vivo is simpler, less
expensive, and less time consuming compared to high resolution MRI that is required to
accurately assess apparent trabecular parameters. In a previous paper (Slade et al.), we
examined trabecular bone of the distal femur in pre- and post-menopausal able-bodied
and SCI women. Here, we compare the results of the geometric structure of the mid-
femur measured by standard T1-wieghted proton magnetic resonance imaging (MRI) to
the trabecular bone of the distal femur to determine the relationship, if any.
69
The purposes were to compare bone geometry of the femur shaft in SCI vs. post
menopausal women. We hypothesized that cortical regions would be smaller in SCI and
post-menopausal women compared to pre-menopausal women and cortical regions would
be smaller in SCI vs. post-menopausal women. The opposite effect was hypothesized for
medullary and endosteal regions. The reliability for bone volumes and widths was also
measured to support findings. We examined the relationship between femoral shaft
cortical bone volume and thigh muscle volume. The last purpose was to examine the
relationship between trabeculae in the distal femur and cortical bone in the mid-femoral
shaft.
Methods
Subjects
Five groups of women were recruited for this study: ambulatory pre- and post-
menopausal women, post-menopausal women with SCI, pre-menopausal women with
SCI-older, pre-menopausal SCI-younger. Women were recruited from the local
communities of Athens and Atlanta and from the Shepherd Center, Atlanta, GA.
Four groups were matched for height, weight, and race. The pre-menopausal
ambulatory group and the older pre-menopausal SCI group were matched for age and the
postmenopausal groups were matched for age and time since menopause. Pre-
menopausal women > 40 years of age were recruited to reduce the age differences
between the pre- and post-menopausal groups. Post-menopausal women were recruited
approximately 5 years or more post-menopause. Menopause was defined according to
the World Health Organization: 12 months after the cessation of normal menstrual cycles
(1981). Exclusionary criteria included fractures or hardware in both lower extremities,
70
heterotopic ossification in both lower extremities, long-term medication use known to
affect bone (i.e. corticosteroids), and known bone disorders or disorders known to
influence bone including hyperthyroidism. Post-menopausal women were not taking any
medications known to effect bone (estrogen replacement, hormone replacement,
bisphosphonates, soy supplements, or estrovan) for at least the previous five years. We
recruited individuals that were not involved in heavy loading activities. Women with
spinal cord injury were recruited who had complete spinal cord injuries (American Spinal
Cord Injury Association rating of A) and were ≥ 2 years post injury. This study was
approved by the Institution Review Boards at the University of Georgia and Shepherd
Center. All participants provided written informed consent prior to enrollment in the
study.
Muscle morphology
Magnetic resonance imaging (MRI) was used to examine bone geometry and
skeletal muscle morphology of the thigh. MR imaging for bone geometry of the mid-
third of the femur has been validated previously (Woodhead et al. 2001). Briefly, T1
weighted MR images were taken of one thigh with a 1.5T magnet. The whole-body coil
was used (TR/TE 500/14 ms, FOV (20-24 cm, 256 x 256 matrix). A 48-cm FOV scout
was used to measure the femoral length and determine the middle-third (Figure 4.1).
Transaxial images, 1-cm thick and 0.5-cm apart, were taken from the knee joint to the
hip, using only the slices corresponding to the middle third for width and volume
measures. Skeletal muscle volume of the thigh corresponding to the middle third of the
femur was reported in a previous paper (Slade et al. 2003).
Reliability
71
Previous research has shown that MR imaging of the femoral mid shaft is reliable
in total, medullary and cortical areas and volumes (Woodhead et al. 2001). Cortical
width has been shown to have poor reliability and accuracy, however only one slice was
previously used to determine these measures. Endosteal volume and width reliability has
not been evaluated with MR imaging. In addition, this study was conducted at two
imaging locations, albeit using identical GE 1.5 T MR imagers. Therefore, four able-
bodied subjects volunteered to be tested at both sites to determine test-retest reliability
between sites. As described above, femur length was measured and slices were acquired
from the knee to the hip, selecting those images corresponding with the middle third
region.
Images were analyzed on specifically designed software (X-Vessel, East Lansing,
MI) as previously described (Kanaley et al. 2001). Images were segmented into
fat/marrow (high intensity), endosteal bone (mid-intensity) and cortical bone (low
intensity). A first-pass segmentation corrected for inhomogeneous signal intensity
variations across the image. The image was then resegmented into three intensity
components using a fuzzy c-mean clustering algorithm. Pixel number at each intensity
was determined and was converted to area by multiplying by the field of view (20-24)
and dividing by the total number of pixels in the image. This value was multiplied by 1.5
to account for the 0.5 cm between slices to calculate mid third femoral shaft bone
volumes. For width the measurements, the center of bone was located and the pixels
counted and corrected for field of view as described. Images were analyzed by a single
investigator to maintain consistency.
72
Statistical analysis
Two-way analyses of variance (ambulatory vs. SCI and pre-menopause vs. post-
menopause vs. young) were used to determine differences in age, height, and weight
(SPSS version 11). One-way ANOVA was used to detect differences in time since
menopause and time after spinal cord injury. Two-way ANOVA was also used to
determine differences in medullary, endosteal and cortical volumes. Mixed model
repeated measures ANOVA was used to determine differences between the groups (amb
x menopause) and within medullary width direction (anterior-posterior vs. medial-lateral
width). Mixed model repeated measures ANOVA was also used to determine
differences between the five groups and within the four-bone width sites (medial, lateral,
anterior, and posterior) for cortical and endosteal bone. Planned comparisons were used
with a modified Bonferroni correction when necessary. Pearson’s r was used to evaluate
the correlation between thigh muscle volume and cortical volume and the relationship
between relative trabecular bone volume (apparent trabecular bone volume) in the distal
femur and cortical cross sectional area in the mid-femur. Pearson’s r was used to
calculate the intra-rater reliability in bone measures. For test-retest and imaging site
reliability, the coefficient of variation (CV) was calculated for volumes and widths in the
femoral shaft. Significance was set at p < 0.05.
Results
Reliability
Mid femoral intra-rater and test-retest reliability was examined in four able-
bodied individuals (3/1 males/female, 28 ± 3 years). Intra-rater reliability was excellent
both slice by slice and for measures of volumes and widths (r2 = 0.998). Agreement
73
between magnets at different locations was excellent for cortical (CV = 0.785 ± 0.418
%), medullary (CV = 2.33 ± 1.30 %) and total bone volumes (CV = 0.428 ± 0.10 %) and
tight for endosteal volume (CV = 3.17 ± 1.90 %). Marrow and cortical widths were also
reliable (CV = 2.93 ± 1.91% and CV = 2.25 ± 0.93 %), while endosteal width had fair
reliability (CV = 6.10 ± 6.90 %).
Subjects
SCI: Eight post-menopausal and 13 pre-menopausal women with SCI volunteered
for the study and met the criteria. One of the post-menopausal women dropped from the
study, resulting in seven post-menopausal women with SCI. Age, height, body weight,
and time since injury were not different between the SCI groups (Table 1) and were not
different from the ambulatory groups. Three of the women with SCI were current
smokers (0.5 pack per day, one in each group). Two women in each SCI group were
African American, all others were Caucasian.
Ambulatory subjects: Nine ambulatory post-menopausal women and seven pre-
menopausal women were also selected for the study. Age, height, and body weight were
not different between the two ambulatory groups (Table 4.1). Time since menopause was
not different compared to the post-menopausal women with SCI. No women in the
ambulatory groups were current smokers. Two women were African American in the
post-menopausal group and one in the pre-menopausal group, all others were Caucasian.
Bone volumes
Femur length was not different for menopause or ambulatory status (Table 4.1).
Mid third bone volume was not significantly different between the pre- and post-
menopausal groups (78 ± 13 cm3 vs. 77 ± 13 cm3) or between the ambulatory vs. SCI
74
groups (79 ± 12.7 cm3 vs. 75 ± 12.0 cm3). Ambulatory status had a significant effect on
medullary, endosteal, and cortical volumes (Figures 4.2 & 4.3). Marrow volume was
51% larger in SCI vs. ambulatory women (SCI vs. amb = 31.47 ± 9.30 cm3 vs. 20.8 ±
4.84 cm3; F(1,35) = 13.5, p = 0.001). Endosteal volume was 51.3% larger in SCI groups
vs. ambulatory groups (SCI vs. amb: 13.01 ± 5.33 cm3 vs. 8.60 ± 2.50 cm3; F(1,35) =
10.2, p =0.003). Cortical volume was 37.7% less in SCI compared to ambulatory women
(SCI vs. amb: 30.8 ± 11.99 vs. 49.4 ± 10.17 cm3; F(1,35) = 22.8, p = 0.001).
Bone widths
Medullary width had main effects for both ambulatory status and direction. SCI
groups had ~ 25% greater width in both directions compared to ambulatory (F(1,31) =
152.7, p = 0.001) and the anterior-posterior was 20% wider than medial-lateral width in
both SCI and ambulatory groups (F(1,31) = 14.5, p = 0.001). For cortical width, there
was a site x ambulation interaction (F(3,93) 4.6 = p = 0.005). Paired samples t-test
showed that the medial, lateral, and posterior sides were all greater then the anterior side
of the femur for SCI and ambulatory groups (p ≤ 0.005) (Table 4.2). For ambulatory
women, the posterior site was greater than the lateral site (p = 0.005) (Table 4.2).
Cortical width was lower at all sites for the SCI groups vs. the ambulatory groups (41%,
28%, 40.8%, and 44.2% lower for medial, lateral, anterior, and posterior, respectively).
For endosteal bone, again there was again a site x ambulation interaction (F(3,93) = 4.6 p
= 0.005). Paired samples t-tests showed that the posterior and medial endosteal width
was greater than anterior in ambulatory individuals (p ≤ 0.004). The posterior region had
more endosteal bone in the SCI group compared to the medial, lateral and anterior sides
(p < 0.001).
75
Cortical volume and skeletal muscle of the thigh
Mean values for mid-thigh muscle volume have been reported previously for this
sample (Slade et al. 2003). There was a significant positive relation between mid thigh
muscle volume and cortical volume in ambulatory women (r = 0.689, p < 0.01), however,
women with SCI did not show this relation (Figure 4.4).
Cortical volume vs. trabeculae
Although cortical (volume and CSA) and trabecular measures were significantly
lower for SCI vs. ambulatory women, average cortical CSA was unrelated to trabecular
measures (trabecular number, bone volume fraction, spacing) within each group (see
figure 4.5).
Discussion
Unloading had remarkable effects on the mid-third femoral shaft in women with
SCI, albeit no changes in total bone volume. Cortical thinning and concomitant
medullary expansion can result in reduced bone strength, therefore increasing fracture
risk. Our results extend the findings of our previous results in men with chronic SCI
(unpublished results). However, women with SCI tend to have even more reduced
cortical volumes compared to men with SCI (37% in women vs. 22.7% in men). This
also is greater than the decline in femoral shaft aBMD reported for a group comprised of
seven males and two females (Biering-Sorensen et al. 1990). aBMD in the femoral shaft,
an area comprise of mainly cortical bone, declined approximately 20% over two years.
This may help to explain the higher incidence of fracture in women with SCI compared
to men (Vestergaard et al. 1998).
76
Our results show ~25% greater medullary cavity width in SCI vs. ambulatory
women. Greater anterior-posterior marrow width compared to medial-lateral width has
been found in cadaver femora (Stephenson and Seedhom 1999) and men with and
without SCI (unpublished results). All sites of the cortical walls were lower for SCI
groups in the current study. The effects on the cortical width in women with SCI were
similar to the effects found in men (unpublished results). In both cases, we found that the
posterior cortical walls were ~45% thinner compared to ambulatory groups. Women
with SCI had deteriorated posterior cortical walls which is important considering this site
typically is thicker than the other sites (our ambulatory females and (Stephenson and
Seedhom 1999). In conjunction, endosteal width in the posterior regions was greater for
women and men with SCI. The posterior sites were much greater than all other sites in
SCI, whereas in able-bodied individuals, site does not influence the amount of endosteal
bone. We speculate that this is due to specific muscle origins (vastus medialis and
lateralis on the medial and lateral lip of the linea aspera) and insertions (adductors) along
the posterior side of the femur. However, this may not be the case since cortical volume
was not related to thigh muscle volume.
Our data do not show effects of menopause on any bone parameters in the mid
femur. Others have reported significantly lower findings when comparing pre- and post-
menopausal women (Han et al. 1996). Han et al. (1996) reported 9.6% and 15.9% lower
cortical width in the iliac of post-menopausal women compared to pre-menopausal
women, respectively for Caucasian and African American women. However, the age
differences in that study were ~25 years between pre- and post-menopause. It must be
realized, as the authors clearly state, that the differences were due to age/menopause,

77
which could not be separated. Our data representing pre- and post-menopausal women
who are ~10 years different in age would suggest that declines can be more readily
explained by age vs. estrogen loss associated with menopause. From previous studies, it
is known that bending strength is reduced in the femoral shaft from loss of cortical
volume (Martin and Atkinson 1977; Ruff and Hayes 1988). These changes in geometry
appear to occur after the age of 35, however the specific age period in which changes are
accelerated (if any) are not known. Our data suggest that any changes to the femoral
shaft geometry occur at a later age and may not be influenced by loss of estrogen.
Geometry of paralyzed bone was first examined using tibias from older male cadavers (n
= 4, age = 66 years) (Lee et al. 1997). The entire range of the shaft was measured
showing thinner cortical widths of ~ 20-40% compared to ambulatory controls, which is
similar to our findings. Tibial geometry has also been studied in vivo. Cortical bone loss
in the tibial shaft is 12.5% over ~ 2 years, which is much lower than our findings in the
femur, possibly due to men with complete and incomplete SCI (de Bruin et al. 2000b).
These investigators also showed that bone cross sectional area in the tibia was ~25-35%
lower in men with complete SCI vs. able-bodied control (de Bruin et al. 2000a). As
periosteal apposition occurs in men with age, the increase in periosteal apposition offset
losses in cortical bone and bone strength was not diminished. However, women,
including those with SCI do not experience periosteal expansion in the lower extremities,
therefore it is expected that the loss in cortical volume would result in decreased bending
strength.
Bone geometry of the mid femur has been previously been measured in women
with SCI by using radiographs to measure cortical width (Kiratli et al. 2000). Although
78
the technique is limited, these data showed that the inner diameter of the femoral
midshaft was 40% larger in women with SCI compared to controls and this value was
larger compared to men with SCI who showed 27% greater inner cortical diameter, which
resulted in lower measures of bending strength for females with SCI compared to males.
Their data nicely compliment the findings from this study while our findings also show
site-specific decrements and show that non-biased MR imaging can be used to measure
structural shaft geometry.
These data suggest that mid-femoral geometry does not accurately reflect
structural measures from the distal femur. While it cannot replace structure measures of
trabeculae, cortical measures are nonetheless important determinants of bone strength and
resistance to bending. Our results show the dramatic effect of unloading on endocortical
bone and show that geometry is not significantly different in the shaft of pre- vs. post-
menopausal ambulatory women. The change in cortical volume and width appears to be
more age-related and not due to estrogen loss per se. It is clear that unloading has effects
on mid-femoral geometry that far outweigh any losses that might be linked to menopause,
as we detected none.
79
References
1. Giangregorio L and Blimkie CJ. Skeletal adaptations to alterations in weight-bearing activity: a comparison of models of disuse osteoporosis. Sports Medicine 32(7), 2002.
2. Manolagas SC. Birth and death of bone cells: basic regulatory mechanisms and implications for the pathogenesis and treatment of osteoporosis. Endocrine Reviews. 21(2): 115-137, 2000.
3. Uebelhart D, Demiaux-Domenech B, Roth M and Chantraine A. Bone metabolism in spinal cord injured individuals and in others who have prolonged immobilisation. A review. Paraplegia 33: 669-673, 1995.
4. Biering-Sorensen F, Bohr HH and Schaadt OP. Longitudinal study of bone mineral content in the lumbar spine, the forearm and the lower extremities after spinal cord injury. European Journal of Clinical Investigation. 20(3): 330-335, 1990.
5. Looker AC, Johnston CC, Jr., Wahner HW, Dunn WL, Calvo MS, Harris TB, Heyse SP and Lindsay RL. Prevalence of low femoral bone density in older U.S. women from NHANES III. Journal of Bone and Mineral Research 10(5): 796-802, 1995.
6. Vestergaard P, Krogh K, Rejnmark L and Mosekilde L. Fracture rates and risk factors for fractures in patients with spinal cord injury. Spinal Cord 36: 790-796, 1998.
7. Assessment of fracture risk and its application to screening for postmenopausal osteoporosis. Report of a WHO Study Group. World Health Organization technical report series. 843, 1994.
8. Martin RB and Atkinson PJ. Age and sex-related changes in the structure and strength of the human femoral shaft. Journal of Biomechanics 10: 223-231, 1977.
9. Ruff CB and Hayes WC. Sex differences in age-related remodeling of the femur and tibia. Journal of Orthopaedic Research 6(6), 1988.
10. Bell GH, Dunbar O, Beck JS and Gibb A. Variations in strength of vertebrae with age and their relation to osteoporosis. Calcified Tissue Research. 1(1), 1967.
11. Cummings SR. Are patients with hip fractures more osteoporotic? Review of the evidence. American Journal of Medicine 78: 487-494, 1985.
80
12. Dempster DW, Shane E, Horbert W and Lindsay R. A simple method for correlative light and scanning electron microscopy of human iliac crest bone biopsies: qualitative observations in normal and osteoporotic subjects. Journal of Bone and Mineral Research 1(1): 15-21, 1986.
13. Mann T, Oviatt SK, Wilson D, Nelson D and Orwoll ES. Vertebral deformity in men. Journal of Bone and Mineral Research 7(11): 1259-1265, 1992.
14. Majumdar S, Link TM, Augat P, Lin JC, Newitt D, Lane NE and Genant HK. Trabecular bone architecture in the distal radius using magnetic resonance imaging in subjects with fractures of the proximal femur. Osteoporosis International 10: 231-239, 1999.
15. Adami S, Gatti D, Braga V, Bianchini D and Rossini M. Site-specific effects of strength training on bone structure and geometry of ultradistal radius in postmenopausal women. Journal of Bone and Mineral Research 14(1): 120-124, 1999.
16. Augat P, Reeb H and Claes LE. Prediction of fracture load at different skeletal sites by geometric properties of the cortical shell. Journal of Bone and Mineral Research 11(9): 1356-1363, 1996.
17. Beck TJ, Ruff CB, Scott WW, Jr., Plato CC, Tobin JD and Quan CA. Sex differences in geometry of the femoral neck with aging: a structural analysis of bone mineral data. Calcified Tissue International. 50(1): 24-29, 1992.
18. de Bruin ED, Herzog R, Rozendal RH, Michel D and Stussi E. Estimation of geometric properties of cortical bone in spinal cord injury. Archives of Physical Medicine and Rehabilitation 81: 150-156, 2000a.
19. Duncan CS, Blimkie CJ, Kemp A, Higgs W, Cowell CT, Woodhead H, Briody JN and Howman-Giles R. Mid-femur geometry and biomechanical properties in 15- to 18-yr-old female athletes. Medicine and Science in Sports and Exercise 34: 673-681, 2002.
20. Nelson DA, Barondess DA, Hendrix SL and Beck TJ. Cross-sectional geometry, bone strength, and bone mass in the proximal femur in black and white postmenopausal women. Journal of Bone and Mineral Research 15: 1992-1997, 2000.
21. Woodhead HJ, Kemp AF, Blimkie CJR, Briody JN, Duncan CS, Thompson M, Lam A, Howman-Giles R and Cowell CT. Measurement of midfemoral shaft geometry:
81
repeatability and accuracy using magnetic resonance imaging and dual-energy X-ray absorptiometry. Journal of Bone and Mineral Research 16: 2251-2259, 2001.
22. Boutry N, Cortet B, Dubois P, Marchandise X and Cotten A. Trabecular bone structure of the calcaneus: preliminary in vivo MR imaging assessment in men with osteoporosis. Radiology 227: 708-717, 2003.
23. Laib A, Hauselmann HJ and Ruegsegger P. In vivo high resolution 3D-QCT of the human forearm. Technology in Health Care 6: 329-337, 1998.
24. Majumdar S, Newitt D, Mathur A, Osman D, Gies A, Chiu E, Lotz J, Kinney J and Genant H. Magnetic resonance imaging of trabecular bone structure in the distal radius: relationship with X-ray tomographic microscopy and biomechanics. Osteoporosis International 6: 376-385, 1996.
25. Research on the menopause. World Health Organization technical report series. 670, 1981.
26. Slade JM, Bickel CS, Modlesky CM, Majumdar S and Dudley GA. Trabecular bone is more deteriorated in spinal cord injured vs. estrogen-free postmenopausal women. In preparation: Osteoporosis International, 2003.
27. Kanaley JA, Sames C, Swisher L, Swick AG, Ploutz-Snyder LL, Steppan CM, Sagendorf KS, Feiglin D, Jaynes EB, Meyer RA and Weinstock RS. Abdominal fat distribution in pre- and postmenopausal women: The impact of physical activity, age, and menopausal status. Metabolism: Clinical and Experimental. 50(8): 976-982, 2001.
28. Stephenson P and Seedhom BB. Cross-sectional geometry of the human femur in the mid-third region. Proceedings of the Institution of Mechanical Engineers. Part H, Journal of engineering in medicine. 213(2), 1999.
29. Han ZH, Palnitkar S, Rao DS, Nelson D and Parfitt AM. Effect of ethnicity and age or menopause on the structure and geometry of iliac bone. Journal of Bone and Mineral Research 11(12): 1967-1975, 1996.
30. Lee TQ, Shapiro TA and Bell DM. Biomechanical properties of human tibias in long-term spinal cord injury. Journal of Rehabilitation Research and Development 34: 295-302, 1997.

82
31. de Bruin ED, Dietz V, Dambacher MA and Stussi E. Longitudinal changes in bone in men with spinal cord injury. Clinical Rehabilitation 14: 145-152, 2000b.
32. Kiratli BJ, Smith AE, Nauenberg T, Kallfelz CF and Perkash I. Bone mineral and geometric changes through the femur with immobilization due to spinal cord injury. Journal of Rehabilitation Research and Development 37: 225-233, 2000.
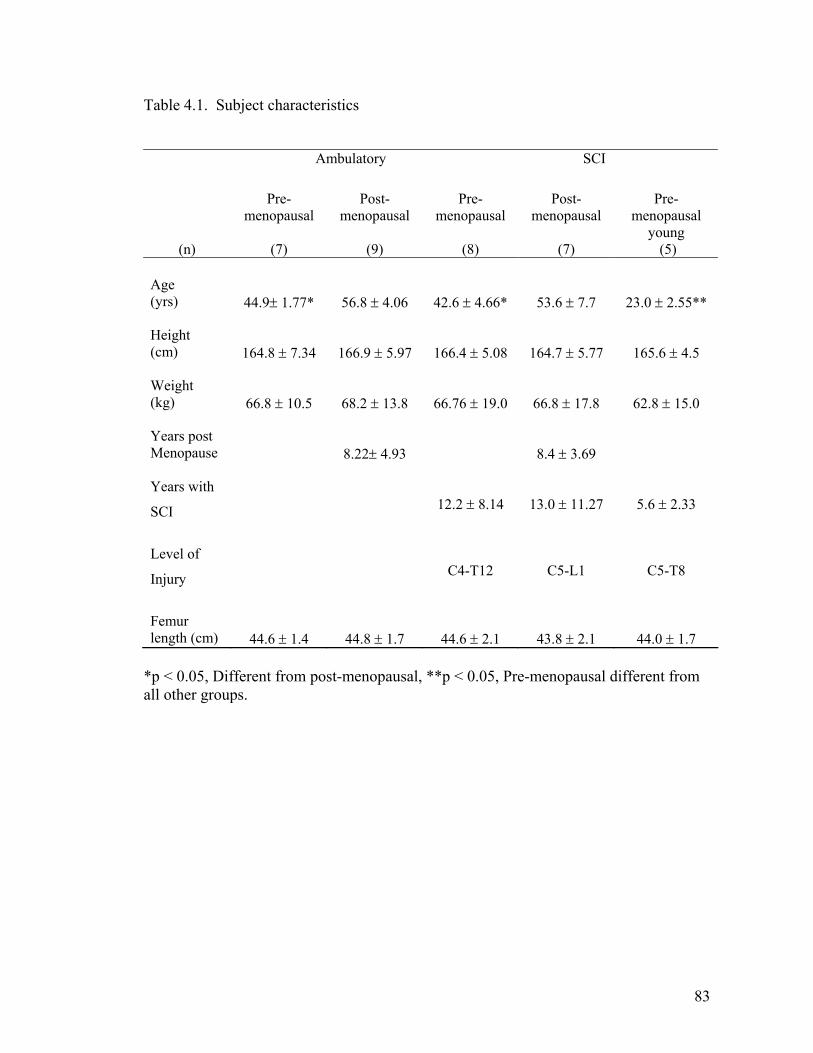
83
Table 4.1. Subject characteristics
*p < 0.05, Different from post-menopausal, **p < 0.05, Pre-menopausal different from all other groups.
Ambulatory SCI
(n)
Pre-menopausal
(7)
Post-menopausal
(9)
Pre-menopausal
(8)
Post-menopausal
(7)
Pre-menopausal
young (5)
Age (yrs)
44.9± 1.77*
56.8 ± 4.06
42.6 ± 4.66*
53.6 ± 7.7
23.0 ± 2.55**
Height (cm)
164.8 ± 7.34
166.9 ± 5.97
166.4 ± 5.08
164.7 ± 5.77
165.6 ± 4.5
Weight (kg)
66.8 ± 10.5
68.2 ± 13.8
66.76 ± 19.0
66.8 ± 17.8
62.8 ± 15.0
Years post Menopause
8.22± 4.93
8.4 ± 3.69
Years with
SCI
12.2 ± 8.14
13.0 ± 11.27
5.6 ± 2.33
Level of
Injury
C4-T12
C5-L1
C5-T8
Femur length (cm)
44.6 ± 1.4
44.8 ± 1.7
44.6 ± 2.1
43.8 ± 2.1
44.0 ± 1.7
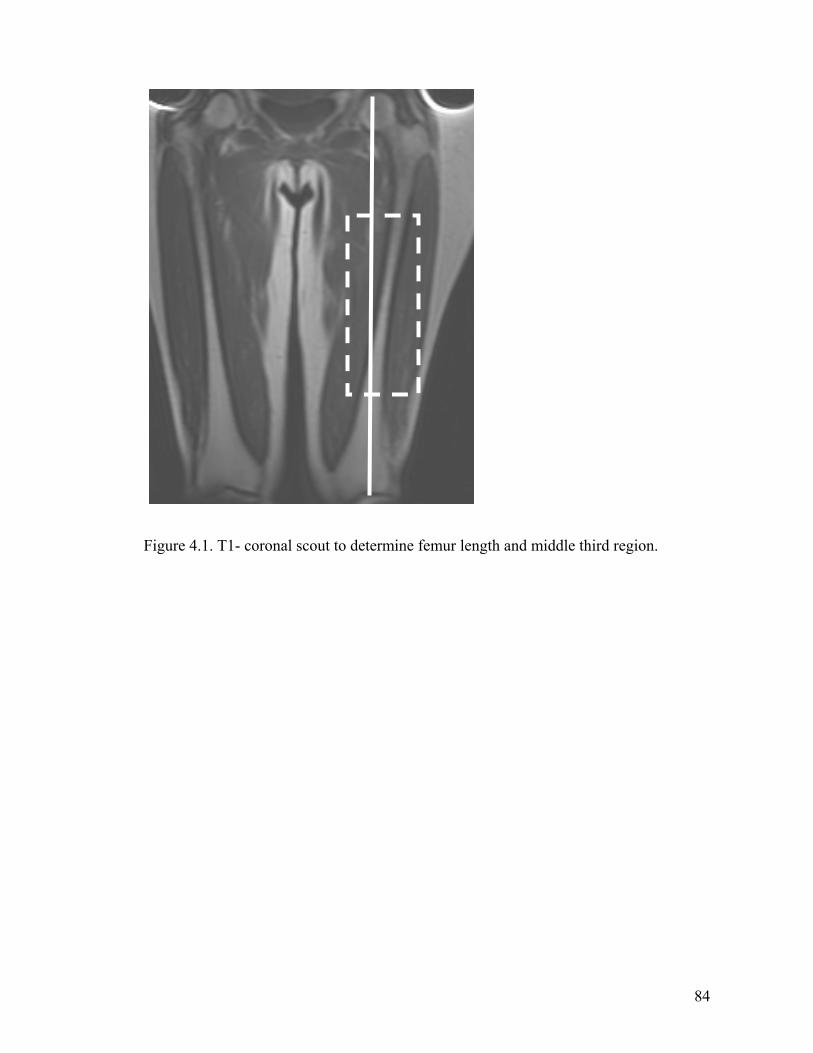
84
Figure 4.1. T1- coronal scout to determine femur length and middle third region.
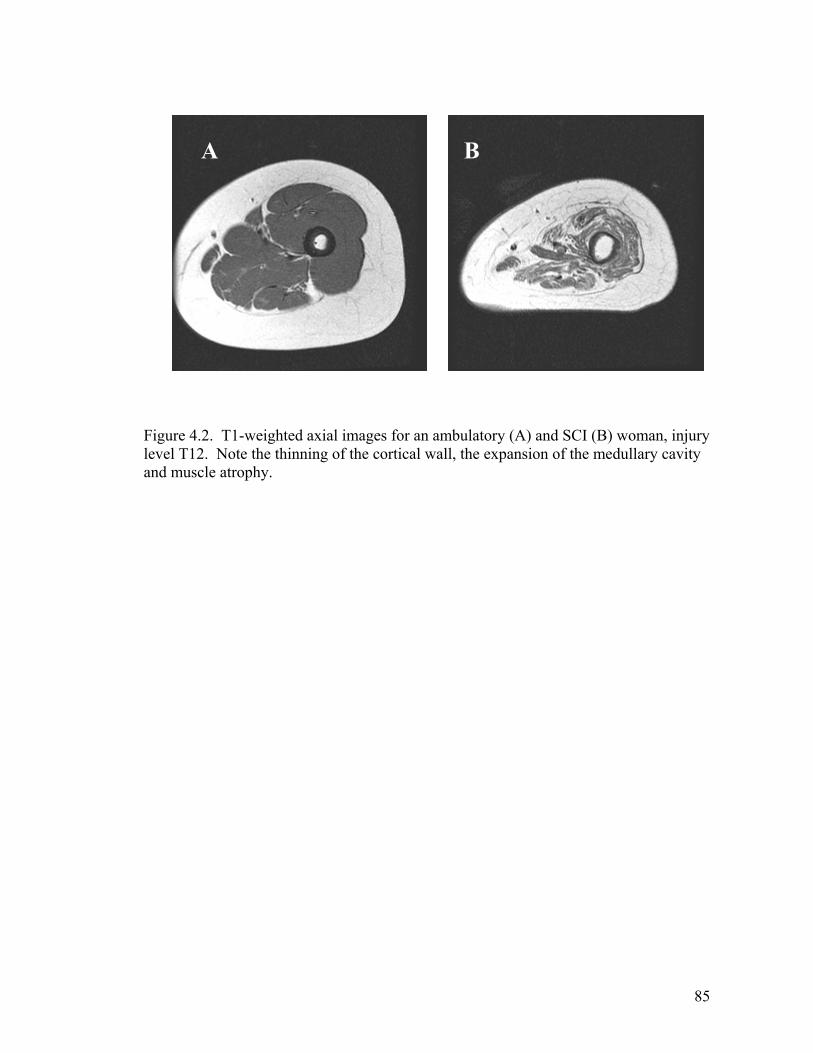
85
Figure 4.2. T1-weighted axial images for an ambulatory (A) and SCI (B) woman, injury level T12. Note the thinning of the cortical wall, the expansion of the medullary cavity and muscle atrophy.
A B
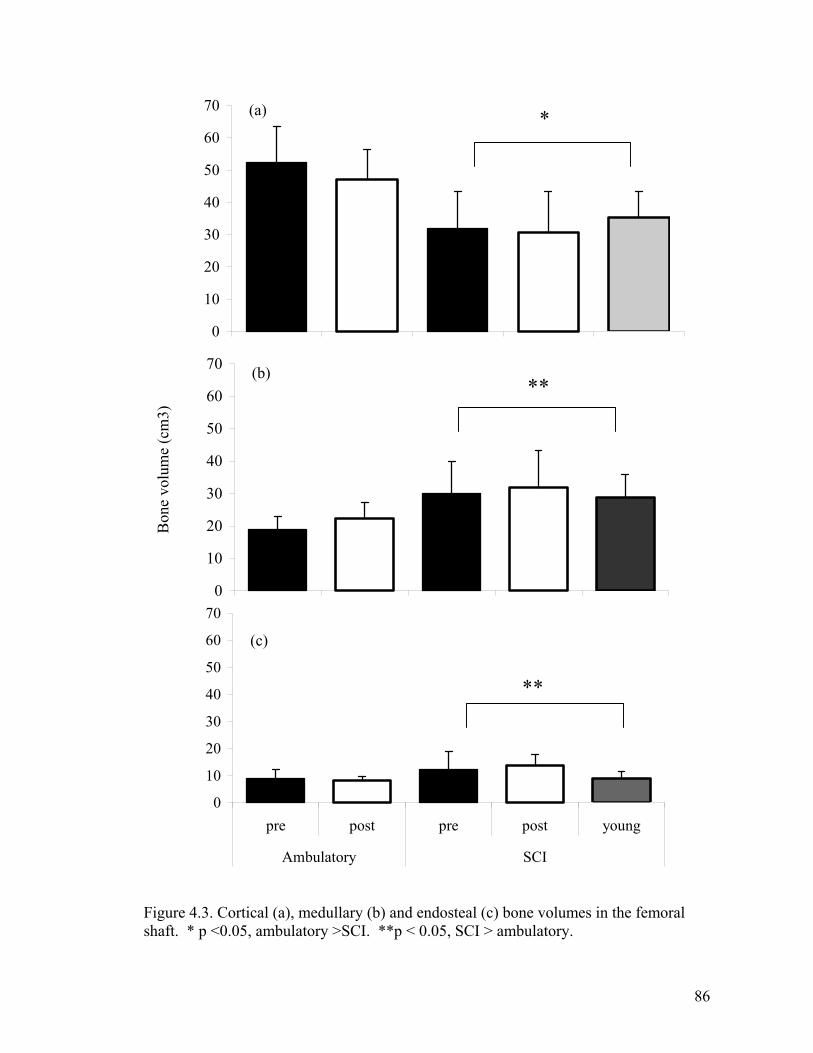
86
Figure 4.3. Cortical (a), medullary (b) and endosteal (c) bone volumes in the femoral shaft. * p <0.05, ambulatory >SCI. **p < 0.05, SCI > ambulatory.
0
10
20
30
40
50
60
70**
Bon
e vo
lum
e (c
m3)
0
10
20
30
40
50
60
70
pre post pre post young
Ambulatory SCI
**
0
10
20
30
40
50
60
70*(a)
(b)
(c)
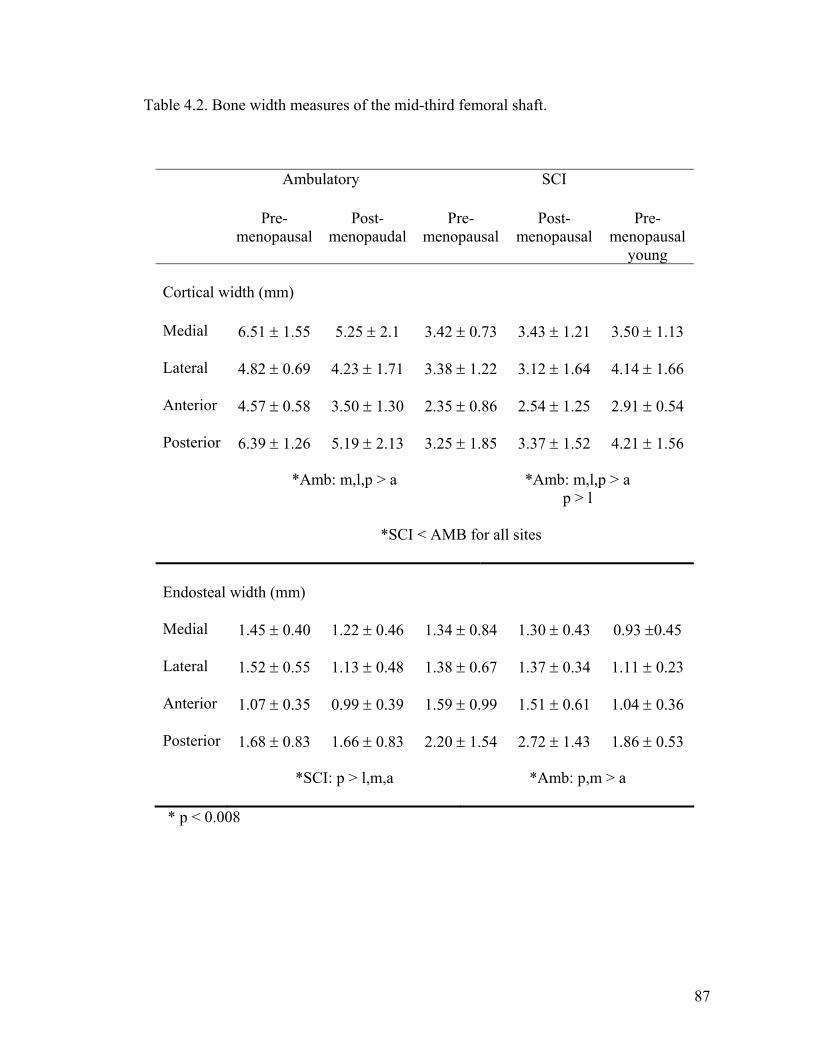
87
Table 4.2. Bone width measures of the mid-third femoral shaft.
Ambulatory SCI Pre-
menopausal Post-
menopaudalPre-
menopausal Post-
menopausal Pre-
menopausal young
Cortical width (mm)
Medial 6.51 ± 1.55 5.25 ± 2.1 3.42 ± 0.73 3.43 ± 1.21 3.50 ± 1.13
Lateral 4.82 ± 0.69 4.23 ± 1.71 3.38 ± 1.22 3.12 ± 1.64 4.14 ± 1.66
Anterior 4.57 ± 0.58 3.50 ± 1.30 2.35 ± 0.86 2.54 ± 1.25 2.91 ± 0.54
Posterior 6.39 ± 1.26 5.19 ± 2.13 3.25 ± 1.85 3.37 ± 1.52 4.21 ± 1.56
*Amb: m,l,p > a
*Amb: m,l,p > a p > l
*SCI < AMB for all sites
Endosteal width (mm)
Medial 1.45 ± 0.40 1.22 ± 0.46 1.34 ± 0.84 1.30 ± 0.43 0.93 ±0.45
Lateral 1.52 ± 0.55 1.13 ± 0.48 1.38 ± 0.67 1.37 ± 0.34 1.11 ± 0.23
Anterior 1.07 ± 0.35 0.99 ± 0.39 1.59 ± 0.99 1.51 ± 0.61 1.04 ± 0.36
Posterior 1.68 ± 0.83 1.66 ± 0.83 2.20 ± 1.54 2.72 ± 1.43 1.86 ± 0.53
*SCI: p > l,m,a *Amb: p,m > a
* p < 0.008
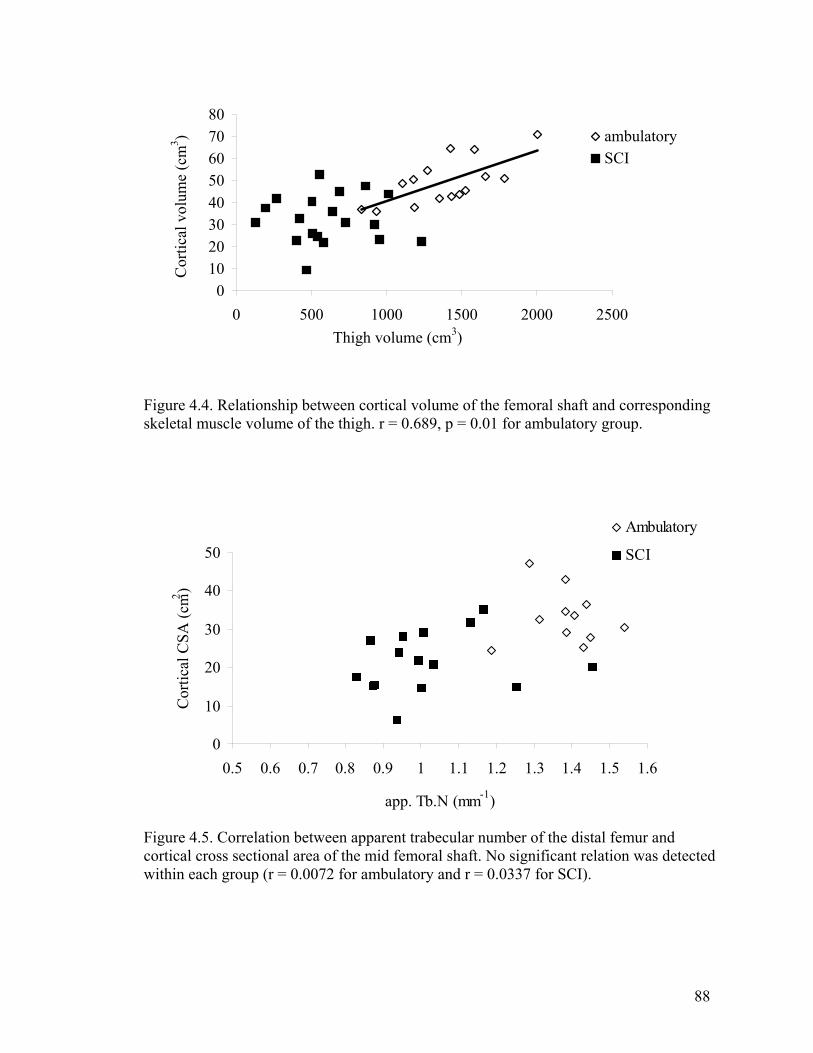
88
01020304050607080
0 500 1000 1500 2000 2500Thigh volume (cm3)
Cor
tical
vol
ume
(cm
3 ) ambulatorySCI
Figure 4.4. Relationship between cortical volume of the femoral shaft and corresponding skeletal muscle volume of the thigh. r = 0.689, p = 0.01 for ambulatory group.
0
10
20
30
40
50
0.5 0.6 0.7 0.8 0.9 1 1.1 1.2 1.3 1.4 1.5 1.6
app. Tb.N (mm-1)
Cor
tical
CSA
(cm2 )
Ambulatory
SCI
Figure 4.5. Correlation between apparent trabecular number of the distal femur and cortical cross sectional area of the mid femoral shaft. No significant relation was detected within each group (r = 0.0072 for ambulatory and r = 0.0337 for SCI).
89
CHAPTER V
SUMMARY
Our primary conclusions are that unloading has substantially greater effects than
estrogen withdrawal on bone architecture both in the femoral shaft and at the knee.
Measuring structural changes in bone is important for advancements in bone health and
prevention of osteoporosis and subsequent fractures. These studies showed the awesome
effects of SCI on both cortical and trabecular bone. Extreme unloading that occurs with
SCI may be more devastating than all conditions that lead to osteoporosis. For the
population of SCI individuals bone deterioration substantially increases the risk for
fractures, which seem to occur in a large proportion of SCI persons. Extra caution should
be taken with transfers and events that may include twisting and efforts to prevent the
loss of bone mass and structure should be more aggressively addressed. Future studies
evaluating the possible re-establishment of lost trabecule and cortical bone are warranted.
This would substantially advance the knowledge about plasticity of trabeculae, since
minimal human data and relatively few animal data suggest that interventions can re-
establish the individual structures.
Estrogen loss seems to have large effects on bone density, although the result is
variable among women. Bone in some women may be more or less sensitive to estrogen,
probably explained by a combination of yet to be determined factors. While post-
menopausal women in these studies had levels of aBMD associated with the World
90
Health Organization’s definition of osteopenia, they did not have deteriorated trabecular
or cortical bone in the femur or proximal tibia. Although these are only preliminary
results, they encourage further investigation into changes in bone that occur due to
estrogen loss. MRI allows for unparalleled visualization and quantification of structure,
while DXA has been the gold standard for bone health for decades. Structural measures
provide much different information compared to measures of mass, although some
overlap may have been expected, at least in two of the three measured parameters. Aging
has been shown to have independent influences on bone and may explain deteriorations
in bone that others have reported. Many factors that affect bone also complicate research
in this field. Selecting homogenous populations is a challenge and may be a confounder
in many studies.
Imaging currently cannot mimic the information and detail obtained from
microscopic evaluation of bone tissue. However, non-invasive procedures are not
practical tools for assessment of bone structure changes in humans. Therefore, continued
use of high-resolution imaging is encouraged with hopes that even better resolution can
be attained with standard clinical imagers.
91
LITERATURE CITED
1. Phillips WT, Kiratli BJ, Sarkarati M, Weraarchakul G, Myers J, Franklin BA, Parkash I and Froelicher V. Effect of spinal cord injury on the heart and cardiovascular fitness. Current Problems in Cardiology 23: 641-716, 1998.
2. Claus-Walker J and Halstead LS. Metabolic and endocrine changes in spinal cord injury: IV. Compounded neurologic dysfunctions. Archives of physical medicine and rehabilitation. 63(12): 632-638, 1982.
3. Biering-Sorensen F, Bohr HH and Schaadt OP. Longitudinal study of bone mineral content in the lumbar spine, the forearm and the lower extremities after spinal cord injury. European Journal of Clinical Investigation. 20(3): 330-335, 1990.
4. Vestergaard P, Krogh K, Rejnmark L and Mosekilde L. Fracture rates and risk factors for fractures in patients with spinal cord injury. Spinal Cord 36: 790-796, 1998.
5. Frisbie JH. Fractures after myelopathy: the risk quantified. The Journal of Spinal Cord Medicine. 20(1): 66-69, 1997.
6. Krause JS. Aging after spinal cord injury: an exploratory study. Spinal cord 38(2): 77-83, 2000.
7. Cummings SR. Are patients with hip fractures more osteoporotic? Review of the evidence. American Journal of Medicine 78: 487-494, 1985.
8. Parfitt AM. Trabecular bone architecture in the pathogenesis and prevention of fracture. American Journal of medicine 82: 68-72, 1987.
9. Consenus development conference: diagnosis, prophylaxis and treatment of osteoporosis. American Journal of medicine 90: 107-110, 1991.
92
10. Garland DE, Adkins RH, Stewart CA, Ashford R and Vigil D. Regional osteoporosis in women who have a complete spinal cord injury. Journal of Bone and Joint Surgery 83-A: 1195-1200, 2001.
11. Beuf O, Ghosh S, Newitt DC, Link TM, Steinbach L, Ries M, Lane N and Majumdar S. Magnetic resonance imaging of normal and osteoarthritic trabecular bone structure in the human knee. Arthritis and Rheumatism 46: 385-393, 2002.
12. Majumdar S, Newitt D, Mathur A, Osman D, Gies A, Chiu E, Lotz J, Kinney J and Genant H. Magnetic resonance imaging of trabecular bone structure in the distal radius: relationship with X-ray tomographic microscopy and biomechanics. Osteoporosis International 6: 376-385, 1996.
13. Woodhead HJ, Kemp AF, Blimkie CJR, Briody JN, Duncan CS, Thompson M, Lam A, Howman-Giles R and Cowell CT. Measurement of midfemoral shaft geometry: repeatability and accuracy using magnetic resonance imaging and dual-energy X-ray absorptiometry. Journal of bone and mineral research 16: 2251-2259, 2001.
14. Castro MJ, Apple DF, Jr., Hillegass EA and Dudley GA. Influence of complete spinal cord injury on skeletal muscle cross-sectional area within the first 6 months of injury. Eur J Appl Physiol Occup Physiol 80: 373-378, 1999a.
15. Castro MJ, Apple DF, Jr., Staron RS, Campos GE and Dudley GA. Influence of complete spinal cord injury on skeletal muscle within 6 mo of injury. J Appl Physiol 86: 350-358, 1999b.
16. BeDell KK, Scremin AM, Perell KL and Kunkel CF. Effects of functional electrical stimulation-induced lower extremity cycling on bone density of spinal cord-injured patients. Am J Phys Med Rehabil 75: 29-34, 1996.
17. Bloomfield SA, Mysiw WJ and Jackson RD. Bone mass and endocrine adaptations to training in spinal cord injured individuals. Bone 19: 61-68, 1996.
18. Leeds EM, Klose KJ, Ganz W, Serafini A and Green BA. Bone mineral density after bicycle ergometry training. Archives of Physical Medicine and Rehabilitation 71: 207-209, 1990.
19. Mohr T, Podenphant J, Biering-Sorensen F, Galbo H, Thamsborg G and Kjaer M. Increased bone mineral density after prolonged electrically induced cycle training of
93
paralyzed limbs in spinal cord injured man. Calcified Tissue International. 61: 22-25, 1997.
20. Baron R. Anatomy and ultrastructure of bone. In: Primer on Metabolic Bone Diseases and Disorders of Mineral Metabolism. An Official Publication of the ASBMR., edited by Favus MJ: Lippincott-Raven Press, 1999, p. 3-10.
21. Frost HM. On the estrogen-bone relationship and postmenopausal bone loss: A new model. Journal of Bone and Mineral Research 14(9): 1473-1477, 1999.
22. Mundy GR. Bone remodeling. In: Principals of bone biology, edited by Rodan GA. New York: Academic Press, 2002, p. 30-38.
23. Ouyang X, Majumdar S, Link TM, Lu Y, Augat P, Lin J, Newitt D and Genant HK. Morphometric texture analysis of spinal trabecular bone structure assessed using orthogonal radiographic projections. Medical Physics 25: 2037-2045, 1998.
24. Manolagas SC. Birth and death of bone cells: basic regulatory mechanisms and implications for the pathogenesis and treatment of osteoporosis. Endocrine reviews. 21(2): 115-137, 2000.
25. Bloomfield SA. Cellular and molecular mechanisms for the bone response to mechanical loading. International Journal of Sports Nutrition in Exercise and Metabolism 11 Suppl: S128-136, 2001.
26. Duncan RL and Turner CH. Mechanotransduction and the functional response of bone to mechanical strain. Calcified Tissue International. 57(5): 344-358, 1995.
27. Frost HM. Bone "mass" and the "mechanostat": a proposal. Anatomical Record 219: 1-9, 1987.
28. Dawson-Hughes B. Calcium and vitamin D nutritional needs of elderly women. Journal of Nutrition 126: 1165S-1167S, 1996.
29. Dawson-Hughes B, Harris SS, Finneran S and Tufts University BMUSA. Calcium absorption on high and low calcium intakes in relation to vitamin D receptor genotype. The Journal of Clinical Endocrinology and Metabolism. 80(12): 3657-3661, 1995.
94
30. Lewis RD and Modlesky CM. Nutrition, physical activity, and bone health in women. International Journal of Sports Nutrition and Exercise Metabolism 8: 250-284, 1998.
31. Kahn Kea. Physical Activity and Bone Health. Champaign, IL: Human Kinetics, 2001.
32. Assessment of fracture risk and its application to screening for postmenopausal osteoporosis. Report of a WHO Study Group. World Health Organization technical report series. 843, 1994.
33. Ito M, Nishida A, Nakamura T, Uetani M and Hayashi K. Differences of three-dimensional trabecular microstructure in osteopenic rat models caused by ovariectomy and neurectomy. Bone 30: 594-598, 2002.
34. Cheng MZ, Zaman G, Rawlinson SC, Pitsillides AA, Suswillo RF and Lanyon LE. Enhancement by sex hormones of the osteoregulatory effects of mechanical loading and prostaglandins in explants of rat ulnae. Journal of Bone and Mineral Research . 12(9): 1424-1430, 1997.
35. Cheng MZ, Zaman G, Rawlinson SC, Suswillo RF and Lanyon LE. Mechanical loading and sex hormone interactions in organ cultures of rat ulna. Journal of Bone and Mineral Research 11(4): 502-511, 1996.
36. Kohrt WM, Snead DB, Slatopolsky E and Birge SJ, Jr. Additive effects of weight-bearing exercise and estrogen on bone mineral density in older women. Journal of Bone and Mineral Research 10(9): 1303-1311, 1995.
37. Ahlborg HG, Johnell O, Nilsson BE, Jeppsson S, Rannevik G and Karlsson MK. Bone loss in relation to menopause: a prospective study during 16 years. Bone. 28(3): 327-331, 2001.
38. Lindsay R. Sex steriods in the pathogenesis and prevention of osteoporosis. In: Osteoporosis: Etiology, diagnosis and management, edited by Riggs BL. New York: Raven Press, 1988, p. 333-358.
39. Ravn P, Hetland ML, Overgaard K and Christiansen C. Premenopausal and postmenopausal changes in bone mineral density of the proximal femur measured by dual-energy X-ray absorptiometry. Journal of Bone and Mineral Research 9(12): 1975-1980, 1994.
95
40. Mundy GR. Bone remodeling. In: Primer on Metabolic Bone Diseases and Disorders of Mineral Metabolism. An Official Publication of the ASBMR., edited by Favus MJ: Lippincott-Raven Press, 1999, p. 30-38.
41. Patel R, Blake GM, Rymer J and Fogelman I. Long-term precision of DXA scanning assessed over seven years in forty postmenopausal women. Osteoporosis international. 11(1), 2000.
42. Christiansen C, Riis BJ and Rodbro P. Prediction of rapid bone loss in postmenopausal women. Lancet 1: 1105-1108, 1987.
43. Falch JA and Sandvik L. Perimenopausal appendicular bone loss: a 10-year prospective study. Bone 11: 425-428, 1990.
44. Hansen MA, Overgaard K, Riis BJ and Christiansen C. Role of peak bone mass and bone loss in postmenopausal osteoporosis: 12 year study. British Journal of Medicine 303: 961-964, 1991.
45. Looker AC, Wahner HW, Dunn WL, Calvo MS, Harris TB, Heyse SP, Johnston CC, Jr. and Lindsay R. Updated data on proximal femur bone mineral levels of US adults. Osteoporosis international 8(5), 1998.
46. Gotfredsen A, Nilas L, Riis BJ, Thomsen K and Christiansen C. Bone changes occurring spontaneously and caused by estrogen in early postmenopausal women: a local or generalised phenomenon? British Medical Journal 292: 1098-1100, 1986.
47. Oda K, Shibayama Y, Abe M and Onomura T. Morphogenesis of vertebral deformities in involutional osteoporosis. Age-related, three-dimensional trabecular structure. Spine. 23(9): 1050-1055, discussion 1056, 1998.
48. Kleerekoper M, Villanueva AR, Stanciu J, Rao DS and Parfitt AM. The role of three-dimensional trabecular microstructure in the pathogenesis of vertebral compression fractures. Calcified Tissue International 37: 594-597, 1985.
49. Mosekilde L. Age-related changes in vertebral trabecular bone architecture--assessed by a new method. Bone 9: 247-250, 1988.
96
50. Thomsen JS, Ebbesen EN and Mosekilde LI. Age-related differences between thinning of horizontal and vertical trabeculae in human lumbar bone as assessed by a new computerized method. Bone 31: 136-142, 2002.
51. Link TM, Majumdar S, Augat P, Lin JC, Newitt D, Lu Y, Lane NE and Genant HK. In vivo high resolution MRI of the calcaneus: differences in trabecular structure in osteoporosis patients. Journal of Bone and Mineral Research 13: 1175-1182, 1998.
52. Majumdar S, Link TM, Augat P, Lin JC, Newitt D, Lane NE and Genant HK. Trabecular bone architecture in the distal radius using magnetic resonance imaging in subjects with fractures of the proximal femur. Osteoporosis International 10: 231-239, 1999.
53. Laib A, Hauselmann HJ and Ruegsegger P. In vivo high resolution 3D-QCT of the human forearm. Technology in Health Care 6: 329-337, 1998.
54. Martin RB and Atkinson PJ. Age and sex-related changes in the structure and strength of the human femoral shaft. Journal of Biomechanics 10: 223-231, 1977.
55. Ruff CB and Hayes WC. Subperiosteal expansion and cortical remodeling of the human femur and tibia with aging. Science. 217(4563): 945-948, 1982.
56. Ruff CB and Hayes WC. Sex differences in age-related remodeling of the femur and tibia. Journal of orthopaedic research 6(6), 1988.
57. Smith RW and Walker RR. Femoral expansion in aging women: implications for osteoporosis and fractures. Science. 145: 156-157, 1964.
58. Bikle DD and Halloran BP. The response of bone to unloading. Journal of Bone and Mineral Metabolism. 17(4), 1999.
59. Giangregorio L and Blimkie CJ. Skeletal adaptations to alterations in weight-bearing activity: a comparison of models of disuse osteoporosis. Sports medicine 32(7), 2002.
60. Uebelhart D, Demiaux-Domenech B, Roth M and Chantraine A. Bone metabolism in spinal cord injured individuals and in others who have prolonged immobilisation. A review. Paraplegia 33: 669-673, 1995.
97
61. Lazo MG, Shirazi P, Sam M, Giobbie-Hurder A, Blacconiere MJ and Muppidi M. Osteoporosis and risk of fracture in men with spinal cord injury. Spinal Cord 39: 208-214, 2001.
62. Biering-Sorensen F, Bohr H and Schaadt O. Bone mineral content of the lumbar spine and lower extremities years after spinal cord lesion. Paraplegia 26: 293-301, 1988.
63. Garland DE, Stewart CA, Adkins RH, Hu SS, Rosen C, Liotta FJ and Weinstein DA. Osteoporosis after spinal cord injury. Journal of Orthopaedic Research 10: 371-378, 1992.
64. Minaire P, Neunier P, Edouard C, Bernard J, Courpron P and Bourret J. Quantitative histological data on disuse osteoporosis: comparison with biological data. Calcified tissue research. 17(1), 1974.
65. Lee TQ, Shapiro TA and Bell DM. Biomechanical properties of human tibias in long-term spinal cord injury. Journal of Rehabilitation Research and Development 34: 295-302, 1997.
66. de Bruin ED, Dietz V, Dambacher MA and Stussi E. Longitudinal changes in bone in men with spinal cord injury. Clinical Rehabilitation 14: 145-152, 2000a.
67. de Bruin ED, Herzog R, Rozendal RH, Michel D and Stussi E. Estimation of geometric properties of cortical bone in spinal cord injury. Archives of Physical Medicine and Rehabilitation 81: 150-156, 2000b.
68. Kiratli BJ, Smith AE, Nauenberg T, Kallfelz CF and Perkash I. Bone mineral and geometric changes through the femur with immobilization due to spinal cord injury. Journal of Rehabilitation Research and Development 37: 225-233, 2000.
69. Parfitt AM, Mundy GR, Roodman GD, Hughes DE and Boyce BF. A new model for the regulation of bone resorption, with particular reference to the effects of bisphosphonates. Journal of Bone and Mineral Research 11: 150-159, 1996.
70. Dudley GA, Castro MJ, Rogers S and Apple DF, Jr. A simple means of increasing muscle size after spinal cord injury: a pilot study. Eur J Appl Physiol Occup Physiol 80: 394-396, 1999.
98
71. Binder EF and Kohrt WM. Relationships between body composition and bone mineral content and density in older women and men. Clinical Exercise Physiology 2: 84-91, 2000.
72. Roberts D, Lee W, Cuneo RC, Wittmann J, Ward G, Flatman R, McWhinney B and Hickman PE. Longitudinal study of bone turnover after acute spinal cord injury. Journal of Clinical Endocrinology & Metabolism 83: 415-422, 1998.
73. Chantraine A, van Ouwenaller C, Hachen HJ and Schinas P. Intra-medullary pressure and intra-osseous phlebography in paraplegia. Paraplegia 17: 391-399, 1979.
74. Minaire P, Edouard C, Arlot M and Meunier PJ. Marrow changes in paraplegic patients. Calcified Tissue International 36: 338-340, 1984.
75. Bergula AP, Huang W and Frangos JA. Femoral vein ligation increases bone mass in the hindlimb suspended rat. Bone 24: 171-177, 1999.
76. Comarr AE, Hutchinson, R.H. and Bors E. Extremity fractures of patients with spinal cord injuries. American Journal of Surgery 103: 732-739, 1962.
77. Freehafer AA. Limb fractures in patients with spinal cord injury. Archives of Physical Medicine and Rehabilitation 76: 823-827, 1995.
78. Ragnarsson KT and Sell GH. Lower extremity fractures after spinal cord injury: a retrospective study. Archives of Physical Medicine and Rehabilitation 62: 418-423, 1981.
79. Eichenholtz S. Management of long-bone fractures in paraplegic patients. Journal of Bone and Joint Surgery American 45: 299-310, 1963.
80. Looker AC, Johnston CC, Jr., Wahner HW, Dunn WL, Calvo MS, Harris TB, Heyse SP and Lindsay RL. Prevalence of low femoral bone density in older U.S. women from NHANES III. Journal of Bone and Mineral Research 10(5): 796-802, 1995.
81. Melton LJ, 3rd, Chrischilles EA, Cooper C, Lane AW and Riggs BL. Perspective. How many women have osteoporosis? Journal of Bone and Mineral Research 7(9): 1005-1010, 1992.
99
82. Bell GH, Dunbar O, Beck JS and Gibb A. Variations in strength of vertebrae with age and their relation to osteoporosis. Calcified Tissue Research. 1(1), 1967.
83. Dempster DW, Shane E, Horbert W and Lindsay R. A simple method for correlative light and scanning electron microscopy of human iliac crest bone biopsies: qualitative observations in normal and osteoporotic subjects. Journal of Bone and Mineral Research 1(1): 15-21, 1986.
84. Mann T, Oviatt SK, Wilson D, Nelson D and Orwoll ES. Vertebral deformity in men. Journal of Bone and Mineral Research 7(11): 1259-1265, 1992.
85. Mosekilde L and Danielsen CC. Biomechanical competence of vertebral trabecular bone in relation to ash density and age in normal individuals. Bone 8: 79-85, 1987.
86. Seeman E. Pathogenesis of bone fragility in women and men. Lancet. 359(9320): 1841-1850, 2002.
87. Rubin C, Turner AS, Mallinckrodt C, Jerome C, McLeod K and Bain S. Mechanical strain, induced noninvasively in the high-frequency domain, is anabolic to cancellous bone, but not cortical bone. Bone. 30(3): 445-452, 2002.
88. Bourrin S, Palle S, Genty C and Alexandre C. Physical exercise during remobilization restores a normal bone trabecular network after tail suspension-induced osteopenia in young rats. Journal of Bone and Mineral Research 10(5): 820-828, 1995.
89. Simkin A, Ayalon J and Leichter I. Increased trabecular bone density due to bone-loading exercises in postmenopausal osteoporotic women. Calcified Tissue International. 40(2): 59-63, 1987.
90. Leblanc AD, Schneider VS, Evans HJ, Engelbretson DA and Krebs JM. Bone mineral loss and recovery after 17 weeks of bed rest. Journal of Bone And Mineral Research 5: 843-850, 1990.
91. Bourrin S, Ammann P, Bonjour JP and Rizzoli R. Recovery of proximal tibia bone mineral density and strength, but not cancellous bone architecture, after long-term bisphosphonate or selective estrogen receptor modulator therapy in aged rats. Bone 30: 195-200, 2002.
100
92. Adami S, Gatti D, Braga V, Bianchini D and Rossini M. Site-specific effects of strength training on bone structure and geometry of ultradistal radius in postmenopausal women. Journal of Bone and Mineral Research 14(1): 120-124, 1999.
93. Augat P, Reeb H and Claes LE. Prediction of fracture load at different skeletal sites by geometric properties of the cortical shell. Journal of Bone and Mineral Research 11(9): 1356-1363, 1996.
94. Beck TJ, Ruff CB, Scott WW, Jr., Plato CC, Tobin JD and Quan CA. Sex differences in geometry of the femoral neck with aging: a structural analysis of bone mineral data. Calcified Tissue International. 50(1): 24-29, 1992.
95. Duncan CS, Blimkie CJ, Kemp A, Higgs W, Cowell CT, Woodhead H, Briody JN and Howman-Giles R. Mid-femur geometry and biomechanical properties in 15- to 18-yr-old female athletes. Medicine and Science in Sports and Exercise 34: 673-681, 2002.
96. Nelson DA, Barondess DA, Hendrix SL and Beck TJ. Cross-sectional geometry, bone strength, and bone mass in the proximal femur in black and white postmenopausal women. Journal of Bone and Mineral Research 15: 1992-1997, 2000.
97. Beck TJ, Ruff CB and Bissessur K. Age-related changes in female femoral neck geometry: implications for bone strength. Calcified Tissue International. 53 Suppl 1, 1993.
98. Beck TJ, Ruff CB, Mourtada FA, Shaffer RA, Maxwell-Williams K, Kao GL, Sartoris DJ and Brodine S. Dual-energy X-ray absorptiometry derived structural geometry for stress fracture prediction in male U.S. Marine Corps recruits. Journal of Bone and Mineral Research 11(5): 645-653, 1996.
99. Mosekilde L. Trabecular microarchitecture and aging. In: Osteoporosis in men: the effects of gender on skeletal health, edited by Orwell ES. San Diego: Academic Press, 1999, p. 313-334.
100. Boutry N, Cortet B, Dubois P, Marchandise X and Cotten A. Trabecular bone structure of the calcaneus: preliminary in vivo MR imaging assessment in men with osteoporosis. Radiology 227: 708-717, 2003.
101
101. Majumdar S, Newitt D, Jergas M, Gies A, Chiu E, Osman D, Keltner J, Keyak J and Genant H. Evaluation of technical factors affecting the quantification of trabecular bone structure using magnetic resonance imaging. Bone 17: 417-430, 1995.
102. Ruegsegger P. Imaging of bone structure. In: Bone Mechanics Handbook, edited by Cowin SC. New York: CRC Press, 2001, p. 9-1 - 9-24.
103. Wehrli FW, Hwang SN, Song HK and Gomberg BR. Visualization and analysis of trabecular bone architecture in the limited spatial resolution regime of in vivo micro-MRI. Advances in Experimental Medicine and Biology 496: 153-164, 2001.
104. Link TM, Lotter A, Beyer F, Christiansen S, Newitt D, Lu Y, Schmid C and Majumdar S. Changes in calcaneal trabecular bone structure after heart transplantation: an MR imaging study. Radiology 217: 855-862, 2000.
105. Link TM, Saborowski, Kisters K, Kempkes M, Kosch M, Newitt D, Lu Y, Waldt S and Majumdar S. Changes in calcaneal trabecular bone structure assessed with high-resolution MR imaging in patients with kidney transplantation. Osteoporosis International 13: 119-129, 2002.
106. Majumdar S, Genant HK, Grampp S, Newitt DC, Truong VH, Lin JC and Mathur A. Correlation of trabecular bone structure with age, bone mineral density, and osteoporotic status: in vivo studies in the distal radius using high resolution magnetic resonance imaging. Journal of Bone and Mineral Research 12: 111-118, 1997.
107. Newitt DC, van Rietbergen B and Majumdar S. Processing and analysis of in vivo high-resolution MR images of trabecular bone for longitudinal studies: reproducibility of structural measures and micro-finite element analysis derived mechanical properties. Osteoporosis International 13: 278-287, 2002.
108. Wald LL, Carvajal L, Moyher SE, Nelson SJ, Grant PE, Barkovich AJ and Vigneron DB. Phased array detectors and an automated intensity-correction algorithm for high-resolution MR imaging of the human brain. Magnetic Resonance in Medicine 34(3): 433-439, 1995.
109. Kothari M, Keaveny TM, Lin JC, Newitt DC, Genant HK and Majumdar S. Impact of spatial resolution on the prediction of trabecular architecture parameters. Bone 22: 437-443, 1998.