Embed Size (px)
Citation preview
i
THE EFFECTS OF SHARE SPLITS ON LONG RUN STOCK
RETURNS FOR COMPANIES LISTED AT THE NAIROBI
SECURITIES EXCHANGE
BY
STEPHEN K. NDEGWA
A RESEARCH PROJECT SUBMITTED IN PARTIAL
FULFILLMENT OF THE REQUIREMENTS FOR THE AWARD
OF THE DEGREE OF MASTER OF BUSINESS
ADMINISTRATION, UNIVERSITY OF NAIROBI
OCTOBER 2013

ii
DECLARATION
This Research project is my original work and has not been presented for a degree in
any other University or institution. No part of this project may be reproduced without
the prior written permission of the author and/ or University of Nairobi.
Signed--------------------------------------------- Date--------------------------------
Stephen K. Ndegwa
D61/75332/2012
This project has been submitted for examination with my approval as the University
supervisor
Signed--------------------------------------- Date----------------------------------
Dr. Josiah Aduda
Chairman
Department of Finance and Accounting
School of business, University of Nairobi

iii
ACKNOWLEDGEMENT
I am most grateful to the Almighty God for the gift of life, health, ability and strength
that has enabled me to complete this project. I shall forever worship and praise your
holy name.
My gratitude goes to my supervisor, Dr. Aduda for his guidance and supervision that
has enabled me to complete this project successfully. I also acknowledge the other
lecturers in the School of business whom I consulted on various issues during the
course of the project. I particularly acknowledge Mr. Mirie Mwangi.
I also wish to thank the Nairobi securities Exchange staff who supported me by
providing the data that I needed to complete this project. I also thank my family who
supported me all through.
May God Bless you all.

iv
DEDICATION
This work is dedicated to my late Father, Eliud Ndegwa for instilling in me the
importance of Education from a very tender age. May the Almighty God Rest his
soul in eternal Peace.

v
ABSTRACT
Share splits are a common corporate event among listed companies. Though it is commonly practiced it has been described as a mere accounting change that increases the number of shares outstanding without any benefit to the shareholders. This study sought to determine the effects of share splits on long run stock returns among listed companies at the Nairobi securities Exchange. The study covered returns for twenty four months after the company had undergone a share split. The study therefore sampled firms that had been in operation for at least twenty four months after they had undergone a share split. There were eleven firms listed at the NSE that fulfilled this condition and were therefore sampled for this study. The study used the long run study methodology and applied the buy and hold benchmark approach. The method required the identification of the event firm and its benchmark firm and comparing the returns achieved by each of these firms correspondingly for the same month. Secondary data obtained from the Nairobi Securities Exchange was used in this study. The data consisted of monthly opening and closing share prices of each of the sampled firms together with those of its identified benchmark firm for the entire twenty four months of the study. The study method required the determination of each of the sampled event firm’s monthly buy and hold returns and comparing these returns with those of its benchmark firm, which acted as a proxy for the market. The benchmark firm was identified as another firm which had not undergone a share split and was within 70% to 130% of the share capital of the event firm at the time of the event firm’s share split, and has a book to market equity (BE/ME) ratio that is closest to that of the event firm. The monthly returns of the event firm are then compared with those of its benchmark firm. The difference in the monthly returns achieved by the paired firms constitutes the buy and hold abnormal return (BHAR) for the event firm. The buy and hold abnormal returns for each firm were then tested for difference from zero at 5% significance level in order to determine whether there is any difference between the returns of the event firm and the returns of its benchmark firm. The study found that among all the eleven firms sampled; only two firms achieved a positive mean buy and hold abnormal return of 1.89% and 3.72% respectively. The other nine firms representing 82% of the sampled firms achieved a mean negative buy and hold abnormal returns ranging from -4.94 % to -0.14 %. These returns were however found to be insignificant at 95% confidence level. This implies that there was no significant difference between the returns achieved by the event firm and the returns achieved by its benchmark firm for the period under study. The study therefore concluded that share splits at the Nairobi securities exchange have insignificant effects on stock returns for the first two years following a share split. However further studies on its effects on periods longer than two years would be recommended in order to develop a hypothesis. The criteria for the choice of the benchmark firm would also need to include a consideration of the industry in which the event firm is operating in order to allow for proper benchmarking of the paired firms returns. Firms from the same industry would be affected by market conditions in the same way.

vi
TABLE OF CONTENTS DECLARATION.......................................................................................................... ii
ACKNOWLEDGEMENT ..........................................................................................iii
DEDICATION............................................................................................................. iv
ABSTRACT .................................................................................................................. v
LIST OF TABLES ...................................................................................................... xi
ABBREVIATIONS ................................................................................................... xiv
CHAPTER ONE .......................................................................................................... 1
INTRODUCTION........................................................................................................ 1
1.1 Background to the Study .......................................................................................... 1
1.1.1Share splits ................................................................................................. 4
1.1.2Reverse splits ............................................................................................. 5
1.1.3Stock Returns ............................................................................................. 5
1.1.4Relationship between Share splits and Long run Stock Returns. .............. 7
1.1.5Nairobi securities Exchange ...................................................................... 9
1.1.6Stock splits in Kenya ............................................................................... 10
1.2Research Problem ................................................................................................... 11
1.3 Research Objective ................................................................................................ 12
1.4Value of the Study .................................................................................................. 13
1.4.1 Researchers ............................................................................................... 13
1.4.2 Investors .................................................................................................... 13
1.4.3 Government and its regulatory Agencies .................................................. 14
1.4.4 Financial practitioners and Advisors ........................................................ 14
CHAPTER TWO ....................................................................................................... 15
LITERATURE REVIEW ......................................................................................... 15
2.1Introduction ............................................................................................................. 15
2.2Efficient market hypothesis .................................................................................... 15
2.3Theories of stock splits ........................................................................................... 17
2.3.1Signaling theory ....................................................................................... 17
2.3.2 Liquidity hypothesis................................................................................ 18
2.3.3Neglected firm theory .............................................................................. 18
2.3.4Trading range theory ................................................................................ 19
vii
2.3.5Value Manipulation hypothesis ............................................................... 19
2.4 Review of Empirical Evidence .............................................................................. 20
2.4.1Empirical Evidence on effects of stock splits on Long run returns ......... 24
2.5 Share splits ............................................................................................................. 25
2.5.1Why firms split their shares ..................................................................... 25
2.5.2 Constraints to share Splits ....................................................................... 26
2.6 Stock prices. ........................................................................................................... 26
2.7 Conclusions ............................................................................................................ 27
CHAPTER THREE ................................................................................................... 28
RESEARCH METHODOLOGY ............................................................................. 28
3.1 Introduction ............................................................................................................ 28
3.2 Research Design..................................................................................................... 28
3.3 Target Population ................................................................................................... 29
3.4 Sample Design ....................................................................................................... 29
3.5 Data Collection Procedures.................................................................................... 29
3.6 Data Analysis ......................................................................................................... 30
CHAPTER FOUR ...................................................................................................... 32
DATA ANALYSIS AND PRESENTATION OF FINDINGS ........ ........................ 32
4.1 Introduction ............................................................................................................ 32
4.2 Data presentation ................................................................................................... 32
4.2.1 Monthly buy and hold returns ................................................................. 33
4.2.2 Monthly buy and hold Abnormal Returns (BHAR). .............................. 44
4.2.3The mean BHAR...................................................................................... 56
4.2.4 Hypothesis test ........................................................................................ 56
4.3 Summary and Interpretation of the Findings ......................................................... 57
CHAPTER FIVE ....................................................................................................... 60
SUMMARY, CONCLUSIONS AND RECOMMENDATIONS .......... ................. 60
5.1 Summary ................................................................................................................ 60
5.2 Conclusions ............................................................................................................ 61
5.3 Recommendations to policy and practice. ............................................................. 62
5.4 Limitations of the study ......................................................................................... 63

viii
5.5 Suggestions for further studies ............................................................................... 64
REFERENCES ........................................................................................................... 65
APPENDICES ............................................................................................................ 74
Appendix 1: Companies Listed at the NSE that have undergone Share Splits ............ 74
Appendix 2: Companies Listed at the NSE that Split their shares between
2004 and 2010 ......................................................................................... 74
Appendix 3 (a) :ANALYSIS OF NSE FIRMS DATA FOR THE
IDENTIFICATION OF BARCLAYS BANK CONTROL FIRM
Data for 30/11/2006 ................................................................................. 75
Appendix 3 (b) :Computation of Barclays Bank Monthly Return ............................... 77
Appendix 3 (c) :Computations of the percentage monthly buy and hol
abnormal return: (BHAR): Barclays Bank (K) limited ............................ 78
Appendix 4 (a) : ANALYSIS OF NSE FIRMS DATA FOR THE
IDENTIFICATION OF CENTUM INVESTMENTS
CONTROL FIRM Data for 5/1/2007 ................................................... 79
Computation of Centum Investments Monthly Return ................................................ 83
Appendix 4(c) :Computations of the percentage monthly buy and
hold abnormal return: (BHAR): Centum Investments limited ................. 84
Appendix 5 (a) :ANALYSIS OF NSE FIRMS DATA FOR THE
IDENTIFICATION OF EA CABLES CONTROL FIRM
Data for 5/9/2006 ....................................................................................... 85
Appendix 5(b) :Computation of EA Cables Monthly Return ...................................... 88
Appendix 5(c) :Computations of the percentage monthly buy and hold
abnormal return: (BHAR): East Africa Cables ........................................... 89
Appendix 6 (a) :ANALYSIS OF NSE FIRMS DATA FOR THE
IDENTIFICATION OF EQUITY BANK CONTROL FIRM
Data for 25/3/2009 ....................................................................................... 90
Appendix 6(b) : Computation of Equity Bank Monthly Return .................................. 93
Appendix 6(c) : Computations of the percentage monthly buy and hold
abnormal return: (BHAR): Equity Bank Limited ........................................ 94
Appendix 7 (a) : ANALYSIS OF NSE FIRMS DATA FOR THE
IDENTIFICATION OF KENYA OIL CONTROL FIRM

ix
Data for 5/7/2004 ................................................................................... 95
Appendix 7(b) :Computation of Kenya Oil Monthly return ........................................ 98
Appendix 7(c) : Computations of the percentage monthly buy and hold
abnormal return: (BHAR): Kenya Oil Company limited .......................... 99
Appendix 8(a) : ANALYSIS OF NSE FIRMS DATA FOR THE
IDENTIFICATION OF NATION MEDIA CONTROL FIRM
Data for 4/8/2008 ..................................................................................... 100
Appendix 8(b) :Computation of Nation Media Monthly return ................................ 103
Appendix 8(c) :Computations of the percentage monthly buy and hold
abnormal return: (BHAR): Nation Media Group limited ......................... 104
Appendix 9(a) :ANALYSIS OF NSE FIRMS DATA FOR THE
IDENTIFICATION OF CMC HOLDINGS CONTROL FIRM
Data for 26/2/2007 ...................................................................................... 105
Appendix 9(b) :Computation of CMC Holdings Monthly return .............................. 109
Appendix 9(c) :Computations of the percentage monthly buy and
hold abnormal return: (BHAR): CMC Holdings limited ............................. 110
Appendix 10 (a) :ANALYSIS OF NSE FIRMS DATA FOR THE
IDENTIFICATION OF EA BREWERIES CONTROL FIRM
Data for 29/11/2004 ..................................................................................... 111
Appendix 10(b) :Computation of EA Breweries Monthly return .............................. 113
Appendix 10(c) :Computations of the percentage monthly buy and hold
abnormal return: (BHAR): East Africa Breweries limited .......................... 114
Appendix 11 (a) :ANALYSIS OF NSE FIRMS DATA FOR THE
IDENTIFICATION OF KENYA COMMERCIAL BANK
CONTROL FIRM: Data for 3/4/2007 .......................................................... 115
Appendix 11(b) :Computation of KCB Monthly return ............................................ 118
Appendix 11(c) :Computations of the percentage monthly buy and
hold abnormal return: (BHAR): Kenya Commercial Bank limited ............. 119
Appendix 12 (a) :ANALYSIS OF NSE FIRMS DATA FOR THE
IDENTIFICATION OF SASINI TEA AND COFEE CONTROL
FIRM: Data for 15/2/2007 ........................................................................... 120
Appendix 12(b) :Computation of Sasini Tea and coffee Monthly return .................. 123
Appendix 12(c) :Computations of the percentage monthly buy and
hold abnormal return: (BHAR): Sasini Tea and coffee Limited ............ 124

x
Appendix 13 (a) :ANALYSIS OF NSE FIRMS DATA FOR THE
IDENTIFICATION OF KPLC CONTROL FIRM:
Data for 19/11/2010 .................................................................................... 125
Appendix 13(b) :Computation of KPLC Monthly return .......................................... 129
Appendix 13 (c) :Computations of the percentage monthly buy and
hold abnormal return: (BHAR): Kenya Power and Lighting
Company limited .......................................................................................... 130
xi
LIST OF TABLES
Table 1: Barclays Bank : Mean BHAR Descriptive Statistics .................................... 45
Table 2: Centum investments limited: BHAR Descriptive Statistics .......................... 46
Table 3: East Africa Cables limited: Descriptive Statistics ......................................... 47
Table 4: Equity Bank limited: Mean BHAR Descriptive Statistics ............................. 48
Table 5: Kenya Oil limited: Mean BHAR Descriptive Statistics ................................ 49
Table 6: Nation Media Group Limited: Mean BHAR Descriptive Statistics .............. 50
Table 7: CMC Holdings Limited: Mean BHAR Descriptive Statistics ....................... 51
Table 8: East Africa Breweries limited: Mean BHAR Descriptive Statistics ............ 52
Table 9: Kenya Commercial Bank limited: Mean BHAR Descriptive Statistics ........ 53
Table 10: Kenya Power and Lighting Limited : Mean BHAR Descriptive Statistics . 54
Table 11: Sasini Tea and coffee limited: Mean BHAR Descriptive Statistics ............ 55
Table 12: Bar graphs showing the percentage mean BHAR of the sampled
companies. ................................................................................................ 56
Table 13: Statistical summary of the firm’s mean BHAR tested for difference from
zero at 95% Confidence level. ................................................................... 57
xii
LIST OF FIGURES
Figure 1: A graph showing the monthly Buy and hold Returns for Barclays Bank
Limited against its Benchmark Firm Standard Chartered Bank after the
BBK share split. .......................................................................................... 33
Figure 2: A graph showing the monthly Buy and hold Returns for Centum Investment
Limited against its Benchmark Firm Rea Vipingo plantations limited after
centum investments split its shares. ............................................................ 34
Figure 3: A graph showing the monthly Buy and hold Returns for E.A Cables Limited
against its Benchmark Firm BAT (K) limited after EA Cables split its
shares............................................................................................................ 35
Figure 4: A graph showing the monthly Buy and hold Returns for Equity Bank
Limited against its Benchmark Firm Standard Chartered Bank limited after
the share split ................................................................................................ 36
Figure 5: A graph showing the monthly Buy and hold Returns for Kenya Oil Limited
against its Benchmark Firm Standard Chartered Bank limited after the share
split ................................................................................................................. 37
Figure 6: A graph showing the monthly Buy and hold Returns for CMC Holdings
Limited against its Benchmark Firm TPS Eastern Africa limited after the
share split ...................................................................................................... 38
Figure 7: A graph showing the monthly Buy and hold Returns for East Africa
Breweries Limited against its Benchmark Firm Standard Chartered Bank
limited after the share split ........................................................................... 39
Figure 8: A graph showing the monthly Buy and hold Returns for KPLC Limited
against its Benchmark Firm Athi River Mining Company limited after the
share split .................................................................................................... 40
Figure 9: A graph showing the monthly Buy and hold returns for Sasini Tea and
coffee Limited against its Benchmark Firm Kapchorua Tea Company
limited after the share split .......................................................................... 41
Figure 10: A graph showing the monthly Buy and hold returns for Nation Media
Group Limited against its Benchmark Firm Kenya Airways limited after
the share split ............................................................................................ 42

xiii
Figure 11: A graph showing the monthly Buy and hold returns for Kenya commercial
Bank Limited against its Benchmark Firm Standard Chartered Bank
limited after the share split ........................................................................ 43

xiv
ABBREVIATIONS
AMEX American Stock Exchange
BAT (K) ltd British American Tobacco Limited
BE/ME Ratio Book to Market Equity Ratio
BBK Barclays Bank limited
BHAR Buy and Hold Abnormal Return
CMC Holdings Cooper Motor Corporation limited
EABL East Africa Breweries limited
KENOL Kenya National Oil Company limited
KPLC Kenya Power and lighting company limited
NASDAQ National Association of securities dealers automated
Quotations
NSE Nairobi Securities Exchange
NYSE New York Stock Exchange
US United States
USA United States of America

1
CHAPTER ONE
INTRODUCTION
1.1 Background to the Study
Share splits are a common corporate event among listed firms. Fama et al, (1969)
defined a stock split as an exchange of shares in which at least five shares were
distributed for every four previously outstanding. According to Dhar and
Chhaochharia (2008) share splits occur in ratios, the most common ones being 2:1,
3:2, 5:4 etc. He gives an example of a 2-for-1 share split as meaning that a
shareholder with one share is given an additional share. After the split there will be
two shares for every one pre-split share.
In some countries however, there are legal restrictions on the ability of companies to
split their shares. According to Roger, (2007) in Switzerland, companies can only
split their shares up to a legally prescribed minimum par value. The same types of
restrictions on minimum par values also apply in Germany (Wulff 1999). In Kenya,
there are no such restrictions.
Several reasons have been advanced to explain the reasons why companies split their
shares. According to Shourun et al (2006), key among them is the desire to make the
shares more affordable in order to increase their trading volumes. He argues that
shareholders are wealth constrained and therefore cannot afford a round lot of stocks
if the prices are too high. Splitting the shares reduces their market prices by the same
factor as the split factor, at least in theory. This makes them more affordable to a
majority of small shareholders.

2
Lakonishok and Lev, (1987) argues that by splitting their shares, firms make their
stocks more attractive for the individual investor. According to Copeland (1979) a
stock split changes stock prices to a more optimal price, which in turn increases its
demand. Lamoureux et al (1987) in his studies noted that managers expected stocks
trading at lower prices to be generally more liquid and to attract a larger pool of
potential investors.
The main objective of any firm is the maximization of the wealth of its shareholders.
This means that every corporate event undertaken by the firm should be geared
towards achieving this goal. A share split is a major corporate event and is therefore
no exception. According to Dennis and Strickland (2002) a stock split is merely an
accounting change in the share composition. It should therefore not theoretically elicit
any reaction on the share price. However considerable research undertaken has shown
that stock prices usually react positively to a stock split.
A stock split has always been a puzzle (Lyroud et,al. (2006). It results in a reduction
of the par value of the shares and a proportionate increase in the number of shares
outstanding (Baker and Gallagher, 1980). Dennis and Strickland, (2002) argues that it
is merely an accounting change that increases the number of shares outstanding
without any benefit to the shareholders.
Grinblatt et al. (1984) studied the effects on returns from stocks after splits for the
period 1967 to 1976 and found an excess positive return of 3.44% during the three
days surrounding the stock splits. Koski, (1998) also observed similar results of 3.4%
excess positive returns surrounding the split announcement days. Ikenbery et al.

3
(1996) found long term positive abnormal return of 7.93% of excess return in the first
year and 12.15% in the three years subsequent to the splits. Desai and Jain (1997)
found 7.05% and 11.87% excess returns respectively after one and three years of the
split events.
Chakraborty, (2012) studied the reaction of share prices to a split from 1999 to 2008
and found that there is significant short lived positive price reaction associated with a
split followed by an abnormally larger negative returns a few days after the split
execution.
This inconsistency between the expectations and the actual findings of the effects of
a split has been a subject of continued interest among researchers. Lyroudi, et,al
(2006) have called this a puzzle. This means that the expectations of the reaction of
share prices to stock splits among firms may not be obvious. Despite this companies
continue splitting their shares.
In Kenya, several companies listed at the Nairobi securities exchange have in the
recent past split their shares. East Africa Breweries Limited, Equity Bank Limited,
Nation Media group Limited, Centum investments Limited , and Kenya commercial
Bank Limited are some of the companies that have split their shares in the recent
past. This study therefore seeks to determine the effects of splits on share prices
among listed firms at the Nairobi securities exchange.
4
1.1.1 Share splits
According to Dhar and Chharchharia (2008) a stock split is a mere ‘cosmetic’ event
because it simply represents a change in the number of shares outstanding, and has no
direct valuation implications. It is a corporate action that increases the number of the
corporation's outstanding shares by dividing each share, which in turn diminishes its
price. The stock's market capitalization however, remains the same. For instance, in a
2 for 1 stock split, every shareholder with one share is given an additional share. This
means that there will be 2 shares for every pre-split share in the company.
Ross (1977) observes that splits are preceded by unusually high growth in earnings
and dividends. The signaling theory of splits suggests that managers’ use splits to
signal good information to investors. According to this view, the key role of splits is
to convey information, not to seek out some optimal price level. Value increases on
split announcements are often attributed to this signaling effect.
Share splits lead to increased stock liquidity. Muscarella et al (1996) provided
empirical evidence that share splits leads to increased stock liquidity. They also found
increased trading activity after the split, which they cite as additional evidence of
liquidity benefits. Liquidity is evidenced by increase in share mobility among
investors.
Dolley (1933) in his survey of companies with splits in the first third of the century
sought to determine the main reason for splitting their shares. He reported that over
90% of the managers of those companies said that the primary reason for splitting
their shares was to achieve a wider distribution of shares.
5
Baker and Powel, (1993) studied the reasons for share split for the period 1987 to
1990. He found out that a managers' major stated purpose of splits is to lower the
stock price and thus bring it into a preferred trading range.
1.1.2 Reverse splits
According to Lihua, (2002), a reverse split is a non economic event that has no effect
on shareholder wealth. They affect only the number of outstanding shares without
changing the ownership among shareholders. For example a 10:1 reverses split means
that for every ten shares held they are consolidated into one share. It is used by
companies with low share prices who would like to increase their share prices.
Market reaction to reverse splits has been mixed. Woodridge and Chambers, (1983)
found that reverse splits leads to negative abnormal returns among US firms. On the
other hand, Masse, and Hanrahan (1997) in their study of Canadian firms found
positive abnormal returns with reverse splits.
Radcliffe and Gillespie (1979) argue that the main motive for reverse splits by firms is
to improve its image. This observation supports the neglected firm theory that
suggests that firms use stock splits to attract attention.
1.1.3 Stock Returns
The value of a stock is the price that a market attaches to it. This price is largely
influenced by the forces of demand and supply. Stock prices are therefore not static
and oscillate in reaction to conditions in the market. Mehra (2002) argues that returns

6
are determined by investor preferences, the uncertainty in asset’s payoffs, and the
state of the economy in which it pays off.
According to Shriller (1981) real stock prices equal the present value of rationally
expected or optimally forecasted future real dividends discounted by a constant real
discount rate. Zhiwu and Ming (2001) argue that the price of the share represents the
value of the companies underlying assets plus its growth potential divided by the
number of shares outstanding.
Stocks are risky securities. According to Thomas, (2002) there is no universally
accepted method of estimating returns for risky assets. However he argues that returns
of such securities can be estimated using the following formula;
Rt = (Ct +Dt)
Pt - 1
Where;
Rt = Return at time t
Ct = Capital gain from time t – 1 to time t
Dt = Dividend payment at time t
Pt = Price of the stock at time t (Time at the end of the period)
Pt -1 = Price of stock at time t-1 (Time at the beginning of the period)
Arising from the above formula, there are two ways in which stock returns may be
realized, through dividend income and through share price appreciation commonly
referred to as capital gains.
7
Gilblatt et al (1984) hypothesized that firm’s signal information about their future
earnings through the stock split announcement. Ross (1977) argues that financial
decisions convey information about firm value. Copeland (1979) observed that a
stock split changed stock prices to a more optimal price, which in turn increased
demand for the stock. His hypothesis stated that there was a price range within which
trading was most liquid for stocks of a company and concluded that firms split their
stock to keep prices within this range.
Conroy and Harris (1999) noted that when a stock became too expensive, a split
brought it back to the optimal price range. Lakonishok et al (1987) argued that there
existed benchmark values regarding stock prices and managers were guided by these
comparative figures in making decisions on whether to split their shares.
1.1.4 Relationship between Share splits and Long run Stock Returns.
According to Naidu, (2000) a stock split is merely a numerical change which leaves
the investors no better or worse off than they were before the split. Baker and
Gallagher, (1980) argued that a stock split is a mere arithmetic exercise which results
in a reduction of the par value and a consequent increase in the number of shares
proportionate to the split while all other capital accounts remain unchanged. Based on
these arguments, a share split should therefore not on itself elicit any reaction from
the market.
Baker and Gallagher (1980) also state that theoretically shareholders receive no
tangible benefits from a stock split, while there are costs associated with it. If this be
so, then the expected reaction of the market to a stock split should be a reduction in

8
the prices of shares, in order to recognize the effects of the additional costs associated
with it. However empirical evidence in several markets indicates that on average,
share prices increase as a result of a split announcement. In the long as well as the
short run therefore share splits would not necessarily be expected to elicit any
responses from the market unless the splits are accompanied by other corporate
announcements such as higher dividend payouts or bonus shares.
Most of the studies undertaken on the effects of share splits on long run stock returns
have shown mixed reactions. Rodney (2001) studied the long run performance of
shares after splits for firms listed at the NYSE and found a significant positive return
during the first year of the split announcement followed by insignificant returns in
subsequent years.
Ikenberry et al. (1996) examined the effects of share splits on the long run stock
returns for a sample of 1275 two for one stock splits and found significant post split
excess returns of 7.93% in the first year following the split, and 12.15% in the first
three years following the split. The announcement returns was however at 3.38%
suggesting that the market under reacts to the immediate share splits announcement.
Desai and Jain (1997) examined one to three year performance of common stocks
following 5596 stock splits and 76 reverse split announcements made during the
period 1976 to 1991. They found a buy and hold abnormal return of 7.05% during the
first year following a split and 11.87% for the three year buy and hold return. For
reverse splits they found 11.76% during the first year of the announcement and -
33.90% for the three year holding period.

9
Equally in the short run the findings of the effects of share splits on returns have been
mixed.
Arbel and Swanson (1993) found that companies listed on the NYSE elicited a
positive response to splits in the USA. In Germany Wulff (1999) also found that stock
splits elicited a positive response to the market. In India, Gupta and Gupta (2007)
found mixed reaction with stock splits.
In Kenya Aduda and Chamarum (2010) and Simbovo (2006) found positive changes
to the market as a result of a share split announcement. This shows that the
relationship between stock splits and share prices may not be truly understood due to
the conflicting findings. These empirical findings are contrary to the expectations. As
a result, the relationship between stock splits and share prices remains a puzzle to
financial economists and practitioners (Desiras et al. 2006).
1.1.5 Nairobi securities Exchange
In Kenya informal trading in shares started in the 1920’s. Trading at the time took
place through a gentleman’s agreement as there were no rules or regulations to govern
trade in shares.
In 1954 the Nairobi stock exchange was constituted as a voluntary association of
stock brokers and registered under the society’s Act. Formal trading in shares
commenced then but was dominated by the whites and Asians. Africans were then not
allowed to trade at the bourse but started trading in shares after the attainment of
independence in 1963.
10
There are currently 62 companies listed at the NSE. Some of these listed companies
are cross listed in other countries of the East Africa e.g Kenya Airways Limited and
East Africa Breweries limited. The Instruments traded in the market are the common
shares, preference shares, and bonds.
The market is made up of different segments, with each representing an industry.
Companies that have undergone stock splits at the NSE are fairly representative of the
market because construction, Energy, Manufacturing, Investments, Agriculture,
Commercial and services, Automobiles and the Banking segments are represented.
The banking sector has taken 25% of the total number of stock splits undertaken at the
NSE so far.
1.1.6 Stock splits in Kenya
The first stock split in Kenya was undertaken in 2004 by Kenya National Oil
Company Limited, followed by East Africa Breweries Limited the same year.
Subsequently, between 2004 and 2012, twelve companies listed at the NSE have
undergone a stock split on their shares.
Shares splits therefore remain a major corporate event undertaken by firms regularly.
Furthermore, according to Debabrata and Pradip (2012) stock splits involve several
costs including administrative cost, printing costs, legal expenses etc. These costs
have to be borne by the shareholders. Fundamentally, the expected reaction to these
events would therefore be a reduction in the market values of the firm’s shares. On the
contrary, many studies undertaken in Kenya and elsewhere have found empirical
evidence that stock returns on average increase after a split.

11
1.2 Research Problem
In theory, stock splits have no direct effect on firm values (Dennis and Strickland
2003). In an efficient market a split is expected to elicit a response from the market as
a consequence of this new set of information. According to Ayodeji, (1998) however,
all the information communicated by a stock split to the market should be recognized
at the time of the split and subsequent stock prices should not show any unusual price
reaction
Studies on the effects of stock splits on returns have been mixed. In India, Gupta and
Kumar (2007) studied split events from 1999 to 2004 taking 60 stocks and found a
mixed announcement effect. They found significant positive abnormal returns on the
very next day of announcement but the following days showed significant negative
abnormal returns.
In Germany, Wulff, (1999) reported abnormal positive returns following a stock split
among companies around the announcement day. In the US, Arbel and swanson
(1993) found that stocks listed on the new York stock exchange (NYSE) and the
American stock exchange (AMEX) reacted positively to stock splits announcements.
In Kenya, Simbovo (2006) studied the effects of stock splits and large stock dividend
on liquidity among firms in the NSE and found that stock splits have a positive effect
on liquidity although the change in liquidity was found to be statistically insignificant.
Aduda and chemarum (2010) in their study on market reaction to stock splits found
that Kenyan market react positively to stock splits.

12
Nkonge (2010) studied the effects of stock splits on the securities returns at the NSE
and found abnormal returns. Ongere (2011) studied the effects of stock splits on the
ownership structure of firms with reference to the Nairobi stock Exchange and found
an increase in shareholders as a result of a split. Obunde (2011) studied the impact of
stock splits on stock performance of firms listed in the Nairobi stock with specific
reference to trading volumes and found that trading volumes increases with the
announcement of a split.
Studies so far undertaken in other developed markets indicate mixed reaction to stock
splits. The findings range from positive responses, negative responses and even no
effect at all. However in Kenya, the findings of all the studies so far undertaken
indicate positive responses to stock splits.
Furthermore, most of the studies on stock splits in Kenya have been on effects of
share splits on returns in the short run. The findings of these studies have shown a
positive response to share splits. There has not been any significant study on the
effects of share splits on the long run stock returns. There is a need for such a study to
be undertaken in Kenya. This study therefore seeks to evaluate the effects of share
splits on long run returns among firms listed at the Nairobi securities Exchange.
1.3 Research Objective
The objective of this study is to evaluate the effects of share splits on long run stock
returns for companies listed at the Nairobi securities Exchange.

13
1.4 Value of the Study
Stock splits are a major corporate event in a company. As such it is important for a
firm to understand the implications of this event on the firm’s future growth and
prosperity. This study will generate knowledge in which several groups of people will
benefit. Among the expected beneficiaries include;
1.4.1 Researchers
This study will enable researchers understand the likely effect of share splits on long
run stock returns. It will also provide a framework for further research in this area of
study. Researchers may also determine which other area of study has not been
covered in the previous studies including this one and undertake studies on it. Further,
this study will act as a good reference material in future studies related to the share
splits and stock prices particularly on the Kenyan Market.
1.4.2 Investors
Investors could use the findings of this study to enable them predict the likely effects
of stock values as a result of a share split announcement. They are concerned with the
returns that accrue from their investments and as such any information that may act as
a reference guide to them would be welcome. The study findings will serve this
purpose. Short term investors who speculate in the market would also use the findings
of this study to position their purchasing and selling strategies in reaction to a stock
split announcement. The long term investors will also be keen on the findings of this
study.

14
1.4.3 Government and its regulatory Agencies
In formulating policies regarding stock markets, the Government and its regulatory
Agencies would find the findings of this study as an important reference document.
Quoted companies in the NSE in 2003 agitated for an amendment to the capital
markets authority Act to allow for stock splits, which the Government did in 2004. It
would be of interest for the Government to find out how the subsequent splits have
generally performed in the market. This will guide the Government in formulating
future policies towards stock splits. A positive effect on the share values also has a
positive effect on the economy.
Activity levels at the securities exchange market have variously been used as a
standard measure of the robustness of the economy of a country. Increased activities
indicate that the economy is robust enough and leads to a bullish run in the market. A
positive effect of share splits on share values will enhance market activity and hence
improve economic performance.
1.4.4 Financial practitioners and Advisors
Financial advisors provide specialized consultancy services to their clients. Before a
company’s management undertakes a major corporate decision such as splitting the
company’s shares, they need to understand the likely effects of their actions on the
wealth of the firm’s shareholders. This they do by seeking advice from their
consultants or financial advisers.
Financial advisers therefore need information on empirical evidence of the effects of
such events on the company’s share values. An increase in the prices of shares will
serve this objective while a decrease will reduce the wealth of the shareholders.

15
CHAPTER TWO
LITERATURE REVIEW
2.1 Introduction
This chapter begins by reviewing efficient market hypothesis and the various theories
that have been advanced to explain the concept of share splits. Several of these
theories explain the main motivation behind managers’ decisions to split their stocks.
It also discusses the different forms of stock splits and also reviews stock values and
their determinants. It concludes with a review of the empirical evidence of the studies
that have been undertaken on share splits.
2.2 Efficient market hypothesis
Efficient market hypothesis is a notion that markets fully, accurately and
instantaneously incorporate all the available information into market prices (Andrew,
2005). It states that in highly competitive and developed markets it is impossible to
derive a trading strategy that can generate persistent excess profits after correction for
risk and transaction costs (Gerwin, 2003). The assumption behind this observation is
that market participants are rational and will be motivated by the desire to increase
their wealth in their investment decisions.
Efficient market hypothesis states that market prices fully reflect all available
information (Fama 1969). Reilley and Brown (1997) defines an efficient market as
one in which stock prices adjust rapidly to new information immediately the market
becomes aware of it and therefore the current stock prices have already reflected all

16
information about the stock. This means that in an efficient market, it’s nearly
impossible to manipulate the share prices.
According to Fama (1970) there are three forms of informational market efficiency.
These are efficiency in the strong form, efficiency in the semi strong form and
efficiency in the weak form. A market is said to be efficient in the weak form if the
market prices of shares reflect all the historical information related to a share. This
information includes the historical price trends of the shares and the market trading
data. Fama (1970) adds that if a market is efficient in the weak form, past prices are
useless in predicting future prices.
A market is said to be efficient in the semi strong form if the share prices reflect all
the publicly available information including information that is only known to
company insiders. In this form all publicly available information has no predictive
power, thus the current prices of shares reflect all information content about historical
prices and all publicly available information about the company.
A strong form efficiency market is one in which the share prices reflect all
information pertaining to the company including historical, private and even
confidential information. Grossman and stiglitz (1980) stated that prices can only
fully reflect costless information since there must be a cost of acquiring information.
As a result of this observation Fama (1991) indicated that in a strong form efficiency
market, trading and information costs are assumed to be non-existent.

17
Based on the concept of efficient market hypothesis, share prices of securities should
adjust immediately the market becomes aware of the company’s intention to split their
shares. However according to Dhar and Chharchharia (2008) a share split only
represents a change in the number of shares outstanding and has no direct valuation
implications on the firm. The information therefore would not necessarily be expected
to lead to any price adjustments at least in theory. Several empirical findings however
indicate that shares on average react to share splits.
2.3 Theories of stock splits
Several theories have been advanced to explain why firms split their shares. These
include the signaling theory, liquidity theory, neglected firm theory, trading range
theory, value manipulation theory and trading speed improvement theories. There are
several other theories related to stock splits besides these.
2.3.1 Signaling theory
According to Brennan and Copeland (1988) managers have private information about
the future prospects of their company. This hypothesis suggests that stock splits are
actions made by management to reveal this information about future earnings of the
company to the market. Fama et al (1969) argues that investors interpret stock split as
a message about future changes in the firm’s expected cash flows.
Glinblatt, et al (1984) argues that stock splits can reduce information asymmetry
between the management and the shareholders by attracting attention paid to a firm.
Brennan and Copeland (1988) indicated that managers only split their stocks if they

18
are optimistic the future prices would increase, or at worst not decrease. McNichols
and Dravid (1990) noted that a split conveys information to the market.
2.3.2 Liquidity hypothesis
According to this theory, stock splits increase liquidity of firms’ shares and
successfully attract more noise traders into that counter. Black, (1986) argues that an
increase in noise traders should improve liquidity. Dennis, and Strickland, (2003)
studied liquidity effects of stock splits at the Nasdaq-100 Index and found that the
frequency, share volume, and dollar-volume of small trades were all increased after
the split, indicating that the split improved liquidity for small traders.
Arnold, and Lipson, (1997) studied a two for one stock split from 1995 to 1996 for
companies listed at the NYSE and confirmed that liquidity increases as a result of
splits. Baker and Powell (1993) in their study found that the main motivation for the
executives to split stock was for improved liquidity. Lamoureux and Poon (1987) and
Conroy et al (1990) noted that managers expected stocks trading at lower prices to be
generally more liquid and to attract a larger pool of potential investors, hence the need
to split shares whose prices have soared to unattractive levels.
2.3.3 Neglected firm theory
Firms are neglected when they attract little or no attention from investors. Arbel and
Swanson (1993) suggested that if there is little information known about a firm, its
shares will be trading at a discount. The firm therefore uses share splits as a means of
drawing investor’s attention about it. Management of neglected firms usually applies
share splits as a means of achieving the attention getting effect (Conroy, 1990). When

19
investors are attracted to a firm the demand for its shares rises. This theory suggests
that share splits are a powerful tool used by neglected firms to rebound into the
market.
2.3.4 Trading range theory
This theory suggests that there exists an optimal price range in which the shares of a
company are more liquid (Copeland 1979). Conroy and Harris (1999) also supported
this theory by arguing that manager’s engineer splits to return their companies share
prices to a preferred range.
Lamoureux et al. (1987) argues that lower stock prices would attract smaller
shareholders thus extending the shareholder base. An extended shareholder base
increases the trading activities among investors thus positively affecting the share
prices. Angel et al. (2004) found increased trading activity by retail shareholders after
the split. Easley, et al (2001) in their studies also found evidence that trading activity
of uninformed (noise traders) market participants increased following stock splits.
2.3.5 Value Manipulation hypothesis
This is a fairly recent theory proposed by Shourun, et,al (2006). It explains why firms
split their stocks before acquisition announcement. This hypothesis suggests that
acquiring firms split their stocks before acquisition announcements in order to inflate
the market value of their equity. They reported that some firms manipulate their stock
prices before large acquisitions financed by stock, probably in an attempt to
manipulate the share prices before an acquisition announcement.

20
A firm intending to acquire another firm through share for share exchange will
according to this theory manipulate the share price in order to reduce the net effects of
this transaction on the acquiring firm. If the prices of their shares rise then fewer of
their shares will be exchanged for the shares of the acquired firm, thus benefitting the
acquiring firm’s shareholders.
2.4 Review of Empirical Evidence
In his study on market reaction to stock splits in Germany, Wulff (1999) found that
stock splits are associated with abnormal returns on both the announcement day and
the execution day, though these returns are much lower in Germany than in the United
States of America. He attributed this to the inability of German firms to use splits for
signaling due to legal restrictions on splits. The law in Germany requires firms to
maintain a minimum par value of their shares. In most other countries including
Kenya there are no such restrictions.
In India, Ashim (2007) studied market reaction to stock splits on stock prices, returns,
volatility and trading volumes around the ex-split dates on a sample of firms over the
period 1999 to 2005. He found an overall negative effect on stock prices and returns
after the split, but the effects on volatility and trading volume was positive. Gupta
and Gupta (2007) studied split events from 1999 to 2004. He studied the reaction of a
total of 60 splits and found a mixed split announcement effect, positive abnormal
returns on the next day following the announcement followed by consecutive negative
abnormal returns on other days.

21
Vijay et,al. (2004) studied the implications of stock splits, reverse stock splits and
dividends on the market in Canada. They found that the performance of the stocks
after the split announcement is less than the pre- split period but there is an increase in
the trading volume after the split. They also found a permanent change in the P/E ratio
which they attribute to a change from institutional investors to individual investors.
These findings suggest that when a firm splits its shares, it experiences a shift of its
clientele from institutional investors to individual investors.
This is consistent with the trading range theory that suggests that individual investors
prefer a specific price range due to psychological reasons. A split reduces the share
prices and as a result attracts small investors to the firm. It also indicates that firms
may use stock splits to deliberately change the shareholder composition. Greenberg
and Brooker (1999) argued that many companies prefer retail investors to institutional
investors because retail investors are thought to be more loyal than institutional
investors.
Empirical evidence in Australia has shown that the market generally react positively
to the announcement of a stock split. McNichols. and Dravid (1990) studied stock price
reaction around the announcements of ‘stock capitalization changes’ (bonus stock
issues, stock splits and rights issues) for the period between 1960 and 1969 using
monthly data and found 20.2% abnormal returns.
Lakonishok and Lev (1987) studied the effects of stock splits and stock dividends on
growth and trading volumes of 1000 firms during the period 1963 to 1982 in the USA.
They found that stock splits occur to bring the stock price to what they referred to as

22
an optimal range. They also found that firms splitting their shares recorded higher
growth in earnings and dividends in the intervening periods. They however did not
find any increase in trading volumes on shares.
Arbel and Swanson (1993) found that stocks listed at the New York Stock Exchange
(NYSE) and the American stock exchange (AMEX) reacted positively to stock splits.
Desai and Jain (1997) found that there was an excess return after a holding period of
one year, followed by a higher return after a holding period of three years.
In the Hong Kong market, Wu and Chang (1997) found excess returns after
examining 67 splits in the period 1986 to 1992. Wulff (1999) found excess returns
during the four days following the stock splits announcement and four days following
the split in Germany. Angel et al, (2004) noted an increase in trading activity among
the retail investors following a split. Bechmann and Raaballe (2004) reported a
positive and significant announcement effect of 2.5% in Denmark.
In other instances studies on stock splits found negative reactions on the market.
Conroy et al. (1990) found declining trading volumes after share splits.
In Kenya, studies have shown that stock splits elicit positive reactions in the market.
Simbovo (2006) studied the effects of stock splits and large stock dividend on
liquidity at the NSE and found that stock splits elicited a positive reaction on the
firm’s liquidity. He also found that a high demand for the company shares preceded
the decision to splits. This demand had apparently led to huge increases in the share
prices making them unaffordable to a majority of the small investors, and hence the
need to split them.

23
Aduda and Chemarum (2010) studied market reaction to stock splits at the Nairobi
stock exchange. Their studies covered nine companies that had undergone stock splits
from 2002 to 2008. They analyzed the trading activity ratio to determine whether
splits elicited any reaction in the Kenyan market. Their studies sought to determine
the reaction of the market to stock splits, using 101 days window period. They found
that the Kenyan market reacts positively to stock splits as evidenced by the relative
increase in the volumes of shares traded around the stock splits.
Nkonge (2010) also studied the effects of stock splits on the securities returns at the
Nairobi securities exchange. He did this by examining the behavior of stock returns
for a period of 10 days prior to the split and 10 after the split. He also found that there
were abnormal returns on the day of the split announcement, as well as two days
before the announcement and two days after the announcement.
Obunde (2011) studied the impact of stock splits on stock performance of firms listed
in the Nairobi stock Exchange with specific reference to trading volumes and returns.
He studied the performance of firms that had undertaken a stock split in the period
2004 to 2011 and found that trading volumes tended to increase with the
announcement of the split. He also found that due to this overreaction by investors on
the announcement, the short run liquidity and returns on the shares tended to rise,
though momentarily.

24
2.4.1 Empirical Evidence on effects of stock splits on Long run
returns
Rodney (2001) studied the long run performance of shares after a split in the US. In
his studies he examined the long run equity performance of 6000 firms following
stock splits during the period 1950 to 2000 for a period of twelve months after the
stock split announcement and found robust weighted abnormal returns during the first
year following the announcement month. In the long run there was insignificant
change in returns in subsequent years. This suggests that the shares reacted positively
in the short run while in the long run the reaction was insignificant.
Ikenberry et al. (1996) examined the effects of share splits on the long run stock
returns for a sample of 1275 two for one stock splits and found significant post split
excess returns of 7.93% in the first year following the split, and 12.15% in the first
three years following the split. The announcement returns were however at 3.38%
suggesting that the market under reacts to share splits announcement.
Desai and Jain (1997) examined one to three year performance of common stocks
following 5596 stock splits and 76 reverse split announcements made during the
period 1976 to 1991. They found a buy and hold abnormal return of 7.05% during the
first year following a split and 11.87% for the three year buy and hold return. For
reverse splits they found 11.76% during the first year of the announcement and -
33.90% for the three year holding period.

25
2.5 Share splits
Firms split shares in order to manage the nominal share price and number of shares
outstanding but cannot change its overall market value through these means (Malcolm
et al 2008). According to Angel (1997), splits signal inside information, or that prices
in certain ranges constitute a market norm and that trading activity by small investors’
increases following a stock split.
2.5.1 Why firms split their shares
Baker and Powell (1993) found that the main motivation for the executives to split
stock was to improve liquidity. Shourun et al., (2006) argues that the firm’s main
motive for splitting their shares is known only to insiders and management and cannot
be observed directly by outsiders. This is consistent with the signaling hypotheses that
suggest that managers implement stock splits to communicate favorable private
information about the firm's prospects.
According to Baker et al, (1993) the main motivation for stock splits by firms is to
move the stock price into a better trading range, the preferred trading range. This
supports the trading range theory that firms split their shares to move their prices to a
preferred price range.
(Ross (1977) also argues that Managers use financial decisions such as stock splits to
convey favorable private information about the current value of the firm. This
supports the neglected firm hypotheses that suggest that neglected firms use splits for
visibility.

26
Baker et al (1980) argues that marketability is a major reason for executing a split.
Research findings tend to support this motive. Lamoureux et al (1987) and Maloney et
al (1992) reported that the number of shareholders increases following common stock
splits. Schultz (1999) found that the number of small orders increases following a
stock split, and that the bulk of these orders are buys. Angel et al (1997) found that
trading activity by small investors’ increases following a stock split. Fernando et al,
(1999) found that firms going public use the offering price to influence investor
interest in the issue.
2.5.2 Constraints to share Splits
The managements' scope to decide on a stock split may be constrained by law. In
Switzerland and Germany, firms are legally required to maintain a minimum
mandatory par value of their shares (Roger, (2007). This limits the split options of
firms in those countries. In other countries including Kenya there are no such
restrictions and as such firms can split their shares to the barest minimum par values.
The par value of the Safaricom Company limited is Ksh.0.05, the lowest possible
value in the Kenyan market.
2.6 Stock prices.
An asset is considered to be efficiently priced if the asset price reflects all the
available market information (Farma et al 1969). Economists argue that the price of a
commodity is determined by the forces of demand and supply. Shiller (1981) argues
that real stock prices equal to the present value of all rationally expected or optimally
forecasted future real dividends discounted by a constant real discount rate. Zhiwu

27
and Ming, (2001) argues that a share price represents the value of the companies
underlying assets plus its growth potential divided by the number of shares
outstanding. These are the fundamental elements of a stock price.
Past studies on share price movement has indicated that share prices move randomly
in what is commonly referred to as random walk. Sharma and Kennedy (1977) studied
the behavior of stock prices in Bombay, London and New York stock Exchanges in
the period 1963 to 1973 and found that share prices in all the three stock exchanges
obey a random walk.
2.7 Conclusions
There is overwhelming empirical evidence that stock splits lead to positive outcomes.
It has been shown variously that splits leads to increased liquidity, positive market
reaction, marketability of shares and increased demand for shares. It has also been
shown that share splits are associated with significant wealth creation among firms.
These findings encourage firms to undertake stock splits as a corporate event when
the circumstances allow. However further research would be necessary to determine
the factors that are responsible for this trend.
In Kenya since the first stock splits were undertaken by the Kenya National Oil
Company (KENOL) and East Africa Breweries in 2004, several other companies
have followed suit. This trend shows that firms are increasingly using split events as a
means of making their shares marketable. It is a relief to companies whose shares are
deemed to be too expensive for a majority of investors.

28
CHAPTER THREE
RESEARCH METHODOLOGY
3.1 Introduction
This chapter begins by describing the research design adopted in this study. It then
identifies the target population from which the sample was selected and the sample
size and the sampling techniques employed in identifying the firms that were
subjected to the study. The nature of data collected and analyzed is also identified.
The chapter ends by describing the data analysis techniques used in analyzing the data
and the models used in the data analysis.
3.2 Research Design
According to Donald and Pamela, (2006), research design constitutes the blue print
for the collection, measurement and analysis of data. The research design used in this
study was the descriptive design. Donald and Pamela (2006) argued that descriptive
design leads to the discovery of associations among the different variables.
This study used the long run event study methodology. It applied the buy and hold
benchmark approach in order to determine the long run stock returns of the event
firms within a period of two years after the share splits. In order to correctly measure
the abnormal returns for the target firms, a control firm which had not undergone a
stock split, and was comparable in size and BE/ME ratio to the event firm was
identified to act as the benchmark whose returns were used as a proxy for expected
returns.

29
3.3 Target Population
The target population for this study was all the twelve firms listed at the Nairobi
securities exchange, and that had undergone a stock split. These companies are shown
in appendix 1.
3.4 Sample Design
Sampling design refers to that part of the research plan that indicates how cases are to
be selected for observation (Kombo and Tromp, 2006). In this case a non probabilistic
sampling design was used because the data to be included in the study are from only
those firms that have undergone stock splits at the Nairobi securities exchange and
have been in existence for at least two years since they split their shares. The study
therefore covered eleven companies listed at the Nairobi securities exchange and
which had undergone a share split from 2004 to 2010.
These companies that qualified for this study are East Africa Breweries Limited ,
Barclays Bank of Kenya limited, Equity Bank limited, Kenya power and lighting
company limited, Centum Investments company limited, CMC holdings limited, East
Africa Cables limited, Kenya Commercial Bank limited, Kenya Oil Company Ltd,
Nation Media Group limited and Sasini tea and coffee company limited. A list of
these companies, their split ratios and the split dates are shown in Appendix 2.
3.5 Data Collection Procedures
The study used secondary data collected from the Nairobi securities exchange. The
nature of data used included the monthly opening and closing prices of the selected
30
companies’ shares starting from the month immediately following the share split date
for each of the firms. Data for twenty four months was collected and analyzed.
3.6 Data Analysis
The Long run event study methodology was used in this study and used the buy and
hold benchmark approach. There are two main tasks in long run event study
methodology. These tasks are to measure the event related long run abnormal returns
and then to test the null hypothesis that the distribution of these long run abnormal
returns concentrates around zero.
The long run buy and hold abnormal return (BHAR) of firm i is calculated as;
AR i = Ri – BRi
Where;
ARi is the buy and hold abnormal return for firm i
Ri is the long run buy and hold return for firm i
BRi is the long run return of a benchmark of firm i
According to Kothari and Warner (2007) a benchmark of a firm or a control firm is
another firm that matches the event firm in size and book to market equity ratio
(BE/ME) but has not undergone a share split.
The benchmark return, (BRi) is the return that an event firm would have earned if the
event had not happened. The returns of the benchmark firm will therefore be used as
a proxy for the expected returns of the event firm if it had not undertaken a share split.
31
According to Fama and French (1993) the expected monthly return is related to three
factors; market factor, size factor and book to market Equity ratio (BE/ ME). They
further argue that a firm with 70% to 130% of the event firm’s market value may be
used as an equivalent of the event firm and therefore may be used as a benchmark
firm for a long run event study.
The monthly buy and hold abnormal returns for each of the event firms was computed
for the entire window period of twenty four months. EXCEL 2007 windows program
was used to plot graphs of the event firm’s monthly buy and hold returns against the
returns of the benchmark firm. The statistical package for social Sciences (SPSS)
Version 18 was used to calculate the summary descriptive statistics for each of the
sampled firms mean buy and hold abnormal returns (BHAR) tested for any significant
difference from zero at 95% confidence level.

32
CHAPTER FOUR
DATA ANALYSIS AND PRESENTATION OF FINDINGS 4.1 Introduction
This chapter presents the analysis of data related to the monthly buy and hold returns
of the sampled firms from 2004 to 2010. Secondary data on the monthly opening and
closing prices of shares for each of the sampled firms beginning from the month
following the date the company underwent a share split for a period of twenty four
months was collected from the NSE. Similar data for the identified benchmark firm
over the same period was also collected. Data on the market prices of shares, the par
value of shares and number of shares outstanding of all companies listed at the NSE
on the day each sampled firm split its shares was also collected. This enabled the
identification of a suitable benchmark firm for each of the event firms by computing
of the market capitalization and the BE/ME ratio of each of the listed firms as at that
date.
The chapter contains graphical presentations of each of the firm’s buy and hold
monthly returns plotted against similar returns for its benchmark firm. A summary of
descriptive statistics for each of the firm’s buy and hold abnormal return was
computed to test its difference from zero at 95% confidence level This was to
determine if the monthly buy and hold returns of the event firm were significantly
different from those of its benchmark firm.
4.2 Data presentation
The data was analyzed using EXCEL 2007 windows program to generate the required
graphs for each of the paired firm’s percentage monthly buy and hold returns. The

33
Statistical package for social Sciences (SPSS) version 18 was used to calculate the
summary descriptive statistics for the mean BHAR of each of the event firms tested
for difference from zero at 5% significance level.
4.2.1 Monthly buy and hold returns
The monthly buy and hold returns of a firm is the difference between the closing price
and the opening price of a share in a month. In order to compare the monthly buy and
hold returns of a firm against its benchmark firm, a graph of its monthly buy and hold
returns for the entire window period of twenty four months after it split its shares was
plotted against a graph of the monthly buy and hold returns of its identified
benchmark or control firm over the same period.
Figure 1: A graph showing the monthly Buy and hold Returns for Barclays
Bank Limited against its Benchmark Firm Standard Chartered Bank after the
BBK share split.
Source: Research Data

34
Figure 1 presents a plotted graph comparing the percentage monthly buy and hold
returns for Barclays Bank (K) Limited and its Benchmark firm, standard Chartered
Bank (K) Limited for the entire period of twenty four months after BBK split its
shares. The graph shows that the two firms’ performances were proportionately
comparable for the first twelve months after the share split. The benchmark firm
however performed better than the event firm in the subsequent twelve months.
Barclays Bank recorded a mean buy and hold return of -2.4% compared with the
benchmark firm which recorded a mean buy and hold return of 0.98 %. The mean
BHAR for the company was therefore -2.5%. The interpretation of this data is that the
Benchmark firm, standard Chartered Bank limited achieved higher returns than the
event firm, Barclays Bank limited by 2.5%.
Figure 2: A graph showing the monthly Buy and hold Returns for Centum
Investment Limited against its Benchmark Firm Rea Vipingo plantations
limited after centum investments split its shares.
Source: Research Data
Figure 2 presents a plotted graph comparing the percentage monthly buy and hold
returns for Centum Investments Limited and its Benchmark firm, Rea Vipingo

35
plantations limited for the entire period of twenty four months after centum
investments limited split its shares. No meaningful differences can be noted in the
monthly buy and hold returns of these two firms.
The mean buy and hold monthly return for the centum investments company was -
4.47 % compared with the benchmark firm which recorded -3.18%. This means that
the mean buy and hold abnormal return (BHAR) for centum investment’s company
was -1.29%. This indicates that the benchmark firm yielded higher returns than the
event firm by 1.29%
Figure 3: A graph showing the monthly Buy and hold Returns for E.A Cables
Limited against its Benchmark Firm BAT (K) limited after EA Cables split its
shares.
Source: Research Data
Figure 3 presents a plotted graph comparing the percentage monthly buy and hold
returns for East Africa Cables Limited and its Benchmark firm, BAT (K) limited for
the entire period of twenty four months after East Africa cables split its shares. The

36
graph does not show any significant differences between the two firms. However it
is noted that form the 13th month to the 18th month, the benchmark firm recorded
significantly higher returns compared to the event firm that recorded low returns.
The mean buy and hold monthly return for the East Africa cables limited during the
window period was -2.22 % while the monthly buy and hold returns for its benchmark
firm was -0.08 %. The mean buy and hold abnormal return for the East Africa Cables
company limited was therefore -2.14%. This indicates that the Benchmark firm
performed better than the event firm by 2.14%.
Figure 4: A graph showing the monthly Buy and hold Returns for Equity Bank
Limited against its Benchmark Firm Standard Chartered Bank limited after the
share split
Source: Research Data
Figure 4 shows plotted graphs of the percentage buy and hold monthly returns of
Equity Bank limited against its benchmark firm Standard Chartered Bank limited for
twenty four months after Equity Bank split its shares. The Benchmark firm performed
well compared to the event firm throughout the entire window period. It achieved a
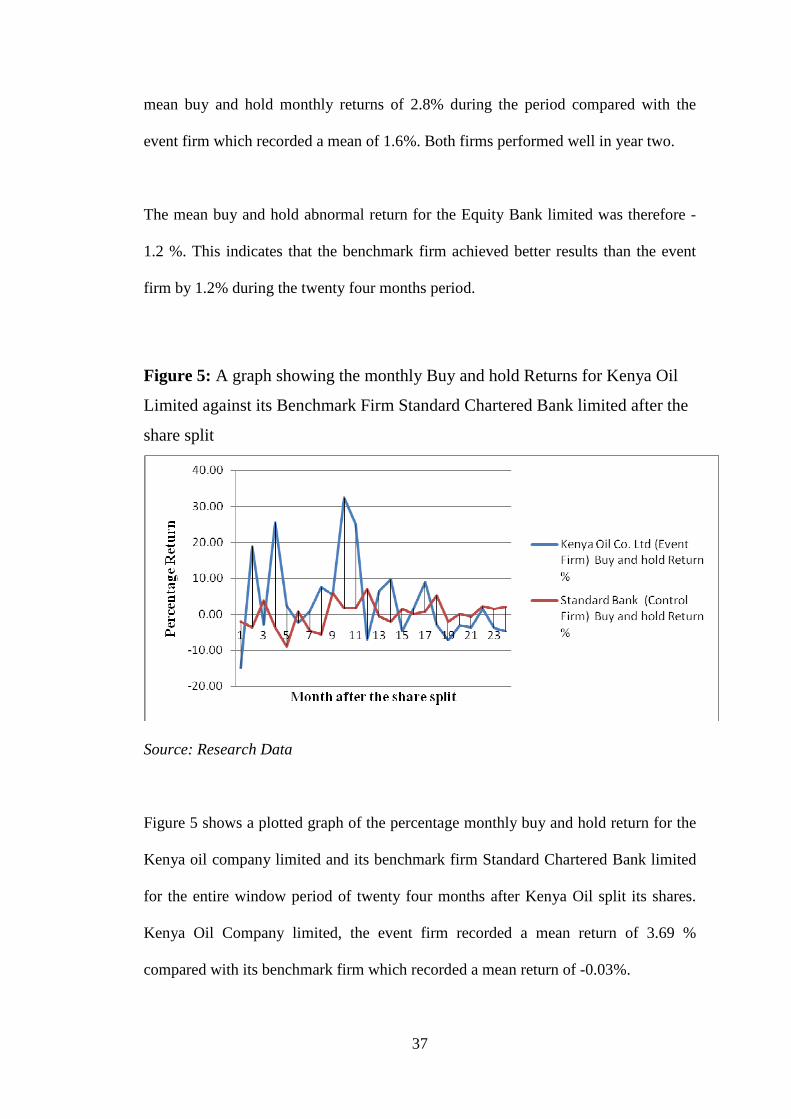
37
mean buy and hold monthly returns of 2.8% during the period compared with the
event firm which recorded a mean of 1.6%. Both firms performed well in year two.
The mean buy and hold abnormal return for the Equity Bank limited was therefore -
1.2 %. This indicates that the benchmark firm achieved better results than the event
firm by 1.2% during the twenty four months period.
Figure 5: A graph showing the monthly Buy and hold Returns for Kenya Oil
Limited against its Benchmark Firm Standard Chartered Bank limited after the
share split
Source: Research Data
Figure 5 shows a plotted graph of the percentage monthly buy and hold return for the
Kenya oil company limited and its benchmark firm Standard Chartered Bank limited
for the entire window period of twenty four months after Kenya Oil split its shares.
Kenya Oil Company limited, the event firm recorded a mean return of 3.69 %
compared with its benchmark firm which recorded a mean return of -0.03%.

38
The mean Buy and hold abnormal return for Kenya Oil Company limited was
therefore 3.72%. This can be interpreted to mean that the Kenya Oil company
achieved a higher return than its benchmark firm by 3.72%
Figure 6: A graph showing the monthly Buy and hold Returns for CMC
Holdings Limited against its Benchmark Firm TPS Eastern Africa limited after
the share split
Source: Research Data
Figure 6 shows a plotted graph of the percentage monthly buy and hold returns for the
CMC Holdings limited against its benchmark firm TPS Eastern Africa limited for the
entire twenty four months after CMC split its shares. In the first twelve months CMC
Holdings recorded returns that were higher than those of its benchmark firm. The
following twelve months however show comparable returns were recorded. CMC
Holdings also recorded a significantly high return comparatively in the fourteenth
month.
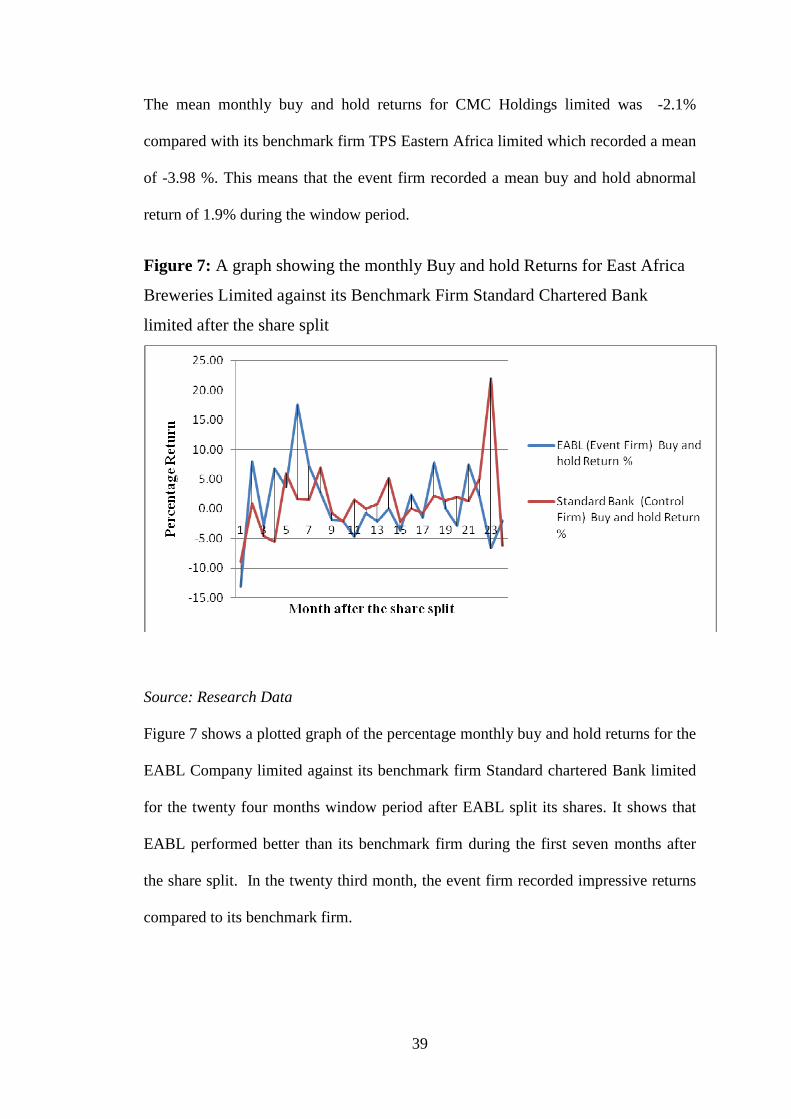
39
The mean monthly buy and hold returns for CMC Holdings limited was -2.1%
compared with its benchmark firm TPS Eastern Africa limited which recorded a mean
of -3.98 %. This means that the event firm recorded a mean buy and hold abnormal
return of 1.9% during the window period.
Figure 7: A graph showing the monthly Buy and hold Returns for East Africa
Breweries Limited against its Benchmark Firm Standard Chartered Bank
limited after the share split
Source: Research Data
Figure 7 shows a plotted graph of the percentage monthly buy and hold returns for the
EABL Company limited against its benchmark firm Standard chartered Bank limited
for the twenty four months window period after EABL split its shares. It shows that
EABL performed better than its benchmark firm during the first seven months after
the share split. In the twenty third month, the event firm recorded impressive returns
compared to its benchmark firm.

40
East Africa Breweries Limited recorded a mean monthly buy and hold return of
0.87% compared with its benchmark firm Standard Chartered Bank limited that
recorded 1.12%. This means that the event firm recorded a mean buy and hold
abnormal return of -0.25%.
Figure 8: A graph showing the monthly Buy and hold Returns for KPLC
Limited against its Benchmark Firm Athi River Mining Company limited after
the share split
Source: Research Data
Figure 8 shows a plotted graph of percentage monthly buy and hold return for KPLC
limited against its benchmark firm Athi River Mining limited for twenty four months
after KPLC split its shares. The mean buy and hold monthly return for KPLC was -
0.84% compared with the buy and hold monthly returns for its benchmark firm, Athi
River Mining which achieved a higher mean of 1.29%.

41
The mean buy and hold abnormal return for the company was -2.13%. This means
that the benchmark firm achieved higher returns than the event firm by 2.13%.
Figure 9: A graph showing the monthly Buy and hold returns for Sasini Tea
and coffee Limited against its Benchmark Firm Kapchorua Tea Company
limited after the share split
Source: Research Data
Figure 9 shows a plotted graph of percentage buy and hold monthly returns for Sasini
Tea and coffee limited compared with its benchmark firm Kapchorua Tea limited for
the entire twenty four months after Sasini split its shares. In the first ten months after
the share split both companies show comparable returns but the event firm showed
huge fluctuations after the tenth month culminating in a huge negative return in the
nineteenth month.

42
The mean buy and hold monthly return for Sasini Tea and coffee was -6.92 %
compared with is benchmark firm, Kapchorua Tea limited which was -1.97%. The
company therefore achieved a mean buy and hold abnormal return of -4.94%. This
means that the benchmark firm achieved higher returns than the event firm by 4.94%
Figure 10: A graph showing the monthly Buy and hold returns for Nation
Media Group Limited against its Benchmark Firm Kenya Airways limited after
the share split
Source: Research Data
Figure 10 shows a plotted graph of percentage buy and hold monthly returns for the
Nation Media group limited compared with its benchmark firm Kenya Airways
limited for the entire twenty four months after Nation Media Group limited split its
shares. The two companies recorded comparable returns during the first twelve
months. However the benchmark firm is shown to have achieved higher returns
compared to the event firm up to the 19th month.
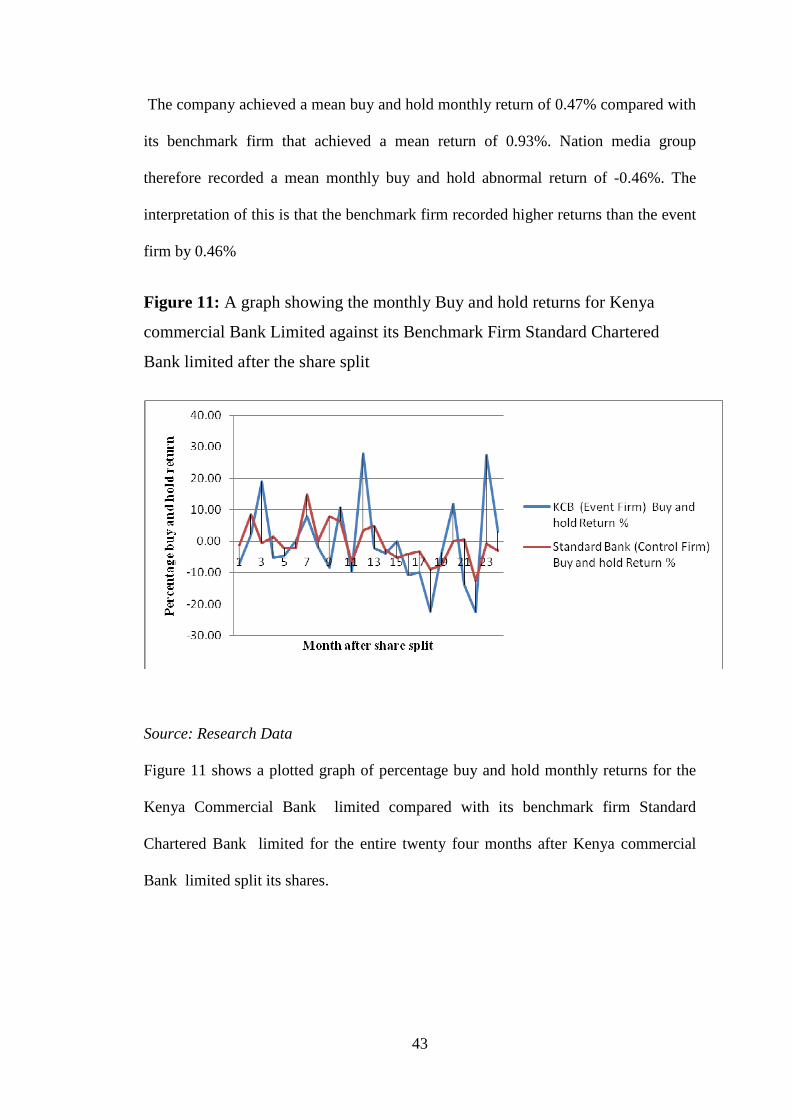
43
The company achieved a mean buy and hold monthly return of 0.47% compared with
its benchmark firm that achieved a mean return of 0.93%. Nation media group
therefore recorded a mean monthly buy and hold abnormal return of -0.46%. The
interpretation of this is that the benchmark firm recorded higher returns than the event
firm by 0.46%
Figure 11: A graph showing the monthly Buy and hold returns for Kenya
commercial Bank Limited against its Benchmark Firm Standard Chartered
Bank limited after the share split
Source: Research Data
Figure 11 shows a plotted graph of percentage buy and hold monthly returns for the
Kenya Commercial Bank limited compared with its benchmark firm Standard
Chartered Bank limited for the entire twenty four months after Kenya commercial
Bank limited split its shares.

44
The mean buy and hold monthly returns for KCB for the entire window period of
twenty four months was -0.62 % compared with its benchmark firm Standard
Chartered Bank which achieved a mean buy and hold monthly return of -0.48 %
during the same period. This means that the company recorded a mean buy and hold
abnormal return of -0.14 %. The interpretation of this is that the benchmark firm
returned a higher buy and hold return than the event firm by 0.14%.
4.2.2 Monthly buy and hold Abnormal Returns (BHAR).
The monthly buy and hold abnormal return for a firm is the difference between the
monthly buy and hold return of the event firm and that of its benchmark firm over the
same month. It is the excess monthly return earned by an event firm over its
benchmark. The assumption in the buy and hold approach is that the benchmark or
control firm is used as a proxy for the market. The returns achieved by the benchmark
firm therefore represents the market return, hence the buy and hold abnormal returns
for an event firm represents the excess return that an event company achieved above
the market as a result of splitting its shares.
The objective of this study was twofold, to determine if the event firms achieved
higher monthly buy and hold returns than their benchmark firms and, then to
determine if the differences between the means of the two firms’ returns are
significant at 95% confidence level. The null hypothesis of the study was that there
was no difference between them.

45
This was interpreted to mean that the mean BHAR of the event firm is zero ie H0:
BHAR = 0. The alternative hypothesis was that the returns of the event firm differ
from that of its benchmark firm, ie, H1: BHAR ≠ 0. This hypothesis was tested for
significance at 95% confidence level. Summarized descriptive statistics for each of
the event firm’s mean BHAR tested for significance from zero at 5% significance
level was calculated to test this hypothesis.
Table 1: Barclays Bank : Mean BHAR Descriptive Statistics
Statistic
Bias Std. Error
95% Confidence Interval
Lower Upper
BHAR N 24 0 0 24 24
Mean -2.5125 -.0271 1.4889 -5.6172 .2377
Std. Deviation 7.22728 -.19382 1.03197 4.93791 9.02272
Valid N (listwise) N 24 0 0 24 24
Source: Research Data
Table 1 shows the calculated summary descriptive statistics for the percentage mean
BHAR for Barclays Bank (K) limited during the 24 months window period after its
share split tested for difference from zero at 95% confidence level. The summary
shows that the mean BHAR for the firm was -2.51 % with a standard deviation of
7.23. It also shows that the true mean BHAR at 5% significance level is likely to be
within the range -5.61 % to 0.24%. Since zero is within this range we conclude that
there was no difference between the returns of the event firm and its benchmark firm.

46
Table 2: Centum investments limited: BHAR Descriptive Statistics
Statistic
Bias Std. Error
95% Confidence Interval
Lower Upper
BHAR % N 24 0 0 24 24
Mean -1.2892 -.0611 1.5989 -4.4293 1.8786
Std. Deviation 8.32514 -.22648 1.03176 6.01485 10.04588
Valid N (listwise) N 24 0 0 24 24
Source: Research Data
Table 2 shows the calculated summary descriptive statistics for the percentage mean
BHAR for Centum investments limited during the 24 months window period after its
share split tested for difference from zero at 95% confidence level.
The summary shows that the mean BHAR of the firm was -1.289 % with a standard
deviation of 8.325. It also shows that the true mean BHAR at 5% significance level is
likely to be within the range - 4.43 % to 1.88%. Since zero is within this range we
conclude that there was no difference between the returns of the event firm and its
benchmark firm.
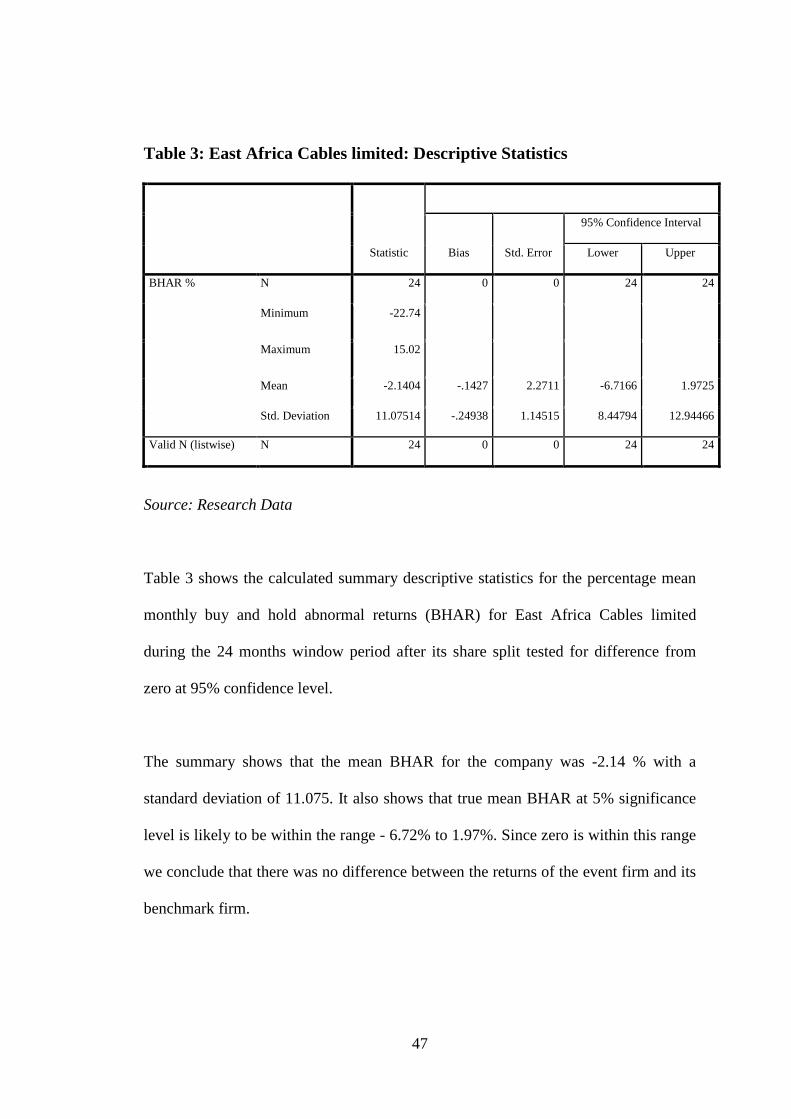
47
Table 3: East Africa Cables limited: Descriptive Statistics
Statistic
Bias Std. Error
95% Confidence Interval
Lower Upper
BHAR % N 24 0 0 24 24
Minimum -22.74
Maximum 15.02
Mean -2.1404 -.1427 2.2711 -6.7166 1.9725
Std. Deviation 11.07514 -.24938 1.14515 8.44794 12.94466
Valid N (listwise) N 24 0 0 24 24
Source: Research Data
Table 3 shows the calculated summary descriptive statistics for the percentage mean
monthly buy and hold abnormal returns (BHAR) for East Africa Cables limited
during the 24 months window period after its share split tested for difference from
zero at 95% confidence level.
The summary shows that the mean BHAR for the company was -2.14 % with a
standard deviation of 11.075. It also shows that true mean BHAR at 5% significance
level is likely to be within the range - 6.72% to 1.97%. Since zero is within this range
we conclude that there was no difference between the returns of the event firm and its
benchmark firm.

48
Table 4: Equity Bank limited: Mean BHAR Descriptive Statistics
Statistic
Bias Std. Error
95% Confidence Interval
Lower Upper
BHAR % N 24 0 0 24 24
Minimum -20.78
Maximum 11.56
Mean -1.1450 .0707 1.7805 -4.5198 2.5476
Std. Deviation 8.84606 -.25302 1.07329 6.42287 10.63665
Valid N (listwise) N 24 0 0 24 24
Source: Research Data
Table 4 shows the calculated summary descriptive statistics for the percentage mean
monthly buy and hold abnormal returns (BHAR) for Equity Bank limited during the
24 months window period after its share split tested for difference from zero at 95%
confidence level.
The summary shows that the mean BHAR for the company was -1.145 % with a
standard deviation of 8.846. It also shows that true mean BHAR at 5% significance
level is likely to be within the range – 4.52% to 2.55%. Since zero is within this range
we conclude that there was no difference between the returns of the event firm and its
benchmark firm.

49
Table 5: Kenya Oil limited: Mean BHAR Descriptive Statistics
Statistic
Bias Std. Error
95% Confidence Interval
Lower Upper
BHAR % N 24 0 0 24 24
Minimum -13.88
Maximum 30.78
Mean 3.7225 -.1530 2.5782 -1.2357 8.9414
Std. Deviation 12.75176 -.52228 1.70452 8.46729 15.17132
Valid N (listwise) N 24 0 0 24 24
Source: Research Data
Table 5 shows the calculated summary descriptive statistics for the percentage mean
monthly buy and hold abnormal returns (BHAR) for Kenya Oil limited during the 24
months window period after its share split tested for difference from zero at 95%
confidence level.
The summary shows that the mean BHAR for the company was 3.722 % with a
standard deviation of 12.751. It also shows that true mean BHAR at 5% significance
level is likely to be within the range – 1.235 % to 8.94 %. Since zero is within this
range we conclude that there was no difference between the returns of the event firm
and its benchmark firm.
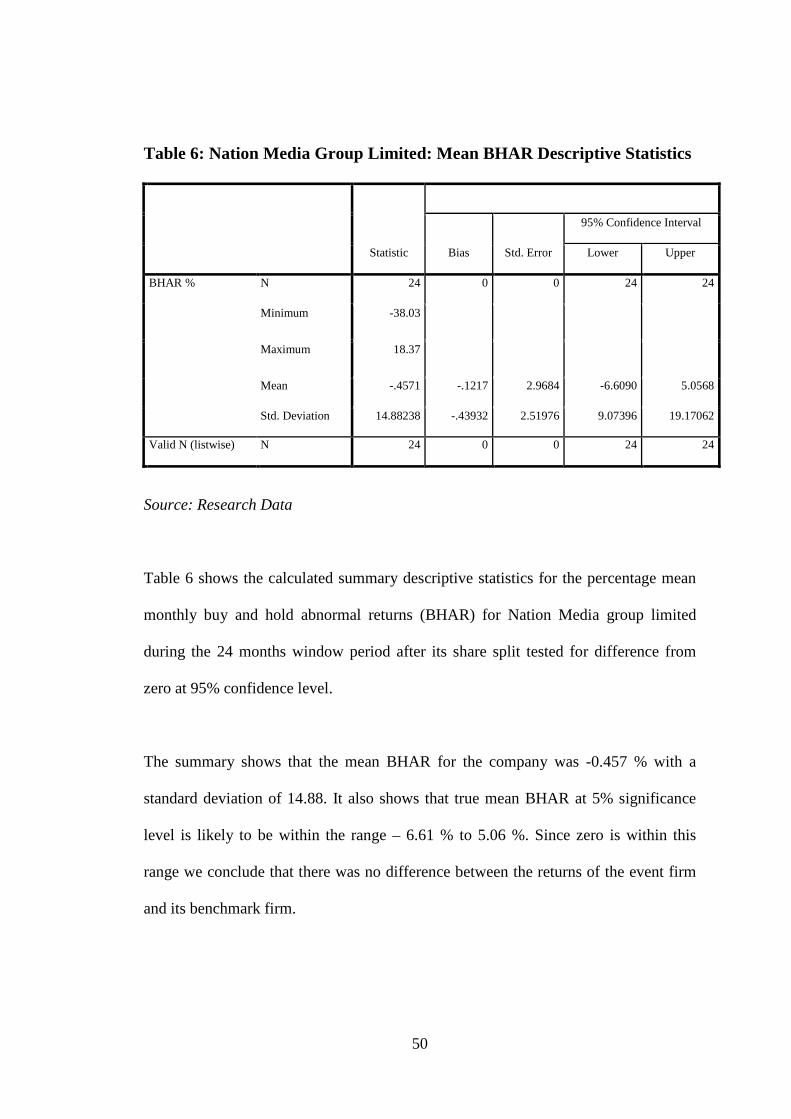
50
Table 6: Nation Media Group Limited: Mean BHAR Descriptive Statistics
Statistic
Bias Std. Error
95% Confidence Interval
Lower Upper
BHAR % N 24 0 0 24 24
Minimum -38.03
Maximum 18.37
Mean -.4571 -.1217 2.9684 -6.6090 5.0568
Std. Deviation 14.88238 -.43932 2.51976 9.07396 19.17062
Valid N (listwise) N 24 0 0 24 24
Source: Research Data
Table 6 shows the calculated summary descriptive statistics for the percentage mean
monthly buy and hold abnormal returns (BHAR) for Nation Media group limited
during the 24 months window period after its share split tested for difference from
zero at 95% confidence level.
The summary shows that the mean BHAR for the company was -0.457 % with a
standard deviation of 14.88. It also shows that true mean BHAR at 5% significance
level is likely to be within the range – 6.61 % to 5.06 %. Since zero is within this
range we conclude that there was no difference between the returns of the event firm
and its benchmark firm.

51
Table 7: CMC Holdings Limited: Mean BHAR Descriptive Statistics
Statistic
Bias Std. Error
95% Confidence Interval
Lower Upper
BHAR % N 24 0 0 24 24
Mean 1.8867 -.1071 2.5760 -3.3004 6.9163
Std.
Deviation
12.90251 -.48459 2.06549 8.40889 16.61551
Valid N (listwise) N 24 0 0 24 24
Source: Research Data
Table 7 shows the summary descriptive statistics for the percentage mean monthly
buy and hold abnormal returns (BHAR) for CMC Holdings limited during the 24
months window period after its share split tested for difference from zero at 95%
confidence level.
The summary shows that the mean BHAR for the company was 1.89 % with a
standard deviation of 12.90. It also shows that true mean BHAR at 5% significance
level is likely to be within the range –3.30 % to 6.92 %. Since zero is within this
range we conclude that there was no difference between the returns of the event firm
and its benchmark firm.

52
Table 8: East Africa Breweries limited: Mean BHAR Descriptive Statistics
Statistic
Bias Std. Error
95% Confidence Interval
Lower Upper
BHAR % N 24 0 0 24 24
Minimum -28.69
Maximum 15.97
Mean -.2525 -.0758 1.6649 -3.7756 2.7835
Std. Deviation 8.24406 -.30007 2.15001 4.09800 12.07389
Valid N (listwise) N 24 0 0 24 24
Source: Research Data
Table 8 shows the calculated summary descriptive statistics for the percentage mean
monthly buy and hold abnormal returns (BHAR) for East Africa Breweries limited
during the 24 months window period after its share split tested for difference from
zero at 95% confidence level.
The summary shows that the mean BHAR for the company was -0.25 % with a
standard deviation of 8.244. It also shows that true mean BHAR at 5% significance
level is likely to be within the range – 3.77 % to 2.78 %. Since zero is within this
range we conclude that there was no difference between the returns of the event firm
and its benchmark firm.

53
Table 9: Kenya Commercial Bank limited: Mean BHAR Descriptive Statistics
Statistic
Bias Std. Error
95% Confidence Interval
Lower Upper
BHAR % N 24 0 0 24 24
Minimum -16.20
Maximum 28.13
Mean -.1404 -.0587 2.3107 -4.3410 4.6769
Std. Deviation 11.59440 -.50026 1.89788 7.15281 14.55668
Valid N (listwise) N 24 0 0 24 24
Source: Research Data
Table 9 shows the calculated summary descriptive statistics for the percentage mean
monthly buy and hold abnormal returns (BHAR) for the Kenya Commercial Bank
limited during the 24 months window period after its share split tested for difference
from zero at 95% confidence level.
The summary shows that the mean BHAR for the company was -0.14 % with a
standard deviation of 11.594. It also shows that true mean BHAR at 5% significance
level is likely to be within the range – 4.34 % to 4.67 %. Since zero is within this
range we conclude that there was no difference between the returns of the event firm
and its benchmark firm.

54
Table 10: Kenya Power and Lighting Limited : Mean BHAR Descriptive
Statistics
Statistic
Bias Std. Error
95% Confidence Interval
Lower Upper
BHAR % N 24 0 0 24 24
Minimum -13.21
Maximum 11.31
Mean -2.1358 -.0789 1.4049 -4.9037 .5828
Std. Deviation 6.95238 -.17350 .78228 5.17744 8.23321
Valid N (listwise) N 24 0 0 24 24
Source: Research Data
Table 10 shows the calculated summary descriptive statistics for the percentage mean
monthly buy and hold abnormal returns (BHAR) for the Kenya Power and lighting
company limited during the 24 months window period after its share split tested for
difference from zero at 95% confidence level.
The summary shows that the mean BHAR for the company was -2.14 % with a
standard deviation of 6.95. It also shows that true mean BHAR at 5% significance
level is likely to be within the range – 4.90 % to 0.582 %. Since zero is within this
range we conclude that there was no difference between the returns of the event firm
and its benchmark firm.

55
Table 11: Sasini Tea and coffee limited: Mean BHAR Descriptive Statistics
Statistic
Bias Std. Error
95% Confidence Interval
Lower Upper
BHAR % N 24 0 0 24 24
Minimum -32.61
Maximum 16.68
Mean -4.9438 -.1166 2.7376 -10.6711 -.0198
Std. Deviation 13.88014 -.38324 1.67432 9.83705 16.51990
Valid N (listwise) N 24 0 0 24 24
Source: Research Data
Table 11 shows the calculated summary descriptive statistics for the percentage
mean monthly buy and hold abnormal returns (BHAR) for Sasini tea and coffee
limited during the 24 months window period after its share split tested for difference
from zero at 95% confidence level.
The summary shows that the mean BHAR for the company was -4.94 % with a
standard deviation of 13.88. It also shows that true mean BHAR at 5% significance
level is likely to be within the range –10.67 % to - 0.0198%. Since zero is outside this
range we conclude that there was a difference between the returns of the event firm
and its benchmark firm. The returns of the event firm were lower than those of the
benchmark firm.

56
4.2.3 The mean BHAR
Most of the firms achieved negative percentages mean BHAR over the window
period. Out of the eleven firms that were subjected to this study, nine firms
representing 82% achieved negative mean BHAR ranging from -4.94 % to -0.14 %.
Only Kenya Oil Company limited and CMC Holdings limited achieved positive mean
BHAR of 3.72 % and 1.89 % respectively as shown in the bar graph below.
Table 12: Bar graphs showing the percentage mean BHAR of the sampled
companies.
Resource: Research data
4.2.4 Hypothesis test
The mean monthly BHAR for each of the sampled firms was tested for difference
from zero at 5% significance level. This was done in order to determine whether the
mean buy and hold return achieved by the event firm was significantly different from
the returns achieved by the benchmark firm at 95% confidence level. The summary
findings are as given below.
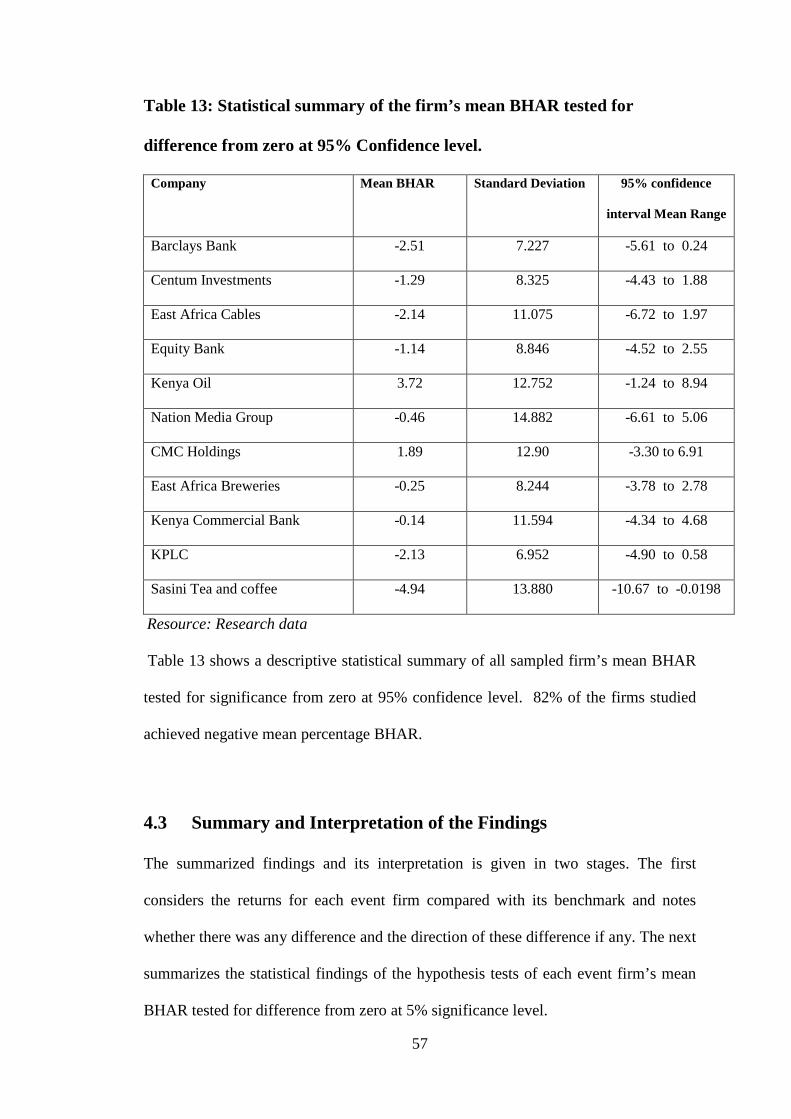
57
Table 13: Statistical summary of the firm’s mean BHAR tested for
difference from zero at 95% Confidence level.
Company Mean BHAR Standard Deviation 95% confidence
interval Mean Range
Barclays Bank -2.51 7.227 -5.61 to 0.24
Centum Investments -1.29 8.325 -4.43 to 1.88
East Africa Cables -2.14 11.075 -6.72 to 1.97
Equity Bank -1.14 8.846 -4.52 to 2.55
Kenya Oil 3.72 12.752 -1.24 to 8.94
Nation Media Group -0.46 14.882 -6.61 to 5.06
CMC Holdings 1.89 12.90 -3.30 to 6.91
East Africa Breweries -0.25 8.244 -3.78 to 2.78
Kenya Commercial Bank -0.14 11.594 -4.34 to 4.68
KPLC -2.13 6.952 -4.90 to 0.58
Sasini Tea and coffee -4.94 13.880 -10.67 to -0.0198
Resource: Research data
Table 13 shows a descriptive statistical summary of all sampled firm’s mean BHAR
tested for significance from zero at 95% confidence level. 82% of the firms studied
achieved negative mean percentage BHAR.
4.3 Summary and Interpretation of the Findings
The summarized findings and its interpretation is given in two stages. The first
considers the returns for each event firm compared with its benchmark and notes
whether there was any difference and the direction of these difference if any. The next
summarizes the statistical findings of the hypothesis tests of each event firm’s mean
BHAR tested for difference from zero at 5% significance level.

58
Generally the study found, that share splits elicit negative effect on firm returns. This
is because 9 out of 11 sample firms achieved buy and hold monthly returns that were
lower than their benchmark firms. Only two firms achieved returns that were higher
than their benchmark firms.
Sasini tea and coffee limited achieved the lowest return at -4.94% while Kenya
Commercial Bank Limited had -0.14%. CMC Holdings Limited achieved 1.89%
while Kenya Oil Limited achieved the highest return at 3.72%.
When tested for significance from zero at 95% confidence level, no significant
difference is observed. The study therefore concludes that share splits at the NSE
elicit negative long run effects on firm returns but these negative returns are not
insignificant. The study covered a period of two years.
The findings of this study are consistent with the findings of Rodney (2001) who
studied the long run performance of shares after split in the USA. He studied the long
run equity performance of 6000 firms following stock splits, during the period 1950 to
2000 and found robust abnormal returns in the first year followed by an insignificant
change in returns in subsequent years.
The findings however contrast with other past findings. Desai and Jain (1997) studied
a one to three year performance of 5596 stocks following stock splits during the
period 1976 to 1991 and found an abnormal return of 7.05 % during the first year and
11.87% in the subsequent years. Ikenberry et al (1996) studied the effects of share
splits on the long run stock returns for a sample of 1275 two for one stock splits and
59
found significant post split excess returns of 7.93% in the first year and 12.15% in the
first three years after the split.
Long run effects appear to contrast with short term effects of share splits. Studies on
short run effects have largely shown that share splits elicit a positive response in the
market. In the USA, Arbel and Swanson (1993) found that share splits elicit positive
responses from the market in the short run. In Germany, Wulff (1999) also found that
share splits elicited positive responses.
In Kenya, most of the studies undertaken on share splits have been on the short run
effects of share splits. Obunde (2011) studied the impact of stock splits on stock
performance of firms listed in the Nairobi stock Exchange with specific reference to
trading volumes and returns. He studied the performance of firms that had undertaken
a stock split in the period 2004 to 2011 and found that trading volumes tended to
increase with the announcement of the split. Nkonge (2010) studied effects of share
splits on stock returns for a window period of forty days and found abnormal returns
on the day of the split, two days before and two days after the split. Simbovo (2006)
studied the effects of stock splits and large stock dividend on liquidity at the NSE and
found that stock splits elicited a positive reaction on the firm’s liquidity.

60
CHAPTER FIVE
SUMMARY, CONCLUSIONS AND RECOMMENDATIONS
5.1 Summary
This study was to investigate the effects of share splits on long run stock returns for
companies listed at the NSE. The period of the study was twenty four months window
period after each of the sampled firms had undergone a share split. Eleven firms that
had undergone share splits from 2004 to 2010 were sampled for the study.
Each of the sampled firm’s monthly buy and hold returns was computed. The
monthly buy and hold returns of a company was determined by subtracting the
opening market price of a share of the company at the beginning of a month from the
closing price of that share at the end of the same month. The same procedure is
repeated for the benchmark firm that acts as the proxy for the market return. Fama and
French (1993) describes a benchmark firm as one that has not undergone a share split
and is within 70% to 130% of the market capitalization of the event firm, and also has
a book to market (BE/ME) equity ratio that is closest to the event firm.
To determine the relationship between the monthly returns of the event firm and the
returns of its benchmark firm, each of the event firm’s monthly buy and hold returns
were plotted on a graph against its benchmark firm for the entire window period of
twenty four months of the event firm’s share split.

61
The difference between the monthly buy and hold returns of the event firm and its
benchmark is the event firm’s buy and hold abnormal return (BHAR). The BHAR of
a company is therefore the return that an event firm would have earned if it had not
split its shares. The mean BHAR of the event firm is then computed as the arithmetic
mean of the monthly buy and hold abnormal returns of the event firm for twenty four
months.
The mean BHAR for each firm were then tested for difference from zero at 5%
significance level. This test was to determine if there was any significant difference
between the mean return achieved by the event firm and that achieved by its
benchmark firm. This was achieved through the calculation of the summary
descriptive statistics for each event firm’s BHAR at 95% confidence level.
Out of 11 firms that had been sampled for this study, 9 firms representing 82% of all
firms achieved mean negative percentage BHAR ranging from –4.94 % to – 0.14 %.
Only two companies achieved a positive mean BHAR of 3.72 % and 1.89 %
respectively. These mean BHAR for each of the sampled firms was tested for
significance at 5% and found to be insignificant.
5.2 Conclusions
This study found that share splits at the NSE elicit insignificant negative returns
among firms within the first two years. Generalized, this study supports the
hypothesis that firms listed at the NSE would not be expected to increase their long
run returns as a result of splitting their shares within the first two years.
62
The findings support earlier findings by Rodney (2001) who studied the long run
equity performance of firms listed at the NYSE and found a long run insignificant
change in returns among firms in the USA. But the findings are inconsistent with
other findings. Ikenberry et al (1996) studied the effects of share splits on long run
stock returns for a sample of 1275 firms and found excess returns of 7.93% in the first
and 12.15% in the subsequent three years. Jain (1997) found positive return after a
holding period of one year followed by a higher return after three years. McNichols
and Dravid (1990) studied monthly price reaction to share splits and found 20.2%
abnormal returns.
The findings also differ substantially from most studies on short term effects of share
splits on returns. Arbel and Swanson (1993) studied the effects of share splits on the
market and found that they reacted positively to splits share splits. Wu and Chang
(1997) found excess returns in the short run. Nkonge (2010) studied the effects of
share splits on returns and found excess returns.
5.3 Recommendations to policy and practice.
Share splits have been adopted as a common corporate event among firms. It is
especially implemented by firms as a means of reducing the share prices to a more
affordable level (Shourun et al, 2006). The signaling theory explains that share splits
signal expected good future performance of the company (Brennan and Copeland,
1988). The expected signal would be interpreted to mean higher returns to the
investor. According to the findings of this study, this may not necessarily be the case.
Investors therefore need to subject the firm to further analysis in order to determine
whether there are likely to be other benefits accruing from stock splits other than

63
expected higher returns as the expectations of higher returns have not been proved by
this study.
To the Government, share splits lead to increased trading activity among investors
(Aduda and Chemarum, 2010). This increase in the trading ratio is a sign of the
robustness of the economy. As a result, more international investors are likely to be
attracted to the bourse with its attendant positive effects on the economy. Increased
foreign investment results in more direct inflow of foreign currency especially hard
currency in the economy. The Government therefore should encourage share splits
among firms for this reason.
5.4 Limitations of the study
This study was faced with certain limitations. The identification of a suitable
benchmark firm upon which the returns of the event firm could be compared was a
challenge. This is because the adopted criteria of size and BE/ME ratio was
insufficient. Some firms had no suitable benchmarks according to this criterion. East
African breweries was paired with a firm whose market size was 54.16% of its capital
because it was the next largest in terms of market capitalization. None of the firms
listed at the NSE achieved the recommended threshold of 70% of the EABL’s capital.
The returns that were considered in this study were those generated through capital
gains. Returns earned through dividends and other incomes to shareholders were not
considered. As is the practice, different companies have adopted different dividend
policies and this may affect the actual returns earned from a firm. The inclusion of
these types of incomes as returns may yield different results.

64
Due to the great disparity in sizes of firms’ listed at the NSE; the choice of the
benchmark did not take into consideration the industry in which the benchmark of an
event firm was selected. As noted earlier, benchmark firms which are in the same
industry as an event firm would make a better match for more reliable results. Firms
were however selected on account of size and BE/ME ratio only.
5.5 Suggestions for further studies
This study covered a period of two years which may not be lengthy enough to draw
conclusive evidence on long term effects of shares splits on returns. A longer period
covering at least five years would be preferred. This is because the market may take a
longer time to adjust to corporate events.
A study on the longer term effects of the dividend policy of firms following a stock
split may also be relevant. This is because it may partly explain why firms that split
their shares experience higher trading activities among investors. The trading activity
ratio has been shown to increase after share splits. Due to the increase in the number
of shares outstanding after a share split, firms may be compelled to change their
dividend policies as a consequence of a change in one of the important variables that
are considered in its formulation.

65
REFERENCES
Aduda,J., & Chemarum, S. (2010). Market reaction to stock splits. African Journal of
Business and management, 165-184.
Al-Qenae, R., Li, C., & Bob, W. (2002). The Information Content of
Earnings on Stock Prices: The Kuwait Stock Exchange. Multinational Finance
Journal.
Andrew, W. (2005). Reconciling efficient markets with behavioral finance: The
Adaptive market hypothesis. Journal of Investment Consulting, Forthcoming.
Angel, J., Brooks, R., & Mathew, P. (1997). When-Issued Shares, Small Traders and
the Variance of Returns around Stock Splits, Georgetown University Working
Paper.
Angel, J., Raymond B., & Prem, M. (2004). When issued shares, Small trades and the
variance of Returns around stock splits. Journal of Financial Research.
Arbel, A. & Swanson, G. (1993). The role of information in stock split
announcement effects. Quaterly Journal of Business and Economics, 32(2),
14-25.
Arnold, T. & Lipson, M. (1997). Tick Size and limit order execution: An
Examination of Stock Splits. Working Paper, University of Georgia.

66
Baker, H. & Gallagher, P. (1980). Management’s view of stock splits. Financial
Management, 9, 73-77
Baker, H., & Powell, G. (1993). Further Evidence on managerial motives for stock
splits Quarterly Journal of business and Economics, 32 (3).
Baker, H. & Powell, G. (1993). Further Evidence on Managerial Motives for Stock
Splits. Quarterly Journal of Business and Economics, 20-31
Bechmann, K. & Raaballe, J. (2004). The Differences between Stock Splits and
Stock Dividends: Evidence from Denmark. Working Paper Copenhagen
Business School
Black, F. (1986). Noise. Journal of Finance, 529-543
Brennan, M. & Copeland, T. (1988). Stock splits, stock prices, and transaction costs.
Journal of Financial Economics, 22, 83-101
Brown, S. & Warner, J. (1980). Measuring Security Price Performance. Journal of
Financial Economic, 8, 205-258
Chakraborty, M. (2012). The Equity Market Around the Ex-split Date: Evidence from
India. Vikalpa, 37 (1) , 57-68.

67
Conroy, R., & Harris, R. (1999). Stock splits and information: The role of share price,
Financial management, 28, 28-40
Conroy, R. Harris, R. & Benet, B. (1990). The effect of stock splits on bid-ask
spreads. Journal of Financial Economics, 45, 1285-1295.
Copeland, T. (1979). Liquidity changes following stock splits. Journal of Finance,
34, 115-141.
Debabrata, D. & Pradip, B. (2012). Better portfolio Diversification – A neglected
aspect of stock splits: Findings from Indian Stock Market. Working Paper
Series.
Dennis, P. & Stickland, D. (2002). The effect of stock splits on liquidity and Excess
returns . Journal of Financial Research.
Dennis, P. & Strickland, D. (2003). The Effect of Stock Splits on Liquidity and
Excess Returns: Evidence from Shareholder Ownership Composition. Journal
of Financial Research, 26 (3), 355-370.
Desai, H., & Jain, J. (1997). Long-run Common Stock Returns Following Stock Splits
and Reverse Splits. Journal of Business, 409-433
Dhar, S & Chhaochharia, S. (2008). Market reactions around stock splits and bonus
issues. Some Indian Evidence. Working paper series

68
Dolley, J. (1933). Characteristics and Procedure of Common Stock Split –ups.
Harvard Business review, 11, 316-326.
Easley, D., O’Hara, M., & Saar, G. (2001). How stock splits affect trading: A
microstructure Approach. Journal of Financial and Quantitative Analysis, 36,
25-51.
Donald, R. & Pamela S. (2006). Business Research methods, (9th Ed.), New York
City: McGraw-Hill/Irwin.
Fama, E., Fisher, L., Jensen, M., & Roll, R. (1969). The Adjustments of Stock Prices
to New Information. International Economic Review, 10.
Fama, E. (1970). Efficient capital markets. A review of theory and Empirical work.
Journal of Finance
Fama E. & French R. (1993). Common risk factors in the returns on stocks and bonds.
Journal of Financial Economics 33, 3-56
Fernando, C., Krishnamurthy, S., & Spindt, P. (1999). Offer Price and IPO
Performance: An Empirical Assessment. Tulane University Working Paper.
Gerwin A. (2003). Technical Analysis in financial markets. working papers series.

69
Grinblatt, M., Masulis, R., & Titman, S. (1984). The Valuation Effects of Stock
Splits and Stock Dividends. Journal of Financial Economics, 13 (4), 461-490.
Grossman, S. & Stiglitz, J. (1980). On the impossibility of informationally efficient
markets. American Economic Review.
Gupta, A., & Gupta, O. (2007). Market Reaction to Stock Market Splits: Evidence
from India. The Icfai Journal of Applied Finance, 13(1), 5-22
Gupta, C., & Kumar, R. (2007). A Re- Examination of factors affecting returns in the
Indian stock Market. Journal of Emerging Market Finance, Forthcoming.
Ikenberry, D., Rankine, G., & Stice, L. (1996). What do Stock Splits really signal?
Journal of Financial and Quantitative Analysis, 31, 357-375
Kombo, D. & Tromp, D. (2006). Proposal and thesis writing: An Introduction (2nd
Ed.). Nairobi: Pauline’s publications Africa.
Koski, J. (1998). Measurement Effects and the Variance of Returns after Stock Splits
and Stock Dividends. The Review of Financial Studies, 11, 143-162.
Kothari S. & Warner B. (2007). Econometrics of event studies. Hand book of
corporate Finance:Amsterdam: Elsevier/North Holland

70
Lakonishok, J., & Lev, B. (1987). Stock Splits and Stock dividends: Why, Who and
When. The Journal of Finance, 42, 913-932.
Lamoureux, C., & Poon, P. (1987). The Market Reaction to Stock Splits. Journal of
Finance, 1347-1370.
Lihua, J. (2002). Why firms consolidate their stock. Working Paper Series.
Lintner , J. (1956). Distribution of incomes of corporations among Dividends,
Retained earnings And Taxes. American Economic Review.
Lyroud, K., Dasilas, A., & Varnas, A. (2006). The valuation effects of stock splits in
NASDAQ. Management Finance, 32(5), 401-414.
Maloney, M., & Mulherin, J. (1992). The Effects of Splitting on the Ex: A
Microstructure Reconciliation. Financial Management, 44-59.
Masse, I., Hanrahan J., & Kushner, J. (1997). The Effect of Canadian Stock Splits,
Stock Dividends, and Reverse Splits on the Value of the Firm. Quarterly
Journal of Business & Economics, 36(4), 51-62.
McNichols, M., & Dravid, A. (1990). Stock Dividends, Stock Splits, and Signaling.
Journal of Finance, 45, 857-879.

71
Mehra, R. (2002). The Equity Premium: Why Is It A Puzzle? Financial Analysts
Journal.
Michaelson, J. (1961). The determinants of Dividend policies: A theoretical and
empirical Study. An unpublished doctoral dissertation, University of Chicago.
Miller, H., & Modigliani, F. (1961). Dividend policy, Growth and the valuation of
shares. Journal of Business.
Muscarella, C., & Vetsuypens, M. (1996). Stock splits: Signaling or Liquidity? The
case of ADR Solo-Splits. Journal of Financial Economics, 42, 3-26.
Nkonge, T. (2010). The effect of stock splits on securities returns at the NSE. An
unpublished MBA Research project, University of Nairobi.
Obunde, W. (2011). An empirical Examination of the relationship between stock
splits and stock performance of firms listed on the NSE. An unpublished
MBA project, University of Nairobi.
Ongere, J. ( 2011). The effects of stock splits on the ownership structure of firms.
Evidence from NSE. An unpublished MBA project, University of Nairobi.
Radcliffe, R. & Gillespie, W. (1979). The Price Impact of Reverse Splits. Financial
Analysts Journal.

72
Reilly, F., & Brown, K. (1997). Investment analysis and portfolio management.
Philadelphia: San Diego Dryden press.
Roger, M., & Sandro, R. (2007): Stock splits in Switzerland: To signal or not to
signal? Working Paper Series.
Ross, S. A. (1977). The Determination of Financial Structure: The Incentive Signaling
approach. Bell Journal of Economics, 8, 23-40.
Schultz, P. (1999). Why Do Stocks Split? The Optimal Tick Size and Preferred Price
Range Hypotheses. Journal of Finance.
Serra, A. (2002), Event Study Tests: A brief survey. Accepted Paper Series.
Shiller, R. (1981). Do stock prices move too much to be justified by subsequent
changes in Dividend? Working Paper Series.
Shourun, G., Mark, H. & Weihong, S. (2006). Why do firms split their stocks before
acquisition? American Economic Review, 71, 421-436.
Simbovo, H. (2006). The effects of stock splits and large stock dividends on liquidity:
Evidence from the Nairobi stock exchange. An unpublished MBA Research
project, University of Nairobi.
Thomas, K. (2002). Estimating Expected returns. Journal of Investing.

73
Udegbunam, R. & Eriki, P. (2001). Inflation and Stock Price Behavior:
Evidence from Nigerian Stock Market. Journal of Financial Management &
Analysis, 20(14).
Vijay, J., & Pencheng, Z. (2004). Thirty years of stock splits, reverse stock splits and
stock Dividends in Canada. Working Paper Series.
Woodridge, J., & Chambers, D. (1983). Reverse split and shareholder wealth.
Financial management.
Wu, L., & Chan, B. (1997). On Existence of an Optimal Stock Price: Evidence from
Stock Splits and Reverse Stock Splits in Hong Kong. International Journal of
Business,2(1), 45-67.
Wulff, C. (1999). Market reaction to stock splits: Evidence from Germany.
Schmalenbach Business Review.
Zhiwu, C. & Ming, D. (2001). Stock valuation and investment strategies. Working
paper series

74
APPENDICES
Appendix 1:
Companies Listed at the NSE that have undergone Share Splits
Company Split Ratio Split Date
KenolKobil Ltd 5:1 5 July 2004
East Africa Breweries Ltd 10:1 29 Nov. 2004
East Africa Cables 10:1 5 Sept. 2006
Barclays Bank of Kenya Ltd 5:1 30 Nov.2006
Centum Investment 10: 1 5 Jan. 2007
Sasini Tea and coffee Ltd 5:1 15 Feb. 2007
CMC Holdings 10:1 26 Feb. 2007
Kenya Commercial Bank Ltd 10: 1 3 April 2007
Nation Media Group Ltd 2:1 4 Aug. 2008
Equity bank Ltd 10:1 25 March 2009
Kenya power & Lighting Co. 8:1 19 Nov. 2010
Athi River Mining Co. Ltd 5: 1 21 Dec. 2012
Appendix 2:
Companies Listed at the NSE that Split their shares between 2004 and 2010
Company Split Ratio Split Date
KenolKobil Ltd 5:1 5 July 2004
East Africa Breweries Ltd 10:1 29 Nov. 2004
East Africa Cables 10:1 5 Sept. 2006
Barclays Bank of Kenya Ltd 5:1 30 Nov.2006
Centum Investment 10: 1 5 Jan. 2007
Sasini Tea and coffee Ltd 5:1 15 Feb. 2007
CMC Holdings 10:1 26 Feb. 2007
Kenya Commercial Bank Ltd 10: 1 3 April 2007
Nation Media Group Ltd 2:1 4 Aug. 2008
Equity bank Ltd 10:1 25 March 2009
Kenya power & Lighting Co. 8:1 19 Nov. 2010

75
Appendix 3 (a)
ANALYSIS OF NSE FIRMS DATA FOR THE IDENTIFICATION
OF BARCLAYS BANK CONTROL FIRM Data for 30/1 1/2006
Shares
outstanding AGRICULTURAL Par value
Market
value BE/ME Ratio
Market
capitalisation
%age of
BBK Capital
48,875,000 Unilever Tea Ord 10.00 10.00 85.00 0.12 4,154,375,000.00 3.33
19,599,999 Kakuzi Ord.5.00 5.00 40.00 0.13 783,999,960.00 0.63
60,000,000 Rea Vipingo Ord 5.00 5.00 25.75 0.19 1,545,000,000.00 1.24
38,009,250
Sasini Tea & Coffee LtdOrd
5.00 5.00 125.00 0.04 4,751,156,250.00 3.80
COMMERCIAL AND
SERVICES - -
22,279,616 Car & General (K) Ltd Ord 5.00 5.00 54.50 0.09 1,214,239,072.00 0.97
48,559,120 CMC Holdings Ltd Ord 5.00 5.00 162.00 0.03 7,866,577,440.00 6.30
360,000 Hutchings Biemer Ltd Ord 5.00 5.00 20.25 0.25 7,290,000.00 0.01
461,615,484 Kenya Airways Ltd Ord 5.00 5.00 118.00 0.04 54,470,627,112.00 43.60
14,393,106 Marshalls (E.A.) Ltd Ord 5.00 5.00 40.00 0.13 575,724,240.00 0.46
71,305,260 Nation Media Group Ord. 5.00 5.00 334.00 0.01 23,815,956,840.00 19.06
159,000,000 Scangroup Ltd Ord 1.00 1.00 21.00 0.05 3,339,000,000.00 2.67
89,865,588 TPS Eastern Africa Ord 1.00 1.00 84.50 0.01 7,593,642,186.00 6.08
180,000,000
Uchumi Supermarket Ltd Ord
5.00 5.00 14.50 0.34 2,610,000,000.00 2.09
FINANCE AND
INVESTMENT - -
1,357,884,000 Barclays Bank Ltd Ord 2.00 2.00 92.00 0.02 124,925,328,000.00 100.00
156,000,000 C.F.C Bank Ltd ord.5.00 5.00 84.50 0.06 13,182,000,000.00 10.55
124,218,750 Diamond Trust Bank Ord 4.00 4.00 72.00 0.06 8,943,750,000.00 7.16
90,564,550 Equity Bank Ltd Ord 5.00 5.00 135.00 0.04 12,226,214,250.00 9.79
115,000,000
Housing Finance Co Ltd Ord
5.00 5.00 40.50 0.12 4,657,500,000.00 3.73
54,995,188 I.C.D.C Investments Ord 5.00 5.00 360.00 0.01 19,798,267,680.00 15.85
36,000,000 Jubilee Holdings Ltd Ord 5.00 5.00 355.00 0.01 12,780,000,000.00 10.23
199,600,000
Kenya Commercial Bank Ord
10.00 10.00 215.00 0.05 42,914,000,000.00 34.35
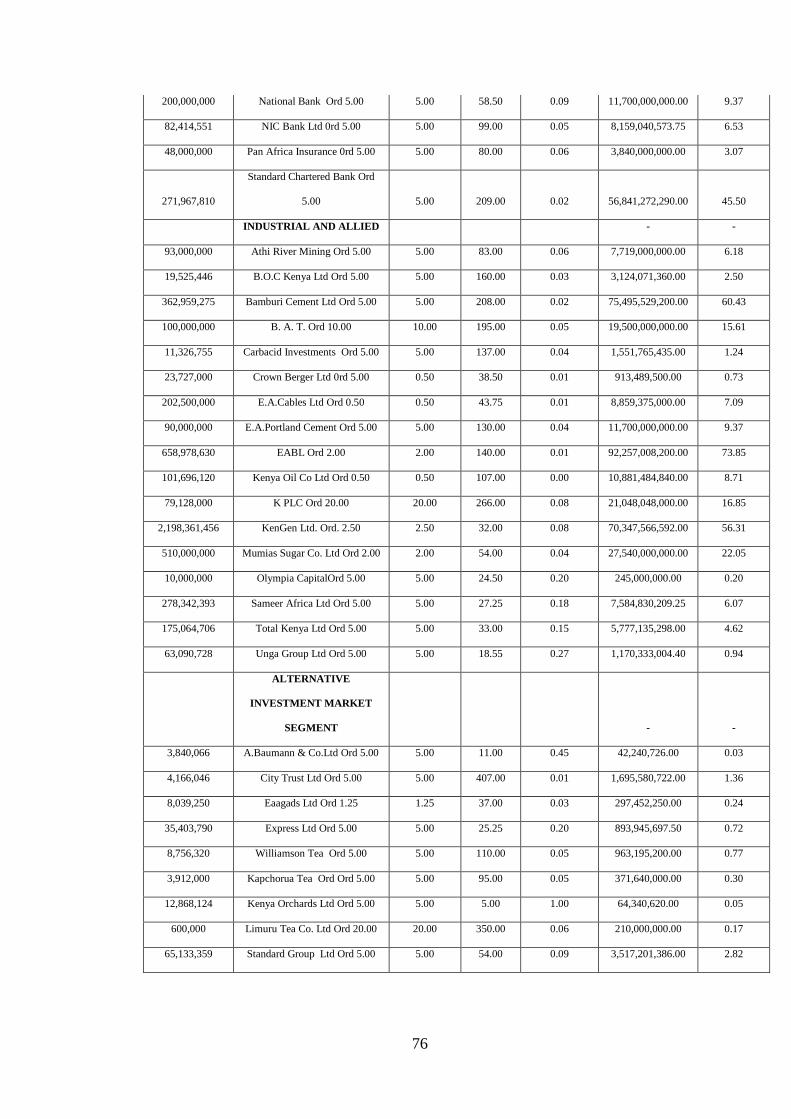
76
200,000,000 National Bank Ord 5.00 5.00 58.50 0.09 11,700,000,000.00 9.37
82,414,551 NIC Bank Ltd 0rd 5.00 5.00 99.00 0.05 8,159,040,573.75 6.53
48,000,000 Pan Africa Insurance 0rd 5.00 5.00 80.00 0.06 3,840,000,000.00 3.07
271,967,810
Standard Chartered Bank Ord
5.00 5.00 209.00 0.02 56,841,272,290.00 45.50
INDUSTRIAL AND ALLIED - -
93,000,000 Athi River Mining Ord 5.00 5.00 83.00 0.06 7,719,000,000.00 6.18
19,525,446 B.O.C Kenya Ltd Ord 5.00 5.00 160.00 0.03 3,124,071,360.00 2.50
362,959,275 Bamburi Cement Ltd Ord 5.00 5.00 208.00 0.02 75,495,529,200.00 60.43
100,000,000 B. A. T. Ord 10.00 10.00 195.00 0.05 19,500,000,000.00 15.61
11,326,755 Carbacid Investments Ord 5.00 5.00 137.00 0.04 1,551,765,435.00 1.24
23,727,000 Crown Berger Ltd 0rd 5.00 0.50 38.50 0.01 913,489,500.00 0.73
202,500,000 E.A.Cables Ltd Ord 0.50 0.50 43.75 0.01 8,859,375,000.00 7.09
90,000,000 E.A.Portland Cement Ord 5.00 5.00 130.00 0.04 11,700,000,000.00 9.37
658,978,630 EABL Ord 2.00 2.00 140.00 0.01 92,257,008,200.00 73.85
101,696,120 Kenya Oil Co Ltd Ord 0.50 0.50 107.00 0.00 10,881,484,840.00 8.71
79,128,000 K PLC Ord 20.00 20.00 266.00 0.08 21,048,048,000.00 16.85
2,198,361,456 KenGen Ltd. Ord. 2.50 2.50 32.00 0.08 70,347,566,592.00 56.31
510,000,000 Mumias Sugar Co. Ltd Ord 2.00 2.00 54.00 0.04 27,540,000,000.00 22.05
10,000,000 Olympia CapitalOrd 5.00 5.00 24.50 0.20 245,000,000.00 0.20
278,342,393 Sameer Africa Ltd Ord 5.00 5.00 27.25 0.18 7,584,830,209.25 6.07
175,064,706 Total Kenya Ltd Ord 5.00 5.00 33.00 0.15 5,777,135,298.00 4.62
63,090,728 Unga Group Ltd Ord 5.00 5.00 18.55 0.27 1,170,333,004.40 0.94
ALTERNATIVE
INVESTMENT MARKET
SEGMENT - -
3,840,066 A.Baumann & Co.Ltd Ord 5.00 5.00 11.00 0.45 42,240,726.00 0.03
4,166,046 City Trust Ltd Ord 5.00 5.00 407.00 0.01 1,695,580,722.00 1.36
8,039,250 Eaagads Ltd Ord 1.25 1.25 37.00 0.03 297,452,250.00 0.24
35,403,790 Express Ltd Ord 5.00 5.00 25.25 0.20 893,945,697.50 0.72
8,756,320 Williamson Tea Ord 5.00 5.00 110.00 0.05 963,195,200.00 0.77
3,912,000 Kapchorua Tea Ord Ord 5.00 5.00 95.00 0.05 371,640,000.00 0.30
12,868,124 Kenya Orchards Ltd Ord 5.00 5.00 5.00 1.00 64,340,620.00 0.05
600,000 Limuru Tea Co. Ltd Ord 20.00 20.00 350.00 0.06 210,000,000.00 0.17
65,133,359 Standard Group Ltd Ord 5.00 5.00 54.00 0.09 3,517,201,386.00 2.82
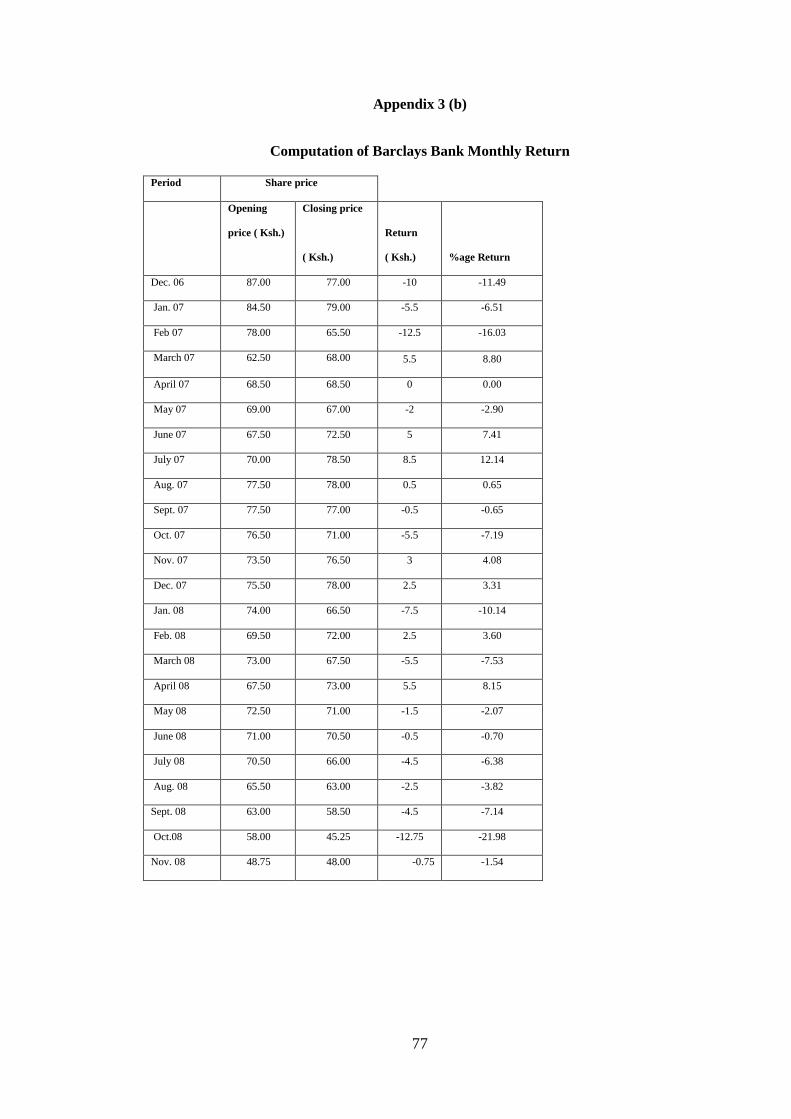
77
Appendix 3 (b)
Computation of Barclays Bank Monthly Return
Period Share price
Opening
price ( Ksh.)
Closing price
( Ksh.)
Return
( Ksh.) %age Return
Dec. 06 87.00 77.00 -10 -11.49
Jan. 07 84.50 79.00 -5.5 -6.51
Feb 07 78.00 65.50 -12.5 -16.03
March 07 62.50 68.00 5.5 8.80
April 07 68.50 68.50 0 0.00
May 07 69.00 67.00 -2 -2.90
June 07 67.50 72.50 5 7.41
July 07 70.00 78.50 8.5 12.14
Aug. 07 77.50 78.00 0.5 0.65
Sept. 07 77.50 77.00 -0.5 -0.65
Oct. 07 76.50 71.00 -5.5 -7.19
Nov. 07 73.50 76.50 3 4.08
Dec. 07 75.50 78.00 2.5 3.31
Jan. 08 74.00 66.50 -7.5 -10.14
Feb. 08 69.50 72.00 2.5 3.60
March 08 73.00 67.50 -5.5 -7.53
April 08 67.50 73.00 5.5 8.15
May 08 72.50 71.00 -1.5 -2.07
June 08 71.00 70.50 -0.5 -0.70
July 08 70.50 66.00 -4.5 -6.38
Aug. 08 65.50 63.00 -2.5 -3.82
Sept. 08 63.00 58.50 -4.5 -7.14
Oct.08 58.00 45.25 -12.75 -21.98
Nov. 08 48.75 48.00 -0.75 -1.54
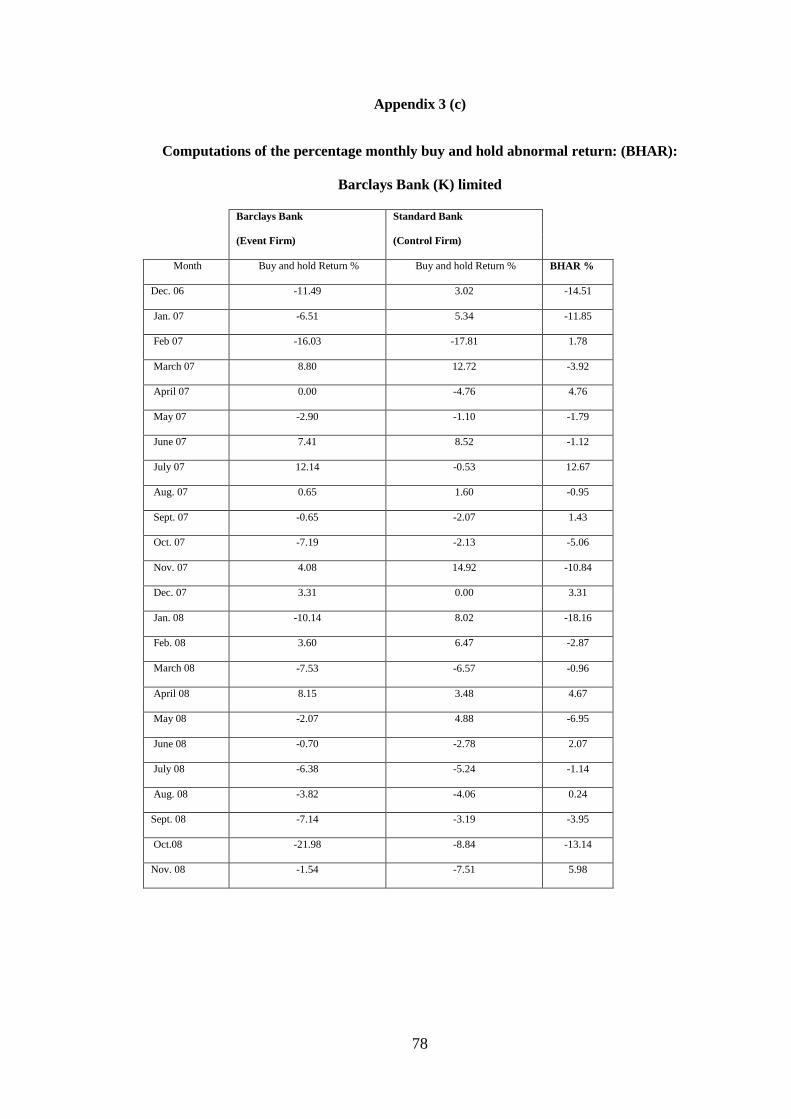
78
Appendix 3 (c)
Computations of the percentage monthly buy and hold abnormal return: (BHAR):
Barclays Bank (K) limited
Barclays Bank Standard Bank
(Event Firm) (Control Firm)
Month Buy and hold Return % Buy and hold Return % BHAR %
Dec. 06 -11.49 3.02 -14.51
Jan. 07 -6.51 5.34 -11.85
Feb 07 -16.03 -17.81 1.78
March 07 8.80 12.72 -3.92
April 07 0.00 -4.76 4.76
May 07 -2.90 -1.10 -1.79
June 07 7.41 8.52 -1.12
July 07 12.14 -0.53 12.67
Aug. 07 0.65 1.60 -0.95
Sept. 07 -0.65 -2.07 1.43
Oct. 07 -7.19 -2.13 -5.06
Nov. 07 4.08 14.92 -10.84
Dec. 07 3.31 0.00 3.31
Jan. 08 -10.14 8.02 -18.16
Feb. 08 3.60 6.47 -2.87
March 08 -7.53 -6.57 -0.96
April 08 8.15 3.48 4.67
May 08 -2.07 4.88 -6.95
June 08 -0.70 -2.78 2.07
July 08 -6.38 -5.24 -1.14
Aug. 08 -3.82 -4.06 0.24
Sept. 08 -7.14 -3.19 -3.95
Oct.08 -21.98 -8.84 -13.14
Nov. 08 -1.54 -7.51 5.98

79
Appendix 4 (a)
ANALYSIS OF NSE FIRMS DATA FOR THE IDENTIFICATION
OF CENTUM INVESTMENTS CONTROL FIRM Data for
5/1/2007
Shares
outstanding AGRICULTURAL Par Value
Market
price
Market
capitalisation
BE/ME
Ratio
%age of
Centum
capital
48,875,000
Unilever Tea Kenya Ltd Ord
10.00 10.00 80.00
3,910,000,000.00 0.13 197.49
19,599,999 Kakuzi Ord.5.00 5.00 41.50
813,399,958.50 0.12 41.08
60,000,000
Rea Vipingo Plantations Ltd
Ord 5.00 5.00 28.25
1,695,000,000.00 0.18 85.61
38,009,250
Sasini Tea & Coffee Ltd Ord
5.00 5.00 139.00
5,283,285,750.00 0.04 266.86
COMMERCIAL AND
SERVICES
22,279,616
Car & General (K) Ltd Ord
5.00 5.00 59.50
1,325,637,152.00 0.08 66.96
48,559,120 CMC Holdings Ltd Ord 5.00 5.00 226.00
10,974,361,120.00 0.02 554.31
360,000
Hutchings Biemer Ltd Ord
5.00 5.00 20.25
7,290,000.00 0.25 0.37
461,615,484 Kenya Airways Ltd Ord 5.00 5.00 119.00
54,932,242,596.00 0.04 2774.60
14,393,106
Marshalls (E.A.) Ltd Ord
5.00 5.00 37.75
543,339,751.50 0.13 27.44
71,305,260
Nation Media Group Ord.
5.00 5.00 338.00
24,101,177,880.00 0.01 1217.34
159,000,000 Scangroup Ltd Ord 1.00 1.00 25.75
4,094,250,000.00 0.04 206.80
89,865,588 TPS Eastern Africa (Serena) 1.00 86.00 0.01 390.36

80
Ltd Ord 1.00 7,728,440,568.00
180,000,000
Uchumi Supermarket Ltd
Ord 5.00 5.00
FINANCE AND
INVESTMENT
1,357,884,000 Barclays Bank Ltd Ord 2.00 2.00 93.00
126,283,212,000.00 0.02 6378.50
156,000,000 C.F.C Bank Ltd ord.5.00 5.00 92.00
14,352,000,000.00 0.05 724.91
139,746,093
Diamond Trust Bank Kenya
Ltd Ord 4.00 4.00 85.00
11,878,417,905.00 0.05 599.97
90,564,550 Equity Bank Ltd Ord 5.00 5.00 169.00
15,305,408,950.00 0.03 773.07
115,000,000
Housing Finance Co Ltd Ord
5.00 5.00 43.75
5,031,250,000.00 0.11 254.13
54,995,188
I.C.D.C Investments Co Ltd
Ord 5.00 5.00 36.00
1,979,826,768.00 0.14 100.00
36,000,000
Jubilee Holdings Ltd Ord
5.00 5.00 333.00
11,988,000,000.00 0.02 605.51
199,600,000
Kenya Commercial Bank
Ltd Ord 10.00 10.00 270.00
53,892,000,000.00 0.04 2722.06
200,000,000
National Bank of Kenya Ltd
Ord 5.00 5.00 64.50
12,900,000,000.00 0.08 651.57
82,414,551 NIC Bank Ltd 0rd 5.00 5.00 110.00
9,065,600,637.50 0.05 457.90
48,000,000
Pan Africa Insurance
Holdings Ltd 5.00 95.00
4,560,000,000.00 0.05 230.32
271,967,810
Standard Chartered Bank
Ltd Ord 5.00 5.00 217.00
59,017,014,770.00 0.02 2980.92
INDUSTRIAL AND
ALLIED
93,000,000
Athi River Mining Ord 5.00
5.00
84.50
7,858,500,000.00
0.06
396.93
19,525,446 B.O.C Kenya Ltd Ord 5.00 5.00 160.00
3,124,071,360.00 0.03 157.80
362,959,275
Bamburi Cement Ltd Ord
5.00 5.00 211.00
76,584,407,025.00 0.02 3868.24
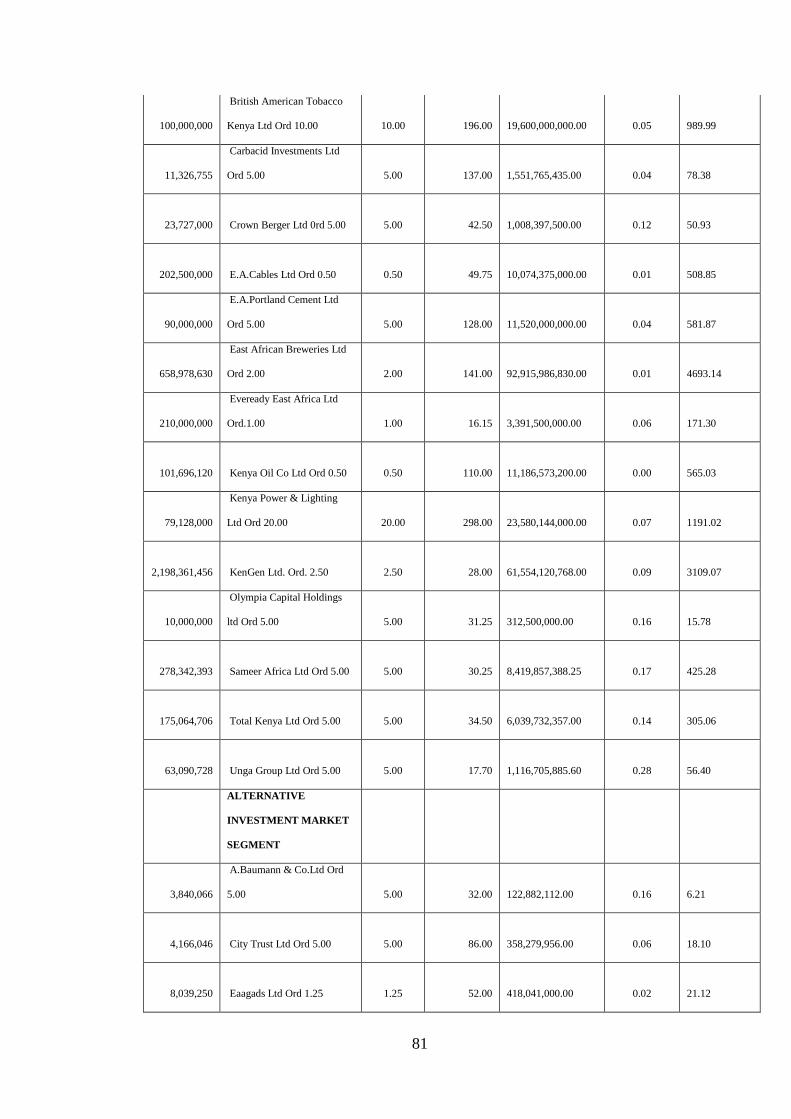
81
100,000,000
British American Tobacco
Kenya Ltd Ord 10.00 10.00 196.00
19,600,000,000.00 0.05 989.99
11,326,755
Carbacid Investments Ltd
Ord 5.00 5.00 137.00
1,551,765,435.00 0.04 78.38
23,727,000 Crown Berger Ltd 0rd 5.00 5.00 42.50
1,008,397,500.00 0.12 50.93
202,500,000 E.A.Cables Ltd Ord 0.50 0.50 49.75
10,074,375,000.00 0.01 508.85
90,000,000
E.A.Portland Cement Ltd
Ord 5.00 5.00 128.00
11,520,000,000.00 0.04 581.87
658,978,630
East African Breweries Ltd
Ord 2.00 2.00 141.00
92,915,986,830.00 0.01 4693.14
210,000,000
Eveready East Africa Ltd
Ord.1.00 1.00 16.15
3,391,500,000.00 0.06 171.30
101,696,120 Kenya Oil Co Ltd Ord 0.50 0.50 110.00
11,186,573,200.00 0.00 565.03
79,128,000
Kenya Power & Lighting
Ltd Ord 20.00 20.00 298.00
23,580,144,000.00 0.07 1191.02
2,198,361,456 KenGen Ltd. Ord. 2.50 2.50 28.00
61,554,120,768.00 0.09 3109.07
10,000,000
Olympia Capital Holdings
ltd Ord 5.00 5.00 31.25
312,500,000.00 0.16 15.78
278,342,393 Sameer Africa Ltd Ord 5.00 5.00 30.25
8,419,857,388.25 0.17 425.28
175,064,706 Total Kenya Ltd Ord 5.00 5.00 34.50
6,039,732,357.00 0.14 305.06
63,090,728 Unga Group Ltd Ord 5.00 5.00 17.70
1,116,705,885.60 0.28 56.40
ALTERNATIVE
INVESTMENT MARKET
SEGMENT
3,840,066
A.Baumann & Co.Ltd Ord
5.00 5.00 32.00
122,882,112.00 0.16 6.21
4,166,046 City Trust Ltd Ord 5.00 5.00 86.00
358,279,956.00 0.06 18.10
8,039,250 Eaagads Ltd Ord 1.25 1.25 52.00
418,041,000.00 0.02 21.12

82
35,403,790 Express Ltd Ord 5.00 5.00 28.75
1,017,858,962.50 0.17 51.41
8,756,320
Williamson Tea Kenya Ltd
Ord 5.00 5.00 112.00
980,707,840.00 0.04 49.54
3,912,000
Kapchorua Tea Co. Ltd Ord
Ord 5.00 5.00 100.00
391,200,000.00 0.05 19.76
12,868,124
Kenya Orchards Ltd Ord
5.00 5.00 5.00
64,340,620.00 1.00 3.25
600,000
Limuru Tea Co. Ltd Ord
20.00 20.00 350.00
210,000,000.00 0.06 10.61
65,133,359
Standard Group Ltd Ord
5.00 5.00 65.50
4,266,235,014.50 0.08 215.49
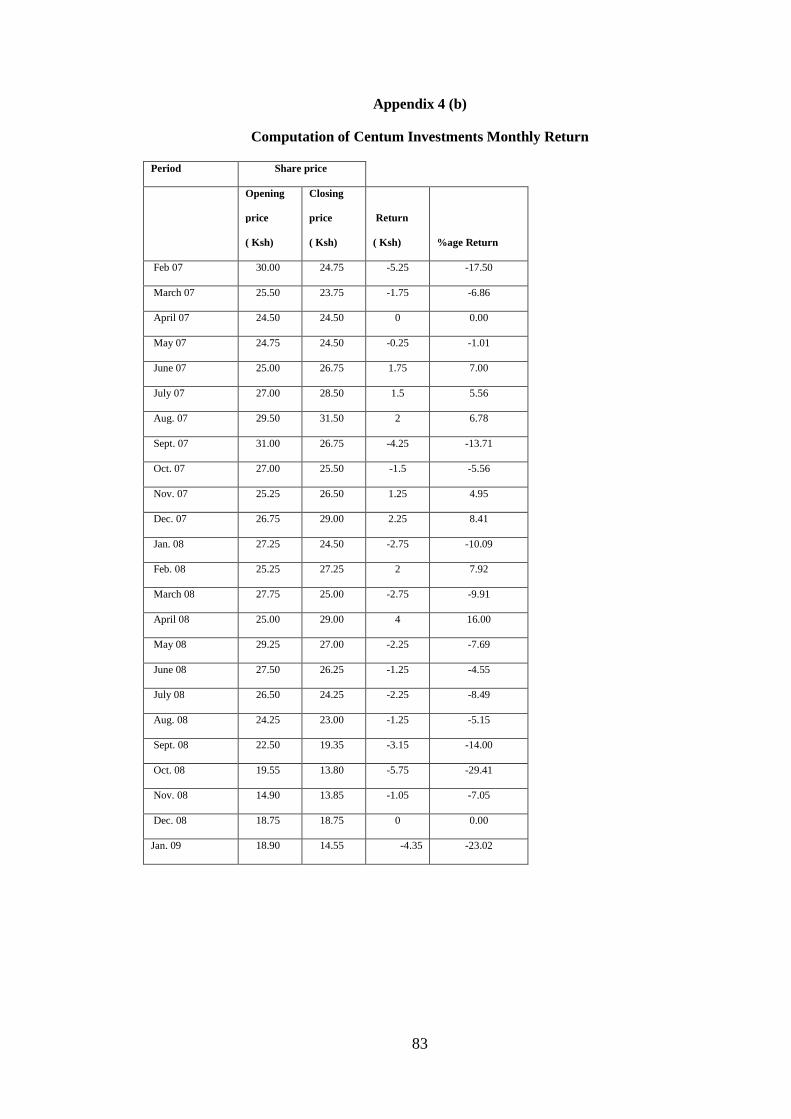
83
Appendix 4 (b)
Computation of Centum Investments Monthly Return
Period Share price
Opening
price
( Ksh)
Closing
price
( Ksh)
Return
( Ksh) %age Return
Feb 07 30.00 24.75 -5.25 -17.50
March 07 25.50 23.75 -1.75 -6.86
April 07 24.50 24.50 0 0.00
May 07 24.75 24.50 -0.25 -1.01
June 07 25.00 26.75 1.75 7.00
July 07 27.00 28.50 1.5 5.56
Aug. 07 29.50 31.50 2 6.78
Sept. 07 31.00 26.75 -4.25 -13.71
Oct. 07 27.00 25.50 -1.5 -5.56
Nov. 07 25.25 26.50 1.25 4.95
Dec. 07 26.75 29.00 2.25 8.41
Jan. 08 27.25 24.50 -2.75 -10.09
Feb. 08 25.25 27.25 2 7.92
March 08 27.75 25.00 -2.75 -9.91
April 08 25.00 29.00 4 16.00
May 08 29.25 27.00 -2.25 -7.69
June 08 27.50 26.25 -1.25 -4.55
July 08 26.50 24.25 -2.25 -8.49
Aug. 08 24.25 23.00 -1.25 -5.15
Sept. 08 22.50 19.35 -3.15 -14.00
Oct. 08 19.55 13.80 -5.75 -29.41
Nov. 08 14.90 13.85 -1.05 -7.05
Dec. 08 18.75 18.75 0 0.00
Jan. 09 18.90 14.55 -4.35 -23.02

84
Appendix 4(c)
Computations of the percentage monthly buy and hold abnormal return: (BHAR):
Centum Investments limited
centum Investments Rea Vipingo
(Event Firm) (Control Firm)
Month Buy and hold Return % Buy and hold Return % BHAR %
Feb 07 -17.50 -5.49 -12.01
March 07 -6.86 2.33 -9.19
April 07 0.00 -10.23 10.23
May 07 -1.01 -4.75 3.74
June 07 7.00 -1.25 8.25
July 07 5.56 9.64 -4.08
Aug. 07 6.78 -7.78 14.56
Sept. 07 -13.71 -6.90 -6.80
Oct. 07 -5.56 -2.00 -3.56
Nov. 07 4.95 1.23 3.72
Dec. 07 8.41 9.76 -1.34
Jan. 08 -10.09 -6.83 -3.26
Feb. 08 7.92 2.50 5.42
March 08 -9.91 -13.56 3.65
April 08 16.00 13.39 2.61
May 08 -7.69 -10.24 2.55
June 08 -4.55 2.15 -6.70
July 08 -8.49 -5.32 -3.17
Aug. 08 -5.15 -5.08 -0.07
Sept. 08 -14.00 -4.23 -9.77
Oct. 08 -29.41 -11.76 -17.65
Nov. 08 -7.05 -18.18 11.13
Dec. 08 0.00 3.33 -3.33
Jan. 09 -23.02 -7.14 -15.87

85
Appendix 5 (a)
ANALYSIS OF NSE FIRMS DATA FOR THE IDENTIFICATION O F EA CABLES
CONTROL FIRM Data for 5/9/2006
Shares
outstanding AGRICULTURAL
Par
Value
Market
value
BE/ME
Ratio
Market
capitalisation
%age of E.A
Cables capital
48,875,000 Unilever Tea Kenya Ltd Ord 10.00
10.00 84.00 0.12
4,105,500,000.00 26.16
19,599,999 Kakuzi Ord.5.00
5.00 35.00 0.14
685,999,965.00 4.37
60,000,000 Rea Vipingo Plantations Ltd Ord 5.00
5.00 22.50 0.22
1,350,000,000.00 8.60
38,009,250 Sasini Tea & Coffee Ltd Ord 5.00
5.00 32.75 0.15
1,244,802,937.50 7.93
COMMERCIAL AND SERVICES
- 0.00
22,279,616 Car & General (K) Ltd Ord 5.00
5.00 34.75 0.14
774,216,656.00 4.93
48,559,120 CMC Holdings Ltd Ord 5.00
5.00 90.00 0.06
4,370,320,800.00 27.85
360,000 Hutchings Biemer Ltd Ord 5.00
5.00 20.25 0.25
7,290,000.00 0.05
461,615,484 Kenya Airways Ltd Ord 5.00
5.00 112.00 0.04
51,700,934,208.00 329.44
14,393,106 Marshalls (E.A.) Ltd Ord 5.00
5.00 32.00 0.16
460,579,392.00 2.93
71,305,260 Nation Media Group Ord. 5.00
5.00 202.00 0.02
14,403,662,520.00 91.78
159,000,000 Scangroup Ltd Ord 1.00
1.00 23.50 0.04
3,736,500,000.00 23.81
89,865,588
TPS Eastern Africa (Serena) Ltd Ord
1.00
1.00 100.00 0.01
8,986,558,800.00 57.26
180,000,000 Uchumi Supermarket Ltd Ord 5.00
5.00
- 0.00
FINANCE AND INVESTMENT
- 0.00
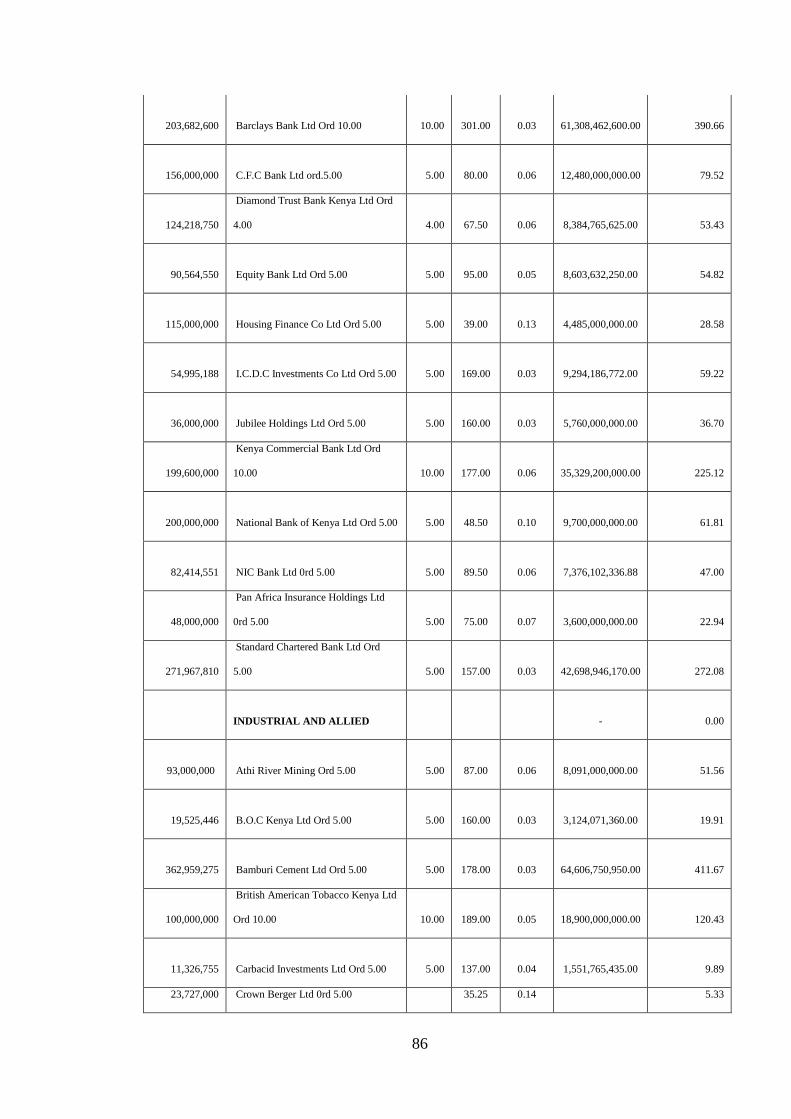
86
203,682,600 Barclays Bank Ltd Ord 10.00
10.00 301.00 0.03
61,308,462,600.00 390.66
156,000,000 C.F.C Bank Ltd ord.5.00
5.00 80.00 0.06
12,480,000,000.00 79.52
124,218,750
Diamond Trust Bank Kenya Ltd Ord
4.00
4.00 67.50 0.06
8,384,765,625.00 53.43
90,564,550 Equity Bank Ltd Ord 5.00
5.00 95.00 0.05
8,603,632,250.00 54.82
115,000,000 Housing Finance Co Ltd Ord 5.00
5.00 39.00 0.13
4,485,000,000.00 28.58
54,995,188 I.C.D.C Investments Co Ltd Ord 5.00
5.00 169.00 0.03
9,294,186,772.00 59.22
36,000,000 Jubilee Holdings Ltd Ord 5.00
5.00 160.00 0.03
5,760,000,000.00 36.70
199,600,000
Kenya Commercial Bank Ltd Ord
10.00
10.00 177.00 0.06
35,329,200,000.00 225.12
200,000,000 National Bank of Kenya Ltd Ord 5.00
5.00 48.50 0.10
9,700,000,000.00 61.81
82,414,551 NIC Bank Ltd 0rd 5.00
5.00 89.50 0.06
7,376,102,336.88 47.00
48,000,000
Pan Africa Insurance Holdings Ltd
0rd 5.00
5.00 75.00 0.07
3,600,000,000.00 22.94
271,967,810
Standard Chartered Bank Ltd Ord
5.00
5.00 157.00 0.03
42,698,946,170.00 272.08
INDUSTRIAL AND ALLIED
- 0.00
93,000,000 Athi River Mining Ord 5.00
5.00 87.00 0.06
8,091,000,000.00 51.56
19,525,446 B.O.C Kenya Ltd Ord 5.00
5.00 160.00 0.03
3,124,071,360.00 19.91
362,959,275 Bamburi Cement Ltd Ord 5.00
5.00 178.00 0.03
64,606,750,950.00 411.67
100,000,000
British American Tobacco Kenya Ltd
Ord 10.00
10.00 189.00 0.05
18,900,000,000.00 120.43
11,326,755 Carbacid Investments Ltd Ord 5.00
5.00 137.00 0.04
1,551,765,435.00 9.89
23,727,000 Crown Berger Ltd 0rd 5.00 35.25 0.14 5.33

87
5.00 836,376,750.00
202,500,000 E.A.Cables Ltd Ord 0.50
0.50 77.50 0.01
15,693,750,000.00 100.00
90,000,000 E.A.Portland Cement Ltd Ord 5.00
5.00 130.00 0.04
11,700,000,000.00 74.55
658,978,630 East African Breweries Ltd Ord 2.00
2.00 140.00 0.01
92,257,008,200.00 587.86
100,796,120 Kenya Oil Co Ltd Ord 0.50
0.50 115.00 0.00
11,591,553,800.00 73.86
79,128,000
Kenya Power & Lighting Ltd Ord
20.00
20.00 203.00 0.10
16,062,984,000.00 102.35
2,198,361,456 KenGen Ltd. Ord. 2.50
2.50 34.50 0.07
75,843,470,232.00 483.27
510,000,000 Mumias Sugar Co. Ltd Ord 2.00
2.00 59.00 0.03
30,090,000,000.00 191.73
10,000,000
Olympia Capital Holdings ltd Ord
5.00
5.00 15.50 0.32
155,000,000.00 0.99
278,342,393 Sameer Africa Ltd Ord 5.00
5.00 15.00 0.33
4,175,135,895.00 26.60
175,064,706 Total Kenya Ltd Ord 5.00
5.00 38.25 0.13
6,696,225,004.50 42.67
63,090,728 Unga Group Ltd Ord 5.00
5.00 17.15 0.29
1,082,005,985.20 6.89
ALTERNATIVE INVESTMENT
MARKET SEGMENT
- 0.00
3,840,066 A.Baumann & Co.Ltd Ord 5.00
5.00 12.50 0.40
48,000,825.00 0.31
4,166,046 City Trust Ltd Ord 5.00
5.00 60.50 0.08
252,045,783.00 1.61
8,039,250 Eaagads Ltd Ord 1.25
1.25 17.60 0.07
141,490,800.00 0.90
32,185,264 Express Ltd Ord 5.00
5.00 23.25 0.22
748,307,388.00 4.77
8,756,320 Williamson Tea Kenya Ltd Ord 5.00
5.00 81.00 0.06
709,261,920.00 4.52
3,912,000 Kapchorua Tea Co. Ltd Ord Ord 5.00
5.00 87.00 0.06
340,344,000.00 2.17
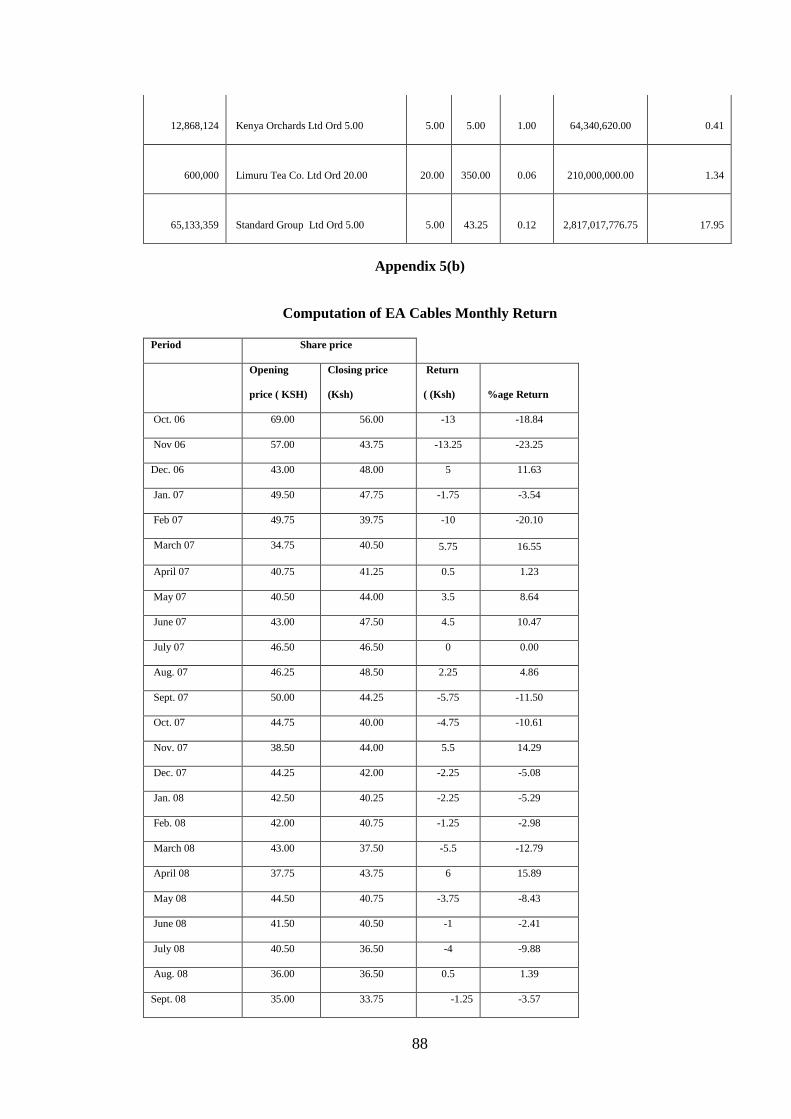
88
12,868,124 Kenya Orchards Ltd Ord 5.00
5.00 5.00 1.00
64,340,620.00 0.41
600,000 Limuru Tea Co. Ltd Ord 20.00
20.00 350.00 0.06
210,000,000.00 1.34
65,133,359 Standard Group Ltd Ord 5.00
5.00 43.25 0.12
2,817,017,776.75 17.95
Appendix 5(b)
Computation of EA Cables Monthly Return
Period Share price
Opening
price ( KSH)
Closing price
(Ksh)
Return
( (Ksh) %age Return
Oct. 06 69.00 56.00 -13 -18.84
Nov 06 57.00 43.75 -13.25 -23.25
Dec. 06 43.00 48.00 5 11.63
Jan. 07 49.50 47.75 -1.75 -3.54
Feb 07 49.75 39.75 -10 -20.10
March 07 34.75 40.50 5.75 16.55
April 07 40.75 41.25 0.5 1.23
May 07 40.50 44.00 3.5 8.64
June 07 43.00 47.50 4.5 10.47
July 07 46.50 46.50 0 0.00
Aug. 07 46.25 48.50 2.25 4.86
Sept. 07 50.00 44.25 -5.75 -11.50
Oct. 07 44.75 40.00 -4.75 -10.61
Nov. 07 38.50 44.00 5.5 14.29
Dec. 07 44.25 42.00 -2.25 -5.08
Jan. 08 42.50 40.25 -2.25 -5.29
Feb. 08 42.00 40.75 -1.25 -2.98
March 08 43.00 37.50 -5.5 -12.79
April 08 37.75 43.75 6 15.89
May 08 44.50 40.75 -3.75 -8.43
June 08 41.50 40.50 -1 -2.41
July 08 40.50 36.50 -4 -9.88
Aug. 08 36.00 36.50 0.5 1.39
Sept. 08 35.00 33.75 -1.25 -3.57
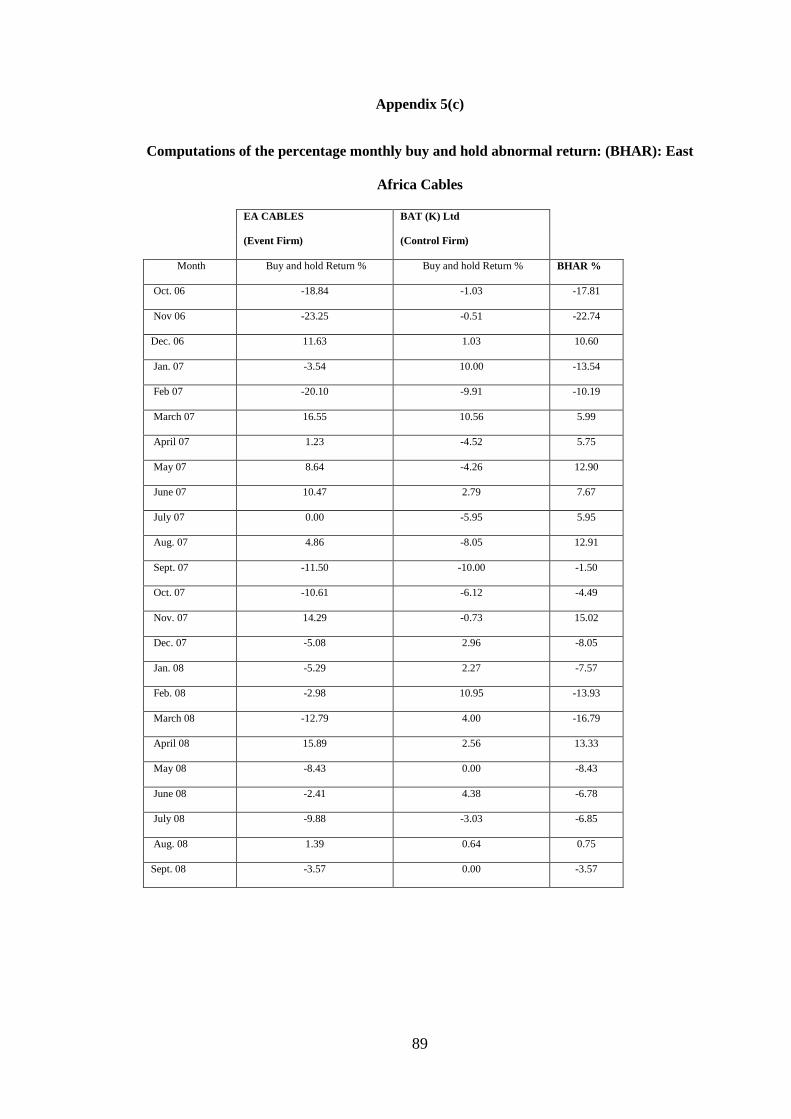
89
Appendix 5(c)
Computations of the percentage monthly buy and hold abnormal return: (BHAR): East
Africa Cables
EA CABLES BAT (K) Ltd
(Event Firm) (Control Firm)
Month Buy and hold Return % Buy and hold Return % BHAR %
Oct. 06 -18.84 -1.03 -17.81
Nov 06 -23.25 -0.51 -22.74
Dec. 06 11.63 1.03 10.60
Jan. 07 -3.54 10.00 -13.54
Feb 07 -20.10 -9.91 -10.19
March 07 16.55 10.56 5.99
April 07 1.23 -4.52 5.75
May 07 8.64 -4.26 12.90
June 07 10.47 2.79 7.67
July 07 0.00 -5.95 5.95
Aug. 07 4.86 -8.05 12.91
Sept. 07 -11.50 -10.00 -1.50
Oct. 07 -10.61 -6.12 -4.49
Nov. 07 14.29 -0.73 15.02
Dec. 07 -5.08 2.96 -8.05
Jan. 08 -5.29 2.27 -7.57
Feb. 08 -2.98 10.95 -13.93
March 08 -12.79 4.00 -16.79
April 08 15.89 2.56 13.33
May 08 -8.43 0.00 -8.43
June 08 -2.41 4.38 -6.78
July 08 -9.88 -3.03 -6.85
Aug. 08 1.39 0.64 0.75
Sept. 08 -3.57 0.00 -3.57
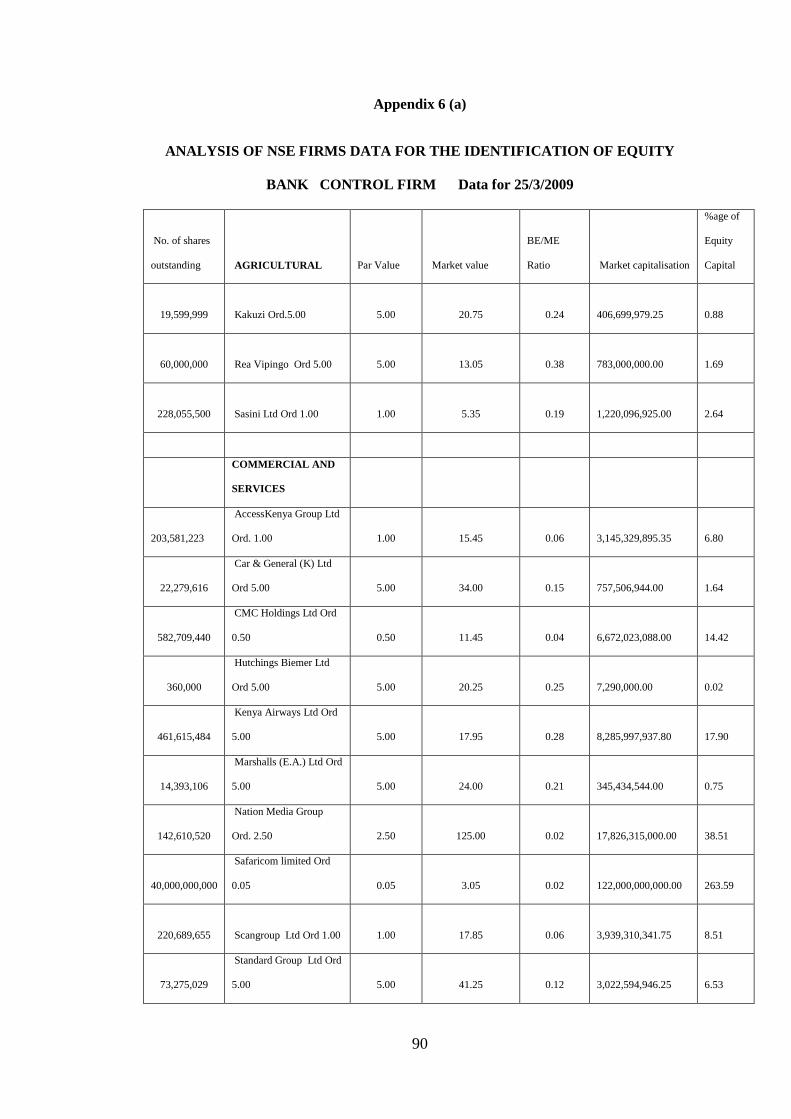
90
Appendix 6 (a)
ANALYSIS OF NSE FIRMS DATA FOR THE IDENTIFICATION O F EQUITY
BANK CONTROL FIRM Data for 25/3/2009
No. of shares
outstanding AGRICULTURAL Par Value Market value
BE/ME
Ratio Market capitalisation
%age of
Equity
Capital
19,599,999 Kakuzi Ord.5.00 5.00 20.75 0.24
406,699,979.25 0.88
60,000,000 Rea Vipingo Ord 5.00 5.00 13.05 0.38
783,000,000.00 1.69
228,055,500 Sasini Ltd Ord 1.00 1.00 5.35 0.19
1,220,096,925.00 2.64
COMMERCIAL AND
SERVICES
203,581,223
AccessKenya Group Ltd
Ord. 1.00 1.00 15.45 0.06
3,145,329,895.35 6.80
22,279,616
Car & General (K) Ltd
Ord 5.00 5.00 34.00 0.15
757,506,944.00 1.64
582,709,440
CMC Holdings Ltd Ord
0.50 0.50 11.45 0.04
6,672,023,088.00 14.42
360,000
Hutchings Biemer Ltd
Ord 5.00 5.00 20.25 0.25
7,290,000.00 0.02
461,615,484
Kenya Airways Ltd Ord
5.00 5.00 17.95 0.28
8,285,997,937.80 17.90
14,393,106
Marshalls (E.A.) Ltd Ord
5.00 5.00 24.00 0.21
345,434,544.00 0.75
142,610,520
Nation Media Group
Ord. 2.50 2.50 125.00 0.02
17,826,315,000.00 38.51
40,000,000,000
Safaricom limited Ord
0.05 0.05 3.05 0.02
122,000,000,000.00 263.59
220,689,655 Scangroup Ltd Ord 1.00 1.00 17.85 0.06
3,939,310,341.75 8.51
73,275,029
Standard Group Ltd Ord
5.00 5.00 41.25 0.12
3,022,594,946.25 6.53
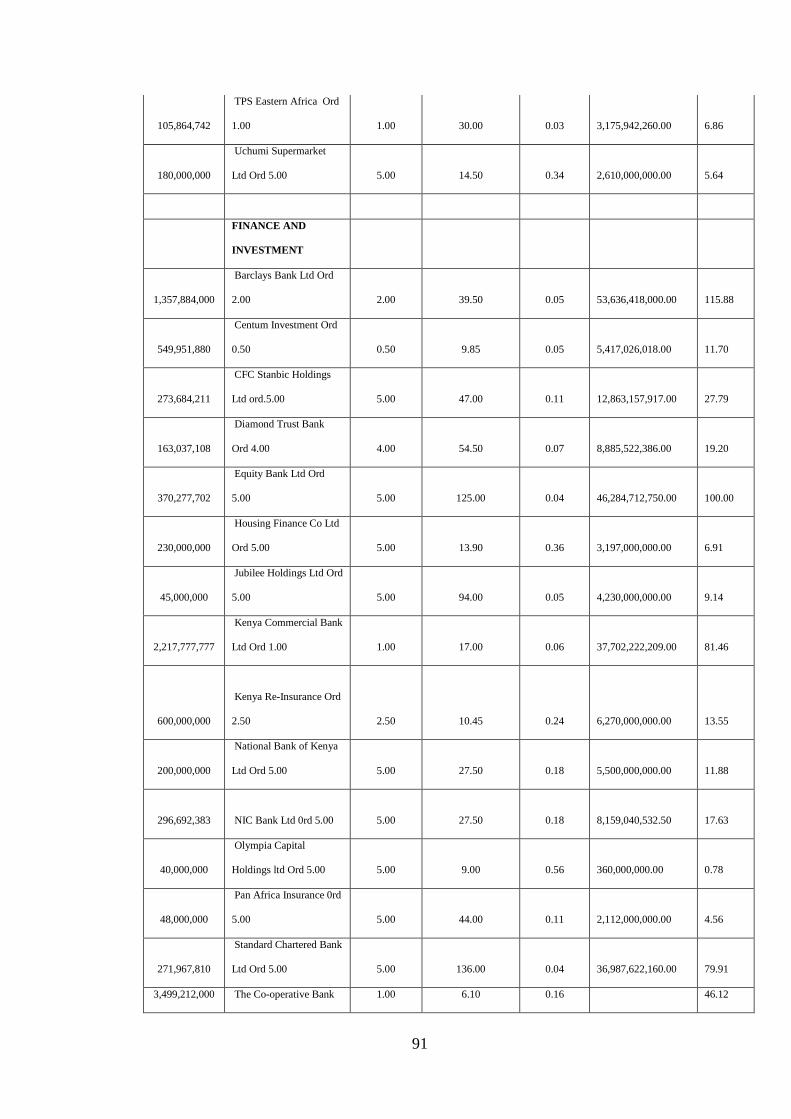
91
105,864,742
TPS Eastern Africa Ord
1.00 1.00 30.00 0.03
3,175,942,260.00 6.86
180,000,000
Uchumi Supermarket
Ltd Ord 5.00 5.00 14.50 0.34
2,610,000,000.00 5.64
FINANCE AND
INVESTMENT
1,357,884,000
Barclays Bank Ltd Ord
2.00 2.00 39.50 0.05
53,636,418,000.00 115.88
549,951,880
Centum Investment Ord
0.50 0.50 9.85 0.05
5,417,026,018.00 11.70
273,684,211
CFC Stanbic Holdings
Ltd ord.5.00 5.00 47.00 0.11
12,863,157,917.00 27.79
163,037,108
Diamond Trust Bank
Ord 4.00 4.00 54.50 0.07
8,885,522,386.00 19.20
370,277,702
Equity Bank Ltd Ord
5.00 5.00 125.00 0.04
46,284,712,750.00 100.00
230,000,000
Housing Finance Co Ltd
Ord 5.00 5.00 13.90 0.36
3,197,000,000.00 6.91
45,000,000
Jubilee Holdings Ltd Ord
5.00 5.00 94.00 0.05
4,230,000,000.00 9.14
2,217,777,777
Kenya Commercial Bank
Ltd Ord 1.00 1.00 17.00 0.06
37,702,222,209.00 81.46
600,000,000
Kenya Re-Insurance Ord
2.50
2.50
10.45
0.24
6,270,000,000.00
13.55
200,000,000
National Bank of Kenya
Ltd Ord 5.00 5.00 27.50 0.18
5,500,000,000.00 11.88
296,692,383 NIC Bank Ltd 0rd 5.00 5.00 27.50 0.18
8,159,040,532.50 17.63
40,000,000
Olympia Capital
Holdings ltd Ord 5.00 5.00 9.00 0.56
360,000,000.00 0.78
48,000,000
Pan Africa Insurance 0rd
5.00 5.00 44.00 0.11
2,112,000,000.00 4.56
271,967,810
Standard Chartered Bank
Ltd Ord 5.00 5.00 136.00 0.04
36,987,622,160.00 79.91
3,499,212,000 The Co-operative Bank 1.00 6.10 0.16 46.12
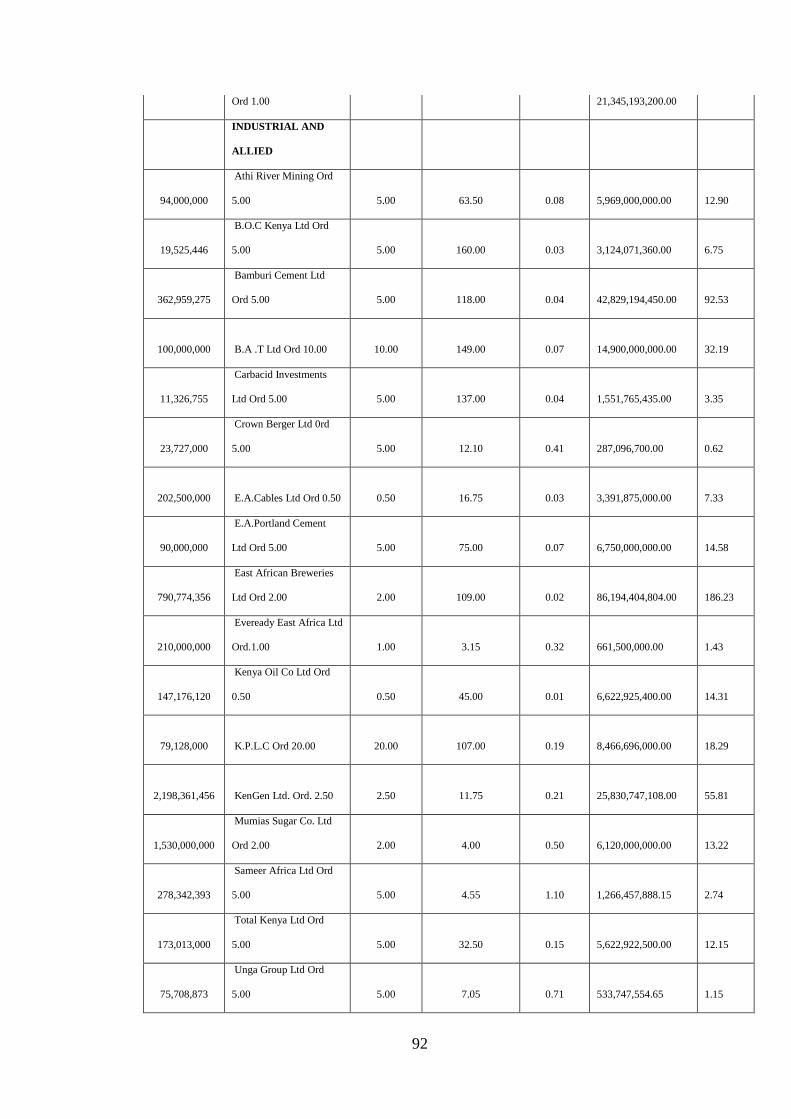
92
Ord 1.00 21,345,193,200.00
INDUSTRIAL AND
ALLIED
94,000,000
Athi River Mining Ord
5.00 5.00 63.50 0.08
5,969,000,000.00 12.90
19,525,446
B.O.C Kenya Ltd Ord
5.00 5.00 160.00 0.03
3,124,071,360.00 6.75
362,959,275
Bamburi Cement Ltd
Ord 5.00 5.00 118.00 0.04
42,829,194,450.00 92.53
100,000,000 B.A .T Ltd Ord 10.00 10.00 149.00 0.07
14,900,000,000.00 32.19
11,326,755
Carbacid Investments
Ltd Ord 5.00 5.00 137.00 0.04
1,551,765,435.00 3.35
23,727,000
Crown Berger Ltd 0rd
5.00 5.00 12.10 0.41
287,096,700.00 0.62
202,500,000 E.A.Cables Ltd Ord 0.50 0.50 16.75 0.03
3,391,875,000.00 7.33
90,000,000
E.A.Portland Cement
Ltd Ord 5.00 5.00 75.00 0.07
6,750,000,000.00 14.58
790,774,356
East African Breweries
Ltd Ord 2.00 2.00 109.00 0.02
86,194,404,804.00 186.23
210,000,000
Eveready East Africa Ltd
Ord.1.00 1.00 3.15 0.32
661,500,000.00 1.43
147,176,120
Kenya Oil Co Ltd Ord
0.50 0.50 45.00 0.01
6,622,925,400.00 14.31
79,128,000 K.P.L.C Ord 20.00 20.00 107.00 0.19
8,466,696,000.00 18.29
2,198,361,456 KenGen Ltd. Ord. 2.50 2.50 11.75 0.21
25,830,747,108.00 55.81
1,530,000,000
Mumias Sugar Co. Ltd
Ord 2.00 2.00 4.00 0.50
6,120,000,000.00 13.22
278,342,393
Sameer Africa Ltd Ord
5.00 5.00 4.55 1.10
1,266,457,888.15 2.74
173,013,000
Total Kenya Ltd Ord
5.00 5.00 32.50 0.15
5,622,922,500.00 12.15
75,708,873
Unga Group Ltd Ord
5.00 5.00 7.05 0.71
533,747,554.65 1.15
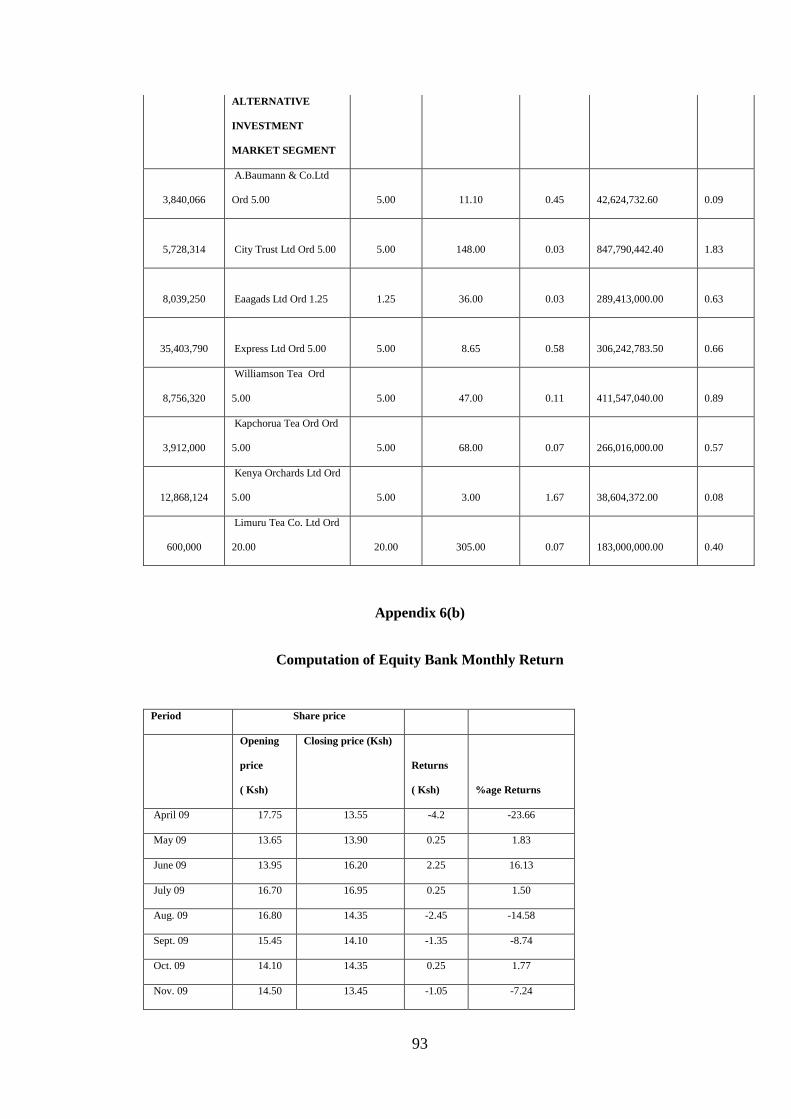
93
ALTERNATIVE
INVESTMENT
MARKET SEGMENT
3,840,066
A.Baumann & Co.Ltd
Ord 5.00 5.00 11.10 0.45
42,624,732.60 0.09
5,728,314 City Trust Ltd Ord 5.00 5.00 148.00 0.03
847,790,442.40 1.83
8,039,250 Eaagads Ltd Ord 1.25 1.25 36.00 0.03
289,413,000.00 0.63
35,403,790 Express Ltd Ord 5.00 5.00 8.65 0.58
306,242,783.50 0.66
8,756,320
Williamson Tea Ord
5.00 5.00 47.00 0.11
411,547,040.00 0.89
3,912,000
Kapchorua Tea Ord Ord
5.00 5.00 68.00 0.07
266,016,000.00 0.57
12,868,124
Kenya Orchards Ltd Ord
5.00 5.00 3.00 1.67
38,604,372.00 0.08
600,000
Limuru Tea Co. Ltd Ord
20.00 20.00 305.00 0.07
183,000,000.00 0.40
Appendix 6(b)
Computation of Equity Bank Monthly Return
Period Share price
Opening
price
( Ksh)
Closing price (Ksh)
Returns
( Ksh) %age Returns
April 09 17.75 13.55 -4.2 -23.66
May 09 13.65 13.90 0.25 1.83
June 09 13.95 16.20 2.25 16.13
July 09 16.70 16.95 0.25 1.50
Aug. 09 16.80 14.35 -2.45 -14.58
Sept. 09 15.45 14.10 -1.35 -8.74
Oct. 09 14.10 14.35 0.25 1.77
Nov. 09 14.50 13.45 -1.05 -7.24

94
Dec. 09 13.10 14.35 1.25 9.54
Jan. 10 14.25 15.95 1.7 11.93
Feb. 10 15.70 15.60 -0.1 -0.64
March 10 15.60 15.75 0.15 0.96
April 10 15.95 18.55 2.6 16.30
May 10 18.50 22.50 4 21.62
June 10 22.75 24.00 1.25 5.49
July 10 23.75 23.75 0 0.00
Aug. 10 24.00 25.00 1 4.17
Sept. 10 25.00 26.75 1.75 7.00
Oct. 10 26.75 26.25 -0.5 -1.87
Nov. 10 25.75 25.50 -0.25 -0.97
Dec. 10 25.75 26.75 1 3.88
Jan. 11 26.75 29.50 2.75 10.28
Feb. 11 29.00 27.75 -1.25 -4.31
Mar-11 28.25 25.00 -3.25 -11.50
Appendix 6(c)
Computations of the percentage monthly buy and hold abnormal return: (BHAR):
Equity Bank Limited
Equity Bank Standard Bank
(Event Firm) (Control Firm)
Month Buy and hold Return % Buy and hold Return % BHAR %
April 09 -23.66 -2.88 -20.78
May 09 1.83 6.20 -4.37
June 09 16.13 6.67 9.46
July 09 1.50 -4.86 6.36
Aug. 09 -14.58 0.00 -14.58
Sept. 09 -8.74 0.72 -9.46
Oct. 09 1.77 0.71 1.06
Nov. 09 -7.24 3.52 -10.76
Dec. 09 9.54 8.78 0.76

95
Jan. 10 11.93 8.33 3.60
Feb. 10 -0.64 4.71 -5.34
March 10 0.96 5.00 -4.04
April 10 16.30 4.74 11.56
May 10 21.62 10.20 11.42
June 10 5.49 5.21 0.28
July 10 0.00 14.93 -14.93
Aug. 10 4.17 -4.20 8.37
Sept. 10 7.00 9.56 -2.56
Oct. 10 -1.87 -5.47 3.61
Nov. 10 -0.97 -3.23 2.25
Dec. 10 3.88 -4.44 8.33
Jan. 11 10.28 4.63 5.65
Feb. 11 -4.31 2.95 -7.26
Mar-11 -11.50 -5.40 -6.11
Appendix 7 (a)
ANALYSIS OF NSE FIRMS DATA FOR THE IDENTIFICATION O F KENYA OIL
CONTROL FIRM Data for 5/7/2004
Shares
outstanding AGRICULTURAL
Par
Value
B/E
Market
Price M/E
Market
capitalisation BE/ME
%age of Kenya
oil capital
48,875,000 Brooke Bond Ltd Ord 10.00 10 70.50
3,445,687,500.00 0.14 8.08
19,599,999 Kakuzi Ord.5.00 5 29.00
568,399,971.00 0.17 1.33
60,000,000
Rea Vipingo Plantations Ltd Ord
5.00 5 9.00
540,000,000.00 0.56 1.27
38,009,250 Sasini Tea & Coffee Ltd Ord 5.00 5 19.00
722,175,750.00 0.26 1.69
COMMERCIAL AND SERVICES
22,279,560 Car & General (K) Ltd Ord 5.00 5 13.80
307,457,928.00 0.36 0.72
48,559,120 CMC Holdings Ltd Ord 5.00 5 52.00 0.10 5.92

96
2,525,074,240.00
360,000 Hutchings Biemer Ltd Ord 5.00 5 20.25
7,290,000.00 0.25 0.02
461,615,484 Kenya Airways Ltd Ord 5.00 5 12.70
5,862,516,646.80 0.39 13.75
14,393,106 Marshalls (E.A.) Ltd Ord 5.00 5 16.70
240,364,870.20 0.30 0.56
53,478,945 Nation Media Group Ord. 5.00 5 184.00
9,840,125,880.00 0.03 23.08
38,679,000 TPS Ltd Ord 5.00 (Serena) 5 30.00
1,160,370,000.00 0.17 2.72
60,000,000 Uchumi Supermarket Ltd Ord 5.00 5 17.55
1,053,000,000.00 0.28 2.47
FINANCE AND INVESTMENT
203,682,600 Barclays Bank Ltd Ord 10.00 10 201.00
40,940,202,600.00 0.05 96.02
144,000,000 C.F.C Bank Ltd ord.5.00 5 45.50
6,552,000,000.00 0.11 15.37
99,375,000
Diamond Trust Bank Kenya Ltd Ord
4.00 4 30.75
3,055,781,250.00 0.13 7.17
115,000,000 Housing Finance Co Ltd Ord 5.00 5 9.50
1,092,500,000.00 0.53 2.56
54,982,863 I.C.D.C Investments Co Ltd Ord 5.00 5 62.50
3,436,428,937.50 0.08 8.06
36,000,000 Jubilee Insurance Co. Ltd Ord 5.00 5 53.00
1,908,000,000.00 0.09 4.48
149,600,000
Kenya Commercial Bank Ltd Ord
10.00 10 56.00
8,377,600,000.00 0.18 19.65
200,000,000
National Bank of Kenya Ltd Ord
5.00 5 18.60
3,720,000,000.00 0.27 8.72
82,414,551 NIC Bank Ltd 0rd 5.00 5 46.00
3,791,069,357.50 0.11 8.89
39,708,334 Pan Africa Insurance Holdings Ltd 5 28.00
1,111,833,352.00 0.18 2.61
271,967,810
Standard Chartered Bank Ltd Ord
5.00 5 130.00
35,355,815,300.00 0.04 82.92
INDUSTRIAL AND ALLIED
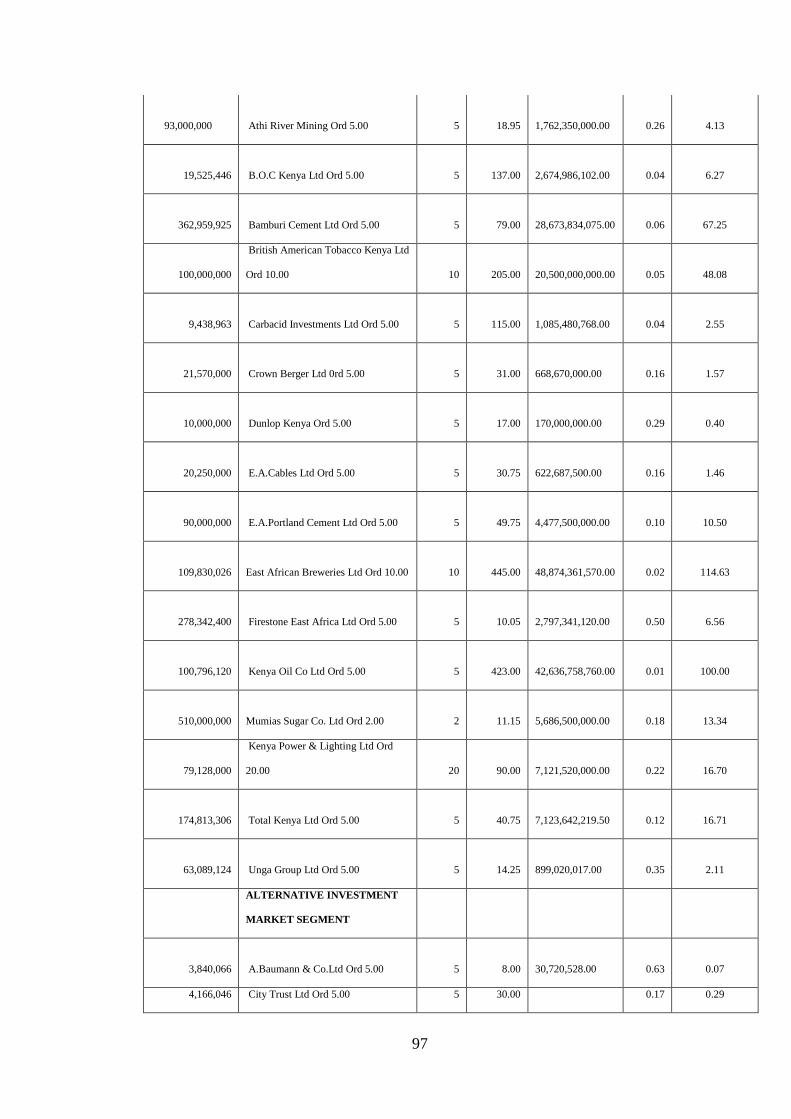
97
93,000,000 Athi River Mining Ord 5.00 5 18.95
1,762,350,000.00 0.26 4.13
19,525,446 B.O.C Kenya Ltd Ord 5.00 5 137.00
2,674,986,102.00 0.04 6.27
362,959,925 Bamburi Cement Ltd Ord 5.00 5 79.00
28,673,834,075.00 0.06 67.25
100,000,000
British American Tobacco Kenya Ltd
Ord 10.00 10 205.00
20,500,000,000.00 0.05 48.08
9,438,963 Carbacid Investments Ltd Ord 5.00 5 115.00
1,085,480,768.00 0.04 2.55
21,570,000 Crown Berger Ltd 0rd 5.00 5 31.00
668,670,000.00 0.16 1.57
10,000,000 Dunlop Kenya Ord 5.00 5 17.00
170,000,000.00 0.29 0.40
20,250,000 E.A.Cables Ltd Ord 5.00 5 30.75
622,687,500.00 0.16 1.46
90,000,000 E.A.Portland Cement Ltd Ord 5.00 5 49.75
4,477,500,000.00 0.10 10.50
109,830,026 East African Breweries Ltd Ord 10.00 10 445.00
48,874,361,570.00 0.02 114.63
278,342,400 Firestone East Africa Ltd Ord 5.00 5 10.05
2,797,341,120.00 0.50 6.56
100,796,120 Kenya Oil Co Ltd Ord 5.00 5 423.00
42,636,758,760.00 0.01 100.00
510,000,000 Mumias Sugar Co. Ltd Ord 2.00 2 11.15
5,686,500,000.00 0.18 13.34
79,128,000
Kenya Power & Lighting Ltd Ord
20.00 20 90.00
7,121,520,000.00 0.22 16.70
174,813,306 Total Kenya Ltd Ord 5.00 5 40.75
7,123,642,219.50 0.12 16.71
63,089,124 Unga Group Ltd Ord 5.00 5 14.25
899,020,017.00 0.35 2.11
ALTERNATIVE INVESTMENT
MARKET SEGMENT
3,840,066 A.Baumann & Co.Ltd Ord 5.00 5 8.00
30,720,528.00 0.63 0.07
4,166,046 City Trust Ltd Ord 5.00 5 30.00 0.17 0.29

98
124,981,380.00
6,341,400 Eaagads Ltd Ord 1.25 1.25 17.00
107,803,800.00 0.07 0.25
32,185,264 Express Ltd Ord 5.00 5 9.00
289,667,376.00 0.56 0.68
8,756,320 Williamson Tea Kenya Ltd Ord 5.00 5 90.50
792,446,960.00 0.06 1.86
3,912,000 Kapchorua Tea Co. Ltd Ord Ord 5.00 5 100.00
391,200,000.00 0.05 0.92
7,800,000 Kenya Orchards Ltd Ord 5.00 5 3.80
29,640,000.00 1.32 0.07
600,000 Limuru Tea Co. Ltd Ord 20.00 20 231.00
138,600,000.00 0.09 0.33
65,133,359
Standard Newspapers Group Ord
5.00 5 48.75
3,175,251,251.25 0.10 7.45
Appendix 7(b)
Computation of Kenya Oil Monthly return
Period Share price Ksh.
Opening price
KSh.
Closing price
Ksh. Returns %age Returns
Aug.04 50.00 42.50 -7.5 -15.00
September 42.50 50.50 8 18.82
Oct. 04 50.50 49.00 -1.5 -2.97
Nov. 04 49.00 61.50 12.5 25.51
Dec. 04 61.50 63.00 1.5 2.44
Jan.05 63.00 61.50 -1.5 -2.38
February 61.50 62.00 0.5 0.81
March 60.00 64.50 4.5 7.50
April 64.50 68.00 3.5 5.43
May 68.00 90.00 22 32.35
June 05 88.00 110.00 22 25.00
July 115.00 107.00 -8 -6.96
Aug.05 107.00 114.00 7 6.54
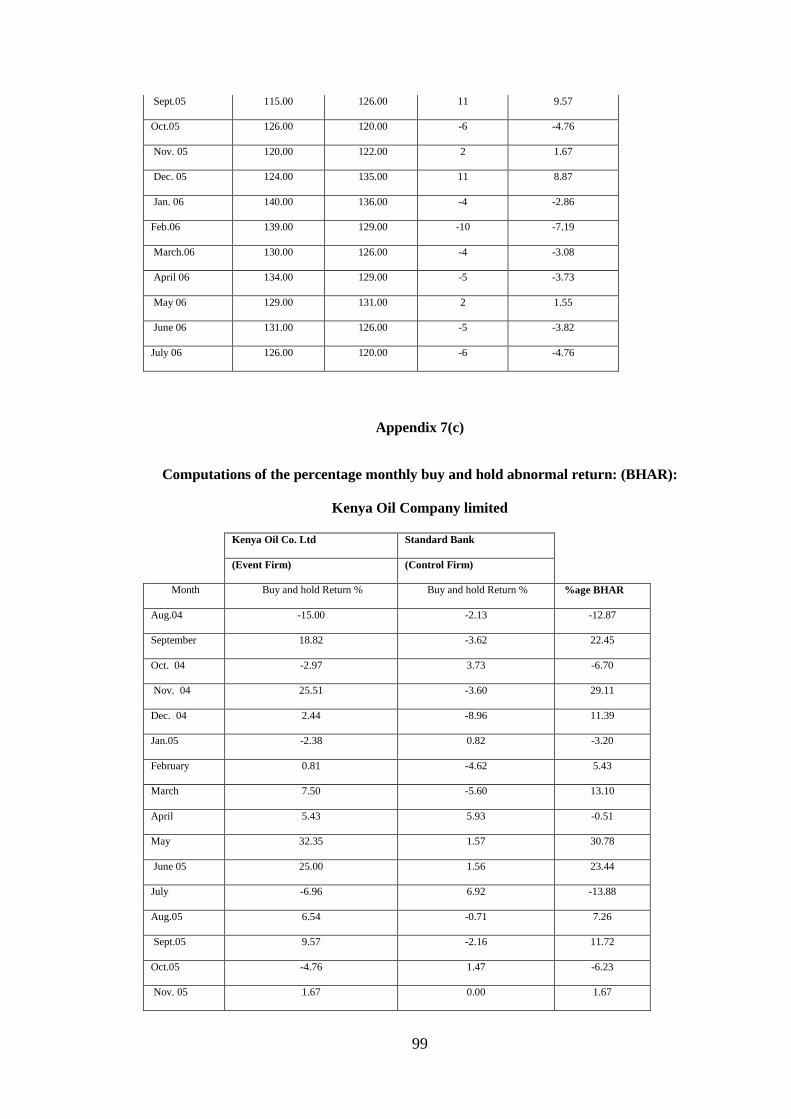
99
Sept.05 115.00 126.00 11 9.57
Oct.05 126.00 120.00 -6 -4.76
Nov. 05 120.00 122.00 2 1.67
Dec. 05 124.00 135.00 11 8.87
Jan. 06 140.00 136.00 -4 -2.86
Feb.06 139.00 129.00 -10 -7.19
March.06 130.00 126.00 -4 -3.08
April 06 134.00 129.00 -5 -3.73
May 06 129.00 131.00 2 1.55
June 06 131.00 126.00 -5 -3.82
July 06 126.00 120.00 -6 -4.76
Appendix 7(c)
Computations of the percentage monthly buy and hold abnormal return: (BHAR):
Kenya Oil Company limited
Kenya Oil Co. Ltd Standard Bank
(Event Firm) (Control Firm)
Month Buy and hold Return % Buy and hold Return % %age BHAR
Aug.04 -15.00 -2.13 -12.87
September 18.82 -3.62 22.45
Oct. 04 -2.97 3.73 -6.70
Nov. 04 25.51 -3.60 29.11
Dec. 04 2.44 -8.96 11.39
Jan.05 -2.38 0.82 -3.20
February 0.81 -4.62 5.43
March 7.50 -5.60 13.10
April 5.43 5.93 -0.51
May 32.35 1.57 30.78
June 05 25.00 1.56 23.44
July -6.96 6.92 -13.88
Aug.05 6.54 -0.71 7.26
Sept.05 9.57 -2.16 11.72
Oct.05 -4.76 1.47 -6.23
Nov. 05 1.67 0.00 1.67

100
Dec. 05 8.87 0.72 8.15
Jan. 06 -2.86 5.15 -8.00
Feb.06 -7.19 -2.11 -5.08
March.06 -3.08 0.00 -3.08
April 06 -3.73 -0.71 -3.02
May 06 1.55 2.16 -0.61
June 06 -3.82 1.41 -5.23
July 06 -4.76 1.99 -6.75
Appendix 8(a)
ANALYSIS OF NSE FIRMS DATA FOR THE IDENTIFICATION O F NATION
MEDIA CONTROL FIRM Data for 4/8/2008
Outstanding
shares AGRICULTURAL Par value
Market
price
BE/ME
Ratio
Market
capitalisation
%age of
KCB
Capital
48,875,000 Unilever Tea Kenya Ltd Ord 10.00 10.00 45.00 0.22
2,199,375,000.00 8.34
19,599,999 Kakuzi Ord.5.00 5.00 38.00 0.13
744,799,962.00 2.82
60,000,000
Rea Vipingo Plantations Ltd Ord
5.00 5.00 18.80 0.27
1,128,000,000.00 4.28
228,055,500 Sasini Ltd Ord 1.00 1.00 12.50 0.08
2,850,693,750.00 10.81
0.00
COMMERCIAL AND SERVICES 0.00
199,885,578 AccessKenya Group Ltd Ord. 1.00 1.00 32.75 0.03
6,546,252,679.50 24.81
22,279,616 Car & General (K) Ltd Ord 5.00 5.00 50.00 0.10
1,113,980,800.00 4.22
582,709,440 CMC Holdings Ltd Ord 0.50 0.50 21.00 0.02
12,236,898,240.00 46.38
360,000 Hutchings Biemer Ltd Ord 5.00 5.00 20.25 0.25
7,290,000.00 0.03

101
461,615,484 Kenya Airways Ltd Ord 5.00 5.00 48.25 0.10
22,272,947,103.00 84.42
14,393,106 Marshalls (E.A.) Ltd Ord 5.00 5.00 30.00 0.17
431,793,180.00 1.64
142,610,520 Nation Media Group Ord. 2.50 2.50 185.00 0.01
26,382,946,200.00 100.00
40,000,000,000 Safaricom limited Ord 0.05 0.05 5.75 0.01
230,000,000,000.00 871.78
159,000,000 Scangroup Ltd Ord 1.00 1.00 29.75 0.03
4,730,250,000.00 17.93
73,275,029 Standard Group Ltd Ord 5.00 5.00 54.00 0.09
3,956,851,566.00 15.00
105,864,742
TPS Eastern Africa (Serena) Ltd
Ord 1.00 1.00 63.50 0.02
6,722,411,117.00 25.48
180,000,000 Uchumi Supermarket Ltd Ord 5.00 5.00 14.50 0.34
2,610,000,000.00 9.89
0.00
FINANCE AND INVESTMENT 0.00
1,357,884,000 Barclays Bank Ltd Ord 2.00 2.00 64.50 0.03
87,583,518,000.00 331.97
273,684,211 CFC Stanbic Holdings Ltd ord.5.00 5.00 105.00 0.05
28,736,842,155.00 108.92
163,037,108
Diamond Trust Bank Kenya Ltd
Ord 4.00 4.00 90.00 0.04
14,673,339,720.00 55.62
370,277,702 Equity Bank Ltd Ord 5.00 5.00 289.00 0.02
107,010,255,878.00 405.60
230,000,000 Housing Finance Co Ltd Ord 5.00 5.00 27.50 0.18
6,325,000,000.00 23.97
549,951,880
Centum Investment Company Ltd
Ord 0.50 0.50 24.75 0.02
13,611,309,030.00 51.59
45,000,000 Jubilee Holdings Ltd Ord 5.00 5.00 175.00 0.03
7,875,000,000.00 29.85
1,996,000,000
Kenya Commercial Bank Ltd Ord
1.00 1.00 30.00 0.03
59,880,000,000.00 226.96
600,000,000
Kenya Re-Insurance Corporation
Ltd Ord 2.50 2.50 15.05 0.17
9,030,000,000.00 34.23
200,000,000 National Bank of Kenya Ltd Ord 5.00 63.00 0.08 47.76

102
5.00 12,600,000,000.00
296,692,383 NIC Bank Ltd 0rd 5.00 5.00 54.50 0.09
16,169,734,873.50 61.29
48,000,000
Pan Africa Insurance Holdings Ltd
0rd 5.00 5.00 68.00 0.07
3,264,000,000.00 12.37
271,967,810
Standard Chartered Bank Ltd Ord
5.00 5.00 197.00 0.03
53,577,658,570.00 203.08
INDUSTRIAL AND ALLIED 0.00
94,000,000 Athi River Mining Ord 5.00 5.00 108.00 0.05
10,152,000,000.00 38.48
19,525,446 B.O.C Kenya Ltd Ord 5.00 5.00 160.00 0.03
3,124,071,360.00 11.84
362,959,275 Bamburi Cement Ltd Ord 5.00 5.00 191.00 0.03
69,325,221,525.00 262.77
100,000,000
British American Tobacco Kenya
Ltd Ord 10.00 10.00 151.00 0.07
15,100,000,000.00 57.23
11,326,755 Carbacid Investments Ltd Ord 5.00 5.00 137.00 0.04
1,551,765,435.00 5.88
23,727,000 Crown Berger Ltd 0rd 5.00 5.00 37.75 0.13
895,694,250.00 3.39
202,500,000 E.A.Cables Ltd Ord 0.50 0.50 36.75 0.01
7,441,875,000.00 28.21
90,000,000 E.A.Portland Cement Ltd Ord 5.00 5.00 112.00 0.04
10,080,000,000.00 38.21
790,774,356
East African Breweries Ltd Ord
2.00 2.00 187.00 0.01
147,874,804,572.00 560.49
210,000,000 Eveready East Africa Ltd Ord.1.00 1.00 5.35 0.19
1,123,500,000.00 4.26
147,176,120 Kenya Oil Co Ltd Ord 0.50 0.50 89.00 0.01
13,098,674,680.00 49.65
79,128,000
Kenya Power & Lighting Ltd Ord
20.00 20.00 198.00 0.10
15,667,344,000.00 59.38
2,198,361,456 KenGen Ltd. Ord. 2.50 2.50 23.00 0.11
50,562,313,488.00 191.65
1,530,000,000 Mumias Sugar Co. Ltd Ord 2.00 2.00 10.75 0.19
16,447,500,000.00 62.34
40,000,000 Olympia Capital Holdings ltd Ord 5.00 14.00 0.36 2.12
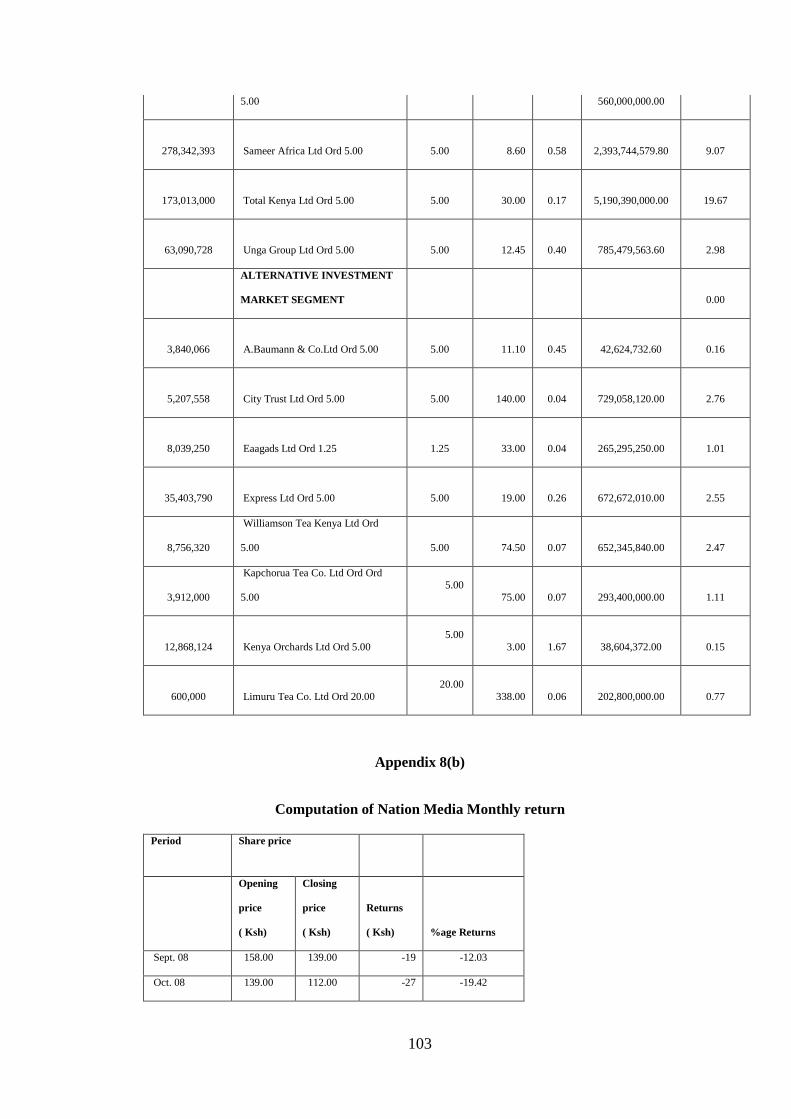
103
5.00 560,000,000.00
278,342,393 Sameer Africa Ltd Ord 5.00 5.00 8.60 0.58
2,393,744,579.80 9.07
173,013,000 Total Kenya Ltd Ord 5.00 5.00 30.00 0.17
5,190,390,000.00 19.67
63,090,728 Unga Group Ltd Ord 5.00 5.00 12.45 0.40
785,479,563.60 2.98
ALTERNATIVE INVESTMENT
MARKET SEGMENT 0.00
3,840,066 A.Baumann & Co.Ltd Ord 5.00 5.00 11.10 0.45
42,624,732.60 0.16
5,207,558 City Trust Ltd Ord 5.00 5.00 140.00 0.04
729,058,120.00 2.76
8,039,250 Eaagads Ltd Ord 1.25 1.25 33.00 0.04
265,295,250.00 1.01
35,403,790 Express Ltd Ord 5.00 5.00 19.00 0.26
672,672,010.00 2.55
8,756,320
Williamson Tea Kenya Ltd Ord
5.00 5.00 74.50 0.07
652,345,840.00 2.47
3,912,000
Kapchorua Tea Co. Ltd Ord Ord
5.00 5.00
75.00 0.07
293,400,000.00 1.11
12,868,124 Kenya Orchards Ltd Ord 5.00 5.00
3.00 1.67
38,604,372.00 0.15
600,000 Limuru Tea Co. Ltd Ord 20.00 20.00
338.00 0.06
202,800,000.00 0.77
Appendix 8(b)
Computation of Nation Media Monthly return
Period Share price
Opening
price
( Ksh)
Closing
price
( Ksh)
Returns
( Ksh) %age Returns
Sept. 08 158.00 139.00 -19 -12.03
Oct. 08 139.00 112.00 -27 -19.42

104
Nov. 08 120.00 138.00 18 15.00
Dec. 08 137.00 144.00 7 5.11
Jan. 09 145.00 140.00 -5 -3.45
Feb. 09 139.00 115.00 -24 -17.27
March 09 114.00 128.00 14 12.28
Apr-09 126.00 132.00 6 4.76
May-09 132.00 127.00 -5 -3.79
June 09 127.00 144.00 17 13.39
July 09 141.00 130.00 -11 -7.80
Aug. 09 130.00 125.00 -5 -3.85
Sept. 09 125.00 119.00 -6 -4.80
Oct. 09 119.00 121.00 2 1.68
Nov. 09 122.00 123.00 1 0.82
Dec. 09 121.00 118.00 -3 -2.48
Jan. 10 117.00 118.00 1 0.85
Feb. 10 120.00 124.00 4 3.33
March 10 124.00 138.00 14 11.29
April 10 137.00 144.00 7 5.11
May 10 140.00 141.00 1 0.71
June 10 140.00 140.00 0 0.00
July 10 140.00 142.00 2 1.43
August 10 143.00 158.00 15 10.49
Appendix 8(c)
Computations of the percentage monthly buy and hold abnormal return: (BHAR):
Nation Media Group limited
Nation Media Group Kenya Airways
(Event Firm) (Control Firm)
Month Return % Return % BHAR %
Sept. 08 -12.03 -8.47 -3.56
Oct. 08 -19.42 -37.79 18.37
Nov. 08 15.00 0.93 14.07
Dec. 08 5.11 7.55 -2.44
Jan. 09 -3.45 -3.48 0.03

105
Feb. 09 -17.27 -27.59 10.33
March 09 12.28 2.33 9.95
Apr-09 4.76 9.88 -5.11
May-09 -3.79 -3.33 -0.45
June 09 13.39 7.87 5.52
July 09 -7.80 4.17 -11.97
Aug. 09 -3.85 -10.00 6.15
Sept. 09 -4.80 -15.79 10.99
Oct. 09 1.68 19.75 -18.07
Nov. 09 0.82 35.05 -34.23
Dec. 09 -2.48 10.85 -13.33
Jan. 10 0.85 38.89 -38.03
Feb. 10 3.33 -1.00 4.33
March 10 11.29 23.08 -11.79
April 10 5.11 -4.24 9.35
May 10 0.71 -2.63 3.35
June 10 0.00 -17.26 17.26
July 10 1.43 0.54 0.89
August 10 10.49 -6.93 17.42
Appendix 9(a)
ANALYSIS OF NSE FIRMS DATA FOR THE IDENTIFICATION O F CMC
HOLDINGS CONTROL FIRM Data for 26/2/2007
Shares
outstanding AGRICULTURAL
Par
value
Market
value BE/ME Ratio
Market
capitalisation
%age of
CMC Capital
48,875,000
Unilever Tea Kenya Ltd Ord
10.00 10 91.00 0.11
4,447,625,000.00 58.34
19,599,999 Kakuzi Ord.5.00 5 40.00 0.13
783,999,960.00 10.28
60,000,000
Rea Vipingo Plantations Ltd
Ord 5.00 5 22.75 0.22
1,365,000,000.00 17.90
38,009,250
Sasini Tea & Coffee Ltd Ord
5.00 5 24.00 0.21
912,222,000.00 11.97
COMMERCIAL AND 0.00

106
SERVICES -
22,279,616
Car & General (K) Ltd Ord
5.00 5 48.75 0.10
1,086,131,280.00 14.25
48,559,120 CMC Holdings Ltd Ord 5.00 5 157.00 0.03
7,623,781,840.00 100.00
360,000
Hutchings Biemer Ltd Ord
5.00 5 20.25 0.25
7,290,000.00 0.10
461,615,484 Kenya Airways Ltd Ord 5.00 5 103.00 0.05
47,546,394,852.00 623.66
14,393,106
Marshalls (E.A.) Ltd Ord
5.00 5 29.00 0.17
417,400,074.00 5.47
71,305,260
Nation Media Group Ord.
5.00 5 300.00 0.02
21,391,578,000.00 280.59
159,000,000 Scangroup Ltd Ord 1.00 1 23.25 0.04
3,696,750,000.00 48.49
65,133,359
Standard Group Ltd Ord
5.00 5 70.00 0.07
4,559,335,130.00 59.80
89,865,588
TPS Eastern Africa (Serena)
Ltd Ord 1.00 1 88.50 0.01
7,953,104,538.00 104.32
180,000,000
Uchumi Supermarket Ltd
Ord 5.00 5
- 0.00
FINANCE AND
INVESTMENT
- 0.00
1,357,884,000 Barclays Bank Ltd Ord 2.00 2 71.50 0.03
97,088,706,000.00 1273.50
156,000,000 C.F.C Bank Ltd ord.5.00 5 125.00 0.04
19,500,000,000.00 255.78
139,746,093
Diamond Trust Bank Kenya
Ltd Ord 4.00 4 68.50 0.06
9,572,607,370.50 125.56
90,564,550 Equity Bank Ltd Ord 5.00 5 220.00 0.02
19,924,201,000.00 261.34
115,000,000
Housing Finance Co Ltd Ord
5.00 5 31.00 0.16
3,565,000,000.00 46.76
549,951,880
I.C.D.C Investments Co Ltd
Ord 0.50 0.5 28.00 0.02
15,398,652,640.00 201.98
36,000,000
Jubilee Holdings Ltd Ord
5.00 5 305.00 0.02
10,980,000,000.00 144.02
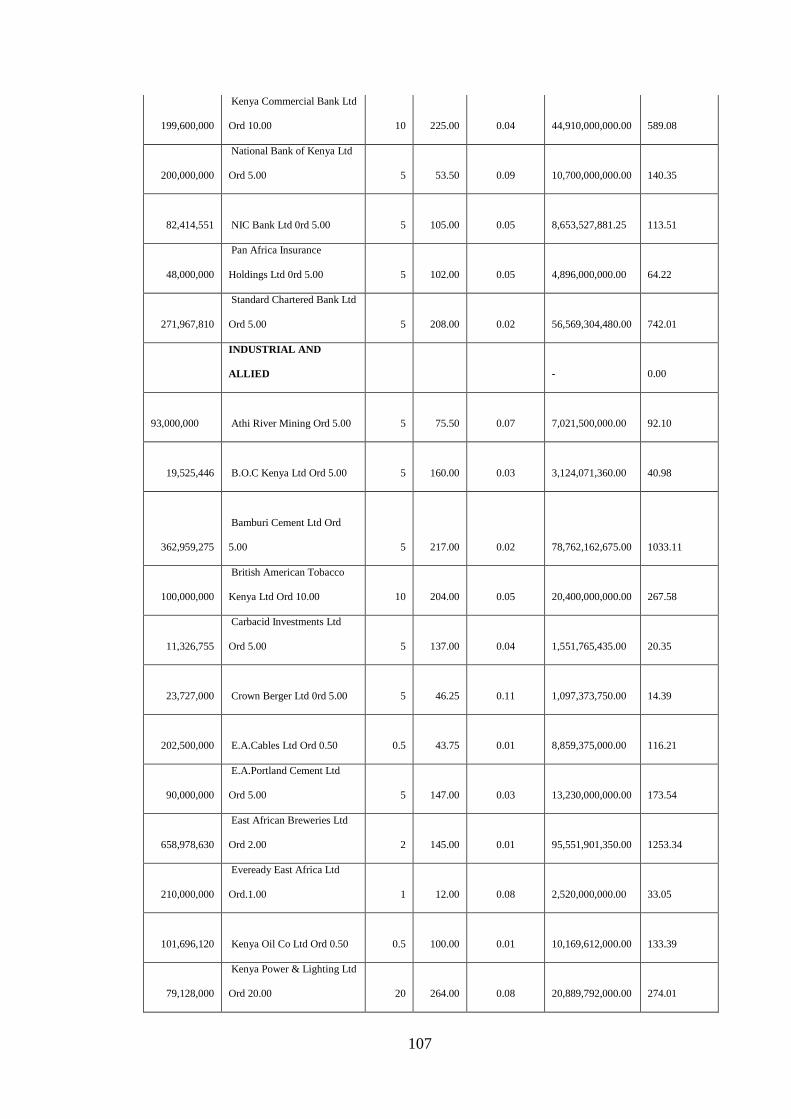
107
199,600,000
Kenya Commercial Bank Ltd
Ord 10.00 10 225.00 0.04
44,910,000,000.00 589.08
200,000,000
National Bank of Kenya Ltd
Ord 5.00 5 53.50 0.09
10,700,000,000.00 140.35
82,414,551 NIC Bank Ltd 0rd 5.00 5 105.00 0.05
8,653,527,881.25 113.51
48,000,000
Pan Africa Insurance
Holdings Ltd 0rd 5.00 5 102.00 0.05
4,896,000,000.00 64.22
271,967,810
Standard Chartered Bank Ltd
Ord 5.00 5 208.00 0.02
56,569,304,480.00 742.01
INDUSTRIAL AND
ALLIED
- 0.00
93,000,000 Athi River Mining Ord 5.00 5 75.50 0.07
7,021,500,000.00 92.10
19,525,446 B.O.C Kenya Ltd Ord 5.00 5 160.00 0.03
3,124,071,360.00 40.98
362,959,275
Bamburi Cement Ltd Ord
5.00
5
217.00
0.02
78,762,162,675.00
1033.11
100,000,000
British American Tobacco
Kenya Ltd Ord 10.00 10 204.00 0.05
20,400,000,000.00 267.58
11,326,755
Carbacid Investments Ltd
Ord 5.00 5 137.00 0.04
1,551,765,435.00 20.35
23,727,000 Crown Berger Ltd 0rd 5.00 5 46.25 0.11
1,097,373,750.00 14.39
202,500,000 E.A.Cables Ltd Ord 0.50 0.5 43.75 0.01
8,859,375,000.00 116.21
90,000,000
E.A.Portland Cement Ltd
Ord 5.00 5 147.00 0.03
13,230,000,000.00 173.54
658,978,630
East African Breweries Ltd
Ord 2.00 2 145.00 0.01
95,551,901,350.00 1253.34
210,000,000
Eveready East Africa Ltd
Ord.1.00 1 12.00 0.08
2,520,000,000.00 33.05
101,696,120 Kenya Oil Co Ltd Ord 0.50 0.5 100.00 0.01
10,169,612,000.00 133.39
79,128,000
Kenya Power & Lighting Ltd
Ord 20.00 20 264.00 0.08
20,889,792,000.00 274.01

108
2,198,361,456 KenGen Ltd. Ord. 2.50 2.5 23.75 0.11
52,211,084,580.00 684.84
510,000,000
Mumias Sugar Co. Ltd Ord
2.00 2 32.75 0.06
16,702,500,000.00 219.08
10,000,000
Olympia Capital Holdings ltd
Ord 5.00 5 23.50 0.21
235,000,000.00 3.08
278,342,393 Sameer Africa Ltd Ord 5.00 5 18.75 0.27
5,218,919,868.75 68.46
175,064,706 Total Kenya Ltd Ord 5.00 5 29.25 0.17
5,120,642,650.50 67.17
63,090,728 Unga Group Ltd Ord 5.00 5 15.50 0.32
977,906,284.00 12.83
3,840,066
A.Baumann & Co.Ltd Ord
5.00 5 29.00 0.17
111,361,914.00 1.46
4,166,046 City Trust Ltd Ord 5.00 5 80.00 0.06
333,283,680.00 4.37
8,039,250 Eaagads Ltd Ord 1.25 1.25 67.00 0.02
538,629,750.00 7.07
35,403,790 Express Ltd Ord 5.00 5 26.00 0.19
920,498,540.00 12.07
8,756,320
Williamson Tea Kenya Ltd
Ord 5.00 5 161.00 0.03
1,409,767,520.00 18.49
3,912,000
Kapchorua Tea Co. Ltd Ord
Ord 5.00 5 122.00 0.04
477,264,000.00 6.26
12,868,124
Kenya Orchards Ltd Ord
5.00 5 5.00 1.00
64,340,620.00 0.84
600,000
Limuru Tea Co. Ltd Ord
20.00 20 350.00 0.06
210,000,000.00 2.75

109
Appendix 9(b)
Computation of CMC Holdings Monthly return
Period Share price
Opening
price
( Ksh)
Closing price
( Ksh) Return
( Ksh) %age Return
March 07 16.80 15.00 -1.8 -10.71
April 07 15.45 13.70 -1.75 -11.33
May 07 13.75 13.90 0.15 1.09
June 07 13.85 14.00 0.15 1.08
July 07 13.95 15.40 1.45 10.39
Aug. 07 15.10 15.35 0.25 1.66
Sept. 07 15.55 15.35 -0.2 -1.29
Oct. 07 15.80 15.35 -0.45 -2.85
Nov. 07 15.45 16.00 0.55 3.56
Dec. 07 16.05 17.70 1.65 10.28
Jan. 08 16.90 17.50 0.6 3.55
Feb. 08 16.60 15.15 -1.45 -8.73
March 08 15.60 14.10 -1.5 -9.62
April 08 14.20 17.20 3 21.13
May 08 18.25 19.05 0.8 4.38
June 08 19.40 20.25 0.85 4.38
July 08 20.50 19.80 -0.7 -3.41
Aug. 08 19.85 19.95 0.1 0.50
Sept. 08 19.80 18.85 -0.95 -4.80
Oct. 08 18.90 14.75 -4.15 -21.96
Nov. 08 16.20 15.50 -0.7 -4.32
Dec. 08 15.30 16.00 0.7 4.58
Jan. 09 16.85 14.30 -2.55 -15.13
February 09 13.60 10.50 -3.1 -22.79

110
Appendix 9(c)
Computations of the percentage monthly buy and hold abnormal return: (BHAR):
CMC Holdings limited
CMC Holdings TPS Eastern Africa
(Event Firm) (Control Firm)
Month Buy and hold Return % Buy and hold Return % BHAR %
March 07 -10.71 15.54 -26.25
April 07 -11.33 2.35 -13.68
May 07 1.09 -2.87 3.96
June 07 1.08 -12.79 13.87
July 07 10.39 17.69 -7.29
Aug. 07 1.66 -5.17 6.83
Sept. 07 -1.29 -4.22 2.93
Oct. 07 -2.85 -3.77 0.93
Nov. 07 3.56 2.72 0.84
Dec. 07 10.28 3.29 6.99
Jan. 08 3.55 -29.11 32.66
Feb. 08 -8.73 12.82 -21.56
March 08 -9.62 -1.43 -8.19
April 08 21.13 5.80 15.33
May 08 4.38 -1.32 5.70
June 08 4.38 -3.97 8.35
July 08 -3.41 -6.94 3.53
Aug. 08 0.50 3.05 -2.55
Sept. 08 -4.80 -14.81 10.02
Oct. 08 -21.96 -14.53 -7.43
Nov. 08 -4.32 -1.82 -2.50
Dec. 08 4.58 -2.78 7.35
Jan. 09 -15.13 -9.05 -6.09
February 09 -22.79 -44.32 21.53

111
Appendix 10 (a)
ANALYSIS OF NSE FIRMS DATA FOR THE IDENTIFICATION O F EA
BREWERIES CONTROL FIRM Data for 29/11/2004
Shares
outsatnding
AGRICULTURAL
Par
value
Market
price
Market
capitalisation BE/ME Ratio
%age of
EA
Breweries
capital
48,875,000 Unilever Tea Kenya Ltd 10.00 92.00 4,496,500,000.00 0.11 5.99
19,599,999 Kakuzi 5.00 32.75 641,899,967.25 0.15 0.85
60,000,000 Rea Vipingo Plantations Ltd 5.00 10.00 600,000,000.00 0.50 0.80
38,009,250 Sasini Tea & Coffee Ltd 5.00 22.00 836,203,500.00 0.23 1.11
COMMERCIAL AND
SERVICES 0.00
22,279,560 Car & General (K) Ltd 5.00 15.00 334,193,400.00 0.33 0.44
48,559,120 CMC Holdings Ltd 5.00 59.00 2,864,988,080.00 0.08 3.81
360,000 Hutchings Biemer Ltd 5.00 20.25 7,290,000.00 0.25 0.01
461,615,484 Kenya Airways Ltd Ord 5.00 5.00 17.50 8,078,270,970.00 0.29 10.75
14,393,106 Marshalls (E.A.) Ltd Ord 5.00 5.00 15.00 215,896,590.00 0.33 0.29
53,478,945 Nation Media Group Ord. 5.00 5.00 190.00 10,160,999,550.00 0.03 13.52
38,679,000 TPS Ltd Ord 5.00 (Serena) 5.00 40.00 1,547,160,000.00 0.13 2.06
60,000,000
Uchumi Supermarket Ltd Ord
5.00 5.00 16.30 978,000,000.00 0.31 1.30
FINANCE AND
INVESTMENT 0.00
203,682,600 Barclays Bank Ltd Ord 10.00 10.00 217.00 44,199,124,200.00 0.05 58.83
172,800,000 C.F.C Bank Ltd ord.5.00 5.00 55.00 9,504,000,000.00 0.09 12.65
99,375,000 Diamond Trust Bank Kenya Ltd 4.00 26.25 2,608,593,750.00 0.15 3.47
115,000,000
Housing Finance Co Ltd Ord
5.00 5.00 9.25 1,063,750,000.00 0.54 1.42
54,982,863
I.C.D.C Investments Co Ltd Ord
5.00 5.00 60.00 3,298,971,780.00 0.08 4.39
36,000,000 Jubilee Insurance Co. Ltd Ord 5.00 57.00 2,052,000,000.00 0.09 2.73

112
5.00
199,600,000
Kenya Commercial Bank Ltd
Ord 10.00 10.00 62.50 12,475,000,000.00 0.16 16.60
200,000,000
National Bank of Kenya Ltd Ord
5.00 5.00 18.00 3,600,000,000.00 0.28 4.79
82,414,551 NIC Bank Ltd 0rd 5.00 5.00 50.00 4,120,727,562.50 0.10 5.48
39,708,334
Pan Africa Insurance Holdings
Ltd 5.00 19.05 756,443,762.70 0.26 1.01
299,164,591
Standard Chartered Bank Ltd
Ord 5.00 5.00 136.00 40,686,384,376.00 0.04 54.16
INDUSTRIAL AND ALLIED 0.00
93,000,000 Athi River Mining Ord 5.00 5.00 15.25 1,418,250,000.00 0.33 1.89
19,525,446 B.O.C Kenya Ltd Ord 5.00 5.00 120.00 2,343,053,520.00 0.04 3.12
362,959,925 Bamburi Cement Ltd Ord 5.00 5.00 96.50 35,025,632,762.50 0.05 46.62
100,000,000
British American Tobacco
Kenya Ltd Ord 10.00 10.00 200.00 20,000,000,000.00 0.05 26.62
9,438,963
Carbacid Investments Ltd Ord
5.00 0.00
23,727,000 Crown Berger Ltd 0rd 5.00 5.00 0.00
10,000,000
Olympia Capital Holdings ltd Ord
5.00
5.00
16.85
168,500,000.00
0.30
0.22
20,250,000 E.A.Cables Ltd Ord 5.00 5.00 37.00 749,250,000.00 0.14 1.00
90,000,000
E.A.Portland Cement Ltd Ord
5.00 5.00 46.00 4,140,000,000.00 0.11 5.51
658,979,900
East African Breweries Ltd Ord
2.00 2.00 114.00 75,123,708,600.00 0.02 99.99
278,342,400
Firestone East Africa Ltd Ord
5.00 5.00 13.00 3,618,451,200.00 0.38 4.82
100,796,120 Kenya Oil Co Ltd Ord 0.50 0.50 60.00 6,047,767,200.00 0.01 8.05
510,000,000 Mumias Sugar Co. Ltd Ord 2.00 2.0 10.85 5,533,500,000.00 0.18 7.37
79,128,000
Kenya Power & Lighting Ltd
Ord 20.00 20.0 86.50 6,844,572,000.00 0.23 9.11
174,813,306 Total Kenya Ltd Ord 5.00 5.00 38.00 6,642,905,628.00 0.13 8.84
63,089,124 Unga Group Ltd Ord 5.00 5.00 11.00 693,980,364.00 0.45 0.92
3,840,066 A.Baumann & Co.Ltd Ord 5.00 5.00 7.90 30,336,521.40 0.63 0.04
4,166,046 City Trust Ltd Ord 5.00 5.00 53.00 220,800,438.00 0.09 0.29
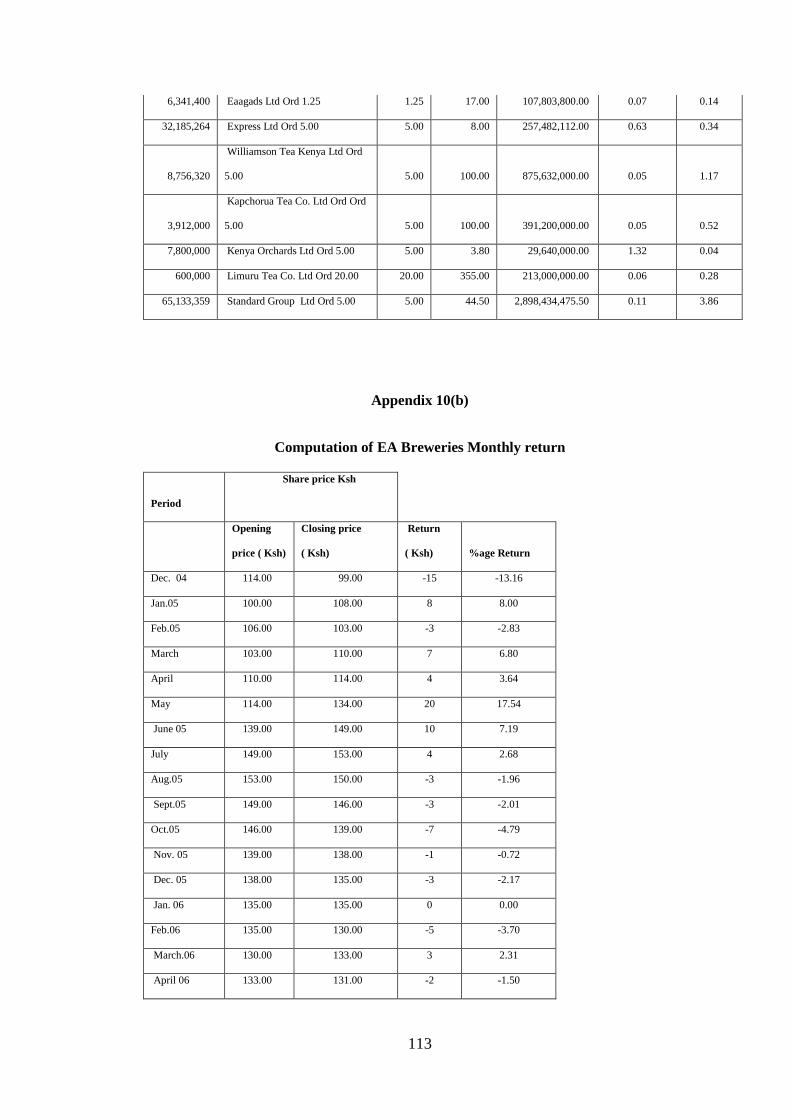
113
6,341,400 Eaagads Ltd Ord 1.25 1.25 17.00 107,803,800.00 0.07 0.14
32,185,264 Express Ltd Ord 5.00 5.00 8.00 257,482,112.00 0.63 0.34
8,756,320
Williamson Tea Kenya Ltd Ord
5.00 5.00 100.00 875,632,000.00 0.05 1.17
3,912,000
Kapchorua Tea Co. Ltd Ord Ord
5.00 5.00 100.00 391,200,000.00 0.05 0.52
7,800,000 Kenya Orchards Ltd Ord 5.00 5.00 3.80 29,640,000.00 1.32 0.04
600,000 Limuru Tea Co. Ltd Ord 20.00 20.00 355.00 213,000,000.00 0.06 0.28
65,133,359 Standard Group Ltd Ord 5.00 5.00 44.50 2,898,434,475.50 0.11 3.86
Appendix 10(b)
Computation of EA Breweries Monthly return
Period
Share price Ksh
Opening
price ( Ksh)
Closing price
( Ksh)
Return
( Ksh) %age Return
Dec. 04 114.00 99.00 -15 -13.16
Jan.05 100.00 108.00 8 8.00
Feb.05 106.00 103.00 -3 -2.83
March 103.00 110.00 7 6.80
April 110.00 114.00 4 3.64
May 114.00 134.00 20 17.54
June 05 139.00 149.00 10 7.19
July 149.00 153.00 4 2.68
Aug.05 153.00 150.00 -3 -1.96
Sept.05 149.00 146.00 -3 -2.01
Oct.05 146.00 139.00 -7 -4.79
Nov. 05 139.00 138.00 -1 -0.72
Dec. 05 138.00 135.00 -3 -2.17
Jan. 06 135.00 135.00 0 0.00
Feb.06 135.00 130.00 -5 -3.70
March.06 130.00 133.00 3 2.31
April 06 133.00 131.00 -2 -1.50

114
May 06 130.00 140.00 10 7.69
June 06 138.00 138.00 0 0.00
July 06 138.00 134.00 -4 -2.90
August 134.00 144.00 10 7.46
Sept. 06 144.00 147.00 3 2.08
Oct. 06 150.00 140.00 -10 -6.67
Nov. 06 143.00 140.00 -3 -2.10
Appendix 10(c)
Computations of the percentage monthly buy and hold abnormal return: (BHAR): East
Africa Breweries limited
EABL Standard Bank
(Event Firm) (Control Firm)
Month Buy and hold Return % Buy and hold Return % BHAR %
Dec. 04 -13.16 -8.96 -4.20
Jan.05 8.00 0.82 7.18
Feb.05 -2.83 -4.62 1.79
March 6.80 -5.60 12.40
April 3.64 5.93 -2.30
May 17.54 1.57 15.97
June 05 7.19 1.56 5.63
July 2.68 6.92 -4.24
Aug.05 -1.96 -0.71 -1.25
Sept.05 -2.01 -2.16 0.14
Oct.05 -4.79 1.47 -6.27
Nov. 05 -0.72 0.00 -0.72
Dec. 05 -2.17 0.72 -2.90
Jan. 06 0.00 5.15 -5.15
Feb.06 -3.70 -2.11 -1.59
March.06 2.31 0.00 2.31
April 06 -1.50 -0.71 -0.79
May 06 7.69 2.16 5.53
June 06 0.00 1.41 -1.41
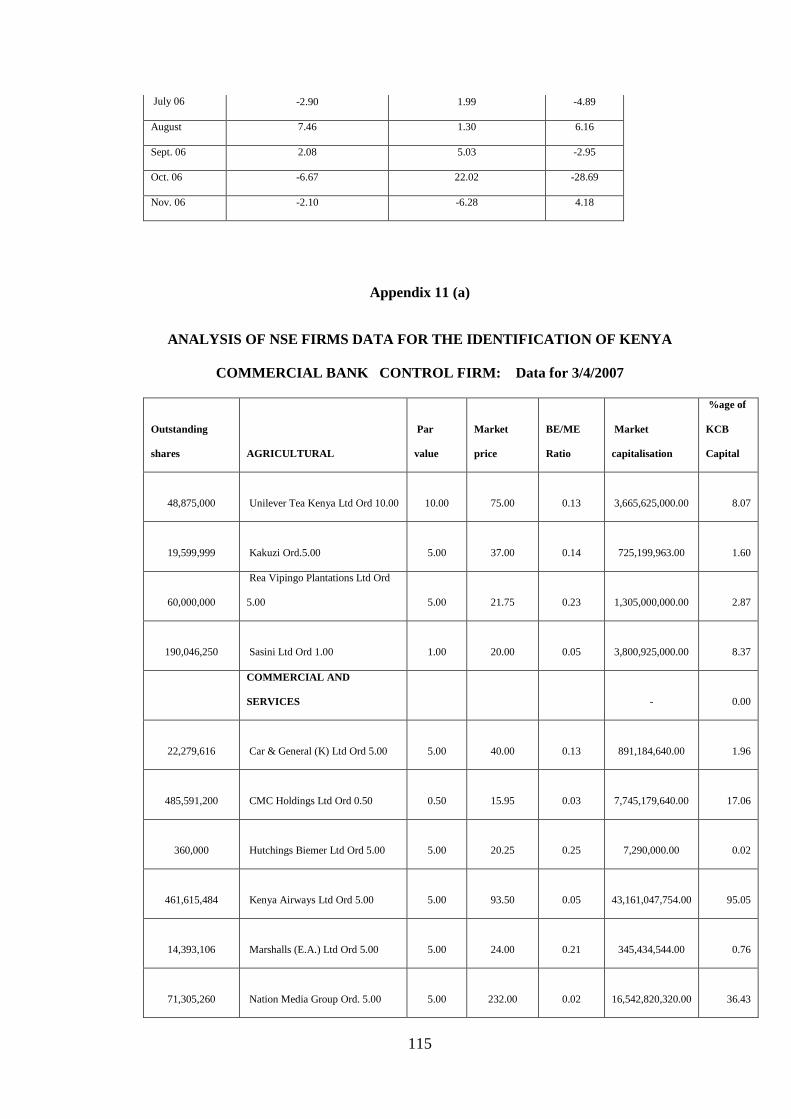
115
July 06 -2.90 1.99 -4.89
August 7.46 1.30 6.16
Sept. 06 2.08 5.03 -2.95
Oct. 06 -6.67 22.02 -28.69
Nov. 06 -2.10 -6.28 4.18
Appendix 11 (a)
ANALYSIS OF NSE FIRMS DATA FOR THE IDENTIFICATION O F KENYA
COMMERCIAL BANK CONTROL FIRM: Data for 3/4/200 7
Outstanding
shares AGRICULTURAL
Par
value
Market
price
BE/ME
Ratio
Market
capitalisation
%age of
KCB
Capital
48,875,000 Unilever Tea Kenya Ltd Ord 10.00 10.00 75.00 0.13
3,665,625,000.00 8.07
19,599,999 Kakuzi Ord.5.00 5.00 37.00 0.14
725,199,963.00 1.60
60,000,000
Rea Vipingo Plantations Ltd Ord
5.00 5.00 21.75 0.23
1,305,000,000.00 2.87
190,046,250 Sasini Ltd Ord 1.00 1.00 20.00 0.05
3,800,925,000.00 8.37
COMMERCIAL AND
SERVICES
- 0.00
22,279,616 Car & General (K) Ltd Ord 5.00 5.00 40.00 0.13
891,184,640.00 1.96
485,591,200 CMC Holdings Ltd Ord 0.50 0.50 15.95 0.03
7,745,179,640.00 17.06
360,000 Hutchings Biemer Ltd Ord 5.00 5.00 20.25 0.25
7,290,000.00 0.02
461,615,484 Kenya Airways Ltd Ord 5.00 5.00 93.50 0.05
43,161,047,754.00 95.05
14,393,106 Marshalls (E.A.) Ltd Ord 5.00 5.00 24.00 0.21
345,434,544.00 0.76
71,305,260 Nation Media Group Ord. 5.00 5.00 232.00 0.02
16,542,820,320.00 36.43

116
159,000,000 Scangroup Ltd Ord 1.00 1.00 24.50 0.04
3,895,500,000.00 8.58
65,133,359 Standard Group Ltd Ord 5.00 5.00 60.00 0.08
3,908,001,540.00 8.61
89,865,588
TPS Eastern Africa (Serena) Ltd
Ord 1.00 1.00 83.00 0.01
7,458,843,804.00 16.43
180,000,000 Uchumi Supermarket Ltd Ord 5.00 5.00 14.50 0.34
2,610,000,000.00 5.75
FINANCE AND INVESTMENT
- 0.00
1,357,884,000 Barclays Bank Ltd Ord 2.00 2.00 69.00 0.03
93,693,996,000.00 206.33
156,000,000 C.F.C Bank Ltd ord.5.00 5.00 118.00 0.04
18,408,000,000.00 40.54
139,746,093
Diamond Trust Bank Kenya Ltd
Ord 4.00 4.00 72.50 0.06
10,131,591,742.50 22.31
90,564,550 Equity Bank Ltd Ord 5.00 5.00 272.00 0.02
24,633,557,600.00 54.25
115,000,000 Housing Finance Co Ltd Ord 5.00 5.00 27.25 0.18
3,133,750,000.00 6.90
549,951,880
I.C.D.C Investments Co Ltd Ord
0.50 0.50 25.25 0.02
13,886,284,970.00 30.58
36,000,000 Jubilee Holdings Ltd Ord 5.00 5.00 237.00 0.02
8,532,000,000.00 18.79
1,996,000,000
Kenya Commercial Bank Ltd Ord
1.00 1.00 22.75 0.04
45,409,000,000.00 100.00
200,000,000
National Bank of Kenya Ltd Ord
5.00 5.00 49.00 0.10
9,800,000,000.00 21.58
82,414,551 NIC Bank Ltd 0rd 5.00 5.00 96.00 0.05
7,911,796,920.00 17.42
48,000,000
Pan Africa Insurance Holdings Ltd
0rd 5.00 5.00 81.50 0.06
3,912,000,000.00 8.62
271,967,810
Standard Chartered Bank Ltd Ord
5.00 5.00 185.00 0.03
50,314,044,850.00 110.80
94,000,000 Athi River Mining Ord 5.00 5.00 72.00 0.07
6,768,000,000.00 14.90
19,525,446 B.O.C Kenya Ltd Ord 5.00 5.00 16000 0.03 6.88
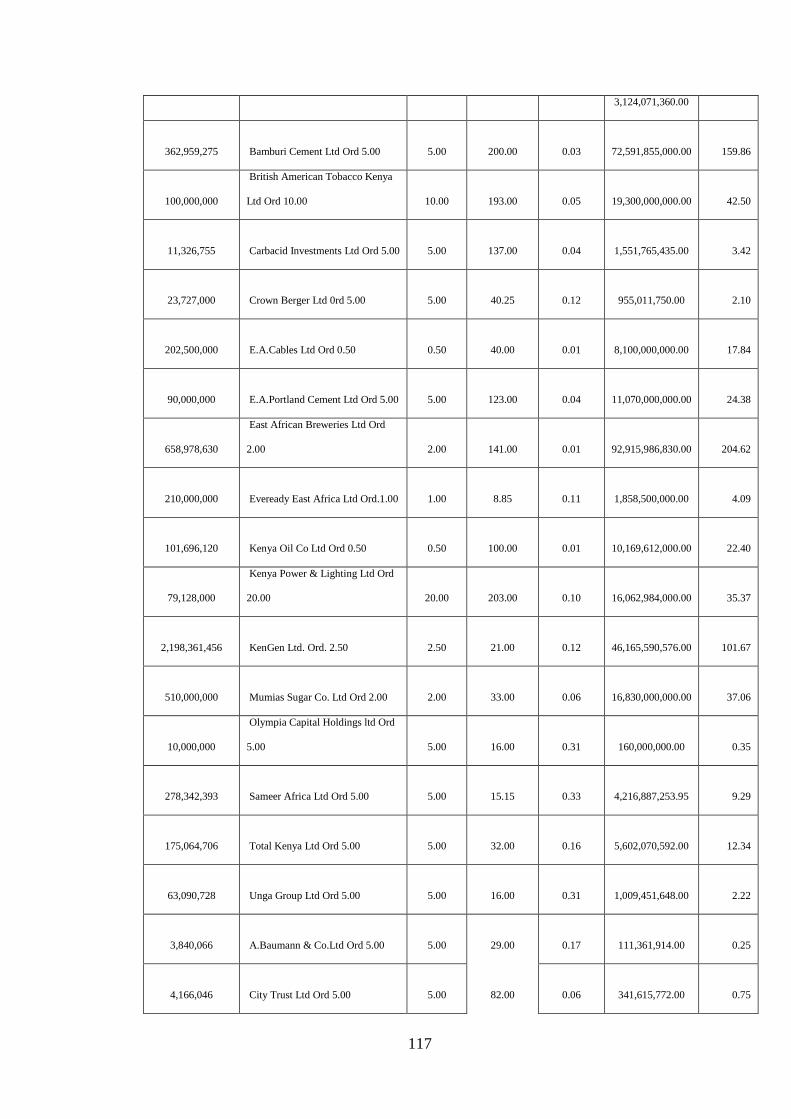
117
3,124,071,360.00
362,959,275 Bamburi Cement Ltd Ord 5.00 5.00 200.00 0.03
72,591,855,000.00 159.86
100,000,000
British American Tobacco Kenya
Ltd Ord 10.00 10.00 193.00 0.05
19,300,000,000.00 42.50
11,326,755 Carbacid Investments Ltd Ord 5.00 5.00 137.00 0.04
1,551,765,435.00 3.42
23,727,000 Crown Berger Ltd 0rd 5.00 5.00 40.25 0.12
955,011,750.00 2.10
202,500,000 E.A.Cables Ltd Ord 0.50 0.50 40.00 0.01
8,100,000,000.00 17.84
90,000,000 E.A.Portland Cement Ltd Ord 5.00 5.00 123.00 0.04
11,070,000,000.00 24.38
658,978,630
East African Breweries Ltd Ord
2.00 2.00 141.00 0.01
92,915,986,830.00 204.62
210,000,000 Eveready East Africa Ltd Ord.1.00 1.00 8.85 0.11
1,858,500,000.00 4.09
101,696,120 Kenya Oil Co Ltd Ord 0.50 0.50 100.00 0.01
10,169,612,000.00 22.40
79,128,000
Kenya Power & Lighting Ltd Ord
20.00 20.00 203.00 0.10
16,062,984,000.00 35.37
2,198,361,456 KenGen Ltd. Ord. 2.50 2.50 21.00 0.12
46,165,590,576.00 101.67
510,000,000 Mumias Sugar Co. Ltd Ord 2.00 2.00 33.00 0.06
16,830,000,000.00 37.06
10,000,000
Olympia Capital Holdings ltd Ord
5.00 5.00 16.00 0.31
160,000,000.00 0.35
278,342,393 Sameer Africa Ltd Ord 5.00 5.00 15.15 0.33
4,216,887,253.95 9.29
175,064,706 Total Kenya Ltd Ord 5.00 5.00 32.00 0.16
5,602,070,592.00 12.34
63,090,728 Unga Group Ltd Ord 5.00 5.00 16.00 0.31
1,009,451,648.00 2.22
3,840,066 A.Baumann & Co.Ltd Ord 5.00 5.00 29.00 0.17
111,361,914.00 0.25
4,166,046 City Trust Ltd Ord 5.00 5.00 82.00 0.06
341,615,772.00 0.75

118
8,039,250 Eaagads Ltd Ord 1.25 1.25 67.00 0.02
538,629,750.00 1.19
35,403,790 Express Ltd Ord 5.00 5.00 22.00 0.23
778,883,380.00 1.72
8,756,320
Williamson Tea Kenya Ltd Ord
5.00 5.00 134.00 0.04
1,173,346,880.00 2.58
3,912,000
Kapchorua Tea Co. Ltd Ord Ord
5.00 5.00 120.00 0.04
469,440,000.00 1.03
12,868,124 Kenya Orchards Ltd Ord 5.00 5.00 5.00 1.00
64,340,620.00 0.14
600,000 Limuru Tea Co. Ltd Ord 20.00 20.00 400.00 0.05
240,000,000.00 0.53
Appendix 11(b)
Computation of KCB Monthly return
Period Share price
Opening
price
( Ksh)
Closing price
( Ksh) Return
( Ksh) %age Return
May 07 25.00 23.25 -1.75 -7.00
June 07 23.00 23.50 0.5 2.17
July 07 23.75 28.25 4.5 18.95
Aug. 07 28.50 27.00 -1.5 -5.26
Sept. 07 26.75 25.50 -1.25 -4.67
Oct. 07 25.50 25.50 0 0.00
Nov. 07 25.25 27.25 2 7.92
Dec. 07 27.25 26.75 -0.5 -1.83
Jan. 08 27.50 25.25 -2.25 -8.18
Feb. 08 25.25 28.00 2.75 10.89
March 08 28.75 26.00 -2.75 -9.57
April 08 26.00 33.25 7.25 27.88
May 08 33.00 32.25 -0.75 -2.27
June 08 32.25 31.00 -1.25 -3.88
July 08 30.75 30.75 0 0.00

119
Aug. 08 30.25 27.00 -3.25 -10.74
Sept. 08 28.00 25.25 -2.75 -9.82
Oct. 08 25.50 19.80 -5.7 -22.35
Nov. 08 21.75 21.00 -0.75 -3.45
Dec. 08 21.00 23.50 2.5 11.90
Jan. 09 23.75 20.50 -3.25 -13.68
Feb. 09 20.00 15.50 -4.5 -22.50
March 09 15.50 19.75 4.25 27.42
April 09 19.40 20.00 0.6 3.093
Appendix 11(c)
Computations of the percentage monthly buy and hold abnormal return: (BHAR):
Kenya Commercial Bank limited
KCB Standard Bank
(Event Firm) (Control Firm)
Month Buy and hold Return % Buy and hold Return % BHAR %
May 07 -7.00 -1.10 -5.90
June 07 2.17 8.52 -6.35
July 07 18.95 -0.53 19.48
Aug. 07 -5.26 1.60 -6.86
Sept. 07 -4.67 -2.07 -2.60
Oct. 07 0.00 -2.13 2.13
Nov. 07 7.92 14.92 -7.00
Dec. 07 -1.83 0.00 -1.83
Jan. 08 -8.18 8.02 -16.20
Feb. 08 10.89 6.47 4.42
March 08 -9.57 -6.57 -2.99
April 08 27.88 3.48 24.40
May 08 -2.27 4.88 -7.15
June 08 -3.88 -2.78 -1.10
July 08 0.00 -5.24 5.24
Aug. 08 -10.74 -4.06 -6.68
Sept. 08 -9.82 -3.19 -6.63

120
Oct. 08 -22.35 -8.84 -13.51
Nov. 08 -3.45 -7.51 4.07
Dec. 08 11.90 0.00 11.90
Jan. 09 -13.68 0.63 -14.31
Feb. 09 -22.50 -12.50 -10.00
March 09 27.42 -0.71 28.13
April 09 3.09 -2.88 5.97
Appendix 12 (a)
ANALYSIS OF NSE FIRMS DATA FOR THE IDENTIFICATION O F SASINI TEA
AND COFEE CONTROL FIRM: Data for 15/2/2007
Shares
outstanding AGRICULTURAL
Par
value
Market
price
BE/ME
Ratio
Market
capitalisation
%age of
Sasini capital
48,875,000 Unilever Tea Kenya Ltd Ord 10.00 10.00 90.00 0.11
4,398,750,000.00 758.87
19,599,999 Kakuzi Ord.5.00 5.00 42.75 0.12
837,899,957.25 144.55
60,000,000
Rea Vipingo Plantations Ltd Ord
5.00 5.00 24.50 0.20
1,470,000,000.00 253.61
38,009,250 Sasini Tea & Coffee Ltd Ord 5.00 5.00 15.25 0.33
579,641,062.50 100.00
COMMERCIAL AND
SERVICES 0.00
22,279,616 Car & General (K) Ltd Ord 5.00 5.00 53.00 0.09
1,180,819,648.00 203.72
48,559,120 CMC Holdings Ltd Ord 5.00 5.00 166.00 0.03
8,060,813,920.00 1390.66
360,000 Hutchings Biemer Ltd Ord 5.00 5.00 20.25 0.25
7,290,000.00 1.26
461,615,484 Kenya Airways Ltd Ord 5.00 5.00 109.00 0.05
50,316,087,756.00 8680.56
14,393,106 Marshalls (E.A.) Ltd Ord 5.00 5.00 29.00 0.17
417,400,074.00 72.01
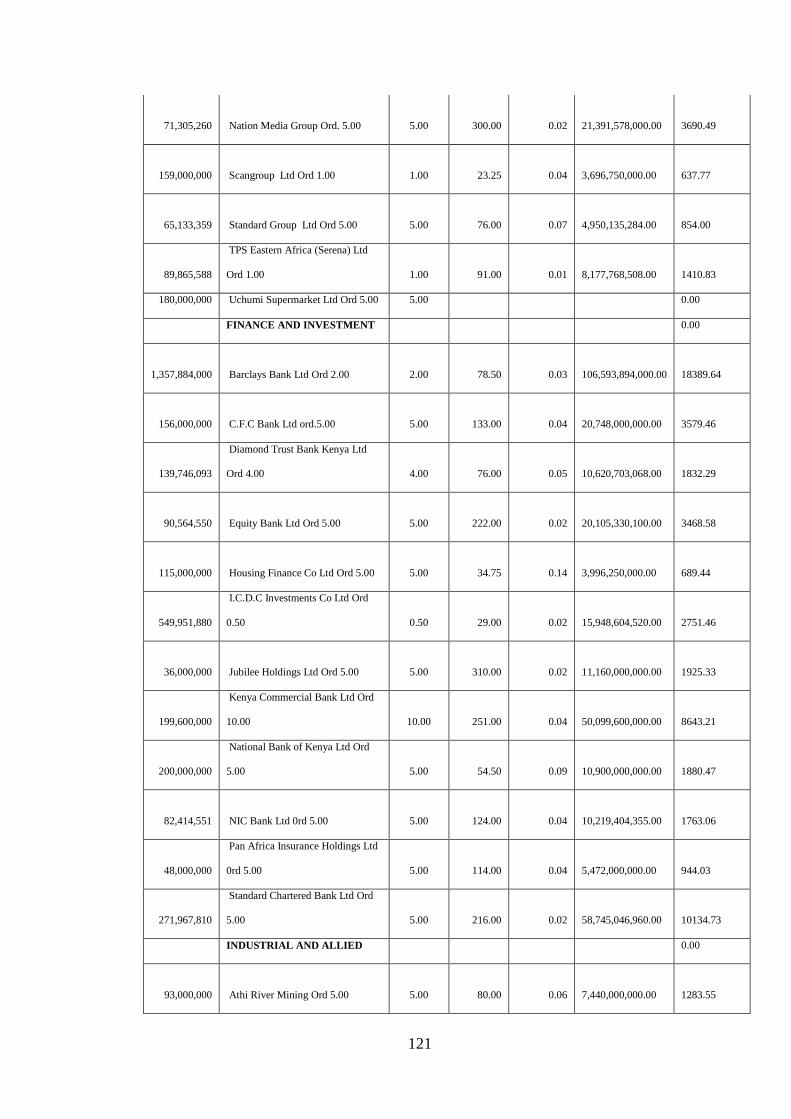
121
71,305,260 Nation Media Group Ord. 5.00 5.00 300.00 0.02
21,391,578,000.00 3690.49
159,000,000 Scangroup Ltd Ord 1.00 1.00 23.25 0.04
3,696,750,000.00 637.77
65,133,359 Standard Group Ltd Ord 5.00 5.00 76.00 0.07
4,950,135,284.00 854.00
89,865,588
TPS Eastern Africa (Serena) Ltd
Ord 1.00 1.00 91.00 0.01
8,177,768,508.00 1410.83
180,000,000 Uchumi Supermarket Ltd Ord 5.00 5.00 0.00
FINANCE AND INVESTMENT 0.00
1,357,884,000 Barclays Bank Ltd Ord 2.00 2.00 78.50 0.03
106,593,894,000.00 18389.64
156,000,000 C.F.C Bank Ltd ord.5.00 5.00 133.00 0.04
20,748,000,000.00 3579.46
139,746,093
Diamond Trust Bank Kenya Ltd
Ord 4.00 4.00 76.00 0.05
10,620,703,068.00 1832.29
90,564,550 Equity Bank Ltd Ord 5.00 5.00 222.00 0.02
20,105,330,100.00 3468.58
115,000,000 Housing Finance Co Ltd Ord 5.00 5.00 34.75 0.14
3,996,250,000.00 689.44
549,951,880
I.C.D.C Investments Co Ltd Ord
0.50 0.50 29.00 0.02
15,948,604,520.00 2751.46
36,000,000 Jubilee Holdings Ltd Ord 5.00 5.00 310.00 0.02
11,160,000,000.00 1925.33
199,600,000
Kenya Commercial Bank Ltd Ord
10.00 10.00 251.00 0.04
50,099,600,000.00 8643.21
200,000,000
National Bank of Kenya Ltd Ord
5.00 5.00 54.50 0.09
10,900,000,000.00 1880.47
82,414,551 NIC Bank Ltd 0rd 5.00 5.00 124.00 0.04
10,219,404,355.00 1763.06
48,000,000
Pan Africa Insurance Holdings Ltd
0rd 5.00 5.00 114.00 0.04
5,472,000,000.00 944.03
271,967,810
Standard Chartered Bank Ltd Ord
5.00 5.00 216.00 0.02
58,745,046,960.00 10134.73
INDUSTRIAL AND ALLIED 0.00
93,000,000 Athi River Mining Ord 5.00 5.00 80.00 0.06
7,440,000,000.00 1283.55
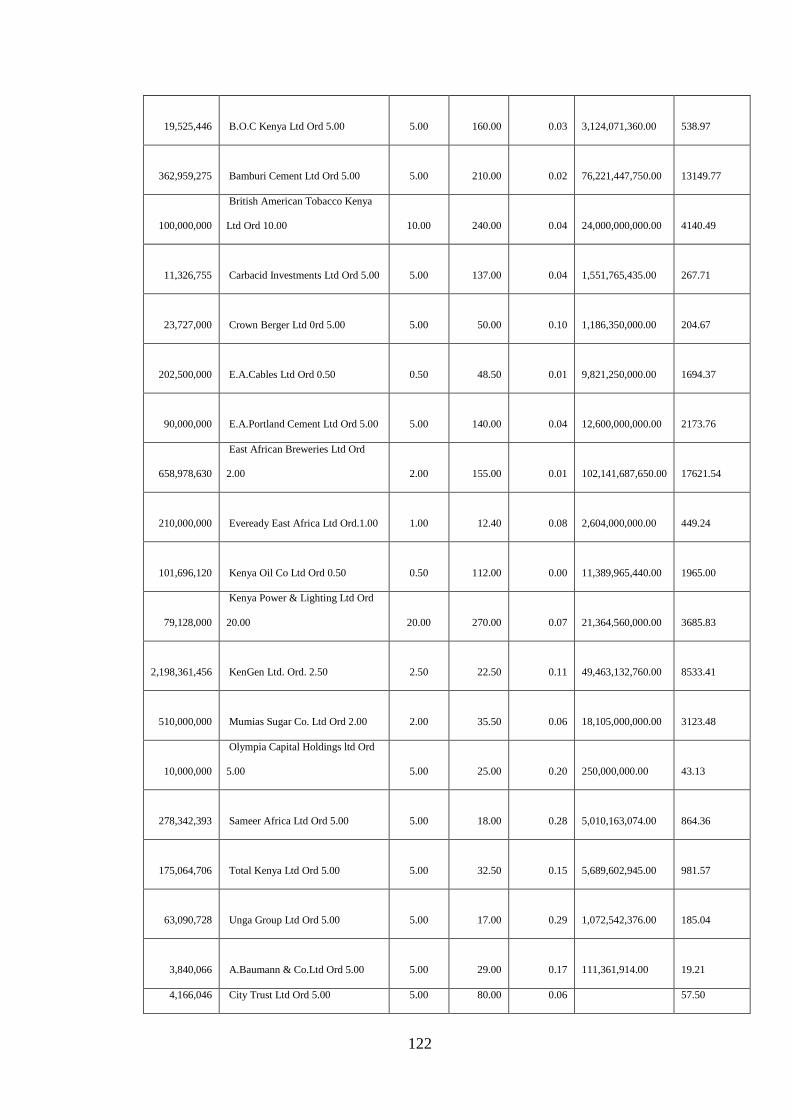
122
19,525,446 B.O.C Kenya Ltd Ord 5.00 5.00 160.00 0.03
3,124,071,360.00 538.97
362,959,275 Bamburi Cement Ltd Ord 5.00 5.00 210.00 0.02
76,221,447,750.00 13149.77
100,000,000
British American Tobacco Kenya
Ltd Ord 10.00 10.00 240.00 0.04
24,000,000,000.00 4140.49
11,326,755 Carbacid Investments Ltd Ord 5.00 5.00 137.00 0.04
1,551,765,435.00 267.71
23,727,000 Crown Berger Ltd 0rd 5.00 5.00 50.00 0.10
1,186,350,000.00 204.67
202,500,000 E.A.Cables Ltd Ord 0.50 0.50 48.50 0.01
9,821,250,000.00 1694.37
90,000,000 E.A.Portland Cement Ltd Ord 5.00 5.00 140.00 0.04
12,600,000,000.00 2173.76
658,978,630
East African Breweries Ltd Ord
2.00 2.00 155.00 0.01
102,141,687,650.00 17621.54
210,000,000 Eveready East Africa Ltd Ord.1.00 1.00 12.40 0.08
2,604,000,000.00 449.24
101,696,120 Kenya Oil Co Ltd Ord 0.50 0.50 112.00 0.00
11,389,965,440.00 1965.00
79,128,000
Kenya Power & Lighting Ltd Ord
20.00 20.00 270.00 0.07
21,364,560,000.00 3685.83
2,198,361,456 KenGen Ltd. Ord. 2.50 2.50 22.50 0.11
49,463,132,760.00 8533.41
510,000,000 Mumias Sugar Co. Ltd Ord 2.00 2.00 35.50 0.06
18,105,000,000.00 3123.48
10,000,000
Olympia Capital Holdings ltd Ord
5.00 5.00 25.00 0.20
250,000,000.00 43.13
278,342,393 Sameer Africa Ltd Ord 5.00 5.00 18.00 0.28
5,010,163,074.00 864.36
175,064,706 Total Kenya Ltd Ord 5.00 5.00 32.50 0.15
5,689,602,945.00 981.57
63,090,728 Unga Group Ltd Ord 5.00 5.00 17.00 0.29
1,072,542,376.00 185.04
3,840,066 A.Baumann & Co.Ltd Ord 5.00 5.00 29.00 0.17
111,361,914.00 19.21
4,166,046 City Trust Ltd Ord 5.00 5.00 80.00 0.06 57.50

123
333,283,680.00
8,039,250 Eaagads Ltd Ord 1.25 1.25 66.00 0.02
530,590,500.00 91.54
35,403,790 Express Ltd Ord 5.00 5.00 26.00 0.19
920,498,540.00 158.80
8,756,320
Williamson Tea Kenya Ltd Ord
5.00 5.00 145.00 0.03
1,269,666,400.00 219.04
3,912,000
Kapchorua Tea Co. Ltd Ord Ord
5.00 5.00 120.00 0.04
469,440,000.00 80.99
12,868,124 Kenya Orchards Ltd Ord 5.00 5.00 5.00 1.00
64,340,620.00 11.10
600,000 Limuru Tea Co. Ltd Ord 20.00 20.00 350.00 0.06
210,000,000.00 36.23
Appendix 12(b)
Computation of Sasini Tea and coffee Monthly return
Period Share price
Opening price
( Ksh)
Closing price
(Ksh)
Return
( Ksh) %age Return
March 07 20.25 18.30 -1.95 -9.63
April 07 19.10 19.10 0 0.00
May 07 19.85 17.95 -1.9 -9.57
June 07 17.95 18.70 0.75 4.18
July 07 18.30 18.60 0.3 1.64
Aug. 07 19.70 18.40 -1.3 -6.60
Sept. 07 18.95 17.50 -1.45 -7.65
Oct. 07 17.60 16.35 -1.25 -7.10
Nov. 07 16.40 17.40 1 6.10
Dec. 07 17.65 18.00 0.35 1.98
Jan. 08 17.05 13.10 -3.95 -23.17
Feb. 08 14.00 14.90 0.9 6.43
March 08 15.05 13.85 -1.2 -7.97

124
April 08 13.80 16.40 2.6 18.84
May 08 16.20 14.00 -2.2 -13.58
June 08 14.10 14.20 0.1 0.71
July 08 14.55 12.95 -1.6 -11.00
Aug. 08 12.65 11.70 -0.95 -7.51
Sept. 08 11.50 7.75 -3.75 -32.61
Oct. 08 8.00 7.65 -0.35 -4.38
Nov. 08 8.35 6.10 -2.25 -26.95
Dec. 08 6.15 7.00 0.85 13.82
Jan.09 7.60 5.90 -1.7 -22.37
Feb. 09 6.25 4.40 -1.85 -29.6
Appendix 12(c)
Computations of the percentage monthly buy and hold abnormal return: (BHAR):
Sasini Tea and coffee Limited
Sasini Tea and coffee Ltd Kapchorua Tea Co. Ltd
(Event Firm) (Control Firm)
Month Buy and hold Return % Buy and hold Return % BHAR %
March 07 -9.63 -11.72 2.09
April 07 0.00 7.14 -7.14
May 07 -9.57 -6.67 -2.91
June 07 4.18 0.00 4.18
July 07 1.64 2.83 -1.19
Aug. 07 -6.60 -16.97 10.37
Sept. 07 -7.65 1.66 -9.31
Oct. 07 -7.10 -5.26 -1.84
Nov. 07 6.10 0.00 6.10
Dec. 07 1.98 0.00 1.98
Jan. 08 -23.17 0.00 -23.17
Feb. 08 6.43 -2.78 9.21
March 08 -7.97 -14.29 6.31
April 08 18.84 5.56 13.29
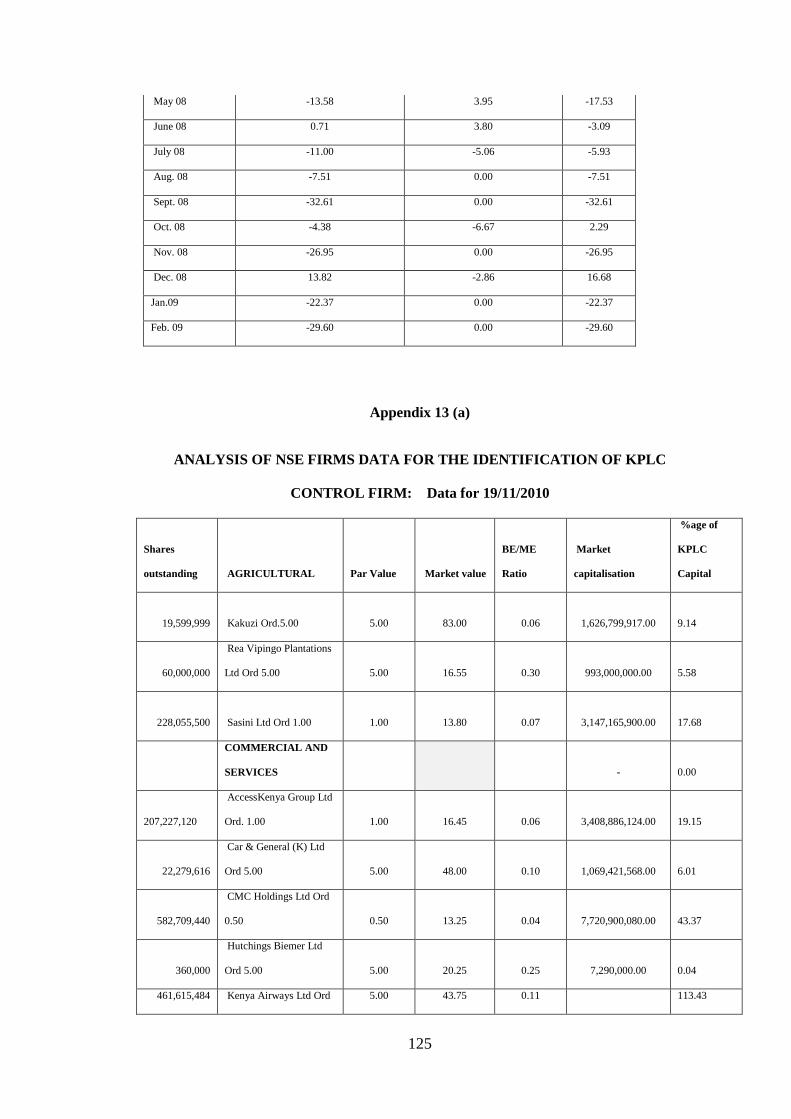
125
May 08 -13.58 3.95 -17.53
June 08 0.71 3.80 -3.09
July 08 -11.00 -5.06 -5.93
Aug. 08 -7.51 0.00 -7.51
Sept. 08 -32.61 0.00 -32.61
Oct. 08 -4.38 -6.67 2.29
Nov. 08 -26.95 0.00 -26.95
Dec. 08 13.82 -2.86 16.68
Jan.09 -22.37 0.00 -22.37
Feb. 09 -29.60 0.00 -29.60
Appendix 13 (a)
ANALYSIS OF NSE FIRMS DATA FOR THE IDENTIFICATION O F KPLC
CONTROL FIRM: Data for 19/11/2010
Shares
outstanding AGRICULTURAL Par Value Market value
BE/ME
Ratio
Market
capitalisation
%age of
KPLC
Capital
19,599,999 Kakuzi Ord.5.00 5.00 83.00 0.06
1,626,799,917.00 9.14
60,000,000
Rea Vipingo Plantations
Ltd Ord 5.00 5.00 16.55 0.30
993,000,000.00 5.58
228,055,500 Sasini Ltd Ord 1.00 1.00 13.80 0.07
3,147,165,900.00 17.68
COMMERCIAL AND
SERVICES
- 0.00
207,227,120
AccessKenya Group Ltd
Ord. 1.00 1.00 16.45 0.06
3,408,886,124.00 19.15
22,279,616
Car & General (K) Ltd
Ord 5.00 5.00 48.00 0.10
1,069,421,568.00 6.01
582,709,440
CMC Holdings Ltd Ord
0.50 0.50 13.25 0.04
7,720,900,080.00 43.37
360,000
Hutchings Biemer Ltd
Ord 5.00 5.00 20.25 0.25
7,290,000.00 0.04
461,615,484 Kenya Airways Ltd Ord 5.00 43.75 0.11 113.43
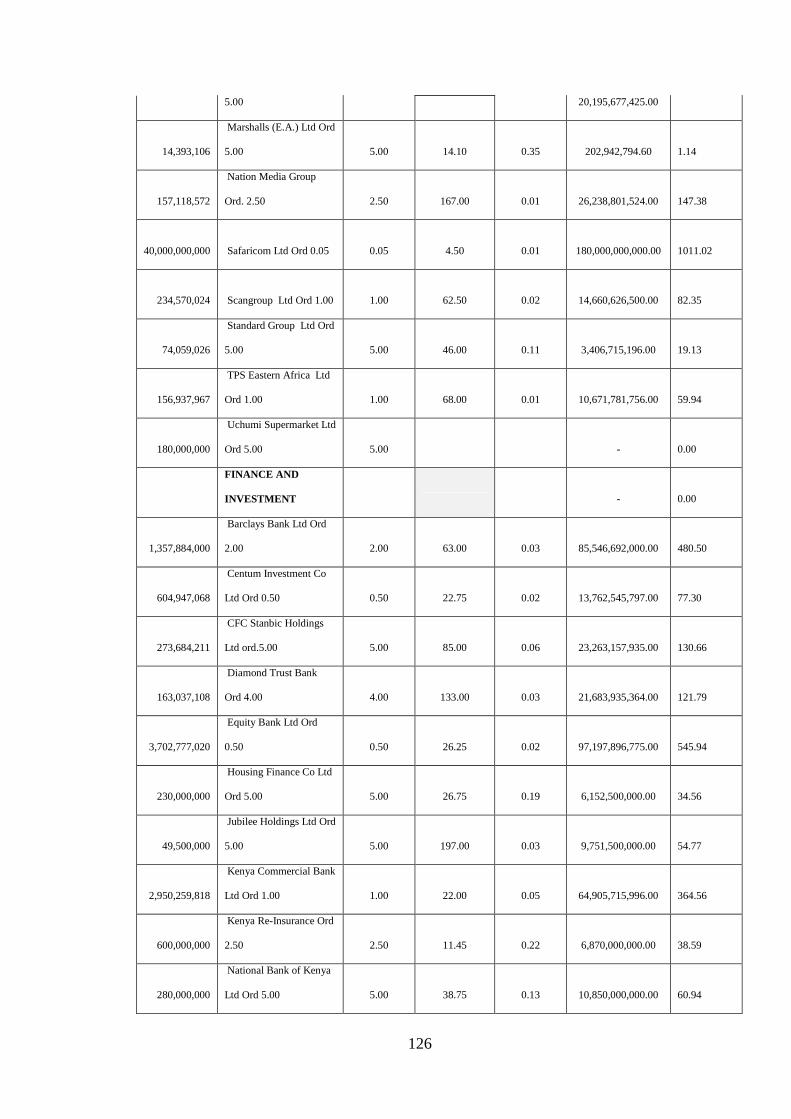
126
5.00 20,195,677,425.00
14,393,106
Marshalls (E.A.) Ltd Ord
5.00 5.00 14.10 0.35
202,942,794.60 1.14
157,118,572
Nation Media Group
Ord. 2.50 2.50 167.00 0.01
26,238,801,524.00 147.38
40,000,000,000 Safaricom Ltd Ord 0.05 0.05 4.50 0.01
180,000,000,000.00 1011.02
234,570,024 Scangroup Ltd Ord 1.00 1.00 62.50 0.02
14,660,626,500.00 82.35
74,059,026
Standard Group Ltd Ord
5.00 5.00 46.00 0.11
3,406,715,196.00 19.13
156,937,967
TPS Eastern Africa Ltd
Ord 1.00 1.00 68.00 0.01
10,671,781,756.00 59.94
180,000,000
Uchumi Supermarket Ltd
Ord 5.00 5.00
- 0.00
FINANCE AND
INVESTMENT
- 0.00
1,357,884,000
Barclays Bank Ltd Ord
2.00 2.00 63.00 0.03
85,546,692,000.00 480.50
604,947,068
Centum Investment Co
Ltd Ord 0.50 0.50 22.75 0.02
13,762,545,797.00 77.30
273,684,211
CFC Stanbic Holdings
Ltd ord.5.00 5.00 85.00 0.06
23,263,157,935.00 130.66
163,037,108
Diamond Trust Bank
Ord 4.00 4.00 133.00 0.03
21,683,935,364.00 121.79
3,702,777,020
Equity Bank Ltd Ord
0.50 0.50 26.25 0.02
97,197,896,775.00 545.94
230,000,000
Housing Finance Co Ltd
Ord 5.00 5.00 26.75 0.19
6,152,500,000.00 34.56
49,500,000
Jubilee Holdings Ltd Ord
5.00 5.00 197.00 0.03
9,751,500,000.00 54.77
2,950,259,818
Kenya Commercial Bank
Ltd Ord 1.00 1.00 22.00 0.05
64,905,715,996.00 364.56
600,000,000
Kenya Re-Insurance Ord
2.50 2.50 11.45 0.22
6,870,000,000.00 38.59
280,000,000
National Bank of Kenya
Ltd Ord 5.00 5.00 38.75 0.13
10,850,000,000.00 60.94

127
358,997,784 NIC Bank Ltd 0rd 5.00 5.00 48.00 0.10
17,231,893,632.00 96.79
40,000,000
Olympia Capital
Holdings ltd Ord 5.00 5.00 6.60 0.76
264,000,000.00 1.48
48,000,000
Pan Africa Insurance
Holdings 0rd 5.00 5.00 70.00 0.07
3,360,000,000.00 18.87
287,077,133
Standard Chartered Bank
Ltd Ord 5.00
5.00
274.00
0.02
78,659,134,442.00
441.81
3,492,369,900
The Co-operative Bank
Ord 1.00 1.00 19.95 0.05
69,672,779,505.00 391.34
INDUSTRIAL AND
ALLIED
- 0.00
99,055,000
Athi River Mining Ord
5.00 5.00 175.00 0.03
17,334,625,000.00 97.36
19,525,446
B.O.C Kenya Ltd Ord
5.00 5.00 140.00 0.04
2,733,562,440.00 15.35
362,959,275
Bamburi Cement Ltd
Ord 5.00 5.00 196.00 0.03
71,140,017,900.00 399.58
100,000,000
British American
Tobacco Ord 10.00 10.00 288.00 0.03
28,800,000,000.00 161.76
33,980,265
Carbacid Investments
Ltd Ord 5.00 5.00 150.00 0.03
5,097,039,750.00 28.63
23,727,000
Crown Berger Ltd 0rd
5.00 5.00 35.00 0.14
830,445,000.00 4.66
202,500,000 E.A.Cables Ltd Ord 0.50 0.50 17.90 0.03
3,624,750,000.00 20.36
90,000,000
E.A.Portland Cement Ltd
Ord 5.00 5.00 105.00 0.05
9,450,000,000.00 53.08
790,774,356
East African Breweries
Ltd Ord 2.00 2.00 225.00 0.01
177,924,230,100.00 999.36
210,000,000
Eveready East Africa Ltd
Ord.1.00 1.00 3.10 0.32
651,000,000.00 3.66
2,198,361,456 KenGen Ltd Ord. 2.50 2.50 17.65 0.14
38,801,079,698.40 217.94
1,471,761,200 KenolKobil Ltd Ord 0.05 0.05 10.45 0.00
15,379,904,540.00 86.39
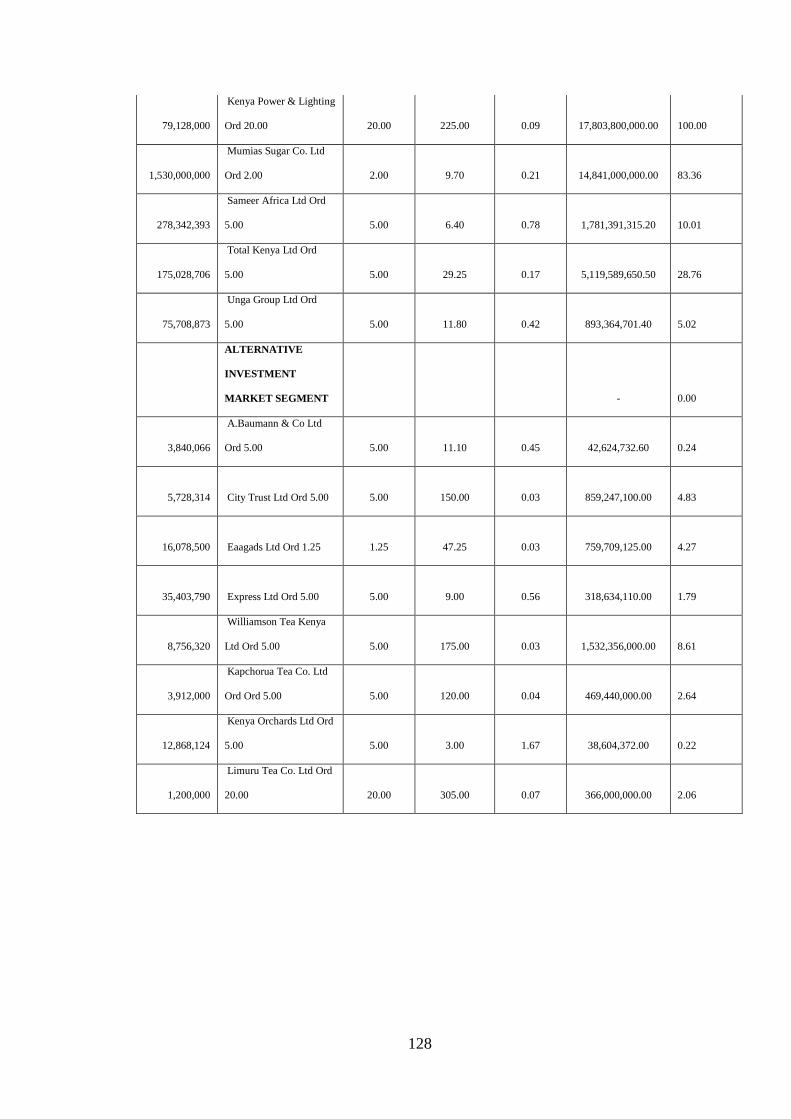
128
79,128,000
Kenya Power & Lighting
Ord 20.00 20.00 225.00 0.09
17,803,800,000.00 100.00
1,530,000,000
Mumias Sugar Co. Ltd
Ord 2.00 2.00 9.70 0.21
14,841,000,000.00 83.36
278,342,393
Sameer Africa Ltd Ord
5.00 5.00 6.40 0.78
1,781,391,315.20 10.01
175,028,706
Total Kenya Ltd Ord
5.00 5.00 29.25 0.17
5,119,589,650.50 28.76
75,708,873
Unga Group Ltd Ord
5.00 5.00 11.80 0.42
893,364,701.40 5.02
ALTERNATIVE
INVESTMENT
MARKET SEGMENT
- 0.00
3,840,066
A.Baumann & Co Ltd
Ord 5.00 5.00 11.10 0.45
42,624,732.60 0.24
5,728,314 City Trust Ltd Ord 5.00 5.00 150.00 0.03
859,247,100.00 4.83
16,078,500 Eaagads Ltd Ord 1.25 1.25 47.25 0.03
759,709,125.00 4.27
35,403,790 Express Ltd Ord 5.00 5.00 9.00 0.56
318,634,110.00 1.79
8,756,320
Williamson Tea Kenya
Ltd Ord 5.00 5.00 175.00 0.03
1,532,356,000.00 8.61
3,912,000
Kapchorua Tea Co. Ltd
Ord Ord 5.00 5.00 120.00 0.04
469,440,000.00 2.64
12,868,124
Kenya Orchards Ltd Ord
5.00 5.00 3.00 1.67
38,604,372.00 0.22
1,200,000
Limuru Tea Co. Ltd Ord
20.00 20.00 305.00 0.07
366,000,000.00 2.06
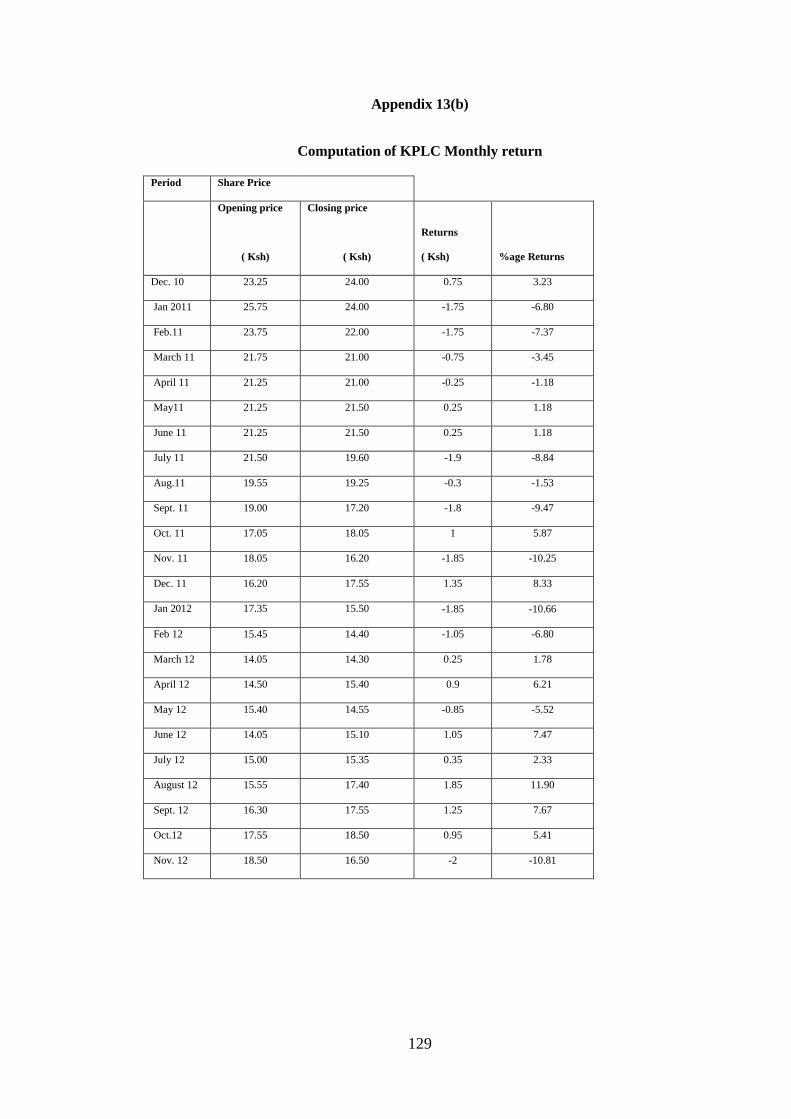
129
Appendix 13(b)
Computation of KPLC Monthly return
Period Share Price
Opening price
( Ksh)
Closing price
( Ksh)
Returns
( Ksh) %age Returns
Dec. 10 23.25 24.00 0.75 3.23
Jan 2011 25.75 24.00 -1.75 -6.80
Feb.11 23.75 22.00 -1.75 -7.37
March 11 21.75 21.00 -0.75 -3.45
April 11 21.25 21.00 -0.25 -1.18
May11 21.25 21.50 0.25 1.18
June 11 21.25 21.50 0.25 1.18
July 11 21.50 19.60 -1.9 -8.84
Aug.11 19.55 19.25 -0.3 -1.53
Sept. 11 19.00 17.20 -1.8 -9.47
Oct. 11 17.05 18.05 1 5.87
Nov. 11 18.05 16.20 -1.85 -10.25
Dec. 11 16.20 17.55 1.35 8.33
Jan 2012 17.35 15.50 -1.85 -10.66
Feb 12 15.45 14.40 -1.05 -6.80
March 12 14.05 14.30 0.25 1.78
April 12 14.50 15.40 0.9 6.21
May 12 15.40 14.55 -0.85 -5.52
June 12 14.05 15.10 1.05 7.47
July 12 15.00 15.35 0.35 2.33
August 12 15.55 17.40 1.85 11.90
Sept. 12 16.30 17.55 1.25 7.67
Oct.12 17.55 18.50 0.95 5.41
Nov. 12 18.50 16.50 -2 -10.81
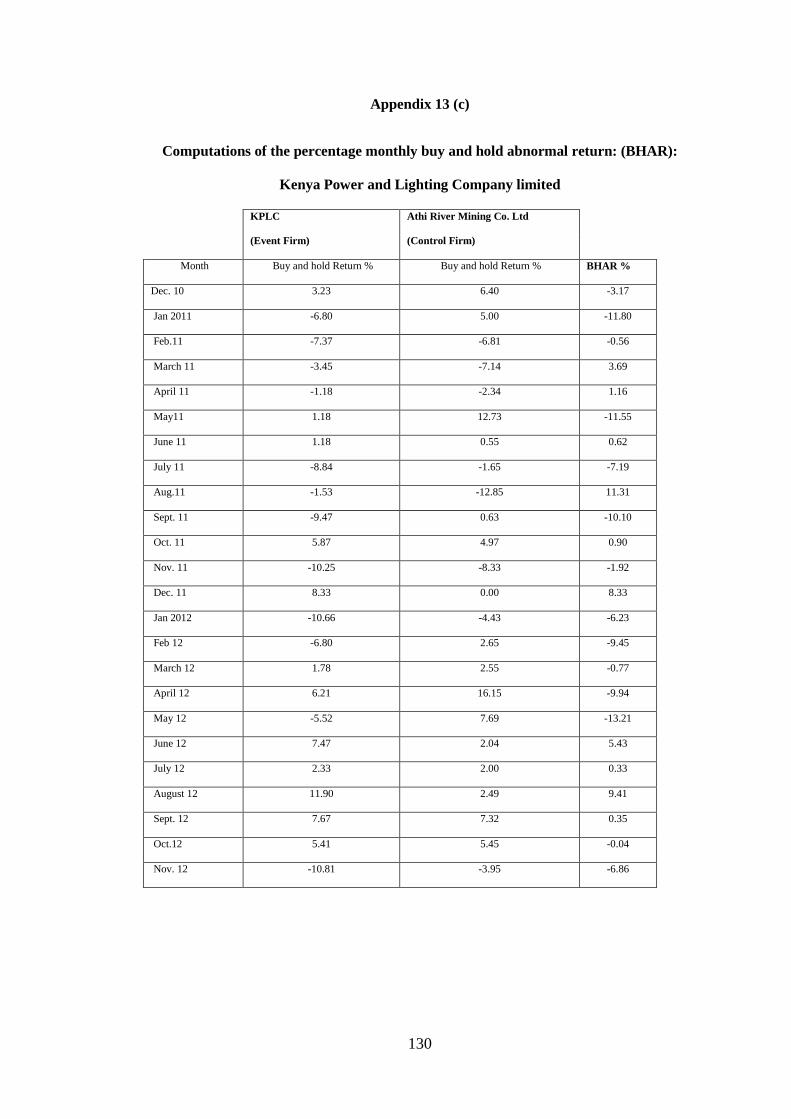
130
Appendix 13 (c)
Computations of the percentage monthly buy and hold abnormal return: (BHAR):
Kenya Power and Lighting Company limited
KPLC Athi River Mining Co. Ltd
(Event Firm) (Control Firm)
Month Buy and hold Return % Buy and hold Return % BHAR %
Dec. 10 3.23 6.40 -3.17
Jan 2011 -6.80 5.00 -11.80
Feb.11 -7.37 -6.81 -0.56
March 11 -3.45 -7.14 3.69
April 11 -1.18 -2.34 1.16
May11 1.18 12.73 -11.55
June 11 1.18 0.55 0.62
July 11 -8.84 -1.65 -7.19
Aug.11 -1.53 -12.85 11.31
Sept. 11 -9.47 0.63 -10.10
Oct. 11 5.87 4.97 0.90
Nov. 11 -10.25 -8.33 -1.92
Dec. 11 8.33 0.00 8.33
Jan 2012 -10.66 -4.43 -6.23
Feb 12 -6.80 2.65 -9.45
March 12 1.78 2.55 -0.77
April 12 6.21 16.15 -9.94
May 12 -5.52 7.69 -13.21
June 12 7.47 2.04 5.43
July 12 2.33 2.00 0.33
August 12 11.90 2.49 9.41
Sept. 12 7.67 7.32 0.35
Oct.12 5.41 5.45 -0.04
Nov. 12 -10.81 -3.95 -6.86