Embed Size (px)
Citation preview
Brirish Journul of Nutrition (1987), 51, 139-155 139
The effects of severe zinc deficiency on protein turnover in muscle and thymus
B Y R. G I U G L I A N O A N D D. J. M I L L W A R D * Nutrition Research Unit, Department of Hunian Nutrition, London School of Hygiene and
Tropical Medicine, 4 St Pancras Way, London NW1 2PE
(Received 29 May 1986 - Accepted 9 September 1986)
1. Measurements have been made of protein turnover, RNA and DNA in thymus and skeletal muscle from rats fed on a zinc-deficient diet (ZD) for 10 and 17 d, in pair-fed controls (CI) and in muscle from rats fed on the ZD diet for 24 d and then fed on restricted amounts of the deficient diet with (RIZS) or without (RIZD) Zn supplementation, for 8 d.
2. In thymus the ZD diet induced a loss of DNA and protein which was not observed with the CI rats. Accumulation of RNA was less affected but protein synthesis was reduced.
3. In muscle the accumulation ofDNA and protein was slowed by the ZD diet, particularly in glycolytic muscles compared with oxidative muscles, and Zn supplementation increased DNA and protein.
4. Protein synthesis and RNA concentrations were reduced in the ZD rats compared with the CI rats, but Zn supplementation at constant restricted food intake did not increase protein synthesis. Muscle protein synthesis per unit RNA varied markedly in the ZD rats after 10 d when the characteristic cycling of the food intakes and body-weight was most pronounced, the highest values being observed in the anabolic phase of the cycle although these were less than values for well-fed controls. The variability was inversely correlated with the plasma Zn levels. The extent of the variability was much less after 17 d and was not apparent in the food-restricted ZD animals.
5. Protein degradation in muscle, assessed as the difference between overall and net protein synthesis, was faster in the ZD rats compared with the CI rats and fluctuated considerably, partly accounting for the cyclic changes in muscle after 10 d, and was entirely responsible after 17 d. The concentration of muscle-free 3-methylhistidine and its urinary excretion rate indicated inconsistent results which could not be satisfactorily interpreted.
6 . Plasma insulin was reduced in the ZD rats compared with the CI rats and was insensitive to food intake in contrast to urinary corticosterone excretion which was inversely correlated with the cyclic changes in body-weight and food intake. Furthermore, adrenalectomized rats exhibited increased mortality and reduced cycling of body-weight and food intake.
7. Thus Zn deficiency impairs growth by a combination of (a) reduced food intake, (b) a reduced anabolic response to food due to a reduced capacity for protein synthesis and reduced activation of protein synthesis, possibly reflecting impaired insulin secretion, and (c) an increased catabolic response to the reduced intake in which corticosterone may play a role.
All tissues contain many zinc-metalloproteins involved in a wide range of functions and adequate dietary Zn is required for optimum growth and development (Underwood, 1977; Prasad, 1978). What is not clear is the extent to which dietary Zn directly influences tissue growth. Part of the growth failure associated with Zn deficiency involves severe anorexia (Todd et al. 1934), which will inhibit growth, and disturb protein synthesis and degradation in tissues such as skeletal muscle (Millward & Waterlow, 1978). This dietary response is complex with cyclical changes in food intake, body-weight (Mills et al. 1969; Wallwork et al. 1981) and muscle mass (Giugliano & Millward, 1984). While the close correlation of these cyclical changes in tissue mass with the changes in food intake indicate the importance of the Zn-induced changes in appetite in the growth failure, a specific independent effect of Zn deficiency on growth inhibition has been demonstrated (Giugliano & Millward, 1984). The nature of the role of Zn in this regulation of growth and tissue protein balance has not been defined.
A role for Zn in protein metabolism might be expected given the importance of Zn-metalloenzymes in nucleic acid metabolism (Vallee & Falchuk, 198 1). Also a regulatory
* For reprints.
Dow
nloaded from https://w
ww
.cambridge.org/core . IP address: 65.21.228.167 , on 31 Jan 2022 at 00:27:35 , subject to the Cam
bridge Core terms of use, available at https://w
ww
.cambridge.org/core/term
s . https://doi.org/10.1079/BJN19870017
140 R. G I U G L I A N O A N D D. J. M I L L W A R D role for Zn in the degradation of nucleic acids (Prasad & Oberleas, 1973) and protein (Chvapil et al. 1976) has been proposed, although not confirmed by others (Chesters & Will, 1978; Dreosti & Record, 1978). However, the overall Zn concentration of muscle does not fall during Zn deficiency (O’Leary et al. 1979; Giugliano & Millward, 1984) and in any case the relative concentration of Zn in muscle reflects the presence of Zn-metalloenzymes many of which (e.g. carbonate dehydratase; EC 4.2.1.1) are not directly involved in protein metabolism. Thus there is no clear indication of the extent to which Zn deficiency might directly affect protein metabolism in muscle, although there are several reports of reduced rates of amino acid incorporation into tissue proteins (see Wallwork & Duerre, 1985). We have therefore attempted to determine the mechanism of the growth failure and cyclic changes in muscle protein content in the severely Zn-deficient rat and to identify any changes in protein synthesis and degradation which might reflect the Zn deficiency specifically rather than the marked alterations in food intake. We have also examined the changes in protein metabolism in thymus since although the Zn content of this tissue is maintained in Zn deficiency (Giugliano & Millward, 1984) its mass appears to be directly affected by the Zn deficiency.
M A T E R I A L S A N D M E T H O D S
Diet composition, animals and experimental design The experiments involved male Sprague-Dawley outbred rats (Charles River UK Ltd, Margate, Kent), 25 d old, initial mean weight 60 g. The diet was based on egg albumin (at 180 g/kg) containing either 0.4p.g Zn/g (Zn-deficient (ZD) diet) or about 55 pg Zn/g (Zn-supplemented control diet) ; full details of the diet composition and preparation, animal housing and experimental design are described by Giugliano & Millward (1984).
The measurements described here were made during three experiments, and for the first two some of the results (i.e. the characteristics of Zn homeostasis) were previously described (as Expt 2,Zn-depletion and Expt 4,Zn-depletion-repletion ; Giugliano & Millward, 1984). Expt 1 involved thirty-eight rats separated into five groups: a base-line group (BL, n 6); two groups fed on the ZD diet ad lib. for 10 d (ZD 10, n 6) or 17 d (ZD 17, n 13) ; and two groups fed on the Zn-supplemented control diet in restricted amounts equal to the previously measured intake of Zn-deficient rats (6 g/d) for 10 d (CIIO, n 6) or 17 d (CI17, n 7). Expt 2 involved Zn-repletion of Zn-deficient rats, the Zn-repletion being achieved at a restricted intake (5 g/d equal to about 0.16 g/g b o d y - ~ e i g h t ~ . ~ ~ ) . Eight rats were fed on the Zn-deficient diet for 24 d and were then divided into two groups: RIZD fed on the restricted amount of the Zn-deficient diet and RIZS fed on the same restricted amount of the Zn-supplemented diet for 8 d. In each of these experiments measurements were made of muscle and thymus (Expt 1) protein turnover and composition, as well as insulin and corticosterone status. Expt 3 (not previously described) investigated the effect of adrenalectomy on the response to the ZD diet in terms of the cyclic changes in body-weight growth and food intake. Twelve rats (mean weight 60 g) were divided into two groups of six, one group was adrenalectomized and both groups were then fed on the ZD diet for 18 d with measurements of daily food intake and growth rate.
Rats were killed between 08.00 and 11.00 hours with blood collection and tissue removal (gastrocnemius, plantaris and soleus muscles, and thymus) as previously described (Giugliano & Millward, 1984).
Protein synthesis This was measured in skeletal muscle and thymus using the flooding-dose phenylalanine method (Garlick et al. 1980). [3H]phenylalanine was injected into a tail vein (150 mM,
Dow
nloaded from https://w
ww
.cambridge.org/core . IP address: 65.21.228.167 , on 31 Jan 2022 at 00:27:35 , subject to the Cam
bridge Core terms of use, available at https://w
ww
.cambridge.org/core/term
s . https://doi.org/10.1079/BJN19870017
Zinc deficiency and muscle protein turnover 141
50 pCi/ml; 1500 pmollkg body-weight) and the rats killed after 10 min. The rate of protein synthesis was calculated from the specific radioactivity of the protein-bound and free phenylalanine (the latter value calculated as mean value of the injection solution and tissue value).
Protein degradation The primary determination of the rate of degradation involved calculation from the synthesis rate and change in muscle protein mass as previously described (Millward et al. 1975). In these rats, muscle-mass change could be estimated from body-weight change since the muscle-mass : body-weight value is constant throughout the cycling (Giugliano & Millward, 1984). The calculation of degradation assumes that the rate of protein synthesis measured over 10 min is similar to the average rate for the 24 h period over which time the growth rate is measured. To examine this we compared the results obtained with the flooding dose over 10 min with those obtained during a 6 h infusion with ~-[UJ~C]tyrosine (Garlick et al. 1973) into a tail vein (Millward et al. 1975). Both methods were applied to a group of rats (mean weight 60 g) and measurements made in muscle and thymus, with calculations of protein synthesis based on intracellular and extracellular pools.
We also made measurements of the concentration of 3-methylhistidine (3MH) in the muscle free pool as well as the 24 h urinary 3MH excretion (Young & Munro, 1978). The use of skeletal muscle free 3MH concentration as an indicator of muscle myofibrillar protein degradation reflects earlier work (Rennie et al. 1981) which suggested that accumulation of free 3MH in muscle is a reliable qualitative index of the rate of myofibrillar protein degradation at the time of death which therefore could be directly comparable with the measured synthesis rate.
Analytical methods Bovine serum albumin, calf thymus DNA, L-tyrosine decarboxylase (EC 4.1 . 1 .25), fluorescamine, P-phenylethylamine, 3-methylhistidine, leucylalanine and corticosterone were obtained from Sigma Chemical Co. (Poole, Dorset); human insulin standards and porcine insulin antibody were obtained from Wellcome Reagents Ltd (Beckenham, Kent) ; combined human plasma (for corticosterone assay) was obtained from the Regional Transfusion Centre (Edgeware, Middlesex). The radioactive compounds, ~-[4-~H]phenyl- alanine, lz5I-iodinated insulin and [ 1, 2, 3, 6, 7-3H]corticosterone, were obtained from Amersham International plc (Amersham, Bucks). All other chemicals were obtained from British Drug Houses (Poole, Dorset).
Tissue protein, RNA and DNA were measured as described previously (Millward et al. 1974) in a tissue homogenate prepared immediately before the analysis by pulverizing the frozen tissue between two aluminium blocks pre-cooled in solid carbon dioxide. In order to compare the RNA concentration with the fractional rate of protein synthesis, the RNA was expressed as RNA:protein value. The specific radioactivity of tissue free and protein-bound phenylalanine was measured and the rate of protein synthesis was calculated from these values as described by Garlick et al. (1980).
The concentration of 3MH was measured in muscle and plasma extracts and in urine after being hydrolysed overnight with 6 M-hydrochloric acid at 110" by a reverse-phase chromatographic method as described previously (Millward & Bates, 1983). Free 3MH concentration in muscle and plasma was expressed as nmol/g wet tissue or nmol/ml, and as pmo1/24 h per kg body-weight in urine.
Plasma insulin concentration was measured by coated-charcoal immunoassay (Herbert et al. 1965) using 1251-labelled insulin, commercially calibrated insulin standards and porcine insulin antibody.
Dow
nloaded from https://w
ww
.cambridge.org/core . IP address: 65.21.228.167 , on 31 Jan 2022 at 00:27:35 , subject to the Cam
bridge Core terms of use, available at https://w
ww
.cambridge.org/core/term
s . https://doi.org/10.1079/BJN19870017
142 R. GIUGLIANO A N D D. J. M I L L W A R D Urine corticosteroids were extracted in dichloromethane and measured by a competitive
protein binding assay modified from the method of Few & Cashmore (1971), using dextran-coated charcoal as absorbent for unbound corticosteroids (Kley et al. 1976). Urine was collected over 24 h in 1 ml Hibitane (20 ml/l) and HCl(500 ml/l), and stored at -20" until analysis. Corticosteroids were extracted in dichloromethane which included an alkaline wash (0.1 M-NaOH). The organic extracts were evaporated to dryness at 50". Corticosteroids were redissolved in 1.5 ml ethanol (20 ml/lksaline (9 g sodium chloride/l). Corticosterone standards (0-1 5 ng/ml in ethanol-saline), quality control (pooled rat urine) and samples were assayed in duplicate. Samples (0.5 ml) were mixed with 0.5 ml binding reagent containing human plasma (20 ml/l) and 0.1 yCi [3H]corticosterone/ml in distilled water, incubated at 45" for 10 min, and cooled on ice. Dextran coated-charcoal (0.5 ml; 20 g charcoal, 2 g dextran and 6 g gelatine/l borate buffer (boric acid (8.25 g/l), NaOH (2.7 g/l), pH 8.0)) was added, mixed and centrifuged all within 20 min of addition of charcoal to the first tube. Portions (1 ml) of the supernatant fraction were removed for counting. To account for non-specific binding, three portions of urine (0.25,0.5 and 1 ml) were made up to 4 ml with distilled water and analysed. Non-specific binding was calculated as the x intercept in a linear regression of measured corticosteroids on urine volume, and subtracted from the total measured values.
Urinary excretion was expressed as pg corticosteroid/24 h per kg body-weight. All results are given as means and 1 SE with significance between means (generally only
assessed between Zn-deficient and the appropriate pair-fed control groups) assessed by Student's t test (Bailey, 1981) and with P < 0.05 considered to be significant.
RESULTS
The characteristics of Zn deficiency, Zn homeostasis, and tissue and whole-body growth in the first two of'these experiments is described in a previous paper (Giugliano & Millward, 1984). Since the objective of these experiments was to assess any effect of Zn deficiency in addition to changes reflecting reduced food intake, comparisons are made primarily with the appropriate food-restricted Zn-supplemented controls.
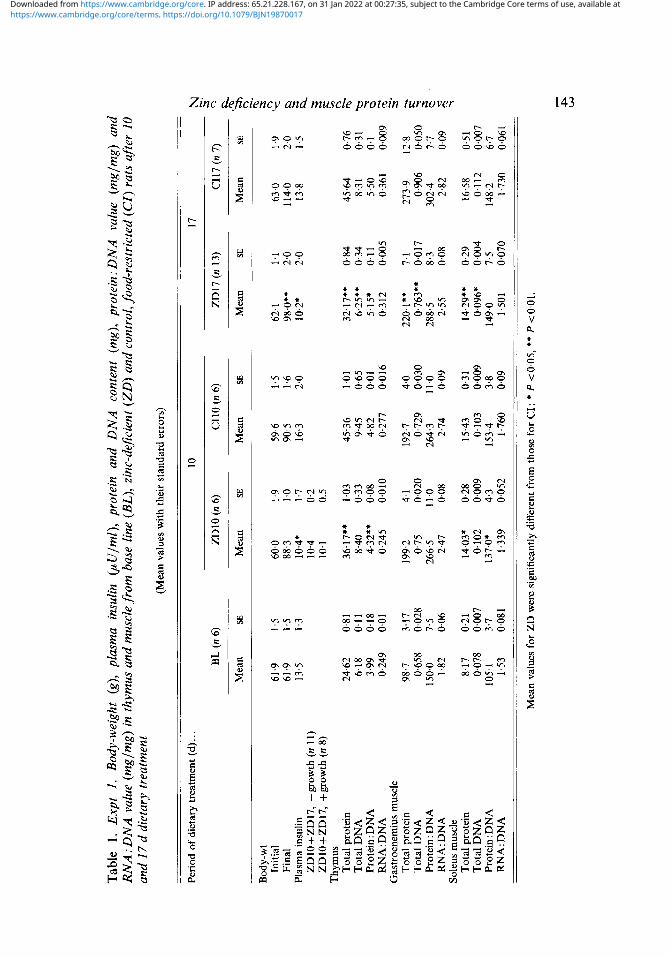
Tissue protein and nucleic acid contents In the thymus, Zn deficiency induced actual losses of DNA and protein compared with pair-fed controls (CI) (Table 1). In muscle the accumulation of protein was slower in the ZD compared with CI rats after the first 10 d, in both gastrocnemius and soleus muscles, and DNA accumulation in the ZD group ceased. The protein: DNA value expanded in both muscles over the first 10 d but the changes were small after this time. In both muscles the RNA: DNA values were always lower in the ZD rats although the differences were small. In summary, the accumulation of protein, DNA and RNA was slowed by the Zn-deficient diet in comparison with food restriction.
In the second experiment (Table 2), whereas Zn supplementation for 8 d enabled body-weights to be maintained, the Zn-deficient animals lost weight. Muscle protein and DNA contents were lower in the gastrocnemius muscle in the RIZD rats, although no differences were observed in the soleus muscle. The composition of the muscle in terms of protein: DNA or RNA: DNA values was not significantly different.
Rates of protein turnover In the preliminary experiments the rate of protein synthesis in muscle measured by the large-dose method was not significantly different from that based on the infusion of tyrosine when the intracellular pool was taken as the precursor (i.e. mean 19.3 (SE 2.1)% /d
Dow
nloaded from https://w
ww
.cambridge.org/core . IP address: 65.21.228.167 , on 31 Jan 2022 at 00:27:35 , subject to the Cam
bridge Core terms of use, available at https://w
ww
.cambridge.org/core/term
s . https://doi.org/10.1079/BJN19870017
Tab
le
1. E
xpt
1.
Bod
y-w
eigh
t (g
), pl
asm
a in
sulin
@U
/ml)
, pro
tein
and
DN
A c
onte
nt
(mg)
, pro
tein
:DN
A v
alue
(m
glm
g) a
nd
RN
A: D
NA
val
ue (
mgl
mg)
in th
ymus
and
mus
cle f
rom
bas
e lin
e (B
L),
zinc
-def
icie
nt (
ZD
) and
con
trol
, foo
d-re
stri
cted
(CZ) r
ats
afte
r 10
-
-
and
I7 d
die
tary
tre
atm
ent
(Mea
n va
lues
with
thei
r st
anda
rd e
rror
s)
Perio
d of
die
tary
trea
tmen
t (d)
. . .
10
BL (n 6
) Z
DlO
(n 6
) C
IlO (n
6)
Mea
n
Bod
y-w
t In
itial
Fi
nal
ZD
IO+Z
D17
, -g
row
th (n
11)
Z
DlO
+ZD
17,
+gro
wth
(n
8)
Tot
al p
rote
in
Tot
al D
NA
Pr
otei
n : D
NA
R
NA
: DN
A
Tot
al p
rote
in
Tot
al D
NA
Pr
otei
n :D
NA
R
NA
: DN
A
Sole
us m
uscl
e T
otal
pro
tein
T
otal
DN
A
Prot
ein
: DN
A
RN
A: D
NA
Plas
ma
insu
lin
Thym
us
Gas
troc
nem
ius
mus
cle
61.9
61
.9
13.5
24.6
2 6.
18
3.99
0.
249
98.7
150.
0 0,
658
1.82
8.17
0.
078
1.53
10
5.1
SE
~
I .5
1.5
1.3
0.81
0.
1 1
0.18
0.
01
3.17
0.
028
7.5
0.06
0.21
0.
007
3.7
0.08
1
Mea
n SE
M
ean
SE
60.0
88
.3
10.4
. 10
.4
10.1
36.1
7**
8.40
4.
32**
0.
245
199.
2
266.
5 0.
75
2.41
14.0
3*
0.10
2
1.33
9 13
7.0*
1.9
1 .o
1.7
0.2
0.5
1.03
0.
33
0.08
0.
010
4.1
0.02
0 11
.0
0.08
0.28
0.
009
4.3
0.05
2
59.6
90
.5
16.3
45.3
6 9.
45
4.82
0.
277
192.
7
264.
3 0.
729
2.74
15.4
3 0.
103
1.76
0 15
3.4
1.5
1.6
2.0
1.01
0.
65
0.01
0.
016
4.0
0.03
0 11
.0
0.09
0.31
0.
009
3.8
0.09
17
N
3.
CI1
7 (n
7)
n 2.
ZD
17 (n 1
3)
Mea
n SE
Mea
n SE
(D 3:
62.1
1.
1 63
.0
1.9
98.0
**
2.0
114.
0 2.
0 $2
10.2
* 2.
0 13
.8
1.5
4. 3 5 5
c,
45.6
4 0.
76 3
32.1
7**
0.84
6.
25**
0.
34
5.15
* 0.
11
0.31
2 0.
005
0.76
3**
0.01
7 0.
906
0,05
0 5
0.08
2.
82
0.09
'
2.55
;:;I 2
0.36
1 0.
009
2
3'
220.
1"
7.1
273.
9 12
.8
288.
5 8.
3 30
2.4
7.7
2 16
.58
0.51
14
.29*
* 0.
29
0.09
6*
0.00
4 0.
112
0.00
7
1.50
1 0.
070
1.73
0 0.
061
149.
0 7.
5 14
8.2
6.7
Mea
n va
lues
for
ZD
wer
e si
gnifi
cant
ly d
iffer
ent f
rom
thos
e fo
r C
I: * P
<0.
05,
** P
<0.
01.
c.
P
W
https://www.cambridge.org/core/terms. https://doi.org/10.1079/BJN19870017Downloaded from https://www.cambridge.org/core. IP address: 65.21.228.167, on 31 Jan 2022 at 00:27:35, subject to the Cambridge Core terms of use, available at
R. GIUGLIANO A N D D. J. MILLWARD
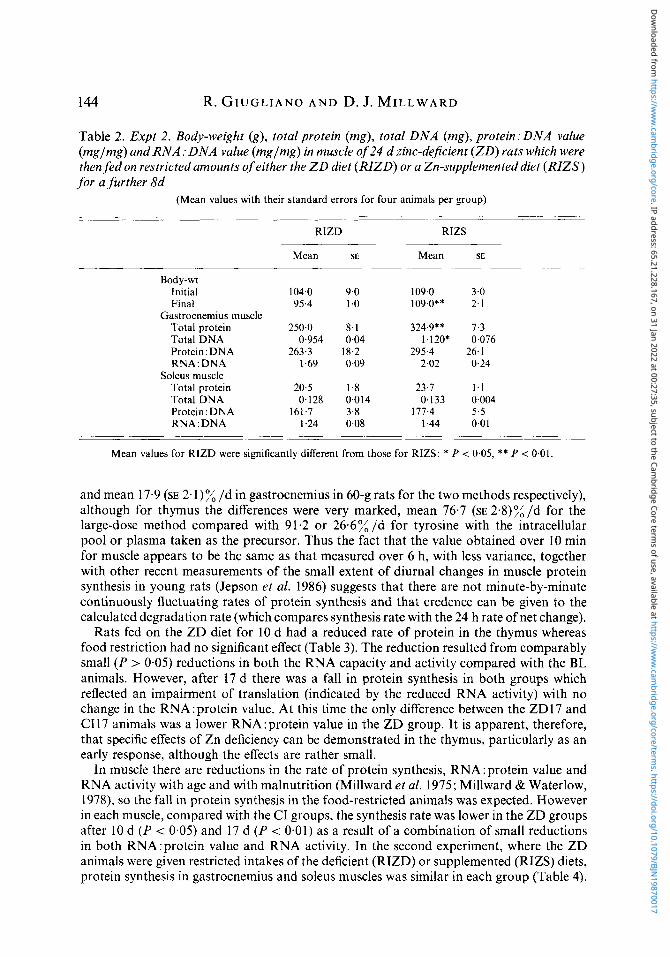
Table 2. Expt 2. Body-weight (g), total protein (mg), total DNA (mg), protein:DNA value (mglmg) and R N A : D N A value (mglmg) in muscle of 24 d zinc-dejicient (ZD) rats which were then fed on restricted amounts of either the Z D diet ( R I Z D ) or a Zn-supplemented diet (RIZS) for a further 8d
(Mean values with their standard errors for four animals per group)
RIZD RIZS
Mean SE Mean SE
Body-wt Initial 104.0 9.0 109.0 3.0 Final 95.4 1 .o 109.0** 2.1
Total protein 250.0 8.1 324.9** 7.3 Total DNA 0.954 0.04 1.120* 0.076 Protein:DNA 263.3 18.2 295.4 26.1 RNA: DNA 1.69 0.09 2.02 0-24
Gastrocnemius muscle
Soleus muscle Total protein 20.5 1.8 23.7 1-1 Total DNA 0.128 0.014 0,133 0.004 Protein:DNA 161.7 3.8 177.4 5.5 RNA : DNA 1.24 0.08 1.44 0.01
Mean values for RIZD were significantly different from those for RIZS: * P i 0.05, ** P -= 0.01.
.~
and mean 17.9 (SE 2.1)% /d in gastrocnemius in 60-g rats for the two methods respectively), although for thymus the differences were very marked, mean 76.7 (SE 2.8)% /d for the large-dose method compared with 91.2 or 26.6% /d for tyrosine with the intracellular pool or plasma taken as the precursor. Thus the fact that the value obtained over 10 min for muscle appears to be the same as that measured over 6 h, with less variance, together with other recent measurements of the small extent of diurnal changes in muscle protein synthesis in young rats (Jepson et al. 1986) suggests that there are not minute-by-minute continuously fluctuating rates of protein synthesis and that credence can be given to the calculated degradation rate (which compares synthesis rate with the 24 h rate of net change).
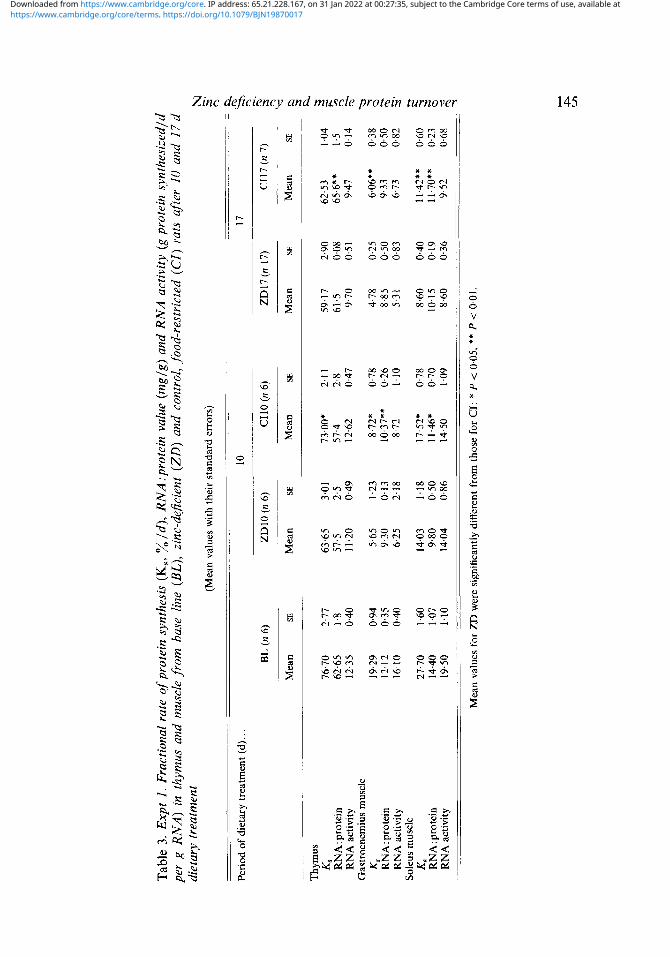
Rats fed on the ZD diet for 10 d had a reduced rate of protein in the thymus whereas food restriction had no significant effect (Table 3). The reduction resulted from comparably small (P > 0.05) reductions in both the RNA capacity and activity compared with the BL animals. However, after 17 d there was a fall in protein synthesis in both groups which reflected an impairment of translation (indicated by the reduced RNA activity) with no change in the RNA:protein value. At this time the only difference between the ZD17 and (2117 animals was a lower RNA:protein value in the ZD group. It is apparent, therefore, that specific effects of Zn deficiency can be demonstrated in the thymus, particularly as an early response, although the effects are rather small.
In muscle there are reductions in the rate of protein synthesis, RNA :protein value and RNA activity with age and with malnutrition (Millward et al. 1975; Millward & Waterlow, I978), so the fall in protein synthesis in the food-restricted animals was expected. However in each muscle, compared with the CI groups, the synthesis rate was lower in the ZD groups after 10 d (P < 0.05) and 17 d (P < 0.01) as a result of a combination of small reductions in both RNA:protein value and RNA activity. In the second experiment, where the ZD animals were given restricted intakes of the deficient (RIZD) or supplemented (RIZS) diets, protein synthesis in gastrocnemius and soleus muscles was similar in each group (Table 4).
Dow
nloaded from https://w
ww
.cambridge.org/core . IP address: 65.21.228.167 , on 31 Jan 2022 at 00:27:35 , subject to the Cam
bridge Core terms of use, available at https://w
ww
.cambridge.org/core/term
s . https://doi.org/10.1079/BJN19870017
Tab
le 3
. Exp
t 1.
Fra
ctio
nal
rate
of p
rote
in s
ynth
esis
(K
s, %
Id),
RN
A:p
rote
in v
alue
(m
glg)
and
RN
A a
ctiv
ity (
g pr
otei
n sy
nthe
size
dld
per
g R
NA
) in
thy
mus
and
mus
cle
from
bas
e lin
e (E
L), z
inc-
deJi
cien
t (Z
D) a
nd c
ontr
ol, f
ood-
rest
rict
ed (
CI)
rats
afte
r I0
and
17d
di
etar
y tr
eatm
ent
(Mea
n va
lues
with
thei
r st
anda
rd er
rors
) N
s cs
__
__
_~
10
17
& cs
Peri
od o
f die
tary
trea
tmen
t (d)
. . .
3
BL (n
6)
ZD
lO (n 6
) C
IlO (n
6)
ZD17
(n
17)
CI1
7 (n
7)
s .1" ~
~- 3
Mea
n SE
M
ean
SE
Mea
n SE
M
ean
SE
Mea
n SE
Thy
mus
76
.70
2.77
63
.65
3.01
73
.00*
2.
1 1
59.1
7 2.
90
62.5
3 1.
04
K8
RN
A: p
rote
in
62.6
5 1.
8 57
.5
2.5
574
2.8
61.5
0.
08
65.6
**
1.5
5 19
.29
0.94
5.
65
1.23
8.
72*
0.78
4.
78
0.25
6.
06**
0.
38
2 R
NA
act
ivity
12
.35
0.40
11
.20
0.49
12
.62
0.47
9.
70
0.51
9.
47
0.14
2
Gas
troc
nem
ius m
uscl
e
RN
A: p
rote
in
12.1
2 0.
35
9.30
0.
13
10,3
7**
0.26
8.
85
0.50
9.
33
0.50
R
NA
act
ivity
16
.10
0.40
6.
25
2.18
8.
72
1.10
5.
31
0.83
6.
73
0.82
5'
Ks
Sole
us m
uscl
e 27
.70
1.60
14
.03
1.18
17
.52*
0.
78
8.60
0.
40
11,4
2**
0.60
R
NA
:pro
tein
14
.40
1.07
9.
80
0.50
11
.46*
0.
70
10.1
5 0.
19
11.7
0**
0.23
R
NA
act
ivity
19
.50
1.10
14
.04
0.86
14
.50
1.09
8.
60
0.36
9.
52
068
Mea
n va
lues
for
ZD
wer
e si
gnifi
cant
ly d
iffer
ent
from
thos
e fo
r C
I: *
P <
0.0
5, *
* P <
0.0
1.
K8
.Y
https://www.cambridge.org/core/terms. https://doi.org/10.1079/BJN19870017Downloaded from https://www.cambridge.org/core. IP address: 65.21.228.167, on 31 Jan 2022 at 00:27:35, subject to the Cambridge Core terms of use, available at
146 R. GIUGLIANO A N D D. J. M I L L W A R D
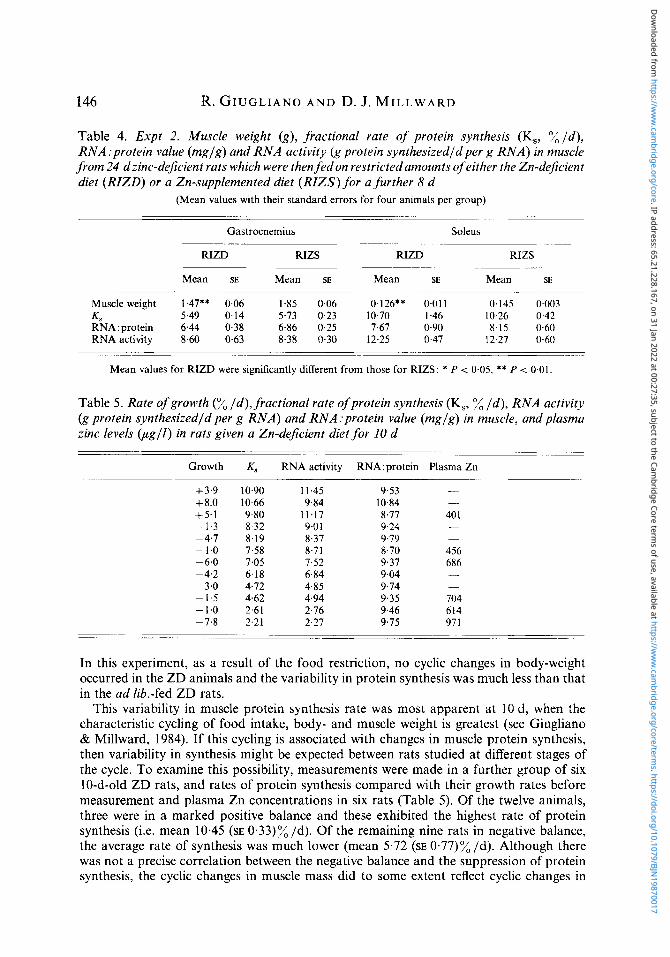
Table 4. Expt 2. Muscle weight (g) , fractional rate of protein synthesis (Ks, % I d ) , RNA:protein value (mglg) and RNA activity (g protein synthesizedldper g RNA) in muscle from 24 dzinc-dejicient rats which were then fedon restrictedamounts of either the Zn-deficient diet (RZZD) or a Zn-supplemented diet (RZZS) for a further 8 d
(Mean values with their standard errors for four animals per group)
Gastrocnemius Soleus
RIZD RIZS RIZD RIZS
Mean SE Mean SE Mean SE Mean SE
Muscle weight 1.47** 0.06 1.85 0.06 0.126** 0.01 1 0.145 0.003 4 5.49 0.14 5.73 0.23 10.70 I .46 10.26 0.42 RNA:protein 6.44 0.38 6.86 0.25 7.67 0.90 8.15 0.60 RNA activity 8.60 0 6 3 8-38 0.30 12.25 0.47 12.27 0-60
~ _ _ _ _ _._.
Mean values for R E D were significantly different from those for RIZS: * P < 0.05, ** P < 0.01.
Table 5. Rate of growth (% I d ) , fractional rate of protein synthesis (Ks, % I d ) , RNA activity (g protein synthesizedld per g RNA) and RNA :protein value (mglg) in muscle, and plasma zinc levels (ug l l ) in rats given a Zn-dejicient diet for 10 d
~~ ~. .
Growth K, RNA activity RNA:protein Plasma Zn
+ 3.9 + 8.0 f5.1 - 1.3 -4.7 -1.0 - 6.0 - 4.2 - 3.0 - 1.5 - 1.0 - 7.8
10.90 10.66 9.80 8.32 8.19 7.58 7.05 6.18 4.72 4.62 2.61 2.21
1 1.45 9.84
11.17 9.0 1 8.37 8.71 7.52 6.84 4.85 4.94 2.76 2.27
9.53 10.84 8.77 9.24 9.79 8.70 9.37 9.04 9.74 9.35 9.46 9.75
-
40 1
~
456 686 __ ~
704 614 971
In this experiment, as a result of the food restriction, no cyclic changes in body-weight occurred in the ZD animals and the variability in protein synthesis was much less than that in the ad lib.-fed ZD rats.
This variability in muscle protein synthesis rate was most apparent at 10 d, when the characteristic cycling of food intake, body- and muscle weight is greatest (see Giugliano & Millward, 1984). If this cycling is associated with changes in muscle protein synthesis, then variability in synthesis might be expected between rats studied at different stages of the cycle. To examine this possibility, measurements were made in a further group of six 10-d-old ZD rats, and rates of protein synthesis compared with their growth rates before measurement and plasma Zn concentrations in six rats (Table 5). Of the twelve animals, three were in a marked positive balance and these exhibited the highest rate of protein synthesis (i.e. mean 10.45 (SE 0.33)% Id). Of the remaining nine rats in negative balance, the average rate of synthesis was much lower (mean 5.72 (SE 0.77)% Id). Although there was not a precise correlation between the negative balance and the suppression of protein synthesis, the cyclic changes in muscle mass did to some extent reflect cyclic changes in
Dow
nloaded from https://w
ww
.cambridge.org/core . IP address: 65.21.228.167 , on 31 Jan 2022 at 00:27:35 , subject to the Cam
bridge Core terms of use, available at https://w
ww
.cambridge.org/core/term
s . https://doi.org/10.1079/BJN19870017
Zinc deficiency and muscle protein turnover 147
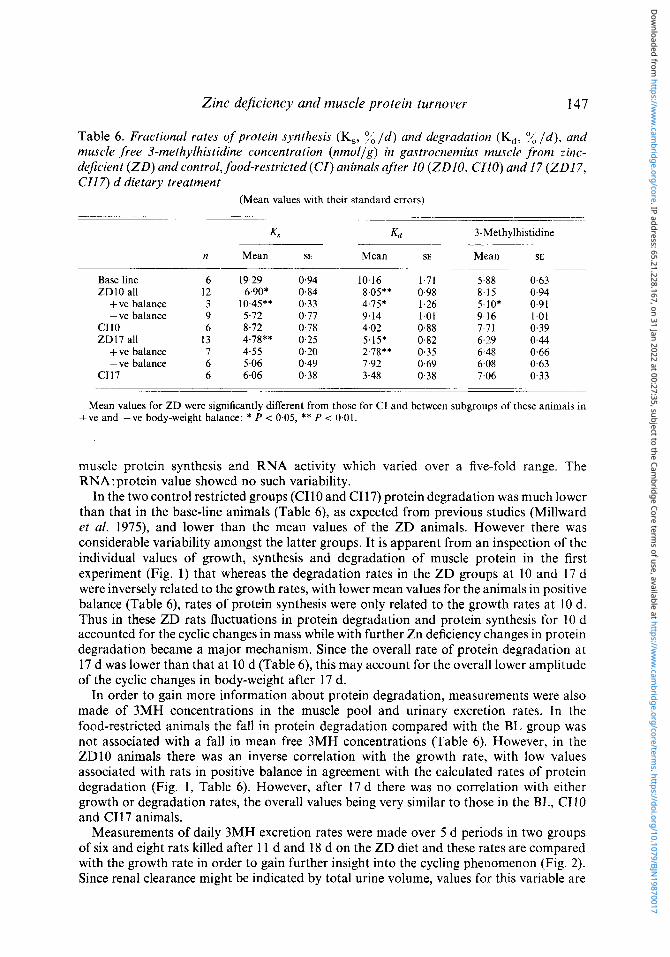
Table 6. Fractional rates of protein synthesis (I&, % / d ) and degradation (Kd, / d ) , and muscle free 3-methylhistidine concentration (nmollg) in gastrocnemius muscle from zinc- deficient ( Z D ) and control, food-restricted (CI ) animals after 10 (ZDIO, CIIO) and 17 ( Z D l 7 , CI17) d dietary treatment
(Mean values with their standaid errors)
~~ ~~~~
Ks Kd 3-Methylhistidine
n Mean SE Mean SE Mean SE
Base line ZDlO all
+ ve balance - ve balance
CIIO ZD17 all
+ ve balance - ve balance
CI17
6 19.29 0.94 12 6.90* 0.84 3 10,45** 0.33 9 5.72 0.17 6 8.72 0.78
13 4.78** 0.25 7 4.55 0.20 6 5.06 0.49 6 6.06 0.38
10.16 8.05** 4,75* 9.14 4.02 5.15* 2,78** 7.92 3.48
~~
1.71 5.88 0.98 8.15 1.26 5,10* 1.01 9.16 0.88 7.71 0.82 6.29 0.35 6.48 0.69 6.08 0.38 7.06
~~ -
0.63 0.94 0.91 1.01 0.39 0.44 0.66 0.63 0.33
Mean values for ZD were significantly different from those for CI and between subgroups of these animals in +ve and -ve body-weight balance: * P < 0.05, ** P c 0.01.
muscle protein synthesis and RNA activity which varied over a five-fold range. The RNA:protein value showed no such variability.
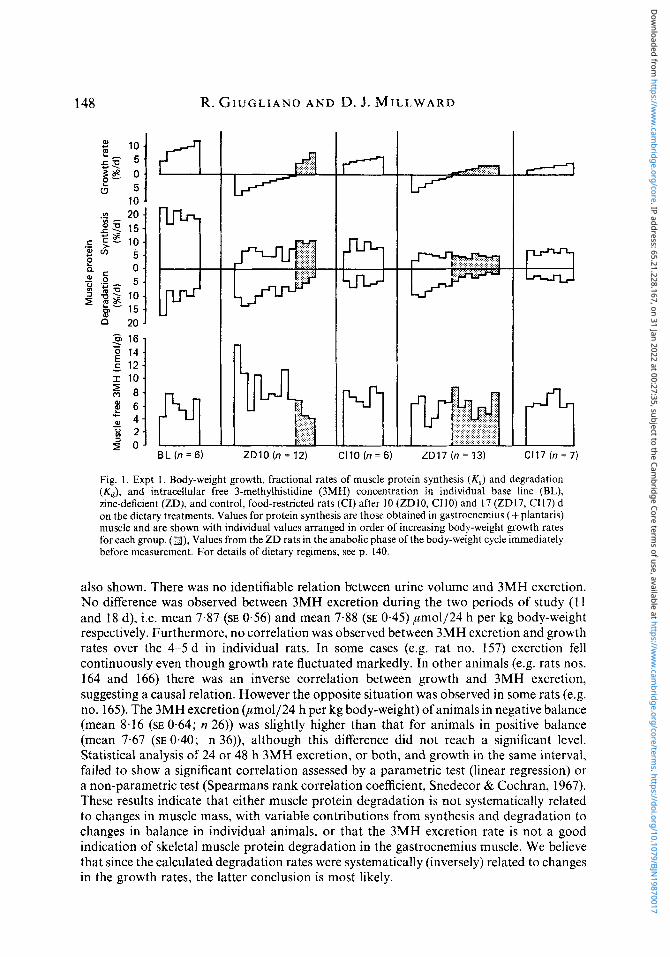
In the two control restricted groups (CIIO and CI17) protein degradation was much lower than that in the base-line animals (Table 6), as expected from previous studies (Millward et al. 1975), and lower than the mean values of the ZD animals. However there was considerable variability amongst the latter groups. It is apparent from an inspection of the individual values of growth, synthesis and degradation of muscle protein in the first experiment (Fig. 1) that whereas the degradation rates in the ZD groups at 10 and 17 d were inversely related to the growth rates, with lower mean values for the animals in positive balance (Table 6) , rates of protein synthesis were only related to the growth rates at 10 d. Thus in these ZD rats fluctuations in protein degradation and protein synthesis for 10 d accounted for the cyclic changes in mass while with further Zn deficiency changes in protein degradation became a major mechanism. Since the overall rate of protein degradation at 17 d was lower than that at 10 d (Table 6), this may account for the overall lower amplitude of the cyclic changes in body-weight after 17 d.
In order to gain more information about protein degradation, measurements were also made of 3MH concentrations in the muscle pool and urinary excretion rates. In the food-restricted animals the fall in protein degradation compared with the BL group was not associated with a fall in mean free 3MH concentrations (Table 6). However, in the ZDlO animals there was an inverse correlation with the growth rate, with low values associated with rats in positive balance in agreement with the calculated rates of protein degradation (Fig. 1, Table 6). However, after 17 d there was no correlation with either growth or degradation rates, the overall values being very similar to those in the BL, CI I0 and C117 animals.
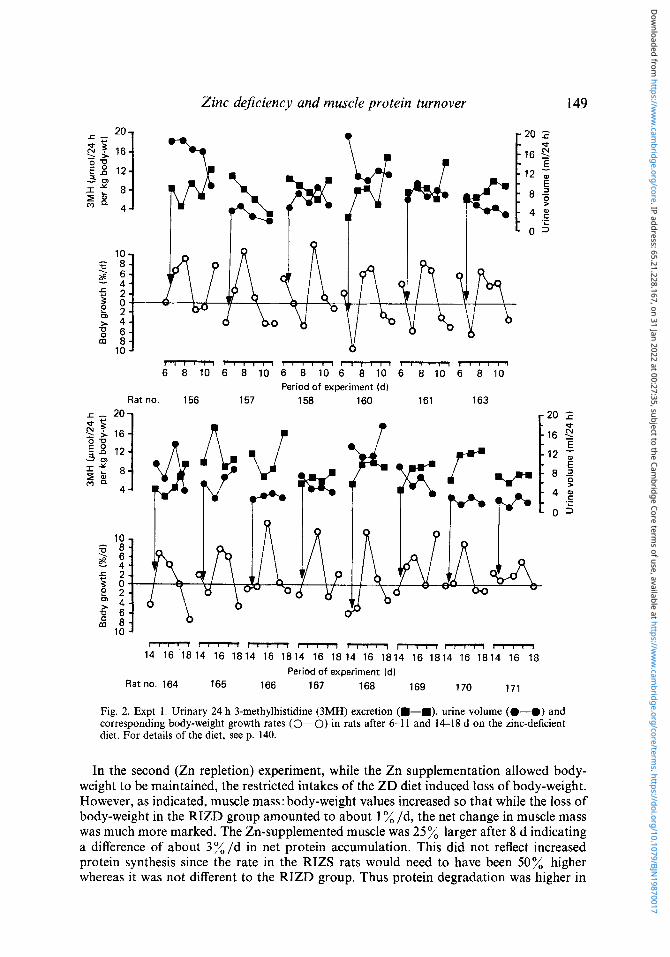
Measurements of daily 3MH excretion rates were made over 5 d periods in two groups of six and eight rats killed after 1 1 d and 18 d on the ZD diet and these rates are compared with the growth rate in order to gain further insight into the cycling phenomenon (Fig. 2 ) . Since renal clearance might be indicated by total urine volume, values for this variable are
Dow
nloaded from https://w
ww
.cambridge.org/core . IP address: 65.21.228.167 , on 31 Jan 2022 at 00:27:35 , subject to the Cam
bridge Core terms of use, available at https://w
ww
.cambridge.org/core/term
s . https://doi.org/10.1079/BJN19870017
148 R. GIUGLIANO A N D D. J. M I L L W A R D
W E
.4-
0 :j 2
BL (n = 6)
a n
ZDlO(n=12) C l l O ( n = 6 ) ZD17(n=13) C117 (n = 7)
Fig. 1. Expt 1. Body-weight growth, fractional rates of muscle protein synthesis (K , ) and degradation (Kd) , and intracellular free 3-methylhistidine (3MH) concentration in individual base line (BL), zinc-deficient (ZD), and control, food-restricted rats (CI) after 10 (ZD10, CI10) and 17 (ZD17, C117) d on the dietary treatments. Values for protein synthesis are those obtained in gastrocnemius (+ plantaris) muscle and are shown with individual values arranged in order of increasing body-weight growth rates for each group. (a), Values from the ZD rats in the anabolic phase of the body-weight cycle immediately before measurement. For details of dietary regimens, see p. 140.
also shown. There was no identifiable relation between urine volume and 3MH excretion. No difference was observed between 3MH excretion during the two periods of study ( 1 1 and 18 d), i.e. mean 7.87 (SE 0.56) and mean 7.88 (SE 0.45) pmo1/24 h per kg body-weight respectively. Furthermore, no correlation was observed between 3MH excretion and growth rates over the 4-5 d in individual rats. In some cases (e.g. rat no. 157) excretion fell continuously even though growth rate fluctuated markedly. In other animals (e.g. rats nos. 164 and 166) there was an inverse correlation between growth and 3MH excretion, suggesting a causal relation. However the opposite situation was observed in some rats (e.g. no. 165). The 3MH excretion @mo1/24 h per kg body-weight) of animals in negative balance (mean 8.16 (SE 0.64; n 26)) was slightly higher than that for animals in positive balance (mean 7.67 (SE 0.40; n 36)), although this difference did not reach a significant level. Statistical analysis of 24 or 48 h 3MH excretion, or both, and growth in the same interval, failed to show a significant correlation assessed by a parametric test (linear regression) or a non-parametric test (Spearmans rank correlation coefficient, Snedecor & Cochran, 1967). These results indicate that either muscle protein degradation is not systematically related to changes in muscle mass, with variable contributions from synthesis and degradation to changes in balance in individual animals, or that the 3MH excretion rate is not a good indication of skeletal muscle protein degradation in the gastrocnemius muscle. We believe that since the calculated degradation rates were systematically (inversely) related to changes in the growth rates, the latter conclusion is most likely.
Dow
nloaded from https://w
ww
.cambridge.org/core . IP address: 65.21.228.167 , on 31 Jan 2022 at 00:27:35 , subject to the Cam
bridge Core terms of use, available at https://w
ww
.cambridge.org/core/term
s . https://doi.org/10.1079/BJN19870017
Zinc deficiency and muscle protein turnover 149
mm11111111rTlll11111TllIll 6 8 1 0 6 8 1 0 6 8 1 0 6 8 1 0 6 8 1 0 6 8 1 0
Period of experiment (d) Rat no. 156 157 158 160 161 163
- - rn - I T t m - 14 16 1814 16 1814 16 1814 16 18 14 16 1814 16 1814 16 1814 16 18
Period of experiment (d)
166 167 168 169 170 171 Ratno. 164 165
Fig. 2. Expt 1. Urinary 24 h 3-methylhistidine (3MH) excretion (m-w), urine volume (0-0) and corresponding body-weight growth rates (0-0) in rats after 6 1 1 and 14-18 d on the zinc-deficient diet. For details of the diet, see p. 140.
In the second (Zn repletion) experiment, while the Zn supplementation allowed body- weight to be maintained, the restricted intakes of the ZD diet induced loss of body-weight. However, as indicated, muscle mass: body-weight values increased so that while the loss of body-weight in the RIZD group amounted to about 1 % /d, the net change in muscle mass was much more marked. The Zn-supplemented muscle was 25% larger after 8 d indicating a difference of about 3%/d in net protein accumulation. This did not reflect increased protein synthesis since the rate in the RIZS rats would need to have been 50% higher whereas it was not different to the RIZD group. Thus protein degradation was higher in
Dow
nloaded from https://w
ww
.cambridge.org/core . IP address: 65.21.228.167 , on 31 Jan 2022 at 00:27:35 , subject to the Cam
bridge Core terms of use, available at https://w
ww
.cambridge.org/core/term
s . https://doi.org/10.1079/BJN19870017
150 R. GIUGLIANO A N D D. J. M I L L W A R D
Table 7. Urinary 3-methylhistidine excretion @mo1/24 h per kg body-weight) in zinc-deficient rats which were then f ed on restricted amounts of either the Zn-deficient diet (RIZD) or a Zn-supplemented diet (RIZS) for a further 8 d
(Mean values with their standard errors for four animals per group) -.
RIZD RIZS
Day Mean SE Mean SE
6 8.85 4.04 4.70 2.7 7 11.38 3.99 9.45 3.45 8 12.40 2.91 8.23 1.52
Overall mean 1 1 15 0.97 7.68 0.87
the RIZD group. In this case the change in the calculated rate of degradation was to some extent supported by measurements of 3MH excretion rates (Table 7). These indicated considerable variation in each rat from day-to-day; while on the second day of the collection, there was no significant difference between the groups, on days 1 and 3 3MH excretion was clearly higher in RIZD rats. Thus the overall average values for this group were over 40% higher than in the RIZS animals, the same order of magnitude as the calculated difference in degradation.
Hormonal changes Insight into the mechanism by which the cyclic changes in food intake mediated the changes in protein metabolism comes from measurements of plasma insulin and urinary corticosterone excretion.
The differences between the plasma insulin in the BL group and the two treated groups were small (Table 1). While this might be thought surprising considering the treated animals had very marked reductions in food intake compared with the BL animals, there are well-documented increases in insulin concentrations and decreases in sensitivity in well-fed rats of this age (Heard & Turner, 1967). However, the ZDlO and ZD17 animals had lower plasma insulin levels than the CI group, and this is in line with reduced rates of protein synthesis in the ZD animals compared with the CI group. However, plasma insulin levels were unresponsive to changes in food intake with no difference between insulin concentrations in rats in positive or negative balance. There was also no difference in plasma insulin in the two groups of rats in the Zn-repletion experiment (pU/ml): RIZD 23.3 (SE 2.8), RIZS 20.2 (SE 7).
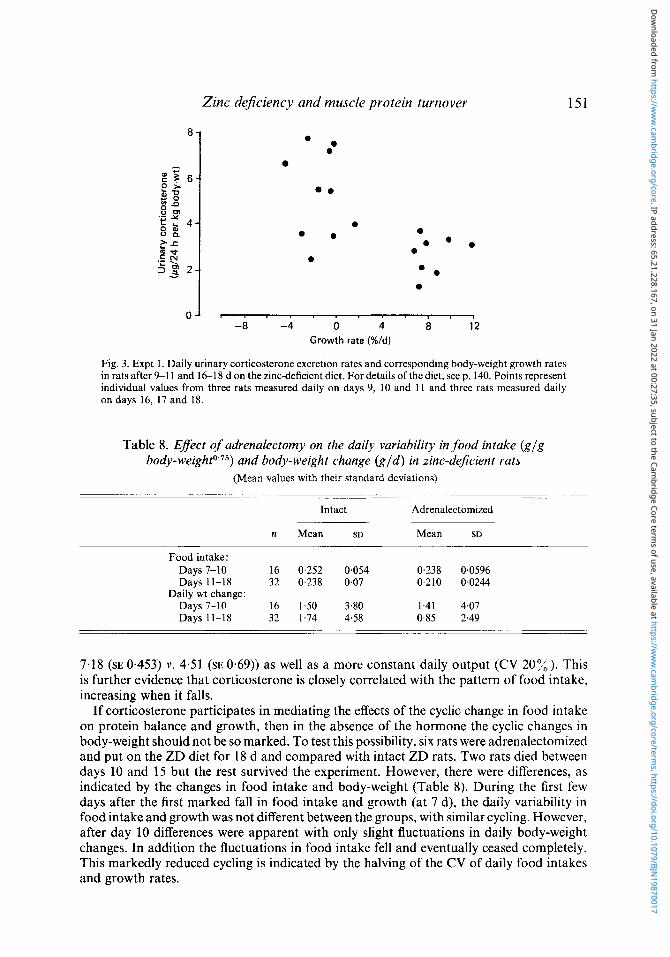
Corticosterone status was assessed from the daily 24 h urinary excretion measured for 3 d, as separate 24 h collections in six ZD animals, with measurements in three rats at 1 1 d and in the other three rats at 18 d. There was an inverse correlation between the daily excretion and the changes in both food intake and growth. A decrease in both variables was always associated with elevated levels of urinary corticosterone and these correlations were equally apparent at 11 and 18 d. These results are grouped together in Fig. 3 showing the inverse relation between growth rates and corticosterone excretion.
There was no difference in the corticosterone excretion rates between the two groups in the supplementation experiment @g/24 h per kg body-weight; RIZD 7.18 (SE 0.45), RIZS 6.43 (SE 0.44). However, compared with the ZD ad lib.-fed animals, when there were very marked daily changes in the corticosterone excretion rates (coefficient of variation (CV) 50% ), the RIZD rats exhibited both higher average excretion &g/24 h per kg body-weight;
Dow
nloaded from https://w
ww
.cambridge.org/core . IP address: 65.21.228.167 , on 31 Jan 2022 at 00:27:35 , subject to the Cam
bridge Core terms of use, available at https://w
ww
.cambridge.org/core/term
s . https://doi.org/10.1079/BJN19870017
Zinc deficiency and muscle protein turnover 151
-a -4 0 4 a 12 Growth rate (%/d)
Fig. 3. Expt 1. Daily urinary corticosterone excretion rates and corresponding body-weight growth rates in rats after 9-1 1 and 1&18 d on the zinc-deficient diet. For details of the diet, seep. 140. Points represent individual values from three rats measured daily on days 9, 10 and 11 and three rats measured daily on days 16, 17 and 18.
Table 8. Effect of adrenalectomy on the daily variability in food intake (g /g b o d y - ~ e i g h t ~ ' ~ ~ ) and body-weight change ( g l d ) in zinc-de$cient rats
(Mean values with their standard deviations) -
Intact Adrenalectomized
n Mean SD Mean SD
Food intake: Days 7-10 16 0.252 0.054 0,238 0.0596 Days 11-18 32 0.238 0.07 0.210 0.0244
Days 7-10 16 1.50 3.80 1.41 4.07 Days 11-18 32 1.74 4.58 0.85 2.49
Daily wt change:
7.18 (SE 0.453) v. 4.51 (SE 0.69)) as well as a more constant daily output (CV 20%). This is further evidence that corticosterone is closely correlated with the pattern of food intake, increasing when it falls.
If corticosterone participates in mediating the effects of the cyclic change in food intake on protein balance and growth, then in the absence of the hormone the cyclic changes in body-weight should not be so marked. To test this possibility, six rats were adrenalectomized and put on the ZD diet for 18 d and compared with intact ZD rats. Two rats died between days 10 and 15 but the rest survived the experiment. However, there were differences, as indicated by the changes in food intake and body-weight (Table 8). During the first few days after the first marked fall in food intake and growth (at 7 d), the daily variability in food intake and growth was not different between the groups, with similar cycling. However, after day 10 differences were apparent with only slight fluctuations in daily body-weight changes. In addition the fluctuations in food intake fell and eventually ceased completely. This markedly reduced cycling is indicated by the halving of the CV of daily food intakes and growth rates.
Dow
nloaded from https://w
ww
.cambridge.org/core . IP address: 65.21.228.167 , on 31 Jan 2022 at 00:27:35 , subject to the Cam
bridge Core terms of use, available at https://w
ww
.cambridge.org/core/term
s . https://doi.org/10.1079/BJN19870017
152 R. GIUGLIANO A N D D. J. M I L L W A R D
DISCUSSION
Although previous studies have suggested that protein synthesis may be depressed in some tissues in ZD rats (e.g. Hsu & Rubenstein, 1982; Suwarnasarn et af. 1982), with the exception of one study with reliable measurements of protein synthesis in intestinal mucosa of ZD rats (indicating that protein synthesis was not affected (Southon et al. 1985)), the methods used mean that neither the qualitative nor quantitative importance of the studies can be easily assessed. Zn might be expected to participate in the regulation of the capacity for protein synthesis, tissue DNA and RNA content, through its presence in DNA and RNA polymerases, and tRNA synthetases (Vallee & Falchuk, 1981). In addition it can have an indirect action on the proliferation of satellite cells, the myonuclear precursor cells in muscle, through its regulation of somatomedin C concentration (Oner et al. 1984), a primary regulator of satellite-cell proliferation (Dodson et al. 1985). Certainly a deficiency of this hormone appears to be closely related to the reduced bone growth with Zn deficiency (Oner et al. 1984) and could partly account for our observation that in both tissues examined in the present study, DNA accumulation was reduced in the ZD animals compared with the pair-fed controls. Because of the very high DNA concentration in the thymus (up to 20% dry weight) as well as intense mitosis required to maintain the continuous export of cells, if Zn is required for DNA synthesis then Zn deficiency would be expected to have an effect on organ size and this is what occurred. However these experiments do not indicate the mechanism of the effect since although Zn deficiency did have a specific early effect on protein synthesis in the thymus, whether this reflected the role of Zn in regulating the capacity for protein synthesis is not decisively indicated. From our experiments, since the changes in protein synthesis were small and their statistical significance low, we cannot say definitively whether a difference in synthesis rather than degradation accounted for the reduced thymus weight and total protein in the ZD animals. This is because the overall rate of protein synthesis in the thymus is so rapid that a relatively small proportional reduction in the synthesis rate could account for a reduction in the rate of accretion of protein.
In muscle the results confirm a role for Zn in regulating the capacity for protein synthesis through the regulation of RNA concentration, which is reinforced by the observation that there were no cyclic changes in RNA concentrations (Table 5) . In meal-fed rats, cyclic changes in muscle RNA levels are apparent throughout the day (Millward et al. 1974) and RNA is very rapidly lost from muscle in response to undernutrition (Millward & Waterlow, 1978). Given the fact that the periodicity of the cyclic changes in food intake was several days, changes in the RNA :protein values would have been expected. This suggests an inability to replace RNA in the anabolic phase of the cycle. The mechanism of this is, however, unknown. Zn concentration does not fall in muscle (Giugliano & Millward, 1984) so any Zn-related depletion or abnormality of enzymes involved in RNA synthesis (Terhune & Sandstead, 1972) or degradation (see Chesters & Will, 1978) must have involved selective and quantitatively small changes.
In contrast to the lack of response of muscle RNA concentration to changes in food intake, the RNA activity was able to respond to the cyclic changes with marked differences between the anabolic and catabolic phases of the cycle. However, in no case did the value reach that observed in the base-line controls and this might have been expected from our previous work. In 30-d malnourished rats refed for 1 d the RNA activity is restored to normal values (Millward et al. 1975) and in diabetic rats infused with insulin a similar value is observed after 6 h (Odedra et al. 1982). Although it is possible that Zn deficiency could directly affect translation since it is present in an elongation factor (Vallee & Falchuk, 198 l), it would follow from the previously mentioned arguments that selective reductions in this Zn-dependent factor would have to occur. Since there was evidence of an inverse
Dow
nloaded from https://w
ww
.cambridge.org/core . IP address: 65.21.228.167 , on 31 Jan 2022 at 00:27:35 , subject to the Cam
bridge Core terms of use, available at https://w
ww
.cambridge.org/core/term
s . https://doi.org/10.1079/BJN19870017
Zinc deficiency and muscle protein turnover 153 correlation between plasma Zn and muscle RNA activity, if muscle free Zn varies with plasma Zn then this would suggest that free Zn does not play a direct regulatory role in protein synthesis.
Another alternative is that the inability of the RNA activity to reach the control values in the anabolic phase reflected an effect of the Zn deficiency on the hormonal response to feeding. Since Zn is required for insulin synthesis, impaired insulin secretion might be expected in Zn deficiency. This is a controversial subject, however, with evidence existing for (Wolman et al. 1979; Emdin et al. 1980; Robinson & Hurley, 1981) and against (Figlewicz et al. 1981) a regulatory role for Zn in insulin secretion. The mean insulin level was lower in the ZD rats compared with the pair-fed animals, suggesting that the ZD rats had a reduced ability to secrete insulin particularly in the anabolic phase of the feeding- body-weight cycle. This would undoubtedly contribute to the inability of the RNA activity to reach control levels. However, it would not explain the reductions in RNA activities in the catabolic phase. The cyclic changes in corticosterone as indicated by urinary excretion (an indication of free corticosterone levels) could well account for the cyclic changes in muscle protein synthesis since high levels of corticosterone suppress RNA activity in muscle regardless of the circulating levels of insulin (Millward et a/. 1976; Odedra & Millward, 1982). More importantly in the present context, the response to small increases of insulin in the acutely refed-fasted rat is modulated by the extent to which the plasma corticosterone falls on refeeding (Millward et al. 1983), indicating that glucocorticoid hormones block the stimulus of muscle protein synthesis by insulin. The observation that the adrenalectomized rats were less able to survive the Zn restriction and did not show such pronounced cyclic changes in body-weight is further support for an important role for corticosterone in mediating the changes in muscle protein synthesis. Furthermore, if the cyclic changes in food intake are related to the cyclic changes in plasma Zn as it is alternatively released and taken up into the tissues following the cyclic changes in tissue protein metabolism, the fact that food intake cycling was also reduced supports the conclusion that the changes in tissue mass are influenced by adrenal hormones. However, the cyclic changes in muscle mass were not completely absent in the initial stages of the Zn deficiency in the adrenalectomized rats, demonstrating that corticosterone is not obligatory for the response. In this initial stage there may have been sufficient insulin to initiate the cyclic changes without the need for amplification from parallel inverse changes in corticosterone.
In these studies the calculated rates of degradation indicated that changes in muscle proteolysis were an important part of the response to Zn deficiency, but this conclusion is not entirely supported by the measurements of 3MH concentrations and excretion. There are well-documented problems in interpreting 3MH results (Millward & Bates, 1983; Rennie & Millward, 1983). The muscle free 3MH levels, which we thought initially might prove to be a good qualitative index of muscle degradation (Rennie et al. 1981; Odedra & Millward, 1982), subsequently proved to be less satisfactory in other studies (Odedra et al. 1982). Presumably changes in the rates of transport out of muscle and in clearance influence intracellular concentration as much as rates of actin degradation.
The rates of urinary 3MH excretion were also difficult to interpret. The variability in urinary excretion of 3MH (previously reported by Hsu & Rubenstein, 1982) and incon- sistency of correlation of 3MH excretion with changes in muscle mass, together with our other measurements of muscle protein degradation, presumably reflect the fact that parallel changes in actin degradation in muscle and the extensive non-muscle sources of urinary 3MH (Millward & Bates, 1983) do not always occur as reported in fasted rats (Cotellesa et al. 1983) and in some clinical situations (Rennie & Millward, 1983). Indeed there is evidence that within muscle, changes in 3MH release do not always occur in parallel with changes in the overall rate of protein degradation (Li & Wassner, 1984; Lowell et al. 1986).
Dow
nloaded from https://w
ww
.cambridge.org/core . IP address: 65.21.228.167 , on 31 Jan 2022 at 00:27:35 , subject to the Cam
bridge Core terms of use, available at https://w
ww
.cambridge.org/core/term
s . https://doi.org/10.1079/BJN19870017
154 R. GIUGLIANO A N D D. J. M I L L W A R D The calculated rates of protein degradation did indicate that changes in degradation were
important at all stages of Zn deficiency in regulating muscle protein mass. Rates were generally higher in the ZD rats and in the latter stages of Zn deficiency changes in degradation appeared to be the dominant mechanism for changing muscle mass. This suggests that Zn deficiency potentiates protein degradation in muscle so that it is more susceptible to regulatory influences. The increases in corticosterone in the catabolic phases of the cycle could then initiate the changes if such increases have similar effects to large doses of exogenous corticosterone which do transiently increase muscle degradation (Odedra et al. 1983). This would be consistent with the observations that Zn inhibits protein degradation in several tissues (Mego, 1976; Ludwig & Chvapil, 1980) including muscle (Lundholm et al. 1981), possibly because lysosomal stability is diminished in response to Zn deficiency. However, according to Dreosti & Record (19781, Zn deficiency increases rather than decreases lysosomal stability in rat liver. Another possibility is that the low insulin levels in the ZD rats result in increased proteolysis, although the evidence supporting a role for insulin in the in vivo regulation of muscle proteolysis is not very convincing (Millward et al. 1985). Whatever the mechanism in muscle, since the ability of muscle protein synthesis to respond to changes in food intake appears to be to some extent limited in the ZD rats, an increased responsiveness of protein degradation is undoubtedly an asset if the cyclic changes in muscle mass are important for survival.
In conclusion, whilst the reduced rate of muscle protein deposition in Zn deficiency is explained in part by alteration in tissue protein metabolism, with a reduced capacity for protein synthesis (possibly reflecting reduced somatomedin C), and an increased catabolic response to reduced food intake, probably mediated by corticosterone, it would appear that the inability of the animal to respond to food intake with sufficient insulin to fully activate the translational phase of protein synthesis does constitute an important additional reason for the impaired growth.
These studies were supported by the British Council through a scholarship for R. G.
REFERENCES Bailey. N. T. J. (1981). Staristical Methods in Biology, 2nd ed., pp. 43-51. London: Hodder & Stoughton. Chesters. J. K. & Will, M. (1978). British Journal of Nutrition 39, 375-382. Chvapil, M., Zukowski, C. F., Hattler, B. G., Stankova, L., Montgomery, D., Carlson, E. C. & Ludwig, J. C.
(1976). In Trace Elements in Human Health and Disease, pp. 269-281 [A. S. Prasad, editor]. New York: Academic Press.
Cotcllcsa, L.. Emery, P. W. & Rennie, M. J. (1983). Proceedings qf the Nutrition Society 42, 26A. Dodson, M. V., Allen, R. E. & Hossner, K. L. (1985). Endocrinology 117, 2357-2363. Dreosti, I . E. & Record, I. R. (1978). British Journal of Nutrition 40, 133-137. Emdin, S. O., Dodson, G. G., Cutfield, J. M. & Cutfield, S. M. (1980). Diabetologia 19, 174-182. Few, J. D. & Cashmore, G. C. (1971). Annals cfclinicul Biochemistry 8, 206209. Figlewicz, D. P., Heldt, A,, Forhan, S . E. & Grodsky, G. M. (1981). Endocrinology 108, 73C732. Garlick, P. J., McNurlan, M. A. & Preedy, V. R. (1980). Biochemical Journal 192, 719-723. Garlick, P. J., Millward, D. J. & James, W. P. T. (1973). Biochemical Journal 136,935-945. Ciugliano, R. & Millward, D. J. (1984). British Journal ofNutrilion 52, 545-560. Heard, C. R. C. & Turner, M. R. (1967). Diabetes 16, 96-107. Herbert, V., Lau. K. S.. Cottlieb, C. W. & Bleicher, S. J. (1965). Journal of Clinical Endocrinology and Metabolism
Ilsu, J. M. & Rubenstein, B. (1982). Journalof Nutrition 112, 461467. Jepson, M. M., Pell, J. M., Bates, P. C. & Millward, D. J. (1986). Biochemical Journal 235, 329-336. Kley. H. K., Herberg, L. & Kruskemper, H. L. (1976). Journal ofsteroid Biochemistry 7, 381-385. Li, J. B. & Wassner, S. J. (1984). American Journal of Physiology 9, E32-E37. Lowell, B. B., Ruderman, N. B. & Goodman, M. N. (1986). Biochemical Journal 234, 237-240. Ludwig, J. D. & Chvdpil, M. (1980). Journal oJNutrition 110, 945-953.
25. 1375-1384.
Dow
nloaded from https://w
ww
.cambridge.org/core . IP address: 65.21.228.167 , on 31 Jan 2022 at 00:27:35 , subject to the Cam
bridge Core terms of use, available at https://w
ww
.cambridge.org/core/term
s . https://doi.org/10.1079/BJN19870017
Zinc deJiciency and muscle protein turnover 155 Lundholm, K., Edstrom, S., Ekman, L., Karlberg, I., Walker, P. & Schersten, T. (1981). Clinical Science 60,
Mego, J. L. (1976). Journal of Biochemistry t Pharmacology 25, 753-756. Mills, C. F., Quarterman, J . , Chesters, J. K., Williams, R. B. & Dalgarno, A. C. (1969). American Journal of
Millward, D. J. & Bates, P. C. (1983). Biochemical Journal 214, 607-615. Millward, D. J., Bates, P. C., Brown, J. G., Cox, M., Giugliano, R., Jepson, M. & Pell, J. M. (1985). Progress
Millward, D. J. , Garlick, P. J., Nnanyelugo, D. 0. & Waterlow, J. C. (1976). Biochemical Journal 156, 185-188. Millward, D. J., Garlick, P. J., Stewart, R. J. C., Nnanyelugo, D. 0. & Waterlow, J . C. (1975). Biochemical Journal
Millward, D. J . , Nnanyelugo, D. O., James, W. P. T. & Garlick, P. J . (1974). British Journal of Nutrition 32,
Millward, D. J., Odedra, B. & Bates, P. C. (1983). Biochemical Journal 216, 583-585. Millward, D. J. & Waterlow, J . C. (1978). Federation Proceedings 37, 2283-2290. OLeary, M. J., McClain, C. J. & Hegarty, V . J. (1979). British Journal of Nutrition 42, 487-495. Odedra, B. R., Bates, P. C. & Millward, D. J. (1983). Biochemical Journal 214, 617-627. Odedra, B. R., Dalal, S. S. & Millward, D. J. (1982). Biochemical Journal 202, 363-368. Odedra, B. R. & Millward, D. J. (1982). Biochemical Journal 204, 663-672. Oner, G., Bhaumick, B. & Bala, R. M. (1984). Endocrinology 114, 1860-1863. Prasad, A. S. (editor) (1978). In Trace Elements and Iron in Human Metabolism, p p . 251-246. New York, London:
Prasad, A. S. & Oberleas, D. (1973). Journal of Laboratory and Clinical Medicine 82,461-466. Rennie, M. J., Edwards, R. H. T., Krywawych, S., Davies, C. T. M., Halliday, D., Waterlow, J. C. & Millward,
Rennie, M. J. & Millward, D. J. (1983). Clinical Science 65, 217-225. Robinson, L. K. & Hurley, L. S . (1981). Journal ofNutrition 111, 869-877. Snedecor, G. W. & Cochran, W . G. (1967). Statistical Methods, 6th ed., p. 194. Iowa: The Iowa State University
Southon, S., Livesey, G., Gee, J. M. & Johnson, I . T. (1985). British Journal of Nutrition 53, 595-603. Suwarnasarn, A,, Wallwork, J. C., Lykken, G. I., Low, F. N. & Sandstead, H. H. (1982). Journal of Nutrition
Terhune, M. W. & Sandstead, H. H . (1972). Science 177, 68-69. Todd, W. R., Elvehjhem, C. A. & Hart, E . B. (1934). American Journal OfPhysiology 107, 146-156. Underwood, E. J. (1977). Trace Elements In Human and Animal Nutrition, 4th ed., New York: Academic Press. Vallee, B. L. & Falchuk, K . H. (1981). In Trace Element Deficiency, pp. 185-197 [L. Fowden, G. A. Carton and
Wallwork, J. C. & Duerre, J. A. (1985). Journal ofNutrition 115, 252-262. Wallwork, J. C. , Fosmire, G. J. & Sandstead, H. H. (1981). British Journalof Nutrition 45, 127-136. Wolman, S. L., Anderson, G. H., Marliss, E. B. & Jeejeebhoy, K. N. (1979). Gastroenterology 76, 458467. Young, V. R. & Munro, H. N. (1978). Federation Proceedings 37, 2291-2297.
319-326.
Clitzical Nutrition 22, 124g1248.
in Clinical and Biological Research 180, 531-542.
150, 235-243.
127-1 42.
Plenum Book Company.
D. J. (1981). Clinical Science 61, 627-639.
Press.
112, 132G1328.
C . F. Mills, editors]. London: The Royal Society.
Printed in Great Britain
Dow
nloaded from https://w
ww
.cambridge.org/core . IP address: 65.21.228.167 , on 31 Jan 2022 at 00:27:35 , subject to the Cam
bridge Core terms of use, available at https://w
ww
.cambridge.org/core/term
s . https://doi.org/10.1079/BJN19870017


![Nitrogen, phosphorus and zinc enhance Maize hybrid productivity … · 2016-12-29 · [16, 17]. Zn deficiency causes stunted growth, slow cell division, susceptibility to disease](https://img.pdfslide.us/doc/110x75/5f5150aae5f918157102baab/nitrogen-phosphorus-and-zinc-enhance-maize-hybrid-productivity-2016-12-29-16.jpg)

![*20SCH1201* · is formed from zinc and chlorine atoms. [2] (b) Zinc is an essential trace element. People who have a zinc deficiency can take hydrated zinc sulfate, ZnSO 4.xH 2O,](https://img.pdfslide.us/doc/110x75/5ebdaa9974911f3abe2789f9/20sch1201-is-formed-from-zinc-and-chlorine-atoms-2-b-zinc-is-an-essential.jpg)