Embed Size (px)
Citation preview
Utah State University Utah State University
DigitalCommons@USU DigitalCommons@USU
All Graduate Theses and Dissertations Graduate Studies
12-2016
The Effects of Rootstock, Scion, Grafting Method and Plant The Effects of Rootstock, Scion, Grafting Method and Plant
Growth Regulators on Flexural Strength and Hydraulic Resistance Growth Regulators on Flexural Strength and Hydraulic Resistance
of Apple of Apple
Stuart W. Adams Utah State University
Follow this and additional works at: https://digitalcommons.usu.edu/etd
Part of the Plant Sciences Commons
Recommended Citation Recommended Citation Adams, Stuart W., "The Effects of Rootstock, Scion, Grafting Method and Plant Growth Regulators on Flexural Strength and Hydraulic Resistance of Apple" (2016). All Graduate Theses and Dissertations. 5075. https://digitalcommons.usu.edu/etd/5075
This Thesis is brought to you for free and open access by the Graduate Studies at DigitalCommons@USU. It has been accepted for inclusion in All Graduate Theses and Dissertations by an authorized administrator of DigitalCommons@USU. For more information, please contact [email protected].
THE EFFECTS OF ROOTSTOCK, SCION, GRAFTING METHOD AND PLANT
GROWTH REGULATORS ON FLEXURAL STRENGTH AND HYDRAULIC
RESISTANCE OF APPLE
by
Stuart W. Adams
A thesis submitted in partial fulfillment of the requirements for the degree
of
MASTER OF SCIENCE
in
Plant Science
Approved: ______________________ ____________________ Brent Black, Ph.D. Bruce Bugbee, Ph.D. Major Professor Committee Member ______________________ ____________________ Gennaro Fazio, Ph.D. Mark McLellan, Ph.D. Committee Member Vice President for Research and Dean of the School of Graduate Studies
UTAH STATE UNIVERSITY Logan, Utah
2016

ii
Copyright © Stuart Adams 2016
All Rights Reserved
iii ABSTRACT
The Effects of Rootstock, Scion, Grafting Method and Plant Growth Regulators on
Flexural Strength and Hydraulic Resistance of Apple
by
Stuart W. Adams, Master of Science
Utah State University, 2016
Major Professor: Dr. Brent Black Department: Plants, Soils and Climate
The apple rootstock ‘Geneva® 41’ (‘G.41’), is desirable for its resistance to fire
blight, Erwinia amylovora, while producing high yields. However, ‘G.41’ and other
Geneva® selections tend to form weak graft unions in the nursery that are susceptible to
breaking in the wind, at harvest, or during shipment. In order to understand and remedy
this graft union weakness, six scions (‘Fuji’, ‘Gala’, ‘Honeycrisp’, ‘McIntosh’, ‘Pink
Lady’, and ‘Scilate’) by seven rootstocks (‘G.41’, ‘G.935’, ‘G.214’, ‘G.11’, ‘M.9-NIC
29’, ‘B.9’ and ‘EMLA 26’), by two grafting methods (chip bud and saddle graft) in a
factorial design were tested for graft union flexural strength and flexibility. Additionally,
plant growth regulators (PGR) were applied to trees with ‘G.41’ as rootstock as a solution
to overcome graft union weakness. Transpiration rate and hydraulic resistance were
measured for comparison of a weak graft forming rootstock (‘G.41’) to a strong graft
forming rootstock (‘M.9-NIC 29’). ‘G.41’ consistently formed a weaker graft union
iv regardless of scion or grafting method. Scions such as ‘McIntosh’ and ‘Pink Lady’
formed stronger graft unions, while ‘Scilate’ and ‘Honeycrisp’ form weaker graft unions.
Saddle grafting did not improve graft union strength. Nurseries that graft on ‘G.41’
should choose scions that form stronger graft unions. Benzyl adenine (BA) in a latex
paint increased the strength and flexibility of the graft union relative to scion cross
sectional area (SCSA), but further research is needs to identify more efficient methods of
application. Rootstock effect on transpiration rate was different between years. No
detectable differences were found for hydraulic resistance through the graft union of
different rootstocks, suggesting weaker graft unions did not limit hydraulic conductance
or transpiration rate. Thus graft union weakness is not an indicator of poor vascular
connection.
(172 pages)
v PUBLIC ABSTRACT
The Effects of Rootstock, Scion, Grafting Method and Plant Growth Regulators on
Flexural Strength and Hydraulic Resistance of Apple
Stuart W. Adams
Fruit trees are always produced through grafting, which unites two genetically
distinct plant parts at a graft union to make a complete tree. The two parts are termed the
scion (fruiting system) and rootstock (root system). Some rootstock cultivars tend to form
weaker graft unions that are susceptible to breaking due to wind, harvest or shipment of
finished trees. Some Geneva® apple rootstocks, especially ‘Geneva® 41’ (‘G.41’), form
weak graft unions leading to large losses to commercial nurseries.
In an effort to understand and possibly remedy the problem, flexural strength was
determined for the graft unions of weak graft forming rootstock compared to other
rootstock in a factorial study of six scion cultivars grafted onto seven rootstock cultivars
using two grafting techniques (chip bud and saddle graft). Additionally, trees grown on
‘G.41’ rootstock received applications of plant growth regulators (PGR) in a spray over
the leaves, and as a latex paint application directly on the graft union. PGR treated trees
were tested for changes in growth and graft union strength. Transpiration rate and
hydraulic resistance were used on a sub-sample to see if a weaker graft union (‘G.41’)
was correlated with less water flow through the graft.
vi ‘G.41’ consistently formed weaker graft unions regardless of what scion, or
grafting technique was used. Scion cultivars, such as ‘McIntosh’, formed stronger unions,
while ‘Scilate’ formed weaker unions. Saddle grafting did not improve the graft union
strength over chip budding and is thus not a justified remedy for graft union weakness.
Benzyl adenine (BA) in a latex paint and prohexadione-calcium (PCa) both increased the
strength of the graft union relative to scion cross-sectional area (SCSA). However, further
research is needed to find efficient application methods for BA. The rootstock effect on
transpiration rate were opposite between trial years. Hydraulic resistance testing yielded
no detectable difference between rootstocks for graft resistance. These suggest that
weaker graft unions were not correlated with reduced flow and transpiration rate.
vii ACKNOWLEDGMENTS
I would like to thank Willow Drive Nursery first for making this research possible
through the donations of several thousand trees. I would also like to thank the Utah
Agriculture Experiment Station, Cornell University in connection with the United States
Department of Agriculture and the International Fruit Tree Association for funding this
project. I would also like to thank Terrence Robinson in providing the original idea and
protocol for this research project. I would especially like to thank my committee
members, Drs. Brent Black, Gennaro Fazio and Bruce Bugbee, for their support and
assistance throughout the process.
Additionally, I would like to thank Dr. Nick Roberts for his assistance with flexural
strength testing in the engineering lab, and James Frisby for his help in the greenhouse.
I give special thanks to my family, especially my dear wife, Angelica, who has supported
and assisted me in all stages of the research. I dedicate this work to her and our daughter
Eva.
Stuart W. Adams
viii CONTENTS
Page
ABSTRACT ...................................................................................................................... iii
PUBLIC ABSTRACT .........................................................................................................v
ACKNOWLEDGMENTS ............................................................................................... vii
LIST OF TABLES ..............................................................................................................x
LIST OF FIGURES ........................................................................................................ xiii
CHAPTER
I. LITERATURE REVIEW ......................................................................................1 Introduction .............................................................................................................1 Graft Formation ......................................................................................................2 Graft Incompatibility ..............................................................................................8 Wood Formation ...................................................................................................14 Measuring Incompatibility ....................................................................................16 Remediation for Improved Graft Formation .........................................................26 Conclusion ............................................................................................................34 Literature Cited .....................................................................................................36 II. THE EFFECT OF ROOTSTOCK, SCION, AND GRAFT METHOD ON THE GRAFT UNION FLEXURAL STRENGTH AND RIGIDITY OF
APPLE ...........................................................................................................42 Abstract ..................................................................................................................42 Introduction ...........................................................................................................43 Materials and Methods ..........................................................................................46 Results and Discussion ..........................................................................................51 Conclusion ............................................................................................................60 Literature Cited .....................................................................................................61 Tables .....................................................................................................................62 Figures....................................................................................................................76 III. THE EFFECT OF PLANT GROWTH REGULATORS ON APPLE GRAFT UNION FLEXURAL STRENGTH AND FLEXIBILITY ............. 83 Abstract ..................................................................................................................83 Introduction ...........................................................................................................83 Materials and Methods ......................................................................................... 90 Results and Discussion .........................................................................................95 Conclusion ............................................................................................................98 Literature Cited .....................................................................................................99

ix Tables ...................................................................................................................102 Figures..................................................................................................................107
IV. HYDRAULIC RESISTANCE OF ‘SCILATE’ AND ‘FUJI’ ON
‘GENEVA®41’ AND ‘M.9-NIC 29’ ROOTSTOCKS WITH TWO GRAFTING METHODS ..............................................................................109
Abstract ................................................................................................................109 Introduction ..........................................................................................................110 Materials and Methods .........................................................................................115 Results and Discussion ........................................................................................120 Conclusion ......................................................................................................... 128 Literature Cited ...................................................................................................129 Tables ...................................................................................................................131 Figures..................................................................................................................134 V. CONCLUSION ................................................................................................139
APPENDICES ................................................................................................................142
APPENDIX A. ADDITIONAL TABLES AND FIGURES ....................................143
x LIST OF TABLES
Table Page
2.1 Rootstock-Scion Combinations Used in the 2014 Break Strength Study .........62
2.2 Break Categorization, Category Number for Analysis, and Description of Break Categories for Break Strength Study ....................................................62
2.3 Break Force, Graft Cross-sectional Area (GCSA), and Force Per Graft Cross-Sectional Area (F/GCSA) for the Main Effects as well as ANOVA p values for Analysis over August and October of 2014 ................63 2.4 October 2015 Analysis of Variance for Break Force, Scion Cross- Sectional Area (SCSA), Force Per Scion Cross-Sectional Area (F/SCSA), Graft Cross-Sectional Area (GCSA), and Force Per Graft Cross-Sectional Area (F/GCSA) Analyzed for Graft Type Separated. ..........64 2.5 October 2015 Comparison of Force (N) for the Rootstock*Scion Interaction by Graft Type ...............................................................................65 2.6 October 2015 Comparison of Scion Cross-Sectional Area (SCSA; cm2) for the Rootstock*Scion Interaction by Graft Type. ......................................66 2.7 October 2015 Comparison of Force Per Scion Cross-Sectional Area (F/SCSA; N/cm2) for the Rootstock*Scion Interaction Per Graft Type .........67 2.8 October 2015 Comparison of Graft Cross-Sectional Area (GCSA; cm2) for the Rootstock*Scion Interaction Per Graft Type. .....................................68 2.9 October 2015 Comparison of Force Per Graft Cross-Sectional Area (F/GCSA; N/cm2) for the Rootstock*Scion Interaction Per Graft Type ........79 2.10 Analysis of Variance for Break force, Graft Cross-Sectional Area (GCSA) and Force Per Graft Cross-Sectional Area (F/GCSA) from the 2-year Time Course Where Trees from the Same Plots were Sampled Twice Each Year Over Two Years .................................................................70 2.11 A Comparison of Scion and Rootstock Brittleness Carried Out in October
2015. ...............................................................................................................70
2.12 Analysis of Variance for Deflection of Graft Union Segments for October 2015, with Graft Type Analyzed Separately ..................................................71
xi 2.13 Comparison of Deflection (cm) Averaged Over Direction for Each Graft Type for October 2015 ....................................................................................72 2.14 October 2014 Break Categorization for the Rootstock or Rootstock*Direction Interaction Per Graft Type ............................................73 2.15 October 2015 Chip Bud Break Categorization Analysis for the Significant Scion Effect and Rootstock*Direction Interaction ......................74 2.16 October 2015 Saddle Graft Break Categorization Results for the Significant Rootstock and Direction Effect ....................................................75 3.1 Plant Growth Regulator Treatments Used in 2014 .........................................102 3.2 Break Categorization, Category Number for Analysis, and Description of Break Categories for Plant Growth Regulator Study ...............................103 3.3 The Plant Growth Regulators Treatments Used in 2015, Their Concentration, Application Method, and Number of Applications ..............103 3.4 The Effect of Plant Growth Regulator (PGR) Treatments on Flexural Strength (Force in N), Graft Cross-Sectional Area (GCSA), Scion Cross-Sectional Area (SCSA), Force Per Graft Cross-Sectional Area (F/GCSA), Force Per Scion Cross-Sectional Area (F/SCSA), Height and Their Ranks in the 2014 Study Averaged Over ‘Scilate’ and ‘Gala’ .....................................................................................................104 3.5 A Comparison of Scion Cultivar and Plant Growth Regulator Main Effects for 2015 Treatments .........................................................................105 3.6 Interaction Effects of Plant Growth Regulator and Scion Treatment on Scion Cross-Sectional Area (SCSA) in the 2015 Study ...............................106 3.7 A Comparison of Tree Height (cm) Over Three Measurement Periods in the 2015 Study ..........................................................................................106 4.1 A Description of the Incomplete Factorials for 2014 and 2015 Transpiration Trials ......................................................................................131 4.2 2014 Comparison of the Ending Root Mass Per Scion Cross-Sectional Area (SCSA) .................................................................................................131 4.3 2015 Comparison of the Ending Root Mass Per Scion Cross-Sectional Area (SCSA). ................................................................................................132
xii 4.4 2014 Pressure Chamber Results and ANOVA p values for Rootstock
Resistance (MPa min mL-1), Cross-Sectional Area (RCSA, cm2), and RCSA-Specific Resistance (RCSA-Resistance, MPa min cm2 mL-1). .........132 4.5 2015 Pressure Chamber Results and ANOVA p values for Resistance (MPa min ml-1), Rootstock Cross-Sectional Area (RCSA, cm2), and Cross-Sectional Area Specific Resistance (CSA-Resistance, MPa min cm2 ml-1). .......................................................................................133 A2.1 The ANOVA p values for 2015 Data Analysis with a Split Plot Design with Tree as the Whole Plot Replicate Unit and Month as the Subplot Factor ............................................................................................................143 A2.2 August 2015 Comparison of Force (N) for the Rootstock*Scion Interaction Per Graft Type ............................................................................144 A2.3 August 2015 Comparison of Scion Cross-Sectional Area (SCSA; cm2) for the Rootstock*Scion Interaction Per Graft Type ....................................145 A2.4 August 2015 Comparison of Force Per Scion Cross-Sectional Area (F/SCSA; N/cm2) for the Rootstock*Scion Interaction Per Graft Type .......146 A2.5 August 2015 Comparison of Graft Cross-Sectional Area (GCSA; cm2) for the Rootstock*Scion Interaction Per Graft Type ....................................147 A2.6 August 2015 Comparison of Force Per Graft Cross-Sectional Area (F/GCSA; N/cm2) for the Rootstock*Scion Interaction Per Graft Type ......148 A2.7 Analysis of Variance for Break Force, Scion Cross-Sectional Area (SCSA), Force Per Scion Cross-Sectional Area (F/SCSA), Graft Cross-Sectional Area (GCSA), Force Per Graft Cross-Sectional Area (F/GCSA), Showing Direction Effects and Interactions in October 2015 ................................................................................................149 A2.8 Rootstocks Mean Separation by Month from 2-year Time Course,
Supplementary to Data Presented in Rootstock*Month Interaction Graphs ........................................................................................150 A3.1 2015 Plant Growth Regulator Results for the Break Type Scion*Direction Interaction Effect ...............................................................150
xiii LIST OF FIGURES
Figure Page
2.1 Apparatus Used for 3-point Flexural Strength Testing in Break Strength Study ...............................................................................................................76 2.2 Rootstock*Graft Interactions for Break Force, Graft Cross-Sectional Area (GCSA), and Force Per Graft Cross-Sectional Area (F/GCSA)
Averaged Over August and October Samples in 2014 ...................................77 2.3 Rootstock*Time and Graft Type*Time Interactions for Break Force, Graft Cross-Sectional Area (GCSA) and Force Per Graft Cross- Sectional Area (F/GCSA) for 2014 ................................................................78 2.4 Rootstock*Graft Type and Scion*Graft Type Interactions for Break Force, Force Per Scion Cross-Sectional Area (F/SCSA), and Force Per Graft Cross-Sectional Area (F/GCSA) for the October 2015 Sampling Date ................................................................................................79
2.5 2-year Time Course Comparison of Break Force, Graft Cross-Sectional Area (GCSA), and Force Per Graft Cross-Sectional Area (F/GCSA) for the Rootstock*Month and Scion*Month Interaction ................................80 2.6 Rootstock*Direction and Scion*Direction Interactions for Brittleness of Graft Types at the October 2015 Sampling ....................................................81 2.7 A Comparison of October 2015 Deflection (cm) for the Least Flexible
Direction Per Graft Type (Chip Up and Saddle Sideways) for Each Rootstock*Scion Combination and Ordered According to the Average
of the Two Directions from Greatest to Least Deflection ..............................82 3.1 Apparatus Used for 3-point Flexural Strength Testing in Plant Growth
Regulator Study ...........................................................................................107
3.2 The Effect of Foliar Prohexadione-calcium Application in July, 2015 on Tree Height and Internode Length ...............................................................108 4.1 2014 Tree Transpiration (g/min), Leaf Area (m2), and Leaf Area Specific (LA) Transpiration Rate (g/min/m2) for Scion*Date,
Rootstock*Date, Scion*Rootstock, and Graft*Date Interactions ................134 4.2 2014 Regression of Tree Transpiration Rate (g/min), and Leaf Area Specific Transpiration Rate (g/min/m2) in Relation to Leaf area (m2) .........135
xiv 4.3 2015 Tree Transpiration (g/min), Leaf Area (m2), and Leaf Area Specific (LA) Transpiration Rate (g/min/m2) for Scion*Date, Rootstock*Date, and Scion*Rootstock Interactions from Comparison 1 ................................136 4.4 2015 Tree Transpiration (g/min), Leaf Area (m2), and Leaf Area Specific (LA) Transpiration Rate (g/min/m2) for Scion*Date, Graft*Date, and
Scion*Graft Interactions from Comparison 2 ..............................................137 4.5 2015 Regression of Tree Transpiration Rate (g/min), and Leaf Area Specific Transpiration Rate (g/min/m2) in Relation to Leaf Area (m2) ........138 A2.1 October 2015 Force, Force Per Scion Cross-Sectional Area (F/SCSA), and Force Per Graft Cross-Sectional Area (F/GCSA) for the
Rootstock*Direction Interaction for Both the Chip Buds and the Saddle Grafts ................................................................................................151 A2.2 October 2015 Force, Force Per Scion Cross-Sectional Area (F/SCSA), and Force Per Graft Cross-Sectional Area (F/GCSA) for the Scion*Direction Interaction for Both the Chip Buds and the Saddle Grafts ................................................................................................152
CHAPTER 1
LITERATURE REVIEW
Introduction
The U.S. is second only to China as a producer of apples with an estimated crop
of 248.6 million bushels in 2013 (USApple, 2015). Apple production in the U.S. has
flourished and expanded to this level due to the utilization of clonal rootstocks.
Production of dwarfing rootstocks has greatly increased the yield efficiency of the
commercial apple orchard, which has increased the demand for high quality nursery trees.
However, many of the common dwarfing rootstocks such as Malling 9 (M.9) and Malling
26 (M.26) are highly susceptible to fire blight, an infection by the bacteria Erwinia
amylovora (Norelli et al., 2003). In these dwarfing rootstocks, fire blight often enters the
plant through blossoms or wounds in stems or leaves and then travels down and infects
the rootstock, which leads to girdling and eventual tree death (Robinson et al., 2007).
In an effort to overcome widespread infection and death of dwarfing apple
orchards, Cornell University, in collaboration with the United States Department of
Agriculture Agricultural Research Service (USDA ARS), have developed several
dwarfing rootstocks that have shown excellent fire blight resistance. These rootstocks are
identified as Geneva® rootstocks and are given a unique designation (i.e. ‘G.11’, ‘G.41’,
‘G.935’, etc.). Trees grown on Geneva® rootstocks usually stop the downward movement
of fire blight to the rootstock and instead allow for pruning of the infected limb from the
tree (Robinson et al., 2007; Russo et al., 2007).
In general, Geneva® rootstocks not only have superior resistance to fire blight, but
also have resistance to crown and root rots from Phytophthora while inducing high yield
2 efficiency, and good fruit size (Fazio et al., 2013). However, some of the Geneva®
rootstocks, especially ‘Geneva® 41’, appear to have weak or brittle graft unions that are
susceptible to breakage in the nursery (R. Adams, personal communication). This
weakness has been observed especially during strong wind events or during harvest and
shipment. Due to the disease resistance and economic potential of these new Geneva®
rootstocks, research to understand and remedy this problem is of great importance to the
apple industry. The following is a discussion of research relevant to graft union
development, graft compatibility, and techniques to improve graft union strength and
function. This literature review provides a framework for understanding the problem of
weak graft unions experienced with some Geneva® rootstocks.
Graft Formation
Grafting is the bringing together of two similar, yet genetically distinct plant parts
that can, under appropriate conditions, form a composite plant. For most grafting
purposes the two plant parts used are called the rootstock and the scion. The rootstock
consists of the root system and an above ground stem portion. In the case of apple,
rootstocks are often categorized according to tree vigor, such as dwarfing, semi-dwarfing,
semi-vigorous, and vigorous. Rootstocks also differ in their resistance to pests and
disease, and in their influence on fruiting. The scion is the cultivar or variety that makes
up the top of the plant. In the case of apple, the scion can be any of the thousands of apple
varieties depending on what the grower desires.
Two main types of grafting are used in the industry and in research, which are
known as bench grafting and budding. Bench grafting utilizes scion tissue that contains
3 several viable buds and is primarily done in the early spring while the rootstock and scion
tissue is dormant. The budding technique uses scion tissue in the form of only one viable
bud and a small portion of subtending stem tissue, and is done in the late summer with
living scion wood. These budded trees are then transplanted from the nursery in the
spring before bud break (known as “sleeping eye”) or in the fall after a season of growth.
Hartmann et al. (2011) provides a good review of the several commonly used methods of
grafting and budding. The sequence of events that takes place in graft formation have
been thoroughly reviewed and presented for both herbaceous and woody plants
(Hartmann et al., 2011; McCully, 1983; Moore, 1983a; Pina and Errea, 2005; Rogers and
Beakbane, 1957). Regardless of how each event is presented, all descriptions of graft
formation have the same four characteristics, namely, initial necrotic/isolation layer
deposition, callus bridge formation, cambial layer differentiation, and secondary xylem
and phloem development.
The necrotic layer, sometimes called an isolation layer, is the first structure to
form between the rootstock and scion during grafting and occurs regardless of the degree
of compatibility (Moore and Walker, 1981a; Moore and Walker, 1981b; Soumelidou et
al., 1994; Stoddard and McCully, 1980). The necrotic layer is made up of the contents of
cut cells and cell walls (Asante and Barnett, 1997; Stoddard and McCully, 1980) and is
observed to occur 1-2 cell layers deep in some species (Moore and Walker, 1981a). This
structure is believed to be a part of the natural wounding response and serves to seal up
and protect the cut surfaces (Hartmann et al., 2011). Since the necrotic layer occurs in
wounding, some may disregard it as a step in graft formation. However, it can serve as a
4 qualitative and quantitative indicator of compatibility in some graft combinations and
eventually influencing graft strength (Moore, 1983b) and possibly hydraulic conductance.
Soon after scion and rootstock are brought in contact, callus proliferation occurs
to eventually form a continuous bridge of callus cells between the graft partners. Callus
cells primarily differentiate from the cambial cells, phloem and xylem parenchyma, and
outer cortex; it has also been seen to occur in the inner cortex and pith to a lesser degree
(Asante and Barnett, 1997; Ermel et al., 1997; Jeffree and Yeoman, 1983; Sass, 1932;
Soumelidou et al., 1994; Stoddard and McCully, 1980). If the graft partners are of equal
size, the scion tends to produce more callus tissue possibly due to increased basipetal
transport of photosynthates (Jeffree and Yeoman, 1983; Kollmann and Glockmann, 1991;
Stoddard and McCully, 1980). In budding, the rootstock contributes more callus to the
callus bridge (Asante and Barnett, 1997). As callus cells continue to proliferate they
eventually fill the space, rupture the necrotic layer and interdigitate so that differentiating
between scion and rootstock cells is difficult (Kollmann and Glockmann, 1985; Moore
and Walker, 1981a; Sass, 1932; Soumelidou et al., 1994; Stoddard and McCully, 1980).
Kollmann et al. (1985) observed that rupturing of the necrotic layer occurred most
abundantly when vascular tissues were aligned, or when parenchymatic tissue of the
same kind were well aligned such as cortex/cortex or pith/pith. They also observed that
mismatched tissue had an almost continuous isolation layer, which may result in graft
failure (Kollmann et al., 1985). In some cases, pith cell proliferation doesn’t rupture the
necrotic layer, but instead the cells formed a wall under the graft line (Stoddard and
McCully, 1980). Asante and Barnett (1997) also observed that interdigitation occurred
most commonly at the cortex and towards the pith in mango. As the callus fills the space,
5 outer cells become suberized (Ermel et al., 1997; Sass, 1932) and form the periderm to
seal the union as a protection from desiccation and infection (Asante and Barnett, 1997).
During this phase of rapid callus cell division, an initial adhesion occurs to help
hold the graft partners together. Jeffree and Yeoman (1983) and Kollmann and
Glockmann (1991) thought that this occurs as pectic material is secreted into the graft
union. In addition, dictyosomes have been seen to accumulate near the necrotic layer and
appear to secrete materials into the space between cells (Kollmann and Glockmann,
1991; Moore and Walker, 1981a). Bead-like structures have also been seen to protrude
from callus cells, which are believed to mix and form a type of middle lamella (Jeffree
and Yeoman, 1983; Miller and Barnett, 1993). Miller and Barnett (1993) found that the
beads in Sitka spruce callus consisted of a homogenous matrix of pectins, carbohydrates,
proteins and fatty acids, with a vesicular core containing high amounts of carbohydrates
and pectins. Ermel et al. (1997) found this same accumulation between cells of pear/pear
and pear/quince grafts to be composed of cellulose and polyphenols. Regardless of the
composition of these secretions, they appear to provide some initial cohesive strength to
resist separation (Moore, 1983b).
Due to the formation of plasmodesmata between dividing cells, callus bridge
formation is thought to be when early cell-to-cell communication occurs (Jeffree and
Yeoman, 1983; Kollmann and Glockmann, 1991; Pina et al., 2012). Jeffree and Yeoman
(1983) suggested that as the pectin beads from callus cells coalesce and form a type of
middle lamella, the cell walls between cells begin to thin and draw closer together, which
allows plasmodesmata to begin to form. This finding has been supported by Kollmann
and Glockmann (1991) who also observed localized thinning of cell walls in the apical
6 region of callus cells where contact is made with other cells. They also observed that if
the wall of one partner didn’t thin, then half plasmodesmata would occur, and if neither
wall thinned, then short pseudo-plasmodesmata strands would develop. Diagrams of the
cell wall thinning theory can be found in Kollmann and Glockmann 1991 and Hartmann
et al., 2011. Kollmann et al. (1985) found that continuous plasmodesmata occur most
abundantly in well-matched vascular tissue. The opposite is true for other parts of the
graft, but it isn’t clear if this changes later in the life of the graft union. Although it is not
clear the role plasmodesmata have in graft formation, Pina et al. (2012) observed better
cell plasmodesmata connections in compatible grafts than in incompatible ones, which
suggest an important role in compatible graft unions.
Once a callus bridge has formed, cambial cells begin to differentiate across the
union. In grafting, wound-repair xylem and phloem may cross the union before the
cambium. However, with budding, the cambium development occurs first (Hartmann et
al., 2011). Cambial cells differentiate in proximity to the cut end of the cambium from
both sides (Asante and Barnett, 1997; Sass, 1932). Although the cambium is often seen to
develop between wound-repair xylem and phloem, it may also develop independently
(Stoddard and McCully, 1980). In budded and grafted trees, well-aligned cambium were
observed to form straight vessel connections, but when not well aligned, vessels may lay
along an s-shaped curve (Soumelidou et al., 1994) or a loop (Ermel et al., 1997). Poor
matching may also produce excess callus resulting in delayed cambium differentiation
(Sass, 1932). Moore (1983a) suggests that cell-to cell communication occurs at this point,
so poor matching would inhibit cell communication and cambial differentiation.
7 The final event that takes place is the production of secondary xylem to the inside
and phloem to the outside of the new vascular cambium (Sass, 1932). It is at this step that
much of the current literature has focused in describing incompatibility and will be
discussed in further detail later. Vascular continuity allows for water and nutrients
absorbed in the roots to be transported up the plant to the leaves where photosynthesis
converts carbon dioxide to sugars, which can then be transported back to the roots and
other plant parts (Aloni, 1987). If there is discontinuity to varying degrees, these normal
processes in the plant may be disrupted or limited and ultimately fail. Auxin has often
been suggested as the primary hormone involved in xylem differentiation and has been
seen to increase vessel number in grafts (Aloni, 1987; Soumelidou et al., 1994). The role
of Auxin and other hormones will be discussed later as part of possible remediation to
graft weakness.
In summary, successful graft formation occurs in four steps. First, a necrotic layer
forms on the cut surface of each graft partners. Second, parenchymatous tissue divides to
form callus cells that fill the space between the graft partners and form an initial cohesion
with cell wall materials. Third, the vascular cambium develops across the graft union
linking the two partners when in close contact. Fourth, secondary xylem and phloem re-
differentiate across the graft union forming adequate vascular continuity to support plant
growth.
Graft Incompatibility
The mechanisms for graft incompatibility are not universal to all species and graft
unions; in fact, graft incompatibility has been suggested to occur at any step of graft
8 formation (Moore, 1983a; Stoddard and McCully, 1980) and may not present itself until
later in the life of the plant (Herrero, 1951). This discussion will exclude
“incompatibility” due to virus infection or poor grafting technique, since these can often
be solved by using virus free plant material and increasing propagation skill. Instead, the
focus of this review for graft incompatibility will be on the types of incompatibility,
anatomical and physiological symptoms, and biochemical issues that leads to graft
failure.
Incompatibility has been described as being either localized or translocated
(Herrero, 1951). Hartmann et al. (2011) explains that localized incompatibility is
characterized by a layer of undifferentiated tissue in the graft union that causes weakness
and poor flow. However, localized incompatibility can be overcome by the use of
mutually compatible interstocks. Translocated incompatibility is characterized by general
ill health, leaf wilting, and phloem degeneration, which cannot be overcome by the use of
an interstock. Localized incompatibility has been seen in pear/quince grafts (Ermel et al.,
1999), and translocated incompatibility is often seen in peach/plum grafts (Zarrouk et al.,
2010). Incompatibility can be further divided into immediate incompatibility that occurs
in early stages of development, and delayed incompatibility, which may take several
years to manifest (Hartmann et al., 2011). Delayed incompatibility has been observed in
apricot/plum (Errea et al., 1994), pear/quince (Ermel et al., 1999; Espen et al., 2005), and
peach/plum grafts (Zarrouk et al., 2010). These differences in types of incompatibility
have made it challenging for researchers to fully understand the mechanisms for
incompatibility because they vary with species. However, many studies have shed light
on possible symptoms and mechanisms.
9 One of the most common symptoms of incompatibility is the interruption in
cambial activity and vascular continuity, which may lead to a smooth break at the graft
union (Hartmann et al., 2011). It has often been seen that initial adhesion and callus
proliferation can occur in incompatible grafts, but interdigitation and rupture of the
necrotic layer does not occur or occurs to a reduced degree. Instead lethal senescence
occurs and the necrotic layer thickens as seen between Sedum and Solanum (Moore and
Walker, 1981b). Kollmann and Glockmann (1985) found that grafts with few ruptured
areas in the necrotic layer led to only 50% survival and reduced growth. In the delayed
compatibility response of apricot, differentiation of xylem was delayed or less complete,
which left large portions of parenchymatous tissue intermingling with vascular tissue
resulting in a weak union (Errea, 1998; Errea et al., 1994; Pina and Errea, 2005; Pina et
al., 2012). Errea et al. (1994) observed that in bud unions only the lower portion of the
interface experienced communication between graft partners during early stages, while
the rest was mostly parenchymatous tissue. Espen et al. (2005) observed this same
delayed differentiation of vascular tissue in micro-grafted pear callus. Cambial involution
and poor conformity in cambial cells were observed in incompatible pear/quince grafts
(Ermel et al., 1999) and nectarine/plum grafts (Zarrouk et al., 2010). Ermel et al. (1999)
saw a sharply visible interface in the bark of pear/quince grafts. They suggested that bark
separation spreads inwards as the tree ages, which eventually leads to separation of
vascular tissue. Moing et al. (1987) observed that radiolabeled deoxyglucose did not
transport very well through the incompatible peach/plum grafts compared to compatible
unions, which supports the findings of reduced phloem connections. Zarrouk et al.
(2010) also observed discontinuous phloem and structural disorder in the nectarine/plum
10 grafts. Similar structural disorders were observed by Soumelidou et al. (1994) and Ermel
et al. (1999), who found lignified, circular or ring-shaped meristems in the callus bridge.
In these examples it is clear that interruption of either proper xylem or phloem
development is a large cause/symptom for incompatibility.
Other anatomical differences have also been observed in incompatible grafts.
Errea et al. (1994; 2001) found that the cell walls in incompatible combinations didn’t
stain well for cellulose. Cellulose is suggested to be primarily responsible for tensile
strength, and by reducing the length of these molecules, a reduction in strength may be
observed (Durkovic et al., 2015). Durkovic et al. (2015) also suggest that rootstocks
contribute traits for lignin development to the composite tree, which may suggest further
scion/rootstock relationship problems.
In a review, Pina and Errea (2005) hypothesized that misaligned plasmodesmata
(as observed by Kollmann and Glockmann, 1991) is a result and a cause of poor cell-to-
cell communication leading to incompatibility. Cell-to-cell symplastic movement was
greatly decreased with incompatible grafts even as soon as callus cells touch (Pina et al.,
2009). Pina et al. (2012) observed better redistribution of dye into bleached cells in
compatible unions compared to incompatible unions, which suggests better
plasmodesmatal connections in compatible grafts.
Aside from anatomical differences, Roger and Beakbane (1957) suggested that
both physiological and biochemical effects play a part in determining incompatibility.
Differences in metabolic activity, or assimilates from one graft partner may be toxic or in
deficient levels for proper function of the graft partner. In addition, the graft partner may
not have the enzymes to use the forms of assimilates that are transported across the graft
11 union. Moore and Walker (1981b) observed higher starch in scion callus cells of Sedum,
while Ermel et al. (1999) saw this in pear/quince grafts. Moore (1984) suggests that
toxins accumulate at the graft interface and override morphogens (plant hormones) to
cause incompatibility and lead to cell senescence. Moore (1983a) also provides a model
for the incompatibility seen in pear/quince grafts in which the ascent of prunasin into the
pear scion leads to its conversion to hydrocyanic acid, causing abnormalities at the graft
interface. Similar to pear/quince grafts, Moing et al. (1987) observed a higher
concentration of prunasin in peach scion on incompatible plum rootstock, which he
suggest may convert to HCN (hydrogen cyanide) and benzaldehyde. In working with
spatially separated pear/quince callus, Nocito et al. (2010) observed an increase in
oxygen consumption that occurred in correlation with reduced growth and an increase in
activity of senescence-like genes. From this, Nocito et al. (2010) suggests that some
diffusible substance must cross the interface to cause the observed negative effects since
there was no intimate contact of the callus cells.
More recent efforts have focused on detection of incompatibility using phenol
analyses. Polyphenols and their accumulation may be an early indicator of
incompatibility since some phenols (flavanols) are synthesized in response to plant stress,
such as wounding (Errea, 1998). These phenols may then be oxidized by peroxidases
resulting in toxic polymerized quinones that inhibit auxin transport and lignin synthesis
(Errea, 1998; Errea et al., 1994; Gebhardt and Feucht, 1982). With Prunus avium/Prunus
cerasus, when symptoms of incompatibility were present (healthy union but wilting
leaves), total phenols, chlorogenic acids, and flavans (catechin, epicatechin, and
oligomeric material) were higher in the scion (Gebhardt and Feucht, 1982). Usenik et al.
12 (2006) found an accumulation of catechin above the graft in incompatible apricot grafts.
P-coumaric was also observed in higher concentrations in apricot grafts (Usenik et al.,
2006). Mng’Omba et al. (2008) found p-coumaric acid as a common phenol in the graft
interface of incompatible loquat, and that there was a higher concentration of cell wall
bound phenols. Large deposits of phenols were found in the extracellular space of graft
unions (Errea, 1998; Errea et al., 1994). Gebhardt and Feucht (1982) found that
homogenetic grafts had relatively constant phenol levels, and phloem browning occurred
in association with low phenols, which was probably due to their oxidation. As has been
stated, high phenols may be oxidized to quinones, which then inhibit lignin synthesis
pathways and auxin accumulation (Errea, 1998; Errea et al., 1994; Gebhardt and Feucht,
1982). In support of this theory, Pina et al. (2012) found that reduced auxin and
lignification was associated with high phenols in incompatible grafts and may suggest
weak graft unions. From these studies, differences in phenols may lead to inhibition of
auxin accumulation and lignin synthesis, which are important for vascular differentiation
and strengthening.
Aside from polyphenols, studies on peroxidases have found some differences that
may serve as indicators for incompatibility. Santamour (1988) hypothesized in his review
of graft incompatibility that differences in isoperoxidases between cultivars may lead to
differences in lignin and lignin binding, which may interfere with bonding of adjacent
cell causing blocked pits, perforation plates and sieve plates in vascular tissue. Gulen et
al. (2002) analyzed isoperoxidases, or active proteins, in different quince and pear tissue
and observed that those cultivars involved in compatible grafts had at least one of two
common isoperoxidase bands appear during electrophoresis, while the incompatible
13 pear/quince combination did not. In the graft tissue, the incompatible unions had neither
of the isoperoxidases, even though just the quince rootstock tissue had one when not
grafted. Similar to the studies on pear and quince, Zarrouk et al. (2010) observed that
incompatible rootstocks of nectarine/plum grafts that exhibited translocated
incompatibility symptoms had isoperoxidase isozyme bands that were not found in graft
union tissue. These isoperoxidase bands were in a zone associated with lignin synthesis
(Zarrouk et al., 2010). In melon grafts, more abundant reactive oxygen species were
found on the cell walls, while peroxidase and superoxide dismutase were less abundant,
which suggests possible oxidation damage to cause incompatibility (Aloni et al., 2008).
Lastly, Guclu and Koyuncu (2012) observed high peroxidase levels above the graft in
sweet cherries. These studies suggest that there are observable differences in peroxidase
activity between compatible and incompatible graft unions, which may lead to
differences in oxidation damage as well as synthesis of lignin in the graft union.
It is clear from these studies that incompatibility in grafting is not a clearly
defined process. Most researchers agree that the formation of proper vascular tissue is
key to a compatible strong union. Research has shown that in many instances there is
either delayed or incomplete differentiation of xylem and/or phloem. Poor cell-to-cell
communication through misaligned plasmodesmata has also been observed in poor graft
unions. Differences in translocatable substances, phenols, and isoperoxidases have also
been seen in incompatible graft unions. Although all of these mechanisms for
incompatibility have been observed, they may not occur in every case of a physically
weak graft union. Because of this, determining incompatibility, especially delayed
14 incompatibility, can be difficult. More research needs to be done to further elucidate the
mechanisms of graft compatibility.
Wood Formation
Aside from proper graft formation and issues with incompatibility, biochemical
differences in wood formation may also be a source of weakness to Geneva® rootstocks.
Studies on wood formation are primarily done using conifers and model deciduous trees
such as poplar, but the concepts are applicable to other wood forming species. Woody
tissue is the result of secondary xylem development and secondary cell wall thickening,
which increases its strength and stiffness (Plomion et al., 2001). The cell wall consists of
five layers (ordered from most external to most internal): middle lamella, primary cell
wall, S1, S2, and S3 (Plomion et al., 2001; Winandy and Rowell, 2005). There are three
main types of cell wall components that influence strength and rigidity, including,
cellulose, hemicellulose, lignin (Plomion et al., 2001).
Cellulose, a polysaccharide, makes up the largest proportion of wood tissue,
which forms the primary structural units known as microfibrils (Plomion et al., 2001).
The cellulose in the microfibrils forms cross-linked chains considered crystalline, and
provide the main source of strength for wood tissue (Winandy and Rowell, 2005).
Cellulose chains of greater length provide greater strength per cell (Mark, 1967). This
added strength and rigidity is due to the numerous hydrogen bonds that can be broken
and reformed when under stress (Winandy and Rowell, 2005).
Hemicelluloses, or mixtures of polysaccharides often as heteropolymers (Plomion
et al., 2001), are another major component of cell walls and may function as connecting
15 material between cellulose and lignin (Winandy and Rowell, 2005). More recent studies
on hemicellulose showed initial strength loss was associated with degradation of
hemicellulose, which suggests a greater contribution to strength than originally thought
(Curling et al., 2002).
Lignin, a phenolic material, is sometimes referred to as adhesive because it help
hold the cell wall components together, while excluding water from polysaccharide
components by encasing them (Winandy and Rowell, 2005). Lignin also contributes
stiffness and strength to wood, since low-lignin transgenic poplar was shown to be
weaker and more flexible (Voelker et al., 2011). Additionally, high cellulose, but low
lignin were measured in wood that had been affected by apple rubbery wood disease,
which causes the limbs to be very flexible and unable to hold the weight of fruit
(Scurfeeld and Bland, 1962)
Differences in cellulose, hemicellulose, and lignin may be factors in graft union
weakness as a sole contributor or in combination with graft union compatibility. If
weakness were not due to true “incompatibility,” then “affinity” would be a better term
used to describe graft union weakness. Combinations that do not have a good affinity
would form a successful union, but may be mechanically weak or have other poor
qualities important to a nursery and orchard like vigor and yields. Principles for wood
formation should be considered when methods for measuring compatibility are
compared, especially for methods that measure physical strength and flexibility.
16 Measuring Incompatibility
Due to the many possible symptoms and mechanisms for incompatibility, being
able to quantitatively or qualitatively measure compatibility/incompatibility can be
difficult. Many methods for measuring graft compatibility focus on identifying whether
vascular differentiation occurs. These methods include break or tensile strength,
hydraulic conductance, electrical conductance, and anatomical analysis through magnetic
resonance imaging, staining, and microscopy. Other methods of measuring
incompatibility address histological abnormalities such as cell-to-cell communication,
phenols, and isoperoxidases. This research focuses directly on the resulting physical
properties of graft unions to compare compatibility.
Tensile/Break Testing
Tensile strength is measured as the force required to pull the graft union apart as
an estimate of internal tensile stress. Similarly, flexural strength by bending to failure is
an estimate of tensile, compressive, and shear stress (Winandy and Rowell, 2005). Both
methods have been used successfully for testing graft unions of woody and herbaceous
species. Weakness, as defined using these methods, suggests a decreased ability to handle
internal stresses due to poor tissue connection. Parkinson and Yeoman (1982) suggested
that a graft is fully developed when significant strength has been reached, due to the
increased wound vessel members per graft union cross-sectional area. However, slight
variations exist within methods due to advancements in technology over time as well as
other factors such as wood chemistry. Flexibility or elasticity, the deformation due to
internal strain (Winandy and Rowell, 2005), or its opposite, brittleness, are other
17 variables that can be measured using these two methods and become useful when
differences in wood formation are significant.
Lindsay et al. (1974) used a tensile strength method that grasped the plant on each
side of the graft union, and then weight was uniformly added to a lever, which pulled the
grafts apart. The weight required to reach failure was then recorded. Moore (1983b) used
this same technique to compare self-grafted Sedum and Sedum/Solanum heterografts with
automatic additions of weight to the lever. Measurements were reported as tensile
strength usually in grams per graft contact area (cross-sectional area of the graft union)
for horizontally cut grafts. Moore (1983b) found that compatible and incompatible grafts
experience the same increase in strength due to initial adhesion, but only in the
compatible self-graft did the strength continue to increase and reach the tensile strength
of an un-grafted internode. Tensile strength has also been tested on whip grafted sweet
cherry trees by vertically positioning the sample with clamps attached at each end, while
an Instron pulled the graft union apart (Pedersen, 2005). An Instron is a universal testing
instrument that is fully mechanized with electronic logging of forces. From this study,
Pedersen (2005) reported their data as a function of the graft union circumference since
measuring the contact area of the whip graft wasn’t feasible. Compatibility was then
reported as tensile strength of scion/stock combination relative to the self-grafted
rootstock.
Instead of the tensile strength method, Evans and Hilton (1957) used the flexural
strength method, which involved holding the sample horizontally in a clamp and pulling
back on a lever attached to the scion end of the sample with bud facing away from the
operator. The results of Evans and Hilton (1957) are not conclusive because proper
18 controls were not used for comparison. Lapins (1959) used the same method as Evans
and Hilton (1957) on apricot budded to peach rootstock and found unreliable results. The
data were contradictory, which may be due to variability in seed propagated rootstocks
used in these studies. Valuable information about the development of the graft union can
still be gained from doing these break strength studies, but standardizing the measured
forces for comparison can be a challenge. Factors other than vascular tissue, such as
wood chemistry, may also affect the outcomes from a tensile or break strength test so
results should not be over interpreted.
Hydraulic conductance
In tensile testing, increased strength of the graft was seen with the onset of
vascular differentiation in vegetable grafts, however, increases of strength due to wood
formation may not be adequately accounted for (Moore, 1983b). In order to single out
differences of vascular tissue, hydraulic conductance through the graft union can be
measured. Hydraulic conductance is measured as the mass or volume of water to flow
over a specific time period divided by the pressure difference (kg s-1 MPa-1).
Conductance may be compared between samples of different diameters by dividing by
the cross-sectional area of the sample (kg s-1 MPa-1 cm-2) (Sperry et al., 1988; Tyree and
Ewers, 1991). Similarly, conductivity takes into account differences in sample length and
can be used to find leaf specific conductivity (Kg m-1 s-1 MPa-1), or the amount of leaf
area supported may also be reported (Tyree and Ewers, 1991). Instead of conductance,
hydraulic resistance may be reported because resistance (MPa s kg-1) is the inverse of
conductance (Atkinson et al., 2003; Solari et al., 2006; Tyree et al., 1995). Many
19 experiments measure conductance/resistance through the graft union by subtracting the
rootstock and scion segment resistance from the whole plant resistance. Several methods
of measuring conductance/resistance will now be described.
Pressure Chamber. One of the earlier methods for measuring conductance utilizes
large pressure chambers similar to ones used for measuring water potential in plant
samples. Gee et al. (Gee et al., 1973) placed the intact root system of a plant in the
pressure chamber and measured the change of transpiration when positive pressures were
applied to the roots. While their research was designed to measure transpiration, the
apparatus for testing conductance in pressure chambers is similar.
While testing whole plant conductance, Tyree et al. (1995) used the pressure
chamber method as a standard for comparison in developing a different apparatus, which
supports its validity for measuring conductance. Tyree et al. (1995) used the positive
pressure of the chamber to push water up out of the stem. The water was then pumped to
a scale and the weight was measured. They found that the slope of the line for flow over
pressure (kg s-1 MPa-1) approaches the true conductivity of the sample when using a
pressure chamber (Tyree et al., 1995). Tworkoski and Fazio (2008; 2016) used a similar
method for measuring flow (ml/hr) and collecting exudate for grafted apple trees and
found that dwarfing rootstocks tended to have less flow than semi-dwarfing and vigorous
rootstocks, which may be due to less extensive root systems. Although these studies have
sought to measure conductance of the whole plant, the method for measuring flow
through the graft union is still possible in the pressure chamber apparatus if rootstock and
scion segment measurements can be subtracted from whole plant measurements.
20 High-pressure Flow Meter. Tyree et al. (1995; 1994) describes another method
for measuring flow through plants called the high-pressure flow meter. This apparatus
measures the pressure decrease across a capillary tube connected between a reservoir and
the attached sample. Instead of conductance, resistance is measured as MPa s kg-1 when
distilled water is forced through the sample. Dynamic measurements of rapidly changing
pressures can reach measurements similar to steady-state measurements, which would
take hours in gravity-fed flow meters (Tyree et al., 1994). Tyree et al. (1995) found that
the high-pressure flow meter obtained similar results to using a pressure chamber when
testing roots of seven different species, but was much more rapid and less affected by
bubbles. However, when measuring the resistance of an intact root system, the flow is
opposite to the natural direction for transpiration, which means solutes can concentrate in
the soil and lead to inaccuracy, thus requiring rapid measurements to be taken.
A couple of recent experiments have utilized the high-pressure flow meter to
specifically measure the resistance across the graft union. Solari et al. (2006) used this
method to measure the resistance of the graft unions of peach trees with different
rootstocks. They did this by first measuring the resistance through a wood segment with
the graft and then without the graft and found that the graft union contributed only 10%
of the tree resistance and had higher conductance than rootstock or scion segments after
the trees had spent one season in the nursery and seven months in the field. However,
their data do not adjust for differences in sample length and so it shouldn’t be surprising
to find higher conductance in short graft segment compared to the complex root system,
especially of older trees. Their data can still be used to compare across graft
combinations when just graft and scion segments were used to measure graft resistance.
21 Gasco et al. (2007) also used the high-pressure flow meter on olive grafts and found that
after 480 days of growth, the graft contributed only 3% of the whole tree resistance and
was similar for both vigorous and dwarf rootstocks. Although these studies are not
conclusive on the role of the graft union for all grafting situations, they do provide
valuable information on the method used to measure conductance/resistance with the
high-pressure flow meter.
Gravity-fed Flow Meter. Another method that has been used successfully is the
gravity-fed flow meter developed by Sperry et al. (1988). For this method a perfusing
solution is pumped to a secondary reservoir, which is then allowed to flow down via
gravity through the sample being tested and the solution that comes through the sample is
collected and weighed (Sperry et al., 1988). The major issue with this method is that it is
very slow since it relies on low pressure. Because this method is slow, microbial growth
can develop and lead to inaccuracies, so oxalic acid is used in the perfusing solution to
prevent microbial decline (Sperry et al., 1988). Embolisms can also be a problem, so it is
recommended that the sample be flushed with direct application of pressurized solution
(Sperry et al., 1988).
One of the more important experiments done using the gravity-fed flow meter was
that of Atkinson et al. (2003) on apple grafts of differing rootstock vigor. In their
experiment they measured the conductivity of a whole stem segment that consisted of the
rootstock stem, graft union, and scion stem. They then cut off the rootstock stem and
measured just the rootstock conductance. Following the rootstock conductance, they cut
off the scion stem and measure the scion conductance. The conductance of the graft was
then found by subtracting the rootstock and scion resistance (converted from
22 conductance) from the whole stem resistance. In measuring conductance/resistance, they
measured the mass of liquid per unit time, the pressure, and the length of the segments to
be able to make accurate comparisons while considering sample differences. Atkinson et
al. (2003) found that vigorous rootstock increased the conductivity of the whole plant and
its parts, and the grafts of the vigorous rootstocks had less resistance than the dwarfing
rootstock grafts while correcting for differences in segment length. The increased
conductivity in vigorous rootstocks was also related to an increased percentage of stained
xylem within the graft segments, suggesting that trees on vigorous rootstocks may have
increased conductance due to increased percentage of active xylem (Atkinson et al.,
2003). Using the gravity-fed flow meter is slow and not ideal for large sample sizes, but
the protocol described by Atkinson et al. (2003) for identifying graft conductance
provided good results and may be modified to another flow meter apparatus.
Negative Pressure Apparatus. In addition to the positive pressures due to gravity
or a pressure chamber, negative pressure by a vacuum has also been used with some
success. Evans and Hilton (1957) used a method that involved attaching six graft union
samples to burettes on one end, and a vacuum on the other and then measuring the
change in the water level in the burette over time under a set vacuum pressure. This
method suffers, however, due to the slow process and the increased chance of unequal
forces being experienced on different samples. Another apparatus developed by Kolb et
al. (1996) modified the gravity-fed flow meter for use with larger shoot systems, and used
a vacuum in order to mimic the negative pressure seen in transpiring plants. However as
negative pressures increased, the restriction to flow due to embolism increased (Kolb et
23 al., 1996). This method has its merits in trying to mimic transpiration, but results for
testing graft union conductance have not been published from this method.
Other Methods for Hydraulic Measurements. Three other methods have been used
to measure or observe the hydraulics through the graft union, including electrical
conductance, magnetic resonance imaging, and staining. Electrical conductance was
probably first used by Yang et al. (1992) and measured graft union development by
applying electrical currents through the graft and comparing differences in resistance.
Yang et al. (1992) measured a strong increase in resistance soon after grafting, which
decreased and leveled off after a few days in compatible vegetable grafts. In incompatible
grafts the resistance increased over time instead of decreasing like the compatible graft
(Yang et al., 1992). What this research suggests is that when poor vascular connections
are formed, resistance to electrical currents is increased and thus can be used to measure
graft union development. This method hasn’t been used much possibly due to difficulty
with sensors, however Mishra and Tiwari (2012) have been developing biosensors that
can be inserted into graft interfaces to measure the electrical resistance. On preliminary
tests in rose grafts, results similar to those described by Yang et al. (1992) have been
reported while testing the new biosensors (Mishra and Tiwari, 2012).
Magnetic resonance imaging (MRI) and staining have been successfully used to
make visual observations on the hydraulics of the graft union. Warmund et al. (1993)
showed that MRI can show whether there is vascular continuity or not by the absence or
presence of high signal intensity in the rootstock, bud shield, and scion. However, they
could not differentiate the source of discontinuity without other techniques. Safranin
staining however could be used to identify the source of discontinuity in the apple chip
24 grafts that had been tested with the MRI (Warmund et al., 1993). Atkinson et al. (2003)
used safranin staining in order to compare the functional xylem in grafted trees with
different rootstocks for correlation to the research using the gravity-fed flow meter. They
found that the percent of stained xylem increased in the graft and scion as the vigor of the
rootstock increased. They suggest that dwarf rootstocks may produce more wood at the
graft to make up for the lack of functional xylem (Atkinson et al., 2003). These methods
may be used for making visual comparisons, and have value in comparison to
conductance measurements.
Other Techniques
Several other techniques, aside from tensile testing and hydraulics, have been
used with varying degrees of success. These techniques can be grouped into four general
categories including, microscopy; lipid, cellulose, and polyphenol analysis;
carbohydrate/radiolabeled ion transport; and peroxidase and reactive oxygen species
analysis. These techniques will only be discussed briefly as a source for possible future
experiments.
Microscopy, both light and electron, have been used very frequently when
studying graft union development. The protocol for many experiments has been to graft
several hundred trees or plants of compatible and incompatible grafts and then observe
the histological differences between them. Much of what we know about the events of
graft formation are from these kind of studies (Asante and Barnett, 1997; Ermel et al.,
1999; Ermel et al., 1997; Errea et al., 1994; Espen et al., 2005; Jeffree and Yeoman,
1983; Kollmann and Glockmann, 1985; Kollmann and Glockmann, 1991; Kollmann et
25 al., 1985; Moore and Walker, 1981a; Moore and Walker, 1981b; Pina et al., 2012; Pina et
al., 2009; Shimomura and Fuzihara, 1977; Soumelidou et al., 1994; Stoddard and
McCully, 1980). Ermel et al. (1999) suggests that using multivariate analysis of both
macroscopic and histological measurements can show the variation or grades of
incompatibility. Ermel et al. (1999) observed from their analysis that compatible
pear/quince grafts were intermediate to compatible pear/pear and incompatible
pear/quince using the multivariate analysis.
Other efforts have focused on chemical analysis to identify differences in organic
material, such as lipids, cellulose and/or polyphenols. For example, Gebhardt and Feucht
(1982) observed high levels of polyphenols, especially chlorogenic acid and flavans, near
the graft with higher concentrations in the scion of Prunus avium on Prunus cerasus
rootstock. High levels of catechin and p-coumaric acid were found in less compatible
apricot grafts (Usenik et al., 2006). Mng’Omba et al. (2008) also found high levels of p-
coumaric acid at the interface of less compatible loquat grafts. Aside from phenols,
staining indicates both increased lipids and decreased cellulose in the cell walls of
incompatible apricot unions (Errea et al., 2001). In general, high phenols are often
reported in incompatible Prunus spp., however, less research has been done to identify
different phenol levels in apple grafts (Pina et al., 2012).
Carbohydrate transport and radiolabeled ion transport has also been used
frequently but requires much care and precision. This technique is similar to hydraulic
experiments in that it tries to check for continuity between graft partners. For example,
Moing et al. (1987) detected less sorbitol, and counted less radiolabeled deoxyglucose in
the rootstock of incompatible peach/plum grafts.
26 Lastly, analysis of peroxidase and reactive oxygen species has been used in
several studies to compare compatible and incompatible grafts in hopes of a method for
early detection of compatibility. Dissimilarities in isoperoxidases may indicate
incompatible unions due to interference with auxin or lignification (Gulen et al., 2002;
Zarrouk et al., 2010). Elevated peroxidase above the graft compared to below has been
observed in incompatible sweet cherry (Guclu and Koyuncu, 2012). In cucurbits, high
reactive oxygen species and low peroxidase and superoxide dismutase levels were found
in the graft (Aloni et al., 2008). Nocito et al. (2010) also found high levels of reactive
oxygen species incompatible pear/quince callus, which was correlated with senescence-
like genes being more expressive.
Conclusion
These other techniques have high potential for early determination of graft
compatibility. However, not all findings are conclusive and in agreement with others, and
few have been used on apple grafts. Many of these techniques require equipment and
techniques that are not readily available, so they will be set aside for possible future
studies. Instead, tensile testing and hydraulic conductance are relatively simple tests of
graft compatibility and strength and should be first used in analyzing possible problem
graft combinations. Histological studies, such as MRI and staining may also be used to
observe possible causes of variation in hydraulic and tensile tests.
27 Remediation for Improved Graft Formation
Although there is no common method currently used to successfully graft
genetically incompatible plants, cultural practices can help improve graft development
and plant survival of compatible combinations. Hartmann et al. (2011) identifies four
conditions necessary for successful grafting, which are separate from the issue of
compatibility:
1. The vascular cambium of the rootstock and the scion should be placed in direct
contact and held tightly together. Similarly sized graft partners are desired when
doing bench grafting.
2. Grafting should take place when scion and rootstock are in the appropriate
physiological condition, which depends on the grafting method.
3. All of the cut surfaces need to be protected from desiccation by wrapping with
tape, parafilm tape, budding tape, covered with moist sawdust, and/or kept in
humid conditions.
4. Removal of suckers and staking new growth to direct energy to where it is needed
and to prevent breaking of new growth when the graft is weak.
Several studies have sought to investigate practical approaches to provide the above
conditions. Yefalvi et al. (2013) found that “V” grafting of two apple cultivars on M.26
and three pear cultivars on quince resulted in increased callus formation, graft survival,
growth, and branching when compared to “omega” grafting. Cholid et al. (2014) found
that “V” grafts of physic nut improved compatibility as measured by increased leaf
glucose content, and a smaller gap between total sugars above versus below the graft
28 union. Additionally, Mng’Omba et al. (2013) investigated the effect of the length of the
cut surface on spliced graft mango, avocado and peach trees. They found that for mango
and peach, increased length of the cut surface improved graft success, while it had no
effect for avocado (Mng’Omba, 2013). Mng’Omba et al. (2013) found that 40 millimeter
cuts had good graft success for all three species. From these studies, it is possible that
success may be improved by various grafting methods and techniques.
Plant Growth Regulators
Many problems with graft success for compatible partners can be improved with
better grafting techniques. However, in some situations the graft union may appear
successful, but still be weak, and it is not known if delayed compatibility is a factor.
Some experiments have sought to use plant growth regulators to improve general graft
success either through improved callusing, vascular differentiation, or wood formation.
However, studies on plant growth regulators and grafting is difficult due to differences in
hormone balance between species and graft partners. Several plant hormones with
different possible roles in graft union development and strengthening have been
proposed.
Auxin. One of the first discovered, and probably most studied hormones is auxin,
which has been suggested to increase callus proliferation and vascular differentiation in
graft unions (Moore, 1983a). Auxin flows in a basipetal pattern from where it is
synthesized in the leaves and shoot tips down to the roots, and it has been shown to
decrease in concentration from top to bottom except at local sites of obstructions where it
induces vessel number increases and vessel diameter decreases (Aloni, 1987). Aloni
29 (1995) suggests that auxin controls the rate of differentiation of xylem cells, so a higher
concentration of auxin leads to more cells of smaller size since cell expansion stops when
the secondary wall is deposited. Low concentrations tend to promote more phloem
differentiation, while high concentrations lead to more xylem differentiation (Aloni,
1995). Savidge (1988) suggests that auxin allows cambial activity/divisions and xylem
development to proceed in the spring, however this doesn’t occur when applied basally to
cuttings. Savidge (1988) also suggest that auxin plays a role in tension wood formation.
Several studies have specifically shown the effects that auxin has on the graft
union. Stoddard and McCully (1980) observed in Coleus that when the leaves nearest the
graft on the scion were removed, the number of graft bridging vessels was decreased,
while leaves on the rootstock had no effect, which they suggest is related to basipetal
transport of auxin from its source in the leaves. In apple bud unions, the xylem cells
between the scion and the dwarfing M.9 rootstock were small and the adjacent cells in the
rootstock were larger, while the vigorous ‘MM.106’ rootstock had normal xylem
development in the rootstock (Soumelidou et al., 1994). Tworkoski and Fazio (2011;
2016) also show accumulation of auxin and smaller xylem vessels above the graft union.
This supports the theory suggested by Aloni (1987) that where auxin accumulates, more
xylem vessels of smaller diameter are formed. Soumelidou et al. (1994) suggested that
auxin accumulated in the graft union of the dwarfing rootstock, which reduced xylem
development in the rootstock. These studies provide strong evidence in favor of auxin’s
role in xylem differentiation.
Other evidence in favor of auxin is shown through the studies on grafting cactus,
vegetables, and grapes. Shimomura and Fuzihara (1977) found in grafting cactus that
30 applied auxin did not stimulate callus formation, but did promote connecting vascular
bundle differentiations as well as increasing bundle diameter. When vascular cambia
were misaligned, auxin applications increased the graft survival compared to the controls
(Shimomura and Fuzihara, 1977). When 1-napthaleneacetic acid (NAA) in lanolin paste
was directly applied to the cut end of the cactus, it induced cambium to form parallel to
the cut surface (Shimomura and Fuzihara, 1977). To further solidify the role of auxin in
forming vascular connections, application of the auxin transport inhibitor 2,3,5-
triidobenzoic acid (TIBA), decreased the number of vascular connections in cactus grafts
(Shimomura and Fuzihara, 1977). Moghadam et al. (2012) also found on cactus grafts
that auxin applied 1-3 times increased the scion diameter, scion height, cambial layer
diameter, areole number, activated areole number and resulted in 100% graft survival.
Parkinson and Yeoman (1982) found indole-3-acetic acid (IAA) apically applied to
vegetable grafts induced vascular connections. As IAA concentrations increased, vascular
connections reached a limit and only callus formation increased (Parkinson and Yeoman,
1982). Studies on grape grafts contradict these findings, where auxin application resulted
in reduced or inhibited callus formation (Kose and Guleryuz, 2006). However, the
concentrations used were 5 to 20 times that used in other studies, which may have been
too high to induce a favorable response. Regardless, exogenous auxin applications may
be a possible avenue for increasing graft success.
Cytokinin. Cytokinin is another plant hormone that may have roles in graft union
formation and strength. In general, cytokinin is predominately synthesized in the roots,
moves acropetally, and is involved in cell divisions. In a review, Aloni (1993; 1995)
suggested that cytokinin alone does not cause vascular tissue differentiation but requires
31 the presence of auxin. However, research on cytokinin is sometimes conflicted most
likely due to promotion or inhibition of effects due to interactions with other hormones.
Aloni (1993) suggested that different types of cytokinin have varying effects at different
levels of IAA and cites research on Coleus that showed zeatin was best at promoting
vascular differentiation at low IAA and kinetin was best at high IAA. Aside from these
possible sources of variation in research, it appears that cytokinin increases the sensitivity
of cambial cells to auxin in wounds (Aloni, 1995). In the presence of auxin, cytokinin
may promote early differentiation of vascular tissue when many cell divisions are
occurring (Aloni, 1995). Parkinson and Yeoman (1982) found that cytokinin in the
presence of IAA increased the number of vascular connections in grafted internodes in
petri dishes. Kose and Guleryuz (2006) found that kinetin and benzyl adenine (BA)
applied to the surface of grape grafts promoted initiation and proliferation of callus.
Exogenous cytokinin has also been shown to activate thickening growth in stems of
cytokinin-deficient Arabidopsis mutants, including increased vessel number, number of
cells in the phloem, and number of xylem cells, with some of increased size (Matsumuto-
Kitano et al., 2008). It is evident from these studies that cytokinin promotes cell division,
which may be lacking in weak graft unions.
Gibberellins. Very little evidence has shown an effect of gibberellins (GA) on
graft formation. Parkinson and Yeoman (1982) found that GA decreased the number of
vascular connections when applied to grafted internodes in a petri dish. It is possible from
this that GA inhibitors may be beneficial to improving graft success. Prohexadione-
calcium (PCa) is one of the more common GA inhibitors and is currently in use for apple
trees. PCa as the commercial formulation “Apogee” has been shown to greatly reduce the
32 vegetative growth of shoots by inhibiting the conversion of GA20 (a precursor) to the
active GA1 (Evans et al., 1999). Foliar application of PCa results in reduced internode
length and vegetative growth in apples and has been seen to increase the diameter of the
basal end of walnut shoots (Evans et al., 1997; Solar et al., 2008). Adams (2010) found
that apple rootstocks that received a high rate of PCa increased the percentage of A-B
grade rootstocks, which have increased rooting compared to C grade rootstock. In apples,
foliar PCa was found to increase cortical parenchyma cell wall thickness of youngest
leaves and shoots when viewed under a scanning electron micrograph (SUNDIN, 2014).
The cell wall thickening may be a possible use for increasing the mechanical strength of
the wood at the graft union and should be considered for study. PCa has been shown to
move acropetally, resulting in greater effects in the upper canopy, and it does not persist
in the trees to the following season (Evans et al., 1999; Miller, 2002). When using PCa,
applying early, within a week of petal fall or when the new growth is 5-15 cm, and
providing a high cumulative rates of 125-250 ppm over the season results in effective
growth control, but applying later has been shown to be less effective (Miller, 2002).
Although no studies have tested the effect of PCa on the graft union, applying it early and
at higher rates may provide some strengthening to the union while temporarily reducing
shoot growth.
Ethylene. Ethylene is a wound response hormone that is also involved in ripening
and senescence in fruits, but may have beneficial responses in promoting wood growth.
Savidge (1988) cited research by Yamamoto and Koslowski, which showed increased
cortical growth and xylem fiber number when ethephon (an ethylene releasing
compound) was applied to stems. Ethephon caused an increase in the stem diameter at the
33 site of application as a result of the phloem being two times thicker and the xylem five
times thicker (Junghans et al., 2004). Junghans et al. (2004) also reported increased fiber
and vessel cell wall thickness, but decreased vessel lumen and length, and decreased fiber
length. It is suggested by Junghans et al. (2004) that ethylene may cause local
concentrations of auxin, which induces these changes. However, Bjorklund (2007) found
that 1-aminocyclopropane-1-carboxylic acid (ACC), a natural precursor to ethylene, may
reduce the relative lignin content in cell walls. Lignin is abundant in woody plants and
primarily contributes strength to the cell wall; so, decreased lignin would be antagonistic
to a strong graft union.
Abscisic Acid. Abscisic acid (ABA) is another wound response or stress hormone.
Little research has been done to see its effects on the graft union. However, some studies
have found that ABA has an effect on increasing wood formation and strength. Parker et
al. (2012) treated drought stressed peach trees with a soil drench of ABA and found that
future drought tolerance was increased along with a greater trunk diameter, fresh weight,
dry weight, and root growth. Arend and Fromm (2013) found that exogenous ABA
increased the levels of ABA in the cambial region of stem and resulted in increased radial
number of undifferentiated cambial cells. They also reported that ABA increased the
formation of longer fiber cells and less, but larger, vessel cells (Arend and Fromm, 2013).
ABA has also been shown to be synergistic with IAA and BA in promoting callus
formation at the abscission zone of leaf petioles on citrus bud explants (Altman and
Goren, 1971). These studies suggest that ABA may have an effect on increasing the trunk
size of the tree and possibly callus formation, which may increase the strength of the graft
union.
34 Conclusion
Proper cultural practices and plant growth regulators may be possible means of
improving graft success and strength. Cultural practices such as using similar sized cuts
on the graft partners, preventing desiccation, and providing protection for the young
growing plant are crucial to improve graft take of genetically compatible plants. Plant
growth regulators may also have possible beneficial effects in improving graft success
and strength, however, little research has been done to address this issue. From the
current literature it appears that auxin and cytokinin may affect the callus formation and
vascular differentiation, while other hormones such as ABA, ethylene, and GA-inhibitors
may increase wood formation and density, which could improve the overall graft union
strength.
Conclusion
Historically, grafting has greatly increased the economic production of apple trees
using clonal rootstock and scion. With advances in rootstock breeding, tests to evaluate
new rootstocks in relation to their scion graft partners is of great importance. New
Geneva® rootstocks have great promise to the apple industry, but work needs to be done
to identify and solve problems in propagation and production of trees on these rootstocks
much the same way other weak scion/rootstock combinations have been found (e.g.
‘Honeycrisp’/’EMLA 26’). In order to solve grafting problems, having an understanding
of compatibility, how to measure it, and possible ways to improve graft success are
crucial.
35 Compatibility occurs as adequate callus proliferates between graft partners, which
leads to differentiation into cambial tissue and further into secondary xylem and phloem.
For a graft to be successful both in the short-term and long-term, vascular differentiation
needs to occur. If vascular tissue develops adequately, then we should be hesitant to call a
graft combination incompatible.
Incompatibility can occur due to failure along any step of graft formation and
development. Commonly it results in inadequate vascular tissue between graft partners
either because of localized cell death at the graft union, or a lack of differentiation. This
poor development of vascular tissue will immediately halt scion growth because it
inhibits water and nutrient flow to a developing shoot.
Aside from compatibility, other factors such as wood formation and chemistry are
important in describing the mechanism of a weak graft union. “Affinity” rather than
“incompatibility” may be a better term in describing these weak graft unions that form
successful unions.
Compatibility and incompatibility can be measureable. Break testing measures the
force required to break a graft union, while hydraulic conductance/resistance can measure
differences in functional xylem. Other histological and biochemical tests are available,
but the differences of weak and strong graft unions are not well defined.
No common method for overcoming incompatibility or low affinity is currently
being used. However, some research suggests that improved grafting methods,
techniques, or the application of plant growth regulators may increase compatibility or
help graft strength and success. In particular, auxin, cytokinin, abscisic acid, and
36 gibberellin inhibitors may be of use to increase the strength of the graft union through
better vascular differentiation or wood formation.
The objective of this thesis was to test the following objectives: First, to use the
break strength testing method to test the compatibility, as measured by flexural strength,
of graft unions of ‘G.41’ rootstock compared to other Geneva® rootstock selections and
industry standards (Chapter 2). Second, determine the effect of scion cultivar on the
flexural strength of the graft union (Chapter 2). Third, compare the effects of graft type
(chip buds or bench grafts) on the break strength testing method (Chapter 2). Fourth, to
test the effect of plant growth regulators on the graft union break strength (Chapter 3).
Finally, use the pressure chamber method, in conjunction with transpiration
measurements, to measure hydraulic resistance of graft unions of weak versus strong
graft forming rootstocks (Chapter 4).
Literature Cited
Adams, R. 2010. Increasing the rooting in apple rootstock stoolbeds. Cornell University,
Master. Aloni, B., L. Karni, G. Deventurero, Z. Levin, R. Cohen, N. Katzir, M. Lotan-Pompan,
M. Edelstein, H. Aktas, E. Turhan, D.M. Joel, C. Horev, and Y. Kapulnik. 2008. Physiological and biochemical changes at the rootstock-scion interface in graft combinations between Cucurbita rootstocks and a melon scion. J. Hort. Sci. Biotechnol. 83:777-783.
Aloni, R. 1987. Differentiation of vascular tissues. Annu. Rev. Plant Physiol. 38:179-204. Aloni, R. 1993. The role of cytokinin in organised differentiation of vascular tissues.
Austral. J. Plant Physiol. 20:601-608. Aloni, R. 1995. The induction of vascular tissue by auxin and cytokinin., p. 531-546. In:
P.J. Davies (ed.), Plant Hormones. Kluwer Academic Publishers, Netherlands. Altman, A. and R. Goren. 1971. Promotion of callus formation by abscisic acid in citrus
bud cultures. Plant Physiol. 47:844-846. Arend, M. and J. Fromm. 2013. Concomitant analysis of cambial abscisic acid and
cambial growth activity in poplar. Trees 27:1271-1276.
37 Asante, A.K. and J.R. Barnett. 1997. Graft union formation in mango (Mangifera
indica L.). J. Hort. Sci. 72:781-790. Atkinson, C.J., M.A. Else, L. Taylor, and C.J. Dover. 2003. Root and stem hydraulic
conductivity as determinants of growth potential in grafted trees of apple (Malus pumila Mill.). J. Expt. Bot. 54:1221-1229.
Bjorklund, S. 2007. Plant hormones in wood formation. Swedish University of Agricultural Science, Umea, Doctoral. Abstr. 81.
Cholid, M., Hariyadi, S. Susant, Djumali, and B.S. Purwoko. 2014. Effects of grafting time and grafting methods used on scion and rootstock compatibility of Physic Nut (Jatropha curcas L.). Asian J. Agr. Res. 8:150-163.
Durkovic, J., F. Kacik, M. Mamonova, M. Kardosova, R. Longauer, and J. Krajnakova. 2015. The effects of propagation techniques on cell wall chemistry and wood anatomy in micropropagated and grafted plants of the Dutch elm hybrid 'Dodoens'. J. Amer. Soc. Hort. Sci. 140:3-11.
Ermel, F.F., J. Kervella, A.M. Catesson, and J.L. Poessel. 1999. Localized graft incompatibility in pear/quince (Pyrus communis/Cydonia oblonga) combinations: multivariate analysis of histological data from 5-month-old grafts. Tree Physiol. 19:645-654.
Ermel, F.F., J.L. Poessel, M. Faurobert, and A.M. Catesson. 1997. Early scion/stock junction in compatible and incompatible pear/pear and pear/quince grafts: a histo-cytological study. Ann. Bot. 79:505-515.
Errea, P. 1998. Implications of phenolic compounds in graft incompatibility in fruit tree species. Scientia Hort. 74:195-205.
Errea, P., A. Felipe, and M. Herrero. 1994. Graft establishment between compatible and incompatible Prunus spp. J. Expt. Bot. 45:393-401.
Errea, P., L. Garay, and J.A. Marin. 2001. Early detection of graft incompatibility in apricot (Prunus armeniaca) using in vitro techniques. Physiol. Plant. 112:135-141.
Espen, L., M. Cocucci, and G.A. Sacchi. 2005. Differentiation and functional connection of vascular elements in compatible and incompatible pear/quince internode micrografts. Tree Physiol. 25:1419-1425.
Evans, J.R., R.R. Evans, C.L. Regusci, and W. Rademacher. 1999. Mode of action, metabolism, and uptake of BAS 125W, prohexadione-calcium. HortScience 34:1200-1201.
Evans, R.R., J.R. Evans, and W. Rademacher. 1997. Prohexadione calcium for suppression of vegetative growth in Eastern apples. Acta Hort. 451:663-666.
Evans, W.D. and R.J. Hilton. 1957. Methods of evaluating stock/scion compatibility in apple trees. Can. J. Plant Sci. 37:327-336.
Fazio, G., H. Aldwinckle, and T. Robinson. 2013. Unique characteristics of Geneva® apple rootstocks. New York Fruit Qrtly. 21:25-28
Gasco, A., A. Nardini, F. Raimondo, E. Gortan, A. Motisi, M.A. Lo Gullo, and S. Salleo. 2007. Hydraulic kinetics of the graft union in different Olea europaea L. scion/rootstock combinations. Environ. Expt. Bot. 60:245-250.
Gebhardt, K. and W. Feucht. 1982. Polyphenol changes at the union of Prunus avium/Prunus cerasus grafts. J. Hort. Sci. 57:253-258.
38 Gee, G.W., B.E. Janes, and C.S. Tan. 1973. A chamber for applying pressure to roots of
intact plants. Plant Physiol. 52:472-474. Guclu, S.F. and F. Koyuncu. 2012. A method for prediction of graft incompatibility in
sweet cherry. Not Bot Horti Agrobo 40:243-246. Gulen, H., R. Arora, A. Kuden, S.L. Krebs, and J. Postman. 2002. Peroxidase isozyme
profiles in compatible incompatible pear-quince graft combinations. J. Amer. Soc. Hort. Sci. 127:152-157.
Hartmann, H.T., D.E. Kester, F.T.J. Davies, and R.L. Geneve. 2011. Hartmann & Kester's Plant Propagation: Principles and Practices. 8th ed. Pearson Education, Inc., Prentice Hall, One Lake Street, Upper Saddle River, NJ.
Herrero, J. 1951. Studies of compatible and incompatible graft combinations with special reference to hardy fruit trees. J. Hort. Sci. 26:186-237.
Jeffree, C.E. and M.M. Yeoman. 1983. Development of intercellular connections between opposing cells in a graft union. New Phytol. 93:491-509.
Junghans, U., R. Langenfeld-Heyser, A. Polle, and T. Teichmann. 2004. Effect of auxin transport inhibitors and ethylene on wood anatomy of poplar. Plant Bio. 6:22-29.
Kolb, K.J., J.S. Sperry, and B.B. Lamont. 1996. A method for measuring xylem hydraulic conductance and embolism in entire root and shoot systems. J. Expt. Bot. 47:1805-1810.
Kollmann, R. and C. Glockmann. 1985. Studies on graft unions. I. Plasmodesmata between cells of plants belonging to different unrelated taxa. Protoplasma 124:224-235.
Kollmann, R. and C. Glockmann. 1991. Studies on graft unions. III. On the mechanism of secondary formation of plasmodesmata at the graft interface. Protoplasma 165:71-85.
Kollmann, R., S. Yang, and C. Glockmann. 1985. Studies on graft unions. II. Continuous and half plasmodesmata in different regions of the graft interface. Protoplasma 126:19-29.
Kose, C. and M. Guleryuz. 2006. Effects of auxins and cytokinins on graft union of grapevine (Vitis vinifera). N.Z. J. Crop Hort. Sci. 34:145-150.
Lapins, K. 1959. Some symptoms of stock-scion incompatibility of apricot varieties on peach seedling rootstock. Can. J. Plant Sci. 39:194-203.
Lindsay, D.W., M.M. Yeoman, and R. Brown. 1974. An analysis of the development of the graft union in Lycopersicon esculentum. Ann. Bot. 38:639-646.
Matsumuto-Kitano, M., T. Kusumoto, P. Tarkowski, K. Kinoshita-Tsujimura, K. Vaclavikova, K. Miyawaki, and T. Kakimoto. 2008. Cytokinins are central regulators of cambial activity. Natl. Acad. Sci. U.S. 105:20027-20031.
McCully, M.E. 1983. Structural aspects of graft development, p. 71-88. In: R. Moore (ed.), Vegetative Compatibility Responses in Plants. Baylor University Press, Waco, TX.
Miller, H. and J.R. Barnett. 1993. The structure and composition of bead-like projections on Sitka Spruce callus cells formed during grafting and in culture. Ann. Bot. 72:441-448.
Miller, S.S. 2002. Prohexadione-calcium controls vegetative shoot growth in apple. J. Tree Fruit Production 3:11-28.
39 Mishra, A.K. and S.N. Tiwari. 2012. Biosensor for graft compatibility detection based on
signal transduction through electrical resistance of graft union in plants, p. 261-264, 2012 1st International Symposium on Physics and Technology of Sensors.
Mng’Omba, S.A., E.S. du Toit, and F.K. Akinnifesi. 2008. The relationship between graft incompatibility and phenols in Uapaca kirkiana Muell Arg. Scientia Hort. 117:212-218.
Mng’Omba, S.A.d.T., Elsa S. 2013. Effect of diagonal cut surface length on graft success and growth of Mangifera indica, Persia americana, and Prunus persica. HortScience 48:481-484.
Moghadam, A.R.L., Z.O. Ardebili, and L. Rezaie 2012. Effect of indole butyric acid on micrografting of cactus. African J. Biotechnol. 11:6484-6493.
Moing, A., G. Salesses, and P.H. Saglio. 1987. Growth and the composition and transport of carbohydrate in compatible and incompatible peach/plum grafts. Tree Physiol. 3:345-354.
Moore, R. 1983a. Physiological aspects of graft formation., p. 89-105. In: R. Moore (ed.), Vegetative Compatibility Responses in Plants. Baylor University Press, Waco, TX.
Moore, R. 1983b. Studies of vegetative compatibility-incompatibility in higher plants. IV. The development of tensile strength in a compatible and an incompatible graft. Amer. J. Bot. 20:226-231.
Moore, R. 1984. A model for graft compatibility-incompatibility in higher plants. Amer. J. Bot. 71:752-758.
Moore, R. and D.B. Walker. 1981a. Studies of Vegetative compatibility-incompatibility in higher plants. I. A structural study of a compatible autograft in Sedum telephoides (Crassulaceae). Amer. J. Bot. 68:820-830.
Moore, R. and D.B. Walker. 1981b. Studies of vegetative vompatibility-incompatibility in higher plants. II. A structural study of an incompatible heterograft between Sedum telephoides (Crassulaceae) and Solanum pennellii (Solanaceae). Amer. J. Bot. 68:831-842.
Nocito, F.F., L. Espen, C. Fedeli, C. Lancilli, S. Musacchi, S. Serra, S. Sansavini, M. Cocucci, and G.A. Sacchi. 2010. Oxidative stress and senescence-like status of pear calli co-cultured on suspensions of incompatible quince microcalli. Tree Physiol. 30:450-458.
Norelli, J.L., H.T. Holleran, W.C. Johnson, T.L. Robinson, and H.S. Aldwinkle. 2003. Resistance of Geneva and other apple rootstocks to Erwinia amylovora. Plant Dis. 87:26-32.
Parker, M.L., M.B. Clark, and C. Campbell. 2012. Abscisic acid application in peach. Acta Hort. 962:403-410.
Parkinson, M. and M.M. Yeoman. 1982. Graft formation in cultured, explanted internodes. New Phytol. 91:711-719.
Pedersen, B.H. 2005. Development of tensile strength in compatible and incompatible sweet cherry graftings. Can. J. Bot. 83:202-210.
Pina, A. and P. Errea. 2005. A review of new advance in mechanism of graft compatibility-incompatibility. Scientia Hort. 106:1-11.
40 Pina, A., P. Errea, and H.J. Martens. 2012. Graft union formation and cell-to-cell
communication via plasmodesmata in compatible and incompatible stem unions of Prunus spp. Scientia Hort. 143:144-150.
Pina, A., P. Errea, A. Schulz, and H.J. Martens. 2009. Cell-to-cell transport through plasmodesmata in tree callus cultures. Tree Physiol. 29:809-818.
Robinson, T., L. Anderson, W. Autio, B. Barritt, J. Cline, W. Cowgill, R. Crassweller, C. Embree, D. Ferree, E. Garcia, G. Greene, C. Hampson, K. Kosola, M. Parker, R. Perry, T. Roper, and M. Warmund. 2007. A multi-location comparison of 'Geneva® 16', 'Geneva® 41' and 'M.9' apple rootstocks in North America. Acta Hort. 732:59-65.
Rogers, W.S. and A.B. Beakbane. 1957. Stock and scion relations. Annu. Rev. Plant Physiol. 8:217-236.
Santamour, F.S.J. 1988. Graft compatibility in woody plants: an expanded perspective. J. Environ. Hort. 6:27-32
Sass, J.E. 1932. Formation of callus knots on apple grafts as related to the histology of the graft union. Bot. Gaz. 94:364-380.
Savidge, R.A. 1988. Auxin and ethylene regulation of diameter growth in trees. Tree Physiol. 4:401-414.
Shimomura, T. and K. Fuzihara. 1977. Physiological study of graft union formation in cactus. II. Role of auxin on vascular connection between stock and scion. J. Jap. Soc. Hort. Sci. 45:397-406.
Solar, A., J. Jakopic, R. Veberic, and F. Stampar. 2008. Prohexadion-Ca affects vegetative growth of the rejuvenated shoots in walnut trees. HortScience 43:558-561.
Solari, L.I., S. Johnson, and T.M. Dejong. 2006. Hydraulic conductance characteristics of peach (Prunus persica) trees on different rootstocks are related to biomass production and distribution. Tree Physiol. 26:1343-1350.
Soumelidou, K., N.H. Battey, P. John, and J.R. Barnett. 1994. The anatomy of the developing bud union and its relationship to dwarfing in apple. Ann. Bot. 74:605-611.
Sperry, J.S., J.R. Donnelly, and M.T. Tyree. 1988. A method for measuring hydraulic conductivity and embolism in xylem. Plant, Cell and Environ. 11:35-40.
Stoddard, F.L. and M.E. McCully. 1980. Effects of excision of stock and scion organs on the formation of the graft union in coleus: A histological study. Bot. Gaz. 141:401-412.
Sundin, G.W. 2014. Managing fire blight: new lessons learned from the use of kasumin for blossom blight and apogee for shoot blight control. New York Fruit Qrtly. 22:9-14.
Tworkoski, T. and G. Fazio 2008. Physiological and morphological effects of size-controlling rootstocks on ‘Fuji’ scion. Acta Hort. 903:865-872.
Tyree, M.T. and F.W. Ewers. 1991. Tansley Review No. 34. The hydraulic architecture of trees and other woody plants. New Phytol. 119:345-360.
Tyree, M.T., S. Patino, J. Bennink, and J. Alexander. 1995. Dynamic measurements of root hydraulic conductance using a high-pressure flowmeter in the laboratory and field. J. Expt. Bot. 46:83-94.
41 Tyree, M.T., S. Yang, P. Cruiziat, and B. Sinclair. 1994. Novel methods of measuring
hydraulic conductivity of tree root systems and interpretation using AMAIZED. Plant Physiol. 104:189-199.
USApple. 2015. Industry statistics: An overview of the U.S. apple industry. U.S. Apple Association, 8233 Old Courthouse Road Suite 200, Vienna, VA.
Usenik, V., B. Krska, M. Vican, and F. Stampar. 2006. Early detection of graft incompatibility in apricot (Prunus armeniaca L.) using phenol analyses. Scientia Hort. 109:332-338.
Warmund, M.R., B.H. Barritt, J.M. Brown, K.L. Schaffer, and B.R. Jeong. 1993. Detection of vascular discontinuity in bud unions of 'Jonagold' apple on Mark rootstock with magnetic resonance imaging. J. Amer. Soc. Hort. Sci. 118:92-96.
Yang, S., G. Xiang, S. Zhang, and C. Lou. 1992. Electrical resistance as a measure of graft union. J. Plant Physiol. 141:98-104.
Yefalvi, J.-I., A. Festila, and L. Platon. 2013. Comparative study of two bench grafting methods of apple (Malus domestica, Borkh) and pear (Pyrus communis L.). Bul. UAVSM Hort. 70:147-156.
Zarrouk, O., P.S. Testillano, M.C. Risueno, M.A. Moreno, and Y. Gogorcena. 2010. Changes in cell/tissue organization and peroxidase activity as Markers for early detection of graft incompatibility in peach/plum combinations. J. Amer. Soc. Hort. Sci. 135:9-17.
42 CHAPTER 2
THE EFFECT OF ROOTSTOCK, SCION, AND GRAFT METHOD ON THE GRAFT
UNION FLEXURAL STRENGTH AND RIGIDITY OF APPLE
Abstract
The apple rootstock ‘Geneva® 41’ (‘G.41’) forms weak graft unions with some
scion cultivars resulting in breakage during wind, harvest, and shipment. Other Geneva®
rootstocks have also been broken during wind events in the nursery. Flexural strength and
flexibility were tested using a factorial design of six scions (‘Fuji’, ‘Gala’, ‘Honeycrisp’,
‘McIntosh’, ‘Pink Lady’, and ‘Scilate’) by seven rootstocks (‘G.41’, ‘G.935’, ‘G.214’,
‘G.11’, ‘M.9-NIC 29’, ‘B.9’ and ‘EMLA 26’), by two grafting methods (chip bud and
saddle graft). A sub-sample was selected to measure change in graft union strength over
two years. ‘G.41’ consistently had the lowest break strength relative to tree size and this
persisted into the second year. ‘G.41’ also had the lowest deflection (flexibility)
regardless of scion cultivar or grafting method. ‘McIntosh’ and ‘Pink Lady’ formed
stronger graft unions, while ‘Scilate’ formed a weaker graft union relative to tree size.
Saddle grafting did not appear to improve graft union flexural strength. Therefore,
grafting rootstock-scion combinations with ‘G.41’ should be done with great care to
ensure stronger scions are selected.
43 Introduction
The United States of America is second only to China as producers of apples with
an estimated crop of 248.6 million bushels in 2013 (USApple, 2015). Apple production in
the U.S. is maintained by the utilization of clonal dwarfing rootstocks. Modern dwarfing
rootstocks have increased the yield efficiency of the commercial apple orchard, which
has increased the demand for high quality nursery trees. However, many of the common
dwarfing rootstocks such as ‘Malling 9’ (‘M.9’) and ‘Malling 26’ (‘M.26’) are highly
susceptible to fire blight, an infection by the bacteria Erwinia amylovora (Norelli et al.,
2003). Fire blight often enters the plant through blossoms or wounds in stems or leaves
and then travels down to the rootstock leading to girdling and eventual tree death.
In an effort to overcome widespread infection and death, Cornell University, in
collaboration with the United States Department of Agriculture Agricultural Research
Services (USDA ARS), have developed several dwarfing rootstocks that have shown
excellent fire blight resistance. These rootstocks are identified as Geneva® rootstocks and
are given a unique designation (i.e. ‘G.11’, ‘G.41’, ‘G.935’, etc.). Trees grown on
Geneva® rootstocks inhibit the movement of fire blight into the rootstock and instead
allow for pruning of the infected limbs from the tree (Robinson et al., 2007; Russo et al.,
2007).
Geneva® rootstocks have also shown resistance to crown and root rots from
Phytophthora, high yield efficiency, and good fruit size (Fazio et al., 2013). However,
some of the Geneva® rootstocks, such as ‘Geneva 41’ (‘G.41’), have weak and brittle
graft unions that are susceptible to breakage in the nursery (R. Adams, personal
44 communication). This weakness has been observed especially during strong wind events
or during harvest and shipment. Weakness is described as the reduced capability of the
union to endure internal stress due to an external load, while brittleness describes the
reduced deformation of the union from strain resulting in sudden brash breaks (Winandy
and Rowell, 2005). Due to the disease resistance and economic potential of these new
Geneva® rootstocks, research to understand and remedy this problem is of great
importance to the apple industry.
In the industry these weak graft forming combinations are often called
incompatible. However, this definition of incompatibility is different from the
incompatibility described in scientific literature, because it is a more broad definition that
combines the successful, yet weak graft unions with the graft unions that fail to form a
proper union or decline with age. The term “affinity” would be better suited for
circumstances where the graft union forms successfully, but other growth qualities such
as wood formation and growth are not optimal. Regardless of how the term is used, many
methods for measuring graft compatibility focus on identifying whether a strong
connection is made through the proper formation of vascular tissue. Two of such methods
are tensile strength and flexural strength testing.
Tensile strength testing, which measures the force to pull a graft apart, has been
used extensively for testing grafts of herbaceous species (Lindsay et al., 1974; Moore,
1983b; Parkinson and Yeoman, 1982). Tensile strength testing has been used in testing
cherry grafts, but testing is limited since the force required to pull the grafts apart exceeds
the machine capacity or ability to adequately hold samples without slipping (Pedersen,
2005). In comparison to tensile testing, flexural testing usually employs a 3-point bend
45 test or some other apparatus that allows for the sample to bend until fracturing at or near
the graft union. This method has been used in the past with mixed results, with
inconsistency likely because its primary use was to test for compatibility with seed
propagated rootstocks that may have wide variability in strength (Evans and Hilton,
1957; Lapins, 1959). Factors other than vascular tissue, such as wood formation and
flexibility, may also affect the outcomes from tensile or break strength tests, so results
should be interpreted carefully.
The great difficulty for either type of testing is the method of standardizing or
adjusting measured forces to some size measurement. Due to the nature of many grafting
methods, determining an accurate measure for graft union surface area is not viable.
Evans and Hilton (Evans and Hilton, 1957) related the force to the scion cross-sectional
area, but this may not account for swelling at the graft union. The graft union cross-
sectional area, or a measure that accounts for the cross-sectional area of the trunk near the
graft should also be considered.
The aim of this study was to use the flexural testing method to determine the
strength of graft unions from apple trees with various scion-rootstock combinations.
More specifically, the aim was to determine the strength of graft unions with ‘G.41’ as
rootstock in relation to other Geneva® selections and industry standard apple rootstocks
(‘M.9’, ‘M.26’, etc.). The second objective was to compare the influence of scion cultivar
on graft union strength, and how the strength of scion-rootstock combinations changes
over two-years of growth. As a possible remediation to graft-union weakness, bench
grafting was compared to chip budding.
46 Materials and Methods
Tree Propagation
2014 Trees. Custom propagated apple trees were produced by a commercial
nursery (Willow Drive Nursery, Ephrata, Washington) using one budding method and
two bench graft methods. Chip budding was performed between August and September
of 2013, while bench grafting was completed in late March of 2014 using both saddle and
whip-and-tongue graft methods. Both methods of bench grafting utilized custom cutting
tools to maintain uniformity. After budding tape was used to wrap the bench grafts, the
grafts were dipped in a custom grafting mix consisting of equal parts paraffin wax,
beeswax, and tree resin heated to 70 °C. For the chip budded trees, the apple cultivars
‘Gala’, ‘Scilate’, ‘Pink Lady’, ‘and ‘Honeycrisp’ were chip budded onto the rootstocks
‘G.11’, ‘G.41’, ‘G.214’, and ‘Malling 9 selection NIC 29’ (‘M.9-NIC 29’) as an
incomplete factorial (Table 2.1) with at least 30 trees per scion-rootstock combination.
For the bench-grafted trees, the same four scion cultivars were saddle grafted and whip-
and-tongue grafted onto ‘G.11’, ‘G.41’, and ‘M.9-NIC 29’ as an incomplete factorial
(Table 2.1) with at least 30 trees per scion-rootstock-graft combination. Enough trees
were bench-grafted so that a full set could be left in the field for testing in the second
year. Trees were grown according to standard commercial practices.
2015 Trees. For the second year of experiments, custom budding and bench
grafting were repeated in August through September of 2014 and in March of 2015 using
the same methods as described above except whip and tongue grafting was excluded to
accommodate more scion-rootstock combinations, and because 2014 results showed no
47 difference in strength between bench grafting methods. For the chip budded trees, the
scion cultivars ‘Gala’, ‘Scilate’, ‘Fuji’, ‘McIntosh’, ‘Pink Lady’, and ‘Honeycrisp’ were
chip budded onto the rootstocks ‘G.11’, ‘G.41’, ‘G.935’, ‘G.214’, ‘M.9-NIC 29’, ‘East
Malling/Long Ashton 26’ (‘EMLA 26’), and ‘Budagovsky 9’ (‘B.9’), resulting in a six
scion by seven rootstock complete factorial, with at least 30 replicate trees per scion-
rootstock combination. Additional scion-rootstock combinations were included the
second year to provide a complete factorial and to incorporate additional rootstocks and
scions that were thought to develop stronger graft unions. For the bench-grafted trees, the
same six apple cultivars were saddle grafted onto the same seven rootstocks, with the
addition of ‘Malling-Merton 106’ (‘MM.106’) rootstock. Trees were grown according to
standard commercial practices.
2-year Time Course. Bench grafted trees from the 2014 study were allowed to
continue to grow through a second year in the nursery. A complete factorial sub-set of the
2014 saddle grafts consisting of ‘Pink Lady’ and ‘Honeycrisp’ grafted on ‘G.11’, ‘G.41’,
and ‘M.9-NIC 29’ were selected for a 2-year study to analyze their change in growth and
strength.
Sampling and Growth Measurements Sampling and measuring of trees occurred at three different times in each year:
mid-June, mid-August, and mid-October. At each sampling time, 10 trees from each
scion-rootstock combination were selected based on visual uniformity. Each tree was
tagged and numbered from 1-10 and then several size measurements were recorded,
including rootstock shank diameter (5 cm below graft union), two perpendicular
48 measurements of graft union diameter at the widest part of the graft union, and in 2015 a
scion diameter (5 cm above point of new growth). The diameter measurements were then
used to calculate cross-sectional areas (CSA). Trees were then hand dug at each sampling
time, all of the roots removed, and the scion cut back so that the total sample length was
about 70 centimeters in order to preserve sample moisture and facilitate transportation.
Replicates were then bundled together in moist burlap according to replicate number and
packed in ice for transportation to ad laboratory at Utah State University in Logan, Utah.
Break Strength Testing
At USU, each specimen was loaded to failure using a 3-point bend apparatus with
a 16-centimeter separation (Figure. 2.1). The apparatus was used in conjunction with a
Bench Testing Machine (Tinius Olsen H50KS, 1065 Easton Road, Horsham, PA 19044)
operating in compression mode. The tests were performed with a fixed strain rate (25
cm/min) as per the ASTM Standard D790 and D7264, which are commonly used for
testing of flexural strength of polymer composites and concrete (ASTM, 2010; ASTM,
2015). A pre-load condition of 10 N was used to bring the crosshead into contact with the
specimen at a constant rate of 50 cm/min. For all of the 2014 samples and the June and
August 2015 samples, force measurements were acquired through the Tinius Olsen Test
Navigator software at 1-second intervals throughout the measurement, until a failure
condition was achieved. Upon achieving the failure condition, the fracture strength was
obtained from the data based on the geometry of the specimen. For the chip budded trees,
half of the samples were broken with the force applied proximal to the chip bud, and the
other half were broken with the force distal from the chip bud. For the bench grafts, half
49 of the samples were broken with the graft in a stacked position relative to the applied
force, and the other half were broken with the graft in a sideways position. The manner in
which each sample broke was categorized according to break type and location of break
(Table 2.2). The categories were later regrouped into orders with assigned numbers as
seen in table 2.2. During earlier tests, there were apparent differences in sample
flexibility, so for the October 2015 tests deflection measurements were also recorded.
Additionally, a subset of trees representing a factorial design of four scions by three
rootstocks was tested for the deflection of the scion and the rootstock shank segments
only.
Data Analysis
2014 study. Treatment comparisons used for the 2014 data were flexural strength
measured as ultimate break force (N), graft cross-sectional area (GCSA, cm2), break
force per graft cross-sectional area (F/GCSA, N/cm2) and break type. Data was analyzed
using the GLIMMIX procedure in Statistical Analytical Software (SAS) with blocking by
row. The blocking effect was found to be non-significant. Both months were included in
the one analysis as a type of repeated measure. A separate directional analysis was
performed for each graft type for F/GCSA. Samples that did not break (< 0.1% per
month) were excluded from analysis for all force, size and deflection measurements,
however those that broke other than the graft were included with the assumption that the
graft was at least as strong as the measured value. Data from the June sampling was
excluded from the analysis due to the high variability in the data, assumed to be due to
the immaturity of the growing trees.
50 2015 study. The 2015 experiment represented a complete factorial and was
analyzed accordingly. GCSA, SCSA, force, graft cross-sectional area specific force
(F/GCSA, N/cm2) and scion cross-sectional area specific force (F/SCSA, N/cm2),
displacement (deflection), and break type variables from the experiment were analyzed
using PROC GLM with log or square root transformations as needed for model
assumptions. Like 2014, June data and samples that did not break were excluded (< 0.1%
per month). Data were initially analyzed as a split plot design with tree number as
replicates and time as a subplot factor. This first analysis showed significant time
interactions, so data were then analyzed independently for each sampling time with
emphasis on the final October sample. To better understand the interactions in the
October sampling, the data were also analyzed separately for each graft type.
2-year Time Course. The sub-sample used for the 2-year study was analyzed
similar to the 2015 break tests with tree as replicate and time as repeated measures. Since
GCSA was measured the same across all months, only force, GCSA and F/GCSA were
used in the analysis.
Flexibility. Deflection or flexibility data were only acquired for the October 2015
sampling time. Data were analyzed using the GLM procedure as a completely
randomized design and transformed as needed.
Categorical Data. After assigning numerical order to the recorded break types,
the GLIMMIX procedure was used to test the probability of lower order categories
occurring. In other words, the test determines if a combination in a paired comparison has
a higher likelihood of lower order breaks, such as clean breaks compared to non-clean
breaks or breaks in locations other than at the graft union.
51
Results and Discussion
2014 Study
The 2014 study did not allow for a complete factorial as it was constrained to
trees that were available from the 2013 budding season. The analysis adjusted for the
missing combinations, but the ability to detect treatment differences was diminished.
Break force measurements for 2014 were related to the graft cross-sectional area
(GCSA), which is related to the size of the rootstock, but also influenced by proliferation
at the graft union. The resulting force per graft cross-sectional area (F/GCSA) provides a
variable for use in comparing combinations that will differ in size. As seen in table 2.3,
all of the main effects were significant for F/GCSA, but there were also rootstock*time (p
= 0.0087) and graft*time (p = 0.0004, Figure 2.3) interactions.
‘G.41’ had consistently weaker F/GCSA than all other rootstocks (Table 2.3),
which was the case for both test dates (Figure 2.3). Although the graft size was similar to
‘M.9-NIC 29’, the break force was significantly lower. The other Geneva® selections
(‘G.214’, ‘G.11’) were as strong as ‘M.9-NIC 29’ by October (‘G.11’ was weaker than
‘M.9-NIC 29’ in August). Averaged over two dates, there was a significant
rootstock*graft type interaction for break force and GCSA, but F/GCSA did not show
significant differences (Figure 2.2), which appear to be due to differences in ‘G.11’
between graft types. ‘G.11’ had a larger GCSA accompanied by a larger force as a chip
bud compared to both bench grafts.
52 Second, the rootstock*scion interaction was not significant for F/GCSA but there
was a significant scion main effect on graft strength. In general, ‘Gala’ formed stronger
graft unions than ‘Honeycrisp’, ‘Pink Lady’, or ‘Scilate’ (Table 2.3).
Comparing graft types, chip buds required greater break force and had larger
GCSA at each date (Figure 2.3). The main effect of graft type over both dates was chip
buds had significantly higher F/GCSA (Table 2.3), although the differences were not
significant within dates and differences appeared to decrease over time between different
grafting methods in October, the final month (Figure 2.3).
2015 Trial
In 2015, a wider range of rootstocks and scions were tested to include genotypes
thought to represent stronger graft unions and to provide a complete factorial. Scion
cross-sectional area (SCSA) was also included as a measure of overall trees size for
standardizing the measured break force.
Initial analysis as a repeated measures design indicated significant interactions
with time (Appendix Table A2.1), so data were analyzed independently for each
sampling time with a focus on the latest date, which corresponded to nursery harvest.
Data for graft types were also analyzed separately at first to determine the effect direction
had on the graft union break strength. For the October 2015 tests, there were no
significant three-way interactions for either the chip buds or the saddle grafts, but there
was a significant rootstock*scion interaction (Table 2.4). The means and means
separations from the rootstock*scion interaction analyses are shown in tables 2.5-2.9. We
53 chose to focus on the general trends and use these tables to report and discuss the main
effects of rootstock and scion. We will also point out peculiar interactions of note.
The direction interactions were also significant (Appendix Table A2.7) and
generally show orienting the chip distal to the displacement force will require higher
forces to break the graft union, however, not every rootstock or scion follows this trend,
or the difference is not significant. For saddle grafts, the stacked direction was generally
stronger, but the differences are never significant per rootstock or scion. Because the
differences in direction are not always significant, we decided to average over the
direction, but the graphs for this interaction are provided in the appendix (Figure A2.1
and A2.2). In an actual nursery scenario the force of the wind will not always be in the
exact same direction, so by averaging over direction we obtain a general strength for that
tree under variable conditions.
Force Per Scion Cross-sectional Area. Break force (Table 2.5) and scion cross-
sectional area (SCSA; Table 2.6) are shown to interpret how graft strength relative to tree
size (F/SCSA) may differ among scion and rootstock combinations. Across all scion
cultivars in 2015, ‘G.41’ was consistently weaker than all other rootstocks (Table 2.7).
This is a result of having the lowest overall break force (Table 2.5), despite having a
relatively large SCSA (Table 2.6). ‘M.9-NIC 29’, ‘G.11’ and ‘G.214’ consistently formed
among the strongest graft unions. ‘MM.106’, which was only included in the saddle
grafts, had a significantly lower F/SCSA than ‘M.9-NIC 29’ or ‘G.11’. ‘MM.106’ was
included because it is classified as a more vigorous rootstock than the rest of the
rootstocks included in these studies. The relative break strengths of these rootstocks
would indicate that break strength is clearly not correlated with vigor. The relative graft
54 union strengths of the rootstocks included differed substantially between graft type
particularly for ‘B.9’, ‘G.935’, and ‘EMLA 26’. ‘B.9’ and ‘G.935’ were significantly
stronger as chip buds than as saddle grafts, whereas ‘EMLA 26’ formed a stronger saddle
graft than a chip bud.
Scion cultivars also had a significant effect on graft union strength (F/SCSA,
Table 2.7). ‘McIntosh’ consistently formed the strongest graft union across all rootstocks
tested. Conversely, ‘Scilate’ was consistently one of the weakest graft-forming scions.
There were differences for scions strength between graft types, where ‘Fuji’ and ‘Gala’
were unusually weak as saddle grafts, and ‘Honeycrisp’ was unusually strong as a saddle
grafts.
One of the primary objectives of this study was to determine whether a specific
graft type could be used to overcome inherent graft weakness for specific scion or
rootstock genotypes. A comparison of graft strength between graft types for each scion-
rootstock combination is shown in Figure 2.4. In most cases, F/SCSA did not differ
among graft types. The scions ‘Fuji’ and ‘Gala’, and the rootstocks ‘B.9’ and ‘G.935’
formed significantly stronger unions by chip budding than by saddle grafting.
Conversely, ‘EMLA 26’ formed significantly stronger unions through saddle grafting. In
the case of ‘EMLA 26’, the greater strength in the saddle graft may have been due to
differences in the quality of the rootstock liner. ‘EMLA 26’ liners used for bench grafting
were from the first cut of a new stoolbed, so the rootstock size was larger than usual.
Since this was the only case where saddle grafts appeared stronger than chip buds,
switching from the current standard practice of chip budding to bench grafting to improve
graft union strength would not be justified. If any advantage in strength is to be found, it
55 would most likely be for the chip buds because they are older, have better root
establishment, and have had longer to form a graft union. It was also observed that some
rootstocks in the research plots did not grow as well as they typically would in the
nursery. Likewise, some scions grew better than others. ‘Honeycrisp’ is an example of
one scion that grew better in the research plots than generally would be expected.
In addition to general interactions, there were several notable rootstock*scion
interactions. First, ‘Honeycrisp’ chip budded on ‘EMLA 26’ was weaker than expected
based on ‘Honeycrisp’ on other rootstocks, or ‘EMLA 26’ with other scions (Table 2.7).
This agrees with anecdotal observations of this combination in commercial nurseries.
‘Honeycrisp’ chip budded on ‘G.214’ was unusually strong. This suggests ‘G.214’ could
be used to increase the strength of the usually weak ‘Honeycrisp’. Also, for both graft
methods, ‘McIntosh’ on ‘G.214’ was numerically the strongest combination.
Force Per Graft Cross-sectional Area. In addition to F/SCSA, force was
compared to GCSA to allow for comparison between years, and for the 2-year time
course. Since GCSA is influenced by tissue proliferation at the graft union, differences
compared to F/SCSA should not be surprising.
Consistent with F/SCSA and the results of 2014, ‘G.41’ was consistently the
weakest rootstock for F/GCSA (Table 2.9). Likewise, ‘M.9-NIC 29’ formed some of the
strongest graft unions for both grafting methods. ‘G.214’ also continues to be a strong
graft forming rootstock (especially for ‘Honeycrisp’ when chip budded). Unlike for
F/SCSA, ‘G.11’ was much weaker when compared for F/GCSA. This is a result of
having a break force intermediate to other rootstocks (Table 2.5), but among the largest in
both GCSA and SCSA. This suggests that the strength comes from an increase in GCSA,
56 and not a stronger union relative to the CSA. This is an example of one possible
mechanism for strengthening the graft union, which is specifically targeted in the plant
growth regulator experiments (Chapter 3). Another big difference between F/SCSA and
F/GCSA was for ‘MM.106’, which was the strongest of all the saddle grafts. It had the
smallest GCSA and the biggest SCSA (Table 2.6 and 2.8). This is possibly due to less
callus proliferation and vascular disorganization at the graft union, resulting in a more
uniform tree caliper (Soumelidou et al., 1994). Aside from these results, we see the same
graft method differences between rootstocks for ‘B.9’, ‘G.935’, and ‘EMLA 26’.
2-year Time Course
Since ‘G.41’ was consistently weaker during the first year, a subset of bench-
grafted trees was carried through and sampled in a second year to determine whether or
not differences in break strength were reduced with subsequent tree growth. Table 2.10
provides the analysis of variance for the 2-year time course, where most of the
scion*time and rootstock*time interactions were significant. These interactions are
shown in Figure 2.5. Means separations have been provided only in the final sample
month, but the other means separation can be found in the appendix (Table A2.7). As
seen in figure 2.5, over two growing seasons ‘G.41’ continues to increase in strength,
both expressed as force and F/GCSA, but the rate of increase is slower than that of ‘M.9-
NIC 29’ and ‘G.11’. This reinforces the need for a sturdy support system in the fruiting
orchard, particularly when using weaker rootstock-scion combinations.
Flexibility/Brittleness
57 As break tests were performed in 2014 and early 2015, there appeared to be
differences in the degree to which samples would bend before failing. For October 2015,
a measurement of deflection was also included to indicate how far the sample bent before
breaking. Deflection measurements of flexibility/rigidity estimate the internal strain or
resistance to deformation or displacement (Winandy and Rowell, 2005). Brittleness is
related to flexibility/rigidity because it characterizes wood failure that has low
deformation or displacement and results in brash or clean break types (Winandy and
Rowell, 2005). Deflection was measured for the graft union and independently on a
subset of scion and rootstock portions.
There were significant differences in both scion and rootstock flexibility (Table
2.11). Not surprisingly, only the scion cultivar had a significant effect on scion
deflection, and likewise only rootstock cultivar had a significant effect on rootstock
deflection. For the scion, ‘Fuji’ had the highest deflection (greatest flexibility), whereas
‘Scilate’ had the lowest deflection or the least flexibility. For the rootstock, ‘M.9-NIC 29’
and ‘G.935’ both tolerated significantly more deflection than ‘G.41’. In this case, more
flexibility is better because it would allow the tree to bend more before breaking.
The maximum deflection before graft failure was also compared. The analysis of
variance for deflection (Table 2.12) indicated several significant 2-way interactions for
both chip buds and saddle grafts, which are illustrated in Figure 2.6. For chip buds, there
was a significant difference between directions for deflection, where chip down was
significantly more flexible than chip up (Figure 2.6). Differences in direction for saddle
graft were not statistically significant. Comparing flexibility in the least flexible direction
for each graft type (Figure 2.7), it appears that saddle grafts have a higher deflection
58 (greater flexibility) than the chip buds in the bud-up position, which is one positive of
saddle grafting.
Comparing the rootstock*scion interactions (Table 2.13), ‘G.41’ formed the most
rigid/brittle unions for both graft types. For the chip buds, ‘G.11’ and ‘B.9’ had the
highest deflections, which is a contributing factor to the few to no breaks seen in the
nursery. For saddle graft, ‘MM.106’ had a much higher deflection than any other
rootstock. As noted earlier, ‘MM.106’ did not have as high of a break force as expected,
and this may be due to the greater flexibility noted here. For the scions, ‘Fuji’ always had
the most flexible union for both graft types, with ‘Pink Lady’ also forming a more
flexible union. As noted above, ‘Fuji’ wood was the most flexible of the scion
subsamples tested (Table 2.11). ‘Scilate’ was always one of the most rigid unions for
both graft types, while ‘Honeycrisp’ formed the most rigid unions for chip buds. This
shows that the flexibility of the scion alone is not the determining factor of the overall
graft flexibility, but scion and rootstock flexibility are generally related to the resulting
flexibility of the graft combinations.
Break Type Categorization
The pattern of graft failure varied from very clean breaks right at the graft union
to less precise failures that incorporated significant portions of scion or rootstock tissue
(as described in table 2.2). Categories were refined with each of the first two sampling
times, but were consistently assigned at the October 2014 and later times. Categorical
data for break type were lumped into orders based on worst to best-case scenarios with
order 1 (clean breaks at the graft) being the worst and order 4 (non-graft breaks or no
59 break) being the best. Samples that did not break were combined with the samples that
broke somewhere other than the graft because less than 0.1% of the samples did not
break. The statistics procedure tested the probability of having lower order break types.
The analysis of these categories for October 2014 is shown in table 2.14. The rootstock
‘G.41’ consistently had the highest frequency of clean breaks for all graft type except for
saddle graft in the stacked position. In general, ‘G.11’ and ‘M.9-NIC 29’ had a
significantly lower probability of clean breaks, except for saddle stacked. ‘G.11’ saddle
stacked had an unusual percentage of clean breaks compared to all of the other
rootstocks.
For chip buds in October 2015, ‘Honeycrisp’ had the highest probability of low
order (clean breaks) and ‘Gala’ had the lowest probability of clean breaks (Table 2.15).
Among rootstocks, ‘G.41’ was significantly different than all other tested rootstocks,
having the highest frequency of clean breaks. Since there was a significant
rootstock*direction interaction, rootstocks were analyzed separately for each direction.
Regardless of direction, ‘G.41’ always had the highest probability for clean breaks. All of
the other rootstock tended to break less cleanly with ‘G.11’ being the least clean or
having more non-graft breaks for chip down, while ‘B.9’ had more non-clean and non-
graft breaks for chip up. For the saddle grafts, ‘G.41’ again had the highest probability of
having clean breaks followed closely by ‘G.935’ (Table 2.16). The highest proportion of
non-clean breaks was for ‘B.9’ and ‘MM.106’. Break patterns were particularly distinct
in ‘MM.106’, in part due to the greater flexibility (high deflection); tissue would often
tear at locations other than the graft.
60 Conclusion
Across all studies, ‘G.41’ formed a graft union that was both weak and
rigid/brittle. The break force corrected for both scion and graft size was weaker than
other rootstocks over both years. This result was true regardless of scion cultivar or graft
method. Although ‘G.41’ increases in strength during a second year, the rate of increase
remained less than other rootstocks tested, such as ‘M.9-NIC 29’. ‘G.41’ also had the
least deflection or flexibility in the rootstock alone and as part of the graft union. In
addition to these results, ‘G.41’ had a higher probability of breaking clean at the graft
compared to the other rootstocks. Clearly it would be unadvisable to use ‘G.41’ as a
rootstock for scions that are also known to have more brittle wood or form weaker graft
unions such as ‘Scilate’. ‘Scilate’ also produces a large highly feathered tree that is more
susceptible to wind damage. ‘Honeycrisp’ also appears to form a weak union with ‘G.41’,
but may be less susceptible to wind damage due to reduced growth compared to ‘Scilate’.
Some cultivars that tended to form stronger graft unions with ‘G.41’ include ‘McIntosh’
and ‘Pink Lady’
Other Geneva® rootstocks appear to be stronger than ‘G.41’, especially ‘G.11’
and ‘G.214’. The rootstock ‘G.935’, while stronger than ‘G.41’, tended to form weaker
graft unions than the remaining rootstocks tested. It also produces a larger tree, so
nurseries should be careful in the scions they select to graft onto ‘G.935’.
Grafting method does not appear to be an effective means of improving graft
union strength. In general, weaker rootstock-scion combinations were also relatively
weak when bench grafted. Further, bench-grafting techniques tend to produce less scion
61 growth. Although the resulting smaller trees would be less susceptible to wind damage,
growers prefer the larger more feathered trees produced from chip budding.
Literature Cited
ASTM. 2010. D790-10 Standard Test Methods for Flexural Properties of Unreinforced and Reinforced Plastics and Electrical Insulating Materials. ASTM International, West Conshohocken, PA.
ASTM. 2015. D7264/D7264-15 Standard Test Methods for Flexural Properties of Polymer Matrix Composite Materials. ASTM International, West Conshohocken, PA.
Evans, W.D. and R.J. Hilton. 1957. Methods of evaluating stock/scion compatibility in apple trees. Can. J. Plant Sci. 37:327-336.
Fazio, G., H. Aldwinckle, and T. Robinson. 2013. Unique characteristics of Geneva® apple rootstocks. New York Fruit Qrtly. 21:25-28
Lapins, K. 1959. Some symptoms of stock-scion incompatibility of apricot varieties on peach seedling rootstock. Can. J. Plant Sci. 39:194-203.
Lindsay, D.W., M.M. Yeoman, and R. Brown. 1974. An analysis of the development of the graft union in Lycopersicon esculentum. Ann. Bot. 38:639-646.
Moore, R. 1983. Studies of vegetative compatibility-incompatibility in higher plants. IV. The development of tensile strength in a compatible and an incompatible graft. Amer. J. Bot. 20:226-231.
Norelli, J.L., H.T. Holleran, W.C. Johnson, T.L. Robinson, and H.S. Aldwinkle. 2003. Resistance of Geneva and other apple rootstocks to Erwinia amylovora. Plant Dis. 87:26-32.
Parkinson, M. and M.M. Yeoman. 1982. Graft formation in cultured, explanted internodes. New Phytol. 91:711-719.
Pedersen, B.H. 2005. Development of tensile strength in compatible and incompatible sweet cherry graftings. Can. J. Bot. 83:202-210.
Robinson, T., L. Anderson, W. Autio, B. Barritt, J. Cline, W. Cowgill, R. Crassweller, C. Embree, D. Ferree, E. Garcia, G. Greene, C. Hampson, K. Kosola, M. Parker, R. Perry, T. Roper, and M. Warmund. 2007. A multi-location comparison of 'Geneva® 16', 'Geneva® 41' and 'M.9' apple rootstocks in North America. Acta Hort. 732:59-65.
Soumelidou, K., N.H. Battey, P. John, and J.R. Barnett. 1994. The anatomy of the developing bud union and its relationship to dwarfing in apple. Ann. Bot. 74:605-611.
USApple. 2015. Industry statistics: An overview of the U.S. apple industry. U.S. Apple Association, 8233 Old Courthouse Road Suite 200, Vienna, VA.
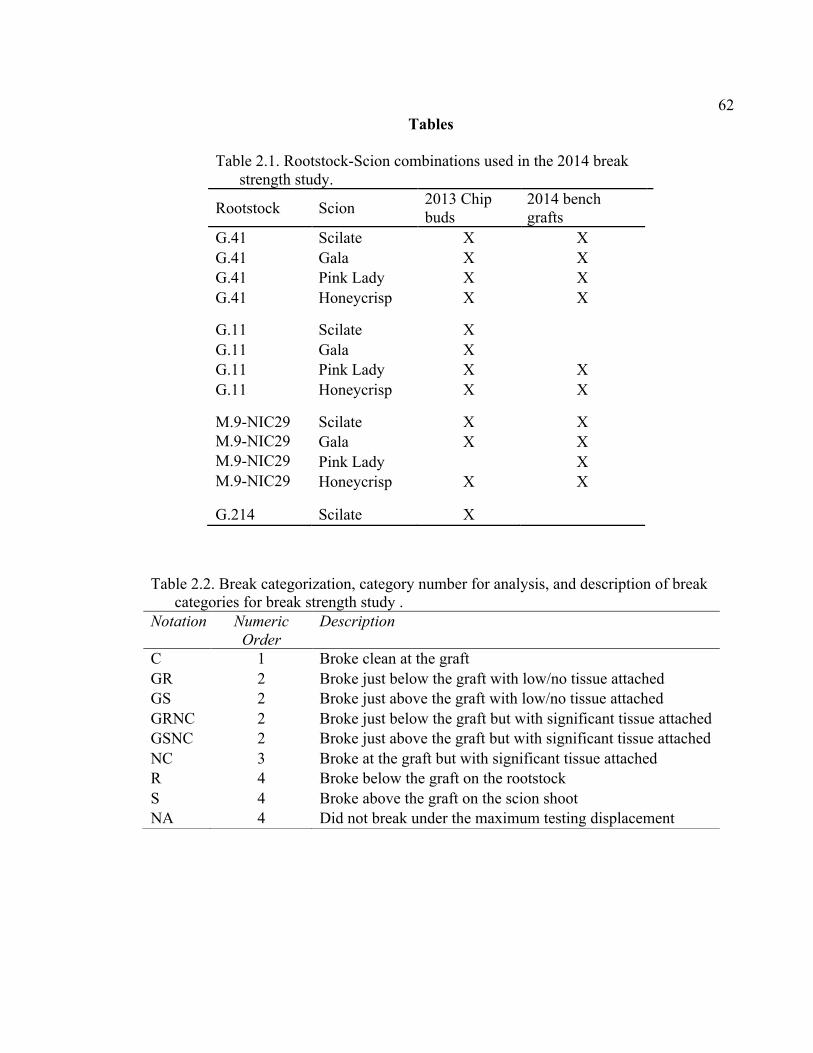
62 Tables
Table 2.1. Rootstock-Scion combinations used in the 2014 break strength study.
Rootstock Scion 2013 Chip buds
2014 bench grafts
G.41 Scilate X X G.41 Gala X X G.41 Pink Lady X X G.41 Honeycrisp X X
G.11 Scilate X G.11 Gala X G.11 Pink Lady X X G.11 Honeycrisp X X
M.9-NIC29 Scilate X X M.9-NIC29 Gala X X M.9-NIC29 Pink Lady X M.9-NIC29 Honeycrisp X X
G.214 Scilate X
Table 2.2. Break categorization, category number for analysis, and description of break categories for break strength study . Notation Numeric
Order Description
C 1 Broke clean at the graft GR 2 Broke just below the graft with low/no tissue attached GS 2 Broke just above the graft with low/no tissue attached GRNC 2 Broke just below the graft but with significant tissue attached GSNC 2 Broke just above the graft but with significant tissue attached NC 3 Broke at the graft but with significant tissue attached R 4 Broke below the graft on the rootstock S 4 Broke above the graft on the scion shoot NA 4 Did not break under the maximum testing displacement
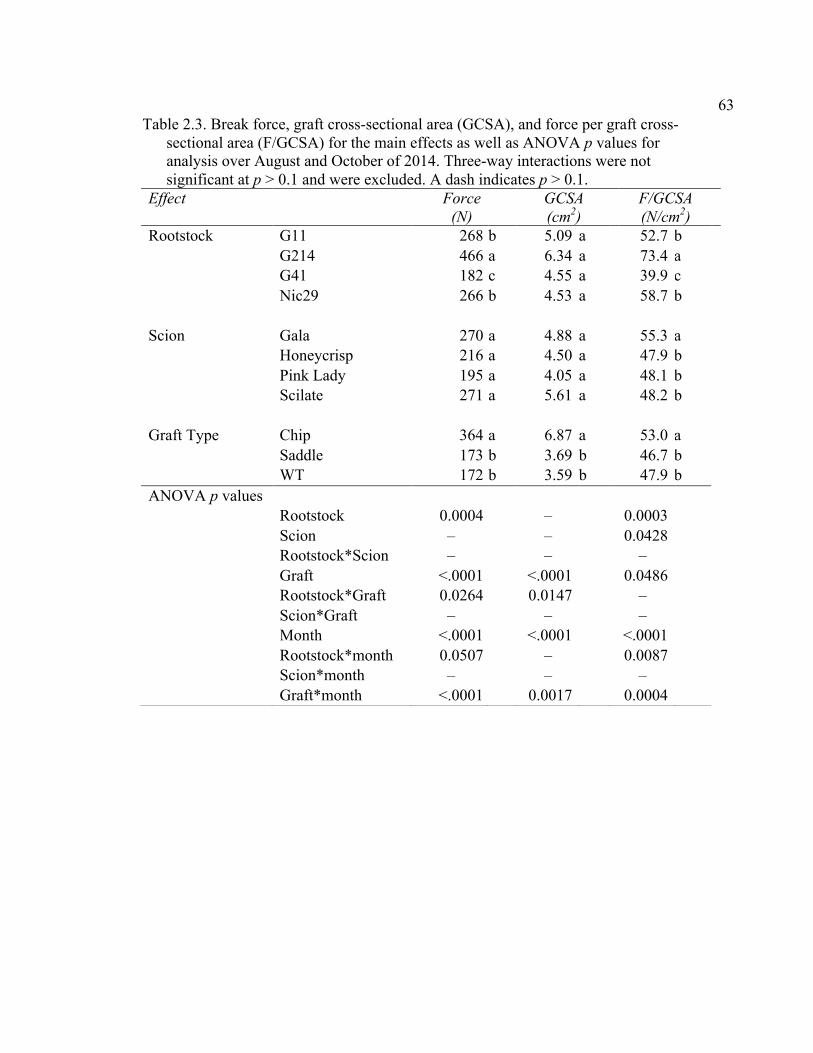
63
Table 2.3. Break force, graft cross-sectional area (GCSA), and force per graft cross- sectional area (F/GCSA) for the main effects as well as ANOVA p values for analysis over August and October of 2014. Three-way interactions were not significant at p > 0.1 and were excluded. A dash indicates p > 0.1. Effect Force
(N) GCSA (cm2)
F/GCSA (N/cm2)
Rootstock G11 268 b 5.09 a 52.7 b G214 466 a 6.34 a 73.4 a G41 182 c 4.55 a 39.9 c Nic29 266 b 4.53 a 58.7 b Scion Gala 270 a 4.88 a 55.3 a Honeycrisp 216 a 4.50 a 47.9 b Pink Lady 195 a 4.05 a 48.1 b Scilate 271 a 5.61 a 48.2 b Graft Type Chip 364 a 6.87 a 53.0 a Saddle 173 b 3.69 b 46.7 b WT 172 b 3.59 b 47.9 b ANOVA p values Rootstock 0.0004 – 0.0003 Scion – – 0.0428 Rootstock*Scion – – – Graft <.0001 <.0001 0.0486 Rootstock*Graft 0.0264 0.0147 – Scion*Graft – – – Month <.0001 <.0001 <.0001 Rootstock*month 0.0507 – 0.0087 Scion*month – – – Graft*month <.0001 0.0017 0.0004
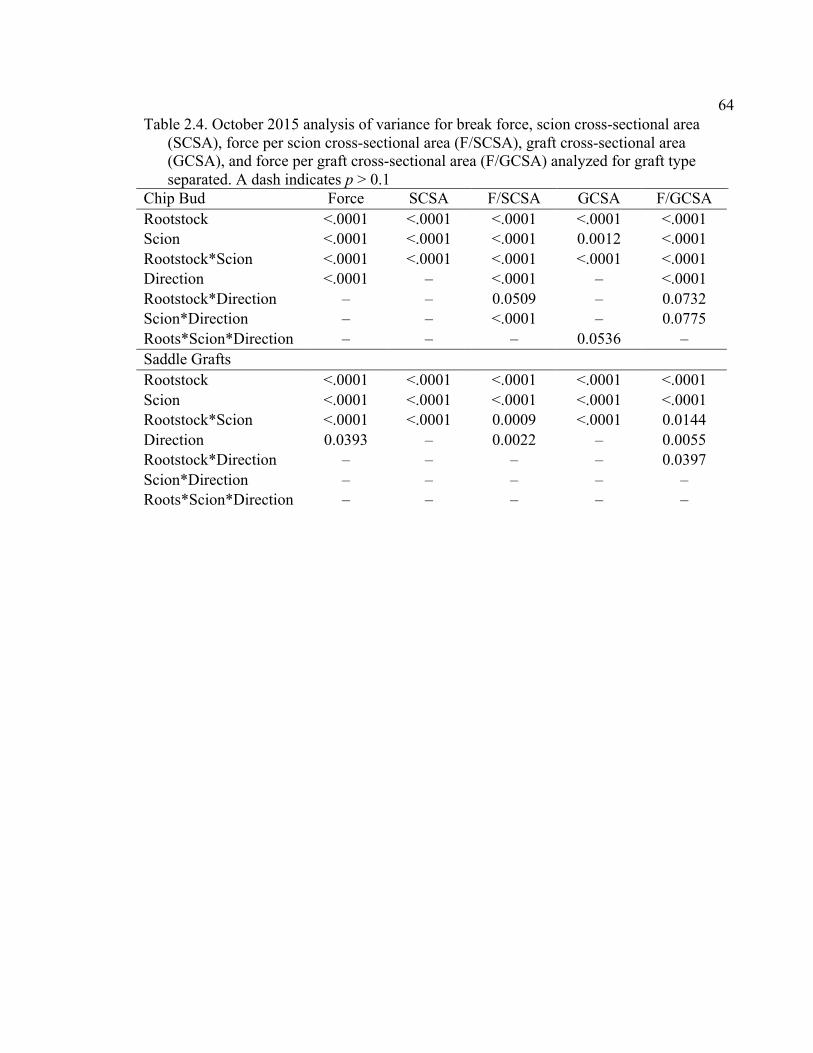
64
Table 2.4. October 2015 analysis of variance for break force, scion cross-sectional area (SCSA), force per scion cross-sectional area (F/SCSA), graft cross-sectional area (GCSA), and force per graft cross-sectional area (F/GCSA) analyzed for graft type separated. A dash indicates p > 0.1 Chip Bud Force SCSA F/SCSA GCSA F/GCSA Rootstock <.0001 <.0001 <.0001 <.0001 <.0001 Scion <.0001 <.0001 <.0001 0.0012 <.0001 Rootstock*Scion <.0001 <.0001 <.0001 <.0001 <.0001 Direction <.0001 – <.0001 – <.0001 Rootstock*Direction – – 0.0509 – 0.0732 Scion*Direction – – <.0001 – 0.0775 Roots*Scion*Direction – – – 0.0536 – Saddle Grafts Rootstock <.0001 <.0001 <.0001 <.0001 <.0001 Scion <.0001 <.0001 <.0001 <.0001 <.0001 Rootstock*Scion <.0001 <.0001 0.0009 <.0001 0.0144 Direction 0.0393 – 0.0022 – 0.0055 Rootstock*Direction – – – – 0.0397 Scion*Direction – – – – – Roots*Scion*Direction – – – – –
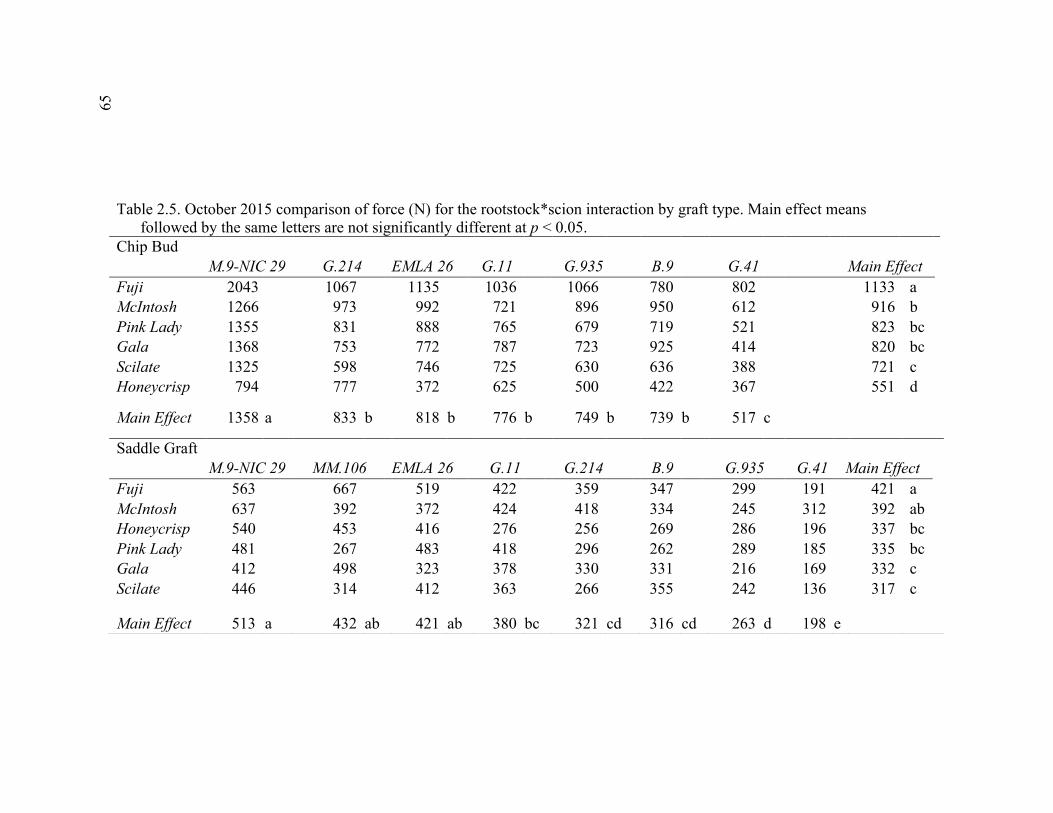
65
Table 2.5. October 2015 comparison of force (N) for the rootstock*scion interaction by graft type. Main effect means followed by the same letters are not significantly different at p < 0.05. Chip Bud M.9-NIC 29 G.214 EMLA 26 G.11 G.935 B.9 G.41 Main Effect Fuji 2043 1067 1135 1036 1066 780 802 1133 a McIntosh 1266 973 992 721 896 950 612 916 b Pink Lady 1355 831 888 765 679 719 521 823 bc Gala 1368 753 772 787 723 925 414 820 bc Scilate 1325 598 746 725 630 636 388 721 c Honeycrisp 794 777 372 625 500 422 367 551 d Main Effect 1358 a 833 b 818 b 776 b 749 b 739 b 517 c
Saddle Graft M.9-NIC 29 MM.106 EMLA 26 G.11 G.214 B.9 G.935 G.41 Main Effect Fuji 563 667 519 422 359 347 299 191 421 a McIntosh 637 392 372 424 418 334 245 312 392 ab Honeycrisp 540 453 416 276 256 269 286 196 337 bc Pink Lady 481 267 483 418 296 262 289 185 335 bc Gala 412 498 323 378 330 331 216 169 332 c Scilate 446 314 412 363 266 355 242 136 317 c Main Effect 513 a 432 ab 421 ab 380 bc 321 cd 316 cd 263 d 198 e
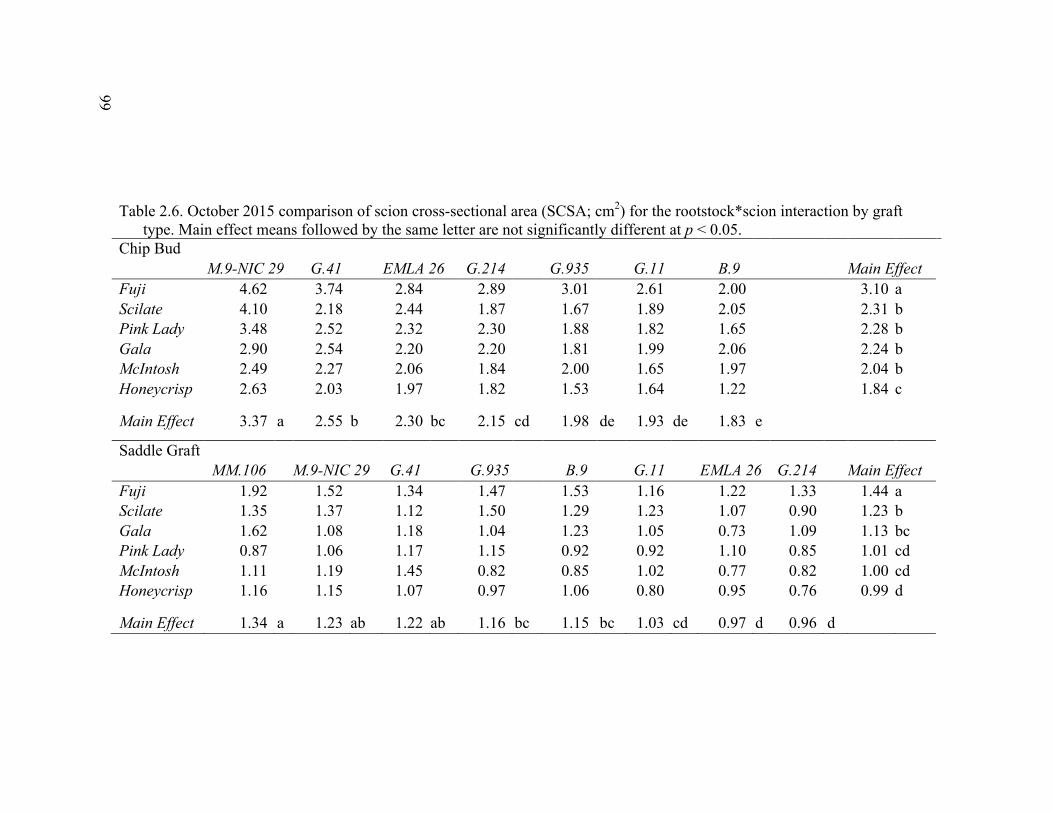
66
Table 2.6. October 2015 comparison of scion cross-sectional area (SCSA; cm2) for the rootstock*scion interaction by graft type. Main effect means followed by the same letter are not significantly different at p < 0.05. Chip Bud M.9-NIC 29 G.41 EMLA 26 G.214 G.935 G.11 B.9 Main Effect Fuji 4.62 3.74 2.84 2.89 3.01 2.61 2.00 3.10 a Scilate 4.10 2.18 2.44 1.87 1.67 1.89 2.05 2.31 b Pink Lady 3.48 2.52 2.32 2.30 1.88 1.82 1.65 2.28 b Gala 2.90 2.54 2.20 2.20 1.81 1.99 2.06 2.24 b McIntosh 2.49 2.27 2.06 1.84 2.00 1.65 1.97 2.04 b Honeycrisp 2.63 2.03 1.97 1.82 1.53 1.64 1.22 1.84 c Main Effect 3.37 a 2.55 b 2.30 bc 2.15 cd 1.98 de 1.93 de 1.83 e
Saddle Graft MM.106 M.9-NIC 29 G.41 G.935’ B.9 G.11 EMLA 26 G.214 Main Effect Fuji 1.92 1.52 1.34 1.47 1.53 1.16 1.22 1.33 1.44 a Scilate 1.35 1.37 1.12 1.50 1.29 1.23 1.07 0.90 1.23 b Gala 1.62 1.08 1.18 1.04 1.23 1.05 0.73 1.09 1.13 bc Pink Lady 0.87 1.06 1.17 1.15 0.92 0.92 1.10 0.85 1.01 cd McIntosh 1.11 1.19 1.45 0.82 0.85 1.02 0.77 0.82 1.00 cd Honeycrisp 1.16 1.15 1.07 0.97 1.06 0.80 0.95 0.76 0.99 d Main Effect 1.34 a 1.23 ab 1.22 ab 1.16 bc 1.15 bc 1.03 cd 0.97 d 0.96 d
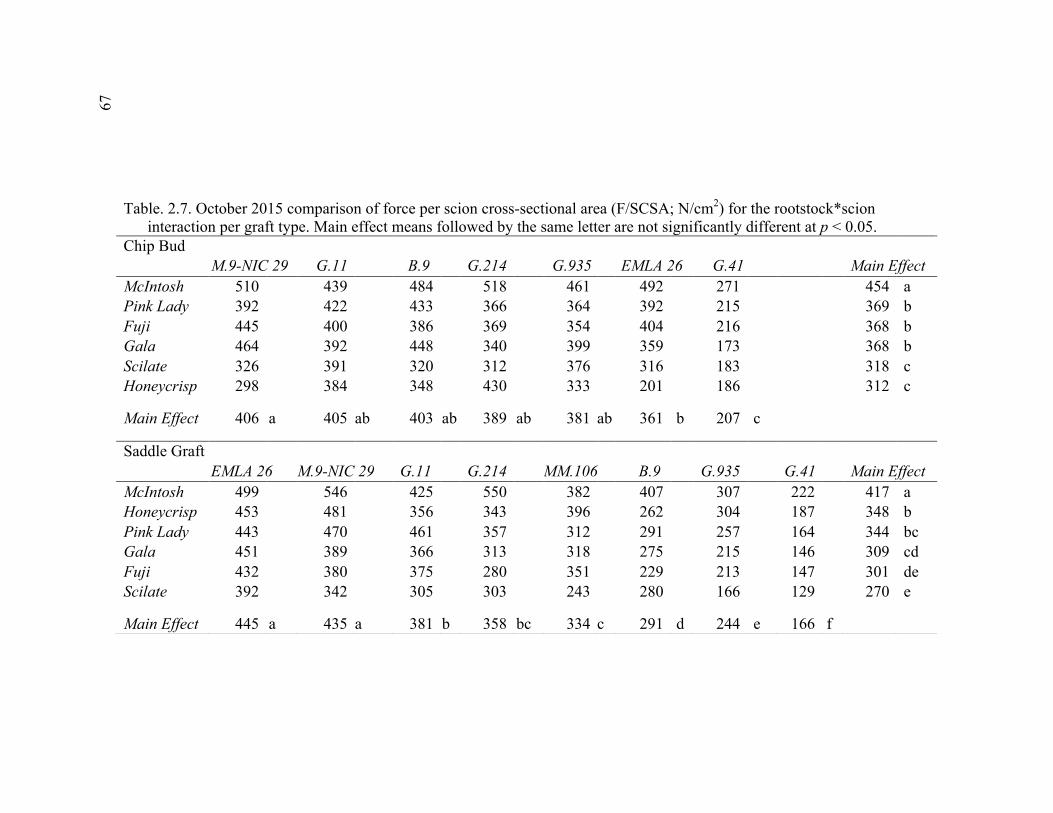
67
Table. 2.7. October 2015 comparison of force per scion cross-sectional area (F/SCSA; N/cm2) for the rootstock*scion interaction per graft type. Main effect means followed by the same letter are not significantly different at p < 0.05. Chip Bud M.9-NIC 29 G.11 B.9 G.214 G.935 EMLA 26 G.41 Main Effect McIntosh 510 439 484 518 461 492 271 454 a Pink Lady 392 422 433 366 364 392 215 369 b Fuji 445 400 386 369 354 404 216 368 b Gala 464 392 448 340 399 359 173 368 b Scilate 326 391 320 312 376 316 183 318 c Honeycrisp 298 384 348 430 333 201 186 312 c Main Effect 406 a 405 ab 403 ab 389 ab 381 ab 361 b 207 c
Saddle Graft EMLA 26 M.9-NIC 29 G.11 G.214 MM.106 B.9 G.935 G.41 Main Effect McIntosh 499 546 425 550 382 407 307 222 417 a Honeycrisp 453 481 356 343 396 262 304 187 348 b Pink Lady 443 470 461 357 312 291 257 164 344 bc Gala 451 389 366 313 318 275 215 146 309 cd Fuji 432 380 375 280 351 229 213 147 301 de Scilate 392 342 305 303 243 280 166 129 270 e Main Effect 445 a 435 a 381 b 358 bc 334 c 291 d 244 e 166 f
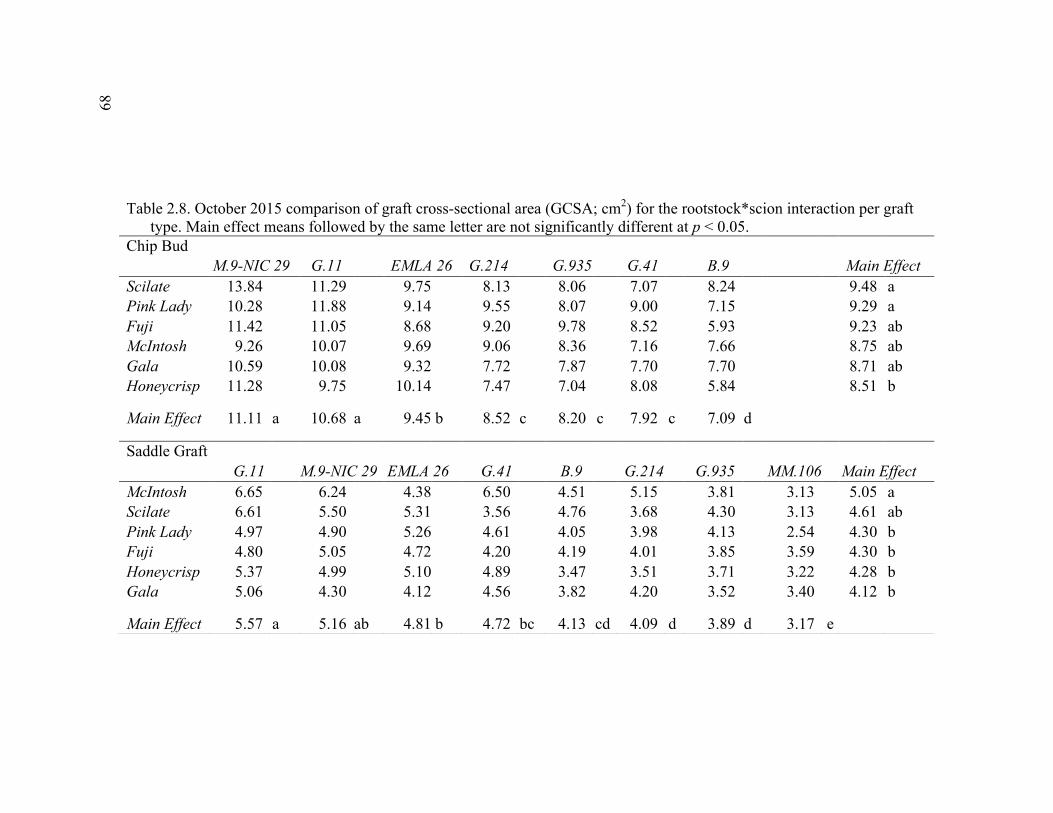
68
Table 2.8. October 2015 comparison of graft cross-sectional area (GCSA; cm2) for the rootstock*scion interaction per graft type. Main effect means followed by the same letter are not significantly different at p < 0.05. Chip Bud M.9-NIC 29 G.11 EMLA 26 G.214 G.935 G.41 B.9 Main Effect Scilate 13.84 11.29 9.75 8.13 8.06 7.07 8.24 9.48 a Pink Lady 10.28 11.88 9.14 9.55 8.07 9.00 7.15 9.29 a Fuji 11.42 11.05 8.68 9.20 9.78 8.52 5.93 9.23 ab McIntosh 9.26 10.07 9.69 9.06 8.36 7.16 7.66 8.75 ab Gala 10.59 10.08 9.32 7.72 7.87 7.70 7.70 8.71 ab Honeycrisp 11.28 9.75 10.14 7.47 7.04 8.08 5.84 8.51 b Main Effect 11.11 a 10.68 a 9.45 b 8.52 c 8.20 c 7.92 c 7.09 d
Saddle Graft G.11 M.9-NIC 29 EMLA 26 G.41 B.9 G.214 G.935 MM.106 Main Effect McIntosh 6.65 6.24 4.38 6.50 4.51 5.15 3.81 3.13 5.05 a Scilate 6.61 5.50 5.31 3.56 4.76 3.68 4.30 3.13 4.61 ab Pink Lady 4.97 4.90 5.26 4.61 4.05 3.98 4.13 2.54 4.30 b Fuji 4.80 5.05 4.72 4.20 4.19 4.01 3.85 3.59 4.30 b Honeycrisp 5.37 4.99 5.10 4.89 3.47 3.51 3.71 3.22 4.28 b Gala 5.06 4.30 4.12 4.56 3.82 4.20 3.52 3.40 4.12 b Main Effect 5.57 a 5.16 ab 4.81 b 4.72 bc 4.13 cd 4.09 d 3.89 d 3.17 e
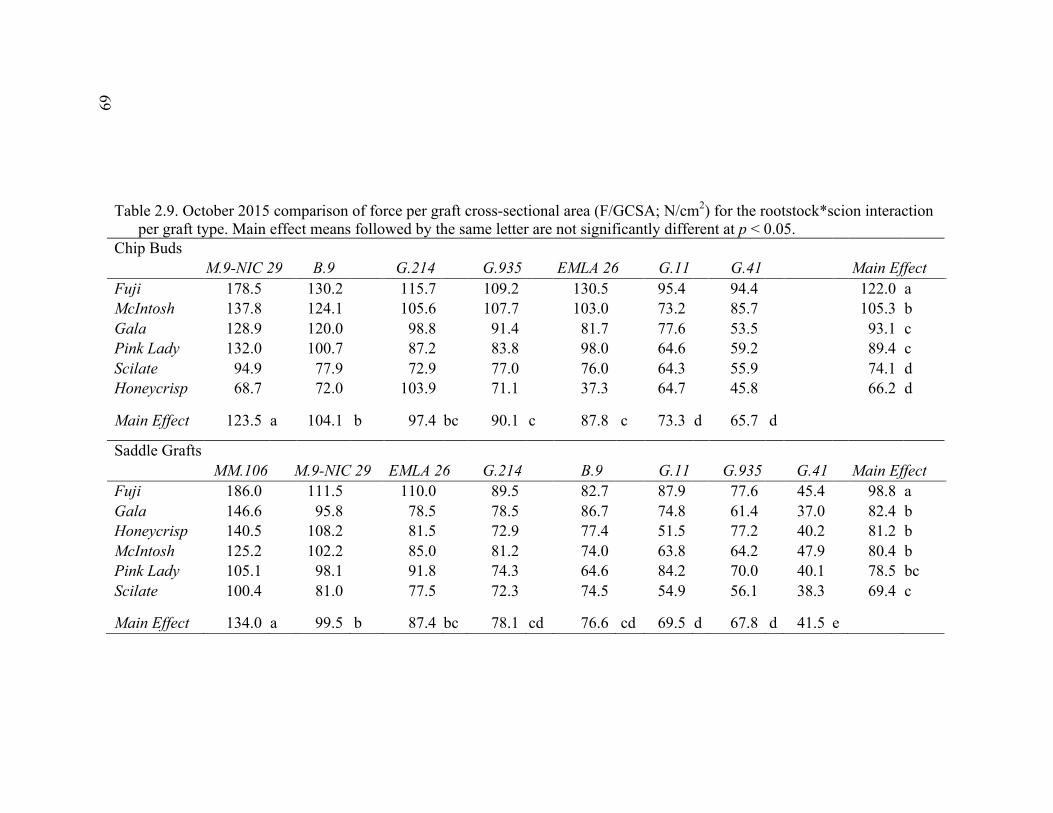
69
Table 2.9. October 2015 comparison of force per graft cross-sectional area (F/GCSA; N/cm2) for the rootstock*scion interaction per graft type. Main effect means followed by the same letter are not significantly different at p < 0.05. Chip Buds M.9-NIC 29 B.9 G.214 G.935 EMLA 26 G.11 G.41 Main Effect Fuji 178.5 130.2 115.7 109.2 130.5 95.4 94.4 122.0 a McIntosh 137.8 124.1 105.6 107.7 103.0 73.2 85.7 105.3 b Gala 128.9 120.0 98.8 91.4 81.7 77.6 53.5 93.1 c Pink Lady 132.0 100.7 87.2 83.8 98.0 64.6 59.2 89.4 c Scilate 94.9 77.9 72.9 77.0 76.0 64.3 55.9 74.1 d Honeycrisp 68.7 72.0 103.9 71.1 37.3 64.7 45.8 66.2 d Main Effect 123.5 a 104.1 b 97.4 bc 90.1 c 87.8 c 73.3 d 65.7 d
Saddle Grafts MM.106 M.9-NIC 29 EMLA 26 G.214 B.9 G.11 G.935 G.41 Main Effect Fuji 186.0 111.5 110.0 89.5 82.7 87.9 77.6 45.4 98.8 a Gala 146.6 95.8 78.5 78.5 86.7 74.8 61.4 37.0 82.4 b Honeycrisp 140.5 108.2 81.5 72.9 77.4 51.5 77.2 40.2 81.2 b McIntosh 125.2 102.2 85.0 81.2 74.0 63.8 64.2 47.9 80.4 b Pink Lady 105.1 98.1 91.8 74.3 64.6 84.2 70.0 40.1 78.5 bc Scilate 100.4 81.0 77.5 72.3 74.5 54.9 56.1 38.3 69.4 c Main Effect 134.0 a 99.5 b 87.4 bc 78.1 cd 76.6 cd 69.5 d 67.8 d 41.5 e
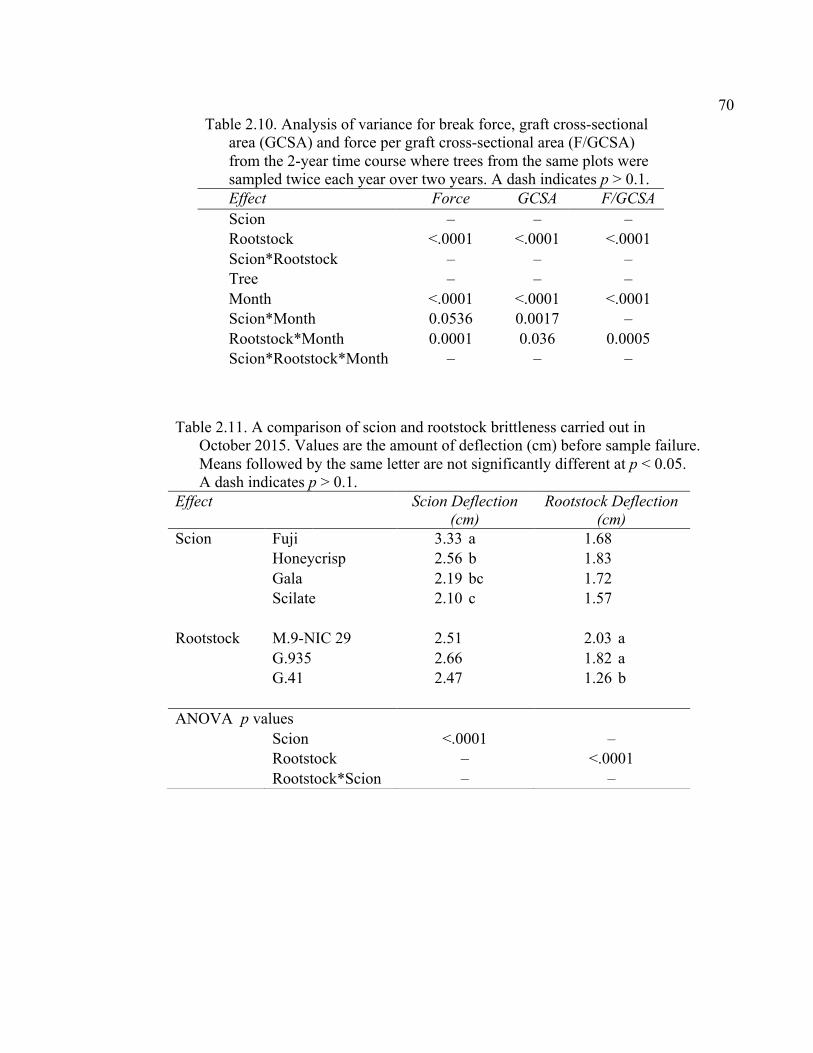
70 Table 2.10. Analysis of variance for break force, graft cross-sectional
area (GCSA) and force per graft cross-sectional area (F/GCSA) from the 2-year time course where trees from the same plots were sampled twice each year over two years. A dash indicates p > 0.1.
Effect Force GCSA F/GCSA Scion – – – Rootstock <.0001 <.0001 <.0001 Scion*Rootstock – – – Tree – – – Month <.0001 <.0001 <.0001 Scion*Month 0.0536 0.0017 – Rootstock*Month 0.0001 0.036 0.0005 Scion*Rootstock*Month – – –
Table 2.11. A comparison of scion and rootstock brittleness carried out in October 2015. Values are the amount of deflection (cm) before sample failure. Means followed by the same letter are not significantly different at p < 0.05. A dash indicates p > 0.1. Effect Scion Deflection
(cm) Rootstock Deflection
(cm) Scion Fuji 3.33 a 1.68 Honeycrisp 2.56 b 1.83 Gala 2.19 bc 1.72 Scilate 2.10 c 1.57 Rootstock M.9-NIC 29 2.51 2.03 a G.935 2.66 1.82 a G.41 2.47 1.26 b ANOVA p values Scion <.0001 – Rootstock – <.0001 Rootstock*Scion – –
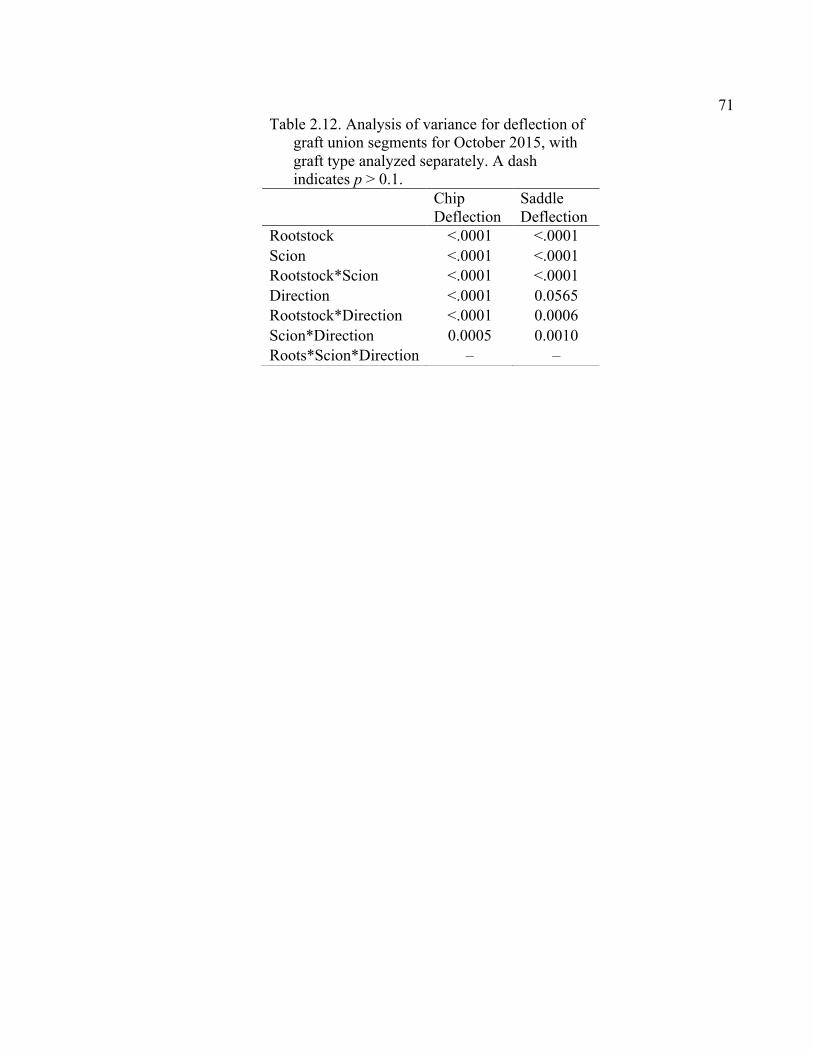
71 Table 2.12. Analysis of variance for deflection of graft union segments for October 2015, with graft type analyzed separately. A dash indicates p > 0.1. Chip
Deflection Saddle Deflection
Rootstock <.0001 <.0001 Scion <.0001 <.0001 Rootstock*Scion <.0001 <.0001 Direction <.0001 0.0565 Rootstock*Direction <.0001 0.0006 Scion*Direction 0.0005 0.0010 Roots*Scion*Direction – –
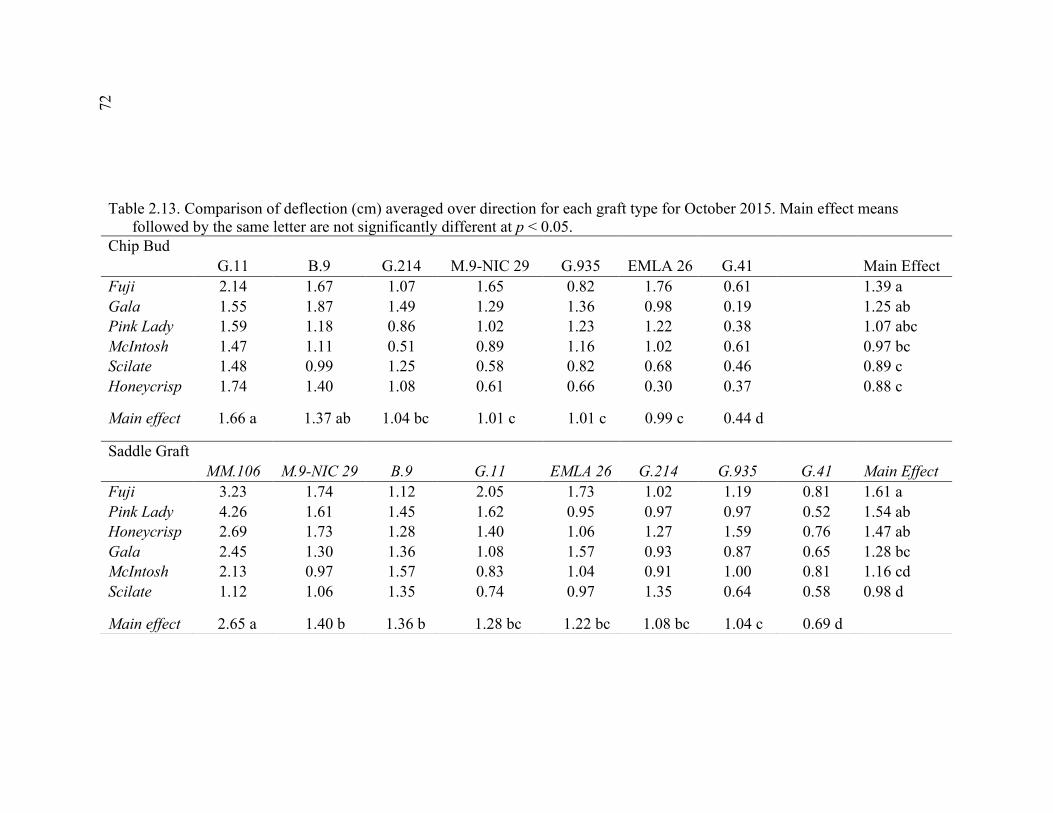
72
Table 2.13. Comparison of deflection (cm) averaged over direction for each graft type for October 2015. Main effect means followed by the same letter are not significantly different at p < 0.05. Chip Bud G.11 B.9 G.214 M.9-NIC 29 G.935 EMLA 26 G.41 Main Effect Fuji 2.14 1.67 1.07 1.65 0.82 1.76 0.61 1.39 a Gala 1.55 1.87 1.49 1.29 1.36 0.98 0.19 1.25 ab Pink Lady 1.59 1.18 0.86 1.02 1.23 1.22 0.38 1.07 abc McIntosh 1.47 1.11 0.51 0.89 1.16 1.02 0.61 0.97 bc Scilate 1.48 0.99 1.25 0.58 0.82 0.68 0.46 0.89 c Honeycrisp 1.74 1.40 1.08 0.61 0.66 0.30 0.37 0.88 c Main effect 1.66 a 1.37 ab 1.04 bc 1.01 c 1.01 c 0.99 c 0.44 d
Saddle Graft MM.106 M.9-NIC 29 B.9 G.11 EMLA 26 G.214 G.935 G.41 Main Effect Fuji 3.23 1.74 1.12 2.05 1.73 1.02 1.19 0.81 1.61 a Pink Lady 4.26 1.61 1.45 1.62 0.95 0.97 0.97 0.52 1.54 ab Honeycrisp 2.69 1.73 1.28 1.40 1.06 1.27 1.59 0.76 1.47 ab Gala 2.45 1.30 1.36 1.08 1.57 0.93 0.87 0.65 1.28 bc McIntosh 2.13 0.97 1.57 0.83 1.04 0.91 1.00 0.81 1.16 cd Scilate 1.12 1.06 1.35 0.74 0.97 1.35 0.64 0.58 0.98 d Main effect 2.65 a 1.40 b 1.36 b 1.28 bc 1.22 bc 1.08 bc 1.04 c 0.69 d
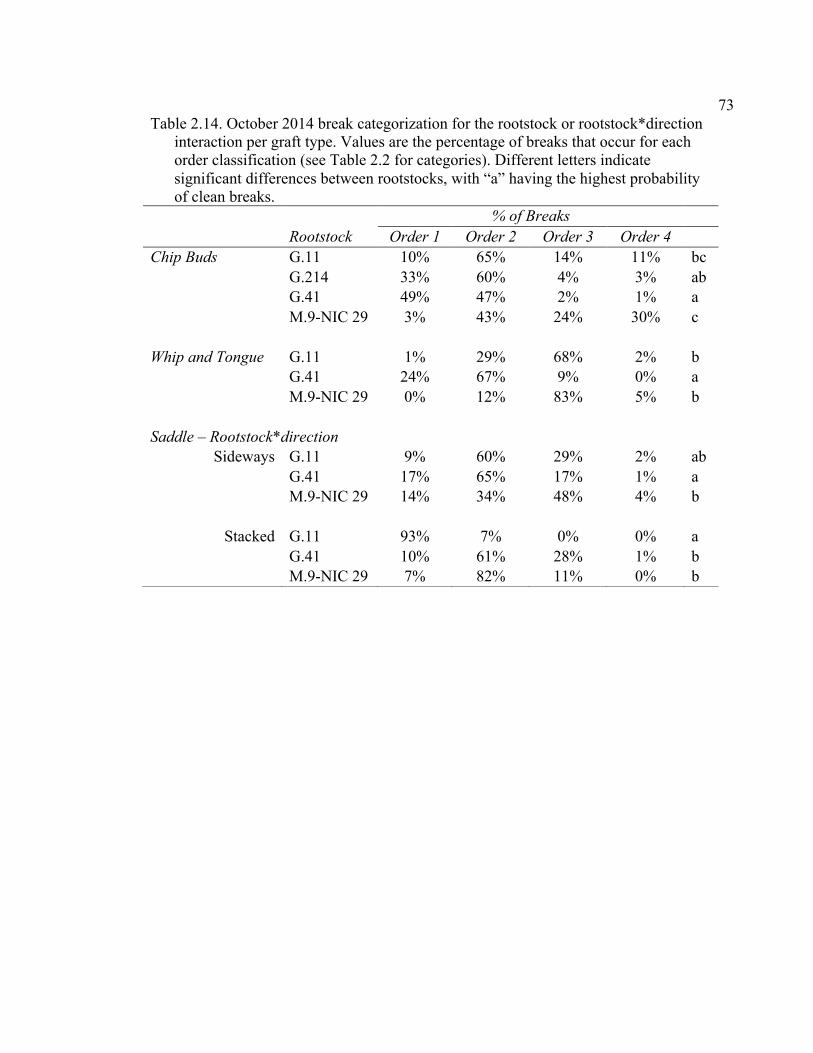
73
Table 2.14. October 2014 break categorization for the rootstock or rootstock*direction interaction per graft type. Values are the percentage of breaks that occur for each order classification (see Table 2.2 for categories). Different letters indicate significant differences between rootstocks, with “a” having the highest probability of clean breaks. % of Breaks Rootstock Order 1 Order 2 Order 3 Order 4 Chip Buds G.11 10% 65% 14% 11% bc G.214 33% 60% 4% 3% ab G.41 49% 47% 2% 1% a M.9-NIC 29 3% 43% 24% 30% c Whip and Tongue G.11 1% 29% 68% 2% b G.41 24% 67% 9% 0% a M.9-NIC 29 0% 12% 83% 5% b Saddle – Rootstock*direction
Sideways G.11 9% 60% 29% 2% ab G.41 17% 65% 17% 1% a M.9-NIC 29 14% 34% 48% 4% b
Stacked G.11 93% 7% 0% 0% a G.41 10% 61% 28% 1% b M.9-NIC 29 7% 82% 11% 0% b

74
Table 2.15. October 2015 chip bud break categorization analysis for the significant scion effect and rootstock*direction interaction. Values are the percentage of breaks that occur for each order classification (see Table 2.2 for categories). Different letters indicate significant differences between scions and rootstocks, with “a” having the highest probability of clean breaks. % of breaks Order 1 Order 2 Order 3 Order 4 Scion Fuji 10% 47% 34% 9% ab Gala 5% 33% 45% 18% b Honeycrisp 16% 54% 25% 5% a McIntosh 9% 46% 36% 10% ab Pink Lady 8% 43% 38% 11% ab Scilate 8% 44% 37% 10% ab Rootstock*Direction Chip Down G.41 34% 52% 12% 2% a G.935 10% 48% 33% 8% b B.9 3% 26% 47% 24% bc EMLA 26 7% 41% 40% 12% bc G.214 8% 44% 38% 11% bc M.9-NIC 29 6% 38% 42% 14% bc G.11 2% 16% 45% 38% c Chip Up G.41 50% 42% 6% 1% a G.11 15% 53% 26% 6% b EMLA 26 9% 46% 35% 9% bc G.214 11% 49% 33% 8% bc G.935 6% 39% 42% 14% bc M.9-NIC 29 7% 39% 41% 13% bc B.9 4% 30% 46% 20% c
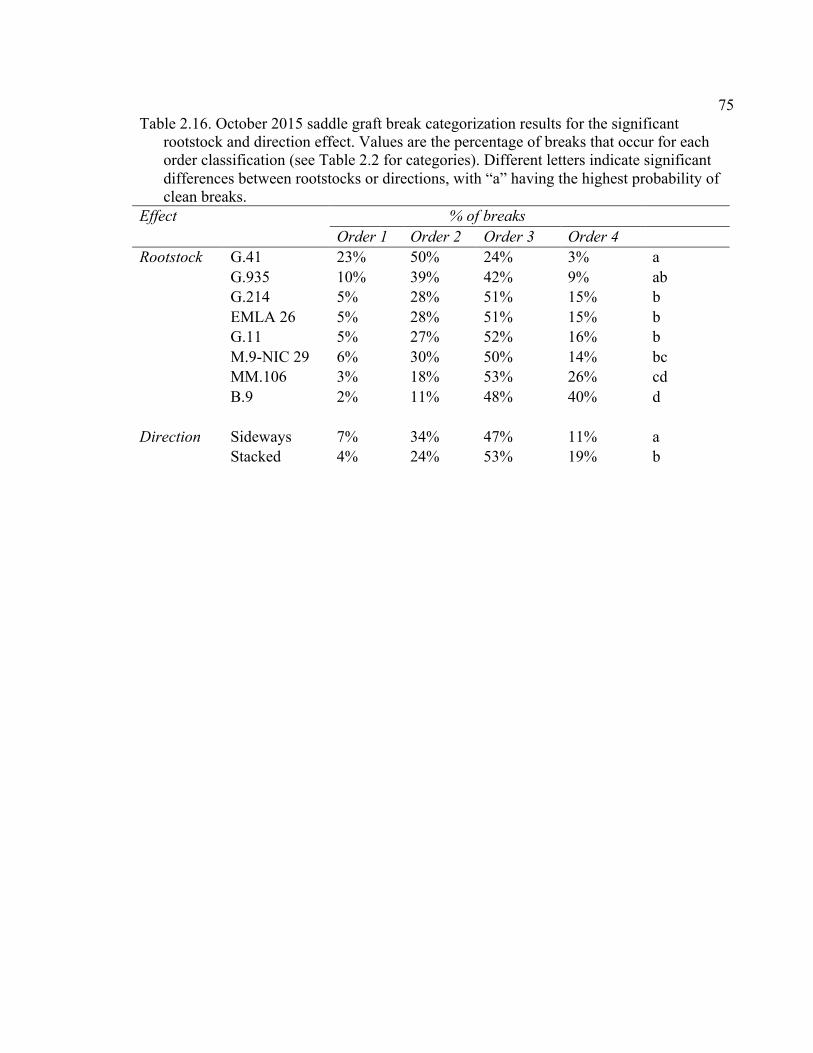
75 Table 2.16. October 2015 saddle graft break categorization results for the significant rootstock and direction effect. Values are the percentage of breaks that occur for each order classification (see Table 2.2 for categories). Different letters indicate significant differences between rootstocks or directions, with “a” having the highest probability of clean breaks. Effect % of breaks Order 1 Order 2 Order 3 Order 4 Rootstock G.41 23% 50% 24% 3% a G.935 10% 39% 42% 9% ab G.214 5% 28% 51% 15% b EMLA 26 5% 28% 51% 15% b G.11 5% 27% 52% 16% b M.9-NIC 29 6% 30% 50% 14% bc MM.106 3% 18% 53% 26% cd B.9 2% 11% 48% 40% d Direction Sideways 7% 34% 47% 11% a Stacked 4% 24% 53% 19% b
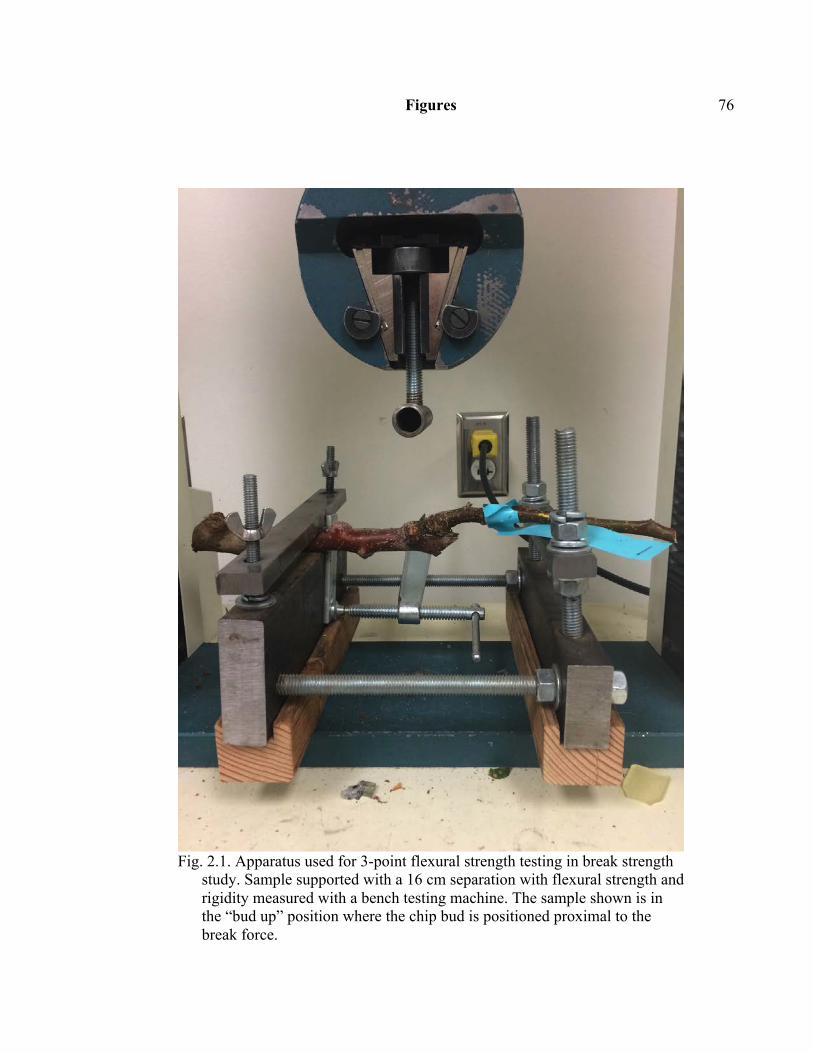
76 Figures
Fig. 2.1. Apparatus used for 3-point flexural strength testing in break strength study. Sample supported with a 16 cm separation with flexural strength and rigidity measured with a bench testing machine. The sample shown is in the “bud up” position where the chip bud is positioned proximal to the break force.
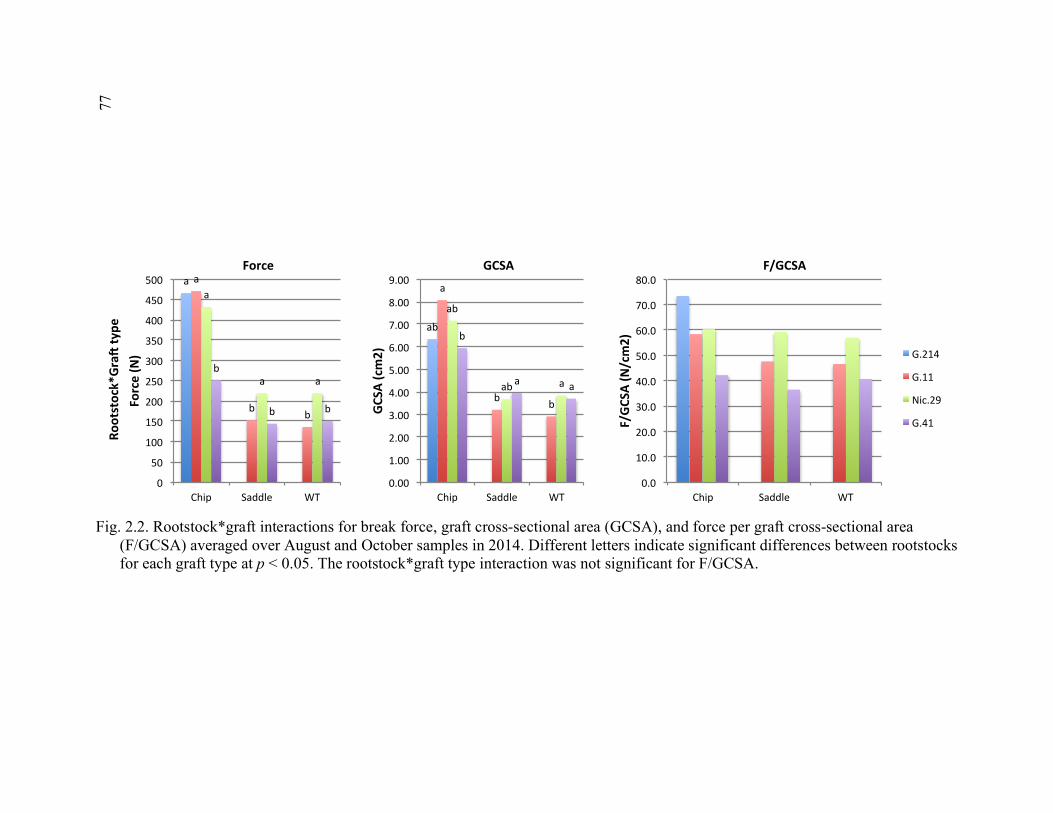
77
a a
b b
a
a ab
b b
0
50
100
150
200
250
300
350
400
450
500
Chip Saddle WT
Force(N)
ab
a
b b
ab
ab a
b
a a
0.00
1.00
2.00
3.00
4.00
5.00
6.00
7.00
8.00
9.00
Chip Saddle WT
GCSA
(cm2)
0.0
10.0
20.0
30.0
40.0
50.0
60.0
70.0
80.0
Chip Saddle WT
F/GC
SA(N
/cm2)
G.214
G.11
Nic.29
G.41
Force GCSA F/GCSA
Rootstock*Gra7
type
Fig. 2.2. Rootstock*graft interactions for break force, graft cross-sectional area (GCSA), and force per graft cross-sectional area (F/GCSA) averaged over August and October samples in 2014. Different letters indicate significant differences between rootstocks for each graft type at p < 0.05. The rootstock*graft type interaction was not significant for F/GCSA.
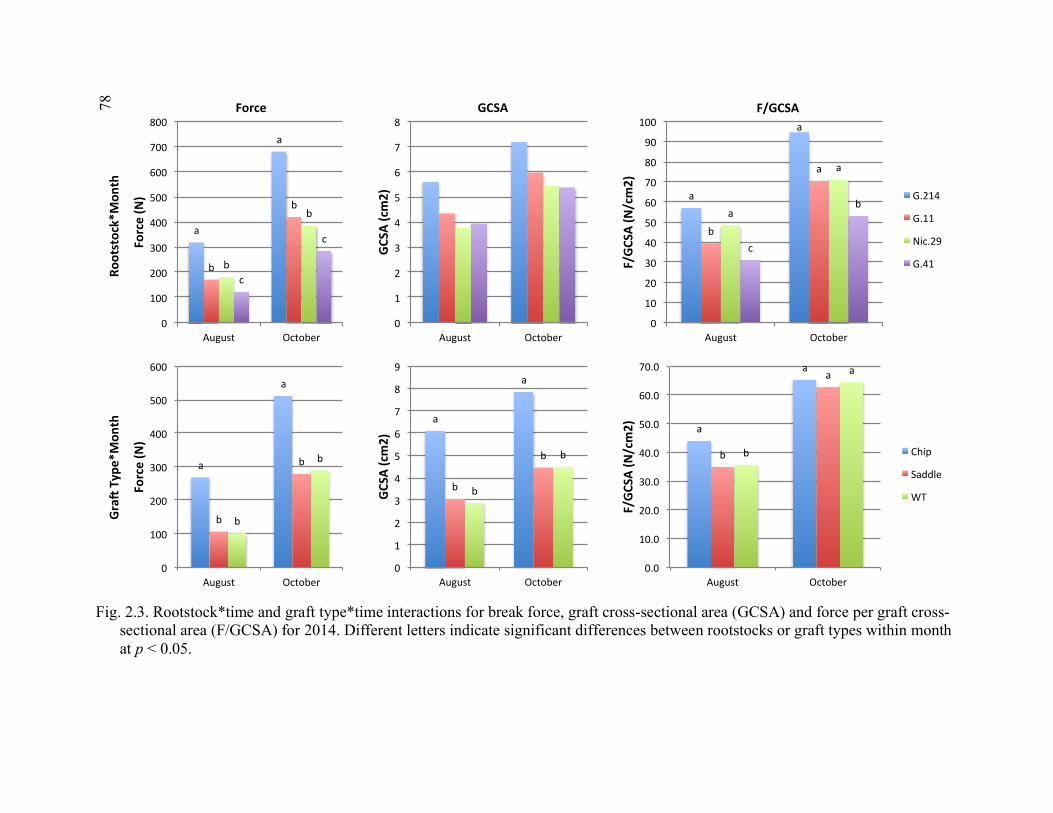
78
a
a
b
b
b
b
c
c
0
100
200
300
400
500
600
700
800
August October
Force(N) a
a
b
a
a
a
c
b
0
10
20
30
40
50
60
70
80
90
100
August October
F/GC
SA(N
/cm2)
G.214
G.11
Nic.29
G.41
0
1
2
3
4
5
6
7
8
August October
GCSA
(cm2)
a
a
b
b
b
b
0
100
200
300
400
500
600
August October
Force(N)
a
a
b
b
b
b
0
1
2
3
4
5
6
7
8
9
August October
GCSA
(cm2) a
a
b
a
b
a
0.0
10.0
20.0
30.0
40.0
50.0
60.0
70.0
August October
F/GC
SA(N
/cm2)
Chip
Saddle
WT
Force GCSA F/GCSARo
otstock*Mon
th
Gra:
Type*Mon
th
Fig. 2.3. Rootstock*time and graft type*time interactions for break force, graft cross-sectional area (GCSA) and force per graft cross-sectional area (F/GCSA) for 2014. Different letters indicate significant differences between rootstocks or graft types within month at p < 0.05.
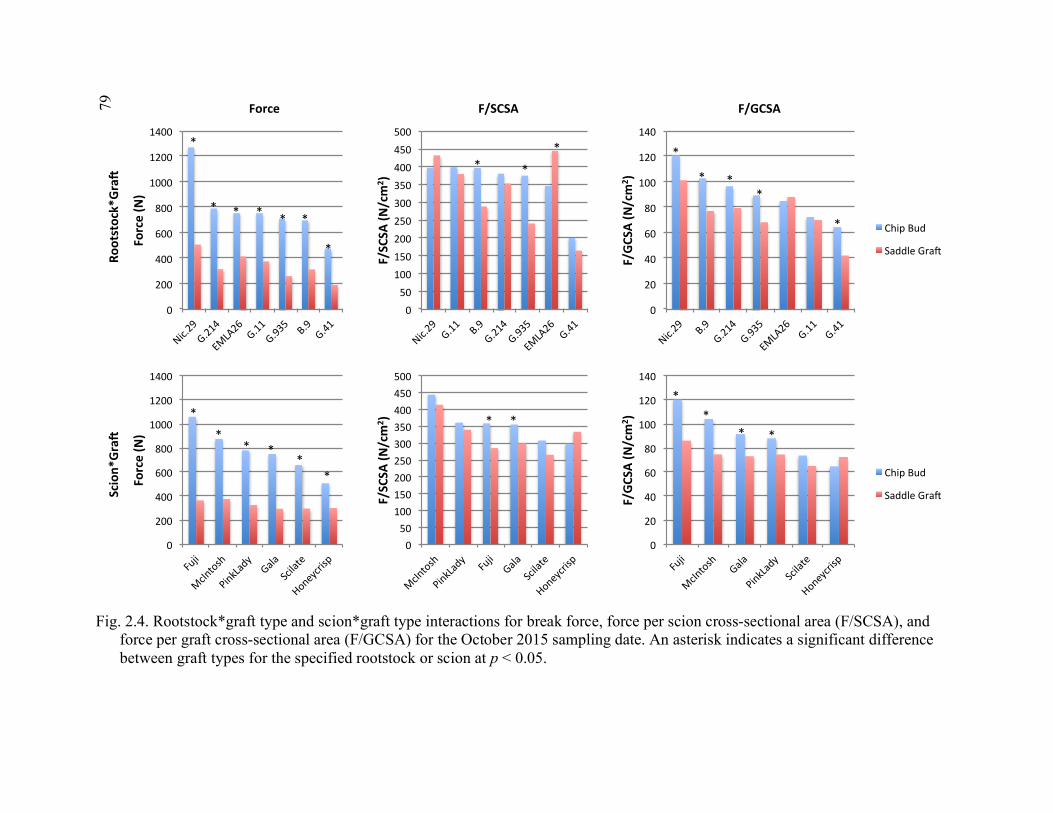
79
0
200
400
600
800
1000
1200
1400
Nic.29
G.214
EMLA26G.11
G.935
B.9G.41
Force(N)
050100150200250300350400450500
Nic.29G.11 B.9
G.214
G.935
EMLA26G.41
F/SCSA
(N/cm
2 )
0
20
40
60
80
100
120
140
Nic.29
B.9
G.214
G.935
EMLA26
G.11
G.41
F/GC
SA(N
/cm
2 )
ChipBud
SaddleGra?
0
200
400
600
800
1000
1200
1400
Fuji
McIntosh
PinkLady
Gala
Scilate
Honeycrisp
Force(N)
050100150200250300350400450500
McIntosh
PinkLady
Fuji
Gala
Scilate
Honeycrisp
F/SCSA
(N/cm
2 )
0
20
40
60
80
100
120
140
Fuji
McIntosh
Gala
PinkLady
Scilate
Honeycrisp
F/GC
SA(N
/cm
2 )
ChipBud
SaddleGra?
Force F/SCSA F/GCSARo
otstock*Gra7
Scion*
Gra7
*
** *
**
* *
**
* *
*
***
** *
**
* * * * *
*
Fig. 2.4. Rootstock*graft type and scion*graft type interactions for break force, force per scion cross-sectional area (F/SCSA), and force per graft cross-sectional area (F/GCSA) for the October 2015 sampling date. An asterisk indicates a significant difference between graft types for the specified rootstock or scion at p < 0.05.
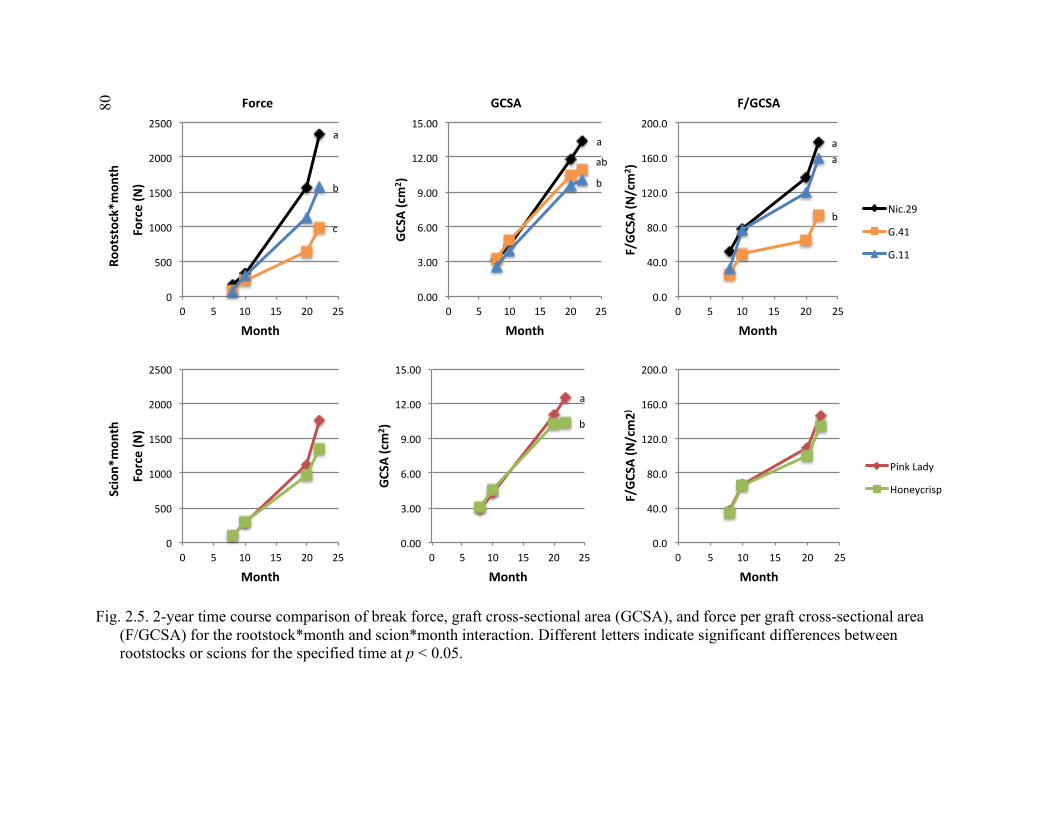
80
a
c
b
0
500
1000
1500
2000
2500
0 5 10 15 20 25
Force(N)
Month
a
ab
b
0.00
3.00
6.00
9.00
12.00
15.00
0 5 10 15 20 25
GCSA
(cm
2 )
Month
a
b
a
0.0
40.0
80.0
120.0
160.0
200.0
0 5 10 15 20 25
F/GC
SA(N
/cm
2 )
Month
Nic.29
G.41
G.11
0
500
1000
1500
2000
2500
0 5 10 15 20 25
Force(N)
Month
a
b
0.00
3.00
6.00
9.00
12.00
15.00
0 5 10 15 20 25
GCSA
(cm
2 )
Month
0.0
40.0
80.0
120.0
160.0
200.0
0 5 10 15 20 25
F/GC
SA(N
/cm2)
Month
PinkLady
Honeycrisp
Force GCSA F/GCSARo
otstock*mon
th
Scion*
mon
th
Fig. 2.5. 2-year time course comparison of break force, graft cross-sectional area (GCSA), and force per graft cross-sectional area (F/GCSA) for the rootstock*month and scion*month interaction. Different letters indicate significant differences between rootstocks or scions for the specified time at p < 0.05.
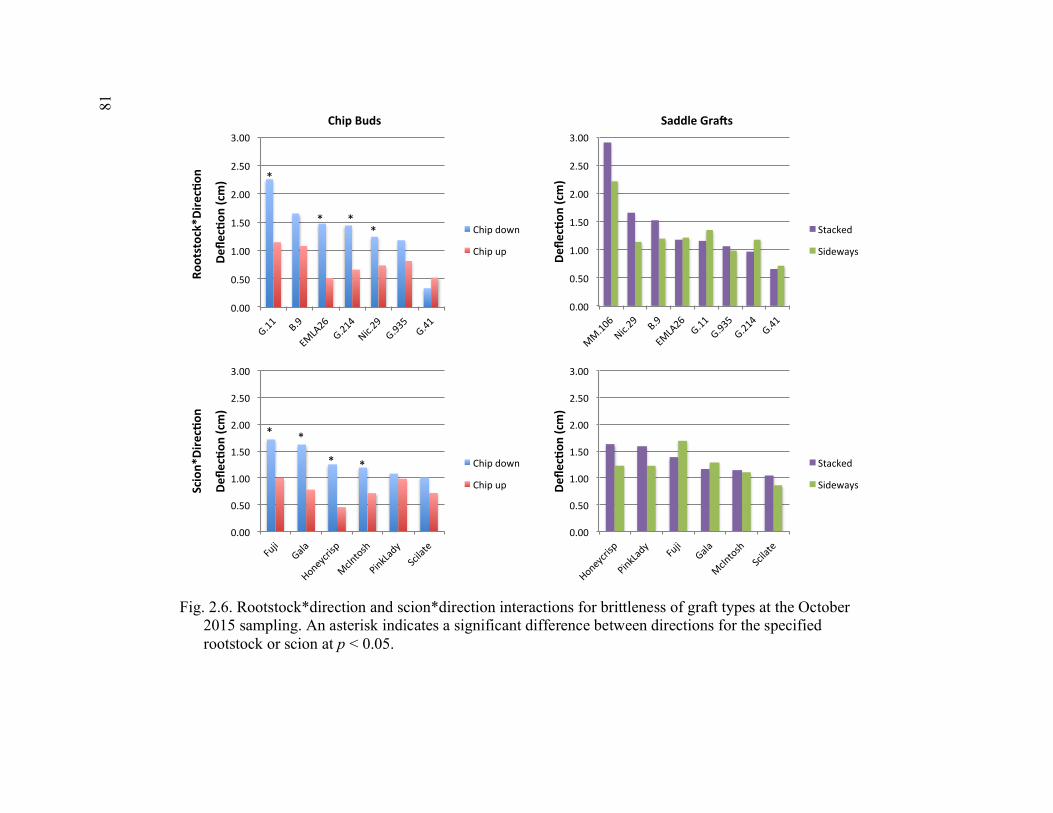
81
0.00
0.50
1.00
1.50
2.00
2.50
3.00
G.11 B.9
EMLA26
G.214
Nic.29
G.935
G.41
Defle
c%on
(cm)
Chipdown
Chipup
0.00
0.50
1.00
1.50
2.00
2.50
3.00
Fuji
Gala
Honeycrisp
McIntosh
PinkLady
Scilate
Defle
c%on
(cm)
Chipdown
Chipup
0.00
0.50
1.00
1.50
2.00
2.50
3.00
MM.106
Nic.29
B.9
EMLA26G.11
G.935
G.214G.41
Defle
c%on
(cm)
Stacked
Sideways
0.00
0.50
1.00
1.50
2.00
2.50
3.00
Honeycrisp
PinkLady
Fuji
Gala
McIntosh
Scilate
Defle
c%on
(cm)
Stacked
Sideways
ChipBuds SaddleGra9s
Rootstock*Direc%on
Scion*
Direc%on
*
** *
* *
* *
Fig. 2.6. Rootstock*direction and scion*direction interactions for brittleness of graft types at the October 2015 sampling. An asterisk indicates a significant difference between directions for the specified rootstock or scion at p < 0.05.
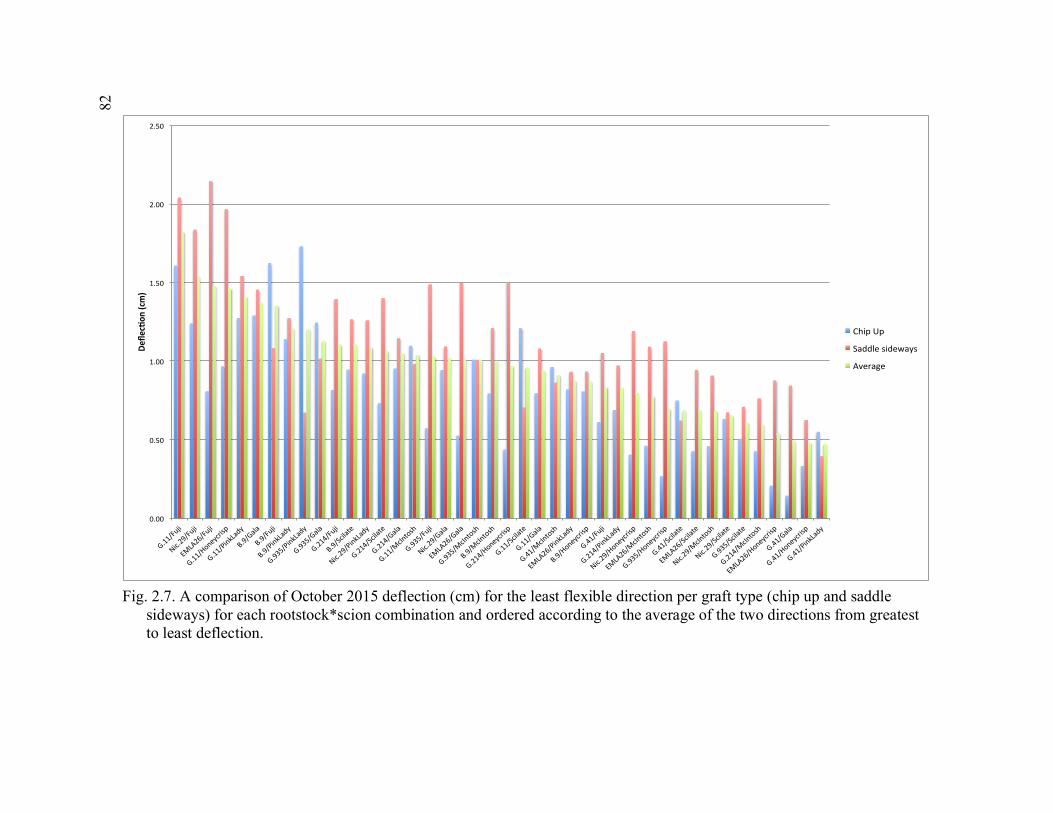
82
0.00
0.50
1.00
1.50
2.00
2.50
G.11/Fuji
Nic.29/Fuji
EMLA26/Fuji
G.11/H
oneycrisp
G.11/P
inkLad
y
B.9/Gala
B.9/Fuji
B.9/PinkLad
y
G.935/PinkLad
y
G.935/Gala
G.214/Fuji
B.9/Scilate
Nic.29/PinkLad
y
G.214/Scilate
G.214/Gala
G.11/M
cIntosh
G.935/Fuji
Nic.29/Gala
EMLA26/Gala
G.935/McIntosh
B.9/McIntosh
G.214/Honeycrisp
G.11/Scilate
G.11/G
ala
G.41/M
cIntosh
EMLA26/PinkLad
y
B.9/Honeycrisp
G.41/Fuji
G.214/PinkLad
y
Nic.29/Honeycrisp
EMLA26/McIntosh
G.935/Honeycrisp
G.41/Scilate
EMLA26/Scilate
Nic.29/McIntosh
Nic.29/Scilate
G.935/Scilate
G.214/McIntosh
EMLA26/Honeycrisp
G.41/G
ala
G.41/H
oneycrisp
G.41/P
inkLad
y
Defle
c%on
(cm)
ChipUp
Saddlesideways
Average
Fig. 2.7. A comparison of October 2015 deflection (cm) for the least flexible direction per graft type (chip up and saddle sideways) for each rootstock*scion combination and ordered according to the average of the two directions from greatest to least deflection.
83 CHAPTER 3
THE EFFECT OF PLANT GROWTH REGULATORS ON APPLE GRAFT UNION
FLEXURAL STRENGTH AND FLEXIBIILITY
Abstract
The apple rootstock ‘Geneva® 41’ (‘G.41’) forms weak graft unions with multiple
scions. Exogenous plant growth regulators (PGR) can influence vascular differentiation
and wood formation, and thus may improve graft union strength. A series of commercial
PGR formulations were applied to trees on ‘G.41’ rootstock, and graft union strength and
flexibility were measured. Abscisic acid (ABA), 1-napthaleneacetic acid (NAA),
prohexadione-calcium (PCa), and benzyl adenine (BA) were applied to commercial
nursery trees as dilute sprays in May and June. BA was also applied in a latex paint
formulation directly to the graft union. BA applied in paint solution to the graft union
significantly increased the flexural strength per scion cross-sectional area and the
flexibility of the union. Applying PGR’s to graft unions may be an option for improving
graft union strength and preventing tree losses in the nursery. However, more efficient
methods of applications are needed for this approach to be commercially viable.
Introduction
The U.S. is second only to China as a producer of apples with an estimated crop
of 248.6 million bushels in 2013 (USApple, 2015). Apple production in the U.S. has
maintained this level due to the utilization of clonal rootstocks. However, many of the
84 common dwarfing rootstocks such as ‘Malling 9’ (‘M.9’) and ‘Malling 26’ (‘M.26’) are
highly susceptible to fire blight, an infection by the bacteria Erwinia amylovora (Norelli
et al., 2003). In an effort to overcome widespread infection and death of dwarfing apple
orchards, Cornell University, in collaboration with the United States Department of
Agriculture Agricultural Research Services (USDA ARS), developed several dwarfing
rootstocks that have shown excellent fire blight resistance. These rootstocks are identified
as Geneva® rootstocks and are given a unique number (e.g. ‘G.11’, ‘G.41’, ‘G.935’, etc.).
Trees grown on Geneva® rootstocks inhibit rootstock infection of fire blight and instead
allow for pruning of infected limbs from the trees (Robinson et al., 2007; Russo et al.,
2007).
In general, Geneva® rootstocks not only have superior resistance to fire blight, but
also resistance to crown and root rots from Phytophthora, induce high yield efficiency,
and good fruit size (Fazio et al., 2013). However, some of the Geneva® rootstocks appear
to have weak or brittle graft unions that are susceptible to breakage in the nursery (R.
Adams, personal communication). This weakness has been observed especially during
strong wind events in the field or during harvest and shipment. Due to the disease
resistance and economic potential of these new Geneva® rootstocks, research to
understand and remedy this problem is of great importance to the apple industry.
Some experiments have sought to use plant growth regulators to improve general
graft success either through improved callusing, vascular differentiation, or wood
formation. However, studies on plant growth regulators and grafting is difficult due to
differences in hormone balance between species and graft partners. Several plant
hormones have been suggested for enhancing graft union development and strength.
85 Auxin. One of the first discovered, and probably most studied classes of plant
hormones is auxin, which has been suggested to increase callus proliferation and vascular
differentiation in graft unions (Moore, 1983a). Auxin flows in a basipetal pattern from
where it is synthesized in the leaves and shoot tips down to the roots. Concentration has
been shown to decrease from the top to the bottom of the plant except at local sites of
obstructions where it induces vessel number increases and vessel diameter decreases
(Aloni, 1987). In a review of the literature citing vegetative and woody plant examples,
Aloni (1995) suggested that auxin controls the rate of differentiation of xylem cells, so a
higher concentration of auxin leads to more cells of smaller size, since cell expansion
stops when the secondary wall is deposited. Low concentrations tend to promote more
phloem differentiation, while high concentrations lead to more xylem differentiation
(Aloni, 1995). In another literature review citing woody plant examples, Savidge (1988)
suggested that auxin allows cambial activity/divisions and xylem development to proceed
in the spring, however this doesn’t occur when applied basally to cuttings. Savidge
(1988) also suggest that auxin plays a role in tension wood formation. From these
articles, it is clear that auxin plays an important role in developing vascular tissue and
may promote stronger wood formation.
Several studies have examined the effects that auxin has on the graft union.
Stoddard and McCully (1980) observed in Coleus that when the leaves nearest the graft
on the scion were removed, the number of graft bridging vessels was decreased, while
leaf presence on the rootstock had no effect, which they concluded indicates basipetal
auxin transport as the cause. In apple bud unions, the xylem cells between the scion and
86 the dwarfing ‘M.9’ rootstock were small and the adjacent cells in the rootstock were
larger, whereas the vigorous ‘MM.106’ rootstock had normal xylem development in
the rootstock (Soumelidou et al., 1994). This supports the theory suggested by Aloni
(1987) that where auxin accumulates, more xylem vessels of smaller diameter are
formed. Soumelidou et al. (1994) suggested that auxin accumulated in the graft union of
the dwarfing rootstock, reducing xylem development in the rootstock. Although both of
these studies suggest a relationship between auxin and xylem differentiation, both studies
are correlative and did not actually measure tissue-specific auxin accumulation.
Additional evidence in favor of auxin is shown through the studies on grafting
cactus, vegetables, and grapes. Shimomura and Fuzihara (1977) found in grafting cactus
that auxin applied as a droplet to the apical end of the scion did not stimulate callus
formation, but did promote differentiation of connecting vascular bundles as well as
increasing bundle diameter. When vascular cambiums were misaligned, auxin
applications increased the graft survival compared to the controls (Shimomura and
Fuzihara, 1977). When 1-napthaleneacetic acid (NAA) in lanolin paste was directly
applied to the cut end of the cactus, it induced cambium to form parallel to the cut surface
(Shimomura and Fuzihara, 1977). To further confirm the role of auxin in forming
vascular connections, they found that triiodobenzoic acid (TIBA), an auxin transport
inhibitor, decreased the number of vascular connections in cactus grafts (Shimomura and
Fuzihara, 1977). Moghadam et al. (2012) also found that auxin applied 1-3 times on
cactus grafts increased the scion diameter, scion height, cambial layer diameter, areole
number, activated areole number, and resulted in 100% graft survival. Parkinson and
Yeoman (1982) found indole-3-acetic acid (IAA) applied apically to vegetable grafts
87 induced vascular connections. As IAA concentrations increased, vascular connections
reached a limit beyond which only callus formation increased (Parkinson and Yeoman,
1982). Studies on grape grafts contradict these findings, where auxin application resulted
in reduced or inhibited callus formation (Kose and Guleryuz, 2006). However, the
concentrations used were 5 to 20 times that used in other studies, which may have been
too high to induce a favorable response. Regardless, exogenous auxin applications may
be a possible avenue for increasing graft success.
Cytokinin. Cytokinins are another class of plant hormones that may function in
graft union formation and strength. In general, cytokinins are predominately synthesized
in the roots and moved acropetally and are involved in cell divisions. In a review, Aloni
(1993; 1995) suggested that cytokinins alone do not cause vascular tissue differentiation
but require the presence of auxin. However, research results on cytokinins are sometimes
conflicting, most likely due to promotion or inhibition of effects due to interactions with
other hormones and the use of different forms of cytokinin (Aloni, 1993). Aside from
these possible sources of variation, it appears that cytokinins increase the sensitivity of
cambial cells to auxin in wounds (Aloni, 1995). In the presence of auxin, cytokinins may
promote early differentiation of vascular tissue when many cell divisions are occurring
(Aloni, 1995). Parkinson and Yeoman (1982) found that cytokinins in the presence of
IAA increased the number of vascular connections in grafted internodes in petri dishes.
Kose and Guleryuz (2006) found that kinetin and benzyl adenine (BA) applied to the
surface of grape grafts promoted initiation and proliferation of callus. Exogenous
cytokinins have also activated thickening growth in stems of cytokinin-deficient
Arabidopsis mutants, including increased vessel number, number of cells in the phloem,
88 and number of xylem cells with some of increased size (Matsumuto-Kitano et al., 2008).
It is evident from these studies that cytokinins promotes cell division in the graft union,
which may be limiting in weak graft combinations.
Gibberellins. Little research has investigated the effects of gibberellins (GA) on
graft formation. Parkinson and Yeoman (1982) found that GA decreased the number of
vascular connections when applied to grafted internodes in a petri dish. This negative
effect suggests that GA inhibitors could be beneficial to improving graft success.
Prohexadione-calcium (PCa) is a common GA inhibitor widely used for apple trees. PCa
has been shown to greatly reduce the vegetative growth of shoots by inhibiting the
conversion of GA20 (a precursor) to the active GA1 (Evans et al., 1999). Foliar
applications of PCa result in reduced internode length and vegetative growth in apples
and has been seen to increase the diameter of the basal end of walnut shoots (Evans et al.,
1997; Solar et al., 2008). In apples, foliar PCa was found to increase cortical parenchyma
cell wall thickness of youngest leaves and shoots when viewed under a scanning electron
micrograph (SUNDIN, 2014). This cell wall thickening may be a possible strategy for
increasing the mechanical strength of the wood at the graft union and should be
considered for study. PCa has been shown to move acropetally, resulting in greater
effects in the upper canopy, and it does not persist in the trees to the following season
(Evans et al., 1999; Miller, 2002). Although no studies have tested the effect of PCa on
the graft union, applying it early and at higher rates may provide some strengthening to
the union while temporarily reducing shoot growth.
Ethylene. Ethylene is a wound response hormone that is also involved in ripening
and senescence in fruits, but may have beneficial responses in promoting wood growth.
89 Savidge (1988) cited research by Yamamoto and Koslowski (1987), which showed
increased cortical growth and xylem fiber number when ethephon (an ethylene releasing
compound) was applied to stems. Ethephon was also shown to cause an increase in the
stem diameter at the site of application as a result of the phloem being two times thicker
and the xylem five times thicker (Junghans et al., 2004). Junghans et al. (2004) also
reported increased fiber and vessel cell wall thickness, but decreased vessel lumen and
length, and decreased fiber length. It is suggested by Junghans et al. (2004) that ethylene
may cause local concentrations of auxin, which induces these changes. However,
Bjorklund (2007) found that 1-aminocyclopropane 1-carboxylic acid (ACC), a natural
precursor to ethylene, may reduce the relative lignin content in cell walls. Lignin is
abundant in woody plants and primarily contributes strength to the cell wall; so decreased
lignin would be antagonistic to a strong graft union.
Abscisic Acid. Abscisic acid (ABA) is another wound response or stress hormone.
Little research has been done to see its effects on the graft union. However, some studies
have found that ABA has an effect on increasing wood formation and strength. Parker et
al. (2012) treated drought stressed peach trees with a soil drench of ABA and found that
future drought tolerance was increased along with a greater trunk diameter, fresh weight,
dry weight, and root growth. Arend and Fromm (2013) found that exogenous ABA
increased the levels of ABA in the cambial region of stem and resulted in increased radial
number of undifferentiated cambial cells. They also reported that ABA increased the
formation of longer fiber cells and less, but larger, vessel cells (Arend and Fromm, 2013).
ABA has also been shown to be synergistic with IAA and BA in promoting callus
formation at the abscission zone of leaf petioles on citrus bud explants (Altman and
90 Goren, 1971). These studies suggest that ABA may have an effect on increasing the trunk
size of the tree and possibly callus formation, which may increase the strength of the graft
union.
The objective of this study was to determine if exogenous plant growth regulator
applications would have a positive effect on the growth characteristics and break strength
of apple graft unions. More specifically, comparisons were made among growth
regulators, and application methods, and results were compared based on both scion size
(cross sectional area) and graft strength and flexibility.
Materials and Methods
2014 Study Experiment Design. Rootstock liners of ‘G.41’ chip budded with ‘Scilate’ and
‘Gala’ in August of 2013 were selected in a commercial apple nursery (Willow Drive
Nursery, Ephrata, Washington) in Spring 2014. Within each rootstock*scion
combination, 22 blocks of 10 trees were Marked off to receive one of 22 plant growth
regulators (PGR) treatments or controls. PGR and control treatments were not
randomized within each row.
Plant Growth Regulator Application. The 22 PGR’s and controls used in this
preliminary experiment are described in Table 3.1. A single application of each PGR was
applied in mid-June, and a second application was applied in mid-July. Foliar
applications were in dilute sprays until leaf drip, using a 4-liter hand sprayer. For the
latex paint application, one-milliliter disposable pipettes were used to apply the paint
91 solution so that every tree received about two milliliters. Paint mixtures were made such
that half of the volume was paint.
Growth Measurements. Prior to PGR application, numbered tags were placed onto
each tree and three growth measurements were taken: rootstock shank diameter (5 cm
below the graft union), two perpendicular graft union diameter measurements at the
widest part of the graft union, and height from the graft union. Following harvest, growth
measurements were retaken with the addition of a scion diameter (5 cm above the graft
union).
Sample Preparation. In November, trees were harvested mechanically using
standard commercial practices and kept in cold storage for later graft strength analysis.
When ready for analysis, trees were topped to an overall length of about 70 centimeters
and the roots, leaves and stems were removed. Trees were then bundled according to tree
number and packed in ice and transported to a laboratory at Utah State University in
Logan, Utah.
Break Strength Testing. At USU, each specimen was loaded to failure using a 3-
point bend apparatus with a 16 cm separation (Figure 3.1). The apparatus was used in
conjunction with a Bench Testing Machine (Tinius Olsen H50KS, Horsham, PA)
operating in compression mode. The tests were performed with a fixed strain rate (25
cm/min) as per the ASTM Standard D790 and D7264, which are commonly used for
testing of flexural strength of polymer composites and concrete (ASTM, 2010; ASTM,
2015). A pre-load condition of 10 N was used to bring the crosshead into contact with the
specimen at a constant rate of 50 cm/min. Force measurements were acquired through the
equipment software (Tinius Olsen Test Navigator) at 1-second intervals throughout the
92 measurement, until a failure condition was achieved. Upon achieving the failure
condition, the fracture strength was obtained from the data based on the geometry of the
3-point bend apparatus and the specimen. For each treatment, five replicate samples were
broken with the chip bud proximal to the displacement force (bud up), and five replicate
samples were broken with the chip bud distal to the displacement force (bud down). The
location and manner of the break was categorized as shown in table 3.2.
Data Analysis. Growth and break strength data were analyzed in SAS using the
means procedure for a numerical comparison of the response variables. The following
variables were used in the analysis: force (F), graft cross-sectional area (GCSA), scion
cross-sectional area (SCSA), F/GCSA, and F/SCSA and height. Some of the trees had the
top few centimeters broken during harvest, so height measurements in 2014 may not be
accurate.
2015 Study
Experiment Design. Rootstock liners of ‘G.41’ chip budded with ‘Scilate’ and
‘Gala’ in August of 2014 were selected in a commercial apple nursery (Willow Drive
Nursery, Ephrata, Washington) in Spring 2015. Four adjacent rows were selected for
each rootstock*scion combination. Within each row, 96 trees were selected for
uniformity and divided into 8 groups of 12 consecutive trees. The eight blocks in each
row were then randomly assigned one of the eight treatments such that each
cultivar/rootstock combination received all eight treatments with four replications,
making a split plot design where the main plot treatments are scion and rootstock and the
sub-plot treatments were PGRs.
93 Plant Growth Regulator Application. The PGR and control treatments are
summarized in Table 3.3. For abscisic acid (ProTone® SG, Valent USA, Walnut Creek,
CA), NAA (Fruitone® N, AMVAC Chemical, Newport Beach, CA), and the controls, the
commercial surfactant Regulaid® (Kalo, Inc. Overland Park, KS) was included at a
concentration of 0.1% (v/v). A single application of plant growth regulator was applied
on May 14. A second application was applied on June 4th for all applications except PCa
because a second application of PCa may have resulted in unacceptable reductions in tree
height. Foliar applications were made in the same manner as 2014. Trunk spray was
applied in a similar manner to foliar application except the spray was directed at the
trunk, graft union, and about eight centimeters of scion stem until thoroughly coated and
allowed to drip. For the first latex paint application, one-milliliter disposable pipettes
were used to apply paint so that every tree received about two milliliters. Paint treatments
were mixed such that half of the solution volume was latex paint. However, when BA
(MaxCel®, Valent USA, Walnut Creek, CA) was mixed with the paint, the mixture was
too thick to be applied with the pipettes, so the paint was applied using a paintbrush such
that 5 cm of the rootstock, the graft union, and 1-2 cm of the scion stem were evenly
coated. The second application of each paint treatment was then applied using just the
paintbrushes to apply an even coat over the previous treatment area.
Growth Measurements. Rootstock, graft and scion caliper and height were
measured 8 May (pre-treatment), 13 July (mid-season), and 12 October (end of season).
Five size measurements were recorded: rootstock shank diameter (5 cm below graft
union), two perpendicular measurements of graft union diameter at the widest part of the
graft union, scion diameter (5 cm above the graft union), and scion height above the graft
94 union. At each measurement time, trees with failed graft unions or that broke during the
season were also noted. Following final measurements, all trees from each treatment
group within each row were labeled in preparation for digging.
Sample Preparation. In November, trees were dug mechanically and kept in cold
storage. When ready for transportation, six trees from each treatment group within each
row were selected and topped to an overall length of 70 cm and the roots, leaves and
stems removed. Diameter measurements were re-taken to account for any changes during
storage. Trees were then bundled according to replication number, packed in ice and
transported to Utah State University in Logan, Utah.
Break Strength Testing. Break strength testing was carried out in the same manner
as described for 2014. However, for 2015 only six samples were used per treatment
group, so three replicates were broken with the chip bud proximal to the displacement
force and three were broken with the chip bud distal to the displacement force.
Deflection, or the maximum displacement of the testing machine between contact with
sample and graft failure, was acquired in addition to the fracture strength described
above. This measure was included to determine if any PGR treatments affected the
flexibility of the graft union.
Data Analysis. Ending CSA and break strength data were analyzed in SAS using
the GLIMMIX procedure and the Tukey-Kramer adjustment for multiple comparisons
with nesting for each treatment per row. Height data that were collected over three
measurement dates were analyzed by month using the GLM procedure. For break type,
the GLIMMIX procedure was used for a multinomial analysis to determine the
probability of lower order break types to occur based on the numeric order in table 3.2.
95 The following variables were used in the analysis: force (F), graft cross-sectional area
(GCSA), scion cross-sectional area (SCSA), height, F/GCSA, F/SCSA, deflection, and
break type.
Results and Discussion
2014 Study
Due to the lack of randomization or true replication, results from 2014 should be
considered preliminary, but were used to identify PGR treatments that warranted further
investigation in the subsequent study in 2015. Generally, few large numerical differences
were measured for force, GCSA, SCSA, F/GCSA, or F/SCSA as seen in Table 3.4.
However, there were some interesting numerical trends. NAA foliar2, ABA foliar1, and
BA latex2 tended to require greater force than the respective controls, regardless of scion
or break direction. ACC foliar1 was the weakest treatment and lower than the untreated
control.
NAA foliar2 tended to have a larger GCSA, while ABA foliar1 was only slightly
larger than the control. Since ABA foliar1 did not increase the GCSA, there may be a
stronger connection in the graft union relative to the graft union area. This is confirmed
with F/GCSA, which shows that ABA foliar1 had break strength 24% higher than the
untreated control, when corrected for GCSA. NAA foliar2 had essentially the same
F/GCSA as the untreated control, which suggests that the greater strength could simply
be due to tissue proliferation at the graft union, as indicated by increased GCSA.
There are no published reports on how ABA, a stress hormone, might affect graft
union formation. However, some studies have shown that ABA has a positive effect on
96 increasing wood formation and strength (Arend and Fromm, 2013; PARKER et al., 2012).
Based on our results, ABA may have actually increased the strength of the wood since it
did not increase the tree size, and both foliar ABA treatments had among the highest
break strengths per unit GCSA.
BA latex2 on the other hand appeared to more directly affect the cross-sectional
areas at the graft and the scion. As seen in Table 3.4, both BA treatments were among the
largest for SCSA, with repeat applications resulting in the highest per-tree break strength.
This suggests that the increase in strength of these trees is due to an increase in size or an
expansion of the union rather than a strengthening of the tissue. This is confirmed in both
the F/GCSA and F/SCSA being at an intermediate level.
Trends in this preliminary data suggested that an ABA foliar spray may actually
increase the strength of the wood tissues in or around the graft union. On the other hand,
NAA applied as a foliar spray, or BA applied in latex may increase the graft size, which
leads to an increase in force required to break the tree.
2015 Study
Based on preliminary results in 2014, the 2015 treatments focused on ABA,
NAA, and BA, with the addition of PCa. In 2015, there were no significant main effects
on break force (Table 3.5), and only the scion cultivar had an effect on the GCSA. Also,
analysis of break type yielded no significant differences among PGR treatments. Only the
scion and scion*direction effects were significant (Appendix 3.1A). However, for SCSA,
F/SCSA, and deflection there were significant PGR main effects, with SCSA showing a
significant scion*PGR interaction. The PGR treatments that were among the highest in
97 flexural strength corrected for SCSA were BA applied as graft paint, BA as a trunk spray,
and the high rate of PCa. The other PGR treatments, ABA, NAA and the low rate of PCa,
showed little difference in F/SCSA compared to the controls (Table 3.5).
BA applied as a latex paint resulted in a significant increase in F/SCSA compared
to both controls. However, break force was the same as the painted control, indicating
that the difference was due to a reduction in SCSA. Although the SCSA showed a
significant scion*PGR interaction (Table 3.6), the BA paint treatment was smaller than
the paint control for both scions. Kose and Guleryuz (Kose and Guleryuz, 2006) reported
that cytokinin increases callus proliferation at the graft union. Although the paint
applications of BA resulted in the largest measured GCSA in both years, these
differences were not statistically significant.
In addition to increased F/SCSA, BA paint also had a significantly higher
deflection, or maximum lateral displacement before fracturing, than both controls. This
indicates greater flexibility, which would contribute to reduced risk of breaking in the
field. Part of this could be due to the reduced SCSA, however, the high rate of PCa had a
similar reduction in SCSA without any increase in flexibility.
The high rate of PCa showed a F/SCSA that was numerically higher than the
control, but this difference was not significant (table 3.5). Further, PCa temporarily
reduced shoot growth by shortening internodes (Figure 3.2). This growth response is not
surprising since PCa is a GA inhibitor used commercially to reduce vegetative growth in
apple (Evans et al., 1997). How this reduced stem elongation would affect nursery tree
value is not known. It is not clear whether or not PCa had any strengthening effect on the
graft union, but it did reduce the growth of the tree. The trees treated with PCa had an
98 initial reduction in height, which difference diminished as the season progressed to where
height differences at the end of the season were not statistically significant (Table 3.7).
However, PCa treated trees continued to have a smaller SCSA and a section of shortened
internodes that may be undesirable to growers. PCa also had a 23% increase in deflection
compared to the control, which may help reduce damage in windy conditions.
Although F/SCSA for BA in a dilute trunk spray did not differ significantly from
the water control, this treatment may merit further investigation. Compared to BA paint,
BA in a dilute spray could be more easily adopted by growers due to ease of application.
The main challenge of any PGR use is efficient delivery of active ingredient to the
appropriate plant tissue. Over both seasons, BA applied to the graft union appeared to be
the most effective for increasing break strength. Additional work to improve delivery
may make this approach the most commercially viable method of increasing graft union
strength and flexibility.
Conclusion
These results indicate a possible strengthening to the graft union through the use
of plant growth regulators. In particular, results from both 2014 and 2015 showed BA
applied in a latex paint increased GCSA leading to an increased break force requirement.
Increased flexibility of the graft would also allow more movement in the wind. However,
BA paint did have reduced SCSA, which may be undesirable to the nursery. Applications
in latex paint were more effective than aqueous trunk paint, indicating that better methods
for delivery are needed. PCa at higher rates may be another good option to decrease the
SCSA, while maintaining a relatively strong union. However, reduced scion growth could
99 reduce the value of the nursery tree. Lastly, while ABA and NAA treatments were among
the strongest in 2014, these results did not occur in 2015. Results in previously published
studies suggest that NAA has greater effect on graft strength. Our results may again
highlight the difficulty of PGR delivery in a field application setting. However, our
results from 2015 follow more of the results of Kose and Guleryuz (2006) who found
cytokinin had more of a positive effect on the grape graft union than auxin. Additional
research on PGR delivery is needed before this approach can be recommended for
nurseries to increase graft union strength.
Literature Cited
Aloni, R. 1987. Differentiation of vascular tissues. Annu. Rev. Plant Physiol. 38:179-204. Aloni, R. 1993. The role of cytokinin in organised differentiation of vascular tissues.
Austral. J. Plant Physiol. 20:601-608. Aloni, R. 1995. The induction of vascular tissue by auxin and cytokinin., p. 531-546. In:
P.J. Davies (ed.), Plant Hormones. Kluwer Academic Publishers, Netherlands. Arend, M. and J. Fromm. 2013. Concomitant analysis of cambial abscisic acid and
cambial growth activity in poplar. Trees 27:1271-1276. ASTM. 2010. D790-10 Standard Test Methods for Flexural Properties of Unreinforced
and Reinforced Plastics and Electrical Insulating Materials. ASTM International, West Conshohocken, PA.
ASTM. 2015. D7264/D7264-15 Standard Test Methods for Flexural Properties of Polymer Matrix Composite Materials. ASTM International, West Conshohocken, PA.
Bjorklund, S. 2007. Plant hormones in wood formation. Swedish University of Agricultural Science, Umea, Doctoral. Abstr. 81.
Evans, J.R., R.R. Evans, C.L. Regusci, and W. Rademacher. 1999. Mode of action, metabolism, and uptake of BAS 125W, prohexadione-calcium. HortScience 34:1200-1201.
Evans, R.R., J.R. Evans, and W. Rademacher. 1997. Prohexadione calcium for suppression of vegetative growth in Eastern apples. Acta Hort. 451:663-666.
Fazio, G., H. Aldwinckle, and T. Robinson. 2013. Unique characteristics of Geneva® apple rootstocks. New York Fruit Qrtly. 21:25-28
Junghans, U., R. Langenfeld-Heyser, A. Polle, and T. Teichmann. 2004. Effect of auxin transport inhibitors and ethylene on wood anatomy of poplar. Plant Bio. 6:22-29.
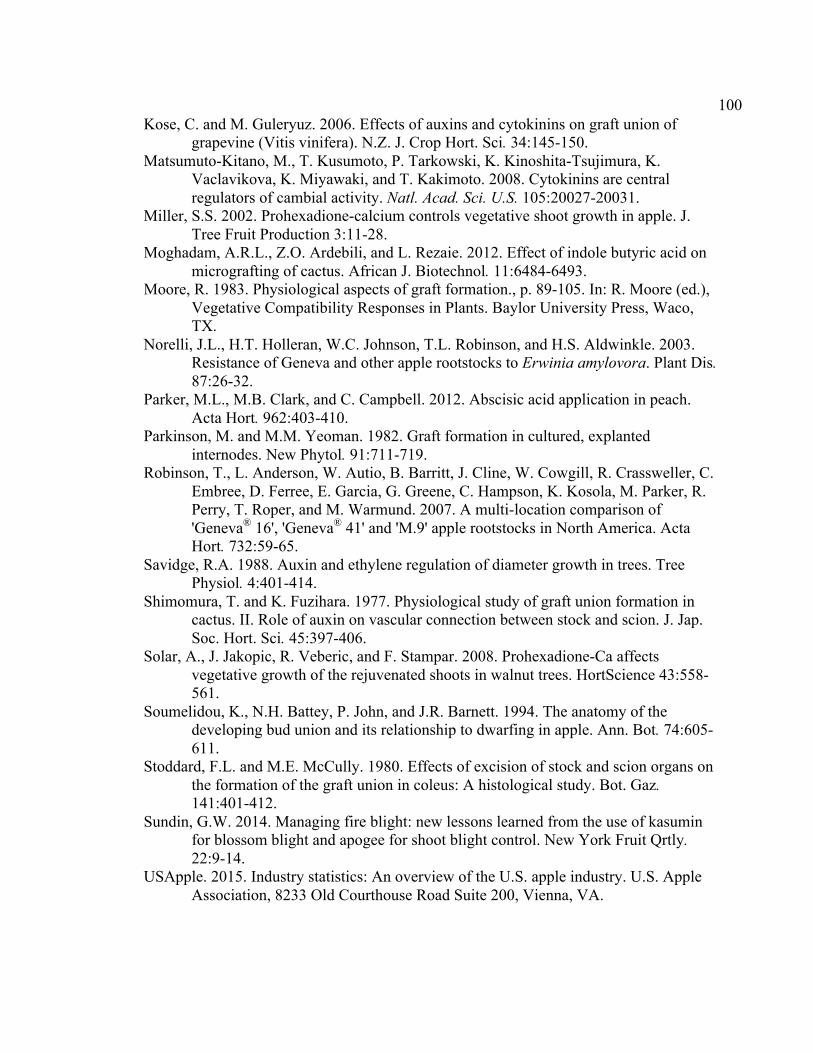
100 Kose, C. and M. Guleryuz. 2006. Effects of auxins and cytokinins on graft union of
grapevine (Vitis vinifera). N.Z. J. Crop Hort. Sci. 34:145-150. Matsumuto-Kitano, M., T. Kusumoto, P. Tarkowski, K. Kinoshita-Tsujimura, K.
Vaclavikova, K. Miyawaki, and T. Kakimoto. 2008. Cytokinins are central regulators of cambial activity. Natl. Acad. Sci. U.S. 105:20027-20031.
Miller, S.S. 2002. Prohexadione-calcium controls vegetative shoot growth in apple. J. Tree Fruit Production 3:11-28.
Moghadam, A.R.L., Z.O. Ardebili, and L. Rezaie. 2012. Effect of indole butyric acid on micrografting of cactus. African J. Biotechnol. 11:6484-6493.
Moore, R. 1983. Physiological aspects of graft formation., p. 89-105. In: R. Moore (ed.), Vegetative Compatibility Responses in Plants. Baylor University Press, Waco, TX.
Norelli, J.L., H.T. Holleran, W.C. Johnson, T.L. Robinson, and H.S. Aldwinkle. 2003. Resistance of Geneva and other apple rootstocks to Erwinia amylovora. Plant Dis. 87:26-32.
Parker, M.L., M.B. Clark, and C. Campbell. 2012. Abscisic acid application in peach. Acta Hort. 962:403-410.
Parkinson, M. and M.M. Yeoman. 1982. Graft formation in cultured, explanted internodes. New Phytol. 91:711-719.
Robinson, T., L. Anderson, W. Autio, B. Barritt, J. Cline, W. Cowgill, R. Crassweller, C. Embree, D. Ferree, E. Garcia, G. Greene, C. Hampson, K. Kosola, M. Parker, R. Perry, T. Roper, and M. Warmund. 2007. A multi-location comparison of 'Geneva® 16', 'Geneva® 41' and 'M.9' apple rootstocks in North America. Acta Hort. 732:59-65.
Savidge, R.A. 1988. Auxin and ethylene regulation of diameter growth in trees. Tree Physiol. 4:401-414.
Shimomura, T. and K. Fuzihara. 1977. Physiological study of graft union formation in cactus. II. Role of auxin on vascular connection between stock and scion. J. Jap. Soc. Hort. Sci. 45:397-406.
Solar, A., J. Jakopic, R. Veberic, and F. Stampar. 2008. Prohexadione-Ca affects vegetative growth of the rejuvenated shoots in walnut trees. HortScience 43:558-561.
Soumelidou, K., N.H. Battey, P. John, and J.R. Barnett. 1994. The anatomy of the developing bud union and its relationship to dwarfing in apple. Ann. Bot. 74:605-611.
Stoddard, F.L. and M.E. McCully. 1980. Effects of excision of stock and scion organs on the formation of the graft union in coleus: A histological study. Bot. Gaz. 141:401-412.
Sundin, G.W. 2014. Managing fire blight: new lessons learned from the use of kasumin for blossom blight and apogee for shoot blight control. New York Fruit Qrtly. 22:9-14.
USApple. 2015. Industry statistics: An overview of the U.S. apple industry. U.S. Apple Association, 8233 Old Courthouse Road Suite 200, Vienna, VA.

101 Yamamoto, F. and T.T. Kozlowski. 1987. Effect of flooding, tilting of stems, and ethrel
application on growth, stem anatomy and ethylene production of Acer platanoides seedlings. Scandan. J. For. Res. 2:141-156.
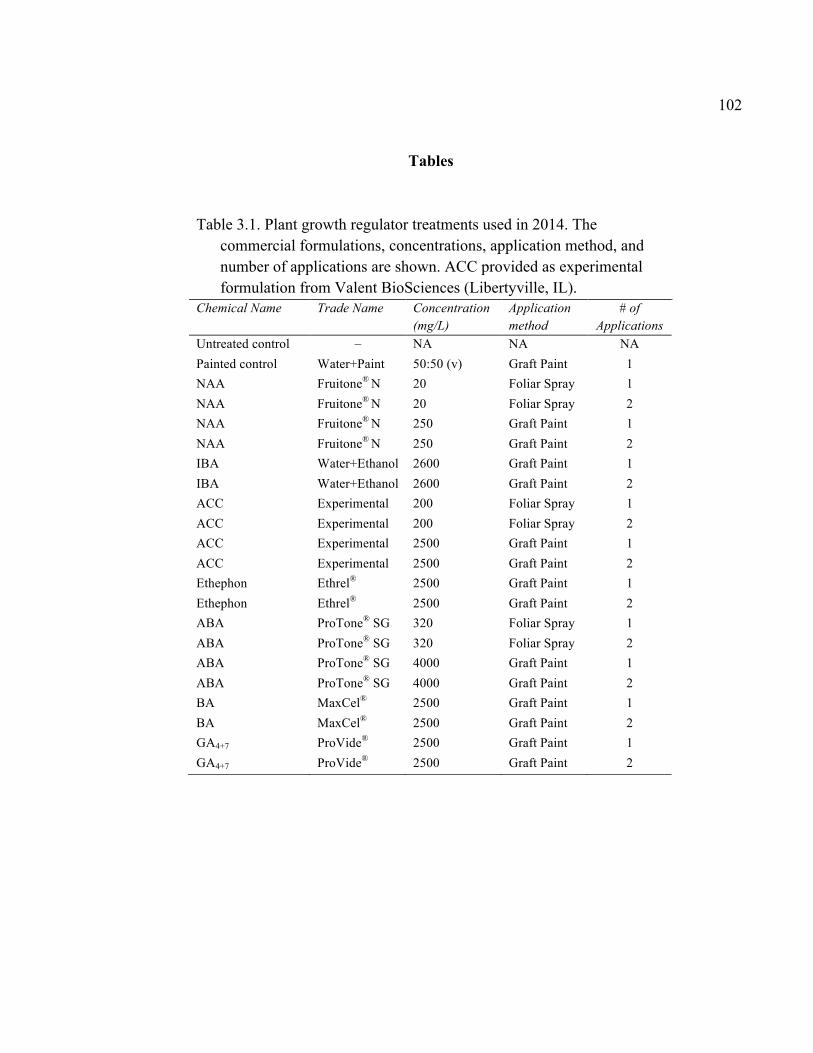
102
Tables
Table 3.1. Plant growth regulator treatments used in 2014. The commercial formulations, concentrations, application method, and number of applications are shown. ACC provided as experimental formulation from Valent BioSciences (Libertyville, IL). Chemical Name Trade Name Concentration
(mg/L) Application method
# of Applications
Untreated control – NA NA NA Painted control Water+Paint 50:50 (v) Graft Paint 1 NAA Fruitone® N 20 Foliar Spray 1 NAA Fruitone® N 20 Foliar Spray 2 NAA Fruitone® N 250 Graft Paint 1 NAA Fruitone® N 250 Graft Paint 2 IBA Water+Ethanol 2600 Graft Paint 1 IBA Water+Ethanol 2600 Graft Paint 2 ACC Experimental 200 Foliar Spray 1 ACC Experimental 200 Foliar Spray 2 ACC Experimental 2500 Graft Paint 1 ACC Experimental 2500 Graft Paint 2 Ethephon Ethrel® 2500 Graft Paint 1 Ethephon Ethrel® 2500 Graft Paint 2 ABA ProTone® SG 320 Foliar Spray 1 ABA ProTone® SG 320 Foliar Spray 2 ABA ProTone® SG 4000 Graft Paint 1 ABA ProTone® SG 4000 Graft Paint 2 BA MaxCel® 2500 Graft Paint 1 BA MaxCel® 2500 Graft Paint 2 GA4+7 ProVide® 2500 Graft Paint 1 GA4+7 ProVide® 2500 Graft Paint 2
103
Table 3.2. Break categorization, category number for analysis, and description of break categories for plant growth regulator study. Notation Numeric
Order Description
C 1 Broke clean at the graft GR 2 Broke just below the graft with low/no tissue attached GS 2 Broke just above the graft with low/no tissue attached GRNC 2 Broke just below the graft but with significant tissue attached GSNC 2 Broke just above the graft but with significant tissue attached NC 3 Broke at the graft but with significant tissue attached R 4 Broke below the graft on the rootstock S 4 Broke above the graft on the scion shoot NA 4 Did not break under the maximum testing displacement
Table 3.3. The plant growth regulators treatments used in 2015, their concentration, application method, and number of applications. Chemical Name Trade Name Concentration
a.i. (mg/L) Application
method Application
# Control Latex Water+paint 50:50 (v) Graft paint 2 BA MaxCel® 5000 Graft Paint 2 Control spray Water+surfactant NA Foliar spray 2 Prohexadione-Ca Apogee® 500 Foliar spray 1 Prohexadione-Ca Apogee® 250 Foliar spray 1 NAA Fruitone® N 20 Foliar spray 2 ABA Protone® SG 400 Foliar spray 2 BA MaxCel® 500 Trunk spray 2
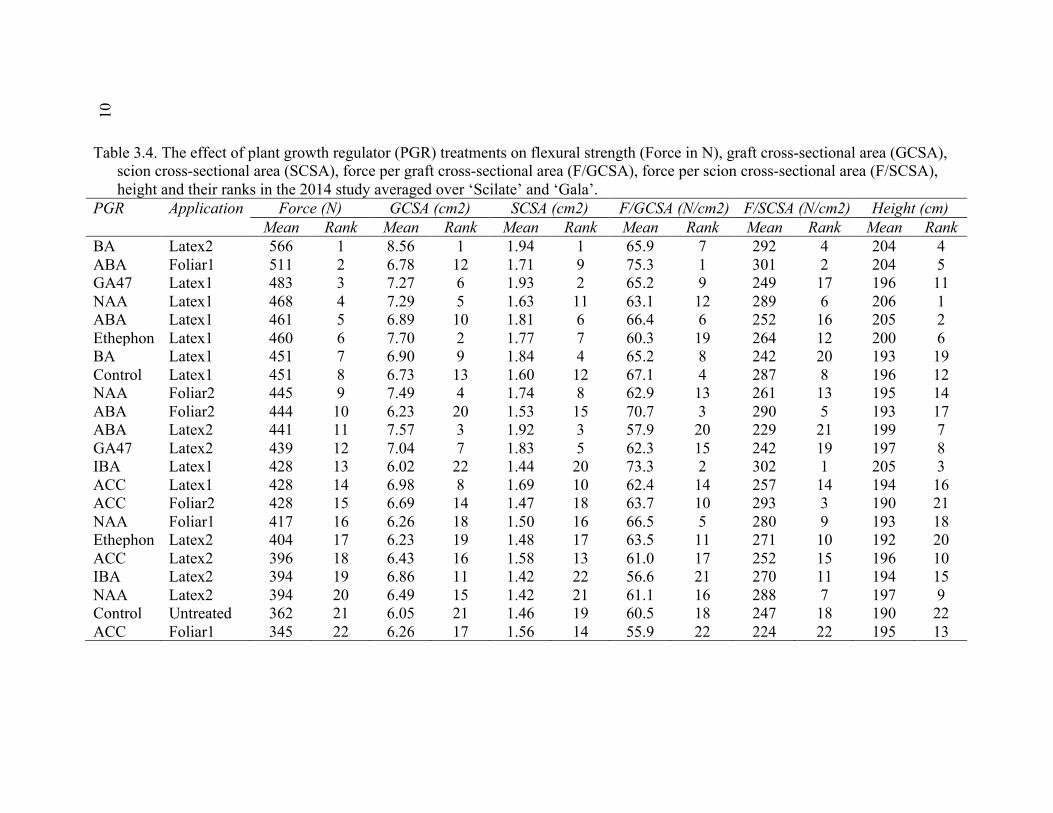
10 4
Table 3.4. The effect of plant growth regulator (PGR) treatments on flexural strength (Force in N), graft cross-sectional area (GCSA), scion cross-sectional area (SCSA), force per graft cross-sectional area (F/GCSA), force per scion cross-sectional area (F/SCSA), height and their ranks in the 2014 study averaged over ‘Scilate’ and ‘Gala’. PGR Application Force (N) GCSA (cm2) SCSA (cm2) F/GCSA (N/cm2) F/SCSA (N/cm2) Height (cm) Mean Rank Mean Rank Mean Rank Mean Rank Mean Rank Mean Rank BA Latex2 566 1 8.56 1 1.94 1 65.9 7 292 4 204 4 ABA Foliar1 511 2 6.78 12 1.71 9 75.3 1 301 2 204 5 GA47 Latex1 483 3 7.27 6 1.93 2 65.2 9 249 17 196 11 NAA Latex1 468 4 7.29 5 1.63 11 63.1 12 289 6 206 1 ABA Latex1 461 5 6.89 10 1.81 6 66.4 6 252 16 205 2 Ethephon Latex1 460 6 7.70 2 1.77 7 60.3 19 264 12 200 6 BA Latex1 451 7 6.90 9 1.84 4 65.2 8 242 20 193 19 Control Latex1 451 8 6.73 13 1.60 12 67.1 4 287 8 196 12 NAA Foliar2 445 9 7.49 4 1.74 8 62.9 13 261 13 195 14 ABA Foliar2 444 10 6.23 20 1.53 15 70.7 3 290 5 193 17 ABA Latex2 441 11 7.57 3 1.92 3 57.9 20 229 21 199 7 GA47 Latex2 439 12 7.04 7 1.83 5 62.3 15 242 19 197 8 IBA Latex1 428 13 6.02 22 1.44 20 73.3 2 302 1 205 3 ACC Latex1 428 14 6.98 8 1.69 10 62.4 14 257 14 194 16 ACC Foliar2 428 15 6.69 14 1.47 18 63.7 10 293 3 190 21 NAA Foliar1 417 16 6.26 18 1.50 16 66.5 5 280 9 193 18 Ethephon Latex2 404 17 6.23 19 1.48 17 63.5 11 271 10 192 20 ACC Latex2 396 18 6.43 16 1.58 13 61.0 17 252 15 196 10 IBA Latex2 394 19 6.86 11 1.42 22 56.6 21 270 11 194 15 NAA Latex2 394 20 6.49 15 1.42 21 61.1 16 288 7 197 9 Control Untreated 362 21 6.05 21 1.46 19 60.5 18 247 18 190 22 ACC Foliar1 345 22 6.26 17 1.56 14 55.9 22 224 22 195 13
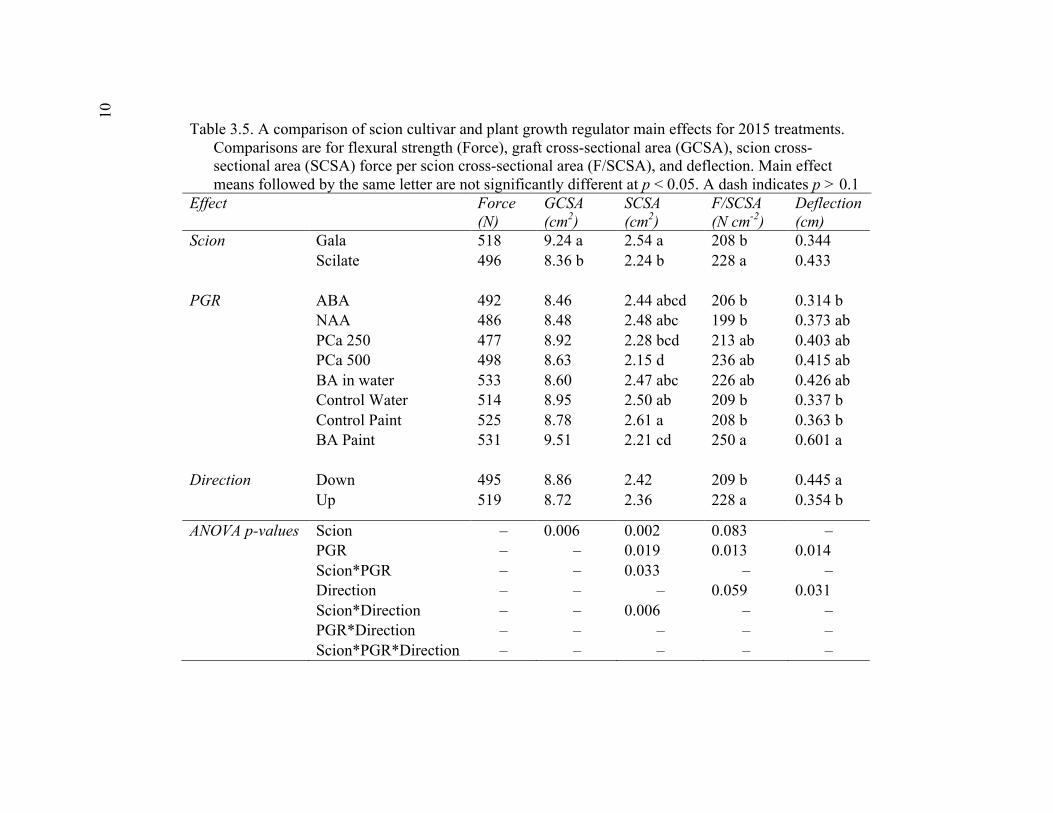
10 5 Table 3.5. A comparison of scion cultivar and plant growth regulator main effects for 2015 treatments. Comparisons are for flexural strength (Force), graft cross-sectional area (GCSA), scion cross- sectional area (SCSA) force per scion cross-sectional area (F/SCSA), and deflection. Main effect means followed by the same letter are not significantly different at p < 0.05. A dash indicates p > 0.1 Effect
Force (N)
GCSA (cm2)
SCSA (cm2)
F/SCSA (N cm-2)
Deflection (cm)
Scion Gala 518 9.24 a 2.54 a 208 b 0.344 Scilate 496 8.36 b 2.24 b 228 a 0.433 PGR ABA 492 8.46 2.44 abcd 206 b 0.314 b NAA 486 8.48 2.48 abc 199 b 0.373 ab PCa 250 477 8.92 2.28 bcd 213 ab 0.403 ab PCa 500 498 8.63 2.15 d 236 ab 0.415 ab BA in water 533 8.60 2.47 abc 226 ab 0.426 ab Control Water 514 8.95 2.50 ab 209 b 0.337 b Control Paint 525 8.78 2.61 a 208 b 0.363 b BA Paint 531 9.51 2.21 cd 250 a 0.601 a Direction Down 495 8.86 2.42 209 b 0.445 a Up 519 8.72 2.36 228 a 0.354 b
ANOVA p-values Scion – 0.006 0.002 0.083 – PGR – – 0.019 0.013 0.014 Scion*PGR – – 0.033 – – Direction – – – 0.059 0.031 Scion*Direction – – 0.006 – – PGR*Direction – – – – – Scion*PGR*Direction – – – – –
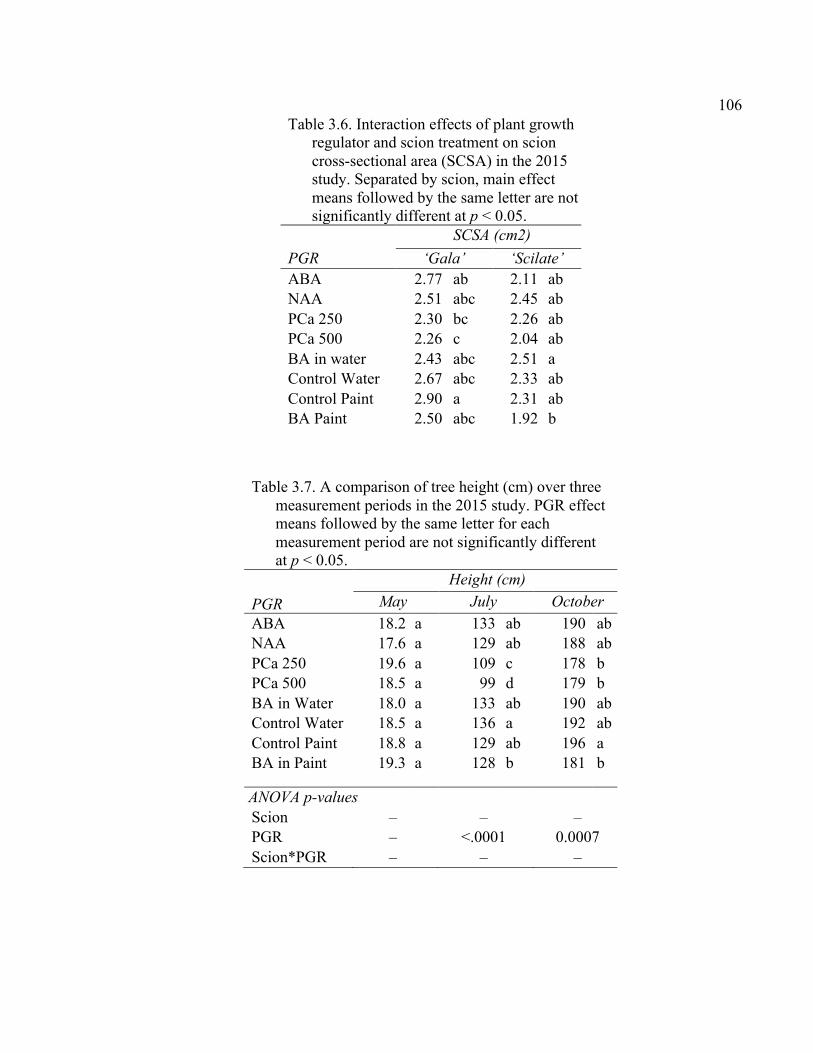
106
Table 3.6. Interaction effects of plant growth regulator and scion treatment on scion cross-sectional area (SCSA) in the 2015 study. Separated by scion, main effect means followed by the same letter are not significantly different at p < 0.05. SCSA (cm2) PGR ‘Gala’ ‘Scilate’ ABA 2.77 ab 2.11 ab NAA 2.51 abc 2.45 ab PCa 250 2.30 bc 2.26 ab PCa 500 2.26 c 2.04 ab BA in water 2.43 abc 2.51 a Control Water 2.67 abc 2.33 ab Control Paint 2.90 a 2.31 ab BA Paint 2.50 abc 1.92 b
Table 3.7. A comparison of tree height (cm) over three measurement periods in the 2015 study. PGR effect means followed by the same letter for each measurement period are not significantly different at p < 0.05.
PGR Height (cm)
May July October ABA 18.2 a 133 ab 190 ab NAA 17.6 a 129 ab 188 ab PCa 250 19.6 a 109 c 178 b PCa 500 18.5 a 99 d 179 b BA in Water 18.0 a 133 ab 190 ab Control Water 18.5 a 136 a 192 ab Control Paint 18.8 a 129 ab 196 a BA in Paint 19.3 a 128 b 181 b
ANOVA p-values Scion – – – PGR – <.0001 0.0007 Scion*PGR – – –
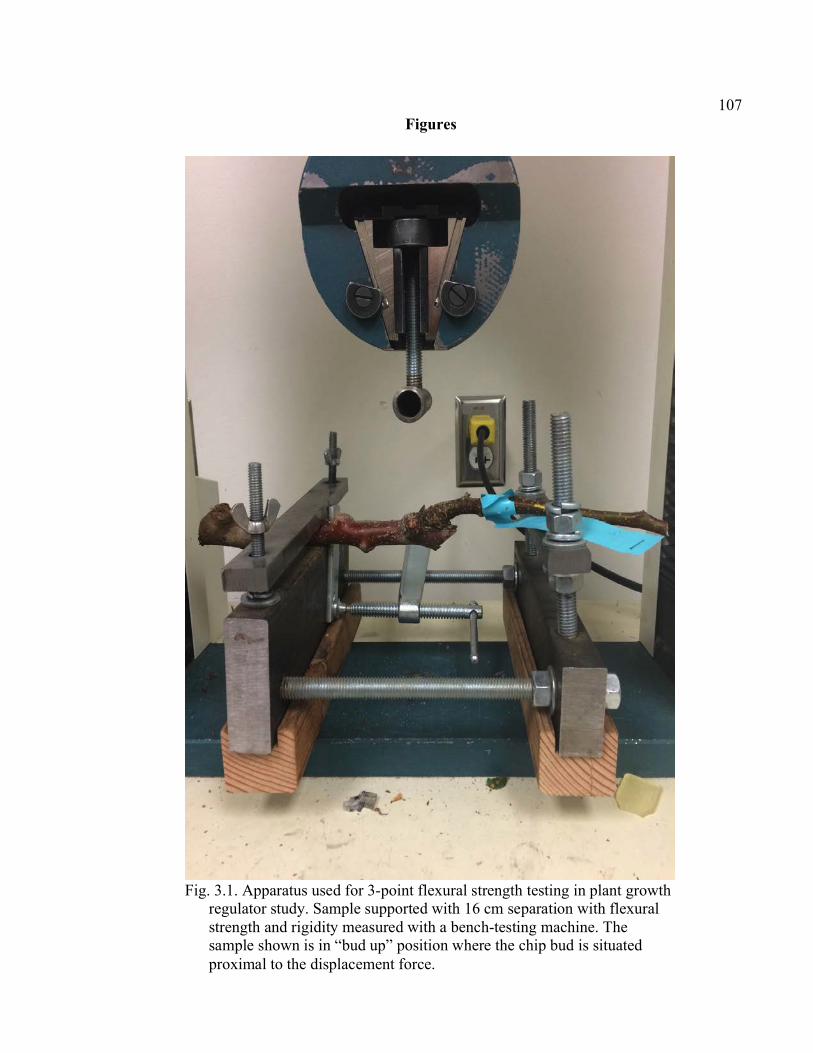
107 Figures
Fig. 3.1. Apparatus used for 3-point flexural strength testing in plant growth regulator study. Sample supported with 16 cm separation with flexural strength and rigidity measured with a bench-testing machine. The sample shown is in “bud up” position where the chip bud is situated proximal to the displacement force.
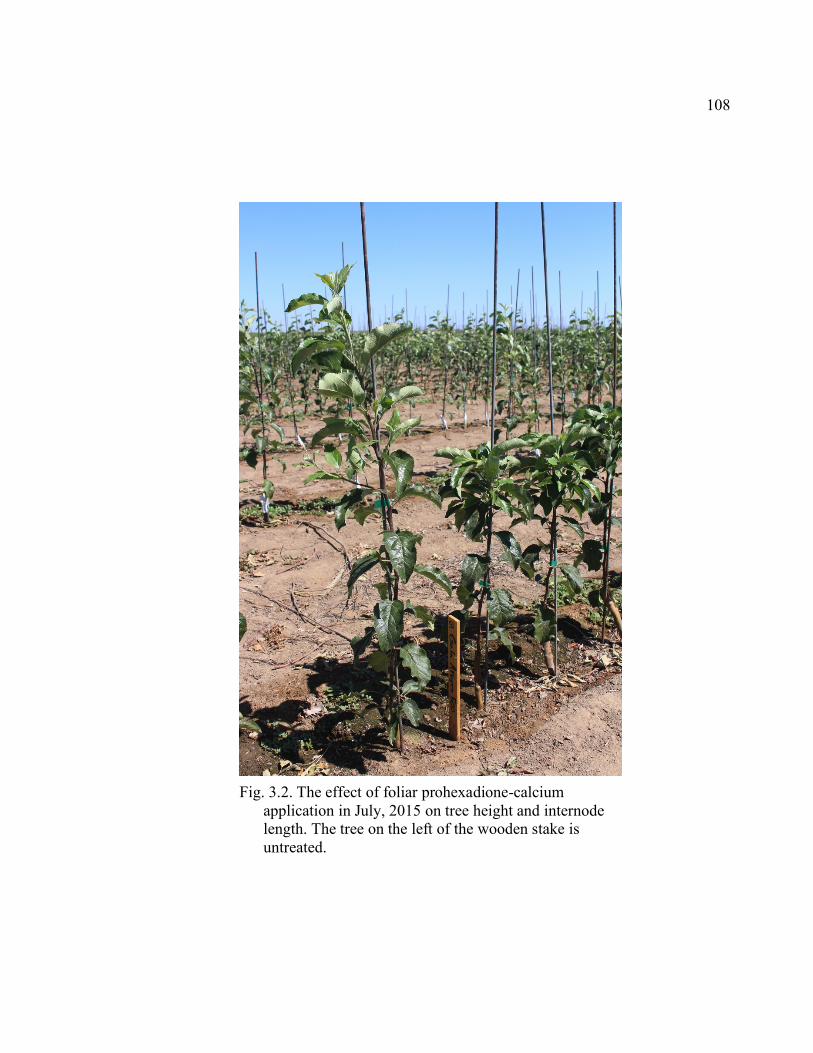
108
Fig. 3.2. The effect of foliar prohexadione-calcium application in July, 2015 on tree height and internode length. The tree on the left of the wooden stake is untreated.
109 CHAPTER 4
HYDRAULIC RESISTANCE OF ‘SCILATE’ AND ‘FUJI’ ON ‘GENEVA® 41’ AND
‘M.9-NIC 29’ ROOTSTOCKS WITH TWO GRAFTING METHODS
Abstract
Flexural strength of graft unions may be related to the amount of vascular tissue
connections between graft partners, and poor vascular connections may cause increased
hydraulic resistance. ‘Geneva® 41’ (‘G.41’) apple rootstock forms weak grafts, and may
have poor vascular connections. We sought to determine if transpiration rate and
hydraulic resistance were correlated with graft union strength by comparing ‘G.41’ with
the strong graft-forming ‘Malling 9 selection NIC 29’ (‘M.9-NIC 29’). Transpiration rate
was determined by daily changes in the mass of potted trees and measuring total tree leaf
area. Hydraulic resistance was measured using a pressure chamber with progressive
removal of stem tissues to determine resistance of scion, graft, and rootstock segments.
The transpiration rate of ‘G.41’ and ‘M.9-NIC 29’ differed between years, with no
consistent difference between rootstocks. Hydraulic resistance of the scion and graft
union was small relative to the root system, making it difficult to measure resistance in
the graft union. The hydraulic resistance of the weaker forming rootstock was not
significantly different than the strong graft union rootstock and there was no correlation
between graft union strength and transpiration rate.
110 Introduction
In an effort to overcome widespread infection and death of dwarfing apple
orchards, Cornell University, in connection with the USDA, have developed several
dwarfing rootstocks that have shown excellent fire blight resistance. These rootstocks are
identified as Geneva® rootstocks and are given a unique number (i.e. ‘G.11’, ‘G.41’,
‘G.935’, etc.). Trees grown on Geneva® rootstocks inhibit fire blight infection of the
rootstock and allow for pruning of the infected limb from the tree if infection occurs
(Robinson et al., 2007; Russo et al., 2007).
In addition to fire blight resistance, Geneva® rootstocks also show superior
resistance to Phytophthora crown and root rots, have high yield efficiency, and good fruit
size (Fazio et al., 2013). However, some of the Geneva® rootstocks, especially ‘G.41’,
appear to have weak or brittle graft unions that are susceptible to breakage in the nursery
and in the field (R. Adams, personal communication). This weakness has been especially
observed during strong wind events or during harvest and shipment suggesting the
potential for graft incompatibility. The disease resistance and economic potential of these
new Geneva® rootstocks make further research on graft incompatibility of great
importance to the apple industry.
There are many possible symptoms and mechanisms for graft incompatibility,
which make it difficult to measure. Most methods focus on quantifying whether vascular
differentiation. These methods include break or tensile strength testing, hydraulic
conductance, electrical conductance, and anatomical analysis through microscopy,
staining or other imaging.
111 In tensile testing, increased strength of the graft was seen with the onset of
vascular differentiation in vegetable grafts, however, increases of strength due to wood
formation may not be adequately accounted for (Moore, 1983b). Hydraulic conductance
of water through the graft union may indicate differences in vascular tissue formation.
Hydraulic conductance is measured as the mass or volume of water to flow over a
specific time period divided by the pressure head (kg s-1 MPa-1). Conductance may be
compared between samples of different diameters by dividing by the cross-sectional area
of the sample (kg s-1 MPa-1 cm-2) (Sperry et al., 1988; Tyree and Ewers, 1991). Similarly,
conductivity can take into account differences in the length of the conductive tissue and
can be used to find leaf specific conductivity (kg m-1 s-1 MPa-1), or the amount of leaf
area supported by the conductive tissues (Tyree and Ewers, 1991). Hydraulic
conductance measurements are sometimes reported as the resistance, which is the inverse
of conductance (MPa s kg-1) (Atkinson et al., 2003; Solari et al., 2006; Tyree et al.,
1995). Many experiments determine conductance/resistance through the graft union by
subtraction, measuring the rootstock and scion segment resistance
Pressure Chamber. One of the earlier methods for measuring conductance utilizes
large pressure chambers similar to ones used for measuring water potential in plant
samples. Gee et al. (1973) placed the intact root system of a plant in the pressure chamber
and measured the change of transpiration when positive pressures were applied to the
roots. While their research was designed to measure transpiration, the apparatus for
testing conductance in pressure chambers is similar. Tyree et al. (1995) used the pressure
chamber method as a standard for comparison in developing a different apparatus, which
supports its validity for measuring conductance. Tyree et al. (1995) used the positive
112 pressure of the chamber to push water up out of the stem. The water was then pumped to
a scale and the weight was measured. They found that the slope of the line for flow over
pressure (kg s-1 MPa-1) approached the true conductivity of the sample when using a
pressure chamber (Tyree et al., 1995). Tworkoski and Fazio (2008) used a similar method
for measuring flow and collecting samples for hormone analysis, however, they attached
tubing to the xylem of the stem and then pipetted out the exudate and weighed it to
determine the mass of the exudate over time. Although these studies have sought to
measure conductance of the whole plant, the method for measuring flow through the graft
union is still possible in the pressure chamber apparatus if rootstock and scion segment
measurements can be subtracted from whole plant measurements.
High-pressure Flow Meter. Tyree et al. (1995; 1994) described another method
for measuring flow through plants called the high-pressure flow meter. This apparatus
measures the pressure decrease across a capillary tube connected between a reservoir and
the attached sample. Instead of conductance, resistance is measured as distilled water is
forced through the sample. Dynamic measurements of rapidly changing pressures can
reach measurements similar to steady-state measurements, which would take hours in
gravity-fed flow meters (Tyree et al., 1994). Tyree et al. (1995) found that the high-
pressure flow meter gave similar results to using a pressure chamber when testing roots
of seven different species, but was much more rapid and less affected by bubbles.
However, when measuring the resistance of an intact root system, the flow is opposite the
natural direction for transpiration, which means solutes can concentrate in the soil and
lead to inaccuracy thus requiring rapid measurements to be taken.
113 Several studies have utilized the high-pressure flow meter to measure the
resistance across the graft union. Solari et al. (Solari et al., 2006) used this method to
measure the resistance of the graft unions of peach trees with different rootstocks. They
did this by first measuring the resistance through a wood segment with the graft and then
without the graft and found that the graft union contributed only 10% of the tree
resistance and had higher conductance than rootstock or scion segments after the trees
had spent one season in the nursery and seven months in the field. However, their data
does not adjust for differences in sample length and so it shouldn’t be surprising to find
higher conductance in short graft segment compared to the complex root system,
especially on older trees. Their data can still be used to compare across graft
combinations when just graft and scion segments were used to measure graft resistance.
Gasco et al. (2007) also used the high-pressure flow meter on olive grafts and found that
after 480 days of growth, the graft contributed to only 3% of the whole tree resistance
and was similar for both vigorous and dwarf rootstocks. Although these studies are not
conclusive for all grafting situations, they provide valuable information on the method
used to measure conductance/resistance with the high-pressure flow meter.
Gravity-fed Flow Meter. Another method that has been used successfully is the
gravity-fed flow meter developed by Sperry et al. (1988). For this method a perfusing
solution is pumped to a secondary reservoir, which is then allowed to flow down via
gravity through the sample, with solution exuded from the sample being collected and
weighed (Sperry et al., 1988). The major issue with this method is that it is slow.
One of the more important experiments done using the gravity-fed flow meter was
that of Atkinson et al. (2003) on apple grafts of differing rootstock vigor. In their
114 experiment they measured the conductivity of a whole stem segment that consisted of the
rootstock stem, graft union, and scion stem. They then cut off the rootstock stem and
measured just the rootstock conductance. Following the rootstock conductance, they cut
off the scion stem and measure the scion conductance. The conductance of the graft was
then found by subtracting the rootstock and scion conductance from the whole stem
conductance. In measuring conductance/resistance, they measured the mass of liquid per
unit time, the pressure, and the length of the segments to be able to make accurate
comparisons while considering sample differences. Atkinson et al. (2003) found that
vigorous rootstock increased the conductivity of the whole plant and its parts, and the
grafts of the vigorous rootstocks had less resistance than the dwarfing rootstock grafts
while correcting for differences in segment length. The increased conductivity in
vigorous rootstocks was also related to an increased percentage of stained xylem within
the graft segments, suggesting that trees on vigorous rootstocks may have increased
conductance due to increased percentage of active xylem (Atkinson et al., 2003). Using
the gravity-fed flow meter is slow and not ideal for a large number of samples, but the
protocol described by Atkinson et al. (2003) for identifying graft conductance provided
good results and may be modified to another flow meter apparatus.
Negative Pressure Apparatus. In addition to the positive pressures due to gravity
or a pressure chamber, negative pressure by a vacuum has also been used with some
success. Evans and Hilton (1957) used a method that involved attaching six graft union
samples to burettes on one end, and a vacuum on the other and then measuring the
change in the water level in the burette over time under a set vacuum pressure. This
115 method suffers, however, due to the slow process and the increased chance of unequal
forces being experienced on different samples. Another apparatus developed by
Kolb et al. (1996) modified the gravity-fed flow meter for use with larger shoot systems,
and used a vacuum in order to mimic the negative pressure seen in transpiring plants.
However as negative pressures increased, the restriction to flow due to embolism
increased (Kolb et al., 1996). This method has its merits in trying to mimic transpiration,
but results for testing graft union conductance have not been published from this method.
The primary goal of this study was to compare weak and strong graft unions by
measuring whole-tree transpiration, as well as hydraulic resistance using the pressure
chamber method. We hypothesized that the weaker ‘G.41’ rootstock would result in poor
or irregular vascular tissue, leading to reduced transpiration. The effects of grafting
method on graft union resistance were also compared.
Materials and Methods
Tree Propagation and Growth 2014 Trials. ‘Gala’ and ‘Scilate’ were custom budded on Geneva® 41 (‘G.41’)
and Malling 9 selection NIC 29™ (‘M.9-NIC 29’) rootstocks at Willow Drive Nursery in
Ephrata, Washington in August of 2013. In March of 2014, ‘Scilate’ was also saddle
grafted and whip and tongue grafted on ‘G.41’ to make an incomplete factorial (table
4.1). In May 2014, 10 trees from all six combinations were dug with a special digger to
maintain the roots in field soil, and then placed in 8-liter pots with the field soil, which is
a Timmerman coarse sandy loam. Trees were then allowed to grow outside in the shade
to prevent transplant shock. At the end of May, the trees were transported to the USU
116 research greenhouse facility in Logan, Utah and set up on an automatic drip irrigation
that irrigated for 30 minutes, 4 days per week. Drip emitters provided 4 L/hr. Trees
received fertigation on one of the 4 watering days with a 21N-5P-20K fertilizer solution
(Peters Excel) at 100 ppm N. The greenhouse was equipped with metal halide lamps to
supplement sunlight and maintain a 14-hour photoperiod. The daytime temperature was
21 °C and the nighttime temperature was 15 °C.
2015 Trials. ‘Fuji’ and ‘Scilate’ were custom budded on ‘G.41’ at Willow Drive
Nursery in August of 2014, and the same cultivars were custom saddle grafted in March
2015 on ‘G.41’ and ‘M.9-NIC 29’ rootstock making an incomplete factorial (table 4.1).
‘Scilate’ had been selected due to reports in the nursery that it was very brittle relative to
other cultivars such as ‘Fuji’. ‘G.41’ as a rootstock has shown to form weak graft unions
in the nursery and breaks frequently in the wind, while ‘M.9-NIC 29’ forms strong graft
unions. Ten trees of each combination were selected and then covered in moist sawdust
for transportation to the USU research greenhouses in Logan, Utah. Upon arrival the trees
were planted in 8-liter pots using a commercial soilless media (Sunshine Mix #4). Trees
were then grown in the greenhouse for three months prior to testing. Greenhouse
conditions were the same as described for 2014. Trees were watered by hand at first, and
then switched to automatic drip irrigation in May. Drip irrigation ran for 25 minutes, on
daily cycles, but was later adjusted to 20 minutes to help with nutrient deficiency. Drip
emitters were the same as for 2014. Trees received fertigation on two of the seven days
with the same solution as for 2014.
117 Transpiration Testing
2014 Trial. In July, eight trees of each rootstock/scion/graft method combination
were selected for uniformity and assigned to one of eight rows within the greenhouse.
Rows were spaced such that there was 60 cm in between every two rows with very little
in-row spacing. Pots were watered the night before any testing and allowed to drain to
field capacity. The pots were then wrapped in white plastic bags to prevent evaporation
from the soil surface. Each tree and pot was weighed in the morning and night for each
trial. Each morning, each tree and pot was weighed, the weight of water used over the 24-
hour period was determined, and water was added to bring the pot and tree back to the
initial weight. This process was repeated daily for 5-7 days. This method of adding back
in water each day was discontinued the following year because we noticed that we had
significant leaking from the bottom of the pot due to the low infiltration rate of the field
soil leading to preferential flow down the sides of the pot. During this time, leaf number
and length were measured and recorded for each tree for a non-destructive estimate of
total leaf area per tree. This method was calibrated by destructively measuring total leaf
area for one tree of each cultivar using a bench-top leaf area meter (model L1-3000 LI-
COR, Lincoln, Nebraska). Size measurements were also taken for each trial date,
including rootstock shank diameter (5 cm below graft union), graft union diameter based
on two perpendicular measurements at the widest part of the graft union, scion diameter
(5 cm above the graft union) and scion height from the graft union.
2015 Trial. In July, four trees of each rootstock/scion/graft method combination
were selected for uniformity and randomly assigned to one of four rows within the
greenhouse. Trees were spaced with 60 cm between rows and 30 cm within rows. Pots

118 were watered the night before any testing and allowed to drain to field capacity. The pots
were then wrapped in white plastic bags to prevent evaporation from the soil surface.
Each tree and pot was weighed in the morning and night for each trial. Bags were then
removed at night and trees were watered and allowed to reach field capacity for the next
day. Non-destructive leaf area estimates were carried out as described above. The process
of weighing and measuring leaf area was repeated at three separate trial periods in July,
however one of the trial periods was affected by leaking irrigation from other
experiments taking place in the greenhouse and was thus excluded. Size measurements
were also taken as described above.
Hydraulic Resistance
Following the completion of transpiration measurements, a pressure chamber
designed for a potted tree root system was used to measure the hydraulic resistance
through the rootstock, graft union, and a portion of the scion stem with sequential tissue
removal to determine resistance of the scion, graft, and root system. For 2014 all eight
trees for each combination were tested row by row. For the 2015 trials all ten trees from
each combination in the transpiration experiment were re-randomized as a completely
randomized design for testing in the pressure chambers.
The protocol for testing hydraulic conductance was as follows. First, the trees
were watered the night before any testing and allowed to reach field capacity by the
morning. We removed all of the leaves from the tree and placed them in plastic bags to so
that leaf area could be measured with the bench-top leaf area meter previously described.
The potted tree was then placed in the pressure chamber and the tree was topped just
119 below branch level to allow the pressure chamber lid to go over the tree. The chamber lid
was then secured and a rubber stopper was secured around the trunk. Pressure was then
applied to reach .345 MPa (50 psi) in the chamber. The tree was then re-topped about 34
cm above the graft union and 2 cm of bark (assumed to be phloem) was removed before
the diameter was measured (assumed to be xylem and pith). Plastic and rubber tube
pieces were used to attach a thin plastic tube used to direct water to a centrifuge tube for
collection. Once exudate began to drip from the thin tubing, we then began to collect the
exudate for 10 minutes. After 10 minutes the centrifuge tube was then removed and
weighed to determine mass of the exudate with 1 g of exudate equaling 1 ml of exudate.
The tree was then cut to 6 cm above the graft union and the above process was repeated.
We then cut the tree to 4 cm below the graft union and followed the same steps as above
but collected exudate for 20 minutes. During this time, lengths were measured for the
scion segment, graft segment, and later, the rootstock shank segment. Following testing
in the pressure chamber, roots were washed of their soil or potting media and allowed to
air dry in the greenhouse for two weeks. Once dry, the weight of the root mass removed
from the rootstock shank was weighed.
Calculations and Data Analysis
For transpiration testing we calculated the leaf area specific (LA) transpiration
rate as transpiration (g or ml/min) divided by leaf area (LA, m2). Transpiration was
calculated by taking the difference in potted tree weight (water loss) divided by the time
interval of water loss. Although accepted SI units for transpiration are kg s-1 m-2, the units
g min-1 m-2 are used for ease of reporting. Transpiration and flow measurements were
120 averaged over each trial period in which the size measurements were taken. Diameter
measurements of the rootstock, graft union, and scion were used to calculate cross-
sectional areas (CSA) using the equation for the area of a circle.
For the pressure chamber experiment, we used the weight of the collected
exudate, the pressure head, and the CSA to calculate resistance and CSA-specific
resistance. Resistance was reported instead of conductance because many of the data in
2014 and some of the data in 2015 had negative or zero resistance, which would result in
in and infinite conductance when calculated. Resistance (MPa min g-1), and CSA-specific
resistance (MPa min m2 g-1) were calculate similar to Gasco et al. (2007).
Data analysis was done using the GLM procedure in SAS as a split plot with date
as a repeated measured. The experiments were designed for two sets of pre-planned
comparisons. The first was a rootstock*scion factorial for a single graft type (chip bud in
2014, saddle graft in 2014). The second comparison was across graft types for individual
rootstocks, including chip bud, saddle graft, and whip and tongue graft for ‘Scilate’ on
‘G.41’ for 2014, and chip bud and saddle graft with ‘Scilate’ and ‘Fuji’ on ‘G.41’ in
2015. An ANOVA table was generated for each set of pre-planned comparisons and the
Tukey adjustment was performed for comparison of the means.
Results and Discussion
Transpiration Trials
Transpiration measurements were made comparing scion and rootstock
combinations in order to test the hypothesis that weaker graft unions would result in
reduced vascular connection, which would then limit transpiration. Analysis of variance
121 for both 2014 and 2015 data showed significant two-way interactions between sampling
time and other factors such as scion, rootstock and graft type. Graphs were generated to
visualize these interactions for tree transpiration, leaf area, and LA-transpiration rate.
Ending root mass was divided by scion cross-sectional area (SCSA) to provide a measure
similar to a root to shoot ratio to see some differences in partitioning and account for
water stress. One of the general trends was of decreasing LA-transpiration rates over
time, due to an increase in leaf area without a proportional increase in transpiration. The
most likely explanation for this is that as trees put on more leaf area, the older leaves
remain on the tree but contribute less to the overall transpiration of the tree partly due to
internal shading. The best comparisons of LA-transpiration rate were seen when leaf
areas were similar, or a regression could be generated to account for non-linear
relationship between transpiration rate and leaf area. Transpiration rate graphs should be
interpreted with this in mind.
Scion*Date. In 2014 (Figure 4.1), ‘Scilate’ and ‘Gala’ did not differ in
transpiration or leaf area until the October 3-6 date. By this final date, four of the
‘Gala’/’G.41’ trees had stopped growing and set terminal buds. Since the significant
difference in leaf area between cultivars was accompanied by a change in flow, there was
no significant difference between ‘Scilate’ and ‘Gala’ in their LA-transpiration rates,
which is also shown using a regression to account for differences in leaf area (Figure
4.2).
In 2015 we used ‘Fuji’ instead of ‘Gala’, because it was thought to form a
stronger graft union (G. Fazio, personal communication). Our results show that ‘Scilate’
had much higher tree transpiration and leaf area, however the LA-transpiration rate was
122 lower than ‘Fuji’ (Figure 4.3). This may be the result internal shading or a leaf area that is
disproportionately large for the available root volume. Conversely, when viewed in a
regression, ‘Scilate’ had a higher transpiration rate except when chip budded (Figure 4.5).
In both years, differences in LA-transpiration rate between scions were minimal, but did
differ in tree transpiration because of differences in leaf area.
Rootstock*Date. In 2014, ‘G.41’ and ‘M.9-NIC 29’ did not differ in tree
transpiration or leaf area at the earliest date (Figure 4.1). However, as leaf area increased
to the second date, the increase in tree transpiration was greater for ‘M.9-NIC 29’, which
translates to a higher LA-transpiration rate than for ‘G.41’. However in the October 3-6
the leaf area increased more drastically than tree transpiration for ‘M.9-NIC 29’, so that
transpiration rate was the same for both cultivars. As mentioned, some of the ‘Gala’ on
‘G.41’ had set terminal buds by the later trial period, which may indicate they went
through significant stress. This stress appears to have affected the ‘G.41’ chip buds
resulting in the reduced tree transpiration rate for the later measurement periods (Figure
4.2). Plant water stress in ‘G.41’ may also be indicated by the significantly higher root
mass per scion cross-sectional area, suggesting more partitioning to roots for water
uptake (Table 4.2)
In 2015, ‘G.41’ grew faster than ‘M.9-NIC 29’ resulting in more tree
transpiration and more leaf area (Figure 4.3). After adjusting for the leaf area, ‘G.41’
consistently had higher LA-transpiration rates (Figure 4.5). From the results over both
seasons, neither rootstock showed consistently higher growth or transpiration.
Differences in growth media may explain the differences in rootstock between years. The
2014 study was conducted using field soil and ‘M.9-NIC 29’ had higher growth rates.
123 Using soilless media in 2015, ‘G.41’ had faster growth. ‘G.41’ may have had higher LA-
transpiration rates than ‘M.9-NIC 29’ because it had a better root system (Table 4.3).
Scion*Rootstock. In 2014, ‘M.9-NIC 29’ in general had higher tree transpiration,
but this only resulted in a higher LA-transpiration rate for ‘Gala’ (Figure 4.1). After
adjusting for the non-linear relationship between tree transpiration and leaf area, ‘M.9-
NIC 29’ had higher tree transpiration than ‘G.41’ for the last two trial periods regardless
of scion cultivar (Figure 4.2). As mentioned, this may be due to stress on ‘G.41’ and thus
lower than expected tree transpiration rates.
In 2015, ‘G.41’ always had higher tree transpiration rates and higher leaf area
than ‘M.9-NIC 29’ for both scions (Figure 4.3), which resulted higher LA-transpiration
rates at a given leaf area (Figure 4.5). The significant scion*rootstock interaction resulted
because saddle grafted ‘Scilate’ on ‘G.41’ had disproportionately higher tree transpiration
and leaf area. This is particularly noteworthy since this combination forms the weakest
graft union (Chapter 2), suggesting that graft strength is not correlated with a limitation in
transpiration. As mentioned it may be more correlated with the root system involved
(Table 4.3)
Graft*Date. In 2014 chip buds were compared to two bench grafts: saddle graft
and whip and tongue graft (table 4.1). For the comparison of graft types, ‘Scilate’ and
‘G.41’ were used as scion and rootstock in all cases. On the first measurement date, chip
buds had significantly higher tree transpiration and leaf area than both bench grafts
(Figure 4.1), but LA-transpiration rates were similar when adjusting for leaf area
differences (Figure 4.2). For the July30-August2 date, chip buds still had a higher leaf
area but there was no difference in tree transpiration rate, which translated into a
124 significantly lower LA-transpiration rate than for both bench graft types. For the final
measurement (October 3-6) the leaf areas were not significantly different among all graft
types, but chip buds had lower tree transpiration. This resulted in a lower, but not
significantly different LA-transpiration rates than the bench grafts, possibly due to stress.
Since chip budding occurred in the fall and bench grafting occurred the following spring,
budded trees were further advanced at the beginning of the experiment, which is
evidenced by the early lead in leaf area. Regardless, on the final date, the leaf area and
LA-transpiration rate did not significantly different, which suggest that the different
grafting methods did not significantly affect the flow/resistance in the tree.
Because there was no difference between bench grafts in 2014, only one bench
graft method was used in 2015. This allowed for comparison of two different scions for
each graft method. For both measurement dates (graft*date), chip buds had higher tree
transpiration and leaf area than saddle grafts (Figure 4.4), but this is due to differences
between scions. For the scion*graft interaction, saddle grafted ‘Scilate’ had the same
levels of tree transpiration as chip budded ‘Scilate’, while saddle grafted ‘Fuji’ was
lower. Saddle grafted ‘Fuji’ had a much lower tree transpiration and disproportionately
lower leaf area than budded ‘Fuji’, which would give it a slightly higher LA-transpiration
rate. However, after adjusting for differences in leaf area, saddle grafted ‘Fuji’ has a
lower LA-transpiration rate. Looking at leaf area and LA-transpiration across
combinations, saddle grafted ‘Scilate’ had a comparable leaf area to chip budded ‘Fuji’,
and these two treatments did not differ in transpiration rates. It appears that treatment
differences were attributable to tree size more than scion-rootstock combination or graft
type. This suggests the grafting method had little effect on transpiration rate.
125 One explanation for some of the differences observed for these interactions are
that the older (chip buds), and larger trees (leaf area) may have reached the limits for
available water in the pot. This would lead to a reduced transpiration rate because the tree
transpiration does not increase proportional to or faster than the increase in leaf area.
Reaching the pots water availability limits are in addition to the already discussed
decrease in LA-transpiration rates due to the accumulation of older, less transpiring
leaves. In 2014, only the ‘G.41’ chip buds had lower LA-transpiration rates due to less
tolerance to plant water stress, which is indicated by having a higher root mass per scion
cross-sectional area (Table 4.2). All of the other combinations in 2014 had a similar root
mass per cross-sectional area (Table 4.2), and a similar LA-transpiration rate when
accounting for differences in leaf area (Figure 4.2). In 2015 the root mass per scion cross-
sectional area was much lower (Table 4.3), which indicates lower water stress since the
soilless media allowed for better water availability.
Based on our results, we found no correlation between transpiration and weak
graft unions. When the above explanations are considered, the differences between
treatment combinations are probably small and more related to tree and root system size
rather than the treatments combinations.
Hydraulic Resistance
2014 trials. Data from the pressure chamber experiment suffered from negative
scion and graft resistance measurements and having high variability within combinations.
Since resistance cannot be negative in this case, we set any negative values to zero and
ran the analysis. However, most of the scion and graft resistance measurements were
126 negative in 2014, so we decided to exclude them and conclude that the resistance in the
root system was too high to accurately measure differences in scion and graft segments.
RCSA specific resistance had a significant scion*rootstock interaction which showed that
chip budded ‘Scilate’ on ‘M.9-NIC 29’ was significantly higher than the other chip
budded combinations (Table 4.4). This result is primarily due to the high RCSA of chip
budded ‘Scilate’ on ‘M.9-NIC 29’. Comparing across graft types for ‘Scilate’ on ‘G.41’,
chip buds had the highest CSA-specific resistance with both saddle graft and whip and
tongue significantly lower. In summary, the two bench grafts had less CSA-specific
resistance than the chip buds, while only ‘Scilate’ on ‘M.9-NIC 29’ had a significantly
higher CSA-specific resistance.
2015 trials. As in 2014, we had some resistance calculations turn out to be
negative. However, there were relatively few negative values especially in comparison to
2014’s data. Saddle grafted ‘Fuji’ on ‘M.9-NIC 29’, in particular, suffered from negative
values when calculating graft resistance. These negative values have been set to zero, but
because they have been set to zero, a constant (1) was added to each data point for
analysis. We then subtracted the constant from the calculated mean resistance for
reporting. Because of this transformation, we are unable to calculate CSA-specific
resistance for the scion and graft.
For resistance through the graft segment, combinations with ‘Fuji’ were
significantly lower than ‘Scilate’ (Table 4.5). Part of this effect is skewed in favor of
‘Fuji’ because when it was saddle grafted on ‘M.9-NIC 29’, 80% of the samples yielded
negative resistance. ‘Fuji’ also had less resistance than ‘Scilate’ in the scion segment
when comparing saddle grafts and chip buds. Regardless, the rootstock did not have a
127 significant effect on the resistance in the graft. Based on these results ‘Fuji’ either has
less resistance to flow in the graft, or the rootstock resistance was still too high to allow
accurate measurements of these above ground segments.
For the root system, ‘G.41’ had less resistance than ‘M.9-NIC 29’ for saddle
grafts, and chip buds had less resistance than saddle grafts (Table 4.5). However, when
we accounted for RCSA, there was no significant difference between rootstocks when
saddle grafted, and the chip buds had higher CSA-specific resistance than saddle grafts
since chip buds had higher RCSA’s, which is the same as what we observed in 2014.
Much the same as our transpiration trials, the chip buds may have higher resistance
because their root system had reached the limits of the pot.
The pressure chamber experiment was designed to further explain where the
resistance is in the tree, however, much of our graft and scion resistance data for 2014
(some for 2015) had to be disregarded since many of the resistance measurements were
negative. Negative numbers occur when the flow above the graft union was greater than
or equal to the flow of just the rootstock. The reason much of this data was negative was
because of the resistance in the rootstock and soil was so high that we could not
accurately measure differences in the graft and scion if still connected to the rootstock. In
other experiments, the graft resistance was measured by testing a wood segment with the
graft attached and then removing the graft portion and retesting the segment (GASCO et
al., 2007). This would have removed the possibility of high resistance overshadowing the
low resistance in the above ground portions of the tree. It is also hypothesized that flow
may decline over time in the pressure chamber, however, we measured the change of
flow in five minute increments on an extra tree and found that if flow did decrease, it
128 only decreased by 100th of a gram (data not shown). Since we assume that much of the
resistance in our experiment was due to the rootstock and soil, we were still able to
calculate the resistance or conductance for the rootstock portion, which may be valuable
for future research.
Conclusion
The main objective of this study was to compare the hydraulic resistance of weak
and strong graft forming rootstocks. This was done by comparing measurements of
transpiration in a controlled environment, to resistance measurements with a pressure
chamber.
There was no significant effect of scion on transpiration rate. For the rootstocks,
there were conflicting results between years. In 2014, ‘M.9-NIC 29’ had an advantage
over ‘G.41’, but in 2015 with a different media, ‘G.41’ had the advantage over ‘M.9-NIC
29’ for leaf area (LA)-transpiration rate. Grafting method had no effect on the LA-
transpiration rate. Total tree leaf area and water availability may have influenced the
results. As discussed, leaf area tends to increase at a faster rate than flow, thus leading to
a general decrease in the transpiration rate over time. Having a higher leaf area may have
resulted in reaching water availability limits, which would also reduce transpiration rates.
Regardless, we found that ‘G.41’ did not suffer from reduced tree transpiration and LA-
transpiration rates. In the future, larger pots should be used to prevent reaching water
availability limits when the trees get larger and fill their space.
The pressure chamber experiment was designed to test whether there was a higher
resistance at the graft union for weak unions such as for ‘G.41’. In 2014, the resistance in
129 the graft union could not be determined because the resistance in the root system was too
high. Resistance measurements in 2015 were improved after switching to a soilless
media. However, there still was no detectable difference in the graft segment resistance
of the two rootstocks, which may be a result of high root resistance.
Based on these results poor vascular connections were not detected in the weak
graft-forming ‘G.41’ compared to the strong ‘M.9-NIC 29’. Instead, the results suggest
another mechanism for graft weakness in ‘G.41’. For future research, measuring
resistance through a graft union would be more accurate using wood segments that do not
include the root system.
Literature Cited
Atkinson, C.J., M.A. Else, L. Taylor, and C.J. Dover. 2003. Root and stem hydraulic conductivity as determinants of growth potential in grafted trees of apple (Malus pumila Mill.). J. Expt. Bot. 54:1221-1229.
Evans, W.D. and R.J. Hilton. 1957. Methods of evaluating stock/scion compatibility in apple trees. Can. J. Plant Sci. 37:327-336.
Fazio, G., H. Aldwinckle, and T. Robinson. 2013. Unique characteristics of Geneva® apple rootstocks. New York Fruit Qrtly. 21:25-28
Gasco, A., A. Nardini, F. Raimondo, E. Gortan, A. Motisi, M.A. Lo Gullo, and S. Salleo. 2007. Hydraulic kinetics of the graft union in different Olea europaea L. scion/rootstock combinations. Environ. Expt. Bot. 60:245-250.
Gee, G.W., B.E. Janes, and C.S. Tan. 1973. A chamber for applying pressure to roots of intact plants. Plant Physiol. 52:472-474.
Kolb, K.J., J.S. Sperry, and B.B. Lamont. 1996. A method for measuring xylem hydraulic conductance and embolism in entire root and shoot systems. J. Expt. Bot. 47:1805-1810.
Moore, R. 1983. Studies of vegetative compatibility-incompatibility in higher plants. IV. The development of tensile strength in a compatible and an incompatible graft. Amer. J. Bot. 20:226-231.
Robinson, T., L. Anderson, W. Autio, B. Barritt, J. Cline, W. Cowgill, R. Crassweller, C. Embree, D. Ferree, E. Garcia, G. Greene, C. Hampson, K. Kosola, M. Parker, R. Perry, T. Roper, and M. Warmund. 2007. A multi-location comparison of 'Geneva® 16', 'Geneva® 41' and 'M.9' apple rootstocks in North America. Acta Hort. 732:59-65.
130 Russo, N.R., T.L. Robinson, G. Fazio, and H.S. Aldwinckle. 2007. Field evaluation of 64
apple rootstocks for orchard performance and fire blight resistance. HortScience 42:1517-1525.
Solari, L.I., S. Johnson, and T.M. Dejong. 2006. Hydraulic conductance characteristics of peach (Prunus persica) trees on different rootstocks are related to biomass production and distribution. Tree Physiol. 26:1343-1350.
Sperry, J.S., J.R. Donnelly, and M.T. Tyree. 1988. A method for measuring hydraulic conductivity and embolism in xylem. Plant, Cell and Environ. 11:35-40.
Tworkoski, T. and G. Fazio. 2008. Physiological and morphological effects of size-controlling rootstocks on 'Fuji' scion. Acta Hort. 903:865-872.
Tyree, M.T. and F.W. Ewers. 1991. Tansley Review No. 34. The hydraulic architecture of trees and other woody plants. New Phytol. 119:345-360.
Tyree, M.T., S. Patino, J. Bennink, and J. Alexander. 1995. Dynamic measurements of root hydraulic conductance using a high-pressure flowmeter in the laboratory and field. J. Expt. Bot. 46:83-94.
Tyree, M.T., S. Yang, P. Cruiziat, and B. Sinclair. 1994. Novel methods of measuring hydraulic conductivity of tree root systems and interpretation using AMAIZED. Plant Physiol. 104:189-199.
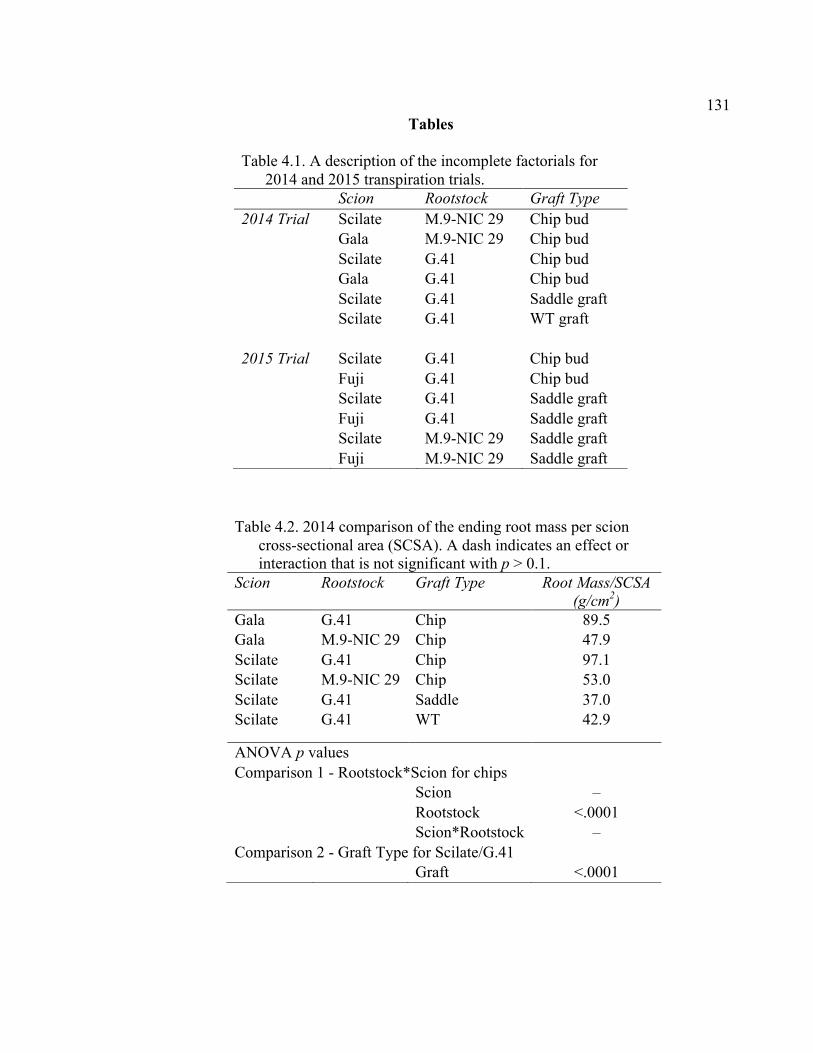
131 Tables
Table 4.1. A description of the incomplete factorials for 2014 and 2015 transpiration trials. Scion Rootstock Graft Type 2014 Trial Scilate M.9-NIC 29 Chip bud Gala M.9-NIC 29 Chip bud Scilate G.41 Chip bud Gala G.41 Chip bud Scilate G.41 Saddle graft Scilate G.41 WT graft 2015 Trial Scilate G.41 Chip bud Fuji G.41 Chip bud Scilate G.41 Saddle graft Fuji G.41 Saddle graft Scilate M.9-NIC 29 Saddle graft Fuji M.9-NIC 29 Saddle graft
Table 4.2. 2014 comparison of the ending root mass per scion cross-sectional area (SCSA). A dash indicates an effect or interaction that is not significant with p > 0.1. Scion Rootstock Graft Type Root Mass/SCSA
(g/cm2) Gala G.41 Chip 89.5 Gala M.9-NIC 29 Chip 47.9 Scilate G.41 Chip 97.1 Scilate M.9-NIC 29 Chip 53.0 Scilate G.41 Saddle 37.0 Scilate G.41 WT 42.9
ANOVA p values Comparison 1 - Rootstock*Scion for chips Scion – Rootstock <.0001 Scion*Rootstock – Comparison 2 - Graft Type for Scilate/G.41 Graft <.0001
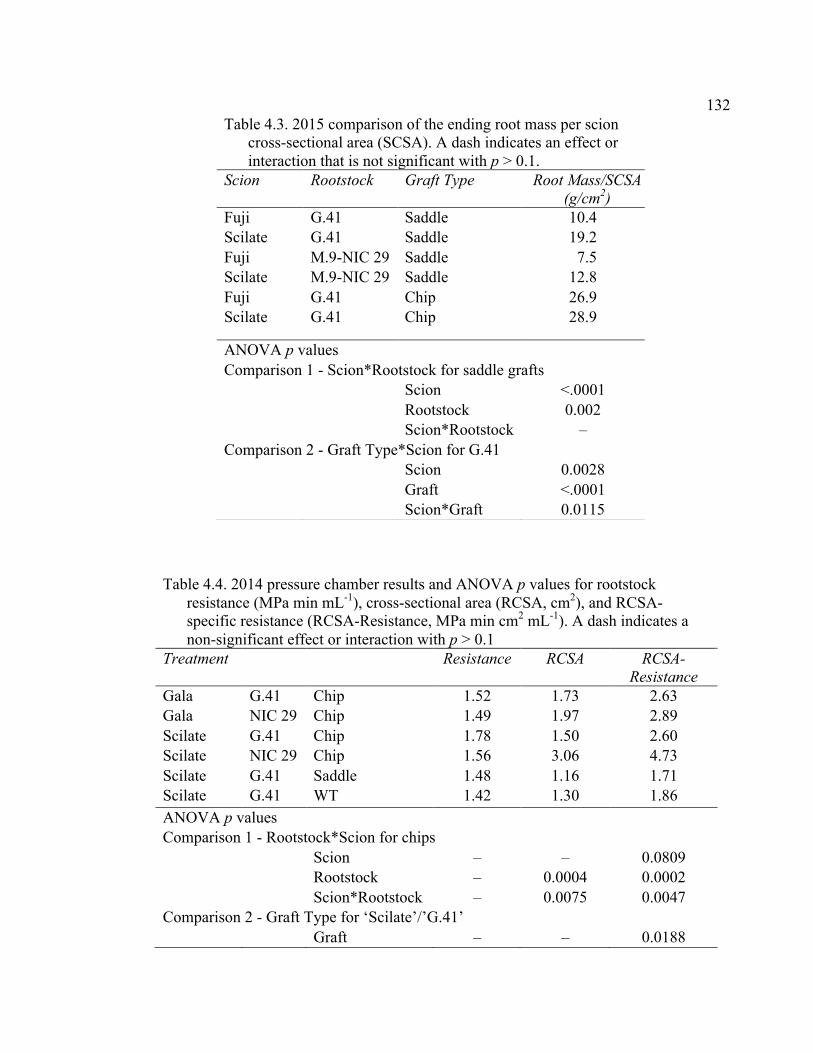
132 Table 4.3. 2015 comparison of the ending root mass per scion
cross-sectional area (SCSA). A dash indicates an effect or interaction that is not significant with p > 0.1. Scion Rootstock Graft Type Root Mass/SCSA
(g/cm2) Fuji G.41 Saddle 10.4 Scilate G.41 Saddle 19.2 Fuji M.9-NIC 29 Saddle 7.5 Scilate M.9-NIC 29 Saddle 12.8 Fuji G.41 Chip 26.9 Scilate G.41 Chip 28.9
ANOVA p values Comparison 1 - Scion*Rootstock for saddle grafts Scion <.0001 Rootstock 0.002 Scion*Rootstock – Comparison 2 - Graft Type*Scion for G.41 Scion 0.0028 Graft <.0001 Scion*Graft 0.0115
Table 4.4. 2014 pressure chamber results and ANOVA p values for rootstock resistance (MPa min mL-1), cross-sectional area (RCSA, cm2), and RCSA-specific resistance (RCSA-Resistance, MPa min cm2 mL-1). A dash indicates a non-significant effect or interaction with p > 0.1
Treatment Resistance RCSA RCSA-Resistance
Gala G.41 Chip 1.52 1.73 2.63 Gala NIC 29 Chip 1.49 1.97 2.89 Scilate G.41 Chip 1.78 1.50 2.60 Scilate NIC 29 Chip 1.56 3.06 4.73 Scilate G.41 Saddle 1.48 1.16 1.71 Scilate G.41 WT 1.42 1.30 1.86 ANOVA p values Comparison 1 - Rootstock*Scion for chips Scion – – 0.0809 Rootstock – 0.0004 0.0002 Scion*Rootstock – 0.0075 0.0047 Comparison 2 - Graft Type for ‘Scilate’/’G.41’ Graft – – 0.0188
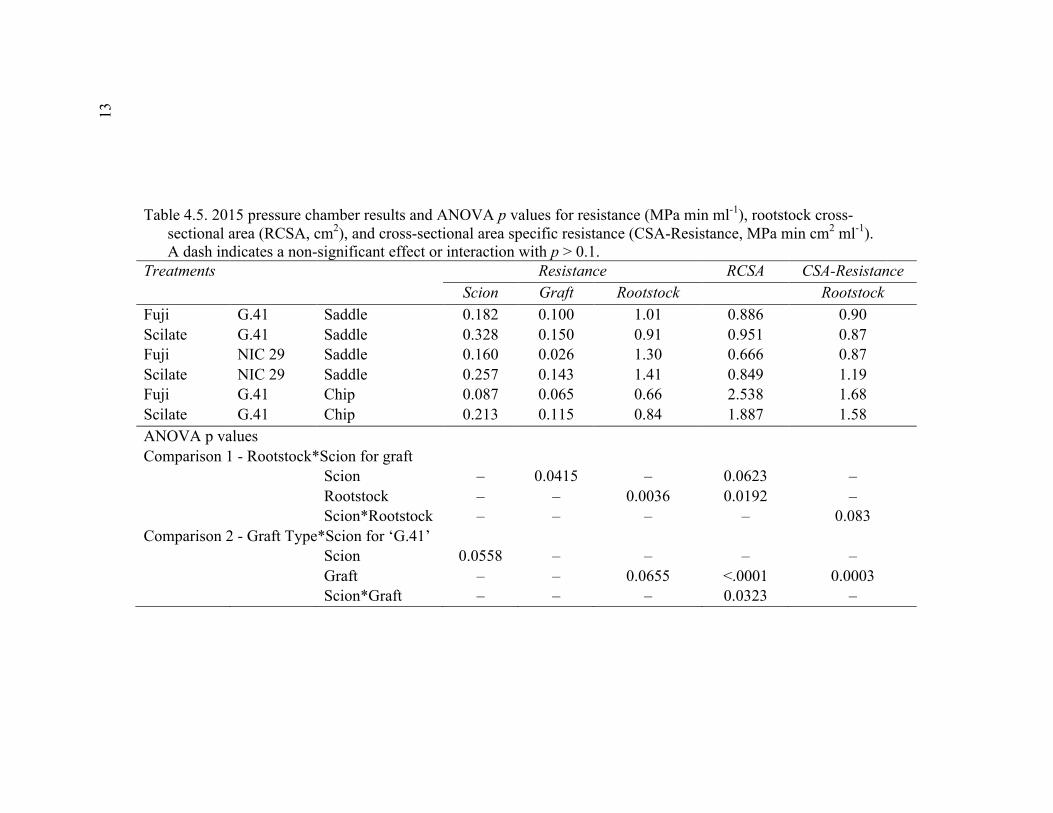
13 3
Table 4.5. 2015 pressure chamber results and ANOVA p values for resistance (MPa min ml-1), rootstock cross- sectional area (RCSA, cm2), and cross-sectional area specific resistance (CSA-Resistance, MPa min cm2 ml-1). A dash indicates a non-significant effect or interaction with p > 0.1. Treatments Resistance RCSA CSA-Resistance Scion Graft Rootstock Rootstock Fuji G.41 Saddle 0.182 0.100 1.01 0.886 0.90 Scilate G.41 Saddle 0.328 0.150 0.91 0.951 0.87 Fuji NIC 29 Saddle 0.160 0.026 1.30 0.666 0.87 Scilate NIC 29 Saddle 0.257 0.143 1.41 0.849 1.19 Fuji G.41 Chip 0.087 0.065 0.66 2.538 1.68 Scilate G.41 Chip 0.213 0.115 0.84 1.887 1.58 ANOVA p values Comparison 1 - Rootstock*Scion for graft Scion – 0.0415 – 0.0623 – Rootstock – – 0.0036 0.0192 – Scion*Rootstock – – – – 0.083 Comparison 2 - Graft Type*Scion for ‘G.41’ Scion 0.0558 – – – – Graft – – 0.0655 <.0001 0.0003 Scion*Graft – – – 0.0323 –
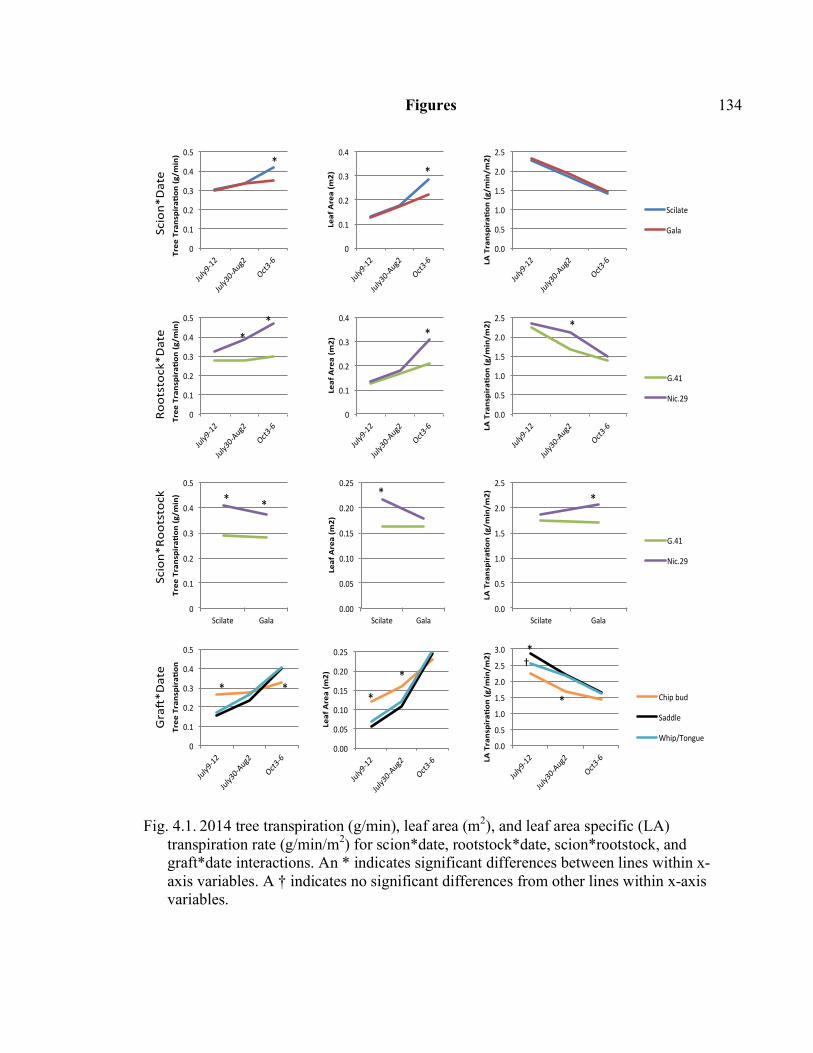
134 Figures
Fig. 4.1. 2014 tree transpiration (g/min), leaf area (m2), and leaf area specific (LA) transpiration rate (g/min/m2) for scion*date, rootstock*date, scion*rootstock, and graft*date interactions. An * indicates significant differences between lines within x-axis variables. A † indicates no significant differences from other lines within x-axis variables.
0
0.1
0.2
0.3
0.4
0.5
July9-12
July30-Aug2
Oct3-6
TreeTranspira*on
(g/m
in)
0
0.1
0.2
0.3
0.4
July9-12
July30-Aug2
Oct3-6
LeafArea(m
2)
0.0
0.5
1.0
1.5
2.0
2.5
July9-12
July30-Aug2
Oct3-6LA
Transpira*on
(g/m
in/m
2)
Scilate
Gala
0
0.1
0.2
0.3
0.4
0.5
July9-12
July30-Aug2
Oct3-6
TreeTranspira*on
(g/m
in)
0
0.1
0.2
0.3
0.4
July9-12
July30-Aug2
Oct3-6
LeafArea(m
2)
0.0
0.5
1.0
1.5
2.0
2.5
July9-12
July30-Aug2
Oct3-6LA
Transpira*on
(g/m
in/m
2)
G.41
Nic.29
Scion*
Date
Rootstock*Date
Scion*
Rootstock
0
0.1
0.2
0.3
0.4
0.5
July9-12
July30-Aug2
Oct3-6
TreeTranspira*on
0.00
0.05
0.10
0.15
0.20
0.25
July9-12
July30-Aug2
Oct3-6
LeafArea(m
2)
0.0
0.5
1.0
1.5
2.0
2.5
3.0
July9-12
July30-Aug2
Oct3-6LA
Transpira*on
(g/m
in/m
2)
Chipbud
Saddle
Whip/Tongue
GraK*D
ate
0
0.1
0.2
0.3
0.4
0.5
Scilate Gala
TreeTranspira*on
(g/m
in)
0.00
0.05
0.10
0.15
0.20
0.25
Scilate Gala
LeafArea(m
2)
0.0
0.5
1.0
1.5
2.0
2.5
Scilate Gala
LATranspira*on
(g/m
in/m
2)
G.41
Nic.29
**
** **
* ** *
* **
*
*
*
†
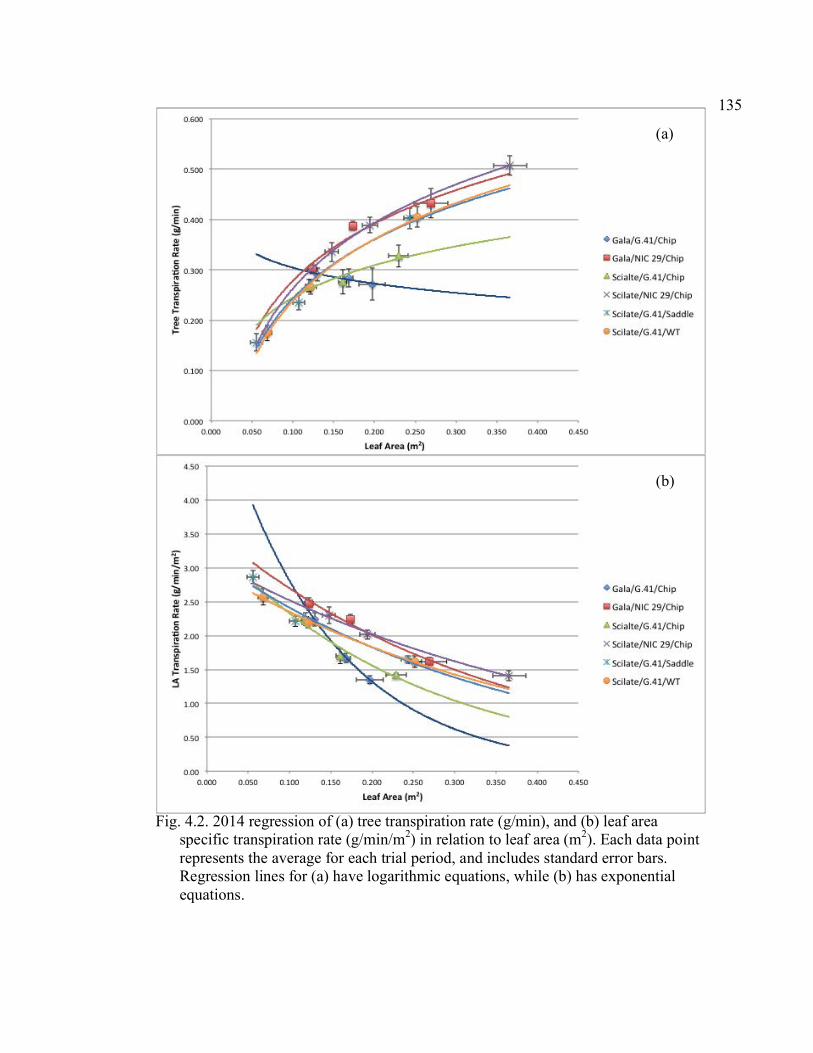
135
(a)
Fig. 4.2. 2014 regression of (a) tree transpiration rate (g/min), and (b) leaf area specific transpiration rate (g/min/m2) in relation to leaf area (m2). Each data point represents the average for each trial period, and includes standard error bars. Regression lines for (a) have logarithmic equations, while (b) has exponential equations.
(a)
(b)
(a)

136
Fig. 4.3. 2015 tree transpiration (g/min), leaf area (m2), and leaf area specific (LA) transpiration rate (g/min/m2) for scion*date, rootstock*date, and scion*rootstock interactions from comparison 1. An asterisk indicates significant differences between lines within x-axis variables.
0.0
0.2
0.4
0.6
0.8
1.0
1.2
July21-22 July29-31
TreeTranspira*on
(g/m
in)
0
0.1
0.2
0.3
0.4
0.5
0.6
0.7
July21-22 July29-31
LeafArea(m
2 )
0.0
0.5
1.0
1.5
2.0
2.5
3.0
July21-22 July29-31
LATranspira*on
(g/m
in/m
2 )
Scilate
Fuji
0.0
0.2
0.4
0.6
0.8
1.0
1.2
July21-22 July29-31
TreeTranspira*on
(g/m
in)
0
0.1
0.2
0.3
0.4
0.5
0.6
0.7
July21-22 July29-31
LeafArea(m
2 )
0.0
0.5
1.0
1.5
2.0
2.5
3.0
July21-22 July29-31
LATranspira*on
(g/min/m
2 )
G.41
Nic.29
Scion*
Date
Rootstock*Date
Scion*
Rootstock
* *
*
* *
*
* *
*
* *
*
*
*
*
0.0
0.2
0.4
0.6
0.8
1.0
1.2
1.4
Scilate Fuji
TreeTranspira*on
(g/m
in)
0
0.1
0.2
0.3
0.4
0.5
0.6
0.7
Scilate Fuji
LeafArea(m
2)
0.0
0.5
1.0
1.5
2.0
2.5
Scilate Fuji
LATranspira*on
(g/min/m
2)
G.41
Nic.29
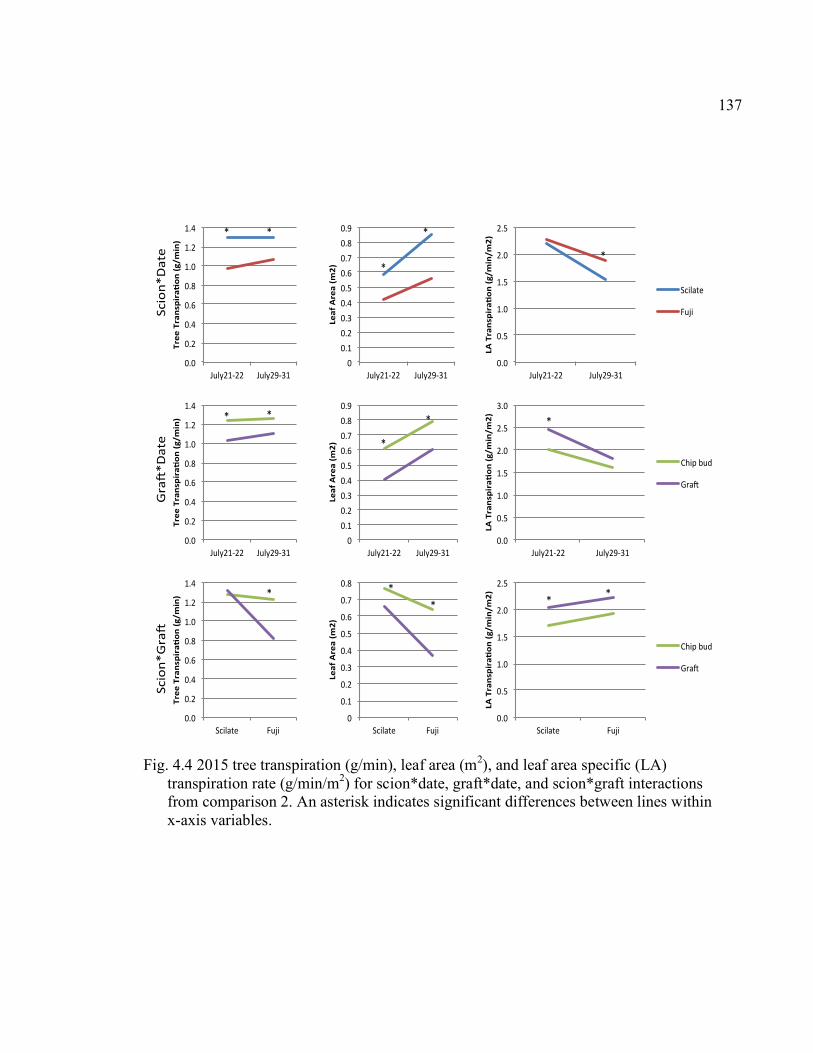
137
Fig. 4.4 2015 tree transpiration (g/min), leaf area (m2), and leaf area specific (LA) transpiration rate (g/min/m2) for scion*date, graft*date, and scion*graft interactions from comparison 2. An asterisk indicates significant differences between lines within x-axis variables.
0.0
0.2
0.4
0.6
0.8
1.0
1.2
1.4
July21-22 July29-31
TreeTranspira*on
(g/m
in)
00.10.20.30.40.50.60.70.80.9
July21-22 July29-31
LeafArea(m
2)
0.0
0.5
1.0
1.5
2.0
2.5
July21-22 July29-31
LATranspira*on
(g/m
in/m
2)
Scilate
Fuji
0.0
0.2
0.4
0.6
0.8
1.0
1.2
1.4
July21-22 July29-31
TreeTranspira*on
(g/m
in)
00.10.20.30.40.50.60.70.80.9
July21-22 July29-31
LeafArea(m
2)
0.0
0.5
1.0
1.5
2.0
2.5
3.0
July21-22 July29-31
LATranspira*on
(g/m
in/m
2)
Chipbud
GraA
Scion*
Date
GraA*D
ate
Scion*
GraA
0.0
0.2
0.4
0.6
0.8
1.0
1.2
1.4
Scilate Fuji
TreeTranspira*on
(g/m
in)
0
0.1
0.2
0.3
0.4
0.5
0.6
0.7
0.8
Scilate Fuji
LeafArea(m
2)
0.0
0.5
1.0
1.5
2.0
2.5
Scilate Fuji
LATranspira*on
(g/m
in/m
2)
Chipbud
GraA
* *
*
*
*
**
*
* *
**
** *
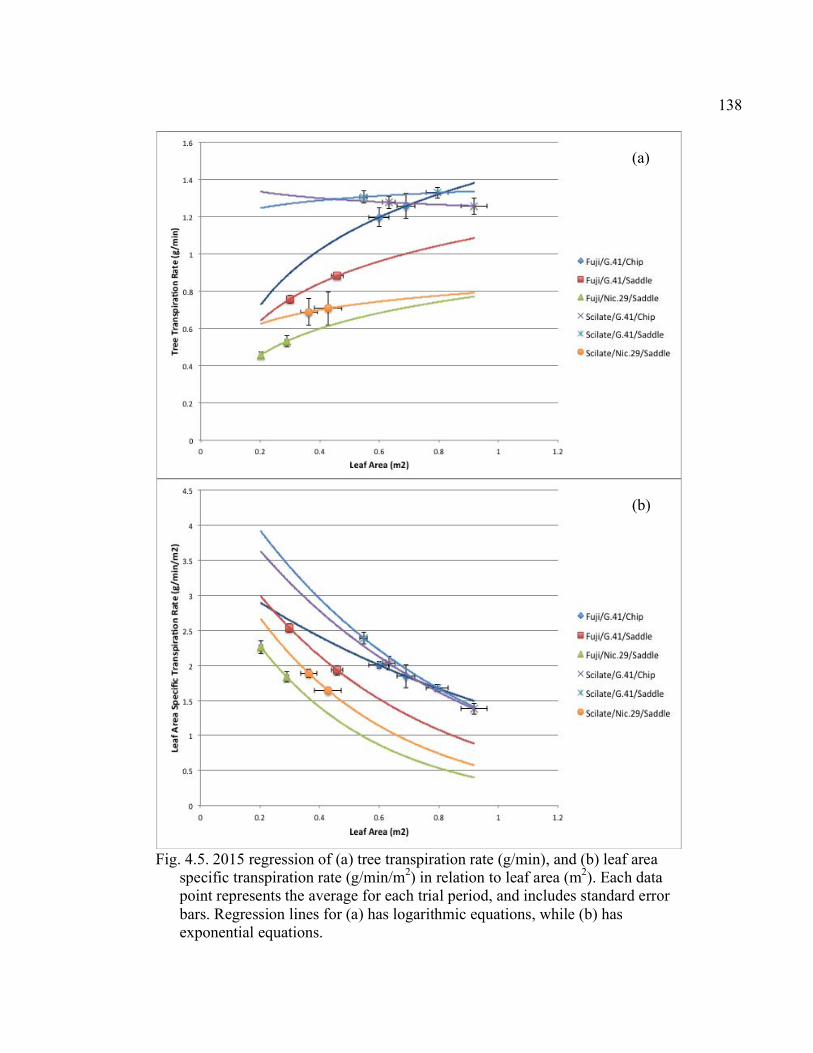
138
Fig. 4.5. 2015 regression of (a) tree transpiration rate (g/min), and (b) leaf area specific transpiration rate (g/min/m2) in relation to leaf area (m2). Each data point represents the average for each trial period, and includes standard error bars. Regression lines for (a) has logarithmic equations, while (b) has exponential equations.
(a)
(b)
139 CHAPTER 5
CONCLUSION
These studies investigated factors affecting graft union flexural strength and
hydraulic resistance in order to better understand a problem of graft failure with
rootstocks such as ‘Geneva® 41’ (‘G.41’), while providing evidence for practical
applications to growers. These studies have shown that rootstock, scion and graft method
all contribute to overall graft union strength and flexibility. Studies on plant growth
regulators (PGR) provide some evidence of their use as a solution for weak graft unions.
Hydraulic resistance studies show that weak graft unions were not associated with altered
transpiration rate or hydraulic resistance.
As seen in Chapter 2, ‘G.41’ had a consistently weaker graft union in regards to
break force and force per scion cross-sectional area (F/SCSA). This weakness continues
into a second year of growth as break strength (F/SCSA) increases at a slower rate than
for ‘Malling 9 selection NIC 29’ (‘M.9-NIC 29’) or ‘Geneva® 11’ (‘G.11’). ‘G.41’
consistently formed graft unions with the lowest deflection or the least flexibility, and
had the highest proportion of clean breaks. Other Geneva® rootstocks, such as ‘G.11’ and
‘Geneva® 214’ (‘G.214’) appear to form stronger unions than ‘G.41’. ‘Geneva® 935’
(‘G.935’) was also stronger than ‘G.41’, but it produces a larger tree that may be more
susceptible to wind.
Scion cultivar also had an effect on the graft union strength. In particular,
‘McIntosh’ and ‘Pink Lady’ form stronger unions in relation to the scion cross-sectional
area. Conversely, ‘Scilate’ and ‘Honeycrisp’ form weaker graft unions; however,
‘Honeycrisp’ produces a smaller tree and may be less influenced by the wind.
140 Saddle grafting did not appear to improve the strength of the graft union
compared to chip budding. Thus, switching graft methods in order to increase graft
strength is not justified from these studies. Saddle grafting increased the flexibility of the
graft union, which is one positive difference. However, saddle grafted trees were also
smaller, which may not be desirable to orchardists as larger, feathered trees are generally
desired.
As seen in chapter 3, efforts to find a PGR treatment that would strengthen the
graft union yielded positive results. In general benzyl adenine (BA) delivered in a latex
paint increased the break strength (F/SCSA) and had increased flexibility, which would
improve survival in windy conditions. Prohexadione-calcium (PCa) at a higher rate may
also increase the strength of the graft union. However, both of these PGR’s also had
reduced scion cross-sectional areas (SCSA), which may reduce their value in the nursery.
One challenge with PGR’s is getting the active ingredient to the right tissues. BA in latex
appears to work, but may not be a viable option at a commercial scale.
As seen in chapter 4, the rootstock effect on transpiration rate was different for
each year, which is possibly due to the different media used in the potted trees between
years. ‘M.9-NIC 29’ had higher transpiration rates in field soil, while ‘G.41’ was higher
in a commercial potting mix. Grafting method had little effect on transpiration, but this is
partially hidden due to differences in leaf area and overall tree size between chip buds
and bench grafts. Regardless, ‘G.41’ did not suffer from reduced transpiration rate.
Results from hydraulic resistance studies showed the rootstock effect had no detectable
difference in graft hydraulic resistance. The high resistance within the root system
probably obscured possible differences between rootstocks. Future studies on hydraulic
141 resistance should use methods that test segments that are not connected to the root
system.
Based on these studies on graft union strength and hydraulic resistance, ‘G.41’
forms a weaker graft union than the other rootstocks tested regardless of scion, or
grafting method. Although ‘G.41’ was always weaker, it may still be used as a rootstock,
but care should be given to graft stronger scions, such as ‘McIntosh’ or ‘Pink Lady’, onto
‘G.41’. ‘Scilate’ in particular should be avoided as a scion on ‘G.41’ since it had the
weakest graft union and forms a large, feathered tree susceptible to the wind. Plant
growth regulators may present a promising remedy, but further research should be
conducted to find more efficient methods of application before any recommendations
could be given. The weakness in ‘G.41’ does not appear to be related to its hydraulic
conductance/resistance, rather, there is a different problem that leads to the graft union
weakness of ‘G.41’.

142
APPENDICES
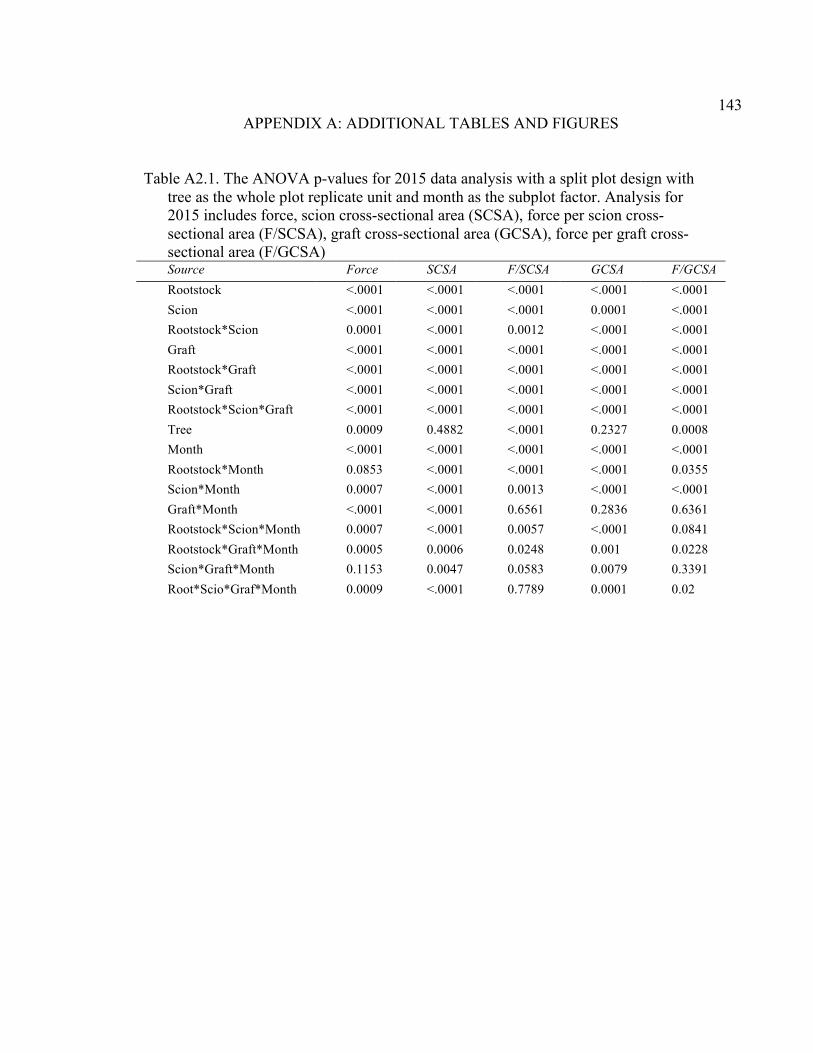
143 APPENDIX A: ADDITIONAL TABLES AND FIGURES
Table A2.1. The ANOVA p-values for 2015 data analysis with a split plot design with tree as the whole plot replicate unit and month as the subplot factor. Analysis for 2015 includes force, scion cross-sectional area (SCSA), force per scion cross- sectional area (F/SCSA), graft cross-sectional area (GCSA), force per graft cross- sectional area (F/GCSA)
Source Force SCSA F/SCSA GCSA F/GCSA Rootstock <.0001 <.0001 <.0001 <.0001 <.0001 Scion <.0001 <.0001 <.0001 0.0001 <.0001 Rootstock*Scion 0.0001 <.0001 0.0012 <.0001 <.0001 Graft <.0001 <.0001 <.0001 <.0001 <.0001 Rootstock*Graft <.0001 <.0001 <.0001 <.0001 <.0001 Scion*Graft <.0001 <.0001 <.0001 <.0001 <.0001 Rootstock*Scion*Graft <.0001 <.0001 <.0001 <.0001 <.0001 Tree 0.0009 0.4882 <.0001 0.2327 0.0008 Month <.0001 <.0001 <.0001 <.0001 <.0001 Rootstock*Month 0.0853 <.0001 <.0001 <.0001 0.0355 Scion*Month 0.0007 <.0001 0.0013 <.0001 <.0001 Graft*Month <.0001 <.0001 0.6561 0.2836 0.6361 Rootstock*Scion*Month 0.0007 <.0001 0.0057 <.0001 0.0841 Rootstock*Graft*Month 0.0005 0.0006 0.0248 0.001 0.0228 Scion*Graft*Month 0.1153 0.0047 0.0583 0.0079 0.3391 Root*Scio*Graf*Month 0.0009 <.0001 0.7789 0.0001 0.02

14 4
Table A2.2. August 2015 comparison of force (N) for the rootstock*scion interaction per graft type. Different letters within main effects are significantly different with p < 0.05. Chip Bud M.9-NIC 29 G.214 G.935 B.9 G.11 EMLA 26 G.41 Main Effect McIntosh 850 664 563 382 362 537 378 533 a Fuji 682 630 573 577 469 473 297 529 a Gala 829 494 481 325 367 310 245 436 b Pink Lady 786 426 345 407 358 349 302 425 bc Scilate 664 393 318 255 356 281 233 357 cd Honeycrisp 513 464 377 361 330 245 150 349 d Main Effect 721 a 512 b 443 bc 384 c 374 c 366 c 267 d
Saddle Graft M.9-NIC 29 MM.106 EMLA 26 G.11 B.9 G.214 G.935 G.41 Main Effect Pink Lady 308 187 219 174 147 131 138 142 181 a Honeycrisp 264 248 235 178 125 155 113 99 177 a McIntosh 248 206 175 146 167 153 136 125 170 a Fuji 202 218 198 192 158 63 144 119 162 ab Scilate 160 150 210 151 179 148 99 74 146 b Gala 193 208 145 116 144 150 107 104 146 b Main Effect 229 a 203 a 197 a 160 b 153 bc 133 cd 123 d 111 d
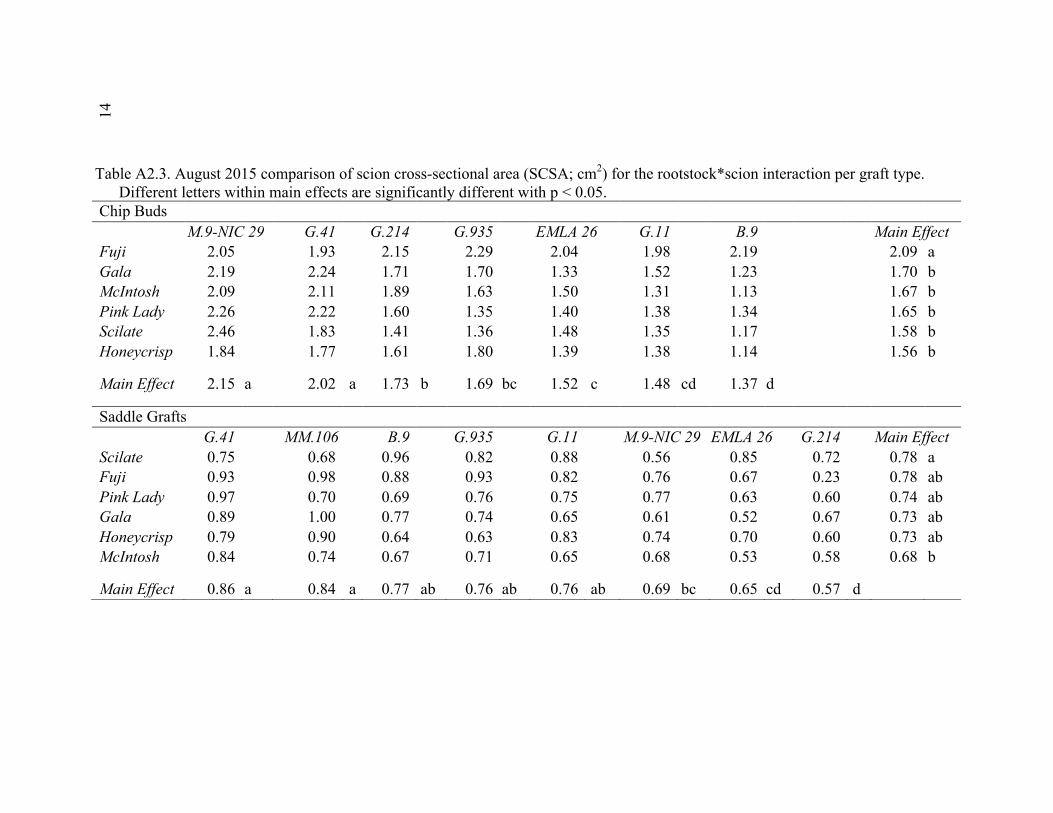
14 5
Table A2.3. August 2015 comparison of scion cross-sectional area (SCSA; cm2) for the rootstock*scion interaction per graft type. Different letters within main effects are significantly different with p < 0.05. Chip Buds M.9-NIC 29 G.41 G.214 G.935 EMLA 26 G.11 B.9 Main Effect Fuji 2.05 1.93 2.15 2.29 2.04 1.98 2.19 2.09 a Gala 2.19 2.24 1.71 1.70 1.33 1.52 1.23 1.70 b McIntosh 2.09 2.11 1.89 1.63 1.50 1.31 1.13 1.67 b Pink Lady 2.26 2.22 1.60 1.35 1.40 1.38 1.34 1.65 b Scilate 2.46 1.83 1.41 1.36 1.48 1.35 1.17 1.58 b Honeycrisp 1.84 1.77 1.61 1.80 1.39 1.38 1.14 1.56 b Main Effect 2.15 a 2.02 a 1.73 b 1.69 bc 1.52 c 1.48 cd 1.37 d
Saddle Grafts G.41 MM.106 B.9 G.935 G.11 M.9-NIC 29 EMLA 26 G.214 Main Effect Scilate 0.75 0.68 0.96 0.82 0.88 0.56 0.85 0.72 0.78 a Fuji 0.93 0.98 0.88 0.93 0.82 0.76 0.67 0.23 0.78 ab Pink Lady 0.97 0.70 0.69 0.76 0.75 0.77 0.63 0.60 0.74 ab Gala 0.89 1.00 0.77 0.74 0.65 0.61 0.52 0.67 0.73 ab Honeycrisp 0.79 0.90 0.64 0.63 0.83 0.74 0.70 0.60 0.73 ab McIntosh 0.84 0.74 0.67 0.71 0.65 0.68 0.53 0.58 0.68 b Main Effect 0.86 a 0.84 a 0.77 ab 0.76 ab 0.76 ab 0.69 bc 0.65 cd 0.57 d
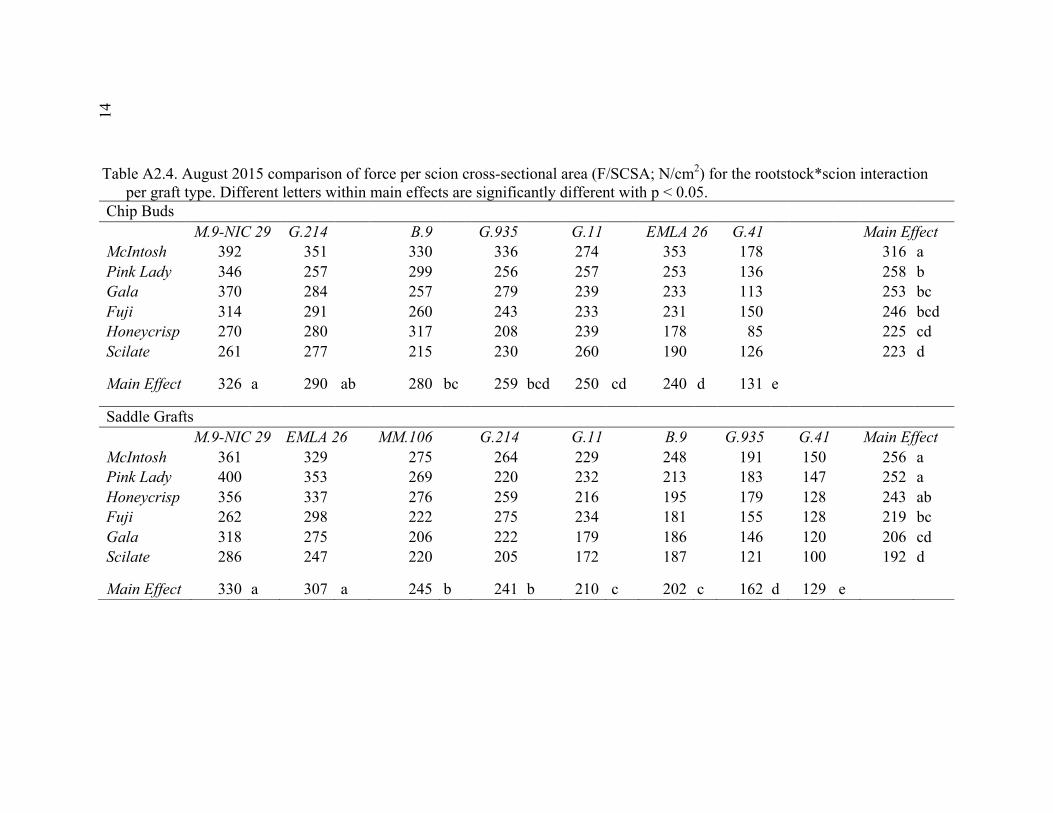
14 6
Table A2.4. August 2015 comparison of force per scion cross-sectional area (F/SCSA; N/cm2) for the rootstock*scion interaction per graft type. Different letters within main effects are significantly different with p < 0.05. Chip Buds M.9-NIC 29 G.214 B.9 G.935 G.11 EMLA 26 G.41 Main Effect McIntosh 392 351 330 336 274 353 178 316 a Pink Lady 346 257 299 256 257 253 136 258 b Gala 370 284 257 279 239 233 113 253 bc Fuji 314 291 260 243 233 231 150 246 bcd Honeycrisp 270 280 317 208 239 178 85 225 cd Scilate 261 277 215 230 260 190 126 223 d Main Effect 326 a 290 ab 280 bc 259 bcd 250 cd 240 d 131 e
Saddle Grafts M.9-NIC 29 EMLA 26 MM.106 G.214 G.11 B.9 G.935 G.41 Main Effect McIntosh 361 329 275 264 229 248 191 150 256 a Pink Lady 400 353 269 220 232 213 183 147 252 a Honeycrisp 356 337 276 259 216 195 179 128 243 ab Fuji 262 298 222 275 234 181 155 128 219 bc Gala 318 275 206 222 179 186 146 120 206 cd Scilate 286 247 220 205 172 187 121 100 192 d Main Effect 330 a 307 a 245 b 241 b 210 c 202 c 162 d 129 e
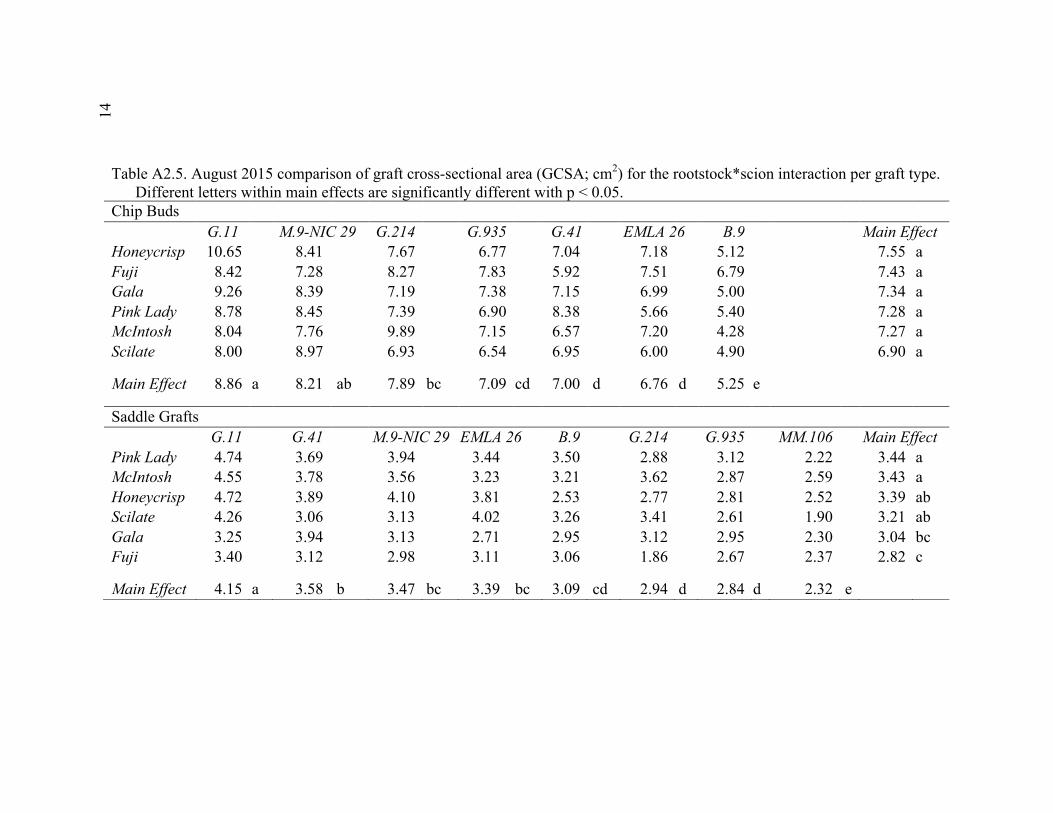
14 7
Table A2.5. August 2015 comparison of graft cross-sectional area (GCSA; cm2) for the rootstock*scion interaction per graft type. Different letters within main effects are significantly different with p < 0.05. Chip Buds G.11 M.9-NIC 29 G.214 G.935 G.41 EMLA 26 B.9 Main Effect Honeycrisp 10.65 8.41 7.67 6.77 7.04 7.18 5.12 7.55 a Fuji 8.42 7.28 8.27 7.83 5.92 7.51 6.79 7.43 a Gala 9.26 8.39 7.19 7.38 7.15 6.99 5.00 7.34 a Pink Lady 8.78 8.45 7.39 6.90 8.38 5.66 5.40 7.28 a McIntosh 8.04 7.76 9.89 7.15 6.57 7.20 4.28 7.27 a Scilate 8.00 8.97 6.93 6.54 6.95 6.00 4.90 6.90 a Main Effect 8.86 a 8.21 ab 7.89 bc 7.09 cd 7.00 d 6.76 d 5.25 e
Saddle Grafts G.11 G.41 M.9-NIC 29 EMLA 26 B.9 G.214 G.935 MM.106 Main Effect Pink Lady 4.74 3.69 3.94 3.44 3.50 2.88 3.12 2.22 3.44 a McIntosh 4.55 3.78 3.56 3.23 3.21 3.62 2.87 2.59 3.43 a Honeycrisp 4.72 3.89 4.10 3.81 2.53 2.77 2.81 2.52 3.39 ab Scilate 4.26 3.06 3.13 4.02 3.26 3.41 2.61 1.90 3.21 ab Gala 3.25 3.94 3.13 2.71 2.95 3.12 2.95 2.30 3.04 bc Fuji 3.40 3.12 2.98 3.11 3.06 1.86 2.67 2.37 2.82 c Main Effect 4.15 a 3.58 b 3.47 bc 3.39 bc 3.09 cd 2.94 d 2.84 d 2.32 e
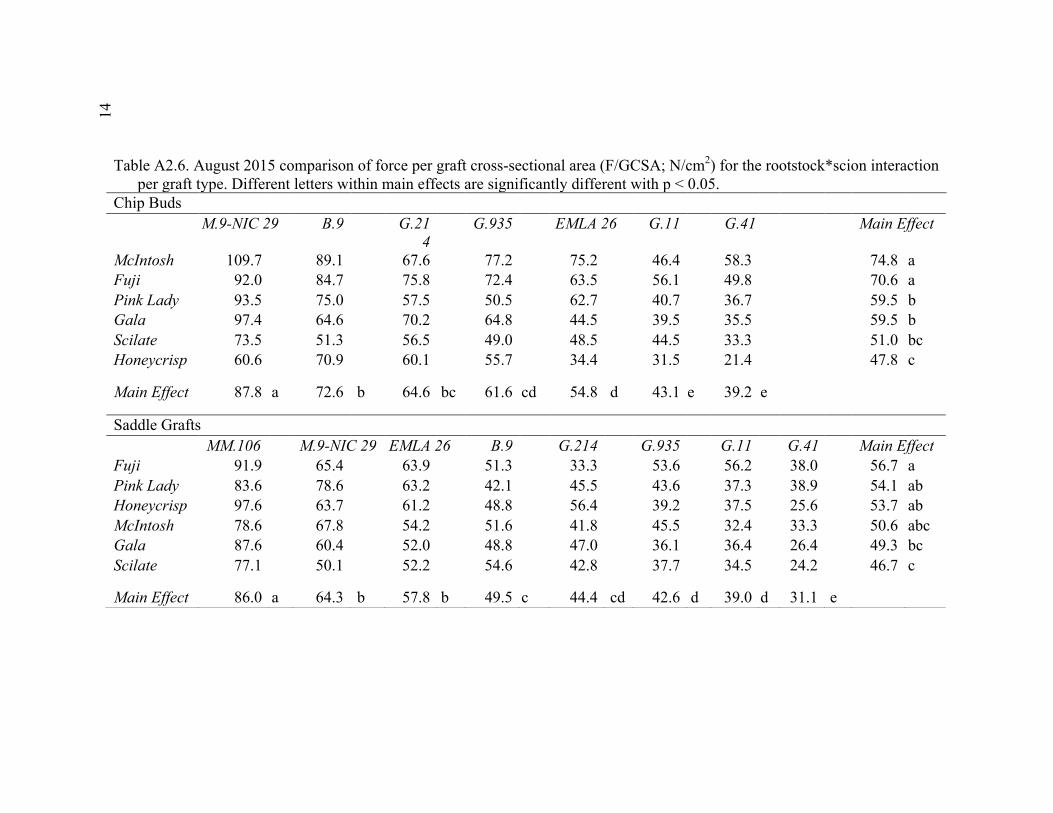
14 8
Table A2.6. August 2015 comparison of force per graft cross-sectional area (F/GCSA; N/cm2) for the rootstock*scion interaction per graft type. Different letters within main effects are significantly different with p < 0.05. Chip Buds M.9-NIC 29 B.9 G.21
4 G.935 EMLA 26 G.11 G.41 Main Effect
McIntosh 109.7 89.1 67.6 77.2 75.2 46.4 58.3 74.8 a Fuji 92.0 84.7 75.8 72.4 63.5 56.1 49.8 70.6 a Pink Lady 93.5 75.0 57.5 50.5 62.7 40.7 36.7 59.5 b Gala 97.4 64.6 70.2 64.8 44.5 39.5 35.5 59.5 b Scilate 73.5 51.3 56.5 49.0 48.5 44.5 33.3 51.0 bc Honeycrisp 60.6 70.9 60.1 55.7 34.4 31.5 21.4 47.8 c Main Effect 87.8 a 72.6 b 64.6 bc 61.6 cd 54.8 d 43.1 e 39.2 e
Saddle Grafts MM.106 M.9-NIC 29 EMLA 26 B.9 G.214 G.935 G.11 G.41 Main Effect Fuji 91.9 65.4 63.9 51.3 33.3 53.6 56.2 38.0 56.7 a Pink Lady 83.6 78.6 63.2 42.1 45.5 43.6 37.3 38.9 54.1 ab Honeycrisp 97.6 63.7 61.2 48.8 56.4 39.2 37.5 25.6 53.7 ab McIntosh 78.6 67.8 54.2 51.6 41.8 45.5 32.4 33.3 50.6 abc Gala 87.6 60.4 52.0 48.8 47.0 36.1 36.4 26.4 49.3 bc Scilate 77.1 50.1 52.2 54.6 42.8 37.7 34.5 24.2 46.7 c Main Effect 86.0 a 64.3 b 57.8 b 49.5 c 44.4 cd 42.6 d 39.0 d 31.1 e
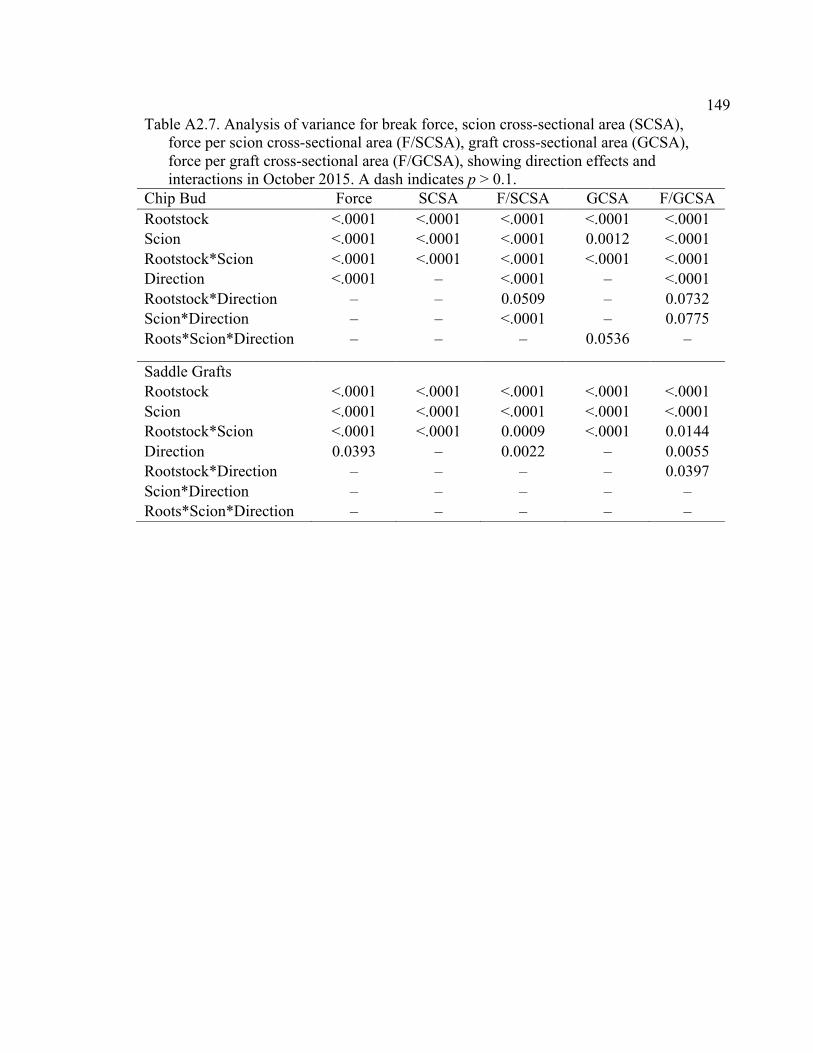
149
Table A2.7. Analysis of variance for break force, scion cross-sectional area (SCSA), force per scion cross-sectional area (F/SCSA), graft cross-sectional area (GCSA), force per graft cross-sectional area (F/GCSA), showing direction effects and interactions in October 2015. A dash indicates p > 0.1. Chip Bud Force SCSA F/SCSA GCSA F/GCSA Rootstock <.0001 <.0001 <.0001 <.0001 <.0001 Scion <.0001 <.0001 <.0001 0.0012 <.0001 Rootstock*Scion <.0001 <.0001 <.0001 <.0001 <.0001 Direction <.0001 – <.0001 – <.0001 Rootstock*Direction – – 0.0509 – 0.0732 Scion*Direction – – <.0001 – 0.0775 Roots*Scion*Direction – – – 0.0536 –
Saddle Grafts Rootstock <.0001 <.0001 <.0001 <.0001 <.0001 Scion <.0001 <.0001 <.0001 <.0001 <.0001 Rootstock*Scion <.0001 <.0001 0.0009 <.0001 0.0144 Direction 0.0393 – 0.0022 – 0.0055 Rootstock*Direction – – – – 0.0397 Scion*Direction – – – – – Roots*Scion*Direction – – – – –
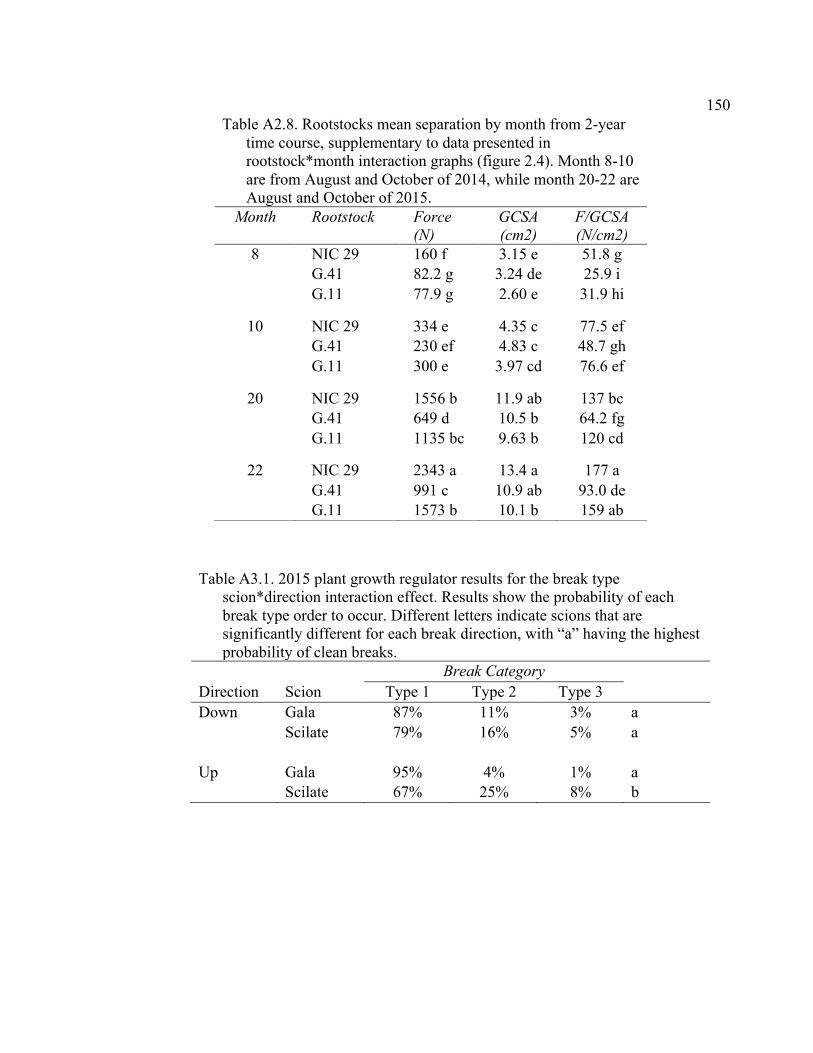
150
Table A2.8. Rootstocks mean separation by month from 2-year time course, supplementary to data presented in rootstock*month interaction graphs (figure 2.4). Month 8-10 are from August and October of 2014, while month 20-22 are August and October of 2015.
Month Rootstock Force (N)
GCSA (cm2)
F/GCSA (N/cm2)
8 NIC 29 160 f 3.15 e 51.8 g G.41 82.2 g 3.24 de 25.9 i G.11 77.9 g 2.60 e 31.9 hi
10 NIC 29 334 e 4.35 c 77.5 ef G.41 230 ef 4.83 c 48.7 gh G.11 300 e 3.97 cd 76.6 ef
20 NIC 29 1556 b 11.9 ab 137 bc G.41 649 d 10.5 b 64.2 fg G.11 1135 bc 9.63 b 120 cd
22 NIC 29 2343 a 13.4 a 177 a G.41 991 c 10.9 ab 93.0 de G.11 1573 b 10.1 b 159 ab
Table A3.1. 2015 plant growth regulator results for the break type scion*direction interaction effect. Results show the probability of each break type order to occur. Different letters indicate scions that are significantly different for each break direction, with “a” having the highest probability of clean breaks. Break Category Direction Scion Type 1 Type 2 Type 3 Down Gala 87% 11% 3% a Scilate 79% 16% 5% a Up Gala 95% 4% 1% a Scilate 67% 25% 8% b
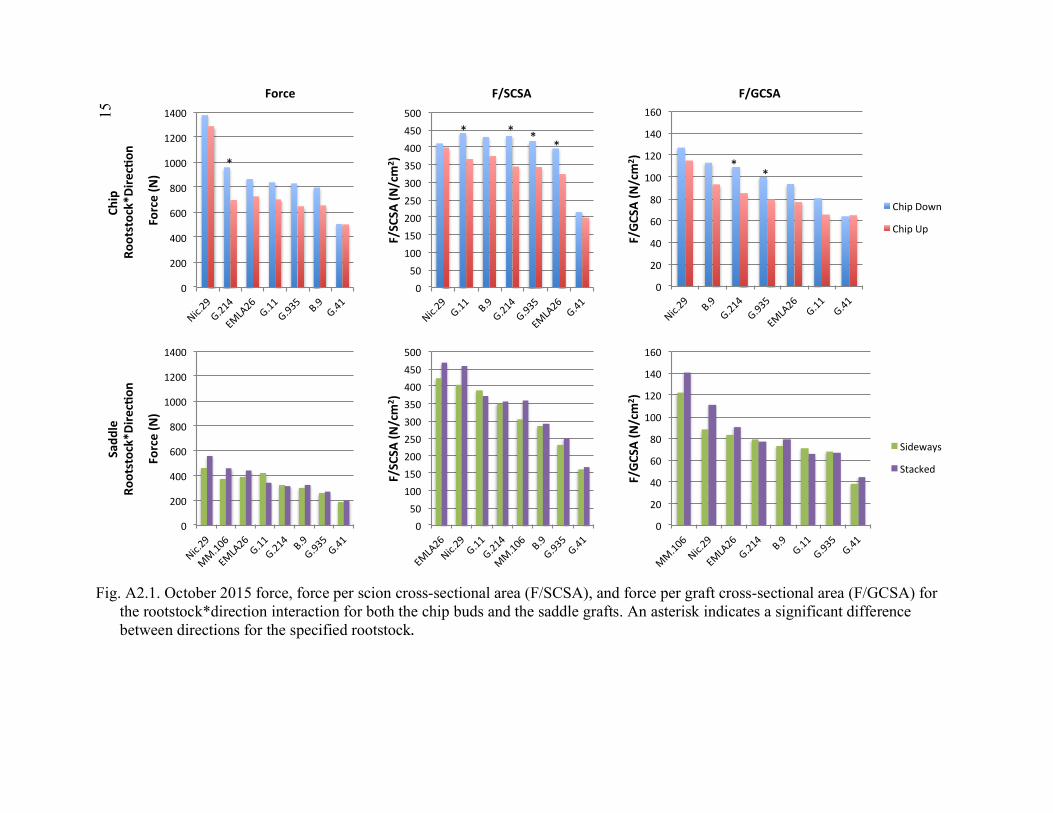
15 1
0
200
400
600
800
1000
1200
1400
Nic.29
G.214
EMLA26G.11
G.935
B.9G.41
Force(N)
050100150200250300350400450500
Nic.29G.11 B.9
G.214
G.935
EMLA26G.41
F/SCSA
(N/cm
2 )
0
20
40
60
80
100
120
140
160
Nic.29
B.9
G.214
G.935
EMLA26
G.11
G.41
F/GC
SA(N
/cm
2 )
ChipDown
ChipUp
0
200
400
600
800
1000
1200
1400
Nic.29
MM.106
EMLA26G.11
G.214B.9
G.935G.41
Force(N)
050100150200250300350400450500
EMLA26
Nic.29G.11
G.214
MM.106 B.9
G.935G.41
F/SCSA
(N/cm
2 )
0
20
40
60
80
100
120
140
160
MM.106
Nic.29
EMLA26
G.214
B.9G.11
G.935G.41
F/GC
SA(N
/cm
2 )
Sideways
Stacked
Force F/SCSA F/GCSACh
ip
Rootstock*Direc:on
Sadd
le
Rootstock*Direc:on
*
* * **
**
Fig. A2.1. October 2015 force, force per scion cross-sectional area (F/SCSA), and force per graft cross-sectional area (F/GCSA) for the rootstock*direction interaction for both the chip buds and the saddle grafts. An asterisk indicates a significant difference between directions for the specified rootstock.
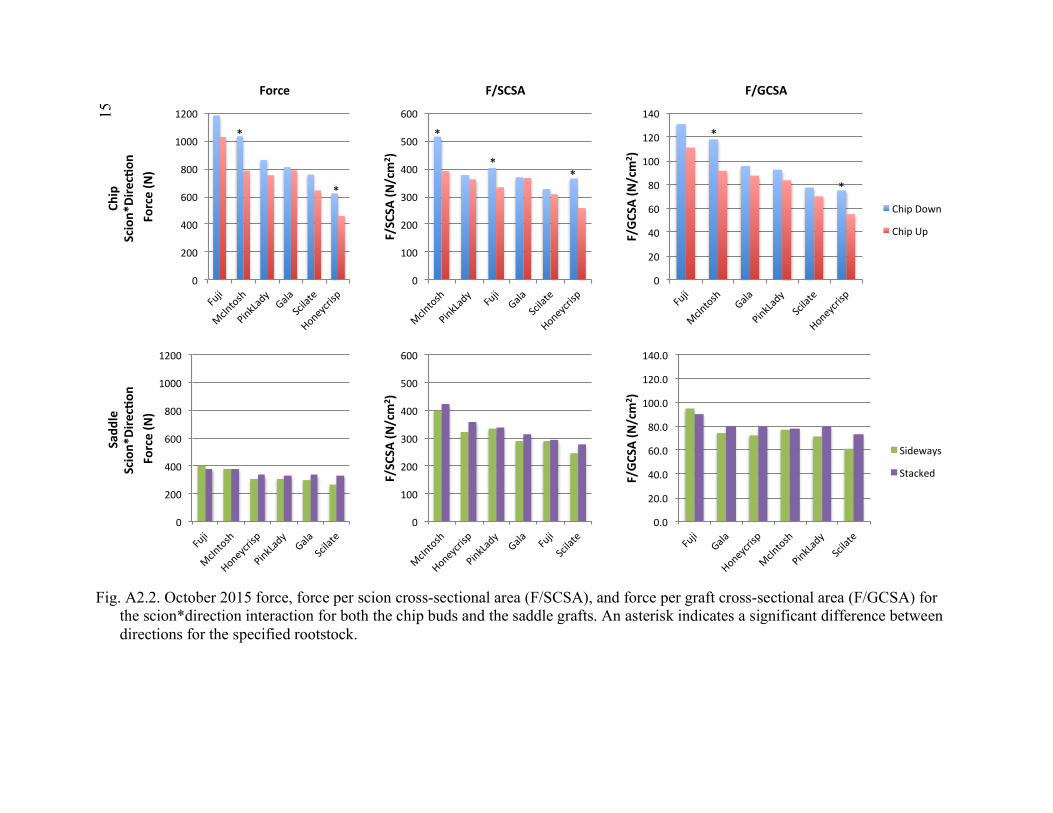
15 2
0
200
400
600
800
1000
1200
Fuji
McIntosh
PinkLady
Gala
Scilate
Honeycrisp
Force(N)
0
100
200
300
400
500
600
McIntosh
PinkLady
Fuji
Gala
Scilate
Honeycrisp
F/SCSA
(N/cm
2 )
0
20
40
60
80
100
120
140
Fuji
McIntosh
Gala
PinkLady
Scilate
Honeycrisp
F/GC
SA(N
/cm
2 )
ChipDown
ChipUp
0
200
400
600
800
1000
1200
Fuji
McIntosh
Honeycrisp
PinkLady
Gala
Scilate
Force(N)
0
100
200
300
400
500
600
McIntosh
Honeycrisp
PinkLady
Gala Fu
ji
Scilate
F/SCSA
(N/cm
2 )
0.0
20.0
40.0
60.0
80.0
100.0
120.0
140.0
Fuji
Gala
Honeycrisp
McIntosh
PinkLady
Scilate
F/GC
SA(N
/cm
2 )
Sideways
Stacked
Force F/SCSA F/GCSA
*
*
*
**
*
*
Chip
Scion*
Direc7on
Sadd
le
Scion*
Direc7on
Fig. A2.2. October 2015 force, force per scion cross-sectional area (F/SCSA), and force per graft cross-sectional area (F/GCSA) for the scion*direction interaction for both the chip buds and the saddle grafts. An asterisk indicates a significant difference between directions for the specified rootstock.