Embed Size (px)
Citation preview

1
The Effects of Rice Export Policy on Regional Income, Prices
and the Poor: A ‘Bottom-up’ Regional CGE model for Vietnam
Tom Kompas* Crawford School of Economics and Government
Australian National University
Pham Van Ha Academy of Finance
Tuong Nhu Che
Australian Bureau of Agricultural and Resource Economics
Nguyen Thi Minh Hoa Centre for Analysis and Forecasting
Bui Trinh
General Statistics Office
April 2010
A report prepared for the ‘Risks facing the Rural Poor in Vietnam’ project for the Poverty Assessment Report in Vietnam conducted by the Centre for Analysis and Forecasting (CAF), Vietnam Academy of Social Sciences. Funding from the ABD, the World Bank, AusAID and the Ford Foundation is gratefully acknowledged. Thanks to Thang Nguyen and participants at the Workshop on Poverty Assessment at CAF in Hanoi for helpful comments.
Abstract: A ‘bottom up’ regional CGE model for Vietnam is constructed for 28 commodities and 8 regions (using a GSO input-output table for 2005). The model is used to analyze the recent dramatic increases in the world price of rice on the regional economy of Vietnam, and the Vietnamese policy response to limit exports. Although results show limited ‘pro-poor’ outcomes, the CGE model and a micro-simulation (using 2006 VHLSS data) show that recent rice export quotas resulted in falls total rural savings as measured by the difference in total income less total production cost and consumption of rice. *Contact author: Tom Kompas, Crawford School of Economics and Government, Crawford Building (#132), Australian National University, Canberra, ACT, 2601, Australia. Email: [email protected], Phone: +61 2 6125 4765, Fax: +61 2 61 2 6125 5448.
Pub
lic D
iscl
osur
e A
utho
rized
Pub
lic D
iscl
osur
e A
utho
rized
Pub
lic D
iscl
osur
e A
utho
rized
Pub
lic D
iscl
osur
e A
utho
rized
Pub
lic D
iscl
osur
e A
utho
rized
Pub
lic D
iscl
osur
e A
utho
rized
Pub
lic D
iscl
osur
e A
utho
rized
Pub
lic D
iscl
osur
e A
utho
rized

2
1. Introduction The year 2008 witnessed rapid increases in the prices of many commodities in the
world, including dramatic increases in the price of rice. Rising from US$ 400 per ton
in January 2008 to roughly US$ 1000 per ton in May 2008, movements in
international rice prices caused considerable concern in both import and export
countries. Some rice exporters, including Vietnam, placed an export ban on rice to
ensure continued low domestic prices for rice and domestic food security.
As the second biggest rice exporter in the world, an increase in world rice prices is
potentially beneficial to Vietnam. However, rice also plays an important role in the
living standards of Vietnamese households, both as producers and consumers. Rice
contributes nearly 69 percent of calorie intake in Vietnam as a whole, and 71 percent
in rural areas and 61 percent in urban areas (Vu and Glewwe, 2008). On the other
hand, half of the households produce rice (Vu and Glewwe, 2008), which makes it
hard to generalize on the relative benefits of increases in the price of rice. Net
producers clearly benefit, but those that mostly consume rice are worse off.
The rice export ban applied in Vietnam generated considerable debate among various
stakeholders. We contribute to this debate by simulating the export ban together with
three other policy scenarios in a ‘bottom-up’ eight-region Computable General
Equilibrium Model (CGE) model of Vietnam, with data from the 2005 GSO input-
output table. We then simulate the results on individual households using the 2006
Vietnamese Household Living Standard Survey (VHLSS 2006). Our results show that
although there were limited ‘pro-poor’ outcomes, the overall effect of the rice export
quotas resulted in falls total rural savings as measured by the difference in total
income less total production cost and consumption of rice.
The structure of the paper is as follows. Section 2 provides the background and
reviews existing studies in Vietnam that have tried to estimate the welfare impact of
government policies in rice market. Section 3 describes the methods and data. The
results from the CGE model and micro-simulation on household data are discussed in
section 4. Section 5 offer concluding remarks.

3
Background Vietnam has made remarkable progress in the rice production in the last thirty years,
moving from being a large importer of rice from 1976-80, to now the second largest
exporter of rice in the world. About 7.5 million hectares of land is under rice
cultivation, producing approximately 39 million tonnes a year. More than 50% of the
rice output is produced by the Mekong River Delta and more than 90% of exported
rice comes from this region. As recent as the year 2008, Vietnam rice exports reached
5 million tonnes of rice with export revenue of about 3 billion USD, contributing
roughly 3 per cent to the GDP of Vietnam.
There have been many policy changes over the last thirty years in the rice sector.
Most important are the pervasive land and market reforms in agriculture, which
moved the system of rice production from commune-based public ownership and
control to one with effective private property rights over land and farm assets,
competitive domestic markets and individual decision making over a wide range of
agricultural activities (Kompas et al. 2009). The outstanding successes in increasing
rice production aside, the Vietnamese rice market is characterized by many
constraints and concerns. Paddy markets, for example, especially between the North
and the South, are not fully integrated (Baulch et al, 2008). Although the strict quota
regime on rice export was removed in 2001, the government still monitors rice
exports by setting the export target for each year based on the production of the
previous year, with adjustment if needed during the year. There are also a number of
bureaucratic procedures that export enterprises need to go through in order to export
rice, such as receiving price approval from the Vietnam Food Association on export
prices on all export contracts.
In the year 2008, the Vietnamese government faced a significant challenge to its
practice of monitoring and controlling rice exports. With rapid increases in
international rice prices from US$ 400 in January 2008 to roughly US$ 600 in March,
and an overall high inflation rate in the domestic economy for food prices (18.9
percent in 2007 and 14.5 percent in the first three months of 2008), the Government of
Vietnam banned the signing of new export contracts from the 25th March until the
4
end of May 2008. In addition, in July 21, 2008, an export tax was imposed on rice
sold at $800 a tonne or more. When the tax went into effect on Aug. 15, prices for
Vietnamese ‘5% broken rice’, the highest quality grain among the country's common
grades for export, had fallen to $550 per tonne, free-on-board basis. The export tax
was subsequently abolished on December 19, 2008 to help boost domestic supply.
A temporarily ban on rice exports versus full trade liberalization generates an
essential trade-off. On one hand, liberalization leads to further increases in domestic
rice prices, which result in increases in input costs for all producers since wages,
especially unskilled labour and labour involved in small manufacturing, are often
correlated with the price of rice. The cost of rice to consumers also increases, of
course. On the other hand, increases in rice prices increase profits for net rice
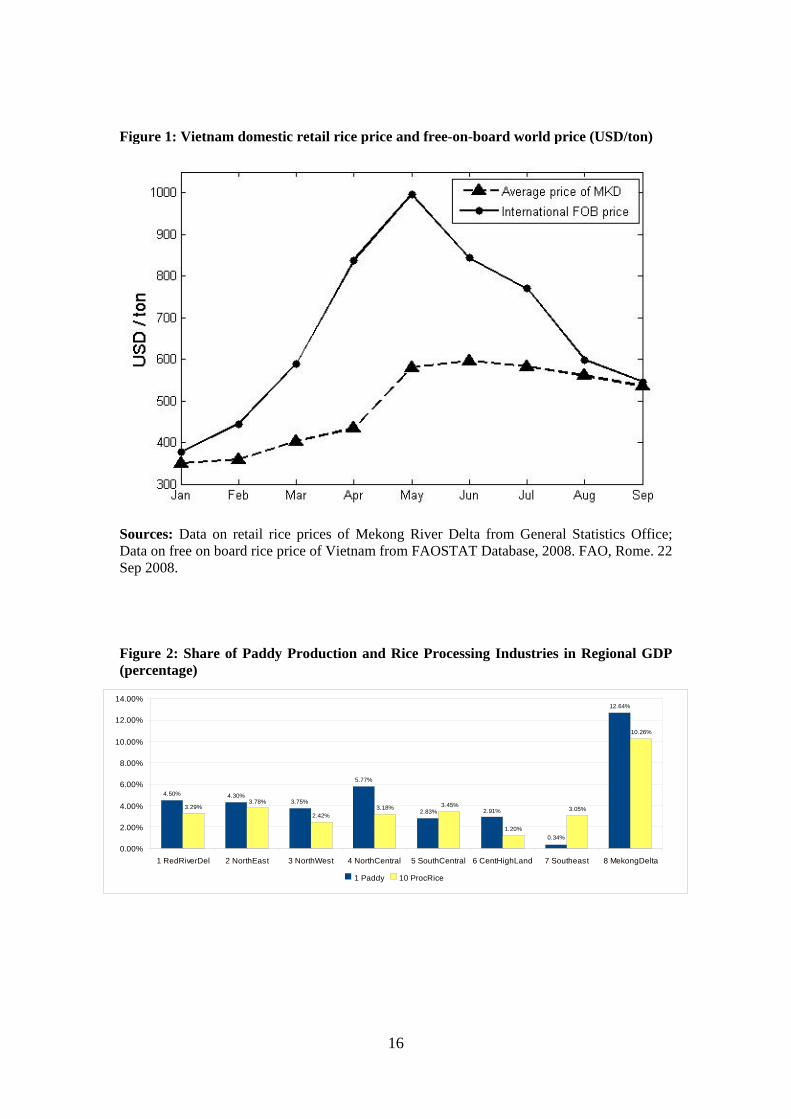
producers, many of whom are the poor. As seen in Figure 1 much of the potential gain
from the rice price surge was foregone as the ban on export was in effect from March
until the end of May 2008.
A number of researchers have explored the impact of trade liberalization in the rice
sector on household welfare. Minot and Goletti (1998) use an aggregate multi-market
spatial equilibrium model, which employs data from the International Food Policy
Research Institute surveys in 1994-1995, in combination with the survey data from the
1992/1993 Vietnamese Living Standard Survey, to show that although rice export
liberalization would increase rice prices and exacerbate regional inequality, it would
also increase average real income and slightly reduce the incidence and severity of
poverty. Nielson (2003) uses a General Trade Policy Analysis Project (GTAP) model,
with data from the Vietnam Input Output Table 1997, and shows that an export quota
has been a binding and restrictive policy that has kept both Vietnamese rice
production and exports well below their maximum potential amounts.
Although the rice export quota has been removed since 2001, we are not aware of any
published studies that measure the effect of export policy in Vietnam and its welfare
impact on households, apart from our study. Most of the studies on impact of trade
liberalization focus on Vietnam’s trade agreements and accession to the World Trade
Organization. Using a ‘bottom-up’ eight-region Computable General Equilibrium
Model (CGE) with data from the input output table for the year 2005, we simulate the
5
impact of an export ban, with and without full rice domestic market integration,
together with two other policy scenarios, which include free trade and a trade tariff.
We then use those results generated from the CGE model and combine them with the
2006 Vietnamese Household Living Standard Survey (VHLSS2006) to simulate and
measure the welfare impact of those policy scenarios on households who are both rice
producers and consumers.
2. Methodology
2.1 ‘Bottom-up’ Regional CGE model for Vietnam The ‘bottom-up’ multi-regional General Equilibrium Model (CGE) for Vietnamese
economy used in this paper is based on an ORANI model for Australian Economy
(Horridge 2003). To have ‘bottom-up’ and multi-regional characteristics, the General
Equilibrium Model for Vietnamese economy is a combination of eight ORANI
models (representing 8 regions in Vietnam), with full regional dimension.
The model has 28 industries (I) which produce 28 commodities (C) (see the
Appendix); 8 regions (R) with four sectors, which include households (urban and
rural), the government, investors and the foreign sector (exports and imports). Labour
is classified as skilled and unskilled labour. The taxes in the model are comprised of
excise, value-added taxes and duties. The margins include wholesale and retail
charges and transportation charges.
The model has seven structural equations. The production equation is assumed to
exhibit a Constant Elasticity of Substitution (CES) specification in labour (CES in
skilled and unskilled), land and capital to generate Primary Inputs; CES in goods from
regions to generate Intermediate Products; and Leontief in Intermediate Products and
Primary Factors to generate output. We assume that this is short-run model with fixed
capital stocks as our analysis focuses on the short-run impact of the temporary rice
export ban.
The household demand equation is also CES in two composite commodities, made up
of two sets of 28 goods from each region and final consumption goods, taken
separately, and combined as Stone-Geary in utility. Parameter values for household

6
demand are drawn from the Vietnamese Monash (VIPAG) model. The investment
demand equation is CES in two composite commodities and combined as Leontief in
capital good outputs (see Appendix 4). Export demand is assumed to be specified as
follows:
where Export is the real export volume of good C in region R; QF and PF are the
quantity and price shift parameters of good C in region R; P is the export price;
EXP_ELAST(c,r) is the elasticity of export demand of good C in region R; and e is the
exchange rate. For the export demand schedule to be downward slopping,
EXP_ELAST(c,r) must be negative in the model.
Government expenditure and composition is held fixed as is the demand for
inventories. Margins (with the exception of inventory demand) are given and the usual
market clearing conditions are imposed.
2.2. Micro-simulation
As the household can be a consumer or producer of rice, or both, any change in the
price of rice affects not only consumption but also income and production. To
measure the impact of various policy scenarios, we use a metric of ‘rice household
savings’ from rice production as an indicator of the household welfare, given by the
difference between revenue and the cost of rice production, less the consumption of
rice. All terms are in values. Household savings before the price shock is used as the
benchmark and compared across all policy scenarios modelled in the CGE
framework. The household is considered to be ‘better off’ if it has more savings after
a resulting price shock.
2.3. Data This paper uses the 8-region Inter-regional Input Output table (2005) for Vietnam’s
economy (VIRIO 2005) to construct the CGE model. It covers eight regions including
the Red River Delta, the North East, the North West, the North Central, the South
Central, the Central Highlands, the Southeast, and the Mekong Delta. The VIRIO
(2005) has 28 industries (I) which produce 28 commodities (C) which include Paddy,
_ ( , )( , )( , ) ( , )
( , )
EXP ELAST C RP C RExport C R QF C R
e PF C R
= ∗

7
Other crops, Livestock and Poultry, Forestry, Fish Farming, Fisheries, Oil and Gas,
Mining, Processed Seafood, Processed Rice, Other Agricultural Processing, Textiles,
Paper, Wood, Rubber, Non-Metallic Mineral Products, Transport Equipment, Metal
Products, Other Manufacturing, Electricity and Water, Construction, Transport
(Margin), Communication, Trade (Margin), Financial services, Public Administration,
Hotels and Restaurants, and Other Services.
For the simulation exercise, the Vietnam Household Living Standard Survey in 2006
(VHLSS 2006) is used to simulate various shocks generated from the Computable
General Equilibrium Model (CGE model). There are two reasons for choosing the
2006 VHLSS for this micro simulation exercise. First, this is the latest Household
Living Standard Survey. Second, the survey time, which was in May and September
of 2006, is the closest to the time frame of the Intra-regional Input Output Tables
2005 (IO Tables 2005) for Vietnam, also the latest or most recent IO Tables. There is
thus strong comparability between the macro and micro data.
The 2006 VHLSS was carried out by the General Statistics Office in Vietnam. The
sample of 2006 VHLSS was selected to represent the whole country (urban/rural), 8
regions (urban/rural), and provinces and cities. A total of 45,945 household interviews
were conducted for the 2006 VHLSS, and income and expenditure data were gathered
for 9,189 of them, or roughly 0.05 per cent of all households in Vietnam (GSO 2006).
This paper relies on income and expenditure data of these 9,189 households as the
income data of the remaining households is not yet released to public. In this report,
we use the term ‘2006 VHLSS’ to refer to the sample of 9,189 households.
2.4. Policy scenario design The key exogenous shock in the model is a 30 percent increase in rice export prices as
the result of an upward shift of the world demand schedule for rice. This roughly
corresponds to the movement in world rice prices. Four policy scenarios are
implemented to trace the effect of the shock and its impact on Vietnam’s economy. In
the first scenario, Vietnam allows free exports so the domestic prices go up in parallel
with the world price. In the second scenario, Vietnam sets an administrative rice
export limit, banning all additional rice exports for a certain date, which helps control
8
the increase in domestic prices. This was the actual policy action taken by the
Government of Vietnam in March 2008.
The third policy scenario is trade but with export limits. In this case, the government
fails to keep the domestic rice price low as the market is not fully integrated and rice
from surplus areas does not reach the areas with supply shortages. This scenario is
designed as having an administrative rice export limit and a producer tax of 15 per
cent. In a sense, this is case closest to reality as the Government of Vietnam banned
the export of rice for a few months and, since the Vietnamese domestic market is
fragmented, rice did not shift from the rice-surplus region of the Mekong River Delta
to other regions. The last scenario is the case where the Government of Vietnam
imposes a 5 percent tariff on rice exports.
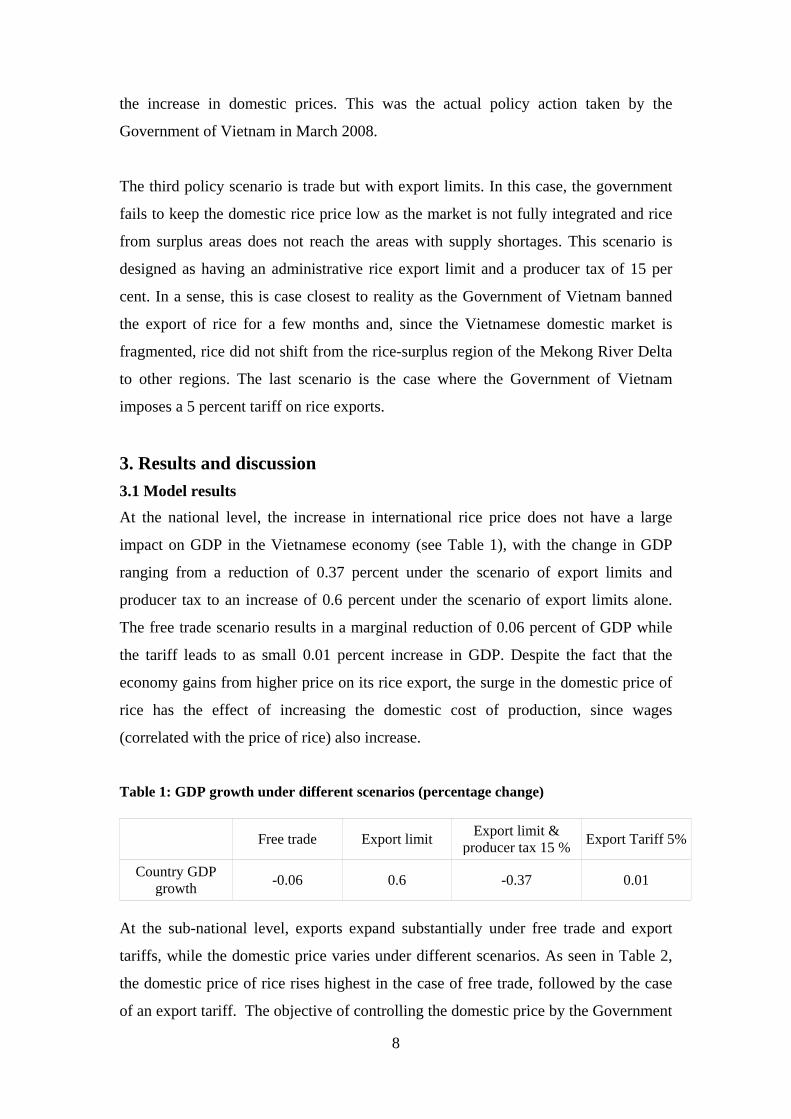
3. Results and discussion 3.1 Model results At the national level, the increase in international rice price does not have a large
impact on GDP in the Vietnamese economy (see Table 1), with the change in GDP
ranging from a reduction of 0.37 percent under the scenario of export limits and
producer tax to an increase of 0.6 percent under the scenario of export limits alone.
The free trade scenario results in a marginal reduction of 0.06 percent of GDP while
the tariff leads to as small 0.01 percent increase in GDP. Despite the fact that the
economy gains from higher price on its rice export, the surge in the domestic price of
rice has the effect of increasing the domestic cost of production, since wages
(correlated with the price of rice) also increase.
Table 1: GDP growth under different scenarios (percentage change) Free trade Export limit Export limit &
producer tax 15 % Export Tariff 5%
Country GDP growth -0.06 0.6 -0.37 0.01
At the sub-national level, exports expand substantially under free trade and export
tariffs, while the domestic price varies under different scenarios. As seen in Table 2,
the domestic price of rice rises highest in the case of free trade, followed by the case
of an export tariff. The objective of controlling the domestic price by the Government

9
of Vietnam can be best achieved in the case of export limit. However, as the domestic
market is likely fragmented (see Baulch et al., 2007), the scenario of export limit and
producer tax is more likely to occur.
Table 2: Percentage Change in Regional Domestic Rice Prices by Scenario
Regions Free trade Export limit Export limit & producer tax 15 % Export Tariff 5%
Red River Delta 27.64 -7.32 12.32 21.58
North East 23.94 -4.70 13.62 18.06
North West 26.10 -4.02 13.68 20.93
North Central Coast 26.16 -4.45 13.57 20.21
South Central Coast 24.52 -4.14 13.84 18.64
Central Highland 26.78 -5.15 12.70 21.69
South East 32.02 -18.27 6.49 25.75
Mekong River Delta 34.24 -16.8 6.41 27.97 The gain in regional GDP from the international rice price surge does not spread
evenly across the regions (see Table 3). The Mekong River Delta ranks the first in
benefiting from the rice price rise with its GDP increasing most, or shrinking least in
all scenarios. Despite being the country's second largest rice producer, the South East
region does not have a comparative advantage in rice production, and higher rice
prices do not affect this region greatly. Among the policy scenarios, an export tariff
appears to be the least distorting with regional GDP growth moving in line with the
case of free trade. The export limit and producer tax hurts all regions while the export
limit narrows the regional gap in GDP growth, harming mostly the Mekong River
Delta and favouring the North West, Central Highlands and South East regions.
Table 3: Regional effect of price change on GDP by scenario (percentage change)
Regions Free trade Export limit Export limit & producer tax 15 % Export Tariff 5%
Red River Delta 0.05 0.41 -0.62 0.06
North East -0.25 0.26 -0.72 -0.22
North West -0.91 0.78 -0.89 -0.72
North Central Coast 0.12 0.29 -0.59 0.1
South Central Coast -0.25 0.15 -0.56 -0.18
Central Highland -1.3 0.82 -0.54 -1.06

10
South East -0.88 0.6 -0.22 -0.66
Mekong River Delta 2.17 1.07 -0.18 1.96 The sub-national distribution pattern can be explained by two main regional features.
First, is the share of paddy and processed rice in regional GDP. As seen in Figure 2,
all regions except the Northwest and Central Highlands ‘export’ rice, with the
Mekong Delta by far the largest international exporter. While the Red River Delta and
the North Central Coast regions also substantially benefit from the rice price increase,
the South East region is worse off as its paddy and processed rice share in its GDP is
the lowest among all regions.
Second, the industrial employment structure also matters (see tables 4a and 4b).
Because the wage rate in the model is indexed with the consumer price index, the
nominal wage increases in all regions with an increase in the price of rice. Therefore,
industries with higher output prices such as Paddy, Processed Rice, or Live Poultry
can increase labour employment and hence achieve higher output. On the other hand,
regions with a lower share of those industries will have lower average labour
employment.
Table 4a: The Effect of a Rice Price Increase on Regional Wages by Scenario (percentage change)
Regions Free trade Export limit Export limit & producer tax 15% Export Tariff 5%
Red River Delta 4.93 -1.06 0.99 3.91
North East 4.74 -1.26 1.17 3.68
North West 6.5 -1.9 1.59 5.25
North Central Coast 5.12 -1.09 1.1 4.05
South Central Coast 3.17 -0.43 0.95 2.44
Central Highland 4.5 -1.6 0.82 3.68
South East 2.31 -0.91 0.36 1.87
Mekong River Delta 8.37 -1.33 0.75 6.91
11
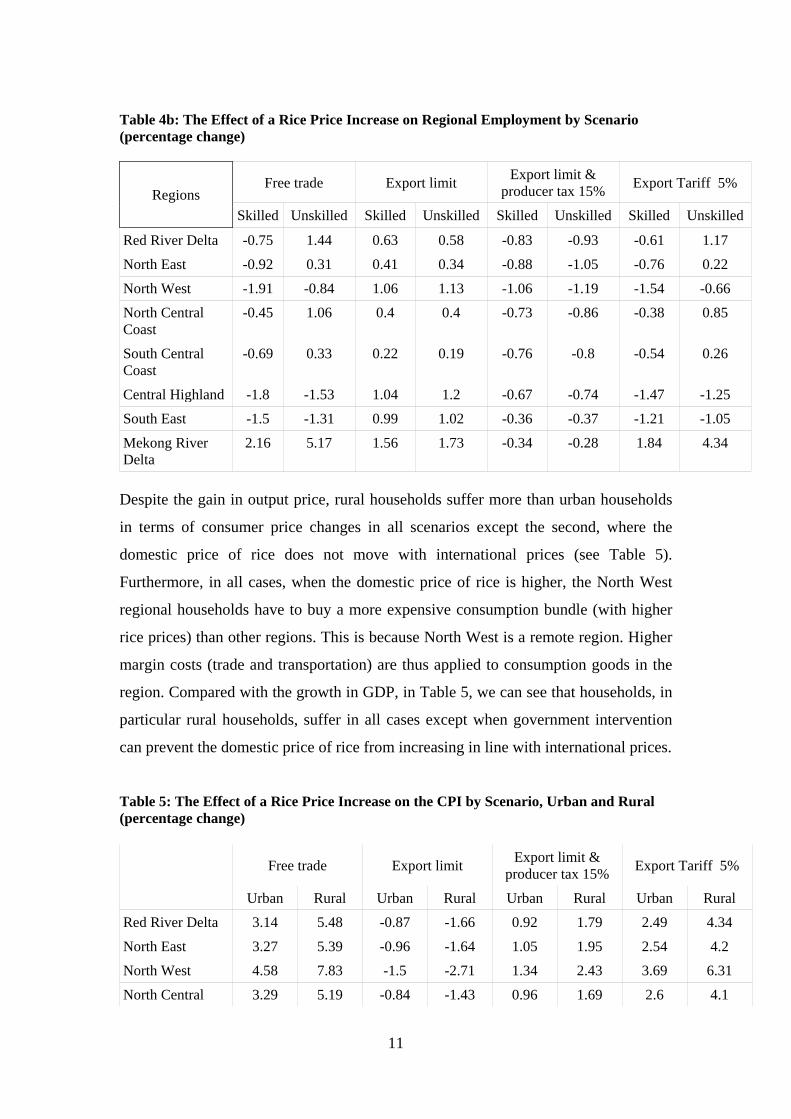
Table 4b: The Effect of a Rice Price Increase on Regional Employment by Scenario (percentage change)
Regions Free trade Export limit Export limit &
producer tax 15% Export Tariff 5%
Skilled Unskilled Skilled Unskilled Skilled Unskilled Skilled Unskilled
Red River Delta -0.75 1.44 0.63 0.58 -0.83 -0.93 -0.61 1.17
North East -0.92 0.31 0.41 0.34 -0.88 -1.05 -0.76 0.22
North West -1.91 -0.84 1.06 1.13 -1.06 -1.19 -1.54 -0.66
North Central Coast
-0.45 1.06 0.4 0.4 -0.73 -0.86 -0.38 0.85
South Central Coast
-0.69 0.33 0.22 0.19 -0.76 -0.8 -0.54 0.26
Central Highland -1.8 -1.53 1.04 1.2 -0.67 -0.74 -1.47 -1.25
South East -1.5 -1.31 0.99 1.02 -0.36 -0.37 -1.21 -1.05
Mekong River Delta
2.16 5.17 1.56 1.73 -0.34 -0.28 1.84 4.34
Despite the gain in output price, rural households suffer more than urban households
in terms of consumer price changes in all scenarios except the second, where the
domestic price of rice does not move with international prices (see Table 5).
Furthermore, in all cases, when the domestic price of rice is higher, the North West
regional households have to buy a more expensive consumption bundle (with higher
rice prices) than other regions. This is because North West is a remote region. Higher
margin costs (trade and transportation) are thus applied to consumption goods in the
region. Compared with the growth in GDP, in Table 5, we can see that households, in
particular rural households, suffer in all cases except when government intervention
can prevent the domestic price of rice from increasing in line with international prices.
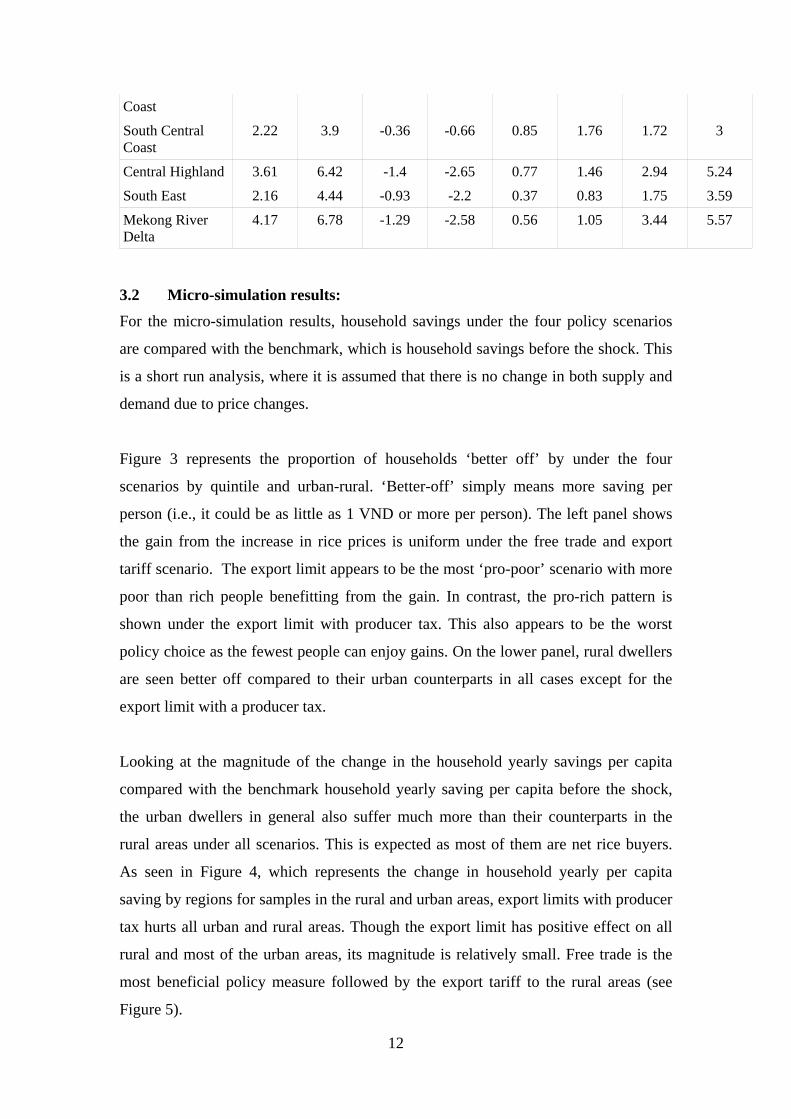
Table 5: The Effect of a Rice Price Increase on the CPI by Scenario, Urban and Rural (percentage change) Free trade Export limit Export limit &
producer tax 15% Export Tariff 5%
Urban Rural Urban Rural Urban Rural Urban Rural
Red River Delta 3.14 5.48 -0.87 -1.66 0.92 1.79 2.49 4.34
North East 3.27 5.39 -0.96 -1.64 1.05 1.95 2.54 4.2
North West 4.58 7.83 -1.5 -2.71 1.34 2.43 3.69 6.31
North Central 3.29 5.19 -0.84 -1.43 0.96 1.69 2.6 4.1
12
Coast
South Central Coast
2.22 3.9 -0.36 -0.66 0.85 1.76 1.72 3
Central Highland 3.61 6.42 -1.4 -2.65 0.77 1.46 2.94 5.24
South East 2.16 4.44 -0.93 -2.2 0.37 0.83 1.75 3.59
Mekong River Delta
4.17 6.78 -1.29 -2.58 0.56 1.05 3.44 5.57
3.2 Micro-simulation results: For the micro-simulation results, household savings under the four policy scenarios
are compared with the benchmark, which is household savings before the shock. This
is a short run analysis, where it is assumed that there is no change in both supply and
demand due to price changes.
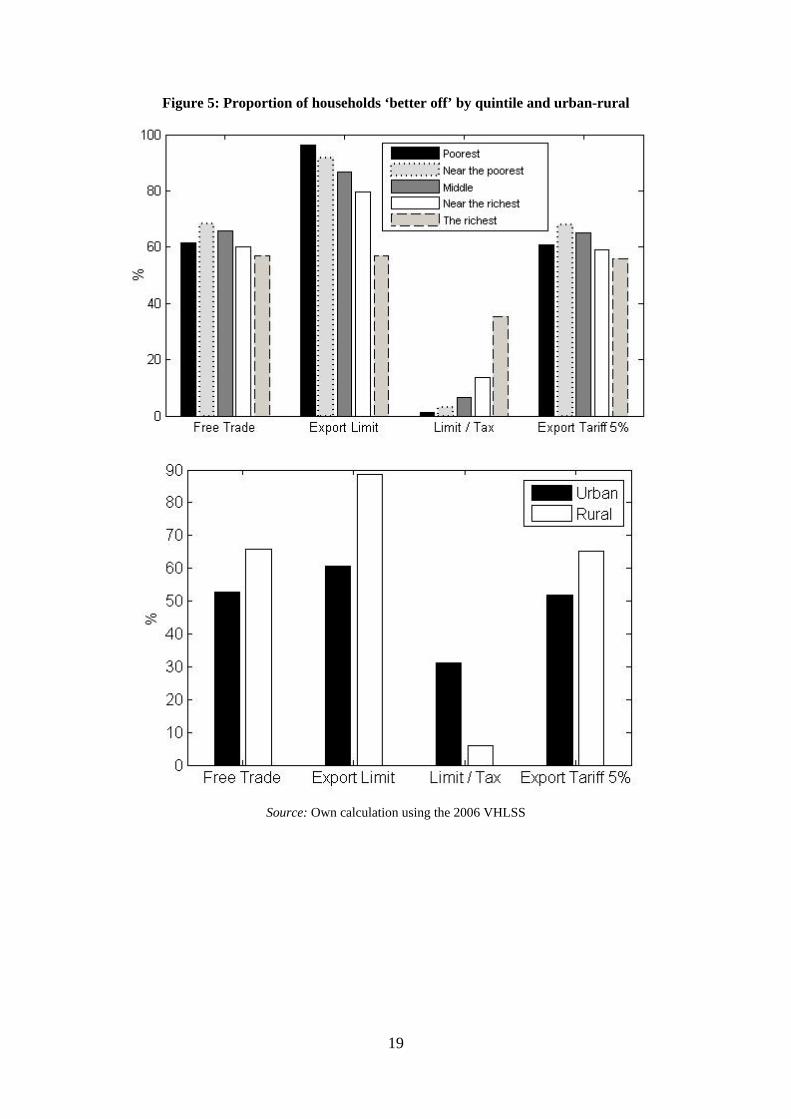
Figure 3 represents the proportion of households ‘better off’ by under the four
scenarios by quintile and urban-rural. ‘Better-off’ simply means more saving per
person (i.e., it could be as little as 1 VND or more per person). The left panel shows
the gain from the increase in rice prices is uniform under the free trade and export
tariff scenario. The export limit appears to be the most ‘pro-poor’ scenario with more
poor than rich people benefitting from the gain. In contrast, the pro-rich pattern is
shown under the export limit with producer tax. This also appears to be the worst
policy choice as the fewest people can enjoy gains. On the lower panel, rural dwellers
are seen better off compared to their urban counterparts in all cases except for the
export limit with a producer tax.
Looking at the magnitude of the change in the household yearly savings per capita
compared with the benchmark household yearly saving per capita before the shock,
the urban dwellers in general also suffer much more than their counterparts in the
rural areas under all scenarios. This is expected as most of them are net rice buyers.
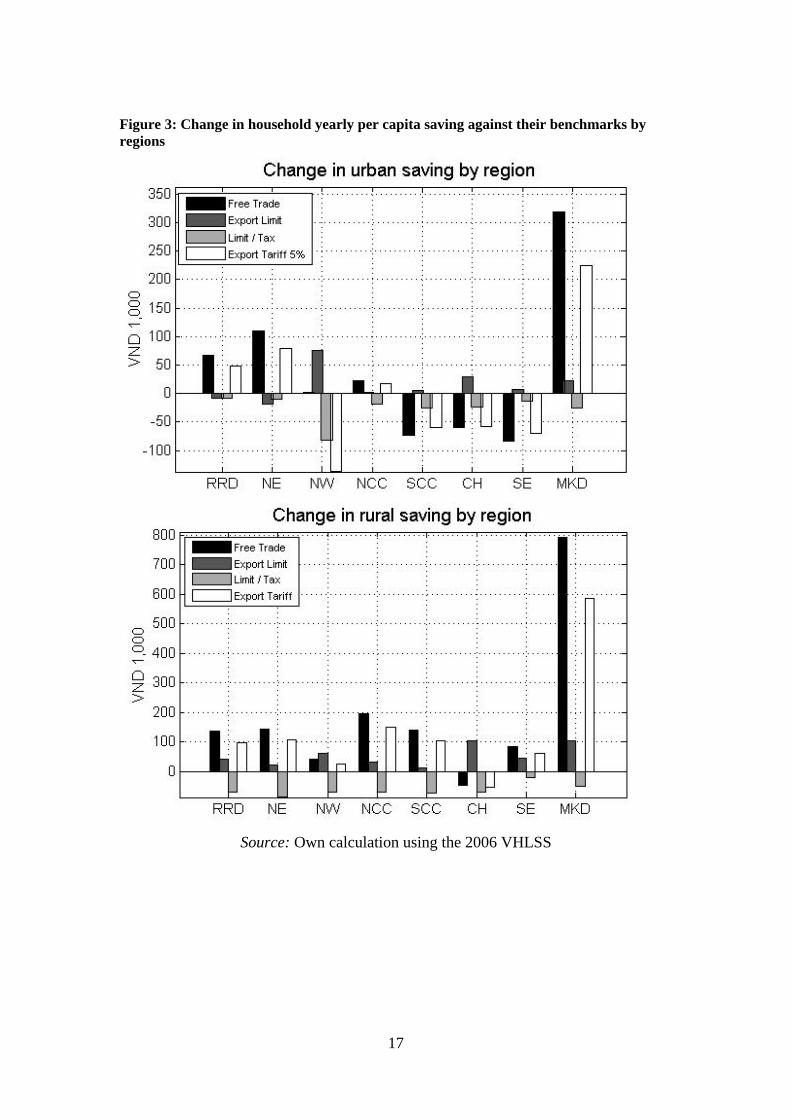
As seen in Figure 4, which represents the change in household yearly per capita
saving by regions for samples in the rural and urban areas, export limits with producer
tax hurts all urban and rural areas. Though the export limit has positive effect on all
rural and most of the urban areas, its magnitude is relatively small. Free trade is the
most beneficial policy measure followed by the export tariff to the rural areas (see
Figure 5).
13
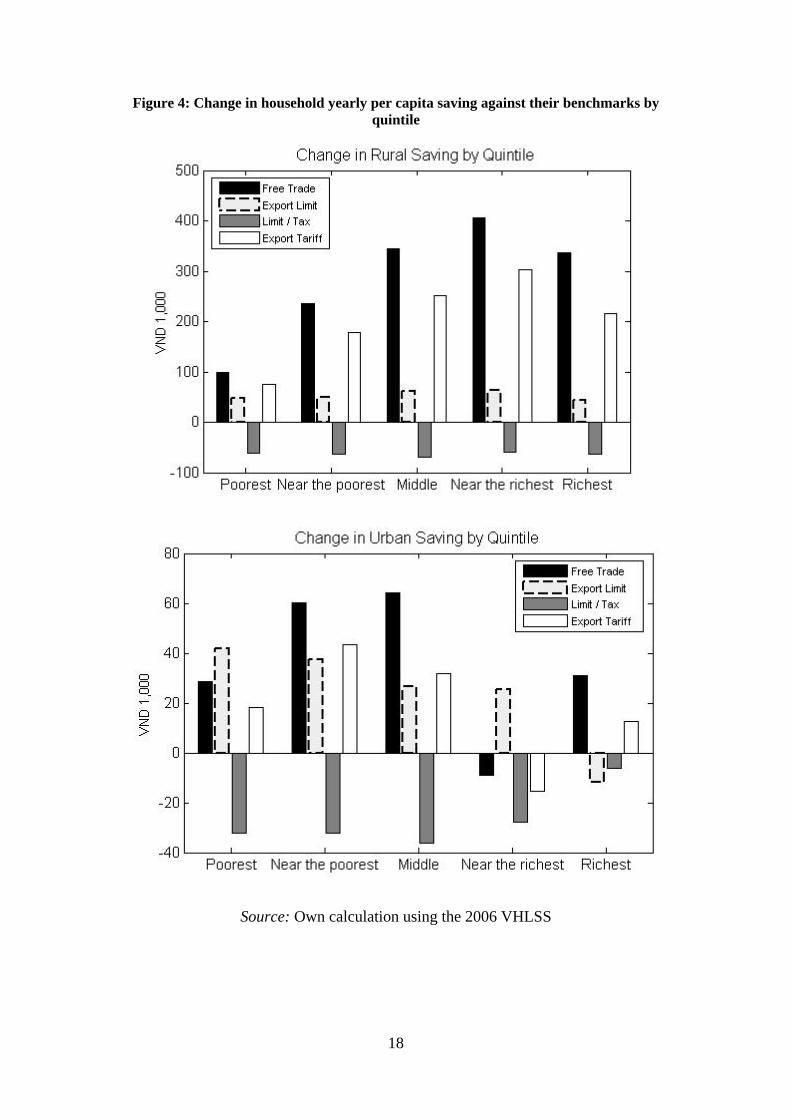
In fact, the urban sample has 49, 32 and 26 per cent of urban households from the
poorest, near the poorest and the middle groups, respectively, who have income from
planting paddy. The two poorest urban groups have a similar pattern of income with
about 35 per cent from wage income and 10 per cent from providing services, 3 per
cent from paddy, 4 per cent from other crops and 3 per cent from livestock. These
items increased in cost most under the free trade and export tariff scenarios. The
middle group earn about 24 per cent income from their business in ferrous metal and
other products and 21 per cent from wage, which have their values increase by 2.7 and
5 per cent, respectively under free trade. The near-the-richest group, on the other
hand, generates only 18 per cent and 17 per cent income from their business ferrous
metal and other products and wage income, respectively. The richest group earned
about 59 per cent of their income from their business in non-metallic mineral
products, which has a price increase of 3.6% under free trade.
From the consumption side, processed rice accounts about 27 per cent of the poorest
group consumption, compared with 19 and 14 per cent, respectively, for the near the
poorest and the middle groups in urban areas. In the contrast, the richest group spends
only about 5 per cent on rice in their consumption bundle compared with 9 per cent
for the near the richest group. This explains why the near the richest group is
relatively worst off under free trade, though the magnitude is very small in urban
areas. Under the trade limit, the richest group gains least as this group consumes many
products which are not reduced much under this scenario such as construction
materials, gasoline and restaurants.
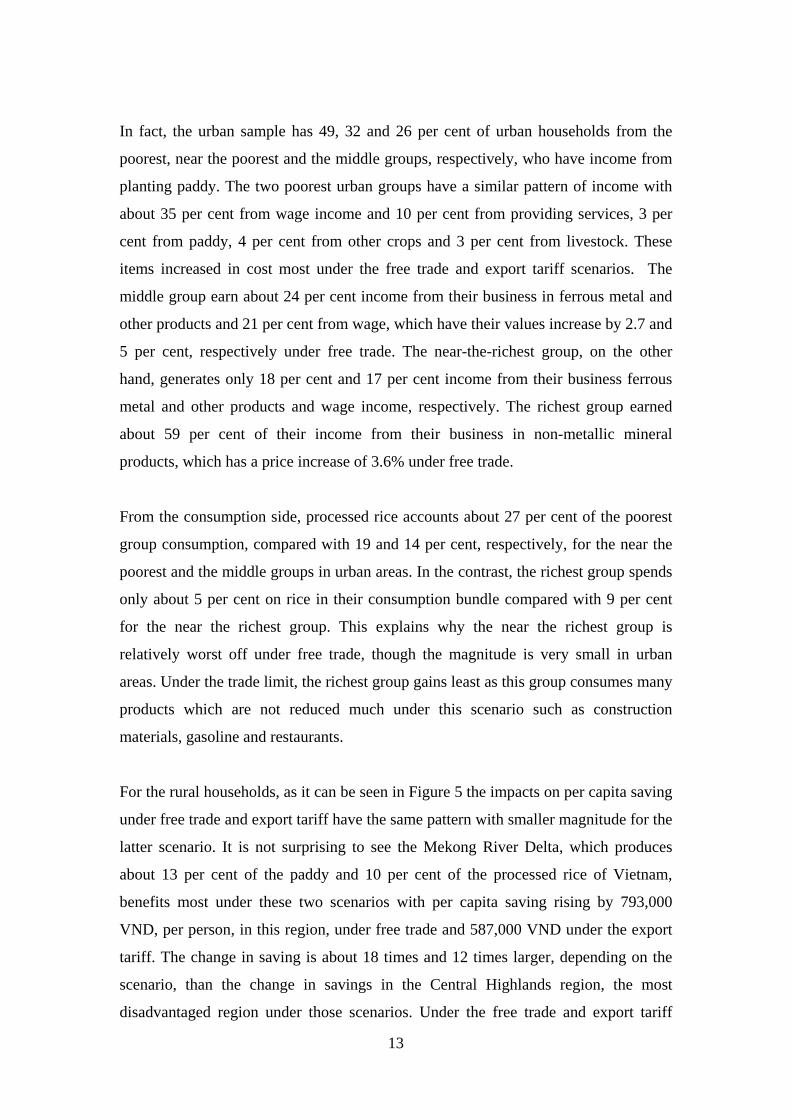
For the rural households, as it can be seen in Figure 5 the impacts on per capita saving
under free trade and export tariff have the same pattern with smaller magnitude for the
latter scenario. It is not surprising to see the Mekong River Delta, which produces
about 13 per cent of the paddy and 10 per cent of the processed rice of Vietnam,
benefits most under these two scenarios with per capita saving rising by 793,000
VND, per person, in this region, under free trade and 587,000 VND under the export
tariff. The change in saving is about 18 times and 12 times larger, depending on the
scenario, than the change in savings in the Central Highlands region, the most
disadvantaged region under those scenarios. Under the free trade and export tariff
14
scenarios, the Central Highlands per capita saving falls by 46,000 VND and 40,000
VND, respectively. As the soil in the Central Highlands is more suitable for planting
perennial crops, including coffee, pepper, rubber, cashew, tea and cotton, the rural
households are more likely net rice buyers compared to other regions in the country.
So the higher are rice prices the more disadvantaged the Central Highlands region will
be.
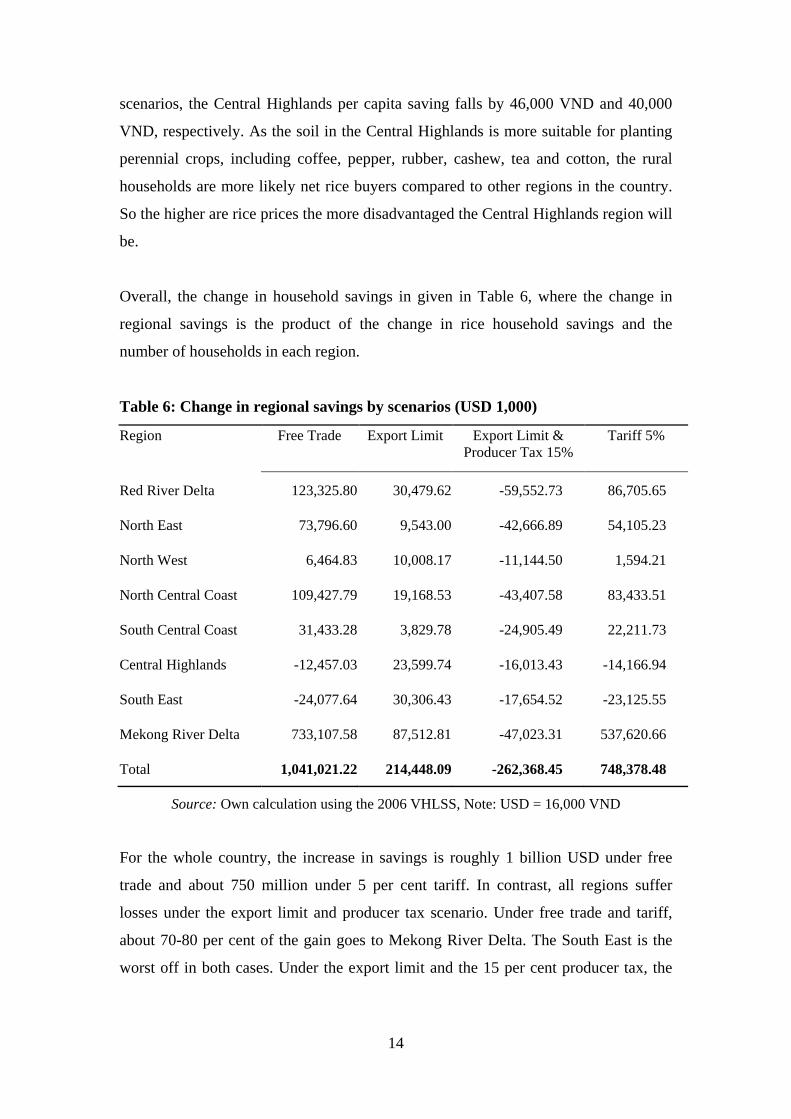
Overall, the change in household savings in given in Table 6, where the change in
regional savings is the product of the change in rice household savings and the
number of households in each region.
Table 6: Change in regional savings by scenarios (USD 1,000)
Region Free Trade Export Limit Export Limit & Producer Tax 15%
Tariff 5%
Red River Delta 123,325.80 30,479.62 -59,552.73 86,705.65
North East 73,796.60 9,543.00 -42,666.89 54,105.23
North West 6,464.83 10,008.17 -11,144.50 1,594.21
North Central Coast 109,427.79 19,168.53 -43,407.58 83,433.51
South Central Coast 31,433.28 3,829.78 -24,905.49 22,211.73
Central Highlands -12,457.03 23,599.74 -16,013.43 -14,166.94
South East -24,077.64 30,306.43 -17,654.52 -23,125.55
Mekong River Delta 733,107.58 87,512.81 -47,023.31 537,620.66
Total 1,041,021.22 214,448.09 -262,368.45 748,378.48
Source: Own calculation using the 2006 VHLSS, Note: USD = 16,000 VND
For the whole country, the increase in savings is roughly 1 billion USD under free
trade and about 750 million under 5 per cent tariff. In contrast, all regions suffer
losses under the export limit and producer tax scenario. Under free trade and tariff,
about 70-80 per cent of the gain goes to Mekong River Delta. The South East is the
worst off in both cases. Under the export limit and the 15 per cent producer tax, the

15
Mekong River Delta is harmed the most, followed by the North Central Coast and
North East regions.
4. Closing Remarks and Recommendations Using a ‘bottom up’ regional CGE model and a micro-simulation of the effect of
different rice export policies in Vietnam, this paper analyses the effect of the recent
dramatic increases in the world price of rice, and Vietnam’s policy response. A
number of results are obtained. First, alternative rice export policies have little or no
national impact on GDP, but large and differential regional impacts in this model. In
general, policies other than increased free trade (of some sort) greatly impact the
Mekong River Delta region most in terms of lost profitability. Second, although the
long term benefits of free trade in rice exports predominate, depending on the extent
of the increase in demand and export prices, CGE results and a micro-simulation
show that the recent government policy of limiting exports potentially generates short-
run regional benefits that favor ‘pro-poor’ outcomes and small rural households, in
terms of both a lower CPI in rural areas and a larger proportion of individuals made
‘better off’ (by at least 1 VND, or more). Finally, even in the short run case, measures
of average total savings per person, using a VHLSS-Simulation, increase in all
regions (except in the Central Highlands) with free trade, or trade with a small export
tariff. It is thus clear that although export bans have a limited ‘pro-poor’ impact, free
trade generates the largest increases in welfare, or measures of rice household savings.
16
Figure 1: Vietnam domestic retail rice price and free-on-board world price (USD/ton)
Sources: Data on retail rice prices of Mekong River Delta from General Statistics Office; Data on free on board rice price of Vietnam from FAOSTAT Database, 2008. FAO, Rome. 22 Sep 2008. Figure 2: Share of Paddy Production and Rice Processing Industries in Regional GDP (percentage)
1 RedRiverDel 2 NorthEast 3 NorthWest 4 NorthCentral 5 SouthCentral 6 CentHighLand 7 Southeast 8 MekongDelta0.00%
2.00%
4.00%
6.00%
8.00%
10.00%
12.00%
14.00%
4.50% 4.30%3.75%
5.77%
2.83% 2.91%
0.34%
12.64%
3.29%3.78%
2.42%3.18% 3.45%
1.20%
3.05%
10.26%
1 Paddy 10 ProcRice
17
Figure 3: Change in household yearly per capita saving against their benchmarks by regions
Source: Own calculation using the 2006 VHLSS
18
Figure 4: Change in household yearly per capita saving against their benchmarks by quintile
Source: Own calculation using the 2006 VHLSS
19
Figure 5: Proportion of households ‘better off’ by quintile and urban-rural
Source: Own calculation using the 2006 VHLSS
20
References
Baulch, B., Hansen, H., Le, T., and Tran, T., 2008. The Spatial Integration of Paddy Markets in Vietnam. Journal of Agricultural Economics. 59(2): 271 – 295.
Bui, C., Bui, T., and Duong, H., 2004. Economic Analysis Based on Interregional Input Output Modelling”. Statistics Publishing House. Hanoi, 2004.
Bui, T., Secritario, F., Kim, K., and Duong, H., 2005. Construction of an Interregional Input Output Table for Vietnam by the Hybrid Aprroach: The case of Hochiminh city and the rest of Vietnam. Presented paper at the 15th International Conference on Input Output Techniques. Beijing, China. June, 2005.
Dixon, P. B. & Rimmer, M. T. (2005). Mini-USAGE: Reducing Barriers to Entry in Dynamic CGE Modelling, Paper prepared for the 8th Annual Conference on Global Economic Analysis Lübeck, Germany, June 9 – 11, 2005.
FAOSTAT Database, 2008. FAO, Rome. 22 Sep 2008.
General Statistics Office, 2006. Sổ tay khảo sát mức sống gia đình 2006 (Vietnam Household Living Standard Survey Manual 2006).
Horridge, M. (2003). ORANI-G: A Generic Single-Country Computable General Equilibrium Model, Online at URL: http://www.monash.edu.au/policy/oranig.htm, Accessed date: 10/07/2006.
Kompas, T, Che, T.N., Nguyen, Q.H., and Nguyen, T.M.H., 2009. Productivity, Net Returns and Efficiency: Land and Market Reform in Vietnamese Rice Production. IDEC Working Paper, Crawford School of Economics and Government, Australian National University.
Kompas, T., Che, N., Nguyen, QH and Nguyen, H., 2009. Productivity, Net Returns and Efficiency: Land and Market Reform in Vietnamese Rice Production.
Linh Vu and Paul Glewwe, 2008. Impacts of rising food prices on poverty and welfare in Vietnam. Draft Report to the World Bank, 2008.
Lutz, C., Praagman, C., and Luu, H., 2006. Rice market integration in the Mekong River Delta: The transition to market rules in the domestic food market in Vietnam. Economics of Transition. 14(3) 2006, 517–546.
Minot and Goletti, 1998. Export Liberalization and Household Welfare: the Case of Rice in Vietnam. American Journal of Agricultural Economics. 80 (November 1998): 738-749.
Miyazawa, K., 1966. Internal and external matrix multipliers in the input-output model. Hitotsubashi Journal of Economics. 7: 38-55.
Nielsen, C., 2003. Vietnam’s Rice Policy: Recent Reforms and Future Opportunities. Asian Economic Journal. January 2007, Volume 17 No.1.
The Centre of Policy Studies & the Impact Project (2008). The ORANI-G Page, Online, Available at: URL:http://www.monash.edu.au/policy/oranig.htm, Accessed date 23/10/2008.

21
United Nations, 1999. Handbook of Input Output Table Compilation and Analysis, New York, 1999, No.27.
Appendix: List of 28 Industries and Commodities
Industry – Commodity descriptions Element of set C 1 Paddy Paddy 2 Other crops OthCrops 3 Livestocks & Poultry Liv_Poultry 4 Forestry Forestry 5 Fish Farming FishFarming 6 Fishery Fishery 7 Oil & gas OilGas 8 Mining Mining 9 Processed seafood ProcSeafood 10 Processed Rice ProcRice 11 Other Agricultural Processing OthAgriProc 12 Textiles Textiles 13 Paper Paper 14 Wood Wood 15 Rubber Rubber 16 Non-Metallic Mineral Products NonMetMin 17 Transport Equipment TransEquip 18 Metal Products MetalProd 19 Other Manufacturing OthManu 20 Electricity & Water ElecWater 21 Construction Construction 22 Transport (Margin) Transport 23 Communication Communication 24 Trade (Margin) Trade 25 Financial services FinServies 26 Public Administration PublicAdmin 27 Hotels & Restaurants HotelsRest 28 Other Services OthServices