Embed Size (px)
Citation preview
The Effects of Relative Price Perceptions and
Demographic Factors on Rest aur ant C at fish
Consumption
Danilo C. Israel Kandice H. Kahl
Robert S. Pomeroy
Using dichotomous logit analysis, the study measures the effects of relative price perceptions and demographic factors on the probability of restaurant catfish consumption in the United States. The study uses data from the 1988 Southern Regional Aquaculture Center Consumer Survey.
Relative price perceptions, income, race, religion, urbanization, and region are found to be significant determinants of the probability of restaurant catfish consumption. The probability of consumption is higher among consumers in urban areas and the Central regions and lower among low income consumers, Hispanics, Catholics, and consumers in the New England and Mid- Atlantic regions.
About two-thirds of total fish purchases in the United States are consumed in restaurants. While no exact figures are available, a substantial percentage of catfish purchases is probably consumed in restaurants also. Yet, restaurant
This study is part of the regional research project “Analysis of Regional and National Markets for Aquaculture Products Produced for Food in the Southern Region” funded in part by the Southern Regional Aquaculture Center.
Research Associate, Professor, and Associate Professor, respectively, Department of Agricultural and Applied Economics, Clemson University.
Agribusiness, Vol. 7, No. 6, 585-595 (1991) 0 1991 by John Wiley & Sons, Inc. CCC 0742-4477/91/060585-11$04.00

ISRAEL, KAHL, AND POMEROY
catfish consumption has been afforded little research attention. So far, most catfish consumption studies have concentrated only on total and at-home con- s ~ m p t i o n . ~ - ~
This study measures the effects of relative price perceptions and demographic factors on the probability of restaurant catfish consumption in the United States. The study fills a gap in catfish consumption research by concentrating on restau- rant catfish consumption as an issue separate from total and at-home catfish consumption.
This study uses discrete choice analysis, an analytical approach that has already been applied in some food consumption s t u d i e ~ . ~ . ~ The results of the study are compared to previous findings on total and at-home catfish con- sumption. The information generated can be useful in the design of marketing strategies aimed towards the promotion of catfish consumption in restau- rants.
DATA
This study is part of the regional research project “Analysis of Regional and National Markets for Aquaculture Products Produced for Food in the Southern Region,” funded in part by the Southern Regional Aquaculture Center. The cooperators of the project include researchers from Auburn University, University of Arkansas at Pine Bluff, Clemson University, Mississippi State University, Louisiana State University, and Texas A&M University.
This study uses data from the Southern Regional Aquaculture Center (SRAC) national telephone survey of households conducted between April and June 1988. The survey covered 3,600 households, 400 in each of the nine census divisions or regions of the contiguous United States (see Appendix A). The respondents of the survey include 1,800 male and 1,800 female adult household members.
Among other information, the survey gathered discretely defined data on respondents’ purchases or consumption of catfish in restaurants (question 9f of the survey questionnaire, see Appendix B). These data are the basis for the measurement of consumers’ restaurant catfish consumption in this studv. The survey also gathered information on consumer relative price perceptions (ques- tion lOj ) and consumer demographic characteristics including household income (question 20), age (question 24), race (question 23), religion (question 22), as well as urbanization (question 17) and region (question 26). These data are the basis for the quantification of the independent variables used in the analysis. The explanatory variables considered are limited to the factors listed above because of data constraints. In particular, survey information on occupation and education are not used because the information pertains to household goods and not to survey respondents which are the subjects of analysis in this study.
Some of the original 3,600 observations were not usable for this analysis. These include observations which either had no response, “don’t know” re- sponse, “don’t know, it depends’’ response, or “refused” response to at least one of the survey questions relevant to the study except question lOj. The analysis used a final sample of 2,697 observations.
CATFISH 587
THE ESTIMATED MODEL
In the estimation of consumption functions, consumption is usually measured in continuous units. However, consumption can also be analyzed by assuming that the consumer faces discrete, instead of continuous, consumption choices. The theoretical basis for discrete choice analysis has already been well discussed in the Also, the dichotomous logit model has been shown to be an appropriate probability model for an analysis involving discretely defined explan- atory fact01-s.~
The estimated dichotomous logit model in this study is
In A P . = Q'X, + U, 1 - Pi
where Pi is the probability that consumer i eats catfish in restaurants, p is a column vector of coefficients, Xi is a column vector of relative price perceptions and demographic factors and ui is the error term. The dependent variable of the logit model in Eq. (1) is the natural logarithm of the ratio of the probability that the consumer eats catfish in restaurants and the probability that he does not.
In this study, relative price perceptions are measured as a dummy variable. The dummy price perceptions variable is given a value of 1 if the consumer perceives catfish as inexpensive compared to other fish, that is, if the response to question l O j ranges from 6 to 10 (Appendix B). The dummy price perceptions variable is given the value of 0 if the consumer does not perceive catfish as inexpensive compared to other fish or has no perceptions about relative prices, that is, if the response to question l O j ranges from 1 to 5 or is 99.
Since data on consumer income are not available from the survey, consumer income is proxied by household income. Consumer or respondent income is assumed to be highly and positively correlated with household income. Income is disaggregated into six categories (less than $10,000 per annum, $10,000- $20,000, $20,000-$30,000, $30,000-$40,000, $40,000-$50,000, and great- er than $50,000). Each category is represented by a dummy variable with a value of 1 if the consumer belongs to that category and 0 otherwise.
All other demographic factors were represented by dummy variables, except for age, which is a continuous variable. Race is disaggregated into five categories (Black, White, Hispanic, Asian, and Others), religion into four categories (Prot- estant, Catholic, Jewish, Others), urbanization into three categories (rural, ur- ban, and suburban), and region into nine categories (New England, Mid-Atlan- tic, East North Central, West North Central, South Atlantic, East South Central, West South Central, Mountain, and Pacific). The dummy variables representing the different categories are given the value of 1 if the consumer falls into the relevant category and the value of 0 otherwise. In the actual estimation, the base categories are the income category $20,000-$30,000, the race category white, the religion category Protestant, the urbanization category suburban, and the region category South Atlantic. The number and percentage of consumers (re- spondents) in the different categories for the variables considered in this study are presented in Appendix C.
If catfish is a substitute for other fish in restaurant consumption, the proba- bility of catfish consumption is expected to be higher among consumers who
588 ISRAEL, KAHL, AND POMEROY
perceive catfish as inexpensive compared to other fish than among other con- sumers. Otherwise, if catfish is not a substitute for other fish in restaurant consumption, the probability of consumption is not expected to be influenced by consumers' relative price perceptions.
If catfish is a normal good in restaurant consumption, the likelihood that it will be consumed is expected to be higher among high-income consumers than among low-income consumers. On the other hand, if catfish is an inferior good in restaurant consumption, the probability of consumption is expected to be higher among low-income consumers than among high-income consumers.
The findings of previous empirical studies regarding the effect of income on catfish consumption appear inconsistent. Using Arkansas data, Pippin and Mor- rison found that income had a positive impact on at-home catfish consumption. On the other hand, Hu found that catfish was an inferior good, a finding sup- ported by Dellenbarger, Luzar, and Schupp using Louisiana data. Using nation- wide data, McGee, Dellenbarger, and Dillard found that income was not a significant determinant of catfish consumption.
Age can affect the probability of restaurant catfish consumption if there are age-related differences in tastes and preferences. For example, health consider- ations could make it more likely for people belonging to certain age groups to prefer eating catfish. Also, the level of awareness about the nutritional attributes of catfish could vary between age groups, resulting in significant differences in their attitudes toward catfish. Age has already been analyzed previously as a determinant of catfish consumption. McGee, Dellenbarger, and Dillard found that young people were more likely to be catfish consumers.
Race can affect the probability of restaurant catfish consumption if there are race-related differences in tastes and preferences toward eating catfish in restau- rants. For example, attitudes about eating catfish in restaurants as a form of entertainment may vary across racial groups. Also, for some racial groups, catfish may be more acceptable for home rather than restaurant consumption, thus, resulting in the consumption of catfish at home but not in restaurants. Previous empirical studies found that differences in away-from-home food con- sumption and in catfish consumption exist between races. Derrick, Dardis and Lehfeld12 found that blacks spend significantly less on S o d away from home than non-blacks. Hu, Pippin, and Morrison, and Dellenbarger, Luzar, and Schupp found that catfish consumption was higher among blacks than among whites.
Religion is included as an explanatory factor in this analysis to take account of possible religion-related differences and biases in restaurant catfish consump- tion. Past empirical findings suggest that religion was an important determinant of fish consumption. Specifically, Cheng and Capps'" found that spending on finfish products was significantly less among households with religious affiliation than among households with no religious affiliation. Previous research, however, has not been conclusive on the effect of religion on catfish consumption. Dellen- barger, Luzar, and Schupp found that Catholic households had greater expendi- tures for catfish than other households. On the contrary, McGee, Dellenbarger, and Dillard found that religion was not significantly different between consumers and nonconsumers of catfish.
The probability of restaurant catfish consumption may be influenced by ur- banization because of the effect of urbanization on catfish promotion and avail- ability. On the one hand, the more urbanized an area is, the more likely catfish
CATFISH 589
will be advertised and the more likely catfish will be offered in restaurants in a variety of preparations. These factors tend to increase the likelihood of catfish consumption in restaurants. On the other hand, increased urbanization also results in consumer exposure to more intense promotion and wider availability of catfish substitutes. With greater product competition, the likelihood of catfish consumption may be diminished. Previous empirical findings on the effect of urbanization on catfish consumption have been contradictory. Hu found that urbanization and consumption were inversely related. In contrast, McGee, Del- lenbarger, and Dillard found that consumption was more likely in urban areas.
Lastly, consumers from different regions face different demand and supply conditions and thus encounter different actual catfish prices. In addition, con- sumers from different regions may differ in tastes and preferences due to cultural and ethnic factors. These elements may make regional location an important determinant of the probability of restaurant catfish consumption. Previous stud- ies found that regional location was an important determinant of catfish consump- tion. In particular, Hu and McGee, Dellenbarger, and Dillard found that catfish consumption was higher in the South Central region than in other regions.
Because restaurant catfish consumption has not been analyzed before, the impacts of relative price perceptions and demographic factors on the probability of restaurant catfish consumption are open empirical questions that are ad- dressed in this study. Thus, no specific hypotheses are presented regarding the signs and levels of significance of the independent variables included in the model.
RESULTS
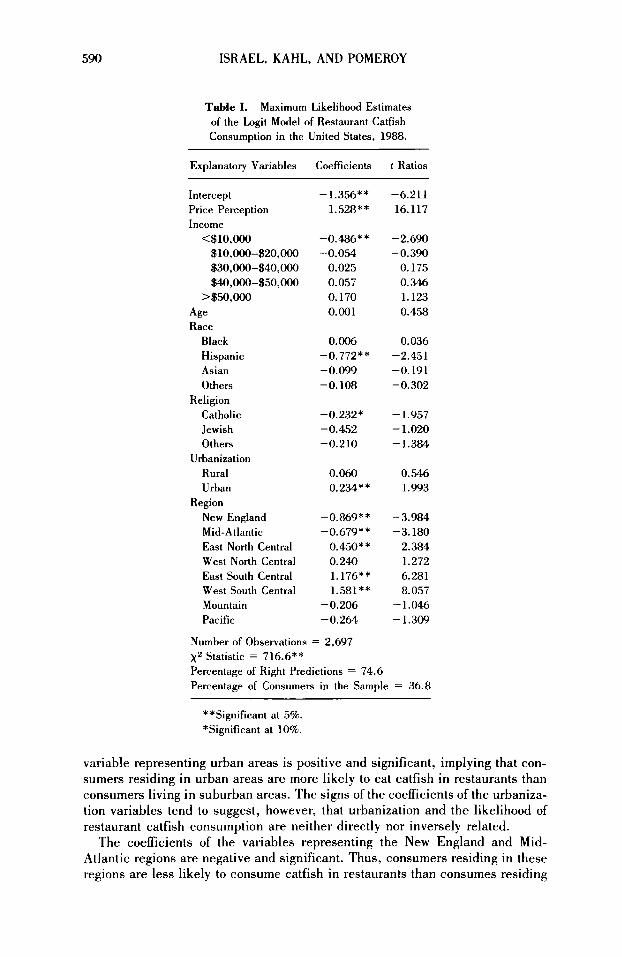
Results of the estimation of Eq. (1) are shown in Table I. The coefficient of the relative price perceptions variable is positive and significant. Thus, other things constant, consumers who perceive catfish as inexpensive compared to other fish are more likely to eat catfish in restaurants than other consumers. This result tends to suggest that catfish is a substitute for other fish in restaurant consumption.
The coefficients of the income variables are negative for income levels lower than the base category and positive for income levels higher than the base category. Also, the magnitude of the coefficients increases as income increases. These results tend to suggest that the probability of restaurant catfish consump- tion is directly related to income and that catfish is a normal good in restaurant consumption. This finding, however, is tempered by the result that except for the lowest income category, all income coefficients are insignificant. The negative and significant income coefficient for the lowest income category implies that consumers with income less than $10,000 per annum are less likely to consume catfish in restaurants than consumers in the middle income range.
The coefficient of the age variable is insignificant, indicating that the age of the consumer is not a significant determinant of the probability of restaurant catfish consumption. The coefficient of the race variable Hispanic is negative and significant, implying that Hispanic consumers are less likely to eat catfish in restaurants than white consumers. The coefficient of the religion variable Catho- lic is negative and significant, indicating that Catholic consumers are less likely to eat catfish in restaurants than Protestant consumers. The coefficient of the
590 ISRAEL, KAHL, AND POMEROY
Table I. Maximum Likelihood Estimates of the Logit Model of Restaurant Catfish Consumption in the United States, 1988.
Explanatory Variables Coefficients t Ratios
Intercept Price Perception Income <$lO,OOo $lO,OOo-$20,OOO $3O,OOO-$4O,OOO 540,OOO-850,OOO
>$5o,OOo Age Race
Black Hispanic Asian Others
Religion Catholic Jewish Others
Urbanization Rural Urban
New England Mid- Atlantic East North Central West North Central East South Central West South Central Mountain Pacific
Region
- 1.356* * 1.528* *
-0.486** -0.054 0.025 0.057 0.170 0.001
0.006 -0.772* * -0.099 -0.108
-0.232" -0.452 -0.210
0.060 0.234**
- 0.869* * -0.679** 0.450** 0.240 1.176** 1.581**
-0.206 -0.264
-6.211 16.117
-2.690 - 0.390 0.175 0.346 1.123 0.458
0.036 -2.451 -0.191 -0.302
-1.957 - 1.020 -1.384
0.546 1.993
-3.984 -3.180 2.384 1.272 6.281 8.057
-1.046 -1.309
Number of Observations = 2,697 xZ Statistic = 716.6** Percentage of Right Predictions = 74.6 Percentage of Consumers in the Sample = 36.8
**Significant at 5%. *Significant at 10%.
variable representing urban areas is positive and significant, implying that con- sumers residing in urban areas are more likely to eat catfish in restaurants than consumers living in suburban areas. The signs of the coefficients of the urbaniza- tion variables tend to suggest, however, that urbanization and the likelihood of restaurant catfish consumption are neither directly nor inversely related.
The coefficients of the variables representing the New England and Mid- Atlantic regions are negative and significant. Thus, consumers residing in these regions are less likely to consume catfish in restaurants than consumes residing
CATFISH 59 1
in the South Atlantic region. On the other hand, the coefficients of the variables representing the East North Central, East South Central, and West South Central regions are positive and significant. Therefore, consumers living in these regions are more likely to eat catfish in restaurants than consumers living in the South Atlantic region.
The chi-squared statistic measures the overall goodness-of-fit of the logit model. In this study, it is significant at the 1% level. Thus, at least one of the independent variables considered in the analysis is a significant determinant of the likelihood of restaurant catfish consumption. Of the study sample, 36.8% consumed catfish in restaurants. Therefore, a naive model that assumes that no consumer eats catfish in restaurants would have a prediction error of 36.8%. The model in this study correctly predicts 74.6% of the sample, implying a prediction error of 25.4%. Thus, when compared to the naive model, the logit model resulted in a substantial reduction in the prediction error.
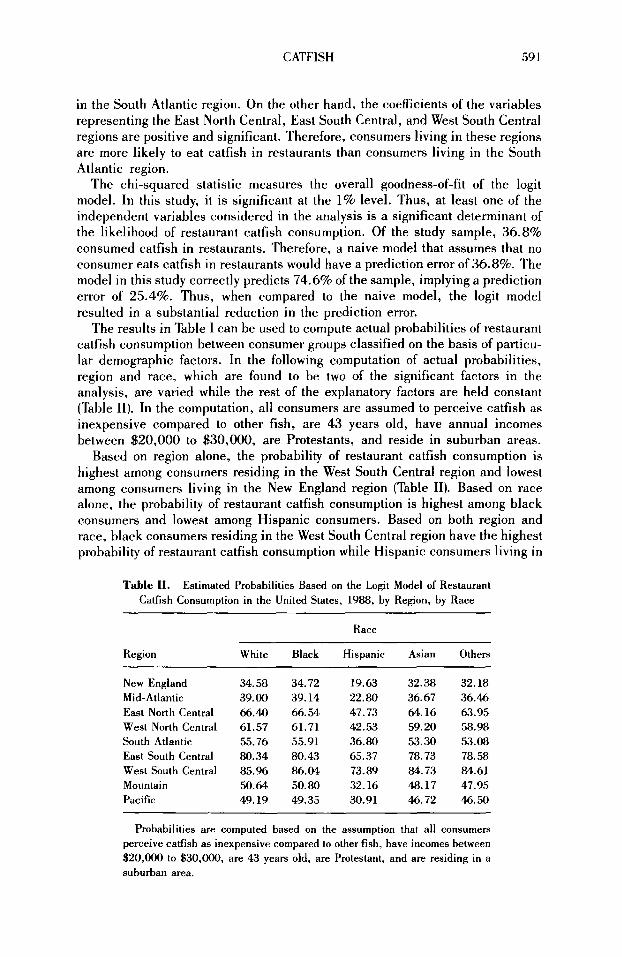
The results in Table I can be used to compute actual probabilities of restaurant catfish consumption between consumer groups classified on the basis of particu- lar demographic factors. In the following computation of actual probabilities, region and race, which are found to be two of the significant factors in the analysis, are varied while the rest of the explanatory factors are held constant (Table 11). In the computation, all consumers are assumed to perceive catfish as inexpensive compared to other fish, are 43 years old, have annual incomes between $20,000 to $30,000, are Protestants, and reside in suburban areas.
Based on region alone, the probability of restaurant catfish consumption is highest among consumers residing in the West South Central region and lowest among consumers living in the New England region (Table 11). Based on race alone, the probability of restaurant catfish consumption is highest among black consumers and lowest among Hispanic consumers. Based on both region and race, black consumers residing in the West South Central region have the highest probability of restaurant catfish consumption while Hispanic consumers living in
Table 11. Estimated Probabilities Based on the Logit Model of Restaurant Catfish Consumption in the United States, 1988, by Region, by Race
Race
Region
New England Mid-Atlantic East North Central West North Central South Atlantic East South Central West South Central Mountain Pacific
White
34.58 39.00 66.w 61.57 55.76 80.34 85.96 50.64 49.19
Black
34.72 39.14 66.54 61.71 55.91 80.43 86.04 50.80 49.35
Hispanic
19.63 22.80 47.73 42.53 36.80 65.37 73.89 32.16 30.91
Asian
32.38 36.67 64.16 59.20 53.30 78.73
48.17 4672
84.73
Others
32.18 36.46 63.95 58.98 53.08 78.58 84.61 47.95 46.50
Probabilities are computed based on the assumption that all consumem perceive catfish as inexpensive compared to other fish, have incomes between $20,000 to $3O,OOO, are 43 years old, are Protestant, and are residing in a suburban area.
592 ISRAEL, KAHL, AND POMEROY
the New England region have the lowest probability of restaurant catfish consumption.
CONCLUSIONS In summary, the results indicate that relative price perceptions, income, race, religion, urbanization, and region have significant influences on the probability of restaurant catfish consumption. Other things constant, consumers who perceive catfish as inexpensive compared to other fish are more likely to consume catfish in restaurants than other consumers. The probability of restaurant catfish consump- tion tends to be directly related to income. Very-low-income consumers, His- panics, Catholics, and consumers residing in the New England and Mid-Atlantic regions are less likely to consume catfish in restaurants. Consumers living in urban areas and those residing in the East North Central, East South Central, and West South Central regions are more likely to be restaurant catfish consumers.
The findings of this study are consistent with some previous findings and inconsistent with other previous results on total and at-home catfish consump- tion. The finding that income has an important positive effect on the probability of restaurant catfish consumption is in agreement with the finding of Pippin and Morrison for at-home consumption and inconsistent with those of studies on total consumption (Hu and McGee, Dellenbarger, and Dillard). In contrast to Hu and in agreement with McGee, Dellenbarger, and Dillard, consumers residing in urban areas are found to be more likely to eat catfish in restaurants. In agreement with both Hu and McGee, Dellenbarger and Dillard, consumers in the South Central regions are found to be more likely to be restaurant catfish consumers.
Contrary to the finding of McGee, Dellenbarger, and Dillard, religion is found to be significant while age is found insignificant in this analysis. Also, the finding that Catholics are less likely to consume catfish in restaurants is incon- sistent with the finding of Dellenbarger, Luzar, and Schupp for at-home catfish consumption.
Because price, income, race, urbanization, and region are found to be signifi- cant determinants of the probability of restaurant catfish consumption, these factors may be given emphasis in the formulation of marketing strategies de- signed to promote restaurant catfish consumption. However, caution must be exercised also in deriving broad inferences from the findings. This analysis has one major limitation. As previously stated, the list of independent factors consid- ered here is limited by available information from the SRAC survey. The exclu- sion of other likely factors of restaurant catfish consumption, such as consumer education and occupation, may have resulted in some degree of bias in the estimates of variable relationships.
REFERENCES 1. K.K. Sanderson, “The New Wave in Seafood,” Restaurant Business, 1 , 165 (1987). 2. K. Pippin and W. R. Morrison, Retail Market Potential for Farm-Cultured Caflikh, Arkansas
Agricultural Experiment Station Bulletin 799, Department of Agricultural Economics and Rural Sociology, University of Arkansas, Fayetteville, AR, 1975.
3 . T. Hu, Analysis of Seafood Consumption in the U S . : 1970, 1974, 1978, 1981, US Department of Commerce, National Technical Information Service, Springfield, VA, 1985.

CATFISH 593
4. L.E. Dellenbarger, E.J. Luzar, and A.R. Schupp, “Household Demand for Catfish in Loui- siana,” Agribusiness 4 , 493 (1988).
5. W.M. McGee, L.E. Dellenbarger, and J.G. Dillard, Demographic and Attitudinal Charac- teristics of Catf ih Consumers, Mississippi Agricultural and Forestry Experiment Station Tech- nical Bulletin No. 168, Mississippi State University, MS, 1989.
6. 0. Capps, Jr. and R.A. Kramer, “Analysis of Food Stamp Participation Using Qualitative Choice Models,” American Journal of Agricultural Economics, 67, 49 (1985).
7. 0. Capps, Jr., D.S. Moen, and R.E. Branson, “Consumer Characteristics Associated with the Selection of Lean Meat Products,” Agribusiness, 4 , 549 (1988).
8. Amemiya, “Qualitative Response Models, A Survey,” Journal of Economic Literature, 19, 1483 (1981).
9. G.S. Maddala, Limited-Dependent and Qualitative Variables in Econometrics, Cambridge Uni- versity Press, New York, 1983.
10. G.G. Judge, W.E. Grifiths, R.C. Hill, H. Lutkepohl, and T. Lee, The Theory and Practice of Econometrics, 2nd ed., Wiley, 1985, p. 752.
11. W.H. Greene, Econometric Analysis, Macmillan, New York, 1990, p. 661. 12. F.W. Derrick, R. Dardis, and A. Lehfeld, “The Impact of Demographic Variables on Expendi-
tures for Food Away from Home,” Journal of the Northeastern Agricultural Economic Council, 1 1 , l (1982) .
13. H. Cheng and 0. Capps, Jr., “Demand Analysis o€ Fresh and Frozen Finfish and Shellfish in the United States,” American Journal of Agricultural Economics, 70, 533 (1988).
APPENDIX A
Breakdown by States of the Nine US Geographical Regions Covered by the SRAC Survey
1. New England Region
2. Mid-Atlantic Region
3. East North Central Region
4. West North Central Region
5. South Atlantic Region
Maine, Vermont, New Hampshire, Massachusetts, Rhode Island, Connecticut
New York, New Jersey, Pennsylvania
Ohio, Indiana, Illinois, Wisconsin, Michigan
Missouri, Iowa, Kansas, Nebraska, North Dakota, South Dakota, Minnesota
Delaware, Maryland, Virginia, West Virginia, North Carolina, South Carolina, Georgia, Florida
Kentucky, Tennessee, Alabama, Mississippi
Arkansas, Louisiana, Oklahoma, Texas
Utah, Colorado, Nevada, Idaho, Montana, Wyoming, Arizona, New Mexico
California, Oregon, Washington
6. East South Central Region
7. West South Central Region
8. Mountain Region
9. Pacific Regiona
aHawaii and Alaska were excluded from the survey.

594 ISRAEL, KAHL, AND POMEROY
APPENDIX B
The SRAC Survey Questions Relevant to the Study"
M. How often do you purchase catfish at a restaurant? Would you say. . . ?
(1) Less than once a month (2) 1-2 times a month (7) Never (3) 3-4 times a month
(4) More often
(8) Don't know, i t depends.
10. Using a scale of 1 to 10, where 1 means strong disagreement and 10 means strong agreement, do you agree or disagree with the following statements? You may use any number in between.
(99) Don't know, it depends
j . Catfish is inexpensive compared to other fish.
17. Do you reside in a:
(1) Rural environment (2) Suburban environment (3) Urban environment
20. Is your household income:
(1) Less than $lO,OOO (2) Between $10,000 and $20,000 (3) Between $20,000 and $30,000 (4) Between $30,000 and $40,000 (5) Between $44),000 and $50,000 (5) Greater than $50,000 (6 ) Refused (9) Don't Know
22. Is your religious preference:
(1) Protestant ( 3 ) Jewish (2) Catholic (4) Other (write in)
23. Is your racial background:
(1) White (4) Asian (2) Black (3) Hispanir
(8) Other (write in)
24. What is your age'?
26. Census subdivision.
aA complete copy of the SRAC Consumer Survey Questionnaire is contained in McGee, Dellen- barger, and Dillard.

CATFISH
APPENDIX C
595
Number and Percentage of Consumers (Respondents) in the Different Categories for the Variables
Considered in the Study"
Consumers
Variable Categories Number Percenlage
4. Race
5. Religion
6. Urbanization
7. Region
1. Eats Catfish in Yes
2. Perceives Catfish Yes
3. Income <$lO,ooo
Restaurant? No
as Inexpensive? No
$lO,ooo-$20,ooo $20,000-$30,000 $30,0Ml-$40,,000 $4Q,000-$50,000
>$so,ooo White Black Hispanic Asian Others Protestant Catholic Jewish Others Rural Suburban Urban New England Mid-Atlantic East North Central West North Central South Atlantic East South Central West South Central Mountain Pacific
993 1,704 943
1,754 281 538 657 489 315 417
2,330 211 84 23 49
1,651 697 39 310 850
1,161 686 322 299 300 305 279 314 290 304 284
36.8 63.2 35.0 65.0 10.4 19.9 24.4 18.1 11.7 15.5 86.4 7.8 3.1 .9 1.8 61.2 25.8 1.4 11.5 31.5 43.0 25.4 11.9 11.1 11.1 11.3 10.3 11.6 10.8 11.3 10.5
eFor the continuous variable Age, the mean age is 43 years, the maximum age is 92 years and the minimum age is 15 years.