Embed Size (px)
Citation preview

* Presented in part at the 10th International Symposium on Digestive Physiology in Pigs, May 2006, Vejle, Denmark, 3rd Conference on Physiology and Biochemistry in Animal Nutrition, September 2006, Warsaw (Poland), and 2nd International Symposium on Energy and Protein Metabolism and Nutrition, September 2007, Vichy (France)1 Corresponding author: e-mail: [email protected]
Journal of Animal and Feed Sciences, 21, 2012, 89–106
The effects of pectin and rye on amino acid ileal digestibility, threonine metabolism, nitrogen
retention, and morphology of the small intestine in young pigs*
E. Święch1, A. Tuśnio, M. Taciak, M. Boryczka and L. Buraczewska
The Kielanowski Institute of Animal Physiology and Nutrition, Polish Academy of Sciences 05-110 Jabłonna, Poland
(Received 29 November 2011; revised 14 February 2012; accepted 15 March 2012)
ABSTRACT
The effects of supplementing cereal-based diets with 0, 40, or 80 g of pectin (P) or 270 g of rye (R) per kg on ileal digestibility of protein and amino acids (AA), and digesta viscosity in pigs of 20 kg body weight (BW), and on growth performance, nitrogen balance, small intestinal morphology, and threonine metabolism parameters in pigs of 15 kg BW were assessed. Digesta viscosity was increased more by 80 g than by 40 g P or by R. Ileal digestibility of AA and nitrogen retention were negatively affected by P, whereas growth performance was decreased by R. The effect of the supplements on intestinal morphology was variable, except for the increase in myenteron thickness by P and crypt depth by R. The number of goblet cells containing acidic mucins was decreased by 40 g P in crypts in the mid-jejunum and by 40 g P and R in villi in the ileum. Fasting and postprandial plasma levels of free threonine and of threonine dehydrogenase activity in the liver and pancreas were not affected. In conclusion, feeding P or R negatively affects ileal AA digestibility and provokes irregular changes of small intestinal morphology. These effects cannot be attributed to the increase of digesta viscosity as the main factor.
KEY WORDS: pigs, soluble NSP, ileal AA digestibility, threonine metabolism, nitrogen retention, intestinal morphology

90 PECTIN AND RYE - THREONINE METABOLISM
INTRODUCTION
Cereals contain nutritionally important amounts of non-starch polysaccharides (NSP) in both insoluble and soluble forms. The main components of rye and wheat NSP are arabinoxylans (pentosans) that constitute about 10% of dry matter in rye and 5.7 to 8.2% in wheat. Soluble NSP, in particular when provided in purified forms, increase digesta viscosity leading to slower absorption of amino acids (AA) and their lower ileal digestibility (Buraczewska, 2001; Wenk, 2001). Insoluble NSP reduce the transit time of digesta and are slowly degradable by the microflora in the large intestine (Buraczewska, 2001; Wenk, 2001). The study of Bartelt et al. (2002) showed that not only the viscosity-enhancing property of soluble NSP, but also other properties of complex dietary fibre, influencing digesta passage rate or bacterial activity, may contribute to changes in intestinal morphology, nutrient absorption, and endogenous nitrogen losses.
The results of several studies (Zhu, 2003; Myrie et al., 2006) showed that soluble NSP increase endogenous losses of AA, especially threonine (Thr), and affect utilization of this AA for protein deposition and growth. In consequence, the presence of soluble NSP in the diet of young pigs with a high lean gain potential may increase their Thr requirement. Large endogenous Thr losses are mainly due to the high Thr content in mucin proteins, which are very resistant to digestion. Mucins are secreted by goblet cells (GC) and protect the intestinal epithelium against bacterial, chemical, and mechanical injuries.
The aim of this study was to examine the response of young pigs to different types and levels of dietary NSP in terms of growth performance and protein utilization, and in relationship to the Thr metabolism and structure of the small intestine.
As the source of soluble NSP, highly esterified apple pectin (P) and rye (R) were compared. Growth performance, nitrogen retention, ileal digestibility of AA, concentration of free Thr and urea in blood plasma, threonine dehydrogenase (TDG) activity in the liver and pancreas, intestinal morphology, goblet cell number in the mid-jejunum and ileum were used as criteria.
MATERIAL AND METHODS
Experimental design
The experiments were approved by the Local Animal Care Committee. Two experiments were performed. In Experiment 1, apparent and standardized ileal digestibility (AID and SID, respectively) of protein and AA and ileal digesta viscosity were determined on cannulated pigs according to a cross-over design.In Experiment 2, nitrogen balance was determined twice in pigs from

91święch e. et Al.
15 to 23 kg and from 24 to 33 kg of body weight (BW), and growth performance was measured during two 14-day periods. Blood was collected for free Thr and urea determination. After slaughter, tissue samples were taken for TDG and histological measurements.
Animals and experimental procedures
The experiments were performed on pigs with a high gain potential (390 g/day from 25-100 kg Bw, synthetic line 990, Mełno, Poland). Pigs were housed individually in metabolism cages in a thermally controlled room (22-23ºC) with free access to water.
In Experiment 1, AID and SID of protein and AA and ileal digesta viscosity were determined on twelve pigs with an initial BW of about 20 kg. The pigs were surgically fitted with a post-valvular t-caecum cannula (PVtc) according to van Leeuwen et al. (1991). The recovery lasting 10 days was followed by 7-day periods of feeding the experimental diets. The feeding level was adjusted to 5% of BW corresponding to about 90% of ad libitum intake. The pigs were fed at 8.00 and 20.00 h with equal portions of meal diets mixed with water (1:1). During the last three days of experimental feeding, ileal digesta was collected from 8.00 to 20.00 h, and viscosity was measured in a pooled sample of fresh digesta. The daily digesta were stored frozen and, after thawing, were pooled per animal within each experimental period and freeze dried for analysis.
In Experiment 2, twenty-four pigs were allocated into four groups (six pigs each), taking BW, age, and litters into account. After seven days of adaptation, the pigs were fed a starter diet with daily incremental additions of the test diets. Equal portions were given at 8.00, 14.00 and 20.00 h, after mixing with water (1:1). Pigs (initially 15 kg BW) were fed experimental diets for 40 days. At a mean BW of approximately 20 and 30 kg, the N balance was performed during two consecutive 14-day periods. The daily dietary allowance was provided at the rate of about 5% of BW, and was kept constant during the last nine days of N balance periods. Faeces and urine were collected for six days as described by Buraczewska et al. (2006).
Average daily gain (ADG) and feed:gain ratio (F/G) were measured during two 14-day periods. Feeding experimental diets was continued for 12 days. After termination of the balance experiment, pigs were surgically implanted with catheters in the jugular vein. Blood sampling began three days after the surgery and lasted 6 h. Samples were collected before and 0.5, 1, 2, 4 and 6 h after the morning meal. The pigs were slaughtered at about 40 kg of BW, the gastrointestinal tract was immediately removed and the small intestine dissected into the duodenum, jejunum and ileum. After rinsing with cold 0.9% NaCl, the segments were weighed and tissue samples were taken for histological parameters. The liver and pancreas were weighed and samples were taken and stored at -80°C for determination of TDG activity.

92 PECTIN AND RYE - THREONINE METABOLISM
Diets
In Experiment 1, four cereal-based diets were used: control diet (C1), two C1 diets supplemented with 40 g or 80 g of pectin per kg (C1+P40 and C1+P80, respectively), and one diet containing rye (C1-R). Diet C1-R was obtained by inclusion of 270 g of R and 30 g of full-fat soyabean into diet C1 instead of 300 g of wheat. The daily dietary allowance provided pigs with the same level of nutrients. Chromium oxide (Cr2O3) was included as an indigestible marker. The composition of diets C1 and C1-R used in Experiment 1 is given in Table 1.
Table 1. Composition of the control diet (C1) and the diet containing rye (C1-R) used in Experiment 1
Item Diets1
C1 C1-RIngredients, g/kg wheat 550.00 250.00 rye 270.00 maize 150.00 150.00 soyabean meal 140.00 140.00 full-fat soyabean 90.00 120.00 casein 20.00 20.00 dicalcium phosphate 14.00 15.00 limestone 6.00 5.00 salt 3.00 3.00 vitamin-mineral mixture2 5.83 5.83 maize starch 10.41 10.70 L-lysine HCl (78%) 4.88 4.33 L-threonine (98%) 1.67 1.59 DL-methionine (98%) 1.21 1.55 chromium oxide 3.00 3.00Contents of nitrogen and amino acids, g/kg nitrogen 31.20 30.30 lysine 13.47 13.76 threonine 8.16 8.34 methionine 4.25 4.37 cysteine 3.24 3.05 tryptophan 2.16 2.11 isoleucine 7.81 8.04 arginine 11.04 11.51 histidine 4.63 4.80 leucine 14.76 15.31 phenylalanine 9.17 9.24 valine 8.85 8.961 C1: control diet; C1-R: diet with rye obtained by inclusion to 1 kg of C1 diet 270 g rye and 30 g
full-fat soyabean instead of 300 g wheat; diets C1+P40 and C1+P80 contained C1 diet additionally supplemented with 40 and 80 g apple pectin per kg, respectively
2 provided per kg diet, IU: vit. A 15 000; vit. D3 2 000; mg: vit. E 60; vit. B1 1; vit. B2 4; biotin 0.25; vit. B6 3; vit. B12 0.02; vit. K 3; niacin 20; folic acid 5; Ca pantothenian 15; choline 150; Mg 150; Mn 50; Zn 150; Co 0.5; Se 0.3; Cu 150; Fe 125; I 1; g: Ca 1.3

93święch e. et Al.
In Experiment 2, four cereal-based diets were used: C2, C2+P40, C2+P80, and C2-R. Diets C2 and C2-R were formulated based on the SID of AA values in diets C1 and C1-R obtained in Experiment 1 and were supplemented with crystalline lysine, threonine, methionine, and tryptophan to cover the AA requirement of pigs during two experimental periods, below and over 23 kg BW. The composition of diets C2 and C2-R used in Experiment 2 is given in Table 2. Ileal digestibility of crystalline AA was assumed to be close to 100%. Diets C2+P40 and C2+P80 were obtained by additional supplementation of diet C2 with P40 and P80 per kg diet, respectively. The metabolizable energy value of the diets calculated as 95% of digestible energy content was close to 14.0 MJ ME/kg.
Chemical and histological analyses
Dry matter in dietary ingredients and diets, and nitrogen (N) in ingredients, diets, digesta, faeces and urine, were analysed using standard methods (AOAC, 1990). Chromic oxide was determined according to Kimura and Miller (1957). Amino acid analyses were performed with a Beckman high pressure System Gold AA analyzer (Beckman instruments, inc. Fullerton, cA, USA) using modified procedures according to Buraczewska and Buraczewski (1984).
Blood was collected into heparinized tubes and immediately centrifuged for 10 min at 3 900 g at 4ºC. Plasma proteins were precipitated with salicylsulphonic acid and centrifuged for 10 min at 10 000 g at 4ºC. Free Thr content was measured using gas chromatography (Hewlett Packard 5890 series II, Avondale, PA, USA) according to the method described by hušek (1991) with modifications. Urea concentration was determined in pooled plasma samples taken at 2 and 4 h after the morning meal, using a biochemical diagnostic analyzer (Vitros DTII). Viscosity of digesta (after centrifugation for 15 min at 10,000 g) was determined using a Brookfield DV-ii+ digital viscosimeter (Brookfield engineering laboratories Inc., Stoughton, MA, USA) with a cone plate device (CP-40) at 40°C. Tissue samples for histological analyses were placed in Bouin’s solution, dehydrated and infiltrated with paraffin wax. two slides were prepared from one sample, each slide containing a minimum of three sections cut at 5 µm. Sections were stained with haematoxylin and eosin, and villous length, crypt depth, and thickness of the tunica mucosa and myenteron were measured. The measurements of villous length and crypt depth were made on 30 well-oriented villi and 30 corresponding crypts. For the histological evaluation of gut mucins in the mid-jejunum and ileum, representative sections were stained with Alcian blue pH 2.5 (AB 2.5) for demonstration of acidic mucins and with periodic acid-Schiff base (PAS) for identification of neutral mucins. Goblet cells in the intestinal mucosa stained with AB 2.5 and PAS were counted in 10 well-oriented villi and 10 corresponding crypts. All measurements were performed using a light microscope (Zeiss type Axiostar Plus with Axio Vision LE Rel 4.5 software) with a 10 x or 5 x objective.
94 PECTIN AND RYE - THREONINE METABOLISM
Threonine dehydrogenase activity was determined by the method described by Simpson (1998). Calculations and statistical analysis
Calculation of AA ileal digestibility was based on the chromium oxide content in diets and digesta. The AID of AA was calculated using the equation given by Buraczewska et al. (1999), the SID of AA was estimated using values of endogenous AA losses according to Jansman et al. (2002).
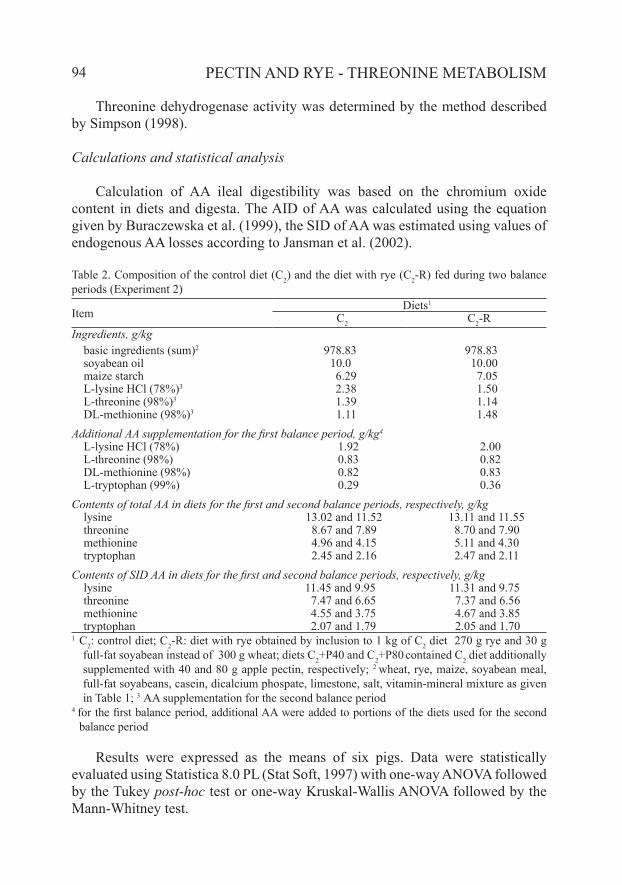
Table 2. Composition of the control diet (C2) and the diet with rye (C2-R) fed during two balance periods (Experiment 2)
ItemDiets1
C2 C2-RIngredients, g/kg basic ingredients (sum)2 978.83 978.83 soyabean oil 10.0 10.00 maize starch 6.29 7.05 L-lysine HCl (78%)3 2.38 1.50 L-threonine (98%)3 1.39 1.14 DL-methionine (98%)3 1.11 1.48Additional AA supplementation for the first balance period, g/kg4
L-lysine HCl (78%) 1.92 2.00 L-threonine (98%) 0.83 0.82 DL-methionine (98%) 0.82 0.83 L-tryptophan (99%) 0.29 0.36Contents of total AA in diets for the first and second balance periods, respectively, g/kg lysine 13.02 and 11.52 13.11 and 11.55 threonine 8.67 and 7.89 8.70 and 7.90 methionine 4.96 and 4.15 5.11 and 4.30 tryptophan 2.45 and 2.16 2.47 and 2.11Contents of SID AA in diets for the first and second balance periods, respectively, g/kg lysine 11.45 and 9.95 11.31 and 9.75 threonine 7.47 and 6.65 7.37 and 6.56 methionine 4.55 and 3.75 4.67 and 3.85 tryptophan 2.07 and 1.79 2.05 and 1.701 C2: control diet; C2-R: diet with rye obtained by inclusion to 1 kg of C2 diet 270 g rye and 30 g
full-fat soyabean instead of 300 g wheat; diets C2+P40 and C2+P80 contained C2 diet additionally supplemented with 40 and 80 g apple pectin, respectively; 2 wheat, rye, maize, soyabean meal, full-fat soyabeans, casein, dicalcium phospate, limestone, salt, vitamin-mineral mixture as given in Table 1; 3 AA supplementation for the second balance period
4 for the first balance period, additional AA were added to portions of the diets used for the second balance period
Results were expressed as the means of six pigs. Data were statistically
evaluated using Statistica 8.0 PL (Stat Soft, 1997) with one-way ANOVA followed by the Tukey post-hoc test or one-way Kruskal-Wallis ANOVA followed by the Mann-Whitney test.

95święch e. et Al.
RESULTS
Ileal digesta viscosity and ileal digestibility of amino acids (Experiment 1)
Effects of P and R on ileal digesta viscosity and AA ileal digestibility are presented in Table 3. Addition of P40 and P80 to diet C1 significantly increased digesta viscosity from 1.3 to 5.0 and to 87.8 mPa.s, respectively. The effect of dietary R on digesta viscosity was smaller (2.1 vs 1.3 mPa.s). Both P levels decreased the AiD and SiD of protein and AA (P≤0.01), however, only the AiD of lysine, arginine, and histidine and the SID of arginine and histidine differed significantly between diets c1+P40 and C1+P80. The lowest digestibility values
Table 3. Ileal digesta viscosity (mPa·s) and ileal digestibility (%) of protein and amino acids; n=6 (Experiment 1)
Item Diets1
SEM P C1 C1+P40 C1+P80 C1-RViscosity 1.32a 4.95c 87.78d 2.06b 7.22 0.05
Apparent ileal digestibilityProtein 77.3b 71.6a 69.8a 75.6b 0.7 <0.001Lys 79.7c 73.3b 70.1a 78.6c 0.5 <0.001Thr 71.7b 63.9a 63.0a 71.3b 0.8 <0.001Met 83.3c 77.9ab 74.9a 80.4bc 0.5 <0.001Cys 68.7b 60.2a 57.3a 64.1b 1.8 0.002Trp 76.1b 70.3a 69.5a 73.8ab 1.1 <0.001Ile 78.1b 73.1a 71.5a 77.3b 0.6 <0.001Arg 86.7c 83.5b 81.0a 86.2c 0.5 <0.001His 83.4c 78.2b 75.4a 82.6c 0.6 <0.001Leu 80.5b 76.1a 74.8a 79.9b 0.7 <0.001Phe 81.8b 77.4a 75.8a 80.6b 0.6 <0.001Val 78.9b 73.5a 72.0a 77.6b 0.6 <0.001
Standardized ileal diestibilityProtein 83.5b 78.0a 76.5a 81.7b 0.7 <0.001Lys 83.8b 77.8a 74.9a 82.6b 0.5 <0.001Thr 81.1b 74.0a 73.7a 80.3b 0.8 <0.001Met 86.9b 81.9a 79.0a 84.3b 0.5 <0.001Cys 75.3b 67.1a 64.5a 71.0ab 1.8 <0.001Trp 82.7b 77.2a 76.7a 80.4ab 1.1 0.003Ile 83.1b 78.2a 76.8a 82.1b 0.6 <0.001Arg 90.3c 87.2b 84.9a 89.6c 0.5 <0.001His 87.5c 82.6b 79.9a 86.6c 0.6 <0.001Leu 83.9b 79.6a 78.5a 83.1b 0.7 <0.001Phe 85.5b 81.3a 79.9a 84.3b 0.6 <0.001Val 85.0b 80.0a 78.7a 83.6b 0.6 <0.001
1 C1: control diet; C1+P40 and C1+P80: diet C1 additionally supplemented with 40 g and 80 g apple pectin per kg, respectively; C1-R: diet with rye obtained by inclusion to 1 kg of C1 diet 270 g rye and 30 g full-fat soyabean instead of 300 g wheat
means in the same row with different superscripts differ at P≤0.05

96 PECTIN AND RYE - THREONINE METABOLISM
were found for cystine and threonine. Inclusion of R in the diet somewhat decreased all values of AID and SID of protein and AA, however, the differences between diets C1 and C1-R were not significant.
Growth performance, nitrogen retention and urea content in plasma (Experiment 2)
the growth performance results are presented in table 4. in the first period, P supplementation tended to decrease ADG from 589 to 556 and 565 g, and to increase the F/G ratio from 1.40 to 1.49 and 1.47 for P40 and P80, respectively. table 4. Growth performance in pigs during the first (1-14 d) and second (15-28 d) periods; n=6 (Experiment 2)
ItemDiets1
SEM PC2 C2+P40 C2+P80 C2-RInitial BW, kg 14.8 14.8 15.1 15.3 0.32Average daily gain, g 1-14 d 589b 556ab 565ab 530a 12.7 0.022 15-28 d 727 686 728 717 14.2 0.206
Feed/gain ratio, kg/kg2
1-14 d 1.40a 1.49a 1.47a 1.57b 0.04 0.015 15-28 d 1.63 1.71 1.61 1.64 0.03 0.2861 C2: control diet; C2+P40 and C2+P80: diet C2 additionally supplemented with 40 g and 80 g apple pectin per kg, respectively; C2-R: diet with rye obtained by inclusion to 1 kg of C2 diet 270 g rye and 30 g full-fat soyabean instead of 300 g wheat
2 feed/gain ratio was calculated taking into account intake of feed without pectin means in the same row with different superscripts differ at P≤0.05
in the second period, no significant effect of P on ADG and F/G ratio was observed. Inclusion of R in diet C2 significantly decreased ADG (530 vs 589 g) and increased the F/G ratio (1.57 vs 1.40), but only in the first period. the results of N balance and urea level are shown in table 5. in the first balance period, significant increases of daily faecal and total N excretion (4.9 vs 3.5 g and 10.5 vs 9.6 g, respectively) and decrease of N retention (60.2 vs 63.6% of N intake) were found in pigs fed diet C2+P80, compared with diet C2. In the second balance period, both P levels significantly increased daily faecal N excretion (from 4.5 to 6.5 and 7.2 g, respectively), increased or tended to increase daily total N excretion (from 14.7 to 15.9 and 15.7 g, respectively), and decreased N retention (from 60.4 to 57.3 and 57.6% of N intake, respectively). No significant effect of R inclusion on N excretion and N retention was found. A tendency to lower urinary N excretion in pigs fed diets supplemented with P and R was observed in both balance periods.

97święch e. et Al.
Table 5. Nitrogen balance and urea concentration in blood plasma; n=6 (Experiment 2)
Item Diets1
SEM PC2 C2+P40 C2+P80 C2-RBalance 1, pigs about 20 kg BW
N intake, g/d 26.4 26.4 26.4 26.0urinary N excretion, g/d 6.1 6.0 5.6 5.4 0.33 0.383faecal N excretion, g/d 3.5a 4.2ab 4.9b 4.2ab 1.05 0.002total N excretion, g/d 9.6a 10.2ab 10.5b 9.6a 0.17 0.011N retention, g/d 16.8b 16.2b 15.9a 16.4b 0.19 0.015protein digestibility2, % 86.7b 84.0ab 81.3a 83.9ab 0.85 0.002N retention, % N intake 63.6b 61.4ab 60.2a 63.1b 0.71 0.007N retention, % N absorbed 73.4 73.1 74.1 75.4 1.28 0.590
Balance 1, pigs about 30 kg BWN intake, g/d 37.2 37.2 37.2 36.4urinary N excretion, g/d 10.3 9.4 8.5 9.5 0.41 0.062faecal N excretion, g/d 4.5a 6.5b 7.2c 5.4ab 0.30 <0.001total N excretion, g/d 14.7a 15.9b 15.7ab 14.9ab 0.29 0.023N retention, g/d 22.5b 21.3a 21.4a 21.5ab 0.30 0.027protein digestibility2, % 88.0c 82.5ab 80.5a 85.1bc 0.72 <0.001N retention, % N intake 60.4 b 57.3a 57.6a 58.9b 0.80 0.040N retention, % N absorbed 68.6 69.5 71.5 69.2 1.14 0.199
Urea in plasma, mmol/l 3.01b 2.85b 2.13a 2.98b 0.22 0.0491 as in Table 4; 2 total tract digestibility of protein means in the same row with different superscripts differ at P≤0.05
Plasma urea concentration was decreased by added P, but only the difference between pigs fed diets C2 and C2+P80 was significant (table 5). inclusion of R in C2 diet did not affect urea concentration.
Free threonine in plasma and threonine dehydrogenase activity in liver and pancreas (Experiment 2)
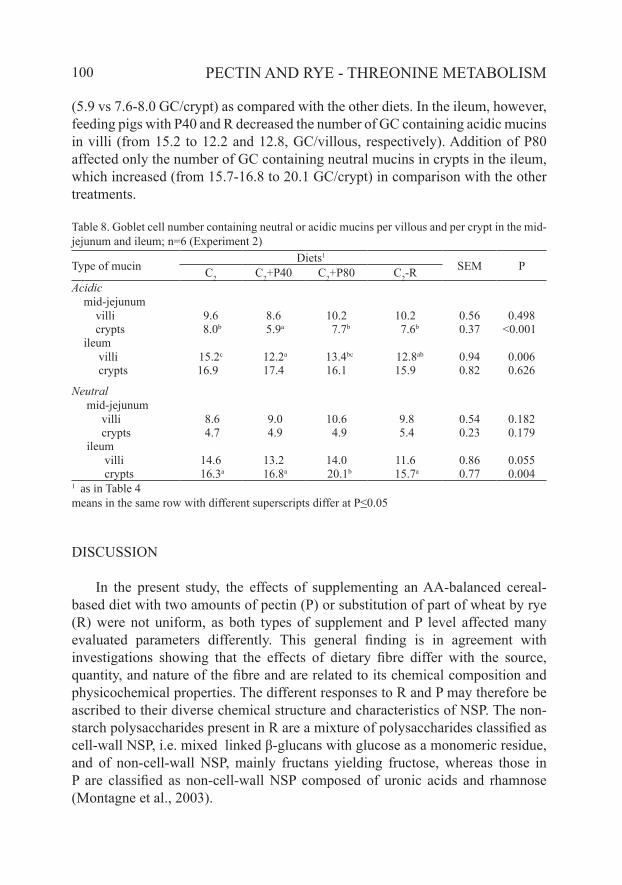
The concentration of free Thr in plasma of fasted animals and its changes during six h after the morning meal are shown in Figure 1. At no sampling time thr levels differed significantly among the treatments, but in all of the samples taken after the meal they were the highest on diet C2+P40. The concentration of the AA increased after the meal until the first hour in animals fed on all diets and until the second hour on diets C2-R and C2+ P40. After 6 h, free Thr concentrations were close to fasting levels.
The experimental diets had no effect on liver and pancreas weights (data not shown). TDG activity was higher in the pancreas than in the liver (Table 6) and was not affected by the diet. A tendency towards lower pancreatic values in animals fed diets supplemented with P and R than in the control pigs (0.62, 0.52 and 0.51 vs 0.70 µmol/min/g, respectively), can be noticed, however.

98 PECTIN AND RYE - THREONINE METABOLISM
1.2
C21.0
C2 + P40 C2 + P80
0.8
µmol
/ml
C2-R
0.6
0.4
0.2
0.00 1 2 3 4 5 6
h
Figure 1. Threonine concentration in plasma (µmol/ml) of pigs fed different experimental diets, n=6 (Experiment 2): C2: control diet; C2+P40 and C2+P80: control diet additionally supplemented with 40 g and 80 g apple pectin per kg, respectively; C2-R: diet with rye obtained by inclusion to 1 kg of C2 diet 270 g rye and 30 g full-fat soyabean instead of 300 g wheat
Table 6. Threonine dehydrogenase activity in the liver and pancreas, µmol/min/g; n=6 (Experiment 2)
ItemDiets1
SEM PC2 C2+P40 C2+P80 C2-RLiver 0.38 0.40 0.33 0.30 0.05 0.559Pancreas 0.70 0.62 0.52 0.51 0.07 0.1151 see Table 4means in the same row with different superscripts differ at P≤0.05
Morphology of the small intestine (Experiment 2)
The experimental diets had no effect on the weights of the small intestine segments (data not shown), but they modified their morphometry (table 7). Villi length was affected by the P level in different ways: P40 decreased villi length in the duodenum (from 347 to 330 µm), whereas P80 increased its length in the ileum (from 331 to 375 µm). Villi surface area was significantly larger in the mid-jejunum of pigs fed diets with both P levels (0.25 and 0.27 vs 0.21 mm2, respectively) and in the ileum in pigs fed the diet with P40 (0.24 vs 0.20 mm2). Crypt depth was smaller in the mid-jejunum in pigs fed the diet containing P40 (240 vs 267 µm) and in the ileum of pigs fed the diet containing P80 (232 vs 248 µm). The villi length to crypt depth ratio was affected by P in an irregular way. the tunica mucosa was significantly thinner in the mid-jejunum of pigs fed diet C2+P40 (676 vs 705 µm). Myenteron thickness was the greatest (P≤0.001) in all segments in pigs fed diets with P in comparison with the other diets.

99święch e. et Al.
Table 7. Measurements of histological parameters of different parts of the small intestine; µm; n=6 (Experiment 2)
ItemDiets1
SEM PC2 C2+P40 C2+P80 C2-RVilli length, μm duodenum 347b 330a 352b 355ab 6 0.041 mid-jejunum 373a 367a 386a 424b 7 <0.001 ileum 331a 325a 375b 336a 6 <0.001
Villi surface area, mm2
duodenum 0.23 0.24 0.25 0.25 0.01 0.055 mid-jejunum 0.21a 0.25b 0.27b 0.26b 0.01 <0.001 ileum 0.20a 0.24b 0.21a 0.23b 0.01 <0.001
Crypt depth, μm duodenum 314a 335a 320a 392b 8 <0.001 mid-jejunum 267b 240a 251ab 315c 6 <0.001 ileum 248b 262b 232a 305c 6 <0.001
Villi length to crypt depth ratio duodenum 1.21c 1.09b 1.18c 0.94a 0.04 <0.001 mid-jejunum 1.48a 1.66b 1.64b 1.40a 0.06 <0.001 ileum 1.43c 1.32b 1.72d 1.15a 0.04 <0.001
Tunica mucosa thickness, μm duodenum 752ab 755ab 729a 805b 11 0.038 mid-jejunum 705b 676a 694ab 781c 9 <0.001 ileum 644 650 654 671 9 0.098
Myenteron thickness, μm duodenum 556ab 635c 569b 559a 12 <0.001 mid-jejunum 359a 443c 421b 374a 8 <0.001 ileum 707a 819b 818b 728a 14 <0.0011 as in Table 4means in the same row with different superscripts differ at P≤0.05
In comparison with all C2 diets, R inclusion significantly increased villi length in the mid-jejunum (424 vs 367-386 µm) and crypt depth in all intestinal segments. Therefore, the villi length to crypt depth ratio showed the lowest values in all segments (P≤0.001). tunica mucosa thickness was significantly increased in the mid-jejunum in pigs fed R (from 705 to 781 µm). Similarly to P, addition of R also increased villi surface in the mid-jejunum (from 0.21 vs to 0.26 mm2) and ileum (from 0.20 to 0.23 mm2) as compared with diet C2.
Goblet cell number in the small intestine (Experiment 2)
The effects of P and R on the number of GC containing acidic and neutral mucins in the mid-jejunum and ileum are presented in Table 8. In the mid-jejunum, the number of acidic type GC in crypts was decreased by P40 supplementation
100 PECTIN AND RYE - THREONINE METABOLISM
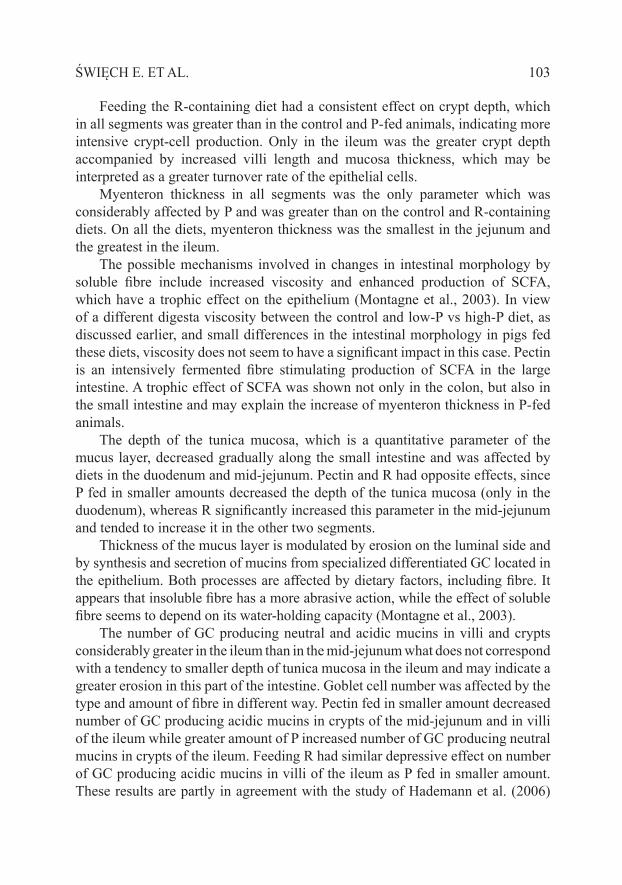
(5.9 vs 7.6-8.0 GC/crypt) as compared with the other diets. In the ileum, however, feeding pigs with P40 and R decreased the number of GC containing acidic mucins in villi (from 15.2 to 12.2 and 12.8, GC/villous, respectively). Addition of P80 affected only the number of GC containing neutral mucins in crypts in the ileum, which increased (from 15.7-16.8 to 20.1 GC/crypt) in comparison with the other treatments.
Table 8. Goblet cell number containing neutral or acidic mucins per villous and per crypt in the mid-jejunum and ileum; n=6 (Experiment 2)
Type of mucinDiets1
SEM PC2 C2+P40 C2+P80 C2-RAcidic mid-jejunum villi 9.6 8.6 10.2 10.2 0.56 0.498 crypts 8.0b 5.9a 7.7b 7.6b 0.37 <0.001 ileum villi 15.2c 12.2a 13.4bc 12.8ab 0.94 0.006 crypts 16.9 17.4 16.1 15.9 0.82 0.626
Neutral mid-jejunum villi 8.6 9.0 10.6 9.8 0.54 0.182 crypts 4.7 4.9 4.9 5.4 0.23 0.179 ileum villi 14.6 13.2 14.0 11.6 0.86 0.055 crypts 16.3a 16.8a 20.1b 15.7a 0.77 0.0041 as in Table 4means in the same row with different superscripts differ at P≤0.05
DISCUSSION
In the present study, the effects of supplementing an AA-balanced cereal-based diet with two amounts of pectin (P) or substitution of part of wheat by rye (R) were not uniform, as both types of supplement and P level affected many evaluated parameters differently. this general finding is in agreement with investigations showing that the effects of dietary fibre differ with the source, quantity, and nature of the fibre and are related to its chemical composition and physicochemical properties. The different responses to R and P may therefore be ascribed to their diverse chemical structure and characteristics of NSP. The non-starch polysaccharides present in R are a mixture of polysaccharides classified as cell-wall NSP, i.e. mixed linked β-glucans with glucose as a monomeric residue, and of non-cell-wall NSP, mainly fructans yielding fructose, whereas those in P are classified as non-cell-wall NSP composed of uronic acids and rhamnose (Montagne et al., 2003).

101święch e. et Al.
In our study, ileal digestibility of all AA was depressed by P, but the response was not proportional to the amount added to the diet. The differences in AID and SID values were considerably greater between pigs fed on diets C1 and C1+P40 than between animals fed the diets with the lower and higher P supplement. The negative effect of P on AID and SID is consistent with the results of experiments on young and adult pigs presented by Mosenthin et al. (1994) and Zhu (2003).
Replacing part of the wheat with R also decreased the ileal digestibility of protein and AA, however, to a smaller extent than P. The lower ileal digestibility of R than wheat protein is in agreement with data reported by Buraczewska (2001), who also indicated that the AiD of R protein is related to the soluble dietary fibre content and viscosity of this cereal.
The increase of digesta viscosity by soluble NSP is often considered to be the main factor responsible for lower ileal digestibility of protein due to the reduced mixing rate of digesta and diffusion of particles, and the formation of complexes with digestive enzymes. The results of some experiments reviewed by Souffrant (2001) do not confirm this relationship, however. Also in our experiment the considerable decrease of ileal protein digestibility at the lower P supplement was accompanied by an only minor increase of digesta viscosity and, in contrast, the high digesta viscosity induced by the greater amount of P was accompanied by a relatively small decrease of digestibility. This discrepancy between the effects of P on viscosity and ileal digestibility seems to confirm the assumption that the negative effect of P on ileal digestibility is also related to other factors, such as increased endogenous nitrogen losses and microbial fermentation in the gut (Schulze et al., 1995; McCullough et al., 1998) as well as digesta passage rate (Bartelt et al., 2002), which contribute to changes in the digestibility of nutrients, their absorption, and utilization.
the results of experiment 2 confirm the negative effect of P not only on ileal, but also on total tract protein digestibility, the effect of P level being more uniform in younger than in older pigs. The increase of faecal nitrogen excretion due to P may reflect not only a lower degree of enzymatic protein digestion in the small intestine, but also more intensive synthesis of bacterial protein in the large intestine.
Inclusion of R into the C2 diet slightly depressed total tract digestibility of protein in younger and older pigs, but the differences were not significant.
In agreement with decreased total tract protein digestibility, nitrogen retention was lowered by P supplementation. Nevertheless, utilization of absorbed nitrogen was not affected by P in younger pigs, whereas in older animals it tended to be even slightly improved. this finding is the opposite of the expected deterioration of protein utilization of P-containing diets due to their lower ileal protein digestibility and smaller content of ileal digestible essential AA, since only diets C2 and C2-R were supplemented with four limiting AA according to their actual SID contents

102 PECTIN AND RYE - THREONINE METABOLISM
determined in Experiment 1. The possible explanation may the apparently excessive level of AA supplementation of the control diet according to proposals given by Rademacher et al. (1999), probably providing sufficient amounts of SiD AA also to the P-containing diets, in spite of their lower ileal digestibility. The actual dietary contents of SID AA covered the requirement given by NRC (1998), except for the marginally lower tryptophan concentration. A slight decrease of urinary nitrogen excretion and improvement in the utilization of absorbed nitrogen was accompanied by a lower plasma urea concentration (significant for the higher P supplementation). Such effects of fermentable NSP, often found in monogastric animals, point to more intensive urea utilization for synthesis of microbial protein in the large intestine due to a greater energy supply.
Deterioration of body weight gain and feed utilization was found only in younger pigs fed the R-containing diet, and it was not related to any parameters of protein utilization. This may indicate a lower than calculated energy value of this diet or, which is less likely, an effect of some antinutritional factors present in R (as resorcinols).
The origin and level of soluble NSP used in the present study had no effect on the length and weight of the small intestine. this finding is at variance with the results of studies reported by Montagne et al. (2003) indicating the trophic effect of fibre on the gut. Both P level and R affected intestinal morphology, but the effects varied among the segments and parameters under study, which is in line with the general statement on the diverse effects of fibre depending on its physico-chemical characteristics and level of incorporation, site of the gut, age of animals, and duration of ingestion.
in general, addition of P provoked less extensive modifications of all parameters except myenteron thickness than inclusion of R. Moreover, the response of many parameters to P was not proportional to the amount added to the diet. Both amounts of P had small and inconsistent effects on villi length, villi surface, crypt depth, and villi length to crypt depth ratio, parameters reflecting epithelial cell turnover rate and considered related to the digestive capacity of the small intestine. this finding is apparently not consistent with the considerable depression of ileal digestibility of protein and AA by P found in Experiment 1. The possible explanation may be a shorter period of feeding experimental diets and younger age of pigs in digestibility experiment than in Experiment 2 when morphological parameters were determined, indicating probably some adaptation of the gut to this type of fibre. in the experiments performed on early weaned piglets, the effects of soluble fibre on gut morphology were more evident than in our study, but were also equivocal. Feeding citrus pulp in similar amounts reduced both villi length and crypt depth in Hedemann et al. (2006) experiment while feeding diet containing low viscosity methylcellulose increased villous length and crypt depth as found by McDonald et al. (2001).
103święch e. et Al.
Feeding the R-containing diet had a consistent effect on crypt depth, which in all segments was greater than in the control and P-fed animals, indicating more intensive crypt-cell production. Only in the ileum was the greater crypt depth accompanied by increased villi length and mucosa thickness, which may be interpreted as a greater turnover rate of the epithelial cells.
Myenteron thickness in all segments was the only parameter which was considerably affected by P and was greater than on the control and R-containing diets. On all the diets, myenteron thickness was the smallest in the jejunum and the greatest in the ileum.
The possible mechanisms involved in changes in intestinal morphology by soluble fibre include increased viscosity and enhanced production of ScFA, which have a trophic effect on the epithelium (Montagne et al., 2003). In view of a different digesta viscosity between the control and low-P vs high-P diet, as discussed earlier, and small differences in the intestinal morphology in pigs fed these diets, viscosity does not seem to have a significant impact in this case. Pectin is an intensively fermented fibre stimulating production of ScFA in the large intestine. A trophic effect of SCFA was shown not only in the colon, but also in the small intestine and may explain the increase of myenteron thickness in P-fed animals.
The depth of the tunica mucosa, which is a quantitative parameter of the mucus layer, decreased gradually along the small intestine and was affected by diets in the duodenum and mid-jejunum. Pectin and R had opposite effects, since P fed in smaller amounts decreased the depth of the tunica mucosa (only in the duodenum), whereas R significantly increased this parameter in the mid-jejunum and tended to increase it in the other two segments.
Thickness of the mucus layer is modulated by erosion on the luminal side and by synthesis and secretion of mucins from specialized differentiated GC located in the epithelium. Both processes are affected by dietary factors, including fibre. it appears that insoluble fibre has a more abrasive action, while the effect of soluble fibre seems to depend on its water-holding capacity (Montagne et al., 2003).
The number of GC producing neutral and acidic mucins in villi and crypts considerably greater in the ileum than in the mid-jejunum what does not correspond with a tendency to smaller depth of tunica mucosa in the ileum and may indicate a greater erosion in this part of the intestine. Goblet cell number was affected by the type and amount of fibre in different way. Pectin fed in smaller amount decreased number of GC producing acidic mucins in crypts of the mid-jejunum and in villi of the ileum while greater amount of P increased number of GC producing neutral mucins in crypts of the ileum. Feeding R had similar depressive effect on number of GC producing acidic mucins in villi of the ileum as P fed in smaller amount. These results are partly in agreement with the study of Hademann et al. (2006)

104 PECTIN AND RYE - THREONINE METABOLISM
who found lower acidic mucin staining areas only in crypts in the mid-jejunum, ileum, and mid-colon in early weaned piglets fed a diet with citrus pectin. In contrast, acidic and neutral mucin staining areas in the small intestine were not affected by soluble NSP fed to adult pigs (Serena et al., 2008). This may indicate that the effect of fibre on secretion of mucins in the small intestine depends on the age of pigs.
Since acidic mucins protect the gut against bacterial translocation (Deplancke and Gaskins, 2001), feeding P (in smaller amounts) and R may increase the susceptibility of pigs to bacterial infection. The positive effect of the larger amount of P on the number of GC containing neutral mucins in crypts of the ileum is not consistent with the results of Hedemann et al. (2006), who found a similar effect in the mid-colon, but not in the ileum.
The rate of colonic mucosal protein synthesis, particularly of Thr-rich mucin protein, is considered an important factor affecting utilization of Thr for protein deposition in growing animals. Pectin increases the fractional synthesis rate of colonic mucosal proteins (Libao-Mercado et al., 2007) and, therefore, may enhance the total requirement for Thr and affect the metabolism of this AA.
In our study, neither of the parameters related to Thr metabolism, i.e. the evolution of postprandial free Thr level and TDG activity in the liver and pancreas, were affected by the type and level of dietary NSP. It may be therefore concluded that the small changes in tunica mucosa depth and GC type and number due to P and R did not produce evident changes in Thr metabolism.
CONCLUSIONS
Feeding pectin or rye negatively affects the ileal digestibility of protein and amino acids and provokes irregular changes in small intestinal morphology. These effects cannot be attributed to the increase of digesta viscosity as the main factor. The parameters related to threonine metabolism were not affected by non-starch polysaccharides, probably because the requirement for this amino acid was covered factor. The parameters related to threonine metabolism are not affected by non-starch polysaccharides probably due to the covered requirement for this amino acid.
105święch e. et Al.
REFERENCES
AOAc, 1990. Association of Analitycal chemists, Official Methods of Analysis. 15th Edition. Washington, DC
Bartelt J., Jadamus A., wiese F., święch e., Buraczewska l., Simon O., 2002. Apparent precaecal digestibility of nutrients and level of endogenous nitrogen in digesta of the small intestine of growing pigs as affected by various digesta viscosities. Arch. Anim. Nutr. 56, 93-107
Buraczewska L., 2001. Fibre components negatively affect ileal protein digestibility in pigs. J. Anim. Feed Sci. 10, Suppl. 1, 139-152
Buraczewska L., Buraczewski S., 1984. A note on determination of methionine and tryptophan. In: Proceeding of the 6th International Symposium on Amino Acids. Serock (Poland). Polish Scientific Publishers, warsaw, pp. 47-50
Buraczewska l., święch e., le Bellego l., 2006. Nitrogen retention and growth performance of 25 to 50 kg pigs fed diets of two protein levels and different ratios of digestible threonine to lysine. J. Anim. Feed Sci. 15, 25-36
Buraczewska l., wasilewko J., Fandrejewski h., Żebrowska t., han i.K., 1999. Formulation of pig diets according to ileal digestible amino acid content. Livest. Prod. Sci. 59, 13-24
Deplancke B., Gaskins H.R., 2001. Microbial modulation of innate defense: goblet cells and the intestinal mucus layer. Amer. J. Clin. Nutr. 73, 1131S-1141S
Hedemann M.S., Eskildsen M., Lærke H.N., Pedersen C., Lindberg J.E., Laurinen P., Bach Knudsen K.E., 2006. Intestinal morphology and enzymatic activity in newly weaned pigs fed contrasting fibre concentrations and fiber properties. J. Anim. Sci. 84, 1375-1386
hušek P., 1991. Amino acid derivatization and analysis in five minutes. FeBS lett. 280, 354-356Jansman A.J.M., Smink W., van Leeuwen P., Rademacher M., 2002. Evaluation through literature
data of the amount and amino acid composition of basal endogenous crude protein at the terminal ileum of pigs. Anim. Feed Sci. Tech. 98, 49-60
Kimura F.T., Miller V.L., 1957. Improved determination of chromic oxide in cow feed and feces. J. Agr. Food Chem. 5, 216
Libao-Mercado A.J., Zhu C.L., Fuller M.F., Rademacher M., Séve B., de Lange C.F.M., 2007. Effect of feeding fermentable fiber on suthesis of total and mucosal protein in the intestine of the growing pigs. Livest. Sci. 109, 125-128
Mccullough J.S., Ratcliffe B., Mandir N., carr K.e., Goodlad R.A., 1998. Dietary fibre and intestinal microflora: effects on intestinal morphometry and crypt branching. Gut 42, 799-806
McDonald D.E., Pethick D.W., Mullan B.P., Hampson D.J., 2001. Increasing viscosity of the intestinal contents alters small intestinal structure and intestinal growth, and stimulates proliferation of enterotoxigenic Escherichia coli in newly-weaned pigs. Brit. J. Nutr. 86, 487-798
Montagne l., Pluske J.R., hampson D.J., 2003. A review of interactions between dietary fibre and the intestinal mucosa, and their consequences on digestive health in young non-ruminant animals. Anim. Feed Sci. Tech. 108, 95-117
Mosenthin R., Sauer W.C., Ahrens F., 1994. Dietary pectin’s effect on ileal and fecal amino acid digestibility and exocrine pancreatic secretions in growing pigs. J. Nutr. 124, 1222-1229
Myrie S.B., Bertolo R.F., Sauer W.C., Ball R.O., 2006. Effect of common antinutrive factors and fibrous feedstuffs in pig diets on amino acid digestibilities with special emphasis on threonine. J. Anim. Sci. 86, 609-619
NRC, 1998. Nutrient Requirements of Swine. 10th Edition. National Academy Press. Washington, DC
Rademacher M., Sauer W.C., Jansman A.J.M., 1999. Standardized ileal digestibility of amino acids in pigs, The New System, Degussa-Hülls

106 PECTIN AND RYE - THREONINE METABOLISM
Schulze H., van Leeuwen P., Verstegen M.W.A., van der Berg J.W., 1995. Dietary level and source of neutral detergent fiber and ileal endogenous nitrogen flow in pigs. J. Anim. Sci. 73, 441-448
Serena A., Hedemann M.S., Bach Knudsen K.E., 2008. influence of dietary fiber on luminal environment and morphology in the small and large intestine of sows. J. Anim. Sci. 86, 2217-2227
Simpson G.J., 1998. Development of methods to improve the estimation of threonine catabolism in the growing pigs. MSc. Thesis, University of Guelph, Guelph (Canada)
StatSoft Inc., 1997. Statistica 8.0 PL for Windows, Tulsa (USA)Souffrant w.B., 2001. effect of dietary fibre on ileal digestibility and endogenous nitrogen lossess
in the pigs. Anim. Feed Sci. Tech. 90, 93-102Van Leeuwen P., van Kleef D., van Kempen G.J.M., Huisman J., Verstegen M.W.A., 1991. The post
valve T-ceacum canulation technique in pigs applicated to determine the digestibility of amino acids in maize, groundnut and sunflower meal. J. Anim. Physiol. Anim. Nutr. 65, 185-193
wenk c., 2001. the role of dietary fibre in the digestive physiology of the pig. Anim. Feed Sci. Tech. 90, 21-33
Zhu C.L., 2003. Effects of graded levels of dietary pectin on amino acid utilization for body protein deposition in growing pigs. MSc Thesis, University of Guelph, Guelph, Ontario (Canada)