Embed Size (px)
Citation preview
The Effects of Open Source License Choice on Software Reuse
John Brewer VIII
Thesis submitted to the Faculty of theVirginia Polytechnic Institute and State University
in partial fulfillment of the requirements for the degree of
Master of Sciencein
Computer Science and Applications
William B. Frakes, ChairGregory Kulczycki
Csaba Egyhazy
May 4, 2012Falls Church, Virginia
Keywords: Open Source License, Software Reuse, Dependency Analysis, PackageRepository
Copyright 2012, John Brewer VIII
The Effects of Open Source License Choice on Software Reuse
John Brewer VIII
ABSTRACT
Previous research shows that software reuse can have a positive impact on software de-velopment economics, and that the adoption of a specific open source license can influ-ence how a software product is received by users and programmers. This study attemptsto bridge these two research areas by examining how the adoption of an open source li-cense affects software reuse. Two reuse metrics were applied to 9,570 software packagescontained in the Fedora Linux software repository. Each package was evaluated to deter-mine how many external components it reuses, as well as how many times it is reusedby other software packages. This data was divided into subsets according to license typeand software category. The study found that, in general, (1) software released under arestrictive license reuse more external components than software released under a per-missive license, and (2) that software released under a permissive license is more likelyto be reused than software released under a restrictive license. However, there are ex-ceptions to these conclusions, as the effect of license choice on reuse varies by softwarecategory.
Contents
1 Introduction 1
1.1 Practical Reuse . . . . . . . . . . . . . . . . . . . . . . . . . . . . . . . . . . . . 2
1.2 Identifying Open Source Software . . . . . . . . . . . . . . . . . . . . . . . . 3
1.3 Problem Statement . . . . . . . . . . . . . . . . . . . . . . . . . . . . . . . . . 5
2 Literature Review 7
2.1 Open Source Licenses . . . . . . . . . . . . . . . . . . . . . . . . . . . . . . . . 7
2.1.1 A Brief History of Open Source Software . . . . . . . . . . . . . . . . 7
2.1.2 Open Source License Types . . . . . . . . . . . . . . . . . . . . . . . . 10
2.1.3 Open Source License Categories . . . . . . . . . . . . . . . . . . . . . 13
2.2 License Choice Matters . . . . . . . . . . . . . . . . . . . . . . . . . . . . . . . 14
2.2.1 License Choice Matters to Programmers . . . . . . . . . . . . . . . . . 15
2.2.2 License Choice Matters to Projects . . . . . . . . . . . . . . . . . . . . 18
2.2.3 License Choice Affects Commercial Decisions . . . . . . . . . . . . . 21
2.3 Methods of Studying Open Source . . . . . . . . . . . . . . . . . . . . . . . . 22
2.4 Open Source Reuse . . . . . . . . . . . . . . . . . . . . . . . . . . . . . . . . . 29
2.5 Component Reuse . . . . . . . . . . . . . . . . . . . . . . . . . . . . . . . . . . 30
3 Methods 35
3.1 Independent Variables . . . . . . . . . . . . . . . . . . . . . . . . . . . . . . . 35
3.1.1 License Type . . . . . . . . . . . . . . . . . . . . . . . . . . . . . . . . . 35
3.1.2 Software Category . . . . . . . . . . . . . . . . . . . . . . . . . . . . . 36
iii
3.2 Dependent Variables . . . . . . . . . . . . . . . . . . . . . . . . . . . . . . . . 37
3.2.1 Package Dependency Count . . . . . . . . . . . . . . . . . . . . . . . . 37
3.2.2 Dependent Package Count . . . . . . . . . . . . . . . . . . . . . . . . 38
3.2.3 Limitations . . . . . . . . . . . . . . . . . . . . . . . . . . . . . . . . . 39
3.2.4 Package Dependency Count Hypotheses . . . . . . . . . . . . . . . . 40
3.2.5 Reusability Hypotheses . . . . . . . . . . . . . . . . . . . . . . . . . . 41
3.3 Data Collection . . . . . . . . . . . . . . . . . . . . . . . . . . . . . . . . . . . 43
3.3.1 Dependency Analysis . . . . . . . . . . . . . . . . . . . . . . . . . . . 43
3.3.2 Software Repository . . . . . . . . . . . . . . . . . . . . . . . . . . . . 44
3.3.3 Limitations of Using a Fedora Repository As a Data Source . . . . . 45
3.3.4 Data Extraction . . . . . . . . . . . . . . . . . . . . . . . . . . . . . . . 46
4 Results 51
4.1 Summary Statistics . . . . . . . . . . . . . . . . . . . . . . . . . . . . . . . . . 51
4.1.1 Package Counts by License Type and Category . . . . . . . . . . . . . 51
4.1.2 Package Dependency Count . . . . . . . . . . . . . . . . . . . . . . . . 53
4.1.3 Dependent Package Count . . . . . . . . . . . . . . . . . . . . . . . . 56
4.2 Package Dependency Count . . . . . . . . . . . . . . . . . . . . . . . . . . . . 59
4.2.1 Restrictive vs Permissive . . . . . . . . . . . . . . . . . . . . . . . . . 59
4.2.2 Package Dependency Counts by Software Category . . . . . . . . . . 62
4.2.3 Software Development Tools . . . . . . . . . . . . . . . . . . . . . . . 63
4.2.4 Applications . . . . . . . . . . . . . . . . . . . . . . . . . . . . . . . . . 66
4.2.5 System Environment Packages . . . . . . . . . . . . . . . . . . . . . . 69
4.2.6 User Interface . . . . . . . . . . . . . . . . . . . . . . . . . . . . . . . . 72
4.3 Dependent Package Count . . . . . . . . . . . . . . . . . . . . . . . . . . . . . 75
4.3.1 Restrictive vs. Permissive . . . . . . . . . . . . . . . . . . . . . . . . . 75
4.3.2 Dependent Package Count by Software Category . . . . . . . . . . . 78
4.3.3 Software Development Tools . . . . . . . . . . . . . . . . . . . . . . . 79
4.3.4 Applications . . . . . . . . . . . . . . . . . . . . . . . . . . . . . . . . . 81
iv
4.3.5 System Environment Packages . . . . . . . . . . . . . . . . . . . . . . 84
4.3.6 User Interface . . . . . . . . . . . . . . . . . . . . . . . . . . . . . . . . 87
5 Conclusions 91
5.1 Hypothesis Review . . . . . . . . . . . . . . . . . . . . . . . . . . . . . . . . . 91
5.1.1 Package Dependency Count . . . . . . . . . . . . . . . . . . . . . . . . 91
5.1.2 Dependent Package Count . . . . . . . . . . . . . . . . . . . . . . . . 93
5.1.3 Summary . . . . . . . . . . . . . . . . . . . . . . . . . . . . . . . . . . 94
5.2 Future Work . . . . . . . . . . . . . . . . . . . . . . . . . . . . . . . . . . . . . 95
6 Appendix 97
6.1 License Type Tables . . . . . . . . . . . . . . . . . . . . . . . . . . . . . . . . . 97
6.1.1 Restrictive License Table Query . . . . . . . . . . . . . . . . . . . . . . 97
6.1.2 Permissive License Table Query . . . . . . . . . . . . . . . . . . . . . 98
6.2 Package Dependency Count Queries . . . . . . . . . . . . . . . . . . . . . . . 99
6.2.1 All Packages By License Type . . . . . . . . . . . . . . . . . . . . . . . 99
6.2.2 By License Type and Software Category . . . . . . . . . . . . . . . . . 99
6.3 Dependent Package Count Queries . . . . . . . . . . . . . . . . . . . . . . . . 102
6.3.1 All Packages By License Type . . . . . . . . . . . . . . . . . . . . . . . 102
6.3.2 All Packages By License Type . . . . . . . . . . . . . . . . . . . . . . . 102
6.3.3 By License Type and Software Category . . . . . . . . . . . . . . . . . 103
Bibliography 106
v
List of Figures
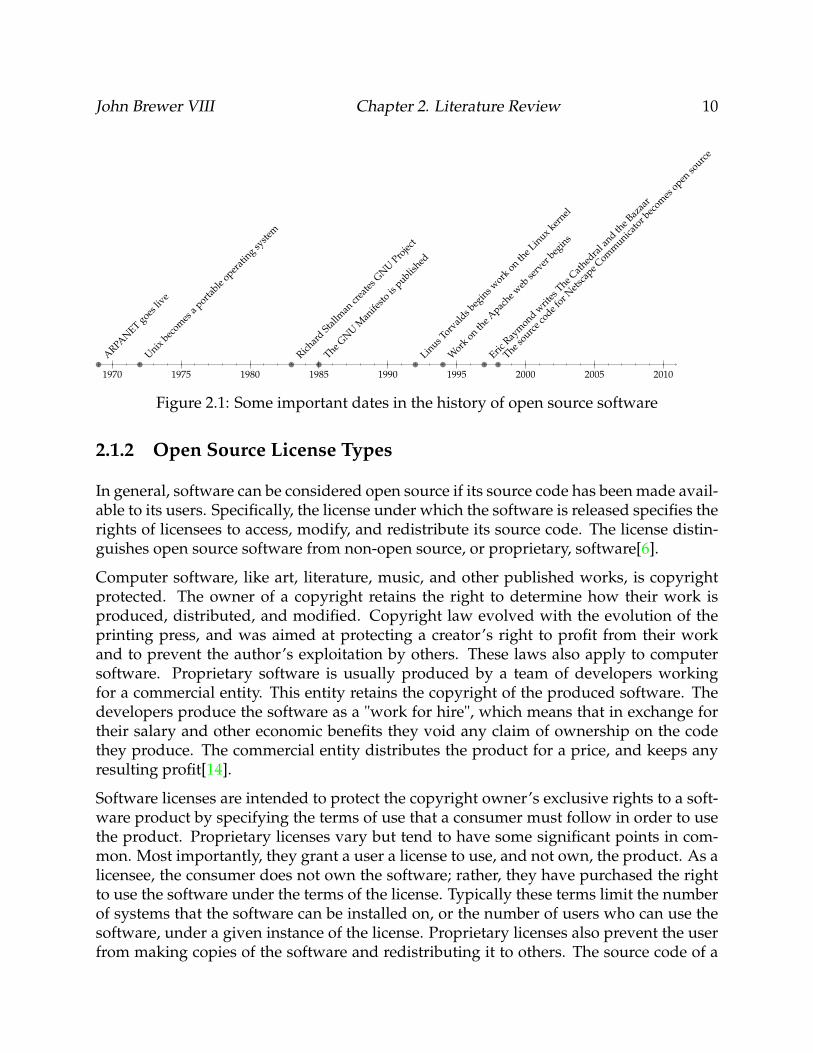
2.1 Some important dates in the history of open source software . . . . . . . . . 10
2.2 Fishbone diagram of factors that influence the adoption of an open sourcelicense . . . . . . . . . . . . . . . . . . . . . . . . . . . . . . . . . . . . . . . . 23
3.1 Abbreviated Yum database entity relationship diagram . . . . . . . . . . . . 48
3.2 External reuse SQL query example . . . . . . . . . . . . . . . . . . . . . . . . 48
4.1 Histogram of package dependency counts of all packages . . . . . . . . . . . 54
4.2 Box plot of the package dependency counts for all packages . . . . . . . . . 55
4.3 Histogram of the dependent package counts of all packages . . . . . . . . . 56
4.4 Histogram of dependent package counts greater than 0 . . . . . . . . . . . . 58
4.5 Box plot of the dependent package counts of all packages . . . . . . . . . . . 59
4.6 Histograms of the package dependency counts of all packages by licensetype . . . . . . . . . . . . . . . . . . . . . . . . . . . . . . . . . . . . . . . . . . 60
4.7 Box plots of package dependency counts of all packages by license type . . 61
4.8 Comparison of median package dependency count of all packages by li-cense type . . . . . . . . . . . . . . . . . . . . . . . . . . . . . . . . . . . . . . 62
4.9 Comparison of package dependency count by software category . . . . . . . 63
4.10 Histogram of package dependency counts of software development toolsby license type . . . . . . . . . . . . . . . . . . . . . . . . . . . . . . . . . . . . 64
4.11 Box plots of package dependency counts of software development tools bylicense type . . . . . . . . . . . . . . . . . . . . . . . . . . . . . . . . . . . . . 65
4.12 Comparison of median package dependency count of software develop-ment tools by license type . . . . . . . . . . . . . . . . . . . . . . . . . . . . . 66
4.13 Histogram of package dependency counts of applications by license type . 67
vi
4.14 Box plots of package dependency counts of applications by license type . . 68
4.15 Comparison of median package dependency count of applications by li-cense type . . . . . . . . . . . . . . . . . . . . . . . . . . . . . . . . . . . . . . 69
4.16 Histogram of package dependency counts of system environment compo-nents by license type . . . . . . . . . . . . . . . . . . . . . . . . . . . . . . . . 70
4.17 Box plots of package dependency counts of system environment compo-nents by license type . . . . . . . . . . . . . . . . . . . . . . . . . . . . . . . . 71
4.18 Comparison of median package dependency counts of system environ-ment packages by license type . . . . . . . . . . . . . . . . . . . . . . . . . . . 72
4.19 Histograms of package dependency counts of user interface packages bylicense type . . . . . . . . . . . . . . . . . . . . . . . . . . . . . . . . . . . . . 73
4.20 Box plots of package dependency counts of user interface packages by li-cense type . . . . . . . . . . . . . . . . . . . . . . . . . . . . . . . . . . . . . . 74
4.21 Comparison of median package dependency count of user interface pack-ages by license type . . . . . . . . . . . . . . . . . . . . . . . . . . . . . . . . . 75
4.22 Histograms of dependent package counts of all packages by license type . . 76
4.23 Box plots of dependent package counts of all packages by license type . . . 77
4.24 Comparison of median dependent package count of all packages by licensetype . . . . . . . . . . . . . . . . . . . . . . . . . . . . . . . . . . . . . . . . . . 77
4.25 Comparison of dependent package count by software category . . . . . . . 78
4.26 Histograms of dependent package counts of software development toolsby license type . . . . . . . . . . . . . . . . . . . . . . . . . . . . . . . . . . . . 79
4.27 Box plots of dependent package counts of software development tools bylicense type . . . . . . . . . . . . . . . . . . . . . . . . . . . . . . . . . . . . . 80
4.28 Comparison of median dependent package count of software developmenttools by license type . . . . . . . . . . . . . . . . . . . . . . . . . . . . . . . . . 81
4.29 Histograms of dependent package counts of applications by license type . . 82
4.30 Box plots of dependent package counts of applications by license type . . . 83
4.31 Comparison of median dependent package count of applications by licensetype . . . . . . . . . . . . . . . . . . . . . . . . . . . . . . . . . . . . . . . . . . 84
4.32 Histograms of dependent package counts of system environment packagesby license type . . . . . . . . . . . . . . . . . . . . . . . . . . . . . . . . . . . . 85
vii
4.33 Box plots of dependent package counts of system environment packagesby license type . . . . . . . . . . . . . . . . . . . . . . . . . . . . . . . . . . . . 86
4.34 Comparison of median dependent package count of system environmentpackages by license type . . . . . . . . . . . . . . . . . . . . . . . . . . . . . . 87
4.35 Histograms of dependent package counts of user interface packages by li-cense type . . . . . . . . . . . . . . . . . . . . . . . . . . . . . . . . . . . . . . 88
4.36 Box plots of dependent package counts of user interface packages by li-cense type . . . . . . . . . . . . . . . . . . . . . . . . . . . . . . . . . . . . . . 89
4.37 Comparison of median dependent package count of user interface pack-ages by license type . . . . . . . . . . . . . . . . . . . . . . . . . . . . . . . . . 90
viii
List of Tables
2.1 How different researchers categorize open source licenses . . . . . . . . . . 14
2.3 Methods used to research open source software . . . . . . . . . . . . . . . . 28
3.1 Data sets collected for each hypothesis . . . . . . . . . . . . . . . . . . . . . . 50
4.1 Package Count by License . . . . . . . . . . . . . . . . . . . . . . . . . . . . . 52
4.2 Package Count by Groups . . . . . . . . . . . . . . . . . . . . . . . . . . . . . 52
4.3 Package Counts by License and Software Category . . . . . . . . . . . . . . . 53
4.4 Summary of package dependency counts of all packages . . . . . . . . . . . 54
4.5 Summary of the dependent package counts of all packages . . . . . . . . . . 57
4.6 Summary of the dependent package counts greater than zero . . . . . . . . 57
4.7 Summary of the package dependency counts of all packages by license type 60
4.8 Summary of package dependency counts of software development toolsby license type . . . . . . . . . . . . . . . . . . . . . . . . . . . . . . . . . . . . 64
4.9 Summary of the package dependency counts of applications by license type 67
4.10 Summary of package dependency counts of system environment compo-nents by license type . . . . . . . . . . . . . . . . . . . . . . . . . . . . . . . . 71
4.11 Summary of package dependency counts of user interface packages by li-cense type . . . . . . . . . . . . . . . . . . . . . . . . . . . . . . . . . . . . . . 73
4.12 Summary of dependent package counts of all packages by license type . . . 76
4.13 Summary of dependent package counts of software development tools bylicense type . . . . . . . . . . . . . . . . . . . . . . . . . . . . . . . . . . . . . 80
4.14 Summary of dependent package counts of applications by license type . . . 82
4.15 Summary of dependent package counts of system environment packagesby license type . . . . . . . . . . . . . . . . . . . . . . . . . . . . . . . . . . . . 85
ix
4.16 Summary of dependent package counts of user interface package by licensetype . . . . . . . . . . . . . . . . . . . . . . . . . . . . . . . . . . . . . . . . . . 89
5.1 Package dependency count hypotheses summary . . . . . . . . . . . . . . . 91
5.2 External reuse hypotheses summary . . . . . . . . . . . . . . . . . . . . . . . 93
x
Chapter 1
Introduction
The open source software movement was born from the idea that users and program-mers should be free to modify existing software to meet their needs. In order for this tohappen, source code must be freely accessible. This allows anyone to fix bugs or extendthe software’s functionality beyond that envisioned by its creators. It also promotes soft-ware reuse by allowing developers to use existing software rather than re-implementinga solution to a problem that has already been solved.
The history of the movement is filled with colorful characters debating a range of issues,including the definition of what it means to be open source. Software projects release theirsource code to the general public for a variety of reasons, such as to offer an alternative toproprietary applications, or to maximize the number of developers that can improve theirproduct. As a result, the term open source can have several different meanings. There isplenty of rhetoric for and against these meanings, and many bold claims have been maderegarding open source software’s potential to strengthen individual liberties, reduce thecost of software development, or produce a superior product.
An individual’s rights over a piece of software is described by the license under whichthe software is released. There are several open source licenses. What they all have incommon is that they grant a user the right to access source code and make modifications.Where they differ is in the terms under which these changes may (or may not) be redis-tributed. These differences reflect the range of opinions by members of the open sourcecommunity as to what it means to be open source. Aside from defining terms of use,an open source license is a project’s way of establishing the underlying philosophy onsoftware development.
To what extent do these ideological differences matter? Is there any way to measure theeffectiveness of one software license type over another? Much has been written on thepotential consequences of including certain rights over others in a license, but are suchthoughts justified? Is there any characteristic of an open source license that has been
1
John Brewer VIII Chapter 1. Introduction 2
shown to be more effective at promoting the ideals of the movement, to the extent theycan be defined, than others?
It is doubtful that there can ever be a definitive answer to any of these questions, partic-ularly as they relate to abstract ideas of freedom. However, we can learn more about theefficacy of various licenses by measuring the indicators of success exhibited by projectsusing them. Many such studies have already been performed, and will be reviewed be-low. This paper is an attempt to examine the effect a project’s choice of license has on thereusability of their product. Are any open source licenses better than others for increasingreuse?
1.1 Practical Reuse
Software reuse is the creation of new software from existing code, documentation, orother objects[1]. Reuse can be measured at many different levels of abstraction. Somestudies of open source software reuse are performed at the source code level; that is, theyseek to identify cases where the text in the source file of one project appears in another.By granting access to source code, open source licenses allow, and seem to encourage,this behavior. For example, suppose an application requires the ability to export datain a compressed format. A developer could locate an open source application that hassuch a feature, locate the compression algorithm it uses in the source code, and copyit into his own. However, such a practice occurs infrequently. A more likely approachwould be to locate an open source component that provides the function and incorporateit into the application’s design. Here the term component is general in scope and canrefer to a variety of software objects, including a collection of library functions, a webservice, or some other unit encapsulating specific functionality. The developer could usea component such as zlib1 by calling it from within the application and achieve withoutever having to access its code.
This approach offers many benefits. For one, it limits the amount of implementation-specific details the developer needs to learn in order to get his compression feature. It isusually simpler to learn and use a component’s application programmer interface (API)than it is to trace through and fully understand its source. For another, it prevents un-necessary duplication. Instead of having two versions of a compression algorithm (theoriginal and the one copied into the new program), there is only one. Any bug fixes orupdates to the original need only be applied once.
Such component reuse is very common in open source development. It has been observed[2] that this approach appeals to the social ethics of open source programmers. A singlesolution developed by many programmers is likely to be more effective than a solution
1http://zlib.net/
John Brewer VIII Chapter 1. Introduction 3
made by an individual. The open source community as a whole benefits when developersdecide to use and contribute changes to an existing component instead of creating a one-off version for themselves. This suggests that identifying how often a component is usedin the creation of a new application is a good way to measure the practice of reuse withinthe open source development community.
1.2 Identifying Open Source Software
Over the past 15 years, a tremendous amount of open source software has been released.The success of products like Linux and the Apache web server has demonstrated theability of open source development techniques to produce reliable business-class appli-cations. Open source software has also introduced new economic models for generatingincome by giving away source code, as shown by the success of the Android operatingsystem for cell phones. Access to source code, along with virtually free distribution overthe Internet, have allowed an increasing number of contributors to use and maintain freesoftware. In almost every application domain, there exist open source tools that providea lower cost or higher quality (or both) alternative to proprietary tools produced usingtraditional development methods. This has obvious benefits to users, both personal andcommercial. It is also beneficial to researchers of development methods. Open sourceprojects typically do their work in full view of the public. Researchers can access com-munications between developers and users over mailing lists and message forums, viewdefect logs, study the history of the source code, read design documentation, and observejust about any part of the development process.
Unfortunately, the sheer number of projects has led to challenges in collecting data aboutopen source software as a whole. The distributed nature of open source developmentmeans that there is no one source for all information about the various software projects.Complicating this issue further is that these projects reflect a wide range of quality andreliability. The low cost of entry for launching an open source project means that for eachrobust open source product like the Linux kernel, there are hundreds, if not thousands,of projects that never made it out of the alpha stage or have been abandoned. One ofthe challenges faced by researchers is identifying software to include in their studies.Depending on the questions being investigated, finding quality software that meets therequirements of the study can be the most difficult part of conducting a research project.
Many hosting services provide free or low cost homes to open source projects. Thesesites provide development tools such as code revision control systems and documenta-tion tools (such as a wiki), and place to host files for download. In short, the give aproject a home on the web. These sites are frequently referred to as “forges”, in refer-
John Brewer VIII Chapter 1. Introduction 4
ence to SourceForge2, which at 300,000 projects3 is the largest of such sites. Similar ser-vices are provided by Freecode (formerly FreshMeat)4, GNU Savannah5, Google Code6,JavaForge7, GitHub8, and others. These sites offer researchers a collection of softwareprojects cataloged in a similar way, and many research papers have used one or more ofthese sites to generate samples for analysis[3, 4, 5, 6, 7, 8]. However, using these sites as adata source has some drawbacks.
For one, a project is likely to be hosted on only one of these sites, making it difficultto identify all of the software projects in a given domain. In addition, not all projectsmake their home on one of these hosts. This is particularly true of large projects withcommercial support, which tend to have their own dedicated homepage. Also, not allprojects are equal; just because a project is hosted on a forge does not mean that it hasan active development team, user base, or runs reliably. Extracting data from these sitescan also be a challenge. While all of them let you examine projects individually, most donot provide any APIs or expose their underlying databases to the public. This makes itdifficult to extract data about a large number of projects concurrently.
Software repositories maintained by Linux distributions may provide researchers with analternative data source. The Linux kernel by itself is just a part of an operating system.A Linux distribution bundles the kernel along with the other utilities needed to create acomplete system. Most distributions include a software management system that sim-plifies installing and removing software from a running instance of their system. Thisadditional software is typically stored in freely accessible repositories that contain thecomponents, bundled into packages, that will run on a computer using the Linux distribu-tion. These packages are pre-compiled programs from open source projects. Repositoriesmake it much easier to use open source software by providing ready-to-run executablesand saving the user from having to compile a program from source. They greatly simplifythe process of adding and removing programs.
This is primarily accomplished through dependency management. Package y is a de-pendency of package x if package y must be installed on a system in order for packagex to function properly. Package y may have its own dependencies which will also haveto be installed for package x to function. Dependencies are said to be resolved when thepackages that provide them have been identified. Repositories simplify the task of resolv-ing dependencies by tracking the installation requirements of all their member packages.The task of dependency management is carried out by tools developed to interact withthe given repository structure. These tools allow users to search for and install packages
2http://sourceforge.net3http://sourceforge.net/apps/trac/sourceforge/wiki/What%20is%20SourceForge.net?4http://freecode.com/5http://savannah.gnu.org/6http://code.google.com/7http://www.javaforge.com8https://github.com/
John Brewer VIII Chapter 1. Introduction 5
stored in the repository. When asked to install a package, they automatically identify andinstall all of the required dependencies. The entire process makes it fairly trivial to installthe most popular open source products. The tools can also be used to query the repositoryfor information about its packages.
Repositories provide an additional, yet equally important function: they can be used toenforce a certain level of quality control over the system. For example, it is common prac-tice for Linux distributions to maintain separate repositories for stable and developmentreleases. This allows the user to easily choose between software that has been proven torun reliably and bleeding edge releases that have not been thoroughly tested. In addition,each repository owner typically places restrictions on which packages would be eligiblefor inclusion. The Debian9 distribution, for instance, is committed to promoting free soft-ware, and therefore limit their repositories to include only packages that are releasedunder a license that meets the open source definitions provided by the Free SoftwareFoundation and the Open Source Initiative. Other distributions have less strict entrancerequirements.
Linux package repositories provide a central location for thousands of projects and can bea great resource for researchers interested in studying open source development methods.To date, few open source research projects have taken advantage of them.
1.3 Problem Statement
The goal of this study is to explore the effects of license choice on open source softwarereuse. Is software released under a particular open source license more likely to be reusedthan software released under a different license? To what extent does license choice affectthe amount of reuse that occurs within a software development project?
In attempting to answer these questions we use a definition and measurement of reusethat reflects the way software is reused in practice. Rather than search for code that iscommon between two or more projects, we identify the number of preexisting packagesused to create a given application, as well as the number of times each package is reusedby another project. It is hoped that the methods employed to analyze reuse of open sourcesoftware used by this study will be used by practicing programmers to evaluate a soft-ware package’s suitability for reuse within a project.
A software repository maintained by a Linux distribution is used as the primary datasource for the study. As will be shown, Linux repositories provide a sample of opensource software from multiple domains and license types. In short, they provide a goodrepresentation of the open source software that is in common use, robust, and activelysupported.
9http://www.debian.org/
John Brewer VIII Chapter 1. Introduction 6
In the end, the results of the study may help to provide empirical evidence of a measur-able difference between types of open source licenses in general, and inform the decisionof which license type to use for a new software project in particular.
Chapter 2
Literature Review
2.1 Open Source Licenses
2.1.1 A Brief History of Open Source Software
The open source movement has a colorful history that can be traced back to the earlydays of computing. Many books, papers, and websites document this history much morethoroughly than will be done here. Nevertheless, a brief summary will help provide thecontext for the current state of open source research.
Before personal computers became affordable to the general public, the only way mostprogrammers could access a computer was by using a mainframe system provided bytheir employer or university. Since these systems could only support a limited numberof users at any given time, the first challenge lay in getting access to the machine. Com-puter systems were often custom built, and ran operating systems written in assemblylanguage that ran on specific hardware. Software was custom built as well. The pro-prietary software industry was in its infancy and many applications were developed inhouse. During this time access to source code was common. System developers neededaccess to the source code in order to troubleshoot problems or update programs. Numer-ous sources[9, 10, 11] describe an environment where the source code to programmingproblem solutions were freely shared and redistributed.
Perhaps the best example of this is the development of the Unix operating system. Unixwas created by a team of programmers working for Bell Labs during the early 1970s.It was written in the C programming language, which meant that it could be run ona variety of hardware platforms. Anti-trust laws prevented AT&T, which owned BellLabs, from selling Unix as a commercial product. Instead, it was made available to uni-versities and commercial entities under licensing terms that granted access to the sourcecode. The proliferation of Unix among universities coincided with the development of the
7
John Brewer VIII Chapter 2. Literature Review 8
ARPANET, which in turn helped facilitate the evolution of a community of programmersthat would eventually create the Internet. The ability to share source code had a directpositive impact on the growth of this community and was a crucial part to its success.
As computers became more accessible, and it became possible for an individual to pur-chase one for their own use, access to source code began to become less common. Theproprietary software industry, which began to grow as the number of personal comput-ers increased, did not distribute source code along with their products in order to pre-vent unauthorized copying. This frustrated programmers who saw accessing and shar-ing source code as a fundamental part of software development. One of these program-mers was Richard Stallman, a programmer who worked for the Massachusetts Instituteof Technology Artificial Intelligence Lab during the late 1970s. In a widely repeated story,which may be apocryphal, Stallman, who was frustrated at the performance of a Xeroxprinter that had been donated to the lab, attempted to get access to the source code so hecould modify the driver and improve its efficiency. He was refused on grounds that theprinter driver was a proprietary product not intended for those outside of the company tomodify. Stallman identifies this event as a turning point that ultimately led to his leavingthe MIT AI Lab and forming the GNU Project in 1983[11].
The GNU1 Project laid the foundation of today’s open source movement. Its manifesto[12]establishes the ideological foundation of what it means for a program to be open source.In the manifesto, Stallman outlined his intention to build a Unix-compatible operatingsystem and associated development tools that would be freely available to anybody whowished to use it. He also outlined his definitions of “free” by describing four freedoms:the freedom to run a program for any reason, the freedom to make modifications to thatsoftware, the freedom to distribute copies, and the freedom to distribute modificationsmade to the software. Stallman’s ideas stem from a strong sense of obligation to his fel-low programmers. He feels that restrictions to these freedoms, which are common in mostcommercial software licenses, are fundamentally unjust, and he refuses to use any pro-gram or computer system that he sees as restricting his freedom or the freedom of others.Not all open source supporters view the accessibility of code in these terms. Nevertheless,these principles were important in establishing the GNU Public License (GPL), the firstsoftware license that encouraged the distribution of source code. By the early 1990s, theGNU Project had produced many tools essential to the success of an operating system,including a compiler (gcc), text editor (emacs), and other software development utilities.It did not have a working kernel, and therefore did not provide a complete system.
In 1992 a computer science student at the University of Helsinki named Linus Torvalds,began working on a project to create a Unix-like kernel that would run on the i386 pro-cessor commonly found in PCs at the time. This kernel, named Linux, was developedby a group of volunteers spread across the world that communicated over the Internet.
1GNU is a recursive acronym that stands for “GNU’s not Unix”; see http://www.gnu.org for moreinformation.
John Brewer VIII Chapter 2. Literature Review 9
Linux was released under the GPL, which meant that anybody interested in contributingto the project was able to do so. Within a few years Linux, combined with the utilitiesdeveloped by the GNU Project, produced a stable Unix-compatible system that realizedStallman’s original vision.
The success of Linux inspired a programmer and writer named Eric Raymond to writeThe Cathedral and the Bazaar[13], an influential paper that describes software developmentpractices that allowed Linux to succeed. Raymond was very skeptical that a loose-knitgroup of developers working independently could produce a piece of software as com-plex as an operating system and have it be anything more than a toy with limited usability.His amazement when he found this not to be the case led him to investigate the softwaredevelopment methods used by the kernel team. In his paper he describes two contrast-ing methods of software development. The cathedral method, typical of most proprietarysoftware projects, consists of a small group of developers working under tight leadership,that does not release software until it has been rigorously tested. In contrast, the bazaarmethod consists of a large number of developers, working individually under little orno supervision, frequently releasing lightly tested code. The Linux kernel was devel-oped using the bazaar method. While trying to figure out how a project using the bazaarmethod could be successful, Raymond made a bunch of observations that underscoredthe practical advantages of allowing unrestricted access to source code.
Perhaps the most important observation was what Raymond dubbed Linus’s law[13]:given enough eyeballs, all bugs are shallow. Increasing the number of users who haveaccess to a product under development increases the number of bugs that can be discov-ered. By allowing any interested developer access to the source code, the chances that thefix for these bugs will be understood and implemented also increases. Releasing changesearly and often can actually increase the quality of the product. None of this is possibleif source code cannot be accessed and redistributed freely. Raymond’s work stressed thestrength of open source software licenses in creating robust and reliable products.
By the end of the 1990s and into the new millennium the open source movement createdproducts capable of challenging their proprietary counterparts. Linux began to play anincreasing role in the server market, with the Apache HTTP server becoming the mostwidely used web server.2 The success of companies such as Red Hat have demonstratedthat open source products can be commercially successful. Since their code is accessibleand their development methods are transparent, open source products provide an excel-lent source for researchers. Numerous studies have been performed on a wide range oftopics related to open source software, some of which are discussed further in this paper.
2See http://news.netcraft.com/archives/2011/01/12/january-2011-web-server-survey-4.html for moreinformation.
John Brewer VIII Chapter 2. Literature Review 10
1970 1975 1980 1985 1990 1995 2000 2005 2010
ARPANET goes
live
Unixbec
omes
a portable
operati
ng syste
m
Richar
d Stallm
ancre
ates GNU
Projec
t
The GNUM
anife
stois
published
Linus To
rvald
s begin
s workon th
e Linux ker
nel
Work
on the Apac
he webse
rver
begin
s
EricRay
mond writ
esThe Cath
edra
l and th
e Bazaa
r
The source
code fo
r Netsca
pe Comm
unicato
r becom
esopen
source
Figure 2.1: Some important dates in the history of open source software
2.1.2 Open Source License Types
In general, software can be considered open source if its source code has been made avail-able to its users. Specifically, the license under which the software is released specifies therights of licensees to access, modify, and redistribute its source code. The license distin-guishes open source software from non-open source, or proprietary, software[6].
Computer software, like art, literature, music, and other published works, is copyrightprotected. The owner of a copyright retains the right to determine how their work isproduced, distributed, and modified. Copyright law evolved with the evolution of theprinting press, and was aimed at protecting a creator’s right to profit from their workand to prevent the author’s exploitation by others. These laws also apply to computersoftware. Proprietary software is usually produced by a team of developers workingfor a commercial entity. This entity retains the copyright of the produced software. Thedevelopers produce the software as a "work for hire", which means that in exchange fortheir salary and other economic benefits they void any claim of ownership on the codethey produce. The commercial entity distributes the product for a price, and keeps anyresulting profit[14].
Software licenses are intended to protect the copyright owner’s exclusive rights to a soft-ware product by specifying the terms of use that a consumer must follow in order to usethe product. Proprietary licenses vary but tend to have some significant points in com-mon. Most importantly, they grant a user a license to use, and not own, the product. As alicensee, the consumer does not own the software; rather, they have purchased the rightto use the software under the terms of the license. Typically these terms limit the numberof systems that the software can be installed on, or the number of users who can use thesoftware, under a given instance of the license. Proprietary licenses also prevent the userfrom making copies of the software and redistributing it to others. The source code of a
John Brewer VIII Chapter 2. Literature Review 11
proprietary software product is not provided to the user because doing so would makeit much easier for users to violate the terms of the license and reduce the effect of theentity’s rights over their product.[15]
The open source software movement was born in part as a reaction to this model. Sup-porters of the movement view the enforcement of the rights of one entity at the expenseof others as the fundamental problem of the proprietary software model. As a result, anumber of open source licenses have been created that use the rights afforded by copy-right protection to prevent one party from controlling the use and distribution of soft-ware. Rather than using license terms to restrict what a user can do with the software,an open source license grants a user the rights to make changes to the original softwareand redistribute these changes. A programmer who releases a program under an opensource license does not give up copyright to their work. Instead, they use their rights asa copyright holder to grant modification and redistribution rights to others.
The open source movement consists of a collection of individual programmers and soft-ware projects, and the term "open source" can mean different things to different people.Two organizations, The Free Software Foundation (FSF)3 and the Open Source Initiative(OSI)4, propose formal definitions of what it means for a software product to be opensource. These definitions are largely accepted by the open source community as a whole.Each organization also provides a list of those software licenses that comply with theirdefinition. The FSF advocates "free" software, by which they mean the freedom of a userto access source code, modify it, and redistribute it without limiting the rights of othersto do the same. The FSF sees free software as a solution to a social problem[12]. Theirphilosophy takes a political stance by emphasizing individual rights over corporate in-terests. The OSI, on the other hand, views open source development methods as a betterapproach to software engineering. They contend that the ability to use existing code in anew project produces higher quality code. They frame their open source advocacy in eco-nomic terms, and say that adopting an open source license will lead to greater innovationand market success than the use of a proprietary license[16].
Currently5 the FSF list includes 86 different licenses, and the OSI list includes 69. How-ever, despite the differences in philosophy between the two organizations, their listsmostly overlap. In addition, the vast majority of open source projects are released un-der a small subset of these licenses. All of these licenses have some important features incommon. First, they grant access to a program’s source code and allow the user to makemodifications. Second, they allow a user to distribute copies of the program, in originalor modified form. Open source licenses differ in the restrictions (or lack thereof) placedon how modifications can be redistributed. What follows is a brief overview of the mostcommonly used open source licenses.
3http://www.fsf.org4http://www.opensource.org5The license count was taken on November 27, 2011.
John Brewer VIII Chapter 2. Literature Review 12
• GNU General Public License[17]- The GNU General Public License (GPL) is the mostwidely used open source license[8]. The original version of this license was writtenby Richard Stallman, and is intended to promote the ideas of freedom that led tothe creation of the GNU project. It has evolved to become the standard license forsoftware released by the FSF, including the GNU C Compiler, the Emacs text editor,and many others. The GPL allows a licensee to modify a program and distribute thechanges, as well as to redistribute the original program. It also allows the licensee tocharge a fee for their efforts provided that the distributed code is released under thesame licensing terms (namely, the GPL) as the original and that any changes madeto the original are identified. This is to ensure that the software remains freely acces-sible to anyone who wants to use it or modify it for their own purposes. Softwarereleased under the GPL cannot be turned into a proprietary product. The GPL isconsidered to be the most restrictive license, and an example of a copyleft license,due to this provision.
• GNU Lesser General Public License[18]- The GNU Lesser General Public License (LGPL)is a variant of the GPL with relaxed some of the redistribution restrictions. Codereleased under the GPL cannot be used as part of a program that is governed byanother license. This can be a problem for code, such as a software library, that isintended to be integrated as part of a larger program. The LGPL was introduced tosolve this problem. Software released under the LGPL is subject to the same termsas the GPL except for those that prevent the software from being included as part ofa larger work covered by a different license. The software covered by the LGPL, andany modifications made to it, must be distributed under the LGPL. This allows anentity to produce a proprietary software product that uses libraries released underthe LGPL to remain closed source, provided that the libraries, and any modificationsto them, remain open source.
• Apache Software License[19]- The Apache Software License (ASL) was created for useby the Apache Software Foundation (ASF)6, an organization that supports a varietyof open source software projects. The ASL grants a licensee the right to distributecopies of a program, with or without modification, provided that any modificationsare identified within the files that they occur and that any attribution notices fromthe original work remain. This allows recipients of the modified or redistributedcode to be able to identify the contributors that have made changes to the codethroughout the life of the product. As long as these terms are met, the ASL does notrequire that the modifications be released under the ASL. Section 4.4 of the licensesexplicitly grants the licensee the ability to provide additional terms. The ASL doesnot give the licensee the right to use the trademarks or product names of the licensor.This means that a modified version of the software produced by a third party cannotbe advertised as a product of the original author without the author’s permission.
6http://www.apache.org
John Brewer VIII Chapter 2. Literature Review 13
The ASL does not require that source code be included as part of a distribution,which means that software released under the ASL can be included as part of aproprietary product.
• BSD License[20]- Another permissive license is the Berkeley Software Distribution(BSD) license, named after the Unix-like operating system developed by the Uni-versity of California, Berkeley that first used it. The current version of the licensegrants licensees the right to redistribute a program in source or binary form, withor without modification, provided that the existing copyright notice is retained. Aswith the ASL, code released under the BSD license can become part of a proprietarysoftware package whose source is not released.
• MIT License[21]- The MIT license allows a recipient to copy, use, modify, and re-distribute source code provided that the copyright/permission notice be includedwith any copies of the software. It is the most permissive open source license, asit places the least amount of restrictions on how modifications can be distributed.As with the ASL and BSD licenses, software released under the MIT license can bedistributed under new licensing terms that limit access to source code.
2.1.3 Open Source License Categories
In the literature open source licenses tend to be categorized according to the restrictionsthey place on how changes to a program can be redistributed. Although researchers cate-gorize licenses differently, most consider a license to fall into one of two categories, copy-left and permissive. Copyleft licenses require that any derivative works be released underthe same licenses as the original work. Copyrights are typically used to ensure that therights to a work remain in the control of one person or entity. Copyleft licenses use copy-right protections to do the opposite. They are aimed at making sure that the work alwaysremains freely available to everyone. Anyone is free to distribute derivative works pro-vided that anyone else is free to do the same with the new work. In the software world,these licenses are specifically designed to prevent an entity from co-opting a program andreleasing it under a proprietary license.
Permissive licenses do not require that derivative works be released under the same li-cense. Software released under a permissive license can be changed and distributed un-der a different license, including a proprietary one, provided that the other license termsare met. In most cases the other terms deal with how to credit contributors and howtrademark or patent rights are enforced under the license.
The copyleft and permissive categories neatly sum up the different opinions of what itmeans to be open source. Those who view open source in terms of individual freedom,such as the FSF, use copyleft licenses to ensure that nobody else’s freedom to use or mod-ify a program is taken by somebody else. Others see permissive licenses as the best way
John Brewer VIII Chapter 2. Literature Review 14
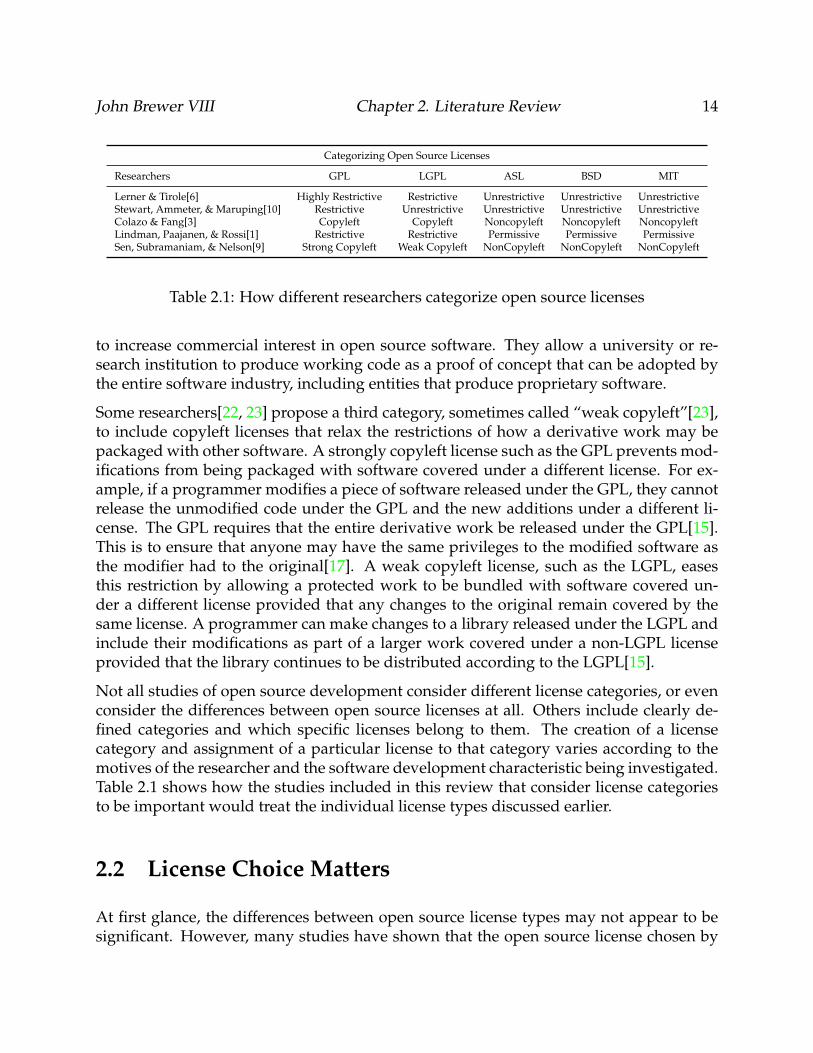
Categorizing Open Source Licenses
Researchers GPL LGPL ASL BSD MIT
Lerner & Tirole[6] Highly Restrictive Restrictive Unrestrictive Unrestrictive UnrestrictiveStewart, Ammeter, & Maruping[10] Restrictive Unrestrictive Unrestrictive Unrestrictive UnrestrictiveColazo & Fang[3] Copyleft Copyleft Noncopyleft Noncopyleft NoncopyleftLindman, Paajanen, & Rossi[1] Restrictive Restrictive Permissive Permissive PermissiveSen, Subramaniam, & Nelson[9] Strong Copyleft Weak Copyleft NonCopyleft NonCopyleft NonCopyleft
Table 2.1: How different researchers categorize open source licenses
to increase commercial interest in open source software. They allow a university or re-search institution to produce working code as a proof of concept that can be adopted bythe entire software industry, including entities that produce proprietary software.
Some researchers[22, 23] propose a third category, sometimes called “weak copyleft”[23],to include copyleft licenses that relax the restrictions of how a derivative work may bepackaged with other software. A strongly copyleft license such as the GPL prevents mod-ifications from being packaged with software covered under a different license. For ex-ample, if a programmer modifies a piece of software released under the GPL, they cannotrelease the unmodified code under the GPL and the new additions under a different li-cense. The GPL requires that the entire derivative work be released under the GPL[15].This is to ensure that anyone may have the same privileges to the modified software asthe modifier had to the original[17]. A weak copyleft license, such as the LGPL, easesthis restriction by allowing a protected work to be bundled with software covered un-der a different license provided that any changes to the original remain covered by thesame license. A programmer can make changes to a library released under the LGPL andinclude their modifications as part of a larger work covered under a non-LGPL licenseprovided that the library continues to be distributed according to the LGPL[15].
Not all studies of open source development consider different license categories, or evenconsider the differences between open source licenses at all. Others include clearly de-fined categories and which specific licenses belong to them. The creation of a licensecategory and assignment of a particular license to that category varies according to themotives of the researcher and the software development characteristic being investigated.Table 2.1 shows how the studies included in this review that consider license categoriesto be important would treat the individual license types discussed earlier.
2.2 License Choice Matters
At first glance, the differences between open source license types may not appear to besignificant. However, many studies have shown that the open source license chosen by
John Brewer VIII Chapter 2. Literature Review 15
a software project can have a significant effect on the project’s success. What follows is asummary of these studies. Each considers varying measures of success, and then exam-ines how the license choice affects these metrics. These studies look at the choice of licensefrom different perspectives, but they all agree that the choice of license is important.
2.2.1 License Choice Matters to Programmers
Open source developers tend to have strong feelings about open source licenses. Thesefeelings vary according to the philosophical ideas expressed in the license, its economicpotential, and the individual beliefs of the programmer. Early research of the open sourcemovement focused on whether open source projects could produce software that couldcompete with proprietary software, and whether or not it is possible to make money byallowing redistribution of source code. As a result, many studies treat a programmer’slicense preference as a function of market factors; that is, a developer is likely to preferthe license that is most likely to lead to future economic reward.
In The Scope of Open Source Licensing, [8] Lerner and Tirole investigate an observation madein their previous work[24] that the proliferation of new open source licenses following thecreation of OSI’s open source definition suggests that license choice is important. Theirfollow-up study examines what factors determine the choice of license. Their researchidentifies peer recognition, possible future career opportunities, the joy of working on achallenging programming problem, and the ability to tailor code for a specific purpose asthe main benefits received by a programmer that chooses to contribute to an open sourceproject. Their model quantifies the noncommercial benefits of an open source project asthe sum of three factors, one of which being the restrictiveness of the project’s license. Inthis model, the noncommercial benefits of a project increase according to the restrictive-ness of the license. This is intended to account for the increased possibility that a projectunder a less restrictive license will be hijacked by a commercial entity producing a closedsource product. Such hijacking is seen as undesirable because the contributions madeby programmer when the project was still open may become harder to identify whenthe source is closed. This reduces the potential of those contributions to increase peerrecognition and to signal skills to future employers. It also prevents developers, alongwith the user community at large, from benefiting from the coding solutions introducedin subsequent versions. A highly restrictive license such as the GPL will guarantee thecontributions are always visible, and all future modifications are accessible by everyone.
Mikko Mustonen also focuses on economic incentives for programmers in the model pro-posed in Copyleft- the economics of Linux and Other Open Source Software[14], which de-scribes the conditions under which proprietary software can coexist with an open sourceequivalent. This paper assumes a conflict between the incentive to create new informa-tion (i.e., a piece of software) and the public’s right to exchange this information freely.A programmer can choose to work for a proprietary software firm, or contribute to an
John Brewer VIII Chapter 2. Literature Review 16
open source project. If the programmer chooses the first option, they will receive a fixedwage, but if they choose the second, they will have to rely on complementary incomeas they will not be able to receive direct compensation for the code they produce. In-stead, the open source programmer will have the chance to develop a reputation thatwill lead to future financial returns, such as receiving investments for a future businessor securing academic employment. Mustonen posits that a programmer will choose theoption that provides the greatest net benefit, and proposes a model of how this choice ismade. The model uses a programmer’s productivity to identify which path to take. Acommercial firm is likely to pay their programmers a similar wage regardless of individ-ual productivity. This benefits a programmer that is not very productive, but not thosewith a high productivity. In an open source project, the benefit to the programmer is theexpected complementary income times the programmer’s productivity. There is produc-tivity threshold above which a programmer can receive greater benefit by contributing toan open source project instead of working for a commercial firm. Note that this modeldoes not take into account the non-financial benefits of contributing to an open sourceproject. These will be discussed in subsequent paragraphs.
The studies that treat reputation benefits and peer recognition as economic indicators runthe risk of over simplifying a significant explanation of the motivation of the open sourceprogrammer. In his essay “Homesteading the Noosphere”[2], Eric Raymond provides asociological explanation for the open source movement. In this essay, as well as severalothers he has written about software engineering, he describes the open source movementin cultural terms; that is, he sees open source programmers, called hackers7, as a collectivegroup that share similar values, behaviors, and traditions, and whose motives cannotbe purely attributed to the same factors that govern decisions made by closed-sourceentities. Raymond makes the point that while it is possible for a hacker to secure a joboffer, teaching position, or book deal from his open source programming exploits, theseevents do not occur frequently enough for such economic considerations to be a primary,let alone the only, motivation for a programmer to give away their source code. Whilethere is variation in the motives and behaviors of individuals within the community atlarge, he identifies the traits that describe the culture as an example of a gift culture, agroup consisting of members who give away goods and services (in this case, software)without receiving obvious compensation in return. Such cultures, he argues, can onlyflourish in environments where necessities, such as food, are abundant. In the modernworld of software development, disk space, network bandwidth, and computing powerare the plentiful necessities. In this culture, social status is tied to what you choose to giveaway.
A hacker’s social standing with the group is tied to his or her reputation as a programmer.Peer recognition has evolved as the best way to measure the value of software contribu-
7The term “hacker” is overloaded and often misused. My usage of the term is the same as Raymond’s:an enthusiastic programmer who enjoys writing code for its own sake, and most definitely not someonewho breaks into computer systems illegally.
John Brewer VIII Chapter 2. Literature Review 17
tions to open source projects. Software is complex, and it is difficult to objectively mea-sure the quality of code submitted to a project. As a result, the open source world placesa high value on hackers that can not only code well, but are able to judge the contribu-tions of others fairly. This “judging” usually takes the form of a person with a positionof authority within a project deciding to accept a hacker’s contribution into the project’snext release. Typically one must have established a reputation of objectivity as well asprogramming excellence in order to get such a position, and the only way to do this is toreceive recognition from your peers. Reputation is everything.
When determining the attractiveness of one license choice over another, Colazo and Fang[7]took into account elements of social movement theory to explain developer choices. Socialmovement theory, as it relates to the open source movement, says that an individual willconsider how personal ideals correspond with those of a project in addition to whetherthe benefit of participating is worth the economic cost. Software licenses fulfill differentneeds; they can be seen as technical, commercial, juridical, and political tools.[22] Stud-ies that focus on the first three aspects risk minimizing the impact of the fourth. Theopen source community is defined by the conviction that source code should be freelyredistributable, but there is much debate within the community over which redistribu-tion rights are ideal and how they should be enforced. Licenses define the specific rightsgranted to users of a project, making the choice of license a way for a project’s leader anddeveloper community to identify the values they associate with the open source devel-opment as a whole. In their work, Colazo and Fang suggest that by choosing to workon a project with a particular license, a developer identifying himself as a member of acollective group, and that group affiliation plays a big part in the choice of which projectsto contribute to. This lead them to the conclusion that open source developers should bemore attracted to copyleft licenses.
Raymond[2] supplies evidence of the values shared by open source programmers with aninteresting observation about the difference between the text of most open source licensesand the way in which code is written. All open source licenses give a user the right tomake changes and redistribute them in some fashion. This implies that these licenses en-courage developers to circulate their own customized versions of a program. In practice,this is rare. Open source programmers have determined that it is much more valuable tothe group as whole to submit changes to the original project instead of creating their ownfork of the project. Justifications for this range from the explanation that forking a projectresults in duplicate effort, to splitting a project makes it difficult to give the right peoplecredit. In either case, this behavior lends strength to the idea that the manner in whicha programmer contributes to a project is indicative of their values and ideas of softwaredevelopment.[2]
Determinants of the Choice of Open Source License by Sen, Subramaniam, and Nelson[23]examines the how a programmer’s motivation and attitude towards the open sourcemovement affects their license preference. This study puts individual motivations intotwo categories: intrinsic and extrinsic. Intrinsic motivations are those that appeal to a
John Brewer VIII Chapter 2. Literature Review 18
developer’s interest in programming for its own sake, rather than in response to an exter-nal pressure. This includes the challenge of solving a programming problem along withthe pleasure of designing that solution. Extrinsic motivations are those that result fromenvironment in which a developer works, and includes peer recognition and financialcompensation. These motivations are a sign of how a developer expects their project tobe accepted by the open source community as a whole, and is reflected in their choice oflicense.
Sen, Subramaniam, and Nelson conducted an online survey to determine how these mo-tives affect license choice. They divided open source licenses into three categories, strongcopyleft (e.g., the GPL), weak copyleft (.e.g., the LGPL), and non-copyleft (e.g., the BSD li-cense). The survey sample consisted of open source developers that contribute to projectshosted on Sourceforge. A request to participate in the survey was sent 2,000 open sourcedevelopers of which 196 responded. An analysis of the survey results drew several con-clusions. The survey results showed that the average score on questions pertaining tointrinsic motivations was higher than those for extrinsic motivations. Developers that en-joy the challenge of programming are 72% more likely to choose a weak copyleft licenseover a non-copyleft one. Developers who are motivated by the extrinsic desire to increasetheir status among their peers are more likely to choose the non-copyleft license. As anexplanation, the authors of this study suggest that this is because software released undera non-copyleft license has fewer restrictions placed on its use, and will therefore attractmore users than software under a weak or strong copyleft license.
2.2.2 License Choice Matters to Projects
If the open source license type is important to individual programmers, it is also im-portant to the projects that they contribute to. Several studies, including the ones alreadydiscussed, have established by showing that a project’s choice of license type has an effecton the project’s success.
Lerner and Tirole’s license determination model[8] describes a project’s license choice asthe sum of the project’s attractiveness to potential users, the restrictiveness of the license,and an economic factor. This economic factor is defined as the possible commercial benefitreceived by the project and the weight the project leadership places on receiving thatbenefit. A project will choose to go open source if there is at least one license type forwhich this sum exceeds the profit that could be realized if the project went proprietary.The model also shows that the developer community’s license preference plays a role inproject success as well. A developer will choose to contribute if the benefit they expectto receive exceeds the opportunity cost of contributing; that is, they will contribute ifthey stand to gain more than they would by working on a closed source alternative. Thisbenefit increases with the restrictiveness of the license. The project stands to increase itschance of success by attracting as many contributors as it can, and choosing the right
John Brewer VIII Chapter 2. Literature Review 19
license type can make the project more appealing to programmers.
To test the predictions made from their model, Lerner and Tirole conducted a study ofthe approximately 39,000 projects hosted on Sourceforge in May of 2002. They extracteda staggering amount of data about these projects, including license type, target environ-ment, the human language the developers use to communicate, operating system, andthe intended audience. The summary statistics of this data set showed 72% of the projectswere released under the GPL and LGPL, which means that highly restrictive license areused much more often than their non-restrictive counterparts. The analysis of this dataled to many conclusions about which factors affect license choice:
• Highly restrictive licenses are much more common in applications created for end-users than they are for software written for other developers. One possible explana-tion for this is that contributors to projects that produce software development toolswant to increase the potential user base for their product, and releasing under anon-restrictive license makes their tools more attractive to commercial projects thatdo not want to make their source code accessible.
• Consumer applications, such as desktop tools and games, programs where the de-velopers speak a language other than English, programs written for open sourcePOSIX operating systems (Linux, FreeBSD, etc), and newer projects are all muchmore likely to be released under a highly restrictive license.
An analysis performed on their models for developer, community, and project licensepreferences predicted that participation in a project increases as the restrictiveness of thelicense decreases. Their study tested this prediction by looking at projects with similarlevels of success, where success is measured by the number of developers working on theproject and the frequency with which they contribute. Projects released under a licensethat is not highly restrictive showed significantly greater contributions, and therefore sup-ported the model’s prediction.
In order for an open source project to be successful, it must be able to attract volunteercontributors. Programmers decide to contribute to a project if they determine that thebenefits received for contributing greater than the cost of not contributing. The challengefor a project leader is to maximize the number of developers that will determine that it isbeneficial to them to contribute to the project. A number of studies have demonstratedthat license choice can play a role in increasing a project’s appeal to potential developers.
Colazo and Fang[7] observed that many open source projects fail due to lack of developerparticipation, and not necessarily that there is no demand for the product. Their studyseeks to determine what effect the choice of license has on developer activity within aproject. To do this, they identified actions taken within the project that could be used toindicate developer activity. This includes the number of developers working on a project,the amount of code generated by these developers, the speed at which the project pro-
John Brewer VIII Chapter 2. Literature Review 20
gresses, and the rate at which developers leave the project. Like many other open sourceresearch projects, they used Sourceforge as a data source, which provided resources thatwere used to establish metrics for each of the actions listed above. For instance, it is pos-sible to see which users commit code changes into the project’s code repository and howoften they do it, which was used to determine the number of participants and the levelat which they contribute. If a certain amount of time had passed since a developer lastcommitted a code change to the project, that developer was considered to have droppedout of the project. They measured project speed as the rate at which new versions ofthe software in their sample were released, under the assumption that successful projectsoperate under the principle of “release early, release often” discussed in[13].
The sample of open source projects extracted from Sourceforge was purposely biasedto include only those projects that showed development activity after the first posting.This eliminated projects that were announced on the site but never developed, a commonoccurrence on many of the free open source project hosting sites. The authors estimatethat this reduced the sample population by about 80%. Candidate projects for the samplewere chosen from the remaining 20% if they were collaboratively developed, had publiclyavailable project data (so that developer activity could be measured), and had producedsoftware that had been ported to at least one other platform or computing environment.The last criterion was used to find projects that are relevant to a large user community,and being ported to a different system is evidence that such a community exists. Theimportance of the size of the user community is an extension of the assumption that manydevelopers are motivated to contribute to open source projects in order to increase theirreputation as contributors to useful projects.
The results of the study showed that projects released under a copyleft license rankedhigher than non-copyleft programs in the number of developers on the project, devel-oper activity, and development speed. Non-copyleft projects performed better on devel-oper permanence, as their developer turnover rates were significantly lower than thoseof copyleft projects. The general conclusion that Colazo and Fang drew from these re-sults is that there is a relationship between license choice and development activity inopen source projects. Also, they concluded that activity in copyleft projects shows thatself identification with open source development as a social movement is an importantmotive among developers, and is just as important as economic motives.
Mustonen’s model[14] addresses project participation from the perspective of a commer-cial entities seeking to attract developers away from open source projects. Their principlemethod of accomplishing this is through the wages they offer to their employers. In or-der to participate in the market at all, the productivity of the best programmers and thewages paid to them must exceed a certain threshold. This threshold defines the point atwhich a productive programmer will choose to contribute to an open source project. Ifthe wage offered by the commercial entity is high enough, the programmer will choose towork for them instead. The model compares proprietary and copyleft projects, and doesnot distinguish between open source license types.
John Brewer VIII Chapter 2. Literature Review 21
2.2.3 License Choice Affects Commercial Decisions
Lerner and Tirole, in a widely cited paper from 2002[24], provide a basic overview ofthe economic considerations of open source software. Inspired by an analysis of foursuccessful open source projects (Apache, Linux, Perl, and Sendmail), they examine twobasic questions: what economic benefit does a person receive by contributing to an opensource project, and what economic opportunities does the open source movement provideto commercial software companies?
How can a proprietary software vendor embrace open source principles and still remainprofitable? Lerner and Tirole suggest a number of different ways. The first is by provid-ing support services to an open source project. Red Hat is an example of this: their coreproduct, Red Hat Enterprise Linux (RHEL), consists of a bundle of programs that can beobtained for free from numerous open source projects. RHEL itself is free, but Red Hatsells technical support and a system update service that greatly reduces the effort neededto set up and maintain RHEL systems. They have also taken the lead in providing certifi-cations in various open source technologies and training courses to assist IT professionalsin earning them.8 Lerner and Tirole call this a reactive strategy, as it relies on softwarecreated by others.
Another approach is for commercial entity to produce their open source software. Thisstrategy makes sense when releasing source code would result in a higher return of in-vestment than what could be achieved by keeping the source closed. For example, byreleasing open source drivers for their product, a hardware vendor might see an increasein sales as the driver is ported to run on different operating systems than they would ifthey provided a closed source driver that only ran on Windows.
A variation on this approach is for a commercial entity to partner with and/or makesignificant contributions to an existing open source project. Lerner and Tirole only hintat this possibility, perhaps because the practice was less common in 2002 than it is today.If a commercial entity has a need for some software, they might fulfill this need moreeffectively if instead of paying for a proprietary solution from another commercial entitythey hire developers to adapt an open source alternative for their purposes. An exampleof this approach is the Eclipse, an open source programming environment9 that began itslife as part of an IBM product. IBM released Eclipse under an open source license, whichhas helped turned the software into one of the leading Java development environments.In exchange, IBM is able to reap the benefits of using a product that has a much largerdeveloper base than might have been possible had they kept Eclipse as a proprietary tool.
Choosing an Open Source Software License in Commercial Context: A Managerial Perspec-tive[22] examined license choices made by companies that produce open source soft-ware. It describes a preliminary model of open source license decision making based
8For more information on Red Hat, visit their website at http://www.redhat.com9http://www.eclipse.org
John Brewer VIII Chapter 2. Literature Review 22
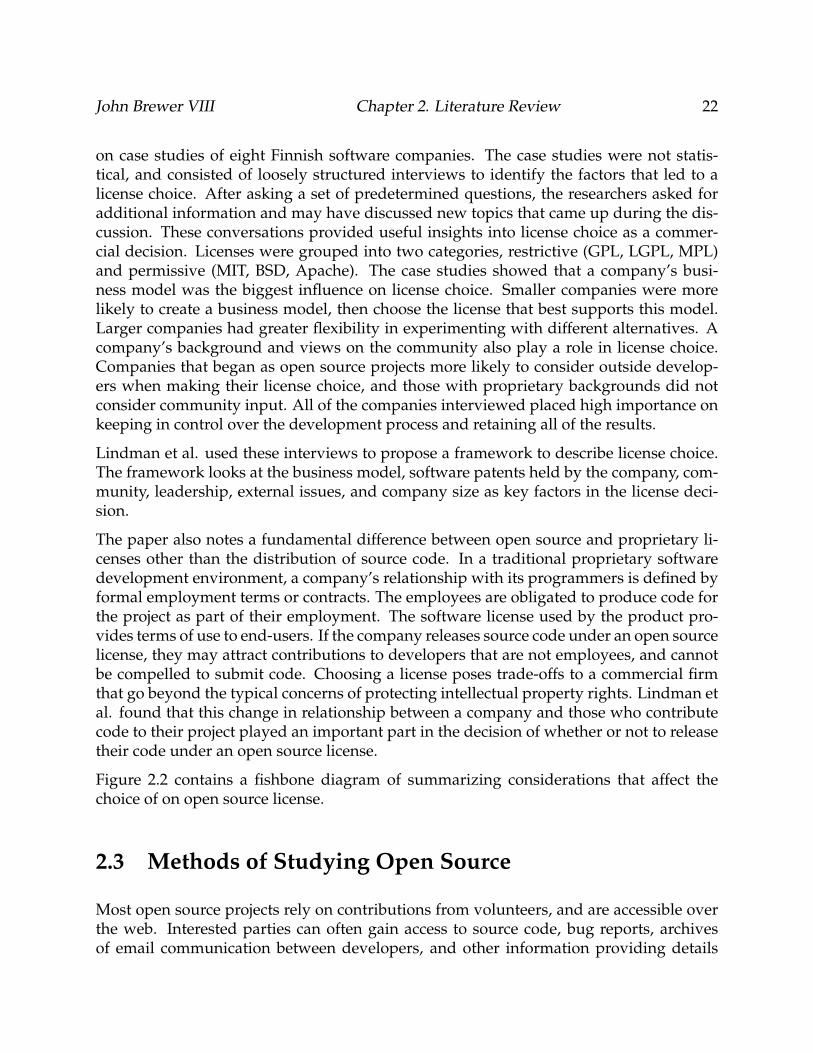
on case studies of eight Finnish software companies. The case studies were not statis-tical, and consisted of loosely structured interviews to identify the factors that led to alicense choice. After asking a set of predetermined questions, the researchers asked foradditional information and may have discussed new topics that came up during the dis-cussion. These conversations provided useful insights into license choice as a commer-cial decision. Licenses were grouped into two categories, restrictive (GPL, LGPL, MPL)and permissive (MIT, BSD, Apache). The case studies showed that a company’s busi-ness model was the biggest influence on license choice. Smaller companies were morelikely to create a business model, then choose the license that best supports this model.Larger companies had greater flexibility in experimenting with different alternatives. Acompany’s background and views on the community also play a role in license choice.Companies that began as open source projects more likely to consider outside develop-ers when making their license choice, and those with proprietary backgrounds did notconsider community input. All of the companies interviewed placed high importance onkeeping in control over the development process and retaining all of the results.
Lindman et al. used these interviews to propose a framework to describe license choice.The framework looks at the business model, software patents held by the company, com-munity, leadership, external issues, and company size as key factors in the license deci-sion.
The paper also notes a fundamental difference between open source and proprietary li-censes other than the distribution of source code. In a traditional proprietary softwaredevelopment environment, a company’s relationship with its programmers is defined byformal employment terms or contracts. The employees are obligated to produce code forthe project as part of their employment. The software license used by the product pro-vides terms of use to end-users. If the company releases source code under an open sourcelicense, they may attract contributions to developers that are not employees, and cannotbe compelled to submit code. Choosing a license poses trade-offs to a commercial firmthat go beyond the typical concerns of protecting intellectual property rights. Lindman etal. found that this change in relationship between a company and those who contributecode to their project played an important part in the decision of whether or not to releasetheir code under an open source license.
Figure 2.2 contains a fishbone diagram of summarizing considerations that affect thechoice of on open source license.
2.3 Methods of Studying Open Source
Most open source projects rely on contributions from volunteers, and are accessible overthe web. Interested parties can often gain access to source code, bug reports, archivesof email communication between developers, and other information providing details
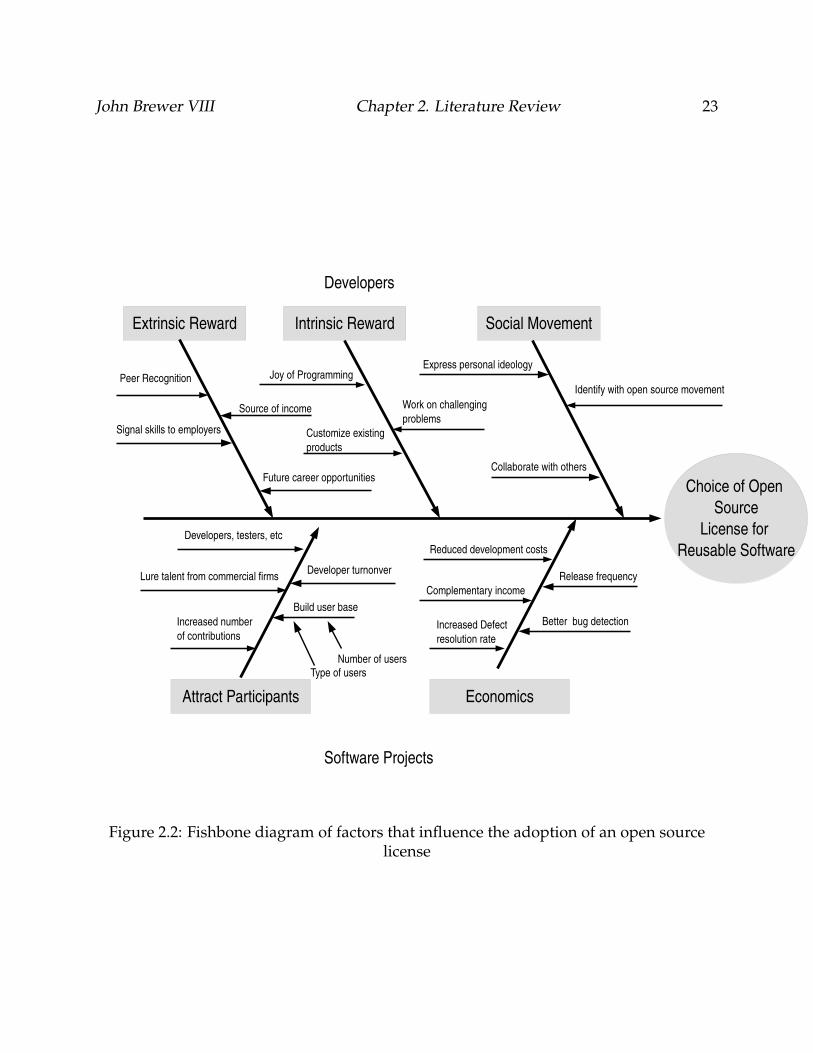
John Brewer VIII Chapter 2. Literature Review 23
Figure 2.2: Fishbone diagram of factors that influence the adoption of an open sourcelicense
John Brewer VIII Chapter 2. Literature Review 24
of the project’s development process. The amount of freely accessible information onthousands of open source projects provides researchers with a wealth of data on softwareengineering practices. This section summarizes the data collection methods used by thepapers examined in this review. A summary of this section is presented in table 2.3.
Gasser et al.[25] recognized the value of the accessibility of open source software andproposed a framework to organize this data to support the research of the open sourcemovement by multiple disciplines. They identified five main objects of study: SourceCode and Artifacts, Processes, Projects, Communities, and Knowledge. Data for each ofthese objects can be found in code repositories, blogs, wikis, mailing list archives, dis-cussion forums, documentation, FAQs, and several other web-based storage methods.Integrating these methods can be difficult, and may require a variety of extraction toolsand interfaces in order to retrieve data for one research question from all of them. Thepaper recommends that the open source research community as a whole begin to addressthese integration issues by creating resources to support empirical research. They proposea few ideas on how to accomplish this, including the creation of tools to extract data fromdiverse sources and the creation of new repositories that provide data on open sourceprojects to the public. Many of the papers in this review demonstrate methods that canbe used to implement these suggestions.
Some studies consist of case studies of individual projects that attempt to draw conclu-sions about open source development as a whole. Lindman, Paganini, and Rossi[22]chose eight companies that publish open source software and conducted semi-structuredinterviews with employees who had the best understanding of open source licensing. Theemployees were asked the same questions about the decision-making process that led toa choice of open source license for their product. The semi-structured nature of the in-terview allowed the interviewers to ask for clarifications and additional information foreach response. Information collected during these interviews was used to formulate ageneral model of the decision making process.
Other case studies focused on the experiences learned from of individual project efforts.Pizka[26] details the challenges encountered by long-term project to develop a distributedoperating system. The team attempted to write a system from scratch; after the projectfell well behind schedule they decided to start over and adapt existing code to build theirproject. The second approach yielded better results. The paper describes the lessonslearned from this experience and provides evidence that it makes more sense to leverageexisting components when building complex software systems. Kritkos, et. al.[27] sug-gest a reuse process based on their experiences on as developers on other projects. Theirprocess identifies iterative steps a programmer might use to break a programming assign-ment into a series of requirements, and how to identify components that will meet theserequirements. The authors propose that following these steps can encourage the use ofopen source components to produce quality software efficiently.
Surveys of open source project participants is another method used to collect data for
John Brewer VIII Chapter 2. Literature Review 25
research papers. Li, Conradi, et al. [28, 29]surveyed IT companies in Norway, Italy, andGermany to determine what factors lead to the adoption of open source and commercialsoftware components. Their study examined decisions made by commercial entities thatpublish software, so online open source project directories would be of limited use increating their survey sample. Instead, they used traditional methods: survey recipientswere selected from software company lists provided by the Norwegian Census Bureau,a comparable German agency, and the Italian yellow pages. A questionnaire designedin English, then translated into the native languages of the recipients, had received 110usable responses at the time of publication.
Ajila and Wu[30] used a similar approach in their study of how the use of open sourcecomponents affects the economic side of software development. They conducted an ini-tial exploratory study consisting of interviews with employees of six companies. Thisresults of this study were used to create a formal survey that was sent to a random sam-ple of 120 software organizations in the United States and Canada.
Sen, Subramaniam, and Nelson[23] used an online survey to collect data from opensource developers in their research of the factors that determine the choice of licensesused by an open source project. They identified survey participants by examining projectshosted on Sourceforge, a website that provides project management resources to opensource projects. 10 Invitations to participate in the survey were sent to 2,000 programmerswhose email addresses were mined from the site. The 196 usable responses they receivedformed the basis of their study.
Other studies use source code and other content extracted from open source project repos-itories. Mockus[3] relies heavily on public code repositories in his analysis of open sourcecode history. Mockus’s ambitious project started from the observation that since sourcecode is the result of software development, an index of source code collected from allpublicly accessible code repositories would assist in the research of software develop-ment methods. His paper describes the results of experiments and techniques used tocollect the complete version control histories of a large sample of open source software.The project’s first step was to identify repositories that hosted open source version con-trol systems. In addition to sites such as Sourceforge, Google Code, and Savannah, whicheach host many projects, they also included sites for large scale or well known projectslike the Linux kernel, Eclipse, and Mozilla. They also searched software directories, suchas the one maintained by the FSF11, that do not host projects but provide URLs to theirsource code. Information collected from the Linux distribution repositories, such as Red-Hat and Debian, was used to identify the most poplar software and create the project’ssample. The full source code version history of the projects in the sample was collected byusing scripts to copy the source code from the project’s version control software and storeit into an external database. Most of the projects used one of a handful of source control
10For more information, visit http://sourceforge.net11 http://directory.fsf.org/wiki/Main_Page
John Brewer VIII Chapter 2. Literature Review 26
systems (Subversion, Git, CVS, etc) which provide APIs that can be used to extract itscontents. All versions of each file in a project’s source code was stored in a database. Thedatabase contained the complete version history of each project in the sample, and servedto be an example of how a universal code index might be created.
Mockus used the index in a second study that examined large-scale code reuse in opensource software[4]. The study examined the directory structures of project the source codeand used common directory names and file contents to identify when one project reusedcode from another. They concluded that approximately half of the files in their code indexwere used in more than one project, suggesting that reuse within open source projects iscommon and widespread.
The work of Ananthanarayanan et al.[31] describes a method of extracting system re-quirements and dependency information from multiple sources. By providing systemrequirements, software components that meet those requirements, and dependency in-formation in a structured format, many system administration and development analysistasks can be automated in a way that is not practical when this information is stored inmultiple, unrelated documents. The system described in this paper automates extract-ing this data; since most of the information is available on web pages, they used a webcrawler seeded with a list of URLs to find pages related to a component. Requirementsinformation was identified on these pages by a text analysis component. Extracted datawas used to populate a dependency model represented in a structured format; this al-lows analytic tools to be developed that support decision making. The authors reportthat their experiments using the tool results in 80% of dependencies identified and 72%of them identified correctly.
Ramel’s study of open source software reuse[5] used both Sourceforge and the SuSELinux package repository as a data source. Many programming languages support theconcept of packaging, where code can be grouped into packages that can be included orreferenced by another program. Ramel measured external reuse by determining whatpercentage of packages used to develop a software product were external to the project.The study applied this metric to a sample of open source projects written in Java and C++.All of the Java projects in the sample were hosted on Sourceforge. Ramel used JDepend, atool that analyzes dependencies of Java programs, to identify all of the packages neededfor each project in the sample, and then used a custom program to determine how manyof these were internal and external to the project. To apply the metric to projects writtenin C++, Ramel identified the shared libraries used by the project, and as with the Javaapplications, determined which of these were external to the project. The SuSE Linuxpackage repository was used as a data source for the C++ programs because the softwareit contains is organized in a way that makes it easy to identify the dependencies of thesoftware in the sample.
Stewart et al.[6] used open source project metrics taken from Freshmeat, an open source
John Brewer VIII Chapter 2. Literature Review 27
project hosting site12, in their study on the impact of license choice and organizationalsponsorship on the development activity of open source projects. Their sample consistedof 138 projects from three software categories. Freshmeat provided descriptive data foreach project as well as data that was used to create the metrics used in the study. De-scriptive data included the age of the project, open source license type, and whether theproject was affiliated with a non-profit organization. The number of subscribers signedup to receive information on a project was used to measure user interest, and the numberof releases over a given time period was used to measure development activity. Analysisof the data collected from the sample projects led to the conclusion that the restrictivenessof a project’s license and its organizational affiliation influence user interest in the project.
Colazzo and Fang[7] adopted a similar approach in their investigation into the impact oflicense choice on development activity. Their sample consisted of 244 projects hosted onSourceforge that are included in at least one of the three most popular Linux distributions.Sourceforge provided descriptive data such as the license type, programming language,age, and description for each project. Developer membership and their coding activity, aswell as the speed of development and developer turnover, were calculated by examiningthe version control system for each project in the sample and identifying the rate that codewas produced and the number of developers producing it. Their study concluded thatcopyleft programs attract more developers and have shorter time between releases thannon-copyleft programs.
Lerner and Tirole also used Sourceforge as a data source[8]. In addition to the descriptivedata taken from each project’s Sourceforge home page, a variety of supplemental datawas obtained directly from Sourceforge staff. This data included website activity and thedate in which a project was first posted to the site. The size of the sample appears to havebeen much larger than those in other studies reviewed here. Lerner and Tirole note thatwhen they collected their data in May of 2002, Sourceforge hosted approximately 39,000projects, and that Sourceforge staff provided them with additional data on about 10,000 ofthese projects. This enabled them to make several observations on the correlation betweenthe type of open source license and various project descriptors.
12Freshmeat has since been re-branded as Freecode. See http://freecode.com for more information.
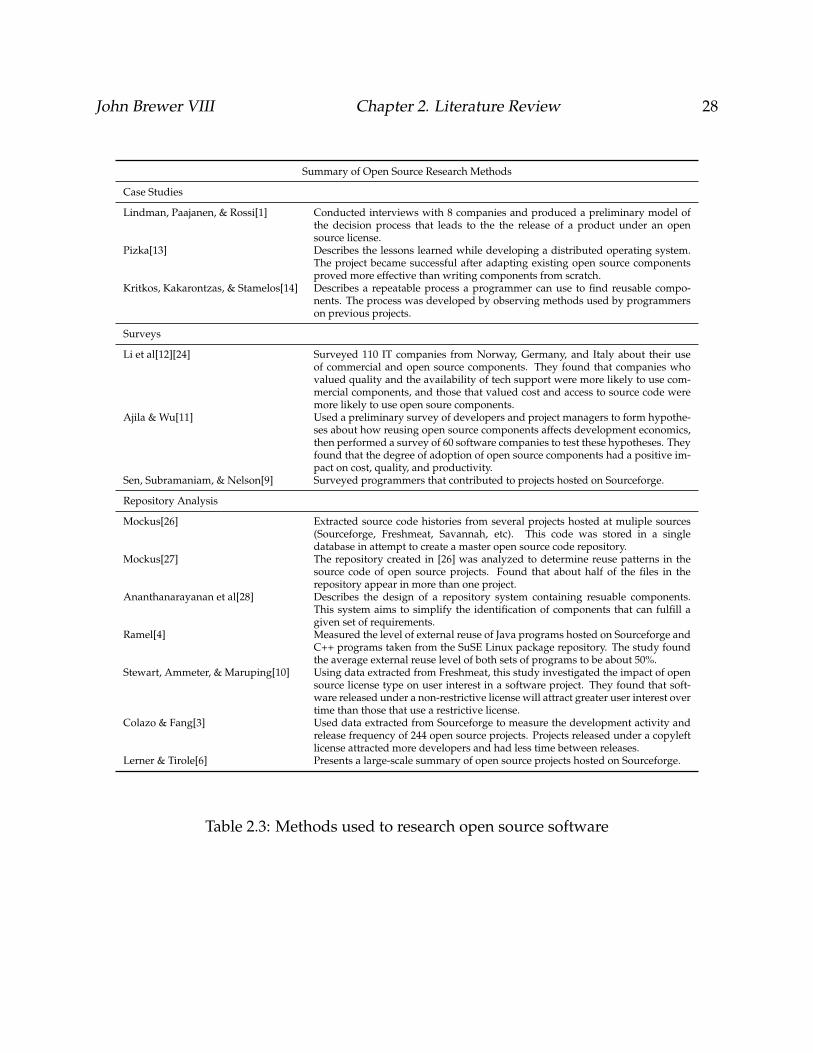
John Brewer VIII Chapter 2. Literature Review 28
Summary of Open Source Research Methods
Case Studies
Lindman, Paajanen, & Rossi[1] Conducted interviews with 8 companies and produced a preliminary model ofthe decision process that leads to the the release of a product under an opensource license.
Pizka[13] Describes the lessons learned while developing a distributed operating system.The project became successful after adapting existing open source componentsproved more effective than writing components from scratch.
Kritkos, Kakarontzas, & Stamelos[14] Describes a repeatable process a programmer can use to find reusable compo-nents. The process was developed by observing methods used by programmerson previous projects.
Surveys
Li et al[12][24] Surveyed 110 IT companies from Norway, Germany, and Italy about their useof commercial and open source components. They found that companies whovalued quality and the availability of tech support were more likely to use com-mercial components, and those that valued cost and access to source code weremore likely to use open soure components.
Ajila & Wu[11] Used a preliminary survey of developers and project managers to form hypothe-ses about how reusing open source components affects development economics,then performed a survey of 60 software companies to test these hypotheses. Theyfound that the degree of adoption of open source components had a positive im-pact on cost, quality, and productivity.
Sen, Subramaniam, & Nelson[9] Surveyed programmers that contributed to projects hosted on Sourceforge.
Repository Analysis
Mockus[26] Extracted source code histories from several projects hosted at muliple sources(Sourceforge, Freshmeat, Savannah, etc). This code was stored in a singledatabase in attempt to create a master open source code repository.
Mockus[27] The repository created in [26] was analyzed to determine reuse patterns in thesource code of open source projects. Found that about half of the files in therepository appear in more than one project.
Ananthanarayanan et al[28] Describes the design of a repository system containing resuable components.This system aims to simplify the identification of components that can fulfill agiven set of requirements.
Ramel[4] Measured the level of external reuse of Java programs hosted on Sourceforge andC++ programs taken from the SuSE Linux package repository. The study foundthe average external reuse level of both sets of programs to be about 50%.
Stewart, Ammeter, & Maruping[10] Using data extracted from Freshmeat, this study investigated the impact of opensource license type on user interest in a software project. They found that soft-ware released under a non-restrictive license will attract greater user interest overtime than those that use a restrictive license.
Colazo & Fang[3] Used data extracted from Sourceforge to measure the development activity andrelease frequency of 244 open source projects. Projects released under a copyleftlicense attracted more developers and had less time between releases.
Lerner & Tirole[6] Presents a large-scale summary of open source projects hosted on Sourceforge.
Table 2.3: Methods used to research open source software
John Brewer VIII Chapter 2. Literature Review 29
2.4 Open Source Reuse
Software reuse is the creation of new software from existing code, documentation, orother objects[1]. Effective reuse is intended to improve software quality and developerproductivity while lowering production costs[32]. Proponents of open source softwareargue that the ability to modify source code for use in another project provides greater po-tential for reuse. Rather than develop a solution to a programming problem from scratch,a programmer can use an existing solution from an open source project and adapt it for anew purpose. The open source movement encourages this behavior; Raymond observesthat “great programmers know what to reuse”[13].
A paper by Markus Pizka[26] describes the experiences of a research team working on asystem for distributed computing and the lessons they learned about reusing open sourcesoftware. The goal of their project was to produce low-level and complex software, in-cluding a compiler for a parallel and distributed programming language and the kernelthat could run the resulting code. Their first approach was to implement these featuresby wrapping existing components to run on an existing system. To accomplish this, theydeveloped a compiler that would translate programs written in their custom language toC++, which could then be compiled to run on a UNIX system. The resulting softwareworked, but performance was poor and well below an acceptable level. After attemptingto increase performance by using C as the intermediate language, they concluded thatthe strategy of wrapping existing components was not going to produce the results theyneeded.
Based on this experience, the project team responsible for the kernel portion of the projectdecided to implement a new kernel from scratch. Their decision was based on the as-sumption that adapting the source of an existing kernel would prove too tedious andtime consuming, and that open source software’s reputation of being sparsely or poorlydocumented would make it difficult to adapt an existing product for their purposes. Thiswould be especially true for a kernel, given the complexity of the tasks it would be ex-pected to perform. Compounding these problems was the lack of documentation on howopen source alternatives were implemented. The time spent figuring out how the codeworked could be spent writing new code that already performed the tasks necessary fortheir project. However, the project quickly fell way beyond schedule. The original goalwas to produce a working kernel within 2 people years, but after 6 years the code was stillnot usable. The reason for this was that most of their time was spent solving problems inkernel design that had already been solved by existing kernels. By choosing to start fromscratch they failed to capitalize on the success of others.
The experience of trying to produce a working kernel led the project to try a differentstrategy when building their compiler. Instead of building one from scratch, they de-cided to modify GCC13, an existing open source compiler, to compile their new language.
13The GNU Compiler Collection. See http://gcc.gnu.org for more information.
John Brewer VIII Chapter 2. Literature Review 30
GCC is a very large and complex program, as it compiles several languages and runs ona wide variety of platforms. While there is documentation on how to use the software,the program’s design and implementation must be learned by examining the source code.Modifying it to compile a new language was seen as very ambitious. However, progresson the new compiler occurred at a higher than expected rate. Within 3 months, a sin-gle undergraduate student with limited programming experience was able to develop aworking prototype. It turned out that although reading unfamiliar source code is frustrat-ing at first, understanding came fairly quickly. Tremendous gains were made by lever-aging the work that had already been done by the GCC project. At this point, the kerneldevelopment team abandoned their efforts and began adapting the Linux kernel for theirpurposes. As with the compiler, work progressed much more rapidly, and the develop-ment schedule of the project as a whole moved forward at a much faster rate.
The importance of this case study is that it provides support for the argument that accessto source code improves the reusability of open source projects. Despite a lack of docu-mentation and the complexity of the tasks, significant gains in productivity can be madeby leveraging the code of others. The key is to avoid solving a problem that has alreadybeen solved, and instead to focus on using existing solutions to solve new problems.
2.5 Component Reuse
The basic method of measuring reuse is to determine the percentage of pre-existing arti-facts used to create a software product. This metric can be applied at various levels. Forinstance, a low reuse level might be measured by the percentage of lines of reused code ina module. Determining the percentage of reused modules in the project would produce ahigher reuse level measurement[1]. In her study of open source software reuse, Ramel[5]examined reuse at the package level, where a package is a resource, such as a shared li-brary, around which a programmer can structure their code. Reuse level was calculatedby dividing the number of external packages used to create a software product by thetotal number of packages in the product. Ramel applied this measurement to two groupsof software projects. The first group consisted of 112 projects written in Java retrievedfrom Sourceforge and open source projects hosted at Java-Source.net.14 The second groupconsisted of 396 projects written in C++ taken from the SuSE Linux package repository.The study found that average external reuse level of both groups of software to be about50%. The Java applications hosted on Sourceforge averaged 45%, and the projects fromJava-Source.net averaged 52%. The C++ applications had an average external reuse levelof 48%.
Ajila and Wu, in their paper Empirical study of the effects of open source adoption on soft-ware development economics[30], examine how the use of open source components affects
14For more information, visit http://www.java-source.net.
John Brewer VIII Chapter 2. Literature Review 31
software development. Their preliminary research showed that although the use of opensource components by commercial entities is on the rise, there was lack of empirical evi-dence on how the use of these components might affect economic considerations of cost,productivity, and product quality. To develop their hypotheses they conducted a prelim-inary study of software development organizations that use open source components byconducting interviews with their developers, QA managers, and project managers. Theseinterviews sought to identify an approximation of the decision making process that leadsto the use of open source components. The responses they received were used to formtheir research hypotheses. These hypotheses make predictions on how various aspects ofopen source reuse affects three basic concerns of software development: cost, productiv-ity, and quality.
The first aspect is the degree of adoption of open source components. Ajila and Wu ob-served from their preliminary study that organizations attempt to create products faster,cheaper, and better than their competition in order to gain market share. The choice toreusing existing open source components was cited as a way to achieve all three of thesegoals. The next aspect is the maturity level of the software reuse program used by theseentities. To determine the effect of maturity level on project success, the study rankedthese programs on a scale ranging from “initial/chaotic” to “ingrained”. Noticing a lackof research on the role a software developer’s experience with reuse plays on the successof an open source reuse program, Ajila and Wu added this aspect to their study. Respon-dents of the preliminary survey mentioned the importance of the selection criteria usedto identify components for reuse. Lastly, they posit that the size of a company impactsthe adoption and effectiveness of an open source reuse program. Their hypotheses wasthat the degree of each of these aspects has a positive relationship to development costs,productivity, and product quality.
A survey of 60 software companies, of varying size, products, and customers, providedthe data for the study. The results largely confirmed the hypotheses. The degree of adop-tion of open source components had positive impact on quality, productivity, and cost, inthat order. Ajila and Wu observed agreement among developers that open source com-ponents tend to be of high quality and using them can lead to a higher quality product.Gains in productivity were seen in a shortened time to market. Project cost reductionswere least affected by open source reuse, suggesting that gains in this area are likely tobe the result of a higher quality product leading to reduced maintenance costs. Reusematurity level was found to have a significant impact on productivity and quality, butas with the degree of adoption there was no significant effect on costs. While developerexperience with reuse did have a positive affect on product quality, the survey did notfind that developer reuse experience had a significant effect overall on project economics.This result did not agree with the information gathered during their literature review thatreuse experience is critical to the success of a reuse program. Component selection crite-ria were found to have a significant impact on product quality and, to a lesser extent, oncost, but no impact on productivity. Finally, the study found no significant differences in
John Brewer VIII Chapter 2. Literature Review 32
open source component reuse adoption between large and small companies.
Ajila and Wu summarize their conclusions by noting that open source reuse has a strongimpact on software quality, a moderate impact on productivity, and the least impact ondevelopment costs. They express some concerns over the limitations of their survey meth-ods, and suggest a larger study of open source reuse data as future work.
The study conducted by Li, et al.[28]makes an attempt to determine whether there is anadvantage in choosing open source components over commercial equivalents. To answerthis question, the study conducted a survey to identify characteristics of projects that useopen source components vs. those that used commercial components, and to examinethe motives that led to the choice of one type of component over the other. By identify-ing which projects use these components, and why, they can determine risks and benefitsassociated with the two component types. The survey sample consisted of projects thatwere “finished”; that is, they had completed core development for at least one releaseand may be in a maintenance phase. 115 software projects from Norway, Italy, and Ger-many completed the survey. Of these, 71 used commercial components only, 39 usedopen source components only, and 5 used both open source and commercial components.These last 5 were removed from the sample.
The survey results showed no significant differences between the characteristics of projectsusing open source components vs. those using commercial components. Both componenttypes were used in several application domains, both were used in small, medium, andlarge IT companies, and both were used in projects that emphasized the importance of ashortened time to market, reliability, and performance. The expectations of projects usingopen source and those using commercial components were the same: both types expectedtheir component choice to reduce development time and effort and to reduce maintenanceefforts. However, the specific motives that led to the choice of one type over the other wasfound to be significantly different. Projects using commercial components listed qualityand the ability to get technical support from the vendor as the primary reasons for theirdecision. The cost, availability of source code, and the possibility that a vendor may goout of business were the main motivations of projects that used open source components.
Among the conclusions drawn from these results is that users of closed source compo-nents were not more satisfied with the reliability and/or performance of their choice,even though they listed performance as a key factor in their decision. Also, projects us-ing open source components were not less satisfied with the technical support they wereable to receive than projects using commercial components, despite that the ability to gettechnical support from the vendor was another key reason for choosing a closed sourcecomponent.
Kritikos, Kakarontzas, and Stamelos look at component reuse from the practitioner’spoint of view in their paper A Semi-Automated Process for Open Source Code Reuse[27]. Theirstudy describes a method an individual programmer might use to determine which partsof their software project can be developed by reusing existing components. This method
John Brewer VIII Chapter 2. Literature Review 33
is different from those proposed in other papers in that it provides a practical approachborn from actual behavior, as opposed to other methods that develop a prescriptive modelbased on a theoretical model. Consequently their method is probably much more appli-cable to the situation faced by most open source developers.
Kritikos, et al. define component-based reuse as combining existing components to createnew software, a definition that is consistent with that found in other papers discussed inthis review. To facilitate reuse, each requirement is considered as a candidate for imple-mentation by one component. If a requirement is too complex for this to be practical, therequirement is decomposed into smaller pieces, and the analysis is repeated. The end re-sult is a set of requirements that can either be implemented from an existing componentor is trivial enough to be implemented from scratch. A trivial requirement might includesomething like writing data to a file, for which numerous examples can be easily foundfor any programming language. The authors call these examples “bibliography code”,and do not consider their use as component reuse.
At this point components that can implement the requirements must be located. This canbe the most difficult part of the process. Numerous online code repositories provide thou-sands of freely available open source components for consideration. Assuming that theserepositories can be searched effectively, there are two potential outcomes that need to beavoided. First, in some cases it might take longer to identify the right component than itwould take to implement a solution from scratch. The second is that the requirement istoo specific, and no such component exists. Searching for a nonexistent component usestime that would be better spent elsewhere. This paper acknowledges the need for bet-ter automated systems that can help overcome all of these challenges. Developing thesesystems is left as an area for future research.
The Amos Project[33], a project aimed at making it easier to build software using opensource components, proposed one method of identifying components for reuse. Theirpaper describes a conceptual model behind the implementation of an algorithm that canbe used to search a repository of reusable components. The repository stores the listof capabilities provided and the prerequisites for each component. These requirementsand capabilities are expressed using a dictionary of terms that facilitate the search pro-cess. The search algorithm takes as its input the list of requirements and returns sets ofcomponents that can meet these requirements. The components in the result set havetheir own requirements, which become the input for the next iteration of the algorithm.Since a repository could contain thousands of packages, with several sets of componentsfulfilling the initial set of requirements, determining an optimal solution can be computa-tionally prohibitive. To offset this problem, the algorithm can take into account heuristicsto increase the chances that an optimal solution is found. Given the algorithm’s use offirst order logic to return results, the creators of the Amos project decided to use CiaoProlog15, an open source version of Prolog released under the GNU GPL, for their imple-
15http://ciaohome.org
John Brewer VIII Chapter 2. Literature Review 34
mentation. The system would be accessed and administered through a web interface, andthe descriptive information for each component stored in a database. One of the goals forthe project is to produce a set of tools that an organization can use to maintain its owncomponent repository of freely available and internally developed software.
The paper briefly discusses the problem of identifying the right components, not justthose that fulfill the requirements, and to ensure that the sets of components returnedby a search are compatible. While no algorithm for accomplishing this is included inthe paper, the authors note two ways of handling this challenge. One is for the personusing the search engine to perform the task by hand, and evaluate each set of componentsreturned by the search. The other is for the software to use descriptive information foreach component to determine component compatibility. Details on how this might beaccomplished are not included the paper. Nevertheless, the paper presents a theoreticalframework and clear design for implementation that promises to simplify componentreuse.
Chapter 3
Methods
A review of the literature shows that the choice of an open source license can effect factorssuch as the number of programmers that decide to contribute to a project and the rate inwhich development occurs. It also shows that reuse, at various levels, is fairly widespreadin the open source development community. To date, no studies examine the role thechoice of license plays in influencing this reuse. This study makes an attempt to determineif license choice makes a significant impact on the reuse within and external to a softwareproject.
3.1 Independent Variables
This study relies on two independent variables: license type and software category.
3.1.1 License Type
License Type: While there are many different open source licenses, most open source soft-ware is released under one of the five described in section 2.1.2. These are the GPL, LGPL,ASL, BSD, and MIT licenses. As demonstrated during the literature review, most researchon the impacts of license choice do not consider the licenses individually, but rather groupthem into categories based on the restrictions they place on how modifications to the soft-ware they cover are distributed. Table II shows how some researchers have categorizedthese five licenses. The same approach will be taken in this study, with licenses beingplaced in one of two license types:
• Restrictive- includes all versions of the GPL and LGPL. Sometimes referred to ascopyleft licenses, these licenses require that any modifications be redistributed un-
35
John Brewer VIII Chapter 3. Methods 36
der the original license, which ensures that the source code of the software willalways be freely accessible. The current GPL is a direct descendant from the orig-inal GNU license, which played an important part in establishing the open sourcemovement.
• Permissive- includes all versions of the ASL, BSD, and MIT licenses. None of thesethree licenses require that the source code of modifications be released. An opensource project might release a software component under one of these licenses to in-crease the potential users of their product. In addition to other open source projects,such components may be used by entities that wish to use them to create proprietary(closed-source) software.
Grouping the licenses into categories simplifies the process of identifying the implicationsof license choice. In addition to the differences between individual licenses discussedin section 2.1.2, there are differences between the different versions of a single license.These differences are small, and are not likely to impact the effectiveness of the licensesat promoting reuse.Grouping them into categories allows us to focus on the significantdifferences between open source licenses that have a direct role on reuse.
3.1.2 Software Category
Since the literature suggests that the purpose or intended audience for a software productaffects license choice, it makes sense to examine reuse patterns along similar lines. All ofthe software components used in this study fall into one of four categories:
• Development tools- components providing basic building blocks for creating otherprograms. The components in this category include things such as programminglanguages, compilers, interpreters, and debugging tools.
• Applications- consumer oriented programs aimed at end-users. This is a broad cate-gory which includes programs such as office applications, games, multimedia play-ers, and more. These programs are likely to have been produced using the tools inthe development tools and system environment categories.
• System environment- components such as shared libraries and command shells whichprovide functionality to other programs, such as shared libraries and disk utilities.The components in this category sit between the development tools and applica-tions; however they are not used directly by end users but rather used by developerswhen building applications.
• User interface- components that provide input and output controls used to interactwith a computer system. This includes desktop window managers and mouse and
John Brewer VIII Chapter 3. Methods 37
keyboard drivers. Like software in the system environment category these compo-nents are needed to run other applications, but users do interact with them directly.
As mentioned above, software that falls into the development tools and system environ-ment categories are expected be more likely to be released under a permissive license,whereas those in the applications and user interface categories are more likely to use arestrictive license.
3.2 Dependent Variables
The dependent variables in this study are determined by quantifying the dependencyrelationships between software packages found in the Fedora Linux package repository.
3.2.1 Package Dependency Count
Frakes and Terry[1] identify methods of quantifying the amount of reuse. The basicmethod takes the form of identifying the percentage of reused objects that appear in anew software object. This metric can be applied at many different levels, such as the per-centage of reused lines of code or the percentage of pre-existing components used in aproject. They use the term external reuse to refer to the number of items taken from anexternal source, and internal reuse to refer to the number of items created specifically foruse in the current project.
Ramel[5] used this method to measure reuse in open source software. She applied thebasic metric at the package level. In this context the term package refers to the practicecommon in most programming languages of breaking functionality into units that canbe imported or referenced as needed. The implementation of packaging varies acrosslanguages (jar files in Java, shared libraries in C/C++, etc) but the general concept is thesame. By identifying the internal and external packages used to create the software in hersample, Ramel was able to calculate the percentage of external reuse for each of them.
In this study, the term package means something different: it refers to an item in the Fe-dora Linux software repository. A Fedora package is a software component and somedescriptive information bundled for distribution and ease of installation. From this pointforward the term package refers a Fedora package. A more detailed description of pack-ages appears in section 3.3.2. For now it will suffice to know that a package might dependon one or more other packages in order to function properly. For instance, a word pro-cessor might rely on the spell checking capabilities provided by a third-party library thatis bundled into its own package. Use of this library counts as an instance of externalreuse by the word processor application. The package dependency count is the total number
John Brewer VIII Chapter 3. Methods 38
of Fedora packages depended on by a package. This count indicates the external reuseof other Fedora packages in a manner similar to that used by Ramel[5] to identify pre-existing software components used by the applications in her sample. However, packagedependency count works at a higher level of abstraction.
Note that the package dependency count includes all of a package’s dependencies regard-less of the license or category that the dependency belongs to. This is done because nomatter the intended use of a dependency it still counts as an instance of external reuse. Acomponent might be reused in ways not anticipated by its authors. Filtering the depen-dency list of a component based on dependency characteristics would be a way of placingunnecessary limits on what counts as reuse.
3.2.2 Dependent Package Count
All of the studies on open source reuse reviewed above, including Ramel’s, attempt tomeasure the amount of reuse within a set of applications. In addition to determining thepackage dependency count, this study seeks to measure software reuse from a differentperspective. When creating a new piece of software, a developer will identify the compo-nents, both internal and external, that are needed to provide the functionality dictated bythe requirements of the program. Software development projects, both proprietary andopen source, seek to use existing components in their products in order to reduce costsand time-to-market. In addition, the open source community has largely embraced theidea that re-implementing a solution to a problem that has already been solved is some-thing to be avoided. An existing component that has been around for some time and hasbeen used by many other projects has been well tested and is more likely to provide a highquality solution to a specific problem domain. Also, there is evidence that the availabilityof existing components frequently plays a large part in the design of new applications;that is, a developer will use existing components to craft a solution rather than decom-pose a problem into pieces and look for components to provide those pieces[34, 26, 28].
All of this suggests that there is value in determining how often a component has beenreused by other software projects. Measuring how often a component is reused can helpdevelopers with evaluating the suitability of a component to their project. It also enablesresearchers to rank components by their reusability and identify software providers thathave a record of producing effective reusable components, and thereby provide subjectsfor case studies on how to develop reusable software. In our case, this metric is used todetermine if open source license types play a role in encouraging reuse.
Frakes and Terry define reuse frequency as a the number of references to a component thatis being reused[1]. This metric can be used to determine to what extent a component isbeing reused within an application. Reuse frequency served as the inspiration for thesecond dependent variable used in this study. The dependent package count of a Fedorapackage is the number of times that package appears on the dependency list of another
John Brewer VIII Chapter 3. Methods 39
package. This count indicates how often the package is reused. A package’s appearanceon a dependency list shows that it provides functionality necessary for another packageto work properly. As with external and internal reuse described above, this metric canbe applied at various levels. The dependent package count is applied at a relatively highlevel. A Fedora package can be a variety of software objects. Most often it is a libraryor some piece of executable code, but it can also be a configuration file, a collection ofdocuments, or a stand-alone application. The dependent package count includes anyinstance where the package is depended on, regardless of the type of function the packageprovides. The dependent package count is the total number of other packages that requirea specific Fedora package in order to run properly.
The dependent package count is intended to give an indication of the reusability of a pack-age within a Linux software repository. Reusability has been defined as the probability thata software artifact is reusable[1, 32]. By determining how often a package has been usedby other packages in the past we can get a sense to its likelihood of reuse in the future.
3.2.3 Limitations
The package dependency and dependent package count variables provide simple, high-level measurements of reuse that are well suited for investigating the relationship be-tween license type and reuse for all of the packages within the Fedora package repository.However, their simplicity imposes some generalizability limitations.
For one, they do not take into account the size or complexity of the package being mea-sured. This means that neither measurement can determine how much of a package’sfunctionality is provided by the pre-existing packages it reuses. In addition, each de-pendency is treated equally, regardless of how a package might actually be reused. Apackage might be used extensively by another package, but provide less functionality toa third, but both dependency relationships are weighted the same. Also, the size andcomplexity of a package does not affect its dependency counts. This can lead essentialsystem libraries to have dependent package counts that may underestimate the extent oftheir reuse by other packages. For example, programs written in the Java programminglanguage require an implementation of the Java runtime environment in order to be ex-ecuted. One such implementation is provided by the package openjdk 1. This packagealso provides an implementation of the standard API that is likely to be used extensivelythroughout most Java applications. openjdk may provide the bulk of the functionalityneeded by an application, but that application’s dependency on openjdk counts once whendetermining the application’s package dependency count.
Despite these limitations, the package dependency and dependent package counts iden-tify reuse relationships between packages in the Defora repository. These counts can be
1http://icedtea.classpath.org/
John Brewer VIII Chapter 3. Methods 40
used to identify high-level trends in reuse, which in turn can be used to examine the rolelicense type plays in predicting reuse.
3.2.4 Package Dependency Count Hypotheses
The most restrictive open source licenses, the GNU GPL and LGPL, are also the licensesmost closely identified with the open source movement. These licenses were created toencourage modification of source code. Since license choice is also a way for projects tosignal their beliefs on how software should be created and distributed, projects choosingto release software under a restrictive license are receptive to the idea of incorporatingexisting components in their designs. Consequently, we expect the package dependencycounts of software released under a restrictive license to be higher than those for packagesreleased under a permissive license. The basic package dependency count hypothesistested in this study is:
H1 : χr > χp
where χris the median package dependency count of software released under a restrictivelicense and χp is the median package dependency count of software released under apermissive license.
Does this hypothesis apply to software in different categories? It is expected that theanswer to this question is yes, and that package dependency counts will be higher forpackages released under a restrictive license type regardless of software category. Allsoftware is created by programmers, and those who share the opinions of open sourcedevelopment promoted by restrictive licenses may be more likely to reuse existing com-ponents. This study examines reuse within four software categories, which leads to fourpackage dependency count hypotheses.
Hypothesis 2 is that packages in the software development tools category released undera restrictive license will have a greater median package dependency count than thosechoosing a permissive license:
H2 : χrd > χpd
where χrdis the median package dependency count of software development tools re-leased under a restrictive license and χpd is the median package dependency count ofsoftware development tools released under a permissive license.
Hypothesis 3 is that packages in the applications category released under a restrictivelicense will have a greater median package dependency count than those choosing a per-missive license:
John Brewer VIII Chapter 3. Methods 41
H3 : χra > χpa
where χrais the median package dependency count of applications released under a re-strictive license and χpa is the median package dependency count of applications releasedunder a permissive license.
Hypothesis 4 predicts that packages in the system environment category released undera restrictive license will have a greater median package dependency count than thosechoosing a permissive license:
H4 : χrs > χps
where χrais the median package dependency count of system environment packages re-leased under a restrictive license and χpa is the median package dependency count ofsystem environment packages released under a permissive license.
Hypothesis 5 is that packages in the user interface category released under a restrictivelicense will have a greater median package dependency count than those choosing a per-missive license:
H5 : χru > χpu
where χruis the median package dependency count of user interface components releasedunder a restrictive license and χpu is the median package dependency count of user inter-face components released under a permissive license.
3.2.5 Reusability Hypotheses
Permissive licenses place fewer restrictions on how a piece of software can be modifiedand redistributed. Fewer restrictions should increase the attractiveness of the softwarefor reuse in a different project. The number of other projects that might reuse the soft-ware should be larger than the number of projects that would reuse a similar componentreleased under a restrictive license. This suggests that software packages released undera permissive license will have higher dependent package counts than packages releasedunder a restrictive one. This leads to the basic hypothesis tested in this study:
H6 : χr < χp
where χr is the median dependent package count of software released under a restrictivelicense and χpr is the median dependent package count of software released under a
John Brewer VIII Chapter 3. Methods 42
permissive license.
Lerner and Tirole[6] observe that software developed for other programmers are signifi-cantly less likely to be released under a highly restrictive license. Development tools, bytheir nature, are intended to be used to create new products, and the use of a permis-sive license may encourage this. This suggests that tools released under these licenses arereused more often. Hypothesis 7 is:
H7 : χrd < χpd
where χrdis the median dependent package count of packages in the software develop-ment tools category released under a restrictive license and χpd is the median dependentpackage count of packages in the software development tools category released under apermissive license.
The same study found that applications targeted at end users are much more likely to bereleased under a restrictive license. While such applications are typically not intended tobe used to create new software products, it is possible for them to fulfill a dependency ofanother program. In this case it is expected that applications packages released under arestrictive license are reused more often. Hypothesis 8 is:
H8 : χra > χpa
where χrais the median dependent package count of packages in the applications categoryreleased under a restrictive license and χpa is the median dependent package count ofpackages in the applications category released under a permissive license.
System environment packages provide shared libraries necessary for other packages tofunction. They are similar to development tools packages in that they are intended for useby other programmers to add functionality to applications. As such, it is expected thatpermissive licensing encourages reuse of these packages more effectively than restrictivelicenses. Hypothesis 9 is:
H9 : χrs < χps
where χrsis the median dependent package count of packages in the system environmentcategory released under a restrictive license and χps is the median dependent packagecount of packages in the system environment category released under a permissive li-cense.
The fourth category is user interface packages. These packages are used to render graph-ical output and receive input from a user, and are essential for use by end user applica-tions. For these packages, permissive licenses are predicted to foster reuse more effec-
John Brewer VIII Chapter 3. Methods 43
tively then restrictive licenses. Hypothesis 10 is:
H10 : χru < χpu
where χruis the median dependent package count of packages in the user interface cate-gory released under a restrictive license and χps is the median dependent package countof packages in the user interface category released under a permissive license.
3.3 Data Collection
3.3.1 Dependency Analysis
The package dependency and dependent package counts were determined through de-pendency analysis. A dependency relationship exists between two Fedora packages ifone must be present for the other to function. Package x is a dependency of package yif x must be present in a system in order for y to be usable. One advantage of buildingsoftware from readily available packages is that when a modifications are made only theaffected package needs to be upgraded. The other packages used by an application donot need be changed. In order for this to work it is necessary to be able to identify thedependencies of each package in order to determine which software is affected when apackage is modified.
Managing the dependency relationships between a large number of packages, such as canbe found in an open source software repository, can become very complex. In their studyof dependencies within the Debian Linux software repository, Abate, Boender, et al.[35]describe some useful definitions for these relationships that are applicable to this project.A repository is a set of packages and the dependencies between them. As defined earlier, apackage is a software object bundled for distribution. The actual contents of a package canvary widely, though in most cases a package consists of either a stand-alone applicationor a library of executable code intended to provide functionality to other packages. Abate,Boender, et al.[35] refer to the type of dependency described above as a strong dependency.Stated formally, a strong dependency exists between two packages p and q in repositoryR if for every installation of a subset of packages from R that includes p also includes q.This relationship can be expressed as:
p =⇒ Rq
When p is installed on a system, its strong dependency with q must be identified, as wellas any packages on which q strongly depends, and so on until the entire dependency
John Brewer VIII Chapter 3. Methods 44
tree has been explored. Upon completion q’s dependencies are said to be resolved. Mostrepository management software includes tools to automate dependency resolution andgreatly simplify the installation and removal of packages from the system.
Dependency resolution can be used to determine both the package dependency countand dependent package count of a Fedora package. To continue the previous example,package p has an package dependency count of at least 1, as it uses the functionality pro-vided by q. The package dependency count of p is therefore the total number of packageswith which p has a strong dependency relationship.
Conversely, dependent package count is determined by looking at dependency resolutionfrom the point of view of the package being depended on. Package q has a dependentpackage count of at least 1, as it provides functionality critical for the use of p. The com-plete dependent package count for q is therefore the total number of packages for whichq fulfills a dependency.
The basic method used to collect data for this study involved choosing a package reposi-tory to provide a sample of open source packages, and using that repository’s dependencyinformation and dependency resolution tools to determine the package dependency anddependent package counts for each package in the repository.
3.3.2 Software Repository
To perform this study it was important to identify a software repository that containeda good representation of open source packages and provided a method by which licensetype, software category, and dependency relationships could be extracted. Linux softwarerepositories meet these criteria. Most Linux distributions maintain their own repositoryof open source software, which is in turn implemented using one of several availablepackage management systems. This study used the Fedora Linux2 repository as a datasource. A number factors influenced this decision:
1. Fedora originated as a community version of Red Hat, one of the leading enterprise-class Linux distributions. As such, it inherited a stable platform and lots of highquality packages. Fedora is a robust and well supported system that serves as a testbed for Red Hat Enterprise Linux.
2. Fedora is one of the most popular Linux distributions. DistroWatch, a website thattracks information about hundreds of Linux distributions, currently ranks Fedoraas the third most popular distribution3. Fedora’s popularity helps ensure that itspackage repository is kept up to date with the most frequently used current opensource software.
2For more information visit http://fedoraproject.org/3http://distrowatch.com/dwres.php?resource=major
John Brewer VIII Chapter 3. Methods 45
3. The RPM Package Management system, which Fedora uses to organize its reposi-tories, tracks the metadata needed to carry out this study and provides tools whichcan be used to automate data collection.
Fedora releases a new version of its operating system approximately every 6 to 8 months.Each version has its own repository. While repositories are constantly being updated asnew software becomes available and new versions of existing software are released, themajority of the packages are migrated from previous versions into the repository of anew release. This means that there is not much of a difference in the packages includedin each version’s repository, and that the repository for one version of Fedora provides acomprehensive sample of open source software. For this study, the repository of the mostcurrent Fedora release, Fedora 16, was used as a data source.
Within a version’s repository, packages are divided into two categories, 32bit and 64bit.An individual Fedora installation will use packages from one of these two groups accord-ing to the hardware used to run the installation and whether a 32bit or 64bit version ofthe operating system was installed. Most of the software included in the repository ap-pears in both categories, so data was only extracted from the packages in one of them,the 64bit category. An online version of the Fedora Package Database can be accessed athttps://admin.fedoraproject.org/pkgdb.
The individual packages within the repository consist of open source programs that havebeen bundled into an RPM file. This file contains a compiled binary version of the pro-gram, configuration files, and documentation that are copied to a Fedora system duringinstallation. The RPM also includes descriptive information about the program, the mostimportant of which for this study is the dependency list of other RPMs that must bepresent on a Fedora system before the package can be installed. Individual RPMs are cre-ated and maintained by volunteers. A packaging committee provides the guidelines thatpackages are expected to conform to, and must approve each addition to the repository.This helps ensure that software in the repository is of sufficient quality and is alignedwith the underlying objectives of the Fedora project.
3.3.3 Limitations of Using a Fedora Repository As a Data Source
There are some limitations and drawbacks of using a Fedora Linux repository as a datasource. First, the decision of the repository maintainers as to which packages to includeand which to exclude is a form of selection bias that may limit the applicability of thepackage dependency and dependent package counts extracted from the repository toopen source software as a whole. It is hoped that this limitation might also be a strength.Other studies that have relied on the various forges as a data source must contend witha large amount of software of dubious quality, as well as the problem of omitting soft-ware hosted in repositories not used as a source. The selection bias of using the Fedora
John Brewer VIII Chapter 3. Methods 46
repository mitigates these drawbacks by providing a sample of open source packages thatwere successfully compiled into a functional state and drawn from a variety of host sites.Still, it is difficult to determine if this selection bias results in the exclusion of a significantnumber of worthy packages from this study.
Use of the Fedora repository as a primary data source may limit the generalizability ofthe results of this study to other open source software collections. The package depen-dency and dependent package counts tally the dependencies between Fedora packages.These specific dependencies are defined by the volunteers who create the packages, andmay not be the same as those defined by the maintainers of repositories for other Linuxdistributions. However, differences in dependency relationships for the same software indifferent repository systems are not expected to be significant. Most open source softwareprojects do not include the source code of their dependencies when distributing their ownsource code. If one open source application requires features provided by a code library,for example, users are expected to download the library from the website maintained bythe library’s authors. Package creation tends to mirror this process by bundling the indi-vidual applications into their own packages. This should ensure some consistency in howsoftware is bundled by the various Linux distribution maintainers. Package dependencyand dependent package counts should therefore be generally applicable to software pro-vided in other open source package repositories.
Another potential source for error is the descriptive information provided for each pack-age. Information such as software category and license type is provided by volunteer con-tributors. While a committee approves each package submission, the number of packagesin the repository increases the chance that one of these items is an inaccurate for a sub-set of all packages. An error of this kind would not prevent a package from functioning,and thus might not be discovered and corrected for some time. Also, the assignment of asoftware category requires a judgment call on the part of the package maintainer, whichinevitably results in some packages being assigned to one category when they just haveeasily been assigned to another. Hopefully the number of packages in each category willreduce the impact of such assignments.
Despite these drawbacks, the benefits of using the Fedora Linux repository for this studyshould on the whole outweigh the disadvantages, and provide a better representation ofopen source software that is actively used and supported.
3.3.4 Data Extraction
The original plan for data collection was to use the Yum4 utility to extract licensing anddependency data from the repository. Yum is a tool for managing the installation of RPMsfrom one or more repositories. Its primary purpose is to resolve and manage dependen-
4http://yum.baseurl.org/
John Brewer VIII Chapter 3. Methods 47
cies. When a user uses it to install a package, Yum will determine which dependenciesare needed that are not already installed, and install them as well. It will also detect con-flicts if the requested package or one of its dependencies is not able to be installed. Thismakes it very easy for a user to add and remove programs on an RPM-based system.Yum supports multiple repositories; given a list of repositories, it will resolve searches forpackages and their dependencies across all of them. This makes it easy to add third partyrepositories, which often contain non-open source software, to a system.
Yum also allows a user to query a repository for information about packages. The firstattempt to collect data for this project made extensive use of this feature. A copy of theFedora 16 repository was downloaded from a server on the Fedora repository mirrorlist5 and stored on a web server on a local area network. This was done to provide ahigh bandwidth connection to the repository and reduce the amount of time needed toexecute queries against it. A script written in the Perl programming language was usedto determine the license, software category, and reuse count for each package, and storethe results into a relational database. The script performed three basic steps. First, it usedYum to query the repository for a list of all of its packages. Second, for each packagein the list, it used Yum to query the license and software category. Last, it would useYum to query the repository for a list of all of the other packages which list the packageas a dependency, and assigned the number of items in the result as the package’s reusefrequency.
This script worked, but had some drawbacks. First among these was performance. TheFedora 16 repository for the 64bit architecture contains a little more than 10,000 entries.Even with the increase in connection speed gained by using a locally hosted repositoryit took close to 48 hours to complete one execution of the script. The other drawbackwas that using a script increased the risk of introducing errors in the data. Thoroughtesting was required to ensure the data collected by the script was accurate. This requiredrepeated execution of the script, increasing the impact of the script’s performance.
In the course of double-checking the results of queries using Yum, it was discovered thatthe Yum itself was basically a front end for another relational database. Repositories man-aged by Yum store package metadata in an SQLite6 database. SQLite is a database imple-mentation that saves its data in files and does not require a database server. It is a popularchoice for application developers who want to their programs to save complex data typeswithout incurring the overhead necessitated by traditional relational database implemen-tations. When Yum is used to query information about a package, it in turn runs a queryagainst an SQLite database contained in a file hosted on the repository site.
5http://mirrors.fedoraproject.org/publiclist/6http://www.sqlite.org/
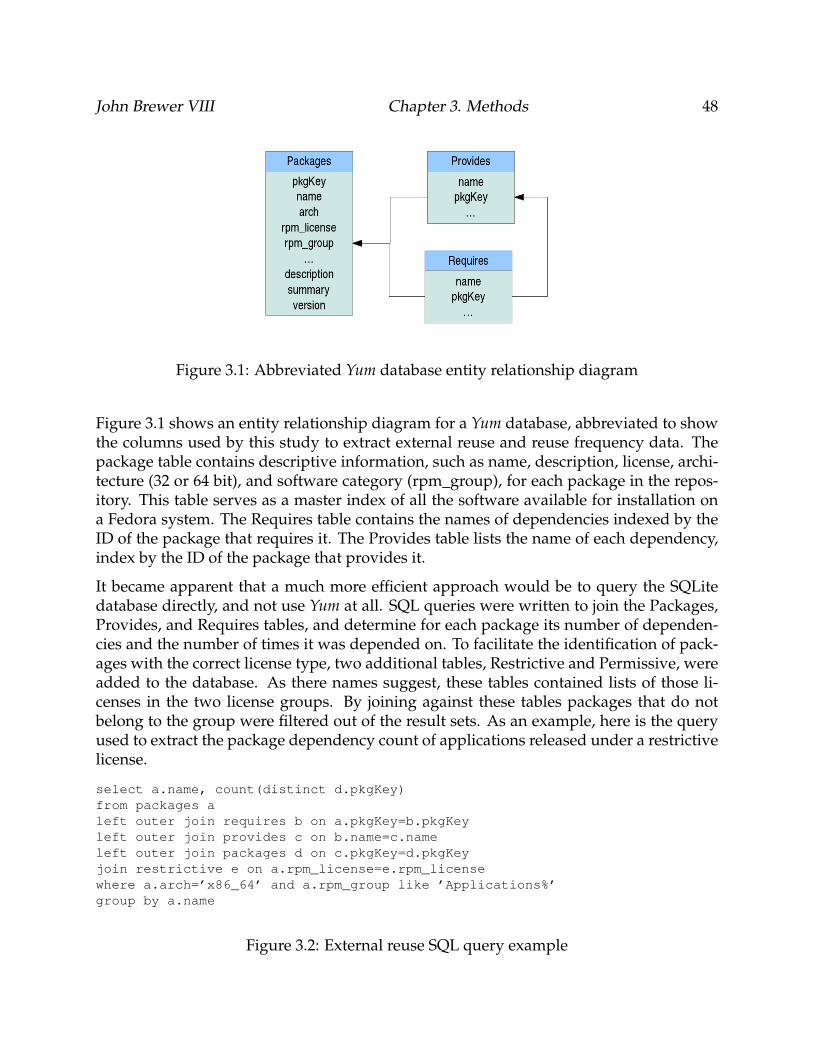
John Brewer VIII Chapter 3. Methods 48
Figure 3.1: Abbreviated Yum database entity relationship diagram
Figure 3.1 shows an entity relationship diagram for a Yum database, abbreviated to showthe columns used by this study to extract external reuse and reuse frequency data. Thepackage table contains descriptive information, such as name, description, license, archi-tecture (32 or 64 bit), and software category (rpm_group), for each package in the repos-itory. This table serves as a master index of all the software available for installation ona Fedora system. The Requires table contains the names of dependencies indexed by theID of the package that requires it. The Provides table lists the name of each dependency,index by the ID of the package that provides it.
It became apparent that a much more efficient approach would be to query the SQLitedatabase directly, and not use Yum at all. SQL queries were written to join the Packages,Provides, and Requires tables, and determine for each package its number of dependen-cies and the number of times it was depended on. To facilitate the identification of pack-ages with the correct license type, two additional tables, Restrictive and Permissive, wereadded to the database. As there names suggest, these tables contained lists of those li-censes in the two license groups. By joining against these tables packages that do notbelong to the group were filtered out of the result sets. As an example, here is the queryused to extract the package dependency count of applications released under a restrictivelicense.
select a.name, count(distinct d.pkgKey)from packages aleft outer join requires b on a.pkgKey=b.pkgKeyleft outer join provides c on b.name=c.nameleft outer join packages d on c.pkgKey=d.pkgKeyjoin restrictive e on a.rpm_license=e.rpm_licensewhere a.arch=’x86_64’ and a.rpm_group like ’Applications%’group by a.name
Figure 3.2: External reuse SQL query example
John Brewer VIII Chapter 3. Methods 49
A complete list of the queries used to collect data for this study is included in the ap-pendix.
A database management tool called sqliteman7was used to execute the queries. Sqlitemanaccepts SQL queries as input, applies them to an SQLite database, and either displays theresults on screen or saves them to a file. Since the database itself is contained in a sin-gle file, it could be downloaded to the computer running sqliteman and eliminate theneed to send queries over a network. This, as well as eliminating the need for Yum, wasresponsible for a large performance increase. SQL makes it possible to query data forlarge numbers of packages concurrently; for instance, instead of running 10,000 individ-ual queries to retrieve the license for each individual package in the database, one querycan be used to get the license for all 10,000 packages. This made it possible to developqueries to extract the necessary data, test them, and verify their results in less time than ittook to complete a single iteration of the original script.
In all, ten sets of data were extracted, two for each of the ten hypotheses listed above.These data sets are summarized in table 3.1. Each data set consists of the external reuseand reuse frequency for each software package in the group relevant to each hypothesis.For example, the first hypothesis is interested in the external reuse of software releasedunder permissive and restrictive licenses. One data set used to test this hypothesis con-tains a list of reuse counts for all of the packages in the repository that was released undera license in the permissive category, and the other data set contains reuse counts for eachpackage released under a restrictive license.
Each data set was stored in a plain text file to facilitate being imported into the R statisticalanalysis tool.
7http://sqliteman.com/
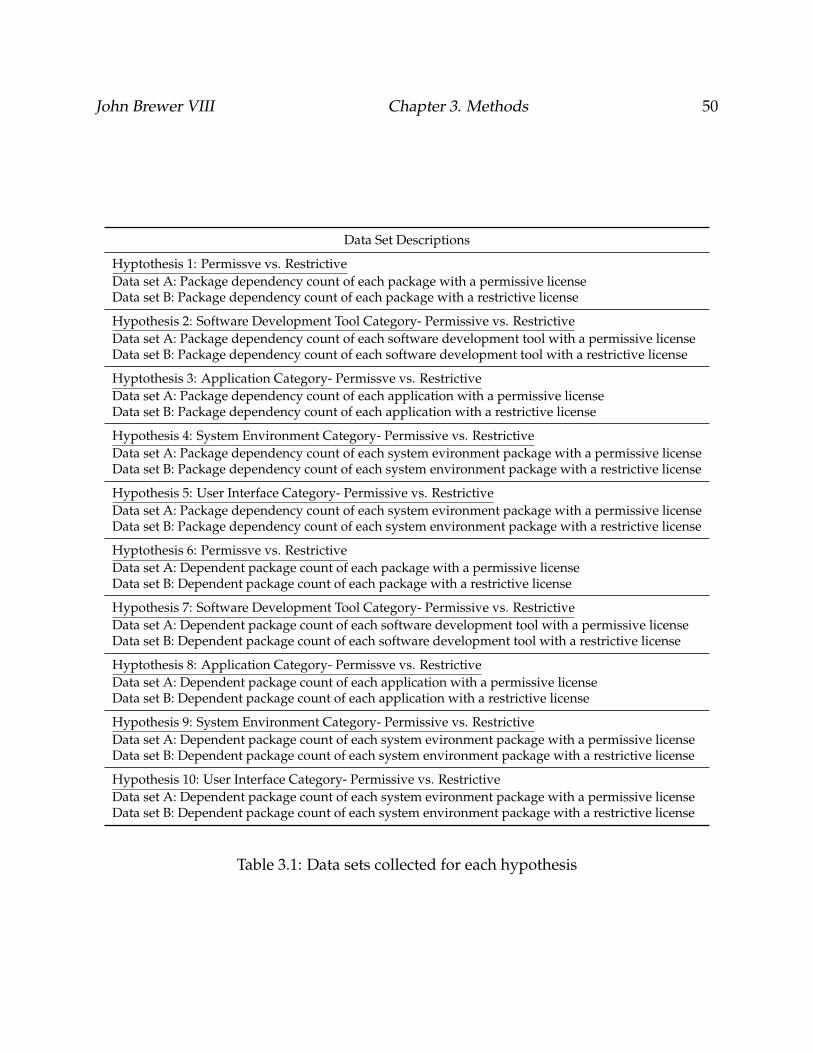
John Brewer VIII Chapter 3. Methods 50
Data Set Descriptions
Hyptothesis 1: Permissve vs. RestrictiveData set A: Package dependency count of each package with a permissive licenseData set B: Package dependency count of each package with a restrictive license
Hypothesis 2: Software Development Tool Category- Permissive vs. RestrictiveData set A: Package dependency count of each software development tool with a permissive licenseData set B: Package dependency count of each software development tool with a restrictive license
Hyptothesis 3: Application Category- Permissve vs. RestrictiveData set A: Package dependency count of each application with a permissive licenseData set B: Package dependency count of each application with a restrictive license
Hypothesis 4: System Environment Category- Permissive vs. RestrictiveData set A: Package dependency count of each system evironment package with a permissive licenseData set B: Package dependency count of each system environment package with a restrictive license
Hypothesis 5: User Interface Category- Permissive vs. RestrictiveData set A: Package dependency count of each system evironment package with a permissive licenseData set B: Package dependency count of each system environment package with a restrictive license
Hyptothesis 6: Permissve vs. RestrictiveData set A: Dependent package count of each package with a permissive licenseData set B: Dependent package count of each package with a restrictive license
Hypothesis 7: Software Development Tool Category- Permissive vs. RestrictiveData set A: Dependent package count of each software development tool with a permissive licenseData set B: Dependent package count of each software development tool with a restrictive license
Hyptothesis 8: Application Category- Permissve vs. RestrictiveData set A: Dependent package count of each application with a permissive licenseData set B: Dependent package count of each application with a restrictive license
Hypothesis 9: System Environment Category- Permissive vs. RestrictiveData set A: Dependent package count of each system evironment package with a permissive licenseData set B: Dependent package count of each system environment package with a restrictive license
Hypothesis 10: User Interface Category- Permissive vs. RestrictiveData set A: Dependent package count of each system evironment package with a permissive licenseData set B: Dependent package count of each system environment package with a restrictive license
Table 3.1: Data sets collected for each hypothesis
Chapter 4
Results
In this section we examine the data collected from the repository to determine whetherthere is any support for the hypotheses presented in section 3. We start with an overviewof package dependency and dependent package counts for all packages in the repository,and then examine how license type affects reuse in both the repository as a whole and bysoftware category.
4.1 Summary Statistics
First we look at some high-level descriptions of the data across all license types.
4.1.1 Package Counts by License Type and Category
Package Counts by License Type and Category: The Fedora 16 repository for 64-bit archi-tectures contains 12,261 packages. Of these, 77% are released under one of the five opensource licenses being considered in this study. Packages not released under one of theselicenses were excluded from the study, leaving a sample of 9,570 packages for analysis.The licensing of these packages is summarized in table 4.1:
51
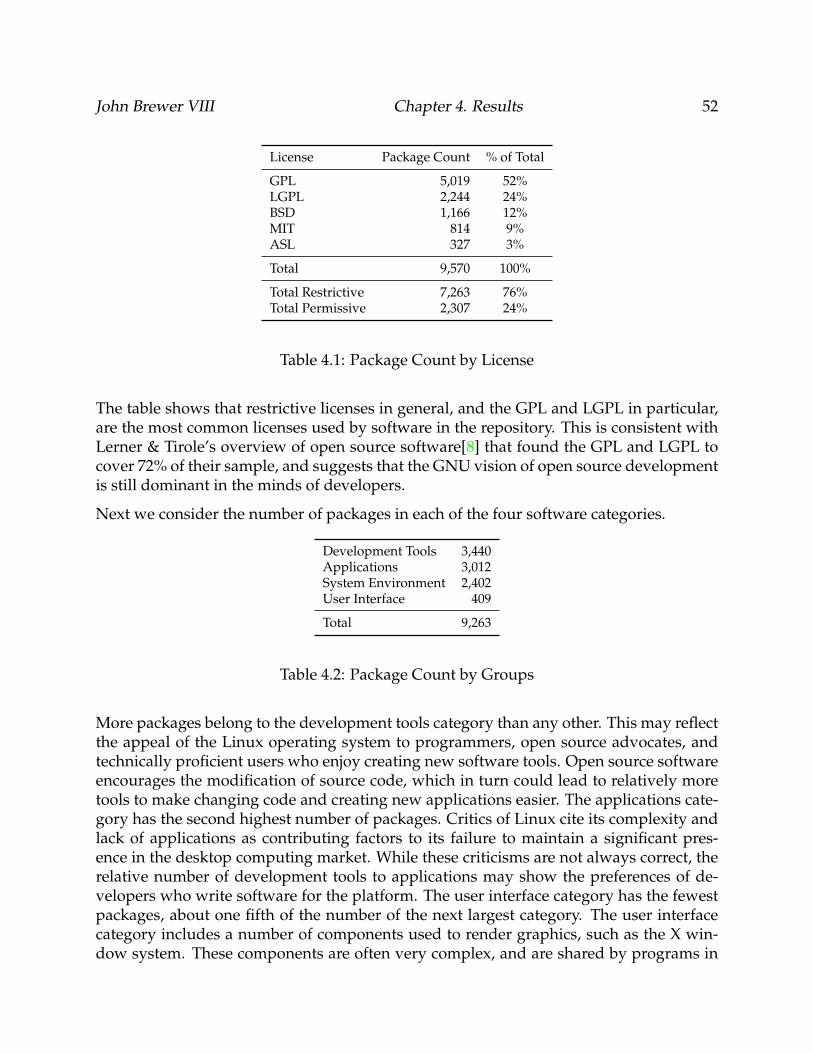
John Brewer VIII Chapter 4. Results 52
License Package Count % of Total
GPL 5,019 52%LGPL 2,244 24%BSD 1,166 12%MIT 814 9%ASL 327 3%
Total 9,570 100%
Total Restrictive 7,263 76%Total Permissive 2,307 24%
Table 4.1: Package Count by License
The table shows that restrictive licenses in general, and the GPL and LGPL in particular,are the most common licenses used by software in the repository. This is consistent withLerner & Tirole’s overview of open source software[8] that found the GPL and LGPL tocover 72% of their sample, and suggests that the GNU vision of open source developmentis still dominant in the minds of developers.
Next we consider the number of packages in each of the four software categories.
Development Tools 3,440Applications 3,012System Environment 2,402User Interface 409
Total 9,263
Table 4.2: Package Count by Groups
More packages belong to the development tools category than any other. This may reflectthe appeal of the Linux operating system to programmers, open source advocates, andtechnically proficient users who enjoy creating new software tools. Open source softwareencourages the modification of source code, which in turn could lead to relatively moretools to make changing code and creating new applications easier. The applications cate-gory has the second highest number of packages. Critics of Linux cite its complexity andlack of applications as contributing factors to its failure to maintain a significant pres-ence in the desktop computing market. While these criticisms are not always correct, therelative number of development tools to applications may show the preferences of de-velopers who write software for the platform. The user interface category has the fewestpackages, about one fifth of the number of the next largest category. The user interfacecategory includes a number of components used to render graphics, such as the X win-dow system. These components are often very complex, and are shared by programs in
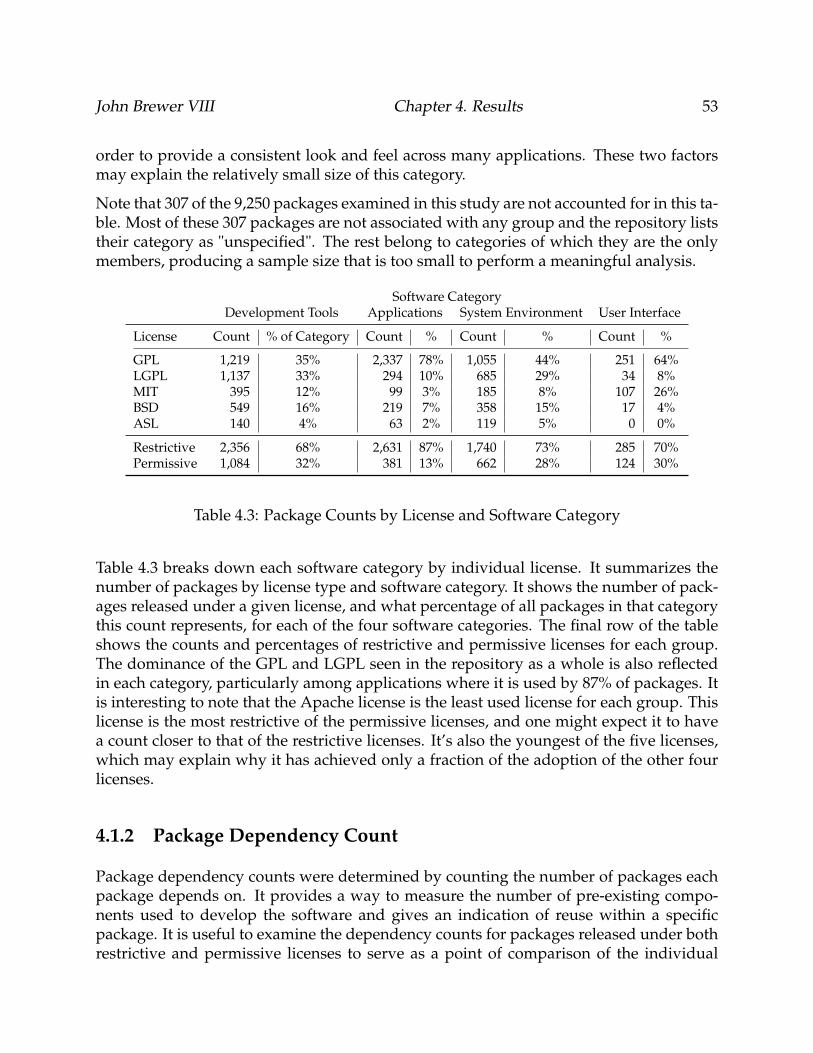
John Brewer VIII Chapter 4. Results 53
order to provide a consistent look and feel across many applications. These two factorsmay explain the relatively small size of this category.
Note that 307 of the 9,250 packages examined in this study are not accounted for in this ta-ble. Most of these 307 packages are not associated with any group and the repository liststheir category as "unspecified". The rest belong to categories of which they are the onlymembers, producing a sample size that is too small to perform a meaningful analysis.
Software CategoryDevelopment Tools Applications System Environment User Interface
License Count % of Category Count % Count % Count %
GPL 1,219 35% 2,337 78% 1,055 44% 251 64%LGPL 1,137 33% 294 10% 685 29% 34 8%MIT 395 12% 99 3% 185 8% 107 26%BSD 549 16% 219 7% 358 15% 17 4%ASL 140 4% 63 2% 119 5% 0 0%
Restrictive 2,356 68% 2,631 87% 1,740 73% 285 70%Permissive 1,084 32% 381 13% 662 28% 124 30%
Table 4.3: Package Counts by License and Software Category
Table 4.3 breaks down each software category by individual license. It summarizes thenumber of packages by license type and software category. It shows the number of pack-ages released under a given license, and what percentage of all packages in that categorythis count represents, for each of the four software categories. The final row of the tableshows the counts and percentages of restrictive and permissive licenses for each group.The dominance of the GPL and LGPL seen in the repository as a whole is also reflectedin each category, particularly among applications where it is used by 87% of packages. Itis interesting to note that the Apache license is the least used license for each group. Thislicense is the most restrictive of the permissive licenses, and one might expect it to havea count closer to that of the restrictive licenses. It’s also the youngest of the five licenses,which may explain why it has achieved only a fraction of the adoption of the other fourlicenses.
4.1.2 Package Dependency Count
Package dependency counts were determined by counting the number of packages eachpackage depends on. It provides a way to measure the number of pre-existing compo-nents used to develop the software and gives an indication of reuse within a specificpackage. It is useful to examine the dependency counts for packages released under bothrestrictive and permissive licenses to serve as a point of comparison of the individual
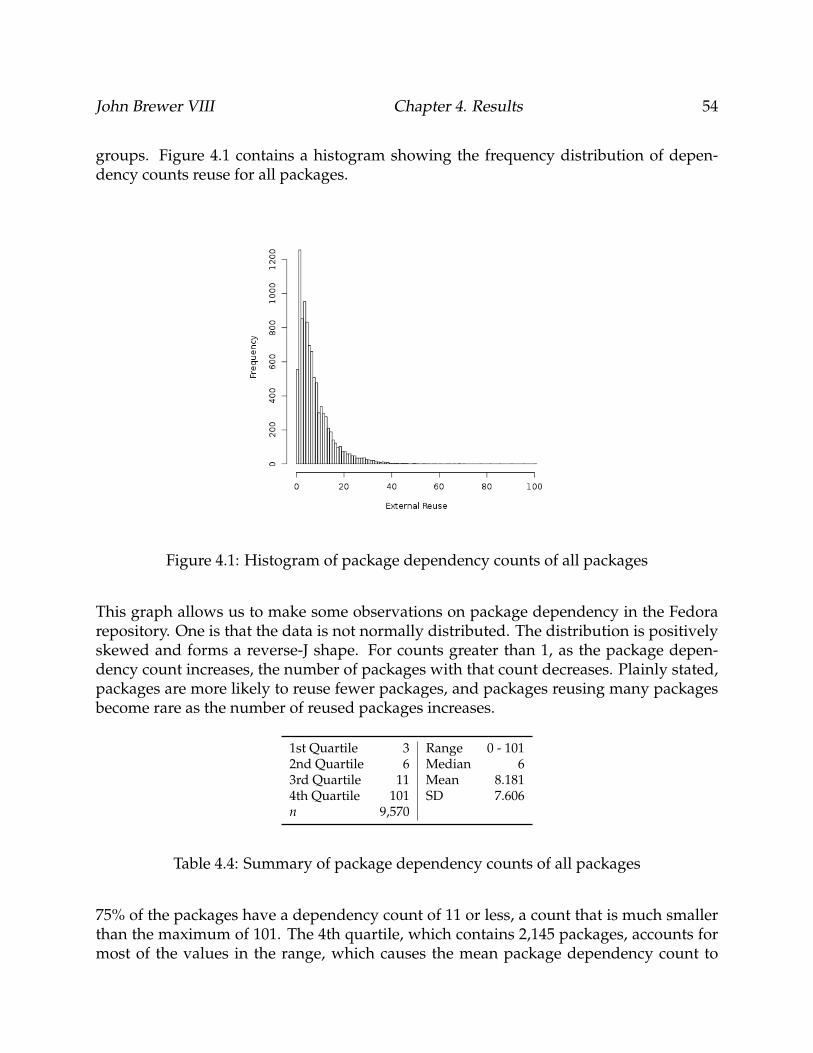
John Brewer VIII Chapter 4. Results 54
groups. Figure 4.1 contains a histogram showing the frequency distribution of depen-dency counts reuse for all packages.
Figure 4.1: Histogram of package dependency counts of all packages
This graph allows us to make some observations on package dependency in the Fedorarepository. One is that the data is not normally distributed. The distribution is positivelyskewed and forms a reverse-J shape. For counts greater than 1, as the package depen-dency count increases, the number of packages with that count decreases. Plainly stated,packages are more likely to reuse fewer packages, and packages reusing many packagesbecome rare as the number of reused packages increases.
1st Quartile 3 Range 0 - 1012nd Quartile 6 Median 63rd Quartile 11 Mean 8.1814th Quartile 101 SD 7.606n 9,570
Table 4.4: Summary of package dependency counts of all packages
75% of the packages have a dependency count of 11 or less, a count that is much smallerthan the maximum of 101. The 4th quartile, which contains 2,145 packages, accounts formost of the values in the range, which causes the mean package dependency count to
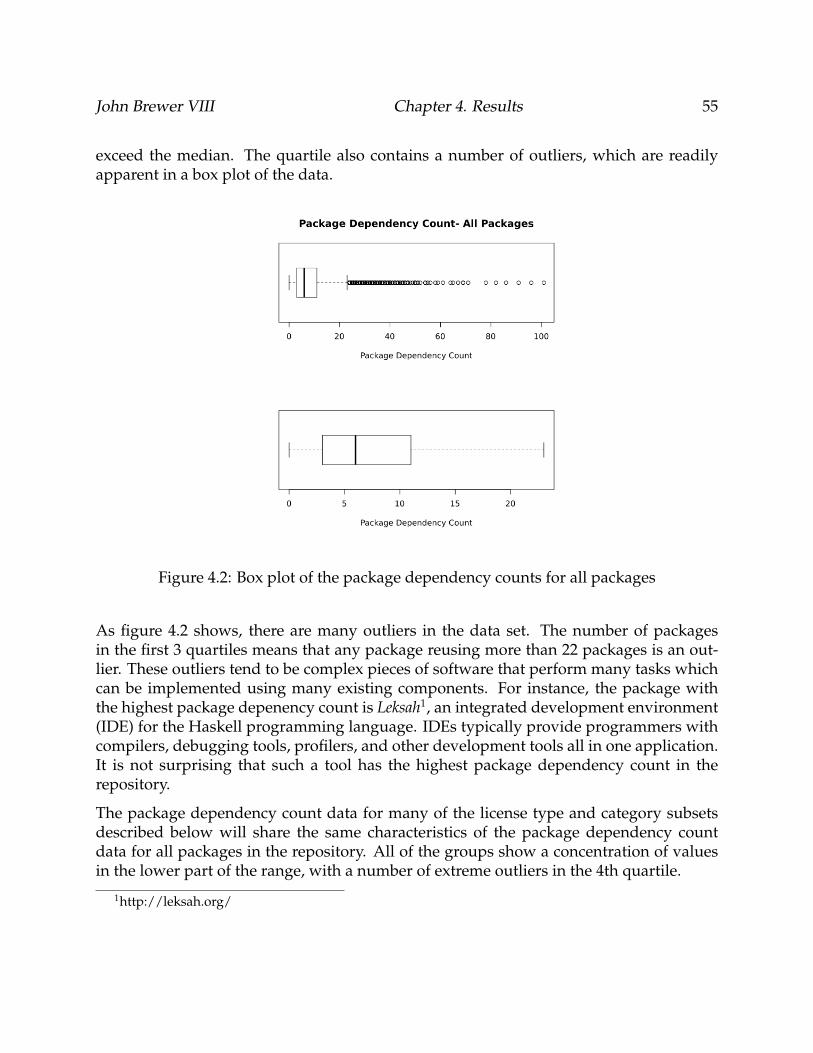
John Brewer VIII Chapter 4. Results 55
exceed the median. The quartile also contains a number of outliers, which are readilyapparent in a box plot of the data.
Figure 4.2: Box plot of the package dependency counts for all packages
As figure 4.2 shows, there are many outliers in the data set. The number of packagesin the first 3 quartiles means that any package reusing more than 22 packages is an out-lier. These outliers tend to be complex pieces of software that perform many tasks whichcan be implemented using many existing components. For instance, the package withthe highest package depenency count is Leksah1, an integrated development environment(IDE) for the Haskell programming language. IDEs typically provide programmers withcompilers, debugging tools, profilers, and other development tools all in one application.It is not surprising that such a tool has the highest package dependency count in therepository.
The package dependency count data for many of the license type and category subsetsdescribed below will share the same characteristics of the package dependency countdata for all packages in the repository. All of the groups show a concentration of valuesin the lower part of the range, with a number of extreme outliers in the 4th quartile.
1http://leksah.org/
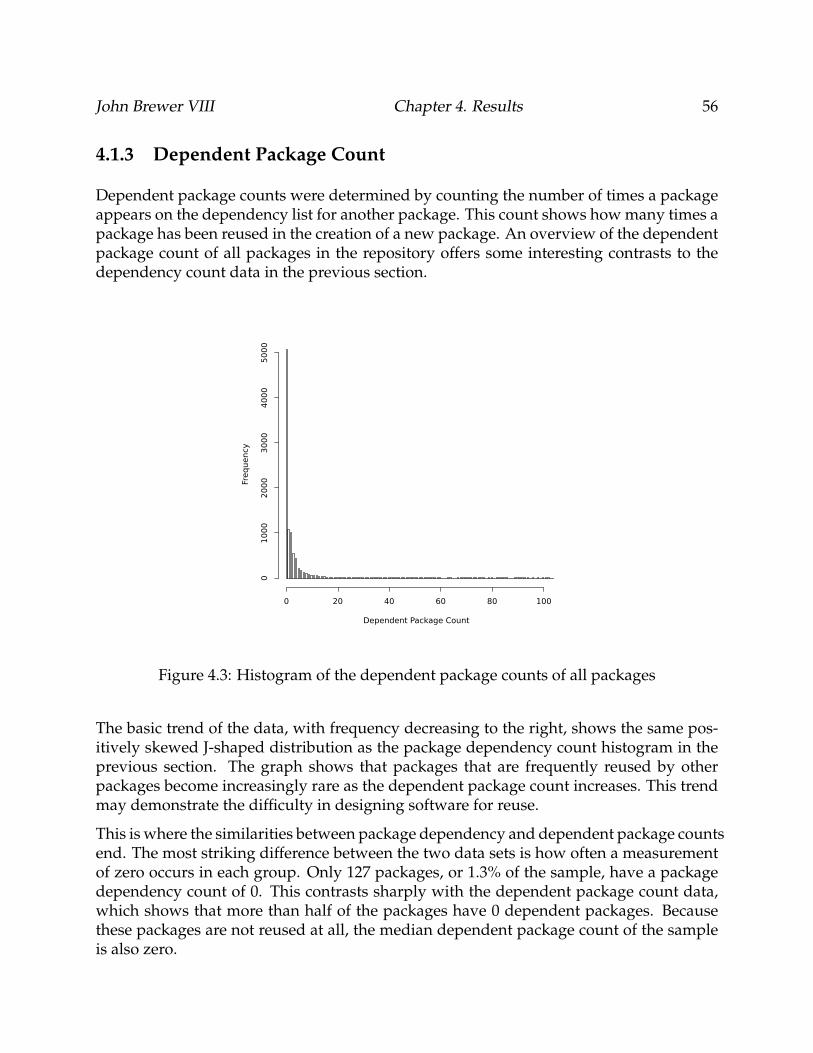
John Brewer VIII Chapter 4. Results 56
4.1.3 Dependent Package Count
Dependent package counts were determined by counting the number of times a packageappears on the dependency list for another package. This count shows how many times apackage has been reused in the creation of a new package. An overview of the dependentpackage count of all packages in the repository offers some interesting contrasts to thedependency count data in the previous section.
Figure 4.3: Histogram of the dependent package counts of all packages
The basic trend of the data, with frequency decreasing to the right, shows the same pos-itively skewed J-shaped distribution as the package dependency count histogram in theprevious section. The graph shows that packages that are frequently reused by otherpackages become increasingly rare as the dependent package count increases. This trendmay demonstrate the difficulty in designing software for reuse.
This is where the similarities between package dependency and dependent package countsend. The most striking difference between the two data sets is how often a measurementof zero occurs in each group. Only 127 packages, or 1.3% of the sample, have a packagedependency count of 0. This contrasts sharply with the dependent package count data,which shows that more than half of the packages have 0 dependent packages. Becausethese packages are not reused at all, the median dependent package count of the sampleis also zero.
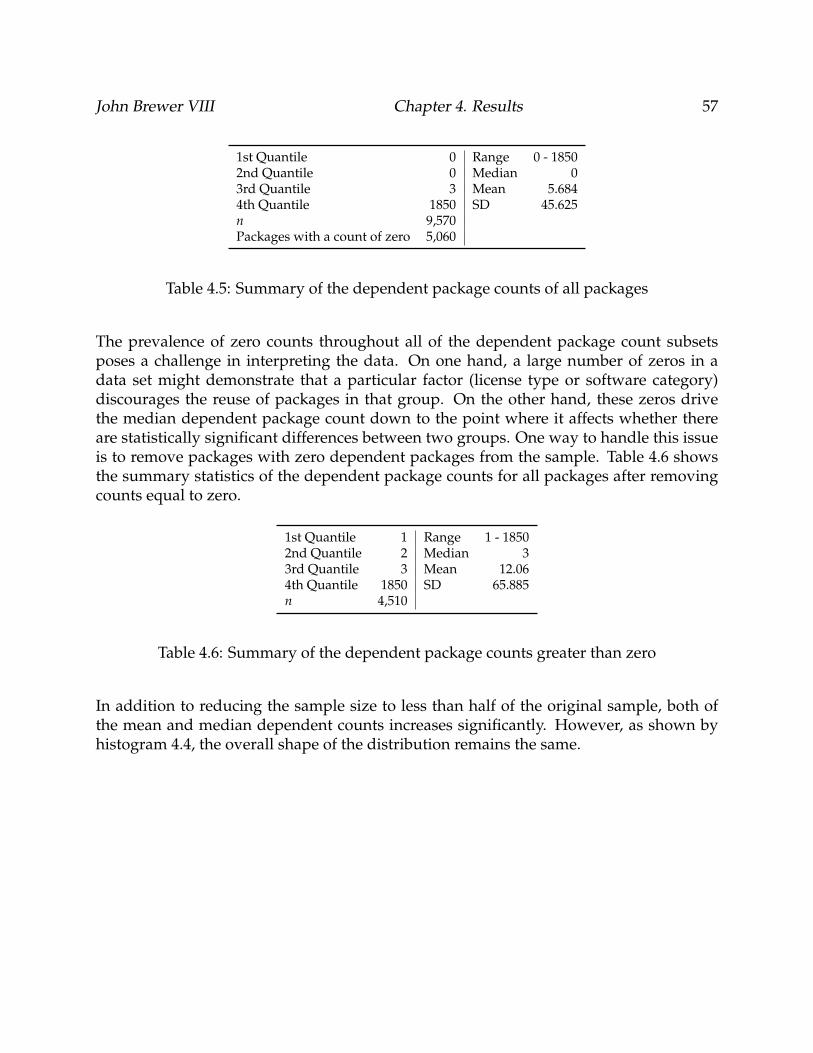
John Brewer VIII Chapter 4. Results 57
1st Quantile 0 Range 0 - 18502nd Quantile 0 Median 03rd Quantile 3 Mean 5.6844th Quantile 1850 SD 45.625n 9,570Packages with a count of zero 5,060
Table 4.5: Summary of the dependent package counts of all packages
The prevalence of zero counts throughout all of the dependent package count subsetsposes a challenge in interpreting the data. On one hand, a large number of zeros in adata set might demonstrate that a particular factor (license type or software category)discourages the reuse of packages in that group. On the other hand, these zeros drivethe median dependent package count down to the point where it affects whether thereare statistically significant differences between two groups. One way to handle this issueis to remove packages with zero dependent packages from the sample. Table 4.6 showsthe summary statistics of the dependent package counts for all packages after removingcounts equal to zero.
1st Quantile 1 Range 1 - 18502nd Quantile 2 Median 33rd Quantile 3 Mean 12.064th Quantile 1850 SD 65.885n 4,510
Table 4.6: Summary of the dependent package counts greater than zero
In addition to reducing the sample size to less than half of the original sample, both ofthe mean and median dependent counts increases significantly. However, as shown byhistogram 4.4, the overall shape of the distribution remains the same.
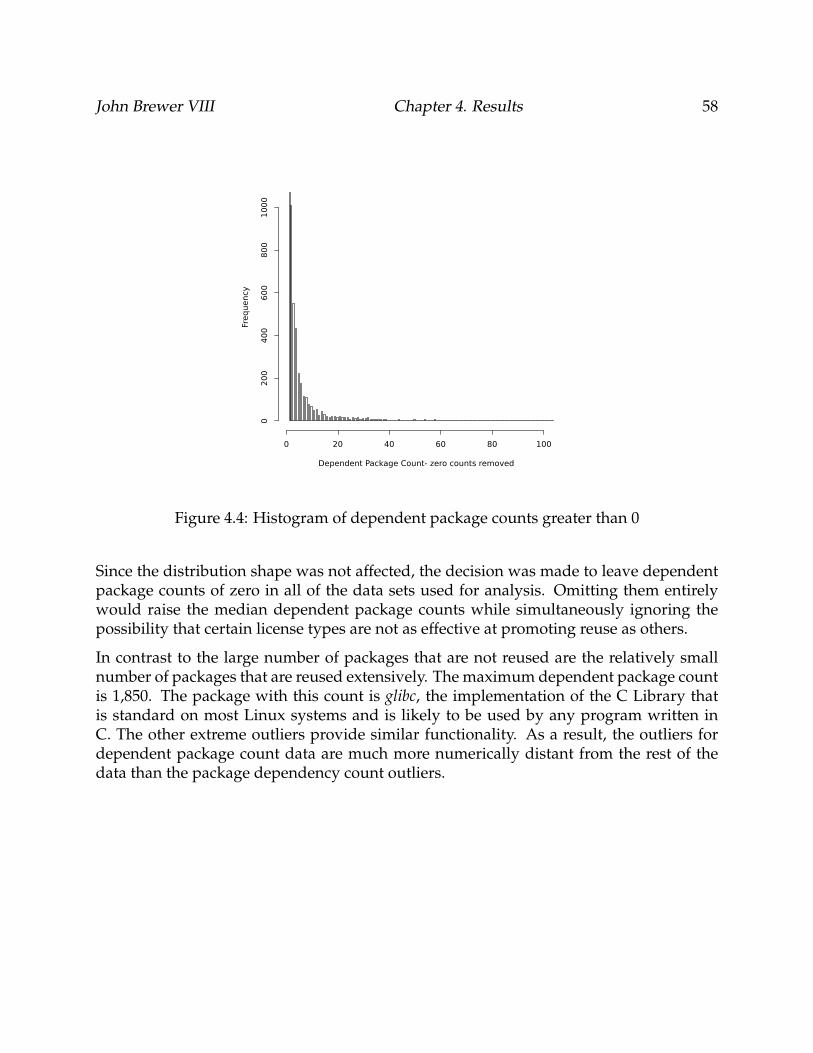
John Brewer VIII Chapter 4. Results 58
Figure 4.4: Histogram of dependent package counts greater than 0
Since the distribution shape was not affected, the decision was made to leave dependentpackage counts of zero in all of the data sets used for analysis. Omitting them entirelywould raise the median dependent package counts while simultaneously ignoring thepossibility that certain license types are not as effective at promoting reuse as others.
In contrast to the large number of packages that are not reused are the relatively smallnumber of packages that are reused extensively. The maximum dependent package countis 1,850. The package with this count is glibc, the implementation of the C Library thatis standard on most Linux systems and is likely to be used by any program written inC. The other extreme outliers provide similar functionality. As a result, the outliers fordependent package count data are much more numerically distant from the rest of thedata than the package dependency count outliers.
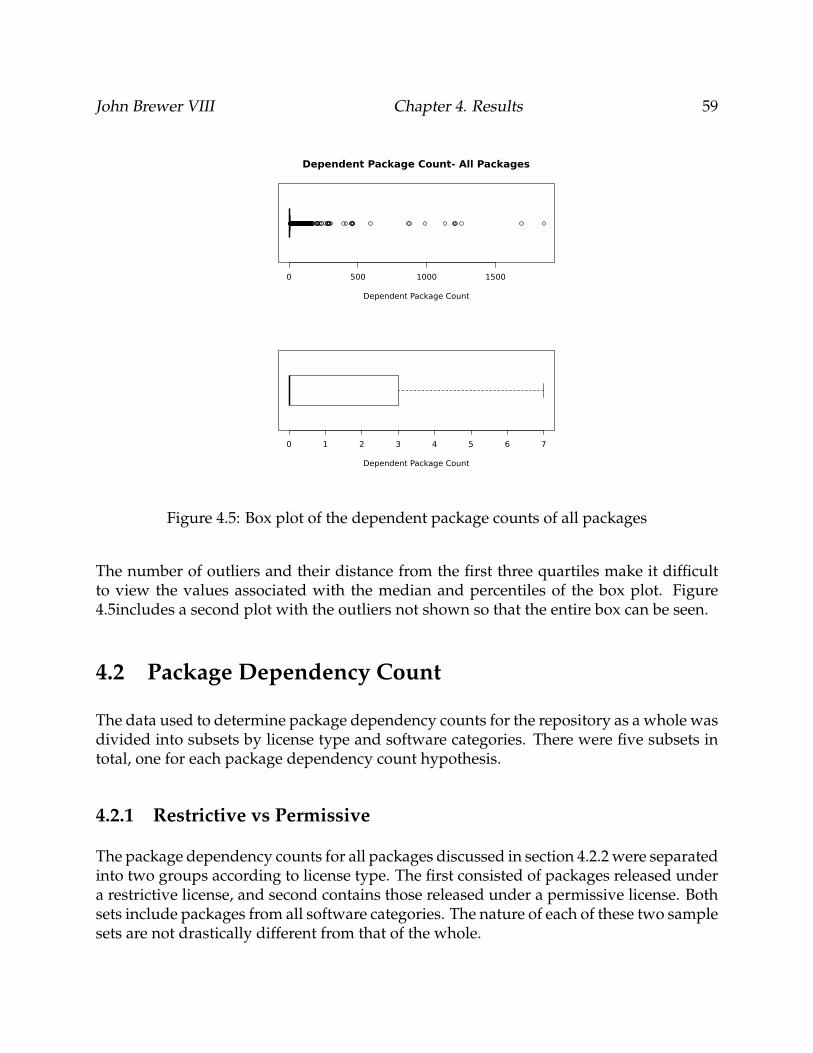
John Brewer VIII Chapter 4. Results 59
Figure 4.5: Box plot of the dependent package counts of all packages
The number of outliers and their distance from the first three quartiles make it difficultto view the values associated with the median and percentiles of the box plot. Figure4.5includes a second plot with the outliers not shown so that the entire box can be seen.
4.2 Package Dependency Count
The data used to determine package dependency counts for the repository as a whole wasdivided into subsets by license type and software categories. There were five subsets intotal, one for each package dependency count hypothesis.
4.2.1 Restrictive vs Permissive
The package dependency counts for all packages discussed in section 4.2.2 were separatedinto two groups according to license type. The first consisted of packages released undera restrictive license, and second contains those released under a permissive license. Bothsets include packages from all software categories. The nature of each of these two samplesets are not drastically different from that of the whole.
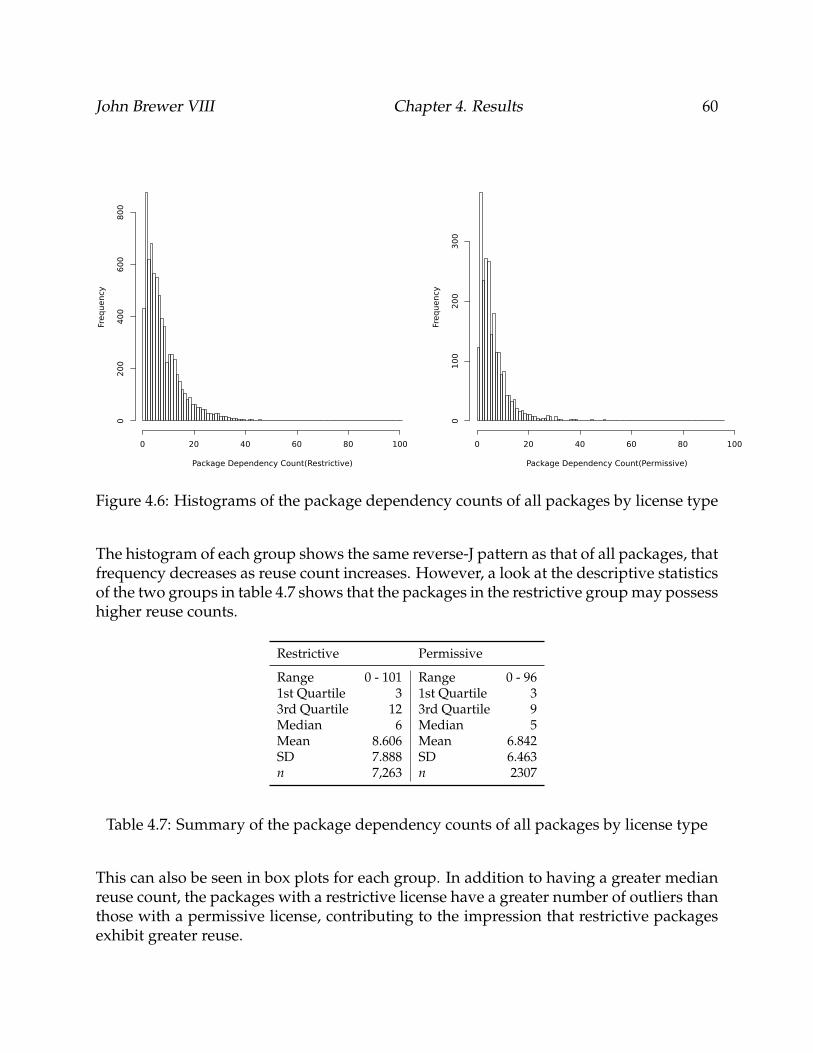
John Brewer VIII Chapter 4. Results 60
Figure 4.6: Histograms of the package dependency counts of all packages by license type
The histogram of each group shows the same reverse-J pattern as that of all packages, thatfrequency decreases as reuse count increases. However, a look at the descriptive statisticsof the two groups in table 4.7 shows that the packages in the restrictive group may possesshigher reuse counts.
Restrictive Permissive
Range 0 - 101 Range 0 - 961st Quartile 3 1st Quartile 33rd Quartile 12 3rd Quartile 9Median 6 Median 5Mean 8.606 Mean 6.842SD 7.888 SD 6.463n 7,263 n 2307
Table 4.7: Summary of the package dependency counts of all packages by license type
This can also be seen in box plots for each group. In addition to having a greater medianreuse count, the packages with a restrictive license have a greater number of outliers thanthose with a permissive license, contributing to the impression that restrictive packagesexhibit greater reuse.
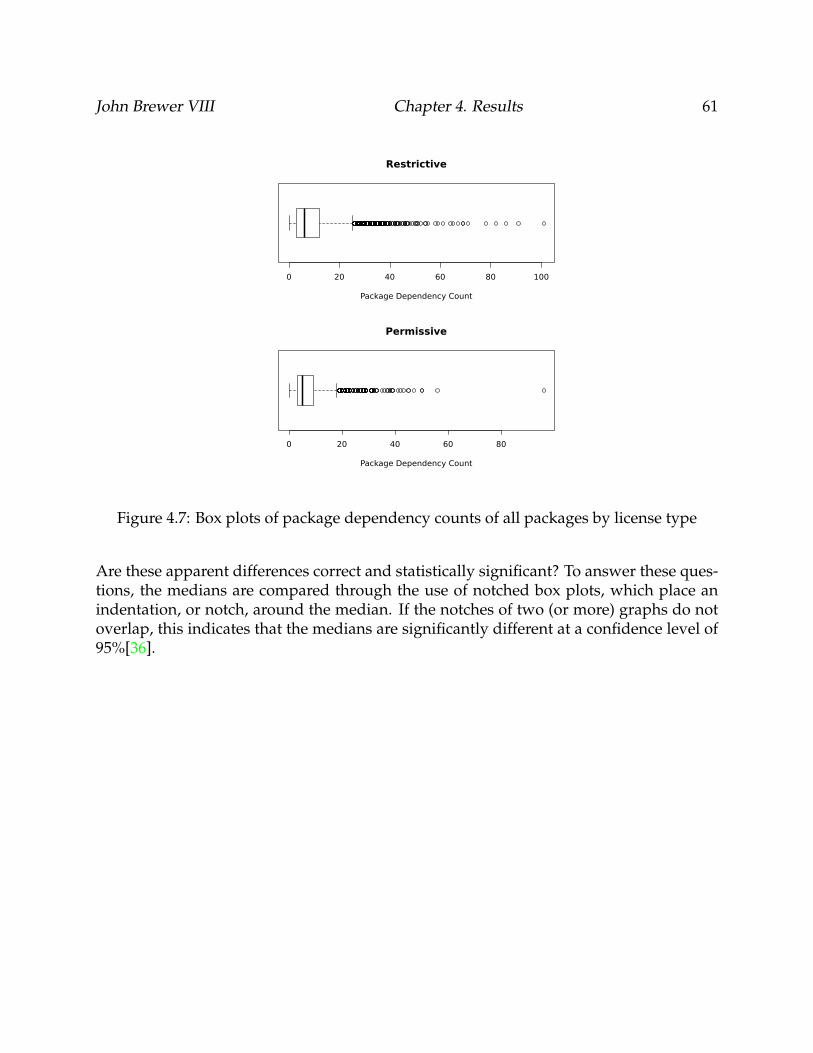
John Brewer VIII Chapter 4. Results 61
Figure 4.7: Box plots of package dependency counts of all packages by license type
Are these apparent differences correct and statistically significant? To answer these ques-tions, the medians are compared through the use of notched box plots, which place anindentation, or notch, around the median. If the notches of two (or more) graphs do notoverlap, this indicates that the medians are significantly different at a confidence level of95%[36].
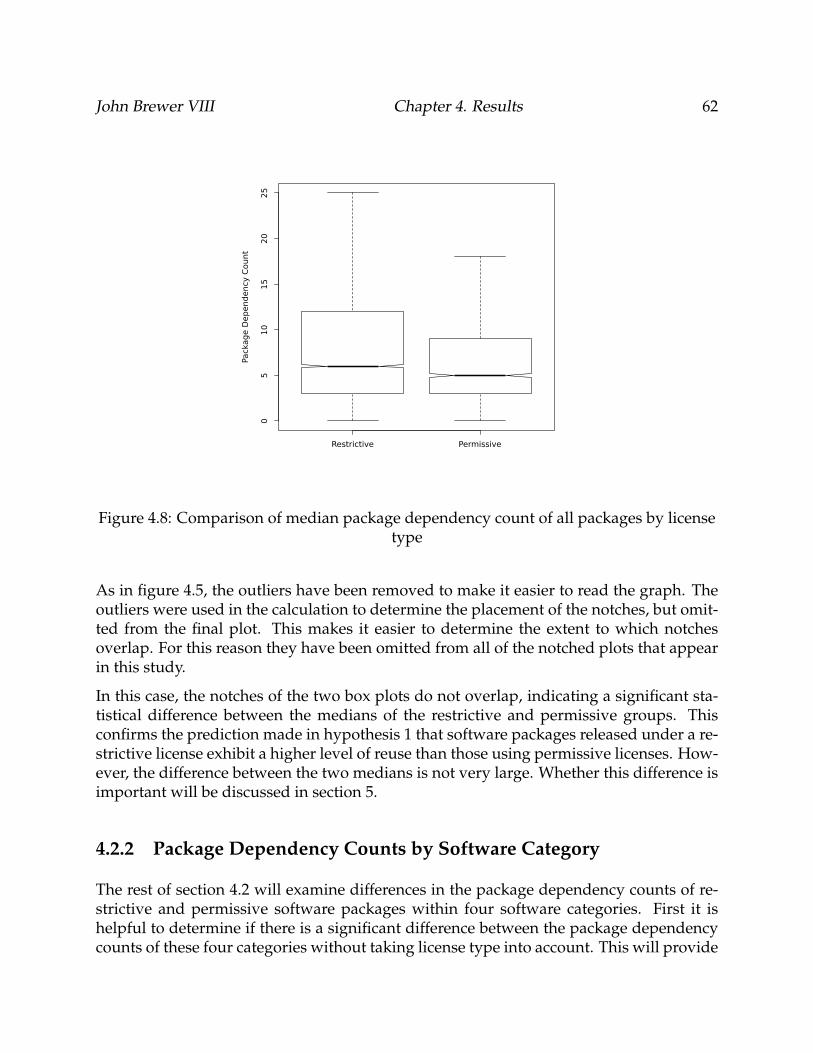
John Brewer VIII Chapter 4. Results 62
Figure 4.8: Comparison of median package dependency count of all packages by licensetype
As in figure 4.5, the outliers have been removed to make it easier to read the graph. Theoutliers were used in the calculation to determine the placement of the notches, but omit-ted from the final plot. This makes it easier to determine the extent to which notchesoverlap. For this reason they have been omitted from all of the notched plots that appearin this study.
In this case, the notches of the two box plots do not overlap, indicating a significant sta-tistical difference between the medians of the restrictive and permissive groups. Thisconfirms the prediction made in hypothesis 1 that software packages released under a re-strictive license exhibit a higher level of reuse than those using permissive licenses. How-ever, the difference between the two medians is not very large. Whether this difference isimportant will be discussed in section 5.
4.2.2 Package Dependency Counts by Software Category
The rest of section 4.2 will examine differences in the package dependency counts of re-strictive and permissive software packages within four software categories. First it ishelpful to determine if there is a significant difference between the package dependencycounts of these four categories without taking license type into account. This will provide
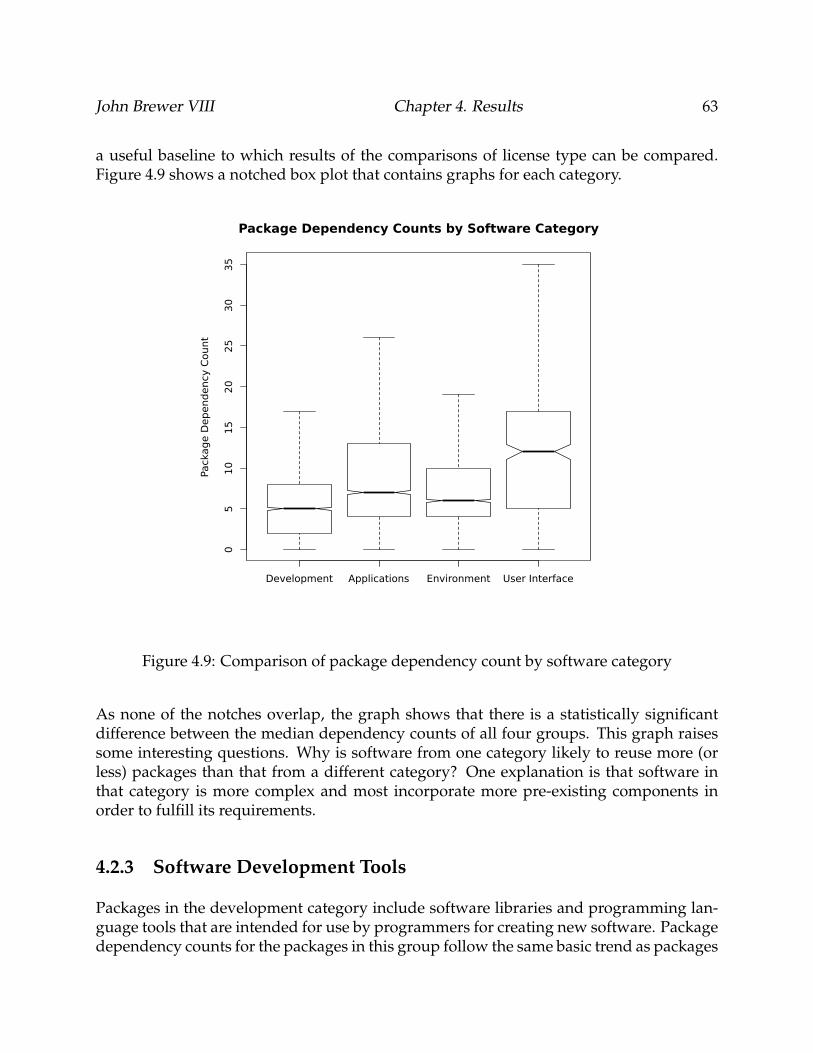
John Brewer VIII Chapter 4. Results 63
a useful baseline to which results of the comparisons of license type can be compared.Figure 4.9 shows a notched box plot that contains graphs for each category.
Figure 4.9: Comparison of package dependency count by software category
As none of the notches overlap, the graph shows that there is a statistically significantdifference between the median dependency counts of all four groups. This graph raisessome interesting questions. Why is software from one category likely to reuse more (orless) packages than that from a different category? One explanation is that software inthat category is more complex and most incorporate more pre-existing components inorder to fulfill its requirements.
4.2.3 Software Development Tools
Packages in the development category include software libraries and programming lan-guage tools that are intended for use by programmers for creating new software. Packagedependency counts for the packages in this group follow the same basic trend as packages
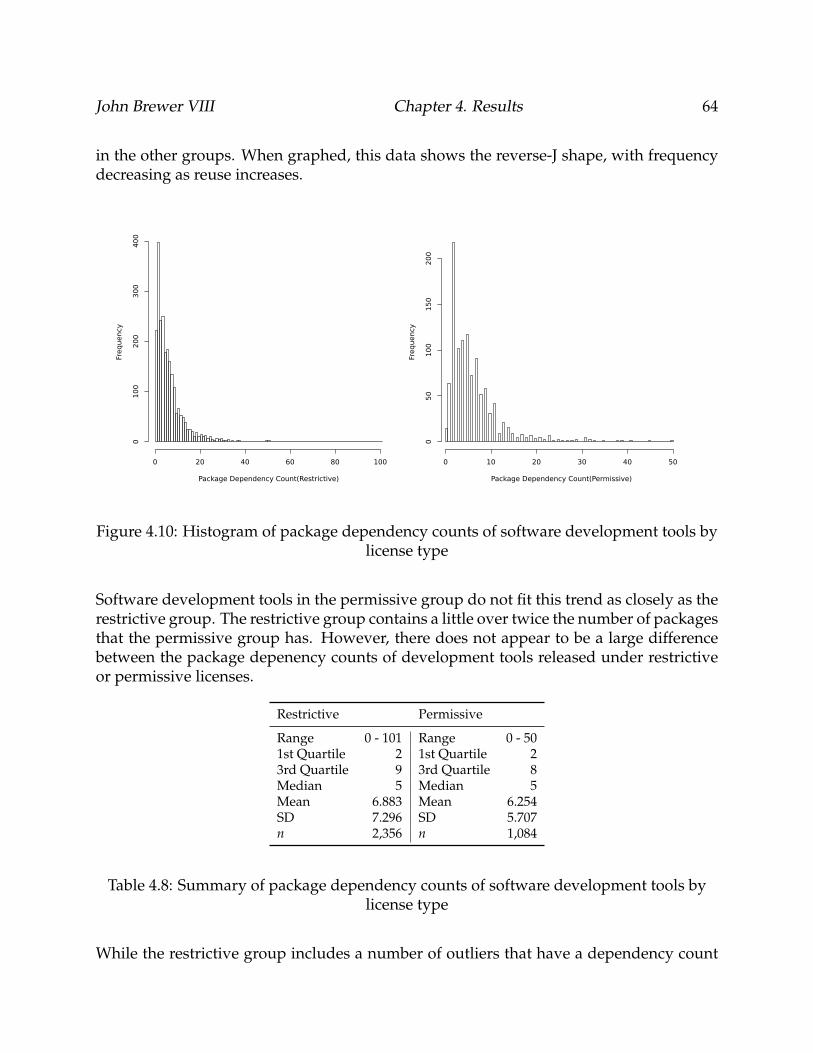
John Brewer VIII Chapter 4. Results 64
in the other groups. When graphed, this data shows the reverse-J shape, with frequencydecreasing as reuse increases.
Figure 4.10: Histogram of package dependency counts of software development tools bylicense type
Software development tools in the permissive group do not fit this trend as closely as therestrictive group. The restrictive group contains a little over twice the number of packagesthat the permissive group has. However, there does not appear to be a large differencebetween the package depenency counts of development tools released under restrictiveor permissive licenses.
Restrictive Permissive
Range 0 - 101 Range 0 - 501st Quartile 2 1st Quartile 23rd Quartile 9 3rd Quartile 8Median 5 Median 5Mean 6.883 Mean 6.254SD 7.296 SD 5.707n 2,356 n 1,084
Table 4.8: Summary of package dependency counts of software development tools bylicense type
While the restrictive group includes a number of outliers that have a dependency count
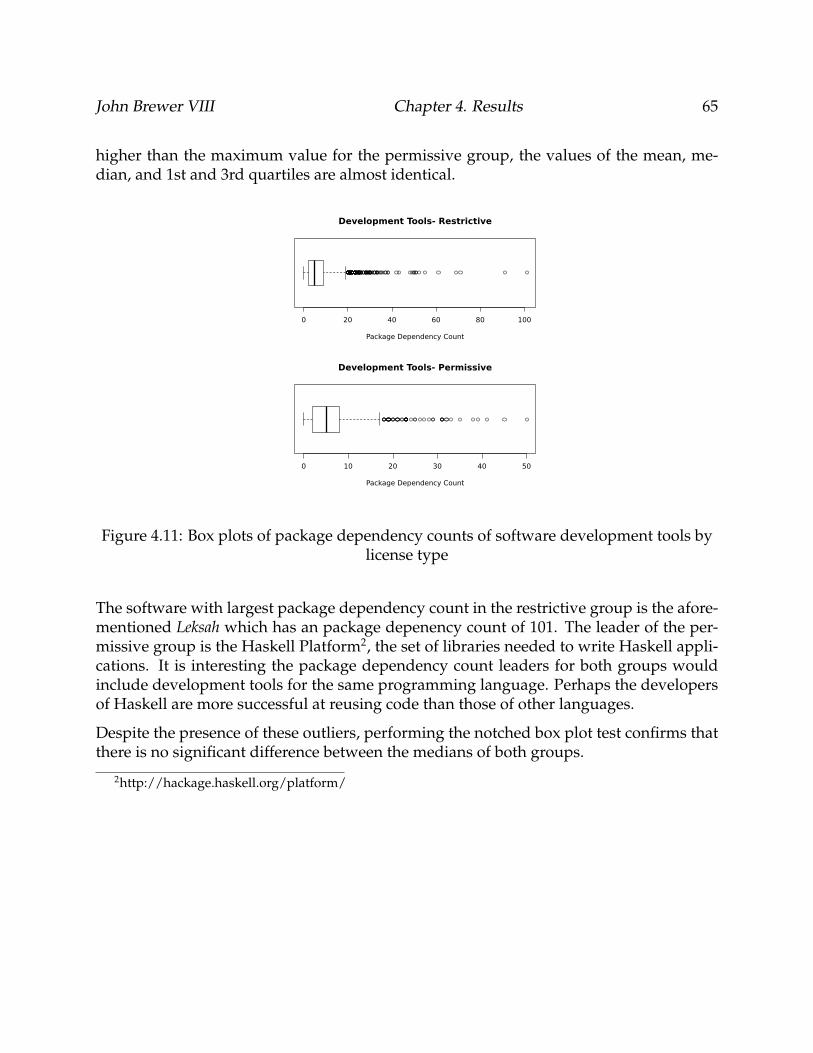
John Brewer VIII Chapter 4. Results 65
higher than the maximum value for the permissive group, the values of the mean, me-dian, and 1st and 3rd quartiles are almost identical.
Figure 4.11: Box plots of package dependency counts of software development tools bylicense type
The software with largest package dependency count in the restrictive group is the afore-mentioned Leksah which has an package depenency count of 101. The leader of the per-missive group is the Haskell Platform2, the set of libraries needed to write Haskell appli-cations. It is interesting the package dependency count leaders for both groups wouldinclude development tools for the same programming language. Perhaps the developersof Haskell are more successful at reusing code than those of other languages.
Despite the presence of these outliers, performing the notched box plot test confirms thatthere is no significant difference between the medians of both groups.
2http://hackage.haskell.org/platform/
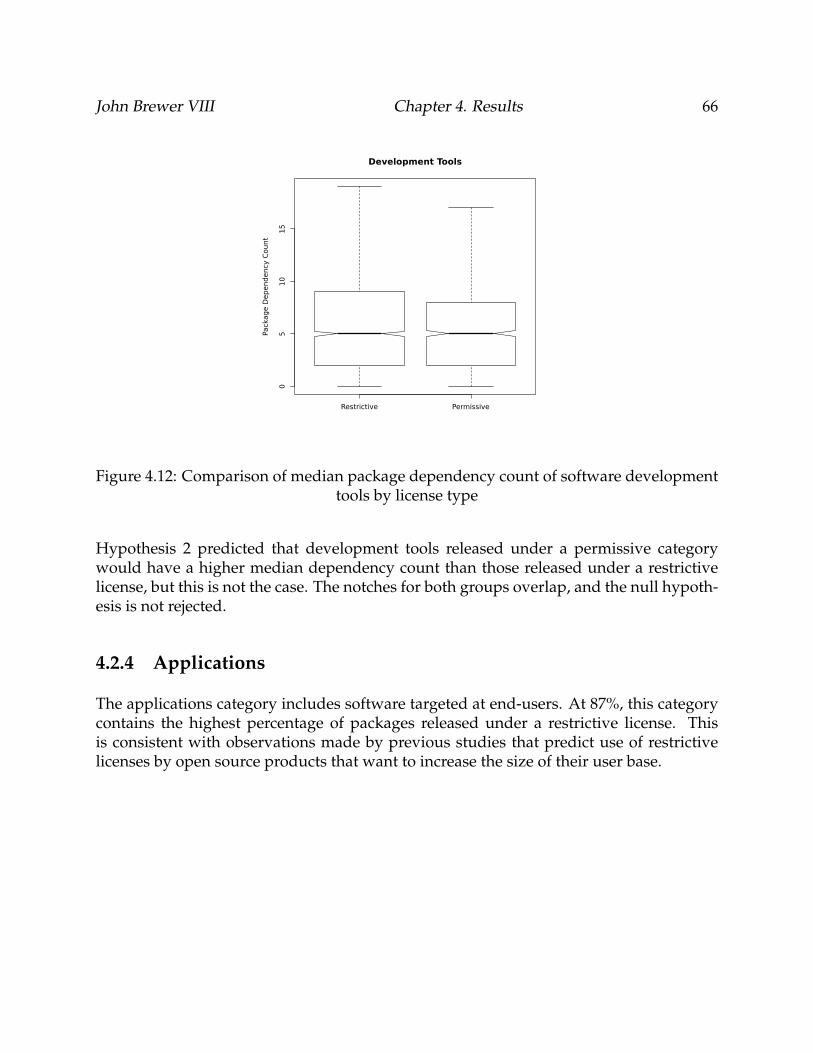
John Brewer VIII Chapter 4. Results 66
Figure 4.12: Comparison of median package dependency count of software developmenttools by license type
Hypothesis 2 predicted that development tools released under a permissive categorywould have a higher median dependency count than those released under a restrictivelicense, but this is not the case. The notches for both groups overlap, and the null hypoth-esis is not rejected.
4.2.4 Applications
The applications category includes software targeted at end-users. At 87%, this categorycontains the highest percentage of packages released under a restrictive license. Thisis consistent with observations made by previous studies that predict use of restrictivelicenses by open source products that want to increase the size of their user base.
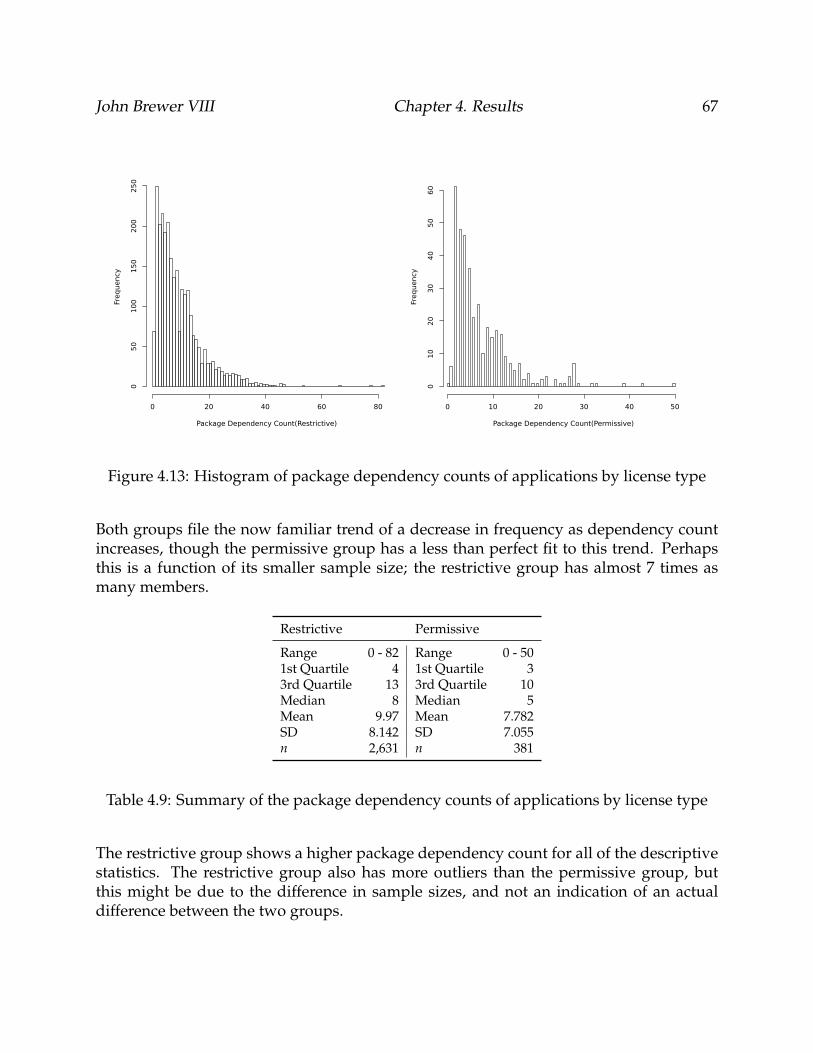
John Brewer VIII Chapter 4. Results 67
Figure 4.13: Histogram of package dependency counts of applications by license type
Both groups file the now familiar trend of a decrease in frequency as dependency countincreases, though the permissive group has a less than perfect fit to this trend. Perhapsthis is a function of its smaller sample size; the restrictive group has almost 7 times asmany members.
Restrictive Permissive
Range 0 - 82 Range 0 - 501st Quartile 4 1st Quartile 33rd Quartile 13 3rd Quartile 10Median 8 Median 5Mean 9.97 Mean 7.782SD 8.142 SD 7.055n 2,631 n 381
Table 4.9: Summary of the package dependency counts of applications by license type
The restrictive group shows a higher package dependency count for all of the descriptivestatistics. The restrictive group also has more outliers than the permissive group, butthis might be due to the difference in sample sizes, and not an indication of an actualdifference between the two groups.
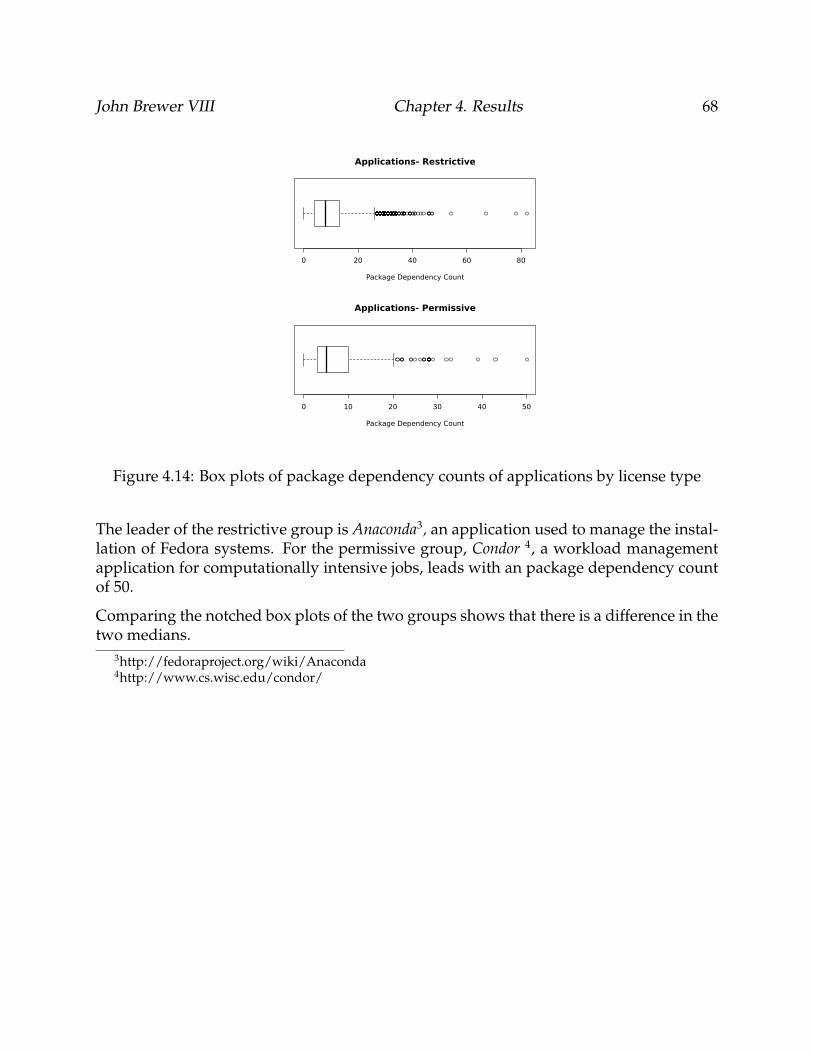
John Brewer VIII Chapter 4. Results 68
Figure 4.14: Box plots of package dependency counts of applications by license type
The leader of the restrictive group is Anaconda3, an application used to manage the instal-lation of Fedora systems. For the permissive group, Condor 4, a workload managementapplication for computationally intensive jobs, leads with an package dependency countof 50.
Comparing the notched box plots of the two groups shows that there is a difference in thetwo medians.
3http://fedoraproject.org/wiki/Anaconda4http://www.cs.wisc.edu/condor/
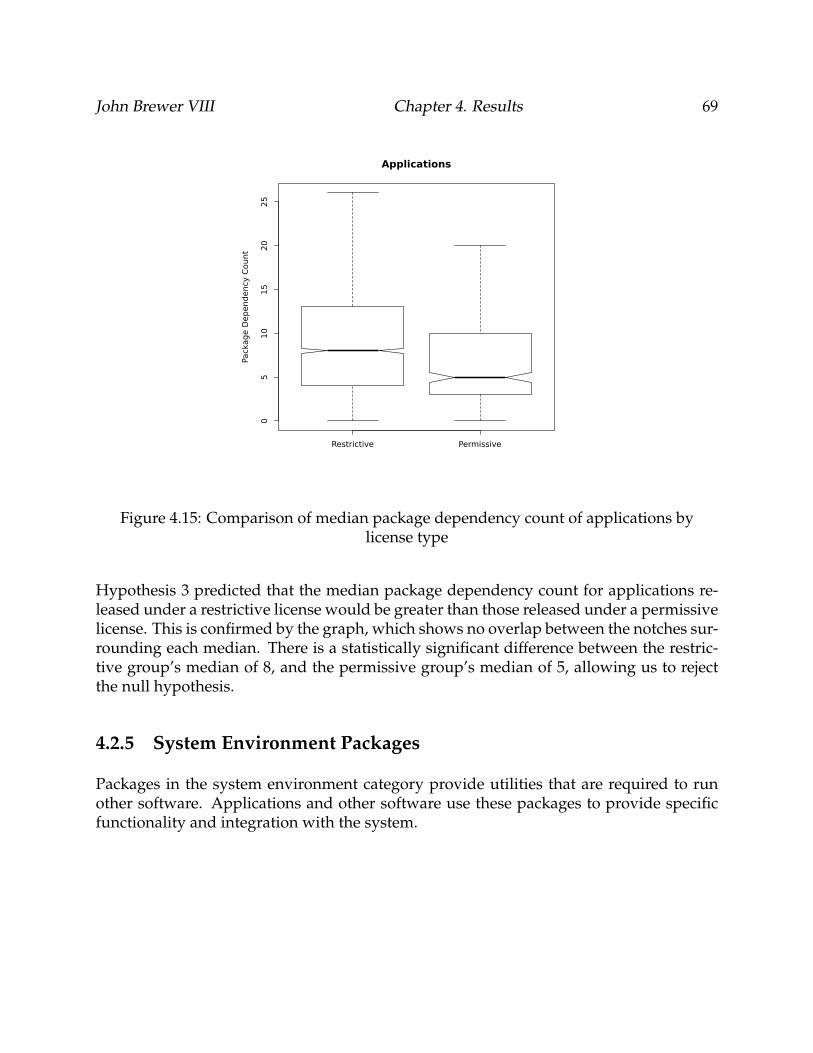
John Brewer VIII Chapter 4. Results 69
Figure 4.15: Comparison of median package dependency count of applications bylicense type
Hypothesis 3 predicted that the median package dependency count for applications re-leased under a restrictive license would be greater than those released under a permissivelicense. This is confirmed by the graph, which shows no overlap between the notches sur-rounding each median. There is a statistically significant difference between the restric-tive group’s median of 8, and the permissive group’s median of 5, allowing us to rejectthe null hypothesis.
4.2.5 System Environment Packages
Packages in the system environment category provide utilities that are required to runother software. Applications and other software use these packages to provide specificfunctionality and integration with the system.
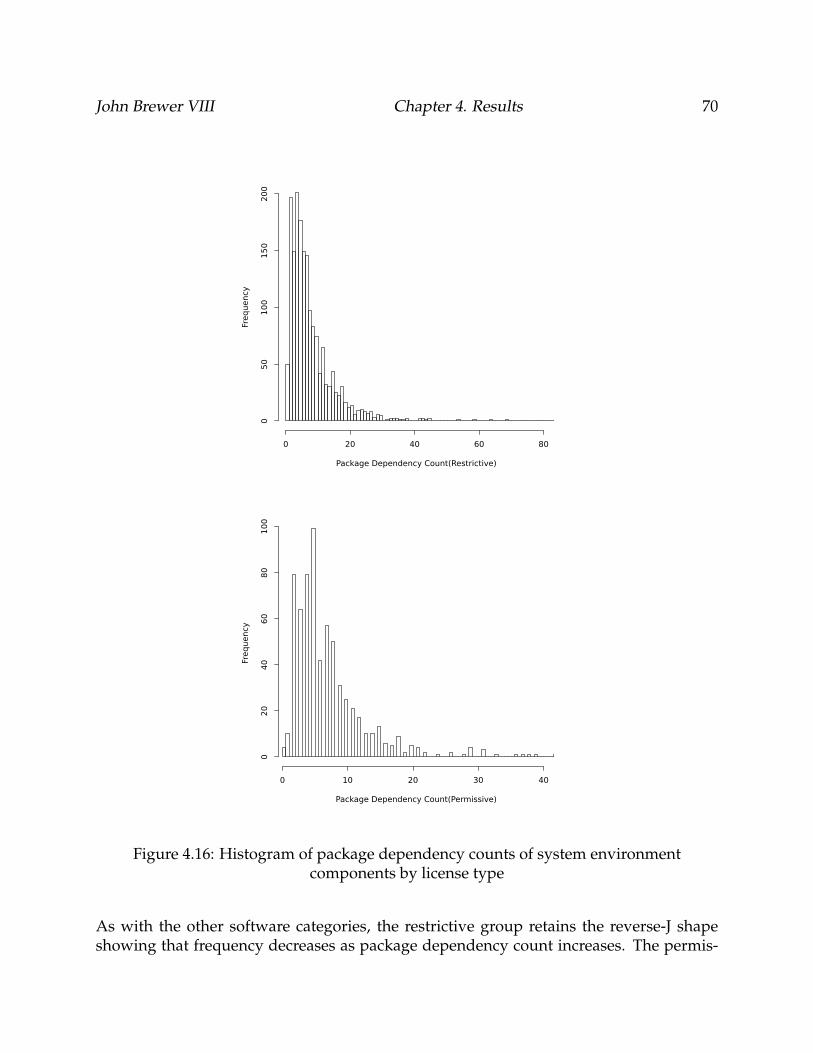
John Brewer VIII Chapter 4. Results 70
Figure 4.16: Histogram of package dependency counts of system environmentcomponents by license type
As with the other software categories, the restrictive group retains the reverse-J shapeshowing that frequency decreases as package dependency count increases. The permis-
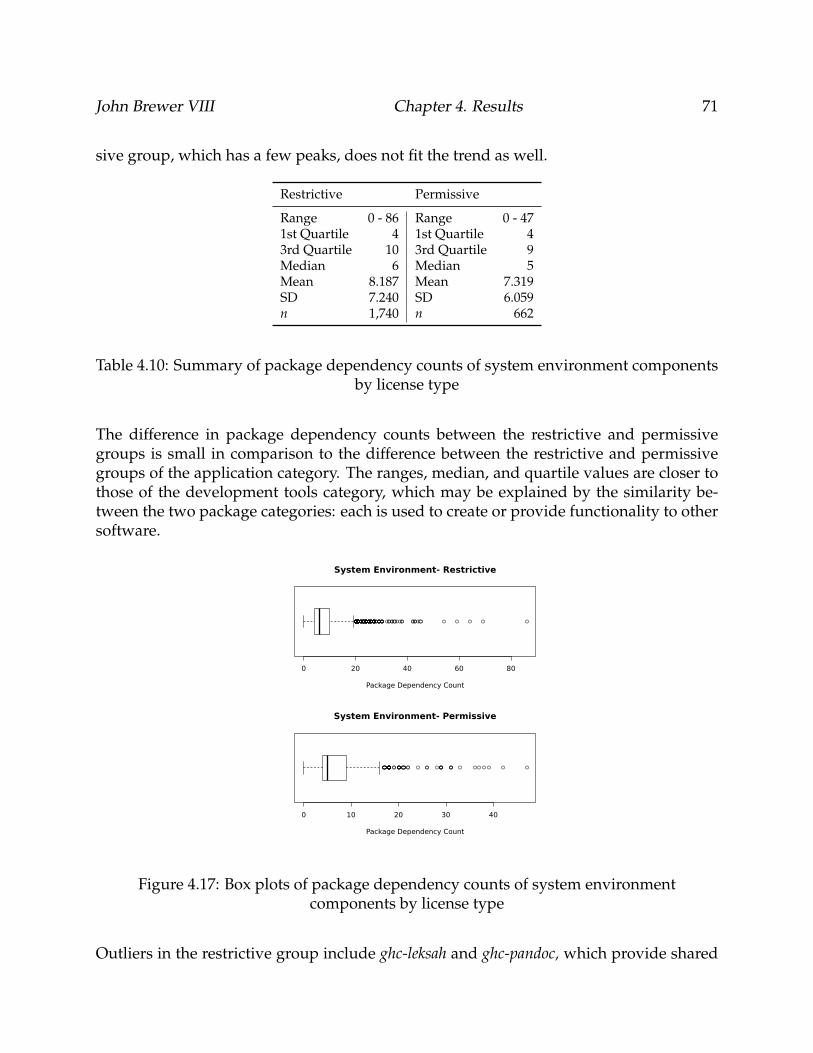
John Brewer VIII Chapter 4. Results 71
sive group, which has a few peaks, does not fit the trend as well.
Restrictive Permissive
Range 0 - 86 Range 0 - 471st Quartile 4 1st Quartile 43rd Quartile 10 3rd Quartile 9Median 6 Median 5Mean 8.187 Mean 7.319SD 7.240 SD 6.059n 1,740 n 662
Table 4.10: Summary of package dependency counts of system environment componentsby license type
The difference in package dependency counts between the restrictive and permissivegroups is small in comparison to the difference between the restrictive and permissivegroups of the application category. The ranges, median, and quartile values are closer tothose of the development tools category, which may be explained by the similarity be-tween the two package categories: each is used to create or provide functionality to othersoftware.
Figure 4.17: Box plots of package dependency counts of system environmentcomponents by license type
Outliers in the restrictive group include ghc-leksah and ghc-pandoc, which provide shared
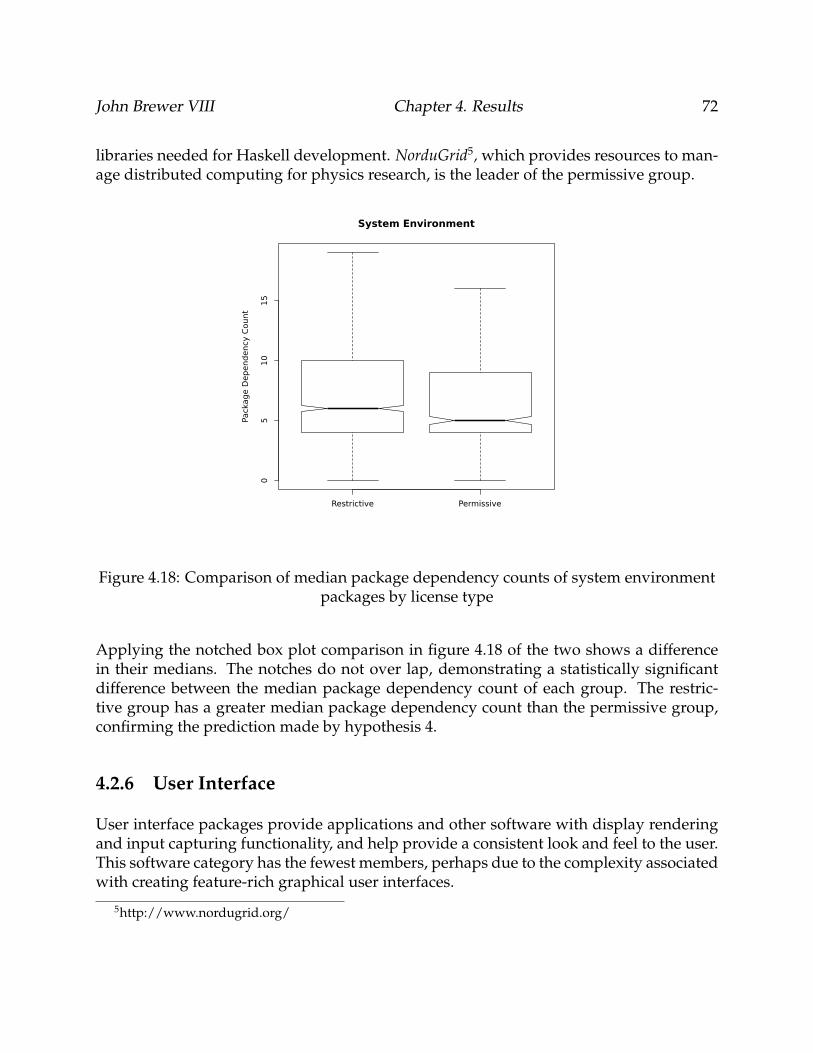
John Brewer VIII Chapter 4. Results 72
libraries needed for Haskell development. NorduGrid5, which provides resources to man-age distributed computing for physics research, is the leader of the permissive group.
Figure 4.18: Comparison of median package dependency counts of system environmentpackages by license type
Applying the notched box plot comparison in figure 4.18 of the two shows a differencein their medians. The notches do not over lap, demonstrating a statistically significantdifference between the median package dependency count of each group. The restric-tive group has a greater median package dependency count than the permissive group,confirming the prediction made by hypothesis 4.
4.2.6 User Interface
User interface packages provide applications and other software with display renderingand input capturing functionality, and help provide a consistent look and feel to the user.This software category has the fewest members, perhaps due to the complexity associatedwith creating feature-rich graphical user interfaces.
5http://www.nordugrid.org/
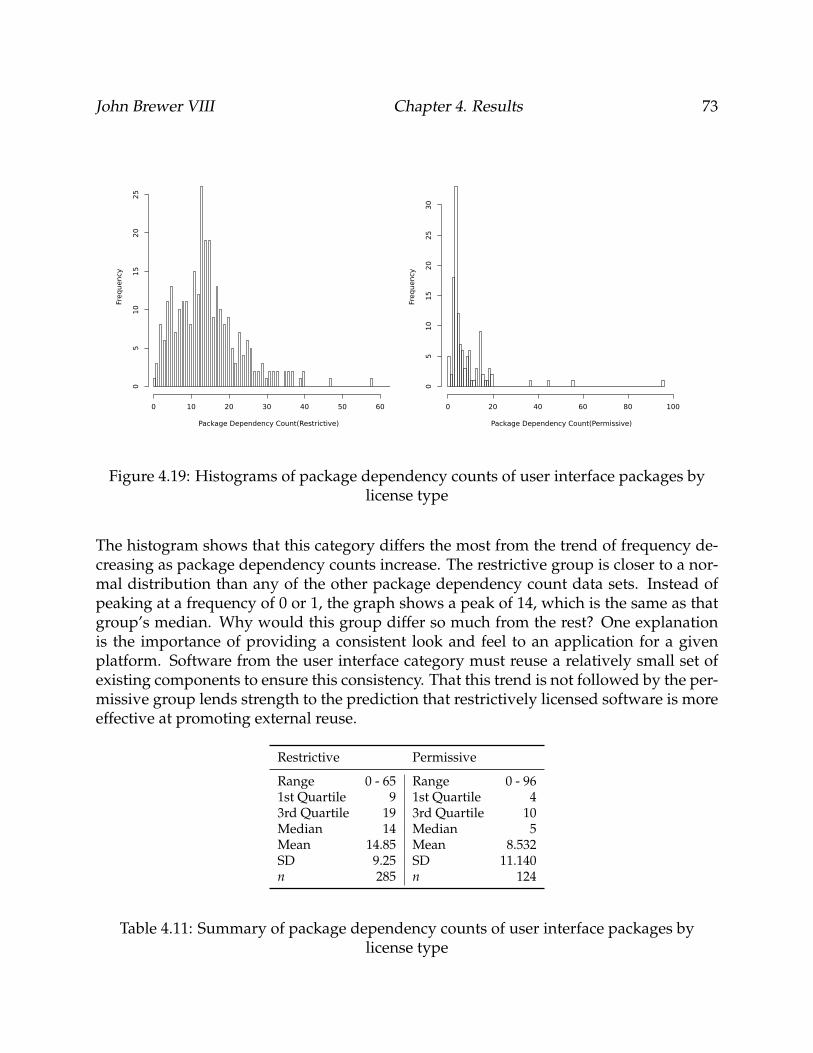
John Brewer VIII Chapter 4. Results 73
Figure 4.19: Histograms of package dependency counts of user interface packages bylicense type
The histogram shows that this category differs the most from the trend of frequency de-creasing as package dependency counts increase. The restrictive group is closer to a nor-mal distribution than any of the other package dependency count data sets. Instead ofpeaking at a frequency of 0 or 1, the graph shows a peak of 14, which is the same as thatgroup’s median. Why would this group differ so much from the rest? One explanationis the importance of providing a consistent look and feel to an application for a givenplatform. Software from the user interface category must reuse a relatively small set ofexisting components to ensure this consistency. That this trend is not followed by the per-missive group lends strength to the prediction that restrictively licensed software is moreeffective at promoting external reuse.
Restrictive Permissive
Range 0 - 65 Range 0 - 961st Quartile 9 1st Quartile 43rd Quartile 19 3rd Quartile 10Median 14 Median 5Mean 14.85 Mean 8.532SD 9.25 SD 11.140n 285 n 124
Table 4.11: Summary of package dependency counts of user interface packages bylicense type
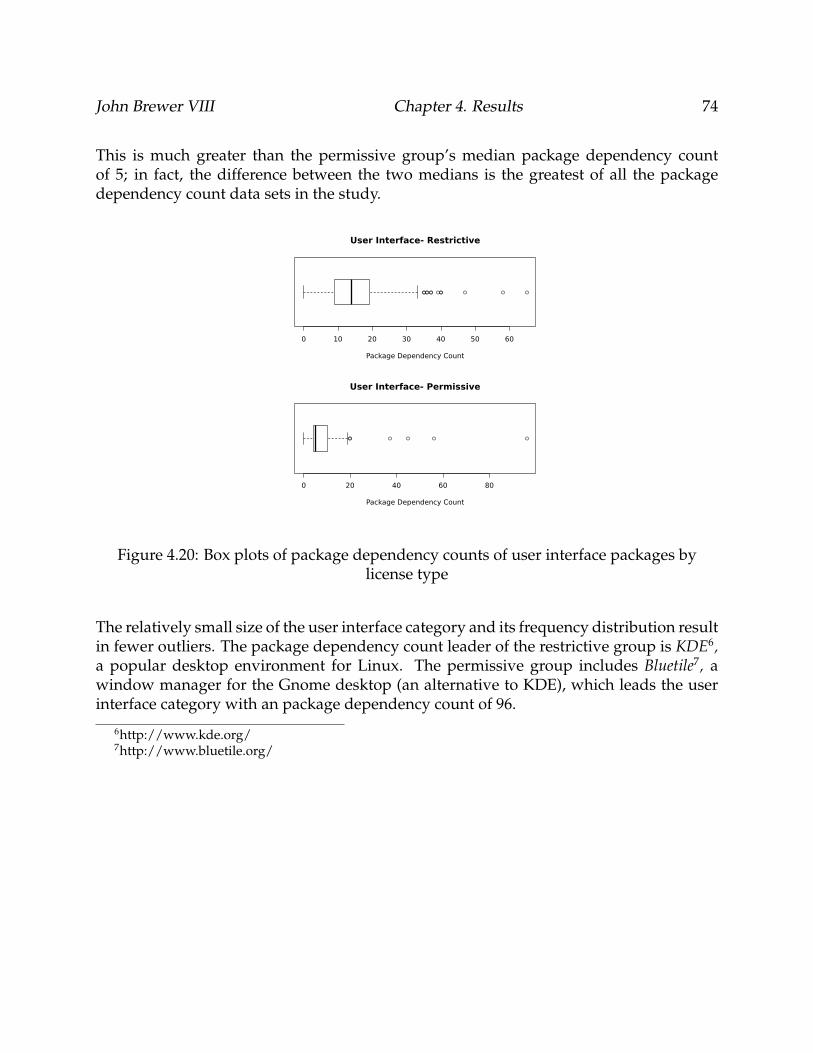
John Brewer VIII Chapter 4. Results 74
This is much greater than the permissive group’s median package dependency countof 5; in fact, the difference between the two medians is the greatest of all the packagedependency count data sets in the study.
Figure 4.20: Box plots of package dependency counts of user interface packages bylicense type
The relatively small size of the user interface category and its frequency distribution resultin fewer outliers. The package dependency count leader of the restrictive group is KDE6,a popular desktop environment for Linux. The permissive group includes Bluetile7, awindow manager for the Gnome desktop (an alternative to KDE), which leads the userinterface category with an package dependency count of 96.
6http://www.kde.org/7http://www.bluetile.org/
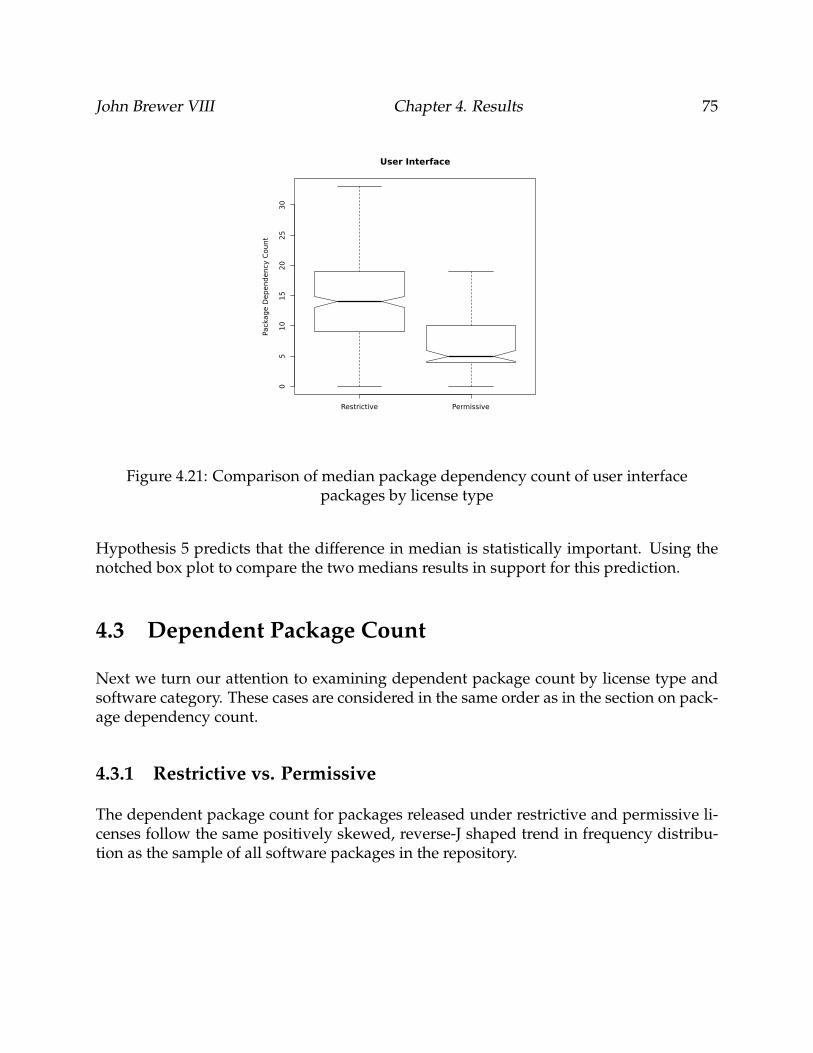
John Brewer VIII Chapter 4. Results 75
Figure 4.21: Comparison of median package dependency count of user interfacepackages by license type
Hypothesis 5 predicts that the difference in median is statistically important. Using thenotched box plot to compare the two medians results in support for this prediction.
4.3 Dependent Package Count
Next we turn our attention to examining dependent package count by license type andsoftware category. These cases are considered in the same order as in the section on pack-age dependency count.
4.3.1 Restrictive vs. Permissive
The dependent package count for packages released under restrictive and permissive li-censes follow the same positively skewed, reverse-J shaped trend in frequency distribu-tion as the sample of all software packages in the repository.
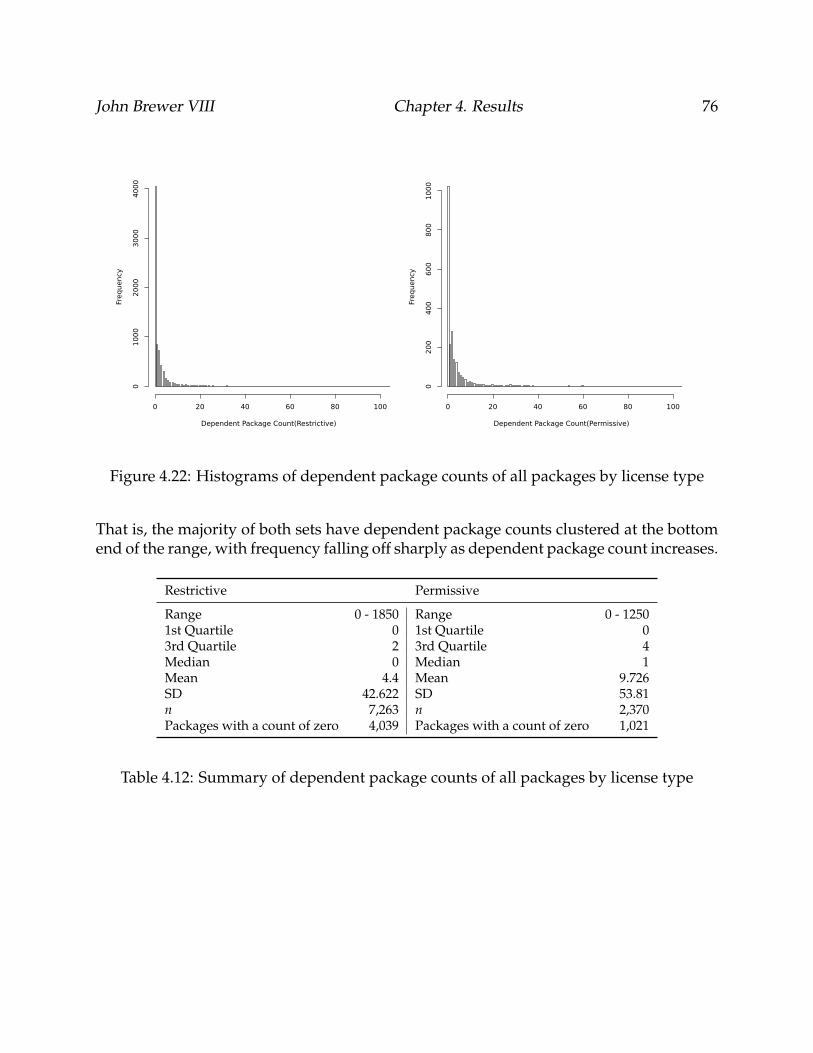
John Brewer VIII Chapter 4. Results 76
Figure 4.22: Histograms of dependent package counts of all packages by license type
That is, the majority of both sets have dependent package counts clustered at the bottomend of the range, with frequency falling off sharply as dependent package count increases.
Restrictive Permissive
Range 0 - 1850 Range 0 - 12501st Quartile 0 1st Quartile 03rd Quartile 2 3rd Quartile 4Median 0 Median 1Mean 4.4 Mean 9.726SD 42.622 SD 53.81n 7,263 n 2,370Packages with a count of zero 4,039 Packages with a count of zero 1,021
Table 4.12: Summary of dependent package counts of all packages by license type
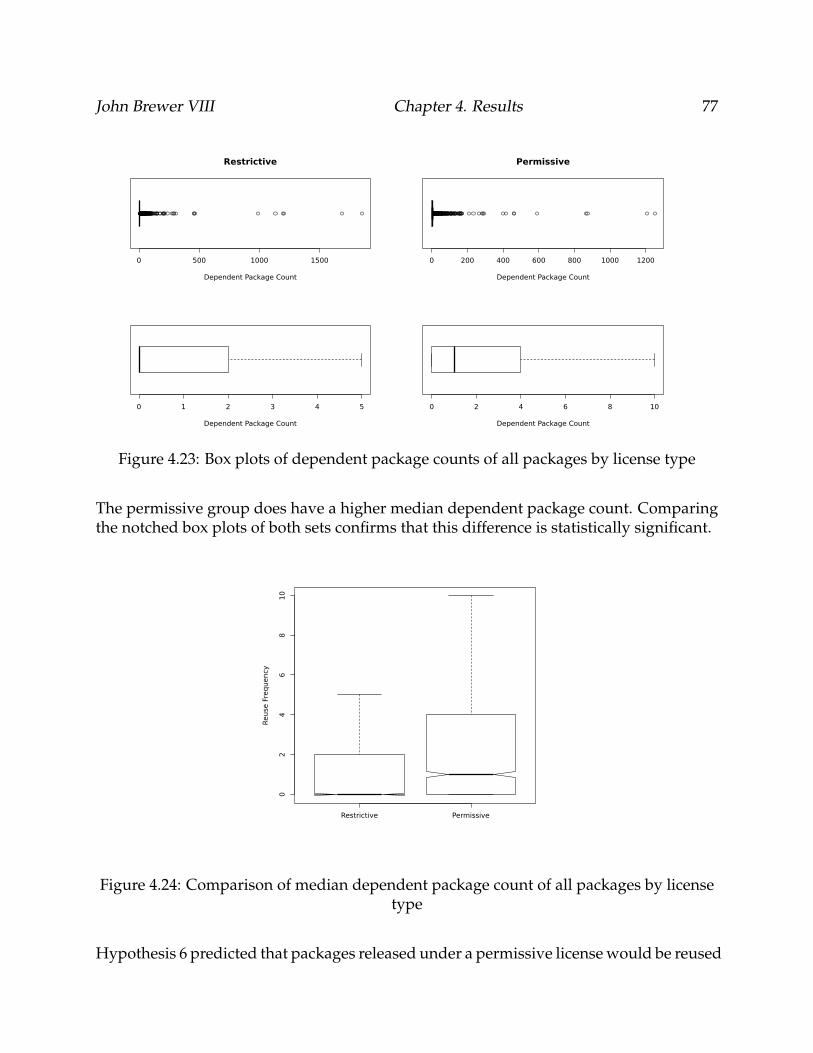
John Brewer VIII Chapter 4. Results 77
Figure 4.23: Box plots of dependent package counts of all packages by license type
The permissive group does have a higher median dependent package count. Comparingthe notched box plots of both sets confirms that this difference is statistically significant.
Figure 4.24: Comparison of median dependent package count of all packages by licensetype
Hypothesis 6 predicted that packages released under a permissive license would be reused
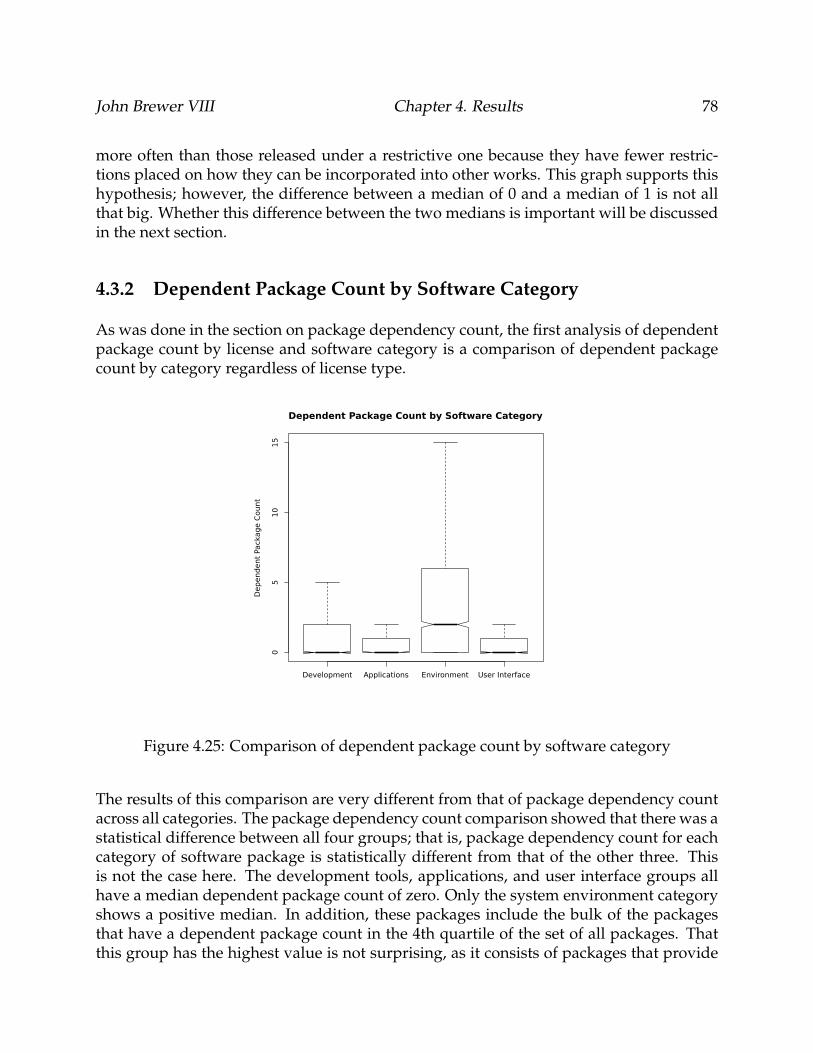
John Brewer VIII Chapter 4. Results 78
more often than those released under a restrictive one because they have fewer restric-tions placed on how they can be incorporated into other works. This graph supports thishypothesis; however, the difference between a median of 0 and a median of 1 is not allthat big. Whether this difference between the two medians is important will be discussedin the next section.
4.3.2 Dependent Package Count by Software Category
As was done in the section on package dependency count, the first analysis of dependentpackage count by license and software category is a comparison of dependent packagecount by category regardless of license type.
Figure 4.25: Comparison of dependent package count by software category
The results of this comparison are very different from that of package dependency countacross all categories. The package dependency count comparison showed that there was astatistical difference between all four groups; that is, package dependency count for eachcategory of software package is statistically different from that of the other three. Thisis not the case here. The development tools, applications, and user interface groups allhave a median dependent package count of zero. Only the system environment categoryshows a positive median. In addition, these packages include the bulk of the packagesthat have a dependent package count in the 4th quartile of the set of all packages. Thatthis group has the highest value is not surprising, as it consists of packages that provide
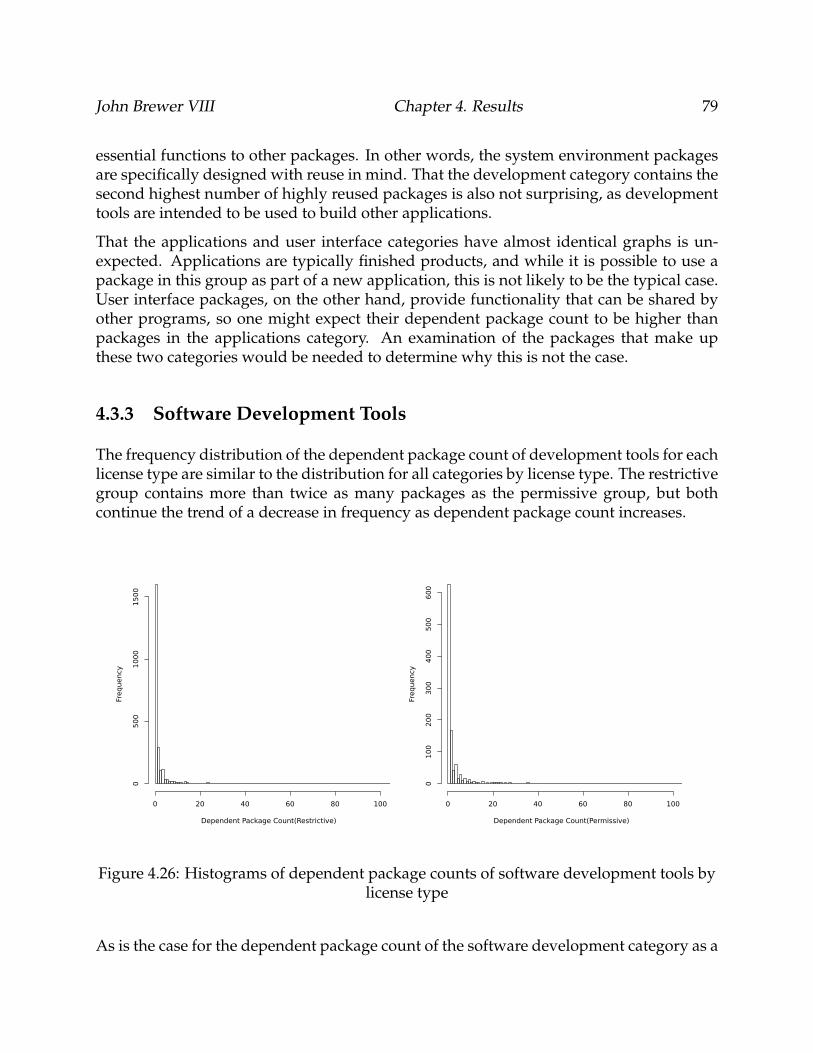
John Brewer VIII Chapter 4. Results 79
essential functions to other packages. In other words, the system environment packagesare specifically designed with reuse in mind. That the development category contains thesecond highest number of highly reused packages is also not surprising, as developmenttools are intended to be used to build other applications.
That the applications and user interface categories have almost identical graphs is un-expected. Applications are typically finished products, and while it is possible to use apackage in this group as part of a new application, this is not likely to be the typical case.User interface packages, on the other hand, provide functionality that can be shared byother programs, so one might expect their dependent package count to be higher thanpackages in the applications category. An examination of the packages that make upthese two categories would be needed to determine why this is not the case.
4.3.3 Software Development Tools
The frequency distribution of the dependent package count of development tools for eachlicense type are similar to the distribution for all categories by license type. The restrictivegroup contains more than twice as many packages as the permissive group, but bothcontinue the trend of a decrease in frequency as dependent package count increases.
Figure 4.26: Histograms of dependent package counts of software development tools bylicense type
As is the case for the dependent package count of the software development category as a
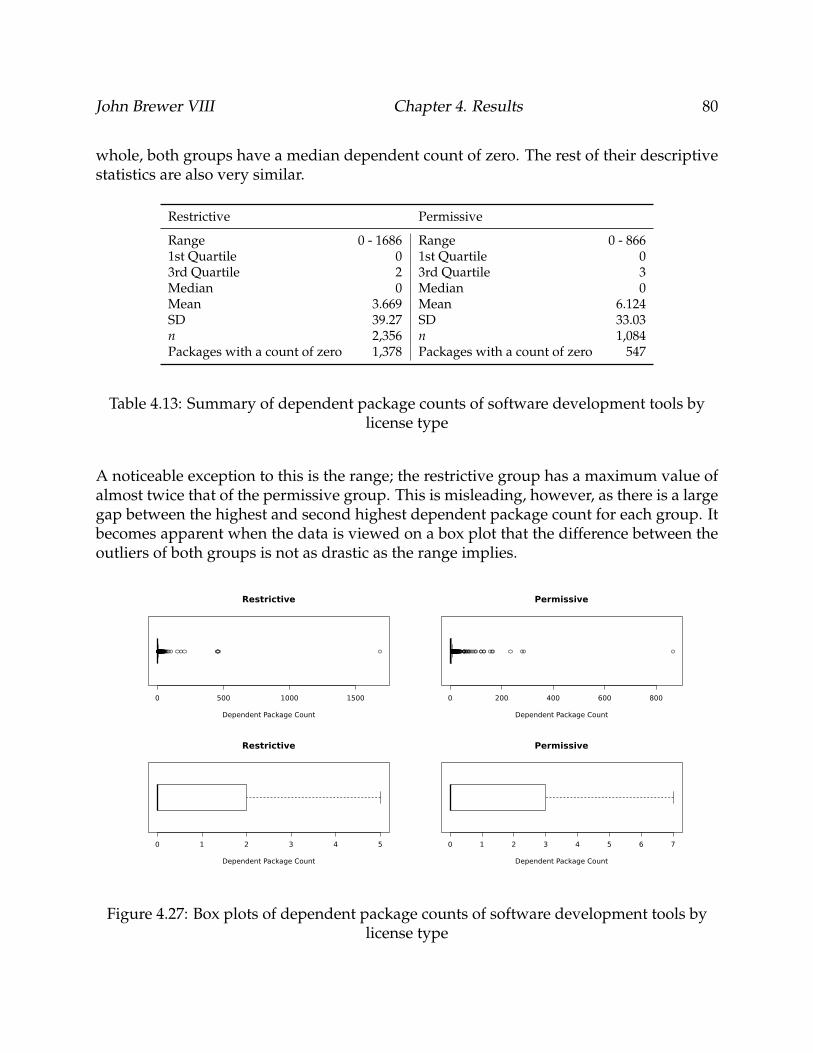
John Brewer VIII Chapter 4. Results 80
whole, both groups have a median dependent count of zero. The rest of their descriptivestatistics are also very similar.
Restrictive Permissive
Range 0 - 1686 Range 0 - 8661st Quartile 0 1st Quartile 03rd Quartile 2 3rd Quartile 3Median 0 Median 0Mean 3.669 Mean 6.124SD 39.27 SD 33.03n 2,356 n 1,084Packages with a count of zero 1,378 Packages with a count of zero 547
Table 4.13: Summary of dependent package counts of software development tools bylicense type
A noticeable exception to this is the range; the restrictive group has a maximum value ofalmost twice that of the permissive group. This is misleading, however, as there is a largegap between the highest and second highest dependent package count for each group. Itbecomes apparent when the data is viewed on a box plot that the difference between theoutliers of both groups is not as drastic as the range implies.
Figure 4.27: Box plots of dependent package counts of software development tools bylicense type
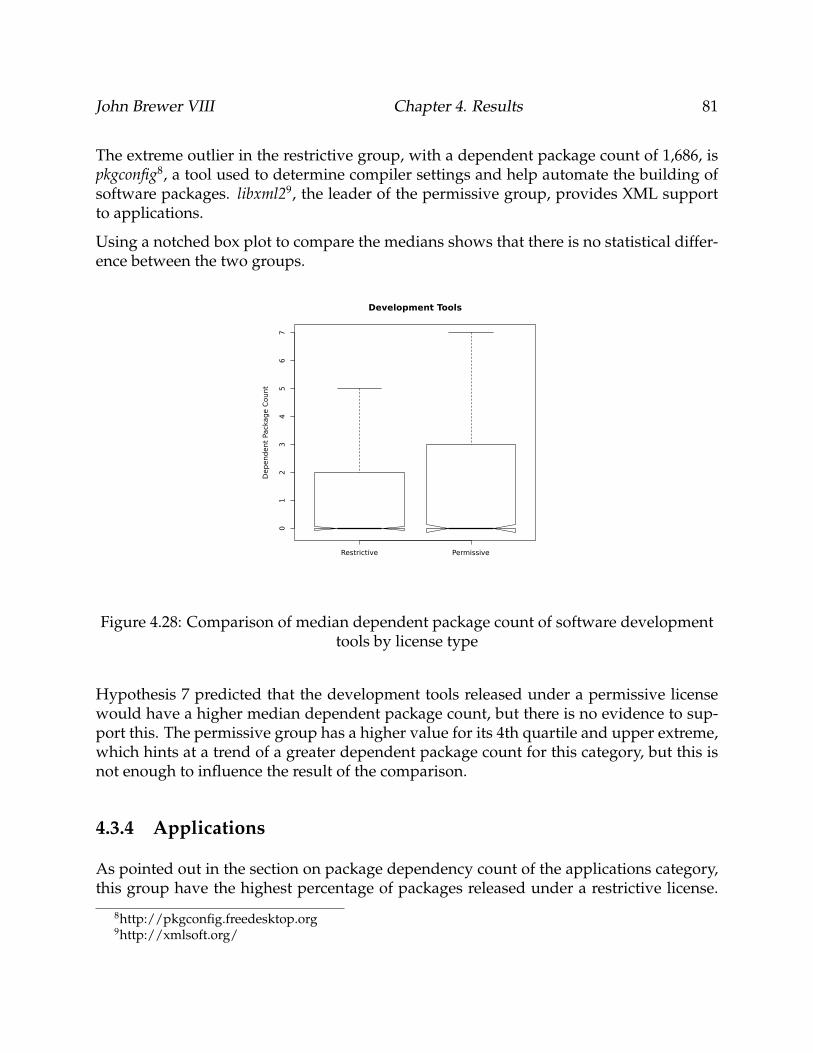
John Brewer VIII Chapter 4. Results 81
The extreme outlier in the restrictive group, with a dependent package count of 1,686, ispkgconfig8, a tool used to determine compiler settings and help automate the building ofsoftware packages. libxml29, the leader of the permissive group, provides XML supportto applications.
Using a notched box plot to compare the medians shows that there is no statistical differ-ence between the two groups.
Figure 4.28: Comparison of median dependent package count of software developmenttools by license type
Hypothesis 7 predicted that the development tools released under a permissive licensewould have a higher median dependent package count, but there is no evidence to sup-port this. The permissive group has a higher value for its 4th quartile and upper extreme,which hints at a trend of a greater dependent package count for this category, but this isnot enough to influence the result of the comparison.
4.3.4 Applications
As pointed out in the section on package dependency count of the applications category,this group have the highest percentage of packages released under a restrictive license.
8http://pkgconfig.freedesktop.org9http://xmlsoft.org/
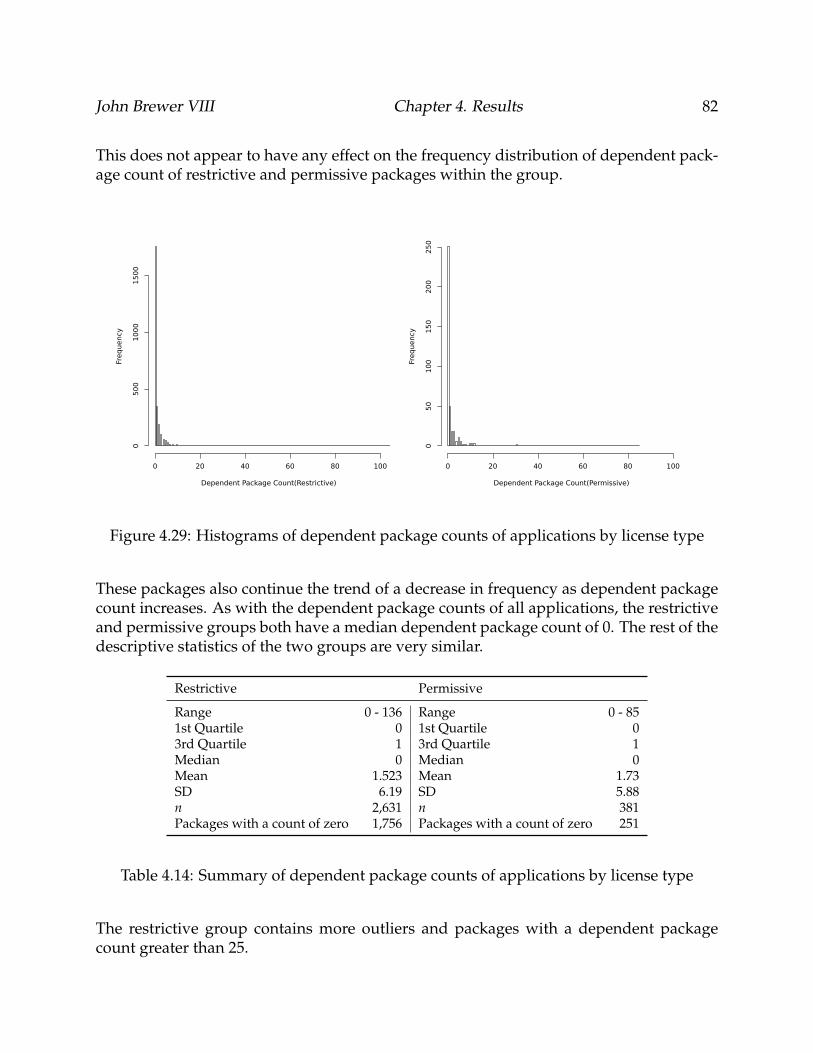
John Brewer VIII Chapter 4. Results 82
This does not appear to have any effect on the frequency distribution of dependent pack-age count of restrictive and permissive packages within the group.
Figure 4.29: Histograms of dependent package counts of applications by license type
These packages also continue the trend of a decrease in frequency as dependent packagecount increases. As with the dependent package counts of all applications, the restrictiveand permissive groups both have a median dependent package count of 0. The rest of thedescriptive statistics of the two groups are very similar.
Restrictive Permissive
Range 0 - 136 Range 0 - 851st Quartile 0 1st Quartile 03rd Quartile 1 3rd Quartile 1Median 0 Median 0Mean 1.523 Mean 1.73SD 6.19 SD 5.88n 2,631 n 381Packages with a count of zero 1,756 Packages with a count of zero 251
Table 4.14: Summary of dependent package counts of applications by license type
The restrictive group contains more outliers and packages with a dependent packagecount greater than 25.
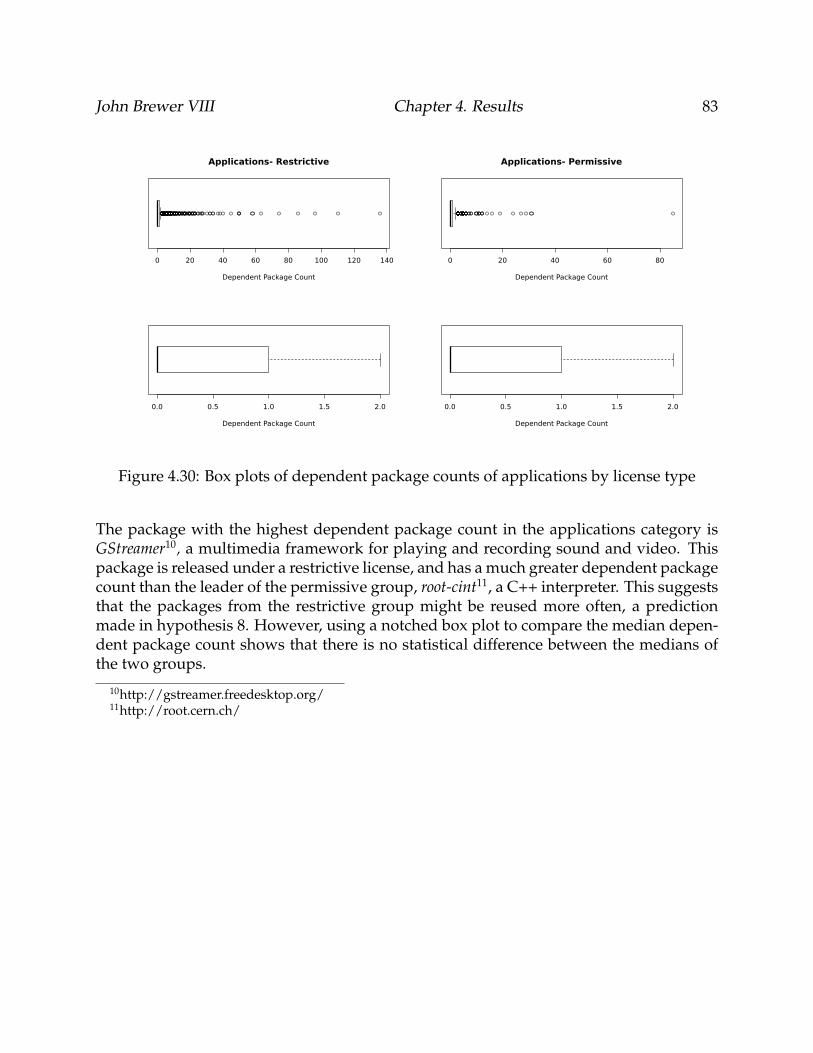
John Brewer VIII Chapter 4. Results 83
Figure 4.30: Box plots of dependent package counts of applications by license type
The package with the highest dependent package count in the applications category isGStreamer10, a multimedia framework for playing and recording sound and video. Thispackage is released under a restrictive license, and has a much greater dependent packagecount than the leader of the permissive group, root-cint11, a C++ interpreter. This suggeststhat the packages from the restrictive group might be reused more often, a predictionmade in hypothesis 8. However, using a notched box plot to compare the median depen-dent package count shows that there is no statistical difference between the medians ofthe two groups.
10http://gstreamer.freedesktop.org/11http://root.cern.ch/
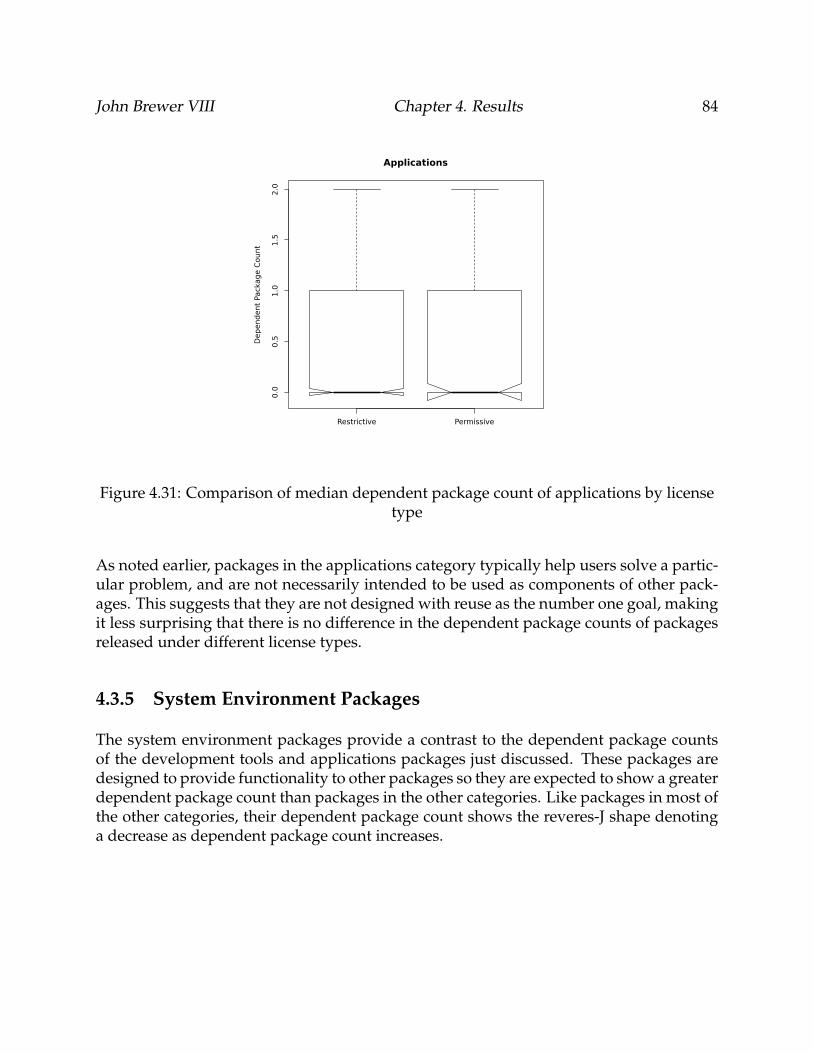
John Brewer VIII Chapter 4. Results 84
Figure 4.31: Comparison of median dependent package count of applications by licensetype
As noted earlier, packages in the applications category typically help users solve a partic-ular problem, and are not necessarily intended to be used as components of other pack-ages. This suggests that they are not designed with reuse as the number one goal, makingit less surprising that there is no difference in the dependent package counts of packagesreleased under different license types.
4.3.5 System Environment Packages
The system environment packages provide a contrast to the dependent package countsof the development tools and applications packages just discussed. These packages aredesigned to provide functionality to other packages so they are expected to show a greaterdependent package count than packages in the other categories. Like packages in most ofthe other categories, their dependent package count shows the reveres-J shape denotinga decrease as dependent package count increases.
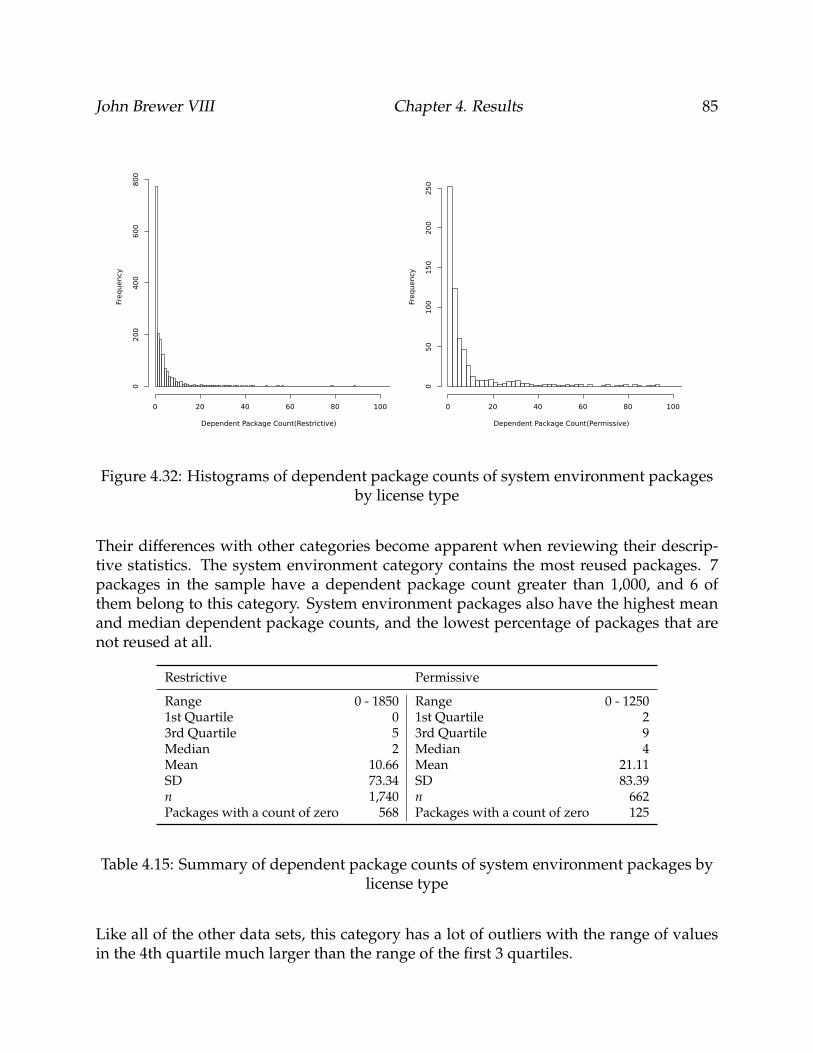
John Brewer VIII Chapter 4. Results 85
Figure 4.32: Histograms of dependent package counts of system environment packagesby license type
Their differences with other categories become apparent when reviewing their descrip-tive statistics. The system environment category contains the most reused packages. 7packages in the sample have a dependent package count greater than 1,000, and 6 ofthem belong to this category. System environment packages also have the highest meanand median dependent package counts, and the lowest percentage of packages that arenot reused at all.
Restrictive Permissive
Range 0 - 1850 Range 0 - 12501st Quartile 0 1st Quartile 23rd Quartile 5 3rd Quartile 9Median 2 Median 4Mean 10.66 Mean 21.11SD 73.34 SD 83.39n 1,740 n 662Packages with a count of zero 568 Packages with a count of zero 125
Table 4.15: Summary of dependent package counts of system environment packages bylicense type
Like all of the other data sets, this category has a lot of outliers with the range of valuesin the 4th quartile much larger than the range of the first 3 quartiles.
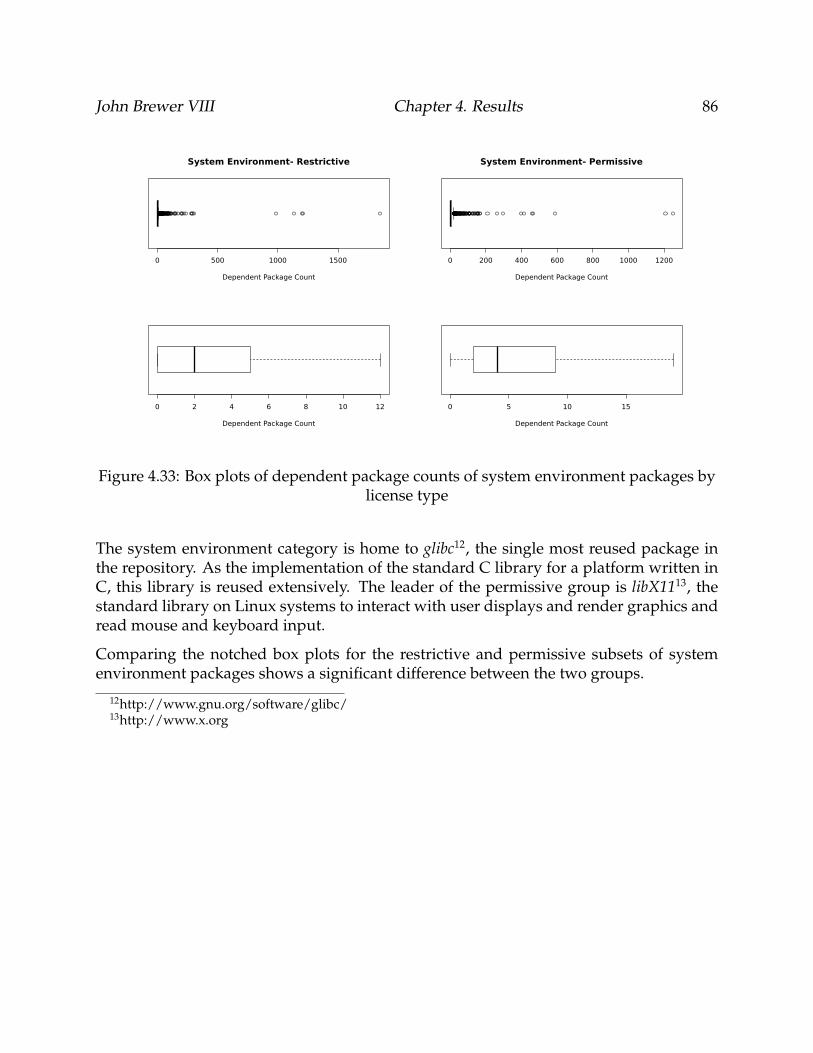
John Brewer VIII Chapter 4. Results 86
Figure 4.33: Box plots of dependent package counts of system environment packages bylicense type
The system environment category is home to glibc12, the single most reused package inthe repository. As the implementation of the standard C library for a platform written inC, this library is reused extensively. The leader of the permissive group is libX1113, thestandard library on Linux systems to interact with user displays and render graphics andread mouse and keyboard input.
Comparing the notched box plots for the restrictive and permissive subsets of systemenvironment packages shows a significant difference between the two groups.
12http://www.gnu.org/software/glibc/13http://www.x.org
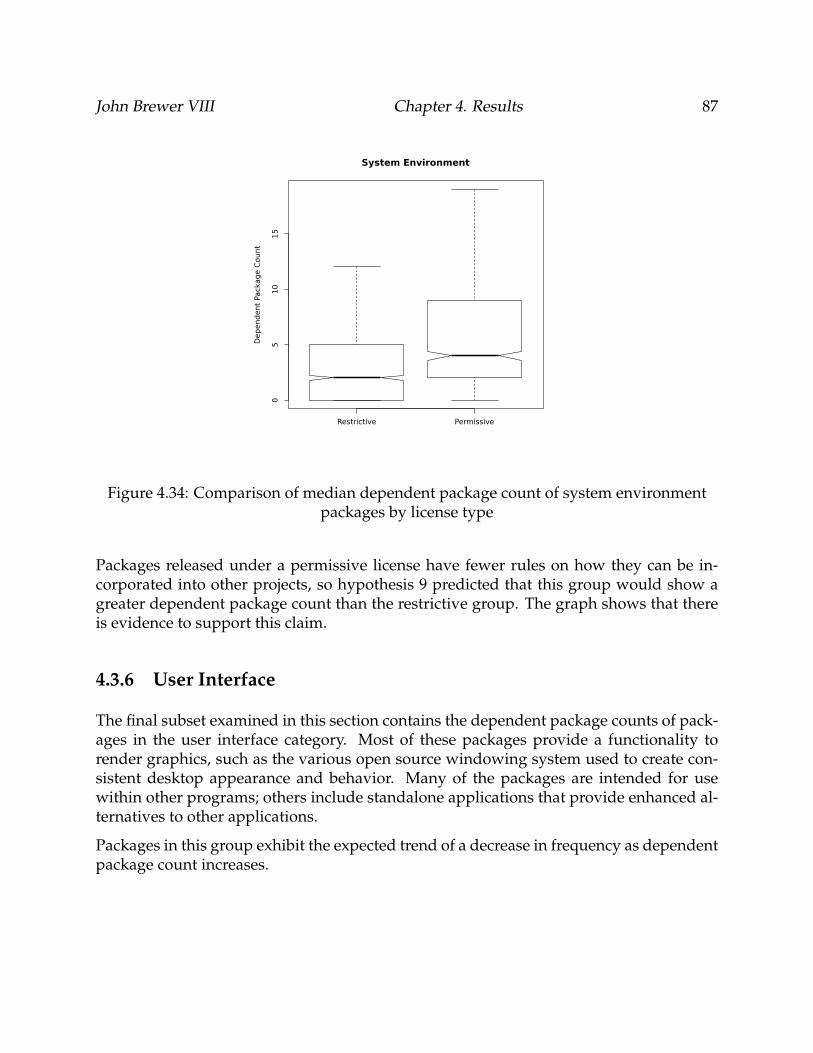
John Brewer VIII Chapter 4. Results 87
Figure 4.34: Comparison of median dependent package count of system environmentpackages by license type
Packages released under a permissive license have fewer rules on how they can be in-corporated into other projects, so hypothesis 9 predicted that this group would show agreater dependent package count than the restrictive group. The graph shows that thereis evidence to support this claim.
4.3.6 User Interface
The final subset examined in this section contains the dependent package counts of pack-ages in the user interface category. Most of these packages provide a functionality torender graphics, such as the various open source windowing system used to create con-sistent desktop appearance and behavior. Many of the packages are intended for usewithin other programs; others include standalone applications that provide enhanced al-ternatives to other applications.
Packages in this group exhibit the expected trend of a decrease in frequency as dependentpackage count increases.
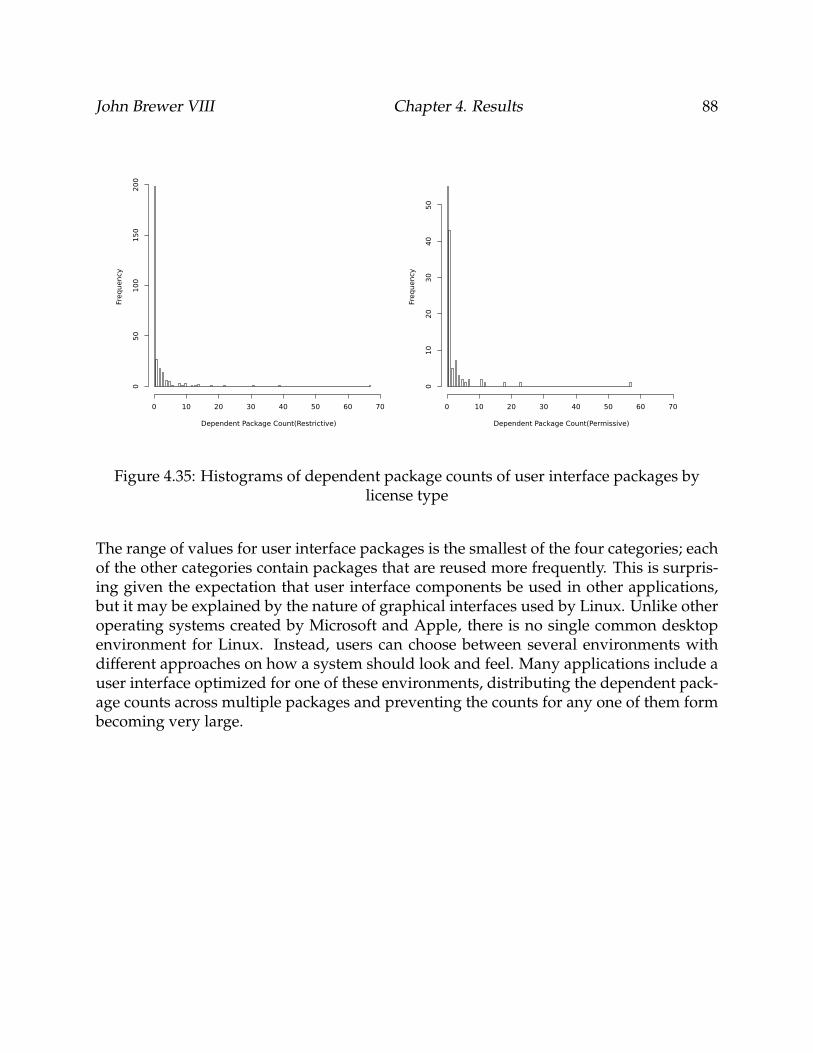
John Brewer VIII Chapter 4. Results 88
Figure 4.35: Histograms of dependent package counts of user interface packages bylicense type
The range of values for user interface packages is the smallest of the four categories; eachof the other categories contain packages that are reused more frequently. This is surpris-ing given the expectation that user interface components be used in other applications,but it may be explained by the nature of graphical interfaces used by Linux. Unlike otheroperating systems created by Microsoft and Apple, there is no single common desktopenvironment for Linux. Instead, users can choose between several environments withdifferent approaches on how a system should look and feel. Many applications include auser interface optimized for one of these environments, distributing the dependent pack-age counts across multiple packages and preventing the counts for any one of them formbecoming very large.
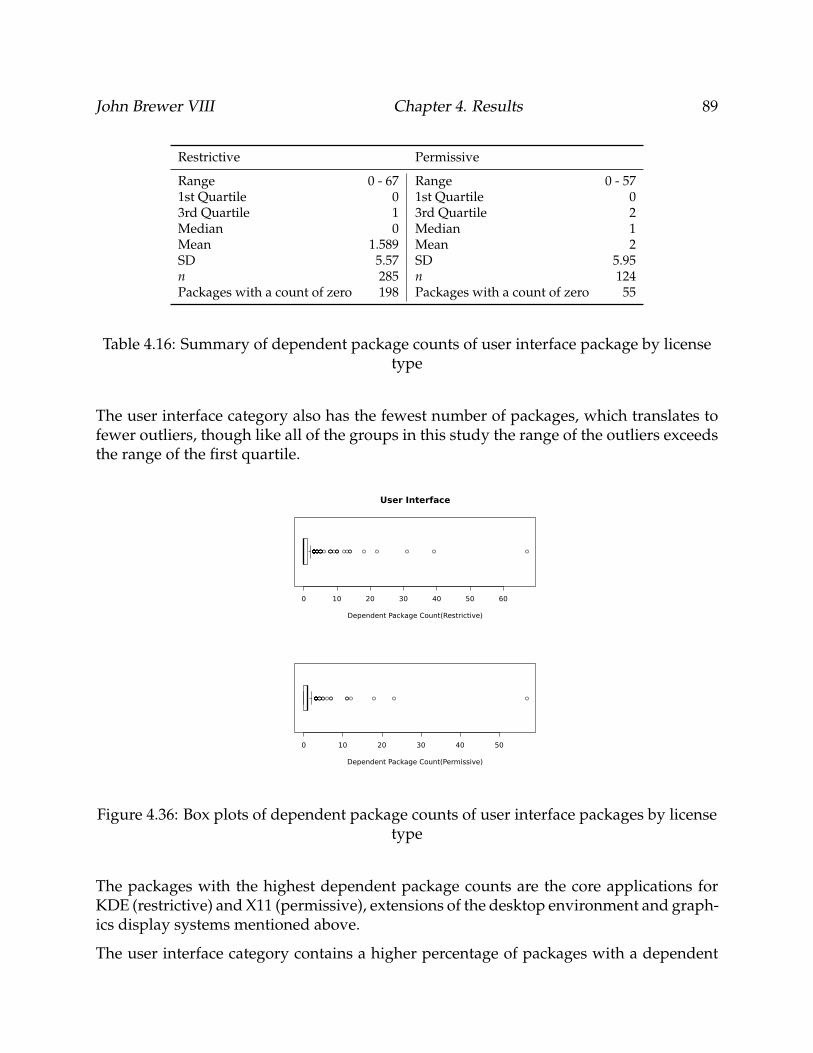
John Brewer VIII Chapter 4. Results 89
Restrictive Permissive
Range 0 - 67 Range 0 - 571st Quartile 0 1st Quartile 03rd Quartile 1 3rd Quartile 2Median 0 Median 1Mean 1.589 Mean 2SD 5.57 SD 5.95n 285 n 124Packages with a count of zero 198 Packages with a count of zero 55
Table 4.16: Summary of dependent package counts of user interface package by licensetype
The user interface category also has the fewest number of packages, which translates tofewer outliers, though like all of the groups in this study the range of the outliers exceedsthe range of the first quartile.
Figure 4.36: Box plots of dependent package counts of user interface packages by licensetype
The packages with the highest dependent package counts are the core applications forKDE (restrictive) and X11 (permissive), extensions of the desktop environment and graph-ics display systems mentioned above.
The user interface category contains a higher percentage of packages with a dependent
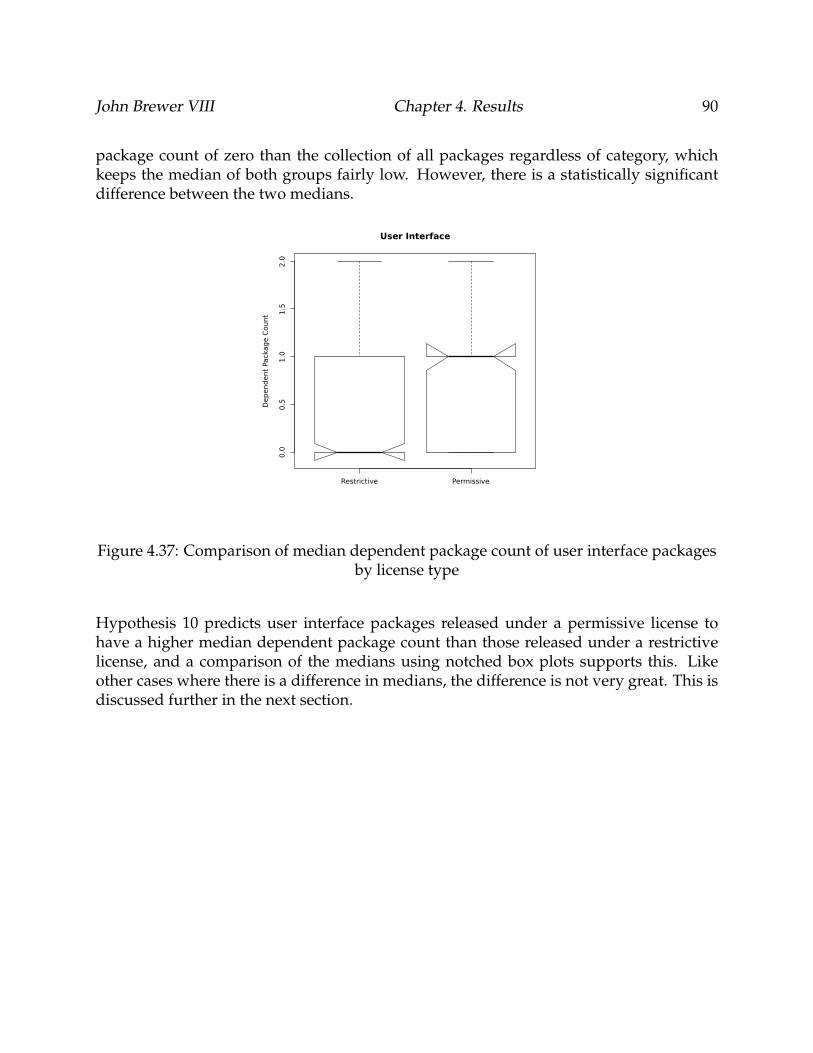
John Brewer VIII Chapter 4. Results 90
package count of zero than the collection of all packages regardless of category, whichkeeps the median of both groups fairly low. However, there is a statistically significantdifference between the two medians.
Figure 4.37: Comparison of median dependent package count of user interface packagesby license type
Hypothesis 10 predicts user interface packages released under a permissive license tohave a higher median dependent package count than those released under a restrictivelicense, and a comparison of the medians using notched box plots supports this. Likeother cases where there is a difference in medians, the difference is not very great. This isdiscussed further in the next section.
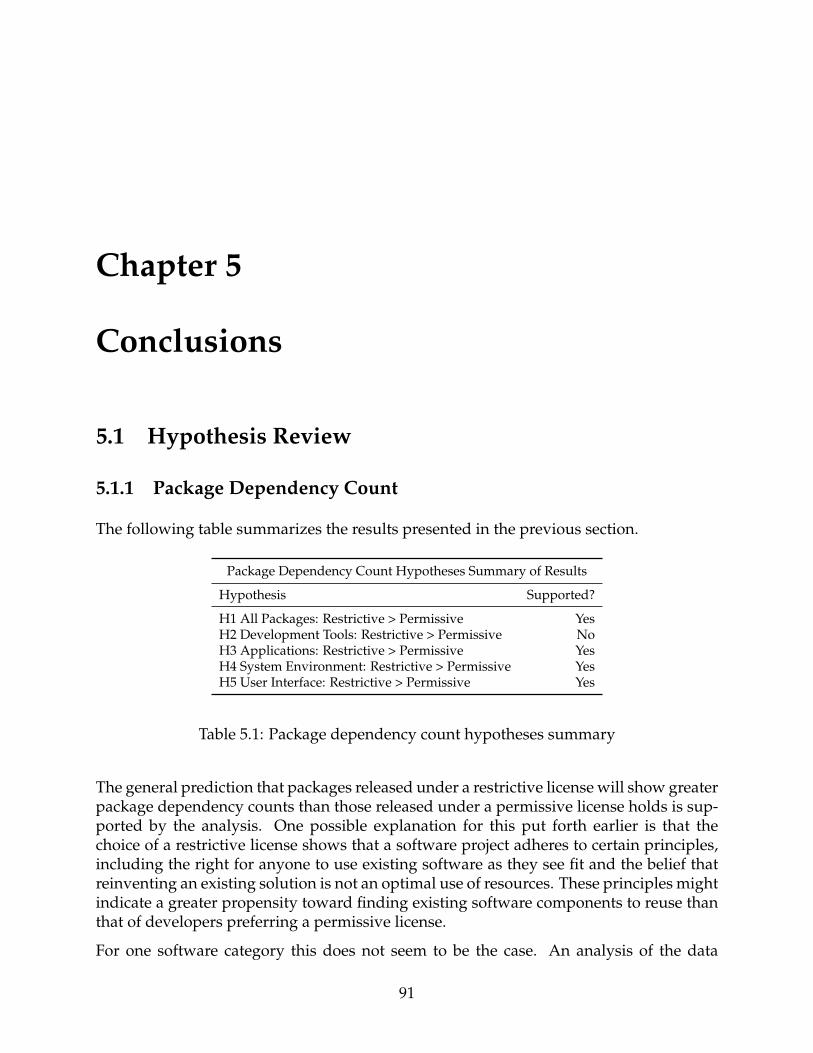
Chapter 5
Conclusions
5.1 Hypothesis Review
5.1.1 Package Dependency Count
The following table summarizes the results presented in the previous section.
Package Dependency Count Hypotheses Summary of Results
Hypothesis Supported?
H1 All Packages: Restrictive > Permissive YesH2 Development Tools: Restrictive > Permissive NoH3 Applications: Restrictive > Permissive YesH4 System Environment: Restrictive > Permissive YesH5 User Interface: Restrictive > Permissive Yes
Table 5.1: Package dependency count hypotheses summary
The general prediction that packages released under a restrictive license will show greaterpackage dependency counts than those released under a permissive license holds is sup-ported by the analysis. One possible explanation for this put forth earlier is that thechoice of a restrictive license shows that a software project adheres to certain principles,including the right for anyone to use existing software as they see fit and the belief thatreinventing an existing solution is not an optimal use of resources. These principles mightindicate a greater propensity toward finding existing software components to reuse thanthat of developers preferring a permissive license.
For one software category this does not seem to be the case. An analysis of the data
91
John Brewer VIII Chapter 5. Conclusions 92
did not support hypotheses 2, which predicted greater package dependency counts forsoftware development tools. This is a surprising result. The GNU project, which playedan important role at beginning of the open source movement, began its work by cre-ating development tools that could be used to create other software. These tools werereleased under the most restrictive licensing terms. It was expected that this would leadto a greater package dependency counts among packages in the software developmentcategory. However, the median package dependency count of both license types in thiscategory is the same. Programmers who write compilers, interpreters, debuggers, andother tools for programmers apparently have views on reusing existing components thatis not affected by their preference for a certain license.
While there are statistically significant differences between the median package depen-dency count by license type, perhaps the more important question is whether these dif-ferences are important. For two of the groups, all packages and system environmentpackages, the median package dependency count of restrictively licensed software is 6,and permissively licensed is 5. This is not a very big difference; in fact, if the differencewere any smaller, there would be no difference at all. The difference in medians for thesetwo groups it does not seem to be important. For all intents and purposes, license typemay not be an accurate predictor of how many packages are reused by packages withinthese two groups.
For some categories, the difference is much greater. Applications released under a restric-tive license have a median package dependency count of 8, as compared to a median of5 for their permissively licensed counterparts. The difference for the user interface cate-gory is the greatest, with medians of 14 for the restrictive group and 5 for the permissivegroup. For these two categories, choice of license type plays appears to play an importantrole in affecting a project’s inclination to reuse existing components.
What is it about packages in these two categories that cause them to show a greater differ-ences in package dependency counts than packages in the other two software categories?Software in these categories may lend themselves to higher package dependency countsbecause they are more likely to provide a range of functionality that can be implementedby multiple components. A word processor application, for example, might have a needfor components that provide lexical analysis, reading and writing data to a file, graphi-cal displays of text, and many others, whereas a system environment component (suchas the file i/o component used by the word processor) does not need to reuse as many.This certainly explains why these categories show package dependency counts. That thesoftware in these categories released under a restrictive license reuse the features of morepacakges supports the idea that developers preferring restrictive licenses place a greatervalue on the importance of reusing existing components.
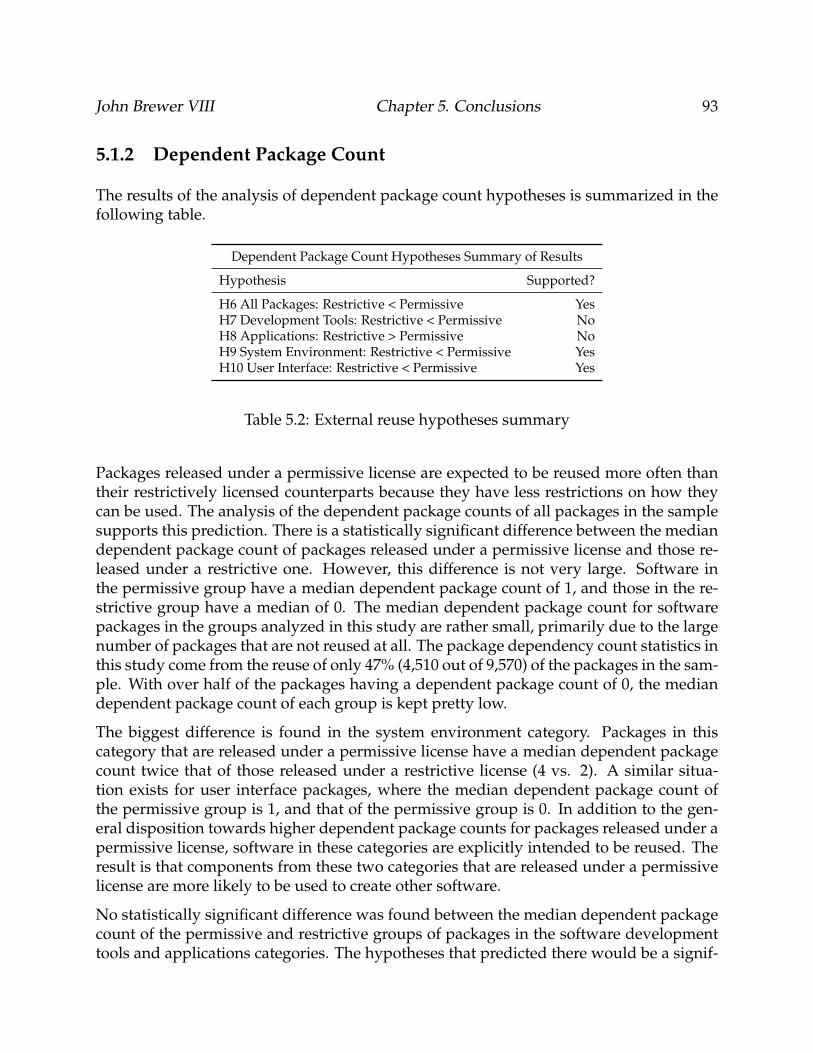
John Brewer VIII Chapter 5. Conclusions 93
5.1.2 Dependent Package Count
The results of the analysis of dependent package count hypotheses is summarized in thefollowing table.
Dependent Package Count Hypotheses Summary of Results
Hypothesis Supported?
H6 All Packages: Restrictive < Permissive YesH7 Development Tools: Restrictive < Permissive NoH8 Applications: Restrictive > Permissive NoH9 System Environment: Restrictive < Permissive YesH10 User Interface: Restrictive < Permissive Yes
Table 5.2: External reuse hypotheses summary
Packages released under a permissive license are expected to be reused more often thantheir restrictively licensed counterparts because they have less restrictions on how theycan be used. The analysis of the dependent package counts of all packages in the samplesupports this prediction. There is a statistically significant difference between the mediandependent package count of packages released under a permissive license and those re-leased under a restrictive one. However, this difference is not very large. Software inthe permissive group have a median dependent package count of 1, and those in the re-strictive group have a median of 0. The median dependent package count for softwarepackages in the groups analyzed in this study are rather small, primarily due to the largenumber of packages that are not reused at all. The package dependency count statistics inthis study come from the reuse of only 47% (4,510 out of 9,570) of the packages in the sam-ple. With over half of the packages having a dependent package count of 0, the mediandependent package count of each group is kept pretty low.
The biggest difference is found in the system environment category. Packages in thiscategory that are released under a permissive license have a median dependent packagecount twice that of those released under a restrictive license (4 vs. 2). A similar situa-tion exists for user interface packages, where the median dependent package count ofthe permissive group is 1, and that of the permissive group is 0. In addition to the gen-eral disposition towards higher dependent package counts for packages released under apermissive license, software in these categories are explicitly intended to be reused. Theresult is that components from these two categories that are released under a permissivelicense are more likely to be used to create other software.
No statistically significant difference was found between the median dependent packagecount of the permissive and restrictive groups of packages in the software developmenttools and applications categories. The hypotheses that predicted there would be a signif-
John Brewer VIII Chapter 5. Conclusions 94
icant difference did not take into account the impact of packages in these sets that werenot reused at all. Both categories have a median reuse of zero. That applications arenot reused all that often does make sense when you consider that they are often builtby reusing components from other categories are not necessarily intended to be reusedthemselves. Software development tools, on the other hand, are used to create new pro-grams, and were therefore expected to be reused. It turns out that software developmenttools may be used to create software, but do not become part of the new software and arenot reused directly.
5.1.3 Summary
The fundamental question considered in this study is whether or not license type affectssoftware reuse. Our conclusion is that yes, choice of license does play a part in predict-ing reuse patterns in open source development. Open source software released undera restrictive license is more likely to reuse external components than those released un-der permissive licenses. This is true for all software, with one noticeable exception. Thenumber of components reused by software intended to help programmers write new pro-grams is not affected by license choice.
In addition, packages that are released under a permissive license are more likely to bereused by another program than those released under a restrictive one. This holds truefor all software categories except for development tools and applications. It is interestingto note that comparing the package dependency and dependent packages count statisticspresents a paradox of sorts. Packages released under a restrictive license reuse more com-ponents than those released under a permissive one. However, the permissive packagesare the ones more likely to be reused.
This conclusion helps shed some light on whether there are tangible differences betweenlicenses. That license choice affects reuse supports the claim that license choice matters.The open source movement, to the extent that it can be defined, can use this information toevaluate the merits of various licenses in promoting the open source ideals. These resultsalso make suggestions to open source projects as to which license type they should usefor their products. Projects developing components intended for use by other projectsmay increase the appeal of their products by releasing them under a permissive license.The trade off to this, however, is that in doing so they lose some control over how thosecomponents are modified and redistributed. Hopefully the results of this study can helpthose making the decision of what license type to choose to pick the license best suitedfor achieving their objectives.
John Brewer VIII Chapter 5. Conclusions 95
5.2 Future Work
This study attempted to look at the big picture of how differences in software licensesaffect reuse. Subsequent studies that examine licenses and software categories in greaterdetail might be able to provide additional insight into this topic. For instance, do differ-ences between individual licenses, as opposed to license type, affect reuse? This studyassumed the answer to this question to be no, but this might not be the case. Not allresearchers categorize the LGPL as a restrictive license. Perhaps it would be worth re-peating this experiment for a third category to include weak-copyleft licenses such as theLGPL.
Also, how does license choice affect reuse of software in a particular domain? The fourcategories examined in this paper are fairly broad, and further research can confirm thetrends identified within are maintained for groups that are smaller and more rigidly de-fined. Examining reuse patterns within a domain would also allow for the identificationof multiple packages that provide the same functionality to determine whether the lack ofavailable alternatives is an intervening variable. Is a package’s dependency or dependentpackage count as high as it is because it is the only package that provides a certain setof capabilities? Given the open source movement’s preference for not solving the sameproblem twice, the lack of alternatives may prove to be a significant influence on packagereuse. glibc has the highest dependent package count of all the packages examined inthis study, but it is also the only implementation of the C standard library in the Fedorarepository.
To what extent do package dependency and dependent package counts vary by program-ming language? The packages in the Fedora repository are implemented in a wide varietyof languages, though the four software categories used in this study do not distinguishbetween them. Another for future work would be to repeat this analysis on groups ofpackages broken down by language or language type. This could determine if choice ofprogramming language has a bigger affect on reuse patterns than choice of license type.
This study also used a fairly broad definition of reuse; it took into account that a packagewas reused, but not how it was reused. A more specific metric would take into accounthow much functionality a component provides to the software that reuses it. Future re-search could then use this metric to refine the understanding of how license choice affectsreuse.
As discussed above, the results of this study may well be applicable to packages stored inthe repositories of other, non-Fedora, Linux distributions due to similarities in how soft-ware is bundled for distribution. Since most Linux distributions provide tools to resolvepackage dependencies it would not be too difficult to repeat this study using anotherrepository as a data source. This would serve to help verify the generalizability of theseresults.
John Brewer VIII Chapter 5. Conclusions 96
Determining the package dependency and dependent package counts for each packagemakes it possible to identify individual software packages that are particularly good atreusing components or being reused themselves. What is it about the outliers that causedthem to have such high package dependency and dependent package counts? An inter-esting direction for future research would be to perform in depth case studies of thesepackages to determine why this is so. What development methods do they have in com-mon? What caused the projects that produced these packages to adopt they license theydid? To what extent did their license choice reflect their ideas on how software shouldbe reused? Case studies of multiple packages can help identify trends in open sourcedevelopment and provide a greater understanding of how reuse occurs in open sourceprojects.
The methods used in this study can also be used to create a catalog of reusable compo-nents ranked by their dependent package count. Finding the right components to reusecan be a challenge, and can lead to increased defect rates and production delays if notdone effectively. The catalog could help programmers and software architects identifycomponents in a particular domain that have a history of being reused successfully byother projects. By examining these other projects, developers can get a sense of how thecomponent is being used, and be in a better position to determine if it applies to theirdesign. In the end, this can only help the open source development community continueto produce new and innovative software.
Chapter 6
Appendix
Fedora repositories store package information in multiple SQLite databases. SQLite isa relational database management system that stores a database in a single file. Fedorarepositories have a subdirectory named repodata that contain the databases for that repos-itory. These databases contain descriptive information for each package in the repository,as well as the dependency relationships between them. The primary database, which ap-pears in a compressed file named primary.sqlite.bz2, provided the data for this study. Acopy of this database was downloaded on March 3, 2012, from http://dl.fedoraproject.org/pub/fedora/linux/releases/16/Everything/x86_64/os/repodata/. A complete listof sites hosting mirrors of the Fedora repository, for all versions, can be found at http://mirrors.fedoraproject.org/publiclist/.
This appendix lists the queries used to generate the package dependency and dependentpackage counts analyzed above.
6.1 License Type Tables
To facilitate the grouping of packages according to license type, two tables were addedto the local copy of the primary database. These tables, named restrictive and permissive,contained the list of all the licenses used by packages within the repository that belongto either of the two license types. All subsequent queries joined against the two licensetables, which simplified the task of creating data sets for each license type.
6.1.1 Restrictive License Table Query
The table of restrictive licenses was created with this query:
97
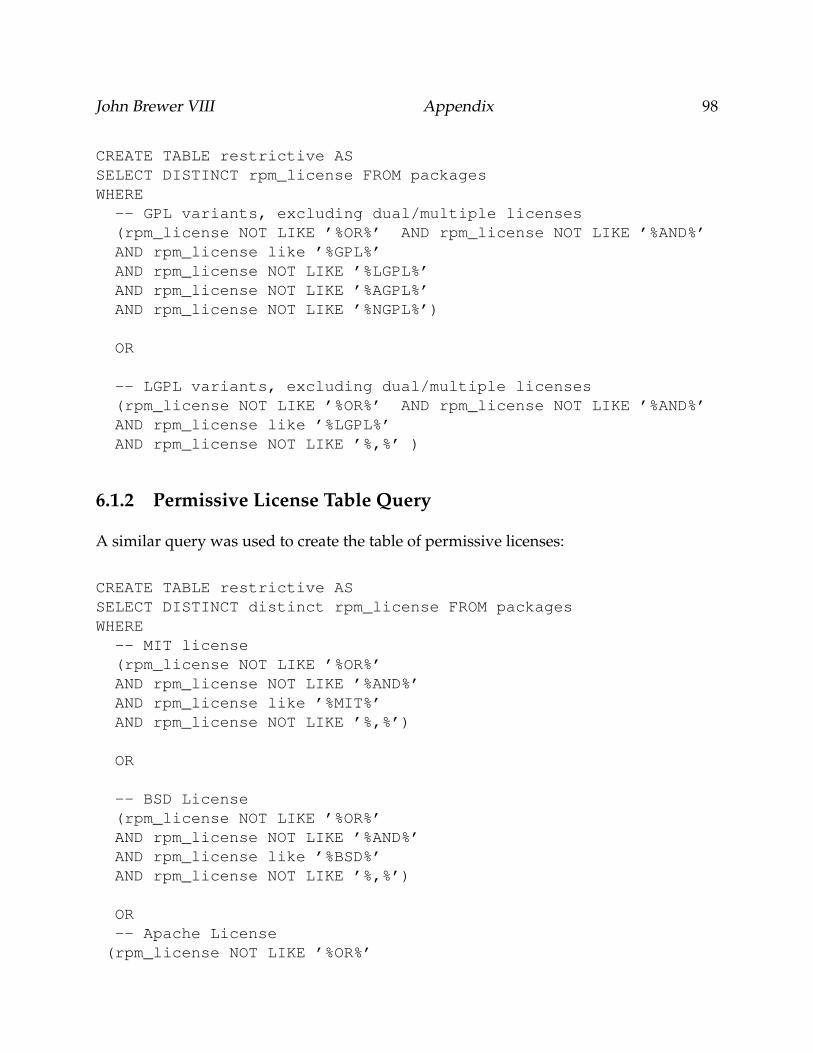
John Brewer VIII Appendix 98
CREATE TABLE restrictive ASSELECT DISTINCT rpm_license FROM packagesWHERE
-- GPL variants, excluding dual/multiple licenses(rpm_license NOT LIKE ’%OR%’ AND rpm_license NOT LIKE ’%AND%’AND rpm_license like ’%GPL%’AND rpm_license NOT LIKE ’%LGPL%’AND rpm_license NOT LIKE ’%AGPL%’AND rpm_license NOT LIKE ’%NGPL%’)
OR
-- LGPL variants, excluding dual/multiple licenses(rpm_license NOT LIKE ’%OR%’ AND rpm_license NOT LIKE ’%AND%’AND rpm_license like ’%LGPL%’AND rpm_license NOT LIKE ’%,%’ )
6.1.2 Permissive License Table Query
A similar query was used to create the table of permissive licenses:
CREATE TABLE restrictive ASSELECT DISTINCT distinct rpm_license FROM packagesWHERE
-- MIT license(rpm_license NOT LIKE ’%OR%’AND rpm_license NOT LIKE ’%AND%’AND rpm_license like ’%MIT%’AND rpm_license NOT LIKE ’%,%’)
OR
-- BSD License(rpm_license NOT LIKE ’%OR%’AND rpm_license NOT LIKE ’%AND%’AND rpm_license like ’%BSD%’AND rpm_license NOT LIKE ’%,%’)
OR-- Apache License(rpm_license NOT LIKE ’%OR%’
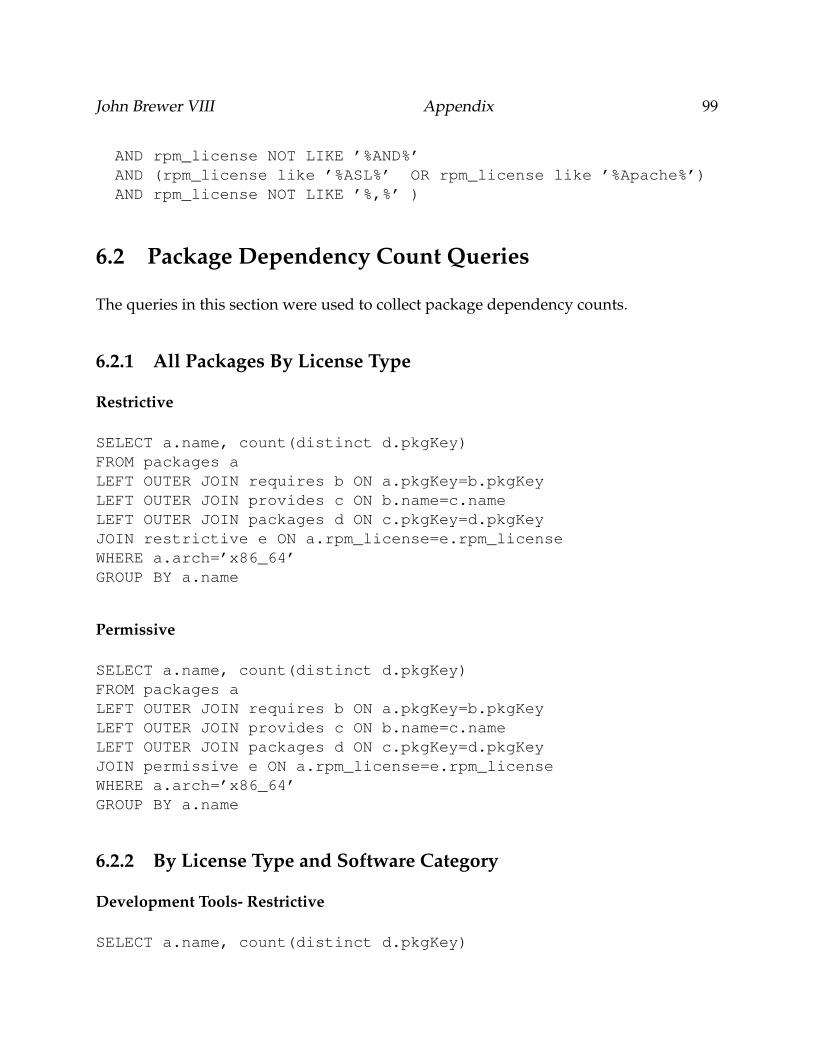
John Brewer VIII Appendix 99
AND rpm_license NOT LIKE ’%AND%’AND (rpm_license like ’%ASL%’ OR rpm_license like ’%Apache%’)AND rpm_license NOT LIKE ’%,%’ )
6.2 Package Dependency Count Queries
The queries in this section were used to collect package dependency counts.
6.2.1 All Packages By License Type
Restrictive
SELECT a.name, count(distinct d.pkgKey)FROM packages aLEFT OUTER JOIN requires b ON a.pkgKey=b.pkgKeyLEFT OUTER JOIN provides c ON b.name=c.nameLEFT OUTER JOIN packages d ON c.pkgKey=d.pkgKeyJOIN restrictive e ON a.rpm_license=e.rpm_licenseWHERE a.arch=’x86_64’GROUP BY a.name
Permissive
SELECT a.name, count(distinct d.pkgKey)FROM packages aLEFT OUTER JOIN requires b ON a.pkgKey=b.pkgKeyLEFT OUTER JOIN provides c ON b.name=c.nameLEFT OUTER JOIN packages d ON c.pkgKey=d.pkgKeyJOIN permissive e ON a.rpm_license=e.rpm_licenseWHERE a.arch=’x86_64’GROUP BY a.name
6.2.2 By License Type and Software Category
Development Tools- Restrictive
SELECT a.name, count(distinct d.pkgKey)
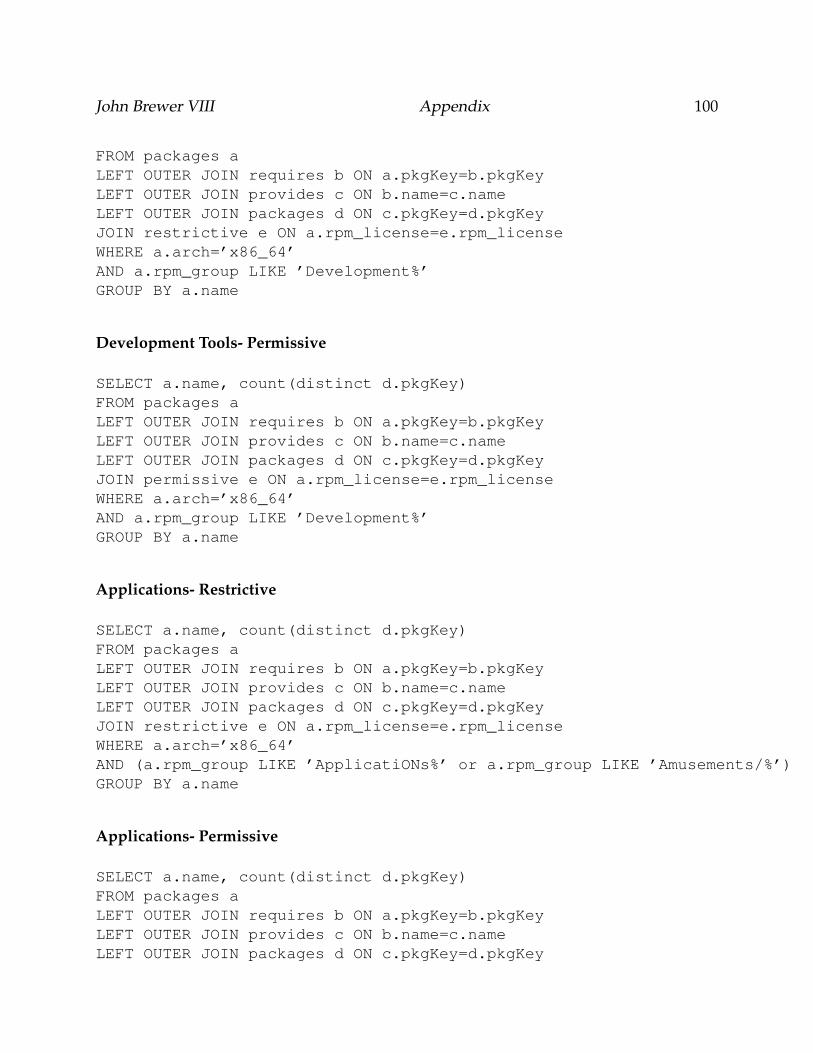
John Brewer VIII Appendix 100
FROM packages aLEFT OUTER JOIN requires b ON a.pkgKey=b.pkgKeyLEFT OUTER JOIN provides c ON b.name=c.nameLEFT OUTER JOIN packages d ON c.pkgKey=d.pkgKeyJOIN restrictive e ON a.rpm_license=e.rpm_licenseWHERE a.arch=’x86_64’AND a.rpm_group LIKE ’Development%’GROUP BY a.name
Development Tools- Permissive
SELECT a.name, count(distinct d.pkgKey)FROM packages aLEFT OUTER JOIN requires b ON a.pkgKey=b.pkgKeyLEFT OUTER JOIN provides c ON b.name=c.nameLEFT OUTER JOIN packages d ON c.pkgKey=d.pkgKeyJOIN permissive e ON a.rpm_license=e.rpm_licenseWHERE a.arch=’x86_64’AND a.rpm_group LIKE ’Development%’GROUP BY a.name
Applications- Restrictive
SELECT a.name, count(distinct d.pkgKey)FROM packages aLEFT OUTER JOIN requires b ON a.pkgKey=b.pkgKeyLEFT OUTER JOIN provides c ON b.name=c.nameLEFT OUTER JOIN packages d ON c.pkgKey=d.pkgKeyJOIN restrictive e ON a.rpm_license=e.rpm_licenseWHERE a.arch=’x86_64’AND (a.rpm_group LIKE ’ApplicatiONs%’ or a.rpm_group LIKE ’Amusements/%’)GROUP BY a.name
Applications- Permissive
SELECT a.name, count(distinct d.pkgKey)FROM packages aLEFT OUTER JOIN requires b ON a.pkgKey=b.pkgKeyLEFT OUTER JOIN provides c ON b.name=c.nameLEFT OUTER JOIN packages d ON c.pkgKey=d.pkgKey
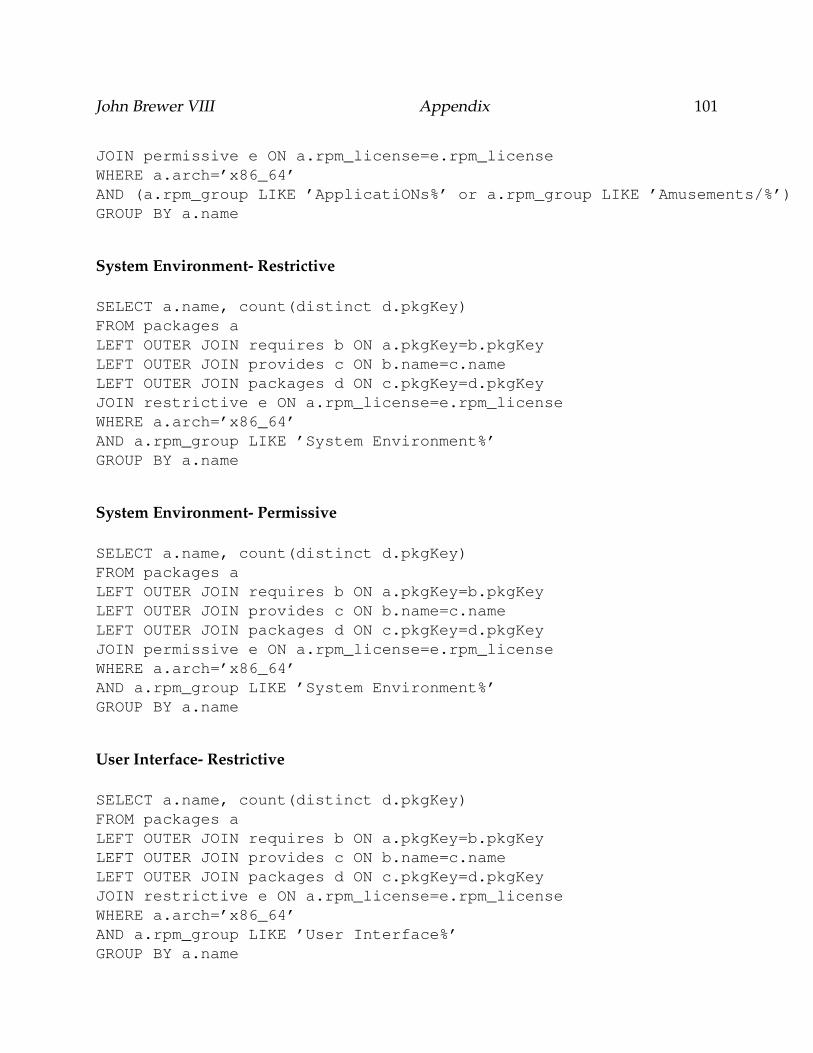
John Brewer VIII Appendix 101
JOIN permissive e ON a.rpm_license=e.rpm_licenseWHERE a.arch=’x86_64’AND (a.rpm_group LIKE ’ApplicatiONs%’ or a.rpm_group LIKE ’Amusements/%’)GROUP BY a.name
System Environment- Restrictive
SELECT a.name, count(distinct d.pkgKey)FROM packages aLEFT OUTER JOIN requires b ON a.pkgKey=b.pkgKeyLEFT OUTER JOIN provides c ON b.name=c.nameLEFT OUTER JOIN packages d ON c.pkgKey=d.pkgKeyJOIN restrictive e ON a.rpm_license=e.rpm_licenseWHERE a.arch=’x86_64’AND a.rpm_group LIKE ’System Environment%’GROUP BY a.name
System Environment- Permissive
SELECT a.name, count(distinct d.pkgKey)FROM packages aLEFT OUTER JOIN requires b ON a.pkgKey=b.pkgKeyLEFT OUTER JOIN provides c ON b.name=c.nameLEFT OUTER JOIN packages d ON c.pkgKey=d.pkgKeyJOIN permissive e ON a.rpm_license=e.rpm_licenseWHERE a.arch=’x86_64’AND a.rpm_group LIKE ’System Environment%’GROUP BY a.name
User Interface- Restrictive
SELECT a.name, count(distinct d.pkgKey)FROM packages aLEFT OUTER JOIN requires b ON a.pkgKey=b.pkgKeyLEFT OUTER JOIN provides c ON b.name=c.nameLEFT OUTER JOIN packages d ON c.pkgKey=d.pkgKeyJOIN restrictive e ON a.rpm_license=e.rpm_licenseWHERE a.arch=’x86_64’AND a.rpm_group LIKE ’User Interface%’GROUP BY a.name
John Brewer VIII Appendix 102
User Interface- Permissive
SELECT a.name, count(distinct d.pkgKey)FROM packages aLEFT OUTER JOIN requires b ON a.pkgKey=b.pkgKeyLEFT OUTER JOIN provides c ON b.name=c.nameLEFT OUTER JOIN packages d ON c.pkgKey=d.pkgKeyJOIN permissive e ON a.rpm_license=e.rpm_licenseWHERE a.arch=’x86_64’AND a.rpm_group LIKE ’User Interface%’GROUP BY a.name
6.3 Dependent Package Count Queries
The queries in this section were used to extract dependent package counts.
6.3.1 All Packages By License Type
Restrictive
SELECT c.name, count(distinct a.pkgKey) AS ’Reuse Count’FROM packages cJOIN provides b on b.pkgKey=c.pkgKeyLEFT OUTER JOIN requires a ON a.name=b.nameJOIN restrictive d ON c.rpm_license=d.rpm_licenseWHERE c.arch=’x86_64’GROUP BY c.name
6.3.2 All Packages By License Type
Permissive
SELECT c.name, count(distinct a.pkgKey) AS ’Reuse Count’FROM packages cJOIN provides b ON b.pkgKey=c.pkgKeyLEFT OUTER JOIN requires a ON a.name=b.nameJOIN permissive d ON c.rpm_license=d.rpm_licenseWHERE c.arch=’x86_64’
John Brewer VIII Appendix 103
GROUP BY c.name
6.3.3 By License Type and Software Category
Development Tools- Restrictive
SELECT c.name, count(distinct a.pkgKey) as ’Reuse Count’FROM packages cJOIN provides b ON b.pkgKey=c.pkgKeyLEFT OUTER JOIN requires a ON a.name=b.nameJOIN restrictive d ON c.rpm_license=d.rpm_licenseWHERE c.arch=’x86_64’AND c.rpm_group LIKE ’Development%’GROUP BY c.name
Development Tools- Permissive
SELECT c.name, count(distinct a.pkgKey) as ’Reuse Count’FROM packages cJOIN provides b ON b.pkgKey=c.pkgKeyLEFT OUTER JOIN requires a ON a.name=b.nameJOIN permissive d ON c.rpm_license=d.rpm_licenseWHERE c.arch=’x86_64’AND c.rpm_group LIKE ’Development%’GROUP BY c.name
Applications- Restrictive
SELECT c.name, count(distinct a.pkgKey) as ’Reuse Count’FROM packages cJOIN provides b ON b.pkgKey=c.pkgKeyLEFT OUTER JOIN requires a ON a.name=b.nameJOIN restrictive d ON c.rpm_license=d.rpm_licenseWHERE c.arch=’x86_64’AND (c.rpm_group LIKE ’Applications%’ or rpm_group LIKE ’Amusements/%’)GROUP BY c.name
John Brewer VIII Appendix 104
Applications- Permissive
SELECT c.name, count(distinct a.pkgKey) as ’Reuse Count’FROM packages cJOIN provides b ON b.pkgKey=c.pkgKeyLEFT OUTER JOIN requires a ON a.name=b.nameJOIN permissive d ON c.rpm_license=d.rpm_licenseWHERE c.arch=’x86_64’AND (c.rpm_group LIKE ’Applications%’ or rpm_group LIKE ’Amusements/%’)GROUP BY c.name
System Environment- Restrictive
SELECT c.name, count(distinct a.pkgKey) as ’Reuse Count’FROM packages cJOIN provides b ON b.pkgKey=c.pkgKeyLEFT OUTER JOIN requires a ON a.name=b.nameJOIN restrictive d ON c.rpm_license=d.rpm_licenseWHERE c.arch=’x86_64’AND c.rpm_group LIKE ’System Environment%’GROUP BY c.name
System Environment- Permissive
SELECT c.name, count(distinct a.pkgKey) as ’Reuse Count’FROM packages cJOIN provides b ON b.pkgKey=c.pkgKeyLEFT OUTER JOIN requires a ON a.name=b.nameJOIN permissive d ON c.rpm_license=d.rpm_licenseWHERE c.arch=’x86_64’AND c.rpm_group LIKE ’System EnvirONment%’GROUP BY c.name
User Interface- Restrictive
SELECT c.name, count(distinct a.pkgKey) as ’Reuse Count’FROM packages cJOIN provides b ON b.pkgKey=c.pkgKeyLEFT OUTER JOIN requires a ON a.name=b.nameJOIN restrictive d ON c.rpm_license=d.rpm_license
John Brewer VIII Appendix 105
WHERE c.arch=’x86_64’AND c.rpm_group LIKE ’User Interface%’GROUP BY c.name
User Interface- Permissive
SELECT c.name, count(distinct a.pkgKey) as ’Reuse Count’FROM packages cJOIN provides b ON b.pkgKey=c.pkgKeyLEFT OUTER JOIN requires a ON a.name=b.nameJOIN permissive d ON c.rpm_license=d.rpm_licenseWHERE c.arch=’x86_64’AND c.rpm_group LIKE ’User Interface%’GROUP BY c.name
Bibliography
[1] W. Frakes and C. Terry, “Software reuse: metrics and models,” ACM Computing Sur-veys (CSUR), vol. 28, no. 2, pp. 415–435, 1996.
[2] E. Raymond, “Homesteading the noosphere,” First Monday, vol. 3, no. 10, pp. 1–28,1998.
[3] A. Mockus, “Amassing and indexing a large sample of version control systems: To-wards the census of public source code history,” in Mining Software Repositories, 2009.MSR’09. 6th IEEE International Working Conference on, 2009, pp. 11–20.
[4] ——, “Large-scale code reuse in open source software,” in Emerging Trends in FLOSSResearch and Development, 2007. FLOSS’07. First International Workshop on, 2007, pp.7–7.
[5] S. Ramel, “Metrics of software reuse for free and open source software,” Centre deRecherche Public Henri Tudor.
[6] K. J. Stewart, A. P. Ammeter, and L. M. Maruping, “Impacts of license choice andorganizational sponsorship on user interest and development activity in open sourcesoftware projects.” Information Systems Research, vol. 17, no. 2, pp. 126–144, Jun. 2006.
[7] J. Colazo and Y. Fang, “Impact of license choice on open source software develop-ment activity,” Journal of the American Society for Information Science and Technology,vol. 60, no. 5, pp. 997–1011, May 2009.
[8] J. Lerner and J. Tirole, “The scope of open source licensing,” Journal of Law, Economics,and Organization, vol. 21, no. 1, pp. 20 –56, Apr. 2005.
[9] S. Levy, Hackers: Heroes of the Computer Revolution - 25th Anniversary Edition, anvupd ed. O’Reilly Media, May 2010.
[10] “Open sources: Voices from the open source revolution,”http://oreilly.com/openbook/opensources/book/index.html, Mar. 1999. [Online].Available: http://oreilly.com/openbook/opensources/book/index.html
106
John Brewer VIII Appendix 107
[11] S. Williams, Free as in Freedom: Richard Stallman’s Crusade for Free Software, first edi-tion ed. O’Reilly Media, Mar. 2002.
[12] R. Stallman et al., “The GNU manifesto,” Dr. Dobb’s Journal of Software Tools, vol. 10,no. 3, pp. 30–35, 1985.
[13] E. Raymond, “The cathedral and the bazaar,” Available in http://tuxedo. org/âLijesr/writings/cathedral-bazaar, 1998.
[14] M. Mustonen, “Copyleft: the economics of linux and other open source software,”Information Economics and Policy, vol. 15, no. 1, pp. 99–121, 2003.
[15] A. M. S. Laurent, Understanding Open Source and Free Software Licensing, annotated,first edition ed. O’Reilly Media, Aug. 2004.
[16] “Mission | open source initiative,” http://www.opensource.org/. [Online].Available: http://www.opensource.org/
[17] “The GNU general public license,” http://www.gnu.org/copyleft/gpl.html.[Online]. Available: http://www.gnu.org/copyleft/gpl.html
[18] “The GNU lesser general public license,” http://www.gnu.org/copyleft/lgpl.html.[Online]. Available: http://www.gnu.org/copyleft/lgpl.html
[19] “Apache license, version 2.0,” http://www.apache.org/licenses/LICENSE-2.0.html. [Online]. Available: http://www.apache.org/licenses/LICENSE-2.0.html
[20] “Open source initiative OSI - the BSD license,”http://www.opensource.org/licenses/bsd-license.php. [Online]. Available: http://www.opensource.org/licenses/bsd-license.php
[21] “Open source initiative OSI - the MIT license (MIT),”http://www.opensource.org/licenses/mit-license.php. [Online]. Available: http://www.opensource.org/licenses/mit-license.php
[22] J. Lindman, A. Paajanen, and M. Rossi, “Choosing an open source software license incommercial context: A managerial perspective,” in Software Engineering and AdvancedApplications, Euromicro Conference. Los Alamitos, CA, USA: IEEE Computer Society,2010, pp. 237–244.
[23] R. Sen, C. Subramaniam, and M. L. Nelson, “Determinants of the choice of opensource software license,” Journal of Management Information Systems, vol. 25, no. 3,pp. 207–240, Dec. 2008.
[24] J. Lerner and J. Tirole, “Some simple economics of open source,” Journal of IndustrialEconomics, pp. 197–234, 2002.
John Brewer VIII Appendix 108
[25] L. Gasser and W. Scacchi, “Towards a global research infrastructure for multidisci-plinary study of free/open source software development,” Open Source Development,Communities and Quality, pp. 143–158, 2008.
[26] M. Pizka, “Adaptation of large-scale open source software-an experience report,” inSoftware Maintenance and Reengineering, 2004. CSMR 2004. Proceedings. Eighth Euro-pean Conference on, 2004, pp. 147–153.
[27] A. Kritikos, G. Kakarontzas, and I. Stamelos, “A semi-automated process for opensource code reuse,” in 5th International Conference on Evaluation of Novel Approaches inSoftware Engineering (ENASE’10), 2010, pp. 24–25.
[28] J. Li, R. Conradi, O. Slyngstad, C. Bunse, U. Khan, M. Torchiano, and M. Morisio,“An empirical study on off-the-shelf component usage in industrial projects,” Prod-uct Focused Software Process Improvement, pp. 54–68, 2005.
[29] J. Li, R. Conradi, O. Slyngstad, C. Bunse, M. Torchiano, and M. Morisio, “An empir-ical study on decision making in off-the-shelf component-based development,” inProceedings of the 28th international conference on Software engineering, 2006, pp. 897–900.
[30] S. A. Ajila and D. Wu, “Empirical study of the effects of open source adoption onsoftware development economics,” Journal of Systems and Software, vol. 80, no. 9, pp.1517–1529, Sep. 2007. [Online]. Available: http://www.sciencedirect.com/science/article/pii/S0164121207000076
[31] R. Ananthanarayanan, V. Chenthamarakshan, H. Chu, P. Deshpande, R. Krishna-puram, and S. Mohammed, “Dependency analysis framework for software servicedelivery,” in Services Computing, 2009. SCC’09. IEEE International Conference on, 2009,pp. 89–96.
[32] W. Frakes and K. Kang, “Software reuse research: Status and future,” Software Engi-neering, IEEE Transactions on, vol. 31, no. 7, pp. 529–536, 2005.
[33] M. Carro, “The amos project: An approach to reusing open source code,” in Proceed-ings of the CBD, 2002, pp. 59–70.
[34] A. Pohthong and D. Budgen, “Reuse strategies in software development: an empiri-cal study,” Information and Software Technology, vol. 43, no. 9, pp. 561–575, 2001.
[35] P. Abate, R. Di Cosmo, J. Boender, and S. Zacchiroli, “Strong dependencies betweensoftware components,” in Proceedings of the 2009 3rd International Symposium on Em-pirical Software Engineering and Measurement, 2009, pp. 89–99.
[36] R. McGill, J. Tukey, and W. Larsen, “Variations of box plots,” American Statistician,pp. 12–16, 1978.