Embed Size (px)
Citation preview
NBER WORKING PAPER SERIES
THE EFFECTS OF OIL PRICE CHANGES ON THE INDUSTRY-LEVEL PRODUCTIONAND PRICES IN THE U.S. AND JAPAN
Ichiro FukunagaNaohisa Hirakata
Nao Sudo
Working Paper 15791http://www.nber.org/papers/w15791
NATIONAL BUREAU OF ECONOMIC RESEARCH1050 Massachusetts Avenue
Cambridge, MA 02138March 2010
This paper was prepared for the 20th Annual East Asia Seminar on Economics, Hong Kong, June26--27, 2009. We are grateful to our discussants, Francis Lui and Warwick McKibbin, the organizers,Takatoshi Ito and Andrew Rose, and other participants for helpful comments and discussions. Wewould also like to thank seminar participants at the Institute for Monetary and Economic Studies, Bankof Japan. Views expressed in this paper are those of the authors and do not necessarily reflect thoseof the Bank of Japan or the National Bureau of Economic Research.
NBER working papers are circulated for discussion and comment purposes. They have not been peer-reviewed or been subject to the review by the NBER Board of Directors that accompanies officialNBER publications.
© 2010 by Ichiro Fukunaga, Naohisa Hirakata, and Nao Sudo. All rights reserved. Short sections oftext, not to exceed two paragraphs, may be quoted without explicit permission provided that full credit,including © notice, is given to the source.
The Effects of Oil Price Changes on the Industry-Level Production and Prices in the U.S.and JapanIchiro Fukunaga, Naohisa Hirakata, and Nao SudoNBER Working Paper No. 15791March 2010JEL No. E30
ABSTRACT
In this paper, we decompose oil price changes into their component parts following Kilian (2009)and estimate the dynamic effects of each component on industry-level production and prices in theU.S. and Japan using identified VAR models. The way oil price changes affect each industry dependson what kind of underlying shock drives oil price changes as well as on industry characteristics. Unexpecteddisruptions of oil supply act mainly as negative supply shocks for oil-intensive industries and act mainlyas negative demand shocks for less oil-intensive industries. For most industries in the U.S., shocksto the global demand for all industrial commodities act mainly as positive demand shocks, and demandshocks that are specific to the global oil market act mainly as negative supply shocks. In Japan, theoil-specific demand shocks as well as the global demand shocks act mainly as positive demand shocksfor many industries.
Ichiro FukunagaBank of Japan2-1-1 Nihonbashi-HongokuchoChuo-ku, Tokyo [email protected]
Naohisa HirakataBank of Japan2-1-1 Nihonbashi-HongokuchoChuo-ku, Tokyo [email protected]
Nao SudoBank of Japan2-1-1 Nihonbashi-HongokuchoChuo-ku, Tokyo [email protected]
1 Introduction
There is a large body of empirical literature on the effects of oil price changes
on the U.S. economy; their magnitudes, transmission mechanisms, and his-
torical changes have been investigated. However, the underlying causes of oil
price changes have not been seriously considered until recently. The way oil
price changes affect the economy may be very different depending on where
the changes fundamentally come from. In particular, global factors such
as rapid growth in emerging economies and the integration of global sup-
ply chains seem to have become increasingly important for oil price changes
themselves and their transmission mechanisms.
Moreover, much remains unknown about the effects of oil price changes in
countries other than the U.S. Some recent empirical international compara-
tive studies show that the magnitudes of the effects of oil price changes differ
greatly even among oil-importing countries. In particular, Japan is different
in the sense that oil price increases have little, or even a positive, effect on
real economic activity.1
In this paper, we investigate the underlying causes of oil price changes
and their transmission mechanisms in the U.S. and Japan. We decompose oil
price changes into their component parts and estimate the dynamic effects
of each component on industry-level production and prices in both countries
using identified VAR models. Our models incorporate two major extensions
to the standard models used in previous studies. First, instead of treating
oil price changes as exogenous shocks, we identify the underlying demand
and supply shocks to the global oil market. Second, we use industry-level
data as well as aggregate data to investigate the transmission mechanisms
of oil price changes in more detail.2 Our models have three-block structures
comprising the global oil market block, the domestic macroeconomy block,
1Recent studies, including those of Blanchard and Galı (2007) and Jimenez-Rodrıguezand Sanchez (2004), show that the effects of oil price changes in Japan are exceptionallydifferent from other oil-importing countries.
2We focus on manufacturing industries for which lengthy periods of monthly time seriesdata are available. The quarterly GDP data that include nonmanufacturing industries arenot compatible with the short-run restrictions on our structural VAR models.
1
and the domestic industry block. To our knowledge, this is the first attempt
to investigate the effects of structural shocks to the global oil market on
industry-level production and prices.3
In identifying structural shocks to the global oil market, we closely follow
Kilian (2009) who proposes a structural decomposition of the real price of
oil into the following three components: oil supply shocks; shocks to the
global demand for all industrial commodities (global demand shocks);4 and
demand shocks that are specific to the global oil market (oil-specific demand
shocks). These three structural shocks that all tend to raise the oil price have
very different effects on domestic economic activity. While an unexpected
disruption of oil supply and an unexpected increase in oil-specific demand
tend to reduce domestic industrial production, an unexpected increase in
global demand raises domestic production. One of the main reasons why
the surge in oil prices from 2002 seems to have had a smaller effect on real
economic activity than did the oil price increases of the 1970s is that the
recent oil price surge and economic expansion were simultaneously driven by
the global demand shocks.5
Examining the industry-level effects of oil price changes facilitates under-
standing of their transmission mechanisms. Lee and Ni (2002) estimate the
effects of exogenous oil price shocks using U.S. industry-level data and find
that oil price shocks act mainly as supply shocks for oil-intensive industries,
such as petroleum refineries, and act mainly as demand shocks for many other
3Kilian and Park (2009) briefly analyze the effects of structural shocks to the global oilmarket on industry-level stock returns using a two-block VAR model.
4Kilian (2009) refers to this component as an “aggregate demand shock.” We do notuse this term because it can be confused with domestic aggregate shocks in our model.
5Blanchard and Galı (2007) offer other explanations for the smaller effects: the smallershare of oil in production; greater labor market flexibility; and improvements in monetarypolicy. Rather than consider these structural changes, we focus on changes in the natureof the shocks to the global oil market. As mentioned in the appendix, estimating ourmodels for shorter sample periods does not greatly change most of the impulse responsesto the identified shocks, except those to the oil supply shocks. Hirakata and Sudo (2009)point out that reduced oil supply variation and the associated correlation with total factorproductivity may be more important than structural changes for explaining the smallereffects of oil price changes on real economic activity.
2
industries.6 They distinguish between demand and supply shocks depending
on whether production and prices move in the same or opposite directions
in response to the shocks. Our estimation results for the domestic industry
block reveal that whether oil price changes act as supply shocks or demand
shocks for each industry depends on what kind of underlying shock drives
the oil price changes, as well as on industry characteristics such as oil inten-
sity. For most industries in the U.S., the global demand shocks act mainly
as positive demand shocks, and the oil-specific demand shocks act mainly as
negative supply shocks.7 The oil supply shocks act mainly as negative supply
shocks for oil-intensive industries and act mainly as negative demand shocks
for less oil-intensive industries, as Lee and Ni (2002) found for exogenous oil
price shocks.
Comparing the U.S. and Japan also enhances our understanding of the
transmission mechanisms of oil price changes. In Japan, relative to the U.S.,
the oil supply shock has weaker negative or statistically insignificant effects,
the global demand shock has stronger positive effects, and most importantly,
the oil-specific demand shock has positive rather than negative effects on the
production of many industries. These findings seem to confirm the results
of recent studies showing that the effects of oil price increases on Japan’s
economy are small or even positive and very different from those of other oil-
importing countries. The positive response of production to the oil-specific
demand shock might be the result of global demand shifts, especially in
automobiles, toward more oil-efficient products made in Japan. In this sense,
unlike in the U.S., the oil-specific demand shocks act mainly as demand
shocks rather than supply shocks for many industries in Japan.
6Lee and Ni (2002) use Hamilton’s (1996) “net oil price increase” as an oil price variable.Hooker (1996), in his reply to Hamilton (1996), casts doubt on the theoretical and empiricalvalidity of using this variable to represent oil price shocks to the macroeconomy and arguesthat the use of cross-sectional data on industries, regions, or countries is required for abetter understanding of the effects of oil price changes.
7The global demand shocks and the oil-specific demand shocks are demand shocks tothe global oil market and do not necessarily act as demand shocks to domestic aggregateor industrial markets. For instance, the global demand shocks may include non-oil sectorproductivity shocks that act as supply shocks to oil-importing countries’ domestic markets.
3
The remainder of the paper is organized as follows. Section 2 describes
our empirical framework and the identified structural shocks to the global
oil market. In Section 3, we briefly discuss the estimation results for the
domestic macroeconomy blocks for the U.S. and Japan. Section 4 reports
the estimation results for the domestic industry blocks of both countries for
each industry. In Section 5, we briefly survey the transmission mechanisms
of oil price changes and interpret our estimation results in more detail. We
also consider the background of the differences between the results for the
U.S. and Japan. Section 6 concludes. Appendix summarizes the estimation
results under several alternative assumptions and specifications of the model
to check the robustness of our main results.
2 Empirical Framework
2.1 The Structural VAR Model
Our VAR models comprise the global oil market block, the domestic macroe-
conomy block, and the domestic industry block. Following Lee and Ni (2002),
we impose block recursive restrictions so that the identified shocks to the
global oil market are the same for each country and the identified macroe-
conomic shocks are the same for each industry. In other words, domestic
variables do not affect global oil market variables, and industry-level vari-
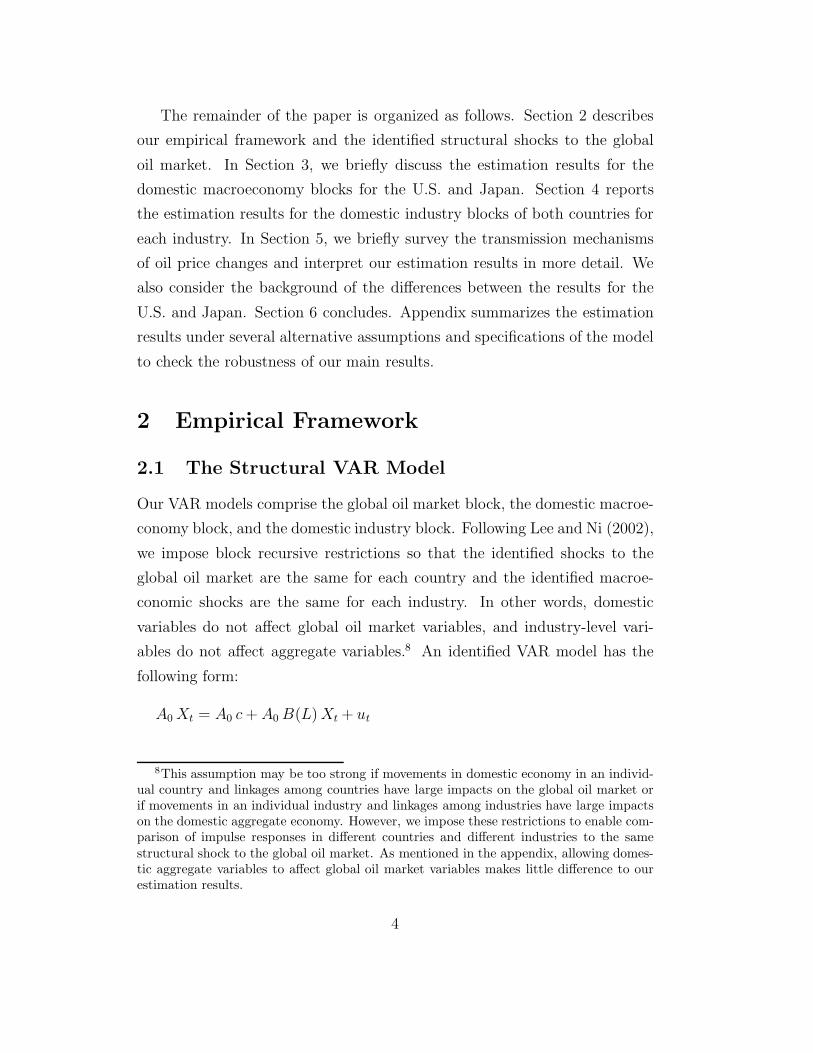
ables do not affect aggregate variables.8 An identified VAR model has the
following form:
A0 Xt = A0 c + A0 B(L) Xt + ut
8This assumption may be too strong if movements in domestic economy in an individ-ual country and linkages among countries have large impacts on the global oil market orif movements in an individual industry and linkages among industries have large impactson the domestic aggregate economy. However, we impose these restrictions to enable com-parison of impulse responses in different countries and different industries to the samestructural shock to the global oil market. As mentioned in the appendix, allowing domes-tic aggregate variables to affect global oil market variables makes little difference to ourestimation results.
4
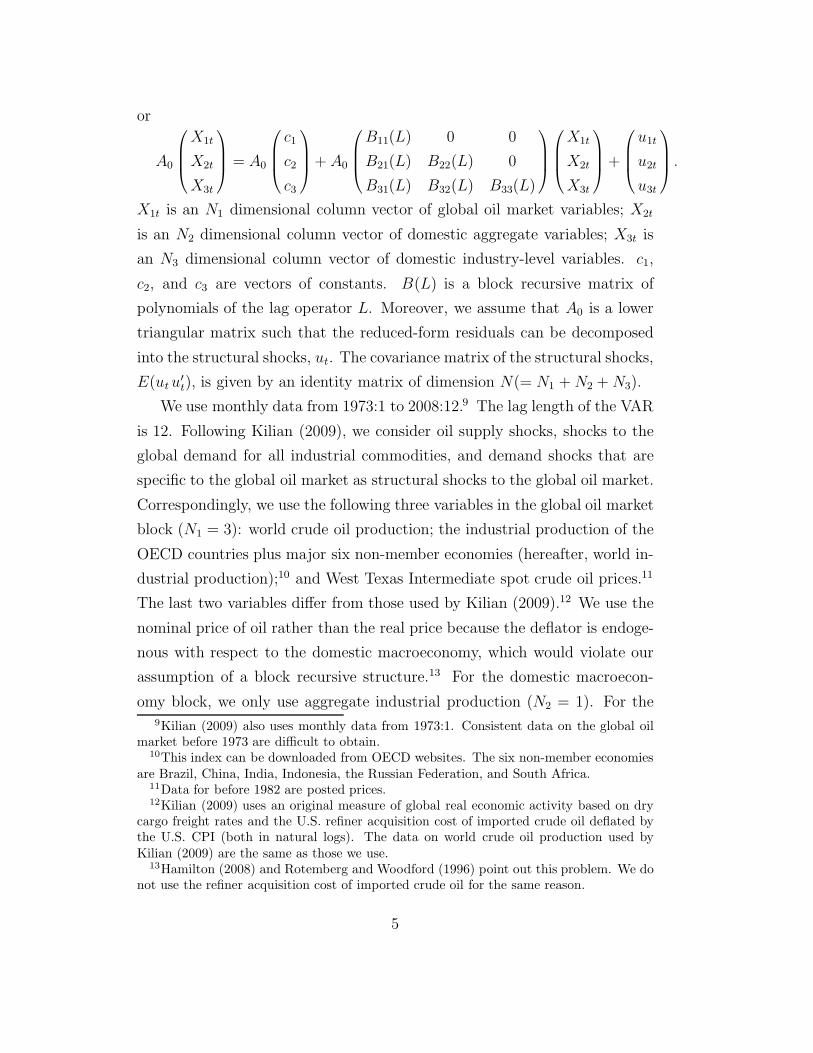
or
A0
X1t
X2t
X3t
= A0
c1
c2
c3
+ A0
B11(L) 0 0
B21(L) B22(L) 0
B31(L) B32(L) B33(L)
X1t
X2t
X3t
+
u1t
u2t
u3t
.
X1t is an N1 dimensional column vector of global oil market variables; X2t
is an N2 dimensional column vector of domestic aggregate variables; X3t is
an N3 dimensional column vector of domestic industry-level variables. c1,
c2, and c3 are vectors of constants. B(L) is a block recursive matrix of
polynomials of the lag operator L. Moreover, we assume that A0 is a lower
triangular matrix such that the reduced-form residuals can be decomposed
into the structural shocks, ut. The covariance matrix of the structural shocks,
E(ut u′
t), is given by an identity matrix of dimension N(= N1 + N2 + N3).
We use monthly data from 1973:1 to 2008:12.9 The lag length of the VAR
is 12. Following Kilian (2009), we consider oil supply shocks, shocks to the
global demand for all industrial commodities, and demand shocks that are
specific to the global oil market as structural shocks to the global oil market.
Correspondingly, we use the following three variables in the global oil market
block (N1 = 3): world crude oil production; the industrial production of the
OECD countries plus major six non-member economies (hereafter, world in-
dustrial production);10 and West Texas Intermediate spot crude oil prices.11
The last two variables differ from those used by Kilian (2009).12 We use the
nominal price of oil rather than the real price because the deflator is endoge-
nous with respect to the domestic macroeconomy, which would violate our
assumption of a block recursive structure.13 For the domestic macroecon-
omy block, we only use aggregate industrial production (N2 = 1). For the9Kilian (2009) also uses monthly data from 1973:1. Consistent data on the global oil
market before 1973 are difficult to obtain.10This index can be downloaded from OECD websites. The six non-member economies
are Brazil, China, India, Indonesia, the Russian Federation, and South Africa.11Data for before 1982 are posted prices.12Kilian (2009) uses an original measure of global real economic activity based on dry
cargo freight rates and the U.S. refiner acquisition cost of imported crude oil deflated bythe U.S. CPI (both in natural logs). The data on world crude oil production used byKilian (2009) are the same as those we use.
13Hamilton (2008) and Rotemberg and Woodford (1996) point out this problem. We donot use the refiner acquisition cost of imported crude oil for the same reason.
5
domestic industry block, we use industrial production and producer prices
(N3 = 2).14 We take first differences in the logs of all variables. The data
on industrial production in each block and producer prices are seasonally
adjusted. The ordering of the variables in the VAR is as described above.15
The reduced form VAR is estimated consistently by the method of ordinary
least squares.
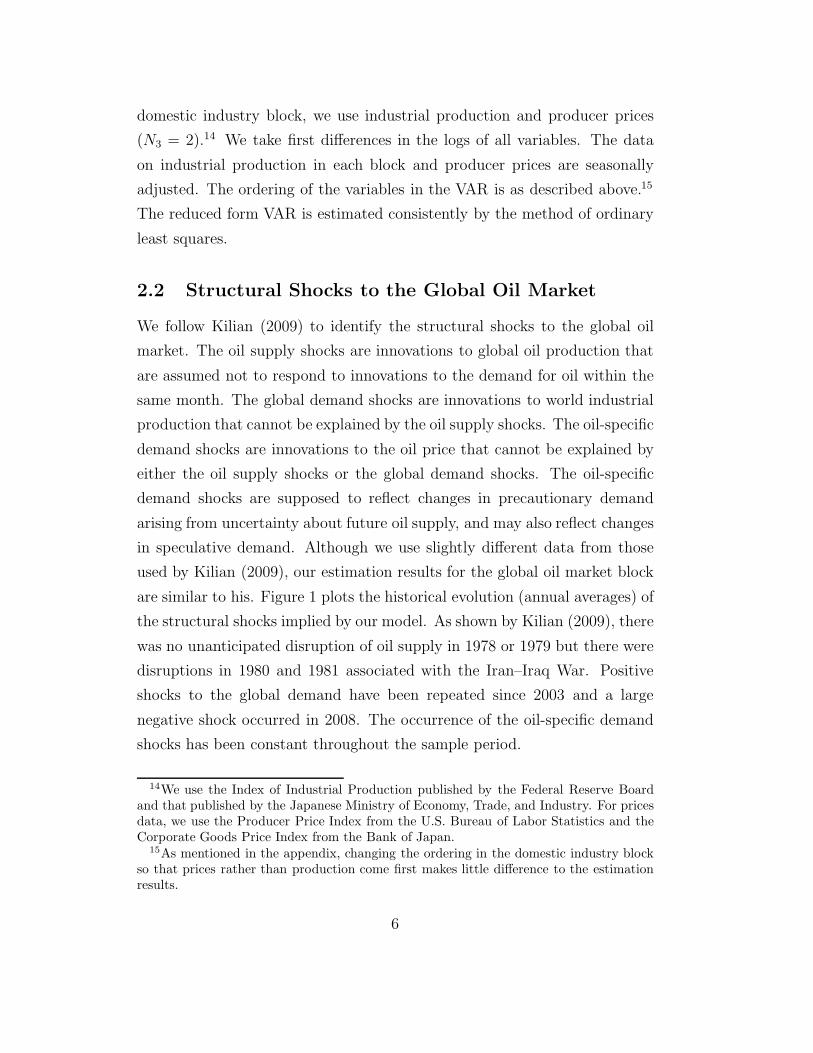
2.2 Structural Shocks to the Global Oil Market
We follow Kilian (2009) to identify the structural shocks to the global oil
market. The oil supply shocks are innovations to global oil production that
are assumed not to respond to innovations to the demand for oil within the
same month. The global demand shocks are innovations to world industrial
production that cannot be explained by the oil supply shocks. The oil-specific
demand shocks are innovations to the oil price that cannot be explained by
either the oil supply shocks or the global demand shocks. The oil-specific
demand shocks are supposed to reflect changes in precautionary demand
arising from uncertainty about future oil supply, and may also reflect changes
in speculative demand. Although we use slightly different data from those
used by Kilian (2009), our estimation results for the global oil market block
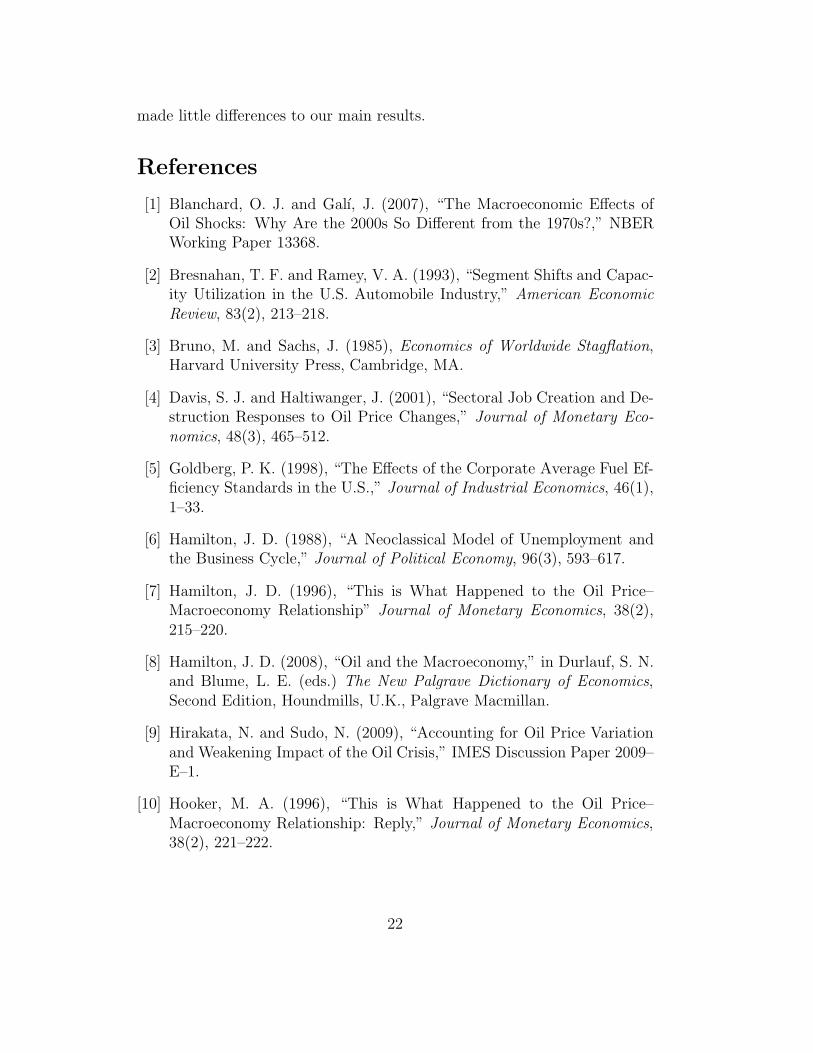
are similar to his. Figure 1 plots the historical evolution (annual averages) of
the structural shocks implied by our model. As shown by Kilian (2009), there
was no unanticipated disruption of oil supply in 1978 or 1979 but there were
disruptions in 1980 and 1981 associated with the Iran–Iraq War. Positive
shocks to the global demand have been repeated since 2003 and a large
negative shock occurred in 2008. The occurrence of the oil-specific demand
shocks has been constant throughout the sample period.
14We use the Index of Industrial Production published by the Federal Reserve Boardand that published by the Japanese Ministry of Economy, Trade, and Industry. For pricesdata, we use the Producer Price Index from the U.S. Bureau of Labor Statistics and theCorporate Goods Price Index from the Bank of Japan.
15As mentioned in the appendix, changing the ordering in the domestic industry blockso that prices rather than production come first makes little difference to the estimationresults.
6
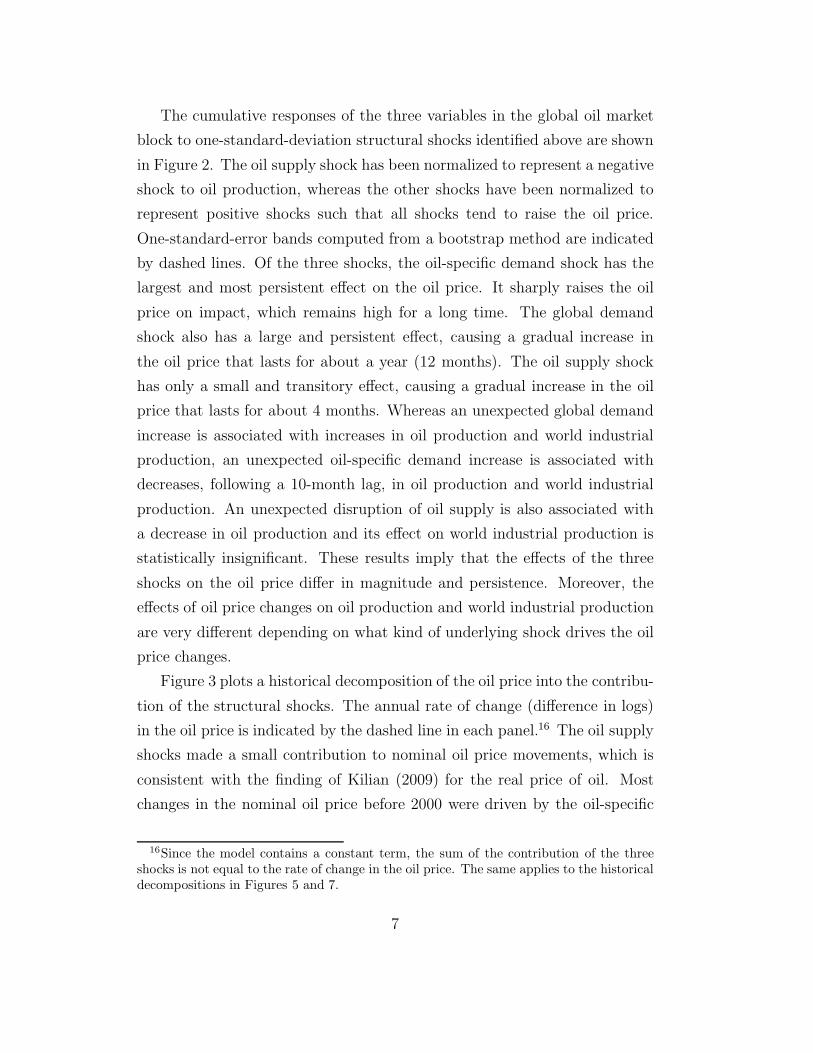
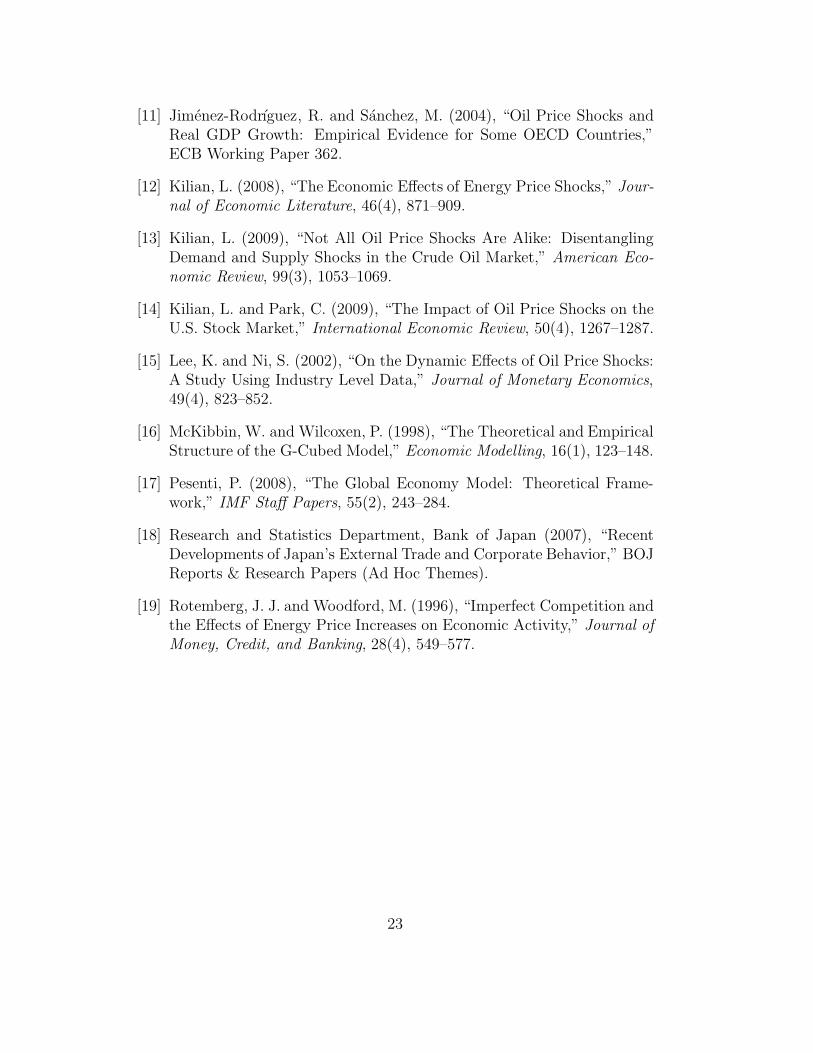
The cumulative responses of the three variables in the global oil market
block to one-standard-deviation structural shocks identified above are shown
in Figure 2. The oil supply shock has been normalized to represent a negative
shock to oil production, whereas the other shocks have been normalized to
represent positive shocks such that all shocks tend to raise the oil price.
One-standard-error bands computed from a bootstrap method are indicated
by dashed lines. Of the three shocks, the oil-specific demand shock has the
largest and most persistent effect on the oil price. It sharply raises the oil
price on impact, which remains high for a long time. The global demand
shock also has a large and persistent effect, causing a gradual increase in
the oil price that lasts for about a year (12 months). The oil supply shock
has only a small and transitory effect, causing a gradual increase in the oil
price that lasts for about 4 months. Whereas an unexpected global demand
increase is associated with increases in oil production and world industrial
production, an unexpected oil-specific demand increase is associated with
decreases, following a 10-month lag, in oil production and world industrial
production. An unexpected disruption of oil supply is also associated with
a decrease in oil production and its effect on world industrial production is
statistically insignificant. These results imply that the effects of the three
shocks on the oil price differ in magnitude and persistence. Moreover, the
effects of oil price changes on oil production and world industrial production
are very different depending on what kind of underlying shock drives the oil
price changes.
Figure 3 plots a historical decomposition of the oil price into the contribu-
tion of the structural shocks. The annual rate of change (difference in logs)
in the oil price is indicated by the dashed line in each panel.16 The oil supply
shocks made a small contribution to nominal oil price movements, which is
consistent with the finding of Kilian (2009) for the real price of oil. Most
changes in the nominal oil price before 2000 were driven by the oil-specific
16Since the model contains a constant term, the sum of the contribution of the threeshocks is not equal to the rate of change in the oil price. The same applies to the historicaldecompositions in Figures 5 and 7.
7
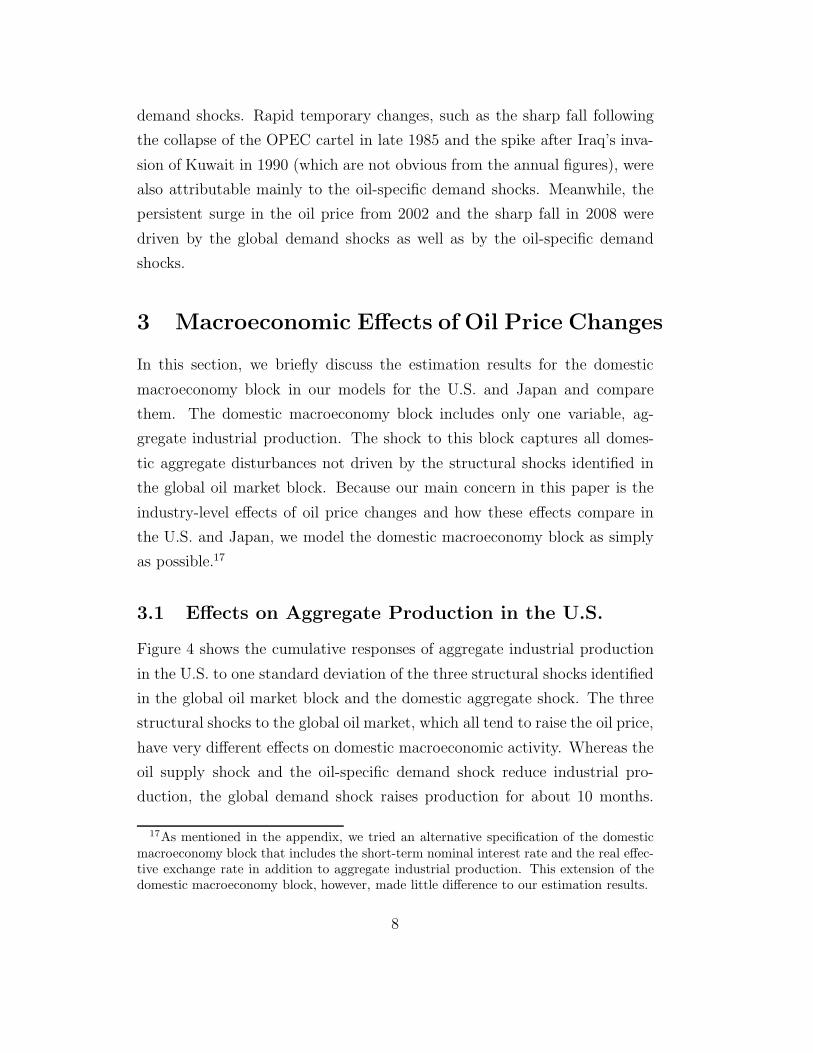
demand shocks. Rapid temporary changes, such as the sharp fall following
the collapse of the OPEC cartel in late 1985 and the spike after Iraq’s inva-
sion of Kuwait in 1990 (which are not obvious from the annual figures), were
also attributable mainly to the oil-specific demand shocks. Meanwhile, the
persistent surge in the oil price from 2002 and the sharp fall in 2008 were
driven by the global demand shocks as well as by the oil-specific demand
shocks.
3 Macroeconomic Effects of Oil Price Changes
In this section, we briefly discuss the estimation results for the domestic
macroeconomy block in our models for the U.S. and Japan and compare
them. The domestic macroeconomy block includes only one variable, ag-
gregate industrial production. The shock to this block captures all domes-
tic aggregate disturbances not driven by the structural shocks identified in
the global oil market block. Because our main concern in this paper is the
industry-level effects of oil price changes and how these effects compare in
the U.S. and Japan, we model the domestic macroeconomy block as simply
as possible.17
3.1 Effects on Aggregate Production in the U.S.
Figure 4 shows the cumulative responses of aggregate industrial production
in the U.S. to one standard deviation of the three structural shocks identified
in the global oil market block and the domestic aggregate shock. The three
structural shocks to the global oil market, which all tend to raise the oil price,
have very different effects on domestic macroeconomic activity. Whereas the
oil supply shock and the oil-specific demand shock reduce industrial pro-
duction, the global demand shock raises production for about 10 months.
17As mentioned in the appendix, we tried an alternative specification of the domesticmacroeconomy block that includes the short-term nominal interest rate and the real effec-tive exchange rate in addition to aggregate industrial production. This extension of thedomestic macroeconomy block, however, made little difference to our estimation results.
8
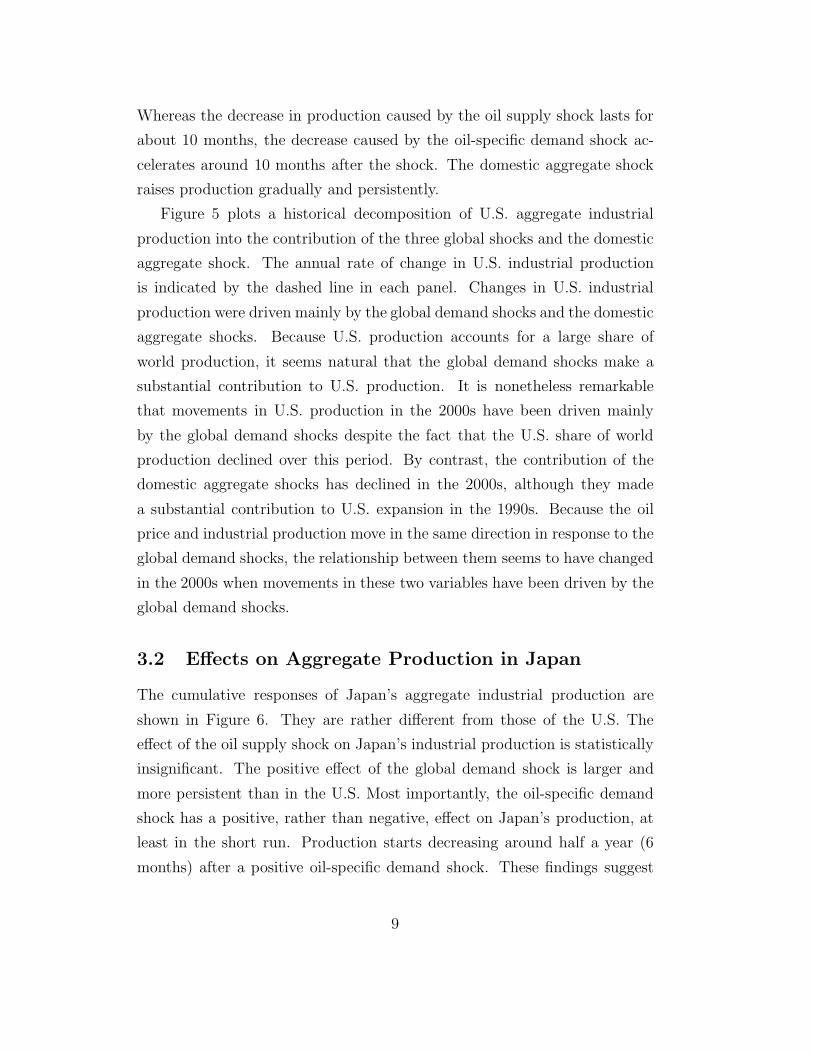
Whereas the decrease in production caused by the oil supply shock lasts for
about 10 months, the decrease caused by the oil-specific demand shock ac-
celerates around 10 months after the shock. The domestic aggregate shock
raises production gradually and persistently.
Figure 5 plots a historical decomposition of U.S. aggregate industrial
production into the contribution of the three global shocks and the domestic
aggregate shock. The annual rate of change in U.S. industrial production
is indicated by the dashed line in each panel. Changes in U.S. industrial
production were driven mainly by the global demand shocks and the domestic
aggregate shocks. Because U.S. production accounts for a large share of
world production, it seems natural that the global demand shocks make a
substantial contribution to U.S. production. It is nonetheless remarkable
that movements in U.S. production in the 2000s have been driven mainly
by the global demand shocks despite the fact that the U.S. share of world
production declined over this period. By contrast, the contribution of the
domestic aggregate shocks has declined in the 2000s, although they made
a substantial contribution to U.S. expansion in the 1990s. Because the oil
price and industrial production move in the same direction in response to the
global demand shocks, the relationship between them seems to have changed
in the 2000s when movements in these two variables have been driven by the
global demand shocks.
3.2 Effects on Aggregate Production in Japan
The cumulative responses of Japan’s aggregate industrial production are
shown in Figure 6. They are rather different from those of the U.S. The
effect of the oil supply shock on Japan’s industrial production is statistically
insignificant. The positive effect of the global demand shock is larger and
more persistent than in the U.S. Most importantly, the oil-specific demand
shock has a positive, rather than negative, effect on Japan’s production, at
least in the short run. Production starts decreasing around half a year (6
months) after a positive oil-specific demand shock. These findings suggest
9
that, unlike in other oil-importing countries including the U.S., the effects
of oil price increases in Japan are either negligibly negative or even positive.
The effect of the domestic aggregate shock in Japan is larger than in the U.S.
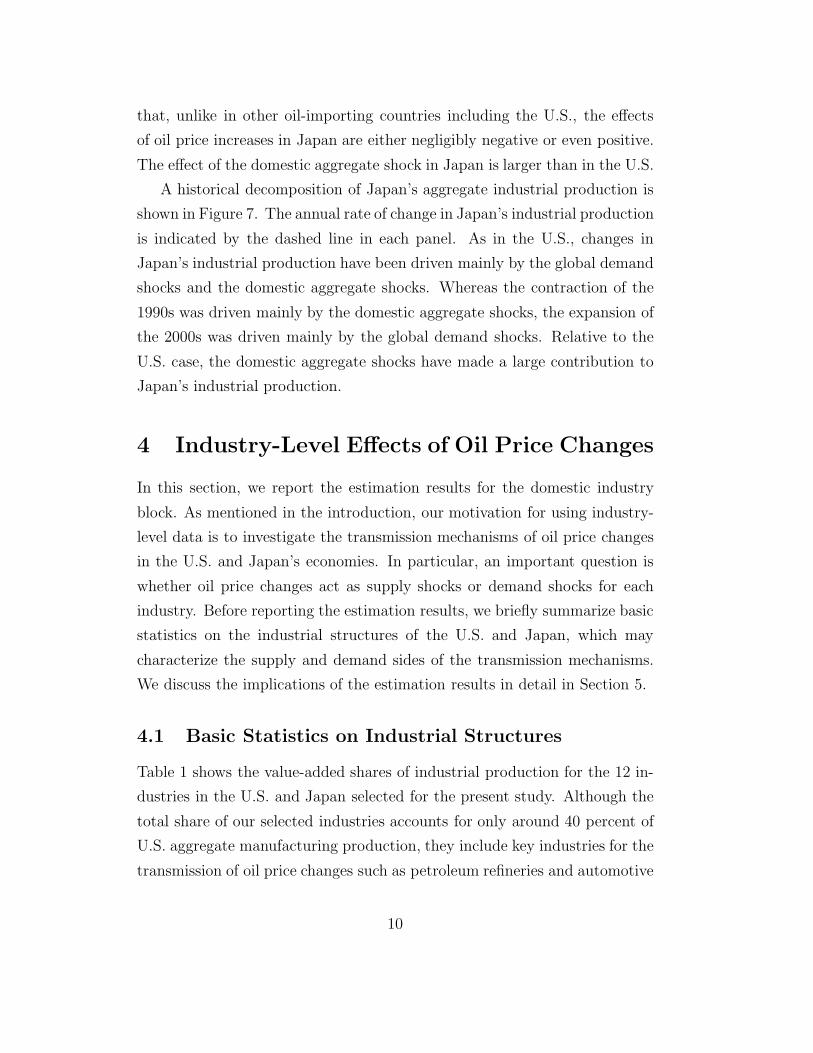
A historical decomposition of Japan’s aggregate industrial production is
shown in Figure 7. The annual rate of change in Japan’s industrial production
is indicated by the dashed line in each panel. As in the U.S., changes in
Japan’s industrial production have been driven mainly by the global demand
shocks and the domestic aggregate shocks. Whereas the contraction of the
1990s was driven mainly by the domestic aggregate shocks, the expansion of
the 2000s was driven mainly by the global demand shocks. Relative to the
U.S. case, the domestic aggregate shocks have made a large contribution to
Japan’s industrial production.
4 Industry-Level Effects of Oil Price Changes
In this section, we report the estimation results for the domestic industry
block. As mentioned in the introduction, our motivation for using industry-
level data is to investigate the transmission mechanisms of oil price changes
in the U.S. and Japan’s economies. In particular, an important question is
whether oil price changes act as supply shocks or demand shocks for each
industry. Before reporting the estimation results, we briefly summarize basic
statistics on the industrial structures of the U.S. and Japan, which may
characterize the supply and demand sides of the transmission mechanisms.
We discuss the implications of the estimation results in detail in Section 5.
4.1 Basic Statistics on Industrial Structures
Table 1 shows the value-added shares of industrial production for the 12 in-
dustries in the U.S. and Japan selected for the present study. Although the
total share of our selected industries accounts for only around 40 percent of
U.S. aggregate manufacturing production, they include key industries for the
transmission of oil price changes such as petroleum refineries and automotive
10
products, as discussed in Section 5. Because we must match industry-level
data on production and prices, we cannot select broadly defined (three-digit
NAICS) industries. For Japan, where the total value-added share of our se-
lected industries is around 80 percent, data on both production and prices
for broadly defined industries are available, although lengthy time-series data
at the highly disaggregated industry level are not available. For instance,
petroleum refineries are included in “petroleum and coal products” and au-
tomotive products are included in “transportation equipment.” Table 1 also
shows that some industries’ shares changed considerably during our sample
period. For instance, in the U.S., from 1973 to 2006, chemical materials and
petroleum refineries increased their shares, whereas fabricated metal prod-
ucts and machinery decreased their shares. In Japan, from 1975 to 2005,
shares for the electrical machinery and transportation equipment increased,
whereas the share for the ceramic, stone, and clay products decreased.
We consider two industry characteristics: oil intensity and export depen-
dence. The former relates to the cost share of oil in production and is a key
characteristic for the supply channel in the transmission of oil price changes,
as discussed in Section 5. The latter relates to the export share of shipments
and is a key characteristic for the effects of the global demand shocks. We
measure these characteristics for both countries based on the 2000 Japan-U.S.
input-output table from Japan’s Ministry of Economy, Trade, and Industry.
Table 2 shows the cost share of oil in each industry in both countries.18
The oil intensity of the petroleum and coal products (which includes petroleum
refineries) is particularly high in both countries. Oil intensity is also relatively
high in ceramics, stone, and clay products, chemical products, steel and steel
products, and non-steel metals and products. We term these industries “oil-
intensive industries” and refer to the others as “less oil-intensive industries.”
Based on the 12-industry average, Japan is less oil-intensive than the U.S.
Table 3 shows the export share of shipments in each industry in both
countries. The export dependences of precision instruments, electric ma-
chinery, general machinery, and transportation equipment (which includes
18The figures show the input cost shares of “mining” and “petroleum and coal products.”
11
automotive products) are particularly high in both countries. These indus-
tries are termed “export-dependent industries.” Based on the 12-industry
average, Japan is more export-dependent than the U.S.
4.2 Effects of Oil Supply Shocks on Industry-Level
Production and Prices
Figures 8 through 19 illustrate the estimated cumulative responses of pro-
duction and prices of the 12 selected industries in the U.S. and Japan to one
standard deviation of the three structural shocks identified in the global oil
market block. Each response is accompanied by one-standard-error bands
computed from a bootstrap method. The graphs for the selected industries
are presented in order of oil intensity. Note that the scales of the responses
are different for different industries. For cross-industry comparisons, we show
the magnitudes of the 12-month cumulative responses for all the selected in-
dustries in the U.S. in Figure 20 and those in Japan in Figure 21. In addition,
in Tables 4 and 5, we summarize the signs of the peak responses within 20
months to each shock in the U.S. and Japan respectively, following Lee and
Ni (2002).19 These tables enable us to identify the main effects of each struc-
tural shock for each industry. If production and price move in the same
(opposite) direction after a shock, the dominant effect of that shock is on the
demand (supply) side.
First we examine the responses of production and prices to the oil supply
shock in the U.S., as shown in Figures 8 and 9. In most industries in the
U.S., an unexpected disruption of oil supply causes a gradual decline in
production that lasts for about a year. The production of petroleum refineries
declines on impact and then continues to decline gradually and persistently.
The responses of prices vary across industries. An unexpected oil supply
disruption significantly raises the price of petroleum refineries and reduces the
19Rather than plot the cumulative responses of first-difference series to permanent levelshocks as we do, Lee and Ni (2002) plot the responses of level variables to temporary levelshocks. Therefore, our responses have different interpretations, particularly in the longrun, from theirs.
12
prices of wood product and electrical equipment. It tends to raise the prices
of oil-intensive industries and tends to reduce the prices of less oil-intensive
industries, although these effects for many industries are only partially (in
limited periods) statistically significant. This implies that the oil supply
shocks act mainly as supply shocks for oil-intensive industries and act mainly
as demand shocks for less oil-intensive industries. This finding is similar to
that obtained by Lee and Ni (2002) for exogenous oil price shocks.
The responses of production and prices to the same shock in Japan are
shown in Figures 10 and 11. An unexpected disruption of oil supply grad-
ually decreases petroleum and coal production, which includes production
of petroleum refineries, and this lasts for about a year. There are declines
in production of many other industries, but only partially statistically sig-
nificant. Disruption of oil supply gradually increases prices of petroleum
refineries, and this also lasts for about a year. There are price falls in other
oil-intensive industries such as ceramic, stone, and clay products and iron
and steel products, but only partially statistically significant. The effects
on prices of less oil-intensive industries are mostly statistically insignificant.
Overall, the oil supply shocks act mainly as supply shocks for petroleum
refineries but have insignificant effects on many other industries in Japan.
4.3 Effects of Global Demand Shocks on Industry-Level
Production and Prices
Figures 12 and 13 illustrate the responses of production and prices to the
global demand shock in the U.S. An unexpected expansion in the global
demand for all industrial commodities gradually increases the production
of most industries. Whereas increases in the production of some export-
dependent industries such as machinery and electrical equipment last for
about a year, the increases in many other industries last for only a few months
or half a year. In particular, automotive products, furniture and related
product, wood product, and some oil-intensive industries including petroleum
refineries, experience only transitory increases in production. At the same
13
time, a positive global demand shock gradually and persistently increases
the prices of most industries. The price increase in petroleum refineries is
the largest among the industries. Prices in many less oil-intensive industries
also increase, but by less than do those in oil-intensive industries. These
results imply that the global demand shocks act mainly as demand shocks,
at least in the short run, for most industries. Note that these global demand
shocks act as positive demand shocks for many industries, in contrast to the
oil supply shocks which act as negative demand shocks for less oil-intensive
industries.
The responses of production and prices to the same shock in Japan are
shown in Figures 14 and 15. As in the U.S., a positive global demand shock
gradually increases production of most industries in Japan. Whereas the in-
creases in production of some oil-intensive industries such as petroleum and
coal products last for only about half a year, production increases in many
less oil-intensive and export-dependent industries last for about a year, and
the effects are larger than those in oil-intensive industries. Compared with
the U.S., the global demand shocks have persistent effects on production in
a wider range of industries, which include transportation equipment. At the
same time, a positive global demand shock gradually and persistently raises
the prices of many industries, particularly oil-intensive industries. By con-
trast, prices of some less oil-intensive industries such as precision instruments
and transportation equipment fall, at least in the short run. As in the U.S.,
the global demand shocks act mainly as demand shocks for most industries
in Japan. However, the magnitude and persistence of the effects in some
industries differ greatly from the corresponding effects in the U.S.
4.4 Effects of Oil-Specific Demand Shocks on Industry-
Level Production and Prices
Figures 16 and 17 illustrate the responses of production and prices to the
oil-specific demand shock in the U.S. An unexpected increase in demand
that is specific to the global oil market gradually and persistently reduces
14
the production of most industries, with a half-year lag. The decrease in
automotive production is the largest, and generally, production declines are
relatively large in less oil-intensive industries. At the same time, a positive
oil-specific demand shock persistently increases the prices of most industries.
In petroleum refineries, prices increase on impact and then continue to rise
until around a year after the shock, which is the largest increase among the
industries. Prices in many less oil-intensive industries, including automotive
products, also increase, but generally by less than those in oil-intensive in-
dustries. These results imply that the oil-specific demand shocks act mainly
as supply shocks for most industries.
Lastly, the responses of production and prices to the same shock in Japan
are shown in Figures 18 and 19. Of the three structural shocks, the responses
to the oil-specific demand shock differ most between the U.S. and Japan.
Unlike in the U.S., a positive oil-specific demand shock raises rather than
reduces production of most industries in Japan, at least in the short run.
Whereas production increases in oil-intensive industries are small and tran-
sitory, those in some less oil-intensive and export-dependent industries, such
as general machinery, precision instruments, and transportation equipment,
last for about a year. Therefore, the oil-specific demand shocks have similar
effects on production to the global demand shocks, although the latter have
much larger effects. At the same time, a positive oil-specific demand shock
gradually and persistently raises the prices of most industries. Unlike in the
U.S., the oil-specific demand shocks act mainly as demand shocks rather than
supply shocks for many industries in Japan.
5 Discussion
The estimation results for the domestic industry block in Section 4 reveal
that whether the oil price changes act as supply shocks or demand shocks
for each industry depends on what kind of underlying shock drives the oil
price changes. It also depends on each industry’s characteristics: that is, oil
price changes tend to act more as supply shocks for oil-intensive industries
15
and tend to act more as demand shocks for less oil-intensive industries, as
shown by Lee and Ni (2002). However, our results imply that the global
demand shocks act mainly as demand shocks for most industries including
oil-intensive industries and that the oil-specific demand shocks act mainly
as supply shocks for most industries including less oil-intensive industries
in the U.S. Considering this key finding, we briefly survey the transmission
mechanisms of oil price changes and interpret our estimation results in more
detail. The three structural shocks to the global oil market identified in our
model are transmitted to each industry through various channels, some of
which are familiar and others are less familiar in the literature.20
Another key finding is that the transmission mechanisms differ consid-
erably between the U.S. and Japan. In particular, the oil-specific demand
shocks in Japan act mainly as demand shocks rather than supply shocks for
many industries. Following discussion of the transmission mechanisms, we
consider the background of the differences between the U.S. and Japan.
5.1 Transmission Mechanisms of Oil Price Changes
Oil price changes have been viewed traditionally as cost shocks or productiv-
ity shocks to oil-importing countries, and many studies focus on the supply
side of their transmission mechanisms.21 When an oil price hike pushes up
production costs, producers reduce their use of oil, which may lower the
productivity of capital and labor. This cost channel or supply channel of
transmission operates mainly in oil-intensive industries. According to our es-
timation results, the magnitudes of the price responses to any kind of struc-
tural shock to the global oil market are relatively large in oil-intensive in-
dustries, particularly petroleum refineries. However, production responses in
oil-intensive industries are not particularly large. The effect of an oil-specific
20The survey is limited to mechanisms relating to our estimation results. Because ourmodels do not explicitly consider either monetary policy shocks or endogenous responsesof monetary policy to oil price changes, we ignore the relationship between oil prices andmonetary policy.
21For instance, Bruno and Sachs (1985) extensively study the supply side of the trans-mission mechanisms of oil price changes.
16
demand shock in the U.S. on production of oil-intensive industries is smaller
than that of less oil-intensive industries such as automotive products. The
production of oil-intensive industries increases rather than decreases in re-
sponse to a positive global demand shock, which moves in the same direction
as prices. Because the economy-wide cost share of oil is low, it is reasonable
to suppose that the direct effect of the cost channel by itself cannot explain
the whole impact of oil price changes on economic activity.22
Another important channel of the transmission is on the demand side of
the economy. Kilian (2008) categorizes the effects of oil price changes on
consumption expenditure into a discretionary income effect, a precautionary
savings effect, an uncertainty effect, and an operating cost effect.23 The first
two effects, which operate through consumers’ present and expected future
incomes, relate to a wide range of goods and services, whereas the other
two effects relate only to consumer durables. The uncertainty effect of oil
price changes causes consumers to postpone irreversible purchases of con-
sumer durables, and the operating cost effect causes consumers to refrain
from purchasing oil-using durables, particularly automobiles. According to
our estimation results, the U.S. automotive industry exhibits the largest pro-
duction decrease following a positive oil-specific demand shock. This implies
that the oil-specific demand shocks act as demand shocks as well as supply
shocks for the U.S. automotive industry, though the negative effect on prices
through the demand channel is not as strong as the positive effect on prices
through the supply channel. Note that all the above effects of oil price in-
creases reduce consumption expenditure; that is, they act as negative demand
shocks. By contrast, the global demand shocks identified in our model act
mainly as positive demand shocks. This is because, by construction, these
shocks incorporate positive shocks to the income of U.S. or other countries’
residents who purchase U.S. products. More precisely, however, the global
22Hamilton (2008) discusses the empirical relevance of the cost channel in his surveyof the mechanisms through which the effects of oil price changes are transmitted to themacroeconomy.
23Oil price changes also affect firms’ investment expenditures, but these effects are con-sidered small by Kilian (2008).
17
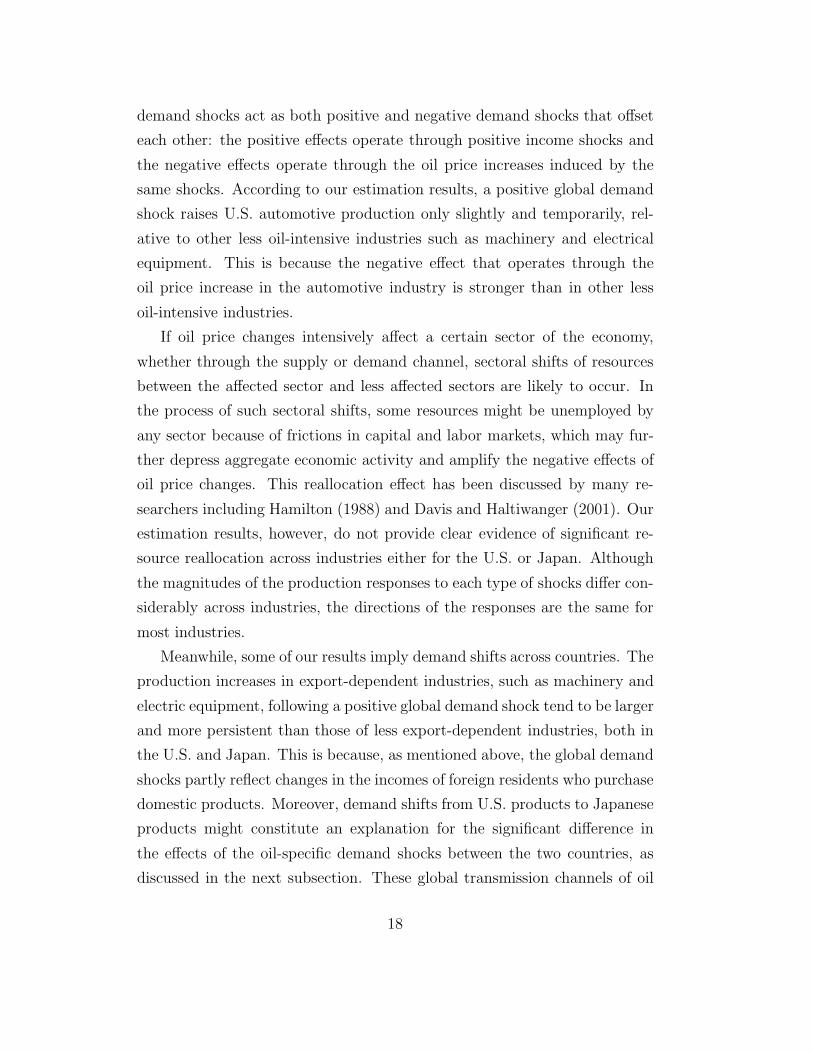
demand shocks act as both positive and negative demand shocks that offset
each other: the positive effects operate through positive income shocks and
the negative effects operate through the oil price increases induced by the
same shocks. According to our estimation results, a positive global demand
shock raises U.S. automotive production only slightly and temporarily, rel-
ative to other less oil-intensive industries such as machinery and electrical
equipment. This is because the negative effect that operates through the
oil price increase in the automotive industry is stronger than in other less
oil-intensive industries.
If oil price changes intensively affect a certain sector of the economy,
whether through the supply or demand channel, sectoral shifts of resources
between the affected sector and less affected sectors are likely to occur. In
the process of such sectoral shifts, some resources might be unemployed by
any sector because of frictions in capital and labor markets, which may fur-
ther depress aggregate economic activity and amplify the negative effects of
oil price changes. This reallocation effect has been discussed by many re-
searchers including Hamilton (1988) and Davis and Haltiwanger (2001). Our
estimation results, however, do not provide clear evidence of significant re-
source reallocation across industries either for the U.S. or Japan. Although
the magnitudes of the production responses to each type of shocks differ con-
siderably across industries, the directions of the responses are the same for
most industries.
Meanwhile, some of our results imply demand shifts across countries. The
production increases in export-dependent industries, such as machinery and
electric equipment, following a positive global demand shock tend to be larger
and more persistent than those of less export-dependent industries, both in
the U.S. and Japan. This is because, as mentioned above, the global demand
shocks partly reflect changes in the incomes of foreign residents who purchase
domestic products. Moreover, demand shifts from U.S. products to Japanese
products might constitute an explanation for the significant difference in
the effects of the oil-specific demand shocks between the two countries, as
discussed in the next subsection. These global transmission channels of oil
18
price changes have received relatively less attention in the literature.24
5.2 Differences between the U.S. and Japan
Based on the above discussion, we consider the background of the differences
between our estimation results for the U.S. and Japan. For Japan, in many
industries, the production responses to the oil supply shock are weaker or
statistically insignificant and those to the global demand shock are stronger
than those of the U.S. These differences are explained by the facts that
Japan’s economy is less oil-intensive and more export-dependent than the
U.S., as shown in Section 4.1.
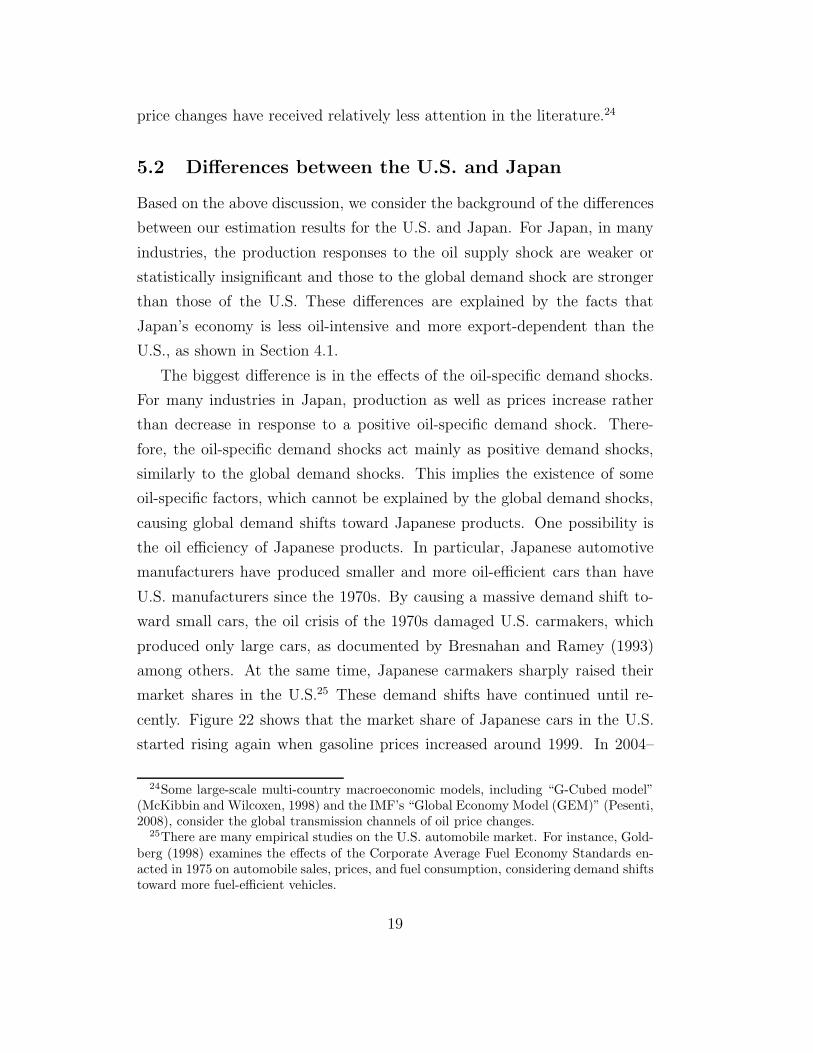
The biggest difference is in the effects of the oil-specific demand shocks.
For many industries in Japan, production as well as prices increase rather
than decrease in response to a positive oil-specific demand shock. There-
fore, the oil-specific demand shocks act mainly as positive demand shocks,
similarly to the global demand shocks. This implies the existence of some
oil-specific factors, which cannot be explained by the global demand shocks,
causing global demand shifts toward Japanese products. One possibility is
the oil efficiency of Japanese products. In particular, Japanese automotive
manufacturers have produced smaller and more oil-efficient cars than have
U.S. manufacturers since the 1970s. By causing a massive demand shift to-
ward small cars, the oil crisis of the 1970s damaged U.S. carmakers, which
produced only large cars, as documented by Bresnahan and Ramey (1993)
among others. At the same time, Japanese carmakers sharply raised their
market shares in the U.S.25 These demand shifts have continued until re-
cently. Figure 22 shows that the market share of Japanese cars in the U.S.
started rising again when gasoline prices increased around 1999. In 2004–
24Some large-scale multi-country macroeconomic models, including “G-Cubed model”(McKibbin and Wilcoxen, 1998) and the IMF’s “Global Economy Model (GEM)” (Pesenti,2008), consider the global transmission channels of oil price changes.
25There are many empirical studies on the U.S. automobile market. For instance, Gold-berg (1998) examines the effects of the Corporate Average Fuel Economy Standards en-acted in 1975 on automobile sales, prices, and fuel consumption, considering demand shiftstoward more fuel-efficient vehicles.
19
06, Japanese cars were still more fuel efficient than U.S. cars, as shown in
Figure 23. These demand shifts might constitute an explanation for why
U.S. and Japanese automotive production differ in their responses to the
oil-specific demand shocks; among our selected industries, automotive pro-
duction differs the most between the U.S. and Japan. Moreover, the demand
for automotive products induces production of many other industries such
as steel and precision instruments. Although the value-added share of pas-
senger cars (excluding buses and trucks) in Japanese industrial production is
only about 8.5 percent, the economy-wide impacts of demand shifts toward
Japanese cars may be substantial.
6 Concluding Remarks
In this paper, we decomposed oil price changes into their component parts
following Kilian (2009) and estimated the dynamic effects of each compo-
nent on industry-level production and prices in the U.S. and Japan using
identified VAR models. Our results reveal that the way oil price changes
affect each industry depends on what kind of underlying shock drives the oil
price changes as well as on industry characteristics. We also found that the
transmission mechanisms differ considerably between the U.S. and Japan.
Our results imply that global demand shifts across countries are impor-
tant factors for oil price changes themselves and their transmission mech-
anisms. We considered the global demand shocks as underlying causes of
oil price changes and discussed the effects of global demand shifts toward
more oil-efficient products. For a better understanding of the transmission
mechanisms, it would be worth investigating differences in the effects of oil
price changes among countries other than the U.S. and Japan. Moreover, de-
veloping open-economy dynamic stochastic general equilibrium models that
incorporate the global oil market is also a promising way of deepening our
understanding and would enhance the interpretation of empirical results on
the effects of oil price changes.
20
Appendix: Robustness Checks
In this appendix, we summarize the estimation results under several alterna-
tive assumptions and specifications of the model to check the robustness of
our main results.26
First, we changed the sample period of estimation, while keeping the
model unchanged. Although we focus on changes in the nature of the shocks
rather than structural changes as an explanation for the weakening effects
of oil price changes on real economic activity (as stated in footnote 5), it is
possible to estimate our models for shorter sample periods and check whether
structural changes occurred during the full sample period. We divided the
sample period into the two sub-periods, 1973:1 to 1983:12 and 1984:1 to
2008:12, following Blanchard and Galı (2007) in choosing the break point.
In the later sub-period, the negative effects of the oil supply shocks on pro-
duction were weakened in both the U.S. and Japan, the positive effects of
the global demand shocks on production were strengthened in Japan, and
the effects of the oil-specific demand shocks were little changed in both coun-
tries. Therefore, structural changes occurred only in the effects of oil price
changes caused by the oil supply shocks (and the global demand shocks in
Japan) which made historically a small contribution to oil price movements
(as shown in Figure 3). Overall, the directions of the responses to the three
structural shocks were little changed in each industry.
Second, we partially relaxed the block recursive restrictions and assumed
that domestic aggregate variables could affect global oil market variables.
Third, we included in the domestic macroeconomy block the short-term nom-
inal interest rate and the real effective exchange rate in addition to aggregate
industrial production.27 Lastly, we changed the ordering of the variables in
the domestic industry block (industrial production and producer prices) so
that prices rather than production come first. We found that all these changes
26The detailed results of the robustness checks will be available upon request.27The short-term nominal interest rate we use is the federal funds rate for the U.S. and
overnight call rate for Japan. We use the real effective exchange rates published by theFederal Reserve Board and that published by Bank of Japan.
21
made little differences to our main results.
References
[1] Blanchard, O. J. and Galı, J. (2007), “The Macroeconomic Effects ofOil Shocks: Why Are the 2000s So Different from the 1970s?,” NBERWorking Paper 13368.
[2] Bresnahan, T. F. and Ramey, V. A. (1993), “Segment Shifts and Capac-ity Utilization in the U.S. Automobile Industry,” American Economic
Review, 83(2), 213–218.
[3] Bruno, M. and Sachs, J. (1985), Economics of Worldwide Stagflation,Harvard University Press, Cambridge, MA.
[4] Davis, S. J. and Haltiwanger, J. (2001), “Sectoral Job Creation and De-struction Responses to Oil Price Changes,” Journal of Monetary Eco-
nomics, 48(3), 465–512.
[5] Goldberg, P. K. (1998), “The Effects of the Corporate Average Fuel Ef-ficiency Standards in the U.S.,” Journal of Industrial Economics, 46(1),1–33.
[6] Hamilton, J. D. (1988), “A Neoclassical Model of Unemployment andthe Business Cycle,” Journal of Political Economy, 96(3), 593–617.
[7] Hamilton, J. D. (1996), “This is What Happened to the Oil Price–Macroeconomy Relationship” Journal of Monetary Economics, 38(2),215–220.
[8] Hamilton, J. D. (2008), “Oil and the Macroeconomy,” in Durlauf, S. N.and Blume, L. E. (eds.) The New Palgrave Dictionary of Economics,Second Edition, Houndmills, U.K., Palgrave Macmillan.
[9] Hirakata, N. and Sudo, N. (2009), “Accounting for Oil Price Variationand Weakening Impact of the Oil Crisis,” IMES Discussion Paper 2009–E–1.
[10] Hooker, M. A. (1996), “This is What Happened to the Oil Price–Macroeconomy Relationship: Reply,” Journal of Monetary Economics,38(2), 221–222.
22
[11] Jimenez-Rodrıguez, R. and Sanchez, M. (2004), “Oil Price Shocks andReal GDP Growth: Empirical Evidence for Some OECD Countries,”ECB Working Paper 362.
[12] Kilian, L. (2008), “The Economic Effects of Energy Price Shocks,” Jour-
nal of Economic Literature, 46(4), 871–909.
[13] Kilian, L. (2009), “Not All Oil Price Shocks Are Alike: DisentanglingDemand and Supply Shocks in the Crude Oil Market,” American Eco-
nomic Review, 99(3), 1053–1069.
[14] Kilian, L. and Park, C. (2009), “The Impact of Oil Price Shocks on theU.S. Stock Market,” International Economic Review, 50(4), 1267–1287.
[15] Lee, K. and Ni, S. (2002), “On the Dynamic Effects of Oil Price Shocks:A Study Using Industry Level Data,” Journal of Monetary Economics,49(4), 823–852.
[16] McKibbin, W. and Wilcoxen, P. (1998), “The Theoretical and EmpiricalStructure of the G-Cubed Model,” Economic Modelling, 16(1), 123–148.
[17] Pesenti, P. (2008), “The Global Economy Model: Theoretical Frame-work,” IMF Staff Papers, 55(2), 243–284.
[18] Research and Statistics Department, Bank of Japan (2007), “RecentDevelopments of Japan’s External Trade and Corporate Behavior,” BOJReports & Research Papers (Ad Hoc Themes).
[19] Rotemberg, J. J. and Woodford, M. (1996), “Imperfect Competition andthe Effects of Energy Price Increases on Economic Activity,” Journal of
Money, Credit, and Banking, 28(4), 549–577.
23
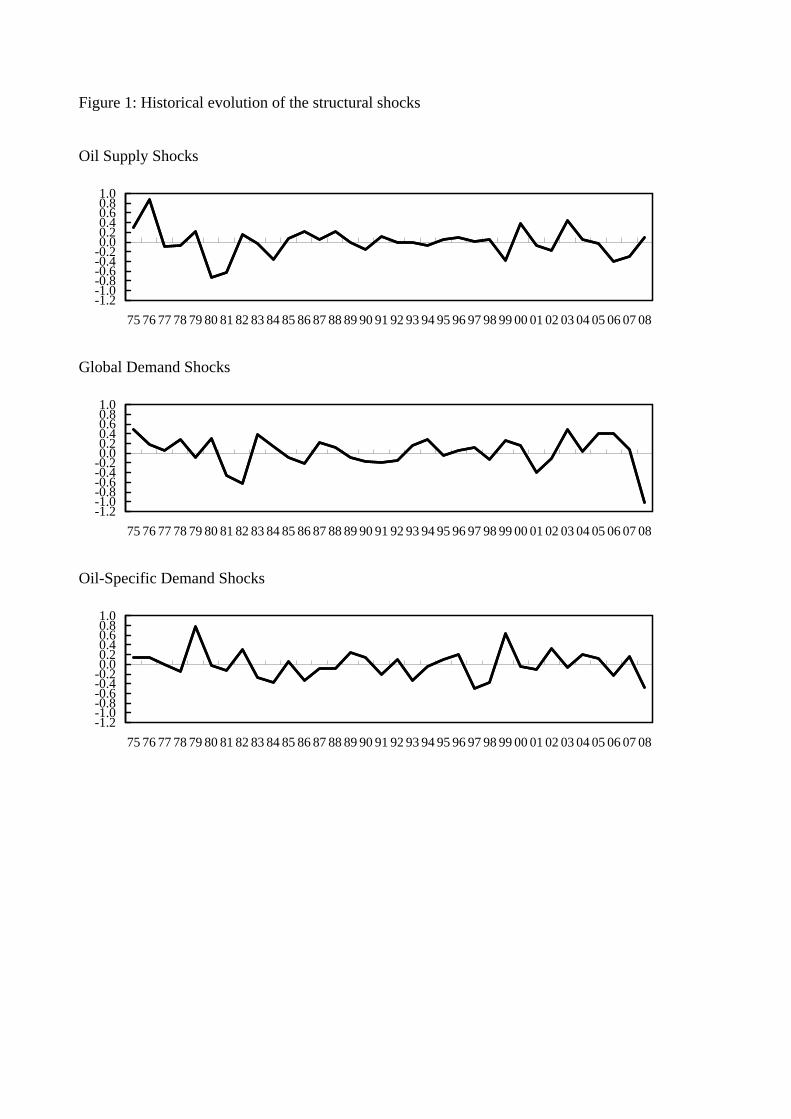
Figure 1: Historical evolution of the structural shocks
Oil Supply Shocks
Global Demand Shocks
Oil-Specific Demand Shocks
-1.2-1.0-0.8-0.6-0.4-0.20.00.20.40.60.81.0
75 76 77 78 79 80 81 82 83 84 85 86 87 88 89 90 91 92 93 94 95 96 97 98 99 00 01 02 03 04 05 06 07 08
-1.2-1.0-0.8-0.6-0.4-0.20.00.20.40.60.81.0
75 76 77 78 79 80 81 82 83 84 85 86 87 88 89 90 91 92 93 94 95 96 97 98 99 00 01 02 03 04 05 06 07 08
-1.2-1.0-0.8-0.6-0.4-0.20.00.20.40.60.81.0
75 76 77 78 79 80 81 82 83 84 85 86 87 88 89 90 91 92 93 94 95 96 97 98 99 00 01 02 03 04 05 06 07 08
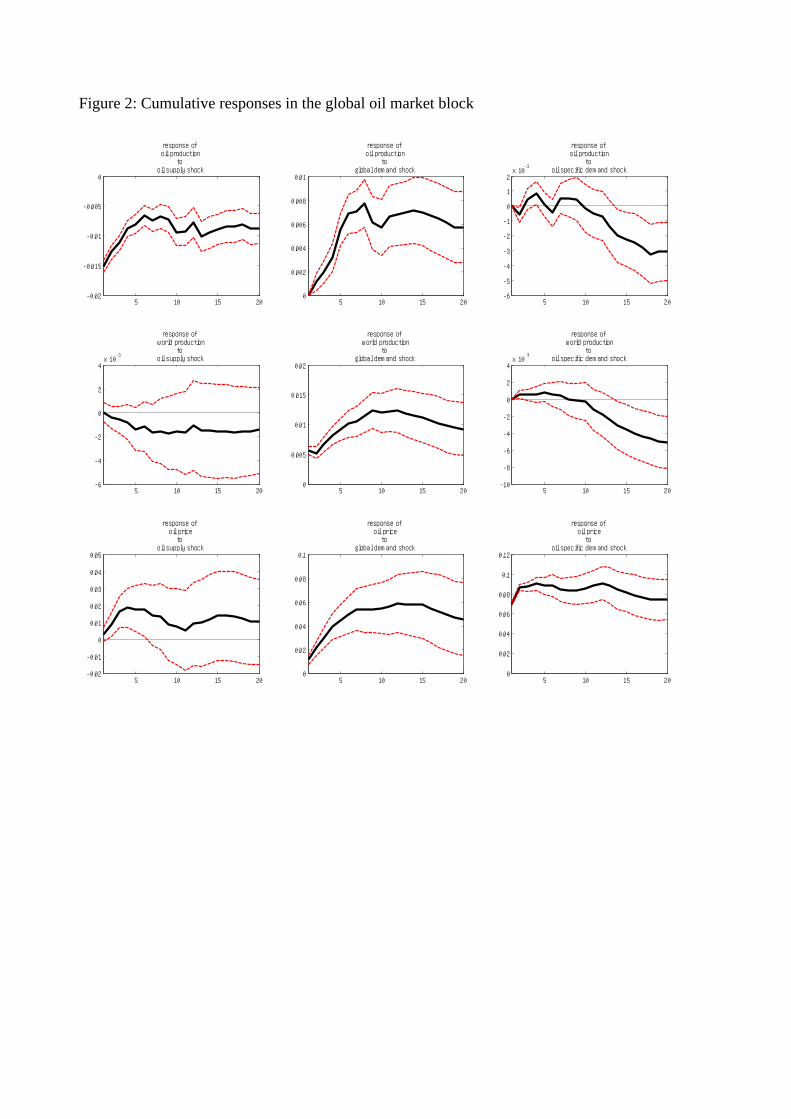
Figure 2: Cumulative responses in the global oil market block
5 10 15 20-0.02
-0.015
-0.01
-0.005
0
response of oil production
to oil supply shock
5 10 15 200
0.002
0.004
0.006
0.008
0.01
response of oil production
to global demand shock
5 10 15 20-6
-5
-4
-3
-2
-1
0
1
2x 10
-3
response of oil production
to oil specific demand shock
5 10 15 20-6
-4
-2
0
2
4x 10
-3
response of world production
to oil supply shock
5 10 15 200
0.005
0.01
0.015
0.02
response of world production
to global demand shock
5 10 15 20-10
-8
-6
-4
-2
0
2
4x 10
-3
response of world production
to oil specific demand shock
5 10 15 20-0.02
-0.01
0
0.01
0.02
0.03
0.04
0.05
response of oil priceto
oil supply shock
5 10 15 200
0.02
0.04
0.06
0.08
0.1
response of oil priceto
global demand shock
5 10 15 200
0.02
0.04
0.06
0.08
0.1
0.12
response of oil priceto
oil specific demand shock
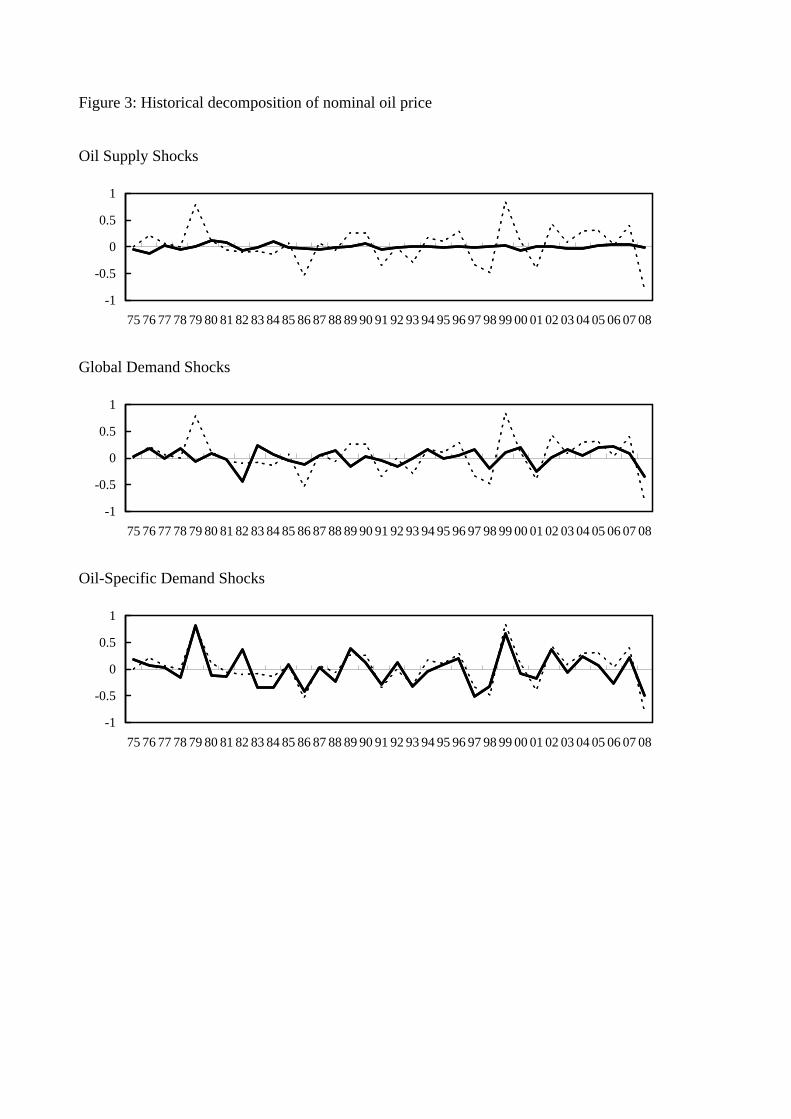
Figure 3: Historical decomposition of nominal oil price
Oil Supply Shocks
Global Demand Shocks
Oil-Specific Demand Shocks
-1
-0.5
0
0.5
1
75 76 77 78 79 80 81 82 83 84 85 86 87 88 89 90 91 92 93 94 95 96 97 98 99 00 01 02 03 04 05 06 07 08
-1
-0.5
0
0.5
1
75 76 77 78 79 80 81 82 83 84 85 86 87 88 89 90 91 92 93 94 95 96 97 98 99 00 01 02 03 04 05 06 07 08
-1
-0.5
0
0.5
1
75 76 77 78 79 80 81 82 83 84 85 86 87 88 89 90 91 92 93 94 95 96 97 98 99 00 01 02 03 04 05 06 07 08
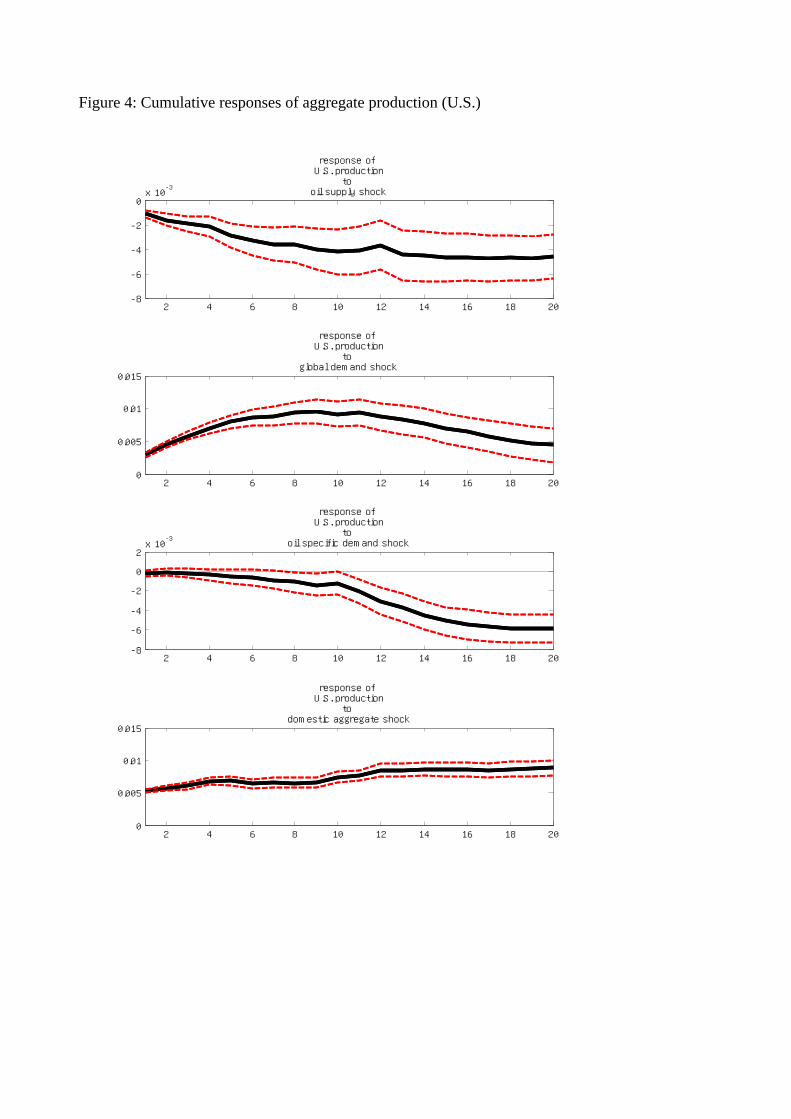
Figure 4: Cumulative responses of aggregate production (U.S.)
2 4 6 8 10 12 14 16 18 20-8
-6
-4
-2
0x 10
-3
response of U.S. production
to oil supply shock
2 4 6 8 10 12 14 16 18 200
0.005
0.01
0.015
response of U.S. production
to global demand shock
2 4 6 8 10 12 14 16 18 20-8
-6
-4
-2
0
2x 10
-3
response of U.S. production
to oil specific demand shock
2 4 6 8 10 12 14 16 18 200
0.005
0.01
0.015
response of U.S. production
to domestic aggregate shock
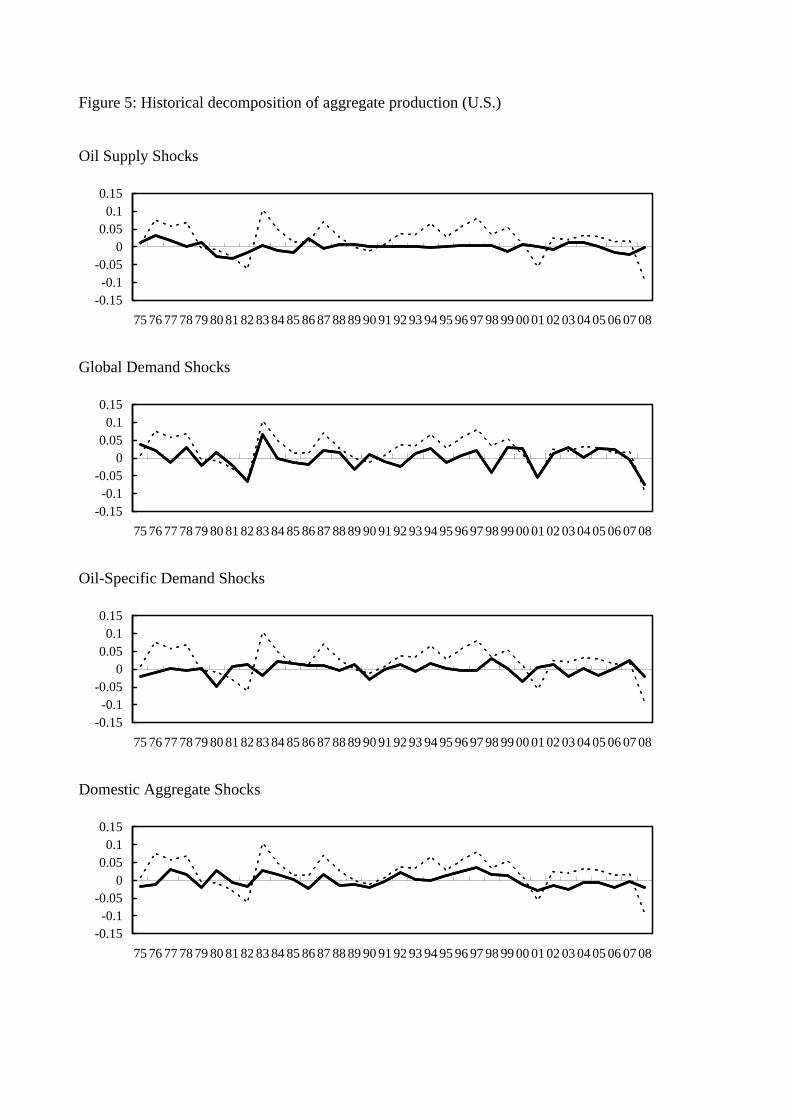
Figure 5: Historical decomposition of aggregate production (U.S.)
Oil Supply Shocks
Global Demand Shocks
Oil-Specific Demand Shocks
Domestic Aggregate Shocks
-0.15-0.1
-0.050
0.050.1
0.15
75 76 77 78 79 80 81 82 83 84 85 86 87 88 89 90 91 92 93 94 95 96 97 98 99 00 01 02 03 04 05 06 07 08
-0.15-0.1
-0.050
0.050.1
0.15
75 76 77 78 79 80 81 82 83 84 85 86 87 88 89 90 91 92 93 94 95 96 97 98 99 00 01 02 03 04 05 06 07 08
-0.15-0.1
-0.050
0.050.1
0.15
75 76 77 78 79 80 81 82 83 84 85 86 87 88 89 90 91 92 93 94 95 96 97 98 99 00 01 02 03 04 05 06 07 08
-0.15-0.1
-0.050
0.050.1
0.15
75 76 77 78 79 80 81 82 83 84 85 86 87 88 89 90 91 92 93 94 95 96 97 98 99 00 01 02 03 04 05 06 07 08
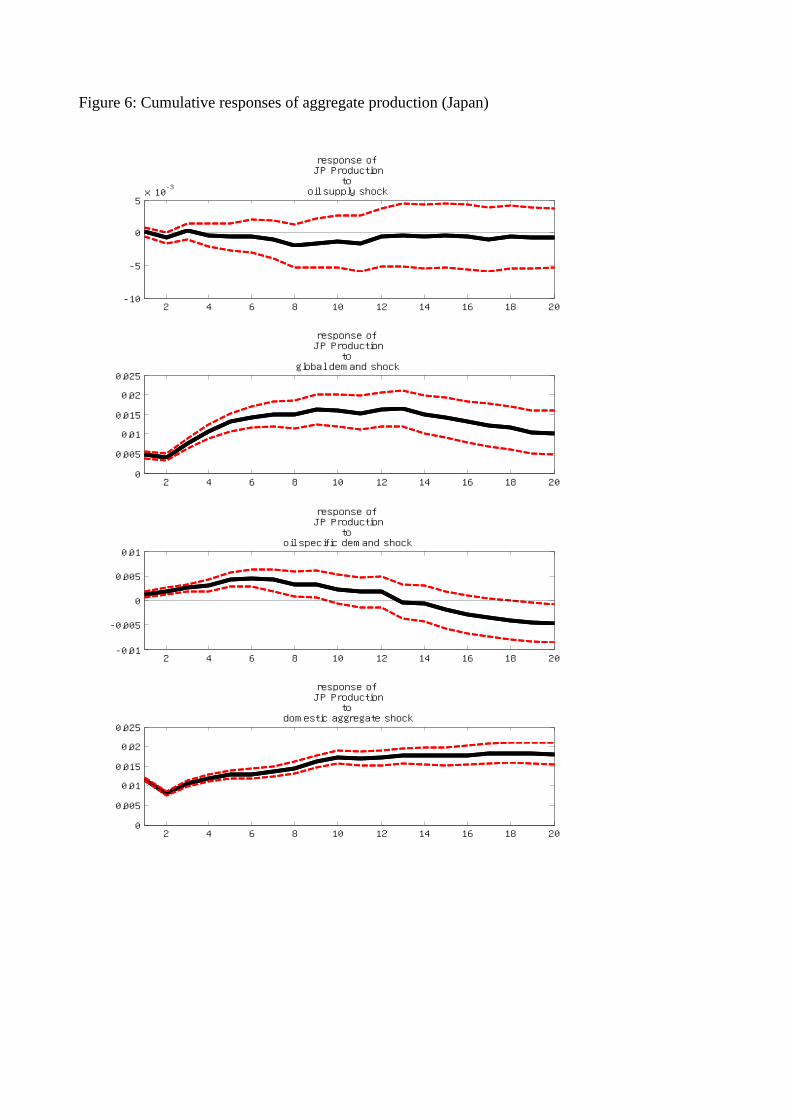
Figure 6: Cumulative responses of aggregate production (Japan)
2 4 6 8 10 12 14 16 18 20-10
-5
0
5x 10
-3
response of JP Production
to oil supply shock
2 4 6 8 10 12 14 16 18 200
0.005
0.01
0.015
0.02
0.025
response of JP Production
to global demand shock
2 4 6 8 10 12 14 16 18 20-0.01
-0.005
0
0.005
0.01
response of JP Production
to oil specific demand shock
2 4 6 8 10 12 14 16 18 200
0.005
0.01
0.015
0.02
0.025
response of JP Production
to domestic aggregate shock
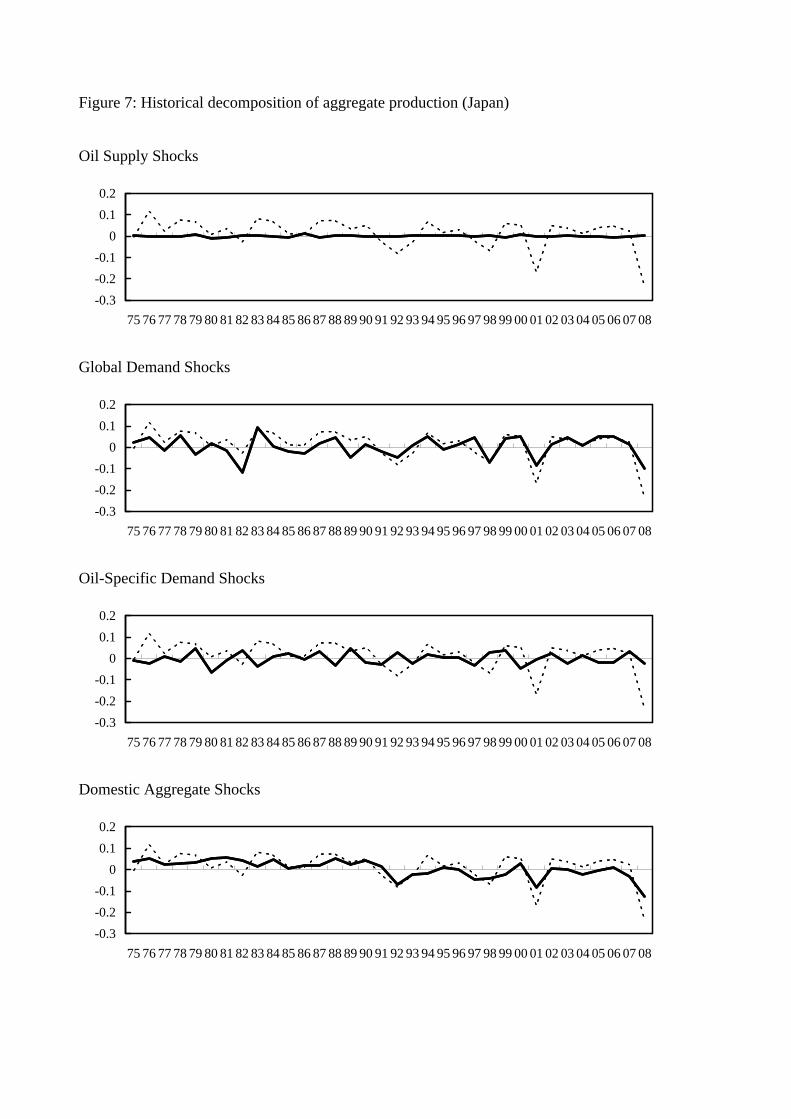
Figure 7: Historical decomposition of aggregate production (Japan)
Oil Supply Shocks
Global Demand Shocks
Oil-Specific Demand Shocks
Domestic Aggregate Shocks
-0.3-0.2-0.1
00.10.2
75 76 77 78 79 80 81 82 83 84 85 86 87 88 89 90 91 92 93 94 95 96 97 98 99 00 01 02 03 04 05 06 07 08
-0.3-0.2-0.1
00.10.2
75 76 77 78 79 80 81 82 83 84 85 86 87 88 89 90 91 92 93 94 95 96 97 98 99 00 01 02 03 04 05 06 07 08
-0.3-0.2-0.1
00.10.2
75 76 77 78 79 80 81 82 83 84 85 86 87 88 89 90 91 92 93 94 95 96 97 98 99 00 01 02 03 04 05 06 07 08
-0.3-0.2-0.1
00.10.2
75 76 77 78 79 80 81 82 83 84 85 86 87 88 89 90 91 92 93 94 95 96 97 98 99 00 01 02 03 04 05 06 07 08
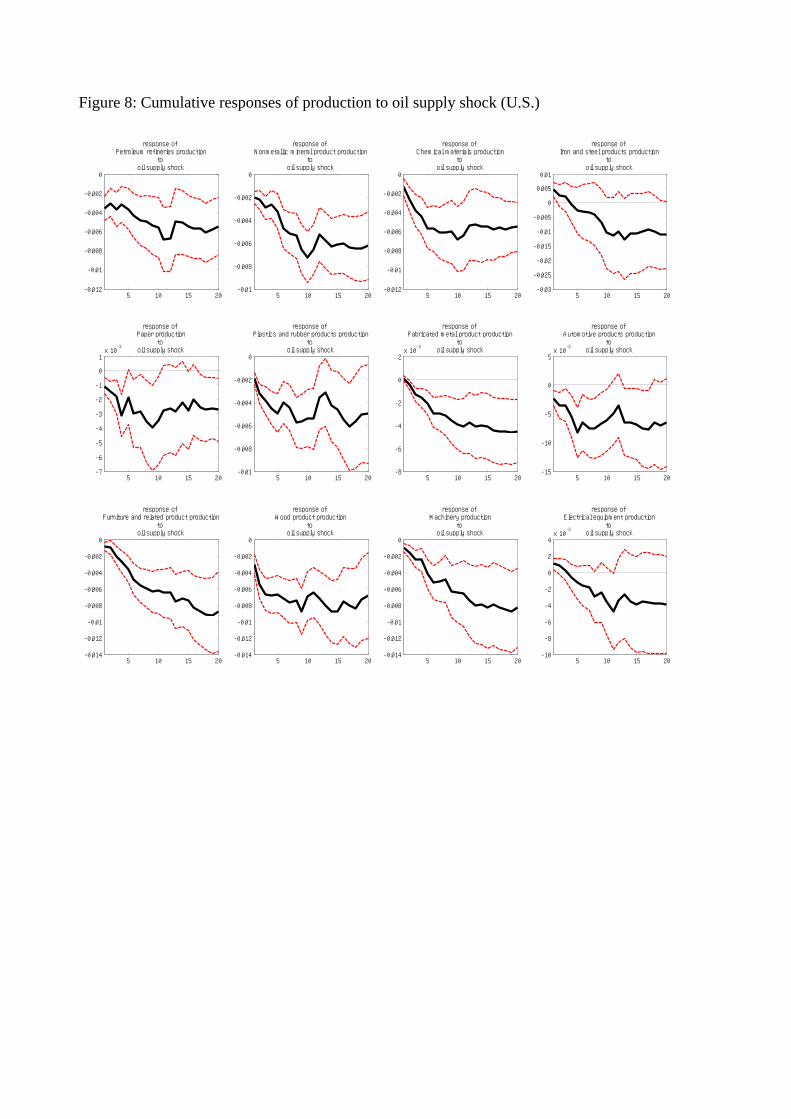
Figure 8: Cumulative responses of production to oil supply shock (U.S.)
5 10 15 20-0.012
-0.01
-0.008
-0.006
-0.004
-0.002
0
response of Petroleum refineries production
to oil supply shock
5 10 15 20-0.01
-0.008
-0.006
-0.004
-0.002
0
response of Nonmetallic mineral product production
to oil supply shock
5 10 15 20-0.012
-0.01
-0.008
-0.006
-0.004
-0.002
0
response of Chemical materials production
to oil supply shock
5 10 15 20-0.03
-0.025
-0.02
-0.015
-0.01
-0.005
0
0.005
0.01
response of Iron and steel products production
to oil supply shock
5 10 15 20-7
-6
-5
-4
-3
-2
-1
0
1x 10
-3
response of Paper production
to oil supply shock
5 10 15 20-0.01
-0.008
-0.006
-0.004
-0.002
0
response of Plastics and rubber products production
to oil supply shock
5 10 15 20-8
-6
-4
-2
0
2x 10
-3
response of Fabricated metal product production
to oil supply shock
5 10 15 20-15
-10
-5
0
5x 10
-3
response of Automotive products production
to oil supply shock
5 10 15 20-0.014
-0.012
-0.01
-0.008
-0.006
-0.004
-0.002
0
response of Furniture and related product production
to oil supply shock
5 10 15 20-0.014
-0.012
-0.01
-0.008
-0.006
-0.004
-0.002
0
response of Wood product production
to oil supply shock
5 10 15 20-0.014
-0.012
-0.01
-0.008
-0.006
-0.004
-0.002
0
response of Machinery production
to oil supply shock
5 10 15 20-10
-8
-6
-4
-2
0
2
4x 10
-3
response of Electrical equipment production
to oil supply shock
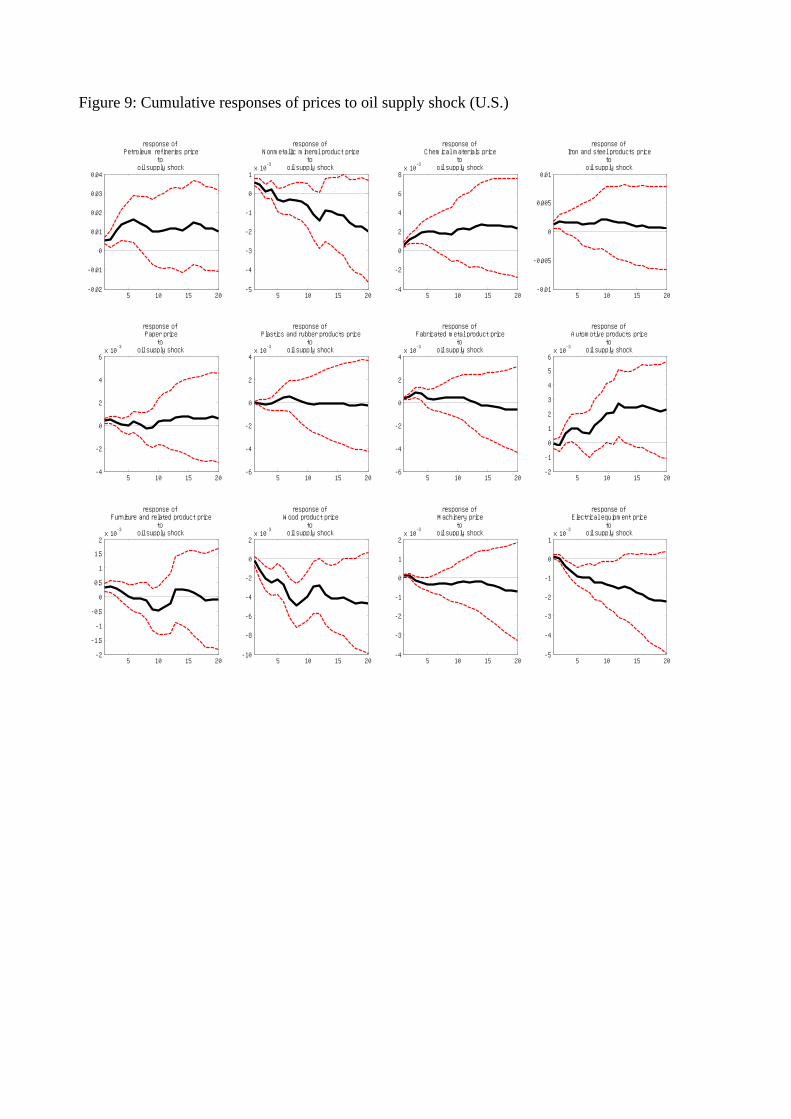
Figure 9: Cumulative responses of prices to oil supply shock (U.S.)
5 10 15 20-0.02
-0.01
0
0.01
0.02
0.03
0.04
response of Petroleum refineries price
to oil supply shock
5 10 15 20-5
-4
-3
-2
-1
0
1x 10
-3
response of Nonmetallic mineral product price
to oil supply shock
5 10 15 20-4
-2
0
2
4
6
8x 10
-3
response of Chemical materials price
to oil supply shock
5 10 15 20-0.01
-0.005
0
0.005
0.01
response of Iron and steel products price
to oil supply shock
5 10 15 20-4
-2
0
2
4
6x 10
-3
response of Paper priceto
oil supply shock
5 10 15 20-6
-4
-2
0
2
4x 10
-3
response of Plastics and rubber products price
to oil supply shock
5 10 15 20-6
-4
-2
0
2
4x 10
-3
response of Fabricated metal product price
to oil supply shock
5 10 15 20-2
-1
0
1
2
3
4
5
6x 10
-3
response of Automotive products price
to oil supply shock
5 10 15 20-2
-1.5
-1
-0.5
0
0.5
1
1.5
2x 10
-3
response of Furniture and related product price
to oil supply shock
5 10 15 20-10
-8
-6
-4
-2
0
2x 10
-3
response of Wood product price
to oil supply shock
5 10 15 20-4
-3
-2
-1
0
1
2x 10
-3
response of Machinery price
to oil supply shock
5 10 15 20-5
-4
-3
-2
-1
0
1x 10
-3
response of Electrical equipment price
to oil supply shock
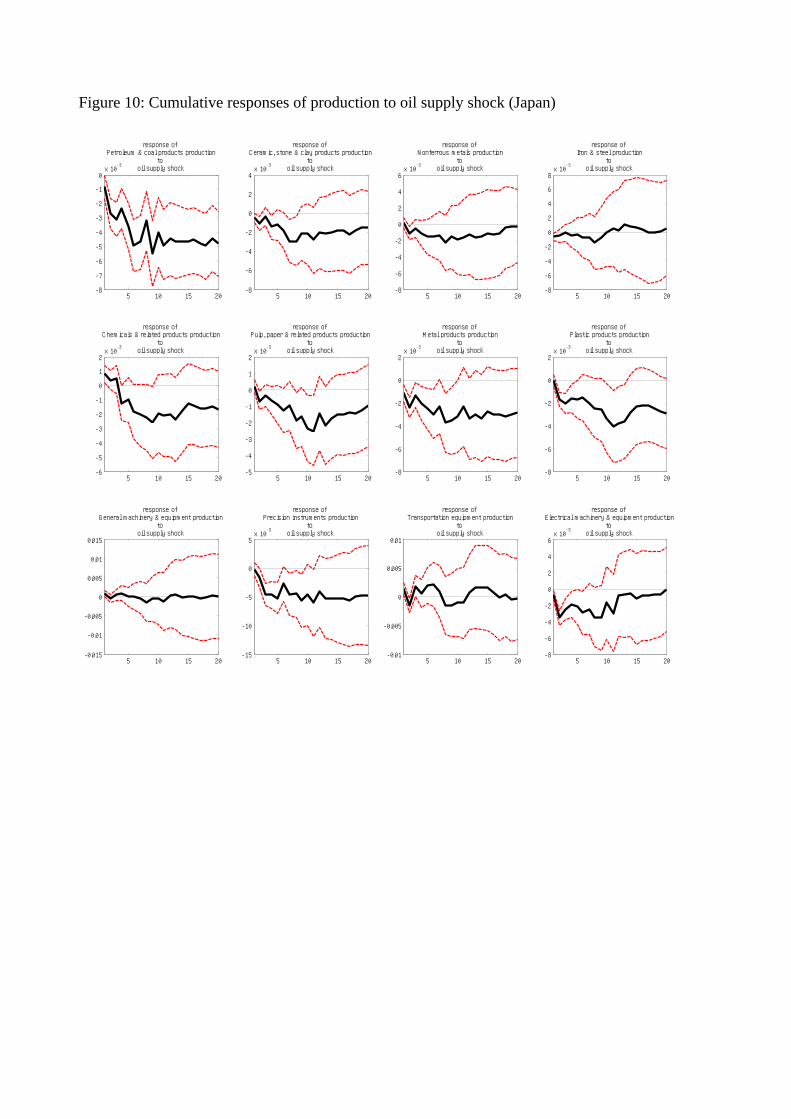
Figure 10: Cumulative responses of production to oil supply shock (Japan)
5 10 15 20-8
-7
-6
-5
-4
-3
-2
-1
0x 10
-3
response of Petroleum & coal products production
to oil supply shock
5 10 15 20-8
-6
-4
-2
0
2
4x 10
-3
response of Ceramic, stone & clay products production
to oil supply shock
5 10 15 20-8
-6
-4
-2
0
2
4
6x 10
-3
response of Nonferrous metals production
to oil supply shock
5 10 15 20-8
-6
-4
-2
0
2
4
6
8x 10
-3
response of Iron & steel production
to oil supply shock
5 10 15 20-6
-5
-4
-3
-2
-1
0
1
2x 10
-3
response of Chemicals & related products production
to oil supply shock
5 10 15 20-5
-4
-3
-2
-1
0
1
2x 10
-3
response of Pulp, paper & related products production
to oil supply shock
5 10 15 20-8
-6
-4
-2
0
2x 10
-3
response of Metal products production
to oil supply shock
5 10 15 20-8
-6
-4
-2
0
2x 10
-3
response of Plastic products production
to oil supply shock
5 10 15 20-0.015
-0.01
-0.005
0
0.005
0.01
0.015
response of General machinery & equipment production
to oil supply shock
5 10 15 20-15
-10
-5
0
5x 10
-3
response of Precision instruments production
to oil supply shock
5 10 15 20-0.01
-0.005
0
0.005
0.01
response of Transportation equipment production
to oil supply shock
5 10 15 20-8
-6
-4
-2
0
2
4
6x 10
-3
response of Electrical machinery & equipment production
to oil supply shock
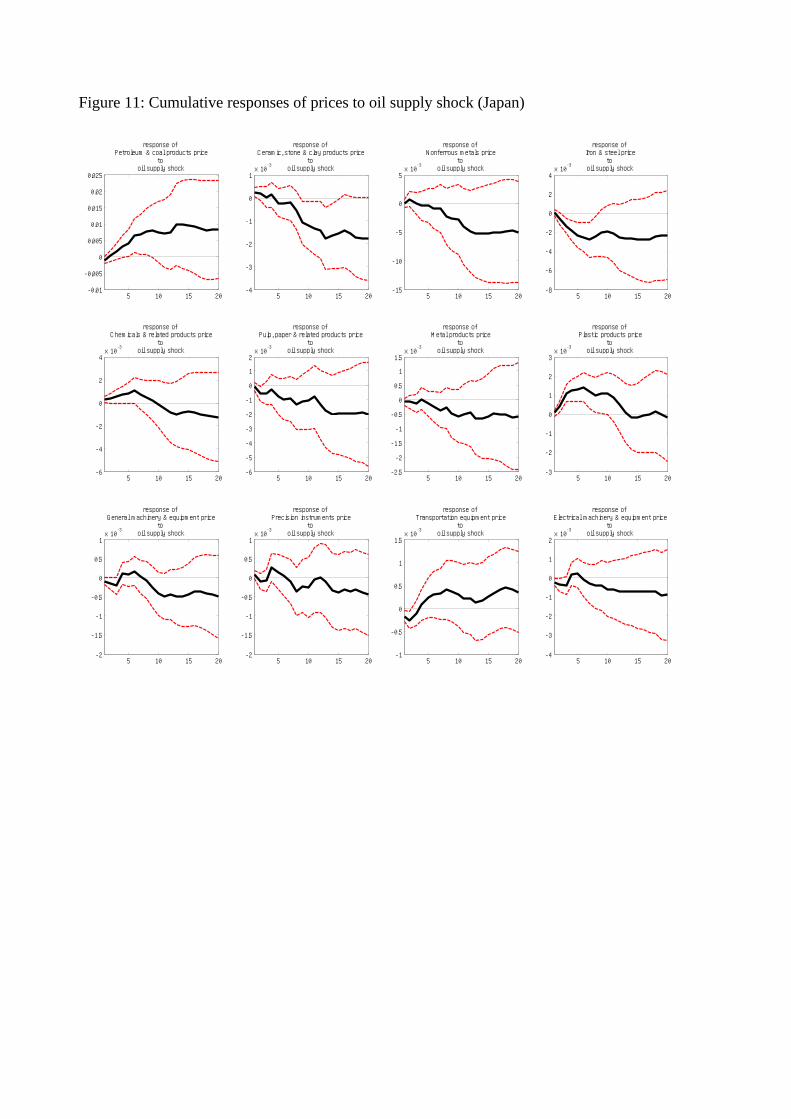
Figure 11: Cumulative responses of prices to oil supply shock (Japan)
5 10 15 20-0.01
-0.005
0
0.005
0.01
0.015
0.02
0.025
response of Petroleum & coal products price
to oil supply shock
5 10 15 20-4
-3
-2
-1
0
1x 10
-3
response of Ceramic, stone & clay products price
to oil supply shock
5 10 15 20-15
-10
-5
0
5x 10
-3
response of Nonferrous metals price
to oil supply shock
5 10 15 20-8
-6
-4
-2
0
2
4x 10
-3
response of Iron & steel price
to oil supply shock
5 10 15 20-6
-4
-2
0
2
4x 10
-3
response of Chemicals & related products price
to oil supply shock
5 10 15 20-6
-5
-4
-3
-2
-1
0
1
2x 10
-3
response of Pulp, paper & related products price
to oil supply shock
5 10 15 20-2.5
-2
-1.5
-1
-0.5
0
0.5
1
1.5x 10
-3
response of Metal products price
to oil supply shock
5 10 15 20-3
-2
-1
0
1
2
3x 10
-3
response of Plastic products price
to oil supply shock
5 10 15 20-2
-1.5
-1
-0.5
0
0.5
1x 10
-3
response of General machinery & equipment price
to oil supply shock
5 10 15 20-2
-1.5
-1
-0.5
0
0.5
1x 10
-3
response of Precision instruments price
to oil supply shock
5 10 15 20-1
-0.5
0
0.5
1
1.5x 10
-3
response of Transportation equipment price
to oil supply shock
5 10 15 20-4
-3
-2
-1
0
1
2x 10
-3
response of Electrical machinery & equipment price
to oil supply shock
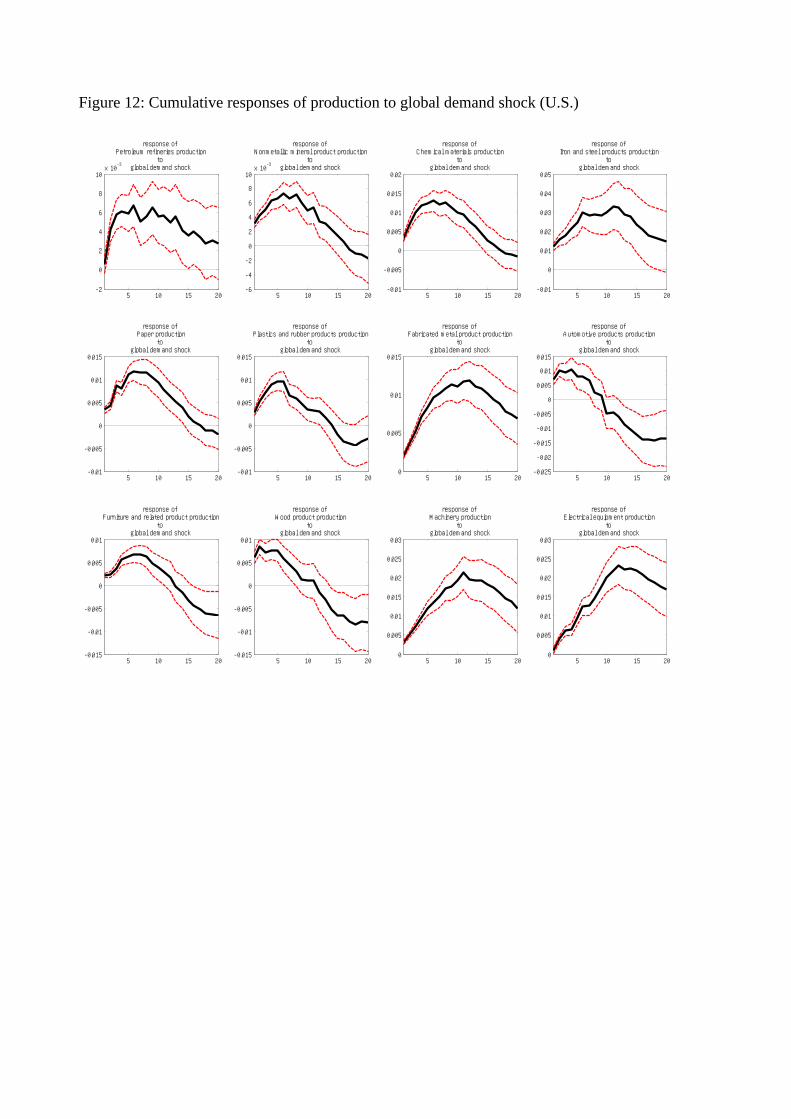
Figure 12: Cumulative responses of production to global demand shock (U.S.)
5 10 15 20-2
0
2
4
6
8
10x 10
-3
response of Petroleum refineries production
to global demand shock
5 10 15 20-6
-4
-2
0
2
4
6
8
10x 10
-3
response of Nonmetallic mineral product production
to global demand shock
5 10 15 20-0.01
-0.005
0
0.005
0.01
0.015
0.02
response of Chemical materials production
to global demand shock
5 10 15 20-0.01
0
0.01
0.02
0.03
0.04
0.05
response of Iron and steel products production
to global demand shock
5 10 15 20-0.01
-0.005
0
0.005
0.01
0.015
response of Paper production
to global demand shock
5 10 15 20-0.01
-0.005
0
0.005
0.01
0.015
response of Plastics and rubber products production
to global demand shock
5 10 15 200
0.005
0.01
0.015
response of Fabricated metal product production
to global demand shock
5 10 15 20-0.025
-0.02
-0.015
-0.01
-0.005
0
0.005
0.01
0.015
response of Automotive products production
to global demand shock
5 10 15 20-0.015
-0.01
-0.005
0
0.005
0.01
response of Furniture and related product production
to global demand shock
5 10 15 20-0.015
-0.01
-0.005
0
0.005
0.01
response of Wood product production
to global demand shock
5 10 15 200
0.005
0.01
0.015
0.02
0.025
0.03
response of Machinery production
to global demand shock
5 10 15 200
0.005
0.01
0.015
0.02
0.025
0.03
response of Electrical equipment production
to global demand shock
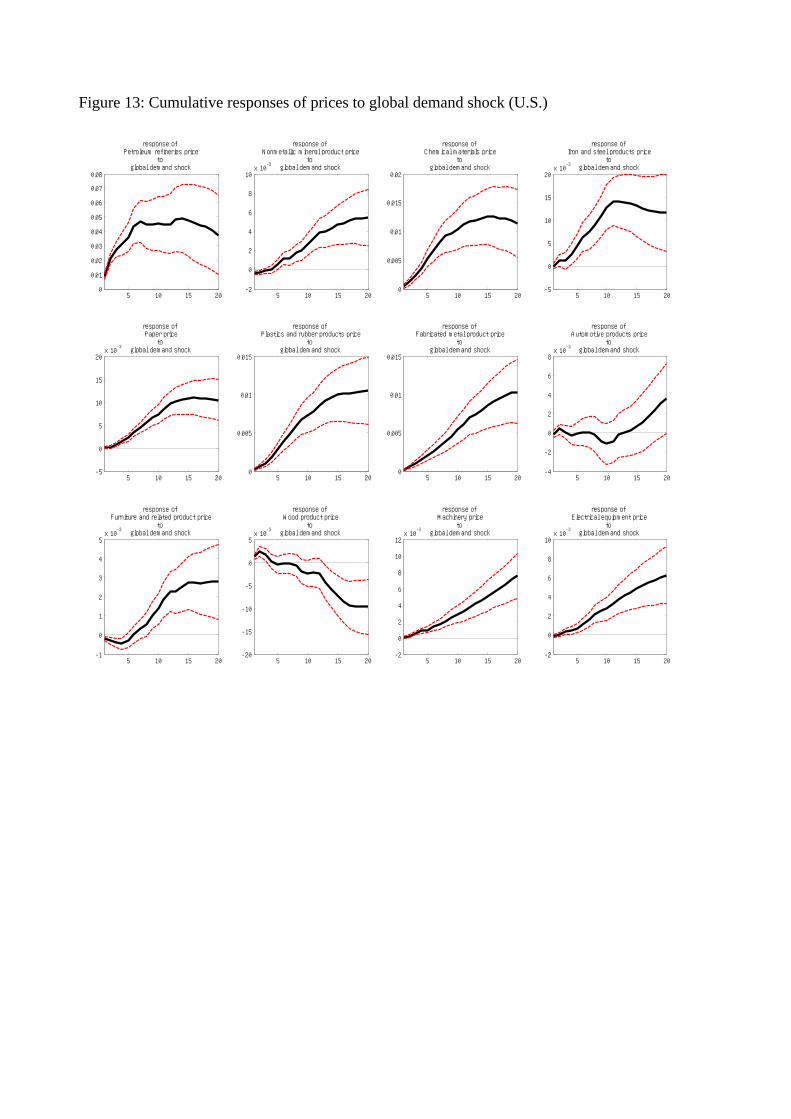
Figure 13: Cumulative responses of prices to global demand shock (U.S.)
5 10 15 200
0.01
0.02
0.03
0.04
0.05
0.06
0.07
0.08
response of Petroleum refineries price
to global demand shock
5 10 15 20-2
0
2
4
6
8
10x 10
-3
response of Nonmetallic mineral product price
to global demand shock
5 10 15 200
0.005
0.01
0.015
0.02
response of Chemical materials price
to global demand shock
5 10 15 20-5
0
5
10
15
20x 10
-3
response of Iron and steel products price
to global demand shock
5 10 15 20-5
0
5
10
15
20x 10
-3
response of Paper priceto
global demand shock
5 10 15 200
0.005
0.01
0.015
response of Plastics and rubber products price
to global demand shock
5 10 15 200
0.005
0.01
0.015
response of Fabricated metal product price
to global demand shock
5 10 15 20-4
-2
0
2
4
6
8x 10
-3
response of Automotive products price
to global demand shock
5 10 15 20-1
0
1
2
3
4
5x 10
-3
response of Furniture and related product price
to global demand shock
5 10 15 20-20
-15
-10
-5
0
5x 10
-3
response of Wood product price
to global demand shock
5 10 15 20-2
0
2
4
6
8
10
12x 10
-3
response of Machinery price
to global demand shock
5 10 15 20-2
0
2
4
6
8
10x 10
-3
response of Electrical equipment price
to global demand shock
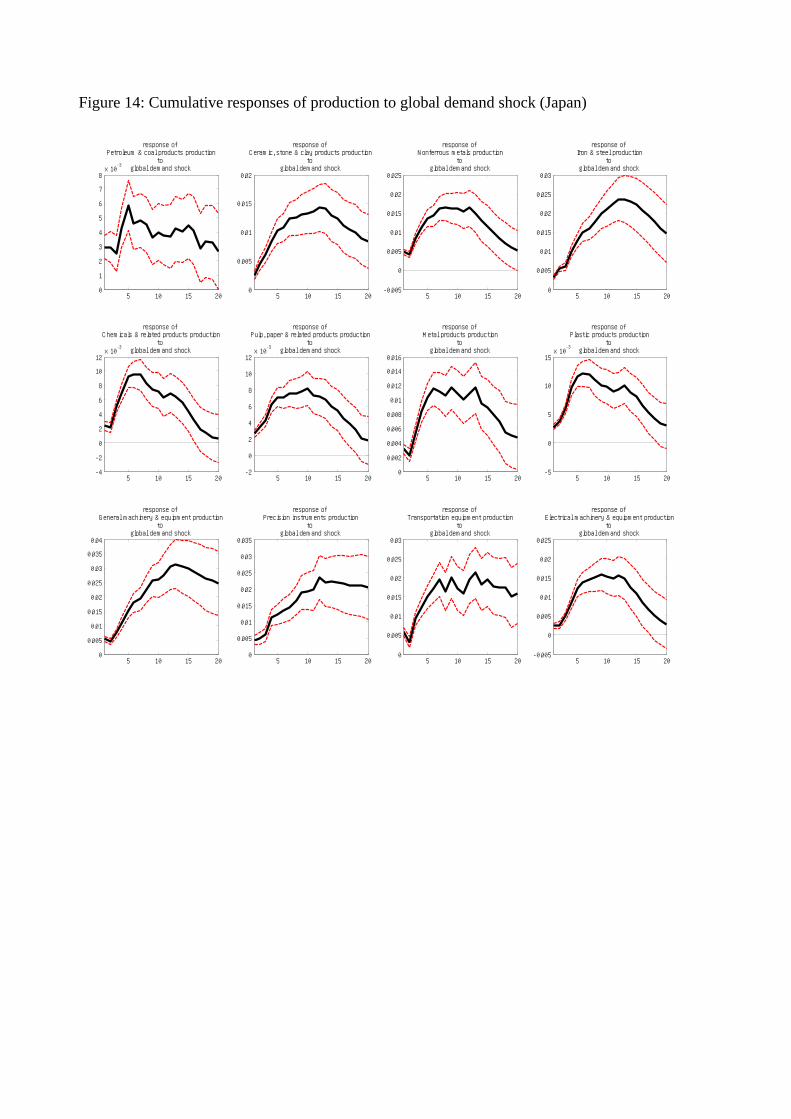
Figure 14: Cumulative responses of production to global demand shock (Japan)
5 10 15 200
1
2
3
4
5
6
7
8x 10
-3
response of Petroleum & coal products production
to global demand shock
5 10 15 200
0.005
0.01
0.015
0.02
response of Ceramic, stone & clay products production
to global demand shock
5 10 15 20-0.005
0
0.005
0.01
0.015
0.02
0.025
response of Nonferrous metals production
to global demand shock
5 10 15 200
0.005
0.01
0.015
0.02
0.025
0.03
response of Iron & steel production
to global demand shock
5 10 15 20-4
-2
0
2
4
6
8
10
12x 10
-3
response of Chemicals & related products production
to global demand shock
5 10 15 20-2
0
2
4
6
8
10
12x 10
-3
response of Pulp, paper & related products production
to global demand shock
5 10 15 200
0.002
0.004
0.006
0.008
0.01
0.012
0.014
0.016
response of Metal products production
to global demand shock
5 10 15 20-5
0
5
10
15x 10
-3
response of Plastic products production
to global demand shock
5 10 15 200
0.005
0.01
0.015
0.02
0.025
0.03
0.035
0.04
response of General machinery & equipment production
to global demand shock
5 10 15 200
0.005
0.01
0.015
0.02
0.025
0.03
0.035
response of Precision instruments production
to global demand shock
5 10 15 200
0.005
0.01
0.015
0.02
0.025
0.03
response of Transportation equipment production
to global demand shock
5 10 15 20-0.005
0
0.005
0.01
0.015
0.02
0.025
response of Electrical machinery & equipment production
to global demand shock
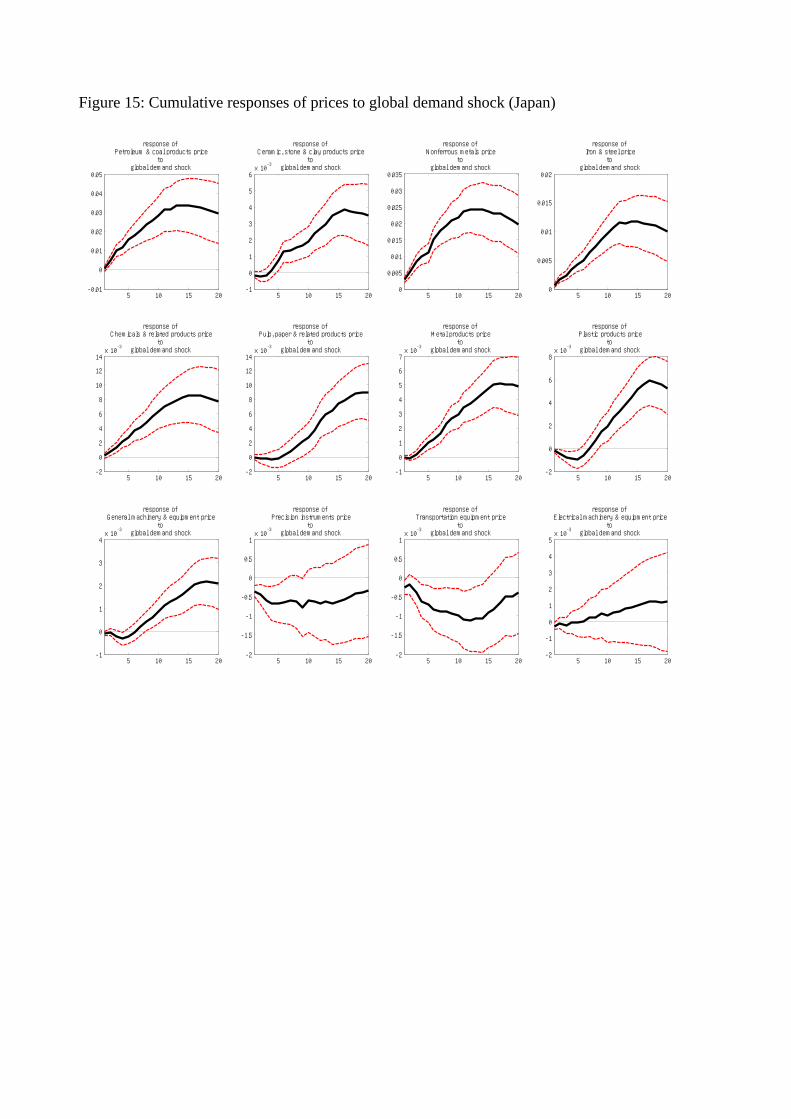
Figure 15: Cumulative responses of prices to global demand shock (Japan)
5 10 15 20-0.01
0
0.01
0.02
0.03
0.04
0.05
response of Petroleum & coal products price
to global demand shock
5 10 15 20-1
0
1
2
3
4
5
6x 10
-3
response of Ceramic, stone & clay products price
to global demand shock
5 10 15 200
0.005
0.01
0.015
0.02
0.025
0.03
0.035
response of Nonferrous metals price
to global demand shock
5 10 15 200
0.005
0.01
0.015
0.02
response of Iron & steel price
to global demand shock
5 10 15 20-2
0
2
4
6
8
10
12
14x 10
-3
response of Chemicals & related products price
to global demand shock
5 10 15 20-2
0
2
4
6
8
10
12
14x 10
-3
response of Pulp, paper & related products price
to global demand shock
5 10 15 20-1
0
1
2
3
4
5
6
7x 10
-3
response of Metal products price
to global demand shock
5 10 15 20-2
0
2
4
6
8x 10
-3
response of Plastic products price
to global demand shock
5 10 15 20-1
0
1
2
3
4x 10
-3
response of General machinery & equipment price
to global demand shock
5 10 15 20-2
-1.5
-1
-0.5
0
0.5
1x 10
-3
response of Precision instruments price
to global demand shock
5 10 15 20-2
-1.5
-1
-0.5
0
0.5
1x 10
-3
response of Transportation equipment price
to global demand shock
5 10 15 20-2
-1
0
1
2
3
4
5x 10
-3
response of Electrical machinery & equipment price
to global demand shock
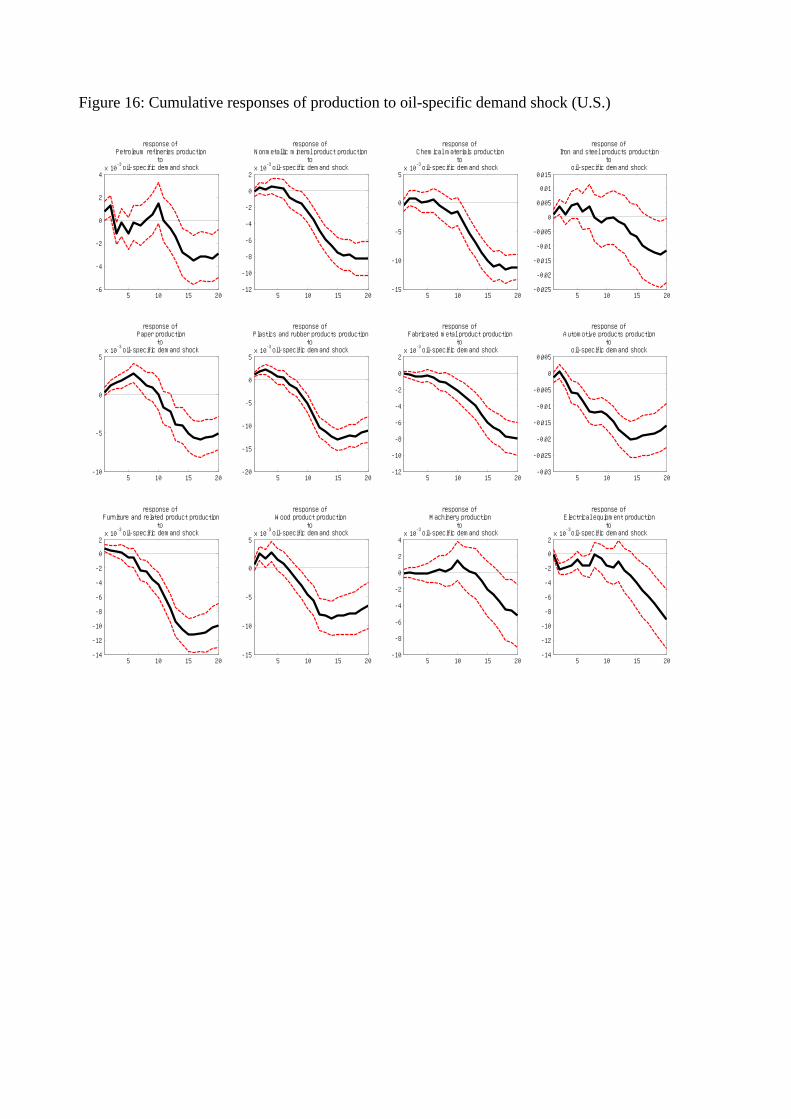
Figure 16: Cumulative responses of production to oil-specific demand shock (U.S.)
5 10 15 20-6
-4
-2
0
2
4x 10
-3
response of Petroleum refineries production
to oil-specific demand shock
5 10 15 20-12
-10
-8
-6
-4
-2
0
2x 10
-3
response of Nonmetallic mineral product production
to oil-specific demand shock
5 10 15 20-15
-10
-5
0
5x 10
-3
response of Chemical materials production
to oil-specific demand shock
5 10 15 20-0.025
-0.02
-0.015
-0.01
-0.005
0
0.005
0.01
0.015
response of Iron and steel products production
to oil-specific demand shock
5 10 15 20-10
-5
0
5x 10
-3
response of Paper production
to oil-specific demand shock
5 10 15 20-20
-15
-10
-5
0
5x 10
-3
response of Plastics and rubber products production
to oil-specific demand shock
5 10 15 20-12
-10
-8
-6
-4
-2
0
2x 10
-3
response of Fabricated metal product production
to oil-specific demand shock
5 10 15 20-0.03
-0.025
-0.02
-0.015
-0.01
-0.005
0
0.005
response of Automotive products production
to oil-specific demand shock
5 10 15 20-14
-12
-10
-8
-6
-4
-2
0
2x 10
-3
response of Furniture and related product production
to oil-specific demand shock
5 10 15 20-15
-10
-5
0
5x 10
-3
response of Wood product production
to oil-specific demand shock
5 10 15 20-10
-8
-6
-4
-2
0
2
4x 10
-3
response of Machinery production
to oil-specific demand shock
5 10 15 20-14
-12
-10
-8
-6
-4
-2
0
2x 10
-3
response of Electrical equipment production
to oil-specific demand shock
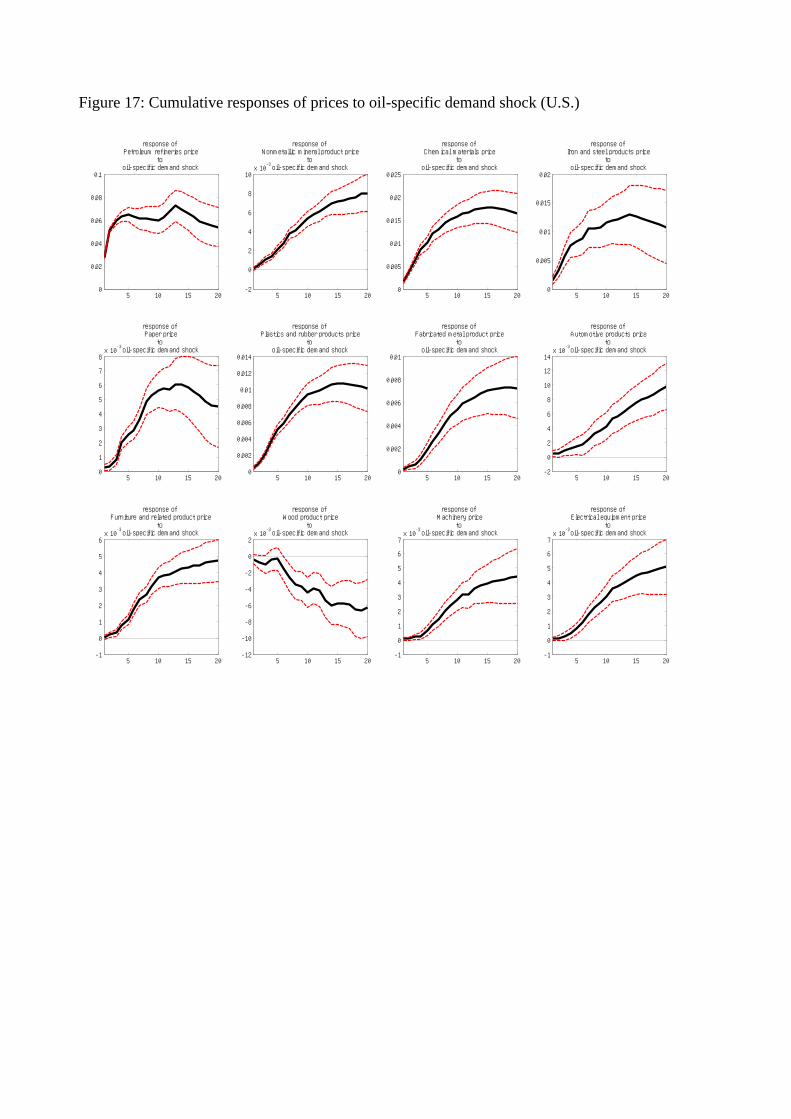
Figure 17: Cumulative responses of prices to oil-specific demand shock (U.S.)
5 10 15 200
0.02
0.04
0.06
0.08
0.1
response of Petroleum refineries price
to oil-specific demand shock
5 10 15 20-2
0
2
4
6
8
10x 10
-3
response of Nonmetallic mineral product price
to oil-specific demand shock
5 10 15 200
0.005
0.01
0.015
0.02
0.025
response of Chemical materials price
to oil-specific demand shock
5 10 15 200
0.005
0.01
0.015
0.02
response of Iron and steel products price
to oil-specific demand shock
5 10 15 200
1
2
3
4
5
6
7
8x 10
-3
response of Paper priceto
oil-specific demand shock
5 10 15 200
0.002
0.004
0.006
0.008
0.01
0.012
0.014
response of Plastics and rubber products price
to oil-specific demand shock
5 10 15 200
0.002
0.004
0.006
0.008
0.01
response of Fabricated metal product price
to oil-specific demand shock
5 10 15 20-2
0
2
4
6
8
10
12
14x 10
-3
response of Automotive products price
to oil-specific demand shock
5 10 15 20-1
0
1
2
3
4
5
6x 10
-3
response of Furniture and related product price
to oil-specific demand shock
5 10 15 20-12
-10
-8
-6
-4
-2
0
2x 10
-3
response of Wood product price
to oil-specific demand shock
5 10 15 20-1
0
1
2
3
4
5
6
7x 10
-3
response of Machinery price
to oil-specific demand shock
5 10 15 20-1
0
1
2
3
4
5
6
7x 10
-3
response of Electrical equipment price
to oil-specific demand shock
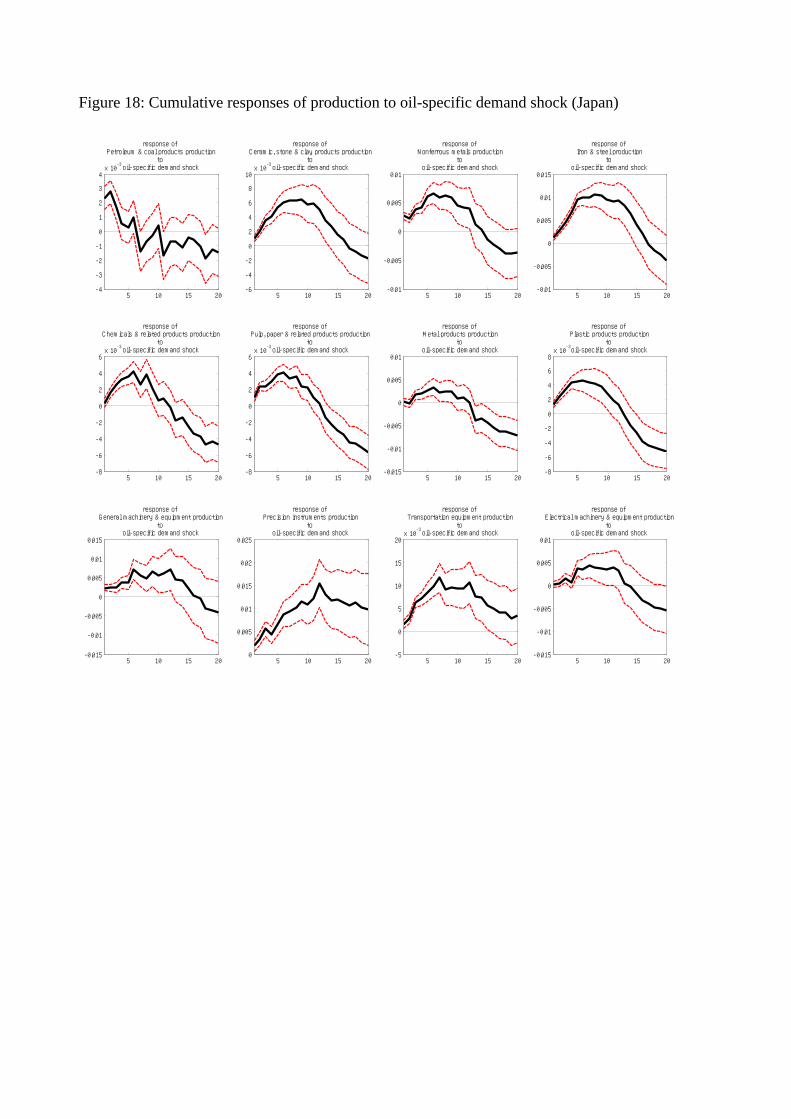
Figure 18: Cumulative responses of production to oil-specific demand shock (Japan)
5 10 15 20-4
-3
-2
-1
0
1
2
3
4x 10
-3
response of Petroleum & coal products production
to oil-specific demand shock
5 10 15 20-6
-4
-2
0
2
4
6
8
10x 10
-3
response of Ceramic, stone & clay products production
to oil-specific demand shock
5 10 15 20-0.01
-0.005
0
0.005
0.01
response of Nonferrous metals production
to oil-specific demand shock
5 10 15 20-0.01
-0.005
0
0.005
0.01
0.015
response of Iron & steel production
to oil-specific demand shock
5 10 15 20-8
-6
-4
-2
0
2
4
6x 10
-3
response of Chemicals & related products production
to oil-specific demand shock
5 10 15 20-8
-6
-4
-2
0
2
4
6x 10
-3
response of Pulp, paper & related products production
to oil-specific demand shock
5 10 15 20-0.015
-0.01
-0.005
0
0.005
0.01
response of Metal products production
to oil-specific demand shock
5 10 15 20-8
-6
-4
-2
0
2
4
6
8x 10
-3
response of Plastic products production
to oil-specific demand shock
5 10 15 20-0.015
-0.01
-0.005
0
0.005
0.01
0.015
response of General machinery & equipment production
to oil-specific demand shock
5 10 15 200
0.005
0.01
0.015
0.02
0.025
response of Precision instruments production
to oil-specific demand shock
5 10 15 20-5
0
5
10
15
20x 10
-3
response of Transportation equipment production
to oil-specific demand shock
5 10 15 20-0.015
-0.01
-0.005
0
0.005
0.01
response of Electrical machinery & equipment production
to oil-specific demand shock
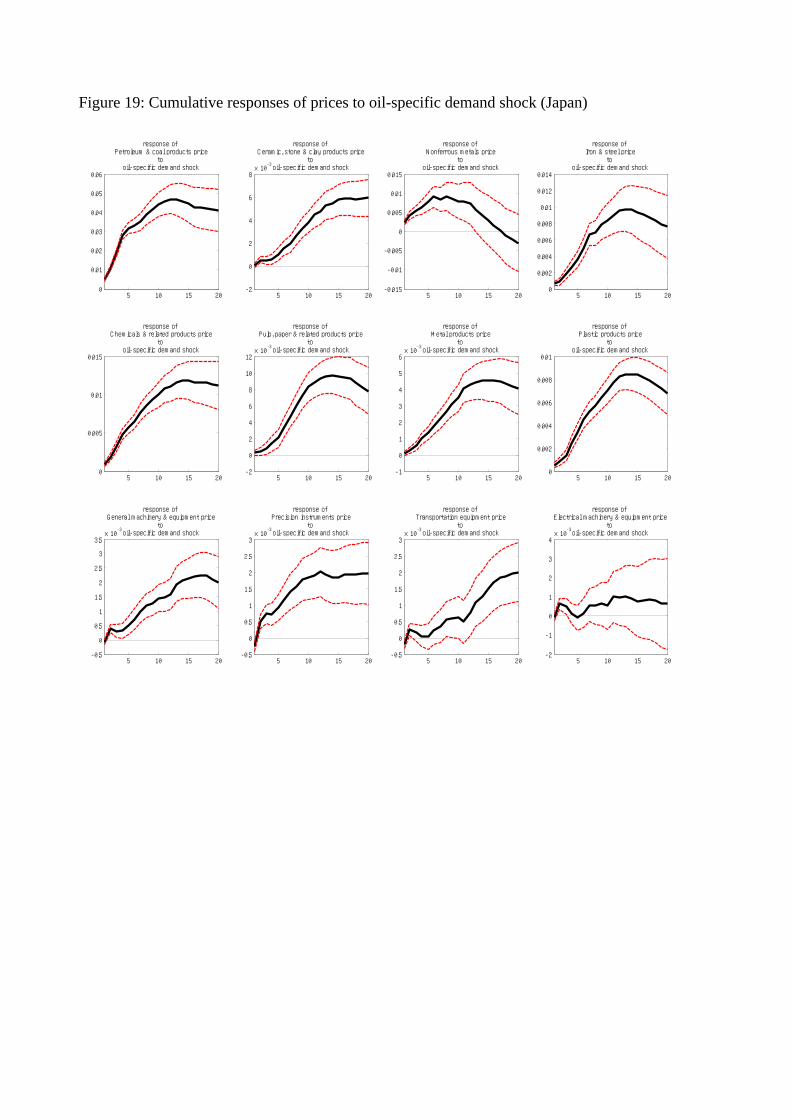
Figure 19: Cumulative responses of prices to oil-specific demand shock (Japan)
5 10 15 200
0.01
0.02
0.03
0.04
0.05
0.06
response of Petroleum & coal products price
to oil-specific demand shock
5 10 15 20-2
0
2
4
6
8x 10
-3
response of Ceramic, stone & clay products price
to oil-specific demand shock
5 10 15 20-0.015
-0.01
-0.005
0
0.005
0.01
0.015
response of Nonferrous metals price
to oil-specific demand shock
5 10 15 200
0.002
0.004
0.006
0.008
0.01
0.012
0.014
response of Iron & steel price
to oil-specific demand shock
5 10 15 200
0.005
0.01
0.015
response of Chemicals & related products price
to oil-specific demand shock
5 10 15 20-2
0
2
4
6
8
10
12x 10
-3
response of Pulp, paper & related products price
to oil-specific demand shock
5 10 15 20-1
0
1
2
3
4
5
6x 10
-3
response of Metal products price
to oil-specific demand shock
5 10 15 200
0.002
0.004
0.006
0.008
0.01
response of Plastic products price
to oil-specific demand shock
5 10 15 20-0.5
0
0.5
1
1.5
2
2.5
3
3.5x 10
-3
response of General machinery & equipment price
to oil-specific demand shock
5 10 15 20-0.5
0
0.5
1
1.5
2
2.5
3x 10
-3
response of Precision instruments price
to oil-specific demand shock
5 10 15 20-0.5
0
0.5
1
1.5
2
2.5
3x 10
-3
response of Transportation equipment price
to oil-specific demand shock
5 10 15 20-2
-1
0
1
2
3
4x 10
-3
response of Electrical machinery & equipment price
to oil-specific demand shock
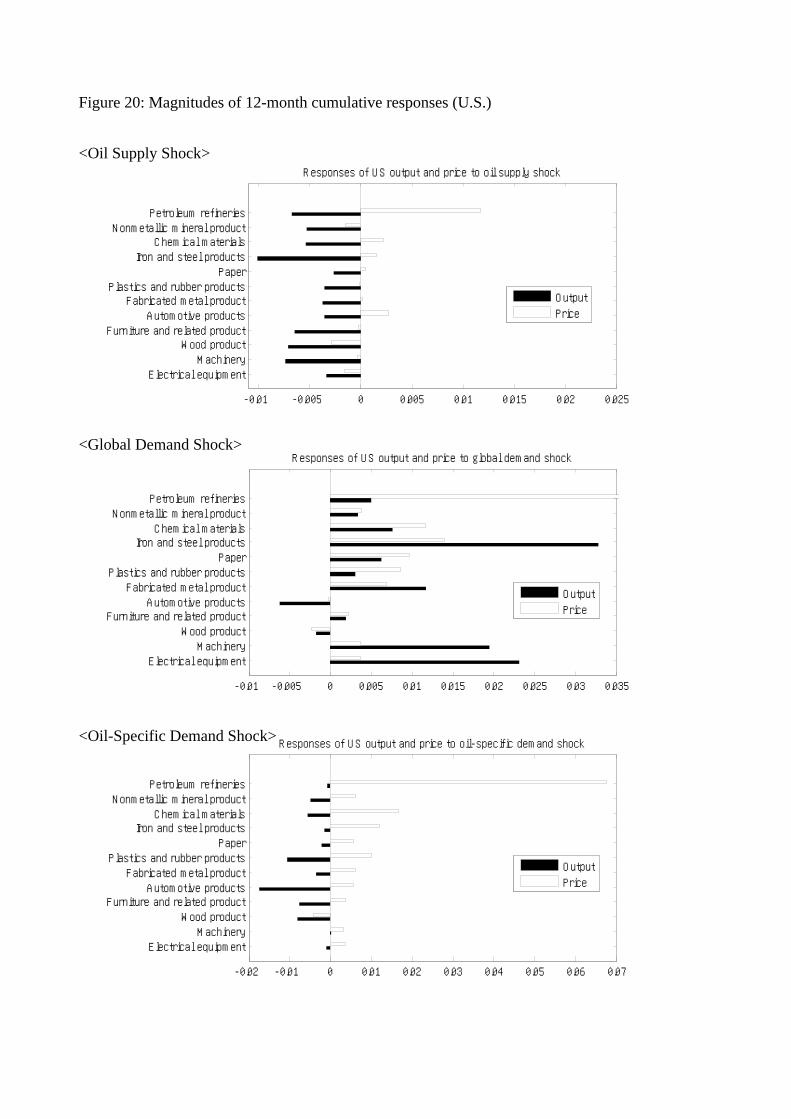
Figure 20: Magnitudes of 12-month cumulative responses (U.S.)
<Oil Supply Shock>
<Global Demand Shock>
<Oil-Specific Demand Shock>
-0.01 -0.005 0 0.005 0.01 0.015 0.02 0.025
Electrical equipmentMachinery
Wood productFurniture and related product
Automotive productsFabricated metal product
Plastics and rubber productsPaper
Iron and steel productsChemical materials
Nonmetallic mineral productPetroleum refineries
Responses of US output and price to oil supply shock
Output
Price
-0.01 -0.005 0 0.005 0.01 0.015 0.02 0.025 0.03 0.035
Electrical equipmentMachinery
Wood productFurniture and related product
Automotive productsFabricated metal product
Plastics and rubber productsPaper
Iron and steel productsChemical materials
Nonmetallic mineral productPetroleum refineries
Responses of US output and price to global demand shock
Output
Price
-0.02 -0.01 0 0.01 0.02 0.03 0.04 0.05 0.06 0.07
Electrical equipmentMachinery
Wood productFurniture and related product
Automotive productsFabricated metal product
Plastics and rubber productsPaper
Iron and steel productsChemical materials
Nonmetallic mineral productPetroleum refineries
Responses of US output and price to oil-specific demand shock
Output
Price
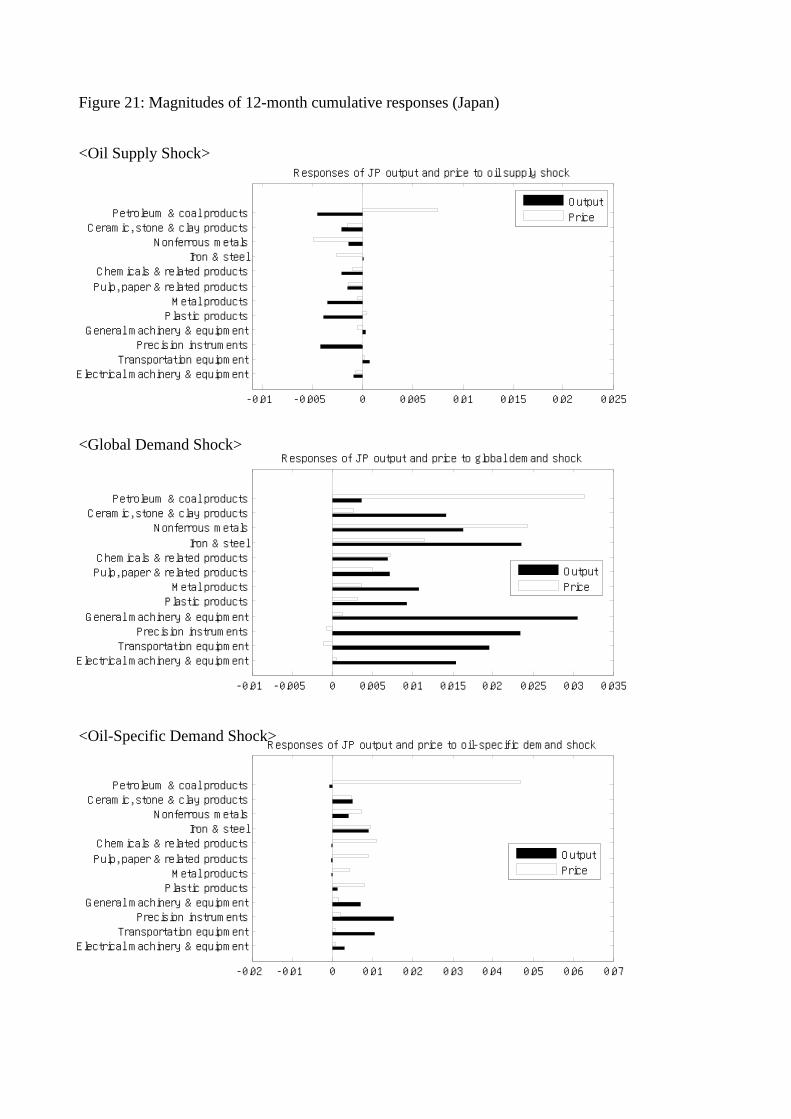
Figure 21: Magnitudes of 12-month cumulative responses (Japan)
<Oil Supply Shock>
<Global Demand Shock>
<Oil-Specific Demand Shock>
-0.01 -0.005 0 0.005 0.01 0.015 0.02 0.025
Electrical machinery & equipmentTransportation equipmentPrecision instruments
General machinery & equipmentPlastic productsMetal products
Pulp, paper & related products
Chemicals & related productsIron & steel
Nonferrous metalsCeramic, stone & clay products
Petroleum & coal products
Responses of JP output and price to oil supply shock
Output
Price
-0.01 -0.005 0 0.005 0.01 0.015 0.02 0.025 0.03 0.035
Electrical machinery & equipmentTransportation equipmentPrecision instruments
General machinery & equipment
Plastic productsMetal products
Pulp, paper & related productsChemicals & related products
Iron & steel
Nonferrous metalsCeramic, stone & clay products
Petroleum & coal products
Responses of JP output and price to global demand shock
Output
Price
-0.02 -0.01 0 0.01 0.02 0.03 0.04 0.05 0.06 0.07
Electrical machinery & equipmentTransportation equipmentPrecision instruments
General machinery & equipmentPlastic productsMetal products
Pulp, paper & related products
Chemicals & related productsIron & steel
Nonferrous metalsCeramic, stone & clay products
Petroleum & coal products
Responses of JP output and price to oil-specific demand shock
Output
Price
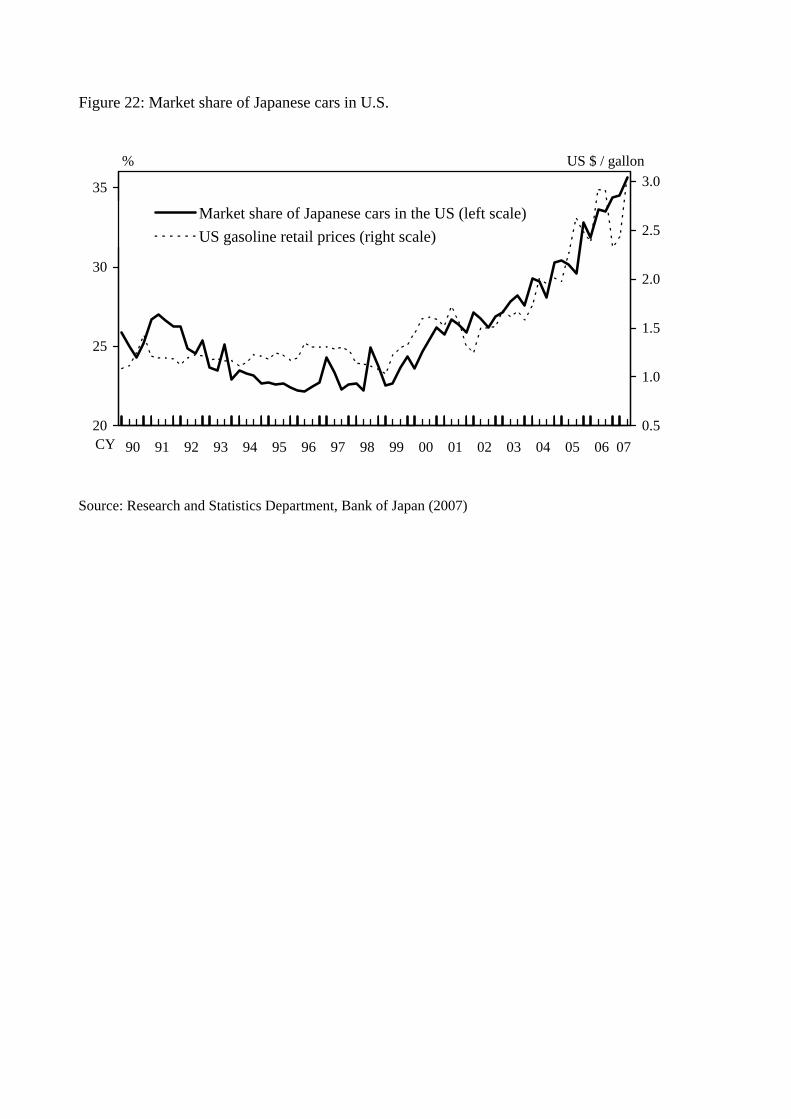
Figure 22: Market share of Japanese cars in U.S.
Source: Research and Statistics Department, Bank of Japan (2007)
20
25
30
35
90 91 92 93 94 95 96 97 98 99 00 01 02 03 04 05 06 070.5
1.0
1.5
2.0
2.5
3.0
Market share of Japanese cars in the US (left scale)US gasoline retail prices (right scale)
CY
% US $ / gallon
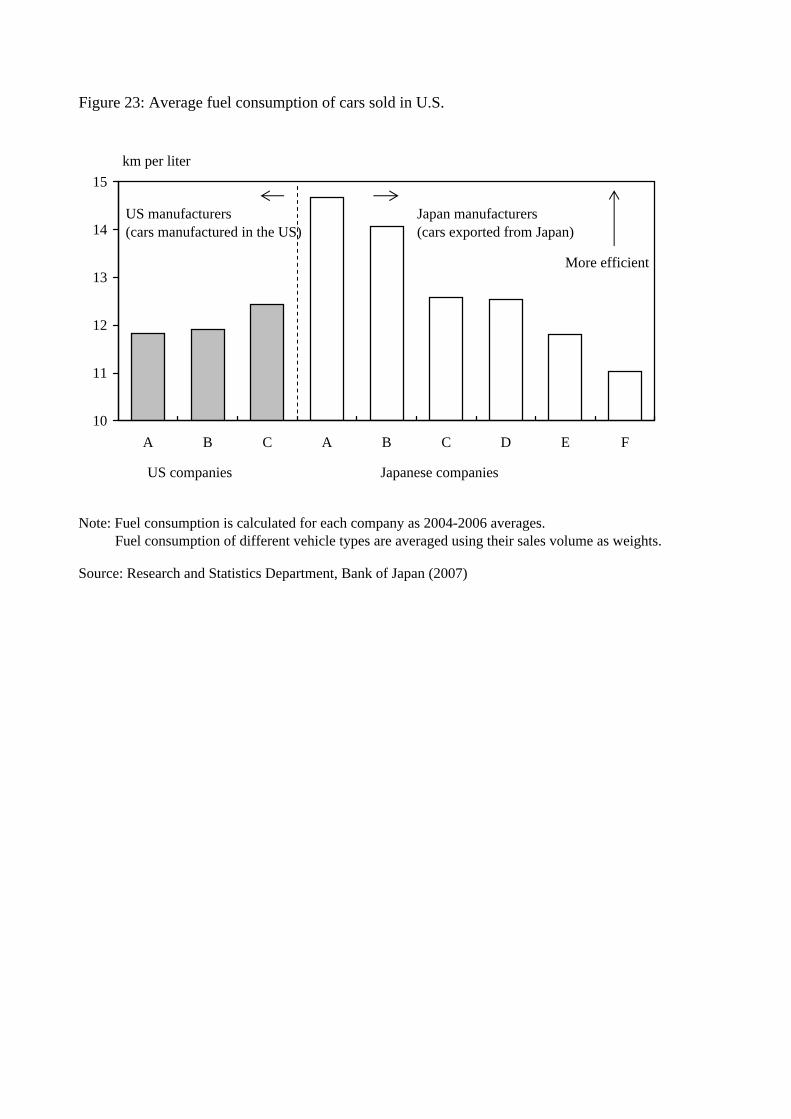
Figure 23: Average fuel consumption of cars sold in U.S.
Note: Fuel consumption is calculated for each company as 2004-2006 averages. Fuel consumption of different vehicle types are averaged using their sales volume as weights.
Source: Research and Statistics Department, Bank of Japan (2007)
10
11
12
13
14
15
A B C A B C D E F
km per liter
US manufacturers(cars manufactured in the US)
Japan manufacturers(cars exported from Japan)
More efficient
US companies Japanese companies
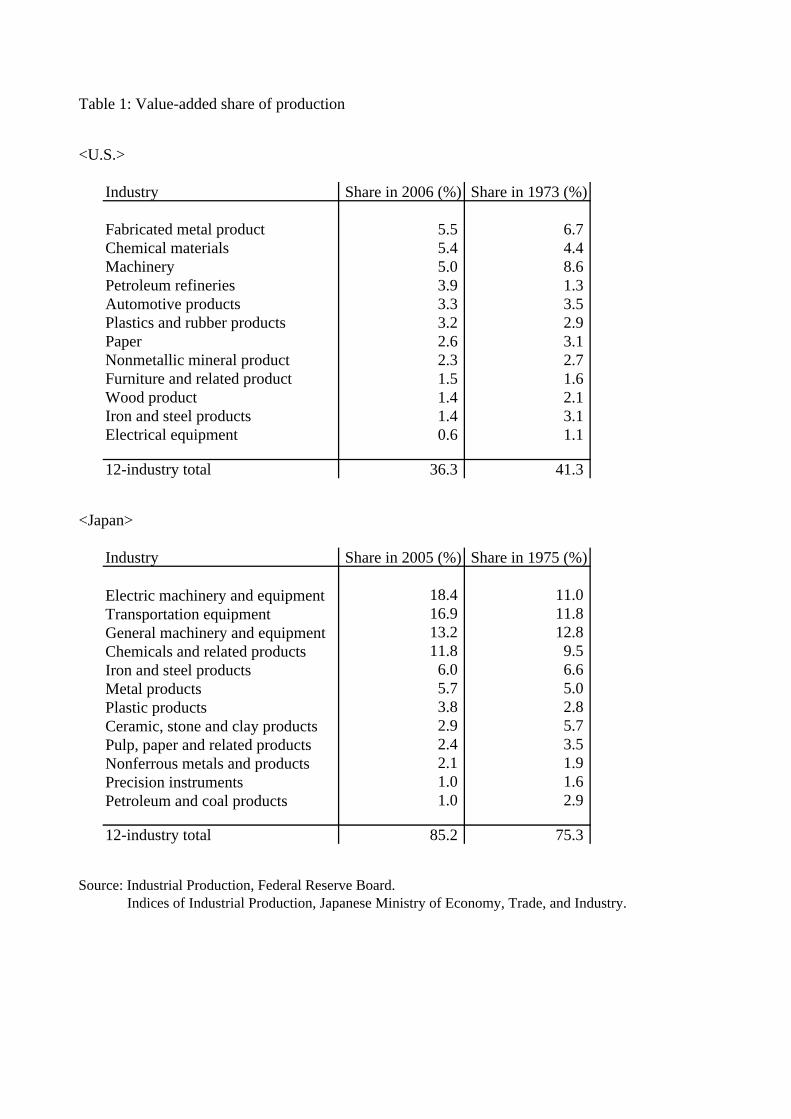
Table 1: Value-added share of production
<U.S.>
Industry Share in 2006 (%) Share in 1973 (%)
Fabricated metal product 5.5 6.7Chemical materials 5.4 4.4Machinery 5.0 8.6Petroleum refineries 3.9 1.3Automotive products 3.3 3.5Plastics and rubber products 3.2 2.9Paper 2.6 3.1Nonmetallic mineral product 2.3 2.7Furniture and related product 1.5 1.6Wood product 1.4 2.1Iron and steel products 1.4 3.1Electrical equipment 0.6 1.1
12-industry total 36.3 41.3
<Japan>
Industry Share in 2005 (%) Share in 1975 (%)
Electric machinery and equipment 18.4 11.0Transportation equipment 16.9 11.8General machinery and equipment 13.2 12.8Chemicals and related products 11.8 9.5Iron and steel products 6.0 6.6Metal products 5.7 5.0Plastic products 3.8 2.8Ceramic, stone and clay products 2.9 5.7Pulp, paper and related products 2.4 3.5Nonferrous metals and products 2.1 1.9Precision instruments 1.0 1.6Petroleum and coal products 1.0 2.9
12-industry total 85.2 75.3
Source: Industrial Production, Federal Reserve Board. Indices of Industrial Production, Japanese Ministry of Economy, Trade, and Industry.
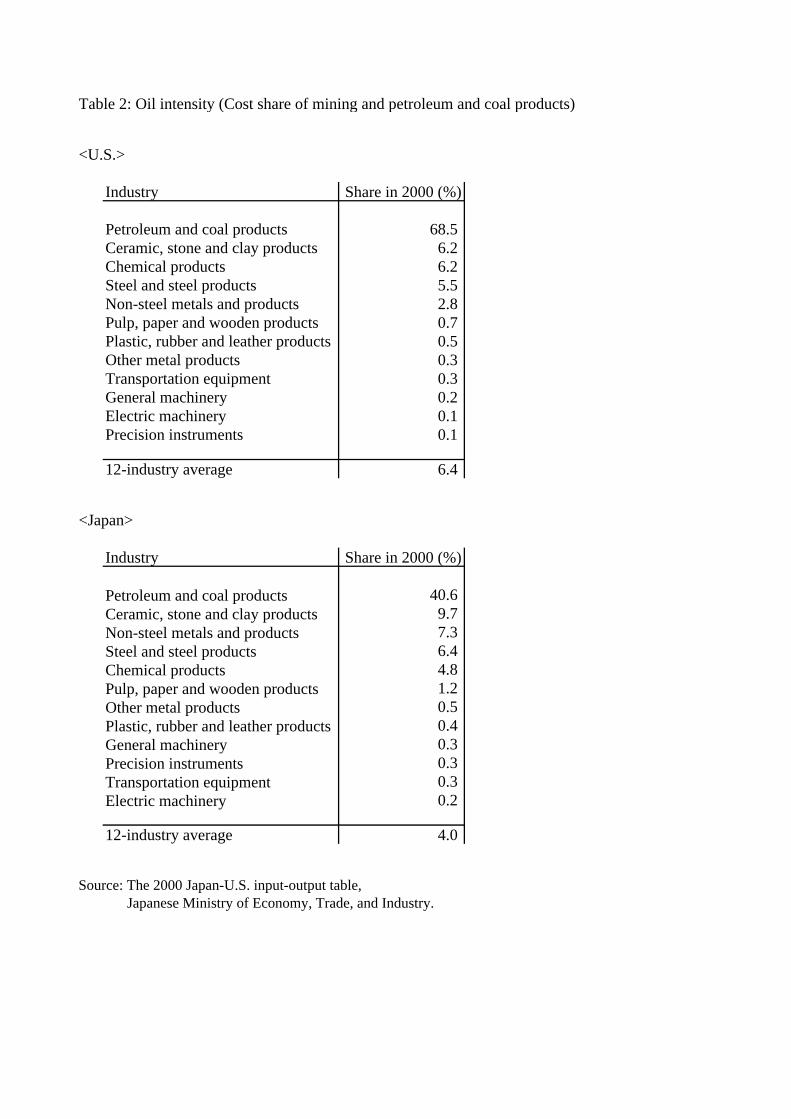
Table 2: Oil intensity (Cost share of mining and petroleum and coal products)
<U.S.>
Industry Share in 2000 (%)
Petroleum and coal products 68.5Ceramic, stone and clay products 6.2Chemical products 6.2Steel and steel products 5.5Non-steel metals and products 2.8Pulp, paper and wooden products 0.7Plastic, rubber and leather products 0.5Other metal products 0.3Transportation equipment 0.3General machinery 0.2Electric machinery 0.1Precision instruments 0.1
12-industry average 6.4
<Japan>
Industry Share in 2000 (%)
Petroleum and coal products 40.6Ceramic, stone and clay products 9.7Non-steel metals and products 7.3Steel and steel products 6.4Chemical products 4.8Pulp, paper and wooden products 1.2Other metal products 0.5Plastic, rubber and leather products 0.4General machinery 0.3Precision instruments 0.3Transportation equipment 0.3Electric machinery 0.2
12-industry average 4.0
Source: The 2000 Japan-U.S. input-output table, Japanese Ministry of Economy, Trade, and Industry.
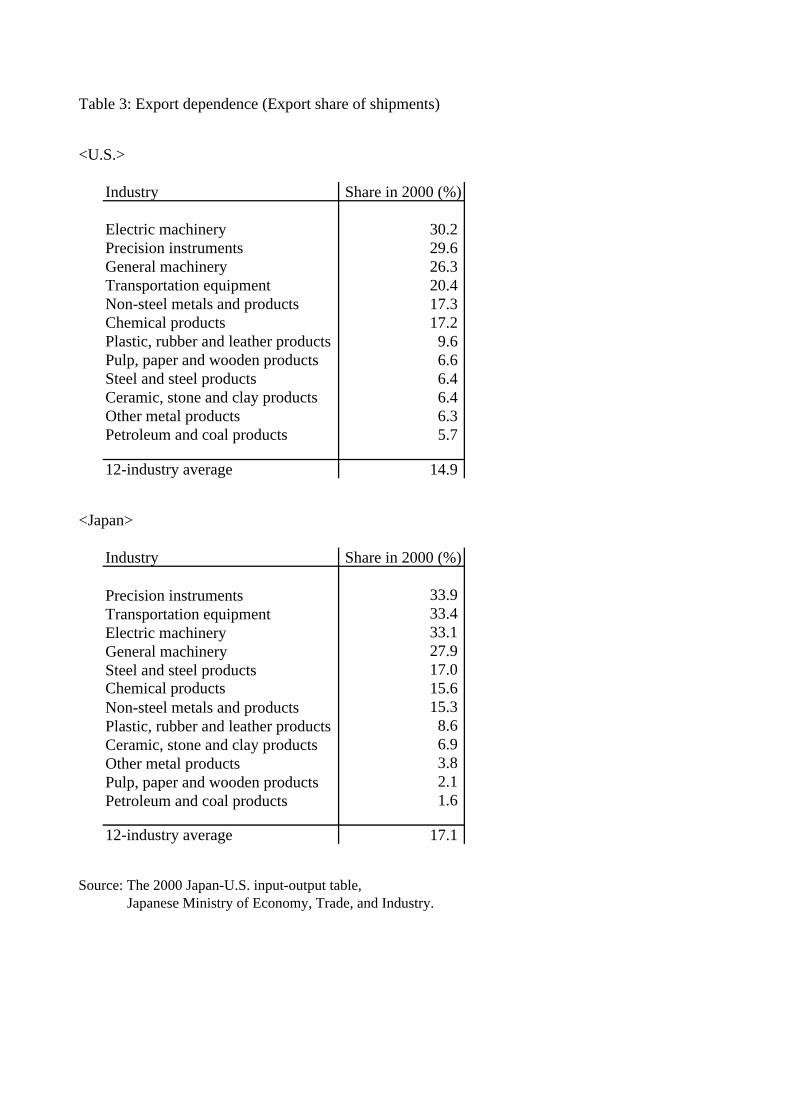
Table 3: Export dependence (Export share of shipments)
<U.S.>
Industry Share in 2000 (%)
Electric machinery 30.2Precision instruments 29.6General machinery 26.3Transportation equipment 20.4Non-steel metals and products 17.3Chemical products 17.2Plastic, rubber and leather products 9.6Pulp, paper and wooden products 6.6Steel and steel products 6.4Ceramic, stone and clay products 6.4Other metal products 6.3Petroleum and coal products 5.7
12-industry average 14.9
<Japan>
Industry Share in 2000 (%)
Precision instruments 33.9Transportation equipment 33.4Electric machinery 33.1General machinery 27.9Steel and steel products 17.0Chemical products 15.6Non-steel metals and products 15.3Plastic, rubber and leather products 8.6Ceramic, stone and clay products 6.9Other metal products 3.8Pulp, paper and wooden products 2.1Petroleum and coal products 1.6
12-industry average 17.1
Source: The 2000 Japan-U.S. input-output table, Japanese Ministry of Economy, Trade, and Industry.
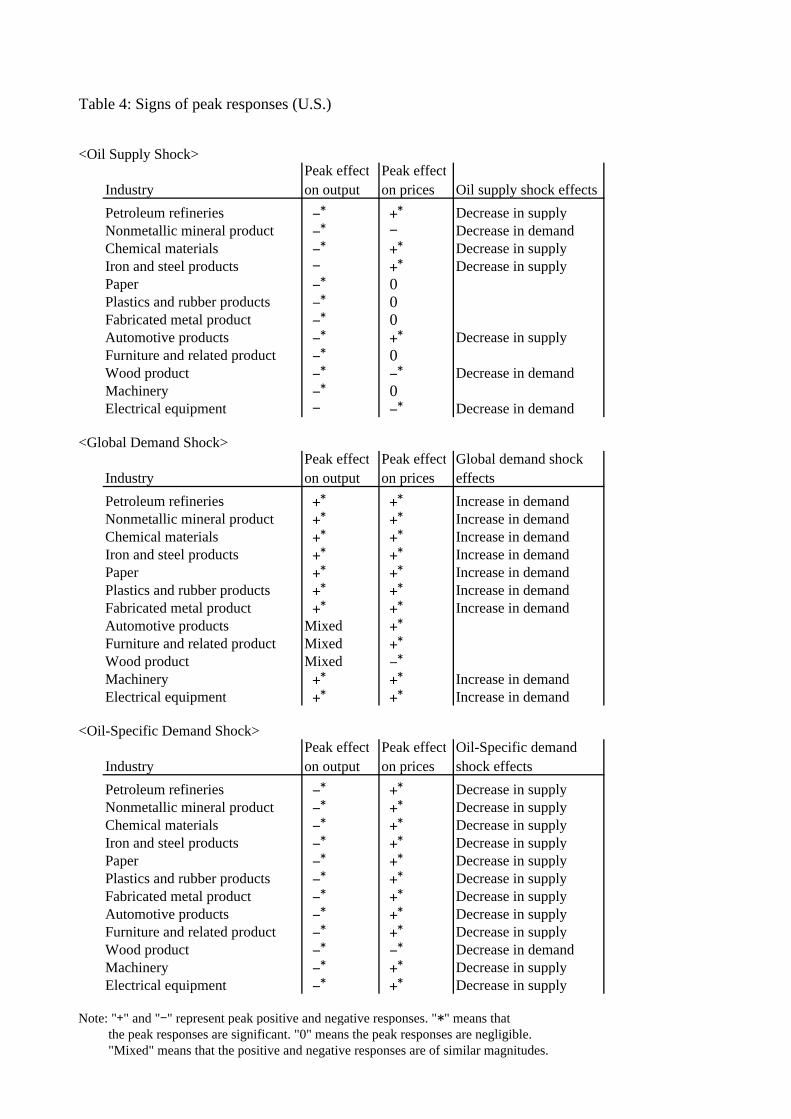
Table 4: Signs of peak responses (U.S.)
<Oil Supply Shock>Peak effect Peak effect
Industry on output on prices Oil supply shock effectsPetroleum refineries -
*+* Decrease in supply
Nonmetallic mineral product -* - Decrease in demand
Chemical materials -*
+* Decrease in supply
Iron and steel products - +* Decrease in supply
Paper -* 0
Plastics and rubber products -* 0
Fabricated metal product -* 0
Automotive products -*
+* Decrease in supply
Furniture and related product -* 0
Wood product -*
-* Decrease in demand
Machinery -* 0
Electrical equipment - -* Decrease in demand
<Global Demand Shock>Peak effect Peak effect Global demand shock
Industry on output on prices effectsPetroleum refineries +
*+* Increase in demand
Nonmetallic mineral product +*
+* Increase in demand
Chemical materials +*
+* Increase in demand
Iron and steel products +*
+* Increase in demand
Paper +*
+* Increase in demand
Plastics and rubber products +*
+* Increase in demand
Fabricated metal product +*
+* Increase in demand
Automotive products Mixed +*
Furniture and related product Mixed +*
Wood product Mixed -*
Machinery +*
+* Increase in demand
Electrical equipment +*
+* Increase in demand
<Oil-Specific Demand Shock>Peak effect Peak effect Oil-Specific demand
Industry on output on prices shock effectsPetroleum refineries -
*+* Decrease in supply
Nonmetallic mineral product -*
+* Decrease in supply
Chemical materials -*
+* Decrease in supply
Iron and steel products -*
+* Decrease in supply
Paper -*
+* Decrease in supply
Plastics and rubber products -*
+* Decrease in supply
Fabricated metal product -*
+* Decrease in supply
Automotive products -*
+* Decrease in supply
Furniture and related product -*
+* Decrease in supply
Wood product -*
-* Decrease in demand
Machinery -*
+* Decrease in supply
Electrical equipment -*
+* Decrease in supply
Note: "+" and "-" represent peak positive and negative responses. "*" means that the peak responses are significant. "0" means the peak responses are negligible. "Mixed" means that the positive and negative responses are of similar magnitudes.
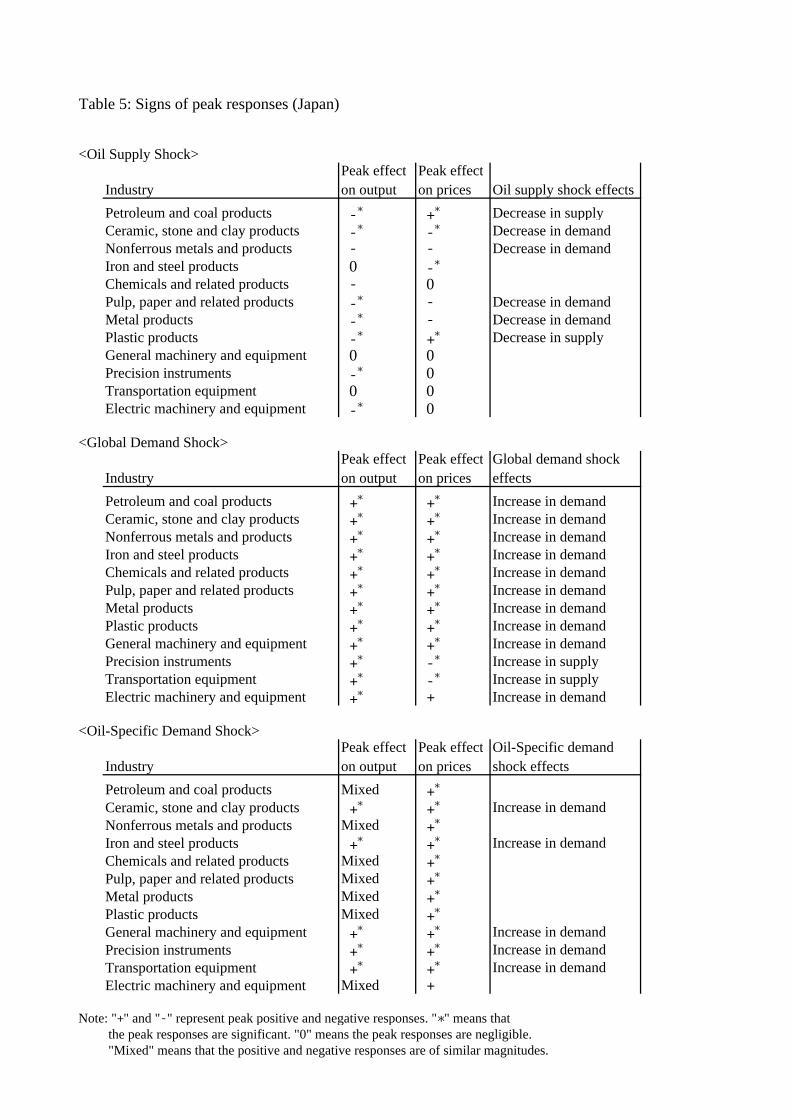
Table 5: Signs of peak responses (Japan)
<Oil Supply Shock>Peak effect Peak effect
Industry on output on prices Oil supply shock effectsPetroleum and coal products -
*+* Decrease in supply
Ceramic, stone and clay products -*
-* Decrease in demand
Nonferrous metals and products - - Decrease in demandIron and steel products 0 -
*
Chemicals and related products - 0Pulp, paper and related products -
* - Decrease in demandMetal products -
* - Decrease in demandPlastic products -
*+* Decrease in supply
General machinery and equipment 0 0Precision instruments -
* 0Transportation equipment 0 0Electric machinery and equipment -
* 0
<Global Demand Shock>Peak effect Peak effect Global demand shock
Industry on output on prices effectsPetroleum and coal products +
*+* Increase in demand
Ceramic, stone and clay products +*
+* Increase in demand
Nonferrous metals and products +*
+* Increase in demand
Iron and steel products +*
+* Increase in demand
Chemicals and related products +*
+* Increase in demand
Pulp, paper and related products +*
+* Increase in demand
Metal products +*
+* Increase in demand
Plastic products +*
+* Increase in demand
General machinery and equipment +*
+* Increase in demand
Precision instruments +*
-* Increase in supply
Transportation equipment +*
-* Increase in supply
Electric machinery and equipment +* + Increase in demand
<Oil-Specific Demand Shock>Peak effect Peak effect Oil-Specific demand
Industry on output on prices shock effectsPetroleum and coal products Mixed +
*
Ceramic, stone and clay products +*
+* Increase in demand
Nonferrous metals and products Mixed +*
Iron and steel products +*
+* Increase in demand
Chemicals and related products Mixed +*
Pulp, paper and related products Mixed +*
Metal products Mixed +*
Plastic products Mixed +*
General machinery and equipment +*
+* Increase in demand
Precision instruments +*
+* Increase in demand
Transportation equipment +*
+* Increase in demand
Electric machinery and equipment Mixed +
Note: "+" and "-" represent peak positive and negative responses. "*" means that the peak responses are significant. "0" means the peak responses are negligible. "Mixed" means that the positive and negative responses are of similar magnitudes.