Embed Size (px)
Citation preview

THE EFFECTS OF MODERATE CALORIC RESTRICTION AND EXERCISE ON BODY MASS, WAIST TO HIP RATIO, AND
VISCERAL FAT DISTRIBUTION
Chung-Bang Weng
A plan B paper submitted in partial fulfillment of the requirements for the degree of
Master of Arts
Department of Physical Education and Sports
Central Michigan University Mount Pleasant, Michigan
May, 2000

TABLE OF CONTENTS
INTRODUCTION .............................................................................................................. 2
REVIEW OF RELATED LITERATURE........................................................................... 3
METHODS ......................................................................................................................... 5
RESULTS............................................................................................................................ 8
DISCUSSION................................................................................................................... 12
Appendix A ....................................................................................................................... 13
Appendix B ....................................................................................................................... 17
Appendix C ....................................................................................................................... 21
Appendix D....................................................................................................................... 25
Appendix E ....................................................................................................................... 29
BIBLIOGRAPHY............................................................................................................. 31
0 1

INTRODUCTION
Obesity has become a prevalent health problem in the United States of America and
has expanded to the whole world in recent years. Although obesity is not an acute
disease, it is identified as a risk factor for some diseases, such as hypertension,
cardiovascular disease, cancers, and diabetes (ACSM-CDC, 1995). Clearly, a reduction
in body weight would be beneficial for the regression of these diseases, especially a
reduction in the visceral adipose tissue. Egger (1992) reviewed studies which showed a
clear association between abdominal obesity and a range of ailments including coronary
events, hypertension, blood lipid level, cholecystectomy, diabetes, and gallbladder
disease. He concluded that the association between waist to hip ratio and risk indicators
appears to be “dose” related. Therefore, weight management should be a major focus in
the public health arena. The main factors of this health problem are eating disorders and
sedentary lifestyles. According to the National Cholesterol Educational Program
(NCEP), caloric restriction, physical activity and behavior modification are the best ways
to fight against obesity. A comprehensive weight loss program should include each of
these aspects. Several aspects of the comorbidities of overweight and obesity are being
explored to indicate that the visceral fat distribution is related to several chronic diseases,
such as hypertension, coronary heart disease, and diabetes. Recent study indicated
several methods to predict the visceral fat distribution, such as computer tomography,
waist circumference, waist to hip ratio, and sagittal diameter. The result of this study
will hopefully lead to a better understanding of the weight loss effect on visceral fat
distribution, which will be examined by waist circumference, waist to hip ratio, and
sagittal diameter.
0 2

REVIEW OF RELATED LITERATURE
Energy Restriction and Weight Loss
The restriction of energy intake has long been utilized as effective means of weight
loss. Furthermore, the degree of caloric restriction is related to the magnitude of weight
reduction. Smith and Zachwieja (1999) reviewed the obesity intervention strategies
regarding the effect of caloric restriction, pharmacological intervention, and exercise to
promote the loss of visceral adipose tissue (VAT). They found that VLCDs and LCDs
usually parallels the rate of weight loss, and does not appear to influence the VAT and fat
mass rate. However, there are strong data to support that VAT decrease significantly.
Exercise and Weight Loss
In order for weight loss to be successful, a negative energy balance must be achieved.
That is, caloric expenditure must be greater than caloric intake. Houmard et al. (1993)
investigated the effects of exercise training on absolute and relative measurements of
regional adiposity. The exercise training program consisted of ground and/or treadmill
walking and /or running 70-80% of maximal heart rate three days a week. There were
significant reductions in sagittal diameter, waist circumference, and WHR. In addition,
the exercise program resulted in a reduction of these girths in virtually all of the subjects.
Weight Loss and Changes in Waist, Hip and WHR
The body composition should change since energy restriction and exercise improved
the weight loss. As long as body weight changed, fat distribution would change as well.
Waist circumference and WHR are the easy methods to determine this change. A study
by Kahn, Young, and Gelskey (1996) showed WHR is an index of central obesity.
There is also evidence that people with large waists may be at high risk of disease and
have greater difficulty performing routine daily tasks.
0 3

A study by Caan, et al. (1994) investigated the changes in measurements of body fat
distribution accompanying weight change. The results did not show a significant
decrease in waist circumference and WHR with body weight loss; however, the results
suggested that weight gain is almost always accompanied by a significant increase in
WHR.
Weight Loss and Visceral Fat Distribution
Computerized Tomography (CT), is a precise tool to assess the visceral fat
distribution. Because of the high price of CT, sagittal diameter measurement is an
alternative method to assess the visceral fat distribution when the research budget is
limited. Tornaghi et al. (1994) compared CT (L4-L5) adipose tissue area accuracy to
WHR, sagittal diameter, and ultrasonic measurements of intra-abdominal depth.
Correlation coefficient between visceral adipose tissue and sagittal diameter (r = 0.77)
was higher than visceral adipose tissue and WHR (r = 0.73). A study by Kvist et al.
(1988) showed that sagittal diameter of the trunk at the L3-L5 level can be a good
predictor of visceral adipose tissue.
Stallone et al. (1991) investigated weight loss and body fat distribution. Their
program included a very low calorie diet and behavior therapy to promote weight loss.
The results showed that the weight loss included a significant decrease of visceral adipose
tissue. They also concluded that the relationship between waist circumference and
visceral adipose tissue is highly related.
Statement of the Problem
The purpose of this study was to determine the effects of body weight changes on
waist to hip ratio and the visceral fat distribution in a community weight loss program.
0 4

METHODS
Subjects: Forty-five obese subjects, 13 males and 32 females, ages 27-75 (mean = 47)
years old, were recruited through advertisements. All subjects signed an informed
consent prior to participation.
Dietary Protocol:
The Diet That Lets you Cheat is a commercially available low-calorie diet program,
which emphasizes the importance of exercise and the role of behavior modification.
This 1200 kcal/day diet consisted of three phases. Each phase allowed a weekly “cheat”
of 300 calories. Phase I lasted two weeks during which the subjects followed a strict
menu. Adherence to the prescribed food choices was emphasized, as the habits
encouraged during this phase would impact the overall success of the program. In the
diet, the subjects were instructed to eat breakfast every day, pay close attention to portion
size, and follow a pre-planned menu. While this portion of the diet allowed for very
little flexibility, it gave the subjects a chance to appreciate the quantity of food that
constituted 1200 calories, learn more about healthy food choices, and plan the best
mealtimes. Phase I of The Diet That Lets you Cheat lasted two weeks.
In Phase II, the diet program become more flexible. In Phase I, a weekly menu was
set and the intention was that it would be followed with very few changes by the subjects.
Phase II allowed for limited exchanges within the recommended food choices, depending
on personal preference. For example, four ounces of turkey could be exchanged for four
ounce of chicken. Exchanges were allowed within food groups as indicated by the
dietary exchange lists developed by the American Diabetes Association and the American
Dietetic Association (Caso, 1950). The subjects were also allowed some flexibility in
planning their meals and snacks were permitted, provided total daily caloric intake did
0 5

not exceed 1200 kcals. This phase emphasized responsible meal planning based on
hunger and individual preferences while limiting total calories by encouraging healthy
eating. To assist the subjects in planning their meals, charts were distributed that
allowed them to keep track of the number of servings of each food exchange they had
eaten, thereby giving them a visual representation of their adherence. Phase II also
lasted two weeks.
For the remainder of the weight loss program the subjects were in Phase III, which
allowed for full exchanges within food exchanges. The subjects were also allowed to
eat foods not presented in the diet program, like prepare meals and fast food. As in
Phase II, making healthy choices was emphasized. The meal planning charts were an
important tool in tracking daily calories and food selections. Phase III also allowed for
a weekly “cheat” of 300 kcals or less. By incorporating this extra allowance, the
subjects could eat something they enjoyed without feeling guilty. The emphasis of this
phase was realizing a diet the subjects could live with through making healthy food
choices and careful attention to what they were eating. Phase III lasted for the
reminding 6 weeks of the study. The subjects were also encouraged to revert back to
Phase I or II if they were having trouble adhering to the 1200 kcal limit.
Weekly meeting were conducted by the research team and focused on techniques for
successful food choice, exchanges, and adherence to the diet. The subjects were
encouraged to share their own experience with the diet. These weekly meeting also
served as a time for the weekly body mass measurement.
Exercise Protocol:
The Diet That Lets you Cheat emphasizes the importance of exercise in a weight loss
program. Specifically, low-intensity, long duration bouts of physical activity are
0 6

emphasized in this program. The duration of exercise progressed along with the phases
of the diet. During Phase I, 20 minutes of exercise was required daily, during Phase II,
40 minutes, and during Phase III the subjects progressed to 60 minutes of activity each
day. The subjects were encouraged to walk as the primary mode of activity, but they
could complement walking with other modes of exercise. The total daily exercise had to
add up to a total of 20, 40, 60 minutes, seven days per week.
It is important to note that if subjects in this program already took part in some
planned leisure activities, such as racquetball or golf, this was considered exercise for the
purpose of this study. If these planned activities did not meet the required time, the
subjects were asked to supplement the activities with walking to accumulate the required
time.
Laboratory Testing:
The body weight for each subject was measured on a calibrated laundry scale at
Wellness Central and was reported to the nearest pound. Initial body weight, waist and
hip circumference, and sagittal diameter were measured at an informational meeting one
week prior to the start of the treatments. Throughout the study, body weight was
measured at weekly Tuesday evening education meetings. Final body weight was
determined the week following the end of treatments. This allowed body weight data to
be collected at pretest, posttest, and weekly during the study. Body weight, waist and
hip circumference, and sagittal diameter were also recorded at the end of phases I and II
but not analyzed for this study (Appendix A-D).
Total and visceral fat were estimated by Kvist’s equation (1988) with weight-height
ratio and sagittal diameter. In order to increase the reliability and estimate accurately,
waist and hip girth and sagittal diameter had to measure in optimal sites.
0 7

Waist circumference was measured at the minimal abdominal girth to the nearest 0.5
cm. Hip circumference was measured at the maximal protrusion of the buttocks to the
nearest 0.5 cm. WHR was calculated by dividing the waist girth by the hip girth.
Sagittal diameter is obtained by measuring the distance from the examination table to a
horizontal spirit level placed over the abdominal of a recumbent subject at the level of the
iliac crest. The measurement is performed after a normal expiration. These data were
only collected at pretest and posttest.
Statistical Analysis:
In the analysis of the data collected in this study, the following statistics were used:
Related t-tests were used in the determination of significance of pretest and posttest.
The .05 level of significance was used in evaluating t-test results.
In order to determine the significant changes in weight loss, waist and hip
circumference changes, and total and visceral adipose tissue changes between males and
females, independent t- tests were used. The .05 level of significance was used in
evaluating t-test results.
Finally, correlation tests were used to determine the relationships between weight
loss, waist and hip circumference changes, sagittal diameter changes, and total and
visceral adipose tissue changes.
RESULTS
Descriptive data along with the results of the laboratory pretest and posttest are
shown in Table 1. The posttest data are less than the pretest data in each single
measurement. Every subject lost weight after this ten-week treatment and the average is
15.3 pounds (Range 37 – 3.5 lbs). (Appendix E).
0 8

Table 1: Descriptive data of subjects
Descriptive Pretest Posttest Descriptive Pretest Posttest Subjects 45 Waist (inches) 39.98±5.87 37.04±5.04 Number men 13 Hip (inches) 46.04±5.10 44.12±4.98 Number Women 32 Sagittal Diameter
(inches) 9.4156±1.35 8.46±1.20
Age (years) 47.13±12.07 WHR1 0.872±0.1256 0.840±0.008 Height (inches) 67.02±3.21 TAT2 (kg) 47.16±15.04 36.53±15.41 Weight (lbs) 207.18±38.68 191.87±36.17 VAT3 (kg) 3.73±1.27 3.32±1.92 % Fat 41.1±7.9 37.02±9.2 LBM4 (lbs) 121.09±23.61 119.67±23.73BMI 32.93±5.3 30.07±5.25 Weight Loss 15.31±7.38 1. Waist to Hip Ratio. 3. Visceral Adipose Tissue. 2. Total Adipose Tissue. 4. Lean Body Mass.
Related (paired) t-tests were determined to test the significance between the pretest
and posttest. Table 2 shows weight, waist and hip girth, sagittal diameter, and total
adipose tissue are significant different between pretest and posttest (p<001). In addition,
WHR, visceral adipose tissue, and lean body mass are significant different between
pretest and posttest (p< .05).
Table 2: Paired Samples Test
Source of Variation
Paired Differences t Sig. (2-tailed)
Mean Std. Deviation
Std. Error Mean
Weight 1 VS Weight 4 15.31 7.41 1.10 13.86 .000**Waist 1 VS Waist 4 2.94 2.55 .38 7.73 .000**
Hip 1 VS Hip 4 1.92 2.56 .38 5.03 .000**Ratio 1 VS Ratio 4 .003 .01 .001 2.18 .035*
SD 1 VS SD 4 .96 .88 .13 7.34 .000**Total AT 1 VS Total AT4 11.42 9.33 1.39 8.21 .000**
Visceral AT1 VS Visceral AT4 .43 1.30 .19 2.25 .030* LBM1 VS LBM 4 1.43 4.34 .65 2.21 .033*
* significant difference p < .05
** significant different p<.001
Tables 3 and 4 show the data for men and women. Men had higher test results in
pretest and lost more than women in most of the measurements, such as waist, hip,
0 9

sagittal diameter, and total adipose tissue. However, men increased the visceral adipose
tissue by .3837 liters.
Table 3: Pre-Post Test data for men and women
Gender N Mean Std. DeviationWaist 1 male 13 44.13 4.63
female 32 38.29 5.52 Waist 4 male 13 40.33 4.15
female 32 35.70 5.41 Hip 1 male 13 45.35 4.02
female 32 46.33 5.51 Hip 4 male 13 43.01 4.05
female 32 44.57 5.31 WHR 1 male 13 .98 .004
female 32 .83 .13 WHR 4 male 13 .94 .004
female 32 .80 .006SD 1 male 13 10.33 1.49
female 32 9.04 1.12 SD 4 male 13 9.02 1.40
female 32 8.23 1.06 Total AD 1 male 13 54.14 12.32
female 32 49.16 15.97 Total 4 male 13 29.02 9.65
female 32 43.31 15.50 Visceral 1 male 13 4.86 1.40
female 32 3.65 1.05 Visceral 4 male 13 5.25 2.59
female 32 2.88 .99 Table 4: Pre-Post Test changes in men and women
Gender N Mean Std. DeviationWaist Loss male 13 3.81 1.72
female 32 2.58 2.76Hip Loss male 13 2.33 1.37
female 32 1.76 2.91SD Loss male 13 1.32 1.29
female 32 .82 .62TAT Loss male 13 25.12 3.68
female 32 5.86 2.77VAT Loss male 13 -.38 2.07
female 32 .77 .58Weight Loss male 13 20.42 7.54
female 32 13.23 6.37
0 10

Table 5shows significant difference between men’s and women’s total adipose tissue
(p< .001) and weight loss (p = .002). Comparing these data to Table 4, it is shown that
men’s weight loss and total adipose tissue loss were significantly better than women’s.
Table 5: Independent sample t-test: Men compared to women t df Sig. (2-tailed)
Waist Loss 1.48 43 .146 Hip Loss .67 43 .505 SD Loss 1.34 43 .201 TAT Loss 19.21 43 .000**VAT Loss -1.97 43 .070
Weight loss 3.26 43 .002* * significant difference p < .05; ** significant different p<.001
Table 6 shows the correlation between weight loss, waist and hip circumference
changes, sagittal diameter changes, and total and visceral adipose tissue changes. We
can find that weight loss is highly correlated to total adipose tissue, sagittal diameter loss,
and waist loss. There is also a high correlation between total adipose tissue and sagittal
diameter. Additionally, there is a very high correlation between sagittal diameter and
visceral adipose tissue because sagittal diameter was used to estimate the visceral adipose
tissue.
Table 6: Correlations
weight loss VAT Loss TAT Loss SD Loss Hip Loss Waist LossWeight loss Pearson Correlation 1.000 .100 .696** .555** .099 .486**
Sig. (2-tailed) . .514 .000 .000 .518 .001 VAT Loss Pearson Correlation .100 1.000 -.340* .638** .034 -.113
Sig. (2-tailed) .514 . .022 .000 .825 .459 TAT Loss Pearson Correlation .696** -.340* 1.000 .384** .115 .353*
Sig. (2-tailed) .000 .022 . .009 .450 .017 SD Loss Pearson Correlation .555** .638** .384** 1.000 .108 .067
Sig. (2-tailed) .000 .000 .009 . .482 .664 Hip Loss Pearson Correlation .099 .034 .115 .108 1.000 -.243
Sig. (2-tailed) .518 .825 .450 .482 . .108 Waist Loss Pearson Correlation .486** -.113 .353* .067 -.243 1.000
Sig. (2-tailed) .001 .459 .017 .664 .108 . ** Correlation is significant at the 0.01 level (2-tailed).
* Correlation is significant at the 0.05 level (2-tailed).
0 11

DISCUSSION
This program focuses on the weight loss by moderate caloric restriction and exercise.
These results suggest subjects lost significant body mass during this ten-week program.
That means The Diet That Lets you Cheat is effective for weight loss.
This study also examined the effect of weight loss on WHR and visceral adipose
tissue. Data shows there are significant difference in waist and hip circumference
changes, sagittal diameter, and total adipose tissues. These findings are consistent with
Houmard, et al., (1993), who, showed an exercise program did induce significant
reductions in sagittal diameter, waist circumference, and WHR. In addition, Smith et al.
(1999) found that a significant difference from a very low caloric diet and visceral
adipose tissue changes.
The decrease of total adipose tissue, sagittal diameter, and waist circumference
are highly correlated to the weight loss. Stallone et al. (1991) investigated weight loss
and body fat distribution. He found the relationship between waist circumference and
visceral adipose tissue is highly related.
This study also investigated the difference between males and females. Overall,
men seem had better improvement than women. These results may be explained by the
best that men had larger measurements than women in the pretest.
In conclusion, this study investigated the effects of moderate caloric restriction
and exercise on body mass, WHR, and visceral far distribution. The results should
significantly changed in weight, WHR, and visceral adipose tissue in both males and
females. We also found that the decrease of total adipose tissue, sagittal diameter,
and waist circumference were highly correlated to the weight loss.
0 12

Appendix A
Test 1, January 4, 2000
Subjects Weekly attendance
Age Height(inch)
Weight(Lbs)
BMI % Fat
Fat Weight
LBM(Lbs)
1 MB 70 42 63 190 33.7 47.2 90 1002 JB 90 41 66 172 27.7 22.6 38 1323 AB 90 55 74 265 33.7 34.3 90 1724 RB 90 50 72 271 36.8 38.2 99 1615 CB 60 44 62 180 32.8 43.4 76 99 6 RB 70 43 64 274 46.9 53.6 143 1247 JB 80 69 65 210 35 46.1 97 1138 GC 100 65 69 198 29.4 23.5 46 1509 GC 60 61 64 176 31.5 36.9 68 11710 EC 80 75 69 259 36.5 37.8 96 15811 JC 90 31 70 192 27.5 38.9 76 11912 BC 90 45 70 235 33.7 37.4 86 14513 TD 70 36 68 271 41.2 52 139 12914 DD 100 37 63.5 198 34.3 45.8 90 10615 MD 80 66 64 220 37.6 48.5 106 11316 KE 80 43 64 240 41.1 49.8 120 12117 JF 70 45 67 210 33.0 44.9 94 11618 MF 80 41 64 239 40.9 53.7 129 11119 MF 90 41 63 225 40 45.2 102 12320 LG 90 68 67 200 31.5 45.9 90 10621 JH 80 49 67.5 202 31.4 45.4 92 11122 BK 80 68 71.5 288 39.1 33 93 18823 DK 80 27 68 150 22.8 35.5 51 94 24 TL 70 38 68 198 30.1 33.5 65 12925 EL 100 30 62.5 211 37.9 48.8 101 10526 CL 70 33 68 173 26.3 39.5 67 10227 BL 80 48 72 264 35.8 53.9 139 11928 CL 100 57 65 152 26.0 38.1 58 93 29 LM 80 27 63 174 30.9 38.9 65 10130 CM 70 47 70.5 189 27.5 24.2 47 147
0 13

Appendix A— Continued Test 1, January 4, 2000
Subjects Weekly
attendanceAge Height
(inch)Weight(Lbs)
BMI % Fat
Fat Weight
LBM(Lbs)
31 EM 100 48 64 149 25.4 39.4 59 90 32 BM 100 40 64 184 31.5 40.8 73 10633 AO 60 42 71 286 40.1 50.8 152 14734 RP 90 46 69 216 32.1 29.2 62 15035 JP 100 59 71 210 29.5 32.1 65 13836 JP 90 30 68 164 24.9 35.3 58 10737 CR 80 37 65 184 30.7 42.5 77 10438 SR 100 39 65 189 31.6 48.3 90 96 39 BR 70 57 73 234 31.1 32.7 75 15440 ER 80 55 63 156 27.7 39.3 60 92 41 JS 70 55 66 149 24 40.6 60 87 42 LS 80 56 69 251 37.3 43.9 109 13943 LS 100 44 65.5 199 32.8 48.6 93 98 44 JS 80 55 70 202 36.2 41.3 83 11945 GW 100 36 68 226 34.3 47.3 107 119
0 14

Appendix A— Continued Test 1, January 4, 2000
Subjects Waist Hip W/H Sagittal
DiameterTotal AT
Visceral AT
Subcut. AT
1 MB 37.5 47 .80 9.75 44.64 3.98 40.662 JB 37 38 .97 8 33.15 2.46 30.683 AB 46.25 48 .96 11.1 58.98 5.15 53.834 RB 45.5 47 .97 12 60.68 5.93 54.755 CB 36.8 43.9 .84 9.4 39.71 3.68 36.036 RB 48 59 .81 11 75.80 5.07 70.747 JB 40 50 .80 9.25 50.36 3.55 46.818 GC 42.5 41.5 1.02 8.5 40.19 2.90 37.299 GC 37 44 .84 8.5 41.73 2.90 38.8310 EC 52 51.5 1.01 11.25 62.35 5.28 57.0711 JC 36 46 .78 8.5 38.92 2.90 36.0212 BC 45.5 45 1.01 12.5 52.41 6.37 46.0413 TD 40 53 .75 10.25 69.46 4.41 65.0414 DD 40 50 .80 9.5 46.52 3.76 42.7615 MD 43 52 .83 9.5 55.86 3.76 52.0916 KE 40 51 .78 9.75 64.79 3.98 60.8117 JF 47.3 33.7 1.40 8.1 48.00 2.55 45.4518 MF 43.6 52.1 .84 10.9 64.17 4.98 59.1919 MF 38.75 49.25 .79 9.75 59.62 3.98 55.6420 LG 40 46 .87 8.5 42.44 2.90 39.5521 JH 36.8 50.4 .73 9.7 44.43 3.94 40.4922 BK 52 52 1.00 11.25 68.98 5.28 63.6923 DK 26.5 40.5 .65 6.75 21.36 1.38 19.9824 TL 39 43 .91 9.5 40.32 3.76 36.5625 EL 43 49 .88 9 52.30 3.33 48.9726 CL 31 40 .78 7 30.55 1.60 28.9527 BL 41.4 54.6 .76 11 59.94 5.07 54.8828 CL 35 41 .85 8 26.43 2.46 23.9629 LM 33 43 .77 7.5 34.72 2.03 32.6930 CM 39 43.5 .90 9.5 37.64 3.76 33.87
0 15

Appendix A— Continued Test 1, January 4, 2000
Subjects Waist Hip W/H Sagittal
DiameterTotalAT
Visceral AT
Subcut. AT
31 EM 34.5 39 .88 7.75 26.35 2.25 24.11 32 BM 36 44 .82 8.75 39.03 3.11 35.91 33 AO 46 54 .85 10.25 76.64 4.41 72.23 34 RP 42.5 44 .97 9 46.16 3.33 42.83 35 JP 41 41.5 .99 10.25 40.68 4.41 36.27 36 JP 30 39 .77 7.25 29.37 1.81 27.56 37 CR 34 44 .77 9.25 38.70 3.55 35.15 38 SR 39 47.5 .82 9.5 40.95 3.76 37.19 39 BR 45 47 .96 9.25 47.89 3.55 44.34 40 ER 31 41 .76 8 28.60 2.46 26.14 41 JS 31 40.5 .77 8.5 23.88 2.90 20.98 42 LS 46.5 47.5 .98 12.25 60.23 6.15 54.08 43 LS 40.5 45.5 .89 9.75 42.40 3.98 38.42 44 JS 38 47 .81 9.5 41.39 3.76 37.63 45 GW 50.5 46.5 1.09 9.25 53.03 3.55 49.49
Males Total Adipose Tissue = 1.36* weight/height – 42.0 (liters) Visceral Adipose Tissue = 0.731* SD – 11.5 (liters) Females
Total Adipose Tissue = 1.61* weight/height – 38.3 (liters) Visceral Adipose Tissue = 0.370* SD – 4.85 (liters) Adipose Tissue (AT), Kg = AT, liter * 0.932 Subcut. AT = Total AT – Visceral AT Weight/Height in Kg/m. SD, Sagittal Diameter in cm.
0 16

Appendix B Test 2, January 18, 2000
Subjects Weekly
attendanceAge Height
(inch)Weight(Lbs)
BMI % Fat
Fat Weight
LBM(Lbs)
1 MB 70 42 63 185 32.8 48.4 90 952 JB 90 41 66 162 26.1 22.1 36 1263 AB 90 55 74 246 31.7 32 79 1674 RB 90 50 72 252 34.3 33.3 84 1685 CB 60 44 62 173 31.7 42.3 73 1006 RB 70 43 64 262 45.1 52.3 137 1257 JB 80 69 65 205 34.2 46.3 95 1108 GC 100 65 69 194 28.7 24.5 48 1469 GC 60 61 64 177 30.4 38.7 68 10910 EC 80 75 69 251 37.1 38.2 96 15511 JC 90 31 70 190 27.3 39.2 74 11612 BC 90 45 70 225 32.3 35.8 80 14413 TD 70 36 68 263 40.1 53 139 12414 DD 100 37 63.5 188 32.8 45.3 85 10315 MD 80 66 64 213 36.6 48.2 102 11016 KE 80 43 64 232 39.9 45.8 106 12617 JF 70 45 67 200 31.4 41.8 84 11618 MF 80 41 64 234 40.2 53.6 125 10919 MF 90 41 63 222 39.4 45.2 100 12220 LG 90 68 67 195 30.5 47.8 93 10221 JH 80 49 67.5 195 30.1 43.7 85 11022 BK 80 68 71.5 273 37.6 34.3 94 17923 DK 80 27 68 141 21.5 34.1 48 9324 TL 70 38 68 185 28.1 25.5 47 13725 EL 100 30 62.5 200 36.1 48.2 96 10426 CL 70 33 68 163 24.8 38 62 10127 BL 80 48 72 255 34.7 52.4 134 12128 CL 100 57 65 147 24.4 38.2 56 9129 LM 80 27 63 166 29.4 39.3 65 10030 CM 70 47 70.5 183 25.9 21.7 40 143
0 17

Appendix B— Continued Test 2, January 18, 2000
Subjects Weekly
attendanceAge Height
(inch)Weight(Lbs)
BMI % Fat
Fat Weight
LBM(Lbs)
31 EM 100 48 64 143 24.6 38.8 55 88 32 BM 100 40 64 179 30.8 40.2 72 10733 AO 60 42 71 293 41.0 46.6 137 15634 RP 90 46 69 206 30.4 28.5 59 14735 JP 100 59 71 196 27.4 27.1 53 14336 JP 90 30 68 168 25.6 38.1 64 10437 CR 80 37 65 174 29.0 40.5 70 10438 SR 100 39 65 180 30.0 48.3 87 93 39 BR 70 57 73 222 29.4 30.5 68 15440 ER 80 55 63 149 26.4 40.7 60 88 41 JS 70 55 66 144 23.3 38.2 55 89 42 LS 80 56 69 241 35.7 40.8 98 14343 LS 100 44 65.5 183 30.0 48.0 88 95 44 JS 80 55 70 . . . . 45 GW 100 36 68 218 33.2 47.0 102 116
0 18

Appendix B— Continued Test 2, January 18, 2000
Subjects Waist Hip W/H Sagittal
DiameterTotal AT
Visceral AT
Subcut. AT
1 MB 36 47 .77 9.75 43.16 4.02 39.142 JB 40.5 .89 7.25 16.36 1.83 14.533 AB 44 46.5 .95 9.25 36.26 30.984 RB 44.5 46 .97 9.5 40.25 5.72 34.535 CB 42 .88 9.25 39.23 3.58 35.656 RB 45 59 .76 11 74.23 69.127 JB 40 49 .82 9.5 49.00 3.80 45.198 GC 41.5 1.02 8 24.63 3.12 21.519 GC 34.75 45.75 .76 8 38.57 36.0810 EC 52 50 1.04 10.5 43.21 7.46 35.7511 JC 44 .84 8 37.19 2.49 34.7012 BC 45 45 1.00 11.25 33.61 24.8613 TD 40 42.5 .94 10.25 68.16 4.45 63.7014 DD 47.5 .84 8.25 43.59 2.70 40.8915 MD 43 52 .83 9 53.47 50.1016 KE 41 51 .80 9.5 61.64 3.80 57.8417 JF 47.5 .69 7.5 44.47 2.05 42.4218 MF 42.5 52.75 .81 11.25 62.48 57.1519 MF 30 49.5 .61 10 58.93 4.24 54.6920 LG 46 .84 8.5 42.26 2.93 39.3321 JH 36 48 .75 8.5 41.68 38.7522 BK 51 51.5 .99 10.5 47.47 7.46 40.0123 DK 41 .78 6.5 19.99 1.17 18.8224 TL 38 40 .95 7.25 22.40 20.5725 EL 42.5 47.5 .89 8.75
36 5.28
37 5.12
42.52.49
37 8.75
39.753.36
33 5.33
38.752.93
32 1.83
50.23 3.14 47.0926 CL 32.25 42 .77 7 28.67 1.61 27.0627 BL 47 52.5 .90 10.5 59.41 4.68 54.7328 CL 33.5 40 .84 7.5 24.83 2.05 22.7829 LM 34 42.5 .80 7.5 34.85 2.05 32.8030 CM 38.5 42 .92 8 19.74 3.12 16.62
0 19

Appendix B— Continued Test 2, January 18, 2000
Subjects Waist Hip W/H Sagittal
DiameterTotalAT
Visceral AT
Subcut. AT
31 EM 34.25 38.25 .90 7.25 24.31 1.83 22.4832 BM 39 44 .89 8.5 39.41 2.93 36.4933 AO 46 52.5 .88 9.75 75.12 4.02 71.1034 RP 41.5 43 .97 9 28.41 4.86 23.5535 JP 41 42 .98 10 23.48 6.59 16.8936 JP 30.25 41 .74 7.75 30.64 2.26 28.3837 CR 37 43.5 .85 8.25 36.19 2.70 33.4938 SR 36 47 .77 9.25 38.67 3.58 35.0939 BR 45.5 46 .99 9.75 29.83 6.15 23.6840 ER 31.5 40.5 .78 9.75 27.60 4.02 23.5841 JS 29.5 40 .74 8 22.90 2.49 20.4142 LS 48 47 1.02 10 40.09 6.59 33.5043 LS 37.5 45 .83 8.25 39.13 2.70 36.4244 JS . . . . 45 GW 45 49.75 .90 9.75 50.39 4.02 46.38
0 20
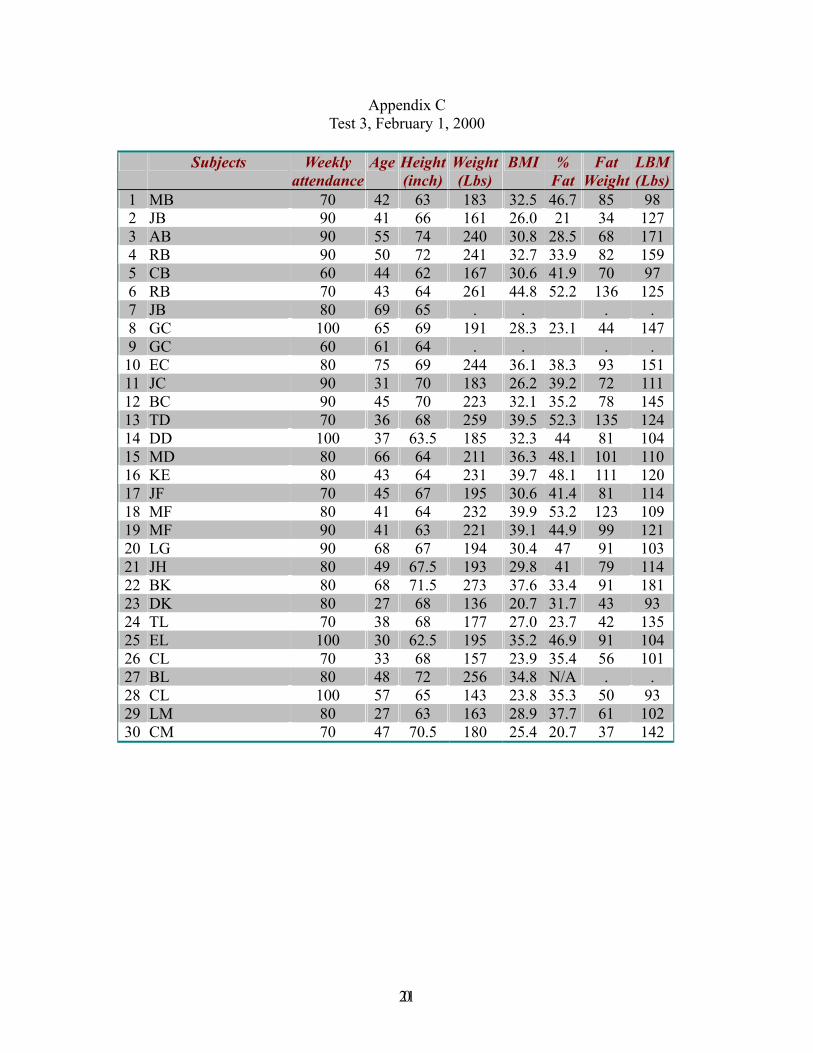
Appendix C Test 3, February 1, 2000
Subjects Weekly
attendanceAge Height
(inch)Weight(Lbs)
BMI % Fat
Fat Weight
LBM(Lbs)
1 MB 70 42 63 183 32.5 46.7 85 98 2 JB 90 41 66 161 26.0 21 34 1273 AB 90 55 74 240 30.8 28.5 68 1714 RB 90 50 72 241 32.7 33.9 82 1595 CB 60 44 62 167 30.6 41.9 70 97 6 RB 70 43 64 261 44.8 52.2 136 1257 JB 80 69 65 . . . . 8 GC 100 65 69 191 28.3 23.1 44 1479 GC 60 61 64 . . . . 10 EC 80 75 69 244 36.1 38.3 93 15111 JC 90 31 70 183 26.2 39.2 72 11112 BC 90 45 70 223 32.1 35.2 78 14513 TD 70 36 68 259 39.5 52.3 135 12414 DD 100 37 63.5 185 32.3 44 81 10415 MD 80 66 64 211 36.3 48.1 101 11016 KE 80 43 64 231 39.7 48.1 111 12017 JF 70 45 67 195 30.6 41.4 81 11418 MF 80 41 64 232 39.9 53.2 123 10919 MF 90 41 63 221 39.1 44.9 99 12120 LG 90 68 67 194 30.4 47 91 10321 JH 80 49 67.5 193 29.8 41 79 11422 BK 80 68 71.5 273 37.6 33.4 91 18123 DK 80 27 68 136 20.7 31.7 43 93 24 TL 70 38 68 177 27.0 23.7 42 13525 EL 100 30 62.5 195 35.2 46.9 91 10426 CL 70 33 68 157 23.9 35.4 56 10127 BL 80 48 72 256 34.8 N/A . . 28 CL 100 57 65 143 23.8 35.3 50 93 29 LM 80 27 63 163 28.9 37.7 61 10230 CM 70 47 70.5 180 25.4 20.7 37 142
0 21

Appendix C— Continued Test 3, February 1, 2000
Subjects Weekly
attendanceAge Height
(inch)Weight(Lbs)
BMI % Fat
Fat Weight
LBM(Lbs)
31 EM 100 48 64 138 23.7 35.9 50 88 32 BM 100 40 64 176 30.2 38.8 68 10733 AO 60 42 71 293 41.0 46.6 137 15634 RP 90 46 69 199 29.4 26.5 53 14635 JP 100 59 71 191 26.6 24.5 47 14436 JP 90 30 68 165 25.1 31.5 52 11337 CR 80 37 65 171 28.4 39 66 10438 SR 100 39 65 176 29.3 44.2 78 98 39 BR 70 57 73 . . . . 40 ER 80 55 63 . . . . 41 JS 70 55 66 140 22.6 35.7 50 90 42 LS 80 56 69 232 34.3 39.8 92 14043 LS 100 44 65.5 185 30.4 46.2 85 10044 JS 80 55 70 193 27.7 41.6 80 11245 GW 100 36 68 213 32.5 46 98 115
0 22

Appendix C— Continued Test 3, February 1, 2000
Subjects Waist Hip W/H Sagittal
DiameterTotal AT
Visceral AT
Subcut. AT
1 MB 35.5 46.5 .76 9.25 42.30 3.58 38.722 JB 35 37.75 .93 6.75 16.02 .96 15.063 AB 42 44 .95 8.75 34.27 4.43 29.844 RB 45 45 1.00 9.5 36.63 5.72 30.915 CB 38 41.5 .92 8.25 36.64 2.70 33.936 RB 45 59 .76 11.5 73.60 5.55 68.057 JB . . . . 8 GC 41.5 42 .99 8.75 23.64 4.43 19.229 GC . . . . 10 EC 51 49.5 1.03 10 41.06 6.59 34.4711 JC 35.75 43.5 .82 8.5 34.32 2.93 31.3912 BC 44 44 1.00 9.75 33.11 6.15 26.9613 TD 37.5 51 .74 10.5 66.58 4.68 61.9014 DD 36.5 47.5 .77 8 42.54 2.49 40.0515 MD 43 52.5 .82 9 52.84 3.36 49.4716 KE 43 51 .84 9.5 61.22 3.80 57.4217 JF 32 45.5 .70 7.25 42.46 1.83 40.6418 MF 43 53 .81 10 61.64 4.24 57.4019 MF 39.5 49.5 .80 9.75 58.29 4.02 54.2720 LG 37.25 44.25 .84 8.25 42.06 2.70 39.3621 JH 38 48.5 .78 8.5 40.89 2.93 37.9622 BK 50.25 52 .97 10.5 47.31 7.46 39.8523 DK 26 40 .65 6.75 17.93 1.39 16.5424 TL 36.5 42.5 .86 7.75 19.90 2.69 17.2025 EL 36 46 .78 8.25 48.08 2.70 45.3826 CL 29 39 .74 6.75 26.30 1.39 24.9127 BL 46.5 53 .88 10.5 59.78 4.68 55.1028 CL 31.75 39.75 .80 7.25 23.38 1.83 21.5629 LM 32.25 42.5 .76 7.25 33.78 1.83 31.9530 CM 38 41 .93 8 18.61 3.12 15.49
0 23

Appendix C— Continued Test 3, February 1, 2000
Subjects Waist Hip W/H Sagittal
DiameterTotalAT
Visceral AT
Subcut. AT
31 EM 31.25 37.5 .83 7.25 22.21 1.83 20.3832 BM 34 43 .79 8 37.94 2.49 35.4533 AO 46 52.5 .88 9.75 75.12 4.02 71.1034 RP 40.5 43 .94 9 26.11 4.86 21.2635 JP 39 40 .98 8.75 21.72 4.43 17.2936 JP 29.5 40 .74 7.25 29.46 1.83 27.6337 CR 35 44 .80 8 34.74 2.49 32.2638 SR 33 45.75 .72 9 36.80 3.36 33.4439 BR . . . . 40 ER . . . . 41 JS 28.5 39.5 .72 7.25 21.27 1.83 19.4442 LS 45 45 1.00 10 37.12 6.59 30.5343 LS 37 45 .82 8.5 40.15 2.93 37.2244 JS 36 44 .82 9 38.15 3.36 34.7845 GW 44.5 46 .97 10 48.42 4.24 44.18
0 24

Appendix D Test 4 March 7, 2000
Subjects Weekly
attendanceAge Height
(inch)Weight(Lbs)
BMI % Fat
Fat Weight
LBM(Lbs)
1 MB 70 42 63 175 31.0 44.1 77 98 2 JB 90 41 66 155 25.1 19.9 31 1243 AB 90 55 74 225 28.9 25.1 56 1694 RB 90 50 72 227 30.9 27 61 1665 CB 60 44 62 167 30.6 42.2 70 97 6 RB 70 43 64 255 43.9 51.7 132 1237 JB 80 69 65 206 34.4 45.9 95 1118 GC 100 65 69 186 27.5 21.2 39 1479 GC 60 61 64 172 29.6 35.9 62 11010 EC 80 75 69 233 34.4 34.9 81 15111 JC 90 31 70 174 25.0 36.9 64 11012 BC 90 45 70 209 30.1 32.2 67 14213 TD 70 36 68 254 38.6 50.3 128 12614 DD 100 37 63.5 180 31.5 41.4 75 10515 MD 80 66 64 206 35.3 45 92 11316 KE 80 43 64 219 37.6 48.5 106 11317 JF 70 45 67 186 29.2 40.2 75 11118 MF 80 41 64 228 39.2 51.3 117 11119 MF 90 41 63 218 38.7 45 98 12020 LG 90 68 67 191 29.9 46.2 88 10221 JH 80 49 67.5 181 27.9 40.2 73 10822 BK 80 68 71.5 266 36.7 31.2 83 18323 DK 80 27 68 136 20.7 28.2 38 98 24 TL 70 38 68 171 26.1 20.2 35 13625 EL 100 30 62.5 183 32.9 45.5 83 99 26 CL 70 33 68 149 22.6 33.7 50 98 27 BL 80 48 72 252 34.2 49.9 126 12628 CL 100 57 65 140 23.3 34.8 49 91 29 LM 80 27 63 161 28.5 34.6 56 10530 CM 70 47 70.5 179 25.4 21 38 141
0 25

Appendix D— Continued Test 4 March 7, 2000
Subjects Weekly
attendanceAge Height
(inch)Weight(Lbs)
BMI % Fat
Fat Weight
LBM(Lbs)
31 EM 100 48 64 134 23.0 34.3 46 88 32 BM 100 40 64 175 30.1 38.5 67 10833 AO 60 42 71 277 38.7 46 127 15034 RP 90 46 69 190 28.1 23.2 44 14635 JP 100 59 71 185 25.9 23 43 14236 JP 90 30 68 159 24.2 29.5 47 11237 CR 80 37 65 168 28.0 36.6 61 10738 SR 100 39 65 165 27.5 44.5 73 92 39 BR 70 57 73 211 27.9 25.2 53 15840 ER 80 55 63 146 25.9 37.3 54 92 41 JS 70 55 66 136 22.0 34.6 47 89 42 LS 80 56 69 229 33.9 37.2 85 14443 LS 100 44 65.5 181 29.7 46.1 83 98 44 JS 80 55 70 189 27.2 41.2 78 11145 GW 100 36 68 205 31.2 44.4 91 114
0 26

Appendix D— Continued Test 4 March 7, 2000
Subjects Waist Hip W/H Sagittal
DiameterTotal AT
Visceral AT
Subcut. AT
1 MB 35.5 45.5 .78 8.25 38.68 2.70 35.982 JB 33 35 .94 8 14.13 3.12 11.013 AB 40 43 .93 8.25 29.82 3.56 26.264 RB 41.5 43 .97 9.5 32.37 5.72 26.655 CB 37.25 44 .85 8.75 36.64 3.14 33.506 RB 46 57.5 .80 10.25 71.30 4.45 66.847 JB 38.5 48.5 .79 9.5 49.41 3.80 45.608 GC 40 40 1.00 8 22.00 3.12 18.889 GC 35.5 42.5 .84 9 36.47 3.36 33.1010 EC 47.5 49 .97 12.25 37.29 10.49 26.8011 JC 33 43 .77 7.25 31.05 1.83 29.2312 BC 42.5 44 .97 9.5 28.58 5.72 22.8613 TD 41 52.5 .78 9.5 64.41 3.80 60.6114 DD 37 46 .80 7.25 40.42 1.83 38.5915 MD 40 51 .78 8.5 50.52 2.93 47.6016 KE 39 49 .80 8.5 55.99 2.93 53.0617 JF 35.5 45.5 .78 7 38.85 1.61 37.2318 MF 41 49.5 .83 10 59.96 4.24 55.7219 MF 39 50.5 .77 9.25 57.22 3.58 53.6520 LG 36 42 .86 9 40.65 3.36 37.2921 JH 33 44 .75 8.5 36.11 2.93 33.1822 BK 45 50 .90 11 45.24 8.31 36.9323 DK 26 36.5 .71 6.25 18.01 .95 17.0624 TL 34 39 .87 7 17.89 1.40 16.5025 EL 39.25 45.25 .87 7.75 42.71 2.26 40.4526 CL 28.5 37 .77 6.25 22.95 .95 22.0027 BL 46 52 .88 10 58.29 4.24 54.0528 CL 29 38 .76 7.5 21.93 2.05 19.8829 LM 32 41.5 .77 7.5 32.71 2.05 30.6630 CM 37.5 43.25 .87 8.5 18.44 3.99 14.46
0 27

Appendix D— Continued Test 4 March 7, 2000
Subjects Waist Hip W/H Sagittal
DiameterTotalAT
Visceral AT
Subcut. AT
31 EM 31 35 .89 7.25 20.52 1.83 18.70 32 BM 33.5 42.5 .79 8 37.73 2.49 35.24 33 AO 44 51 .86 8.5 69.07 2.93 66.14 34 RP 39.75 41.5 .96 8.75 23.32 4.43 18.89 35 JP 38.5 40.5 .95 8.5 19.96 3.99 15.97 36 JP 27.5 37.5 .73 7 27.09 1.61 25.48 37 CR 33 42.5 .78 8 33.71 2.49 31.22 38 SR 32.5 44.5 .73 8.25 32.47 2.70 29.77 39 BR 40 45 .89 8.25 26.42 3.56 22.86 40 ER 29.5 39 .76 7 26.53 1.61 24.92 41 JS 27.5 39 .71 7.5 19.64 2.05 17.59 42 LS 45 46 .98 9.75 36.13 6.15 29.98 43 LS 36 43 .84 8.5 38.51 2.93 35.58 44 JS 36 45 .80 8.25 36.80 2.70 34.10 45 GW 44 46 .96 9.25 45.26 3.58 41.68
0 28

Appendix E Difference between T1 (1-4-00) --- T4 (3-7-00)
Subjects Weight BMI %
Fat Fat
WeightLBM Waist Hip WHR Sagittal
Diameter TAT VAT Subcut.
AT 1 MB 15.0 2.70 3.10 12.68 2.32 2.00 1.50 .02 1.50 5.96 1.28 4.68 2 JB 15.0 2.60 2.70 7.42 7.58 4.00 3.00 .03 .00 19.02 -.66 19.683 AB 37.0 4.80 9.20 33.87 3.13 6.25 5.00 .03 2.85 29.16 1.59 27.574 RB 33.0 5.90 11.20 38.32 -5.32 4.00 4.00 .00 2.50 28.31 .21 28.105 CB 8.0 2.20 1.20 5.95 2.05 -.45 -.10 -.01 .65 3.07 .54 2.54 6 RB 12.5 3.00 1.90 11.38 1.12 2.00 1.50 .01 .75 4.50 .61 3.89 7 JB 3.5 .60 .20 1.58 1.92 1.50 1.50 .01 -.25 .96 -.26 1.21 8 GC 10.0 1.90 2.30 7.06 2.94 2.50 1.50 .02 .50 18.18 -.23 18.419 GC 13.5 1.90 1.00 6.45 7.05 1.50 1.50 .00 -.50 5.26 -.47 5.73 10 EC 20.5 2.10 2.90 14.82 6.68 4.50 2.50 .04 -1.00 25.06 -5.20 30.2611 JC 21.5 2.50 2.00 12.05 9.45 3.00 3.00 .01 1.25 7.87 1.07 6.80 12 BC 22.0 3.60 5.20 19.39 2.61 3.00 1.00 .04 3.00 23.82 .64 23.1813 TD 14.0 2.60 1.70 11.36 2.64 -1.00 .50 -.03 .75 5.05 .61 4.44 14 DD 15.5 2.80 4.40 14.54 .96 3.00 4.00 .00 2.25 6.10 1.94 4.16 15 MD 13.5 2.30 3.50 14.46 .04 3.00 1.00 .05 1.00 5.33 .84 4.49 16 KE 22.0 3.50 1.30 14.02 7.98 1.00 2.00 -.02 1.25 8.80 1.05 7.75 17 JF 24.0 3.80 4.70 19.29 4.71 11.80 -11.80 .62 1.10 9.16 .94 8.22 18 MF 11.5 1.70 2.40 11.61 -.11 2.60 2.60 .01 .90 4.20 .74 3.46 19 MF 7.0 1.30 .20 3.70 3.30 -.25 -2.25 .02 .50 2.40 .40 2.00 20 LG 5.0 1.60 -.30 1.96 4.04 4.00 4.00 .01 -.50 1.79 -.47 2.26 21 JH 21.5 3.50 5.20 18.94 2.56 3.80 6.40 -.02 1.20 8.32 1.01 7.31 22 BK 14.5 2.40 1.80 9.56 4.94 7.00 2.00 .10 .25 23.74 -3.03 26.7723 DK 9.0 2.10 7.30 13.48 -4.47 .50 4.00 -.06 .50 3.35 .43 2.92 24 TL 22.5 4.00 13.30 29.82 -7.32 5.00 4.00 .04 2.50 22.43 2.37 20.0625 EL 23.0 5.00 3.30 17.53 6.47 3.75 3.75 .01 1.25 9.59 1.07 8.52 26 CL 19.5 3.70 5.80 16.56 3.94 2.50 3.00 .01 .75 7.60 .64 6.95 27 BL 6.0 1.60 4.00 13.06 -7.06 -4.60 2.60 -.12 1.00 1.65 .82 .83 28 CL 11.0 2.70 3.30 8.53 2.47 6.00 3.00 .09 .50 4.50 .41 4.08 29 LM 5.0 2.40 4.30 8.57 -3.57 1.00 1.50 .00 .00 2.01 -.02 2.03 30 CM 14.5 2.10 3.20 8.83 5.67 1.50 .25 .03 1.00 19.19 -.22 19.42
0 29

Appendix E— Continued Difference between T1 (1-4-00) --- T4 (3-7-00)
Subjects Weight BMI %
Fat Fat
WeightLBM Waist Hip WHR Sagittal
Diameter TAT VAT Subcut.
AT 31 EM 14.5 2.40 5.10 12.51 1.99 3.50 4.00 -.01 .50 5.83 .42 5.41 32 BM 4.0 1.40 2.30 6.03 -2.03 2.50 1.50 .03 .75 1.30 .63 .67 33 AO 22.0 1.40 4.80 24.89 -2.89 2.00 3.00 -.01 1.75 7.57 1.49 6.08 34 RP 21.5 4.00 6.00 17.76 3.74 2.75 2.50 .01 .25 22.84 -1.10 23.9435 JP 18.0 3.60 9.10 22.16 -4.16 2.50 1.00 .04 1.75 20.72 .43 20.2936 JP 6.5 .70 5.80 11.42 -4.92 2.50 1.50 .04 .25 2.28 .20 2.08 37 CR 13.0 2.70 5.90 15.92 -2.92 1.00 1.50 -.01 1.25 4.99 1.06 3.93 38 SR 21.5 4.10 3.80 17.08 4.42 6.50 3.00 .09 1.25 8.48 1.06 7.42 39 BR 17.5 3.20 7.50 21.72 -4.22 5.00 2.00 .07 1.00 21.47 -.01 21.4840 ER 5.5 1.80 2.00 5.54 -.04 1.50 2.00 .00 1.00 2.07 .85 1.21 41 JS 11.0 2.00 6.00 12.68 -1.68 3.50 1.50 .06 1.00 4.24 .85 3.40 42 LS 19.0 3.40 6.70 23.87 -4.87 1.50 1.50 .00 2.50 24.10 .00 24.1043 LS 10.5 3.10 2.50 10.07 .43 4.50 2.50 .05 1.25 3.89 1.05 2.83 44 JS 13.0 9.00 .10 5.43 7.57 2.00 2.00 .01 1.25 4.58 1.06 3.52 45 GW 21.0 3.10 2.90 15.90 5.10 6.50 .50 .13 .00 7.77 -.03 7.81 - means increased. For example, subject 2’s VAT is -.66. It means he/she increased
VAT by .66 kg.
0 30

0 31
BIBLIOGRAPHY
Caan Bette, Mary Anne Armstrong, Joseph V. Selby, Marianne Sadler, Aaron R.
Folsom, David Jacobs, Martha L. Slattery, Joan E Hilner and Jeffery Roseman. Changes in Measurements of body fat distribution accompanying weight change. International Journal of Obesity. 1994; 18: 397-404.
Caso, E.K. Calculation of diabetic diets. Journal of the American Dieteic Association, 1950; 26, 575-583. Center for Disease and Prevention and the American College of Sports Medicine.
Physical activity and public health. JAMA. 1995; 273: 402-407 Egger Garry. The case for using waist to hip ratio measurements in routine medical checks. The Medical Journal of Australia. 1992; 156: 280-285. Houmard Joseph A., Catherine McCullery, Linad K. Roy, Robert K. Bruner, Michael
R. McCammon and Richard G. Israel. Effects of exercise training on absolute and relative measurements of regional adiposity. International Journal of Obesity. 1994; 18: 243-248.
Kahn Henry S., T. Kue Young and Dale Gelskey. The waist-to-hip ration as an index
of central obesity. JAMA. 1996; 275: 160-162. Kvist Henry, Badrul Chowdhury, Ulla Grangard, Ulf Tylen, and Lars Sjostrom. Total
and visceral adipose-tissue volumes derived from measurements with computer tomography in adult men and women: predictive equations. American Journal of Clinical Nutrition 1998; 48: 1351-61.
Parr, R.B, Bachman, D.C., and Noble, H.B. The Diet That Lets You Cheat. New York:
Crown Publishers, Inc. 1983. Smith SR, and JJ Zachwieja. Visceral adipose tissue: a critical review of intervention strategies. International Journal of Obesity. 1999; 23: 329-335. Stallone Dayth D., Albert J. Stunkard, Thomas A. Wassen, Gary D. Foster, Jeffery
Boorstein and Peter Arger. Weight loss and body fat distribution: a feasibility study using computer Tomography. International Journal of Obesity. 1991; 15: 775-780.
Tornaghi Giulio, Riccardo Raiteri, Carlo Pozzato, Anna Rispoli, Maurizio Bramani,
Marco Cipolat and Angelo Craveri. Anthropometric or ultrasonic measurement in assessment of visceral fat? A comparative study. International Journal of Obesity. 1994; 18: 771-775.