Embed Size (px)
Citation preview
The Effects of Minimum Wages on the Philippine Economy
Leonardo A. Lanzona, Jr.
Introduction
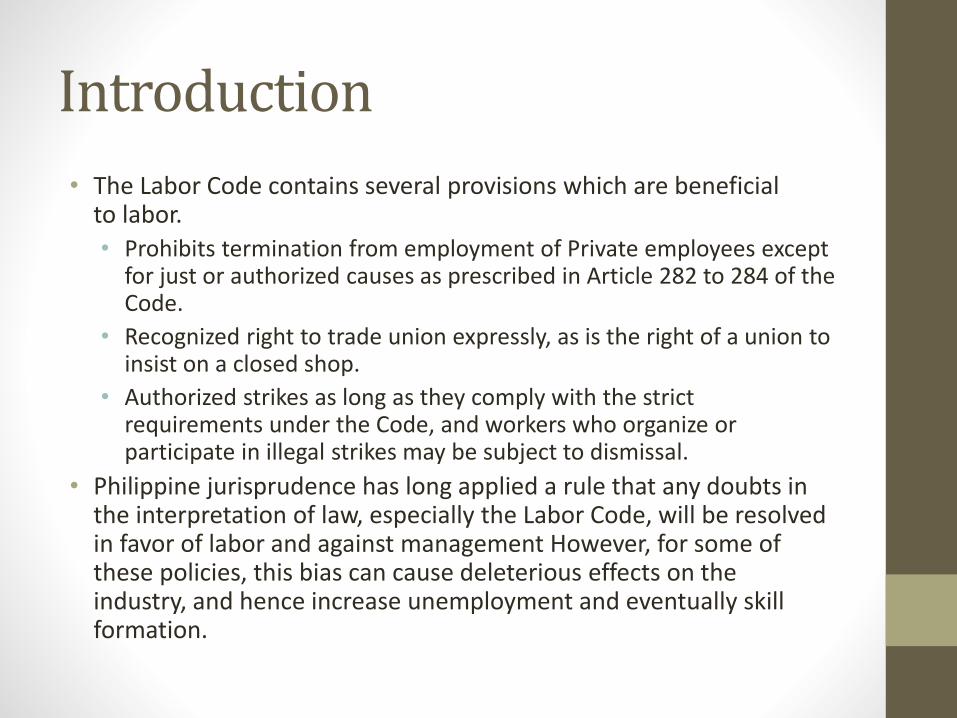
• The Labor Code contains several provisions which are beneficial to labor.
• Prohibits termination from employment of Private employees except for just or authorized causes as prescribed in Article 282 to 284 of the Code.
• Recognized right to trade union expressly, as is the right of a union to insist on a closed shop.
• Authorized strikes as long as they comply with the strict requirements under the Code, and workers who organize or participate in illegal strikes may be subject to dismissal.
• Philippine jurisprudence has long applied a rule that any doubts in the interpretation of law, especially the Labor Code, will be resolved in favor of labor and against management However, for some of these policies, this bias can cause deleterious effects on the industry, and hence increase unemployment and eventually skill formation.
Introduction
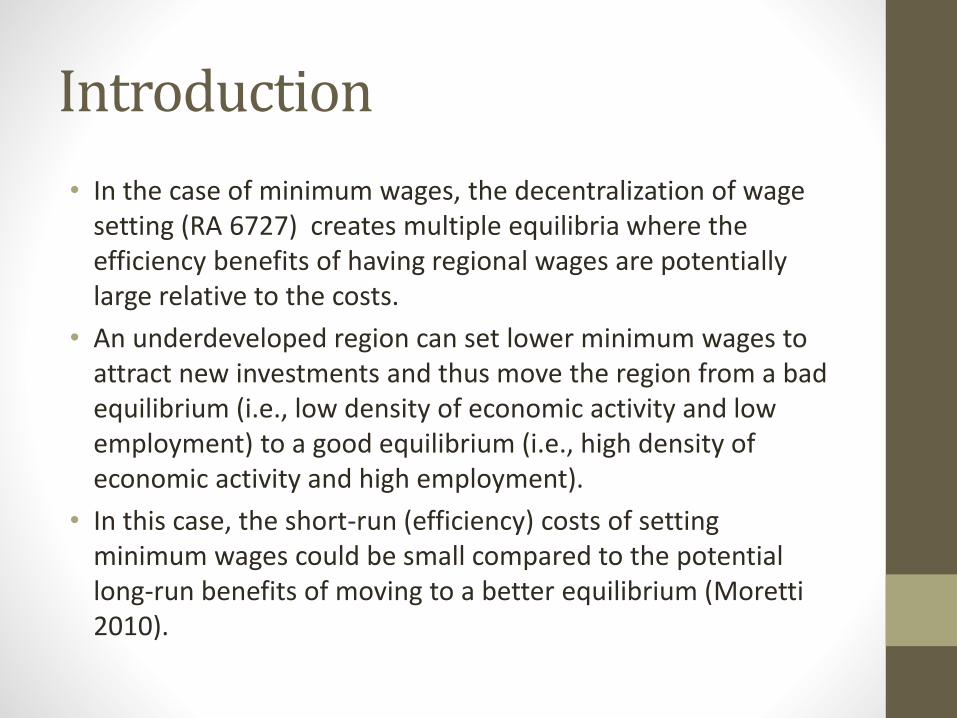
• In the case of minimum wages, the decentralization of wage setting (RA 6727) creates multiple equilibria where the efficiency benefits of having regional wages are potentially large relative to the costs.
• An underdeveloped region can set lower minimum wages to attract new investments and thus move the region from a bad equilibrium (i.e., low density of economic activity and low employment) to a good equilibrium (i.e., high density of economic activity and high employment).
• In this case, the short-run (efficiency) costs of setting minimum wages could be small compared to the potential long-run benefits of moving to a better equilibrium (Moretti2010).
Introduction
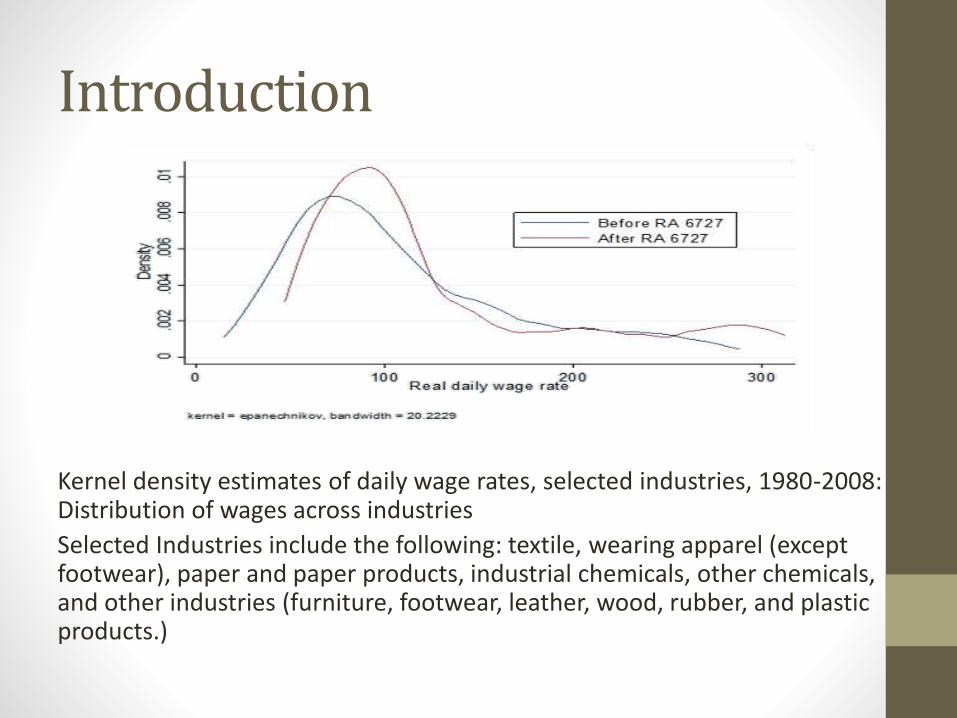
Kernel density estimates of daily wage rates, selected industries, 1980-2008: Distribution of wages across industries
Selected Industries include the following: textile, wearing apparel (except footwear), paper and paper products, industrial chemicals, other chemicals, and other industries (furniture, footwear, leather, wood, rubber, and plastic products.)
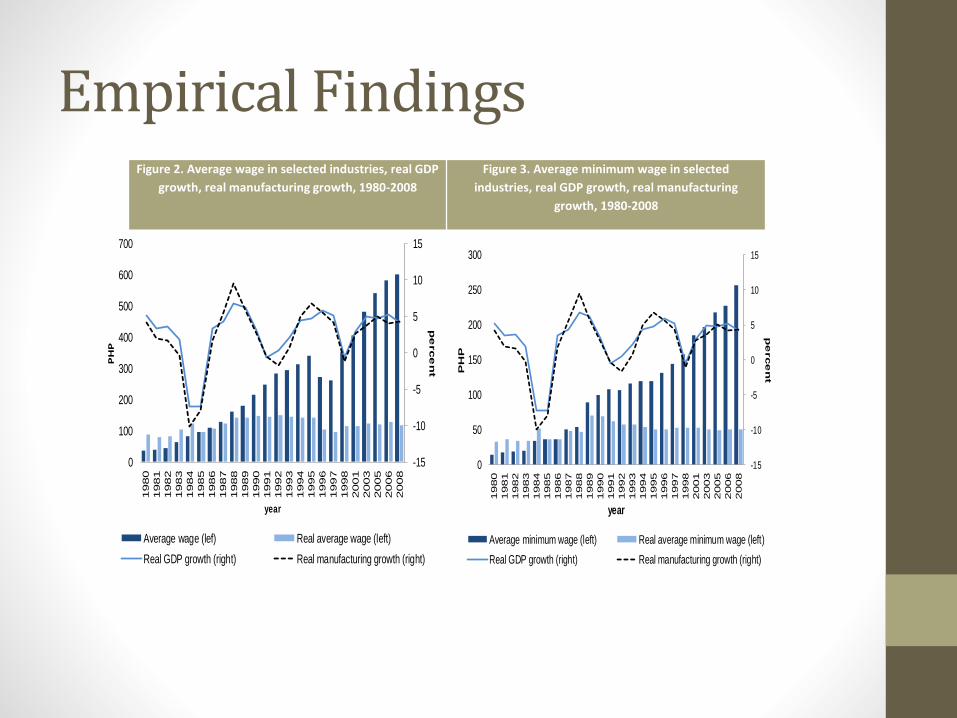
Empirical FindingsFigure 2. Average wage in selected industries, real GDP
growth, real manufacturing growth, 1980-2008
Figure 3. Average minimum wage in selected
industries, real GDP growth, real manufacturing
growth, 1980-2008
-15
-10
-5
0
5
10
15
0
100
200
300
400
500
600
700
1980
1981
1982
1983
1984
1985
1986
1987
1988
1989
1990
1991
1992
1993
1994
1995
1996
1997
1998
2001
2003
2005
2006
2008
pe
rce
nt
PH
P
year
Average wage (lef) Real average wage (left)
Real GDP growth (right) Real manufacturing growth (right)
-15
-10
-5
0
5
10
15
0
50
100
150
200
250
300
1980
1981
1982
1983
1984
1985
1986
1987
1988
1989
1990
1991
1992
1993
1994
1995
1996
1997
1998
2001
2003
2005
2006
2008
pe
rce
nt
PH
P
year
Average minimum wage (left) Real average minimum wage (left)
Real GDP growth (right) Real manufacturing growth (right)

Objective of the Study
• This paper is an attempt at disentangling and controlling the various factors that may confound the effects of minimum wages on employment.
• In doing so, one can arrive at an unbiased and more consistent measure of minimum wages’ effects and their consequences on the composition of workers in the labor market in the Philippines. This serves as basis for examining the effects of Labor Market Policies on Employment.
• The paper focuses on labor-intensive industries that are highly susceptible to minimum wages and examines the policy’s impact not only on the firms but also on the workers in general. It uses panel data extracted from both the Annual Survey of Philippine Business and Industry (ASPBI), formerly the Annual Survey of Establishments (ASE), as well as panel data from the annual Labor Force Survey (LFS).
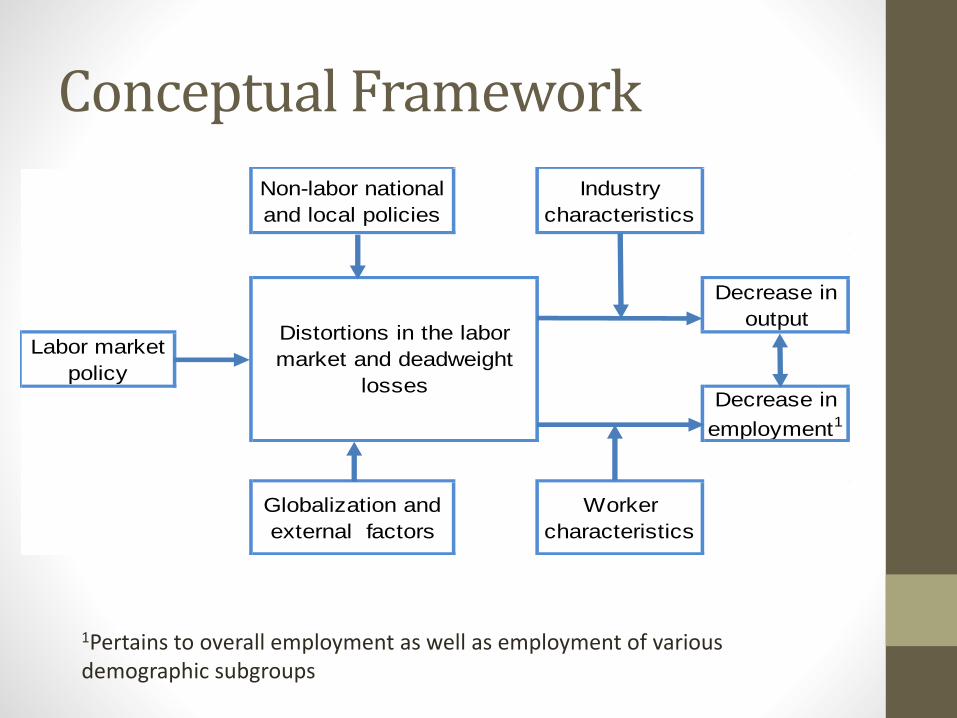
Conceptual Framework
Non-labor national
and local policies
Industry
characteristics
Labor market
policy
Globalization and
external factors
Worker
characteristics
Decrease in
employment1
Distortions in the labor
market and deadweight
losses
Decrease in
output
1Pertains to overall employment as well as employment of various demographic subgroups

Conceptual Framework
• Minimum wages, more than other forms of regulation, are more directly associated with unemployment.
• Maloney and Mendez (2004) pointed out that minimum wages can impose a restriction on the amount of benefits offered by firms. Workers carry part of the burden of higher minimum wages in the form of lower benefits (though somewhat mitigated by mandatory benefit restrictions) and reduced worker security.
• Both of these effects may result in greater incidence of unemployment or lower participation in the formal sector
Data Used
• The data comprise labor-intensive manufacturing industries with at least 10 employees (at the three digit Philippine Standard Industry Classification (PSIC) level) for the years 1980 to 2008 following the 1990 regional configuration.
• However, there are no data available for 1999, 2000, 2002, 2004, and 2007 because no survey was conducted as a result of a limited national budget during these years. In addition to the national level information, however, a panel data of firms between 1998 and 2008 are available Shifts in the classification of firm sizes can be noted in the data. It is possible to determine whether firms with initially 10 workers are employing more or less workers over time.
• The data are available at regional disaggregation and thus may not be independent of the regional factors used in determining minimum wages.

Data Used
• Two datasets with which to test our hypotheses at the firm level:
• i) a regional dataset aggregated at the three-digit PSIC from 1980 to 2008, and
• ii) a panel dataset of firms from 1996 to 2008.
• These are used to arrive at comparable findings to see the effects of minimum-wage changes on employment decisionsat the firm level
• Finally, a panel dataset of workers extracted from the annual labor force survey has also been gathered. This data will then allow us to analyze the demographic implications of the minimum wage policy. Hence, the effect of minimum wages on the subgroup of workers can be determined

Data Used
• As already indicated, the analysis also takes into consideration the differential effects of minimum wages on large and small firms and industries. In the absence of any standard measurement for firm size, the value of assets (consisting of buildings, capital expenditures, fixed assets and land) was used.
• Large industries or firms are defined as having above average asset values while small industries or firms are those that have below average values. At the firm level, the average (nominal) value of assets was P1.125 Billion based on the panel data for establishments.
• The firms that considered large are those with above average value of assets. These include manufacturing of chemical products, paper and paper products, and textile. Because these firms are highly capitalized and face limited competition, it is likely that these are able to exercise some form of monopsony power in their respective labor markets.
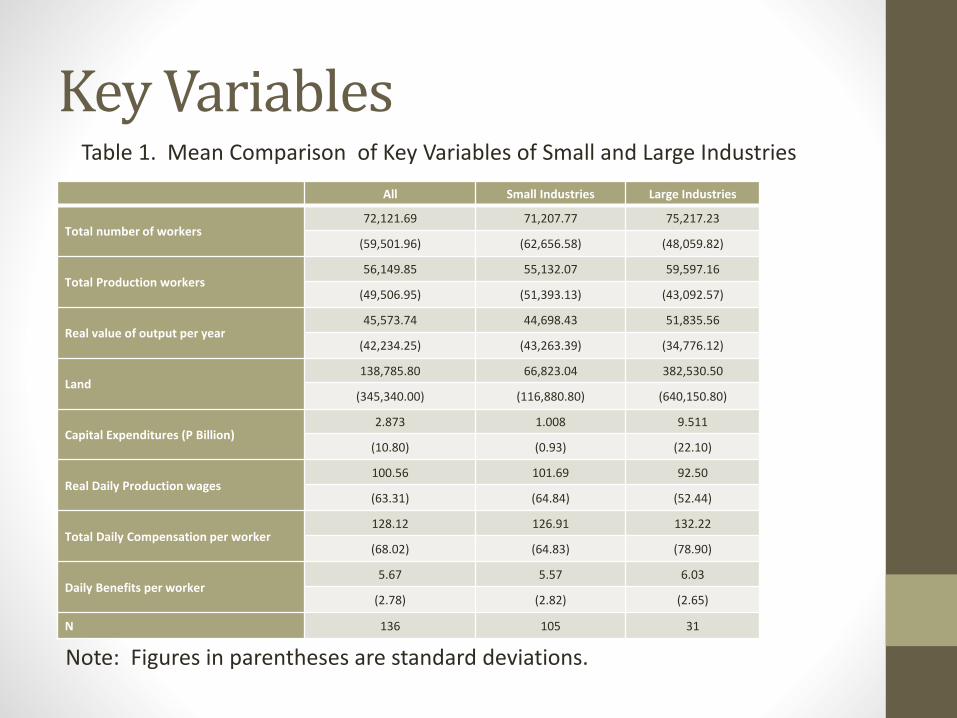
Key VariablesTable 1. Mean Comparison of Key Variables of Small and Large Industries
Note: Figures in parentheses are standard deviations.
All Small Industries Large Industries
Total number of workers72,121.69 71,207.77 75,217.23
(59,501.96) (62,656.58) (48,059.82)
Total Production workers56,149.85 55,132.07 59,597.16
(49,506.95) (51,393.13) (43,092.57)
Real value of output per year45,573.74 44,698.43 51,835.56
(42,234.25) (43,263.39) (34,776.12)
Land138,785.80 66,823.04 382,530.50
(345,340.00) (116,880.80) (640,150.80)
Capital Expenditures (P Billion)2.873 1.008 9.511
(10.80) (0.93) (22.10)
Real Daily Production wages100.56 101.69 92.50
(63.31) (64.84) (52.44)
Total Daily Compensation per worker128.12 126.91 132.22
(68.02) (64.83) (78.90)
Daily Benefits per worker5.67 5.57 6.03
(2.78) (2.82) (2.65)
N 136 105 31
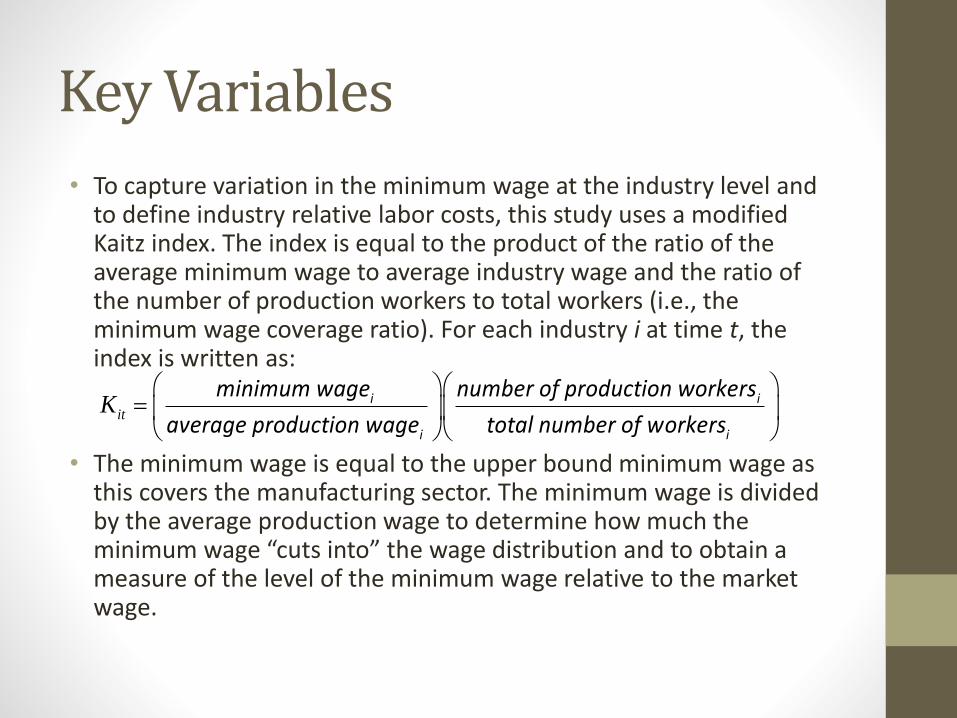
Key Variables
• To capture variation in the minimum wage at the industry level and to define industry relative labor costs, this study uses a modified Kaitz index. The index is equal to the product of the ratio of the average minimum wage to average industry wage and the ratio of the number of production workers to total workers (i.e., the minimum wage coverage ratio). For each industry i at time t, the index is written as:
• The minimum wage is equal to the upper bound minimum wage as this covers the manufacturing sector. The minimum wage is divided by the average production wage to determine how much the minimum wage “cuts into” the wage distribution and to obtain a measure of the level of the minimum wage relative to the market wage.
i i
i i
minimum wage number of production workers
average production wage total number of workersitK
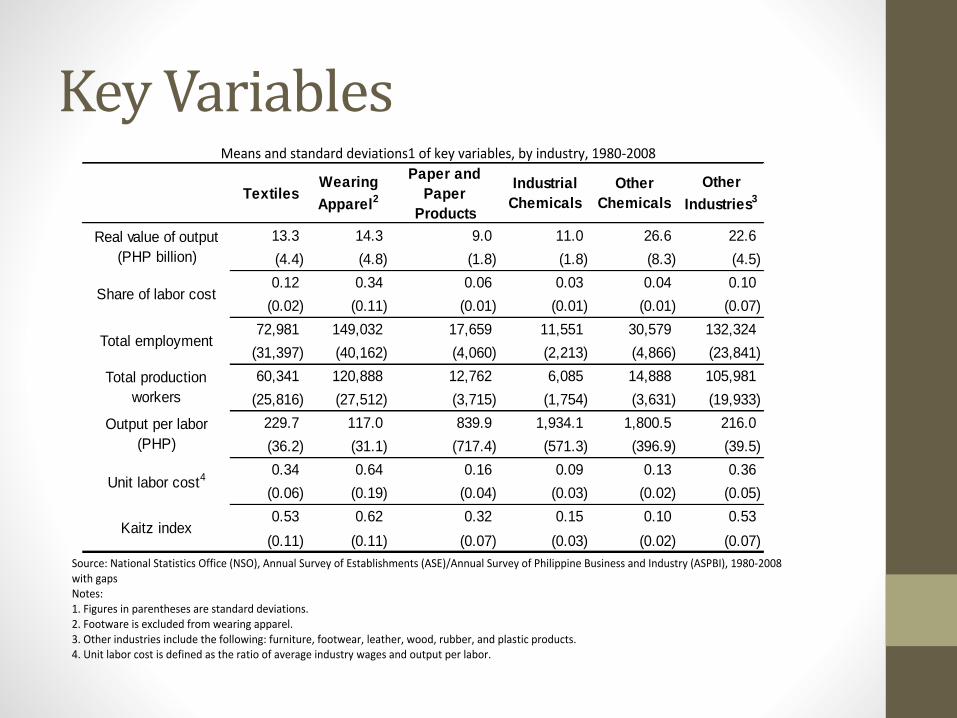
Key Variables Means and standard deviations1 of key variables, by industry, 1980-2008
Source: National Statistics Office (NSO), Annual Survey of Establishments (ASE)/Annual Survey of Philippine Business and Industry (ASPBI), 1980-2008 with gaps Notes: 1. Figures in parentheses are standard deviations. 2. Footware is excluded from wearing apparel. 3. Other industries include the following: furniture, footwear, leather, wood, rubber, and plastic products. 4. Unit labor cost is defined as the ratio of average industry wages and output per labor.
TextilesWearing
Apparel2
Paper and
Paper
Products
Industrial
Chemicals
Other
Chemicals
Other
Industries3
13.3 14.3 9.0 11.0 26.6 22.6
(4.4) (4.8) (1.8) (1.8) (8.3) (4.5)
0.12 0.34 0.06 0.03 0.04 0.10
(0.02) (0.11) (0.01) (0.01) (0.01) (0.07)
72,981 149,032 17,659 11,551 30,579 132,324
(31,397) (40,162) (4,060) (2,213) (4,866) (23,841)
60,341 120,888 12,762 6,085 14,888 105,981
(25,816) (27,512) (3,715) (1,754) (3,631) (19,933)
229.7 117.0 839.9 1,934.1 1,800.5 216.0
(36.2) (31.1) (717.4) (571.3) (396.9) (39.5)
0.34 0.64 0.16 0.09 0.13 0.36
(0.06) (0.19) (0.04) (0.03) (0.02) (0.05)
0.53 0.62 0.32 0.15 0.10 0.53
(0.11) (0.11) (0.07) (0.03) (0.02) (0.07)
Source: NSO, ASE/ASPBI, 1980-2008 w ith gaps
Notes:
1. Figures in parentheses are standard deviations.
2. Footw are is excluded from w earing apparel.
3. Other industries include the follow ing: furniture, footw ear, leather, w ood, rubber, and plastic products.
4. Unit labor cost is defined as the ratio of average industry w ages and output per labor.
Real value of output
(PHP billion)
Share of labor cost
Total employment
Total production
workers
Output per labor
(PHP)
Unit labor cost4
Kaitz index

Methodology for Firm Data
• By means of various econometric methods, the study is able to establish a causal relationship between minimum wages and employment. In particular, the analyses based on both national and regional pooled data and panel data show that minimum wage policy appears to reduce employment.
• Fixed effects (FE) estimates are conducted for all ASE data in order to control for the unobserved heterogeneity at the industrial -national and regional - and firm levels.
• Random effects (RE) models are also going to be tested in order to determine if the conclusions made in the FE models can be generalized for their particular grouping.
• Finally, because of the wide time coverage for the national and regional data, the estimates for these datasets can be used to perform difference-in-difference analysis as these cover the period before the minimum policy change in 1990.
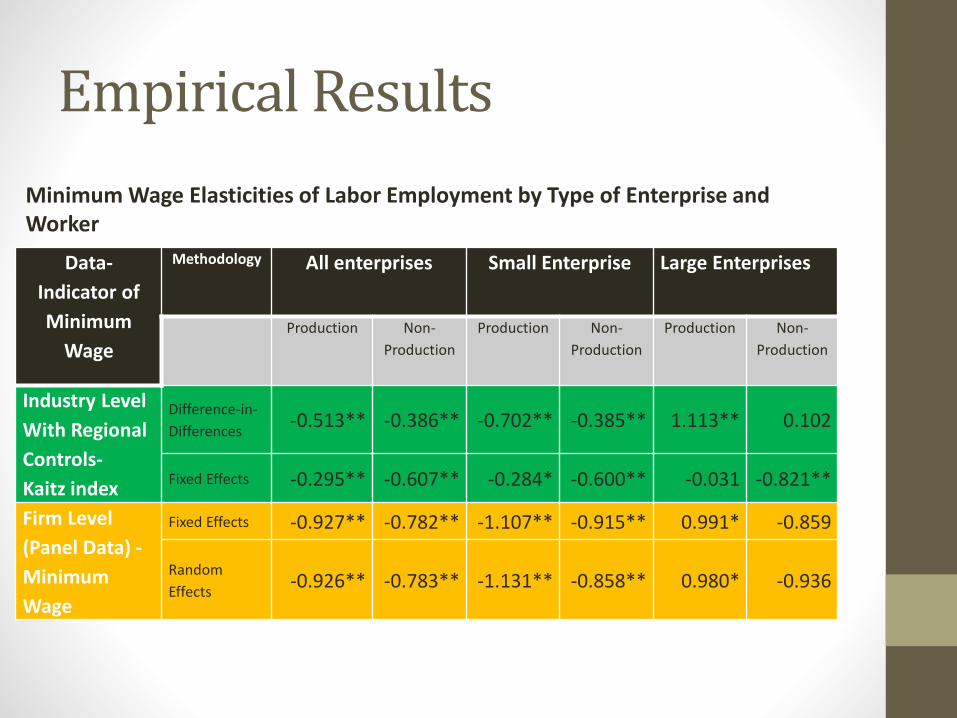
Empirical Results
Data-
Indicator of
Minimum
Wage
Methodology All enterprises Small Enterprise Large Enterprises
Production Non-
Production
Production Non-
Production
Production Non-
Production
Industry Level
With Regional
Controls-
Kaitz index
Difference-in-
Differences-0.513** -0.386** -0.702** -0.385** 1.113** 0.102
Fixed Effects -0.295** -0.607** -0.284* -0.600** -0.031 -0.821**
Firm Level
(Panel Data) -
Minimum
Wage
Fixed Effects -0.927** -0.782** -1.107** -0.915** 0.991* -0.859
Random
Effects-0.926** -0.783** -1.131** -0.858** 0.980* -0.936
Minimum Wage Elasticities of Labor Employment by Type of Enterprise and Worker
Empirical Results
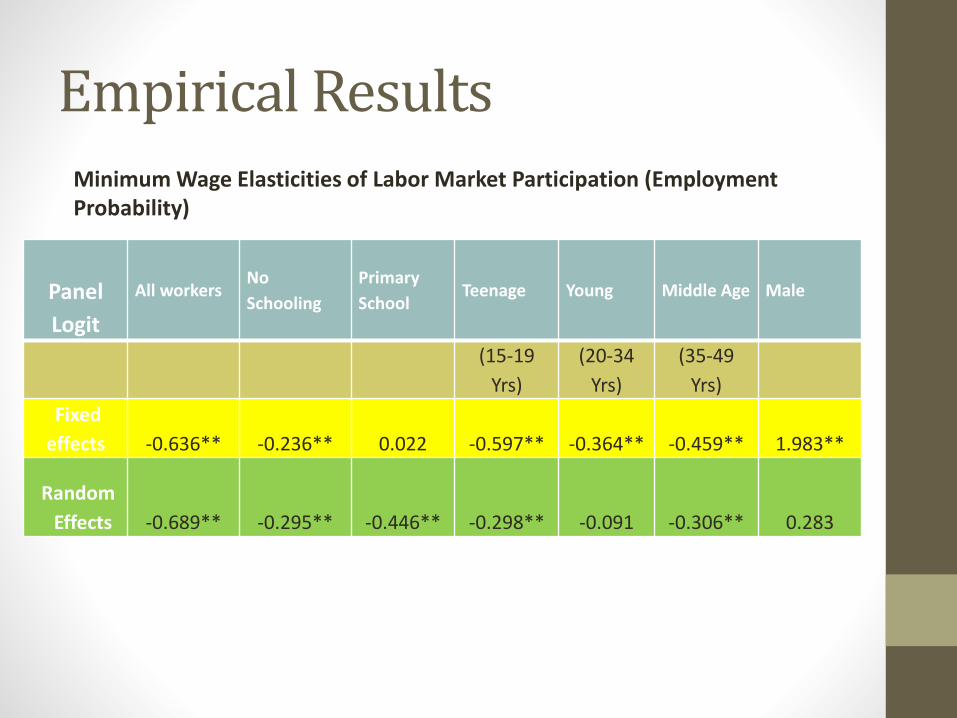
Panel
Logit
All workersNo
Schooling
Primary
SchoolTeenage Young Middle Age Male
(15-19
Yrs)
(20-34
Yrs)
(35-49
Yrs)
Fixed
effects -0.636** -0.236** 0.022 -0.597** -0.364** -0.459** 1.983**
Random
Effects -0.689** -0.295** -0.446** -0.298** -0.091 -0.306** 0.283
Minimum Wage Elasticities of Labor Market Participation (Employment Probability)
Conclusion
• The paper finds that minimum wages causes firms to reduce their production workers. Theory predicts that minimum wages can adversely affect employment because of scale effects. The negative impact of minimum wages emanates from scale effects which predict that such outcomes are a consequence of greater marginal costs.
• Because of this, it is difficult for small firms to mature into larger scale firms. In the process, the production and the demand for production workers declines.
• In the process, the larger firms are able to hire some of these workers. In addition, such firms are able to able minimize training costs by laying off younger and less educated production workers.
Conclusion
• All of these findings seem consistent with the analysis made on the panel data from the Labor Force Surveys. The effect of regulations on employment is far from neutral across demographic subgroups. The results indicate that minimum wages reduced the employment opportunities of the young and the less educated while promoting the employment rates of more educated and older workers.
• Minimum wages may force some workers out of wage employment due to higher cost of production. The results of the empirical tests point to the possibility that firms in anticipation of higher costs of labor can just as likely to lay off younger, less educated or less skilled workers in order to increase savings.
• Moreover, minimum wages could have resulted in women having found lesser job opportunities, as firms would prefer males. In this case, the young and less educated female workers are disadvantaged by the minimum wage policy.
Conclusion
• Finally, the Kaitz index is higher for more labor-intensiveindustries, suggesting that the minimum wage policy may have failed to account for the labor requirements of these small industries because the policy focuses mainly on protecting workers at the regional level. In conjunction with the other findings, this offers some support for labor market policy reforms.
• In particular, these findings may have serious consequences in the way the labor code affects production efficiency but also social protection. There is thus a need to coordinate these policy areas in a way that reinforces one another