Embed Size (px)
Citation preview
sustainability
Article
The Effects of Microclimate Parameters on OutdoorThermal Sensation in Severe Cold Cities
Ming Lu 1, Tuoyu Hou 1,*, Jingwan Fu 1 and Yuan Wei 2
1 Key Laboratory of Cold Region Urban and Rural Human Settlement Environment Science and Technology,Ministry of Industry and Information Technology, School of Architecture, Harbin Institute of Technology,Harbin 150001, China; [email protected] (M.L.); [email protected] (J.F.)
2 College of Urban and Rural Construction, Shanxi Agricultural University, Jinzhong 030801, China;[email protected]
* Correspondence: [email protected]
Received: 18 January 2019; Accepted: 12 March 2019; Published: 15 March 2019�����������������
Abstract: This study investigated the outdoor thermal sensation characteristics in severe coldcities, and the effects of four microclimate parameters on outdoor thermal sensation. A one-yearinvestigation of public spaces in Harbin, China, as an example of a severe cold city, was carriedout. Volunteers were randomly invited to fill out a microclimate perception questionnaire, and thereal-time microclimate data were measured and recorded at the same time on site. The relationshipbetween the outdoor actual thermal sensation and the perception of microclimate parameters wasanalyzed quantitatively. The results showed that the effect of microclimate parameters on the actualthermal sensation was very significant. The actual thermal sensation varies greatly from the seasons.People feel the most comfortable in the transition season. Among the four parameters, temperaturehas the greatest effect on ATSV in cold season and severe cold season, solar radiation has the greatesteffect on ATSV in transition season and hot season. In the severe cold season and hot season, the windspeed also has a significant effect on ATSV.
Keywords: microclimate; thermal sensation; severe cold cities
1. Introduction
In recent years, people have paid great attention to the comfort of outdoor activities, and theimpact of outdoor microclimate on health. The field research has found that the description ofmicroclimate perception often begins with ‘feeling cold or hot’, which means that the most intuitiveperception of microclimate is the actual thermal sensation. In the severe cold cities of northern China,the cold and windy climate has adversely affected residents’ winter activities. There are also persistenthigh temperature and high humidity weather in summer in these cities, with the increasing effect ofurban heat island, which makes the impact of microclimate perception more complicated. Therefore,how to make the microclimate parameters meet the requirement of thermal sensation, this is veryimportant for people living in severe cold cities.
The outdoor thermal sensation is affected by the microclimate parameters, including airtemperature, air humidity, air velocity (wind speed) and thermal radiation (solar radiation). At present,researchers have paid attention to the effect of microclimate parameters on thermal sensation.Gaitani et al. studied the thermal sensation of the activists in the outdoor environment [1–3].Nikolopoulou et al. compared the thermal comfort of different urban spaces [4]. These studiesshow that the influence of air temperature and solar radiation on the outdoor thermal sensation isthe most significant, while the influence of air humidity and wind speed on the thermal sensation
Sustainability 2019, 11, 1572; doi:10.3390/su11061572 www.mdpi.com/journal/sustainability
Sustainability 2019, 11, 1572 2 of 12
depends on the range of outdoor air temperature [5–8]. These studies indicate that the microclimaticparameters not only affect the thermal sensation, but also interact with each other.
The ultimate goal of this study on thermal sensation is to achieve microclimate comfort, overallcomfort is also an important indicator. ‘When the temperature is close to the neutral temperature,the microclimate is considered comfortable.’ This finding has been proven by the studies of neutraltemperature in different cities [9–14]. Neutral temperature is a temperature that makes people feelneither cold nor hot. Liu et al. compared neutral temperatures in some cities, pointed out that neutraltemperatures were lower in cold cities than in hot ones, especially in winter [15]. These studies haveproved that the numerical range of the thermal sensation was entirely different in different climateand areas [14,15].
Therefore, many research results would not be applicable to severe cold cities. In severe coldcities, researchers are trying to establish a set of criteria to evaluate the quality of the outdoor publicspace microclimate, and to help designers create a comfortable environment. Chen et al. studiedthe acceptability range of severe cold cities in China [16]. Lai et al. studied the neutral physiologicalequivalent temperature (PET) range [17]. Zhang et al. studied an integrated design approach tosystematically evaluate and optimize school design parameters at different design stages for summeroutdoor thermal comfort demand [18].
The relationship between spatial layout and microclimatic parameters is very close. In urbanplanning and design, a more comfortable microclimate is often obtained by adjusting the site scale.Hedquist et al. investigated outdoor human comfort, utilizing output from the microclimate modelENVI-met, and predicted mean vote outcomes at key points within each of the three areas [19].Limor et al. investigated how to reduce, by appropriate urban design, air temperature at the streetlevel and to improve pedestrian thermal conditions in summer [20]. Gruchy et al. considered theeffects of urban layout and architectural form on the microclimate, and proposed indicators of urbanand architectural design [21]. These studies show that we can adjust the microclimate by adjustingthe aspect ratio of the street, the orientation of the street, the open degree of the site, the high-risebuilding and the multi-storey building, the greening, the setting of sunshade and so on. At the sametime, many kinds of computer simulation techniques are widely used, such as CFD, ENVI-met andGIS etc. Taleghani et al. simulated outdoor air temperature, mean radiant temperature, wind speedand relative humidity, and the effects of urban and architectural forms on microclimate parametersand thermal comfort were studied [22,23].
There are some limitations in the existing studies. First, the studies for severe cold area are stillinsufficient. Second, the actual thermal sensation is also affected by the psychological and physiologicalfactors of the environmental perception. When the environment changes, it stimulates the humanbody, and people adapt to the stress by changing clothes and using sunshade to achieve physical andmental balance. As such, behavior changes are difficult to quantify. Third, the existing studies didnot reveal the effects of the outdoor microclimate parameters on actual thermal sensation, which canprovide more useful basis for the design of public spaces in severe cold cites.
The characteristics and influencing factors of thermal sensation in severe cold cities are of greatvalue, and the effect of microclimate parameters on actual thermal sensation is the focus of this study.Additionally, time periods in the existing studies are selected according to the four seasons [24–27].However, the temperature of cities in the north and south regions varies significantly from season toseason in countries such as China, where the latitudes on the north and south borders are entirelydifferent. Therefore, to study thermal sensation, the investigation period should be selected accordingto the temperature variation of the target city. Finally, the relationship between spatial layout andmicroclimatic parameters is very close. The actual thermal sensation can be used as an importantindex of environmental quality assessment. The study has considered the impact of behavior onevaluation results. This effect is different from the indoor environment, not just the movement or rest,or what kind of clothing people wear. The subjects are not individuals, but a group of people who werepurposefully active. Their state is likely to change and they can make themselves more comfortable by
Sustainability 2019, 11, 1572 3 of 12
taking the initiative, such as opening the neckline, taking off their coats or gloves, or choosing a morecomfortable environment. These factors are closely related to actual engineering projects and that isvaluable to urban planners. Therefore, the study of microclimate and thermal sensation can be used toguide urban planning.
In this study, a one-year investigation of public spaces in Harbin, China, as an example of severecold cities, was carried out. The objective of this study was to investigate the effect of outdoormicroclimate on the actual thermal sensation in public spaces of severe cold cities.
2. Methods
2.1. Survey Site
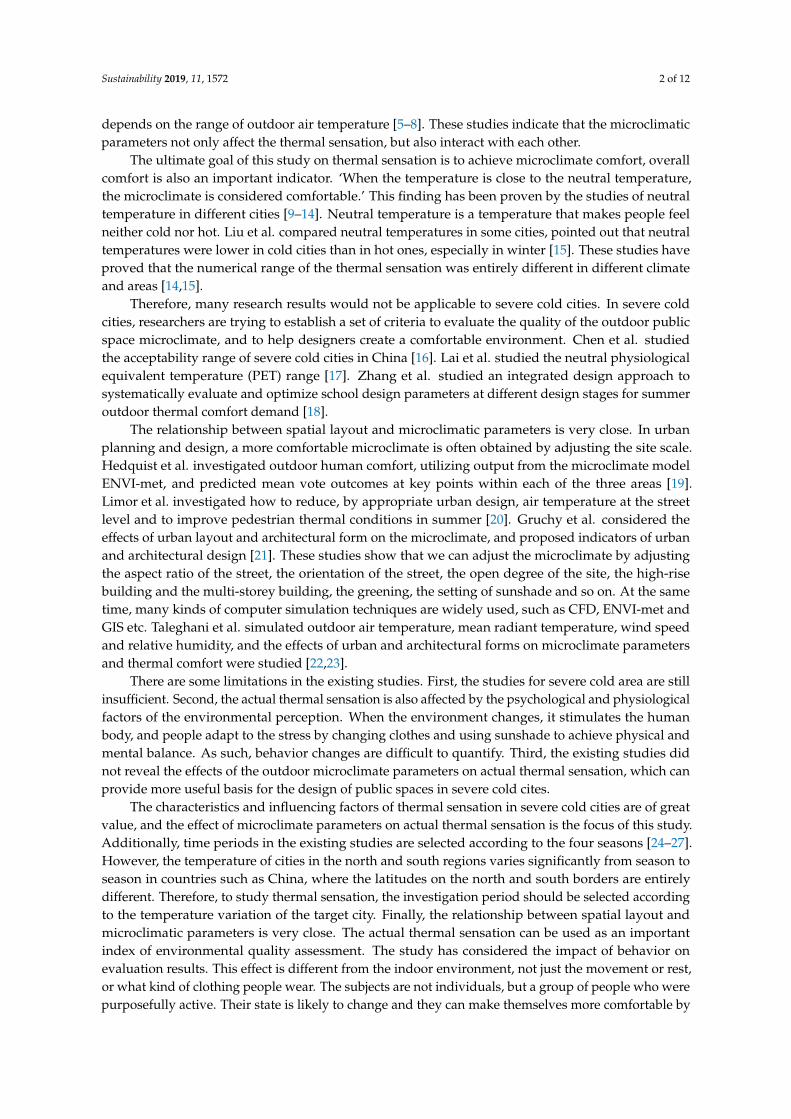
Harbin (125◦42′ E–130◦10′ E, 44◦04′N–46◦40′ N) is the capital of Heilongjiang Province innortheast China and is also a typical severe cold city. Four typical outdoor public spaces wereselected as the field investigation locations, as shown in Table 1. The public spaces are large parks inthe central urban area of Harbin, with a large number of activists. The types and activities of thesespaces are different, and there is a steady flow of people. Moreover, people can access these publicspaces freely. The influence of different spatial forms on outdoor microclimate was considered in theselection of these locations. Abundant microclimate data could be acquired as the spatial morphologywas entirely different.
Table 1. Basic spatial information of the locations.
Location Number Image of the Space Description of the Space
1
Sustainability 2019, 11, x FOR PEER REVIEW 3 of 12
In this study, a one-year investigation of public spaces in Harbin, China, as an example of severe cold cities, was carried out. The objective of this study was to investigate the effect of outdoor microclimate on the actual thermal sensation in public spaces of severe cold cities.
2. Methods
2.1. Survey Site
Harbin (125°42′ E–130°10′ E、44°04′N–46°40′ N) is the capital of Heilongjiang Province in northeast China and is also a typical severe cold city. Four typical outdoor public spaces were selected as the field investigation locations, as shown in Table 1. The public spaces are large parks in the central urban area of Harbin, with a large number of activists. The types and activities of these spaces are different, and there is a steady flow of people. Moreover, people can access these public spaces freely. The influence of different spatial forms on outdoor microclimate was considered in the selection of these locations. Abundant microclimate data could be acquired as the spatial morphology was entirely different.
Table 1. Basic spatial information of the locations.
Location Number Image of the Space Description of the Space
1
Space type: road Subsurface: pavement Natural elements: trees
2
space type: square subsurface: masonry pavement
natural elements: trees, shrubs, grass
3
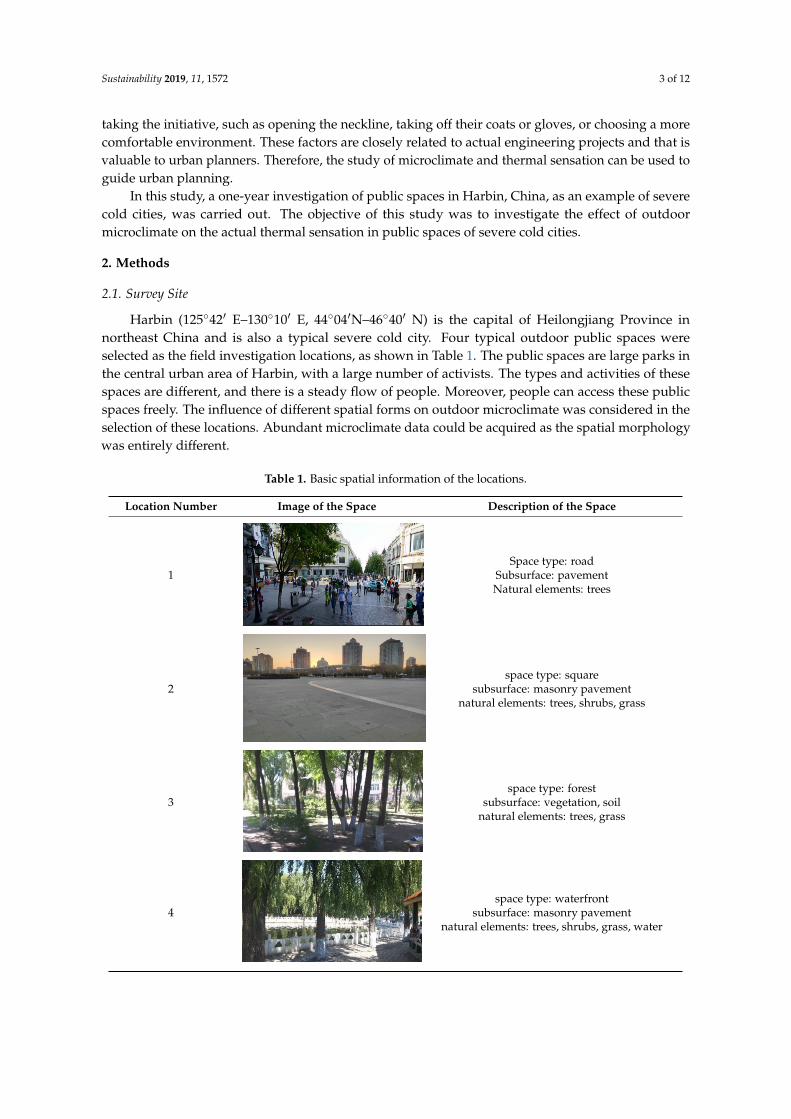
space type: forest subsurface: vegetation, soil
natural elements: trees, grass
4
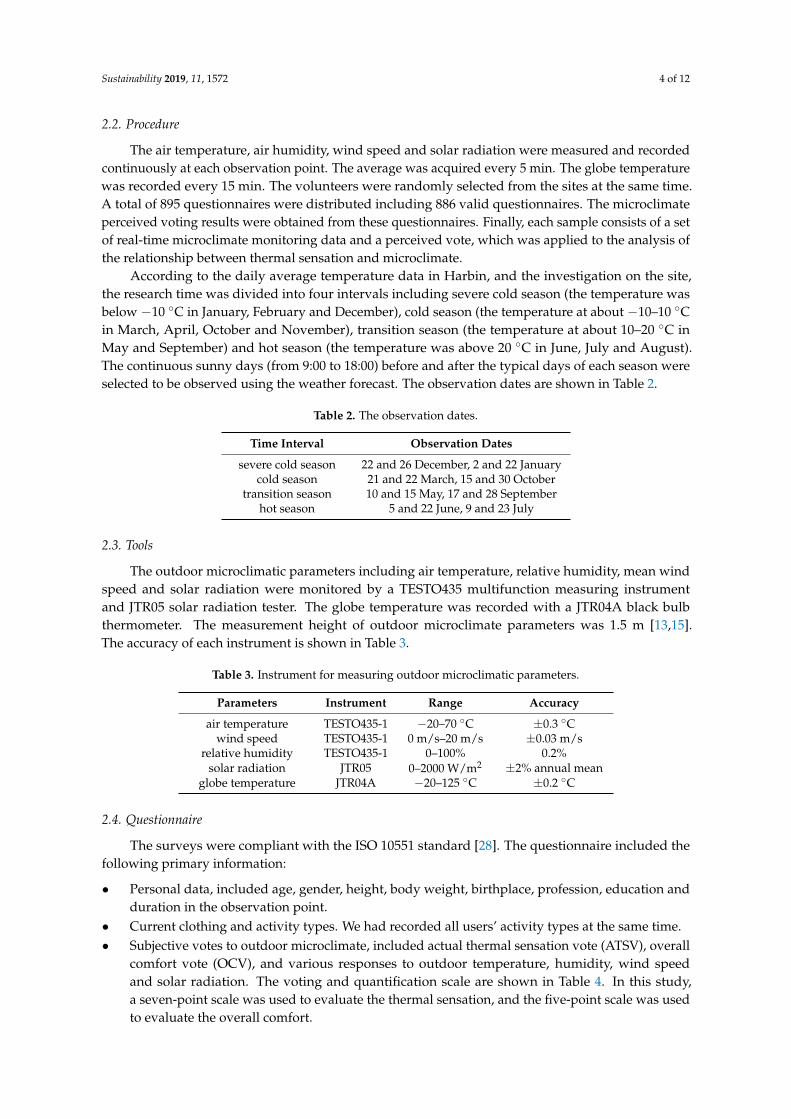
space type: waterfront subsurface: masonry pavement
natural elements: trees, shrubs, grass, water
2.2. Procedure
The air temperature, air humidity, wind speed and solar radiation were measured and recorded continuously at each observation point. The average was acquired every 5 min. The globe temperature was recorded every 15 min. The volunteers were randomly selected from the sites at the same time. A total of 895 questionnaires were distributed including 886 valid questionnaires. The microclimate perceived voting results were obtained from these questionnaires. Finally, each sample
Space type: roadSubsurface: pavementNatural elements: trees
2
Sustainability 2019, 11, x FOR PEER REVIEW 3 of 12
In this study, a one-year investigation of public spaces in Harbin, China, as an example of severe cold cities, was carried out. The objective of this study was to investigate the effect of outdoor microclimate on the actual thermal sensation in public spaces of severe cold cities.
2. Methods
2.1. Survey Site
Harbin (125°42′ E–130°10′ E、44°04′N–46°40′ N) is the capital of Heilongjiang Province in northeast China and is also a typical severe cold city. Four typical outdoor public spaces were selected as the field investigation locations, as shown in Table 1. The public spaces are large parks in the central urban area of Harbin, with a large number of activists. The types and activities of these spaces are different, and there is a steady flow of people. Moreover, people can access these public spaces freely. The influence of different spatial forms on outdoor microclimate was considered in the selection of these locations. Abundant microclimate data could be acquired as the spatial morphology was entirely different.
Table 1. Basic spatial information of the locations.
Location Number Image of the Space Description of the Space
1
Space type: road Subsurface: pavement Natural elements: trees
2
space type: square subsurface: masonry pavement
natural elements: trees, shrubs, grass
3
space type: forest subsurface: vegetation, soil
natural elements: trees, grass
4
space type: waterfront subsurface: masonry pavement
natural elements: trees, shrubs, grass, water
2.2. Procedure
The air temperature, air humidity, wind speed and solar radiation were measured and recorded continuously at each observation point. The average was acquired every 5 min. The globe temperature was recorded every 15 min. The volunteers were randomly selected from the sites at the same time. A total of 895 questionnaires were distributed including 886 valid questionnaires. The microclimate perceived voting results were obtained from these questionnaires. Finally, each sample
space type: squaresubsurface: masonry pavement
natural elements: trees, shrubs, grass
3
Sustainability 2019, 11, x FOR PEER REVIEW 3 of 12
In this study, a one-year investigation of public spaces in Harbin, China, as an example of severe cold cities, was carried out. The objective of this study was to investigate the effect of outdoor microclimate on the actual thermal sensation in public spaces of severe cold cities.
2. Methods
2.1. Survey Site
Harbin (125°42′ E–130°10′ E、44°04′N–46°40′ N) is the capital of Heilongjiang Province in northeast China and is also a typical severe cold city. Four typical outdoor public spaces were selected as the field investigation locations, as shown in Table 1. The public spaces are large parks in the central urban area of Harbin, with a large number of activists. The types and activities of these spaces are different, and there is a steady flow of people. Moreover, people can access these public spaces freely. The influence of different spatial forms on outdoor microclimate was considered in the selection of these locations. Abundant microclimate data could be acquired as the spatial morphology was entirely different.
Table 1. Basic spatial information of the locations.
Location Number Image of the Space Description of the Space
1
Space type: road Subsurface: pavement Natural elements: trees
2
space type: square subsurface: masonry pavement
natural elements: trees, shrubs, grass
3
space type: forest subsurface: vegetation, soil
natural elements: trees, grass
4
space type: waterfront subsurface: masonry pavement
natural elements: trees, shrubs, grass, water
2.2. Procedure
The air temperature, air humidity, wind speed and solar radiation were measured and recorded continuously at each observation point. The average was acquired every 5 min. The globe temperature was recorded every 15 min. The volunteers were randomly selected from the sites at the same time. A total of 895 questionnaires were distributed including 886 valid questionnaires. The microclimate perceived voting results were obtained from these questionnaires. Finally, each sample
space type: forestsubsurface: vegetation, soil
natural elements: trees, grass
4
Sustainability 2019, 11, x FOR PEER REVIEW 3 of 12
In this study, a one-year investigation of public spaces in Harbin, China, as an example of severe cold cities, was carried out. The objective of this study was to investigate the effect of outdoor microclimate on the actual thermal sensation in public spaces of severe cold cities.
2. Methods
2.1. Survey Site
Harbin (125°42′ E–130°10′ E、44°04′N–46°40′ N) is the capital of Heilongjiang Province in northeast China and is also a typical severe cold city. Four typical outdoor public spaces were selected as the field investigation locations, as shown in Table 1. The public spaces are large parks in the central urban area of Harbin, with a large number of activists. The types and activities of these spaces are different, and there is a steady flow of people. Moreover, people can access these public spaces freely. The influence of different spatial forms on outdoor microclimate was considered in the selection of these locations. Abundant microclimate data could be acquired as the spatial morphology was entirely different.
Table 1. Basic spatial information of the locations.
Location Number Image of the Space Description of the Space
1
Space type: road Subsurface: pavement Natural elements: trees
2
space type: square subsurface: masonry pavement
natural elements: trees, shrubs, grass
3
space type: forest subsurface: vegetation, soil
natural elements: trees, grass
4
space type: waterfront subsurface: masonry pavement
natural elements: trees, shrubs, grass, water
2.2. Procedure
The air temperature, air humidity, wind speed and solar radiation were measured and recorded continuously at each observation point. The average was acquired every 5 min. The globe temperature was recorded every 15 min. The volunteers were randomly selected from the sites at the same time. A total of 895 questionnaires were distributed including 886 valid questionnaires. The microclimate perceived voting results were obtained from these questionnaires. Finally, each sample
space type: waterfrontsubsurface: masonry pavement
natural elements: trees, shrubs, grass, water
Sustainability 2019, 11, 1572 4 of 12
2.2. Procedure
The air temperature, air humidity, wind speed and solar radiation were measured and recordedcontinuously at each observation point. The average was acquired every 5 min. The globe temperaturewas recorded every 15 min. The volunteers were randomly selected from the sites at the same time.A total of 895 questionnaires were distributed including 886 valid questionnaires. The microclimateperceived voting results were obtained from these questionnaires. Finally, each sample consists of a setof real-time microclimate monitoring data and a perceived vote, which was applied to the analysis ofthe relationship between thermal sensation and microclimate.
According to the daily average temperature data in Harbin, and the investigation on the site,the research time was divided into four intervals including severe cold season (the temperature wasbelow −10 ◦C in January, February and December), cold season (the temperature at about −10–10 ◦Cin March, April, October and November), transition season (the temperature at about 10–20 ◦C inMay and September) and hot season (the temperature was above 20 ◦C in June, July and August).The continuous sunny days (from 9:00 to 18:00) before and after the typical days of each season wereselected to be observed using the weather forecast. The observation dates are shown in Table 2.
Table 2. The observation dates.
Time Interval Observation Dates
severe cold season 22 and 26 December, 2 and 22 Januarycold season 21 and 22 March, 15 and 30 October
transition season 10 and 15 May, 17 and 28 Septemberhot season 5 and 22 June, 9 and 23 July
2.3. Tools
The outdoor microclimatic parameters including air temperature, relative humidity, mean windspeed and solar radiation were monitored by a TESTO435 multifunction measuring instrumentand JTR05 solar radiation tester. The globe temperature was recorded with a JTR04A black bulbthermometer. The measurement height of outdoor microclimate parameters was 1.5 m [13,15].The accuracy of each instrument is shown in Table 3.
Table 3. Instrument for measuring outdoor microclimatic parameters.
Parameters Instrument Range Accuracy
air temperature TESTO435-1 −20–70 ◦C ±0.3 ◦Cwind speed TESTO435-1 0 m/s–20 m/s ±0.03 m/s
relative humidity TESTO435-1 0–100% 0.2%solar radiation JTR05 0–2000 W/m2 ±2% annual mean
globe temperature JTR04A −20–125 ◦C ±0.2 ◦C
2.4. Questionnaire
The surveys were compliant with the ISO 10551 standard [28]. The questionnaire included thefollowing primary information:
• Personal data, included age, gender, height, body weight, birthplace, profession, education andduration in the observation point.
• Current clothing and activity types. We had recorded all users’ activity types at the same time.• Subjective votes to outdoor microclimate, included actual thermal sensation vote (ATSV), overall
comfort vote (OCV), and various responses to outdoor temperature, humidity, wind speedand solar radiation. The voting and quantification scale are shown in Table 4. In this study,a seven-point scale was used to evaluate the thermal sensation, and the five-point scale was usedto evaluate the overall comfort.
Sustainability 2019, 11, 1572 5 of 12
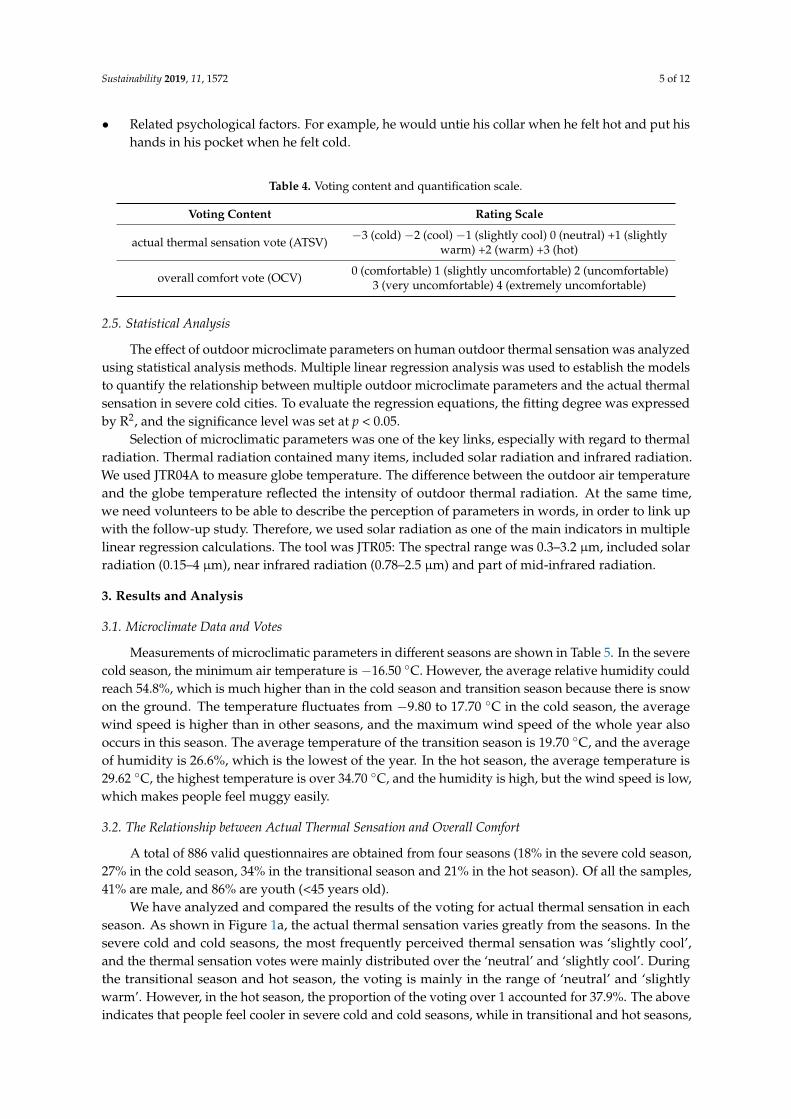
• Related psychological factors. For example, he would untie his collar when he felt hot and put hishands in his pocket when he felt cold.
Table 4. Voting content and quantification scale.
Voting Content Rating Scale
actual thermal sensation vote (ATSV) −3 (cold) −2 (cool) −1 (slightly cool) 0 (neutral) +1 (slightlywarm) +2 (warm) +3 (hot)
overall comfort vote (OCV) 0 (comfortable) 1 (slightly uncomfortable) 2 (uncomfortable)3 (very uncomfortable) 4 (extremely uncomfortable)
2.5. Statistical Analysis
The effect of outdoor microclimate parameters on human outdoor thermal sensation was analyzedusing statistical analysis methods. Multiple linear regression analysis was used to establish the modelsto quantify the relationship between multiple outdoor microclimate parameters and the actual thermalsensation in severe cold cities. To evaluate the regression equations, the fitting degree was expressedby R2, and the significance level was set at p < 0.05.
Selection of microclimatic parameters was one of the key links, especially with regard to thermalradiation. Thermal radiation contained many items, included solar radiation and infrared radiation.We used JTR04A to measure globe temperature. The difference between the outdoor air temperatureand the globe temperature reflected the intensity of outdoor thermal radiation. At the same time,we need volunteers to be able to describe the perception of parameters in words, in order to link upwith the follow-up study. Therefore, we used solar radiation as one of the main indicators in multiplelinear regression calculations. The tool was JTR05: The spectral range was 0.3–3.2 µm, included solarradiation (0.15–4 µm), near infrared radiation (0.78–2.5 µm) and part of mid-infrared radiation.
3. Results and Analysis
3.1. Microclimate Data and Votes
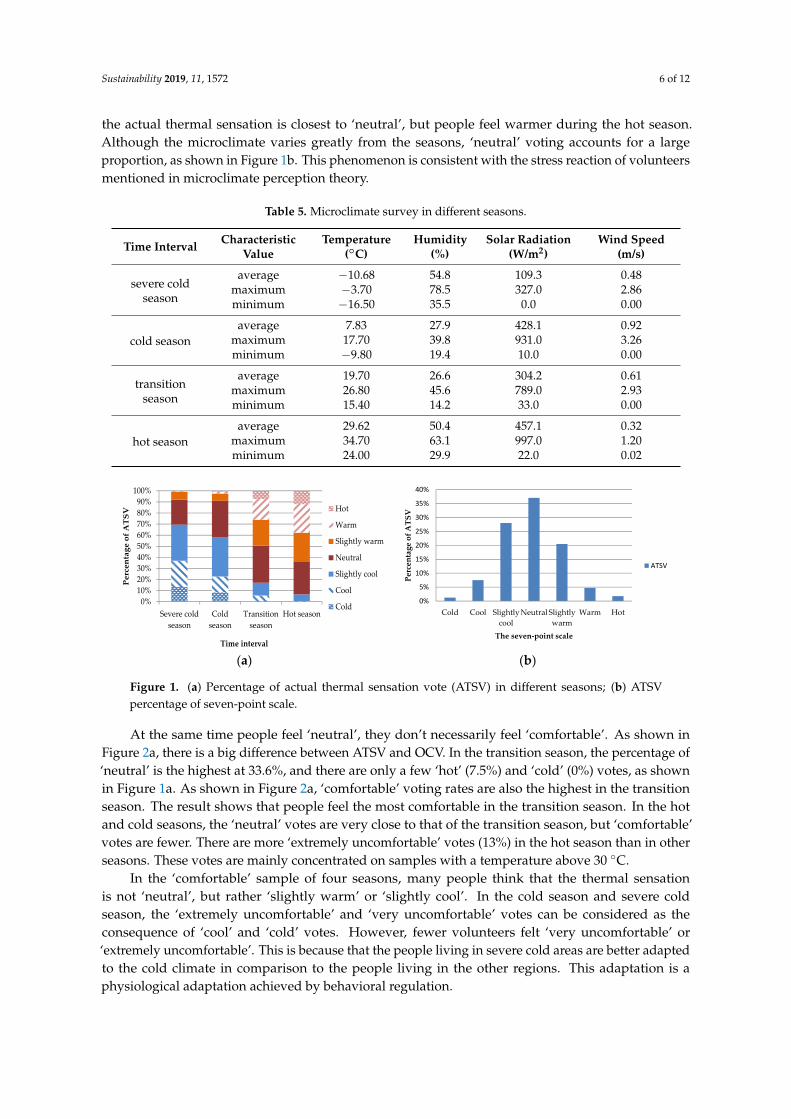
Measurements of microclimatic parameters in different seasons are shown in Table 5. In the severecold season, the minimum air temperature is −16.50 ◦C. However, the average relative humidity couldreach 54.8%, which is much higher than in the cold season and transition season because there is snowon the ground. The temperature fluctuates from −9.80 to 17.70 ◦C in the cold season, the averagewind speed is higher than in other seasons, and the maximum wind speed of the whole year alsooccurs in this season. The average temperature of the transition season is 19.70 ◦C, and the averageof humidity is 26.6%, which is the lowest of the year. In the hot season, the average temperature is29.62 ◦C, the highest temperature is over 34.70 ◦C, and the humidity is high, but the wind speed is low,which makes people feel muggy easily.
3.2. The Relationship between Actual Thermal Sensation and Overall Comfort
A total of 886 valid questionnaires are obtained from four seasons (18% in the severe cold season,27% in the cold season, 34% in the transitional season and 21% in the hot season). Of all the samples,41% are male, and 86% are youth (<45 years old).
We have analyzed and compared the results of the voting for actual thermal sensation in eachseason. As shown in Figure 1a, the actual thermal sensation varies greatly from the seasons. In thesevere cold and cold seasons, the most frequently perceived thermal sensation was ‘slightly cool’,and the thermal sensation votes were mainly distributed over the ‘neutral’ and ‘slightly cool’. Duringthe transitional season and hot season, the voting is mainly in the range of ‘neutral’ and ‘slightlywarm’. However, in the hot season, the proportion of the voting over 1 accounted for 37.9%. The aboveindicates that people feel cooler in severe cold and cold seasons, while in transitional and hot seasons,
Sustainability 2019, 11, 1572 6 of 12
the actual thermal sensation is closest to ‘neutral’, but people feel warmer during the hot season.Although the microclimate varies greatly from the seasons, ‘neutral’ voting accounts for a largeproportion, as shown in Figure 1b. This phenomenon is consistent with the stress reaction of volunteersmentioned in microclimate perception theory.
Table 5. Microclimate survey in different seasons.
Time Interval CharacteristicValue
Temperature(◦C)
Humidity(%)
Solar Radiation(W/m2)
Wind Speed(m/s)
severe coldseason
average −10.68 54.8 109.3 0.48maximum −3.70 78.5 327.0 2.86minimum −16.50 35.5 0.0 0.00
cold seasonaverage 7.83 27.9 428.1 0.92
maximum 17.70 39.8 931.0 3.26minimum −9.80 19.4 10.0 0.00
transitionseason
average 19.70 26.6 304.2 0.61maximum 26.80 45.6 789.0 2.93minimum 15.40 14.2 33.0 0.00
hot seasonaverage 29.62 50.4 457.1 0.32
maximum 34.70 63.1 997.0 1.20minimum 24.00 29.9 22.0 0.02
Sustainability 2019, 11, x FOR PEER REVIEW 6 of 12
3.2. The Relationship between Actual Thermal Sensation and Overall Comfort
A total of 886 valid questionnaires are obtained from four seasons (18% in the severe cold season, 27% in the cold season, 34% in the transitional season and 21% in the hot season). Of all the samples, 41% are male, and 86% are youth (<45 years old).
We have analyzed and compared the results of the voting for actual thermal sensation in each season. As shown in Figure 1a, the actual thermal sensation varies greatly from the seasons. In the severe cold and cold seasons, the most frequently perceived thermal sensation was ‘slightly cool’, and the thermal sensation votes were mainly distributed over the ‘neutral’ and ‘slightly cool’. During the transitional season and hot season, the voting is mainly in the range of ‘neutral’ and ‘slightly warm’. However, in the hot season, the proportion of the voting over 1 accounted for 37.9%. The above indicates that people feel cooler in severe cold and cold seasons, while in transitional and hot seasons, the actual thermal sensation is closest to ‘neutral’, but people feel warmer during the hot season. Although the microclimate varies greatly from the seasons, ‘neutral’ voting accounts for a large proportion, as shown in Figure 1b. This phenomenon is consistent with the stress reaction of volunteers mentioned in microclimate perception theory.
(a) (b)
Figure 1. (a) Percentage of actual thermal sensation vote (ATSV) in different seasons; (b) ATSV percentage of seven-point scale.
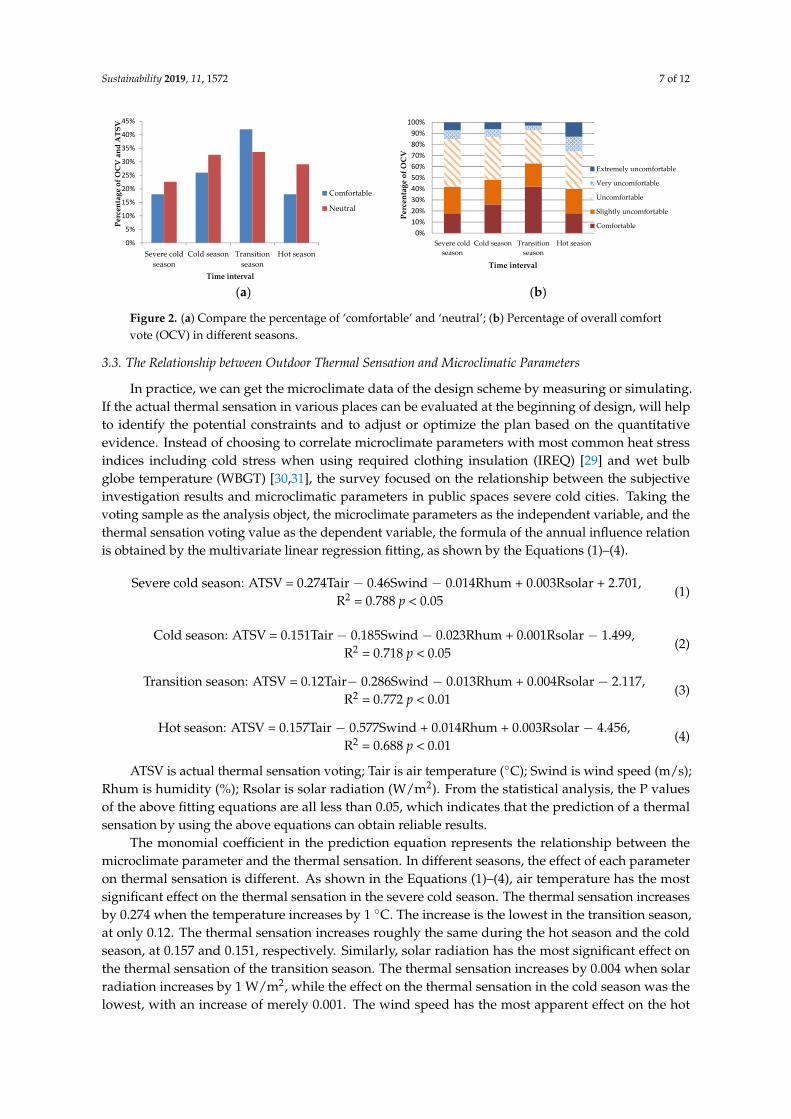
At the same time people feel ‘neutral’, they don’t necessarily feel ‘comfortable’. As shown in Figure 2a, there is a big difference between ATSV and OCV. In the transition season, the percentage of ‘neutral’ is the highest at 33.6%, and there are only a few ‘hot’ (7.5%) and ‘cold’ (0%) votes, as shown in Figure 1a. As shown in Figure 2a, ‘comfortable’ voting rates are also the highest in the transition season. The result shows that people feel the most comfortable in the transition season. In the hot and cold seasons, the ‘neutral’ votes are very close to that of the transition season, but ‘comfortable’ votes are fewer. There are more ‘extremely uncomfortable’ votes (13%) in the hot season than in other seasons. These votes are mainly concentrated on samples with a temperature above 30 °C.
In the ‘comfortable’ sample of four seasons, many people think that the thermal sensation is not ‘neutral ’, but rather ‘slightly warm’ or ‘slightly cool’. In the cold season and severe cold season, the ‘extremely uncomfortable’ and ‘very uncomfortable’ votes can be considered as the consequence of ‘cool’ and ‘cold’ votes. However, fewer volunteers felt ‘very uncomfortable’ or ‘extremely uncomfortable’. This is because that the people living in severe cold areas are better adapted to the cold climate in comparison to the people living in the other regions. This adaptation is a physiological adaptation achieved by behavioral regulation.
0%10%20%30%40%50%60%70%80%90%
100%
Severe coldseason
Coldseason
Transitionseason
Hot season
Perc
enta
ge o
f A
TS
V
Time interval
Hot
Warm
Slightly warm
Neutral
Slightly cool
Cool
Cold0%
5%
10%
15%
20%
25%
30%
35%
40%
Cold Cool Slightlycool
Neutral Slightlywarm
Warm Hot
Perc
enta
ge o
f ATS
V
The seven-point scale
ATSV
Figure 1. (a) Percentage of actual thermal sensation vote (ATSV) in different seasons; (b) ATSVpercentage of seven-point scale.
At the same time people feel ‘neutral’, they don’t necessarily feel ‘comfortable’. As shown inFigure 2a, there is a big difference between ATSV and OCV. In the transition season, the percentage of‘neutral’ is the highest at 33.6%, and there are only a few ‘hot’ (7.5%) and ‘cold’ (0%) votes, as shownin Figure 1a. As shown in Figure 2a, ‘comfortable’ voting rates are also the highest in the transitionseason. The result shows that people feel the most comfortable in the transition season. In the hotand cold seasons, the ‘neutral’ votes are very close to that of the transition season, but ‘comfortable’votes are fewer. There are more ‘extremely uncomfortable’ votes (13%) in the hot season than in otherseasons. These votes are mainly concentrated on samples with a temperature above 30 ◦C.
In the ‘comfortable’ sample of four seasons, many people think that the thermal sensationis not ‘neutral’, but rather ‘slightly warm’ or ‘slightly cool’. In the cold season and severe coldseason, the ‘extremely uncomfortable’ and ‘very uncomfortable’ votes can be considered as theconsequence of ‘cool’ and ‘cold’ votes. However, fewer volunteers felt ‘very uncomfortable’ or‘extremely uncomfortable’. This is because that the people living in severe cold areas are better adaptedto the cold climate in comparison to the people living in the other regions. This adaptation is aphysiological adaptation achieved by behavioral regulation.
Sustainability 2019, 11, 1572 7 of 12Sustainability 2019, 11, x FOR PEER REVIEW 7 of 12
(a) (b)
Figure 2. (a) Compare the percentage of ‘comfortable’ and ‘neutral’; (b) Percentage of overall comfort vote (OCV) in different seasons.
3.3. The Relationship between Outdoor Thermal Sensation and Microclimatic Parameters
In practice, we can get the microclimate data of the design scheme by measuring or simulating. If the actual thermal sensation in various places can be evaluated at the beginning of design, will help to identify the potential constraints and to adjust or optimize the plan based on the quantitative evidence. Instead of choosing to correlate microclimate parameters with most common heat stress indices including cold stress when using required clothing insulation (IREQ) [29] and wet bulb globe temperature (WBGT) [30,31], the survey focused on the relationship between the subjective investigation results and microclimatic parameters in public spaces severe cold cities. Taking the voting sample as the analysis object, the microclimate parameters as the independent variable, and the thermal sensation voting value as the dependent variable, the formula of the annual influence relation is obtained by the multivariate linear regression fitting, as shown by the Equations (1)–(4).
Severe cold season: ATSV = 0.274Tair − 0.46Swind − 0.014Rhum + 0.003Rsolar + 2.701, R2
= 0.788 p < 0.05 (1)
Cold season: ATSV = 0.151Tair − 0.185Swind − 0.023Rhum + 0.001Rsolar − 1.499, R2 = 0.718 p < 0.05
(2)
Transition season: ATSV = 0.12Tair− 0.286Swind − 0.013Rhum + 0.004Rsolar − 2.117, R2 = 0.772 p < 0.01
(3)
Hot season: ATSV = 0.157Tair − 0.577Swind + 0.014Rhum + 0.003Rsolar − 4.456, R2 = 0.688 p < 0.01 (4)
ATSV is actual thermal sensation voting; Tair is air temperature (°C); Swind is wind speed (m/s); Rhum is humidity (%); Rsolar is solar radiation (W/m2). From the statistical analysis, the P values of the above fitting equations are all less than 0.05, which indicates that the prediction of a thermal sensation by using the above equations can obtain reliable results.
The monomial coefficient in the prediction equation represents the relationship between the microclimate parameter and the thermal sensation. In different seasons, the effect of each parameter on thermal sensation is different. As shown in the Equations (1)–(4), air temperature has the most significant effect on the thermal sensation in the severe cold season. The thermal sensation increases by 0.274 when the temperature increases by 1 °C. The increase is the lowest in the transition season, at only 0.12. The thermal sensation increases roughly the same during the hot season and the cold season, at 0.157 and 0.151, respectively. Similarly, solar radiation has the most significant effect on the thermal sensation of the transition season. The thermal sensation increases by 0.004 when solar radiation increases by 1 W/m2, while the effect on the thermal sensation in the cold season was the lowest, with an increase of merely 0.001. The wind speed has the most apparent effect on the hot season. The increase in the wind speed of 1 m/s can cause a 0.577 decrease in thermal sensation. While the effect on the cold season was the least, only decreasing by 0.185. Humidity is the most
0%
5%
10%
15%
20%
25%
30%
35%
40%
45%
Severe coldseason
Cold season Transitionseason
Hot season
Perc
enta
ge o
f OC
V a
nd A
TSV
Time interval
Comfortable
Neutral
0%10%20%30%40%50%60%70%80%90%
100%
Severe coldseason
Cold season Transitionseason
Hot season
Perc
enta
ge o
f OC
V
Time interval
Extremely uncomfortable
Very uncomfortable
Uncomfortable
Slightly uncomfortable
Comfortable
Figure 2. (a) Compare the percentage of ‘comfortable’ and ‘neutral’; (b) Percentage of overall comfortvote (OCV) in different seasons.
3.3. The Relationship between Outdoor Thermal Sensation and Microclimatic Parameters
In practice, we can get the microclimate data of the design scheme by measuring or simulating.If the actual thermal sensation in various places can be evaluated at the beginning of design, will helpto identify the potential constraints and to adjust or optimize the plan based on the quantitativeevidence. Instead of choosing to correlate microclimate parameters with most common heat stressindices including cold stress when using required clothing insulation (IREQ) [29] and wet bulbglobe temperature (WBGT) [30,31], the survey focused on the relationship between the subjectiveinvestigation results and microclimatic parameters in public spaces severe cold cities. Taking thevoting sample as the analysis object, the microclimate parameters as the independent variable, and thethermal sensation voting value as the dependent variable, the formula of the annual influence relationis obtained by the multivariate linear regression fitting, as shown by the Equations (1)–(4).
Severe cold season: ATSV = 0.274Tair − 0.46Swind − 0.014Rhum + 0.003Rsolar + 2.701,R2 = 0.788 p < 0.05
(1)
Cold season: ATSV = 0.151Tair − 0.185Swind − 0.023Rhum + 0.001Rsolar − 1.499,R2 = 0.718 p < 0.05
(2)
Transition season: ATSV = 0.12Tair− 0.286Swind − 0.013Rhum + 0.004Rsolar − 2.117,R2 = 0.772 p < 0.01
(3)
Hot season: ATSV = 0.157Tair − 0.577Swind + 0.014Rhum + 0.003Rsolar − 4.456,R2 = 0.688 p < 0.01
(4)
ATSV is actual thermal sensation voting; Tair is air temperature (◦C); Swind is wind speed (m/s);Rhum is humidity (%); Rsolar is solar radiation (W/m2). From the statistical analysis, the P valuesof the above fitting equations are all less than 0.05, which indicates that the prediction of a thermalsensation by using the above equations can obtain reliable results.
The monomial coefficient in the prediction equation represents the relationship between themicroclimate parameter and the thermal sensation. In different seasons, the effect of each parameteron thermal sensation is different. As shown in the Equations (1)–(4), air temperature has the mostsignificant effect on the thermal sensation in the severe cold season. The thermal sensation increasesby 0.274 when the temperature increases by 1 ◦C. The increase is the lowest in the transition season,at only 0.12. The thermal sensation increases roughly the same during the hot season and the coldseason, at 0.157 and 0.151, respectively. Similarly, solar radiation has the most significant effect onthe thermal sensation of the transition season. The thermal sensation increases by 0.004 when solarradiation increases by 1 W/m2, while the effect on the thermal sensation in the cold season was thelowest, with an increase of merely 0.001. The wind speed has the most apparent effect on the hot
Sustainability 2019, 11, 1572 8 of 12
season. The increase in the wind speed of 1 m/s can cause a 0.577 decrease in thermal sensation.While the effect on the cold season was the least, only decreasing by 0.185. Humidity is the mostdiscrete variable in the prediction formula of each season. In the hot season, humidity is positivelycorrelated with thermal sensation, while it is negatively correlated in the severe cold season, coldseason and transition season.
To compare the relative impact of independent variables on ATSV, we took the voting sampleas the analysis object, the microclimate parameters as the independent variable, and the thermalsensation voting value as the dependent variable, the standardization coefficients of the microclimateparameters are obtained by the multivariate linear regression fitting, as shown in Table 6. Amongthe four parameters, temperature has the greatest effect on ATSV in cold season (0.81) and severecold season (0.697). Solar radiation has the greatest effect on ATSV in transition season and hotseason. In the severe cold season and hot season, the wind speed also has a significant effect on ATSV(−0.17, −0.167), but in the transition season and cold season, the effect becomes less (−0.077, −0.099).The effect of hot air on thermal sensation has not been demonstrated in this study. Climatic conditionsalso have an effect on humidity, resulting in a very small coefficient of humidity. These issues need tobe further studied.
Table 6. Standardization coefficient of microclimatic parameters in different seasons.
Time Interval Temperature Wind Speed Humidity Solar Radiation
severe cold season 0.697 −0.170 −0.110 0.271cold season 0.810 −0.077 −0.085 0.184
transition season 0.360 −0.099 −0.080 0.618hot season 0.272 −0.167 0.125 0.528
4. Discussion
The above results reveal the effect of outdoor microclimate parameters on the actual thermalsensation in severe cold cities. Throughout the year, the increase in outdoor air temperature and solarradiation caused the rise of outdoor thermal sensation, while the effect on wind speed was the opposite.At the same time, there are seasonal and regional differences in the effect of microclimate parameterson the outdoor actual thermal sensation, which are mainly reflected in neutral air temperature (NAT).
Outdoor neutral air temperature (NAT) refers to the outdoor air temperature when the averagethermal sensation vote of the target group equals to 0 (neutral). The NAT can be calculated accordingto the Equations (1)–(4). The values of outdoor humidity, wind speed, and solar radiation need to beset according to the standard thermal conditions [5]:
• The outdoor air humidity is set to 50%;• The outdoor wind speed is set to 0.1 m/s;• The solar radiation is 0 (close to 0 thermal radiation).
The results are as follows: NAT reaches the highest value in summer (24.3 ◦C) and the lowestvalue (−7.1 ◦C) in winter. The NAT of spring and autumn (including the cold and transition seasonsmentioned above) are between 17.7 ◦C and 23.3 ◦C.
Given the regional and seasonal differences between outdoor thermal sensation and neutral airtemperature, the neutral air temperature in Harbin is compared with that in cities in southern China,Changsha, and Taipei [15,26], as shown in Table 7. It is found that the NAT in Harbin is lower and of ahigher difference in winter and summer than that of other two cities. These differences are related tothe climatic conditions of the city. The difference between the average temperature in summer andwinter in Harbin is approximately 40 ◦C, which is the reason why the residents in a city of this kind ofsevere cold are more adaptable to seasonal climate change.
Sustainability 2019, 11, 1572 9 of 12
Table 7. Comparison of outdoor air temperature range and neutral air temperature (NAT) betweennorth and south cities in China.
City
Outdoor Mean Temperature (◦C) Outdoor Neutral Temperature (◦C)
Severe ColdSeason (Winter)
Hot Season(Summer)
Severe ColdSeason (Winter)
Hot Season(Summer)
Harbin −15 24 −7.1 24.3Taipei 19 25 21.3 28.5
Changsha 8.3 30.2 16.7 24.5
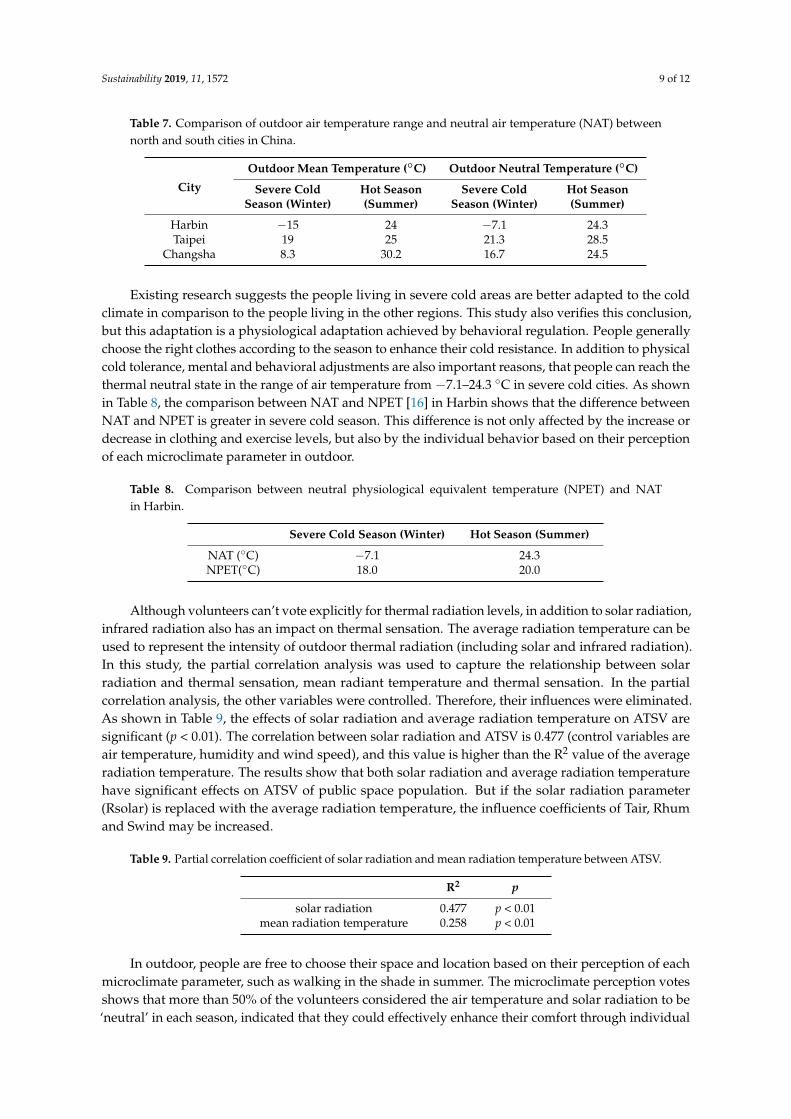
Existing research suggests the people living in severe cold areas are better adapted to the coldclimate in comparison to the people living in the other regions. This study also verifies this conclusion,but this adaptation is a physiological adaptation achieved by behavioral regulation. People generallychoose the right clothes according to the season to enhance their cold resistance. In addition to physicalcold tolerance, mental and behavioral adjustments are also important reasons, that people can reach thethermal neutral state in the range of air temperature from −7.1–24.3 ◦C in severe cold cities. As shownin Table 8, the comparison between NAT and NPET [16] in Harbin shows that the difference betweenNAT and NPET is greater in severe cold season. This difference is not only affected by the increase ordecrease in clothing and exercise levels, but also by the individual behavior based on their perceptionof each microclimate parameter in outdoor.
Table 8. Comparison between neutral physiological equivalent temperature (NPET) and NATin Harbin.
Severe Cold Season (Winter) Hot Season (Summer)
NAT (◦C) −7.1 24.3NPET(◦C) 18.0 20.0
Although volunteers can’t vote explicitly for thermal radiation levels, in addition to solar radiation,infrared radiation also has an impact on thermal sensation. The average radiation temperature can beused to represent the intensity of outdoor thermal radiation (including solar and infrared radiation).In this study, the partial correlation analysis was used to capture the relationship between solarradiation and thermal sensation, mean radiant temperature and thermal sensation. In the partialcorrelation analysis, the other variables were controlled. Therefore, their influences were eliminated.As shown in Table 9, the effects of solar radiation and average radiation temperature on ATSV aresignificant (p < 0.01). The correlation between solar radiation and ATSV is 0.477 (control variables areair temperature, humidity and wind speed), and this value is higher than the R2 value of the averageradiation temperature. The results show that both solar radiation and average radiation temperaturehave significant effects on ATSV of public space population. But if the solar radiation parameter(Rsolar) is replaced with the average radiation temperature, the influence coefficients of Tair, Rhumand Swind may be increased.
Table 9. Partial correlation coefficient of solar radiation and mean radiation temperature between ATSV.
R2 p
solar radiation 0.477 p < 0.01mean radiation temperature 0.258 p < 0.01
In outdoor, people are free to choose their space and location based on their perception of eachmicroclimate parameter, such as walking in the shade in summer. The microclimate perception votesshows that more than 50% of the volunteers considered the air temperature and solar radiation to be‘neutral’ in each season, indicated that they could effectively enhance their comfort through individual
Sustainability 2019, 11, 1572 10 of 12
behavior. 80% of the volunteers thought that the humidity was ‘neutral’, indicating that the changein humidity was within the acceptable range. The wind environment becomes much more complexdue to the occlusion of the buildings in the city. Moreover, the wind speed may vary significantly indifferent places in the same day, which often makes the negative impact of wind speed on thermalsensation more serious. In the cold season, 55% of the volunteers thought that the wind speed was‘strong’ or ‘very strong’, which indicated that high wind speed is an essential reason for the discomfortof outdoor activity. However, it was the opposite in the hot season, where the wind speed was low,and people were feeling muggy. These problems are difficult to adjust through personal behavior.So from the perspective of urban planning, the negative effects of unstable wind speed are more criticalthan the persistent low temperature in winter, especially in severe cold cities.
The survey focused on the relationship between actual thermal sensation voting and microclimaticparameters in severe cold cities. In this survey, volunteers were randomly selected to vote in urbanpublic space. This kind of investigation pays attention to the practice, makes the research result moreaccord with the city situation. However, the sample collected in the survey was not evenly distributed,such as different age structures, sex ratios and behavior types did not have the same number ofquestions. The study also did not collect microclimate data and votes in extreme weather (such asrain and snow). We have obtained the thermal sensing equation for practical engineering, but thevariation trend of regression coefficient needs to be further studied. At the same time, the concretepractice method has not been explained in detail in this paper. In the future, we will further studythese problems.
5. Conclusions
The effects of microclimate on outdoor thermal sensation in severe cold cities were analyzed,and the following conclusions can be drawn:
1. The actual thermal sensation varies greatly from the seasons. In the severe cold and coldseasons, and the thermal sensation votes were mainly distributed over the ‘neutral’ and ‘slightlycool’. During the transitional season and hot season, the voting is mainly in the range of‘neutral’ and ‘slightly warm’. Although the microclimate varies greatly from the seasons, ‘neutral’voting accounts for a large proportion. This phenomenon is consistent with the stress reactionmentioned in microclimate perception theory. The microclimate perception of the volunteers isrelatively accurate. Therefore, improving the microclimate environment can efficiently improvethe activity quality.
2. People feel the most comfortable in the transition season. In the transition season, the percentageof ‘neutral’ is the highest at 33.6%, and there are only a few ‘hot’ (7.5%) and ‘cold’ (0%) votes,and ‘comfortable’ voting rates are also the highest. In the hot and cold seasons, the ‘neutral’ votesare very close to that of the transition season, but ‘comfortable’ votes are fewer. There are more‘extremely uncomfortable’ votes (13%) in the hot season than in other seasons.
3. Microclimate parameters play an essential role in outdoor thermal sensation. From a year-roundperspective, the increase in the air temperature and the solar radiation lead to the rise of outdoorthermal sensation, while the influence of wind speed and relative humidity is the opposite.Outdoor volunteers in severe cold cities are usually not sensitive to humidity. Among the fourparameters, temperature has the greatest effect on ATSV in cold season (0.81) and severe coldseason (0.697). Solar radiation has the greatest effect on ATSV in transition season and hotseason. In the severe cold season and hot season, the wind speed also has a significant effecton ATSV (−0.17, −0.167), but in the transition season and cold season, the effect becomes less(−0.077, −0.099).
4. The NAT of Harbin is 24.3 ◦C in summer, −7.1 ◦C in winter, and between 17.7 ◦C and 23.3 ◦C inspring and autumn.
Sustainability 2019, 11, 1572 11 of 12
5. People’s perception of each microclimate parameter has an impact on comfort. More than 50% ofthe volunteers considered the air temperature and solar radiation to be ‘neutral’ in each season,and 80% of the volunteers thought that the humidity was ‘neutral’, indicating that they caneffectively enhance their comfort through individual behavior. In the cold season, 55% of thevolunteers thought the wind speed was ‘strong’ or ‘very strong’, which indicates that high windspeed is an essential reason for the discomfort of outdoor activity. However, it is the oppositein the hot season, where the wind speed is low, and the activists feel muggy. These problemsare difficult to adjust through personal behavior. So from the perspective of urban planning,the negative effects of unstable wind speed are more critical than the persistent low temperaturein winter, especially in severe cold cities.
Author Contributions: Conceptualization, M.L. and T.H.; Methodology, M.L. and T.H.; Data curation, T.H.and Y.W.; Formal analysis, T.H.; Investigation, T.H., J.F. and Y.W.; Resources, M.L.; Supervision, M.L.; Projectadministration, M.L.; Funding acquisition, M.L.; Writing—original draft preparation, T.H.; Writing—review andediting, M.L., T.H. and J.F.
Funding: This research was funded by National Natural Science Foundation of China for the major project“Research on Adjustment Principle and Design Method of the City Microclimate for Severe Cold Areas”, grantnumber “No. 51438005”.
Acknowledgments: Thanks to the team (National Natural Science Foundation of China for the major project,No. 51438005) for its technical support. The authors would like to acknowledge the subjects who volunteered forthe outdoor field investigation.
Conflicts of Interest: The authors declare no conflict of interest.
References
1. Gaitani, N. On the use of bioclimatic architecture principles in order to improve thermal comfort conditionsin outdoor spaces. Build. Environ. 2007, 1, 317–324. [CrossRef]
2. Givoni, B.; Noguchi, M.; Saroni, H.; Pochter, O.; Yaacov, Y.; Feller, N.; Becker, S. Outdoor comfort researchissues. Energy Build. 2003, 35, 77–86. [CrossRef]
3. Stathopoulos, T.; Wu, H.; Zacharias, J. Outdoor human comfort in an urban climate. Build. Environ. 2004, 39,297–305. [CrossRef]
4. Nikolopoulou, M.; Lykoudis, S. Use of outdoor spaces and microclimate in a Mediterranean urban area.Build. Environ. 2007, 42, 3691–3707. [CrossRef]
5. Höppe, P. Different aspects of assessing indoor and outdoor thermal comfort. Energy Build. 2002, 34, 661–665.[CrossRef]
6. Andrade, H.; Alcoforado, M.; Oliveira, S. Perception of temperature and wind by users of public outdoorspaces: Relationships with weather parameters and personal characteristics. Int. J. Biometeorol. 2011, 55,665–680. [CrossRef] [PubMed]
7. Krüger, E.; Rossi, F. Effect of personal and microclimatic variables on observed thermal sensation from afield study in southern Brazil. Build. Environ. 2011, 46, 690–697. [CrossRef]
8. Matzarakis, A.; Rutz, F.; Mayer, H. Modelling radiation fluxes in simple and complex environmentsapplication of the Rayman model. Int. J. Biometeorol. 2007, 51, 323–334. [CrossRef]
9. Ahmed, K.S. Comfort in urban spaces: Defining the boundaries of outdoor thermal comfort for the tropicalurban environment. Energy Build. 2003, 35, 103–110. [CrossRef]
10. Thorsson, S. Thermal comfort and outdoor activity in Japanese urban public places. Environ. Behav. 2007, 39,660–684. [CrossRef]
11. Hou, T.; Lu, M.; Fu, J. Microclimate perception features of commercial street in severe cold cities. EnergyProcedia 2017, 134, 528–535. [CrossRef]
12. Lenzholzer, S.; Koh, J. Immersed in microclimatic space: Microclimate experience and perception of spatialconfigurations in Dutch squares. Landsc. Urban Plan. 2010, 11, 1–15. [CrossRef]
13. Wei, Y. Research of Thermal Comfort of Microclimate on Harbin Urban Park Based on Behavior Activity.Master’s Thesis, Harbin Institute of Technology, Harbin, China, 2015.

Sustainability 2019, 11, 1572 12 of 12
14. Yang, W.; Wong, N.H.; Jusuf, S.K. Thermal comfort in outdoor urban spaces in Singapore. Build. Environ.2013, 59, 426–435. [CrossRef]
15. Liu, W.; Zhang, Y.; Deng, Q. The effects of urban microclimate on outdoor thermal sensation and neutraltemperature in hot-summer and cold-winter climate. Energy Build. 2016, 128, 190–197. [CrossRef]
16. Chen, X.; Xue, P.; Liu, L.; Gao, L.; Liu, J. Outdoor thermal comfort and adaptation in severe cold area:A longitudinal survey in Harbin. Build. Environ. 2018, 143, 548–560. [CrossRef]
17. Lai, D.; Guo, D.; Hou, Y.; Lin, C.; Chen, Q. Studies of outdoor thermal comfort in northern China.Build. Environ. 2014, 77, 110–118. [CrossRef]
18. Zhang, A.; Bokel, R.; Dobbelsteen, A.; Sun, Y.; Huang, Q.; Zhang, Q. An integrated school and schoolyarddesign method for summer thermal comfort and energy efficiency in northern China. Build. Environ.2017, 124, 369–387. [CrossRef]
19. Hedquist, B.C.; Brazel, A. Seasonal variability of temperatures and outdoor human comfort in Phoenix.Build. Environ. 2014, 72, 377–388. [CrossRef]
20. Limor, S.; Loannis, X.T.; Milo, H. Passive cooling design options to ameliorate thermal comfort in urbanstreets of a Mediterranean climate (Athens) under hot summer conditions. Build. Environ. 2012, 3, 110–119.[CrossRef]
21. Gruchy, G.F.D. Some environmental relationships between topography, built form, landscape andmicroclimate in Brisbane’s city centre. Urban Ecol. 1978, 57, 155–170. [CrossRef]
22. Taleghani, M.; Kleerekoper, L.; Tenpierik, M.; Dobbelsteen, A. Outdoor thermal comfort within five differenturban forms in the Netherlands. Build. Environ. 2015, 83, 65–78. [CrossRef]
23. Salata, F.; Golasi, I.; Vollaro, R.; Vollaro, A. Urban microclimate and outdoor thermal comfort: A properprocedure to fit ENVI-met simulation outputs to experimental data. Cities Soc. 2016, 26, 318–343. [CrossRef]
24. Middel, A.; Hab, K.; Brazel, A.J.; Martin, C.A.; Guhathakurta, S. Impact of urban form and design onmid-afternoon microclimate in Phoenix local climate zones. Urban Plan. 2014, 122, 16–28. [CrossRef]
25. Jin, H.; Kang, J.; Jin, Y.; Shao, T. A study on the construction technics of strawbale walls in severe cold ruralareas of northeast China. Sci. Sin. Technol. 2016, 46, 1079–1085. [CrossRef]
26. Lin, T.; Matzarakis, A. Tourism climate and thermal comfort in Sun Moon Lake, Taiwan. Int. J. Biometeorol.2008, 52, 281–290. [CrossRef]
27. Shui, T.; Liu, J.; Zhang, P.; Liu, S.; Zhao, Z. Development of an urban canopy model for the evaluation ofurban thermal climate with snow cover in severe cold regions. Build. Environ. 2016, 96, 160–170. [CrossRef]
28. International Organization for Standardization. ISO 10551 Ergonomics of the Thermal Environment—Assessmentof the Influence of the Thermal Environment Using Subjective Judgement Scales; ISO Stand; ISO 10551:2001 (E);ISO: London, UK, 2002.
29. International Organization for Standardization. ISO 11079 Ergonomics of the Thermal Environment—Determination and Interpretation of Cold Stress When Using Required Clothing Insulation (IREQ) and LocalCooling Effects; ISO Stand; ISO 11079:2007 (E); ISO: Geneva, Switzerland, 2007.
30. International Organization for Standardization. ISO 7243 Ergonomics of the Thermal Environment—Assessmentof Heat Stress Using the WBGT (Wet Bulb Globe Temperature) Index; ISO Stand; ISO 7243:2017 (E); ISO: Geneva,Switzerland, 2017.
31. D’Ambrosio Alfano, F.R.; Malchaire, J.; Palella, B.I.; Riccio, G. The WBGT index revisited after 60 years ofuse. Ann. Occup. Hyg. 2014, 58, 955–970. [CrossRef] [PubMed]
© 2019 by the authors. Licensee MDPI, Basel, Switzerland. This article is an open accessarticle distributed under the terms and conditions of the Creative Commons Attribution(CC BY) license (http://creativecommons.org/licenses/by/4.0/).
![Real-time Urban Microclimate Analysis Using … Urban Microclimate Analysis Using Internet of Things ... In many IoT applications, ... urban microclimate monitoring [20]. To study](https://img.pdfslide.us/doc/110x75/5ac834157f8b9aa3298bdae6/real-time-urban-microclimate-analysis-using-urban-microclimate-analysis-using.jpg)


![ASSESSMENT OF OUTDOOR THERMAL COMFORT IN … · assessment of outdoor thermal comfort in urban microclimate in hot arid areas .kdolg 6hwdlk 1hyhhq +dp]d dqg 7lp 7rzqvkhqg 6fkrro ri](https://img.pdfslide.us/doc/110x75/5ad4a9517f8b9a0d2d8cb2ee/assessment-of-outdoor-thermal-comfort-in-of-outdoor-thermal-comfort-in-urban.jpg)