Embed Size (px)
Citation preview
The Effects of Integrated Pest Management Techniques (IPM) Farmer Field Schools on
Groundnut Productivity: Evidence from Ghana
Authors:
Eric Carlberg
University of Georgia
Genti Kostandini
University of Georgia
Awere Dankyi
Crops Research Institute
Kumasi, Ghana
Selected Paper prepared for presentation at the Agricultural & Applied Economics
Association’s 2012 AAEA Annual Meeting, Seattle, Washington, August 12-14, 2012
Copyright 2012 by Eric Carlberg, Genti Kostandini, and Awere Dankyi. All rights reserved.
Readers may make verbatim copies of this document for non-commercial purposes by any
means, provided that this copyright notice appears on all such copies.
Abstract: This study examines the impact of Integrated Pest Management-Farmer Field School
(IPM-FFS) programs on groundnut production in Ghana. The program was conducted in the
groundnut regions of Ghana with the goal to improve groundnut agriculture through the
dissemination of information and technology to the producers. Several approaches are used to
control for selection and endogeneity on household level data collected in 2011 from FFS famers
and non-FFS farmers. The results suggest that farmers who participated in the IPM-FFS program
have significantly higher groundnut production levels.
Key Words: Farmer Field School, Integrated Pest Management, Groundnut, Production, Ghana,
Treatment Effects Model
Groundnut is an important crop for both household consumption and cash crop purposes
in Ghana (Debrah and Waliyer 1996). Groundnut production for Ghana in 2010 was 2.5 times
more than at the beginning of the decade. The sharp rise in production is due to a 75% increase
in the area harvested and a 50% increase in yield during the same decade (FAOstat 2012). At the
beginning of the decade, several biotic and abiotic stresses, including aflatoxin, Rosette virus,
and pests, were prevalent, limiting groundnut output (Attuhen-Amankway, Hossain, and Asibi
1998). The integrated pest management farmer field school (IPM-FFS) program was initiated as
a direct response to the need to combat these agricultural stresses.
Farmer Field Schools (FFS) are an adult education program used to disseminate
information and technology to farmers (Van den Berg 2004). It is an interactive and participatory
model used for IPM methods that is present around the world, but is especially common in many
developing countries. FFS began in 1989 in Indonesia with the aim to correct the over usage of
insecticides in rice farming. Today the program covers a variety of farming practices and focuses
on the major crops of Sub-Saharan Africa, Asia, and Latin America. The model is also used to
spread information on non-agricultural topics such as HIV/AIDS, water conservation, food
security, and nutrition (Braun et al. 2006).
Sudan was the first country in Sub-Saharan Africa (SSA) to implement FFS in 1993, but
the first major FFS program in SSA did not arrive until 1996 in Zimbabwe (Rahman 2003). With
the large undeveloped land area in SSA, the FFS model is used as an effective way to spread
information and technology to remote villages with little development on social, health, and
agricultural topics (Braun et al. 2006). The program’s cost effectiveness is a concern, but it does
ensure that remote farmers receive the information (Feder, Murgai, and Quizon 2004). With the
high costs, important policy and program decisions are made from impact assessments that report
on the evaluation of FFS on the intended outcomes.
It is important to determine whether the dissemination of information and technology has
generated positive impacts and sustainability. In order for the program to be worthwhile, the FFS
program needs to not only spread information, but influence farmer behaviors and decisions that
lead to accomplishing the programs goals. One major study concluded that the programs in
Indonesia and Philippines are unsustainable with the current structure and costs (Quizon, Feder,
and Murgai 2001). Other studies looking at the impact report mixed results, with several
concluding the effectiveness diminishes over time with no real long term-effects (Praneetvatakul
& Waibel 2006; Feder, Murgai, and Quizon 2004; Feranadez-Cornejo 1996). At the same time,
several studies find positive impacts of FFSs (Yorobe, Rejesus, and Hammig 2011; Godtland et
al. 2003). The contradicting reports illustrate the difficulty and lack of consensus of a standard
form of assessment for IPM-FFS. This may be due to the fact that the program evolved initially
to address ecological heterogeneity and combat specific, local pest management issues (Braun et
al. 2006).
The purpose of this paper is to evaluate the impact of Ghana’s IPM-FFS on groundnut
productivity. Specifically, this impact evaluation focuses on the groundnut IPM-FFS in Ghana
during the last decade to provide an assessment of the value of Peanut Collaboration Research
Support Program (PCRSP), Council for Scientific and Industrial Research-Crops Research
Institute (CSIR-CSR), and Savannah Agricultural Research Institute’s (SARI) presence in
groundnut research and technology dissemination through FFS using household data collected in
2011. FFSs are a primary tool used to spread agricultural research, including Peanut CRSP’s, in
Ghana. With the growth of Ghana’s groundnut production coinciding with the IPM-FFS
program, it is important to determine if the program is contributing to enhancing productivity.
While most of the impact studies to date evaluated IPM programs on pesticide use and yields,
there are no prior studies that focus on groundnut productivity. Most prior evaluations focused
on rice, cotton, or vegetables (Braun et al. 2006). This impact evaluation on groundnuts in Ghana
will contribute to the literature from an underrepresented region and crop on FFS impact
evaluations.
A treatment effect model is used to address self selection issues that arise from the
structure of the program to better evaluate the treatment effect of the program. To assess the
impact of FFS on groundnut productivity in Ghana, data was collected from Central and
Southern Ghana in 2011. To explore the relationship between FFS and productivity, alternative
treatment effect modeling approaches dissecting the sample between treatment and control
villages are considered each controlling for self-selection and endogeneity issues in the FFS
program. As the results indicate, controlling for participation is critical in order to accurately
estimate the relationship between FFS participation and groundnut productivity.
The rest of the paper is organized as follows. Section two provides a literature review on
FFS impacts including studies focusing on Ghana. The FFS experience in Ghana, along with the
data collection method and a description of the data, are presented in section three. The model
used is discussed in section four. Results and conclusions are provided in sections five and six,
respectively.
Farmer Field School Literature Review
There is an extensive literature on FFSs and a variety of analysis reporting its impact on
developing countries. Studies have analyzed the impact on the farmers attending the program
against non-FFS farmers to discover any significant differences in knowledge, pesticide use,
production, income, or poverty (Davis et al. 2010; Yorobe, Rejesus, and Hammig 2011;
Godtland et al. 2003). Several methods have been used in previous studies, including
instrumental variable procedures (IV), propensity score matching (PSM), and difference in
difference (DiD), with most studies accounting for selection and endogeneity bias. Evidence
from these studies found conflicting reports about the significance of FFS impacts in developing
countries. The results differ depending on the setting, evaluation methods, and the assumptions
used in the evaluation (Godtland et al. 2003). There is currently no agreement on what should be
measured, how to measure the data, and how to analyze the data in reference to the impact of
FFS (Braun et al. 2006). IPM-FFS programs are designed to effectively disseminate information
and technology to a certain region of farmers, usually on a specific crop. Since each crop has
different management techniques and each region contains farmers with different cultures and
practices, the impact of each study must be analyzed on a case-by-case basis. Given the nature of
the program, it is important to identify the setting and specific, relevant variables in order to
accurately measure the local impact.
Ghana FFS Evaluations
There are a couple of studies that analyzed the FFSs in Ghana. An early assessment of the
groundnut FFSs that implemented PCRSP technology was conducted in 2007. The study focused
around one of the early districts to deploy FFS, Ejura-Sekyedumase, and only contained 28 FFS
participants in the 120 farmer survey. The study found higher adoption rates of agronomic
practices relevant to groundnuts, such as land preparation and pest management, paired with
greater social-economic indicators for FFS participants (Dankyi et al. 2007). Since the study
used a small sample early in the region’s FFS program, the study might not be representative of
the population. Also, the study heavily relied on descriptive statistics without controlling for self-
selection issues.
Another study examined FFS trainings on cocoa farmers in the Ashanti region of Ghana
(Gockowski et al. 2006). The program focused on practices and issues directly related to the
management of cocoa crops. A multivariate regression analysis was used to determine the
program’s impact, which estimated a 14% increase in net production for FFS farmers compared
to non-FFS farmers. The study also stressed the impact of FFS training on the decision making
ability of farmers. The study indicated that FFSs also develop decision making skills for farmers
which would produce results on crops outside of the focus of the FFS and the ability of decisions
on agronomic practices not covered in the FFS program (Gockowski et al. 2010).
Other FFS Impact Evaluations
Several impact studies look at the effect FFS programs have on the adoption of certain
farming practices. Yorobe, Rejesus, and Hammig (2011) controlling for selection and
endogeneity problems via an instrumental variable (IV) model, find that FFS onion farmers in
the Philippines have significantly lower insecticide expenditure compared to non-FFS farmers.
This finding is important with the conception that using too much insecticide commonly has
negative impacts on agricultural output along with environmental and health implications.
Godtland et al. (2009) used cross sectional data for PSM and regression analysis to evaluate the
impact of FFS in potato production in the Peruvian Andes. They found that FFS participation has
a significant impact on IPM knowledge and high levels of IPM knowledge have a significant
impact on the production of potatoes. Fernandez-Cornejo (1996) found IPM-FFS to lower
insecticide use in the US, causing a small effect on profits, but no effect on yields. This was a
result of over-usage of insecticide in the study region, but not enough to affect production levels.
Therefore, the change in profit only occurs from lower pesticide costs.
In a study conducted by the International Food Policy Research Institute (IFPRI), FFS
data was evaluated for Tanzania, Kenya, and Uganda. The study looked at participant
characteristics and used a DiD and PSM approach to analyze overall effectiveness of several FFS
in East Africa. The study found an overall significant effect on production and poverty, but
found mixed results when broken down by country (Davis et al. 2010). In 2004, Feder, Murgai,
and Quizon (2004) employed a difference-in-difference approach to FFSs in Indonesia and found
no significant impact. While using the same data, Yamakazi and Resosudarmo (2008) found an
increase in short term yields due to a decrease in pesticide use. Yet in the long term, those who
attended FFS did not achieve significantly different production results than those who did not
attend FFS (Yamazaki and Resosudarmo 2008). Another study found a statistically significant
result for a reduction of insecticide use for farmers who attended FFS using a DiD approach
similar to Feder, Murgai, and Quizon (2004) (Praneetvatakul and Waibel 2006).
The lack of agreement on the impact of FFS begins with the classification of FFS. From
one side of the argument, FFSs are seen as an extension agent tool to disperse information and
technology to local farmers. This system relies heavily on one or two agents to spread the
information throughout the particular region. The other side of the argument views FFS as an
educational activity. Those who are able and willing will participate in the program but will
naturally keep most of the information to themselves (Van den Berg 2004; Braun et al. 2006).
Each type of program will give differing results about the diffusion of information from FFS
participants to non-FFS participants, which will alter results in each region or study. As an
educational program, FFS participants will not only gain information and technology but will
also gain analytical skills; but these skills are less likely to be transferred from one farmer to the
next outside of the FFS (Braun et al. 2006).
The assumption of the dissemination of knowledge from a participant to a non-participant
in FFS will alter the measured impact of the program. Studies in Cambodia and Sri Lanka
illustrate a situation where information from the FFS did not disseminate throughout the region.
The pesticide expenditure was the same for farmers despite no FFS presence in their village (Van
Duuren 2003; Tripp, Wijeratne, and Piyadasa 2005). While no significant differences were found
in Cambodia and Sri Lanka, an assortment of Cotton IPM studies showed a 39% reduction in
pesticide use for FFS farmers and 26% for neighboring farmers compared to the control group
(Braun et al. 2006). FFS participants increased their yield by 10% while simultaneously
decreasing their pesticide expenditure. Even though neighboring farmers decreased their
pesticide expenditure compared to the control group there was no significant difference in yield,
and profitability was only affected by the decrease in pesticide expenditure. Each side of the
argument has also produced differing proposed questions to be assessed. Working with different
initial research questions about how to assess the impact of FFS leads to differing measures to
changes in practice, knowledge, productivity, and profitability.
Farmer Field Schools in Ghana
In 1997, the initial groundnut research began in the Eastern, Brong Ahafo, Volta, and
Ashanti regions of Central and Southern Ghana (see figure 3.1). The initial phase, conducted by
the Council of Scientific and Industrial Research- Crops Research Institute (CSIR-CRI), North
Carolina State University, and the Peanut Collaborative Research Support Program (PCRSP),
began with surveys and documentation of current groundnut pests, cultivars, diseases, and
beneficial organisms to groundnuts in the region (Dankyi et al. 2007). Research continued in the
initial PCRSP phase in Ghana until 2002 by identifying groundnut production constraints. The
information gathered during the initial research period was used as the initial curriculum in the
FFS program (Dankyi et al. 2007).
In 2002, FFSs began at Hiawoanu, in the Ejura-Sekyedumasi district of Ghana, involving
farmers from Bonyon, Hiawoanwu, Ejura, and Dromankuma. This location was used to initiate
the FFS program because of the severity of the damage groundnuts faced from pests and diseases
documented from an initial survey (Dankyi et al. 2007). In 2002, a station at Ejura was selected
to be the first site for the program for proper supervision with plans to increase to more locations.
Each farmer was taken through land preparation, production practices, plant health, seed
selection, site selection, and post-harvest handling (Dankyi et al 2007). After a successful first
year in Hiawoanwu, the FFS program expanded to the Derma and Atebubu in the Brong Ahafo
region as well as the Somanya area of the Eastern region (Figure 3.1). The new sites were
selected due to their popular production in groundnuts and groundnut production constraints
similar to the initial region (Dankyi et al. 2007).
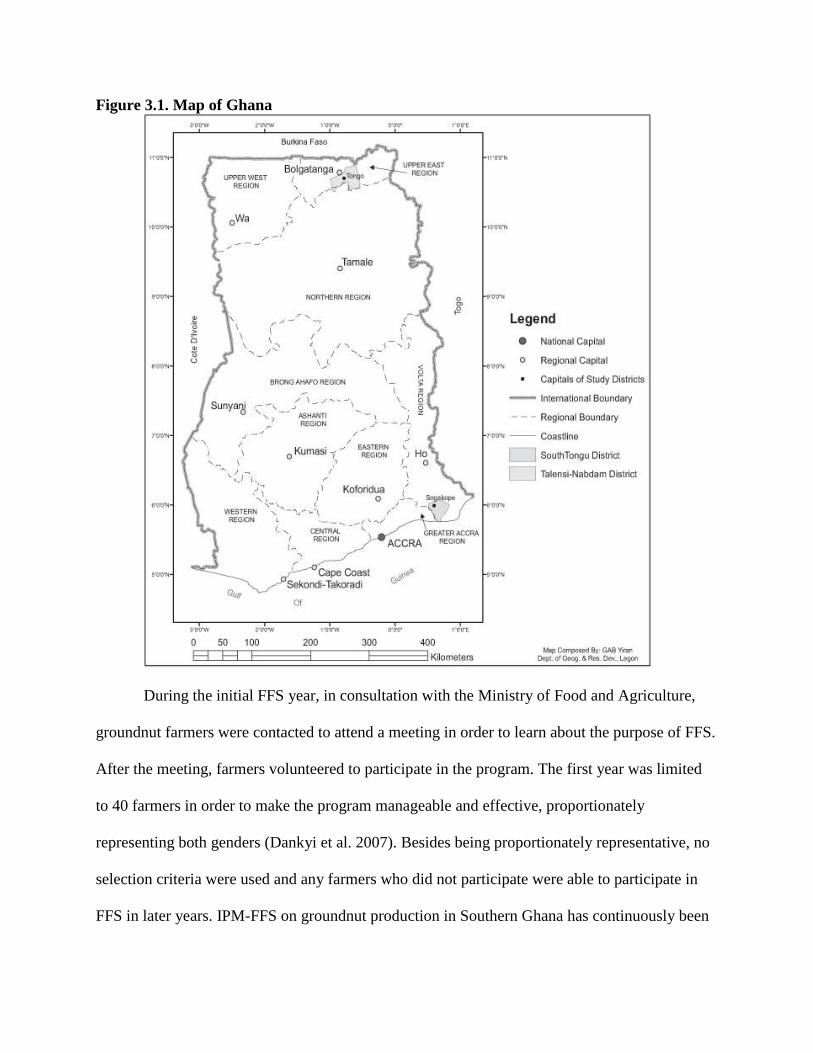
Figure 3.1. Map of Ghana
During the initial FFS year, in consultation with the Ministry of Food and Agriculture,
groundnut farmers were contacted to attend a meeting in order to learn about the purpose of FFS.
After the meeting, farmers volunteered to participate in the program. The first year was limited
to 40 farmers in order to make the program manageable and effective, proportionately
representing both genders (Dankyi et al. 2007). Besides being proportionately representative, no
selection criteria were used and any farmers who did not participate were able to participate in
FFS in later years. IPM-FFS on groundnut production in Southern Ghana has continuously been
operating since 2002 and has trained about 3,000 farmers through 2011 with CSIR-CRI and
PCRSP technologies (Dankyi et al. 2007).
Data Collection Methodology
For the purpose of this study, data were collected from the Ashanti, Brong Ahafo, and
Eastern regions of Ghana. All three regions are common areas for groundnut production and
contain villages that participated in FFS and PCRSP activities. The three regions also spread
throughout three ecological zones: Forest, Coastal Savannah, and Transitional. Household
surveys were used to collect the data in 2011 in six FFS and six non-FFS villages in each region.
The six FFS villages for the study are: Hiawoanwu, Bonyon, Kasei, Atebubu, Derma, and
Somanya.
The non-FFS villages were randomly selected by compiling a list of all villages that are
within a 10 mile radius of each FFS village. Enumerators collaborated with the agricultural
extension officer to compile the lists of non-FFS villages within the designated radius of each
FFS village. After the list was compiled, each village was given a number from one to the total
number of villages. The village numbers were then randomly chosen to decide which village
would participate in the household survey. If the village chosen was too small for our sample,
less than 30 households, it was discarded and another village was chosen. The following non-
FFS villages participated in the household surveys: Monta, Konkoma, Aberewa Ano, Mensuo,
and New Somenya.
Thirty households were randomly chosen from each FFS and non-FFS village.
Enumerators and the agricultural extension officer compiled a list of groundnut farmers in each
village with each farmer receiving a different number. An enumerator chose a random number
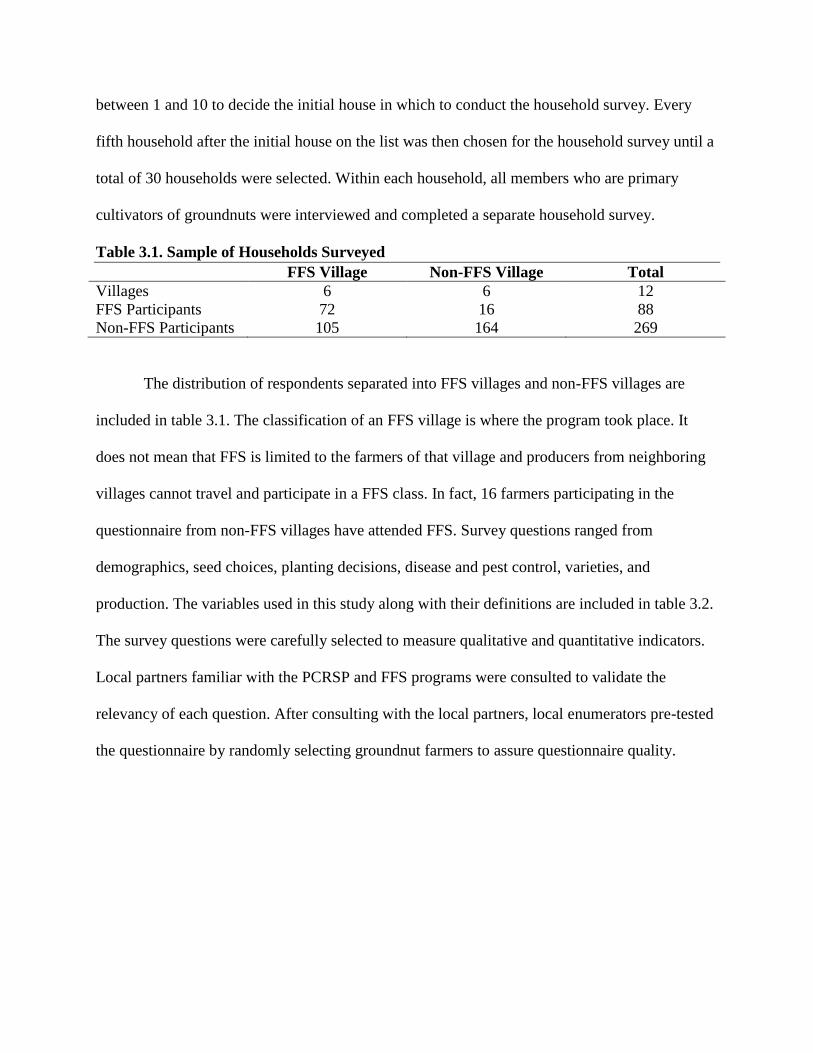
between 1 and 10 to decide the initial house in which to conduct the household survey. Every
fifth household after the initial house on the list was then chosen for the household survey until a
total of 30 households were selected. Within each household, all members who are primary
cultivators of groundnuts were interviewed and completed a separate household survey.
Table 3.1. Sample of Households Surveyed
FFS Village Non-FFS Village Total
Villages 6 6 12
FFS Participants 72 16 88
Non-FFS Participants 105 164 269
The distribution of respondents separated into FFS villages and non-FFS villages are
included in table 3.1. The classification of an FFS village is where the program took place. It
does not mean that FFS is limited to the farmers of that village and producers from neighboring
villages cannot travel and participate in a FFS class. In fact, 16 farmers participating in the
questionnaire from non-FFS villages have attended FFS. Survey questions ranged from
demographics, seed choices, planting decisions, disease and pest control, varieties, and
production. The variables used in this study along with their definitions are included in table 3.2.
The survey questions were carefully selected to measure qualitative and quantitative indicators.
Local partners familiar with the PCRSP and FFS programs were consulted to validate the
relevancy of each question. After consulting with the local partners, local enumerators pre-tested
the questionnaire by randomly selecting groundnut farmers to assure questionnaire quality.
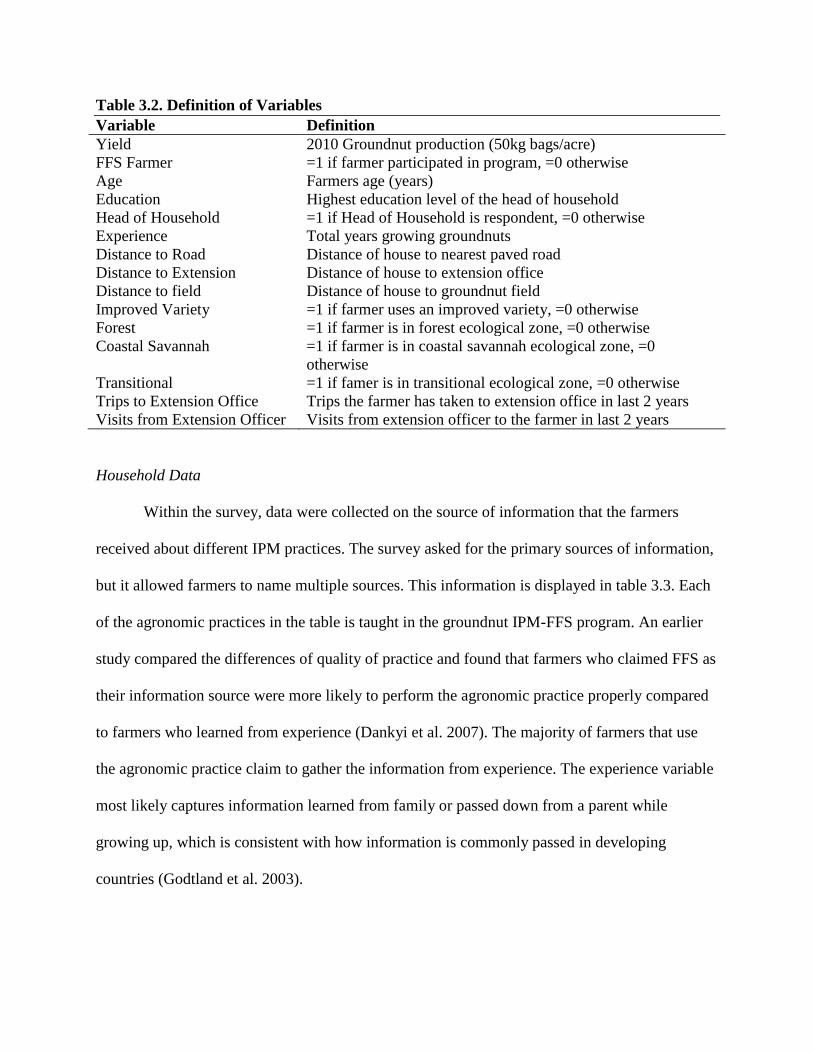
Table 3.2. Definition of Variables
Variable Definition
Yield 2010 Groundnut production (50kg bags/acre)
FFS Farmer =1 if farmer participated in program, =0 otherwise
Age Farmers age (years)
Education Highest education level of the head of household
Head of Household =1 if Head of Household is respondent, =0 otherwise
Experience Total years growing groundnuts
Distance to Road Distance of house to nearest paved road
Distance to Extension Distance of house to extension office
Distance to field Distance of house to groundnut field
Improved Variety =1 if farmer uses an improved variety, =0 otherwise
Forest =1 if farmer is in forest ecological zone, =0 otherwise
Coastal Savannah =1 if farmer is in coastal savannah ecological zone, =0
otherwise
Transitional =1 if famer is in transitional ecological zone, =0 otherwise
Trips to Extension Office Trips the farmer has taken to extension office in last 2 years
Visits from Extension Officer Visits from extension officer to the farmer in last 2 years
Household Data
Within the survey, data were collected on the source of information that the farmers
received about different IPM practices. The survey asked for the primary sources of information,
but it allowed farmers to name multiple sources. This information is displayed in table 3.3. Each
of the agronomic practices in the table is taught in the groundnut IPM-FFS program. An earlier
study compared the differences of quality of practice and found that farmers who claimed FFS as
their information source were more likely to perform the agronomic practice properly compared
to farmers who learned from experience (Dankyi et al. 2007). The majority of farmers that use
the agronomic practice claim to gather the information from experience. The experience variable
most likely captures information learned from family or passed down from a parent while
growing up, which is consistent with how information is commonly passed in developing
countries (Godtland et al. 2003).
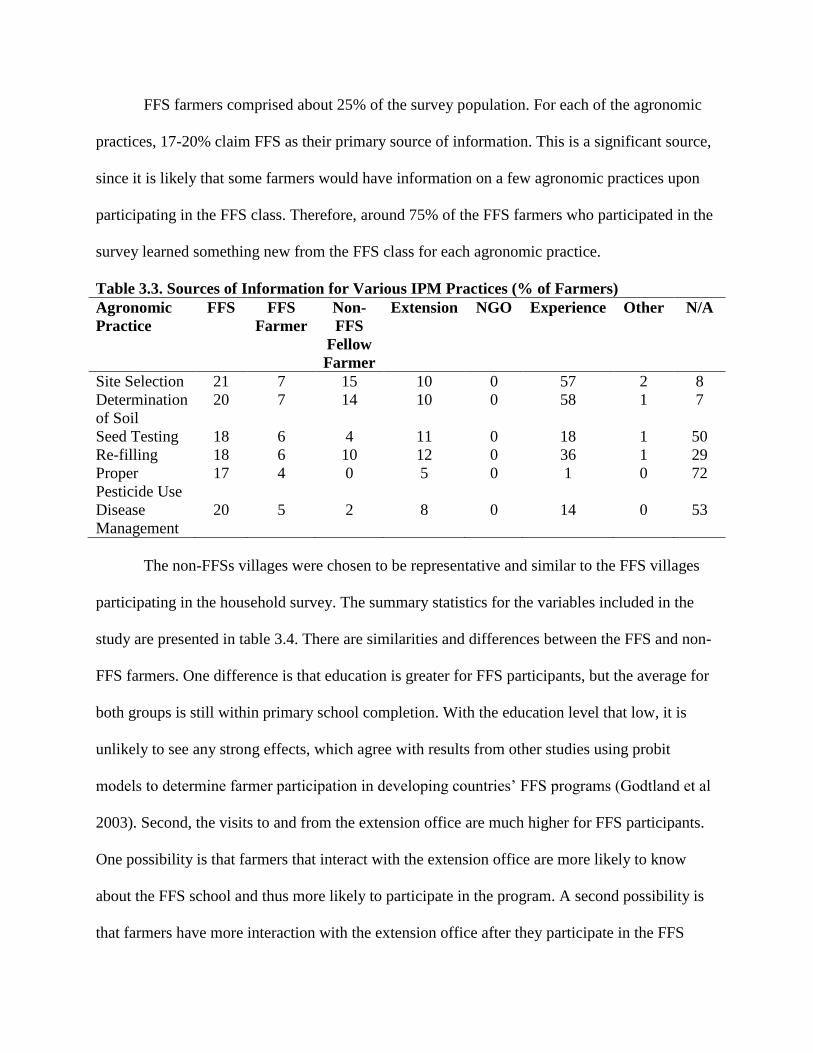
FFS farmers comprised about 25% of the survey population. For each of the agronomic
practices, 17-20% claim FFS as their primary source of information. This is a significant source,
since it is likely that some farmers would have information on a few agronomic practices upon
participating in the FFS class. Therefore, around 75% of the FFS farmers who participated in the
survey learned something new from the FFS class for each agronomic practice.
Table 3.3. Sources of Information for Various IPM Practices (% of Farmers)
Agronomic
Practice
FFS FFS
Farmer
Non-
FFS
Fellow
Farmer
Extension NGO Experience Other N/A
Site Selection 21 7 15 10 0 57 2 8
Determination
of Soil
20 7 14 10 0 58 1 7
Seed Testing 18 6 4 11 0 18 1 50
Re-filling 18 6 10 12 0 36 1 29
Proper
Pesticide Use
17 4 0 5 0 1 0 72
Disease
Management
20 5 2 8 0 14 0 53
The non-FFSs villages were chosen to be representative and similar to the FFS villages
participating in the household survey. The summary statistics for the variables included in the
study are presented in table 3.4. There are similarities and differences between the FFS and non-
FFS farmers. One difference is that education is greater for FFS participants, but the average for
both groups is still within primary school completion. With the education level that low, it is
unlikely to see any strong effects, which agree with results from other studies using probit
models to determine farmer participation in developing countries’ FFS programs (Godtland et al
2003). Second, the visits to and from the extension office are much higher for FFS participants.
One possibility is that farmers that interact with the extension office are more likely to know
about the FFS school and thus more likely to participate in the program. A second possibility is
that farmers have more interaction with the extension office after they participate in the FFS
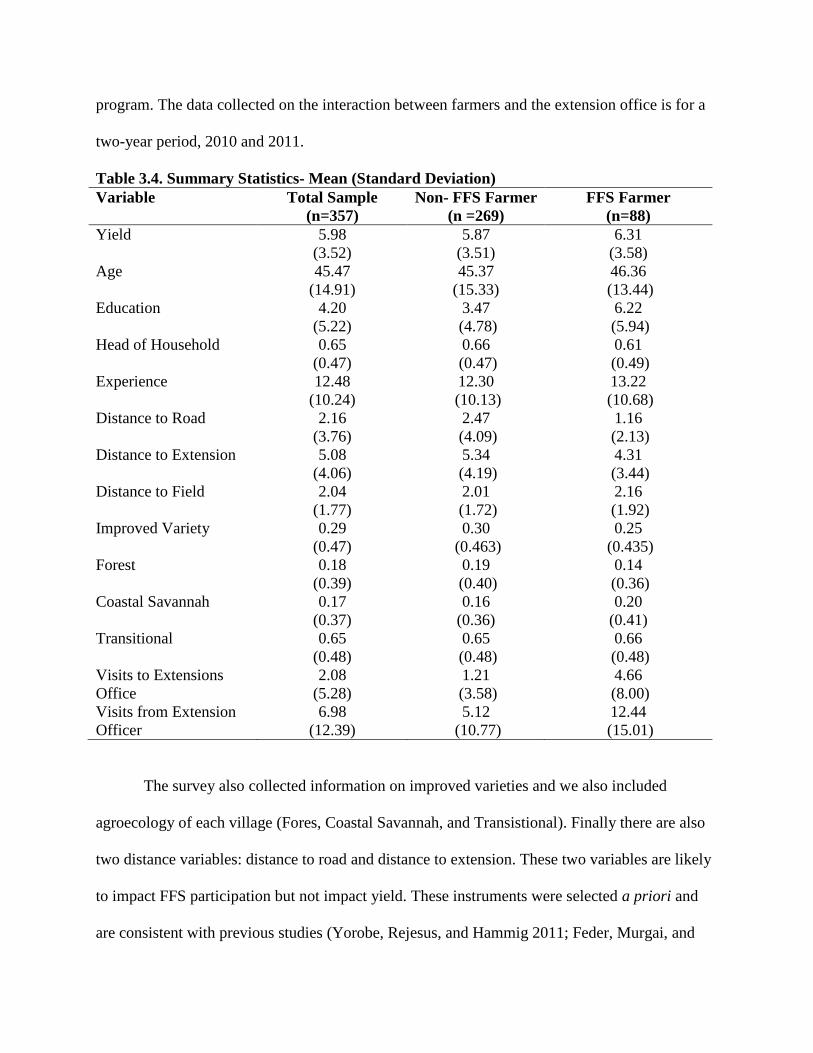
program. The data collected on the interaction between farmers and the extension office is for a
two-year period, 2010 and 2011.
Table 3.4. Summary Statistics- Mean (Standard Deviation)
Variable Total Sample
(n=357)
Non- FFS Farmer
(n =269)
FFS Farmer
(n=88)
Yield 5.98
(3.52)
5.87
(3.51)
6.31
(3.58)
Age 45.47
(14.91)
45.37
(15.33)
46.36
(13.44)
Education 4.20
(5.22)
3.47
(4.78)
6.22
(5.94)
Head of Household 0.65
(0.47)
0.66
(0.47)
0.61
(0.49)
Experience 12.48
(10.24)
12.30
(10.13)
13.22
(10.68)
Distance to Road 2.16
(3.76)
2.47
(4.09)
1.16
(2.13)
Distance to Extension 5.08
(4.06)
5.34
(4.19)
4.31
(3.44)
Distance to Field 2.04
(1.77)
2.01
(1.72)
2.16
(1.92)
Improved Variety 0.29
(0.47)
0.30
(0.463)
0.25
(0.435)
Forest 0.18
(0.39)
0.19
(0.40)
0.14
(0.36)
Coastal Savannah 0.17
(0.37)
0.16
(0.36)
0.20
(0.41)
Transitional 0.65
(0.48)
0.65
(0.48)
0.66
(0.48)
Visits to Extensions
Office
2.08
(5.28)
1.21
(3.58)
4.66
(8.00)
Visits from Extension
Officer
6.98
(12.39)
5.12
(10.77)
12.44
(15.01)
The survey also collected information on improved varieties and we also included
agroecology of each village (Fores, Coastal Savannah, and Transistional). Finally there are also
two distance variables: distance to road and distance to extension. These two variables are likely
to impact FFS participation but not impact yield. These instruments were selected a priori and
are consistent with previous studies (Yorobe, Rejesus, and Hammig 2011; Feder, Murgai, and
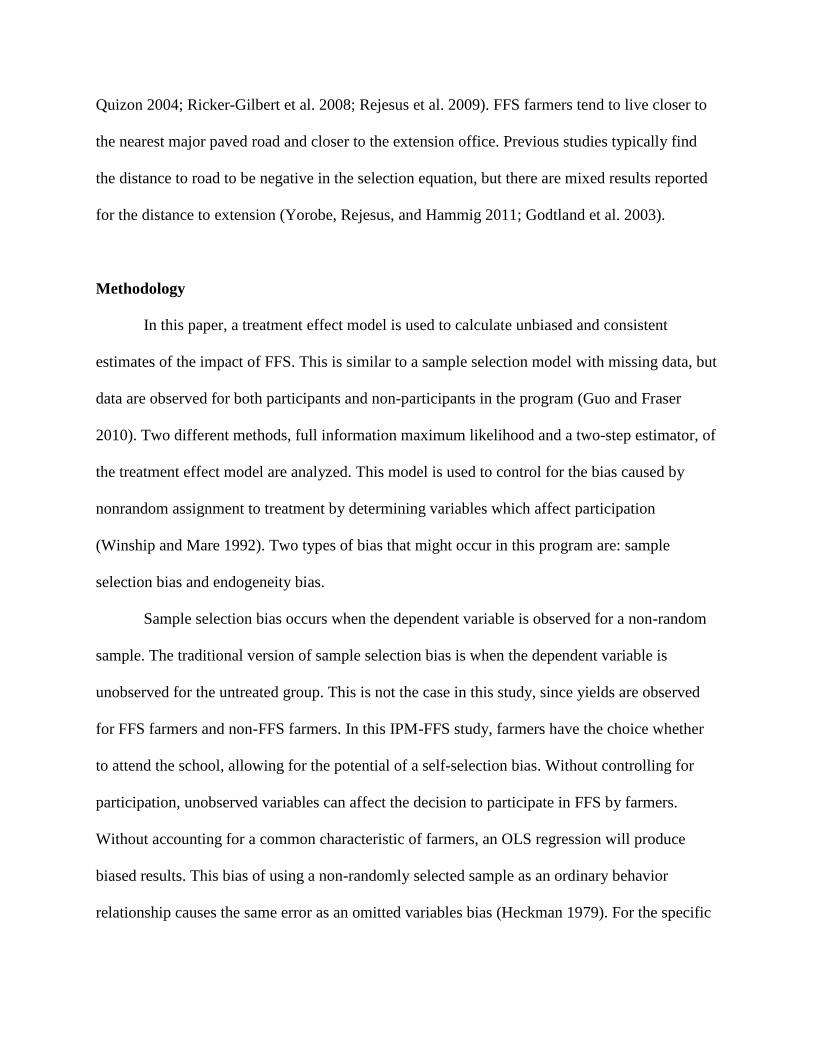
Quizon 2004; Ricker-Gilbert et al. 2008; Rejesus et al. 2009). FFS farmers tend to live closer to
the nearest major paved road and closer to the extension office. Previous studies typically find
the distance to road to be negative in the selection equation, but there are mixed results reported
for the distance to extension (Yorobe, Rejesus, and Hammig 2011; Godtland et al. 2003).
Methodology
In this paper, a treatment effect model is used to calculate unbiased and consistent
estimates of the impact of FFS. This is similar to a sample selection model with missing data, but
data are observed for both participants and non-participants in the program (Guo and Fraser
2010). Two different methods, full information maximum likelihood and a two-step estimator, of
the treatment effect model are analyzed. This model is used to control for the bias caused by
nonrandom assignment to treatment by determining variables which affect participation
(Winship and Mare 1992). Two types of bias that might occur in this program are: sample
selection bias and endogeneity bias.
Sample selection bias occurs when the dependent variable is observed for a non-random
sample. The traditional version of sample selection bias is when the dependent variable is
unobserved for the untreated group. This is not the case in this study, since yields are observed
for FFS farmers and non-FFS farmers. In this IPM-FFS study, farmers have the choice whether
to attend the school, allowing for the potential of a self-selection bias. Without controlling for
participation, unobserved variables can affect the decision to participate in FFS by farmers.
Without accounting for a common characteristic of farmers, an OLS regression will produce
biased results. This bias of using a non-randomly selected sample as an ordinary behavior
relationship causes the same error as an omitted variables bias (Heckman 1979). For the specific
focus of this paper, potential bias is of concern for two primary reasons: there are unmeasured
characteristics that influence farmer yields, and it is unlikely that every variable influencing
selection is controlled by the outcome equation.
The endogeneity problem arises when an independent variable in the model is a choice
variable, participation in this study, and is correlated with unobservables correlated with the error
term. Thus, the error term in the participation regression is correlated with the error term in the
outcome equation. This is possible from the non-randomized sample selection process of the FFS
program. The treatment effects model accounts for both types of bias, selection and endogeneity,
to provide consistent, un-biased results (Green 2003).
Treatment Effect Model
The treatment effect model mimics the Heckman sample selection model, except that the
participation variable is directly inserted into the outcome equation since both groups’
production is observed (Winship and Mare 1992). The two-part model accounts for the
correlation of the error terms of the participation and outcome equation with two stages of
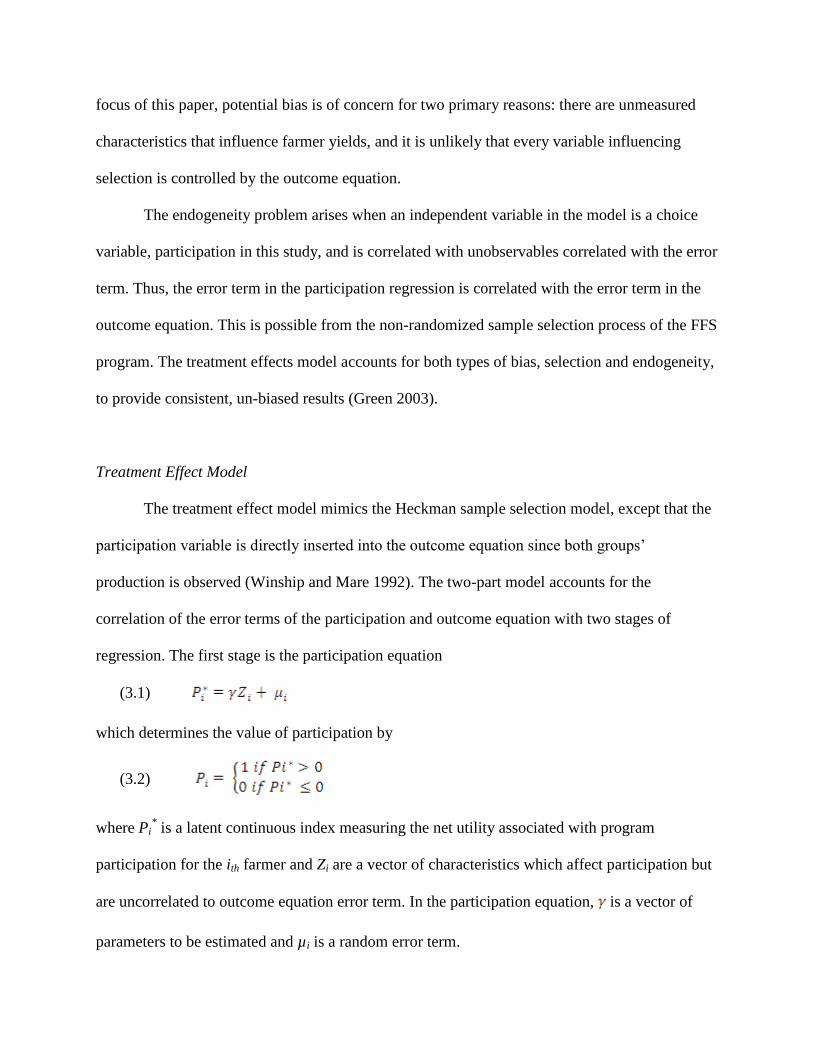
regression. The first stage is the participation equation
(3.1)
which determines the value of participation by
(3.2)
where Pi* is a latent continuous index measuring the net utility associated with program
participation for the ith farmer and Zi are a vector of characteristics which affect participation but
are uncorrelated to outcome equation error term. In the participation equation, is a vector of
parameters to be estimated and µi is a random error term.
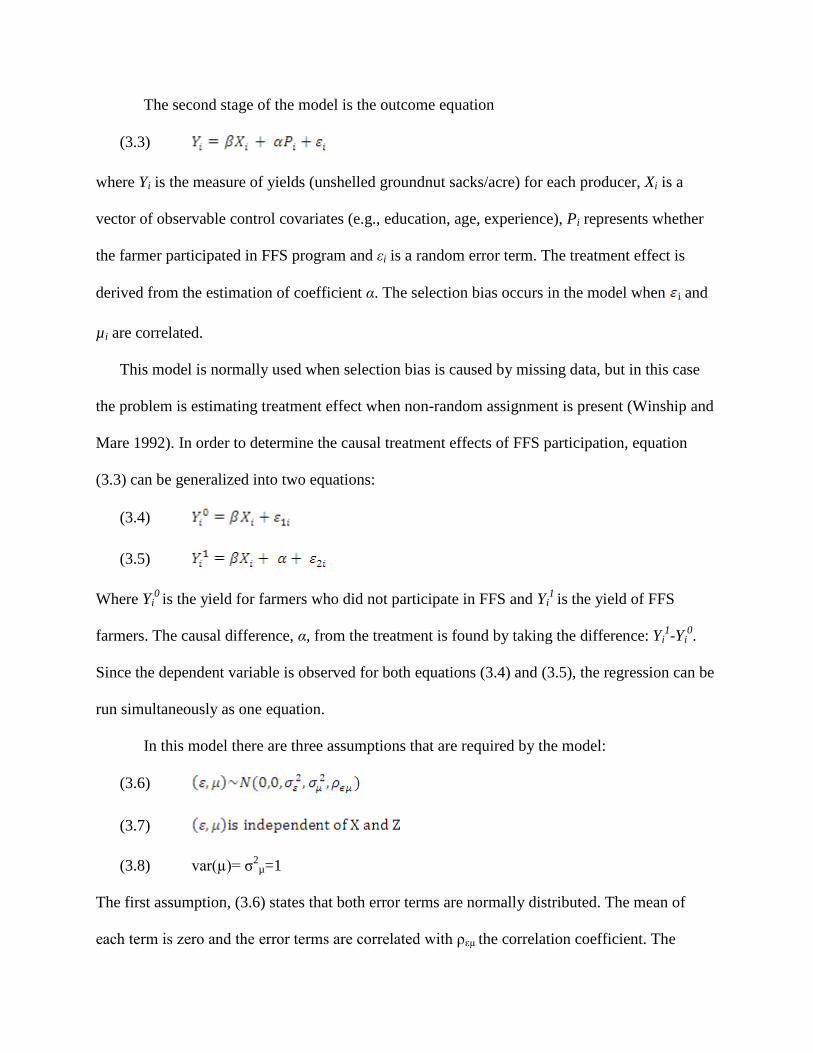
The second stage of the model is the outcome equation
(3.3)
where Yi is the measure of yields (unshelled groundnut sacks/acre) for each producer, Xi is a
vector of observable control covariates (e.g., education, age, experience), Pi represents whether
the farmer participated in FFS program and εi is a random error term. The treatment effect is
derived from the estimation of coefficient α. The selection bias occurs in the model when i and
µi are correlated.
This model is normally used when selection bias is caused by missing data, but in this case
the problem is estimating treatment effect when non-random assignment is present (Winship and
Mare 1992). In order to determine the causal treatment effects of FFS participation, equation
(3.3) can be generalized into two equations:
(3.4)
(3.5)
Where Yi0 is the yield for farmers who did not participate in FFS and Yi
1 is the yield of FFS
farmers. The causal difference, α, from the treatment is found by taking the difference: Yi1-Yi
0.
Since the dependent variable is observed for both equations (3.4) and (3.5), the regression can be
run simultaneously as one equation.
In this model there are three assumptions that are required by the model:
(3.6)
(3.7)
(3.8) var(µ)= σ2
µ=1
The first assumption, (3.6) states that both error terms are normally distributed. The mean of
each term is zero and the error terms are correlated with ρεµ the correlation coefficient. The
second assumption, (3.7), states the error terms are independent from the explanatory variables.
Finally, the third assumption, (3.8), is the standardization of the probit selection equation which
normalizes the variance for µ for the probit regression (Heckman 1979). When there is a non-
random selection as is the case for FFS participation and the error terms for the two equations are
correlated, the estimates for an OLS will be inconsistent.
Empirical Specification
The treatment effects model is essentially running two regressions simultaneously (Guo
and Fraser 2010). The first step to quantitatively measure the impact of FFS on groundnut
farmers is to estimate a probit model of FFS participation and obtain estimates of which can be
used to make consistent estimates of the inverse Mills ratio term. The inverse Mills ratio is the
probability density function over the cumulative distribution function of a distribution and serves
as the function that controls for selection bias (Heckman 1979, Green 2003). In this study, we
use several instruments in the first stage probit estimation: distance to the nearest paved road,
distance to extension office, age, head of household’s education, experience, head of household’s
status, visits from extension, and trips to extension. These variables are likely to affect
participation in the FFS program. The two distance variables and visits from an extension officer
are only included in the selection equation. They are not expected to have an impact on yields,
but all other selection variables are used in both equations. It helps identify the effect of outcome
by treatment by including variables only in the selection equation. These variables have been
used in other selection models assessing the impact of FFS programs as valid indicators of
participation (Yorobe, Rejesus, and Hammig 2011; Mauceri et al. 2007; Davis et al. 2010;
Godtland et al. 2003). The variables included in only the treatment equation act as instruments
and could be used in an instrumental variable approach. This study only uses the treatment
effects approach because it is less dependent on strong instruments while the IV approach is
improper to use with weak instruments.
After the first stage, the outcome equation in the second stage can be estimated by a
linear regression. The outcome equation includes the constructed value of the inverse Mills ratio
and the vector of observables from the first stage. The covariates chosen to represent farmer
characteristics are similar to those used in prior assessments (Feder, Murgai, and Quizon 2004;
Mauceri et al. 2007; Yorobe, Rejesus, and Hammig 2011). These are farmer characteristics that
might affect IPM technique adoption habits and impact yield which was displayed in table 3.2.
The second stage will provide a consistent estimate of α in which conclusions can be drawn
about the effectiveness of the FFS program. The standard errors are corrected in the outcome
equation in the selection model to correct the heteroskedasticity.
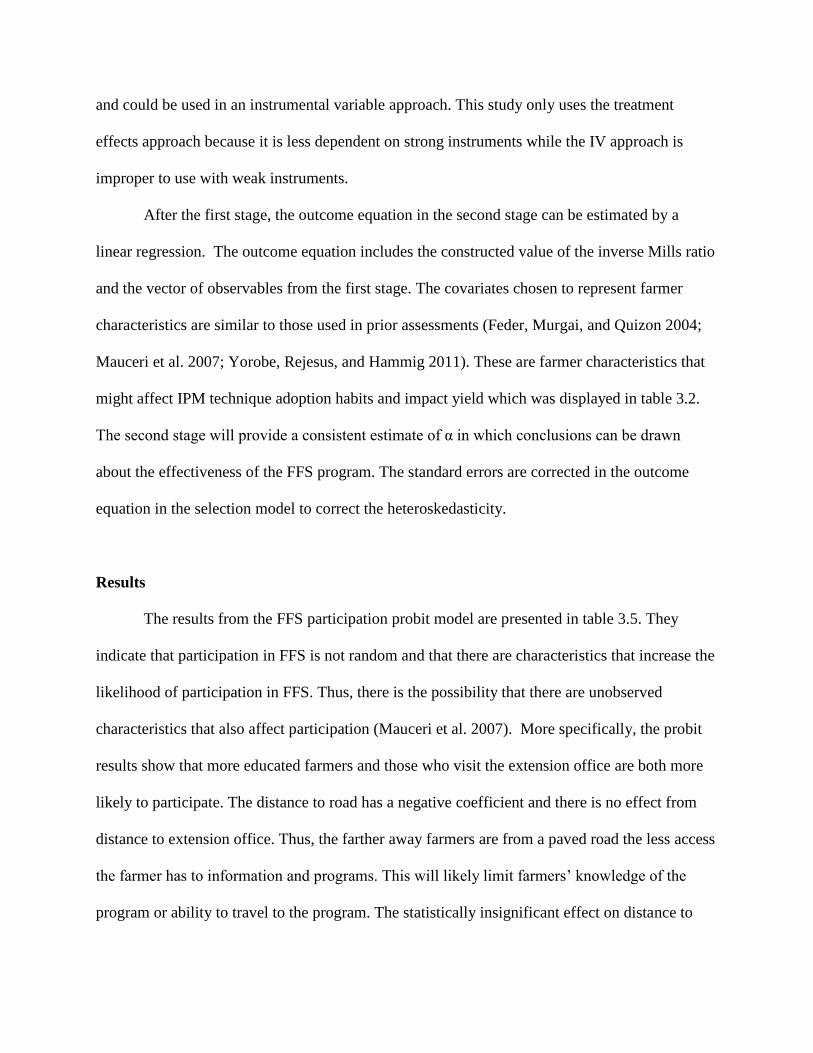
Results
The results from the FFS participation probit model are presented in table 3.5. They
indicate that participation in FFS is not random and that there are characteristics that increase the
likelihood of participation in FFS. Thus, there is the possibility that there are unobserved
characteristics that also affect participation (Mauceri et al. 2007). More specifically, the probit
results show that more educated farmers and those who visit the extension office are both more
likely to participate. The distance to road has a negative coefficient and there is no effect from
distance to extension office. Thus, the farther away farmers are from a paved road the less access
the farmer has to information and programs. This will likely limit farmers’ knowledge of the
program or ability to travel to the program. The statistically insignificant effect on distance to
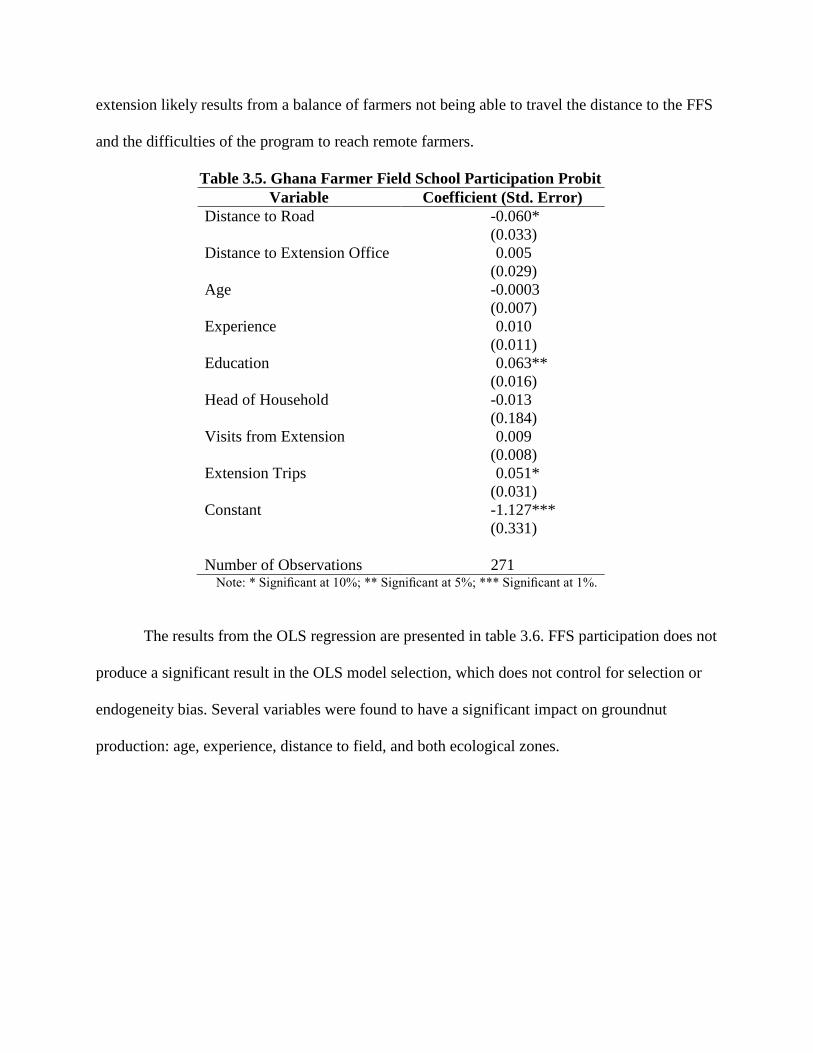
extension likely results from a balance of farmers not being able to travel the distance to the FFS
and the difficulties of the program to reach remote farmers.
Table 3.5. Ghana Farmer Field School Participation Probit
Variable Coefficient (Std. Error)
Distance to Road -0.060*
(0.033)
Distance to Extension Office 0.005
(0.029)
Age -0.0003
(0.007)
Experience 0.010
(0.011)
Education 0.063**
(0.016)
Head of Household -0.013
(0.184)
Visits from Extension 0.009
(0.008)
Extension Trips 0.051*
(0.031)
Constant -1.127***
(0.331)
Number of Observations 271 Note: * Significant at 10%; ** Significant at 5%; *** Significant at 1%.
The results from the OLS regression are presented in table 3.6. FFS participation does not
produce a significant result in the OLS model selection, which does not control for selection or
endogeneity bias. Several variables were found to have a significant impact on groundnut
production: age, experience, distance to field, and both ecological zones.
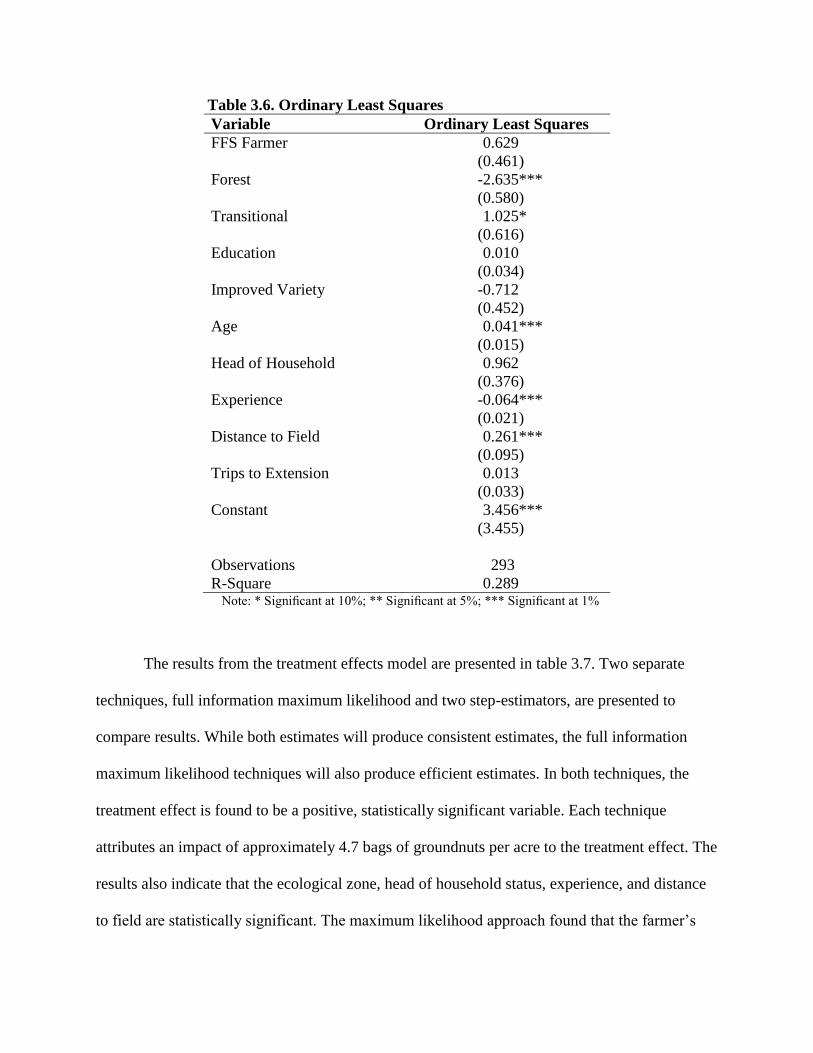
Table 3.6. Ordinary Least Squares
Variable Ordinary Least Squares
FFS Farmer 0.629
(0.461)
Forest -2.635***
(0.580)
Transitional 1.025*
(0.616)
Education 0.010
(0.034)
Improved Variety -0.712
(0.452)
Age 0.041***
(0.015)
Head of Household 0.962
(0.376)
Experience -0.064***
(0.021)
Distance to Field 0.261***
(0.095)
Trips to Extension 0.013
(0.033)
Constant 3.456***
(3.455)
Observations 293
R-Square 0.289 Note: * Significant at 10%; ** Significant at 5%; *** Significant at 1%
The results from the treatment effects model are presented in table 3.7. Two separate
techniques, full information maximum likelihood and two step-estimators, are presented to
compare results. While both estimates will produce consistent estimates, the full information
maximum likelihood techniques will also produce efficient estimates. In both techniques, the
treatment effect is found to be a positive, statistically significant variable. Each technique
attributes an impact of approximately 4.7 bags of groundnuts per acre to the treatment effect. The
results also indicate that the ecological zone, head of household status, experience, and distance
to field are statistically significant. The maximum likelihood approach found that the farmer’s
education, age, and trips to extension were also significant while the two step procedure did not
find them significant. Each approach produced a statistically significant chi-square test at the one
percent level, verifying the goodness of fit.
In the results, a few of the variables indicated a different direction than might be
expected. First, experience has a negative estimate. Experience is measured as the number of
years planting groundnuts, but does not account for experience with other crops. Therefore, a
farmer’s knowledge on agriculture might not be completely captured in their groundnut
experience. Second, the distance to field has a positive estimate. Meaning the farther away the
field is from the farmer’s house, the higher the groundnut production. This could be a result from
site selection. Finally, the trips to extension estimate are negative. A farmer is more likely to visit
an extension officer when the farmer is in need of help. Therefore, visiting the extension office
might be an indicator of problems already in existence which decrease production.
Finally, it is important to look at the rho coefficient for each treatment effect model. The
coefficient indicates the level of correlation between the error term in the participation equation
and outcome equation. This model is chosen based off the belief that the correlation between the
two error terms is nonzero. In each treatment effect model, the rho is statistically significant at
that the one percent level, the null hypothesis that the correlation is equal to zero is rejected,
strengthening the model assumption.
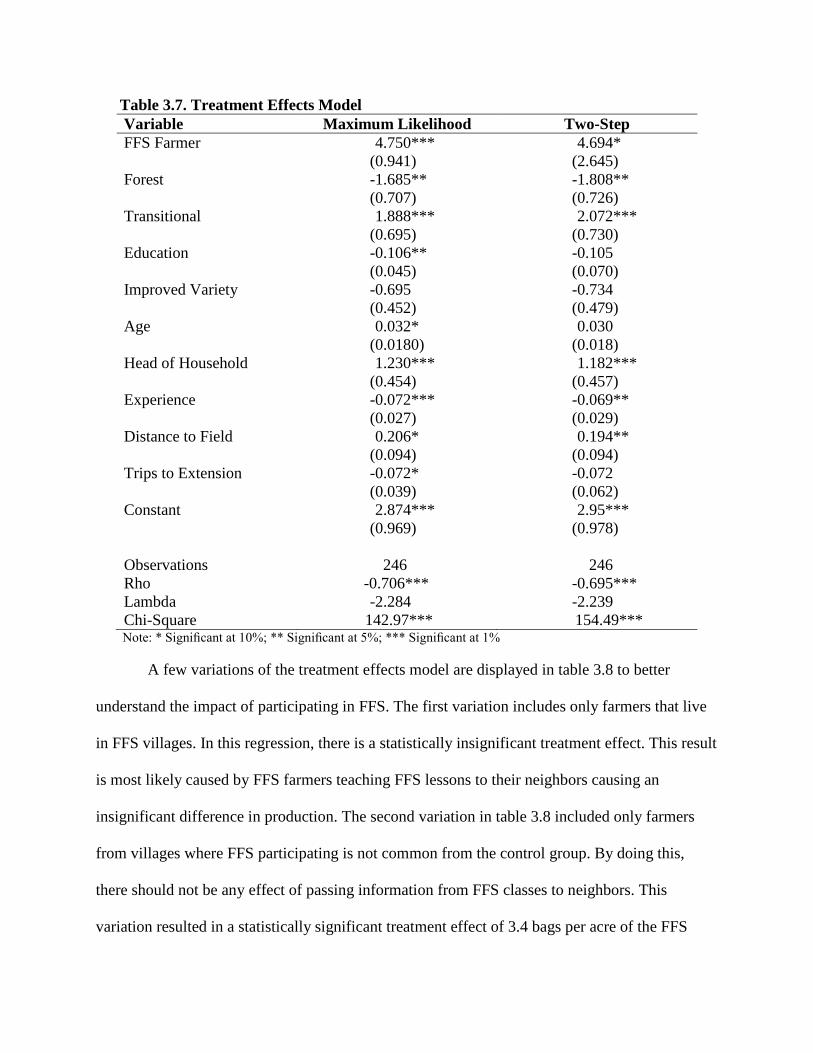
Table 3.7. Treatment Effects Model
Variable Maximum Likelihood Two-Step
FFS Farmer 4.750***
(0.941)
4.694*
(2.645)
Forest -1.685**
(0.707)
-1.808**
(0.726)
Transitional 1.888***
(0.695)
2.072***
(0.730)
Education -0.106**
(0.045)
-0.105
(0.070)
Improved Variety -0.695
(0.452)
-0.734
(0.479)
Age 0.032*
(0.0180)
0.030
(0.018)
Head of Household 1.230***
(0.454)
1.182***
(0.457)
Experience -0.072***
(0.027)
-0.069**
(0.029)
Distance to Field 0.206*
(0.094)
0.194**
(0.094)
Trips to Extension -0.072*
(0.039)
-0.072
(0.062)
Constant 2.874***
(0.969)
2.95***
(0.978)
Observations 246 246
Rho -0.706*** -0.695***
Lambda -2.284 -2.239
Chi-Square 142.97*** 154.49*** Note: * Significant at 10%; ** Significant at 5%; *** Significant at 1%
A few variations of the treatment effects model are displayed in table 3.8 to better
understand the impact of participating in FFS. The first variation includes only farmers that live
in FFS villages. In this regression, there is a statistically insignificant treatment effect. This result
is most likely caused by FFS farmers teaching FFS lessons to their neighbors causing an
insignificant difference in production. The second variation in table 3.8 included only farmers
from villages where FFS participating is not common from the control group. By doing this,
there should not be any effect of passing information from FFS classes to neighbors. This
variation resulted in a statistically significant treatment effect of 3.4 bags per acre of the FFS
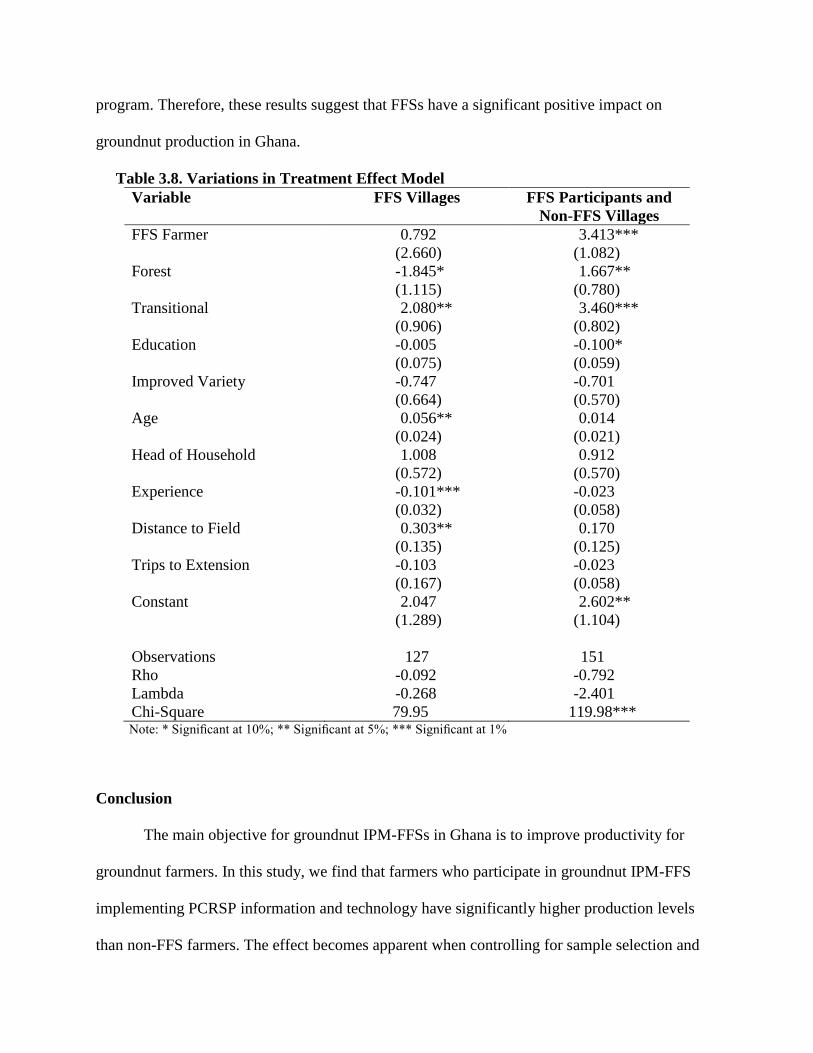
program. Therefore, these results suggest that FFSs have a significant positive impact on
groundnut production in Ghana.
Table 3.8. Variations in Treatment Effect Model
Variable FFS Villages FFS Participants and
Non-FFS Villages
FFS Farmer 0.792
(2.660)
3.413***
(1.082)
Forest -1.845*
(1.115)
1.667**
(0.780)
Transitional 2.080**
(0.906)
3.460***
(0.802)
Education -0.005
(0.075)
-0.100*
(0.059)
Improved Variety -0.747
(0.664)
-0.701
(0.570)
Age 0.056**
(0.024)
0.014
(0.021)
Head of Household 1.008
(0.572)
0.912
(0.570)
Experience -0.101***
(0.032)
-0.023
(0.058)
Distance to Field 0.303**
(0.135)
0.170
(0.125)
Trips to Extension -0.103
(0.167)
-0.023
(0.058)
Constant 2.047
(1.289)
2.602**
(1.104)
Observations 127 151
Rho -0.092 -0.792
Lambda -0.268 -2.401
Chi-Square 79.95 119.98*** Note: * Significant at 10%; ** Significant at 5%; *** Significant at 1%
Conclusion
The main objective for groundnut IPM-FFSs in Ghana is to improve productivity for
groundnut farmers. In this study, we find that farmers who participate in groundnut IPM-FFS
implementing PCRSP information and technology have significantly higher production levels
than non-FFS farmers. The effect becomes apparent when controlling for sample selection and
endogeneity biases. The robustness of the positive result is demonstrated through the agreement
in estimations using multiple approaches.
The results of this paper suggest that FFSs are an effective tool to spread information and
technologies that increase groundnut productivity in constrained geographic areas. The
information and lessons learned in FFS are having a direct effect on the program’s goals.
Agricultural development and international development institutions may consider using FFSs as
a component to spread information and technologies to remote areas of developing countries.
Along with the contributions of this study, there are areas for future work on quantifying
the impact of FFS. Several areas of future work include analysis on other outcome variables and
the effect on the region’s other crops. Research on the effect of groundnut IPM-FFS participants
on other crops will provide information on the decision making skills developed in the program.
Also, research on the long-term effects of FFS is an important topic for further research. As
technology development continues to advance, there is new information to be reported to
farmers. This can cause former FFS programs to become outdated which require the continuous
dissemination process of new information and technology.
REFERENCES
Altman, A. 1999. “Plant Biotechnology in the 21st Century: The Challenges Ahead.” Electronic
Journal of Biotechnology 2(2):51-55
Amin, P. W. and Mohammad, A. B.1980. “Groundnut Pest Research at ICRISAT.” Proceedings
of the International Workshop on Groundnuts, 13-17 October 1980, ICRISAT Center
Patancheru, India.
Attuahene-Amankwah, G., M.A. Hossain, and M.A. Asibi. 1990. “Peanut production and
improvement in Ghana.” Summary Proceedings of the First Reg. Peanut Mtg. for West
Africa. ICRISAT. Sahelian Center, Niamey, Niger, September, 13-16.
Badiane, O., and S. Kinteh. 1994. “Trade Pessimism and Regionalism in African Countries: The
Case of Groundnut Exporters.” IFPRI Series Number 97. USA: International Food Policy
Research Institute.
Braun, A., J. Jiggins, N. Roling, V. Den Berg, and P. Snijders. 2006. “A Global Survey and
Review of Farmer Field School Experiences.” Nairobi: International Livestock Research
Institute.
Dankyi A., R. Moxley, J. Jacka, W. Clifford, and M. Owusu-Akyaw. 2007. “Socioeconomic
Impact Assessment of Peanut CRSP Supported New Technology Related to Integrated
Crop Management Techniques in Ghana.” Final Report for USAID, Peanut CRSP
Program.
Davis, K., E. Nkonya, E. Kato, D.A. Mekonnen, M. Odendo, R. Miiro, J. Nkuba. 2010. “Impact
of Farmer Field Schools on Agricultural Productivity and Poverty in East Africa.”
Discussion Paper 00992, IFPRI.
Debrah, S.K. and F. Waliyar. 1996. “Groundnut Production and Utilization in Africa; Past
Trends; Projections and Opportunities for Increased Production.” Paper Delivered at the
5th
Regional Groundnut Workshop for West Africa. No. 18-21, 1996. Accra, Ghana.
FAOstat. 2012. Food and Agriculture Organization of the United Nations "FAOSTAT Statistics
Database.” Accessed January 2012.
Feder, G., R. Murgai, and J.B. Quizon "Sending Farmers Back to School: The Impact of Farmer
Field Schools in Indonesia." Review of Agricultural Economics. 26(1):45-62.
Fernandez-Cornejo J., 1996. “The Microeconomics Impact of IPM Adoption: Theory and
Application” Agricultural and Resource Economics Review. 25(2):149-161
Freeman, H.A., P.J.A. Merwe, P. Subrahmanyam, A.J. Chiyembekeza, and W. Kaguongo. 2002.
“Assessing Adoption Potential of New Groundnut Varieties in Malawi.” Experimental
Agriculture. 38:211-21.
Gapasin, D., J, Cherry, J. Gilbert, R. Gibbons, G. Hildebrand, D Nelson, H Valentine, H
Williamson. 2005.”The Peanut Collaborative Research Support Program. 2005 External
Evaluation Report.” Washington D.C.:United States Agency for International
Development
Gockowski J, C. Asamoah, S. David, I. Gyamfi, S. Agordorku and M. A. Kumi, 2010. “An
Evaluation of Farmer Field School Induced Changes in Ghanaian Cocoa Production.”
Journal of International Agricultural and Extension Education. 17(3):43-56.
Godtland, E.M., E. Sadoulet, A. de Janvry, R. Murgai, and O. Ortiz. 2004. "The Impact of
Farmer Field Schools on Knowledge and Productivity: A Study of Potato Farmers in the
Peruvian Andes." Economic Development & Cultural Change. 53(1):63-92.
Greene, W.H. 2003 Econometric analysis 6th
ed. Harlow; New York: Pearson Addison Wesley,
co 2003.
Guo, S. and M. W Fraser. 2010. Propensity Score Analysis: Statistical Methods and
Applications. Sage Publications, Inc
Heckman, J.J. 1979. "Sample Selection Bias a Specification Error." Econometrica 47(1):153-61
Khandker, S.R., G.B. Koolwal, and H.A. Samad. 2010. Handbook on Impact Evaluation:
Quantitative Methods and Practices. Washington, D.C.: World Bank.
Mauceri, M., J. Alwang, G. Norton, and V. Barrera. 2007. "Effectiveness of Integrated Pest
Management Dissemination Techniques: A Case Study of Potato Farmers in Carchi,
Ecuador." Journal of Agricultural and Applied Economics 39(3):765-80.
Morris M, Kelly V, Kopiciki R, Byerlee D. 2007. “Fertilizer Use in African Agriculture: Lessons
Learned and Good Practice Guidelines.” World Bank, Washington D.C.
Nkoola Institutional Development Associates (NIDA). “Groundnut Agronomic and Postharvest
Practices” Technologies and Practices for Small Agricultural Producers.
Olorunju, P.E., S.M. Misari, O.A. Ansa, C.W. Kuhn, and J.W. Demski. 1991. "Disease
Reactions and Yield Performance of Peanut Genotypes Grown Under Groundnut Rosette
and Rosette-Free Field Environments." Plant Disease 75:1269-73.
Praneetvatakul S and Waibel H. 2006. “Impact Assessment of Farmer Field Schools using A
Multi-Period Panel Data Model.” Paper Presented at International Association of
Agricultural Economist Conference, Gold Coast, Australia. Aug 12-18, 2006
Quizon, J, G. Feder and R. Murgai, 2001. “Fiscal Sustainability of Agricultural Extension: The
Case of the Farmer Field School Approach.” Journal on International Agricultural and
Extension Education 8:13-24
Rahman, A.M.A., 2003. “Farmer Field Schools (FFS) in the Sudan: Past, Present and Future.”
AgREN Newsletter 48:5
Rao, J.M. 1989. "Agricultural Supply Response: A Survey."Agricultural Economics: The
Journal of the International Association of Agricultural Economics 3(1):1-22.
Rejesus, R.M., F.G. Palis, A.V. Lapitan, T.T.N. Chi, and M. Hossain. 2009. "The Impact of
Integrated Pest Management Information Dissemination Methods on Insecticide Use and
Efficiency: Evidence from Rice Producers in South Vietnam." Review of Agricultural
Economics. 31(4):814-33.
Ricker-Gilbert, J., G.W. Norton, J. Alwang, M. Miah, G. Feder. “Cost-Effectiveness of
Alternative Integrated Pest Management Extension Methods: An Example of
Bangladesh.” Review of Agricultural Economics. 30(Summer 2008), 252-269
Rosenbaum P. R. and D.B. Rubin. “The Central Role of the Propensity Score in Observational
Studies for Causal Effects”. Biometrika. 70(1):41-55.
Sullivan, J. 1992. A 1989 Global Database for the Static World Policy Simulation (SWOPSIM)
Modeling Framework. Washington, DC: U.S. Dept. of Agriculture, Economic Research
Service, Agriculture and Trade Analysis Division.
Tripp, R., M. Wijeratne, and V. Hiroshini Piyadasa "What Should We Expect from Farmer Field
Schools? A Sri Lanka Case Study." World Development. 33(10):1705-20.
Van Duuren, B. 2003. “Report of a Consultancy on the Assessment of the Impact of the IPM
Programme at Field Level.” Phnom Penh: Report prepared for the DANIDA Integrated
Pest Management Farmer Training Project, 2003.
Van den Berg. IPM Farmer Field Schools: A Synthesis of 25 Impact Evaluations. The
Netherlands: Wageningen University, 2004.
Winship, C. and R.D Mare. “Models for Sample Selection Bias.” Annual Review of Sociology.
19:327-350
Yamazaki, S., and B.P. Resosudarmo "Does Sending Farmers Back to School Have an Impact?
Revisiting the Issue." Developing Economies 46 (2):135-50.
Yorobe Jr., J.M., R.M. Rejesus, M.D Hammig "Insecticide Use Impacts of Integrated Pest
Management (IPM) Farmer Field Schools: Evidence from Onion Farmers in the
Philippines." Agricultural Systems 104(7):580-7.


![Terminix integrated pest management [ipm] pest control indonesia](https://img.pdfslide.us/doc/110x75/556c5d50d8b42acc228b5069/terminix-integrated-pest-management-ipm-pest-control-indonesia.jpg)