Embed Size (px)
Citation preview

BHP Petroleum
The Effects of Increasing Demand on
the Dynamics of the Gas Business
Seapex Presentation
Singapore
February 1997
BHP Petroleum
GAS RESERVES (Asia & Australia)Strong demand for energy has focussed governments and world lending
institutions on optimal utilisation of energy resources, particularly gas.
Source: Wood MacKenzie, *modified, **uncommitted gas reserves
Country Remaining Gas Reserves P+P
(TCF)
1994 Production (mmcfd)
R/P Ratio
Australia 29.4 2632 30
Bangladesh 9 720* 35
Brunei 18.6 1097 50
China 32 1759 50
India 26.3 2000 35
Indonesia 43 6005 20
Malaysia 44.5 3720 30
Myanmar* 7.0 102 190
New Zealand 2.5 537 13
Pakistan 21 1627 35
Papua New Guinea 15 15.5 2660
Philippines 3 0
Thailand 8.1 1057 20
Vietnam 3.4 77 120
1994 TOTAL REMAINING GAS RESERVES
(Asia & Australasia)
Total Gas Reserves: 483.2 TCF
Others include New Zealand, Philippines and Vietnam
Asian Opportunities (undeveloped gas reserves)
LUZON
PALAWAN
MINDANAO
M A NILA
SUMATRABORNEO
SABAH
CELEBES
MOLUCCAS
PAPUA
SRI LANKA
PHILIPPINES
NEW GUINEA
JAPANN.
S.
SCALE0 300
KM
KOREA
KOREA
SAKHALIN
HOKKAIDO
HONSHU
KYUSHU
SHIKOKU
KURILISLANDS
HAINAN
TAIWAN
HONGKONG
Singapore
Segam at
Kuala
Lumpur
Su rat Thani
Bangkok
TAIPEI
OKINAWA
J A K A R TA
YANGON
ISLAMABAD
KARACHI
BEIJING
YAKUTSK
SHANGHAI
BOMBAY HIGH
BOMBAY
SURAT
JAGDISHPUR
NEW DELHIANOLA
Sea ofJapan
Yellow Sea
Pacific Ocean
SouthChina Sea
Banda Sea
Arafura Sea
AndamanSea
Bay ofBengal
ArabianSea
C.I.S.
MONGOLIA
PEOPLE'S REPUBLICOF CHINA
IRAN
AFGHANISTAN
PAKISTAN
INDIA
NEPALBHUTAN
BANGLADESHMYANMAR
LAOS
THAILAND
CAMBODIA
VIETNAM
BRUNEI
MALAYSIA
INDONESIA
IRIAN JAYA
AUSTRALIA
NEW ZEALAND
Bangladesh
9.0 TCF
Myanmar
7.0 TCF
Thailand
8.1 TCF
PNG
15 TCF
E Malaysia
21 TCF*
W Malaysia
8 TCF*
Philippines
3.0 TCF
Brunei
18.6 TCF
Vietnam
3.4 TCF
Natuna Sea
Indonesia
2 TCF (W)
25 TCF (E)
Kutei
Indonesia
2 TCF**
NW Australia
TCF
China
32.0 TCF
India
26.0 TCF
Pakistan
21.0 TCF
17.3%11.0%
17.1%
12.2%
8.0% 9.9%
7.2%
5.7%
3.0%
3.4%2.7%
3.4%
Indonesia
Australia
Malaysia
China
Pakistan
India
Brunei
Papua New Guinea
Thailand
Bangladesh
Myanmar
Others

BHP Petroleum
GAS PRICINGStrong demand, and high value and prices for gas in power generation,
means that regional pricing depends primarily on proximity to power
demand markets.
LUZON
PALAWAN
MINDANAO
MANILA
BORNEO
SABAH
CELEBES
MOLUCCAS
SCALE0 300
KM
HOKKAIDO
HONSHU
KYUSHU
SHIKOKU
KURILISLANDS
Singapore
Segam at
Ku ala
Lumpur
Surat Thani
Bangkok
TAIPEI
OKINAWA
JAKARTA
YANGON
ISLAMABAD
KARACHI
BEIJING
YAKUTSK
SHANGHAI
BOMBAYHIGH
BOMBAY
SURAT
JAGDISHPUR
NEWDELHIANOLA
Sea ofJapan
Yellow Sea
Pacific Ocean
SouthChina Sea
Banda Sea
Arafura Sea
AndamanSea
Bay ofBengal
ArabianSea
C.I.S.
MONGOLIA
PEOPLE'S REPUBLICOF CHINA
IRAN
AFGHANISTAN
PAKISTAN
INDIA
NEPALBHUTAN
BANGLADESHMYANMAR
LAOS
THAILAND
CAMBODIA
VIETNAM
BRUNEI
MALAYSIA
INDONESIA
IRIAN JAYA
AUSTRALIA
NEW ZEALAND
Undeveloped resources without markets
Gas demand centres
Indicative market price *
(US$/GJ)
$3.80
$3.80
$3.80
$3.00
$3.00
$1.30
$1.50
SUMATRA
PAPUA
SRILANKA
PHILIPPINES
NEWGUINEA
JAPANN.
S.
KOREA
KOREA
SAKHALIN
HAINAN
TAIWAN
HONGKONG
$3.00
$2.50
$2.20
$3.80
$1.50$2.50
* for end user
$1.50
$3.10
$2.60
$2.00
$0.50* For the Middle East:
Strong rates of economic growth
Developing countries on the threshold of industrialisation
Fast rising demand for electrical power (i.e. widening
capacity shortfalls)
Environmental constraints
Gas fired power generation capacity expansion
(i.e. GTCC technology)
short construction lead time
higher generation efficiency
lower emissions (i.e. as against coal)
Co-generation
Strong demand for gas into power generation
Relatively high gas price ~ US$2.00/Mcf upwards cf urea
feedstock
High intrinsic value as a result of competing fuel prices

BHP Petroleum
INDONESIAGas in Indonesia has been primarily developed for the export market to East
Asia. The large gas resource base will continue to permit an export focus.
INDONESIA GAS MARKET(Supply/Demand Balance)
TIMOR
BUTON
Alor
Tali AbuJambi
Bandung
Bandar Lampung
JAKARTA
Lhok Seumawe
Medan
Padang
Bengkulu
Palembang
Pontianak
Banjarmasin
Semarang
Yogyakarta
Banda Aceh
Manado
Palu
Kendari
Denpasar
Kupang
Mataram
BRUNEI PHILIPPINES
MALAYSIASINGAPORE
MALAYSIA
THAILAND
Flores
Sumba
Bangka
SOUTH CHINA SEA
INDIAN
OCEAN
CELEBES
SEA
JAVA SEA
FLORES SEA
Simeulue
Nias
Siberut
Togian
Ujungpandang
Sumbawa
Belitung
JAVA
KALIMANTAN
Palangkaraya
SULAWESI
Samarinda
0 km 600
Bali
SUMATRA
Natuna
Lombok
KangeanMaduraSurabaya
120100
5
0
5
120°100°
C. Sumatra0.5 Bt provenBrown coal
S. Sumatra1.8 Bt provenBrown coal
Arunsoon to decline
6 TCF
1 TCF
2 TCF 25 TCF
1.1 TCF0.4 TCF
Natuna potential LNGHigh CO2
1.8 TCF
1 TCF
0.5 TCF0.3 TCF
1.5 TCF
0.5 TCF
2 Bt Black coal
10 TCF
E. Kalimantan6 trains plus 22 TCF uncommitted
Indonesia has significant gas reserves located primarily in remote areas.
Largest reserves are located in North Sumatra and East Kalimantan with gas used mostly for LNG plants.
Natuna will be developed initially as an LNG project.
Currently over half the gas produced in Indonesia is liquefied into LNG, and further investments in gas export infrastructure at
East Kalimantan and Natuna are planned.
Java's industrialisation and energy demand growth is generating strong domestic gas demand
Demand projection as per Pertamina forecast
Supply projecction as per Wood MacKenzie
East Kalimantan North Sumatra South Sumatra Java Other Fields
0
2000
4000
6000
8000
93 94 95 96 97 98 99 2000 2001 2002 2003 2004
YEAR
Ga
s R
eq
uir
em
en
ts (
mm
cfd
)
LNG Capacity Feedstock Power Generation City Gas & CNG Industry
BHP Petroleum
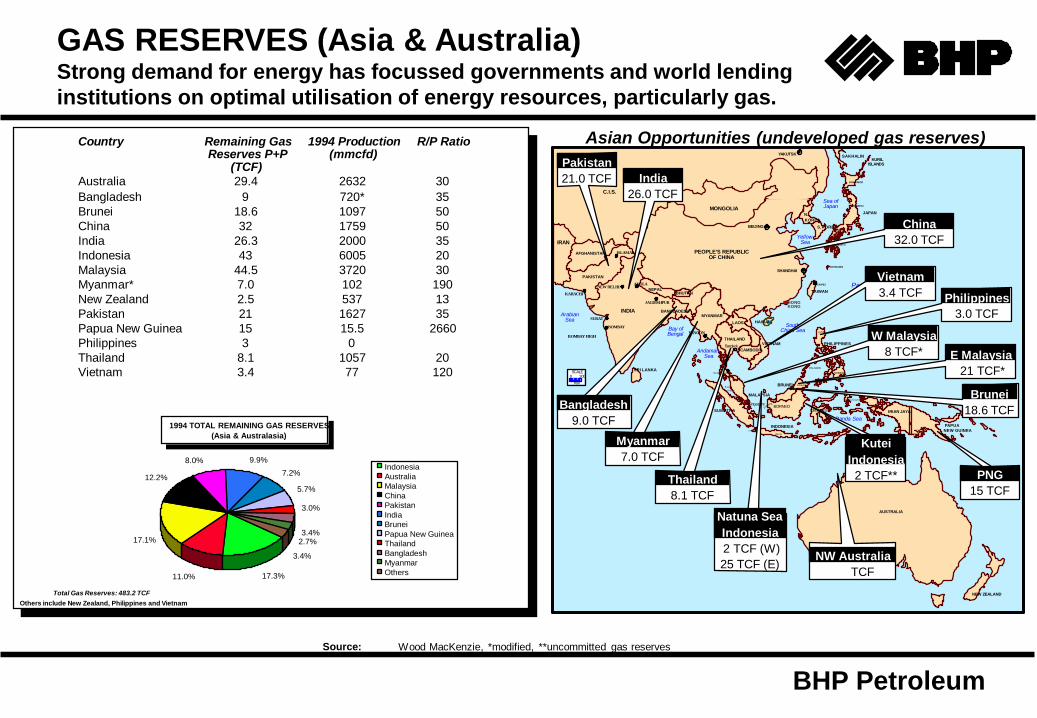
INDONESIAGas pricing for the fertiliser industry in Indonesia is dictated by ministerial
decree. The low pricing is a result of providing cheap fertiliser products to
the rural constituencies. Gas prices have risen rapidly, in response to intense demand
GAS PRICING East Kalimantan
Fertiliser plant 1.00
Gas Pricing into LNG plants
Generally based on an index to the Indonesia Crude Price
Average net price (1994): US$2.06/Mcf
East Java US$/MCF (Delivered to the user)
Power generation (PLN Gresik) 2.53-3.00 (ARCO-Kodeco)
State gas company 2.16
Fertiliser plant 2.00
West Java
Power generation (?) 3.00
Power generation (PLN Maura Karang) 2.45 (ARCO)
*Cement (Indocement & Semen Cibinong) 3.00
*Cement (Tri Manunggal Pesaka Cement) 2.70
Steel Industry 3.00
Steel Industry (as fuel) 2.00
State gas company (Jakarta & Bogor) 1.50
State gas company (Cirebon) 1.25
Fertiliser industry 1.00
South Sumatra
Power generation (minor volume) 3.00
Fertiliser industry (large volume) 1.00
North Sumatra
Power generation (minor volume) 3.00
Fertiliser plant (Aceh) 1.00
Paper Mill 1.50
Gas prices for urea (as dictated by Ministerial decree)
1991 Ministerial decree
East Kalimantan fertiliser co 1.00
North Sumatra PIM & AAF 1.00
South Sumatra 4 units 1.00
West Java Kujang 1.00
Post-1991 Ministerial decrees (ie new or modified plants)South Sumatra remodelled unit 1.50
Gresik 2.00
Trend to higher price

BHP Petroleum
THAILANDThailand's gas supply is heavily committed to power generation expansion
plans. Domestic ammonia/urea production is not likely to occur.
Gas reserves are mainly concentrated offshore in the Gulf of Thailand (i.e. 7 TCF)
Expanding infrastructure
capacity debottlenecking.
links with Myanmar and Malaysia
PTT has a contract for 525 mmcfd of gas from the Yadana offshore gasfield starting from 1998
The power generation sector will continue to dominate gas demand (i.e. EGAT plans to double gas-fired capacity over the next 10 years).
Industrialisation in the country is driving a high growth rate in electricity consumption.Gas use in the residential and industrial sectors will grow as the pipeline network is expanded (i.e. Bangkok ring).Local gas supply is constrained.Pipeline imports from Myanmar and Malaysia represents the best option for incremental gas supply.Potential LNG buyer.
ANDAMAN SEA
MYANMAR
THAILAND
LAOS
CAMBODIA
VIETNAM
MALAYSIA
INDONESIA
BASIR GUDANG
SEGAMAT
KUALA
LUMPUR
BANGKOK
Khonkaen
Rayong
SONG KHLA
PRAI
ARUN
KhanchanaburiYadana
ERAWAN
COMPLEX
BONGKOT
BEKOK
DUYONG
SOTONG
NAMPHONG
JOINT DEVELOPMENT AREA
KERTEH
(THAILAND-MALAYSIA)
Kang Koi
Ta Luang
Yetagun
Bang Pa -in
Ratchburi Bangpakong
Platong
Khanom
Krabi
Natural gas field
Natural gas demand location
Existing pipeline
Future pipeline
LNG
LNG (possibility)
THAILAND NATURAL GAS MARKET(Supply/Demand Balance)
* Assumes all IPP generating capacity to be gas fired (ie LNG) IPP to build a total at 10600 MW by 2006
Demand projections as per PTT forecast and EGAT generation energy plan
Supply projections as per Wood MacKenzie
1st Contract (Unocal) 2nd Contract (Unocal) 3rd Contract (Unocal) Pailin (Unocal)
Sikirit (Shell) Nam Phong (Esso) Bongkot (Total) Yadana (Total)
Yetagun (Texaco) JDA
0
1000
2000
3000
4000
90 91 92 93 94 95 96 97 98 99 2000 2001 2002 2003 2004 2005
YEAR
Ga
s R
eq
uir
em
en
ts (
mm
cfd
)
Feedstock Industry Bangkok Ring EGAT (Energy Plan) IPP
BHP Petroleum
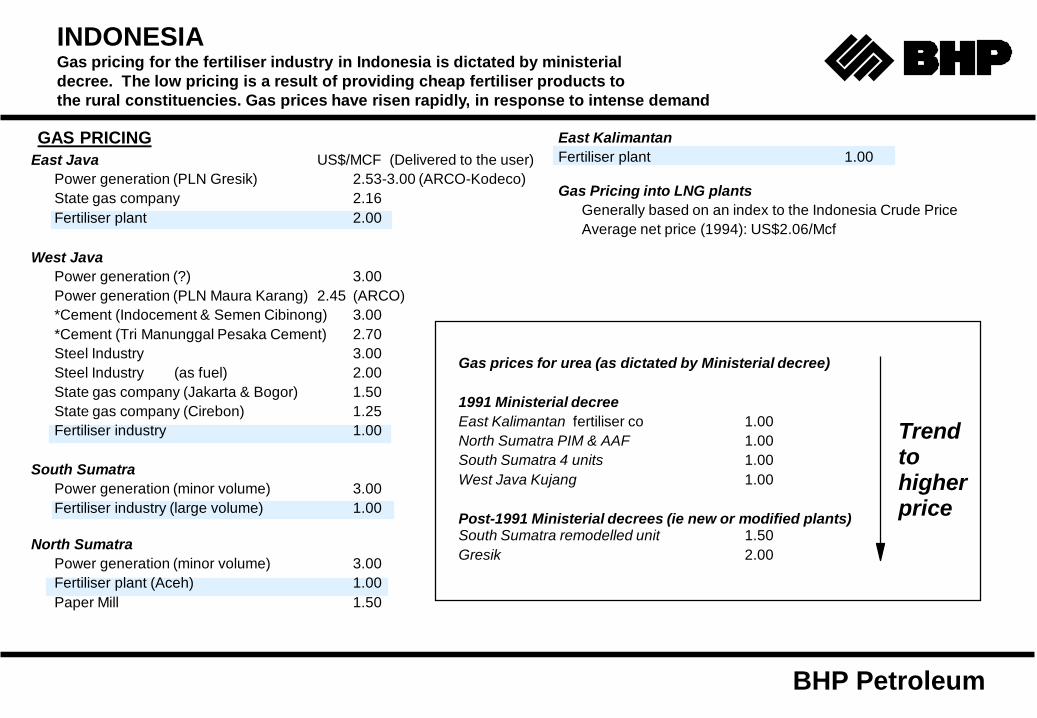
THAILANDThailand is willing to pay fairly high prices for gas supply. Current gas
prices are too expensive for viable domestic ammonia/urea production.
Retail Market Segment PTT Price US$/MMBTU
EGAT (Power Generation) $2.80
NPC (Petrochemical) $3.10
Cement $3.25
Industry $4.95
Gulf of Thailand production is relatively expensive due to the geology being complex and highly faulted. Gas is found in small fractured pockets necessitating the drilling of many deviated wells to develop sizeable production rates.Gas prices have contractually been linked to the thermal equivalent price of high sulphur fuel oil (HSFO)
* delivered gas price to the Thai border
Sources: Wood MacKenzie, Thailand (1994)PTIT Focus Special Annual Issue 1993Reuters
WELLHEAD GAS PRICES US$/MMBTU (1994)
Sirikit Nam
Phong
1st Contract (Unocal)
Yetagun 2nd Contract (Unocal)
Bongkot 3rd Contract (Unocal)
Yadana
$1.18
$1.50$1.65 $1.70
$1.76$1.91
$2.03
$2.52*
BHP Petroleum
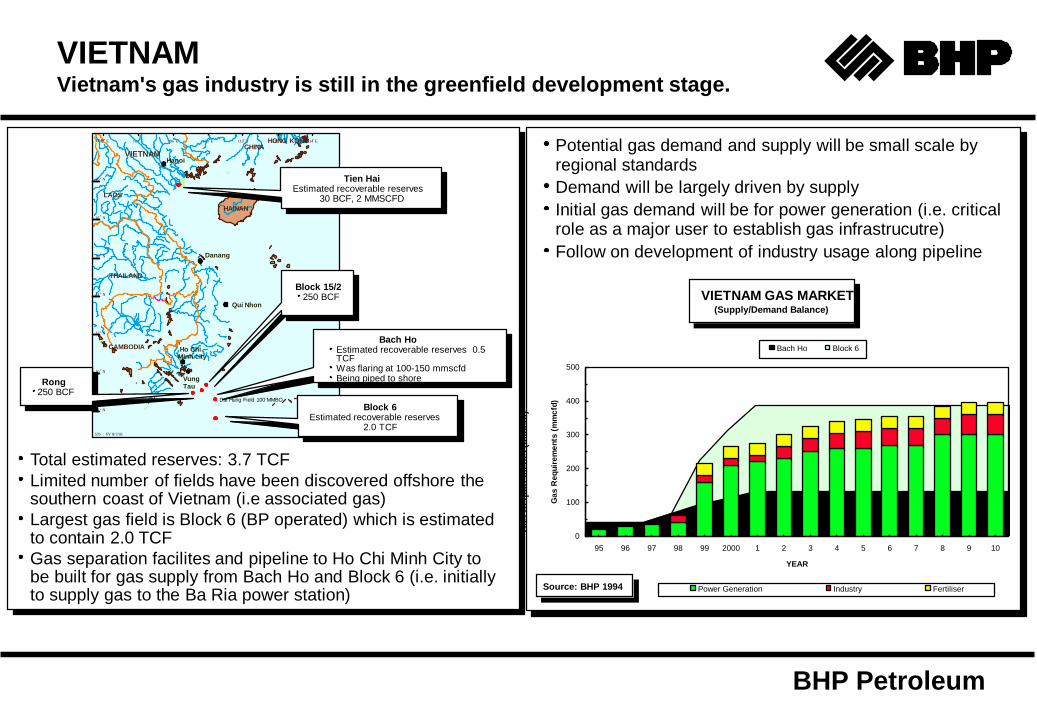
VIETNAMVietnam's gas industry is still in the greenfield development stage.
VIETNAM GAS MARKET(Supply/Demand Balance)
Source: BHP 1994
Gas R
eq
uir
em
en
ts (
mm
cfd
)
Total estimated reserves: 3.7 TCF
Limited number of fields have been discovered offshore the southern coast of Vietnam (i.e associated gas)
Largest gas field is Block 6 (BP operated) which is estimated to contain 2.0 TCF
Gas separation facilites and pipeline to Ho Chi Minh City to be built for gas supply from Bach Ho and Block 6 (i.e. initially to supply gas to the Ba Ria power station)
Potential gas demand and supply will be small scale by regional standards
Demand will be largely driven by supply
Initial gas demand will be for power generation (i.e. critical role as a major user to establish gas infrastrucutre)
Follow on development of industry usage along pipeline
57b VV 8/7/93
102 E 104 E 106 E 108 E 110 E 112 E 114 Eo o o o o o o
LAOS
THAILAND
CAMBODIA
CHINA
HAINAN
VIETNAMHanoi
Danang
Qui Nhon
Ho ChiMinh city
8 N
10 N
12 N
14 N
16 N
18 N
20 N
o
o
o
o
o
o
o
o22 N HONG KONG
VungTau
Dai Hung Field 100 MMBO
Tien Hai Estimated recoverable reserves
30 BCF, 2 MMSCFD
Bach Ho Estimated recoverable reserves 0.5 TCFWas flaring at 100-150 mmscfdBeing piped to shore
Block 6Estimated recoverable reserves
2.0 TCF
Block 15/2250 BCF
Rong250 BCF
Bach Ho Block 6
0
100
200
300
400
500
95 96 97 98 99 2000 1 2 3 4 5 6 7 8 9 10
YEAR
Ga
s R
eq
uir
em
en
ts (
mm
cfd
)
Power Generation Industry Fertiliser
BHP Petroleum
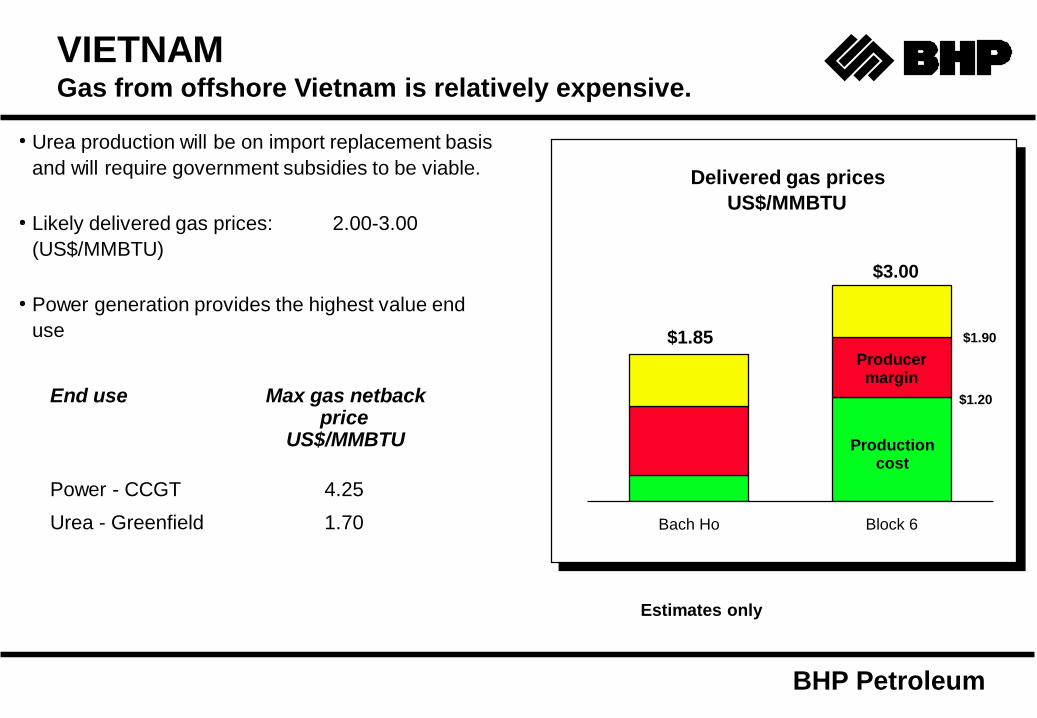
VIETNAMGas from offshore Vietnam is relatively expensive.
Urea production will be on import replacement basis
and will require government subsidies to be viable.
Likely delivered gas prices: 2.00-3.00
(US$/MMBTU)
Power generation provides the highest value end
use
End use Max gas netback price
US$/MMBTU
Power - CCGT 4.25
Urea - Greenfield 1.70
Delivered gas prices
US$/MMBTU
Estimates only
Bach Ho Block 6
$1.85
$3.00
$1.90
$1.20
Producer margin
Production cost

BHP Petroleum
MYAMNARA large proportion of the newly discovered offshore gas has
been allocated for export to Thailand.
Total reserves: 7 TCF.
Gas reserve distribution: 98% offshore 2% onshore.
Declining onshore gas production due to depleting reserves and loss of reservoir pressures.
National oil company lacks the expertise and funds to develop the gas reserves.
Gas potential lies offshore in the Gulf of Martaban where two discoveries (Yadana and Yetagun) have been made. Total reserves 6.9 TCF.
The option of exporting gas to Thailand has been taken in order to earn vital foreign exchange.Alteration of domestic supply constraint dependent upon further exploration success.Only incremental production from the offshore gas fields will be available for domestic use.Power generation to dominate gas demand.Proposed ammonia urea plant in Yangon is dependent upon increasing domestic gas supply.
BANGLADESH
THAILAND
BAY
OF
BENGAL
LAOS
GULF
OF
THAILAND
094 00 00E 098 00 00E
12 00 00N
16 00 00N
20 00 00N
24 00 00N
28 00 00N
090 00 00E 102 00 00E
CHINA
AndamanIsland
Dhaka
Yangon
Bangkok
Yadana
0 200km
Mandalay
INDIA
M Y A N M A R
Yetagun
Ayadaw
ChaukChaukChauk
Pyalo
Prome
Apyauk
Payogon
PIPELINES
Existing
Planned
MYANMAR NATURAL GAS MARKET
(Supply/Demand Balance)
Demand profile based on gas users maximum production capacities:
I. Power generation: As per MEPE power development plan with capacity operated @80% cf
II. Methanol capacity: 450 tonnes/dayIII. Urea capacity: (Existing) 1470 tonnes/day
(New additional Yr 2000) 1750 tonnes/dayIV. Cement capacity: 3000 tonnes/dayV. Allowance for paper mill and general industrial use
Onshore (MOGE) Yadana
0
100
200
300
400
1995 1996 1997 1998 1999 2000 2001 2002 2003 2004 2005
YEAR
Ga
s R
eq
uir
em
en
ts (
mm
cfd
)
Power Gen Urea Cement Methanol Industrial Paper Mill
Supply shortfall

BHP Petroleum
SummaryIn summary, intense pressure on gas demand in Asia is fuelling substantial
gas price increases and restricting use in low value end uses.
Sources: The outlook for Urea, December 1993 (Fertecon)BHPP Analysis
Iran
315,000 T/a capacity
On-line 1995
Iran
570,000 T/a capacity
On-line 2000
Iraq
570,000 T/a capacity
On-line 2000
Saudi Arabia
570,000 T/a capacity
On-line 2000
Bahrain
570,000 T/a capacity
On-line 1997
Qatar
660,000 T/a capacity
On-line 1997
Bangladesh
560,000 T/a capacity
On-line 1995
Bangladesh
330,000 T/a capacity
On-line 1997
Myanmar
570,000 T/a capacity
On-line 2000
Malaysia
495,000 T/a capacity
On-line 1997
Indonesia
462,000 T/a capacity
On-line 1994
Indonesia
572,000 T/a capacity
On-line 1997* Note: Plant capacities are for total urea output at tonnes/annum
* Urea gas feedstock
prices (likely); US$/GJ
$1.50-$2.00
$1.50 plus$1.80
$0.30-$0.80
$0.50-$0.80
$1.10 - $1.50
Location of proposed urea projects and likely gas feedstock prices
$1.50

BHP Petroleum
Asia dominates world urea demand and is responsible for approximately
50% of total world production. Significant regional supply shortfall is
made up from imports from the Middle East and the former Soviet Union.
Regional Surplus/Deficit(1992)
ASIA & OCEANIA UREA MARKET(Supply/Demand Balance)
Total demand growth (post 93): 4.5% pa.
Demand growth is driven by increasing fertiliser usage rates due to agricultural expansion in developing countries with large populations.
A demand shortfall of at least 8 million tonnes per annum is expected to exist in the region throughout the decade.
China and India dominate demand in the region and represent the largest import market segments in the region.
Local urea production in the region is constrained by the availability of low cost indigenous gas supply.
Urea is the most widely used and tested nitrogen fertiliser, particularly in the developing countries.
Imports are mainly from the former Soviet Union & Middle East
China Production India Production SE Asia Production
West Asia Production East Asia Production Oceania Production
Imports
0
10,000,000
20,000,000
30,000,000
40,000,000
50,000,000
60,000,000
70,000,000
88 89 90 91 92 93 94 95 96 97 98
YEAR
Ure
a V
olu
me
(T
on
ne
s)
Mil
lio
ns
China Demand India Demand SE Asia Demand
West Asia Demand East Asia Demand Oceania Demand
-8.0E+6 -6.0E+6 -4.0E+6 -2.0E+6 000.0E+0 2.0E+6
Indonesia
Malaysia
Bangladesh
New
Zealand
North Korea
Pakistan
Taiwan
Myanmar
Japan
South Korea
Australia
Thailand
Vietnam
Philippines
India
China
BHP Petroleum
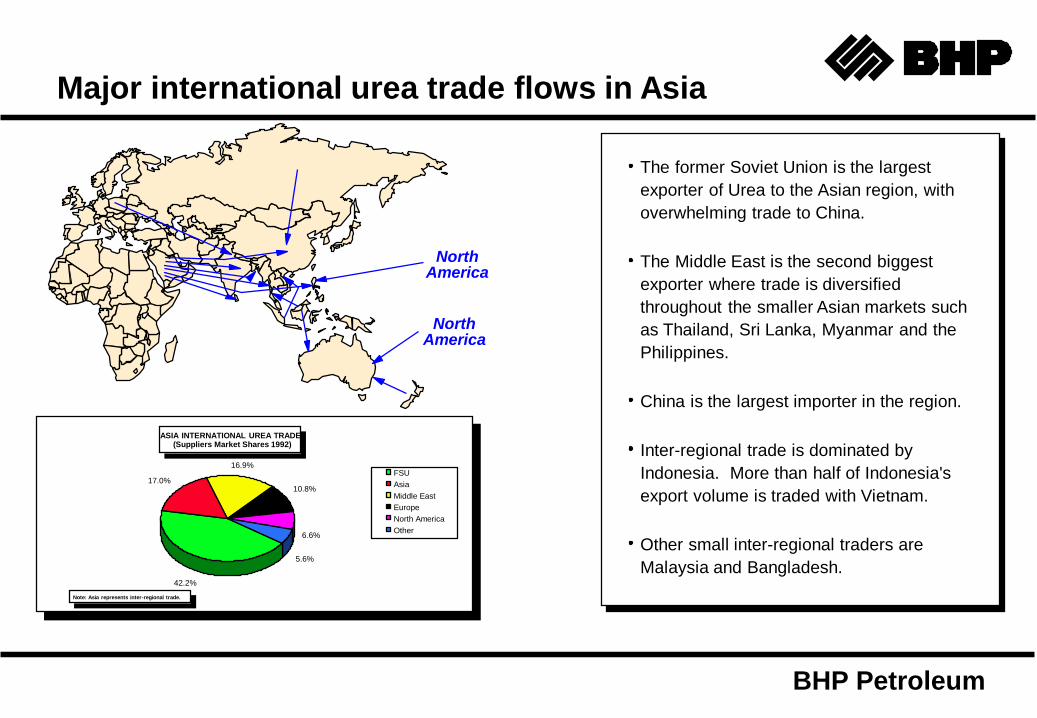
Major international urea trade flows in Asia
The former Soviet Union is the largest
exporter of Urea to the Asian region, with
overwhelming trade to China.
The Middle East is the second biggest
exporter where trade is diversified
throughout the smaller Asian markets such
as Thailand, Sri Lanka, Myanmar and the
Philippines.
China is the largest importer in the region.
Inter-regional trade is dominated by
Indonesia. More than half of Indonesia's
export volume is traded with Vietnam.
Other small inter-regional traders are
Malaysia and Bangladesh.
ASIA INTERNATIONAL UREA TRADE(Suppliers Market Shares 1992)
Note: Asia represents inter-regional trade.
NorthAmerica
NorthAmerica
42.2%
17.0%
16.9%
10.8%
6.6%
5.6%
FSU
Asia
Middle East
Europe
North America
Other

BHP Petroleum
Proposed ammonia/urea export-oriented projects
Source: The outlook for Urea, December 1993 (Fertecon)The outlook for Ammonia, December 1993 (Fertecon)Hydrocarbon processing (June 1995)
Facility Capacity
Country Location Company NH3 Urea Production Possible ureaexport surplus
Middle East Iran Bojnurd KhorosanPetrochemical Co
330,000 T/a 315,000 T/a 1995 200,000 T/a
Bharain Sitah Gulf PetrochemicalIndustries
495,000 T/a 570,000 T/a 1997 570,000 T/a
Qatar Umm Said QAFCO 495,000 T/a 660,000 T/a 1997 660,000 T/a
Iran Queshm Island IFFCO/Kribhco 495,000 T/a 660,000 T/a 2000 660,000 T/a
Iraq Khor Al Zubair SEF 330,000 T/a 570,000 T/a 2000 570,000 T/a
Saudi Arabia Al-Jubail Saudi Binladen Group 330,000 T/a 570,000 T/a 2000 570,000 T/a
West Asia Bangladesh Chittagong Karnafuli Fertiliser Co 495,000 T/a 570,000 T/a 1995 100,000 T/a
Bangladesh Fenchuganj Jalalabad Fertiliser Co 190,000 T/a 330,000 T/a 1997 100,000 T/a
Pakistan Port Quesim Farigi Fertilisers 429,000 T/a 462,000 T/a 1998 200,000 T/a
South-East Asia Indonesia Gresik PT Petrokimia Gresik 445,000 T/a 462,000 T/a 1994 300,000 T/a
Indonesia Bontang PT Pupuk Kalimantan 495,000 T/a 572,000 T/a 1997 250,000 T/a
Malaysia Gunan Kedah Petronas 330,000 T/a 495,000 T/a 1998 495,000 T/a
Myanmar Yangon Myanma PetrochemicalEnterprise
330,000 T/a 570,000 T/a 2000 570,000 T/a

BHP Petroleum
INDONESIAUrea Outlook
120°100°
Government policy of urea self-sufficiency (i.e. agriculture efficiency)
Export advantage to Indochina via small shipments to minor ports
Further capacity additions to be limited by increased gas costs due to:
higher value from domestic use (i) power generation
(ii) industry
(i.e. gas supply to java is critical)
alternative export potential for gas as LNG
TIMOR
BUTON
Alor
Tali AbuJambi
Bandung
Bandar Lampung
JAKARTA
Lhok Seumawe
Medan
Padang
Bengkulu
Palembang
Pontianak
Banjarmasin
Semarang
Yogyakarta
Banda Aceh
Manado
Palu
Kendari
Denpasar
Kupang
Mataram
BRUNEI PHILIPPINES
MALAYSIASINGAPORE
MALAYSIA
THAILAND
Flores
Sumba
Bangka
SOUTH CHINA SEA
INDIAN
OCEAN
CELEBES
SEA
JAVA SEA
FLORES SEA
Simeulue
Nias
Siberut
Togian
Ujungpandang
Sumbawa
Belitung
JAVA
KALIMANTAN
Palangkaraya
SULAWESI
Samarinda
0 km 600
Bali
SUMATRA
Natuna
Lombok
KangeanMaduraSurabaya
1201005
0
5
Proposed projects
INDONESIA UREA MARKET
(Production Profile)
INDONESIA UREA MARKET
(Exports)
Source: Urea Outlook 1994 (Fertecon)
0
2,000,000
4,000,000
6,000,000
8,000,000
88 89 90 91 92 93 94 95 96 97 98 99 2000
YEAR
Ure
a V
olu
me
Mil
lio
ns
0
2,000,000
4,000,000
6,000,000
8,000,000
88 89 90 91 92 93 94 95 96 97 98 99 2000
YEAR
Ure
a V
olu
me
Mil
lio
ns

BHP Petroleum
MALAYSIAUrea Outlook
Government has a industry development priority programme (i.e.
launching of Malaysia into the Vision 2020 Industrialisation Era)
Petronas' greenfield urea plant an integral part of the Peninsular Gas
Utilisation Scheme expansion (Phase III)
Export target market of Thailand
Further urea capacity additions not likely for
higher value alternate gas uses (i.e. power generation)
LNG export potential
Thailand
Cambodia
Malaysia
Vietnam
Indonesia
Phnom PenhVung Tau
Kertih
Kuala Lumpur
Singapore
Sarawak
SabahPeninsular Malaysia
Bintulu
Lotong
Proposed project
MALAYSIA UREA MARKET
(Production)
MALAYSIA UREA MARKET
(Import/Export)
Source: Urea Outlook 1994 (Fertecon)
0
200,000
400,000
600,000
800,000
1,000,000
1,200,000
88 89 90 91 92 93 94 95 96 97 98 99 2000
YEAR
Ure
a V
olu
me
Mil
lio
ns
Production
0
200,000
400,000
600,000
800,000
1,000,000
88 89 90 91 92 93 94 95 96 97 98 99 2000
YEAR
Ure
a V
olu
me
Mil
lio
ns
Import
Export

BHP Petroleum
INDOCHINAUrea Outlook
Rice economy region
Proposed urea production mainly on import replacement basis
Urea projects require government assistance for viability (i.e. low cost
gas position critical)
Export pipeline gas sales to Thailand would provide higher netbacks
and foreign currency savings to the potential urea producing countries
India
Thailand
Myanmar
Bangladesh
Cambodia
Malaysia
China
Vietnam
Laos
Bangkok
Proposed projects
MYANMAR UREA MARKET
VIETNAM UREA MARKET
THAILAND UREA MARKET
Source: Urea Outlook 1994 (Fertecon)
50
100
150
200
250
300
350
88 89 90 91 92 93 94 95 96 97 98 99 2000
Ure
a V
olu
me
Th
ou
sa
nd
s
Production
Consumption
100
200
300
400
500
600
700
88 89 90 91 92 93 94 95 96 97 98 99 2000
Ure
a V
olu
me
Tho
us
an
ds
Consumption
0
200,000
400,000
600,000
800,000
1,000,000
1,200,000
1,400,000
1,600,000
1,800,000
2,000,000
88 89 90 91 92 93 94 95 96 97 98 99 2000
Ure
a V
olu
me
Mil
lio
ns
Production
Consumption

BHP PetroleumOctober 1995
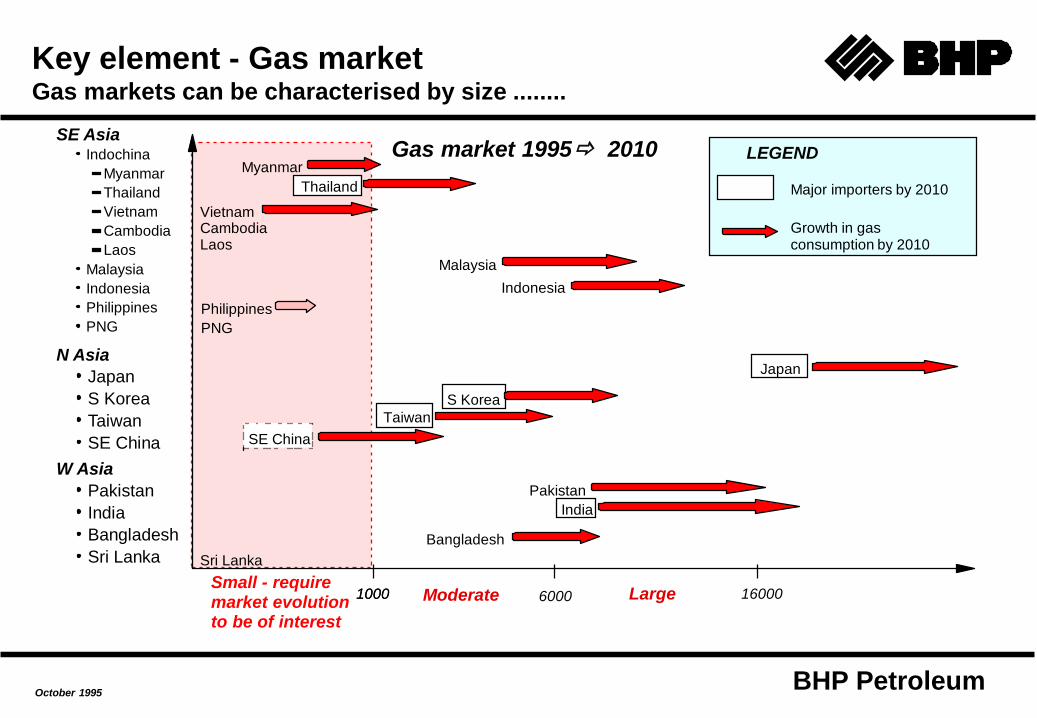
Key element - Gas market Gas markets can be characterised by size ........
SE AsiaIndochina
Myanmar
Thailand
Vietnam
Cambodia
Laos
Malaysia
Indonesia
Philippines
PNG
N Asia
Japan
S Korea
Taiwan
SE China
W Asia
Pakistan
India
Bangladesh
Sri Lanka
Thailand
Philippines
PNG
Indonesia
Japan
Taiwan
SE China
Pakistan
India
Bangladesh
1000
Sri Lanka
6000 160001000
VietnamCambodia Laos
Myanmar
Malaysia
S Korea
Major importers by 2010
Growth in gas consumption by 2010
Small - require market evolution to be of interest
Moderate Large
Gas market 1995 2010 LEGEND
BHP PetroleumOctober 1995
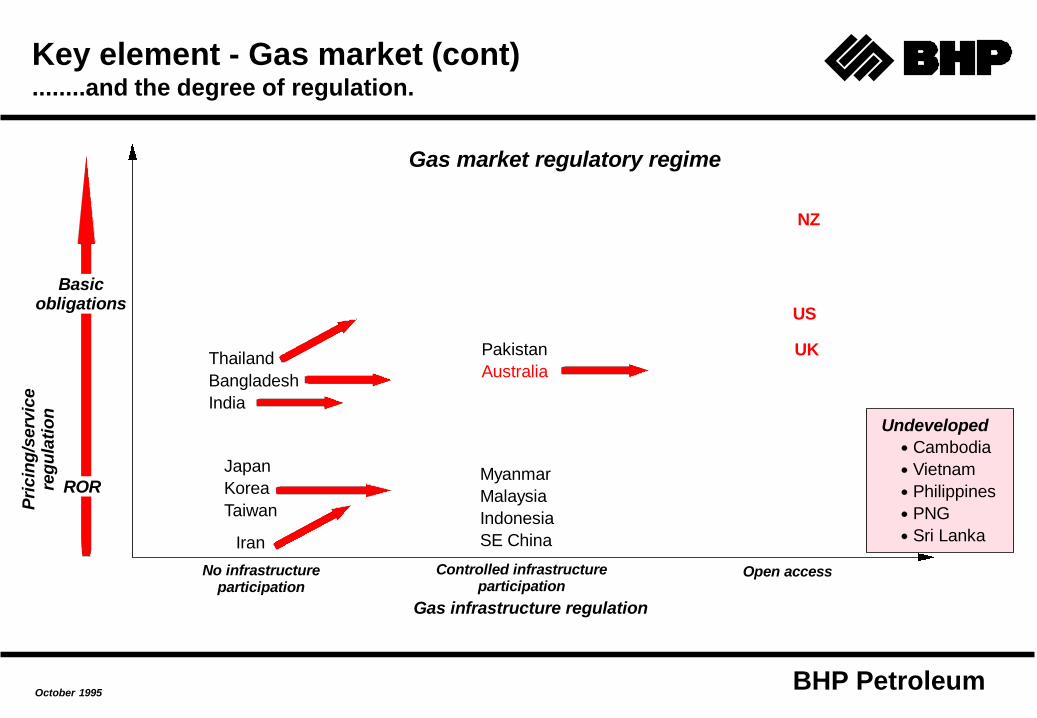
Key element - Gas market (cont)........and the degree of regulation.
Thailand
Bangladesh
India
No infrastructure participation
Controlled infrastructure participation
Open access
Basic obligations
ROR
Pakistan
Australia
Japan
Korea
Taiwan
Myanmar
Malaysia
Indonesia
SE China
NZ
UK
US
Undeveloped
Cambodia
Vietnam
Philippines
PNG
Sri Lanka
Pri
cin
g/s
erv
ice
reg
ula
tio
n
Gas infrastructure regulation
Gas market regulatory regime
Iran

BHP Petroleum
Review - Gas supply business potentialGas supply business potential can be characterised by a country's prospectivity and
fiscal terms. Onerous terms or low prospectivity will preclude BHPP from seeking a
gas supply position in an area.
Myanmar
Vietnam
Thailand
PNG
Pakistan
Bangladesh
SE China
India
Sri Lanka Korea
Philippines
Japan/Taiwan
Malaysia
Indonesia
Iran
Pro
sp
ecti
vit
y
Fiscal terms
High
Low
Onerous Good
cut-off
cu
t-o
ff
Cambodia
BHP Petroleum
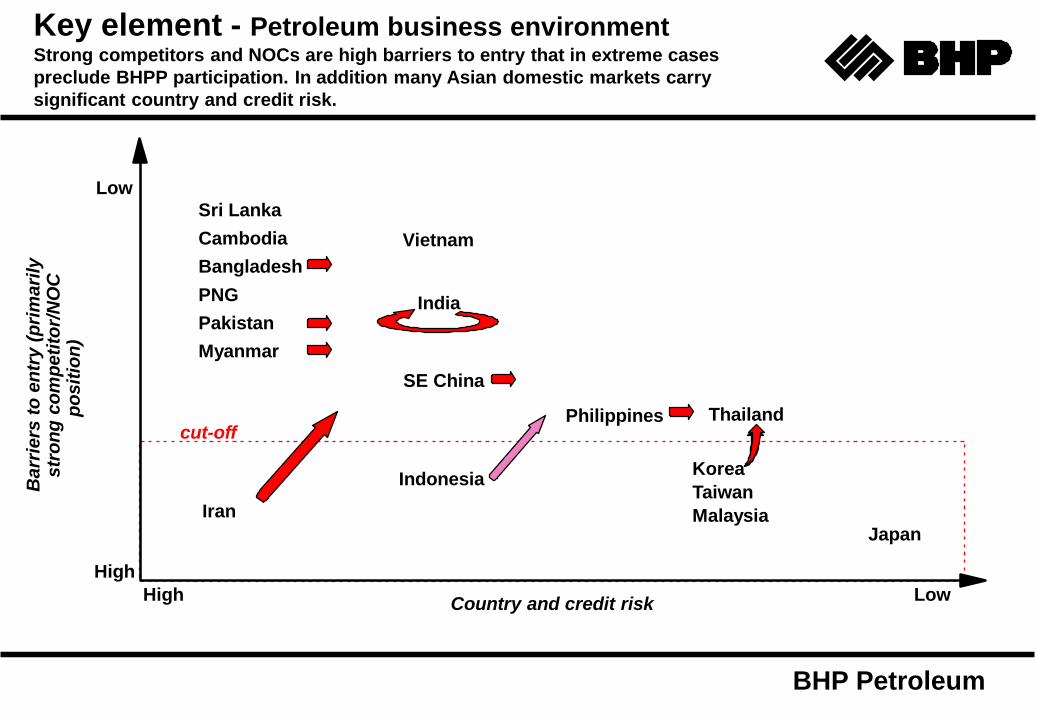
Key element - Petroleum business environmentStrong competitors and NOCs are high barriers to entry that in extreme cases
preclude BHPP participation. In addition many Asian domestic markets carry
significant country and credit risk.
Korea
Taiwan
Malaysia
SE China
Japan
Sri Lanka
Cambodia
Bangladesh
PNG
Pakistan
Myanmar
Vietnam
India
Barr
iers
to
en
try (
pri
mari
ly
str
on
g c
om
peti
tor/
NO
C
po
sit
ion
)
Country and credit risk
Low
High
High Low
cut-off
Indonesia
Philippines Thailand
Iran

BHP Petroleum
Global Gas Production

BHP Petroleum
Global Gas Consumption
0%
10%
20%
30%
40%
50%
60%
70%
80%
90%
100%
1975
1985
1987
1989
1991
1993
1995
Asia &Australasia
Africa
Middle East
Former SovietUnion
Europe
Sth. & Cen.America
North America

BHP Petroleum
Global Gas Reserves
0%
10%
20%
30%
40%
50%
60%
70%
80%
90%
100%
1975 1985 1987 1989 1991 1993 1995
Other
Asia &AustralasiaAfrica
Middle East
Former SovietUnionEurope
Sth. & Cen.AmericaNorth America

BHP Petroleum
Asian Gas Reserves
BHP Petroleum
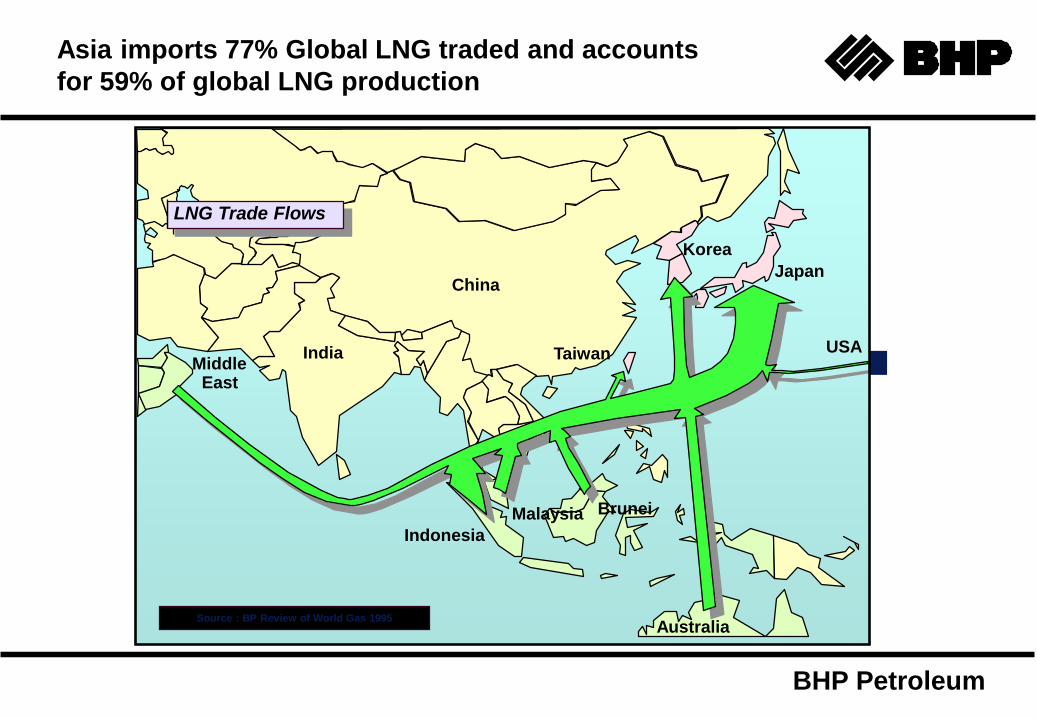
Asia imports 77% Global LNG traded and accounts
for 59% of global LNG production
China
Australia
TaiwanIndia
Japan
Brunei
Middle East
Korea
LNG Trade Flows
Indonesia
Malaysia
USA
Source : BP Review of World Gas 1995

BHP Petroleum
IPP Fuel CostsCurrent pricing favours coal on marginal cost basis
0
1
2
3
4
5
6
7
8
9
Coal Gas
Ge
nera
tio
n c
ost
c/k
Wh
$60/ton
$40/ton
$20/ton
$6/MMBtu
$4/MMBtu
$2/MMBtu

BHP Petroleum
Asian Existing Gas-Fired Power
Generating Capacity by Country
0 10 20 30 40 50
Australia
India
Indonesia
Japan
Malaysia
New Zealand
Pakistan
Singapore
South Korea
Taiwan
Hong Kong
Thailand
MW (Thousands)
Steam Turbine
CC GT

BHP Petroleum
Singapore Gas Demand• Gas demand in the near term will be supply driven
• Malaysia unlikely to supply more gas than its current contract
• Indonesian gas cannot compete with current fuel oil price
• Singapore has ready access to low cost fuel oil supplies
(US$2.40/MMBtu)
• Gas likely to command a slight premium in price - depending,
however, on the country’s commitment to fuel diversity, security
of supply, environmental issues, etc.
• Fuel oil prices have been depressed, and likely to stay that way,
making competition for gas tougher

BHP Petroleum
Malaysia Gas Demand
• Future gas demand in Peninsular Malaysia wil be for power
generation
• Domestic gas demand onshore Peninsular Malaysia can be met
by domestic production until 2010
• Gas supply for PGU Scheme wil double by 2000, mostly
supplied by Exxon
• Gas prices net to suppliers are relatively low due to Petronas’
captive market - unlikely to change in the short/medium term
• Low domestic gas prices make it hard for external sources of
supply to compete

BHP Petroleum
Thailand Gas Demand
• Power sector will be the driving force behind future expansion
of Thailand’s gas market
• Gas will dominate the power generation fuel mix in the near
term, but coal’s position will increase in the medium/longer
term
• A “gas bubble” could emerge in the short/medium term
• In the longer term, as yet uncontracted sources of gas will
compete to supply the Thai gas market
• LNG will not actually be required until around 2010, although
small volumes are likely to be taken from 2005 as a security of
supply measure

BHP Petroleum
Vietnam Gas Demand
• As gas industry is still young, demand is likely to be supply
driven
• Power generation will dominate future gas demand - current
reserve base likely to meet this demand until 2010
• Domestic suppliers still face difficult times in commercialisation
of existing reserves
– Fundamental legislative decisions need to be made
– Gas pricing methodology is still uncertain
– Alternative fuels are subsidised