Embed Size (px)
Citation preview
July 2014
The effects of increased learning time on student academic and
nonacademic outcomes: Findings from a
meta‑analytic review
Yael Kidron Jim Lindsay
American Institutes for Research
Key findings
This report summarizes a review of rigorous research studies on increased
learning time. Findings across studies have been combined using meta-analysis
techniques.
• Increased learning time programs improved literacy and math achievement when
instruction was led by certified teachers, though the effects were small.
• Effects varied by type of instruction. Programs that used a traditional instruction
style improved literacy and math achievement. Programs that used an experiential
learning instruction style improved student social-emotional skills. In both cases
the effects were small.
• Increased learning time improved the literacy achievement of students performing
below standards and the social-emotional skills of students with attention deficit/
hyperactivity disorder.
U . S . D e p a r t m e n t o f E d u c a t i o n At CNA
REL 2014–015
The National Center for Education Evaluation and Regional Assistance (NCEE) conducts unbiased large-scale evaluations of education programs and practices supported by federal funds; provides research-based technical assistance to educators and policymakers; and supports the synthesis and the widespread dissemination of the results of research and evaluation throughout the United States.
July 2014
This report was prepared for the Institute of Education Sciences (IES) under Contract ED-IES-12-C-0005 by Regional Educational Laboratory Appalachia administered by CNA. The content of the publication does not necessarily reflect the views or policies of IES or the U.S. Department of Education, nor does mention of trade names, commercial products, or organizations imply endorsement by the U.S. Government.
This REL report is in the public domain. While permission to reprint this publication is not necessary, it should be cited as:
Kidron, Y., and Lindsay, J. (2014). The effects of increased learning time on student academic and nonacademic outcomes: Findings from a meta-analytic review (REL 2014–015). Washing-ton, DC: U.S. Department of Education, Institute of Education Sciences, National Center for Education Evaluation and Regional Assistance, Regional Educational Laboratory Appalachia. Retrieved from http://ies.ed.gov/ncee/edlabs.
This report is available on the Regional Educational Laboratory website at http://ies.ed.gov/ncee/edlabs.
i
Summary
Interest in increased learning time programs delivered beyond the regular school day has grown (Stonehill et al., 2011). These programs provide additional instruction in English language arts, math, and other subjects and are meant to enhance students’ academic interests and success (Redd et al., 2012). The most common approaches include out-of-school programs (before- and after-school and weekend programs); summer school; schools with longer school days, weeks, or years; and year-round schools.
Numerous evaluations have tested the effects of such programs on students’ academic knowledge, study skills, social skills, and motivation to learn. This meta-analysis examined more than 7,000 studies, sorted them by scientific rigor, and identified 30 that used research designs capable of yielding strong evidence about the outcomes of increased learning time. In some cases the 30 studies found that increased learning time programs had a positive effect on student outcomes; in other cases the studies found no positive effect. This sug-gests that no single increased learning time program fits the needs of all students.
The information in this report should help practitioners decide how best to select and implement an increased learning time approach. The programs were found, for example, to improve academic outcomes when instruction was led by certified teachers. Ten studies reported that literacy instruction was delivered by certified teachers and found a statisti-cally significant positive effect on literacy achievement. Five studies reported that math instruction was conducted by certified teachers and found a statistically significant positive effect on math achievement. In both cases, however, the effects were small.
Programs that used a traditional instruction style (with the teacher responsible for the pro-gression of activities and students following directions to complete tasks) improved academ-ic outcomes in literacy (nine studies) and math (four studies). The effects were small for both subjects. Programs that used an experiential learning instruction style (such as hands-on, inquiry-based instruction) improved student social-emotional skill development (for example, self-confidence and self-management; four studies). Again, the effects were small.
The findings also show that increased learning time can benefit students at risk of aca-demic failure. Increased learning time improved the literacy achievement of students performing below standards (three studies). Increased learning time also promoted the social-emotional skill development (for example, emotional well-being and externalizing behavior) of students with attention deficit/hyperactivity disorder (three studies).
Programs that targeted specific student subgroups (such as struggling readers) and used explicit instruction to teach well specified skills tended to show a positive effect on student outcomes. Practitioners who wish to use increased learning time programs might there-fore set goals and design activities based on a deep understanding of student needs and interests.
Because this study examined the data one category at a time, it does not provide informa-tion on potential interactions among implementation features, such as how the effective-ness of experiential learning, might vary with teacher–student ratio or the frequency and duration of classes. As the evidence base grows, studies like this one will be able to assess the effects of increased learning time using multiple factors at the same time.
ii
Contents
Summary i
Why this study? 1
What the study considered 3
Findings of the research review 5Out-of-school programs had a positive effect on students’ academic motivation but not on
literacy or math achievement 5Certified teachers and traditional instruction each had a positive effect on students’ academic
outcomes; experiential instruction had a positive effect on social-emotional skill development 6Increased learning time had a positive effect on students performing below standards 10Increased learning time can be effective in urban, suburban, and mixed locales 12Increased learning time programs had a positive effect on the academic achievement of
elementary school students but a negative effect on the literacy achievement of middle school students 13
Implications of the study 16In sum, districts and schools should choose increased learning time programs based on a
program’s features as well as the student outcome targeted for improvement 16Further research is needed on increased learning time 17
Study limitations 18
Appendix A. Research methodology A-1
Appendix B. Program descriptions of the 30 reviewed studies B-1
Appendix C. Program implementation in the reviewed studies C-1
Appendix D. Narrative summaries of the increased learning time programs evaluated in the studies reviewed D-1
Notes Notes-1
References Ref-1
Boxes1 Approaches to increased learning time 22 Data sources and methodology 43 Comparison of findings to past meta-analyses of increased learning time 64 Definitions of instruction style and at-risk student subgroups 9
FiguresA1 Literature search and screening process A-1A2 Number of studies, by sample characteristics A-7A3 Number of studies, by program and study design characteristics A-8
iii
Tables1 Summary effects of increased learning time programs, by approach 52 Additional evidence on the effects of increased learning time programs, by approach 73 Summary effects of increased learning time programs, by instructor qualifications 84 Summary effects of increased learning time programs, by pedagogical approach 85 Additional evidence on the effects of increased learning time programs, by pedagogical
approach 106 Summary effects of increased learning time programs, by student subgroup 117 Additional evidence of the effects of increased learning time programs, by student subgroup 128 Summary effects of increased learning time programs, by locale 139 Additional evidence of the effects of increased learning time programs, by locale 1410 Summary effects of increased learning time programs, by grade level 1411 Additional evidence of the effects of increased learning time programs, by grade level 1512 Program features, student groups, and circumstances under which increased learning
time produced a statistically significant effect 16A1 Keywords used in academic database and Internet searches A-2A2 Reasons for excluding studies during the advanced screening process A-6B1 Program descriptions of the 30 reviewed studies B-1C1 Program implementation in the reviewed studies C-1D1 Effect sizes for 21st Century Community Learning Centers D-2D2 Effect sizes for After School Matters D-3D3 Effect sizes for After-School program (Baltimore, Maryland) D-3D4 Effect sizes for AfterZone D-4D5 Effect sizes for the Challenging Horizons Program D-5D6 Effect sizes for District summer literacy program D-6D7 Effect sizes for Early Risers’ Skills for Success D-6D8 Effect size for Extended Learning Opportunities D-7D9 Effect sizes for full-day kindergarten D-8D10 Effect sizes for KindergARTen Summer Camp D-8D11 Effect sizes for Los Angeles’ Better Educated Students for Tomorrow D-8D12 Effect sizes for the National Aeronautics and Space Administration’s Science,
Engineering, Mathematics, and Aerospace Academy D-9D13 Effect sizes for reading clubs D-9D14 Effect sizes for Read to Achieve D-10D15 Effect sizes for Skill Building Summer School D-10D16 Effect size for small group tutoring by Intervention Services, Inc. D-11D17 Effect size for Teach Baltimore Summer Academy D-11D18 Effect sizes for the Higher Achievement Program D-12D19 Effect sizes for the Investigators’ Club D-13D20 Effect size for writing clubs D-13D21 Effect sizes for Youth Services–Child Care, Academic Assistance, Recreation, and
Enrichment D-13
1
Why this study?
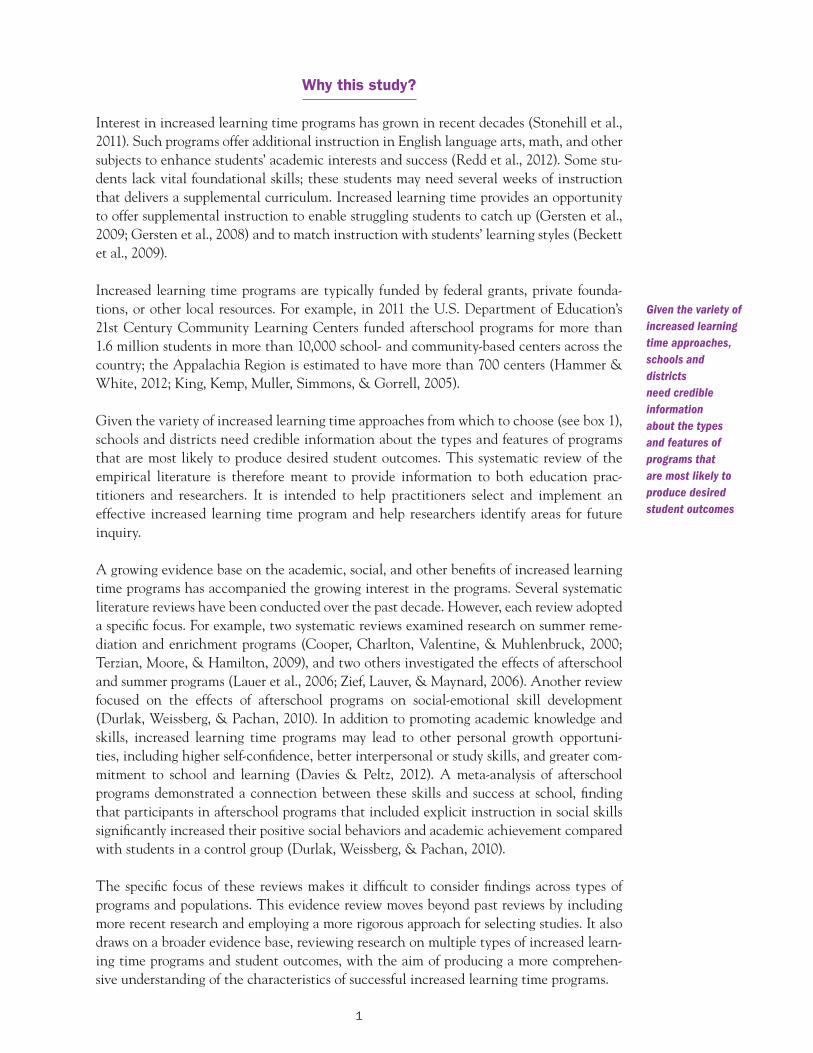
Interest in increased learning time programs has grown in recent decades (Stonehill et al., 2011). Such programs offer additional instruction in English language arts, math, and other subjects to enhance students’ academic interests and success (Redd et al., 2012). Some stu-dents lack vital foundational skills; these students may need several weeks of instruction that delivers a supplemental curriculum. Increased learning time provides an opportunity to offer supplemental instruction to enable struggling students to catch up (Gersten et al., 2009; Gersten et al., 2008) and to match instruction with students’ learning styles (Beckett et al., 2009).
Increased learning time programs are typically funded by federal grants, private founda-tions, or other local resources. For example, in 2011 the U.S. Department of Education’s 21st Century Community Learning Centers funded afterschool programs for more than 1.6 million students in more than 10,000 school- and community-based centers across the country; the Appalachia Region is estimated to have more than 700 centers (Hammer & White, 2012; King, Kemp, Muller, Simmons, & Gorrell, 2005).
Given the variety of increased learning time approaches from which to choose (see box 1), schools and districts need credible information about the types and features of programs that are most likely to produce desired student outcomes. This systematic review of the empirical literature is therefore meant to provide information to both education prac-titioners and researchers. It is intended to help practitioners select and implement an effective increased learning time program and help researchers identify areas for future inquiry.
A growing evidence base on the academic, social, and other benefits of increased learning time programs has accompanied the growing interest in the programs. Several systematic literature reviews have been conducted over the past decade. However, each review adopted a specific focus. For example, two systematic reviews examined research on summer reme-diation and enrichment programs (Cooper, Charlton, Valentine, & Muhlenbruck, 2000; Terzian, Moore, & Hamilton, 2009), and two others investigated the effects of afterschool and summer programs (Lauer et al., 2006; Zief, Lauver, & Maynard, 2006). Another review focused on the effects of afterschool programs on social-emotional skill development (Durlak, Weissberg, & Pachan, 2010). In addition to promoting academic knowledge and skills, increased learning time programs may lead to other personal growth opportuni-ties, including higher self-confidence, better interpersonal or study skills, and greater com-mitment to school and learning (Davies & Peltz, 2012). A meta-analysis of afterschool programs demonstrated a connection between these skills and success at school, finding that participants in afterschool programs that included explicit instruction in social skills significantly increased their positive social behaviors and academic achievement compared with students in a control group (Durlak, Weissberg, & Pachan, 2010).
The specific focus of these reviews makes it difficult to consider findings across types of programs and populations. This evidence review moves beyond past reviews by including more recent research and employing a more rigorous approach for selecting studies. It also draws on a broader evidence base, reviewing research on multiple types of increased learn-ing time programs and student outcomes, with the aim of producing a more comprehen-sive understanding of the characteristics of successful increased learning time programs.
Given the variety of increased learning time approaches, schools and districts need credible information about the types and features of programs that are most likely to produce desired student outcomes
2
Box 1. Approaches to increased learning time
This report defines increased learning time as programs that extend students’ exposure to
instruction beyond the traditional school day and, in some cases, beyond the traditional school
year (Stonehill et al., 2011). The most commonly adopted approaches include:
• Out-of-school programs: Enrichment and academic programs that operate during the school
year but outside regular school hours. These programs may take place before school, after
school, or during weekends. They may operate on school campuses or at other sites such
as community centers and college campuses.
• Summer schools: Study programs held during the summer, chiefly for supplementary and
remedial study.
• Expanded learning time schools: Schools that increase the number of hours in the school
day or the number of days in the school year for all students in one or more grade levels.
• Year-round schools: Schools that operate year-round and replace the long summer recess
with shorter breaks between school sessions (referred to as intersessions). Extended
school days may be offered during intersessions.
In addition to types of programs, other factors might also affect program effectiveness, such as instructors’ qualifications and pedagogical practices used. For example, teaching during increased learning time can augment the instruction that occurs during the regular school day without replicating that instruction. Afterschool, weekend, and summertime instruction offers opportunities to recruit additional instructors from the community (such as college students, parents, and individuals with an interest in teaching) and integrate them into programs to boost teacher–student ratios. Instructors can connect their teach-ing to students’ interests and experiences and encourage inquiry and exploration (Beckett et al., 2009).
Two examples of programs that employ additional factors to increase their effectiveness are reading clubs and the National Aeronautics and Space Administration’s (NASA) Science, Engineering, Mathematics, and Aerospace Academy out-of-school science program. The reading clubs are before- or after-school programs for grade 2 students who struggle with reading (Berninger, Abbott, Vermeulen, & Fulton, 2006). The club format is intended to motivate students to spend extra time on reading. Students have to whisper the secret password chosen by each club and have their hand stamped every time they enter a club session. Activities are designed to be fun and engaging. Each session begins with an activ-ity called “You [sic] Got to Laugh.” Students select riddles and jokes from a collection provided by the teachers and read them to each other. Once a month students vote on their favorite jokes, scoring them on a “laugh-o-meter.” The NASA out-of-school science program, which operates from institutions of higher education that target racial/ethnic minority students across the country, is directed to populations typically underserved and underrepresented in science, technology, engineering, and math (Martinez and Cosenti-no de Cohen, 2010). The program teaches elementary and secondary school students to problem solve real-life situations while completing projects and learning science.
This review also estimates the effects of increased learning time on various student sub-groups. Knowing the effects of increased learning time on specific student groups (rather than on the overall student population) can guide program planning. For example, research has shown that students from economically disadvantaged households tend to have fewer
3
learning opportunities and experience a less supportive learning environment than their more affluent peers (Reardon, 2011). One example of difference in learning opportuni-ties is loss in reading skills during summer recess (Allington, 2010; Cooper, Nye, Charl-ton, Lindsay, & Greathouse, 1996; Downey, von Hippel, & Broh, 2004). Lack of access to books, encouragement to read, and reading support during summer recess, compounded year after year, may be one of several reasons that students from disadvantaged households are consistently outperformed in reading by their more affluent peers (Allington, 2010). Offering additional reading support beyond the regular school day to students from eco-nomically disadvantaged households might help close the achievement gap.
Increased learning time is intended not only for struggling students but also for high- potential students with limited learning opportunities and for students who perform well at school and seek additional learning opportunities (Mahoney, Parente, & Zigler, 2009). Such enrichment activities might boost the skills, academic engagement, education aspi-rations, and self-confidence of high-potential students from low-income backgrounds who otherwise might not have access to such education programs (VanTassel-Baska & Stam-baugh, 2007). For example, some programs use new educational technologies to help stu-dents understand ideas in science and the physical world. Some of these programs allow students to express their understanding and ideas in creative ways (Finkelstein & Mayhew, 2008).
What the study considered
The meta-analysis was guided by five research questions:• To what extent do the four types of increased learning time approaches (out-of-
school programs, summer schools, expanded learning time schools, and year-round schools) affect student outcomes?
• What are the effects of increased learning time program characteristics, such as instructors’ qualifications, instruction approach, and teacher–student ratio?
• Are increased learning time programs effective for students at risk of academic failure?
• Are increased learning time programs effective for students in urban, suburban, and rural schools?
• Are increased learning time programs effective for students in elementary and sec-ondary grade levels?
Box 2 summarizes the data sources and methodology used for this literature review; appen-dix A provides more detail.
4
Box 2. Data sources and methodology
More than 7,000 studies of increased learning time programs were identified for possible
review. Of these studies 165 experimental and quasi-experimental studies were identified and
screened (see appendix A for more on the review process). Reviewers excluded 135 of these
studies in the advanced screening process (see table A2 in appendix A for the primary reasons
for excluding each study). Two-thirds of the studies that did not meet the advanced evidence
screen were quasi-experimental design studies that did not establish the baseline equivalence
of the intervention and comparison groups. That left 30 relevant studies.
The 30 studies were conducted relatively recently (half were published within the last five
years). The most commonly represented increased learning time approach in the data was out-
of-school time. No studies of expanded learning time schools or year-round schools met the
screening criteria (except studies of full-day kindergarten), so no conclusions could be drawn
for those approaches. Appendixes B and C detail the study, program, and sample characteris-
tics for each of the 30 studies. Appendix D describes the 21 programs implemented in these
studies.
Meta-analysis was used to summarize the findings across the 30 studies that met all
screening criteria (see appendix A for the statistical techniques used). The effects of all
relevant studies were combined to arrive at a single estimate of the size of the effect (the
summary effect). Meta-analysis increases the power of statistical analyses, detecting interven-
tion effects in a set of studies that individually could not detect effects (Cohn & Becker, 2003).
Meta-analytic techniques can also be used to determine whether particular features of studies
are related to the size of the effect estimate.
Several features of the meta-analysis should be kept in mind when interpreting the results:
• This review uses an effect size of 0.25 as a benchmark of “educational significance,” as
recommended by Hill, Bloom, Black, and Lipsey (2008). The What Works Clearinghouse
terminology of “substantively important” is used when referring to this benchmark.
• Not all studies focusing on a particular program type examined the same outcomes. For
example, some studies that examined the effect of out-of-school programs focused on
academic outcomes (such as literacy or math achievement) while others looked at non-
academic outcomes (such as social-emotional skill development).
• Research evidence that is based on fewer than three studies may be insufficient to provide
confident answers to the study’s research questions. Therefore, effect sizes based on one
or two studies are presented separately.
5
Findings of the research review
This section details the findings for the report’s five research questions. These are based on the 30 studies that were analyzed using meta-analysis approaches, which are outlined in appendix A.
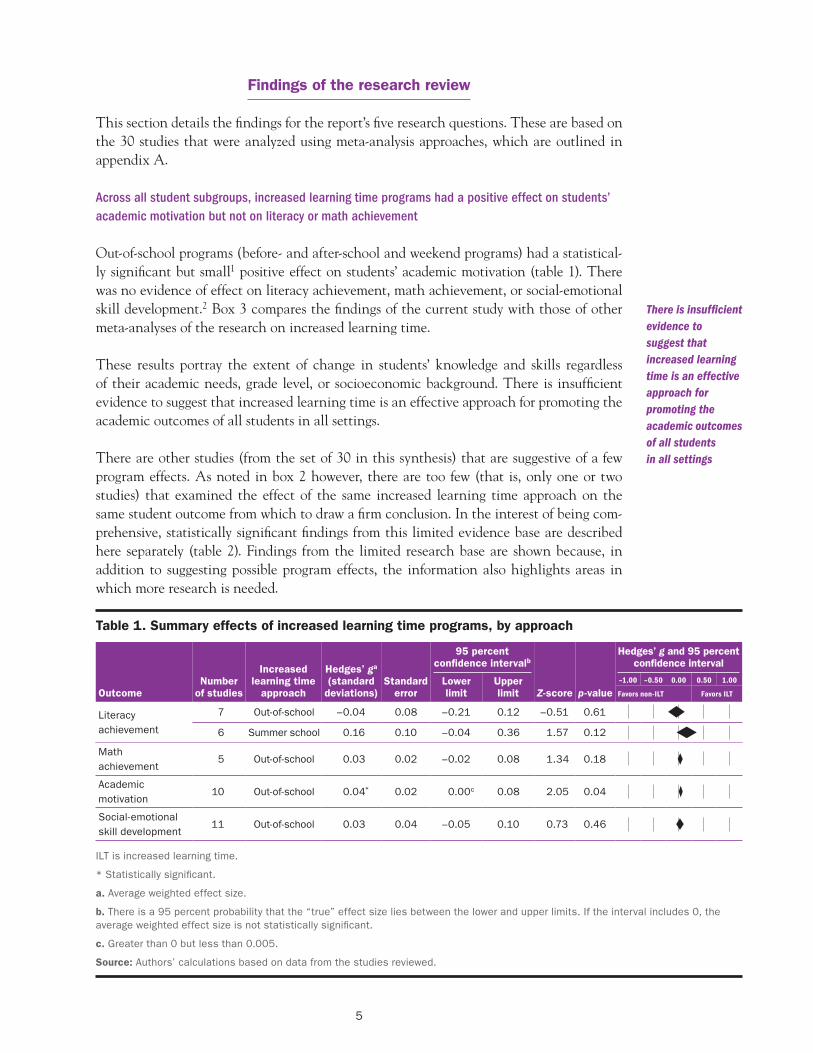
Across all student subgroups, increased learning time programs had a positive effect on students’ academic motivation but not on literacy or math achievement
Out-of-school programs (before- and after-school and weekend programs) had a statistical-ly significant but small1 positive effect on students’ academic motivation (table 1). There was no evidence of effect on literacy achievement, math achievement, or social-emotional skill development.2 Box 3 compares the findings of the current study with those of other meta-analyses of the research on increased learning time.
These results portray the extent of change in students’ knowledge and skills regardless of their academic needs, grade level, or socioeconomic background. There is insufficient evidence to suggest that increased learning time is an effective approach for promoting the academic outcomes of all students in all settings.
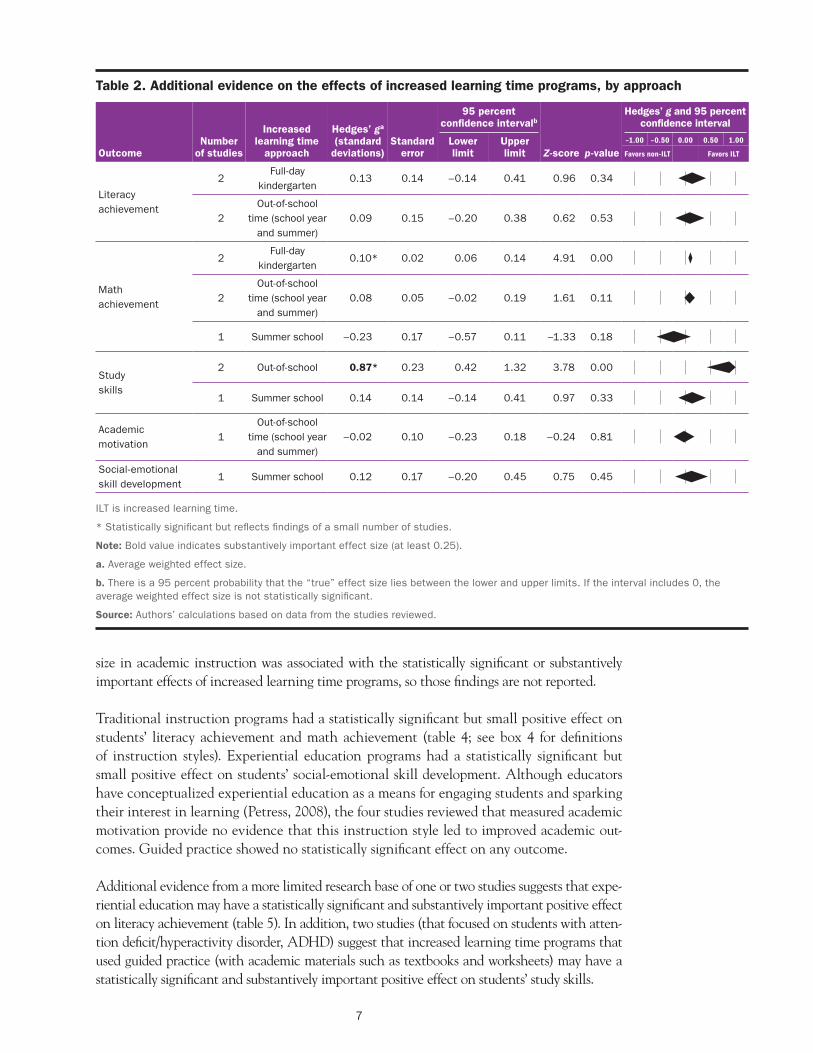
There are other studies (from the set of 30 in this synthesis) that are suggestive of a few program effects. As noted in box 2 however, there are too few (that is, only one or two studies) that examined the effect of the same increased learning time approach on the same student outcome from which to draw a firm conclusion. In the interest of being com-prehensive, statistically significant findings from this limited evidence base are described here separately (table 2). Findings from the limited research base are shown because, in addition to suggesting possible program effects, the information also highlights areas in which more research is needed.
Table 1. Summary effects of increased learning time programs, by approach
Hedges’ g and 95 percent confidence interval
–1.00 –0.50 0.00 0.50 1.00
Favors non-ILT Favors ILTOutcomeNumber
of studies
Increased learning time
approach
Hedges’ ga (standard
deviations)Standard
error
95 percent confidence intervalb
Lower limit
Upper limit Z‑score p‑value
Literacy achievement
7
6
Out-of-school
Summer school
–0.04
0.16
0.08
0.10
–0.21 0.12
–0.04 0.36
–0.51 0.61
1.57 0.12
Math achievement
5 Out-of-school 0.03 0.02 –0.02 0.08 1.34 0.18
Academic motivation
10 Out-of-school 0.04* 0.02 0.00c 0.08 2.05 0.04
Social-emotional skill development
11 Out-of-school 0.03 0.04 –0.05 0.10 0.73 0.46
ILT is increased learning time.
* Statistically significant.
a. Average weighted effect size.
b. There is a 95 percent probability that the “true” effect size lies between the lower and upper limits. If the interval includes 0, the average weighted effect size is not statistically significant.
c. Greater than 0 but less than 0.005.
Source: Authors’ calculations based on data from the studies reviewed.
There is insufficient evidence to suggest that increased learning time is an effective approach for promoting the academic outcomes of all students in all settings
6
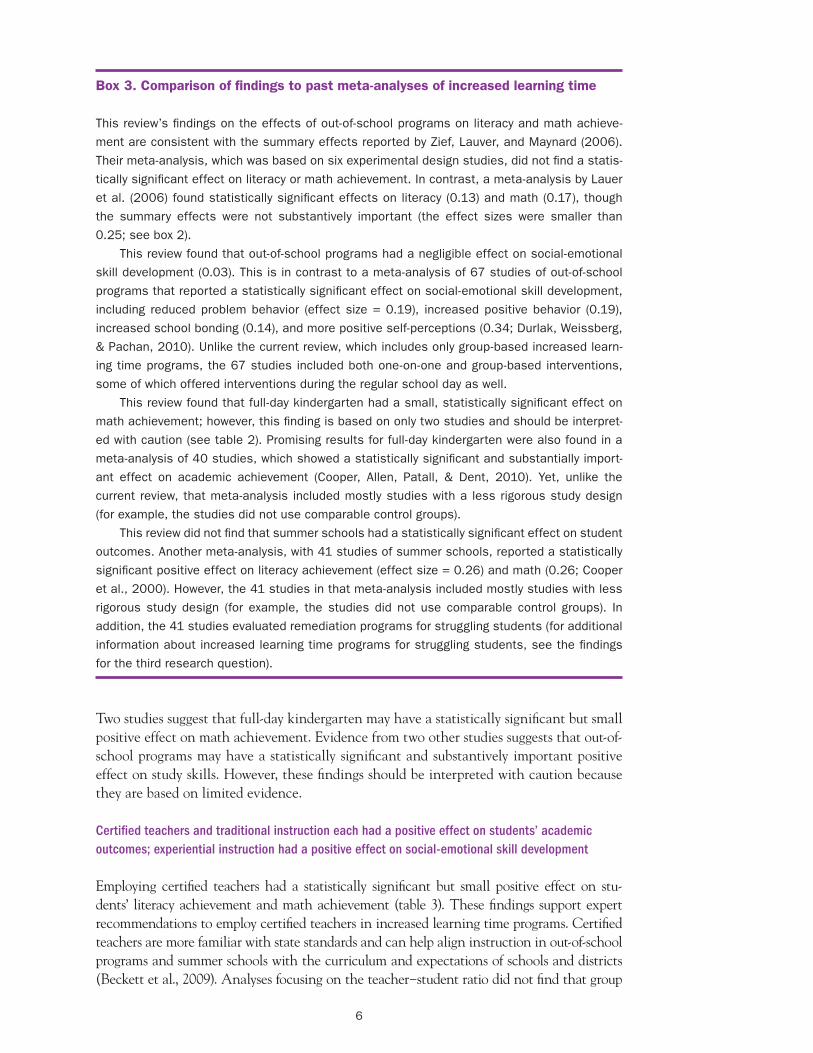
Box 3. Comparison of findings to past meta‑analyses of increased learning time
This review’s findings on the effects of out-of-school programs on literacy and math achieve-
ment are consistent with the summary effects reported by Zief, Lauver, and Maynard (2006).
Their meta-analysis, which was based on six experimental design studies, did not find a statis-
tically significant effect on literacy or math achievement. In contrast, a meta-analysis by Lauer
et al. (2006) found statistically significant effects on literacy (0.13) and math (0.17), though
the summary effects were not substantively important (the effect sizes were smaller than
0.25; see box 2).
This review found that out-of-school programs had a negligible effect on social-emotional
skill development (0.03). This is in contrast to a meta-analysis of 67 studies of out-of-school
programs that reported a statistically significant effect on social-emotional skill development,
including reduced problem behavior (effect size = 0.19), increased positive behavior (0.19),
increased school bonding (0.14), and more positive self-perceptions (0.34; Durlak, Weissberg,
& Pachan, 2010). Unlike the current review, which includes only group-based increased learn-
ing time programs, the 67 studies included both one-on-one and group-based interventions,
some of which offered interventions during the regular school day as well.
This review found that full-day kindergarten had a small, statistically significant effect on
math achievement; however, this finding is based on only two studies and should be interpret-
ed with caution (see table 2). Promising results for full-day kindergarten were also found in a
meta-analysis of 40 studies, which showed a statistically significant and substantially import-
ant effect on academic achievement (Cooper, Allen, Patall, & Dent, 2010). Yet, unlike the
current review, that meta-analysis included mostly studies with a less rigorous study design
(for example, the studies did not use comparable control groups).
This review did not find that summer schools had a statistically significant effect on student
outcomes. Another meta-analysis, with 41 studies of summer schools, reported a statistically
significant positive effect on literacy achievement (effect size = 0.26) and math (0.26; Cooper
et al., 2000). However, the 41 studies in that meta-analysis included mostly studies with less
rigorous study design (for example, the studies did not use comparable control groups). In
addition, the 41 studies evaluated remediation programs for struggling students (for additional
information about increased learning time programs for struggling students, see the findings
for the third research question).
Two studies suggest that full-day kindergarten may have a statistically significant but small positive effect on math achievement. Evidence from two other studies suggests that out-of-school programs may have a statistically significant and substantively important positive effect on study skills. However, these findings should be interpreted with caution because they are based on limited evidence.
Certified teachers and traditional instruction each had a positive effect on students’ academic outcomes; experiential instruction had a positive effect on social-emotional skill development
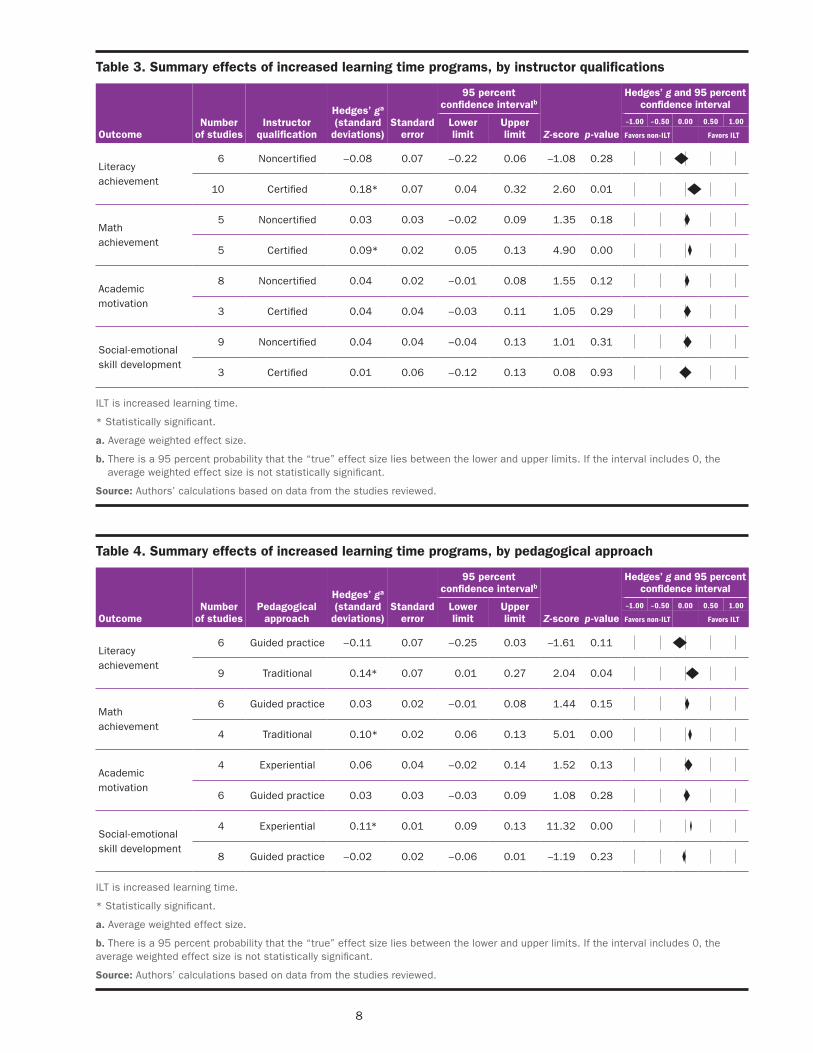
Employing certified teachers had a statistically significant but small positive effect on stu-dents’ literacy achievement and math achievement (table 3). These findings support expert recommendations to employ certified teachers in increased learning time programs. Certified teachers are more familiar with state standards and can help align instruction in out-of-school programs and summer schools with the curriculum and expectations of schools and districts (Beckett et al., 2009). Analyses focusing on the teacher−student ratio did not find that group
7
Table 2. Additional evidence on the effects of increased learning time programs, by approach
Hedges’ g and 95 percent confidence interval
–1.00 –0.50 0.00 0.50 1.00
Favors non-ILT Favors ILTOutcome
Literacy achievement
Number of studies
2
Increased learning time
approach
Full-day kindergarten
Hedges’ ga (standard
deviations)
0.13
Standard error
0.14
95 percent confidence intervalb
Lower limit
Upper limit
–0.14 0.41
Z‑score p‑value
0.96 0.34
2Out-of-school
time (school year and summer)
0.09 0.15 –0.20 0.38 0.62 0.53
Math achievement
2Full-day
kindergarten0.10* 0.02 0.06 0.14 4.91 0.00
2Out-of-school
time (school year and summer)
0.08 0.05 –0.02 0.19 1.61 0.11
1 Summer school –0.23 0.17 –0.57 0.11 –1.33 0.18
Study skills
2 Out-of-school 0.87* 0.23 0.42 1.32 3.78 0.00
1 Summer school 0.14 0.14 –0.14 0.41 0.97 0.33
Academic motivation
1Out-of-school
time (school year and summer)
–0.02 0.10 –0.23 0.18 –0.24 0.81
Social-emotional skill development
1 Summer school 0.12 0.17 –0.20 0.45 0.75 0.45
ILT is increased learning time.
* Statistically significant but reflects findings of a small number of studies.
Note: Bold value indicates substantively important effect size (at least 0.25).
a. Average weighted effect size.
b. There is a 95 percent probability that the “true” effect size lies between the lower and upper limits. If the interval includes 0, the average weighted effect size is not statistically significant.
Source: Authors’ calculations based on data from the studies reviewed.
size in academic instruction was associated with the statistically significant or substantively important effects of increased learning time programs, so those findings are not reported.
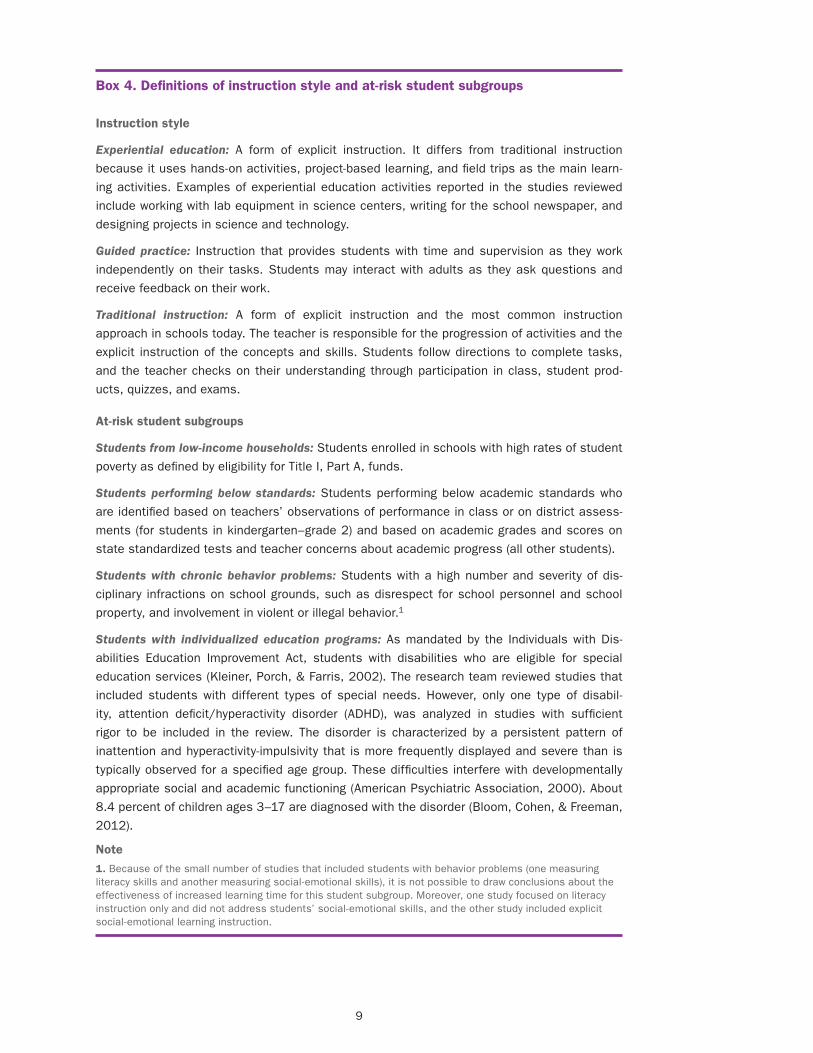
Traditional instruction programs had a statistically significant but small positive effect on students’ literacy achievement and math achievement (table 4; see box 4 for definitions of instruction styles). Experiential education programs had a statistically significant but small positive effect on students’ social-emotional skill development. Although educators have conceptualized experiential education as a means for engaging students and sparking their interest in learning (Petress, 2008), the four studies reviewed that measured academic motivation provide no evidence that this instruction style led to improved academic out-comes. Guided practice showed no statistically significant effect on any outcome.
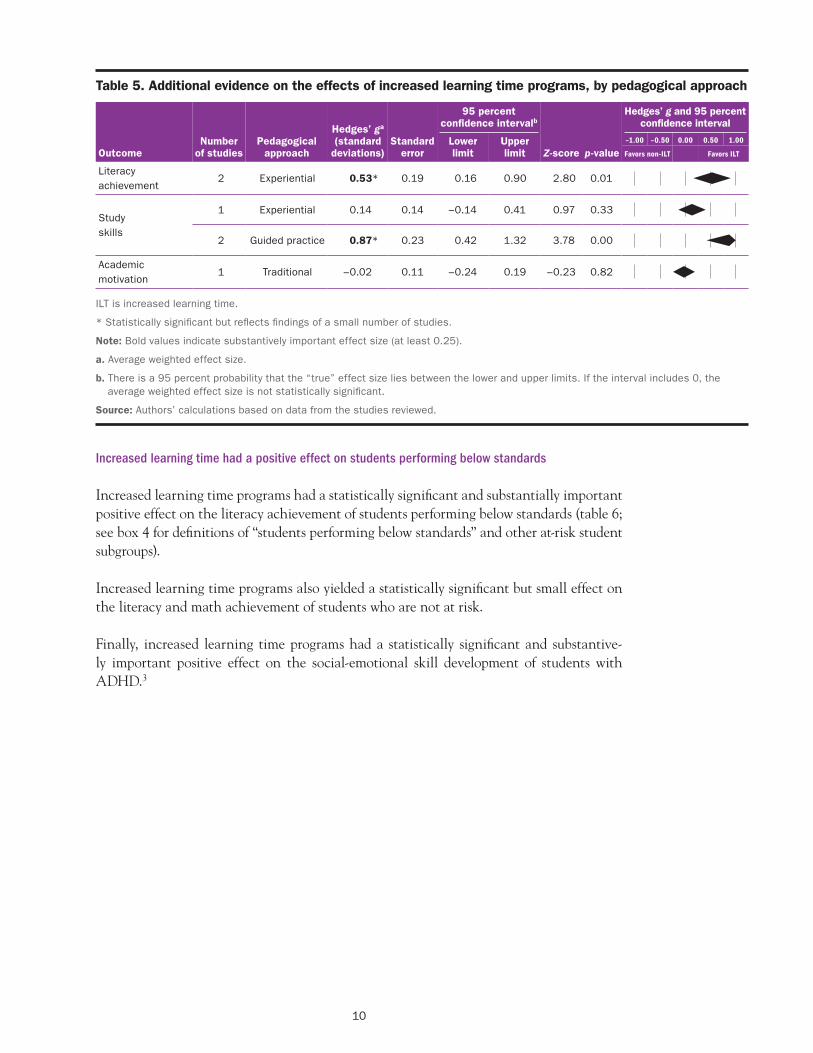
Additional evidence from a more limited research base of one or two studies suggests that expe-riential education may have a statistically significant and substantively important positive effect on literacy achievement (table 5). In addition, two studies (that focused on students with atten-tion deficit/hyperactivity disorder, ADHD) suggest that increased learning time programs that used guided practice (with academic materials such as textbooks and worksheets) may have a statistically significant and substantively important positive effect on students’ study skills.
8
Table 3. Summary effects of increased learning time programs, by instructor qualifications
Hedges’ g and 95 percent confidence interval
–1.00 –0.50 0.00 0.50 1.00
Favors non-ILT Favors ILTOutcomeNumber
of studiesInstructor
qualification
Hedges’ ga (standard
deviations)Standard
error
95 percent confidence intervalb
Lower limit
Upper limit Z‑score p‑value
Literacy achievement
6 Noncertified –0.08 0.07 –0.22 0.06 –1.08 0.28
10 Certified 0.18* 0.07 0.04 0.32 2.60 0.01
Math achievement
5 Noncertified 0.03 0.03 –0.02 0.09 1.35 0.18
5 Certified 0.09* 0.02 0.05 0.13 4.90 0.00
Academic motivation
8 Noncertified 0.04 0.02 –0.01 0.08 1.55 0.12
3 Certified 0.04 0.04 –0.03 0.11 1.05 0.29
Social-emotional skill development
9 Noncertified 0.04 0.04 –0.04 0.13 1.01 0.31
3 Certified 0.01 0.06 –0.12 0.13 0.08 0.93
ILT is increased learning time.
* Statistically significant.
a. Average weighted effect size.
b. There is a 95 percent probability that the “true” effect size lies between the lower and upper limits. If the interval includes 0, the average weighted effect size is not statistically significant.
Source: Authors’ calculations based on data from the studies reviewed.
Table 4. Summary effects of increased learning time programs, by pedagogical approach
Hedges’ g and 95 percent confidence interval
–1.00 –0.50 0.00 0.50 1.00
Favors non-ILT Favors ILTOutcomeNumber
of studiesPedagogical
approach
Hedges’ ga (standard
deviations)Standard
error
95 percent confidence intervalb
Lower limit
Upper limit p‑value
Literacy achievement
6 Guided practice –0.11 0.07 –0.25 0.03 –1.61
Z‑score
0.11
9 Traditional 0.14* 0.07 0.01 0.27 2.04 0.04
Math achievement
6 Guided practice 0.03 0.02 –0.01 0.08 1.44 0.15
4 Traditional 0.10* 0.02 0.06 0.13 5.01 0.00
Academic motivation
4 Experiential 0.06 0.04 –0.02 0.14 1.52 0.13
6 Guided practice 0.03 0.03 –0.03 0.09 1.08 0.28
Social-emotional skill development
4 Experiential 0.11* 0.01 0.09 0.13 11.32 0.00
8 Guided practice –0.02 0.02 –0.06 0.01 –1.19 0.23
ILT is increased learning time.
* Statistically significant.
a. Average weighted effect size.
b. There is a 95 percent probability that the “true” effect size lies between the lower and upper limits. If the interval includes 0, the average weighted effect size is not statistically significant.
Source: Authors’ calculations based on data from the studies reviewed.
9
Box 4. Definitions of instruction style and at‑risk student subgroups
Instruction style
Experiential education: A form of explicit instruction. It differs from traditional instruction
because it uses hands-on activities, project-based learning, and field trips as the main learn-
ing activities. Examples of experiential education activities reported in the studies reviewed
include working with lab equipment in science centers, writing for the school newspaper, and
designing projects in science and technology.
Guided practice: Instruction that provides students with time and supervision as they work
independently on their tasks. Students may interact with adults as they ask questions and
receive feedback on their work.
Traditional instruction: A form of explicit instruction and the most common instruction
approach in schools today. The teacher is responsible for the progression of activities and the
explicit instruction of the concepts and skills. Students follow directions to complete tasks,
and the teacher checks on their understanding through participation in class, student prod-
ucts, quizzes, and exams.
At‑risk student subgroups
Students from low-income households: Students enrolled in schools with high rates of student
poverty as defined by eligibility for Title I, Part A, funds.
Students performing below standards: Students performing below academic standards who
are identified based on teachers’ observations of performance in class or on district assess-
ments (for students in kindergarten–grade 2) and based on academic grades and scores on
state standardized tests and teacher concerns about academic progress (all other students).
Students with chronic behavior problems: Students with a high number and severity of dis-
ciplinary infractions on school grounds, such as disrespect for school personnel and school
property, and involvement in violent or illegal behavior.1
Students with individualized education programs: As mandated by the Individuals with Dis-
abilities Education Improvement Act, students with disabilities who are eligible for special
education services (Kleiner, Porch, & Farris, 2002). The research team reviewed studies that
included students with different types of special needs. However, only one type of disabil-
ity, attention deficit/hyperactivity disorder (ADHD), was analyzed in studies with sufficient
rigor to be included in the review. The disorder is characterized by a persistent pattern of
inattention and hyperactivity- impulsivity that is more frequently displayed and severe than is
typically observed for a specified age group. These difficulties interfere with developmentally
appropriate social and academic functioning (American Psychiatric Association, 2000). About
8.4 percent of children ages 3–17 are diagnosed with the disorder (Bloom, Cohen, & Freeman,
2012).
Note1. Because of the small number of studies that included students with behavior problems (one measuring literacy skills and another measuring social-emotional skills), it is not possible to draw conclusions about the effectiveness of increased learning time for this student subgroup. Moreover, one study focused on literacy instruction only and did not address students’ social-emotional skills, and the other study included explicit social-emotional learning instruction.
10
Table 5. Additional evidence on the effects of increased learning time programs, by pedagogical approach
Hedges’ g and 95 percent confidence interval
–1.00 –0.50 0.00 0.50 1.00
Favors non-ILT Favors ILT
95 percent confidence intervalbHedges’ ga
(standard deviations)
Number of studies
Pedagogical approach
Standard error
Lower limit
Upper limitOutcome Z‑score p‑value
Literacy achievement
2 Experiential 0.53* 0.19 0.16 0.90 2.80 0.01
Study skills
1 Experiential 0.14 0.14 –0.14 0.41 0.97 0.33
2 Guided practice 0.87* 0.23 0.42 1.32 3.78 0.00
Academic motivation
1 Traditional –0.02 0.11 –0.24 0.19 –0.23 0.82
ILT is increased learning time.
* Statistically significant but reflects findings of a small number of studies.
Note: Bold values indicate substantively important effect size (at least 0.25).
a. Average weighted effect size.
b. There is a 95 percent probability that the “true” effect size lies between the lower and upper limits. If the interval includes 0, the average weighted effect size is not statistically significant.
Source: Authors’ calculations based on data from the studies reviewed.
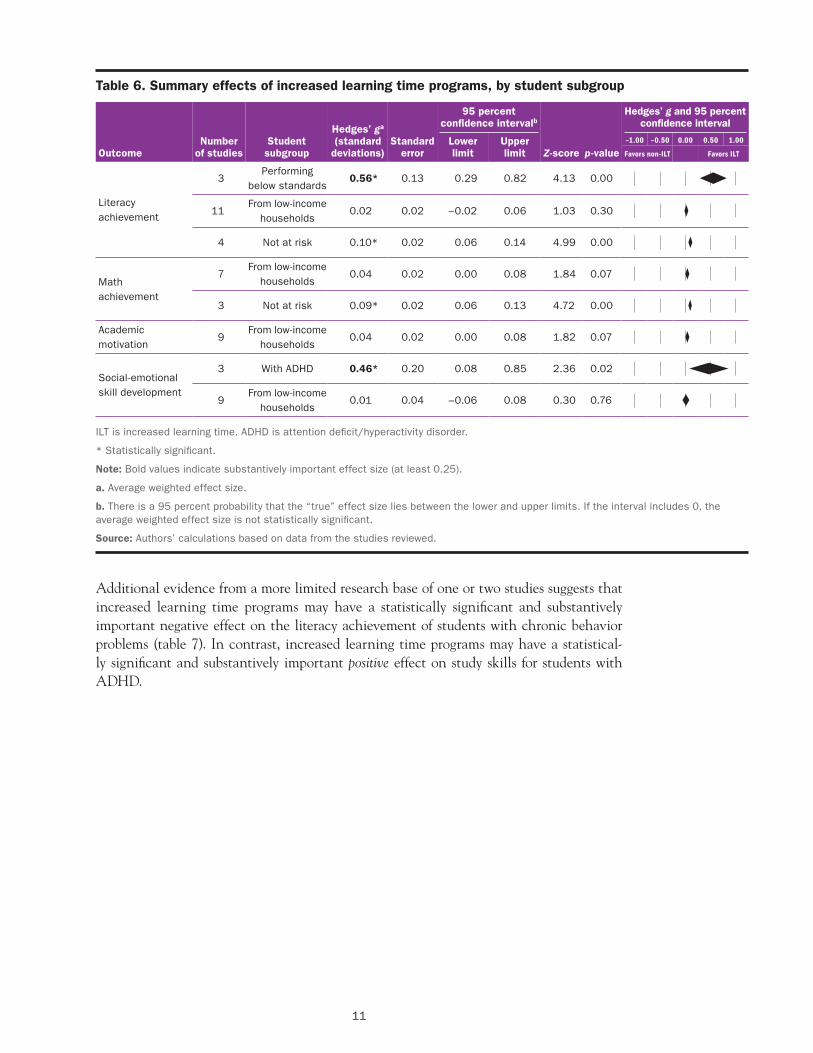
Increased learning time had a positive effect on students performing below standards
Increased learning time programs had a statistically significant and substantially important positive effect on the literacy achievement of students performing below standards (table 6; see box 4 for definitions of “students performing below standards” and other at-risk student subgroups).
Increased learning time programs also yielded a statistically significant but small effect on the literacy and math achievement of students who are not at risk.
Finally, increased learning time programs had a statistically significant and substantive-ly important positive effect on the social-emotional skill development of students with ADHD.3
11
Table 6. Summary effects of increased learning time programs, by student subgroup
Hedges’ g and 95 percent confidence interval
–1.00 –0.50 0.00 0.50 1.00
Favors non-ILT Favors ILTOutcomeNumber
of studiesStudent subgroup
Hedges’ ga (standard
deviations)Standard
error
95 percent confidence intervalb
Lower limit
Upper limit Z‑score p‑value
Literacy achievement
3Performing
below standards0.56* 0.13 0.29 0.82 4.13 0.00
11From low-income
households0.02 0.02 –0.02 0.06 1.03 0.30
4 Not at risk 0.10* 0.02 0.06 0.14 4.99 0.00
Math achievement
7From low-income
households0.04 0.02 0.00 0.08 1.84 0.07
3 Not at risk 0.09* 0.02 0.06 0.13 4.72 0.00
Academic motivation
9From low-income
households0.04 0.02 0.00 0.08 1.82 0.07
Social-emotional skill development
3 With ADHD 0.46* 0.20 0.08 0.85 2.36 0.02
9From low-income
households0.01 0.04 –0.06 0.08 0.30 0.76
ILT is increased learning time. ADHD is attention deficit/hyperactivity disorder.
* Statistically significant.
Note: Bold values indicate substantively important effect size (at least 0.25).
a. Average weighted effect size.
b. There is a 95 percent probability that the “true” effect size lies between the lower and upper limits. If the interval includes 0, the average weighted effect size is not statistically significant.
Source: Authors’ calculations based on data from the studies reviewed.
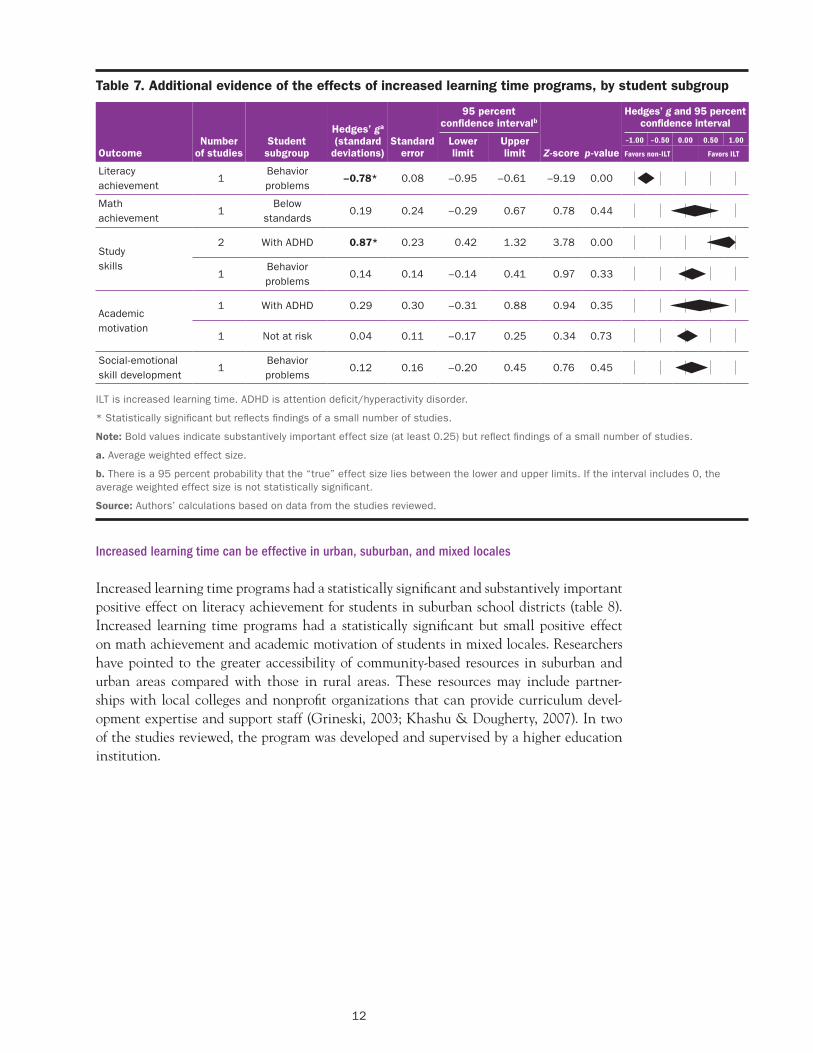
Additional evidence from a more limited research base of one or two studies suggests that increased learning time programs may have a statistically significant and substantively important negative effect on the literacy achievement of students with chronic behavior problems (table 7). In contrast, increased learning time programs may have a statistical-ly significant and substantively important positive effect on study skills for students with ADHD.
12
Table 7. Additional evidence of the effects of increased learning time programs, by student subgroup
Hedges’ g and 95 percent confidence interval
–1.00 –0.50 0.00 0.50 1.00
Favors non-ILT Favors ILTOutcomeNumber
of studiesStudent subgroup
Hedges’ ga (standard
deviations)Standard
error
95 percent confidence intervalb
Lower limit
Upper limit Z‑score p‑value
Literacy achievement
1Behavior problems
–0.78* 0.08 –0.95 –0.61 –9.19 0.00
Math achievement
1Below
standards0.19 0.24 –0.29 0.67 0.78 0.44
Study skills
2 With ADHD 0.87* 0.23 0.42 1.32 3.78 0.00
1Behavior problems
0.14 0.14 –0.14 0.41 0.97 0.33
Academic motivation
1 With ADHD 0.29 0.30 –0.31 0.88 0.94 0.35
1 Not at risk 0.04 0.11 –0.17 0.25 0.34 0.73
Social-emotional skill development
1Behavior problems
0.12 0.16 –0.20 0.45 0.76 0.45
ILT is increased learning time. ADHD is attention deficit/hyperactivity disorder.
* Statistically significant but reflects findings of a small number of studies.
Note: Bold values indicate substantively important effect size (at least 0.25) but reflect findings of a small number of studies.
a. Average weighted effect size.
b. There is a 95 percent probability that the “true” effect size lies between the lower and upper limits. If the interval includes 0, the average weighted effect size is not statistically significant.
Source: Authors’ calculations based on data from the studies reviewed.
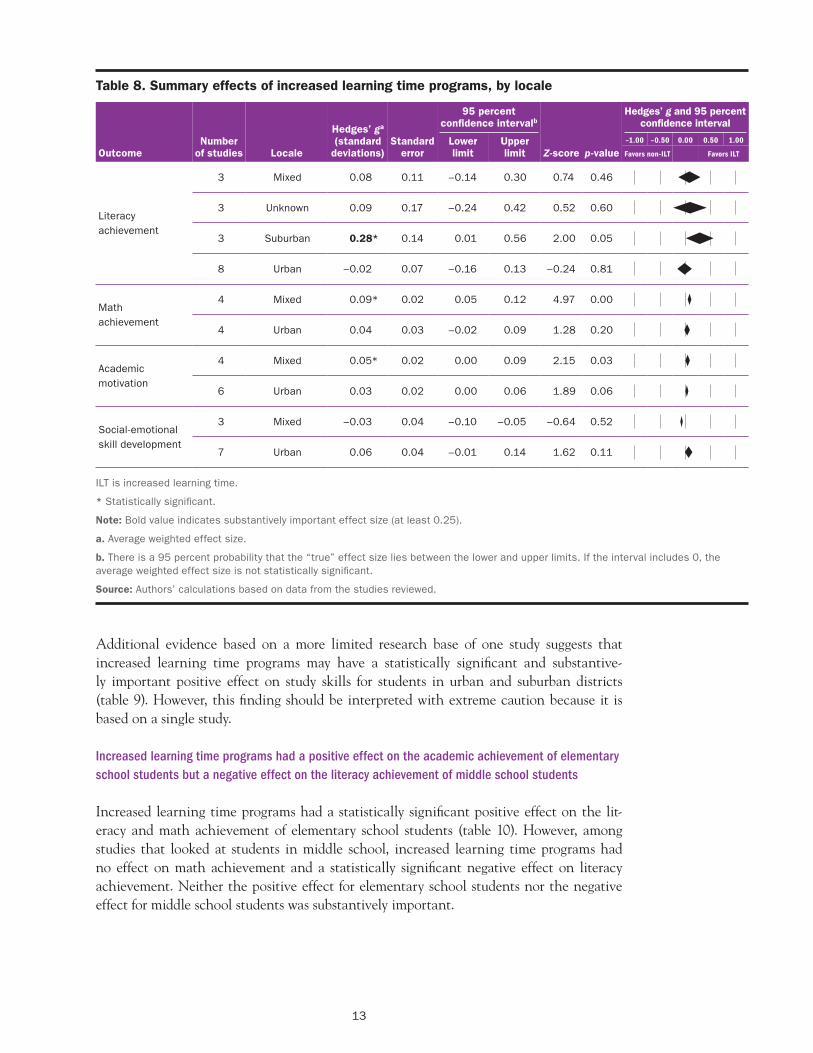
Increased learning time can be effective in urban, suburban, and mixed locales
Increased learning time programs had a statistically significant and substantively important positive effect on literacy achievement for students in suburban school districts (table 8). Increased learning time programs had a statistically significant but small positive effect on math achievement and academic motivation of students in mixed locales. Researchers have pointed to the greater accessibility of community- based resources in suburban and urban areas compared with those in rural areas. These resources may include partner-ships with local colleges and nonprofit organizations that can provide curriculum devel-opment expertise and support staff (Grineski, 2003; Khashu & Dougherty, 2007). In two of the studies reviewed, the program was developed and supervised by a higher education institution.
13
Table 8. Summary effects of increased learning time programs, by locale
Hedges’ g and 95 percent confidence interval
–1.00 –0.50 0.00 0.50 1.00
Favors non-ILT Favors ILTOutcomeNumber
of studies Locale
Hedges’ ga (standard
deviations)Standard
error
95 percent confidence intervalb
Lower limit
Upper limit Z‑score p‑value
Literacy achievement
3 Mixed 0.08 0.11 –0.14 0.30 0.74 0.46
3 Unknown 0.09 0.17 –0.24 0.42 0.52 0.60
3 Suburban 0.28* 0.14 0.01 0.56 2.00 0.05
8 Urban –0.02 0.07 –0.16 0.13 –0.24 0.81
Math achievement
4 Mixed 0.09* 0.02 0.05 0.12 4.97 0.00
4 Urban 0.04 0.03 –0.02 0.09 1.28 0.20
Academic motivation
4 Mixed 0.05* 0.02 0.00 0.09 2.15 0.03
6 Urban 0.03 0.02 0.00 0.06 1.89 0.06
Social-emotional skill development
3 Mixed –0.03 0.04 –0.10 –0.05 –0.64 0.52
7 Urban 0.06 0.04 –0.01 0.14 1.62 0.11
ILT is increased learning time.
* Statistically significant.
Note: Bold value indicates substantively important effect size (at least 0.25).
a. Average weighted effect size.
b. There is a 95 percent probability that the “true” effect size lies between the lower and upper limits. If the interval includes 0, the average weighted effect size is not statistically significant.
Source: Authors’ calculations based on data from the studies reviewed.
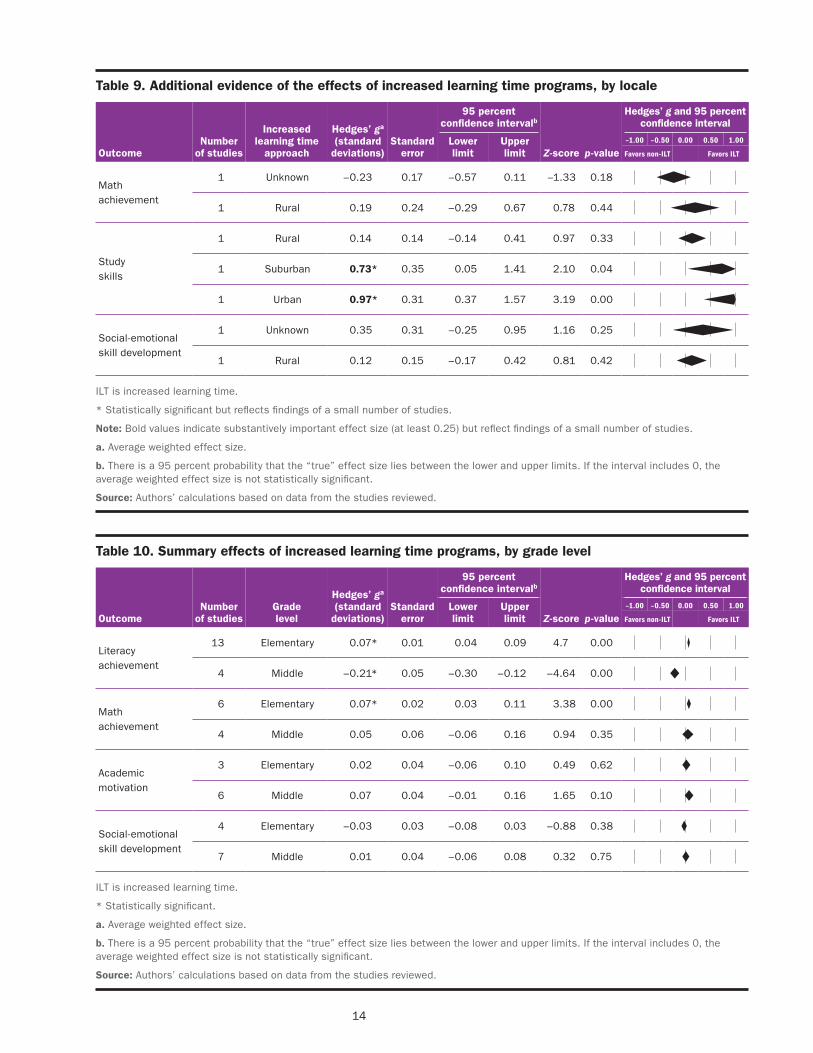
Additional evidence based on a more limited research base of one study suggests that increased learning time programs may have a statistically significant and substantive-ly important positive effect on study skills for students in urban and suburban districts (table 9). However, this finding should be interpreted with extreme caution because it is based on a single study.
Increased learning time programs had a positive effect on the academic achievement of elementary school students but a negative effect on the literacy achievement of middle school students
Increased learning time programs had a statistically significant positive effect on the lit-eracy and math achievement of elementary school students (table 10). However, among studies that looked at students in middle school, increased learning time programs had no effect on math achievement and a statistically significant negative effect on literacy achievement. Neither the positive effect for elementary school students nor the negative effect for middle school students was substantively important.
14
Table 9. Additional evidence of the effects of increased learning time programs, by locale
Hedges’ g and 95 percent confidence interval
–1.00 –0.50 0.00 0.50 1.00
Favors non-ILT Favors ILTOutcomeNumber
of studies
Increased learning time
approach
Hedges’ ga (standard
deviations)Standard
error
95 percent confidence intervalb
Lower limit
Upper limit Z‑score p‑value
Math achievement
1 Unknown –0.23 0.17 –0.57 0.11 –1.33 0.18
1 Rural 0.19 0.24 –0.29 0.67 0.78 0.44
Study skills
1 Rural 0.14 0.14 –0.14 0.41 0.97 0.33
1 Suburban 0.73* 0.35 0.05 1.41 2.10 0.04
1 Urban 0.97* 0.31 0.37 1.57 3.19 0.00
Social-emotional skill development
1 Unknown 0.35 0.31 –0.25 0.95 1.16 0.25
1 Rural 0.12 0.15 –0.17 0.42 0.81 0.42
ILT is increased learning time.
* Statistically significant but reflects findings of a small number of studies.
Note: Bold values indicate substantively important effect size (at least 0.25) but reflect findings of a small number of studies.
a. Average weighted effect size.
b. There is a 95 percent probability that the “true” effect size lies between the lower and upper limits. If the interval includes 0, the average weighted effect size is not statistically significant.
Source: Authors’ calculations based on data from the studies reviewed.
Table 10. Summary effects of increased learning time programs, by grade level
Hedges’ g and 95 percent confidence interval
–1.00 –0.50 0.00 0.50 1.00
Favors non-ILT Favors ILTOutcomeNumber
of studiesGrade level
Hedges’ ga (standard
deviations)Standard
error
95 percent confidence intervalb
Lower limit
Upper limit Z‑score p‑value
Literacy achievement
13 Elementary 0.07* 0.01 0.04 0.09 4.7 0.00
4 Middle –0.21* 0.05 –0.30 –0.12 –4.64 0.00
Math achievement
6 Elementary 0.07* 0.02 0.03 0.11 3.38 0.00
4 Middle 0.05 0.06 –0.06 0.16 0.94 0.35
Academic motivation
3 Elementary 0.02 0.04 –0.06 0.10 0.49 0.62
6 Middle 0.07 0.04 –0.01 0.16 1.65 0.10
Social-emotional skill development
4 Elementary –0.03 0.03 –0.08 0.03 –0.88 0.38
7 Middle 0.01 0.04 –0.06 0.08 0.32 0.75
ILT is increased learning time.
* Statistically significant.
a. Average weighted effect size.
b. There is a 95 percent probability that the “true” effect size lies between the lower and upper limits. If the interval includes 0, the average weighted effect size is not statistically significant.
Source: Authors’ calculations based on data from the studies reviewed.
15
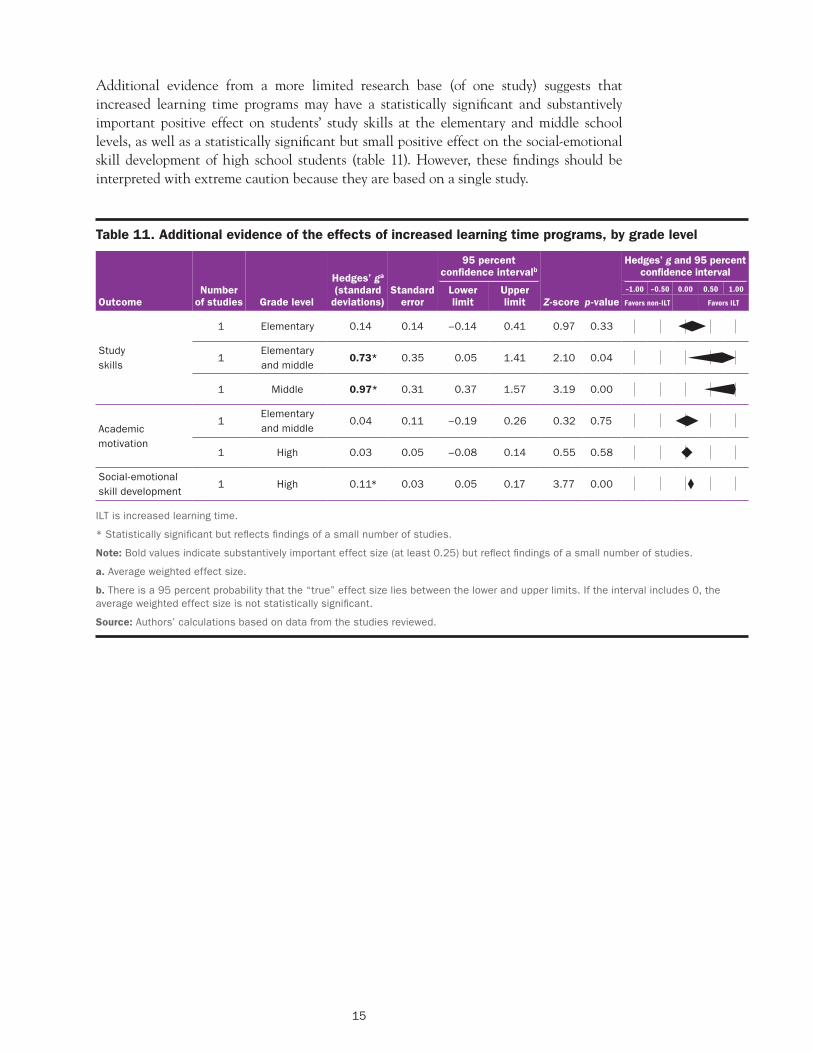
Additional evidence from a more limited research base (of one study) suggests that increased learning time programs may have a statistically significant and substantively important positive effect on students’ study skills at the elementary and middle school levels, as well as a statistically significant but small positive effect on the social-emotional skill development of high school students (table 11). However, these findings should be interpreted with extreme caution because they are based on a single study.
Table 11. Additional evidence of the effects of increased learning time programs, by grade level
Hedges’ g and 95 percent confidence interval
–1.00 –0.50 0.00 0.50 1.00
Favors non-ILT Favors ILTOutcomeNumber
of studies Grade level
Hedges’ ga (standard
deviations)Standard
error
95 percent confidence intervalb
Lower limit
Upper limit Z‑score p‑value
Study skills
1 Elementary 0.14 0.14 –0.14 0.41 0.97 0.33
1Elementary and middle
0.73* 0.35 0.05 1.41 2.10 0.04
1 Middle 0.97* 0.31 0.37 1.57 3.19 0.00
Academic motivation
1Elementary and middle
0.04 0.11 –0.19 0.26 0.32 0.75
1 High 0.03 0.05 –0.08 0.14 0.55 0.58
Social-emotional skill development
1 High 0.11* 0.03 0.05 0.17 3.77 0.00
ILT is increased learning time.
* Statistically significant but reflects findings of a small number of studies.
Note: Bold values indicate substantively important effect size (at least 0.25) but reflect findings of a small number of studies.
a. Average weighted effect size.
b. There is a 95 percent probability that the “true” effect size lies between the lower and upper limits. If the interval includes 0, the average weighted effect size is not statistically significant.
Source: Authors’ calculations based on data from the studies reviewed.
16
Implications of the study
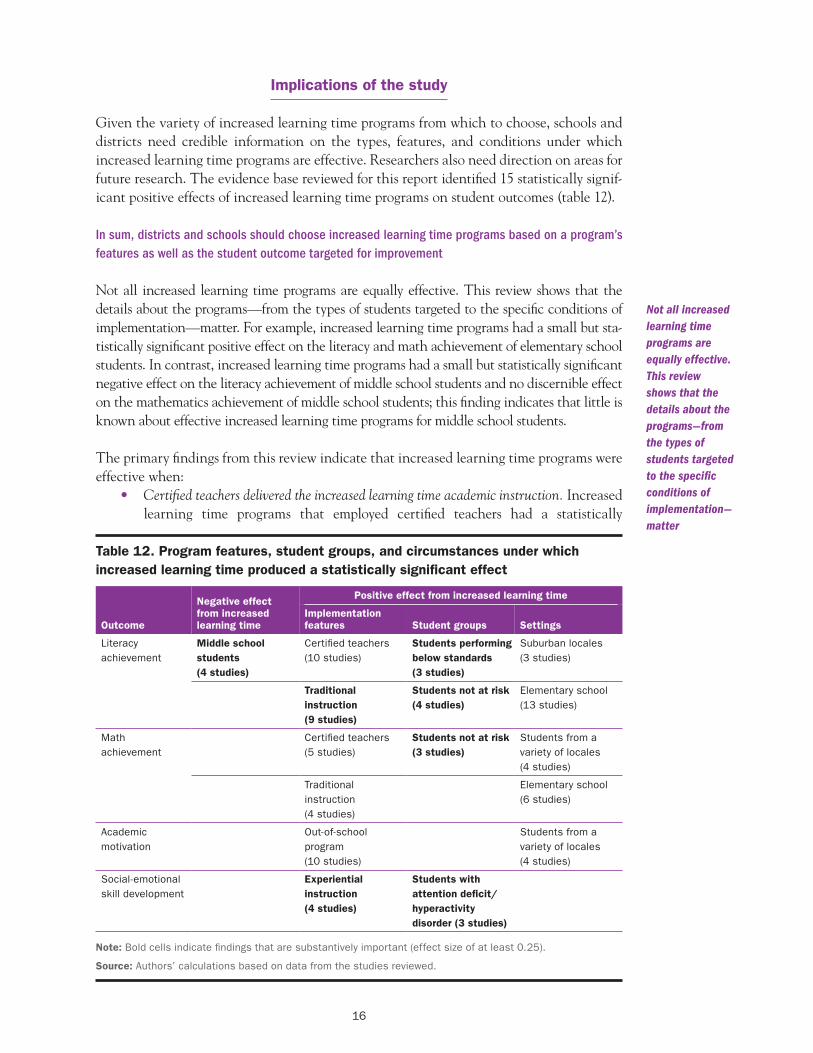
Given the variety of increased learning time programs from which to choose, schools and districts need credible information on the types, features, and conditions under which increased learning time programs are effective. Researchers also need direction on areas for future research. The evidence base reviewed for this report identified 15 statistically signif-icant positive effects of increased learning time programs on student outcomes (table 12).
In sum, districts and schools should choose increased learning time programs based on a program’s features as well as the student outcome targeted for improvement
Not all increased learning time programs are equally effective. This review shows that the details about the programs—from the types of students targeted to the specific conditions of implementation—matter. For example, increased learning time programs had a small but sta-tistically significant positive effect on the literacy and math achievement of elementary school students. In contrast, increased learning time programs had a small but statistically significant negative effect on the literacy achievement of middle school students and no discernible effect on the mathematics achievement of middle school students; this finding indicates that little is known about effective increased learning time programs for middle school students.
The primary findings from this review indicate that increased learning time programs were effective when:
• Certified teachers delivered the increased learning time academic instruction. Increased learning time programs that employed certified teachers had a statistically
Table 12. Program features, student groups, and circumstances under which increased learning time produced a statistically significant effect
Outcome
Negative effect from increased learning time
Positive effect from increased learning time
Implementationfeatures Student groups Settings
Literacy achievement
Middle school students (4 studies)
Certified teachers (10 studies)
Students performing below standards (3 studies)
Suburban locales(3 studies)
Traditional instruction (9 studies)
Students not at risk (4 studies)
Elementary school(13 studies)
Math achievement
Certified teachers (5 studies)
Students not at risk (3 studies)
Students from a variety of locales(4 studies)
Traditional instruction (4 studies)
Elementary school(6 studies)
Academic motivation
Out-of-school program (10 studies)
Students from a variety of locales(4 studies)
Social-emotional skill development
Experiential instruction (4 studies)
Students with attention deficit/hyperactivity disorder (3 studies)
Note: Bold cells indicate findings that are substantively important (effect size of at least 0.25).
Source: Authors’ calculations based on data from the studies reviewed.
Not all increased learning time programs are equally effective. This review shows that the details about the programs—from the types of students targeted to the specific conditions of implementation—matter
17
significant but small positive effect on students’ literacy achievement and math achievement. In contrast, programs that employed instructors who were not certi-fied (such as graduate students and volunteers) had no effect on students’ academic achievement.
• Program facilitators used traditional instruction. Traditional instruction includes organized and focused lessons, clear articulation of learning objectives, and a sequenced demonstration of skills. Increased learning time programs that used traditional instruction had a statistically significant but small positive effect on students’ literacy and math achievement. In contrast, programs based on guided practice (that is, time and supervision as students work independently on their tasks) without initial, explicit instruction did not improve students’ academic achievement.
• Program facilitators used experiential instruction. Experiential education uses hands-on activities, project-based learning, and field trips as the main learning activities. Increased learning time programs that incorporated experiential education had a statistically significant but small positive effect on students’ social-emotional skill development, including self-esteem, prosocial behavior, and self-regulation.
• Specific student subgroups were targeted. Broad program inclusion criteria using clas-sification categories such as “low-income households” are not sufficient to inform effective program design. In the research reviewed, effective programs targeted specific subgroups of students (for example, students performing below literacy standards) based on district, school, and program assessments and teacher reports and offered a curriculum designed to address students’ needs, such as:• Students struggling to meet grade-level standards in English language arts.
Increased learning time programs in reading and writing had a statistically significant but small positive effect on literacy achievement for students at or above academic standards and a statistically significant and substantively important positive effect on literacy achievement for students below academic standards.
• Students with ADHD. Afterschool activities for middle school students with ADHD produced a statistically significant but small positive effect on their social-emotional skill development (see caution below).
Further research is needed on increased learning time
The results of this report point to the need for additional studies to improve the knowl-edge base on increased learning time programs. Effective implementation features were identified based primarily on evaluations of increased learning time programs implement-ed outside the regular school day. Of the 30 studies in the analysis, 26 evaluated out-of-school programs and summer schools. Additional rigorous research evidence on expanded learning time schools and year-round schools is needed to inform increased learning time practices as part of the regular school schedule. Additional work is also needed to help practitioners understand the tradeoffs when adopting different types of programs.
The conclusions of the analysis reported here are based primarily on outcomes of ele-mentary and middle school students. Only one study reported an effect on high school students. Furthermore, experts suggest that increased learning time programs for high school students should be conceptualized differently from programs for elementary and middle school students in terms of goals, content, structure, and organization (Friedman &
Additional rigorous research evidence on expanded learning time schools and year-round schools is needed to inform increased learning time practices as part of the regular school schedule
18
Bleiberg, 2007). Additional rigorous research is needed on the effects of increased learning time programs on high school students’ academic and nonacademic outcomes, including their career and college readiness.
Finally, this review and meta-analysis identified only studies that examined increased learning time programs in urban and suburban locales. No recently conducted rigorous studies on the effects of increased learning time programs in rural settings were found. Future studies should examine whether the effects found for increased learning time pro-grams in urban and suburban settings apply in rural settings as well.
Study limitations
This meta-analysis used a systematic search and screening process that prevented the research team’s personal biases from affecting the findings and interpretations. Despite this strength, the review is not without limitations. First, readers can have more confidence in findings that are based on a larger number of studies (three or more). When the summary effect is based on a small number of studies (one or two), the estimates are often less stable, leading to misleading measures of effect sizes and confidence intervals.
Second, the analyses involved in examining research questions 2–5 only suggest the con-ditions under which student effects are largest. However, there are instances when the characteristics being examined are confounded with program effects, making interpreta-tion difficult (Lipsey, 2003). One example involves interpreting whether increased learn-ing time programs are especially effective at improving the study skills of students with ADHD. The same studies that looked at this relationship also noted that university staff implemented these programs. Thus, with the meta-analytic findings alone, it cannot be determined which program or student characteristic actually influenced the outcome.
A third limitation involves the limited breadth of characteristics that have been rigor-ously examined within the pool of 30 relevant and rigorous studies. Schools and districts looking to apply the findings of this report to their programs should take into consider-ation other factors that have received less attention in the research but may influence the effectiveness of their programs, such as the nature of the facility (Tanner, 2009) and program management and social climate, as indicated by supervision styles, staff turnover, and program policies pertaining to student behavior (Cross, Gottfredson, Wilson, Rorie, & Connell, 2010).

A-1
Appendix A. Research methodology
This appendix discusses the literature search and screening process, coding program char-acteristics, and the calculations and meta-analytic procedures used in the study.
Literature search and screening
Figure A1 shows a flow chart of the literature search and screening process.
The initial literature search cast a wide net to include all published and nonpublished research on increased learning time. The purpose of this extensive search was to ensure
Figure A1. Literature search and screening process
Initial pool: 7,000 studies
Screened pool: 165 studies
Final pool: 30 studies
Meta-analysis
Review of implementation characteristics(for example, duration, instructional approach, instructor qualifications)
Initial screen criteria
• Focus on increased learning time programs with academic component• Published since 1998• Journal articles, technical reports, and doctoral dissertations• Students in grades K–12• Conducted in the United States• Randomized controlled trial or quasi-experimental design
Advanced screen criteria
• Meets WWC standards (with or without reservations)• Measured and analyzed at least one student-level outcome
Researchers andfunders of increased
learning timeprograms andfoundations
Foundationand association
websitesTwelve literature
databasesInternet
search engineReferencesof reports
Source: Authors.
A-2
that the review included all the relevant research about increased learning time. This strategy identified more than 7,000 research reports.4
Five strategies were used to locate reports:
1. Used search strings in 12 literature databases (see table A1 for keywords):• Academic Search Premier.• Education Research Complete.• Education Full Text (H. W. Wilson).• ERIC.• JSTOR.• Professional Development Collection.• ProQuest.• PsycARTICLES.• PsycEXTRA.• PsycINFO.• Psychology and Behavioral Sciences Collection.• SocINDEX with Full Text.
2. Searched references of reports
Many research studies mention the results of prior evaluations. Therefore, reviewers examined the references in each of the studies located through databases search. In addition, the reviewers examined references of the meta-analysis and research review
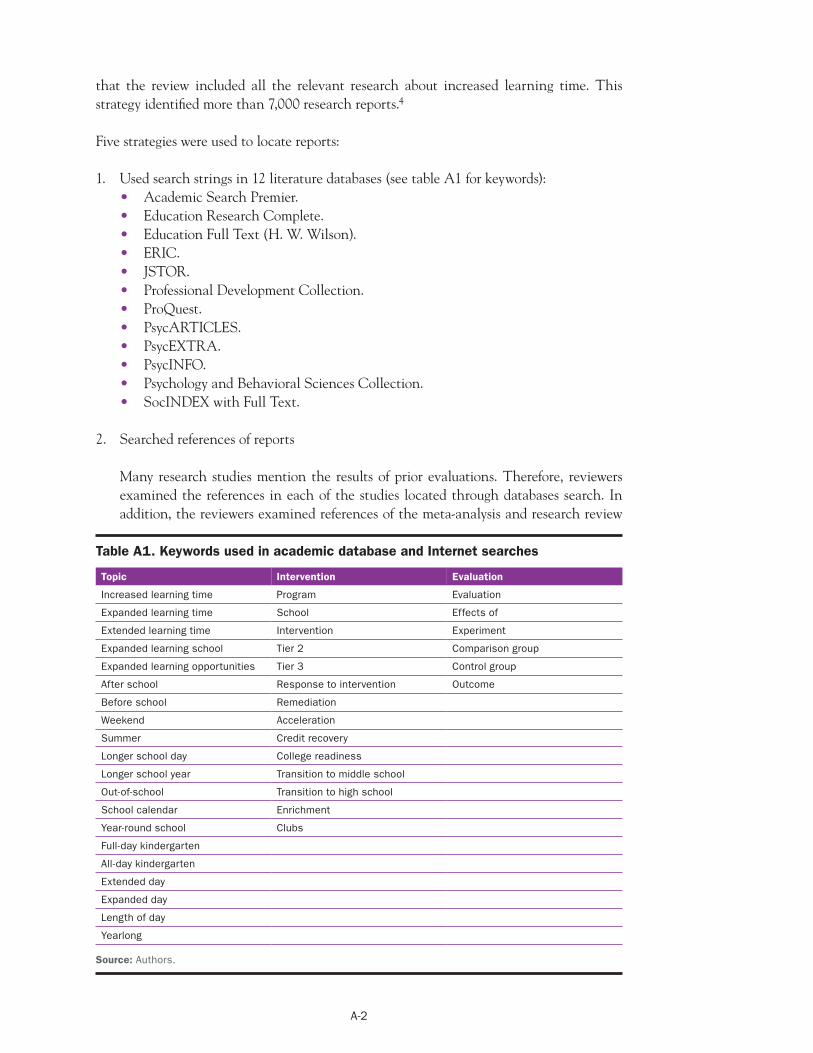
Table A1. Keywords used in academic database and Internet searches
Topic Intervention Evaluation
Increased learning time Program Evaluation
Expanded learning time School Effects of
Extended learning time Intervention Experiment
Expanded learning school Tier 2 Comparison group
Expanded learning opportunities Tier 3 Control group
After school Response to intervention Outcome
Before school Remediation
Weekend Acceleration
Summer Credit recovery
Longer school day College readiness
Longer school year Transition to middle school
Out-of-school Transition to high school
School calendar Enrichment
Year-round school Clubs
Full-day kindergarten
All-day kindergarten
Extended day
Expanded day
Length of day
Yearlong
Source: Authors.
A-3
reports (Cooper et al., 2010; Cooper et al., 2000; Beckett et al., 2009; Durlak et al., 2010; Lauer et al., 2006; Terzian et al., 2009).
3. Reviewed foundation and association websites
The review team searched websites to identify research reports and references to pub-lished articles. The list below includes the links of websites searched.• Afterschool Alliance: http://www.afterschoolalliance.org/• Center for Comprehensive School Reform and Improvement: http://www.
centerforcsri.org/• Find Youth Info: http://findyouthinfo.gov/• Harvard Family Research Project: http://www.hfrp.org/out-of-school-time• Harvard Family Research Project Out-of-School Time Program Research and Eval-
uation Database: http://www.hfrp.org/out-of-school-time/ost-database-bibliography• National Association for Year-Round Education: http://www.nayre.org/• National Center on Time and Learning: http://www.timeandlearning.org/• National Institute on Out-of-School Time: http://www.niost.org/• National Summer Learning Association: http://www.summerlearning.org/• National Network of Statewide Afterschool Networks: http://www.statewideafter
schoolnetworks.net/• Time to Succeed Coalition: http://www.timetosucceed.com/• Southern Regional Education Board: http://www.sreb.org/• U.S. Department of Education website, including the National Center for Educa-
tion Evaluation and Regional Assistance pages: http://ies.ed.gov/ncee/• The Wallace Foundation: Summer and Extended Learning Time: http://www.
wallacefoundation.org/knowledge-center/summer-and-extended-learning-time/Pages/default.aspx
4. Used Internet search engine
The same keywords used to search academic databases were also entered into the Google search engine to identify publicly available research reports.
5. Made inquiries to researchers and funders of increased learning time programs and foundations
The research team sent e-mails to increased learning time researchers and to foun-dations that have funded research on increased learning time. This data collection activity aimed to identify unpublished research.
Screening process
Study abstracts and in some cases full study reports of the more than 7,000 experimental and quasi-experimental studies identified in the literature search were reviewed. To pass the initial screen, studies had to meet several criteria to ensure that they were relevant to the topic, were relevant to the current education system, and used a quantitative research design that included a comparison group.5 This process screened out 6,835 studies, leaving 165 studies that progressed to advanced screening.
A-4
To be included in the review, a study had to meet the following relevancy criteria:• Topic relevance. The report had to summarize a study about the effect of an
increased learning time program or school on student outcomes. Eligible increased learning time programs included expanded learning time schools (schools that add to the state-required minimum annual instruction hours by lengthening the school day, week, or year) and out-of-school programs that included academic instruction (out-of-school programs that included only sports activities were not eligible for review, nor were afterschool care programs that included homework help but no purposeful academic instruction). Evaluations of multicomponent educational initiatives (such as evaluations of charter schools) in which the effects of increased learning time cannot be disentangled were excluded from the review.
• Timeframe relevance. The scope of the review was limited to reports of studies made available since 1998. This timeframe complements earlier reviews on similar topics conducted in the 1990s and is more relevant to the current education system; bud-getary constraints prohibited reviewing studies published earlier.
• Publication status. To be reviewed, a study report could be published or unpub-lished.6 In either case the manuscript had to be considered final by the study authors (versions labeled “draft” were not reviewed).
• Sample relevance. The study had to satisfy two sample-related criteria:• Grade levels. The study assessed outcomes of K–12 students. Studies assessing
preschool students only were not eligible for inclusion. Studies that assessed outcomes of college students were included if the intervention evaluated was conducted within the range of K–12 grade levels (for example, a high school summer bridge program to promote academic outcomes during the freshman year in college).
• Location of the intervention. Eligible studies included samples in the United States or its territories. Because of the difference in formal and informal edu-cation systems internationally, studies conducted outside the United States were considered as outside the scope of the review.
• Design relevance. The report had to summarize a study that included a counter-factual condition (defined as a likely result had students not been exposed to the program).
The results of the initial screening were documented in a database that tracked the bib-liographic information of all studies screened. A trained researcher sorted and organized the database to ensure that multiple reports of the same study were linked together to avoid duplication in review.
The second step of the screening process focused on the studies’ methodologies to identify those that could reliably assess causal relationships between increased learning time and student outcomes. Eligible studies also had to meet evidence standards established by the What Works Clearinghouse (WWC)7 and to analyze outcomes at the student level (as opposed to the school level).8 Reviewers certified to perform reviews for the WWC con-ducted the advanced screening and identified the studies that met WWC standards (see below).
A-5
The following criteria were used in the advance screen:
1. Study meets WWC standards (with or without reservations).• Full reports. Full reports were required for the completion of the advanced screen-
ing. When shortened project summaries (such as research briefs, Web-based sum-maries, and nontechnical summaries) were identified in searches, the literature review team attempted to find the full technical version of the report and base its eligibility on that version.
• Study design relevance. Only empirical studies that used quantitative methods and inferential statistical analysis and that met WWC standards or met WWC stan-dards with reservations were included. Studies met WWC standards if they ran-domly assigned units (students, classrooms, teachers, or schools) to experimental conditions and showed low overall attrition of units from the study and low differ-ential attrition from the study (that is, units from one group discontinue study at higher rate than another experimental group). Studies met WWC standards with reservations if they were a group design (involving two or more groups, including groups from randomized controlled trials studies with high overall or differential attrition or naturally occurring groups with one exposed to the program and one not exposed to the program) and demonstrated that the groups were equivalent on a measure of the outcome at baseline.
• Reliability and validity of outcome measures. Only findings from outcome mea-sures that were reliable and valid and not overaligned with the intervention were included. Reliability was indicated by internal consistency (minimum of 0.60; Cronbach’s alpha), temporal stability/test-retest reliability (minimum of 0.40), or interrater reliability (minimum of 0.50; percent agreement, correlation, Cohen’s kappa). Validity refers to whether a measure assesses what it is supposed to measure for the intended purpose; it was determined based on a description or sample items of the measure. Overalignment of measures is evident when an outcome measure assesses constructs that are explicitly used in the intervention. Most measures of academic constructs (that is, achievement on assessments, graduation rates, and school attendance rates) were eligible for inclusion in the review. However, student grades, grade point averages, and office referrals were not considered as reliable or valid due to variations in how they are defined and practiced across schools.
2. Study measured and analyzed at least one student-level outcome. Classroom- level and school- level effect size were regarded as noncomparable to student-level effect size and could not be averaged together to estimate mean weighted effect sizes. Therefore, studies that reported classroom-level or school-level data only were excluded from the review.
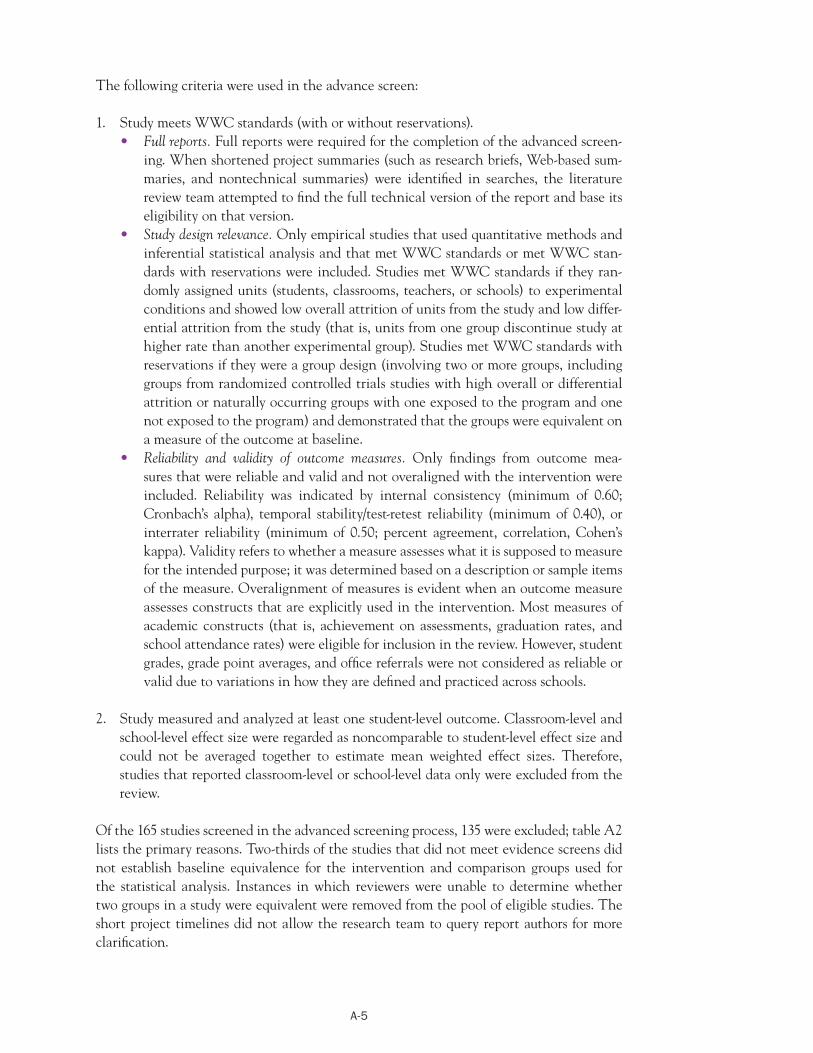
Of the 165 studies screened in the advanced screening process, 135 were excluded; table A2 lists the primary reasons. Two-thirds of the studies that did not meet evidence screens did not establish baseline equivalence for the intervention and comparison groups used for the statistical analysis. Instances in which reviewers were unable to determine whether two groups in a study were equivalent were removed from the pool of eligible studies. The short project timelines did not allow the research team to query report authors for more clarification.
A-6
Table A2. Reasons for excluding studies during the advanced screening process
Primary reason for exclusion
Number of studies excluded
Share of total
(percent)aBaseline equivalence was not demonstrated. 91 67
The study did not use a “business-as-usual” comparison group. 16 12
There was only one unit assigned to one or both conditions (confounding). 7 5
The increased learning time program did not include an academic component. 5 4
Analysis did not use student-level data. 4 3
Increased learning time is not the main program component. 3 2
The study used a regression discontinuity design. 2 1
Participants were not enrolled in grades K–12 during the study. 2 1
The increased learning time program was not conducted in a group setting. 2 1
The study was conducted outside the United States. 1 1
The outcome measures were not shown to be valid and reliable. 1 1
None of the outcome measures fall within the scope of this review. 1 1
Total 135 100
a. According to What Works Clearinghouse standards, baseline equivalence should be demonstrated for quasi-experimental design studies as well as randomized controlled trials with high attrition or randomization problems.
Source: Authors.
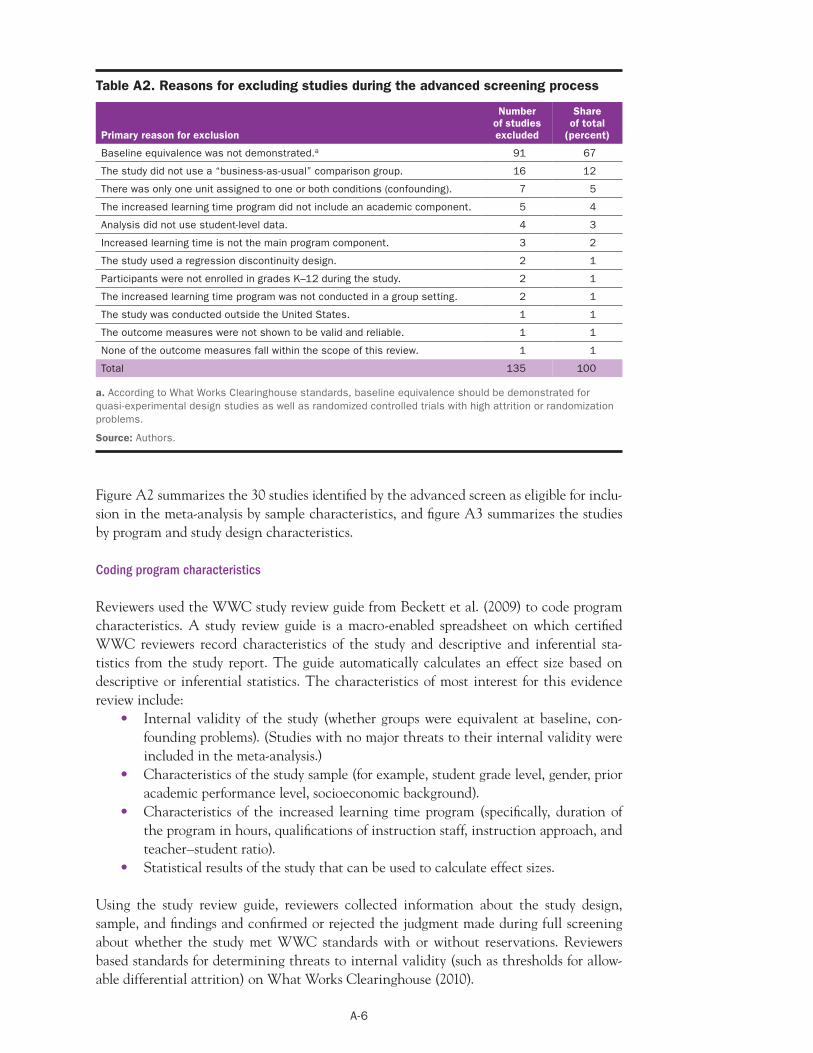
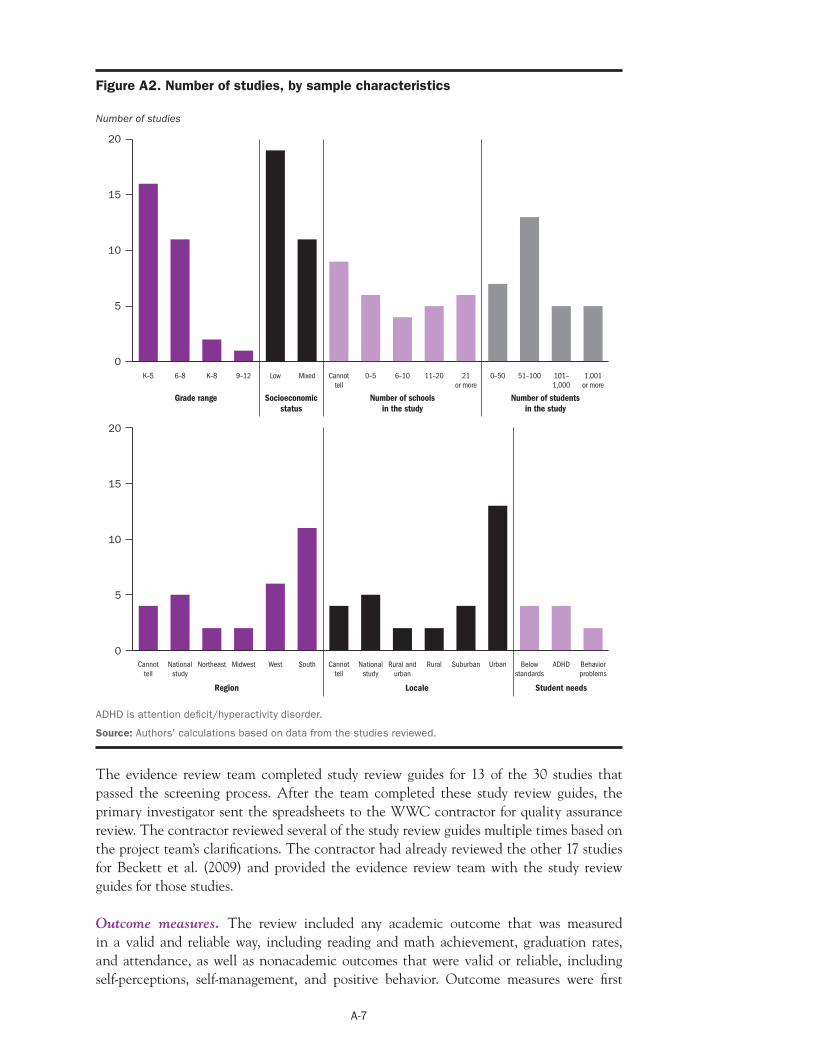
Figure A2 summarizes the 30 studies identified by the advanced screen as eligible for inclu-sion in the meta-analysis by sample characteristics, and figure A3 summarizes the studies by program and study design characteristics.
Coding program characteristics
Reviewers used the WWC study review guide from Beckett et al. (2009) to code program characteristics. A study review guide is a macro-enabled spreadsheet on which certified WWC reviewers record characteristics of the study and descriptive and inferential sta-tistics from the study report. The guide automatically calculates an effect size based on descriptive or inferential statistics. The characteristics of most interest for this evidence review include:
• Internal validity of the study (whether groups were equivalent at baseline, con-founding problems). (Studies with no major threats to their internal validity were included in the meta-analysis.)
• Characteristics of the study sample (for example, student grade level, gender, prior academic performance level, socioeconomic background).
• Characteristics of the increased learning time program (specifically, duration of the program in hours, qualifications of instruction staff, instruction approach, and teacher–student ratio).
• Statistical results of the study that can be used to calculate effect sizes.
Using the study review guide, reviewers collected information about the study design, sample, and findings and confirmed or rejected the judgment made during full screening about whether the study met WWC standards with or without reservations. Reviewers based standards for determining threats to internal validity (such as thresholds for allow-able differential attrition) on What Works Clearinghouse (2010).
A-7
Figure A2. Number of studies, by sample characteristics
Number of studies
0
5
10
15
20
1,001or more
101–1,000
51–1000–5021or more
11–206–100–5Cannottell
MixedLow9–12K–86–8K–5
Number of studentsin the study
Number of schoolsin the study
Socioeconomicstatus
Grade range
0
5
10
15
20
Behaviorproblems
ADHDBelowstandards
UrbanSuburbanRuralRural andurban
Nationalstudy
Cannottell
SouthWestMidwestNortheastNationalstudy
Cannottell
Region Locale Student needs
ADHD is attention deficit/hyperactivity disorder.
Source: Authors’ calculations based on data from the studies reviewed.
The evidence review team completed study review guides for 13 of the 30 studies that passed the screening process. After the team completed these study review guides, the primary investigator sent the spreadsheets to the WWC contractor for quality assurance review. The contractor reviewed several of the study review guides multiple times based on the project team’s clarifications. The contractor had already reviewed the other 17 studies for Beckett et al. (2009) and provided the evidence review team with the study review guides for those studies.
Outcome measures. The review included any academic outcome that was measured in a valid and reliable way, including reading and math achievement, graduation rates, and attendance, as well as nonacademic outcomes that were valid or reliable, including self- perceptions, self-management, and positive behavior. Outcome measures were first
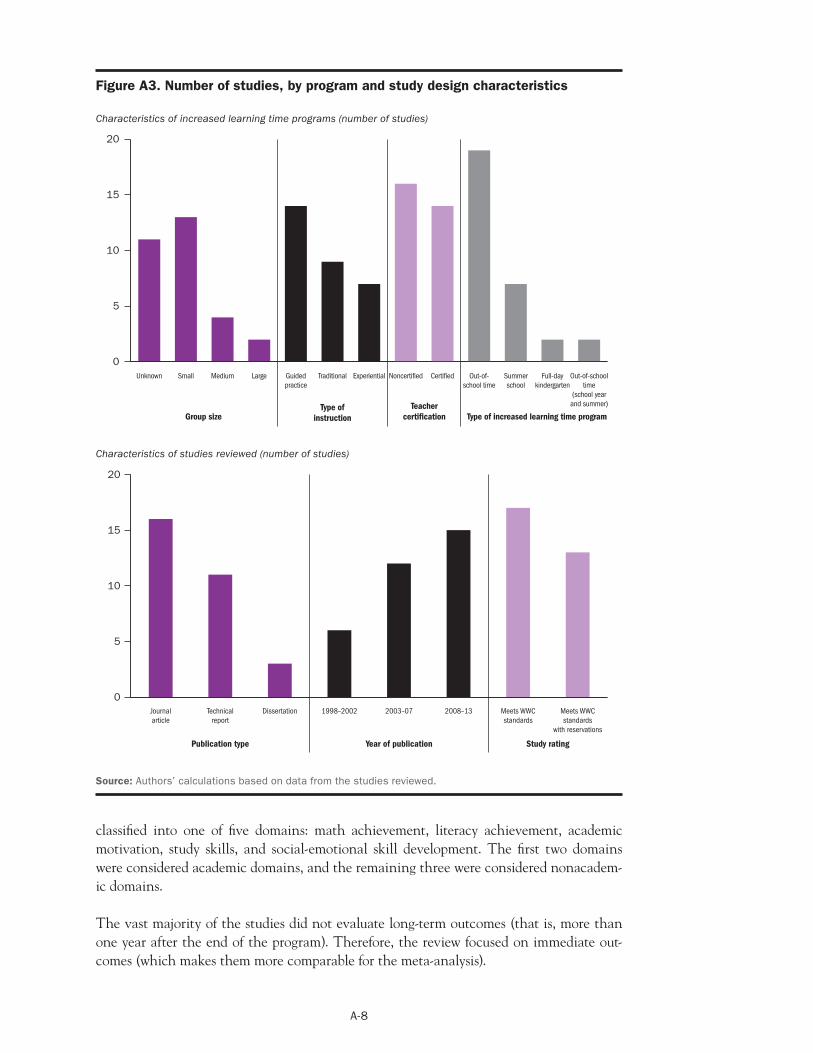
A-8
Figure A3. Number of studies, by program and study design characteristics
Characteristics of increased learning time programs (number of studies)
0
5
10
15
20
Out-of-schooltime
(school yearand summer)
Full-daykindergarten
Summerschool
Out-of-school time
CertifiedNoncertifiedExperientialTraditionalGuidedpractice
LargeMediumSmallUnknown
Type of increased learning time programTeacher
certificationType of
instructionGroup size
0
5
10
15
20
Meets WWCstandards
with reservations
Meets WWCstandards
2008–132003–071998–2002DissertationTechnicalreport
Journalarticle
Publication type Year of publication Study rating
Characteristics of studies reviewed (number of studies)
Source: Authors’ calculations based on data from the studies reviewed.
classified into one of five domains: math achievement, literacy achievement, academic motivation, study skills, and social-emotional skill development. The first two domains were considered academic domains, and the remaining three were considered nonacadem-ic domains.
The vast majority of the studies did not evaluate long-term outcomes (that is, more than one year after the end of the program). Therefore, the review focused on immediate out-comes (which makes them more comparable for the meta-analysis).
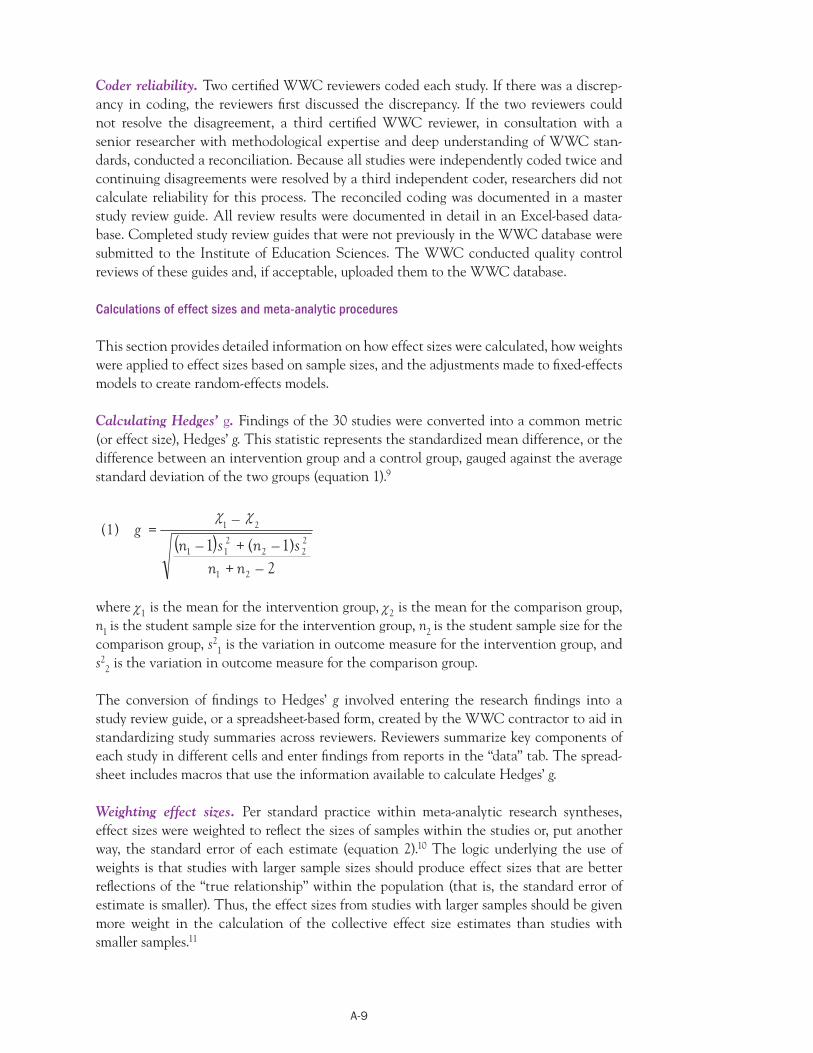
A-9
Coder reliability. Two certified WWC reviewers coded each study. If there was a discrep-ancy in coding, the reviewers first discussed the discrepancy. If the two reviewers could not resolve the disagreement, a third certified WWC reviewer, in consultation with a senior researcher with methodological expertise and deep understanding of WWC stan-dards, conducted a reconciliation. Because all studies were independently coded twice and continuing disagreements were resolved by a third independent coder, researchers did not calculate reliability for this process. The reconciled coding was documented in a master study review guide. All review results were documented in detail in an Excel-based data-base. Completed study review guides that were not previously in the WWC database were submitted to the Institute of Education Sciences. The WWC conducted quality control reviews of these guides and, if acceptable, uploaded them to the WWC database.
Calculations of effect sizes and meta-analytic procedures
This section provides detailed information on how effect sizes were calculated, how weights were applied to effect sizes based on sample sizes, and the adjustments made to fixed-effects models to create random-effects models.
Calculating Hedges’ g. Findings of the 30 studies were converted into a common metric (or effect size), Hedges’ g. This statistic represents the standardized mean difference, or the difference between an intervention group and a control group, gauged against the average standard deviation of the two groups (equation 1).9
(1) ( )
2)1(1
21
222
211
21
–+–+–
–=
nnsnsn
g
where χ1 is the mean for the intervention group, χ2 is the mean for the comparison group, n1 is the student sample size for the intervention group, n2 is the student sample size for the comparison group, s2
1 is the variation in outcome measure for the intervention group, and s2
2 is the variation in outcome measure for the comparison group.
The conversion of findings to Hedges’ g involved entering the research findings into a study review guide, or a spreadsheet-based form, created by the WWC contractor to aid in standardizing study summaries across reviewers. Reviewers summarize key components of each study in different cells and enter findings from reports in the “data” tab. The spread-sheet includes macros that use the information available to calculate Hedges’ g.
Weighting effect sizes. Per standard practice within meta-analytic research syntheses, effect sizes were weighted to reflect the sizes of samples within the studies or, put another way, the standard error of each estimate (equation 2).10 The logic underlying the use of weights is that studies with larger sample sizes should produce effect sizes that are better reflections of the “true relationship” within the population (that is, the standard error of estimate is smaller). Thus, the effect sizes from studies with larger samples should be given more weight in the calculation of the collective effect size estimates than studies with smaller samples.11
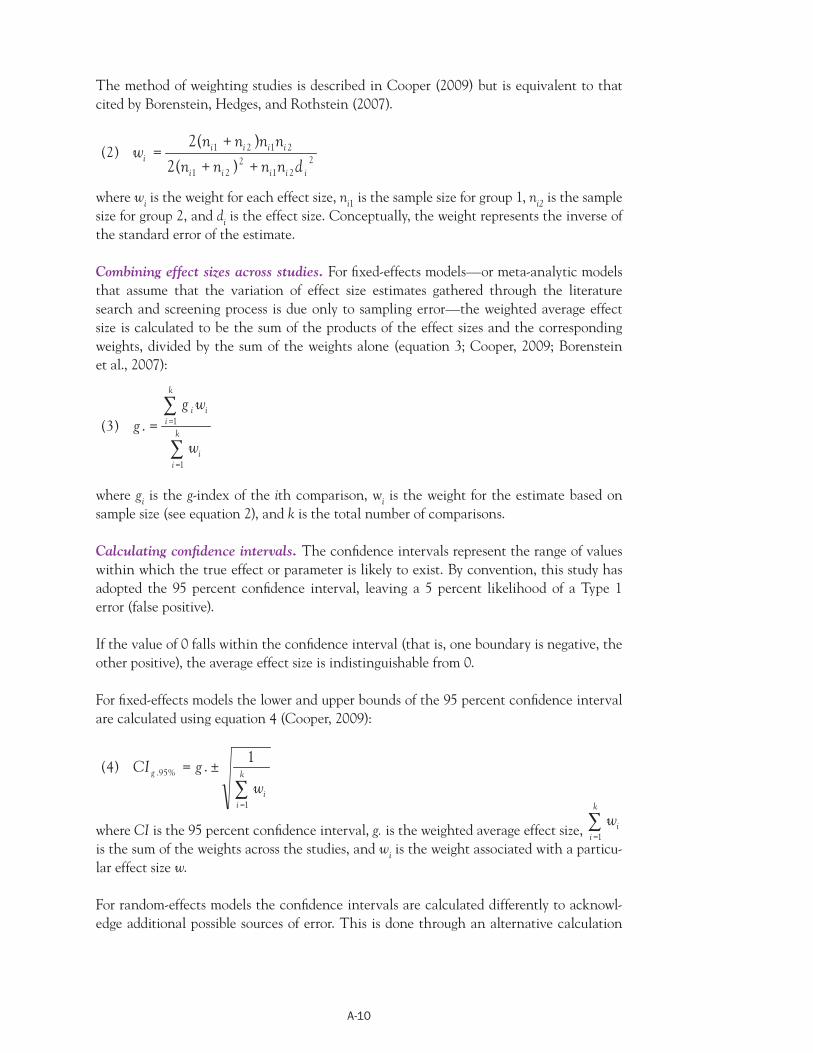
A-10
The method of weighting studies is described in Cooper (2009) but is equivalent to that cited by Borenstein, Hedges, and Rothstein (2007).
(2) 2
212
21
2121
)(2
)(2
iiiii
iiiii
dnnnn
nnnnw
++
+=
where wi is the weight for each effect size, ni1 is the sample size for group 1, ni2 is the sample size for group 2, and di is the effect size. Conceptually, the weight represents the inverse of the standard error of the estimate.
Combining effect sizes across studies. For fixed-effects models—or meta-analytic models that assume that the variation of effect size estimates gathered through the literature search and screening process is due only to sampling error—the weighted average effect size is calculated to be the sum of the products of the effect sizes and the corresponding weights, divided by the sum of the weights alone (equation 3; Cooper, 2009; Borenstein et al., 2007):
(3)
=
==k
ii
k
iii
w
wgg
1
1.
where gi is the g-index of the ith comparison, wi is the weight for the estimate based on sample size (see equation 2), and k is the total number of comparisons.
Calculating confidence intervals. The confidence intervals represent the range of values within which the true effect or parameter is likely to exist. By convention, this study has adopted the 95 percent confidence interval, leaving a 5 percent likelihood of a Type 1 error (false positive).
If the value of 0 falls within the confidence interval (that is, one boundary is negative, the other positive), the average effect size is indistinguishable from 0.
For fixed-effects models the lower and upper bounds of the 95 percent confidence interval are calculated using equation 4 (Cooper, 2009):
(4)
=
±=k
ii
g
wgCI
1
%95.1
.
k
wwhere CI is the 95 percent confidence interval, g. is the weighted average effect size, i
i =1 is the sum of the weights across the studies, and wi is the weight associated with a particu-lar effect size w.
For random-effects models the confidence intervals are calculated differently to acknowl-edge additional possible sources of error. This is done through an alternative calculation
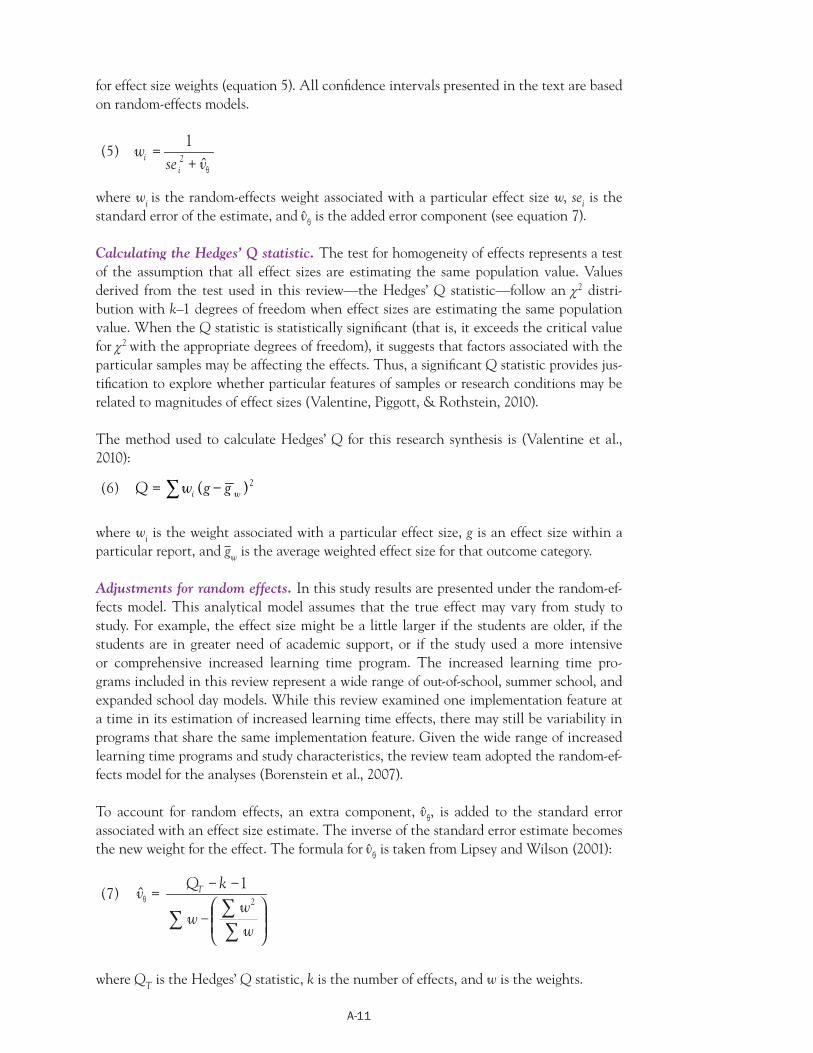
A-11
for effect size weights (equation 5). All confidence intervals presented in the text are based on random-effects models.
(5) vse
wi
i ˆ1
2 +=
where wi is the random-effects weight associated with a particular effect size w, sei is the standard error of the estimate, and v̂θ is the added error component (see equation 7).
Calculating the Hedges’ Q statistic. The test for homogeneity of effects represents a test of the assumption that all effect sizes are estimating the same population value. Values derived from the test used in this review—the Hedges’ Q statistic—follow an χ2 distri-bution with k–1 degrees of freedom when effect sizes are estimating the same population value. When the Q statistic is statistically significant (that is, it exceeds the critical value for χ2 with the appropriate degrees of freedom), it suggests that factors associated with the particular samples may be affecting the effects. Thus, a significant Q statistic provides jus-tification to explore whether particular features of samples or research conditions may be related to magnitudes of effect sizes (Valentine, Piggott, & Rothstein, 2010).
The method used to calculate Hedges’ Q for this research synthesis is (Valentine et al., 2010):
(6) 2)( wi ggwQ −=
where wi is the weight associated with a particular effect size, g is an effect size within a particular report, and gw is the average weighted effect size for that outcome category.
Adjustments for random effects. In this study results are presented under the random-ef-fects model. This analytical model assumes that the true effect may vary from study to study. For example, the effect size might be a little larger if the students are older, if the students are in greater need of academic support, or if the study used a more intensive or comprehensive increased learning time program. The increased learning time pro-grams included in this review represent a wide range of out-of-school, summer school, and expanded school day models. While this review examined one implementation feature at a time in its estimation of increased learning time effects, there may still be variability in programs that share the same implementation feature. Given the wide range of increased learning time programs and study characteristics, the review team adopted the random-ef-fects model for the analyses (Borenstein et al., 2007).
To account for random effects, an extra component, v̂θ, is added to the standard error associated with an effect size estimate. The inverse of the standard error estimate becomes the new weight for the effect. The formula for v̂θ is taken from Lipsey and Wilson (2001):
(7)
−
−−=
ww
w
kQv T
2
1ˆ
where QT is the Hedges’ Q statistic, k is the number of effects, and w is the weights.
A-12
v̂θ was recalculated for each point estimate, even when point estimates were calculated for categories of studies (Borenstein, Hedges, Higgins, & Rothstein, 2005).
In practice, adding the additional error to the standard error has two effects. First, it reduces the impact of the sample size weights on the average weighted effect size. Second, it increases the confidence interval around the average effect size, thereby making it less likely to find a significant effect.
Sensitivity testing of average weighted effect sizes (summary effect). To test the robust-ness of summary effects, analyses involving four or more effect sizes were rerun after first making adjustments to the tails of the distribution of effect sizes. One adjustment involved a 10 percent cut (removing the most extreme 5 percent of effect sizes from both positive and negative tails of distribution, with a minimum of one effect size per tail). Another adjustment involved fixing the most extreme 5 percent from each tail of the distribution of effect sizes to the same value as the next nearest effect size (called a 10 percent Win-sorizing). Winsorizing is a common technique in meta-analysis that is used to ensure that extreme values do not distort the results (Lipsey & Wilson, 2001).
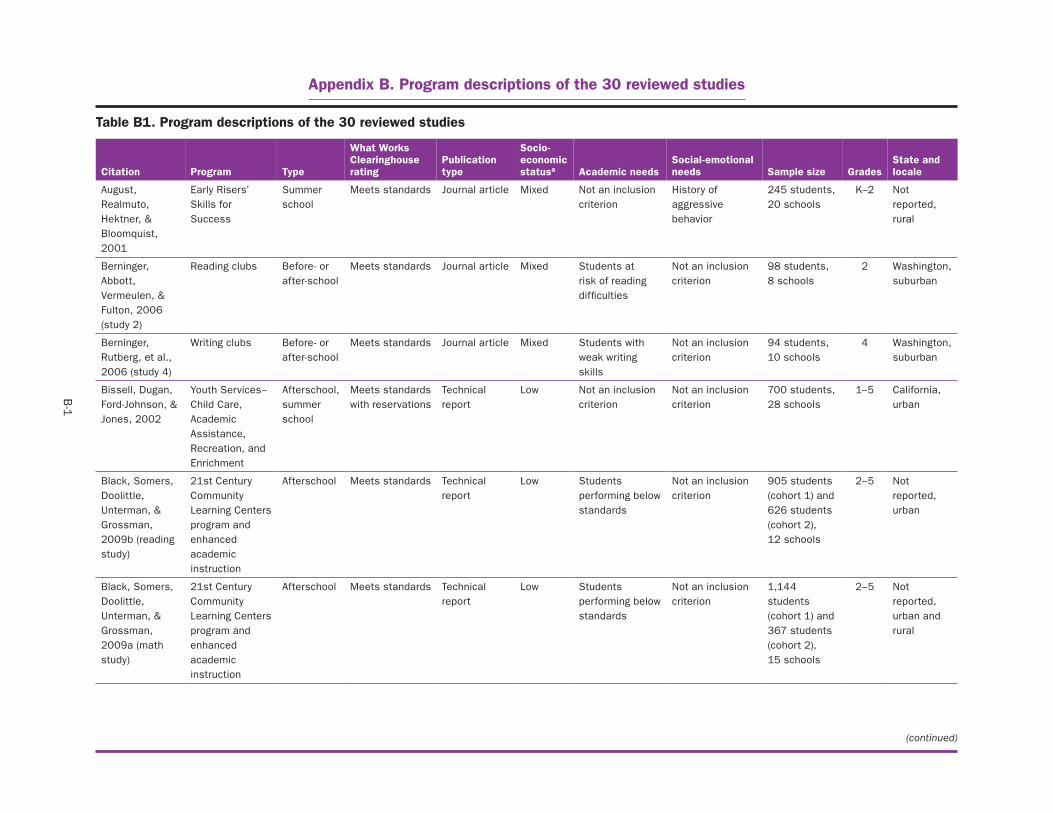
B-1
Appendix B. Program descriptions of the 30 reviewed studies
Table B1. Program descriptions of the 30 reviewed studies
Citation Program Type
What Works Clearinghouse rating
Publication type
Socio‑economic statusa Academic needs
Social‑emotional needs Sample size Grades
State and locale
August, Realmuto, Hektner, & Bloomquist, 2001
Early Risers’ Skills for Success
Summer school
Meets standards Journal article Mixed Not an inclusion criterion
History of aggressive behavior
245 students, 20 schools
K–2 Not reported, rural
Berninger, Abbott, Vermeulen, & Fulton, 2006 (study 2)
Reading clubs Before- or after-school
Meets standards Journal article Mixed Students at risk of reading difficulties
Not an inclusion criterion
98 students, 8 schools
2 Washington, suburban
Berninger, Rutberg, et al., 2006 (study 4)
Writing clubs Before- or after-school
Meets standards Journal article Mixed Students with weak writing skills
Not an inclusion criterion
94 students, 10 schools
4 Washington, suburban
Bissell, Dugan, Ford-Johnson, & Jones, 2002
Youth Services–Child Care, Academic Assistance, Recreation, and Enrichment
Afterschool, summer school
Meets standards with reservations
Technical report
Low Not an inclusion criterion
Not an inclusion criterion
700 students, 28 schools
1–5 California, urban
Black, Somers, Doolittle, Unterman, & Grossman, 2009b (reading study)
21st Century Community Learning Centers program and enhanced academic instruction
Afterschool Meets standards Technical report
Low Students performing below standards
Not an inclusion criterion
905 students (cohort 1) and 626 students (cohort 2), 12 schools
2–5 Not reported, urban
Black, Somers, Doolittle, Unterman, & Grossman, 2009a (math study)
21st Century Community Learning Centers program and enhanced academic instruction
Afterschool Meets standards Technical report
Low Students performing below standards
Not an inclusion criterion
1,144 students (cohort 1) and 367 students (cohort 2), 15 schools
2–5 Not reported, urban and rural
(continued)
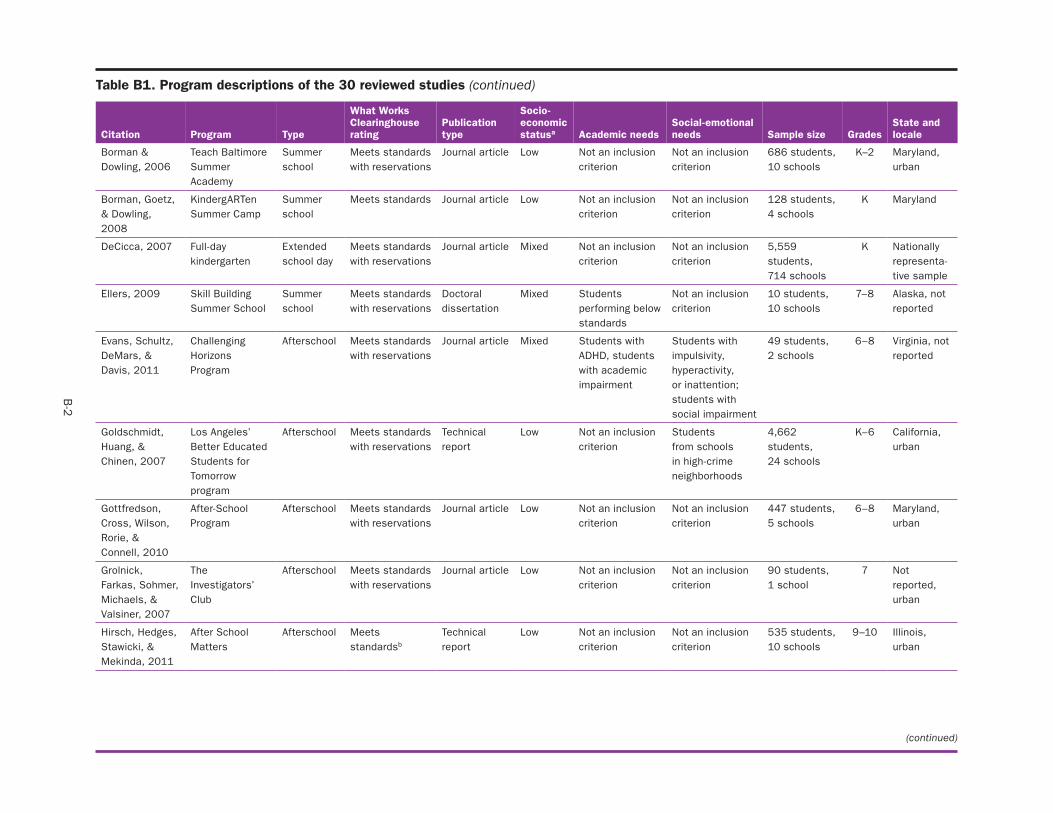
B-2
Table B1. Program descriptions of the 30 reviewed studies (continued)
Citation
Borman & Dowling, 2006
Program
Teach Baltimore Summer Academy
Type
Summer school
What Works Clearinghouse rating
Meets standards with reservations
Publication type
Journal article
Socio‑economic statusa
Low
Academic needs
Not an inclusion criterion
Social‑emotional needs
Not an inclusion criterion
Sample size
686 students, 10 schools
Grades
K–2
State and locale
Maryland, urban
Borman, Goetz, & Dowling, 2008
KindergARTen Summer Camp
Summer school
Meets standards Journal article Low Not an inclusion criterion
Not an inclusion criterion
128 students, 4 schools
K Maryland
DeCicca, 2007 Full-day kindergarten
Extended school day
Meets standards with reservations
Journal article Mixed Not an inclusion criterion
Not an inclusion criterion
5,559 students, 714 schools
K Nationally representa-tive sample
Ellers, 2009 Skill Building Summer School
Summer school
Meets standards with reservations
Doctoral dissertation
Mixed Students performing below standards
Not an inclusion criterion
10 students, 10 schools
7–8 Alaska, not reported
Evans, Schultz, DeMars, & Davis, 2011
Challenging Horizons Program
Afterschool Meets standards with reservations
Journal article Mixed Students with ADHD, students with academic impairment
Students with impulsivity, hyperactivity, or inattention; students with social impairment
49 students, 2 schools
6–8 Virginia, not reported
Goldschmidt, Huang, & Chinen, 2007
Los Angeles’ Better Educated Students for Tomorrow program
Afterschool Meets standards with reservations
Technical report
Low Not an inclusion criterion
Students from schools in high-crime neighborhoods
4,662 students, 24 schools
K–6 California, urban
Gottfredson, Cross, Wilson, Rorie, & Connell, 2010
After-School Program
Afterschool Meets standards with reservations
Journal article Low Not an inclusion criterion
Not an inclusion criterion
447 students, 5 schools
6–8 Maryland, urban
Grolnick, Farkas, Sohmer, Michaels, & Valsiner, 2007
The Investigators’ Club
Afterschool Meets standards with reservations
Journal article Low Not an inclusion criterion
Not an inclusion criterion
90 students, 1 school
7 Not reported, urban
Hirsch, Hedges, Stawicki, & Mekinda, 2011
After School Matters
Afterschool Meets standardsb
Technical report
Low Not an inclusion criterion
Not an inclusion criterion
535 students, 10 schools
9–10 Illinois, urban
(continued)
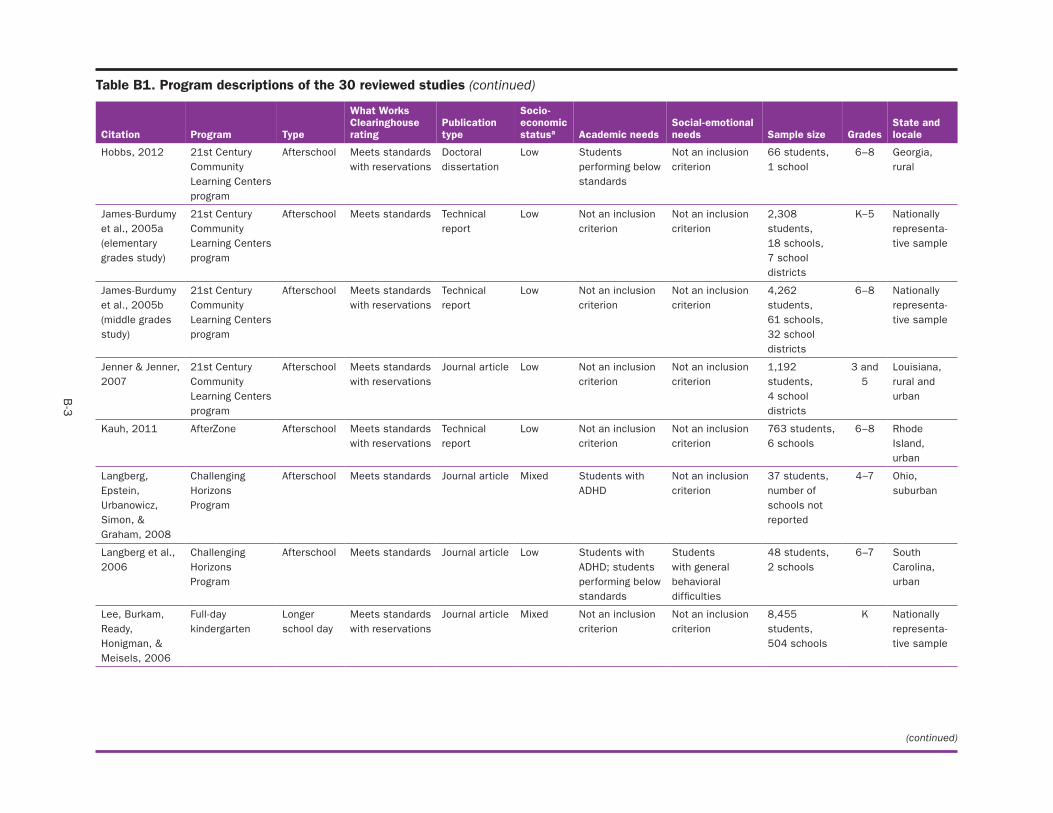
B-3
Table B1. Program descriptions of the 30 reviewed studies (continued)
Citation
Hobbs, 2012
Program
21st Century Community Learning Centers program
Type
Afterschool
What Works Clearinghouse rating
Meets standards with reservations
Publication type
Doctoral dissertation
Socio‑economic statusa
Low
Academic needs
Students performing below standards
Social‑emotional needs
Not an inclusion criterion
Sample size
66 students, 1 school
Grades
6–8
State and locale
Georgia, rural
James-Burdumy et al., 2005a (elementary grades study)
21st Century Community Learning Centers program
Afterschool Meets standards Technical report
Low Not an inclusion criterion
Not an inclusion criterion
2,308 students, 18 schools, 7 school districts
K–5 Nationally representa-tive sample
James-Burdumy et al., 2005b (middle grades study)
21st Century Community Learning Centers program
Afterschool Meets standards with reservations
Technical report
Low Not an inclusion criterion
Not an inclusion criterion
4,262 students, 61 schools, 32 school districts
6–8 Nationally representa-tive sample
Jenner & Jenner, 2007
21st Century Community Learning Centers program
Afterschool Meets standards with reservations
Journal article Low Not an inclusion criterion
Not an inclusion criterion
1,192 students, 4 school districts
3 and 5
Louisiana, rural and urban
Kauh, 2011 AfterZone Afterschool Meets standards with reservations
Technical report
Low Not an inclusion criterion
Not an inclusion criterion
763 students, 6 schools
6–8 Rhode Island, urban
Langberg, Epstein, Urbanowicz, Simon, & Graham, 2008
Challenging Horizons Program
Afterschool Meets standards Journal article Mixed Students with ADHD
Not an inclusion criterion
37 students, number of schools not reported
4–7 Ohio, suburban
Langberg et al., 2006
Challenging Horizons Program
Afterschool Meets standards Journal article Low Students with ADHD; students performing below standards
Students with general behavioral difficulties
48 students, 2 schools
6–7 South Carolina, urban
Lee, Burkam, Ready, Honigman, & Meisels, 2006
Full-day kindergarten
Longer school day
Meets standards with reservations
Journal article Mixed Not an inclusion criterion
Not an inclusion criterion
8,455 students, 504 schools
K Nationally representa-tive sample
(continued)
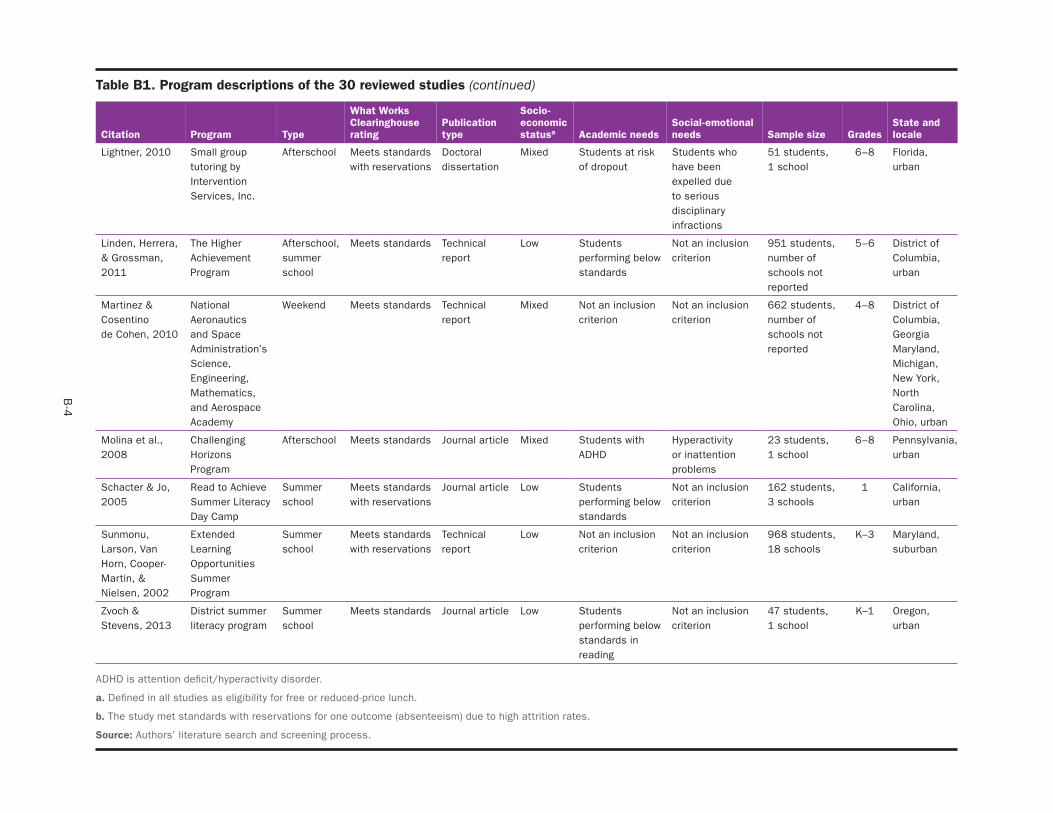
B-4
Table B1. Program descriptions of the 30 reviewed studies (continued)
Citation Program Type
What Works Clearinghouse rating
Publication type
Socio‑economic statusa Academic needs
Social‑emotional needs Sample size Grades
State and locale
Lightner, 2010 Small group tutoring by Intervention Services, Inc.
Afterschool Meets standards with reservations
Doctoral dissertation
Mixed Students at risk of dropout
Students who have been expelled due to serious disciplinary infractions
51 students, 1 school
6–8 Florida, urban
Linden, Herrera, & Grossman, 2011
The Higher Achievement Program
Afterschool, summer school
Meets standards Technical report
Low Students performing below standards
Not an inclusion criterion
951 students, number of schools not reported
5–6 District of Columbia, urban
Martinez & Cosentino de Cohen, 2010
National Aeronautics and Space Administration’s Science, Engineering, Mathematics, and Aerospace Academy
Weekend Meets standards Technical report
Mixed Not an inclusion criterion
Not an inclusion criterion
662 students, number of schools not reported
4–8 District of Columbia, Georgia Maryland, Michigan, New York, North Carolina, Ohio, urban
Molina et al., 2008
Challenging Horizons Program
Afterschool Meets standards Journal article Mixed Students with ADHD
Hyperactivity or inattention problems
23 students, 1 school
6–8 Pennsylvania, urban
Schacter & Jo, 2005
Read to Achieve Summer Literacy Day Camp
Summer school
Meets standards with reservations
Journal article Low Students performing below standards
Not an inclusion criterion
162 students, 3 schools
1 California, urban
Sunmonu, Larson, Van Horn, Cooper-Martin, & Nielsen, 2002
Extended Learning Opportunities Summer Program
Summer school
Meets standards with reservations
Technical report
Low Not an inclusion criterion
Not an inclusion criterion
968 students, 18 schools
K–3 Maryland, suburban
Zvoch & Stevens, 2013
District summer literacy program
Summer school
Meets standards Journal article Low Students performing below standards in reading
Not an inclusion criterion
47 students, 1 school
K–1 Oregon, urban
ADHD is attention deficit/hyperactivity disorder.
a. Defined in all studies as eligibility for free or reduced-price lunch.
b. The study met standards with reservations for one outcome (absenteeism) due to high attrition rates.
Source: Authors’ literature search and screening process.
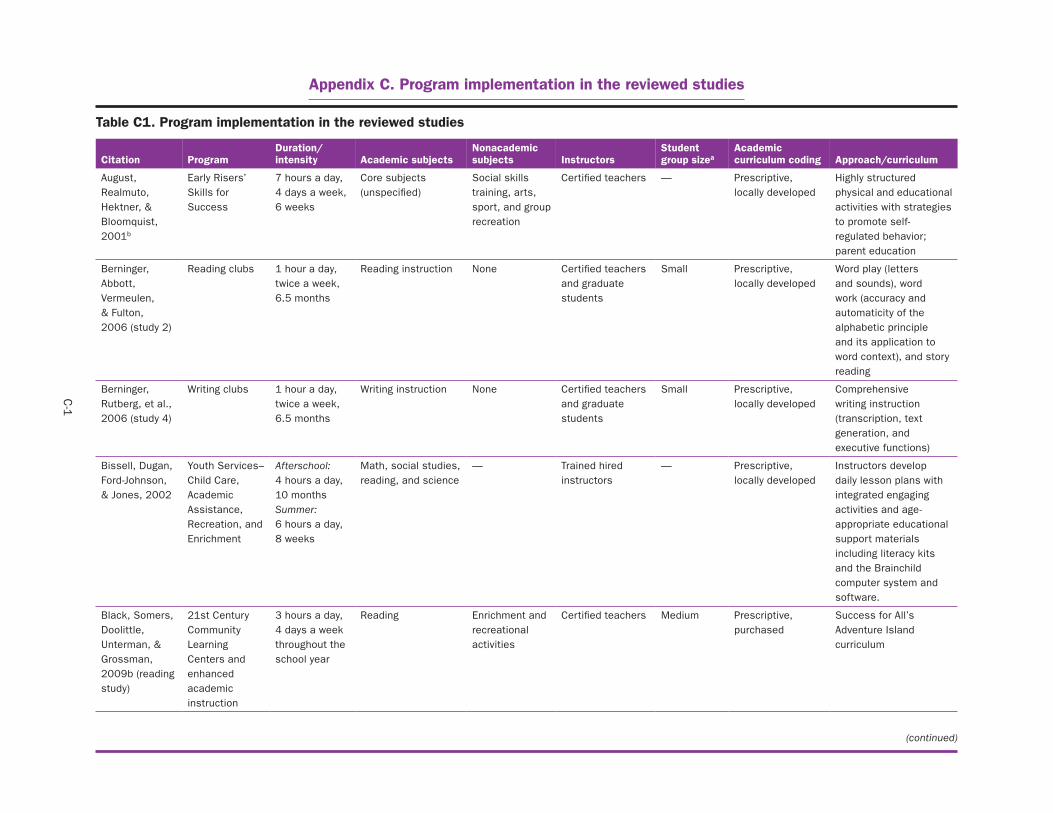
C-1
Appendix C. Program implementation in the reviewed studies
Table C1. Program implementation in the reviewed studies
Citation
August, Realmuto, Hektner, & Bloomquist, 2001b
Program
Early Risers’ Skills for Success
Duration/ intensity
7 hours a day, 4 days a week, 6 weeks
Academic subjects
Core subjects (unspecified)
Nonacademic subjects
Social skills training, arts, sport, and group recreation
Instructors
Certified teachers
Student group sizea
—
Academic curriculum coding
Prescriptive, locally developed
Approach/curriculum
Highly structured physical and educational activities with strategies to promote self-regulated behavior; parent education
Berninger, Abbott, Vermeulen, & Fulton, 2006 (study 2)
Reading clubs 1 hour a day, twice a week, 6.5 months
Reading instruction None Certified teachers and graduate students
Small Prescriptive, locally developed
Word play (letters and sounds), word work (accuracy and automaticity of the alphabetic principle and its application to word context), and story reading
Berninger, Rutberg, et al., 2006 (study 4)
Writing clubs 1 hour a day, twice a week, 6.5 months
Writing instruction None Certified teachers and graduate students
Small Prescriptive, locally developed
Comprehensive writing instruction (transcription, text generation, and executive functions)
Bissell, Dugan, Ford-Johnson, & Jones, 2002
Youth Services–Child Care, Academic Assistance, Recreation, and Enrichment
Afterschool: 4 hours a day, 10 monthsSummer: 6 hours a day, 8 weeks
Math, social studies, reading, and science
— Trained hired instructors
— Prescriptive, locally developed
Instructors develop daily lesson plans with integrated engaging activities and age-appropriate educational support materials including literacy kits and the Brainchild computer system and software.
Black, Somers, Doolittle, Unterman, & Grossman, 2009b (reading study)
21st Century Community Learning Centers and enhanced academic instruction
3 hours a day, 4 days a week throughout the school year
Reading Enrichment and recreational activities
Certified teachers Medium Prescriptive, purchased
Success for All’s Adventure Island curriculum
(continued)
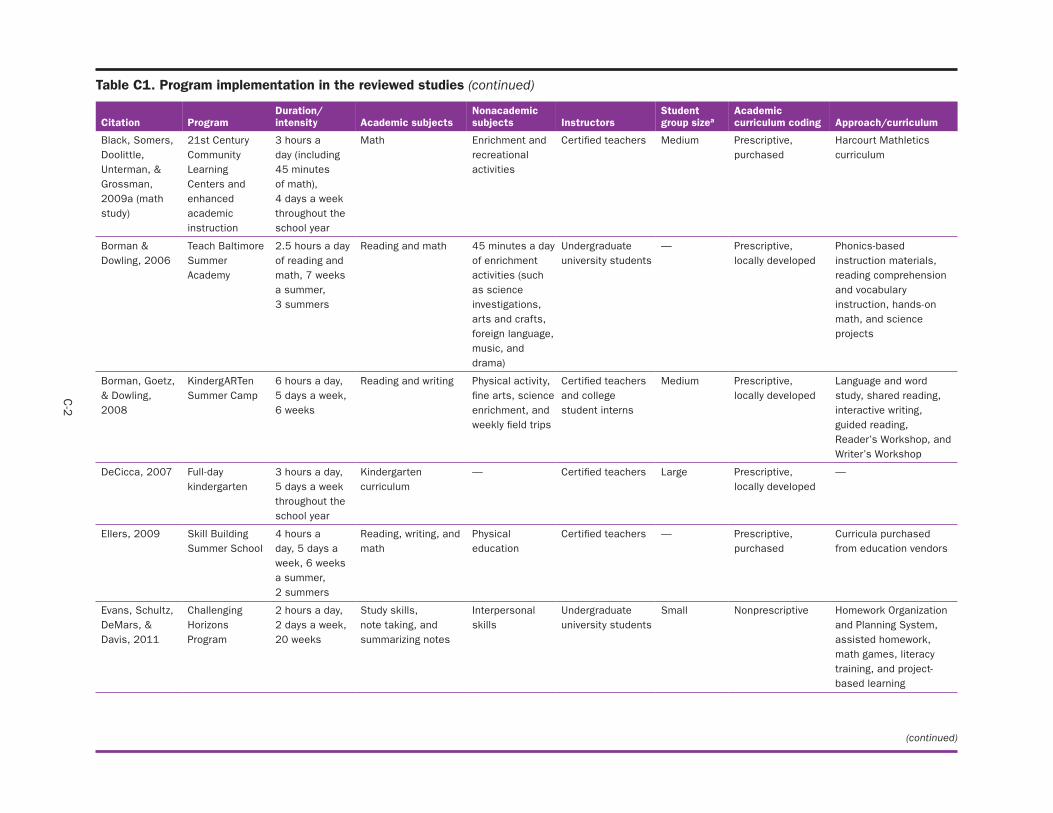
C-2
Table C1. Program implementation in the reviewed studies (continued)
Citation
Black, Somers, Doolittle, Unterman, & Grossman, 2009a (math study)
Program
21st Century Community Learning Centers and enhanced academic instruction
Duration/ intensity
3 hours a day (including 45 minutes of math), 4 days a week throughout the school year
Academic subjects
Math
Nonacademic subjects
Enrichment and recreational activities
Instructors
Certified teachers
Student group sizea
Medium
Academic curriculum coding
Prescriptive, purchased
Approach/curriculum
Harcourt Mathletics curriculum
Borman & Dowling, 2006
Teach Baltimore Summer Academy
2.5 hours a day of reading and math, 7 weeks a summer, 3 summers
Reading and math 45 minutes a day of enrichment activities (such as science investigations, arts and crafts, foreign language, music, and drama)
Undergraduate university students
— Prescriptive, locally developed
Phonics-based instruction materials, reading comprehension and vocabulary instruction, hands-on math, and science projects
Borman, Goetz, & Dowling, 2008
KindergARTen Summer Camp
6 hours a day, 5 days a week, 6 weeks
Reading and writing Physical activity, fine arts, science enrichment, and weekly field trips
Certified teachers and college student interns
Medium Prescriptive, locally developed
Language and word study, shared reading, interactive writing, guided reading, Reader’s Workshop, and Writer’s Workshop
DeCicca, 2007 Full-day kindergarten
3 hours a day, 5 days a week throughout the school year
Kindergarten curriculum
— Certified teachers Large Prescriptive, locally developed
—
Ellers, 2009 Skill Building Summer School
4 hours a day, 5 days a week, 6 weeks a summer, 2 summers
Reading, writing, and math
Physical education
Certified teachers — Prescriptive, purchased
Curricula purchased from education vendors
Evans, Schultz, DeMars, & Davis, 2011
Challenging Horizons Program
2 hours a day, 2 days a week, 20 weeks
Study skills, note taking, and summarizing notes
Interpersonal skills
Undergraduate university students
Small Nonprescriptive Homework Organization and Planning System, assisted homework, math games, literacy training, and project-based learning
(continued)
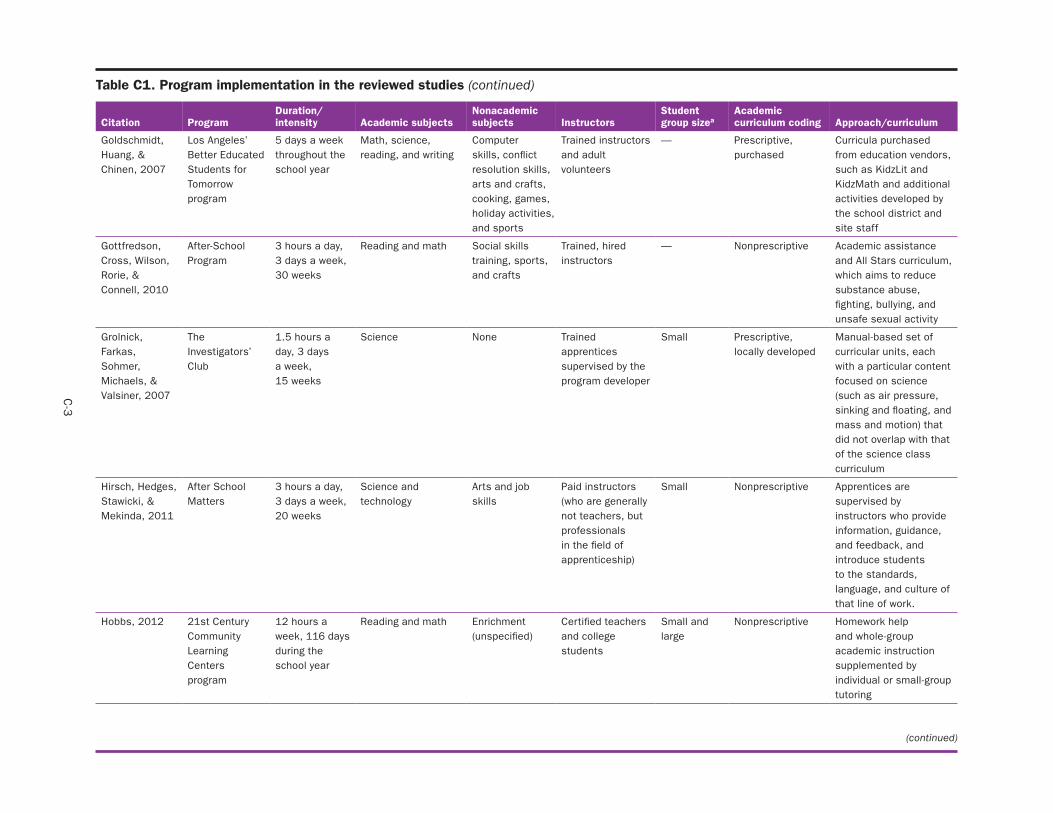
C-3
Table C1. Program implementation in the reviewed studies (continued)
Citation
Goldschmidt, Huang, & Chinen, 2007
Program
Los Angeles’ Better Educated Students for Tomorrow program
Duration/ intensity
5 days a week throughout the school year
Academic subjects
Math, science, reading, and writing
Nonacademic subjects
Computer skills, conflict resolution skills, arts and crafts, cooking, games, holiday activities, and sports
Instructors
Trained instructors and adult volunteers
Student group sizea
—
Academic curriculum coding
Prescriptive, purchased
Approach/curriculum
Curricula purchased from education vendors, such as KidzLit and KidzMath and additional activities developed by the school district and site staff
Gottfredson, Cross, Wilson, Rorie, & Connell, 2010
After-School Program
3 hours a day, 3 days a week, 30 weeks
Reading and math Social skills training, sports, and crafts
Trained, hired instructors
— Nonprescriptive Academic assistance and All Stars curriculum, which aims to reduce substance abuse, fighting, bullying, and unsafe sexual activity
Grolnick, Farkas, Sohmer, Michaels, & Valsiner, 2007
The Investigators’ Club
1.5 hours a day, 3 days a week, 15 weeks
Science None Trained apprentices supervised by the program developer
Small Prescriptive, locally developed
Manual-based set of curricular units, each with a particular content focused on science (such as air pressure, sinking and floating, and mass and motion) that did not overlap with that of the science class curriculum
Hirsch, Hedges, Stawicki, & Mekinda, 2011
After School Matters
3 hours a day, 3 days a week, 20 weeks
Science and technology
Arts and job skills
Paid instructors (who are generally not teachers, but professionals in the field of apprenticeship)
Small Nonprescriptive Apprentices are supervised by instructors who provide information, guidance, and feedback, and introduce students to the standards, language, and culture of that line of work.
Hobbs, 2012 21st Century Community Learning Centers program
12 hours a week, 116 days during the school year
Reading and math Enrichment (unspecified)
Certified teachers and college students
Small and large
Nonprescriptive Homework help and whole-group academic instruction supplemented by individual or small-group tutoring
(continued)
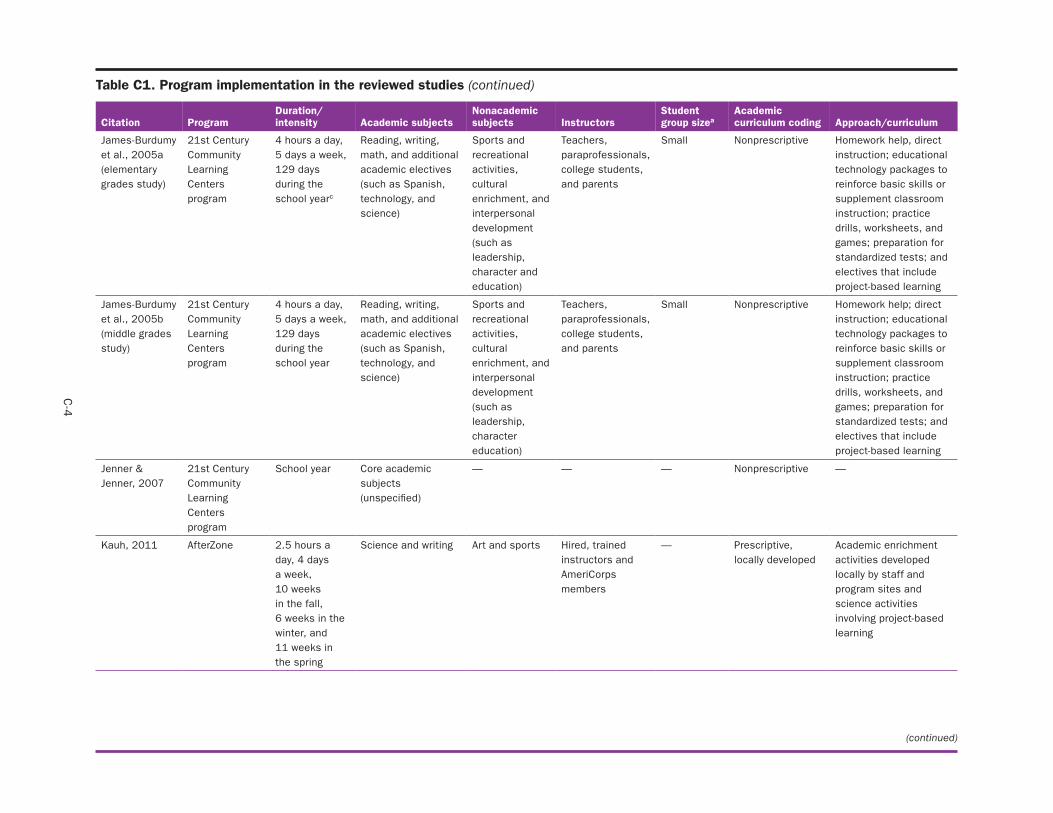
C-4
Table C1. Program implementation in the reviewed studies (continued)
Citation
James-Burdumy et al., 2005a (elementary grades study)
Program
21st Century Community Learning Centers program
Duration/ intensity
4 hours a day, 5 days a week, 129 days during the school yearc
Academic subjects
Reading, writing, math, and additional academic electives (such as Spanish, technology, and science)
Nonacademic subjects
Sports and recreational activities, cultural enrichment, and interpersonal development (such as leadership, character and education)
Instructors
Teachers, paraprofessionals, college students, and parents
Student group sizea
Small
Academic curriculum coding
Nonprescriptive
Approach/curriculum
Homework help, direct instruction; educational technology packages to reinforce basic skills or supplement classroom instruction; practice drills, worksheets, and games; preparation for standardized tests; and electives that include project-based learning
James-Burdumy et al., 2005b (middle grades study)
21st Century Community Learning Centers program
4 hours a day, 5 days a week, 129 days during the school year
Reading, writing, math, and additional academic electives (such as Spanish, technology, and science)
Sports and recreational activities, cultural enrichment, and interpersonal development (such as leadership, character education)
Teachers, paraprofessionals, college students, and parents
Small Nonprescriptive Homework help; direct instruction; educational technology packages to reinforce basic skills or supplement classroom instruction; practice drills, worksheets, and games; preparation for standardized tests; and electives that include project-based learning
Jenner & Jenner, 2007
21st Century Community Learning Centers program
School year Core academic subjects (unspecified)
— — — Nonprescriptive —
Kauh, 2011 AfterZone 2.5 hours a day, 4 days a week, 10 weeks in the fall, 6 weeks in the winter, and 11 weeks in the spring
Science and writing Art and sports Hired, trained instructors and AmeriCorps members
— Prescriptive, locally developed
Academic enrichment activities developed locally by staff and program sites and science activities involving project-based learning
(continued)
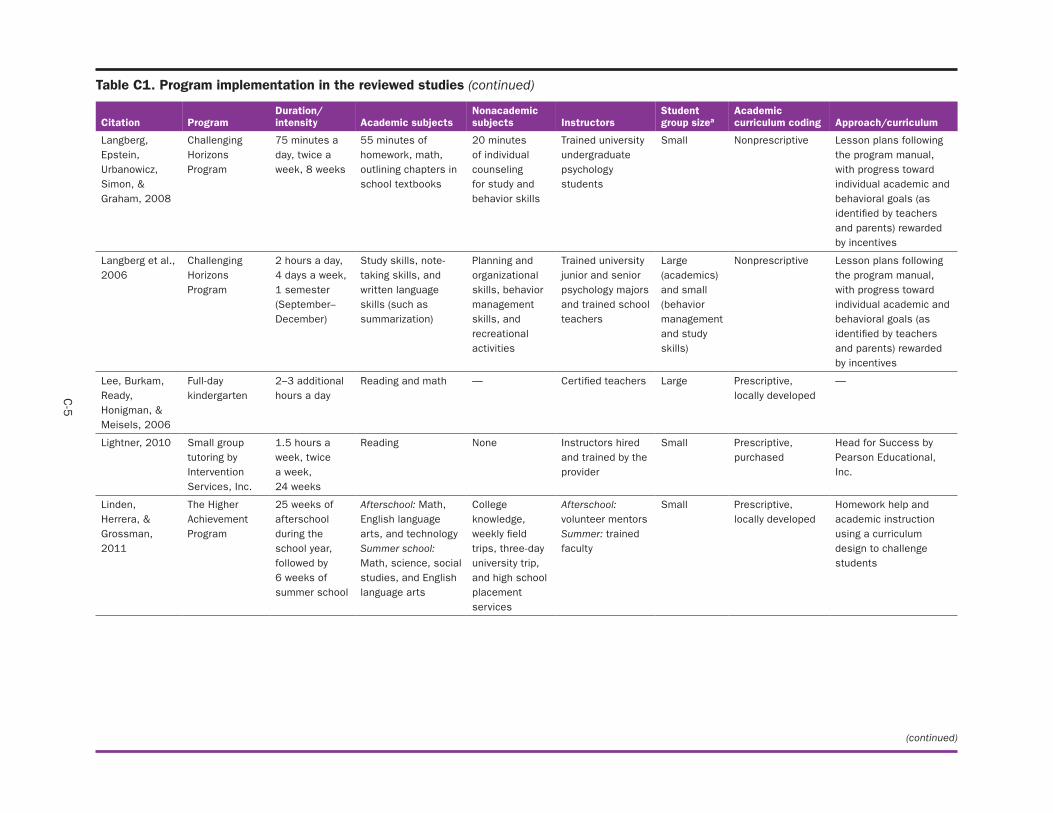
C-5
Table C1. Program implementation in the reviewed studies (continued)
Citation
Langberg, Epstein, Urbanowicz, Simon, & Graham, 2008
Program
Challenging Horizons Program
Duration/ intensity
75 minutes a day, twice a week, 8 weeks
Academic subjects
55 minutes of homework, math, outlining chapters in school textbooks
Nonacademic subjects
20 minutes of individual counseling for study and behavior skills
Instructors
Trained university undergraduate psychology students
Student group sizea
Small
Academic curriculum coding
Nonprescriptive
Approach/curriculum
Lesson plans following the program manual, with progress toward individual academic and behavioral goals (as identified by teachers and parents) rewarded by incentives
Langberg et al., 2006
Challenging Horizons Program
2 hours a day, 4 days a week, 1 semester (September–December)
Study skills, note-taking skills, and written language skills (such as summarization)
Planning and organizational skills, behavior management skills, and recreational activities
Trained university junior and senior psychology majors and trained school teachers
Large (academics) and small (behavior management and study skills)
Nonprescriptive Lesson plans following the program manual, with progress toward individual academic and behavioral goals (as identified by teachers and parents) rewarded by incentives
Lee, Burkam, Ready, Honigman, & Meisels, 2006
Full-day kindergarten
2–3 additional hours a day
Reading and math — Certified teachers Large Prescriptive, locally developed
—
Lightner, 2010 Small group tutoring by Intervention Services, Inc.
1.5 hours a week, twice a week, 24 weeks
Reading None Instructors hired and trained by the provider
Small Prescriptive, purchased
Head for Success by Pearson Educational, Inc.
Linden, Herrera, & Grossman, 2011
The Higher Achievement Program
25 weeks of afterschool during the school year, followed by 6 weeks of summer school
Afterschool: Math, English language arts, and technologySummer school: Math, science, social studies, and English language arts
College knowledge, weekly field trips, three-day university trip, and high school placement services
Afterschool: volunteer mentorsSummer: trained faculty
Small Prescriptive, locally developed
Homework help and academic instruction using a curriculum design to challenge students
(continued)
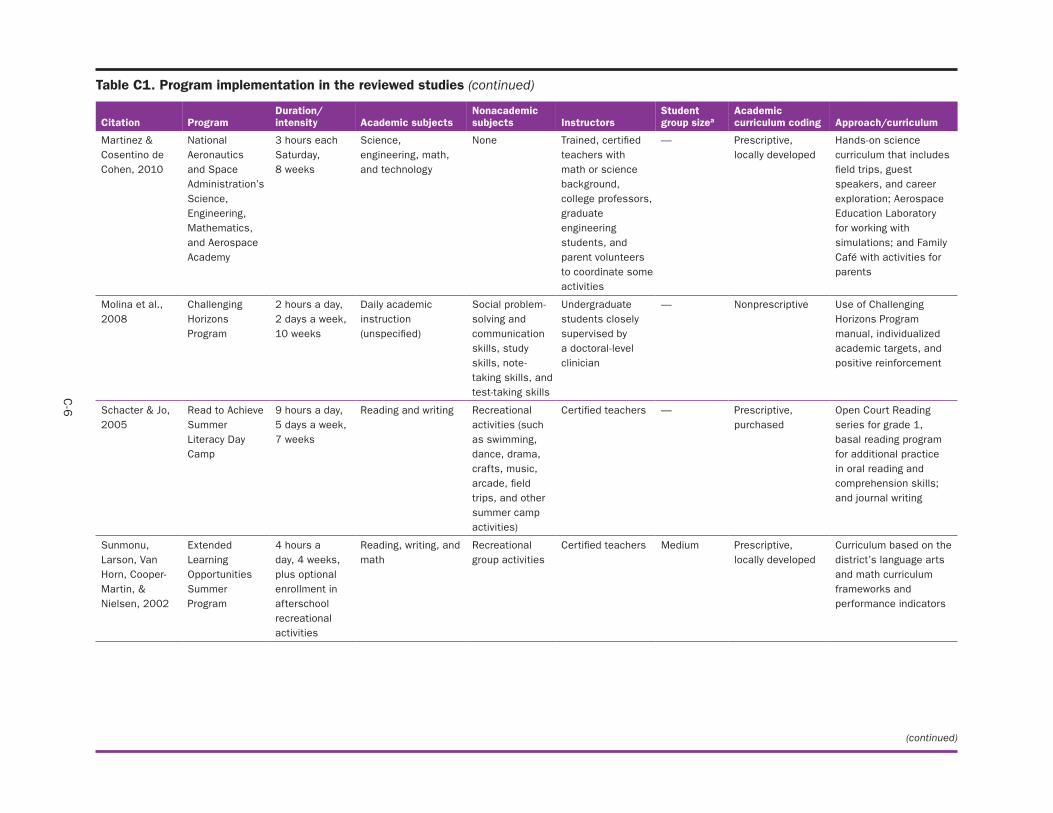
C-6
Table C1. Program implementation in the reviewed studies (continued)
Citation
Martinez & Cosentino de Cohen, 2010
Program
National Aeronautics and Space Administration’s Science, Engineering, Mathematics, and Aerospace Academy
Duration/ intensity
3 hours each Saturday, 8 weeks
Academic subjects
Science, engineering, math, and technology
Nonacademic subjects
None
Instructors
Trained, certified teachers with math or science background, college professors, graduate engineering students, and parent volunteers to coordinate some activities
Student group sizea
—
Academic curriculum coding
Prescriptive, locally developed
Approach/curriculum
Hands-on science curriculum that includes field trips, guest speakers, and career exploration; Aerospace Education Laboratory for working with simulations; and Family Café with activities for parents
Molina et al., 2008
Challenging Horizons Program
2 hours a day, 2 days a week, 10 weeks
Daily academic instruction (unspecified)
Social problem- solving and communication skills, study skills, note-taking skills, and test-taking skills
Undergraduate students closely supervised by a doctoral-level clinician
— Nonprescriptive Use of Challenging Horizons Program manual, individualized academic targets, and positive reinforcement
Schacter & Jo, 2005
Read to Achieve Summer Literacy Day Camp
9 hours a day, 5 days a week, 7 weeks
Reading and writing Recreational activities (such as swimming, dance, drama, crafts, music, arcade, field trips, and other summer camp activities)
Certified teachers — Prescriptive, purchased
Open Court Reading series for grade 1, basal reading program for additional practice in oral reading and comprehension skills; and journal writing
Sunmonu, Larson, Van Horn, Cooper-Martin, & Nielsen, 2002
Extended Learning Opportunities Summer Program
4 hours a day, 4 weeks, plus optional enrollment in afterschool recreational activities
Reading, writing, and math
Recreational group activities
Certified teachers Medium Prescriptive, locally developed
Curriculum based on the district’s language arts and math curriculum frameworks and performance indicators
(continued)
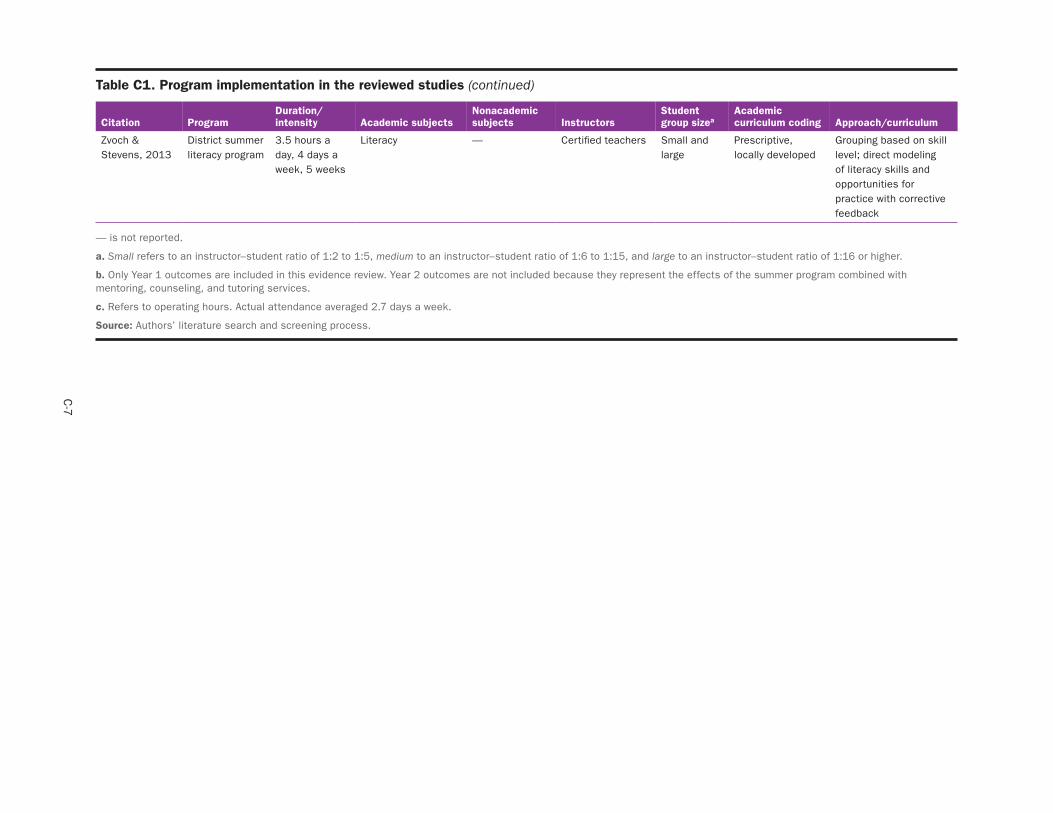
C-7
Table C1. Program implementation in the reviewed studies (continued)
Duration/ intensity
Nonacademic subjects
Student group sizea
Academic curriculum codingCitation Program Academic subjects Instructors Approach/curriculum
Zvoch & Stevens, 2013
District summer literacy program
3.5 hours a day, 4 days a week, 5 weeks
Literacy — Certified teachers Small and large
Prescriptive, locally developed
Grouping based on skill level; direct modeling of literacy skills and opportunities for practice with corrective feedback
— is not reported.
a. Small refers to an instructor–student ratio of 1:2 to 1:5, medium to an instructor–student ratio of 1:6 to 1:15, and large to an instructor–student ratio of 1:16 or higher.
b. Only Year 1 outcomes are included in this evidence review. Year 2 outcomes are not included because they represent the effects of the summer program combined with mentoring, counseling, and tutoring services.
c. Refers to operating hours. Actual attendance averaged 2.7 days a week.
Source: Authors’ literature search and screening process.
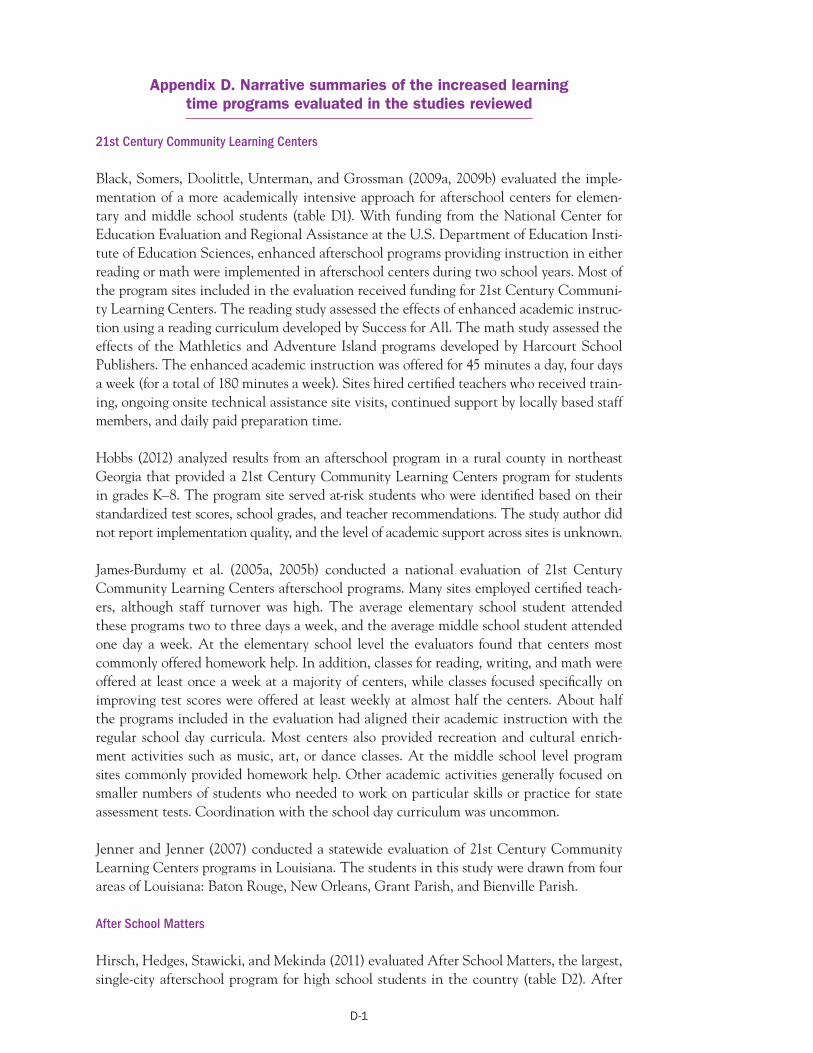
D-1
Appendix D. Narrative summaries of the increased learning time programs evaluated in the studies reviewed
21st Century Community Learning Centers
Black, Somers, Doolittle, Unterman, and Grossman (2009a, 2009b) evaluated the imple-mentation of a more academically intensive approach for afterschool centers for elemen-tary and middle school students (table D1). With funding from the National Center for Education Evaluation and Regional Assistance at the U.S. Department of Education Insti-tute of Education Sciences, enhanced afterschool programs providing instruction in either reading or math were implemented in afterschool centers during two school years. Most of the program sites included in the evaluation received funding for 21st Century Communi-ty Learning Centers. The reading study assessed the effects of enhanced academic instruc-tion using a reading curriculum developed by Success for All. The math study assessed the effects of the Mathletics and Adventure Island programs developed by Harcourt School Publishers. The enhanced academic instruction was offered for 45 minutes a day, four days a week (for a total of 180 minutes a week). Sites hired certified teachers who received train-ing, ongoing onsite technical assistance site visits, continued support by locally based staff members, and daily paid preparation time.
Hobbs (2012) analyzed results from an afterschool program in a rural county in northeast Georgia that provided a 21st Century Community Learning Centers program for students in grades K–8. The program site served at-risk students who were identified based on their standardized test scores, school grades, and teacher recommendations. The study author did not report implementation quality, and the level of academic support across sites is unknown.
James-Burdumy et al. (2005a, 2005b) conducted a national evaluation of 21st Century Community Learning Centers afterschool programs. Many sites employed certified teach-ers, although staff turnover was high. The average elementary school student attended these programs two to three days a week, and the average middle school student attended one day a week. At the elementary school level the evaluators found that centers most commonly offered homework help. In addition, classes for reading, writing, and math were offered at least once a week at a majority of centers, while classes focused specifically on improving test scores were offered at least weekly at almost half the centers. About half the programs included in the evaluation had aligned their academic instruction with the regular school day curricula. Most centers also provided recreation and cultural enrich-ment activities such as music, art, or dance classes. At the middle school level program sites commonly provided homework help. Other academic activities generally focused on smaller numbers of students who needed to work on particular skills or practice for state assessment tests. Coordination with the school day curriculum was uncommon.
Jenner and Jenner (2007) conducted a statewide evaluation of 21st Century Community Learning Centers programs in Louisiana. The students in this study were drawn from four areas of Louisiana: Baton Rouge, New Orleans, Grant Parish, and Bienville Parish.
After School Matters
Hirsch, Hedges, Stawicki, and Mekinda (2011) evaluated After School Matters, the largest, single-city afterschool program for high school students in the country (table D2). After
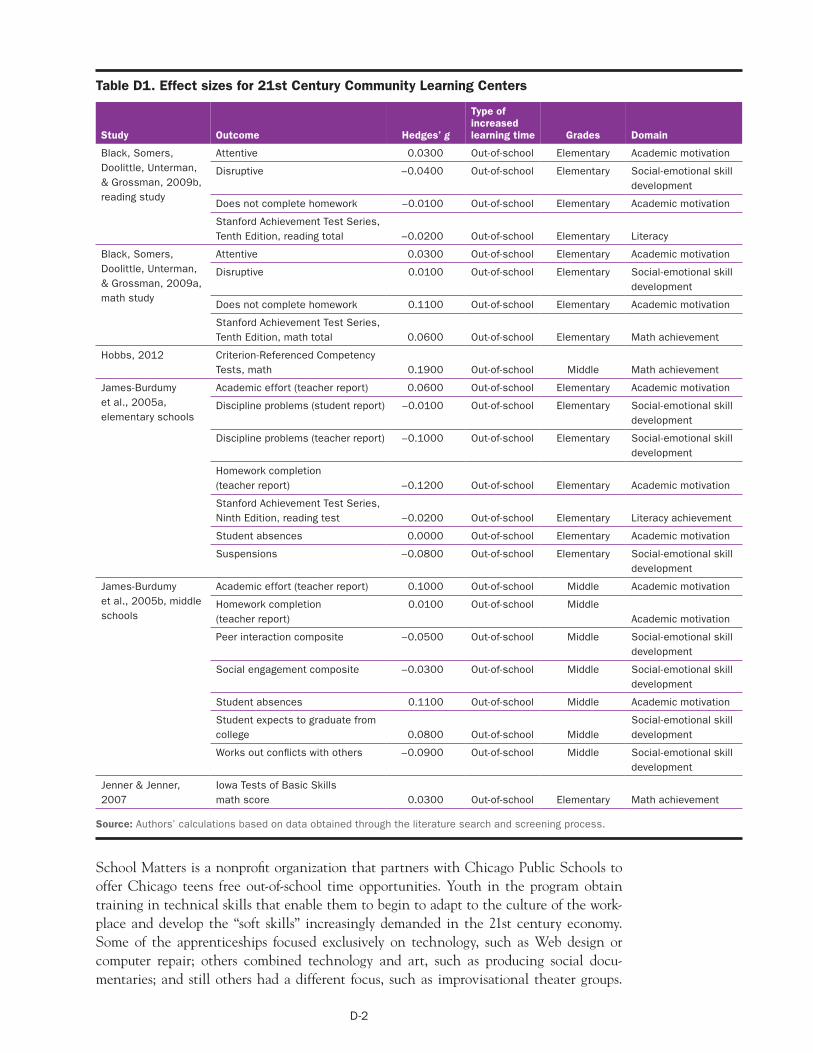
D-2
Table D1. Effect sizes for 21st Century Community Learning Centers
Study Outcome Hedges’ g
Type of increased learning time Grades Domain
Black, Somers, Doolittle, Unterman, & Grossman, 2009b,reading study
Attentive 0.0300 Out-of-school Elementary Academic motivation
Disruptive –0.0400 Out-of-school Elementary Social-emotional skill development
Does not complete homework –0.0100 Out-of-school Elementary Academic motivation
Stanford Achievement Test Series, Tenth Edition, reading total –0.0200 Out-of-school Elementary Literacy
Black, Somers, Doolittle, Unterman, & Grossman, 2009a, math study
Attentive 0.0300 Out-of-school Elementary Academic motivation
Disruptive 0.0100 Out-of-school Elementary Social-emotional skill development
Does not complete homework 0.1100 Out-of-school Elementary Academic motivation
Stanford Achievement Test Series, Tenth Edition, math total 0.0600 Out-of-school Elementary Math achievement
Hobbs, 2012 Criterion-Referenced Competency Tests, math 0.1900 Out-of-school Middle Math achievement
James-Burdumy et al., 2005a, elementary schools
Academic effort (teacher report) 0.0600 Out-of-school Elementary Academic motivation
Discipline problems (student report) –0.0100 Out-of-school Elementary Social-emotional skill development
Discipline problems (teacher report) –0.1000 Out-of-school Elementary Social-emotional skill development
Homework completion (teacher report) –0.1200 Out-of-school Elementary Academic motivation
Stanford Achievement Test Series, Ninth Edition, reading test –0.0200 Out-of-school Elementary Literacy achievement
Student absences 0.0000 Out-of-school Elementary Academic motivation
Suspensions –0.0800 Out-of-school Elementary Social-emotional skill development
James-Burdumy et al., 2005b, middle schools
Academic effort (teacher report) 0.1000 Out-of-school Middle Academic motivation
Homework completion (teacher report)
0.0100 Out-of-school MiddleAcademic motivation
Peer interaction composite –0.0500 Out-of-school Middle Social-emotional skill development
Social engagement composite –0.0300 Out-of-school Middle Social-emotional skill development
Student absences 0.1100 Out-of-school Middle Academic motivation
Student expects to graduate from college
Social-emotional skill development0.0800 Out-of-school Middle
Works out conflicts with others –0.0900 Out-of-school Middle Social-emotional skill development
Jenner & Jenner, 2007
Iowa Tests of Basic Skills math score 0.0300 Out-of-school Elementary Math achievement
Source: Authors’ calculations based on data obtained through the literature search and screening process.
School Matters is a nonprofit organization that partners with Chicago Public Schools to offer Chicago teens free out-of-school time opportunities. Youth in the program obtain training in technical skills that enable them to begin to adapt to the culture of the work-place and develop the “soft skills” increasingly demanded in the 21st century economy. Some of the apprenticeships focused exclusively on technology, such as Web design or computer repair; others combined technology and art, such as producing social docu-mentaries; and still others had a different focus, such as improvisational theater groups.
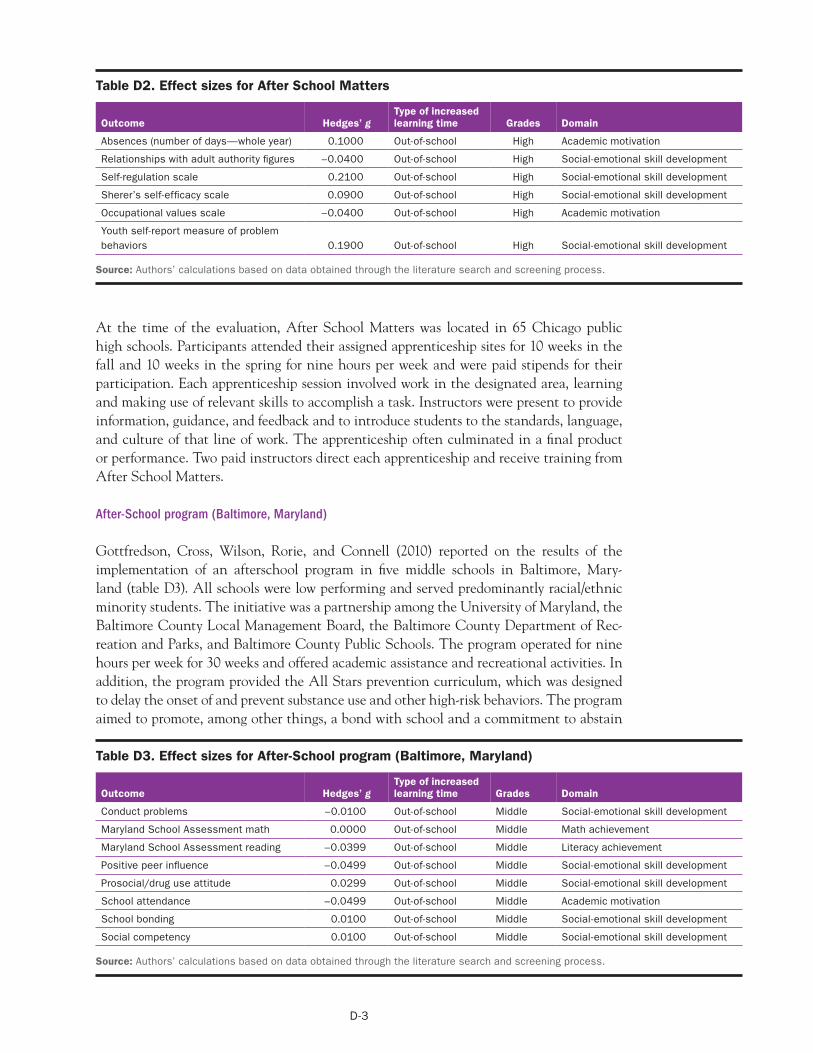
D-3
After-School program (Baltimore, Maryland)
Gottfredson, Cross, Wilson, Rorie, and Connell (2010) reported on the results of the implementation of an afterschool program in five middle schools in Baltimore, Mary-land (table D3). All schools were low performing and served predominantly racial/ethnic minority students. The initiative was a partnership among the University of Maryland, the Baltimore County Local Management Board, the Baltimore County Department of Rec-reation and Parks, and Baltimore County Public Schools. The program operated for nine hours per week for 30 weeks and offered academic assistance and recreational activities. In addition, the program provided the All Stars prevention curriculum, which was designed to delay the onset of and prevent substance use and other high-risk behaviors. The program aimed to promote, among other things, a bond with school and a commitment to abstain
Table D3. Effect sizes for After‑School program (Baltimore, Maryland)
Table D2. Effect sizes for After School Matters
Outcome Hedges’ gType of increased learning time Grades Domain
Absences (number of days—whole year) 0.1000 Out-of-school High Academic motivation
Relationships with adult authority figures –0.0400 Out-of-school High Social-emotional skill development
Self-regulation scale 0.2100 Out-of-school High Social-emotional skill development
Sherer’s self-efficacy scale 0.0900 Out-of-school High Social-emotional skill development
Occupational values scale –0.0400 Out-of-school High Academic motivation
Youth self-report measure of problem behaviors 0.1900 Out-of-school High Social-emotional skill development
Source: Authors’ calculations based on data obtained through the literature search and screening process.
At the time of the evaluation, After School Matters was located in 65 Chicago public high schools. Participants attended their assigned apprenticeship sites for 10 weeks in the fall and 10 weeks in the spring for nine hours per week and were paid stipends for their participation. Each apprenticeship session involved work in the designated area, learning and making use of relevant skills to accomplish a task. Instructors were present to provide information, guidance, and feedback and to introduce students to the standards, language, and culture of that line of work. The apprenticeship often culminated in a final product or performance. Two paid instructors direct each apprenticeship and receive training from After School Matters.
Outcome Hedges’ gType of increased learning time Grades Domain
Conduct problems –0.0100 Out-of-school Middle Social-emotional skill development
Maryland School Assessment math 0.0000 Out-of-school Middle Math achievement
Maryland School Assessment reading –0.0399 Out-of-school Middle Literacy achievement
Positive peer influence –0.0499 Out-of-school Middle Social-emotional skill development
Prosocial/drug use attitude 0.0299 Out-of-school Middle Social-emotional skill development
School attendance –0.0499 Out-of-school Middle Academic motivation
School bonding 0.0100 Out-of-school Middle Social-emotional skill development
Social competency 0.0100 Out-of-school Middle Social-emotional skill development
Source: Authors’ calculations based on data obtained through the literature search and screening process.
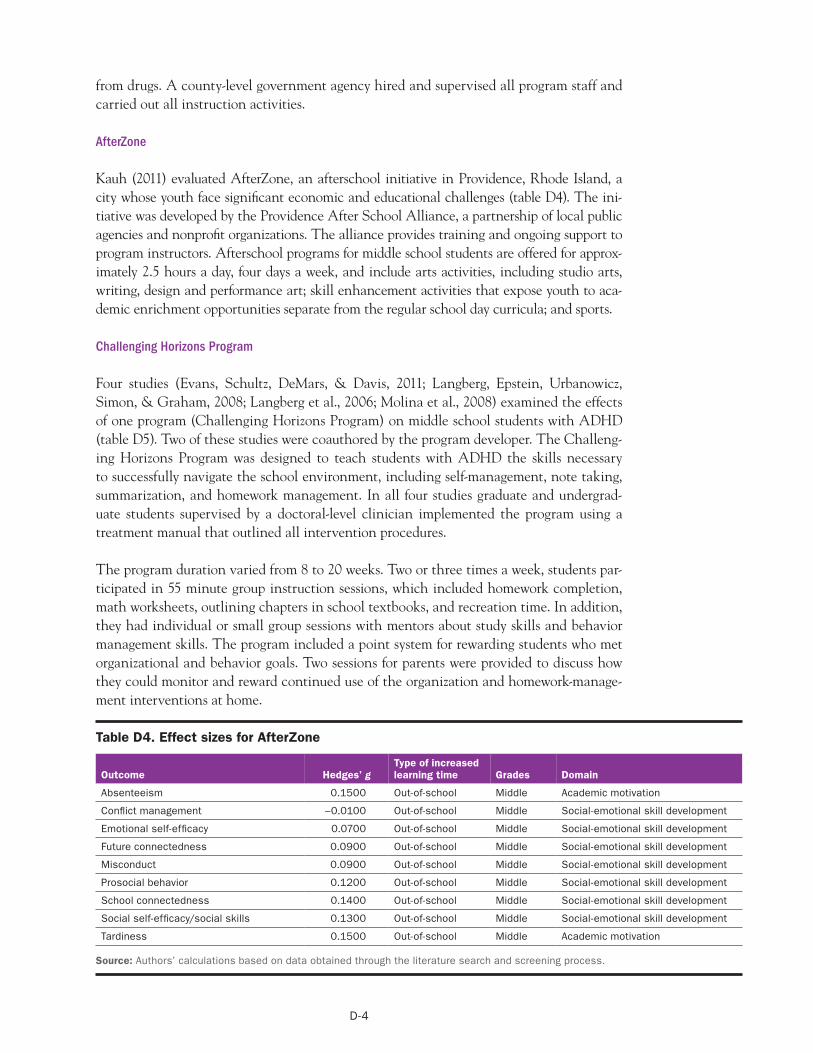
D-4
from drugs. A county-level government agency hired and supervised all program staff and carried out all instruction activities.
AfterZone
Kauh (2011) evaluated AfterZone, an afterschool initiative in Providence, Rhode Island, a city whose youth face significant economic and educational challenges (table D4). The ini-tiative was developed by the Providence After School Alliance, a partnership of local public agencies and nonprofit organizations. The alliance provides training and ongoing support to program instructors. Afterschool programs for middle school students are offered for approx-imately 2.5 hours a day, four days a week, and include arts activities, including studio arts, writing, design and performance art; skill enhancement activities that expose youth to aca-demic enrichment opportunities separate from the regular school day curricula; and sports.
Challenging Horizons Program
Four studies (Evans, Schultz, DeMars, & Davis, 2011; Langberg, Epstein, Urbanowicz, Simon, & Graham, 2008; Langberg et al., 2006; Molina et al., 2008) examined the effects of one program (Challenging Horizons Program) on middle school students with ADHD (table D5). Two of these studies were coauthored by the program developer. The Challeng-ing Horizons Program was designed to teach students with ADHD the skills necessary to successfully navigate the school environment, including self-management, note taking, summarization, and homework management. In all four studies graduate and undergrad-uate students supervised by a doctoral-level clinician implemented the program using a treatment manual that outlined all intervention procedures.
The program duration varied from 8 to 20 weeks. Two or three times a week, students par-ticipated in 55 minute group instruction sessions, which included homework completion, math worksheets, outlining chapters in school textbooks, and recreation time. In addition, they had individual or small group sessions with mentors about study skills and behavior management skills. The program included a point system for rewarding students who met organizational and behavior goals. Two sessions for parents were provided to discuss how they could monitor and reward continued use of the organization and homework-manage-ment interventions at home.
Table D4. Effect sizes for AfterZone
Outcome Hedges’ gType of increased learning time Grades Domain
Absenteeism 0.1500 Out-of-school Middle Academic motivation
Conflict management –0.0100 Out-of-school Middle Social-emotional skill development
Emotional self-efficacy 0.0700 Out-of-school Middle Social-emotional skill development
Future connectedness 0.0900 Out-of-school Middle Social-emotional skill development
Misconduct 0.0900 Out-of-school Middle Social-emotional skill development
Prosocial behavior 0.1200 Out-of-school Middle Social-emotional skill development
School connectedness 0.1400 Out-of-school Middle Social-emotional skill development
Social self-efficacy/social skills 0.1300 Out-of-school Middle Social-emotional skill development
Tardiness 0.1500 Out-of-school Middle Academic motivation
Source: Authors’ calculations based on data obtained through the literature search and screening process.
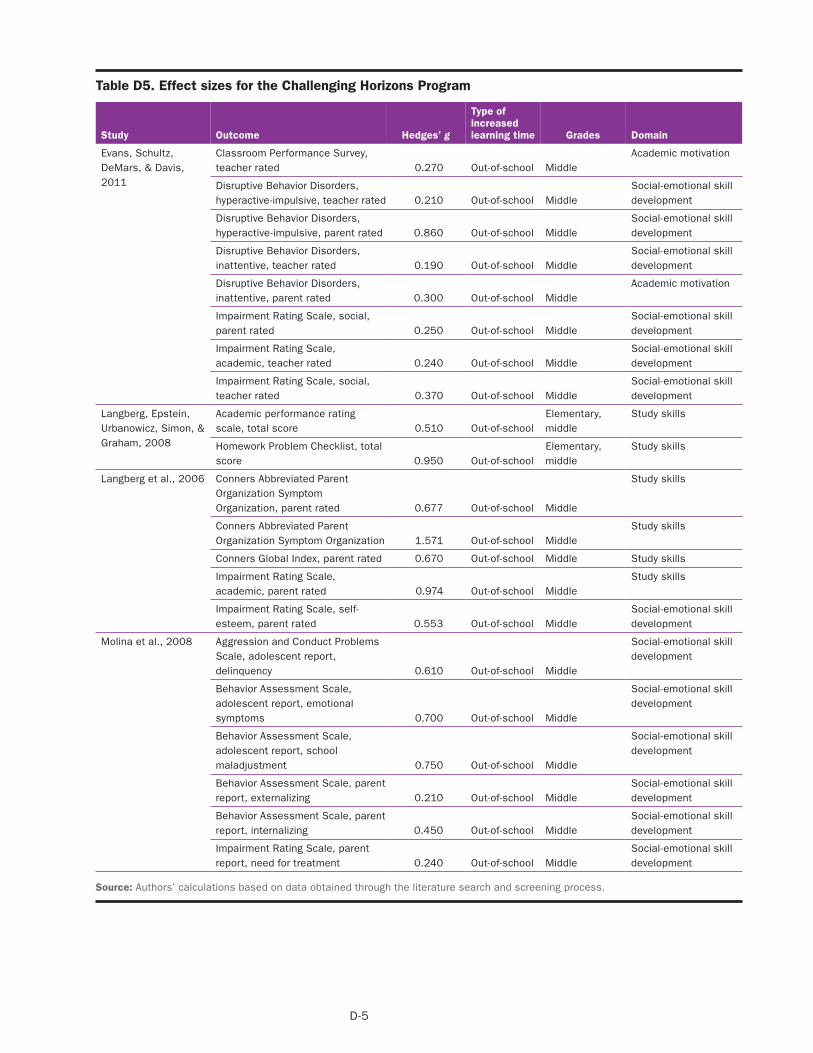
D-5
Table D5. Effect sizes for the Challenging Horizons Program
Study Outcome Hedges’ g
Type of increased learning time Grades Domain
Evans, Schultz, DeMars, & Davis, 2011
Classroom Performance Survey, teacher rated 0.270 Out-of-school Middle
Academic motivation
Disruptive Behavior Disorders, hyperactive-impulsive, teacher rated 0.210 Out-of-school Middle
Social-emotional skill development
Disruptive Behavior Disorders, hyperactive-impulsive, parent rated 0.860 Out-of-school Middle
Social-emotional skill development
Disruptive Behavior Disorders, inattentive, teacher rated 0.190 Out-of-school Middle
Social-emotional skill development
Disruptive Behavior Disorders, inattentive, parent rated 0.300 Out-of-school Middle
Academic motivation
Impairment Rating Scale, social, parent rated 0.250 Out-of-school Middle
Social-emotional skill development
Impairment Rating Scale, academic, teacher rated 0.240 Out-of-school Middle
Social-emotional skill development
Impairment Rating Scale, social, teacher rated 0.370 Out-of-school Middle
Social-emotional skill development
Langberg, Epstein, Urbanowicz, Simon, & Graham, 2008
Academic performance rating scale, total score 0.510 Out-of-school
Elementary, middle
Study skills
Homework Problem Checklist, total score 0.950 Out-of-school
Elementary, middle
Study skills
Langberg et al., 2006 Conners Abbreviated Parent Organization Symptom Organization, parent rated 0.677 Out-of-school Middle
Study skills
Conners Abbreviated Parent Organization Symptom Organization 1.571 Out-of-school Middle
Study skills
Conners Global Index, parent rated 0.670 Out-of-school Middle Study skills
Impairment Rating Scale, academic, parent rated 0.974 Out-of-school Middle
Study skills
Impairment Rating Scale, self-esteem, parent rated 0.553 Out-of-school Middle
Social-emotional skill development
Molina et al., 2008 Aggression and Conduct Problems Scale, adolescent report, delinquency 0.610 Out-of-school Middle
Social-emotional skill development
Behavior Assessment Scale, adolescent report, emotional symptoms
Social-emotional skill development
0.700 Out-of-school Middle
Behavior Assessment Scale, adolescent report, school maladjustment
Social-emotional skill development
0.750 Out-of-school Middle
Behavior Assessment Scale, parent report, externalizing 0.210 Out-of-school Middle
Social-emotional skill development
Behavior Assessment Scale, parent report, internalizing 0.450 Out-of-school Middle
Social-emotional skill development
Impairment Rating Scale, parent report, need for treatment 0.240 Out-of-school Middle
Social-emotional skill development
Source: Authors’ calculations based on data obtained through the literature search and screening process.
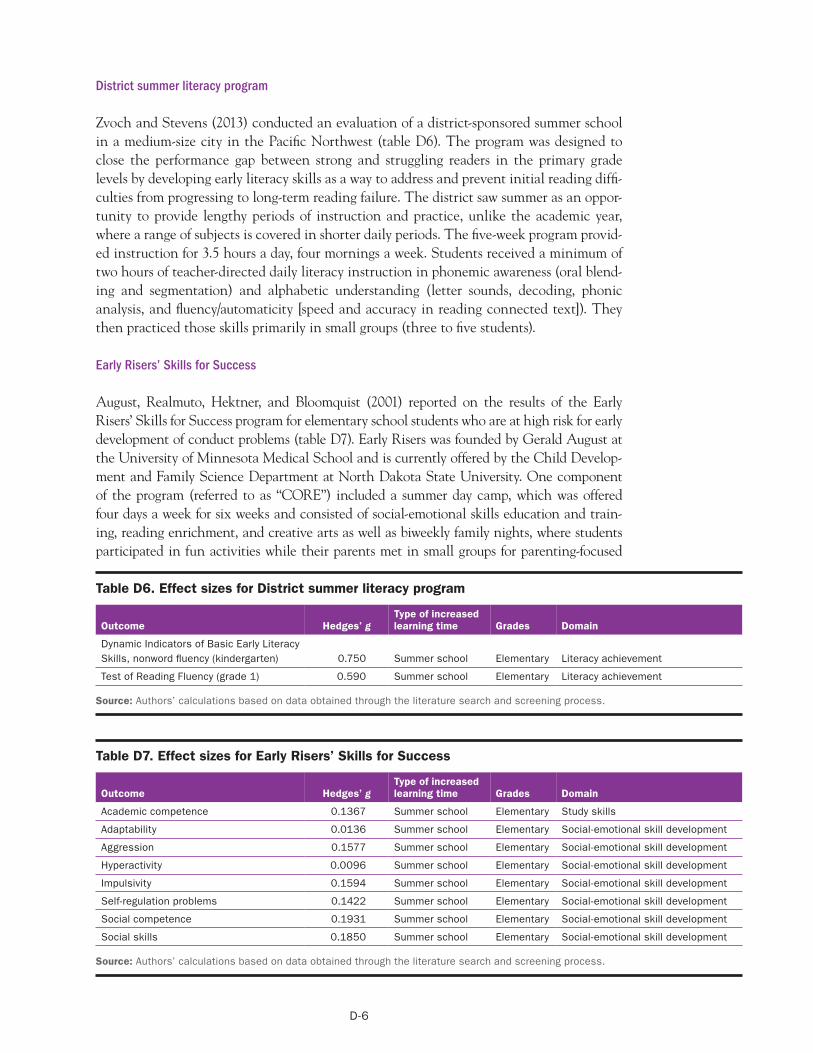
D-6
District summer literacy program
Zvoch and Stevens (2013) conducted an evaluation of a district-sponsored summer school in a medium-size city in the Pacific Northwest (table D6). The program was designed to close the performance gap between strong and struggling readers in the primary grade levels by developing early literacy skills as a way to address and prevent initial reading diffi-culties from progressing to long-term reading failure. The district saw summer as an oppor-tunity to provide lengthy periods of instruction and practice, unlike the academic year, where a range of subjects is covered in shorter daily periods. The five-week program provid-ed instruction for 3.5 hours a day, four mornings a week. Students received a minimum of two hours of teacher-directed daily literacy instruction in phonemic awareness (oral blend-ing and segmentation) and alphabetic understanding (letter sounds, decoding, phonic analysis, and fluency/automaticity [speed and accuracy in reading connected text]). They then practiced those skills primarily in small groups (three to five students).
Early Risers’ Skills for Success
August, Realmuto, Hektner, and Bloomquist (2001) reported on the results of the Early Risers’ Skills for Success program for elementary school students who are at high risk for early development of conduct problems (table D7). Early Risers was founded by Gerald August at the University of Minnesota Medical School and is currently offered by the Child Develop-ment and Family Science Department at North Dakota State University. One component of the program (referred to as “CORE”) included a summer day camp, which was offered four days a week for six weeks and consisted of social-emotional skills education and train-ing, reading enrichment, and creative arts as well as biweekly family nights, where students participated in fun activities while their parents met in small groups for parenting-focused
Table D6. Effect sizes for District summer literacy program
Outcome Hedges’ gType of increased learning time Grades Domain
Dynamic Indicators of Basic Early Literacy Skills, nonword fluency (kindergarten) 0.750 Summer school Elementary Literacy achievement
Test of Reading Fluency (grade 1) 0.590 Summer school Elementary Literacy achievement
Source: Authors’ calculations based on data obtained through the literature search and screening process.
Table D7. Effect sizes for Early Risers’ Skills for Success
Outcome Hedges’ gType of increased learning time Grades Domain
Academic competence 0.1367 Summer school Elementary Study skills
Adaptability 0.0136 Summer school Elementary Social-emotional skill development
Aggression 0.1577 Summer school Elementary Social-emotional skill development
Hyperactivity 0.0096 Summer school Elementary Social-emotional skill development
Impulsivity 0.1594 Summer school Elementary Social-emotional skill development
Self-regulation problems 0.1422 Summer school Elementary Social-emotional skill development
Social competence 0.1931 Summer school Elementary Social-emotional skill development
Social skills 0.1850 Summer school Elementary Social-emotional skill development
Source: Authors’ calculations based on data obtained through the literature search and screening process.
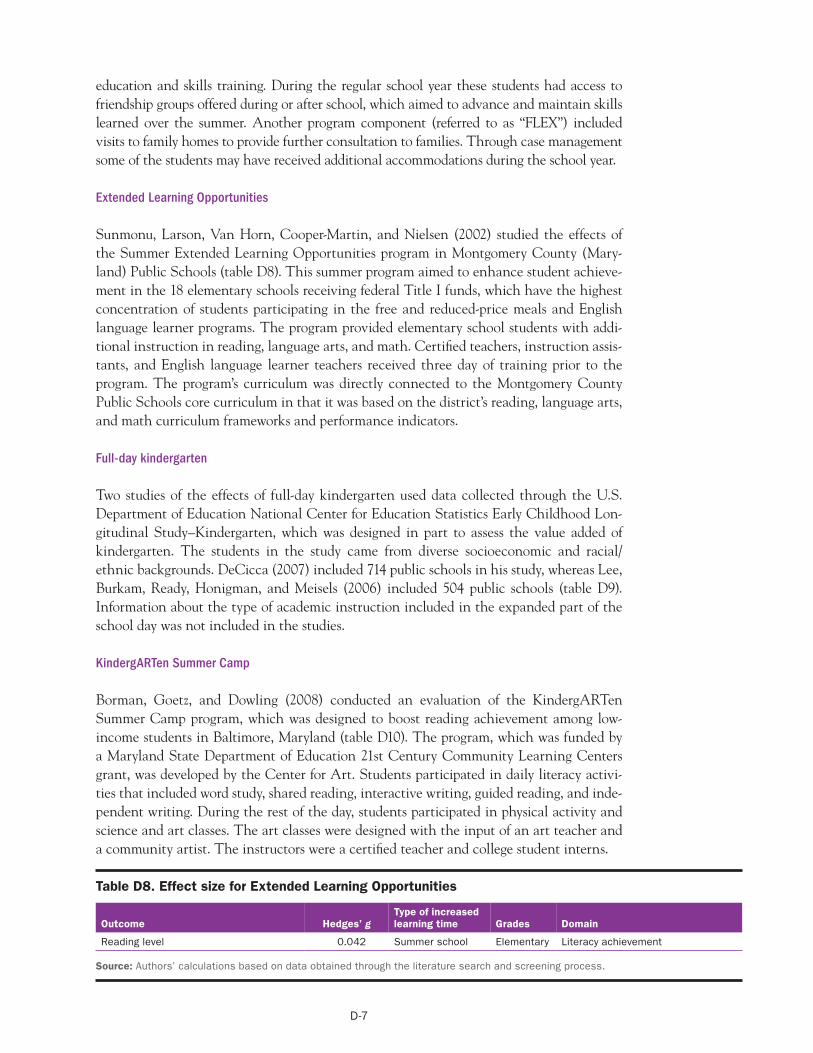
D-7
education and skills training. During the regular school year these students had access to friendship groups offered during or after school, which aimed to advance and maintain skills learned over the summer. Another program component (referred to as “FLEX”) included visits to family homes to provide further consultation to families. Through case management some of the students may have received additional accommodations during the school year.
Extended Learning Opportunities
Sunmonu, Larson, Van Horn, Cooper-Martin, and Nielsen (2002) studied the effects of the Summer Extended Learning Opportunities program in Montgomery County (Mary-land) Public Schools (table D8). This summer program aimed to enhance student achieve-ment in the 18 elementary schools receiving federal Title I funds, which have the highest concentration of students participating in the free and reduced-price meals and English language learner programs. The program provided elementary school students with addi-tional instruction in reading, language arts, and math. Certified teachers, instruction assis-tants, and English language learner teachers received three day of training prior to the program. The program’s curriculum was directly connected to the Montgomery County Public Schools core curriculum in that it was based on the district’s reading, language arts, and math curriculum frameworks and performance indicators.
Full-day kindergarten
Two studies of the effects of full-day kindergarten used data collected through the U.S. Department of Education National Center for Education Statistics Early Childhood Lon-gitudinal Study–Kindergarten, which was designed in part to assess the value added of kindergarten. The students in the study came from diverse socioeconomic and racial/ethnic backgrounds. DeCicca (2007) included 714 public schools in his study, whereas Lee, Burkam, Ready, Honigman, and Meisels (2006) included 504 public schools (table D9). Information about the type of academic instruction included in the expanded part of the school day was not included in the studies.
KindergARTen Summer Camp
Borman, Goetz, and Dowling (2008) conducted an evaluation of the KindergARTen Summer Camp program, which was designed to boost reading achievement among low- income students in Baltimore, Maryland (table D10). The program, which was funded by a Maryland State Department of Education 21st Century Community Learning Centers grant, was developed by the Center for Art. Students participated in daily literacy activi-ties that included word study, shared reading, interactive writing, guided reading, and inde-pendent writing. During the rest of the day, students participated in physical activity and science and art classes. The art classes were designed with the input of an art teacher and a community artist. The instructors were a certified teacher and college student interns.
Table D8. Effect size for Extended Learning Opportunities
Type of increased learning timeOutcome Hedges’ g Grades Domain
Reading level 0.042 Summer school Elementary Literacy achievement
Source: Authors’ calculations based on data obtained through the literature search and screening process.
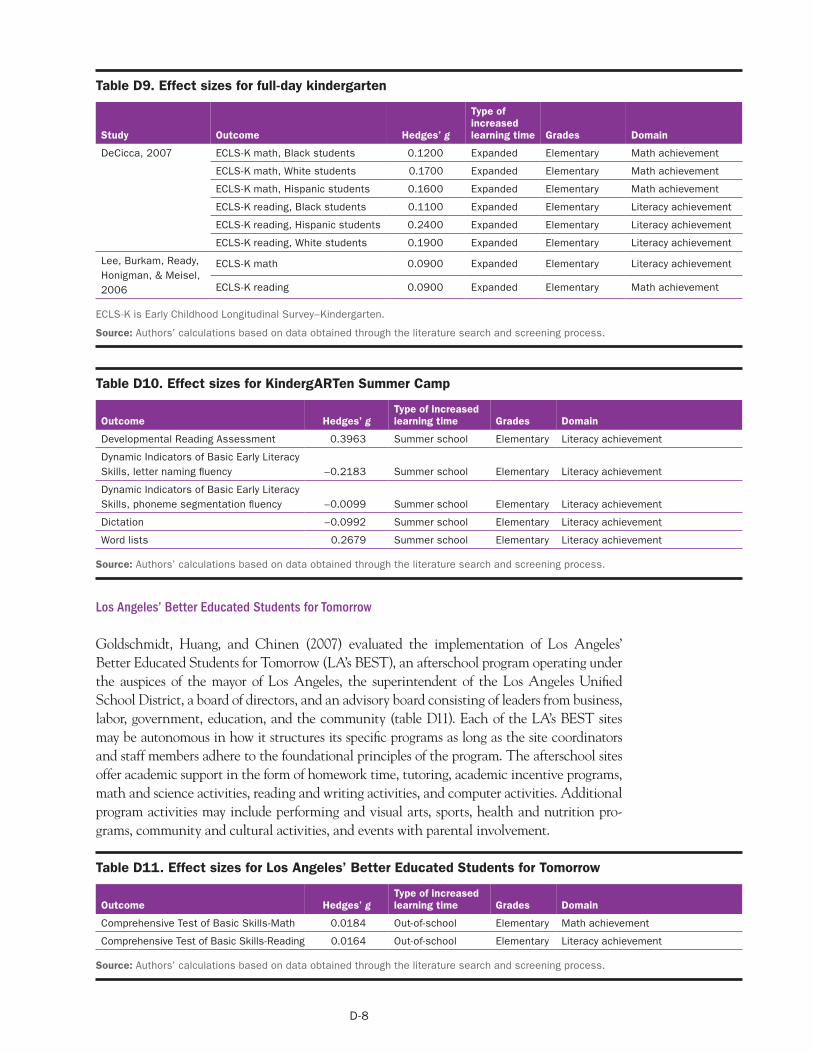
D-8
Table D9. Effect sizes for full‑day kindergarten
Study Outcome Hedges’ g
Type of increased learning time Grades Domain
DeCicca, 2007 ECLS-K math, Black students 0.1200 Expanded Elementary Math achievement
ECLS-K math, White students 0.1700 Expanded Elementary Math achievement
ECLS-K math, Hispanic students 0.1600 Expanded Elementary Math achievement
ECLS-K reading, Black students 0.1100 Expanded Elementary Literacy achievement
ECLS-K reading, Hispanic students 0.2400 Expanded Elementary Literacy achievement
ECLS-K reading, White students 0.1900 Expanded Elementary Literacy achievement
Lee, Burkam, Ready, Honigman, & Meisel, 2006
ECLS-K math 0.0900 Expanded Elementary Literacy achievement
ECLS-K reading 0.0900 Expanded Elementary Math achievement
ECLS-K is Early Childhood Longitudinal Survey–Kindergarten.
Source: Authors’ calculations based on data obtained through the literature search and screening process.
Table D10. Effect sizes for KindergARTen Summer Camp
Outcome Hedges’ gType of increased learning time Grades Domain
Developmental Reading Assessment 0.3963 Summer school Elementary Literacy achievement
Dynamic Indicators of Basic Early Literacy Skills, letter naming fluency –0.2183 Summer school Elementary Literacy achievement
Dynamic Indicators of Basic Early Literacy Skills, phoneme segmentation fluency –0.0099 Summer school Elementary Literacy achievement
Dictation –0.0992 Summer school Elementary Literacy achievement
Word lists 0.2679 Summer school Elementary Literacy achievement
Source: Authors’ calculations based on data obtained through the literature search and screening process.
Los Angeles’ Better Educated Students for Tomorrow
Goldschmidt, Huang, and Chinen (2007) evaluated the implementation of Los Angeles’ Better Educated Students for Tomorrow (LA’s BEST), an afterschool program operating under the auspices of the mayor of Los Angeles, the superintendent of the Los Angeles Unified School District, a board of directors, and an advisory board consisting of leaders from business, labor, government, education, and the community (table D11). Each of the LA’s BEST sites may be autonomous in how it structures its specific programs as long as the site coordinators and staff members adhere to the foundational principles of the program. The afterschool sites offer academic support in the form of homework time, tutoring, academic incentive programs, math and science activities, reading and writing activities, and computer activities. Additional program activities may include performing and visual arts, sports, health and nutrition pro-grams, community and cultural activities, and events with parental involvement.
Table D11. Effect sizes for Los Angeles’ Better Educated Students for Tomorrow
Outcome Hedges’ gType of increased learning time Grades Domain
Comprehensive Test of Basic Skills-Math 0.0184 Out-of-school Elementary Math achievement
Comprehensive Test of Basic Skills-Reading 0.0164 Out-of-school Elementary Literacy achievement
Source: Authors’ calculations based on data obtained through the literature search and screening process.
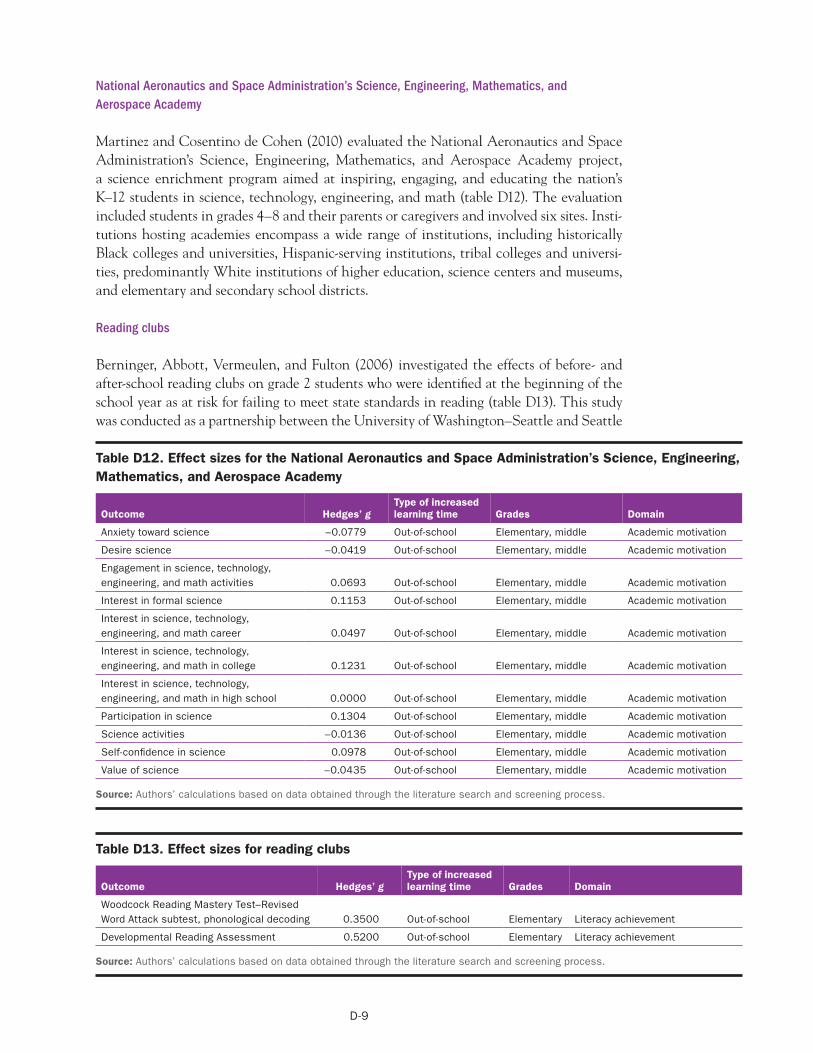
D-9
National Aeronautics and Space Administration’s Science, Engineering, Mathematics, and Aerospace Academy
Martinez and Cosentino de Cohen (2010) evaluated the National Aeronautics and Space Administration’s Science, Engineering, Mathematics, and Aerospace Academy project, a science enrichment program aimed at inspiring, engaging, and educating the nation’s K–12 students in science, technology, engineering, and math (table D12). The evaluation included students in grades 4–8 and their parents or caregivers and involved six sites. Insti-tutions hosting academies encompass a wide range of institutions, including historically Black colleges and universities, Hispanic-serving institutions, tribal colleges and universi-ties, predominantly White institutions of higher education, science centers and museums, and elementary and secondary school districts.
Reading clubs
Berninger, Abbott, Vermeulen, and Fulton (2006) investigated the effects of before- and after-school reading clubs on grade 2 students who were identified at the beginning of the school year as at risk for failing to meet state standards in reading (table D13). This study was conducted as a partnership between the University of Washington–Seattle and Seattle
Table D12. Effect sizes for the National Aeronautics and Space Administration’s Science, Engineering, Mathematics, and Aerospace Academy
Outcome Hedges’ gType of increased learning time Grades Domain
Anxiety toward science –0.0779 Out-of-school Elementary, middle Academic motivation
Desire science –0.0419 Out-of-school Elementary, middle Academic motivation
Engagement in science, technology, engineering, and math activities 0.0693 Out-of-school Elementary, middle Academic motivation
Interest in formal science 0.1153 Out-of-school Elementary, middle Academic motivation
Interest in science, technology, engineering, and math career 0.0497 Out-of-school Elementary, middle Academic motivation
Interest in science, technology, engineering, and math in college 0.1231 Out-of-school Elementary, middle Academic motivation
Interest in science, technology, engineering, and math in high school 0.0000 Out-of-school Elementary, middle Academic motivation
Participation in science 0.1304 Out-of-school Elementary, middle Academic motivation
Science activities –0.0136 Out-of-school Elementary, middle Academic motivation
Self-confidence in science 0.0978 Out-of-school Elementary, middle Academic motivation
Value of science –0.0435 Out-of-school Elementary, middle Academic motivation
Source: Authors’ calculations based on data obtained through the literature search and screening process.
Table D13. Effect sizes for reading clubs
Outcome Hedges’ gType of increased learning time Grades Domain
Woodcock Reading Mastery Test–Revised Word Attack subtest, phonological decoding 0.3500 Out-of-school Elementary Literacy achievement
Developmental Reading Assessment 0.5200 Out-of-school Elementary Literacy achievement
Source: Authors’ calculations based on data obtained through the literature search and screening process.
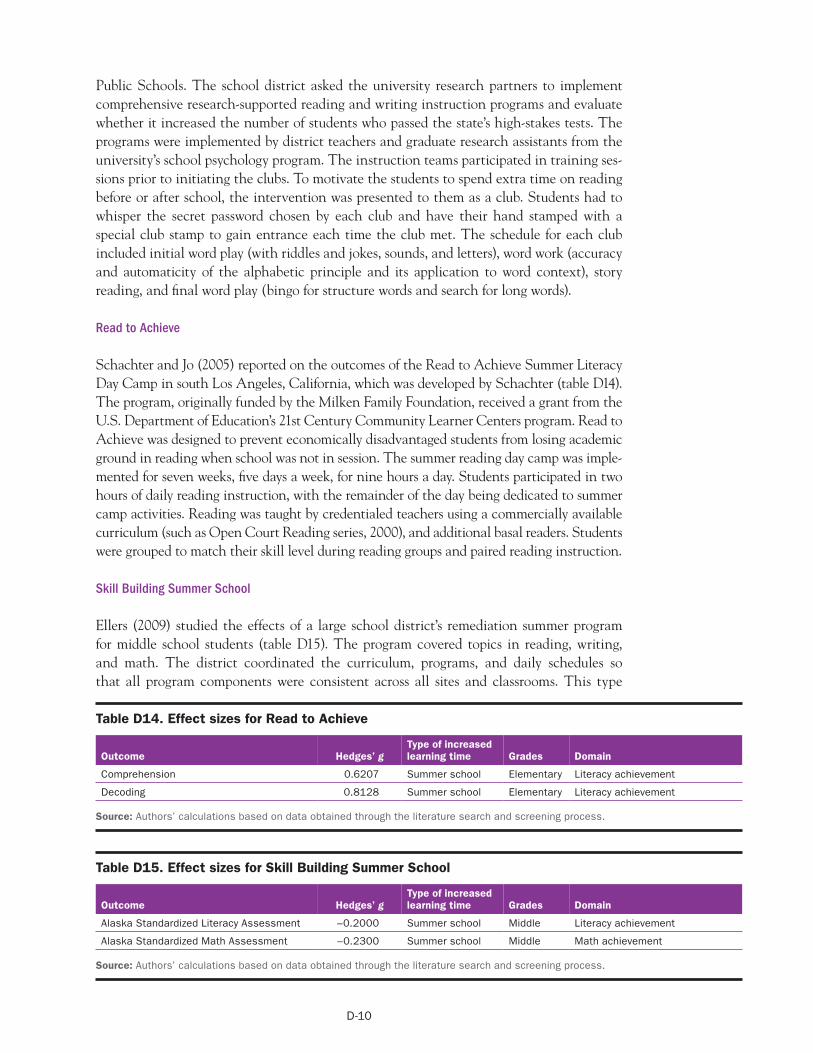
D-10
Public Schools. The school district asked the university research partners to implement comprehensive research-supported reading and writing instruction programs and evaluate whether it increased the number of students who passed the state’s high-stakes tests. The programs were implemented by district teachers and graduate research assistants from the university’s school psychology program. The instruction teams participated in training ses-sions prior to initiating the clubs. To motivate the students to spend extra time on reading before or after school, the intervention was presented to them as a club. Students had to whisper the secret password chosen by each club and have their hand stamped with a special club stamp to gain entrance each time the club met. The schedule for each club included initial word play (with riddles and jokes, sounds, and letters), word work (accuracy and automaticity of the alphabetic principle and its application to word context), story reading, and final word play (bingo for structure words and search for long words).
Read to Achieve
Schachter and Jo (2005) reported on the outcomes of the Read to Achieve Summer Literacy Day Camp in south Los Angeles, California, which was developed by Schachter (table D14). The program, originally funded by the Milken Family Foundation, received a grant from the U.S. Department of Education’s 21st Century Community Learner Centers program. Read to Achieve was designed to prevent economically disadvantaged students from losing academic ground in reading when school was not in session. The summer reading day camp was imple-mented for seven weeks, five days a week, for nine hours a day. Students participated in two hours of daily reading instruction, with the remainder of the day being dedicated to summer camp activities. Reading was taught by credentialed teachers using a commercially available curriculum (such as Open Court Reading series, 2000), and additional basal readers. Students were grouped to match their skill level during reading groups and paired reading instruction.
Skill Building Summer School
Ellers (2009) studied the effects of a large school district’s remediation summer program for middle school students (table D15). The program covered topics in reading, writing, and math. The district coordinated the curriculum, programs, and daily schedules so that all program components were consistent across all sites and classrooms. This type
Table D14. Effect sizes for Read to Achieve
Type of increased learning timeOutcome Hedges’ g Grades Domain
Comprehension 0.6207 Summer school Elementary Literacy achievement
Decoding 0.8128 Summer school Elementary Literacy achievement
Source: Authors’ calculations based on data obtained through the literature search and screening process.
Table D15. Effect sizes for Skill Building Summer School
Outcome Hedges’ gType of increased learning time Grades Domain
Alaska Standardized Literacy Assessment –0.2000 Summer school Middle Literacy achievement
Alaska Standardized Math Assessment –0.2300 Summer school Middle Math achievement
Source: Authors’ calculations based on data obtained through the literature search and screening process.
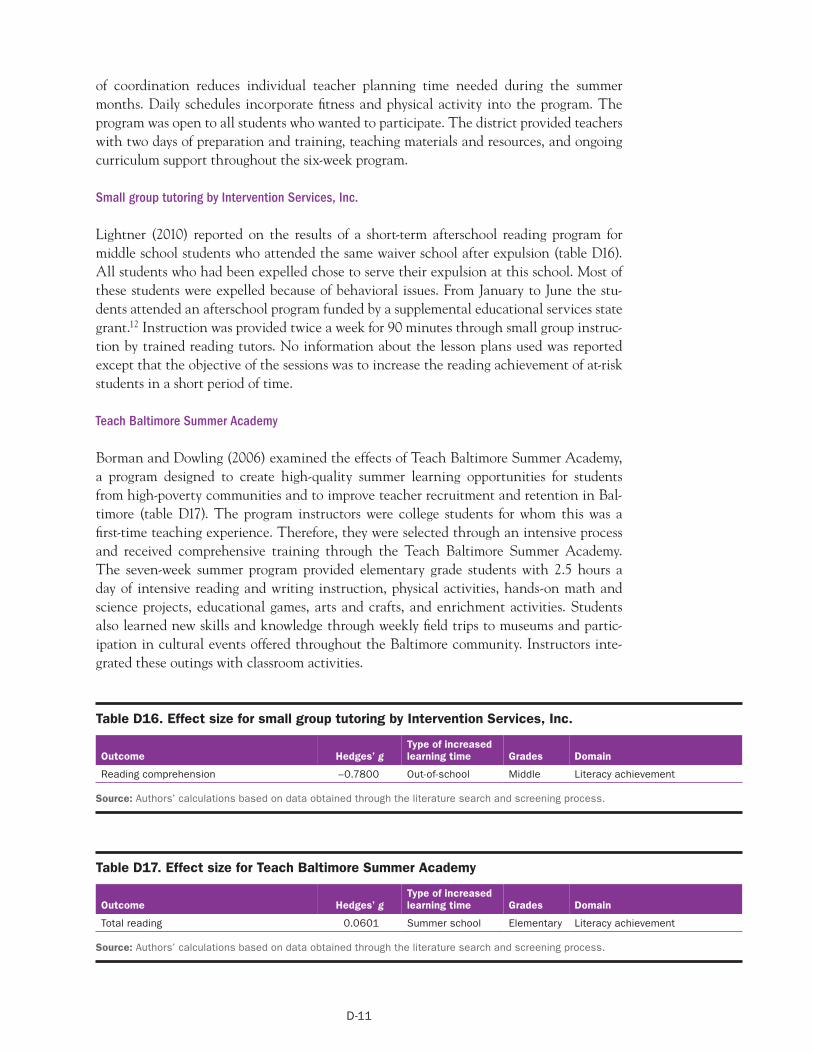
D-11
of coordination reduces individual teacher planning time needed during the summer months. Daily schedules incorporate fitness and physical activity into the program. The program was open to all students who wanted to participate. The district provided teachers with two days of preparation and training, teaching materials and resources, and ongoing curriculum support throughout the six-week program.
Small group tutoring by Intervention Services, Inc.
Lightner (2010) reported on the results of a short-term afterschool reading program for middle school students who attended the same waiver school after expulsion (table D16). All students who had been expelled chose to serve their expulsion at this school. Most of these students were expelled because of behavioral issues. From January to June the stu-dents attended an afterschool program funded by a supplemental educational services state grant.12 Instruction was provided twice a week for 90 minutes through small group instruc-tion by trained reading tutors. No information about the lesson plans used was reported except that the objective of the sessions was to increase the reading achievement of at-risk students in a short period of time.
Teach Baltimore Summer Academy
Borman and Dowling (2006) examined the effects of Teach Baltimore Summer Academy, a program designed to create high-quality summer learning opportunities for students from high-poverty communities and to improve teacher recruitment and retention in Bal-timore (table D17). The program instructors were college students for whom this was a first-time teaching experience. Therefore, they were selected through an intensive process and received comprehensive training through the Teach Baltimore Summer Academy. The seven-week summer program provided elementary grade students with 2.5 hours a day of intensive reading and writing instruction, physical activities, hands-on math and science projects, educational games, arts and crafts, and enrichment activities. Students also learned new skills and knowledge through weekly field trips to museums and partic-ipation in cultural events offered throughout the Baltimore community. Instructors inte-grated these outings with classroom activities.
Table D16. Effect size for small group tutoring by Intervention Services, Inc.
Type of increased learning timeOutcome Hedges’ g Grades Domain
Reading comprehension –0.7800 Out-of-school Middle Literacy achievement
Source: Authors’ calculations based on data obtained through the literature search and screening process.
Table D17. Effect size for Teach Baltimore Summer Academy
Type of increased learning timeOutcome Hedges’ g Grades Domain
Total reading 0.0601 Summer school Elementary Literacy achievement
Source: Authors’ calculations based on data obtained through the literature search and screening process.
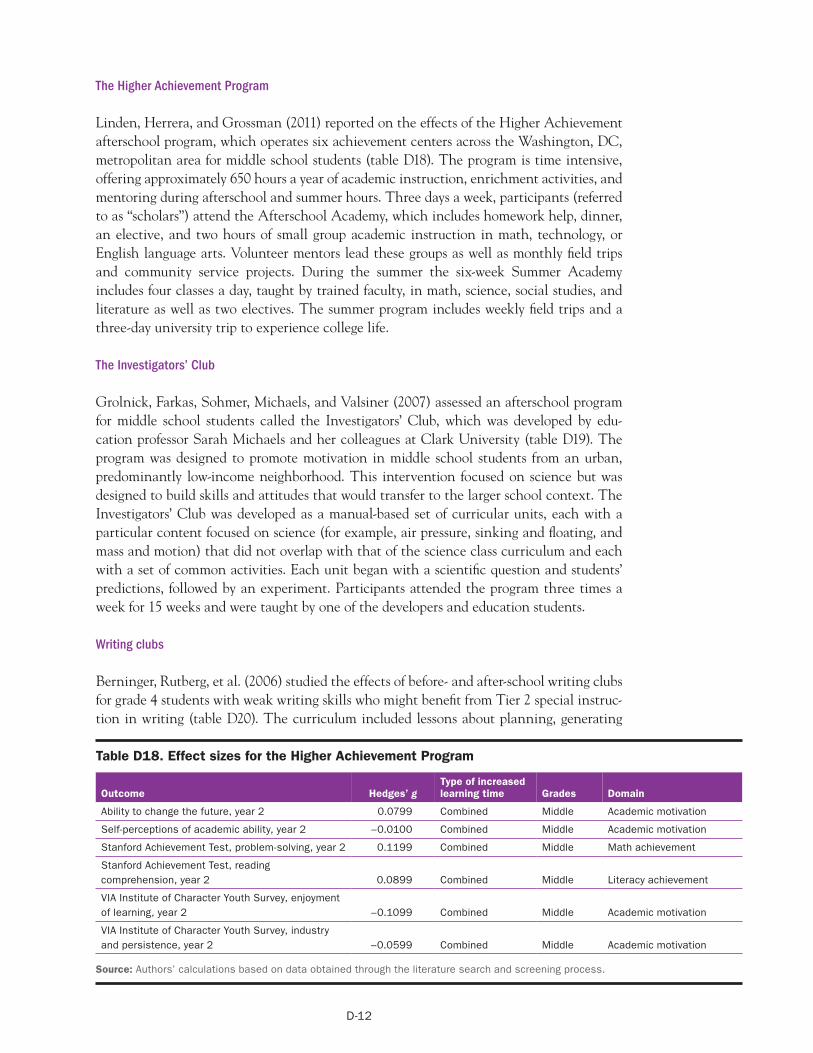
D-12
The Higher Achievement Program
Linden, Herrera, and Grossman (2011) reported on the effects of the Higher Achievement afterschool program, which operates six achievement centers across the Washington, DC, metropolitan area for middle school students (table D18). The program is time intensive, offering approximately 650 hours a year of academic instruction, enrichment activities, and mentoring during afterschool and summer hours. Three days a week, participants (referred to as “scholars”) attend the Afterschool Academy, which includes homework help, dinner, an elective, and two hours of small group academic instruction in math, technology, or English language arts. Volunteer mentors lead these groups as well as monthly field trips and community service projects. During the summer the six-week Summer Academy includes four classes a day, taught by trained faculty, in math, science, social studies, and literature as well as two electives. The summer program includes weekly field trips and a three-day university trip to experience college life.
The Investigators’ Club
Grolnick, Farkas, Sohmer, Michaels, and Valsiner (2007) assessed an afterschool program for middle school students called the Investigators’ Club, which was developed by edu-cation professor Sarah Michaels and her colleagues at Clark University (table D19). The program was designed to promote motivation in middle school students from an urban, predominantly low-income neighborhood. This intervention focused on science but was designed to build skills and attitudes that would transfer to the larger school context. The Investigators’ Club was developed as a manual-based set of curricular units, each with a particular content focused on science (for example, air pressure, sinking and floating, and mass and motion) that did not overlap with that of the science class curriculum and each with a set of common activities. Each unit began with a scientific question and students’ predictions, followed by an experiment. Participants attended the program three times a week for 15 weeks and were taught by one of the developers and education students.
Writing clubs
Berninger, Rutberg, et al. (2006) studied the effects of before- and after-school writing clubs for grade 4 students with weak writing skills who might benefit from Tier 2 special instruc-tion in writing (table D20). The curriculum included lessons about planning, generating
Table D18. Effect sizes for the Higher Achievement Program
Outcome Hedges’ gType of increased learning time Grades Domain
Ability to change the future, year 2 0.0799 Combined Middle Academic motivation
Self-perceptions of academic ability, year 2 –0.0100 Combined Middle Academic motivation
Stanford Achievement Test, problem-solving, year 2 0.1199 Combined Middle Math achievement
Stanford Achievement Test, reading comprehension, year 2 0.0899 Combined Middle Literacy achievement
VIA Institute of Character Youth Survey, enjoyment of learning, year 2 –0.1099 Combined Middle Academic motivation
VIA Institute of Character Youth Survey, industry and persistence, year 2 –0.0599 Combined Middle Academic motivation
Source: Authors’ calculations based on data obtained through the literature search and screening process.
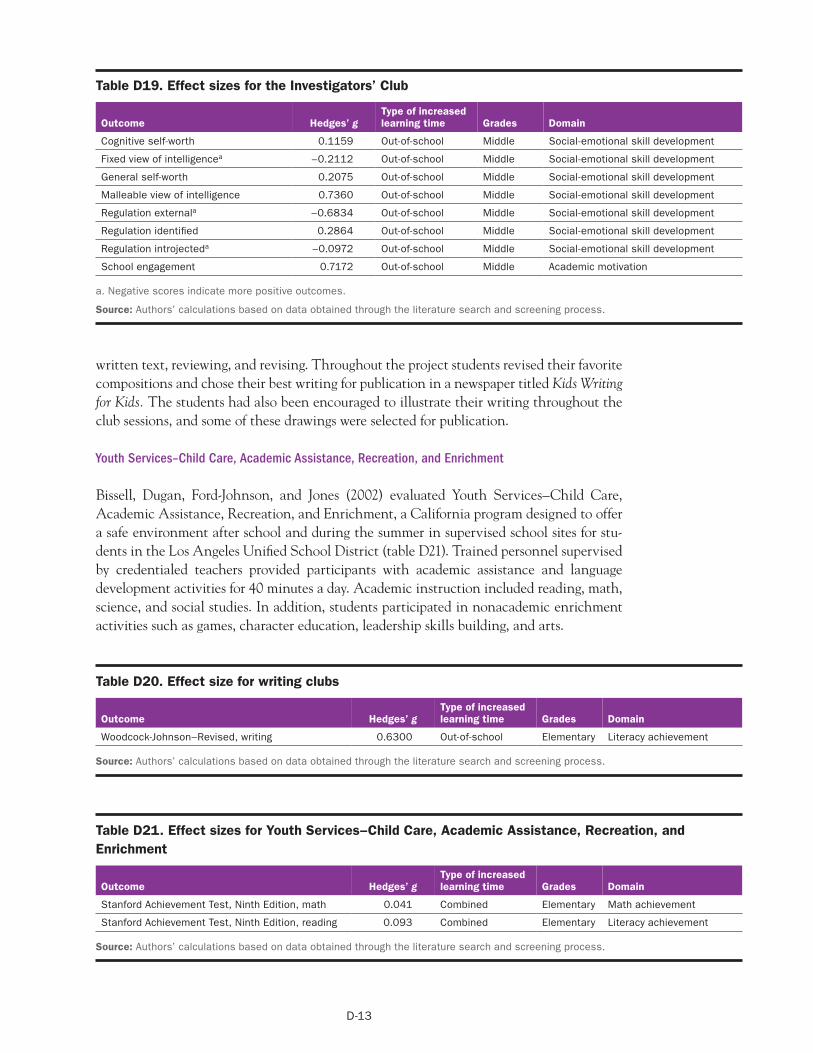
D-13
Youth Services–Child Care, Academic Assistance, Recreation, and Enrichment
Bissell, Dugan, Ford-Johnson, and Jones (2002) evaluated Youth Services–Child Care, Academic Assistance, Recreation, and Enrichment, a California program designed to offer a safe environment after school and during the summer in supervised school sites for stu-dents in the Los Angeles Unified School District (table D21). Trained personnel supervised by credentialed teachers provided participants with academic assistance and language development activities for 40 minutes a day. Academic instruction included reading, math, science, and social studies. In addition, students participated in nonacademic enrichment activities such as games, character education, leadership skills building, and arts.
Table D20. Effect size for writing clubs
Table D19. Effect sizes for the Investigators’ Club
Outcome Hedges’ gType of increased learning time Grades Domain
Cognitive self-worth 0.1159 Out-of-school Middle Social-emotional skill development
Fixed view of intelligencea –0.2112 Out-of-school Middle Social-emotional skill development
General self-worth 0.2075 Out-of-school Middle Social-emotional skill development
Malleable view of intelligence 0.7360 Out-of-school Middle Social-emotional skill development
Regulation externala –0.6834 Out-of-school Middle Social-emotional skill development
Regulation identified 0.2864 Out-of-school Middle Social-emotional skill development
Regulation introjecteda –0.0972 Out-of-school Middle Social-emotional skill development
School engagement 0.7172 Out-of-school Middle Academic motivation
a. Negative scores indicate more positive outcomes.
Source: Authors’ calculations based on data obtained through the literature search and screening process.
written text, reviewing, and revising. Throughout the project students revised their favorite compositions and chose their best writing for publication in a newspaper titled Kids Writing for Kids. The students had also been encouraged to illustrate their writing throughout the club sessions, and some of these drawings were selected for publication.
Type of increased learning timeOutcome Hedges’ g Grades Domain
Woodcock-Johnson–Revised, writing 0.6300 Out-of-school Elementary Literacy achievement
Source: Authors’ calculations based on data obtained through the literature search and screening process.
Table D21. Effect sizes for Youth Services–Child Care, Academic Assistance, Recreation, and Enrichment
Outcome Hedges’ gType of increased learning time Grades Domain
Stanford Achievement Test, Ninth Edition, math 0.041 Combined Elementary Math achievement
Stanford Achievement Test, Ninth Edition, reading 0.093 Combined Elementary Literacy achievement
Source: Authors’ calculations based on data obtained through the literature search and screening process.
Notes-1
Notes
1. This review follows the guidelines suggested by Cohen (1988): an effect size of 0.01–0.49 is a small effect, an effect size of 0.50–0.79 is a medium effect, and an effect size of 0.80 or larger is a large effect.
2. As discussed in appendix A, findings were subjected to adjustments to the tails of effect size distributions as a means of sensitivity testing. The summary effect sizes presented in this and the following sections do not change when those adjustments are made.
3. All studies that included students with ADHD evaluated the same afterschool program, the Challenging Horizons Program.
4. The exact number of unique reports is difficult to determine given the numerous dupli-cates that appeared in multiple databases and the practice among some researchers to have multiple reports on the same study or multiple reports using the same indepen-dent sample.
5. This review aimed to assess the benefits of adding time for learning beyond the regular school day, so a comparison group was defined as “students who did not receive addi-tional academic instruction beyond the regular school day.”
6. “Published” was defined as made available through a publication vehicle that is mass disseminated, such as a book, book chapter, academic journal, newspaper, magazine, or collateral material widely disseminated by foundations or professional organizations. Unpublished reports are those that summarize a research study but have not been sub-mitted to one of the above mentioned publication vehicles (examples include doctoral dissertations, conference presentations, reports on organizations’ websites, or reports written by researchers but never submitted for publication).
7. The WWC is a repository of studies regarding education-related topics that meet certain standards of evidence. The U.S. Department of Education’s Institute of Edu-cation Sciences uses a competitive bidding process to choose a contractor to establish and refine research standards and to oversee topic area reviews of studies. The con-tractor releases numerous products every year. For more information about WWC, see www.whatworks.ed.gov.
8. It is not possible to combine studies that assigned schools to conditions and analyzed data at the school level with studies that assigned students to conditions and analyzed the data at the student level or at multiple levels. The standard deviations in studies that analyzed student-level data tend to be larger than the standard deviations in studies that analyzed school-level data. Consequently, effect sizes based on school-level data tend to be larger than effect sizes based on student-level data. Therefore, studies involving school-level assignment and analyses were omitted from this review.
9. For methods of converting other types of statistics into Hedges’ g, see What Works Clearinghouse (2010), pages 37–41.
10. All analyses were conducted using Comprehensive Meta-Analysis software, Version 2 (Borenstein et al., 2005).
11. Hedges (2009) provides additional equations that accommodate for the hierarchical nature of data often found in education settings (such as when classrooms are assigned to conditions but data analysis is conducted at the student level). None of the studies in this increased learning time review used multiple units of analysis.
12. Supplemental education services is a program funded by the U.S. Department of Edu-cation that appropriates money to state education agencies to support extra academic instruction through before- or after-school, weekend, or summer tutoring and remedia-tion programs (http://www2.ed.gov/nclb/choice/help/ses/description.html).
Ref-1
References
References marked with an asterisk indicate studies included in the meta-analysis.
Allington, R. (2010). Addressing summer reading setback among economically disad-vantaged elementary students. Reading Psychology, 31(5), 411–427. http://eric.ed.gov/ ?id=EJ900788
American Psychiatric Association. (2000). Diagnostic and statistical manual of mental disor-ders (4th ed., text rev.). Washington, DC: Author.
*August, G. J., Realmuto, G. M., Hektner, J. M., & Bloomquist, M. L. (2001). An integrat-ed components preventive intervention for aggressive elementary school children: The Early Risers program. Journal of Consulting and Clinical Psychology, 69(4), 614–626.
Beckett, M., Borman, G., Capizzano, J., Parsley, D., Ross, S., Schirm, A., et al. (2009). Structuring out-of-school time to improve academic achievement: A practice guide (NCEE 2009–012). Washington, DC: U.S. Department of Education, Institute of Education Sciences, National Center for Education Evaluation and Regional Assistance. http://eric.ed.gov/?id=ED505962
*Berninger, V. W., Abbott, R. D., Vermeulen, K., & Fulton, C. M. (2006). Paths to reading comprehension in at-risk second-grade readers. Journal of Learning Disabilities, 39(4), 334–351. http://eric.ed.gov/?id=EJ757962
*Berninger, V. W., Rutberg, J. E., Abbott, R. D., Garcia, N., Anderson-Youngstrom, M., Brooks, A., et al. (2006). Tier 1 and tier 2 early intervention for handwriting and com-posing. Journal of School Psychology, 44(1), 3–30. http://eric.ed.gov/?id=EJ729898
*Bissell, J. S., Dugan, C., Ford-Johnson, A., & Jones, P. (2002). Evaluation of the YS-CARE afterschool program for California Work Opportunity and Responsibility to Kids (CalWORKS). Irvine, CA: University of California–Irvine, Department of Education.
*Black, A. R., Somers, M.-A., Doolittle, F., Unterman, R., & Grossman, J. B. (2009a). The evaluation of enhanced academic instruction in afterschool programs: Final report (NCEE 2009–4077). Washington, DC: U.S. Department of Education, Institute of Education Sciences, National Center for Education Evaluation and Regional Assistance. (Math Intervention Study) http://eric.ed.gov/?id=ED506725
*Black, A. R., Somers, M.-A., Doolittle, F., Unterman, R., & Grossman, J. B. (2009b). The evaluation of enhanced academic instruction in afterschool programs: Final report (NCEE 2009–4077). Washington, DC: U.S. Department of Education, Institute of Educa-tion Sciences, National Center for Education Evaluation and Regional Assistance. (Reading Intervention Study) http://eric.ed.gov/?id=ED506725
Bloom, B., Cohen, R. A., & Freeman, G. (2012). Summary health statistics for U.S. chil-dren: National Health Interview Survey, 2011. Vital and Health Statistics, 10, 254.
Ref-2
Borenstein, M., Hedges, L., Higgins, J., & Rothstein, H. (2005). Comprehensive meta-analy-sis: Version 2. Englewood, NJ: Biostat.
Borenstein, M., Hedges, L., & Rothstein, H. (2007). Introduction to meta-analysis. Retrieved November 6, 2012, from http://www.metaanalysis.com/downloads/Meta%20Analysis%20Fixed%20vs%20Random%20effects.pdf
*Borman, G. D., & Dowling, N. M. (2006). Longitudinal achievement effects of multiyear summer school: Evidence from the Teach Baltimore randomized field trial. Educational Evaluation and Policy Analysis, 28(1), 25–48. http://eric.ed.gov/?id=EJ750483
*Borman, G. D., Goetz, M. E., & Dowling, N. M. (2008). Halting the summer achievement slide: A randomized field trial of the KindergARTen summer camp. Journal of Educa-tion for Students Placed At Risk, 14(2), 133–147. http://eric.ed.gov/?id=EJ855750
Cohen, J. (1988). Statistical power analysis for the behavioral sciences (2nd ed.). Hillsdale, NJ: Lawrence Earlbaum Associates.
Cohn, L. D., & Becker, B. J. (2003). How meta-analysis increases statistical power. Psycho-logical Methods, 8(3), 243–253.
Cooper, H. M. (2009). Research synthesis and meta-analysis (4th ed.). Thousand Oaks, CA: Sage.
Cooper, H. M., Allen, A., Patall, E. A., & Dent, A. L. (2010). Effects of full-day kindergar-ten on academic achievement and social development. Review of Educational Research, 80(1), 34–70. http://eric.ed.gov/?id=EJ879414
Cooper, H. M., Charlton, K., Valentine, J. C., & Muhlenbruck, L. (2000). Making the most of summer school: A meta-analytic and narrative review. Monographs of the Society for Research in Child Development, 65(1), 1–118. http://eric.ed.gov/?id=EJ630022
Cooper, H. M., Nye, B., Charlton, K., Lindsay, J., & Greathouse, S. (1996). The effects of summer vacation on student achievement test scores: A narrative and meta-analytic review. Review of Educational Research, 66(3), 227–268.
Cross, A., Gottfredson, D. C., Wilson, D. M., Rorie, M., & Connell, N. (2010). Implemen-tation quality and positive experiences in afterschool programs. American Journal of Community Psychology, 45(3/4), 370–380.
Davies, S.C., & Peltz, L.J. (2012). At-risk students in after-school programs: Outcomes and recommendations. Principal Leadership, 13(2), 12–16.
*DeCicca, P. (2007). Does full-day kindergarten matter? Evidence from the first two years of schooling. Economics of Education Review, 26(1), 67–82. http://eric.ed.gov/ ?id=EJ749462
Ref-3
Downey, D. B., von Hippel, P. T., & Broh, B. A. (2004). Are schools the great equalizer? Cognitive inequality during the summer months and the school year. American Socio-logical Review, 69(5), 613–635.
Durlak, J. A., Weissberg, R. P., & Pachan, M. (2010). A meta-analysis of afterschool pro-grams that seek to promote personal and social skills in children and adolescents. American Journal of Community Psychology, 45(3/4), 294–309.
*Ellers, S. L. (2009). The effects of a standards-based middle-level summer school program as an intervention to increase academic achievement as measured by standards-based assessment. Unpublished doctoral dissertation, Capella University, Minneapolis, MN.
*Evans, S. W., Schultz, B. K., DeMars, C. E., & Davis, H. (2011). Effectiveness of the Chal-lenging Horizons Afterschool Program for young adolescents with ADHD. Behavior Therapy, 42(3), 462–474. http://eric.ed.gov/?id=EJ928834
Finkelstein, N. D., & Mayhew, L. (2008). Acting in our own self-interests: Blending uni-versity and community in informal science education. AIP Conference Proceedings, 1064(1), 19–22.
Friedman, L. N., & Bleiberg, M. S. (2007). Meeting the high school challenge: Making after-school work for older students. New York, NY: The After-School Corporation.
Gersten, R., Beckmann, S., Clarke, B., Foegen, A., Marsh, L., Star, J. R., et al. (2009). Assisting students struggling with mathematics: Response to intervention (RtI) for elemen-tary and middle schools: A practice guide (NCEE 2009–4060). Washington, DC: U.S. Department of Education, Institute of Education Sciences, National Center for Educa-tion Evaluation and Regional Assistance. http://eric.ed.gov/?id=ED504995
Gersten, R., Compton, D., Connor, C. M., Dimino, J., Santoro, L., Linan-Thompson, S., et al. (2008). Assisting students struggling with reading: Response to intervention and multitier intervention for reading in the primary grades: A practice guide (NCEE 2009–4045). Washington, DC: U.S. Department of Education, Institute of Education Sci-ences, National Center for Education Evaluation and Regional Assistance. http://eric.ed.gov/?id=ED504264
*Goldschmidt, P., Huang, D., & Chinen, M. (2007). The long-term effects of afterschool programming on educational adjustment and juvenile crime: A study of the L.A.’s BEST afterschool program. Los Angeles: U.S. Department of Justice, National Institute of Justice, National Center for Research on Evaluation, Standards, and Student Testing (CRESST).
*Gottfredson, D. C., Cross, A. B., Wilson, D., Rorie, M., & Connell, N. (2010). Effects of participation in afterschool programs for middle school students: A randomized trial. Journal of Research on Educational Effectiveness, 3(3), 282–313. http://eric.ed.gov/?id= EJ888772
Grineski, S. (2003). A university and community-based partnership: After-school mentor-ing for low-income youth. The School Community Journal, 13(1), 101–114.
Ref-4
*Grolnick, W. S., Farkas, M. S., Sohmer, R., Michaels, S., & Valsiner, J. (2007). Facilitating motivation in young adolescents: Effects of an afterschool program. Journal of Applied Developmental Psychology, 28(4), 332–344. http://eric.ed.gov/?id=EJ769421
Hammer, P. C., & White, L. J. (2012). 21st Century Community Learning Centers: A descrip-tive evaluation for 2011–2012. Charleston, WV: West Virginia Board of Education.
Hedges, L. V. (2009). Effect sizes in nested designs. In H. Cooper, L. V. Hedges, & J. C. Valentine (Eds.), The handbook of research synthesis and meta-analysis (2nd ed., pp. 337–355). New York: Russell Sage Foundation.
Hill, C. J., Bloom, H. S., Black, A. R., and Lipsey, M. W. (2008). Empirical benchmarks for interpreting effect sizes in research. Child Development Perspectives, 2(3), 172–177.
*Hirsch, B. J., Hedges L. V., Stawicki, J., & Mekinda, M. (2011). Afterschool programs for high school students: An evaluation of After School Matters. Evanston, IL: Northwest-ern University. Retrieved November 6, 2012, from http://www.wallacefoundation.org/knowledge-center/after-school/evaluations/Pages/After-School-Programs-for-High -School-Students-An-Evaluation-of-After-School-Matters.aspx
*Hobbs, C. L. (2012). Effects of an afterschool program on elementary and middle school math achievement in Georgia schools. Unpublished doctoral dissertation, Liberty University, Lynchburg, VA.
*James-Burdumy, S., Dynarski, M., Moore, M., Deke, J., Mansfield, W., & Pistorino, C. (2005a). When schools stay open late: The national evaluation of the 21st Century Com-munity Learning Centers program: Final report. Washington, DC: U.S. Department of Education, Institute of Education Sciences, National Center for Education Evaluation and Regional Assistance. (Elementary Grades Study) http://eric.ed.gov/?id=ED485162
*James-Burdumy, S., Dynarski, M., Moore, M., Deke, J., Mansfield, W., & Pistorino, C. (2005b). When schools stay open late: The national evaluation of the 21st Century Com-munity Learning Centers program: Final report. Washington, DC: U.S. Department of Education, Institute of Education Sciences, National Center for Education Evaluation and Regional Assistance. (Middle Grades Study) http://eric.ed.gov/?id=ED485162
*Jenner, E., & Jenner, L. W. (2007). Results from a first-year evaluation of academic impacts of an afterschool program for at-risk students. Journal of Education for Students Placed At Risk, 12(2), 213–237. http://eric.ed.gov/?id=EJ780932
*Kauh, T. J. (2011). Afterzone: Outcomes for youth participating in Providence’s citywide afterschool system. New York: Public/Private Ventures. http://eric.ed.gov/?id=ED522983
Khashu, A., & Dougherty, N. L. (2007). Staffing practices of high-quality afterschool programs. Retrieved May 6, 2013, from http://www.mdecgateway.org/olms/data/resource/4425/TASC%20Staffing%20Practices_4.pdf
Ref-5
King, H. M., Kemp, A. M., Muller, P. A., Simmons, A. B., & Gorrell, L. L. (2005). Evalua-tion of Kentucky 21st Century Community Learning Centers year 2 interim report. Bloom-ington, IN: Center for Evaluation and Education Policy.
Kleiner, B., Porch, R., & Farris, E. (2002). Public alternative schools and programs for students at risk of education failure: 2000–01 (NCES 2002–004). Washington, DC: U.S. Depart-ment of Education, Institute of Education Sciences, National Center for Education Statistics. http://eric.ed.gov/?id=EJ665524
*Langberg, J. M., Epstein, J. N., Urbanowicz, C. M., Simon, J. O., & Graham, A. J. (2008). Efficacy of an organization skills intervention to improve the academic functioning of students with attention-deficit/hyperactivity disorder. School Psychology Quarterly, 23(3), 407–417. http://eric.ed.gov/?id=EJ811150
*Langberg, J. M., Smith, B. H., Bogle, K. E., Schmidt, J. D., Cole, W. R., & Pender, C. A. S. (2006). A pilot evaluation of small-group Challenging Horizons Program (CHP): A randomized trial. Journal of Applied School Psychology, 23(1), 31–58. http://eric.ed.gov/?id=EJ755984
Lauer, P. A., Akiba, M., Wilkerson, S. B., Apthorp, H. S., Snow, D., & Martin-Glenn, M. L. (2006). Out-of-school-time programs: A meta-analysis of effects for at-risk students. Review of Educational Research, 76(2), 275–313. http://eric.ed.gov/?id=EJ751154
*Lee, V. E., Burkam, D. T., Ready, D. D., Honigman, J., & Meisels, S. J. (2006). Full-day versus half-day kindergarten: In which program do children learn more? American Journal of Education, 112(2), 163–208. http://eric.ed.gov/?id=EJ750264
*Lightner, P. A. (2010). Expelled middle school students: A study of the effects of a short-term, afterschool reading intervention program. Unpublished doctoral dissertation, Capella University, Minneapolis, MN.
*Linden, L. L., Herrera, C., & Grossman, J. B. (2011). Achieving academic success after school: A randomized evaluation of the Higher Achievement program. Austin, TX: Uni-versity of Texas.
Lipsey, M. W. (2003). Those confounded moderators in meta-analysis: Good, bad, and ugly. Annals of the American Academy of Political and Social Science, 587(1), 69–81.
Lipsey, M. W., & Wilson, D. B. (2001). Practical meta-analysis. Thousand Oaks, CA: Sage.
Mahoney, J. L., Parente, M. E., & Zigler, E. F. (2009). Afterschool programs in America: Origins, growth, popularity, and politics. Journal of Youth Development, 4(3). Retrieved October 19, 2012, from http://www.nsba.org/Board-Leadership/EDLO/ WhatIsExtendedDay/Afterschool-Programs-in-America.pdf
*Martinez, A., & Cosentino de Cohen, C. (2010). The national evaluation of NASA’s Science, Engineering, Mathematics and Aerospace Academy (SEMAA) program. Cam-bridge, MA: Abt Associates.
Ref-6
*Molina, B. S. G., Flory, K., Bukstein, O. G., Greiner, A. R., Baker, J. L., Krug, V., et al. (2008). Feasibility and preliminary efficacy of an afterschool program for middle schoolers with ADHD: A randomized trial in a large public middle school. Journal of Attention Disorders, 12(3), 207–217. http://eric.ed.gov/?id=EJ813175
Petress, K. (2008). What is meant by “active learning”? Education, 128(4), 566–569. http://eric.ed.gov/?id=EJ816939
Reardon, S. F. (2011). The widening academic achievement gap between rich and poor: New evidence and possible explanations. In G. J. Duncan & R. J. Murnane (Eds.), Whither opportunity? Rising inequality, schools, and children’s life chances (pp. 91–115). New York: Russell Sage Foundation.
Redd, Z., Boccanfuso, C., Walker, K., Princiotta, D., Knewstub, D., & Moore, K. (2012). Expanding time for learning both inside and outside the classroom: A review of the evidence base. Washington, DC: Child Trends. http://eric.ed.gov/?id=ED534555
*Schacter, J., & Jo, B. (2005). Learning when school is not in session: A reading summer day-camp intervention to improve the achievement of exiting first-grade students who are economically disadvantaged. Journal of Research in Reading, 28(2), 158–169. http://eric.ed.gov/?id=EJ715458
Stonehill, R. M., Lauver, S. C., Donahue, T., Naftzger, N., McElvain, C. K., & Stephanidis, J. (2011). From after-school to expanded learning: A decade of progress. New Directions for Youth Development, 2011(131), 29–41. http://eric.ed.gov/?id=EJ945493
*Sunmonu, K., Larson, J., Van Horn, Y., Cooper-Martin, E., & Nielsen, J. L. (2002). Evalu-ation of the extended learning opportunities summer program. Rockville, MD: Montgom-ery County Public Schools, Office of Shared Accountability.
Tanner, C. K. (2009). Effects of school design on student outcomes. Journal of Educational Administration, 47(3), 381–399. http://eric.ed.gov/?id=EJ842604
Terzian, M., Moore, K.A., & Hamilton, K. (2009). Effective and promising summer learning programs and approaches for economically-disadvantaged children and youth. White paper for the Wallace Foundation. http://eric.ed.gov/?id=ED506969
Valentine, J. C., Piggot, T. D., & Rothstein, H. R. (2010). How many studies do you need? A primer on statistical power for meta-analysis. Journal of Educational and Behavioral Statistics, 35(2), 215–247. http://eric.ed.gov/?id=EJ883973
VanTassel-Baska, J., & Stambaugh, T. (Eds.). (2007). Overlooked gems: A national perspective on low-income promising learners. Washington, DC: National Association for Gifted Children. http://eric.ed.gov/?id=ED494579
What Works Clearinghouse. (2010). The WWC procedures and standards handbook (version 2.1). Washington, DC: U.S. Department of Education. Retrieved October 19, 2012, from http://ies.ed.gov/ncee/wwc/pdf/reference_resources/wwc_procedures_v2_1_standards _handbook.pdf

Ref-7
Zief, S. G., Lauver, S., & Maynard, R. (2006). The impacts of afterschool programs on student outcomes: A systematic review for the Campbell Collaboration. Retrieved October 15, 2012, from http://www.olc.edu/~jolson/socialwork/OnlineLibrary/GoerlichEtAl(2006)ImpactsOfAfterSchoolProgramsOnStudentOutcomes.pdf
*Zvoch, K., & Stevens, J. J. (2013). Summer school effects in a randomized field trial. Early Childhood Research Quarterly, 28(1), 24–32. http://eric.ed.gov/?id=EJ1007876