Embed Size (px)
Citation preview

Volume 118, 2016, pp. 57–116DOI: 10.1650/CONDOR-15-24.1
RESEARCH ARTICLE
The effects of habitat, climate, and Barred Owls on long-termdemography of Northern Spotted Owls
Katie M. Dugger,1* Eric D. Forsman,2 Alan B. Franklin,3 Raymond J. Davis,2 Gary C. White,4 Carl J. Schwarz,5
Kenneth P. Burnham,4 James D. Nichols,6 James E. Hines,6 Charles B. Yackulic,7 Paul F. Doherty, Jr.,4
Larissa Bailey,4 Darren A. Clark,8 Steven H. Ackers,8 Lawrence S. Andrews,8 Benjamin Augustine,9 Brian L.Biswell,10 Jennifer Blakesley,11 Peter C. Carlson,12 Matthew J. Clement,6 Lowell V. Diller,13 Elizabeth M.Glenn,14 Adam Green,4 Scott A. Gremel,15 Dale R. Herter,16 J. Mark Higley,17 Jeremy Hobson,18 Rob B.Horn,19 Kathryn P. Huyvaert,4 Christopher McCafferty,8 Trent McDonald,20 Kevin McDonnell,8 Gail S.Olson,21 Janice A. Reid,22 Jeremy Rockweit,12 Viviana Ruiz,4 Jessica Saenz,8 and Stan G. Sovern8
1 U.S. Geological Survey, Oregon Cooperative Fish and Wildlife Research Unit, Department of Fisheries and Wildlife, Oregon StateUniversity, Corvallis, Oregon, USA
2 USDA Forest Service, Pacific Northwest Research Station, Forestry Sciences Laboratory, Corvallis, Oregon, USA3 USDA APHIS National Wildlife Research Center, Fort Collins, Colorado, USA4 Department of Fish, Wildlife and Conservation Biology, Colorado State University, Fort Collins, Colorado, USA5 Department of Statistics and Actuarial Science, Simon Fraser University, Burnaby, British Columbia, Canada6 U.S. Geological Survey, Patuxent Wildlife Research Center, Laurel, Maryland, USA7 U.S. Geological Survey, Southwest Biological Science Center, Flagstaff, Arizona, USA8 Oregon Cooperative Fish and Wildlife Research Unit, Department of Fisheries and Wildlife, Oregon State University, Corvallis,
Oregon, USA9 Department of Fish and Wildlife Conservation, Virginia Tech, Blacksburg, Virginia, USA10 USDA Forest Service, Pacific Northwest Research Station, Forestry Sciences Laboratory, Olympia, Washington, USA11 Rocky Mountain Bird Observatory, Fort Collins, Colorado, USA12 Colorado Cooperative Fish and Wildlife Research Unit, Department of Fish, Wildlife and Conservation Biology, Colorado State
University, Fort Collins, Colorado, USA13 Green Diamond Resource Company, Korbel, California, USA14 U.S. Fish and Wildlife Service, Portland, Oregon, USA15 USDI National Park Service, Olympic National Park, Port Angeles, Washington, USA16 Raedeke Associates, Seattle, Washington, USA17 Hoopa Tribal Forestry, Hoopa, California, USA18 USDA Forest Service, Pacific Northwest Region, Springfield, Oregon, USA19 USDI Bureau of Land Management, Roseburg District Office, Roseburg, Oregon, USA20 West, Inc., Laramie, Wyoming, USA21 Washington Department of Fish and Wildlife, Olympia, Washington, USA22 USDA Forest Service, Pacific Northwest Research Station, Roseburg Field Station, Roseburg, Oregon, USA* Corresponding author: [email protected]
Submitted February 17, 2015; Accepted September 18, 2015; Published December 10, 2015
ABSTRACTEstimates of species’ vital rates and an understanding of the factors affecting those parameters over time and spacecan provide crucial information for management and conservation. We used mark–recapture, reproductive output,and territory occupancy data collected during 1985–2013 to evaluate population processes of Northern Spotted Owls(Strix occidentalis caurina) in 11 study areas in Washington, Oregon, and northern California, USA. We estimatedapparent survival, fecundity, recruitment, rate of population change, and local extinction and colonization rates, andinvestigated relationships between these parameters and the amount of suitable habitat, local and regional variationin meteorological conditions, and competition with Barred Owls (Strix varia). Data were analyzed for each areaseparately and in a meta-analysis of all areas combined, following a strict protocol for data collection, preparation, andanalysis. We used mixed effects linear models for analyses of fecundity, Cormack-Jolly-Seber open population modelsfor analyses of apparent annual survival (/), and a reparameterization of the Jolly-Seber capture–recapture model (i.e.reverse Jolly-Seber; RJS) to estimate annual rates of population change (kRJS) and recruitment. We also modeledterritory occupancy dynamics of Northern Spotted Owls and Barred Owls in each study area using 2-species occupancymodels. Estimated mean annual rates of population change (k) suggested that Spotted Owl populations declined from1.2% to 8.4% per year depending on the study area. The weighted mean estimate of k for all study areas was 0.962 (60.019 SE; 95% CI: 0.925–0.999), indicating an estimated range-wide decline of 3.8% per year from 1985 to 2013.
Q 2016 Cooper Ornithological Society. ISSN 0010-5422, electronic ISSN 1938-5129Direct all requests to reproduce journal content to the Central Ornithology Publication Office at [email protected]

Variation in recruitment rates across the range of the Spotted Owl was best explained by an interaction between totalwinter precipitation and mean minimum winter temperature. Thus, recruitment rates were highest when both totalprecipitation (29 cm) and minimum winter temperature (�9.58C) were lowest. Barred Owl presence was associated withincreased local extinction rates of Spotted Owl pairs for all 11 study areas. Habitat covariates were related to extinctionrates for Spotted Owl pairs in 8 of 11 study areas, and a greater amount of suitable owl habitat was generallyassociated with decreased extinction rates. We observed negative effects of Barred Owl presence on colonization ratesof Spotted Owl pairs in 5 of 11 study areas. The total amount of suitable Spotted Owl habitat was positively associatedwith colonization rates in 5 areas, and more habitat disturbance was associated with lower colonization rates in 2areas. We observed strong declines in derived estimates of occupancy in all study areas. Mean fecundity of femaleswas highest for adults (0.309 6 0.027 SE), intermediate for 2-yr-olds (0.179 6 0.040 SE), and lowest for 1-yr-olds (0.0656 0.022 SE). The presence of Barred Owls and habitat covariates explained little of the temporal variation in fecundityin most study areas. Climate covariates occurred in competitive fecundity models in 8 of 11 study areas, but supportfor these relationships was generally weak. The fecundity meta-analysis resulted in 6 competitive models, all of whichincluded the additive effects of geographic region and annual time variation. The 2 top-ranked models also weaklysupported the additive negative effects of the amount of suitable core area habitat, Barred Owl presence, and theamount of edge habitat on fecundity. We found strong support for a negative effect of Barred Owl presence onapparent survival of Spotted Owls in 10 of 11 study areas, but found few strong effects of habitat on survival at thestudy area scale. Climate covariates occurred in top or competitive survival models for 10 of 11 study areas, and inmost cases the relationships were as predicted; however, there was little consistency among areas regarding therelative importance of specific climate covariates. In contrast, meta-analysis results suggested that Spotted Owlsurvival was higher across all study areas when the Pacific Decadal Oscillation (PDO) was in a warming phase and theSouthern Oscillation Index (SOI) was negative, with a strongly negative SOI indicative of El Nino events. The best modelthat included the Barred Owl covariate (BO) was ranked 4th and also included the PDO covariate, but the BO effect wasstrongly negative. Our results indicated that Northern Spotted Owl populations were declining throughout the rangeof the subspecies and that annual rates of decline were accelerating in many areas. We observed strong evidence thatBarred Owls negatively affected Spotted Owl populations, primarily by decreasing apparent survival and increasinglocal territory extinction rates. However, the amount of suitable owl habitat, local weather, and regional climaticpatterns also were related to survival, occupancy (via colonization rate), recruitment, and, to a lesser extent, fecundity,although there was inconsistency in regard to which covariates were important for particular demographic parametersor across study areas. In the study areas where habitat was an important source of variation for Spotted Owldemographics, vital rates were generally positively associated with a greater amount of suitable owl habitat. However,Barred Owl densities may now be high enough across the range of the Northern Spotted Owl that, despite thecontinued management and conservation of suitable owl habitat on federal lands, the long-term prognosis for thepersistence of Northern Spotted Owls may be in question without additional management intervention. Based on ourstudy, the removal of Barred Owls from the Green Diamond Resources (GDR) study area had rapid, positive effects onNorthern Spotted Owl survival and the rate of population change, supporting the hypothesis that, along with habitatconservation and management, Barred Owl removal may be able to slow or reverse Northern Spotted Owl populationdeclines on at least a localized scale.
Keywords: Barred Owl, fecundity, Northern Spotted Owl, occupancy, population change, Strix occidentaliscaurina, Strix varia, survival
Efectos del habitat, del clima y de Strix varia sobre la demografıa a largo plazo de Strix occidentaliscaurina
RESUMENLas estimaciones de las tasas vitales de las especies y el entendimiento de los factores que afectan estos patrones a lolargo del tiempo y del espacio pueden brindar informacion crucial para el manejo y la conservacion. Usamos datos demarcado y recaptura, de rendimiento reproductivo y de ocupacion del territorio colectados durante 1985–2013 paraevaluar los procesos poblacionales de Strix occidentalis caurina en 11 areas de estudio en Washington, Oregon y elnorte de California. Estimamos la supervivencia aparente, la fecundidad, el reclutamiento, la tasa de cambiopoblacional y las tasas de extincion local y de colonizacion, e investigamos las relaciones entre estos parametros y lacantidad de habitat adecuado, la variacion en las condiciones meteorologicas local y regional y la competencia conStrix varia. Los datos fueron analizados para cada area por separado y mediante un meta-analisis con todas las areascombinadas, siguiendo un estricto protocolo para la colecta, la preparacion y el analisis de los datos. Usamos modeloslineales de efectos mixtos para los analisis de fecundidad, modelos poblacionales abiertos de Cormack-Jolly-Seber paralos analisis de supervivencia anual aparente (/) y una re-parametrizacion del modelo de captura-recaptura de Jolly-Seber (i.e. Jolly-Seber reverso: JSR) para estimar las tasas anuales de cambio poblacional (kJSR) y el reclutamiento.Tambien modelamos la dinamica de ocupacion del territorio de S. o. caurina y de S. varia en cada area de estudiousando modelos de ocupacion de dos especies. Las tasas anuales medias estimadas de cambio poblacional (k)sugirieron que las poblaciones de S. o. caurina disminuyeron de 1.2% a 8.4% por ano dependiendo del area de estudio.La estimacion media ponderada de k para todas las areas de estudio fue 0.962 (EE¼ 0.019; 95% IC¼ 0.925 a 0.999),
The Condor: Ornithological Applications 118:57–116, Q 2016 Cooper Ornithological Society
58 Northern Spotted Owl demography K. M. Dugger, E. D. Forsman, A. B. Franklin, et al.

indicando una disminucion en todo el rango estimada en 3.8% por ano desde 1985 a 2013. La variacion en las tasas dereclutamiento a lo largo del rango de S. o. caurina fue mejor explicada por una interaccion entre la precipitacion totalde invierno y la temperatura media mınima de invierno. Por ende, las tasas de reclutamiento fueron maximas cuandola precipitacion total (29 cm) y la temperatura mınima de invierno (�9.58C) fueron las mas bajas. La presencia de S.varia estuvo asociada con un incremento en las tasas locales de extincion de las parejas de S. o. caurina para todas las11 areas de estudio. Las covariables del habitat estuvieron relacionadas con las tasas de extincion de las parejas de S. o.caurina en 8 de las 11 areas de estudio y el habitat mas adecuado para los buhos estuvo generalmente asociado conuna disminucion en las tasas de extincion. La presencia de S. varia tuvo efectos negativos sobre las tasas decolonizacion de las parejas de S. o. caurina en 5 de las 11 areas de estudio. La cantidad total de habitat adecuado paraS. o. caurina estuvo positivamente asociada con las tasas de colonizacion en 5 areas, y un mayor disturbio del habitatestuvo asociado con tasas de colonizacion mas bajas en 2 areas. Observamos fuertes disminuciones en lasestimaciones derivadas de la ocupacion en todas las areas de estudio. La fecundidad media de las hembras fue altapara los adultos (0.309, EE¼ 0.027), intermedia para los individuos de dos anos de edad (0.179, EE¼ 0.040) y baja paralos individuos de un ano de edad (0.065, EE¼ 0.022). La presencia de S. varia y las covariables del habitat explicaronpoco de la variacion temporal en la fecundidad en la mayorıa de las areas de estudio. Las covariables climaticasaparecieron en los modelos de fecundidad competitivos en 8 de las 11 areas de estudio, pero el apoyo para estasrelaciones fue generalmente debil. El meta-analisis de fecundidad produjo 6 modelos de competencia, todos los cualesincluyeron los efectos aditivos de la region geografica y de la variacion temporal anual. Los dos modelos mejorclasificados tambien apoyaron debilmente los efectos aditivos negativos en la fecundidad de la cantidad de superficiede habitat nucleo adecuado, de la presencia de S. varia y de la cantidad de habitat de borde. Encontramos un fuerteapoyo para un efecto negativo de la presencia de S. varia en la supervivencia aparente de S. o. caurina en 10 de las 11areas de estudio, pero encontramos pocos efectos fuertes del habitat en la supervivencia a la escala del area deestudio. Las covariables climaticas se encontraron en el tope de los modelos de supervivencia competitivos en 10 delas 11 areas de estudio y en la mayorıa de los casos las relaciones fueron como predichas; sin embargo, hubo pocaconsistencia entre las areas con respecto a la importancia relativa de las covariables climaticas especıficas. En contraste,los resultados de los meta-analisis sugirieron que la supervivencia de S. o. caurina fue mas alta en todas las areas deestudio cuando el PDO estaba en una fase calida y cuando el SOI era negativo, siendo los SOI indicadores fuertementenegativos de los eventos de El Nino. El mejor modelo que incluyo la covariable de S. o. caurina (BO, por su nombre eningles) estuvo clasificado en cuarto lugar y tambien incluyo PDO, pero el efecto de BO fue fuertemente negativo.Nuestros resultados indicaron que las poblaciones de S. o. caurina estaban disminuyendo a lo largo del rango de lasubespecie y que las tasas anuales de disminucion estaban acelerandose en muchas areas. Encontramos fuerteevidencia de que S. varia afecto negativamente las poblaciones de S. o. caurina, principalmente a traves de ladisminucion de la supervivencia aparente y del incremento de las tasas de extincion de los territorios locales. Sinembargo, la cantidad de habitat adecuado para los buhos, el clima local y los patrones regionales del clima tambien serelacionaron con la supervivencia, la ocupacion (vıa la tasa de colonizacion), el reclutamiento y en menor grado, lafecundidad; aunque hubo inconsistencia sobre cuales covariables fueron importantes para determinados parametrosdemograficos, o para las distintas areas de estudio. En el area de estudio donde el habitat fue una fuente importantede variacion en la demografıa de S. o. caurina, las tasas vitales estuvieron generalmente positivamente asociadas con elhabitat mas adecuado para los buhos. Sin embargo, las densidades de S. varia pueden ser actualmente losuficientemente altas a traves del rango de S. o. caurina como para que a pesar del manejo continuo y la conservacionde habitat adecuado en tierras federales para los buhos (Davis et al. 2011, 2015), el pronostico de largo plazo para lapersistencia de S. o. caurina pueda verse cuestionado sin una intervencion adicional de manejo. En base a nuestroestudio, la remocion de S. varia en el area de estudio de GDR tiene un efecto rapido y positivo sobre la supervivenciade S. o. caurina y sobre la tasa de cambio de la poblacion, apoyando la hipotesis de que junto a la conservacion y elmanejo del habitat, la remocion de S. varia puede ser capaz de ralentizar o revertir la disminucion poblacional de S. o.caurina al menos a la escala local.
Palabras clave: cambio poblacional, fecundidad, ocupacion, reclutamiento, Strix occidentalis caurina, Strix varia,supervivencia
INTRODUCTION
The development and application of statistical theory and
procedures for estimating demographic parameters using
data collected from marked individuals have increased
rapidly in the last 50 yr (Williams et al. 2002).These advances
have facilitated the use of long-term population monitoring,
particularly longitudinal data on marked individuals, to
investigate complex questions in avian evolutionary ecology
and population dynamics (e.g., Tautin et al. 1999, Seber and
Schwarz 2002, Nichols 2004, Cam 2009). In addition,
estimates of species’ vital rates and sources of biotic and
abiotic variation in these parameters over time and space can
provide crucial information for management and conserva-
tion (Jenouvrier 2013). However, while the temporal scale of
many studies can be substantial, with long-term monitoring
exceeding 40 or even 50 yr for some bird species (e.g., Lesser
Snow Goose [Chen caerulescens caerulescens]; Koons et al.
The Condor: Ornithological Applications 118:57–116, Q 2016 Cooper Ornithological Society
K. M. Dugger, E. D. Forsman, A. B. Franklin, et al. Northern Spotted Owl demography 59

2014,Wandering Albatross [Diomedea exulans]; Pardo et al.
2013, Neotropical migrants; Faaborg et al. 2013), the
geographical scale of these studies is often limited because
of funding and personnel constraints. Large-scale collabora-
tive efforts among funding agencies and multiple researchers
that focus on specific scientific, management, and conserva-
tion objectives can be the key to overcoming geographical
research limitations, particularly for threatened or endan-
gered species for which range-wide demographic datamay be
crucial (e.g., Blakesley et al. 2010, Forsman et al. 2011).
One species that has benefited from this sort of
collaboration between land managers and researchers is
the Northern Spotted Owl (Strix occidentalis caurina),
which was listed as a threatened subspecies under the U.S.
Endangered Species Act in 1990 (U.S. Fish and Wildlife
Service 1990). The Northwest Forest Plan (NWFP) was
adopted in 1994 and designed to protect habitat for all
native species in the region, including the Northern
Spotted Owl (USDA Forest Service and USDI Bureau of
Land Management 1994). To understand whether this plan
was benefiting the Northern Spotted Owl, collaboration
among several federal resource agencies resulted in an
Effectiveness Monitoring Program to estimate range-wide
trends for Northern Spotted Owl populations on federallands (Lint et al. 1999). An important condition of this
monitoring program was the regular estimation of
demographic characteristics and trends of Spotted Owl
populations in 8 study areas on federal lands (Lint et al.
1999). In addition, researchers studying owl populations in
several private and tribal study areas agreed to participate
in these regular analytical efforts to examine range-wide
population trends, regardless of land ownership (e.g.,
Anthony et al. 2006, Forsman et al. 2011). While trends in
fecundity, apparent survival, and rate of population change
were the focus of initial meta-analyses (Burnham et al.
1996, Franklin et al. 1999), demographic data have now
been collected from study areas involved in this effort for
.20 yr, making it possible to investigate additional
biological and environmental factors that may influence
Spotted Owl vital rates (e.g., Anthony et al. 2006, Forsman
et al. 2011).
Of particular interest is the effect of the Barred Owl
(Strix varia) on vital rates of Northern Spotted Owls. The
Barred Owl is a medium-sized, congeneric owl species that
was historically restricted to the forests of eastern North
America, but has now invaded the entire range of the
Northern Spotted Owl (Bent 1938, Livezy 2009). The cause
of this range expansion is unclear, but there is mounting
evidence that the species is having a negative effect on the
Spotted Owl (e.g., Dugger et al. 2011, Forsman et al. 2011,
Yackulic et al. 2014), most likely through competition for
resources. Recent studies have confirmed high overlap in
resource use between the 2 species (Hamer et al. 2001,
2007, Livezy 2007, Singleton et al. 2010, Wiens et al. 2014),
with the larger Barred Owl usually dominating territorial
interactions with the smaller Spotted Owl (Van Lanen et
al. 2011) and occurring at much higher densities (Singleton
et al. 2010, Wiens et al. 2014).
In addition to the effect of the Barred Owl on Spotted
Owl demographics, the effects of habitat characteristics
and weather and climatic patterns on Spotted Owl vital
rates are also of fundamental interest (U.S. Fish and
Wildlife Service 2011). The harvesting of old-growth forest
habitat suitable for Spotted Owls and other dependent
species (e.g., Marbled Murrelet [Brachyramphus marmo-
ratus], red tree vole [Arborimus longicaudus]) on federal
lands has declined since the adoption of the NWFP.
However, low rates of loss continue on all lands within the
NWFP area (~3% since 1993), although on federal lands
this loss has been primarily attributed to large wildfires
(Davis et al. 2011, 2015). Climate change is expected to
increase the risk of large, high-intensity wildfire in the
Pacific Northwest and throughout the western U.S. in
general (Westerling et al. 2006, Davis et al. 2011, Stavros et
al. 2014). In addition, climate change may cause changes in
forest tree species composition (Peterson et al. 2014) and
even potentially the growth rates of tree species in the
Pacific Northwest (Littell et al. 2010, Albright and Peterson
2013). Thus, because of predicted changes in habitat
availability and composition related to climate change and
ongoing competitive pressures from an invasive species, it
is essential for wildlife managers to understand the
complex relationships between Spotted Owl demographics
and the environmental and biotic factors that can affect
Spotted Owls, such as long-term local weather patterns
and regional climatic cycles, amount and configuration of
suitable old-growth forest habitat, and the presence of
Barred Owls in these habitats.
The objectives of our meta-analysis were to: (1) estimate
the range-wide population status and trends in vital rates
of Northern Spotted Owls, including apparent survival,
fecundity, recruitment, rates of population change, and
local extinction and colonization rates, and (2) investigate
the potential effects of a suite of biotic and abiotic factors
on Spotted Owl demographics, including Barred Owl
presence, amount of suitable habitat, local weather, and
regional climatic patterns. The following hypotheses reflect
the relationships that we predicted between these factors
and demographic rates of Spotted Owls.
(1) Barred Owls: We hypothesized that there would be
negative relationships between the presence of Barred
Owls and fecundity, apparent survival, rates of
population change, and local colonization rates of
Spotted Owls.We also predicted a positive relationship
between Barred Owl presence and local extinction
rates of Spotted Owls (Kelly et al. 2003, Olson et al.
2005, Anthony et al. 2006, Bailey et al. 2009, Dugger et
The Condor: Ornithological Applications 118:57–116, Q 2016 Cooper Ornithological Society
60 Northern Spotted Owl demography K. M. Dugger, E. D. Forsman, A. B. Franklin, et al.

al. 2011, Forsman et al. 2011, Sovern et al. 2014,
Yackulic et al. 2014).
(2) Habitat: We hypothesized that increasing amounts of
Spotted Owl nesting and roosting habitat would
positively affect survival, fecundity, recruitment, and
rates of population change, and would also increase
colonization rates while decreasing extinction rates in
individual territories (Franklin et al. 2000, Olson et al.
2004, Dugger et al. 2005, 2011, Seamans and Gutierrez
2007, Forsman et al. 2011). We expected that these
effects could vary at different spatial scales (i.e. territory
vs. study area scale) and might be independent of, or
interact with, Barred Owl presence. Additionally, we
predicted that the spatial arrangement of habitat that
resulted in concentrated areas of nesting and roosting
habitat or increased amounts of edge habitat could have
positive effects on the vital rates of Spotted Owls
(Franklin et al. 2000, Olson et al. 2004).
(3) Weather and climate: At the local climate scale, previous
research has documented negative relationships be-
tween cold, wet weather in winter or early spring and
fecundity and survival of Spotted Owls (Franklin et al.
2000, Dugger et al. 2005, Forsman et al. 2011). On a
regional scale, large-scale climate indices, such as the
Palmer Drought Severity Index (PDSI), Southern
Oscillation Index (SOI), and Pacific Decadal Oscillation
(PDO), also have been correlated with Spotted Owl
demographic rates (Glenn et al. 2010, 2011a, 2011b,
Forsman et al. 2011). With a few exceptions at the
northern end of the Spotted Owl’s distribution, these
large-scale relationships have suggested the positive
effect of wetter growing seasons (PDSI) or cooler, wetter
winters (SOI, PDO) on demographic rates, probably as
an index to overall productivity and prey population
cycles in the system (Glenn et al. 2010, 2011a, 2011b,
Forsman et al. 2011). We predicted similar relationships
in our analyses (Table 1).
METHODS
Study Areas
The 11 study areas in our analysis included 3 in
Washington, 5 in Oregon, and 3 in California, USA (Figure
1). The duration of studies in these areas ranged from 22 to
29 yr (Table 2). Eight of the 11 study areas (codes from
Table 2: OLY, CLE, COA, HJA, TYE, KLA, CAS, and
NWC) were part of the Northwest Forest Plan Effective-
ness Monitoring Program; of these 8 areas, 4 were
primarily on federal lands (OLY, HJA, CAS, and NWC),
and 4 included a mixture of federal and private lands (CLE,
COA, TYE, and KLA). The 3 study areas that were not part
of the Northwest Forest Plan Monitoring Program
included 1 on lands owned by the Green Diamond
Resource Company (GDR), 1 on the Hoopa Tribe
Reservation (HUP), and 1 on private and federal lands in
TABLE 1. Hypothesized relationships between climate and weather variables and apparent survival (/), number of young fledgedper female (NYF), and recruitment (f) of Northern Spotted Owls in 11 study areas in Washington, Oregon, and California, USA.
Climate covariate / NYF f Sources
Palmer Drought Severity Index (PDSI) a þ þ None Glenn et al. (2010, 2011a)Southern Oscillation Index (SOI) b þ þ None Glenn et al. (2011a)Pacific Decadal Oscillation Index (PDO) c þ þ þ with lags Glenn et al. (2010, 2011a)Winter temperature (WT) d þ þ þ Dugger et al. (2005), Glenn et al.
(2010, 2011a, 2011b)Winter precipitation (WP) d � � � Dugger et al. (2005), Glenn et al.
(2010, 2011a, 2011b)Nesting season temperature e þ þ None Howell (1964), Franklin et al. (2000),
Olson et al. (2004), Glenn et al.(2011a, 2011b)
Nesting season precipitation f � � None Howell (1964), Franklin et al. (2000),Olson et al. (2004), Glenn et al.(2011a, 2011b)
a Standardized mean growing season values (Washington and Oregon: May–September; California: April–November) that rangedfrom �6 to 6, with negative values denoting drier conditions.
b Annual mean monthly values (July–June) that ranged from �1.21 to 1.81. Negative values denote warmer, drier winters (El Ninoconditions), and positive values denote cold, wet, snowy winters (La Nina conditions).
c Annual mean monthly values (July–June) that ranged from�1.38 to 1.49. Positive values denote the warm phase, with less rain andhigher temperatures, and negative values denote the cool phase, with more rain and lower temperatures.
d Mean monthly minimum temperature (WT; 8C) and total precipitation (WP; cm) during winter (November–February).e Mean monthly minimum temperature (8C) during the early (ENT; March–April) or late (LNT; May–June) nesting season.f Total precipitation (cm) during the early (ENP; March–April) or late (LNP; May–June) nesting season.
The Condor: Ornithological Applications 118:57–116, Q 2016 Cooper Ornithological Society
K. M. Dugger, E. D. Forsman, A. B. Franklin, et al. Northern Spotted Owl demography 61

Washington (RAI). The RAI study area was monitored by
Raedeke Associates in cooperation with Plum Creek
Timber Company, the National Park Service, the USDA
Forest Service, and Hancock Forest Management. The 11
study areas ranged in size from 356 to 3,922 km2 and were
distributed across a broad geographical region in which
climate, topography, vegetation, and elevation varied
widely (Figure 1, Table 3). Although they were not selected
randomly, the study areas represented most of the
physiographical provinces within the range of the North-
ern Spotted Owl. For details regarding study area
characteristics see Appendix A.
Survey Methods and Workshop ProtocolsWe monitored Spotted Owls by surveying each study area
each year to locate and resight previously banded owls,
band unmarked owls, and document the number of
young produced by each territorial female. Specific
protocols used in these surveys have been extensively
described in previous reports (Franklin et al. 1996, Lint et
al. 1999, Reid et al. 1999; see summary in Appendix B).
Our analysis was the sixth time that data from these study
areas were used to assess the range-wide population
status and trends of the Northern Spotted Owl (Anderson
and Burnham 1992, Burnham et al. 1994, Forsman et al.
1996a, Franklin et al. 1999, Anthony et al. 2006, Forsman
et al. 2011). In keeping with previous analyses, we
adhered to strict protocols for data preparation and
model development, and all participants agreed to follow
these protocols (Anderson et al. 1999; see Appendix B for
details).
Delineation of Territory BoundariesSpatially delineated Spotted Owl territories were impor-
tant to the development of detection vs. nondetection
datasets for our analyses of site occupancy and for
estimation of habitat and Barred Owl covariates within
study areas. We defined an owl territory as a landscape
patch that represented the cumulative area of use by an
owl, or pair of owls, during the study period. To delineate
territories we first documented the center of every owl
use area for every year of study. Territory centers were the
UTM coordinates of the most biologically important
location in each year, which we determined based on the
following hierarchical ranking: (1) active nest, (2) fledged
young, (3) primary roost location, (4) diurnal location,and (5) nocturnal detection (Forsman et al. 2011). We
then used the Euclidean Allocation Distance tool in
ArcGIS 10 (ESRI, Redlands, California, USA) to delineate
a Thiessen polygon around all the annual center locations
for each territory. Thiessen polygons are based on a set of
predefined sample points, such that the boundaries of
each polygon define the area that is closest to each point
relative to all other points. The Thiessen polygon for each
owl territory was static (did not vary by year), encom-
passed all the annual territory center locations, and
extended outward to a maximum of half of the median
nearest-neighbor distance or midway between the annual
territory center locations of owls occupying adjacent
territories, whichever distance was shorter. Median
nearest-neighbor distances varied among study areas,
and were longer in the northern portions of the Spotted
Owl range (1.75 km) than in the southern portions of the
range (0.6 km; Table 3). The predefined Thiessen
polygons were then used to represent individual owl
territories (Figure 2A). For analyses of survival and
fecundity, the Thiessen polygons in each study area were
merged to delineate the study area (Figure 2B). This area
was then buffered by 23 km to delineate an ‘‘outer zone’’
to represent an area that might influence recruitment into
FIGURE 1. Locations of 11 study areas used in the analysis ofvital rates and population trends of Northern Spotted Owls,1985–2013.
The Condor: Ornithological Applications 118:57–116, Q 2016 Cooper Ornithological Society
62 Northern Spotted Owl demography K. M. Dugger, E. D. Forsman, A. B. Franklin, et al.

the study area (Figure 2B). Thus, individual territories,
study areas, and buffered study areas (Figure 2) were the 3
spatial scales used to estimate the amount of suitable
habitat and Barred Owl presence vs. absence, and to
develop detection histories for the occupancy analysis, as
described below.
Development of Covariates
Temporal trends. We modeled temporal variation in
Spotted Owl vital rates in a variety of ways, including
annual time effects (t), linear effects (T), log-linear effects
(lnT), and spline models (SPLINE). We used spline models
rather than quadratic time effect models because spline
TABLE 2. Years of study and sample sizes of banded owls used to estimate vital rates of Northern Spotted Owls in 11 study areas inWashington, Oregon, and California, USA, 1985–2013.
Study area
Studyareacode
Startyear a
k startyear b
Expansionyear c
Number of owls bandedby age class d
Totalencounters eS1 S2 Adult Total
WashingtonCle Elum CLE 1989 1992 none 35 34 159 228 1,219Rainier RAI 1992 1993 1998 11 12 168 191 742Olympic OLY 1990 1990 1994 21 39 349 409 1,715
OregonCoast Ranges COA 1990 1992 none 63 100 496 659 3,616H. J. Andrews HJA 1987 1990 2000 52 130 594 776 3,981Tyee TYE 1990 1990 none 156 128 246 530 2,897Klamath KLA 1990 1990 1998 179 152 394 725 3,609South Cascades CAS 1991 1992 2001 31 88 557 676 2,856
CaliforniaNW California NWC 1985 1988 none 146 109 315 570 2,935Hoopa HUP 1992 1992 none 46 57 143 246 1,217Green Diamond Resources GDR 1990 1990 1998 162 228 592 982 4,733
All areas combined 902 1,077 4,013 5,992 29,520
a Year banding study was begun.b First year of data used in the analysis of k. Start year for occupancy analysis was 1999 for GDR and 1995 for all other study areas.c Indicates year in which study area was expanded in the k analysis.d Indicates age when owls were first captured and banded on territories: S1 ¼ 1 yr old, S2 ¼ 2 yr old, Adult ¼ �3 yr old.e Excluding multiple encounters of individuals in the same year.
TABLE 3. Size, ownership, location, and precipitation (precip) in the 11 study areas included in the January 2014 analysis ofdemographic status and trends of Northern Spotted Owls in Washington, Oregon, and California, USA, 1985–2013.
Study area a Area (km2) Landowner RegionMean annualprecip (cm) Latitude
½ medianNND (km) b
WashingtonCLE 1,784 Mixed Washington mixed conifer 136 46.996 1.75RAI 2,167 Mixed Washington Douglas-fir 215 47.195 1.50OLY 2,230 Federal Washington Douglas-fir 282 47.800 1.75
OregonCOA 3,922 Mixed Oregon coastal Douglas-fir 212 44.381 1.25HJA 1,604 Federal Oregon Cascades Douglas-fir 201 44.213 1.00TYE 1,026 Mixed Oregon coastal Douglas-fir 126 43.468 1.00KLA 1,422 Mixed Oregon–California mixed conifer 116 42.736 1.25CAS 3,377 Federal Oregon Cascades Douglas-fir 119 42.695 1.75
CaliforniaNWC 460 Federal Oregon–California mixed conifer 154 40.848 0.75HUP 356 Tribal Oregon–California mixed conifer 176 41.051 1.00GDR 1,465 Private California Coast 187 41.122 0.60
Total 19,813
a See Table 2 for study area codes.b Nearest neighbor distances, representing the maximum distances used in the delineation of Northern Spotted Owl territories,
using Thiessen polygons placed around all annual owl activity centers associated with each territory over the course of this study.
The Condor: Ornithological Applications 118:57–116, Q 2016 Cooper Ornithological Society
K. M. Dugger, E. D. Forsman, A. B. Franklin, et al. Northern Spotted Owl demography 63

models could capture the quadratic effect were it to be
present, but also allowed more overall flexibility for
complex temporal patterns over long time periods (Bonner
et al. 2009). In particular, spline models could accommo-
date a slowly varying external influence (e.g., regional
climatic pattern) or a single ‘‘blip’’ in the middle of the time
series. If we observed strong support for a spline model
across multiple study areas, this might indicate that we
were omitting some fundamental covariate. We used a
penalized cubic spline model with knots every 5 yr going
backward from the year with the last estimable parameterand with the first interval �5 years. For the fecundity
analyses only, we also investigated a temporal even–odd
year effect (EO), in which years of high reproductive
output alternated with years of low reproductive output.
Barred Owl covariate. We did not specifically survey
Barred Owls along with Spotted Owls. However, Barred
Owls frequently responded when we used playback calls or
vocal imitations to locate Spotted Owls, and we recorded
all such detections. Based on a calling experiment
conducted by Wiens et al. (2011), we estimated that
cumulative annual detection probabilities of Barred Owlswere .85% at territories in which we conducted �3nocturnal surveys for Spotted Owls. Based on these
detection data, we created a Barred Owl covariate that
was specific to year and study area and reflected the
proportion of Northern Spotted Owl territories (i.e.
Thiessen polygons) in which Barred Owls were detected
�1 time per year in each study area (Anthony et al. 2006,
Forsman et al. 2011; Appendix C Figure 13). We used this
covariate to model the Barred Owl effect on fecundity and
apparent survival in individual study areas and in the meta-
analysis. For the occupancy analysis, we used detections of
Barred Owls from the multiple Spotted Owl surveys
conducted each year to estimate the effects of each specieson the other, including probability of detection and rates of
colonization and extinction (Bailey et al. 2009, Yackulic et
al. 2014).
Habitat covariates. Habitat covariates were year-
specific covariates applied at the study area scale for
survival and fecundity analyses (Figure 2B). For occupancy
analyses in individual study areas, habitat covariates were
developed as year- and territory-specific covariates for
individual owl territories (i.e. Thiessen polygons; Figure
2A). Covariates developed to represent the amount and
spatial distribution of Northern Spotted Owl habitatwithin study areas included: (1) the proportion of
Northern Spotted Owl nesting and roosting habitat in
FIGURE 2. An example, using the Tyee study area (TYE), of (A) individual Northern Spotted Owl territories based on Thiessenpolygons placed around annual Spotted Owl activity centers from 1990 to 2013. In each study area, Northern Spotted Owl territories(i.e. Thiessen polygons) were (B) combined to represent the study area scale (inner zone) used to generate habitat covariates for thefecundity and apparent survival analyses. Habitat covariates for the recruitment analysis were generated from a 23-km buffer addedaround the outside of each study area (outer zone).
The Condor: Ornithological Applications 118:57–116, Q 2016 Cooper Ornithological Society
64 Northern Spotted Owl demography K. M. Dugger, E. D. Forsman, A. B. Franklin, et al.

each study area each year (HAB), (2) habitat disturbance,
or the mean percentage of nesting and roosting habitat lost
during 3-yr intervals prior to and including each survey
year (HD), (3) a neighborhood focal statistic defined as the
proportion of 30 3 30 m pixels in each study area with
�50% nesting and roosting habitat within 800 m of each
pixel (CORE), and (4) the proportion of edge habitat
within each study area (EDGE), with edge as the amount of
nesting and roosting habitat within 100 m of all other
cover types (Appendix D Figure 14). We hypothesized that
higher proportions of HAB and CORE would have positive
effects on Spotted Owl vital rates, and that EDGE would
have a variable effect, depending on the amount of nesting
and roosting habitat remaining (EDGE and HAB interac-
tion) and differences in the dominant types of prey
available in each study area (Franklin et al. 2000). We
predicted that study areas with more habitat disturbance
(i.e. more habitat loss) would have lower survival rates than
areas experiencing less habitat disturbance. These covar-
iates were developed for all analyses as follows:
Amount of suitable nesting and roosting habitat (HAB).
We used the range-wide map of Northern Spotted Owl
nesting and roosting habitat developed by Davis et al.
(2011) as our baseline measure of the amount of Spotted
Owl nesting and roosting habitat in 1994 for Oregon and
Washington and in 1996 for California. This map was
developed using MaxEnt, a species distribution model that
correlated species presence data with relevant environ-
mental data to generate a geographical representation of
the realized niche of the Northern Spotted Owl (Phillips et
al. 2006, Phillips and Dudık 2008). The environmental data
underlying this habitat map included stand age, canopy
cover, average tree height, mean conifer diameter, conifer
density, and forest type, and was derived from vegetation
maps developed through a ‘‘gradient nearest neighbor’’
(GNN) analysis conducted for the entire Pacific Northwest
(Ohmann and Gregory 2002). We used yearly maps of
forest disturbance (LandTrendr; Kennedy et al. 2010) to
adjust the base map of Davis et al. (2011) for annual loss of
nesting and roosting habitat, thereby producing a time
series of binary maps that reflected the year-specific
amount of nesting and roosting habitat across the entire
range of the Northern Spotted Owl from 1985 to 2013. The
covariate developed from these maps (HAB) was the
annual proportion of 30 3 30 m pixels that was labeled as
nesting and roosting owl habitat within or adjacent to each
study area or each individual owl territory (Appendix D
Figure 14). Therefore, in contrast to the previous meta-
analysis of Northern Spotted Owl population data that
omitted California (Forsman et al. 2011), we had a
standardized map of suitable nesting and roosting habitat
that encompassed the entire range of the Northern Spotted
Owl.
As with all maps derived from models, there is some
uncertainty and error associated with the accuracy of the
final product, but the baseline habitat map developed by
Davis et al. (2011) and used in this analysis included only
environmental variables from the GNN data that were
highly correlated with the ground plot information (r �0.7). In addition, the resulting Northern Spotted Owl
habitat map performed reasonably well in map accuracy
tests (Area Under the Curve (AUC) values of 0.78 to 0.88,
and Spearman rank correlations .0.9; Davis et al. 2011).
Thus, while caution is advised when using modeled habitat
maps of this sort because it is difficult to derive precise
representations of all of the habitat characteristics that are
important to a species (Yackulic et al. 2012, Loehle et al.
2015), we believe that the map that we used in this analysis
represented the best available range-wide map of Northern
Spotted Owl nesting and roosting habitat.
For analyses of apparent survival, fecundity, recruitment,
and rates of population change, we created boundaries for
habitat delineation within each study area by merging all
owl territories (Thiessen polygons) for a specific study area
into one large polygon (Figure 2B). The amount of habitat
was then estimated each year as the percent cover of
nesting and roosting habitat within each study area.
Because the occupancy analysis was spatially explicit, we
calculated the habitat covariates used to model occupancy
dynamics as the percent cover (HABp) and absolute
amount (HABa) of nesting and roosting habitat within
each owl territory in each study area.
To evaluate the hypothesis that the amount of suitable
habitat surrounding the study area might influence
immigration and recruitment into the study area, we
developed a habitat covariate (HAB2) that was the
estimated proportion of nesting and roosting habitat
within a 23-km buffer of each study area boundary as
described above, similar to methods used by Forsman et al.
(2011; Figure 2B, Appendix D Figure 14).
Habitat disturbance (HD). The habitat disturbance
covariate (HD) was based on LandTrendr remotely sensed
change detection data (Kennedy et al. 2010), and was
calculated as the percentage of nesting and roosting
habitat that was disturbed (�30% reduction in vegetation
cover) in each study area or owl territory within 3 yr prior
to each year of study (e.g., HD for 1990¼ the percent cover
of nesting and roosting habitat that was disturbed in 1987–
1989; Appendix D Figure 14). We used the proportion of
disturbance relative to the amount of habitat present at the
start of each interval because we reasoned that the same
absolute amount of habitat loss would have different
impacts depending on the amount of habitat that was
present at the outset (i.e. small amounts of habitat loss
would have greater impacts in areas that had less habitat to
start with).
The Condor: Ornithological Applications 118:57–116, Q 2016 Cooper Ornithological Society
K. M. Dugger, E. D. Forsman, A. B. Franklin, et al. Northern Spotted Owl demography 65

Amount of core-area habitat (CORE). The CORE habitat
covariate was calculated using the Neighborhood Statistic
Tool in ArcGIS 10 (ESRI, Redlands, California, USA) to
estimate the annual proportion of 303 30 m pixels in each
study area that was surrounded by �50% nesting and
roosting habitat within an 800-m radius (Appendix D
Figure 14). The 800-m radius (500 ha) was selected based
on previous analyses that examined the average size of
high-use areas (‘‘core areas’’) of Northern Spotted Owls
(Bingham and Noon 1997, Glenn et al. 2004, Schilling et al.
2013). Pixels were categorized as ‘‘0’’ if they were
surrounded by ,50% nesting and roosting habitat, or ‘‘1’’
if they were surrounded by �50% nesting and roosting
habitat. This covariate characterized the amount and
distribution of habitat in the landscape, not habitat in a
particular map pixel.
Amount of edge habitat (EDGE). We used the amount of
edge between nesting and roosting habitat and other cover
types to evaluate the hypothesis that the amount of edge
was associated with vital rates of Northern Spotted Owls
(Franklin et al. 2000, Olson et al. 2004, Forsman et al.
2011). We defined the EDGE covariate as the percentage of
nesting and roosting habitat in the study area or owl site
that was within 100 m of a boundary with another covertype (Appendix D Figure 14), including younger forest
seral stages, unforested areas, and pine-dominated or high-
elevation forest types that did not meet our definition of
nesting and roosting habitat. We estimated EDGE using
the same annual binary habitat maps used to estimate the
HAB covariate, but resampled with spatial pattern analysis
software (GUIDOS 1.3; Soille and Vogt 2009) at 100 m (1
ha) pixel resolution.
Weather and climate.We used a variety of covariates to
investigate any possible effects of weather and climate on
vital rates of Northern Spotted Owls (Table 1). All weather
and climate covariates were time-specific, linear effects
applied at the scale of individual study areas. These
variables included measures of seasonal and annual
weather, as well as long-term climatic conditions. Specific
covariates included total precipitation and mean minimum
temperature during various life-history stages, the Palmer
Drought Severity Index (PDSI), the Southern Oscillation
Index (SOI), and the Pacific Decadal Oscillation (PDO;
Franklin et al. 2000, Seamans et al. 2002, LaHaye et al.
2004, Olson et al. 2004, Dugger et al. 2005, Glenn 2010,
2011a, 2011b, Forsman et al. 2011). Mean temperature and
precipitation data were obtained from PRISM (Parameter
Elevated Regression on Independent Slope Models) maps
of each study area (PRISM Climate Group, http://prism.
oregonstate.edu). PRISM maps were raster-based digital
maps with 4-km2 resolution for mean monthly tempera-
ture (minimum and maximum; 8C) and precipitation (cm),
developed from weather station data and a digital elevation
model (Daly 2006). From the mean monthly PRISM maps
we calculated total precipitation and mean minimum
monthly temperature for seasons that corresponded with
important life-history stages of Spotted Owls as follows:
winter (W; November 1–February 28), early nesting season
(EN; March 1–April 30), late nesting season (LN; May 1–
June 30), and the entire annual cycle (A; July 1–June 30).
Temperature and precipitation values for each study area
and time period were obtained by computing the average
values of PRISM raster cells that fell within the study area
boundaries.
The PDSI is a measurement of moisture conditions
standardized for comparison across regions (http://www.
ncdc.noaa.gov/temp-and-precip/climatological-rankings/).
The PDSI is calculated using precipitation, temperature,
and soil moisture data, which allows the derivation of the
basic components of the water balance, including evapo-
transpiration, soil recharge, runoff, and moisture loss from
the surface layer (Alley 1984). We considered the PDSI an
index of primary productivity that had the potential to
influence the abundance of Spotted Owl prey. Values
ranged from�6 (extremely dry) toþ6 (extremely wet), with
0 representing normal water balance conditions. The PDSI
was calculated separately for each climatic region in
Washington, Oregon, and California. Most study areas fellwithin a single climatic region. When study areas included
multiple climatic regions, we used a weighted average
PDSI based on the proportion of the study area that fell
within each region.We also averaged monthly values of the
SOI (http://www.cpc.ncep.noaa.gov/data/indices/soi), and
the PDO (http://jisao.washington.edu/pdo/PDO.latest) to
generate annual measures (July 1 to June 30) that reflected
region-wide climatic patterns that affected all study areas.
Land ownership, region, latitude, and prey species
richness. In our meta-analyses, we evaluated whether
Spotted Owl vital rates or rates of population change
varied in relation to land ownership, region, latitude, and
prey species richness. Land ownership (OWN) was a
categorical variable that divided the 11 study areas into 3
ownership categories depending on whether primary
ownership was federal, private, or a relatively equal mix
of federal and private (Table 3). The region (REG) covariate
classified each study area into 1 of 6 geographic regions
based on state boundaries and major vegetation types
(Table 3). Latitude (LAT) was a continuous variable
measured at the center of each study area. The prey
diversity index (PREY) was a discrete variable that
characterized the maximum number of potential mam-
malian prey species (range: 6–17) that were available to
Spotted Owls in each study area. We estimated the PREY
covariate by using extensive data on the diets of Spotted
Owls (Cutler and Hays 1991, Carey et al. 1992, Zabel et al.
1995, Ward et al. 1998, Forsman et al. 2001, 2004,
Rosenberg et al. 2003) and species distribution maps in
NatureServe (http://www.natureserve.org/conservation-
The Condor: Ornithological Applications 118:57–116, Q 2016 Cooper Ornithological Society
66 Northern Spotted Owl demography K. M. Dugger, E. D. Forsman, A. B. Franklin, et al.

tools/data-maps-tools/digital-distribution-maps-
mammals-western-hemisphere), summarized across the
range of the Northern Spotted Owl in 50-km hexagons.
Long-term data on prey abundance were not available for
any of the Spotted Owl study areas, so the PREY covariate
was a simple attempt to address variation in prey species
richness among study areas.
Reproduction covariate. We used a covariate that was
specific to year and study area, mean number of young
fledged per female (NYF) in the current year t, to test
whether reproductive effort affected adult survival in the
interval between year t and year tþ 1 (Franklin et al. 1996,
Anthony et al. 2006, Forsman et al. 2011; Appendix E
Figure 15). We also investigated the effect of reproduction
on detection probability in year t, because breeding birds
are generally easier to detect than nonbreeders (Anthony
et al. 2006, Forsman et al. 2011, Stoelting et al. 2015).
Barred Owl removal study. Beginning in 2009, a paired
before–after control–impact (BACI) study design was
implemented in the GDR study area, where lethal removal
of Barred Owls was the treatment effect on Northern
Spotted Owl vital rates (Diller et al. 2014). The GDR
demographic study area was partitioned into treatment
(Barred Owls lethally removed) and control (Barred Owls
undisturbed) areas to estimate the response of Spotted
Owl fecundity, survival, and rate of population change to
the removal activities. To account for geographical
differences in the history of timber harvesting, physio-graphical patterns, and density of Barred Owl and Spotted
Owl territories, the GDR study area was divided into 3
paired treatment and control areas totaling 84,205 and
72,711 ha, respectively. Within these treatment areas,
investigators attempted to remove all Barred Owls
detected (Diller et al. 2014). For analyses involving
individual study areas, a BACI (e.g., Stewart-Oaten et al.
1986) design was incorporated for the GDR study area,
with parameters estimated separately for treatment and
control areas both before and after removals began, unless
otherwise noted. For the meta-analyses conducted with
data from all study areas combined, only data from control
and treatment areas prior to the Barred Owl removals (up
to 2008) and control areas after removals began (2009–
2013) were included, so that the GDR data were
comparable with data from the other study areas.
Analytical MethodsWe primarily used a random effects approach (Burnham
and White 2002, Franklin et al. 2002, Forsman et al. 2011,
Burnham 2013; see Appendix F) to examine trends in
fecundity, survival, recruitment, and rates of population
change of Northern Spotted Owls, and associations
between these vital rates and other environmental
covariates (i.e. Barred Owl presence, habitat, and climate).
We calculated estimates and evaluated the effects of
covariates on fecundity, survival, and rates of population
change for both individual study areas and in meta-
analyses with data from all study areas combined. We
estimated annual recruitment rates within a meta-analysis
using a random effects approach, but because of the
complicated nature of the 2-species occupancy analysis, we
modeled Northern Spotted Owl occupancy dynamics for
individual study areas using fixed effects models. Logit-link
functions were used for apparent survival and log-link
functions were used for recruitment and lambda in fixed
effects models, while the identity link function was used in
all random effects models.
Because vital rates and population trajectories of
Northern Spotted Owls differed only slightly between
federal and nonfederal study areas (Anthony et al. 2006,
Forsman et al. 2011), we did a single analysis and
calculated mean estimates for the entire range of the
owl, rather than performing separate analyses for federal
and nonfederal study areas. However, we evaluated the
validity of the assumption that demographic rates were
similar on federal and nonfederal lands by including a land
ownership covariate in the meta-analyses of fecundity,
survival, and recruitment. For the meta-analysis of survival
we also used a categorical covariate (NWFP) to explicitlyevaluate the null hypothesis that survival rates did not
differ between the 8 areas under primarily federal
ownership (OLY, CLE, COA, HJA, TYE, KLA, CAS, and
NWC) and the 3 other areas (RAI, HUP, and GDR).
We used an information-theoretic approach (Burnham
and Anderson 2002) and Akaike’s Information Criterion
corrected for small sample sizes (AICc) to determine the
best model(s) from a priori model sets generated for each
analysis. We generally selected the model with the lowest
AICc value and highest Akaike weight (wi) as our best
model, but models within 2 AICc units (DAICc � 2.0) were
considered competitive (Burnham and Anderson 2002).
When evaluating models with DAICc � 2.0, we also
examined the maximized log-likelihood (�2lnL) or devi-
ance values to ensure that DAICc values were not solely a
result of adding an additional, uninformative covariate
(Arnold 2010). We also evaluated the strength of evidence
for specific effects in competing models based on the
degree to which 95% confidence intervals (95% CI) for
slope coefficients (b) overlapped 0 (Anthony et al. 2006,
Forsman et al. 2011). Covariates in competitive models
with 95% CI that did not overlap 0 were considered to have
the strongest evidence of an effect. Covariates in
competitive models with ,10% of the 95% CI overlapping
0 (‘‘slightly’’ overlapping) were considered to have less
evidence of an effect compared with covariates with 95%
CI that did not overlap 0. Covariates with confidence limits
with .10% of the interval above or below 0 (‘‘widely’’
overlapping) were considered to have no support for the
importance of the effect. Values reported in the results are
The Condor: Ornithological Applications 118:57–116, Q 2016 Cooper Ornithological Society
K. M. Dugger, E. D. Forsman, A. B. Franklin, et al. Northern Spotted Owl demography 67

means 6 SE unless otherwise noted (see Appendix G for a
consideration of possible sources of bias associated with
estimates of Northern Spotted Owl demographic param-
eters).
Annual rate of population change (k). We estimated
annual rates of population change (k) in individual study
areas using the k- and recruitment- (f ) parameterizations
of the temporal symmetry models (Pradel 1996) imple-
mented in program MARK. For this analysis we used all
banded, territorial birds (S1, S2, adults) combined into a
single age class. We ran 5 random effects models on kt,
including the intercept-only (no effect), general time (t),
linear time trend (T), log-linear time trend (lnT), and
spline models (SPLINE; with knots every 5 yr backward
from 2013, such that the first interval was �5 yr; Bonner et
al. 2009). We dealt with expansions or contractions in
areas surveyed (Table 2) using the design matrix in
program MARK, such that all estimates of k reflected
changes in owl numbers and were not confounded with
sampling changes (Anthony et al. 2006, Forsman et al.
2011; see Appendix H for further details). Start years
varied by study area, but estimates were generated from
the start date through 2012 in all cases (Table 2). However,
for general models with time-specific capture and survival
probabilities, the first and last estimates (k1, kk�1) were
confounded with other parameters, and the second
estimate was frequently biased (k2; Hines and Nichols
2002). Thus, we only present estimates from 2 yr after the
start date through 2011, and used these estimates in
random effects models.
Estimates of realized population change.We estimat-
ed realized population change (Dt), which portrays the
population trajectory (Dt¼Nt/Nx) in each year of the study
(Nt) relative to population size in the first year (Nx) that kt
was estimated (Franklin et al. 2004).
Annual estimates of kt were based on the full fixed
effects model [/(t) p(t) f(t); i.e. time-dependent (t) survival
(/), capture probability (p), and recruitment (f )], and
annual estimates of realized population change (Dt) were
computed as:
Dt ¼Pt�1
i¼xki:
We estimated 95% confidence limits (CL) for Dt using a
parametric bootstrap algorithm (Franklin et al. 2004).
Estimates of annual survival (/t), recruitment (ft), and
recapture probabilities (pt) from the full fixed effects
model [/(t) p(t) f(t)], and an estimate of initial abundance
(Nx), were used to stochastically generate 1,000 sets of
individual capture histories. These simulated capture
history datasets were analyzed to obtain 1,000 estimates
of kt and Dt, and these estimates were used to generate
empirical confidence intervals based on the ith and jth
values of Dt arranged in ascending order, where i ¼ 25
(0.025*1,000) and j ¼ 975 (0.975*1,000).
Meta-analysis of annual rate of population change.
We conducted the meta-analysis of the annual finite rate of
population change using the same data that we used to
estimate kt for individual study areas. However, we only
used data for 1992–2013 so that we could make inferences
based on the same years for all study areas. As in the
analysis of individual areas, we used c¼ 1 for modeling all
rates of population change (Anthony et al. 2006, Forsman
et al. 2011; see Appendix H). We used the global model
[/(g*t) p(g*t) f(g*t)] as the basis for random effects
modeling of covariate effects on recruitment, where g
indicated individual study areas. We only included climate
and habitat covariates that we predicted would have effects
on recruitment. In some cases we modeled 1- or 2-yr lag
effects of climate covariates, because we hypothesized that
this was likely the most appropriate relationship if climate
was associated with annual reproductive output (NYF) and
it took fledged young at least 1 or 2 yr to be recruited into
the territorial population.
Territory occupancy modeling. We investigated the
co-occurrence dynamics of Northern Spotted Owls and
Barred Owls based on 19 yr of detection data for both
species (1995–2013) in 10 study areas, and 15 yr of
detection data (1999–2013) in the GDR study area. We
excluded data from the Barred Owl removal treatment
areas in the GDR study area after 2008. We createddetection histories that consisted of a sequence of
detections (1) and nondetections (0) for both species
within and among years on all study areas. We applied
these data to the multiseason (robust design) extension of
the conditional, 2-species occupancy model (MacKenzie et
al. 2004, 2006) following Miller et al. (2012) and Yackulic
et al. (2014), and used program MARK to estimate
occupancy parameters and model selection results. Model
parameters included initial occupancy (W1), colonization
(ci), extinction (ei), and detection probabilities (pij) for
both species as potential functions of presence of the other
species. For initial occupancy, we used the parameteriza-
tion of Richmond et al. (2010) because it is more stable
than the parameterization of the original 2-species models
developed by MacKenzie et al. (2004, 2006), which can fail
to converge when covariates are included. Based on prior
research (Van Lanen et al. 2011, Wiens et al. 2014), we
assumed that the Barred Owl was the dominant species
(coded as ‘‘A’’) and that the Northern Spotted Owl was the
subordinate species (coded as ‘‘B’’). Although occupancy
dynamics parameters for both Spotted Owls and Barred
Owls were generated in this analysis, here we focus on the
patterns of occupancy and occupancy dynamics (extinc-
tion and colonization rates) for Spotted Owls only, in
relation to the presence or absence of Barred Owls. The
specific parameters of interest were: (1) initial probability
The Condor: Ornithological Applications 118:57–116, Q 2016 Cooper Ornithological Society
68 Northern Spotted Owl demography K. M. Dugger, E. D. Forsman, A. B. Franklin, et al.

of occupancy of Northern Spotted Owls when Barred Owls
were absent (WB1 ) and when Barred Owls were present
(WBA1 ), (2) the probability that a territory unoccupied by a
Spotted Owl in year i was occupied by a Spotted Owl in
year i þ 1 (i.e. colonization) when Barred Owls were
present (cBAi ) and when Barred Owls were absent (cBi ), (3)the probability that a territory occupied by a Spotted Owl
in year i was unoccupied in year iþ 1 (i.e. local extinction)
when Barred Owls were present (eBAi ) and when Barred
Owls were absent (eBi ), and (4) annual probability of
territory occupancy by Northern Spotted Owls when
Barred Owls were present (WBAi ) and when Barred Owls
were absent (WBi ), which was derived using the best model
structure for detection, extinction, and colonization rates.
We analyzed each study area separately using fixed
effects models and an iterative model selection process
identified a priori (see Appendix H for details). We
modeled colonization and extinction rates for both species
with linear time trends (T), year-specific effects (t), no
temporal effects (intercept-only), the presence vs. absence
of the other species, and the effects of habitat covariates.
Finally, the effects of 2- and 3-yr lags in Spotted Owl
annual reproductive output were also modeled for Spotted
Owl colonization probabilities (see Yackulic et al. 2014 fordetails on this general approach).
Fecundity. Analyses for individual study areas were
conducted on the number of young produced per territorial
female (NYF), but our results are presented as fecundity,defined as the number of female young produced per
territorial female per year. This was calculated as NYF/2,
because the sex ratio of juvenile owls at hatching is
approximately 1:1 (Fleming et al. 1996). Spotted Owls are
strongly territorial, have high site fidelity, and are detectable
even when they are not breeding (Franklin et al. 1996, Reid
et al. 1999). Thus, we assumed that sampling over the
course of an entire breeding season was not biased toward
birds that reproduced, and that the sample of owls used in
our analyses was representative of the territorial population.
Owls that were recruited into the banded population were
assigned to 1 of 3 discrete age classes based on their age at
first capture as a territorial bird (S1¼ 1 yr old, S2¼ 2 yr old,
Adult ¼ �3 yr old; Table 2). We determined age classes
based on known age of birds first banded as juveniles, or
plumage attributes of birds first banded as nonjuveniles
(Forsman 1981, Moen et al. 1991, Franklin et al. 1996).
Mean annual NYF was computed by age class and then
averaged across years for estimates of age-specific
reproductive output. Standard errors were calculated as
the standard errors of the averages among years, which
gave equal weight to all years regardless of the number of
owls sampled (Anthony et al. 2006, Forsman et al. 2011).
This approach essentially treated year as a random effect,
with year effects being large relative to within-year
sampling variation.
We developed an a priori model set and used a linear
mixed model approach implemented with PROC MIXED
in SAS (SAS Institute 2008) to investigate patterns of
variation and hypothesized relationships between covari-
ates and NYF (see Appendix H for details). Models
included the effects of age (S1, S2, Adult), annual time
variation (t), linear or quadratic time trends (T, TT), an
autoregressive time effect (AR1), the Barred Owl (BO)
covariate, a temporal even–odd year effect (EO) in which
years of high reproductive output alternated with years of
low reproductive output, and the weather, climate, and
habitat covariates described previously.
Meta-analysis of fecundity. We restricted the meta-
analysis of fecundity to adult females because the sample
size of younger age classes was small (,10%), particularly in
the most recent years of study. We used the same covariates
as in the individual study area analyses to generate an a
priori model set, with the addition of models investigating
the effects of latitude (LAT), region (REG), land ownership
(OWN), and prey species richness (PREY) as fixed random
variables. We used mixed models to analyze mean NYF per
year, and treated sampling units (study areas within years) as
random effects (Anthony et al. 2006, Forsman et al. 2011).
Apparent survival.We used capture–recapture (resight-
ing) data and Cormack-Jolly-Seber open population models
(Lebreton et al. 1992) to estimate recapture probabilities (p)
and annual apparent survival probabilities (/) of non-
juvenile, territorial owls (Table 2). Annual estimates ofsurvival corresponded roughly to the interval from June 15
in year t to June 14 in year t þ 1, which reflected the
approximate midpoint of the annual field season during
which demographic (mark–resighting) data were collected
(March–August). Estimates and model selection results to
investigate the effects of Barred Owls, reproduction, habitat,
weather, climate, and time effects on apparent survival of
Spotted Owls were generated using the Method of
Moments random effects module in program MARK
(White and Burnham 1999; Appendix F, H).
Meta-analysis of apparent survival.We used the same
general protocol for the meta-analysis of apparent survival
as for the analysis of apparent survival in individual study
areas (for details see Appendix H). We ran random effects
models in program MARK (White et al. 2001) to
investigate the effect of covariates (i.e. time, Barred Owls,
cost of reproduction, weather, climate, habitat, latitude,
region, and prey species richness), always excluding the
last confounded estimate of survival (/K; Burnham and
White 2002, Burnham 2013; Appendix F).
RESULTS
Annual Rate of Population ChangeIndividual study areas. We estimated annual rates of
population change (k) using capture histories for 5,992
The Condor: Ornithological Applications 118:57–116, Q 2016 Cooper Ornithological Society
K. M. Dugger, E. D. Forsman, A. B. Franklin, et al. Northern Spotted Owl demography 69

territorial owls from all age classes (S1, S2, Adult; Table 2).
We used a base model for random effects modeling that
included general time effects on survival [/(t)] and lambda
(k(t); Table 4) in all study areas except GDR, where the
recruitment [f(t)] and lambda [k(t)] parameterization was
used to facilitate convergence. The best fixed effects
structure for capture rates included annual time effects
[p(t)] in 4 study areas (RAI, COA, CAS, and HUP),
additive effects of sex and annual time [p(sex þ t)] in 6
areas (CLE, HJA, TYE, KLA, NWC, and GDR; capture
rates higher for males), and an interaction between sex and
time [p(sex*t)] in 1 area (OLY).
The best random effects model for 7 of the 11 study
areas included a negative linear time trend on k (RE(T);
Table 4), with 95% CIs of covariate coefficients widely
overlapping 0 only for CLE and OLY (Figure 3), suggesting
that annual rates of decline were increasing over time in
many areas. The spline model [RE(SPLINE)] performed
best for HJA and NWC, although the linear time trend
model was also competitive for NWC, and the coefficient
was negative with a 95% CI that did not overlap zero. The
intercept-only model [RE(.)] received the most support for
RAI and CAS.
Mean estimates of k from the RE(.) models suggested
declining population trends (i.e. k , 1.0) in almost all
study areas, with strong evidence of declines in CLE, RAI,
OLY, COA, HJA, NWC, HUP, GDR-CB, GDR-TB, and
GDR-CA, and less evidence of declines in TYE, KLA, and
CAS (Figure 4). The only estimate of k that suggested an
increasing population was observed in GDR treatment
areas after Barred Owl removals began in 2009 (GDR-TA;
k ¼ 1.03), although the 95% CI widely overlapped 1.0.
Estimated annual rates of decline were variable (Table 4),
but were lowest in the GDR control areas before Barred
Owl removals began in treatment areas in 2009 (1.2%
annual decline), and highest in the CLE study area in
Washington (8.4% annual decline) and in GDR control
areas after 2009 (12.0% annual decline). The weighted
mean estimate of k for all study areas (excluding GDR-TB
and GDR-TA) was 0.962 6 0.019 (95% CI: 0.925 to 0.999),
indicating an estimated decline of 3.8% per year across the
range of the Northern Spotted Owl.
TABLE 4. Estimates, standard errors (SE), and lower (LCL) and upper (UCL) 95% confidence limits of mean annual rate of populationchange based on a reverse Jolly-Seber model (kRJS) and temporal process variance (rtemporal) for Northern Spotted Owls in 11 studyareas in Washington, Oregon, and California, USA, 1985–2013. Estimates of kRJS were generated using the intercept-only randomeffects model [RE(.)]. Estimates of temporal process variance were based on the best random effects models using time-specificestimates of survival (/), capture probability (p), and rate of population change (k) or recruitment (f).
Study area a Model b kRJS SE LCL UCL rtemporal LCL UCLAnnualchange
WashingtonCLE /(t) p(sex þ t) k(t): RE k(T) 0.916 0.011 0.894 0.938 0.000 0.000 0.139 �8.4%RAI /(t) p(t) k(t): RE k(.) 0.953 0.017 0.919 0.987 0.000 0.000 0.017 �4.7%OLY /(t) p(sex*t) k(t): RE k(T) 0.961 0.015 0.931 0.990 0.051 0.000 0.136 �3.9%
OregonCOA /(t) p(t) k(t): RE k(T) 0.949 0.019 0.911 0.987 0.078 0.047 0.134 �5.1%HJA /(t) p(sex þ t) k(t): RE k(SPLINE) 0.965 0.008 0.949 0.980 0.026 0.000 0.062 �3.5%TYE /(t) p(sex þ t) k(t): RE k(T) 0.976 0.017 0.944 1.008 0.068 0.041 0.113 �2.4%KLA /(t) p(sex þ t) k(t): RE k(T) 0.972 0.017 0.940 1.005 0.068 0.033 0.127 �2.8%CAS /(t) p(t) k(t): RE k(.) 0.963 0.024 0.916 1.010 0.096 0.056 0.168 �3.7%
CaliforniaNWC /(t) p(sex þ t) k(t): RE k(SPLINE) 0.970 0.009 0.951 0.989 0.032 0.000 0.075 �3.0%HUP /(t) p(t) k(t): RE k(T) 0.977 0.010 0.958 0.996 0.000 0.000 0.068 �2.3%GDR-CB c /(t) p(sex þ t) f(t): RE k(BACI: Trt þ T, Trt) 0.988 0.009 0.970 1.006 0.032 0.000 0.081 �1.2%GDR-TB c /(t) p(sex þ t) f(t): RE k(BACI: Trt þ T, Trt) 0.961 0.018 0.926 0.996 0.068 0.026 0.130 �3.9%GDR-CA c /(t) p(sex þ t) f(t): RE k(BACI: Trt þ T, Trt) 0.878 0.070 0.741 1.015 0.119 0.000 0.559 �12.2%GDR-TA c /(t) p(sex þ t) f(t): RE k(BACI: Trt þ T, Trt) 1.030 0.040 0.952 1.108 0.063 0.000 0.321 3.0%
Weighted mean for all study areas d 0.962 0.019 0.925 0.999 �3.8%
a See Table 2 for study area codes.b Best Random Effects (RE) model structure with time or sex effects from analyses of the a priori model set based on the best base
model. Model notation indicates structure for effects of time (t), sex (sex), linear time trend (T), a spline (SPLINE, with knots every 5yr backward from 2013), or constant (.) models. The best model for the GDR study area included a treatment effect (Trt) todistinguish areas where Barred Owl removal occurred, both before (1992–2008) and after (2009–2013) removals began (BACI).
c GDR-TB ¼ treatment areas before Barred Owls were removed; GDR-CB ¼ control areas before Barred Owls were removed intreatment areas; GDR-TA¼ treatment areas after Barred Owls were removed (2009–2013); GDR-CA¼ control areas after Barred Owlsremoved in treatment areas (2009–2013).
d Included GDR-CB and GDR-CA areas only.
The Condor: Ornithological Applications 118:57–116, Q 2016 Cooper Ornithological Society
70 Northern Spotted Owl demography K. M. Dugger, E. D. Forsman, A. B. Franklin, et al.

Realized population change. Our estimates of realized
population change indicated that populations in Wash-
ington declined by 55–77% (Figure 5A). Declines in
Oregon were more variable, ranging from 31% in TYE to
68% in COA (Figure 5B), and in 2 cases (KLA and TYE)
the 95% CIs for realized population change widely
overlapped 1.0 for most or all of the last several years,
indicating uncertainty about annual rates of population
change for these areas. In California, declines ranged from
32% to 55%, except in the treatment areas of GDR (GDR-
T), where the estimated overall population decline was
only 9% (Figure 5C). Realized population change estimates
FIGURE 3. Estimates of covariate coefficients and 95% confidence intervals for the linear time trend (T) on k from the best randomeffects model containing a linear time trend, for Northern Spotted Owls in 11 study areas in Washington, Oregon, and California,USA. The estimate for the GDR study area represents the parallel (additive) trend on control and treatment areas before Barred Owlremovals began (1990–2008). See Table 2 for study area abbreviations.
FIGURE 4. Estimated mean rates of population change (k) and 95% confidence intervals for Northern Spotted Owls from the randomeffects (RE) intercept-only model [RE k(.)] in each of 11 study areas in Washington, Oregon, and California, USA, 1985–2013. Estimatesfor the GDR study area are presented separately for control and treatment areas before (1990–2008) and after (2009–2013) BarredOwls were removed (GDR-CB¼ control before removal, GDR-TB¼ treatment before removal, GDR-CA¼ control after removal, GDR-TA ¼ treatment after removal). See Table 2 for study area abbreviations.
The Condor: Ornithological Applications 118:57–116, Q 2016 Cooper Ornithological Society
K. M. Dugger, E. D. Forsman, A. B. Franklin, et al. Northern Spotted Owl demography 71

for HUP and GDR-T included confidence limits that
overlapped 1.0 in many years, indicating uncertainty about
annual rates of population change in these areas.
Meta-analysis of annual rate of population change:
recruitment. As described above, we focused the meta-
analysis of population change on recruitment parameter-
ization, in which k was written as the sum of apparent
survival and recruitment rate. The fixed effects model on
which all random effects models for recruitment were
based included area by year interactions on survival,
capture probabilities, and recruitment [/(Area*t) p(Area*t)f(Area*t)]. The best random effects model had nearly all of
the model weight and included interactions between total
winter precipitation (WP) and mean winter minimum
temperature (WMT; Table 5). As predicted, recruitment
was negatively affected by WP as a main effect (b ¼�0.0003 6 0.0001 SE, 95% CI: �0.0005 to �0.0001).However, contrary to our prediction, the main effect of
WMTwas also negatively related to recruitment rates (b¼�0.0066 6 0.0037 SE, 95% CI:�0.0140 to 0.0006), although
the interaction between precipitation and temperature was
positive (b ¼ 0.0001 6 0.0000 SE, 95% CI: �0.0000 to
0.0001). Thus, recruitment was highest when both total
precipitation (29 cm) and mean minimum winter temper-
ature (�9.58C) were lowest, and higher WP resulted in
lower recruitment rates when WMT was low (,48C;
Figure 6). When the total precipitation level was near its
average for all years and study areas (112 cm), recruitment
rates were nearly constant across the range of mean
minimum temperatures.
FIGURE 5. Annual estimates of realized population change (Dt) with 95% confidence intervals for Northern Spotted Owls at (A) 3study areas in Washington, (B) 5 study areas in Oregon, and (C) 3 study areas in California, USA. Estimates for the GDR study area arepresented separately for control and treatment areas in relation to Barred Owl removals beginning in 2009. See Table 2 for studyarea abbreviations.
The Condor: Ornithological Applications 118:57–116, Q 2016 Cooper Ornithological Society
72 Northern Spotted Owl demography K. M. Dugger, E. D. Forsman, A. B. Franklin, et al.

Occupancy
Initial territory occupancy by Northern Spotted Owls was
best modeled by territory-specific habitat covariates for 7
of the 11 study areas (OLY, COA, TYE, CAS, NWC, HUP,
and GDR), and, in most cases, relationships were as
predicted (Table 6). However, support for a relationship
between initial occupancy and habitat was weak as the 95%
CIs of habitat covariates widely overlapped 0 for all areas
except NWC and TYE. For NWC, initial territory
occupancy was negatively related to increasing amounts
of edge habitat, whereas in TYE, more nesting and roosting
habitat at the core scale resulted in higher rates of initial
territory occupancy.
Colonization rates of Spotted Owl territories did not vary
temporally or spatially in the RAI and HUP study areas, but
strong evidence for negative trends in colonization rates was
observed in CLE, HJA, and KLA, with less evidence for a
negative trend observed in COA, where the 95% CI slightly
overlapped 0 (Table 7A). In 5 of 11 areas (OLY, COA, TYE,
KLA, and CAS) there was strong evidence that the presence
of Barred Owls was negatively associated with Spotted Owl
colonization rates, as 95% CIs did not overlap 0 in all 5 areas
(Table 7A). Habitat characteristics were related to coloni-
zation rates of Spotted Owls in 9 of 11 areas (Table 6).
Consistent with predictions, the total amount of suitable
owl habitat was positively associated with Spotted Owl
colonization rates in OLY, COA, TYE, CAS, and NWC, and
the 95% CIs for these covariate coefficients did not overlap 0
in all cases, suggesting strong support for these relationships
(Table 7A). Habitat disturbance (HD) was negatively
associated with colonization rates in CLE and HJA, but
the 95% CIs of the covariate coefficients slightly overlapped
0 in both cases, suggesting that these relationships were
only weakly supported. EDGE was positively related to
FIGURE 5. Continued.
The Condor: Ornithological Applications 118:57–116, Q 2016 Cooper Ornithological Society
K. M. Dugger, E. D. Forsman, A. B. Franklin, et al. Northern Spotted Owl demography 73

Spotted Owl territory colonization rates in KLA and GDR,
but the 95% CI for this covariate coefficient slightly
overlapped 0 for GDR, suggesting weaker support for a
relationship in this area (Table 7A).
The most consistent pattern in Northern Spotted Owl
territory occupancy dynamics was the strong positive
association between the presence of Barred Owls and
territory extinction rates of Spotted Owls in all 11 study
areas (Table 6, Figure 7), with 95% CIs of covariate
coefficients not overlapping 0 in 10 cases (CLE, OLY, COA,
HJA, TYE, KLA, CAS, NWC, HUP, and GDR), and only
slightly overlapping 0 for RAI (Table 7B). As predicted,
extinction rates were higher in all areas when Barred Owls
were present (Figure 7). Habitat covariates also were
associated with territory extinction rates of Spotted Owls
in 8 of 11 study areas. Lower territory extinction rates of
Spotted Owls were associated with higher amounts (HABa;
RAI, OLY, HJA, and CAS) and greater proportions (HABp;
COA) of nesting and roosting habitat in each territory, or
higher amounts of nesting and roosting habitat at the core
scale (CORE; KLA and NWC). However, the 95% CIs of
habitat covariate coefficients slightly overlapped 0 for OLY,
COA, and CAS, suggesting weaker support for habitat
effects in these areas. In the GDR study area, more core
habitat was associated with increased Spotted Owl
extinction rates (95% CI of covariate coefficient did not
overlap 0), which was contrary to general predictions.
However, this was possibly consistent with the best
structure for initial occupancy and colonization rates,
which suggested that habitat heterogeneity was important
in the GDR area. Strong evidence for positive time trends
in Spotted Owl territory extinction rates was observed in 4
study areas (RAI, OLY, NWC, and HUP), as the 95% CIs
on the trend coefficients for these areas did not overlap 0.
Based on models incorporating the best structure for
initial occupancy, extinction, and colonization rates (Table
8), our derived estimates showed that time-specific
territory occupancy rates for Spotted Owls were declining
in all study areas (Figure 8). In Washington, occupancyrates for Northern Spotted Owls declined from 56–100%
in 1995 to 11–26% in 2013. During this same time period,
Northern Spotted Owl territory occupancy rates in Oregon
declined from 61–88% in 1995 to 28–48% in 2013. In
California, Spotted Owl occupancy rates declined from
75% to 38% in NWC and from 79% to 47% in HUP
between 1995 and 2013. In the control areas in the GDR
study area, occupancy rates declined from 92% in 1999 to
55% in 2013.
FecundityIndividual study areas. We estimated fecundity using
12,969 records in which we determined the number of
young produced by territorial females of known age, 91%
of which were females �3 years old (i.e. adults; Table 9).
Female age was an important factor affecting fecundity
in all study areas, with mean fecundity generally lowest
for 1-yr-olds, intermediate for 2-yr-olds, and highest for
adults. In most study areas, the mean annual fecundity of
TABLE 5. Model selection results from the meta-analysis of thefinite rate of population change (k) of adult Northern SpottedOwls in 11 demographic study areas in Washington, Oregon,and California, USA, 1994–2013. Random effects models (RE) ofrecruitment were run using a general fixed effects base model[/(Area*t) p(Area*t) f(Area*t)] that included the interactionbetween study area (Area) and general time effects (t) onapparent survival (/), capture probability (p), and recruitment (f).Models were ranked according to Akaike’s Information Criterionadjusted for small sample size (AICc). The model deviance(Deviance), number of parameters (K), difference in AICc
between each model and the model with the lowest AICc
(DAICc), and Akaike model weights (wi) are given for all models.
Random effects model a DAICc K wi Deviance
RE f(WP*WMT) 0.00 b 657.94 0.997 14035.84RE f(LAG1R þ HD) 11.33 691.40 0.003 13975.98RE f(.) 40.49 738.00 0.000 13905.61RE f(WP þ WMT) 55.37 685.30 0.000 14033.01RE f(BO) 68.39 681.85 0.000 14053.37RE f(BO þ LAG1R) 82.60 697.80 0.000 14033.60RE f(WP*WMT*L1WP) 86.28 702.00 0.000 14028.33RE f(LAG2R) 86.57 699.47 0.000 14034.01RE f(BO þ LAG2R) 87.23 699.14 0.000 14035.37RE f(HD) 88.66 694.48 0.000 14046.73RE f(LAG1R) 89.48 702.14 0.000 14031.22RE f(WP) 89.49 701.10 0.000 14033.45RE f(LAG2R þ HD) 90.51 701.70 0.000 14033.18RE f(L1WMT þ WP) 92.60 697.98 0.000 14043.21RE f(EDGE) 95.06 700.60 0.000 14040.08RE f(WMT) 95.40 699.23 0.000 14043.34RE f(BO þ HD) 96.58 698.96 0.000 14045.09RE f(L1WP*L1WMT) 101.30 699.96 0.000 14047.69RE f(CORE) 103.57 702.35 0.000 14044.86RE f(L1WP) 105.07 701.80 0.000 14047.54RE f(WP þ WMT þ L1WP) 112.09 700.47 0.000 14057.40RE f(L1WMT) 117.06 701.74 0.000 14059.66RE f(L1WP þ L1WMT) 126.01 700.70 0.000 14070.82RE f(PDO) 129.87 701.80 0.000 14072.33RE f(HAB2) 148.06 699.87 0.000 14094.65
a Model notation indicates structure for the following: repro-ductive rate with 1 yr (LAG1R) and 2 yr (LAG2R) lags, proportionof territories with Barred Owl detections (BO), Pacific DecadalOscillation (PDO), mean monthly minimum temperature duringwinter (WMT), 1-yr lag in mean monthly minimum temperatureduring winter (L1WMT), total precipitation during winter (WP),1-yr lag in total precipitation during winter (L1WP), aneighborhood focal statistic that defines the number of 30m2 pixels with �50% suitable habitat within 800 m of eachpixel in each owl site (CORE), the amount of interface betweensuitable habitat and other cover types within each owl site(EDGE), the percentage of suitable habitat that was disturbed(HD), and the estimated proportion of suitable owl habitatwithin a 23-km buffer distance of the study area boundaries(HAB2).
b The AICc of the top model ¼ 59829.22.
The Condor: Ornithological Applications 118:57–116, Q 2016 Cooper Ornithological Society
74 Northern Spotted Owl demography K. M. Dugger, E. D. Forsman, A. B. Franklin, et al.

TABLE 6. Model selection results, including the difference from the top model in Akaike’s Information Criterion corrected for smallsample sizes (DAICc), number of parameters (K), model deviance (Deviance), and AICc weights (wi), for competitive models (�2 AICc)from the analysis of occupancy dynamics of Northern Spotted Owls and Barred Owls in 11 demographic study areas in Washington,Oregon, and California, USA, during 1994–2013. Model parameter structure and direction of effect are presented for initialoccupancy (w1), colonization (ci), extinction (ei), and detection (pij) probabilities, with matching model numbers within a study areareflecting (A) Northern Spotted Owl, and (B) Barred Owl components for specific models. See Table 2 for study area codes.
Study area Model a w1 c e p DAICcb K Deviance wi
(A) Northern Spotted OwlWashington
CLE 1 . T(�), HD(�) bo(þ) j, TR(þ), bo(�) 0.0 27 4861.84 0.642 . T(�), HD(�) bo(þ) j, TR(þ), bo(�) 1.2 27 4863.02 0.36
RAI 1 . . T(þ), HABa(�),bo(þ)
t, j, TR(þ), bo(�) 0.0 46 4889.11 0.81
OLY 1 EDGE(�) HABa(þ), bo(�) T(þ), HABa(�),bo(þ)
t, j, TR(þ), bo(�),BO(�)
0.0 50 8892.09 0.45
2 EDGE(�) HABa(þ), bo(�) T(þ), bo(þ) t, j, TR(þ), bo(�),BO(�)
1.1 49 8895.33 0.25
3 . HABa(þ), bo(�) T(þ), HABa(�),bo(þ)
t, j, TR(þ), bo(�),BO(�)
1.5 49 8895.67 0.22
OregonCOA 1 HABa(þ) T(�), HABa(þ),
bo(�)t, HABp(�), bo(þ) t, j, TR(þ), bo(�),
BO(�)0.0 82 20357.77 0.24
2 HABa(þ) T(�), HABa(þ),bo(�)
t, HABp(�), bo(þ) t, j, TR(þ), bo(�),BO(�)
0.5 81 20360.37 0.18
3 HABa(þ) HABa(þ), bo(�) t, HABp(�), bo(þ) t, j, TR(þ), bo(�),BO(�)
0.8 81 20360.68 0.16
4 . T(�), HABa(þ),bo(�)
t, HABp(�), bo(þ) t, j, TR(þ), bo(�),BO(�)
1.0 81 20360.85 0.15
5 HABa(þ) T(�), HABa(þ),bo(�)
t, HABp(�), bo(þ) t, j, TR(þ), bo(�) 1.2 81 20361.10 0.13
6 HABa(þ) T(�), HABa(þ),bo(�)
t, bo(þ) t, j, TR(þ), bo(�),BO(�)
1.3 81 20361.22 0.12
HJA 1 . T(�), HD(�) HABa(�), bo(þ) t, j, TR(þ), bo(�) 0.0 78 18691.36 0.44TYE 1 CORE(þ) t, HABa(þ), bo(�) T(�), bo(þ) t, j, TR(þ), bo(�) 0.0 96 17164.61 0.86KLA 1 . T(�), EDGE(þ),
bo(�)CORE(�), bo(þ) t, j, TR(þ), bo(�) 0.0 63 14101.30 0.31
2 . T(�), EDGE(þ),bo(�)
CORE(�), bo(þ) t, j, TR(þ), bo(�) 0.7 62 14104.09 0.22
3 . T(�), EDGE(þ),bo(�)
EDGE(�), bo(þ) t, j, TR(þ), bo(�) 1.5 63 14102.77 0.15
CAS 1 EDGE(�) HABa(þ), bo(�) HABa(�), bo(þ) t, j, TR(þ), bo(�) 0.0 52 13906.31 0.282 EDGE(�) HABa(þ), bo(�) HABa(�), bo(þ) t, j, TR(þ), bo(�) 0.7 51 13909.05 0.203 EDGE(�) HABa(þ), bo(�) HABa(�), bo(þ) t, j, TR(þ), bo(�) 0.8 51 13909.14 0.194 EDGE(�) HABa(þ), bo(�) bo(þ) t, j, TR(þ), bo(�) 1.2 51 13909.55 0.165 . HABa(þ), bo(�) HABa(�), bo(þ) t, j, TR(þ), bo(�) 1.7 51 13910.06 0.12
CaliforniaNWC 1 EDGE(�),
bo(þ)HABa(þ) T(þ), CORE(�),
bo(þ)j, TR(þ), bo(�),
BO(þ)0.0 35 6455.63 0.23
2 EDGE(�),bo(þ)
HABa(þ) T(þ), CORE(�),bo(þ)
j, TR(þ), bo(�),BO(þ)
0.6 34 6458.36 0.17
3 EDGE(�),bo(þ)
HABa(þ) T(þ), CORE(�),bo(þ)
j, TR(þ), bo(�),BO(þ)
0.9 34 6458.67 0.14
4 EDGE(�),bo(þ)
HABa(þ) T(þ), CORE(�),bo(þ)
j, TR(þ), bo(�),BO(þ)
2.0 34 6459.71 0.09
HUP 1 EDGE(�) . T(þ), bo(þ) j, TR(þ), bo(�) 0.0 40 7072.20 0.182 EDGE(�) . T(þ), bo(þ) j, TR(þ), bo(�) 0.1 39 7074.44 0.183 EDGE(�) . T(þ), bo(þ) j, TR(þ), bo(�) 0.6 40 7072.77 0.144 EDGE(�) . T(þ), bo(þ) j, TR(þ), bo(�) 0.6 39 7074.96 0.145 CORE(�) . T(þ), bo(þ) j, TR(þ), bo(�) 1.4 40 7073.57 0.096 EDGE(�) . T(þ), bo(þ) j, TR(þ), bo(�) 1.7 39 7076.04 0.087 EDGE(�) . bo(þ) j, TR(þ), bo(�) 1.7 39 7076.09 0.08
The Condor: Ornithological Applications 118:57–116, Q 2016 Cooper Ornithological Society
K. M. Dugger, E. D. Forsman, A. B. Franklin, et al. Northern Spotted Owl demography 75

TABLE 6. Continued.
Study area Model a w1 c e p DAICcb K Deviance wi
GDR 1 HD(þ) EDGE(þ) CORE(þ), bo(þ) t, j, TR(þ), bo(�),BO(�)
0.0 46 9762.76 0.27
2 HD(þ) EDGE(þ) CORE(þ), bo(þ) t, j, TR(þ), bo(�),BO(�)
0.6 45 9765.44 0.20
3 HD(þ) EDGE(þ) CORE(þ), bo(þ) t, j, TR(þ), bo(�),BO(�)
0.9 46 9763.71 0.17
4 HD(þ) EDGE(þ) CORE(þ), bo(þ) t, j, TR(þ), bo(�),BO(�)
1.3 45 9766.12 0.15
5 HD(þ) EDGE(þ) HABa(þ), bo(þ) t, j, TR(þ), bo(�),BO(�)
1.5 46 9764.22 0.13
(B) Barred OwlWashington
CLE 1 . HD(�) HABa(�), nso(þ) TR(�)2 . HD(�) HD(þ), nso(þ) TR(�)
RAI 1 . . HABa(�), nso(þ) T(þ), nso(�)OLY 1 . HABa(þ) nso(þ) T(þ), nso(�)
2 . HABa(þ) nso(þ) T(þ), nso(�)3 . HABa(þ) nso(þ) T(þ), nso(�)
OregonCOA 1 . T(þ), HD(�) T(�), EDGE(�),
nso(þ)T(þ), j, TR(�), NSO(�)
2 . T(þ) T(�), EDGE(�),nso(þ)
T(þ), j, TR(�), NSO(�)
3 . T(þ), HD(�) T(�), EDGE(�),nso(þ)
T(þ), j, TR(�), NSO(�)
4 . T(þ), HD(�) T(�), EDGE(�),nso(þ)
T(þ), j, TR(�), NSO(�)
5 . T(þ), HD(�) T(�), EDGE(�),nso(þ)
T(þ), j, TR(�), NSO(�)
6 . T(þ), HD(�) T(�), EDGE(�),nso(þ)
T(þ), j, TR(�), NSO(�)
HJA 1 . T(þ), nso(þ) HABp(�), nso(þ) t, j, TR(�), nso(�)TYE 1 . T(þ), HABa(þ) T(�), HABa(�),
nso(þ)t, j, TR(�)
KLA 1 . T(þ), HABp(þ),nso(�)
T(�), nso(þ) T(�), j, TR(�),nso(�)
2 . T(þ), HABp(þ) T(�), nso(þ) T(�), j, TR(�),nso(�)
3 . T(þ), HABp(þ),nso(�)
T(�), nso(þ) T(�), j, TR(�),nso(�)
CAS 1 . T(þ), EDGE(�),nso(þ)
T(�), HABa(�),nso(þ)
T, TR(�)
2 . T(þ), EDGE(�),nso(þ)
HABa(�), nso(þ) T, TR(�)
3 . T(þ), EDGE(�) T(�), HABa(�),nso(þ)
T, TR(�)
4 . T(þ), EDGE(�),nso(þ)
T(�), HABa(�),nso(þ)
T, TR(�)
5 . T(þ), EDGE(�),nso(þ)
T(�), HABa(�),nso(þ)
T, TR(�)
CaliforniaNWC 1 . T(þ), nso(þ) HD(þ), nso(þ) T(þ), TR(þ),
nso(�)2 . T(þ), nso(þ) HD(þ), nso(þ) TR(þ), nso(�)3 . T(þ), nso(þ) HD(þ) T(þ), TR(þ),
nso(�)4 . T(þ), nso(þ) nso(þ) T(þ), TR(þ),
nso(�)HUP 1 . T(þ), EDGE(þ) T(þ), HABa(�),
nso(þ)j
2 . T(þ), EDGE(þ) HABa(�), nso(þ) j
The Condor: Ornithological Applications 118:57–116, Q 2016 Cooper Ornithological Society
76 Northern Spotted Owl demography K. M. Dugger, E. D. Forsman, A. B. Franklin, et al.

adult females was between 0.18 and 0.34. The one
notable exception was the CLE study area in Wash-
ington, where mean annual fecundity for adult females (x
¼ 0.570 6 0.045) was nearly twice as high as in any other
area.
Female age was strongly associated with NYF and
occurred in top or competitive models for all study areas
(Table 10). However, there was considerable model
uncertainty for other effects. Of the 11 study areas, 5 had
top models or competitive models that included negative
TABLE 6. Continued.
Study area Model a w1 c e p DAICcb K Deviance wi
3 . T(þ), HD(�) T(þ), HABa(�),nso(þ)
j
4 . T(þ), EDGE(þ) T(þ), nso(þ) j5 . T(þ), EDGE(þ) T(þ), HABa(�),
nso(þ)j
6 . T(þ), EDGE(þ) T(þ), HABa(�) j7 . T(þ), EDGE(þ) T(þ), HABa(�),
nso(þ)j
GDR 1 . T(þ), EDGE(�) HABa(þ), nso(þ) T(þ)2 . T(þ), EDGE(�) nso(þ) T(þ)3 . T(þ), HD(�) HABa(þ), nso(þ) T(þ)4 . T(þ) HABa(þ), nso(þ) T(þ)5 . T(þ), EDGE(�) HABa(þ), nso(þ) T(þ)
a Model notation indicates the following parameter structures and the direction of the effect if appropriate: linear time trend (T),independent annual variation (t), the effect of Barred Owl presence on a territory (bo), the effect of Northern Spotted Owl presenceon a territory (nso), the effect of Barred Owl detections during a survey (BO), the effect of Northern Spotted Owl detections during asurvey (NSO), a detection response related to previous detection history within seasons (i.e. ‘‘trap response’’; TR), differences indetection rates within seasons (j), the total area of suitable habitat within each owl site (HABa), the proportion of each owl site thatcontained suitable habitat (HABp), a neighborhood focal statistic that defined the number of 30 m2 pixels with �50% suitablehabitat within 800 m of each pixel in each owl site (CORE), the amount of interface between suitable habitat and other cover typeswithin each owl site (EDGE), and the percentage of suitable habitat that was disturbed (HD).
b Lowest AICc value from top-ranking model for each study area: CLE¼ 4916.83; RAI¼ 4985.27; OLY¼ 8995.01; COA¼ 20526.07; HJA¼ 18851.46; TYE ¼ 17362.77; KLA¼ 14230.38; CAS ¼ 14012.13; NWC ¼ 6527.87; HUP ¼ 7155.04; and GDR ¼ 9856.94.
FIGURE 6. Predicted estimates of recruitment of Northern Spotted Owls from the best random-effects (RE) model from the meta-analysis of lambda, using the survival (/), recruitment (f), and capture probability (p) parameterization with study area (Area) andgeneral time (t) fixed effects [/(Area*t) p(Area*t) f(Area*t) RE f(WP*WMT)]. Estimates of recruitment are plotted across the range ofmean minimum winter temperatures (WMT) from the data, for the minimum (29 cm), mean (112 cm), and maximum (297 cm) levelsof total winter precipitation (WP) across all study areas and years.
The Condor: Ornithological Applications 118:57–116, Q 2016 Cooper Ornithological Society
K. M. Dugger, E. D. Forsman, A. B. Franklin, et al. Northern Spotted Owl demography 77

TABLE 7. Model covariate coefficients (b), standard errors (SE), and 95% confidence limits (lower: LCL; upper: UCL) for best timetrend, habitat, or Barred Owl model structure on (A) colonization (ci), and (B) extinction (ei) probabilities for Northern Spotted Owlsfrom the analysis of occupancy dynamics of Northern Spotted Owls and Barred Owls in 11 demographic study areas in Washington,Oregon, and California, USA, during 1994–2013.
(A) Colonization (ci)
Study area a Best model b ci effect b SE LCL UCL
WashingtonCLE c(T þ HD), e(bo) T �0.146 0.051 �0.245 �0.047
HD �1.156 0.852 �2.826 0.515RAI c(.), e(T þ HABa þ bo) .OLY c(HABa þ bo), e(T þ HABa þ bo) HABa 0.767 0.158 0.457 1.076
bo �1.256 0.543 �2.321 �0.191Oregon
COA c (T þ HABa þ bo), e(t þ HABp þ bo) T �0.053 0.031 �0.114 0.008HABa 0.532 0.121 0.295 0.769bo �0.882 0.343 �1.554 �0.211
HJA c(T þ HD), e(HABa þ bo) T �0.068 0.033 �0.133 �0.004HD �3.802 2.798 �9.285 1.681
TYE c(t þ HABa þ bo), e(T þ bo) HABa 0.761 0.148 0.471 1.052bo �1.352 0.447 �2.228 �0.476
KLA c(T þ EDGE þ bo), e(CORE þ bo) T �0.053 0.023 �0.099 �0.008EDGE 0.309 0.115 0.084 0.535bo �1.215 0.506 �2.208 �0.223
CAS c(HABa þ bo), e(HABa þ bo) HABa 0.433 0.149 0.142 0.725bo �0.942 0.391 �1.708 �0.176
CaliforniaNWC c(HABa), e(T þ CORE þ bo) HABa 0.562 0.246 0.081 1.043HUP c(.), e(T þ bo) .GDR c(EDGE), e(CORE þ bo) EDGE 0.339 0.196 �0.044 0.722
(B) Extinction (ei)
Study area a Best model b ei effect b SE LCL UCL
WashingtonCLE c(T þ HD), e(bo) bo 1.022 0.449 0.142 1.902RAI c(.), e(T þ HABa þ bo) T 0.093 0.043 0.009 0.176
HABa �0.732 0.254 �1.229 �0.235bo 2.556 1.488 �0.360 5.472
OLY c(HABa þ bo), e(T þ HABa þ bo) T 0.106 0.033 0.040 0.171HABa �0.337 0.199 �0.726 0.052bo 1.526 0.450 0.644 2.409
OregonCOA c(T þ HABa þ bo), e(t þ HABp þ bo) HABp �0.185 0.101 �0.382 0.013
bo 1.919 0.353 1.226 2.611HJA c(T þ HD), e(HABa þ bo) HABa �0.538 0.136 �0.804 �0.272
bo 2.174 0.407 1.376 2.971TYE c(t þ HABa þ bo), e(T þ bo) T �0.065 0.028 �0.121 �0.010
bo 1.426 0.297 0.844 2.008KLA (T þ EDGE þ bo), e(CORE þ bo) CORE �0.270 0.105 �0.477 �0.063
bo 1.102 0.380 0.357 1.846CAS c(HABa þ bo), e(HABa þ bo) HABa �0.283 0.164 �0.604 0.038
bo 2.601 0.417 1.783 3.412California
NWC c(HABa), e(T þ CORE þ bo) T 0.099 0.039 0.022 0.175CORE �0.398 0.149 �0.690 �0.106bo 0.914 0.422 0.086 1.742
HUP c(.), e(T þ bo) T 0.071 0.037 �0.002 0.143bo 1.318 0.392 0.550 2.085
GDR (EDGE), e(CORE þ bo) CORE 0.279 0.140 0.004 0.553bo 1.959 0.450 1.076 2.842
a See Table 2 for study area codes.b See Table 6 for model covariate notation.
The Condor: Ornithological Applications 118:57–116, Q 2016 Cooper Ornithological Society
78 Northern Spotted Owl demography K. M. Dugger, E. D. Forsman, A. B. Franklin, et al.

linear (T) or quadratic (TT) time trends on fecundity,
including 1 area in Washington (CLE), 3 areas in Oregon
(COA, HJA, and TYE), and 1 area in California (NWC;
Table 10, 11). The 95% CIs for the covariate coefficients (b)from these models excluded 0 for TYE and NWC,
suggesting strong support for a declining trend in
fecundity in these areas (Table 11). There was less support
for declining trends in CLE, COA, and HJA, as 95% CIs
slightly overlapped 0 for these study areas. Annual
variation in fecundity was particularly high in study areas
in Washington, which may have made it more difficult to
detect trends in that region (Figure 9). For example, it was
common for there to be years of no reproduction in the
RAI and OLY study areas in Washington, whereas years
with no reproduction were rare in study areas in Oregon,
and were never observed in any of the California study
areas.
Barred Owl presence (BO) was included in a top or
competing fecundity model in only 2 of the 11 study areas
(COA and KLA; Table 10, 12) and the relationship was
negative, with 95% CIs for the covariate coefficients not
FIGURE 7. Mean (A) local colonization (c) and (B) extinction (e)rates with 95% confidence intervals for Northern Spotted Owlsin 11 study areas in Washington, Oregon, and California, USA,1985–2013, relative to when a territory was also occupied byBarred Owls (gray triangles) and when Barred Owls were notpresent (black circles). Estimates reflect mean values for otherfactors in the best model for each study area. Data from theBarred Owl removal treatment areas in the GDR study area wereexcluded after 2008, so that all study areas were comparable.See Table 2 for study area abbreviations.
FIGURE 8. Estimates of the probability of territory occupancy forNorthern Spotted Owls in 11 study areas in (A) Washington, (B)Oregon, and (C) California, USA. See Table 2 for study areaabbreviations.
The Condor: Ornithological Applications 118:57–116, Q 2016 Cooper Ornithological Society
K. M. Dugger, E. D. Forsman, A. B. Franklin, et al. Northern Spotted Owl demography 79

overlapping 0 in both cases. It is important to note that the
proportion of each study area occupied by Barred Owls
gradually increased over time (Appendix C Figure 13), so
the temporal effect and BO effect were highly correlated
and not easily separated. This may explain the lack of effect
(or counterintuitive effect) of Barred Owls on fecundity in
some areas.
Habitat covariates (HAB and CORE) were included in
the top or competitive models for fecundity in 7 study
areas (CLE, COA, HJA, TYE, CAS, NWC, GDR, GDR-C,
and GDR-T; Table 10, 13). More nesting and roosting
habitat (HAB or CORE) was associated with higher NYF in
these areas; however, only in TYE, NWC, GDR, and
GDR-C did the 95% CIs for covariate coefficients not
TABLE 8. Estimates of annual territory occupancy (Wi), with standard errors (SE) and lower (LCL) and upper (UCL) confidence limits,for Northern Spotted Owls during the first year of the study (1999 for the GDR study area; 1995 for all other areas), and also the lastyear (2013), based on the best model parameter structure for initial occupancy (w1), colonization (ci), extinction (ei), and detection(pij) probabilities in each of 11 study areas in Washington, Oregon and California, USA.
Study Area a Wstart SE LCL UCL W2013 SE LCL UCL
WashingtonCLE 0.555 0.060 0.436 0.668 0.113 0.031 0.065 0.190RAI 1.000 1.000 1.000 1.000 0.256 0.057 0.161 0.381OLY 0.811 0.066 0.648 0.909 0.209 0.041 0.141 0.300
OregonCOA 0.749 0.050 0.640 0.834 0.284 0.039 0.214 0.366HJA 0.879 0.043 0.769 0.941 0.482 0.049 0.388 0.577TYE 0.609 0.065 0.477 0.726 0.384 0.054 0.285 0.495KLA 0.705 0.061 0.574 0.810 0.457 0.037 0.386 0.530CAS 0.691 0.056 0.572 0.788 0.443 0.035 0.377 0.511
CaliforniaNWC 0.788 0.082 0.586 0.908 0.471 0.069 0.342 0.605HUP 0.739 0.082 0.553 0.867 0.381 0.051 0.287 0.484GDR b 0.920 0.065 0.669 0.985 0.548 0.042 0.466 0.628
a See Table 2 for study area codes.b Data from the GDR study area excluded the Barred Owl removal treatment areas after 2008 so that results were comparable with
other study areas.
TABLE 9. Estimates of means (x) with standard errors (SE) of age-specific fecundity (number of female young produced per femaleper year) of Northern Spotted Owls in 11 study areas in Washington, Oregon, and California, USA, 1985–2013.
Study area a Years
1-yr-old (S1) 2-yr-old (S2) �3-yr-old (Adult)
n b x SE n b x SE n b x SE
WashingtonCLE 1989–2013 26 0.107 0.077 37 0.506 0.100 519 0.570 0.045RAI 1992–2013 7 0.083 0.083 12 0.100 0.100 316 0.264 0.055OLY 1990–2013 4 0.250 0.250 16 0.292 0.126 726 0.294 0.056
OregonCOA 1990–2013 24 0.000 0.000 60 0.060 0.026 1,611 0.223 0.036HJA 1990–2013 13 0.000 0.000 45 0.103 0.040 1,388 0.288 0.037TYE 1990–2013 65 0.016 0.011 92 0.229 0.061 1,112 0.263 0.032KLA 1990–2013 93 0.048 0.021 139 0.257 0.044 1,427 0.335 0.032CAS 1991–2013 37 0.042 0.032 56 0.132 0.044 1,235 0.323 0.046
CaliforniaNWC 1985–2013 76 0.080 0.049 100 0.140 0.036 1,240 0.315 0.024HUP 1992–2013 21 0.000 0.000 28 0.067 0.045 446 0.223 0.032GDR-CB a 1990–2008 39 0.109 0.043 72 0.088 0.032 870 0.302 0.034GDR-TB a 1990-2008 30 0.039 0.026 54 0.126 0.064 595 0.308 0.030GDR-CA a 2009–2013 1 0.000 0.000 2 0.000 0.000 94 0.182 0.080GDR-TA a 2009–2013 6 0.000 0.000 23 0.063 0.063 212 0.212 0.050
Mean fecundity c 0.065 0.022 0.175 0.039 0.309 0.027
a See Table 2 for general study area codes and Table 4 for GDR study area notation.b Total number of cases sampled in each age class.c Mean fecundity by age class excludes means for GDR-CA and GDR-TA in 2009–2013.
The Condor: Ornithological Applications 118:57–116, Q 2016 Cooper Ornithological Society
80 Northern Spotted Owl demography K. M. Dugger, E. D. Forsman, A. B. Franklin, et al.

TABLE 10. Model selection results for models with DAICc , 2 from the analysis of mean age-specific number of young fledged peryear per female (NYF) for Northern Spotted Owls in 11 study areas in Washington, Oregon, and California, USA, 1985–2013. Modelswere ranked according to Akaike’s Information Criterion adjusted for small sample size (AICc), and the difference in AICc betweeneach model and the model with the lowest AICc (DAICc), the number of parameters (K), Akaike weight (wi), and model deviance(�2logL) are included for each candidate model.
Study area a Model b DAICcc K wi �2logL
WashingtonCLE A þ AR(1) 0.00 5 0.09 100.00
A þ ENT 1.44 5 0.04 101.44A þ T þ AR(1) 1.72 6 0.04 99.22A þ AR(1) þ HAB 1.78 6 0.04 99.28
RAI A þ EO þ ENT*ENP 0.00 8 0.28 27.51A þ ENT*ENP 0.55 7 0.21 31.29
OLY EO 0.00 3 0.16 65.10A þ EO þ SOI 1.86 6 0.06 59.08A þ EO 1.89 5 0.06 61.90
OregonCOA A þ TT þ EO þ AR(1) 0.00 8 0.09 �17.36
A þ EO þ BO 0.71 6 0.06 �11.20A þ EO þ HAB þ Y09S 1.33 7 0.05 �13.24A þ EO þ T 1.44 6 0.04 �10.47A þ EO þ HAB þ Y09P 1.47 7 0.04 �13.11A þ EO þ T þ Y09S 1.70 7 0.04 �12.87A þ EO þ T þ Y09P 1.99 7 0.03 �12.59
HJA A*EO 0.00 7 0.09 �1.48A*EO þ HAB 0.88 8 0.06 �3.40A þ EO þ ENT 1.19 6 0.05 2.39A þ EO þ LNP 1.43 6 0.04 2.64A*EO þ T 1.50 8 0.04 �2.78A þ EO 1.58 5 0.04 5.35
TYE A þ AR(1) þ HAB 0.00 6 0.25 35.51A þ T þ AR(1) 0.09 6 0.24 35.60A þ TT þ AR(1) 1.21 7 0.14 34.21
KLA A þ LNP*BO 0.00 7 0.13 11.89A þ APL1*BO 1.32 7 0.07 13.20A þ EO þ BO 1.35 6 0.07 15.73
CAS A þ EO þ ENT 0.00 6 0.15 22.31A þ EO þ ENT þ CORE 0.04 7 0.14 19.76A þ EO þ ENT þ HAB 0.11 7 0.14 19.83A þ EO þ ENT þ ENP 1.78 7 0.06 21.50
CaliforniaNWC A þ HAB þ WMT þ WP 0.00 7 0.06 35.62
A þ HAB þ WMT*WP 0.61 8 0.04 33.73A þ HAB 0.99 5 0.04 41.40A þ HAB þ ENP 1.06 6 0.04 39.11A þ HAB þ SOI 1.32 6 0.03 39.38A*EO þ HAB 1.68 8 0.03 34.80A þ T 1.80 5 0.02 42.21
HUP A þ ENT*ENP 0.00 7 0.15 �4.37A þ ENT þ ENP 0.78 6 0.10 �0.91
GDR d A þ EO þ WP þ CORE 0.00 7 0.12 �23.60A þ EO þ CORE þ WMT þ WP 0.17 8 0.11 �26.00A þ EO þ WP þ HAB 0.23 7 0.11 �23.37A þ EO þ HAB þ WMT þ WP 0.50 8 0.10 �25.67
GDR-C e A þ EO þ WP þ CORE 0.00 7 0.25 �8.46A þ EO þ WP þ HAB 0.36 7 0.21 �8.11
GDR-T f A þ EO þ WMT þ WP 0.00 7 0.10 16.50A þ EO þ WP 0.15 6 0.09 19.21A þ EO þ HAB þ WMT þ WP 1.13 8 0.06 14.98A þ EO þ CORE þ WMT þ WP 1.13 8 0.06 14.98A þ EO þ EDGE þ WMT þ WP 1.58 8 0.04 15.42A þ EO þ WP þ HAB 1.69 7 0.04 18.19
The Condor: Ornithological Applications 118:57–116, Q 2016 Cooper Ornithological Society
K. M. Dugger, E. D. Forsman, A. B. Franklin, et al. Northern Spotted Owl demography 81

overlap 0, suggesting that there was little support for
strong associations between habitat and NYF in most
study areas (Table 13).
Climate covariates occurred in competitive models for 8
of 11 study areas (Table 10, 14), but the best covariate and
the direction of the effect varied among areas (Table 14).
For example, the effect of mean monthly minimum
temperature during the early nesting season (ENT)
occurred in the best model or a competitive model for 5
areas (CLE, RAI, HJA, CAS, and HUP), but the effect was
positive in 3 areas (CLE, HJA, and CAS) and negative in 2
others (RAI and HUP; Table 14), with 95% CIs that did not
overlap 0 for CLE, CAS, and HUP. Precipitation during the
early nesting season (ENP) occurred in competitive models
TABLE 10. Continued.
Study area a Model b DAICcc K wi �2logL
A þ EO þ WP þ CORE 1.71 7 0.04 18.22
a See Table 2 for general study area codes.b Model notation indicates structure for the effects of owl age (A), even–odd year variation (EO), linear time trend (T), quadratic time
trend (TT), autoregressive time trend (AR(1)), a time step in which fecundity experienced a sudden change in 2009 (Y09S), a ‘‘brokenstick’’ time effect in which fecundity experienced a gradual change beginning in 2009 (Y09P), total annual precipitation from theprevious year (APL1), proportion of territories with Barred Owl detections (BO), southern oscillation index (SOI), mean monthlyminimum temperature during the early nesting season (ENT), total precipitation during the early nesting season (ENP), totalprecipitation during the late nesting season (LNP), mean monthly minimum temperature during winter (WMT), total precipitationduring winter (WP), percent cover of suitable owl habitat (HAB), a neighborhood focal statistic that defined the number of 30 m2
pixels with �50% suitable habitat within 800 m of each pixel in each owl site (CORE), and the amount of interface between suitablehabitat and other cover types within each owl site (EDGE).
c The AICc values for the top models were: CLE¼ 111.18, RAI¼48.47, OLY¼ 71.77, COA¼ 1.91, HJA¼ 15.07, TYE¼ 48.96, KLA¼ 27.78,CAS ¼ 35.96, NWC ¼ 51.27, HUP ¼ 12.18, GDR ¼�7.73, GDR-C ¼ 7.65, and GDR-T¼ 32.62.
d Estimates based on all Spotted Owl territories.e Estimates based only on Spotted Owl territories within control areas where Barred Owls were not removed.f Estimates based only on Spotted Owl territories within treatment areas where Barred Owls were removed.
TABLE 11. Best model containing a linear (T), quadratic (TT), or autoregressive (AR(1)) time effect on the mean annual number ofyoung fledged per adult female Northern Spotted Owl (NYF) in each of 11 study areas in Washington, Oregon, and California, USA,1985–2013. Model covariate coefficients (b), standard errors, and 95% confidence limits (lower: LCL; upper: UCL) are presented forthe linear and/or quadratic term in each model.
Study area a Best model b DAICcc b SE LCL UCL
WashingtonCLE A þ T þ AR(1) 1.72 �0.004 0.004 �0.013 0.005RAI A þ EO þ T 8.37 �0.002 0.006 �0.015 0.011OLY A þ EO þ T 4.57 �0.005 0.006 �0.017 0.006
OregonCOA A þ TT d þ EO þ AR(1) 0.00 �0.002 0.004 �0.010 0.007
�0.000 0.000 �0.001 0.000HJA A*EO þ T 1.50 �0.003 0.002 �0.008 0.002TYE A þ T þ AR(1) 0.09 �0.009 0.002 �0.013 �0.004KLA A þ EO þ TT d þ HAB 2.06 0.028 0.014 �0.001 0.057
�0.001 0.000 �0.002 �0.001CAS A þ TT d þ EO þ AR(1) þ HAB 2.86 0.009 0.007 �0.006 0.024
0.001 0.000 0.000 0.001California
NWC A þ T 1.80 �0.009 0.002 �0.013 �0.004HUP A þ EO þ HAB þ T09P 5.52 –0.068 0.026 –0.120 –0.015GDR A þ EO þ T 2.60 �0.006 0.002 �0.010 �0.002GDR-C A þ EO þ T 6.10 �0.012 0.002 �0.016 �0.007GDR-T A þ EO þ T þ HAB 3.60 �0.048 0.027 �0.102 0.005
a See Table 2 for general study area codes and Table 10 for GDR study area notation.b See Table 10 for model covariate notation.c See Table 10 for model AICc values.d The first estimate is the linear term, and the second is the quadratic term.
The Condor: Ornithological Applications 118:57–116, Q 2016 Cooper Ornithological Society
82 Northern Spotted Owl demography K. M. Dugger, E. D. Forsman, A. B. Franklin, et al.

for only 2 study areas (RAI and HUP), and in both areas
ENP interacted with ENT. The 95% CIs around the ENP
covariate coefficients excluded or slightly overlapped 0 in
both cases, and the association was negative (as predicted)
in 1 area (HUP), but positive in the other (RAI).
Precipitation during the late nesting season (LNP) was
included in a best or competitive model for only 1 study
area (KLA), where it occurred as an interaction with the
presence of Barred Owls, and where the 95% CI for the
effect of LNP did not overlap 0. Mean minimum winter
temperature (WMT) and total winter precipitation (WP)
were included in top or competitive models for only 2
study areas (NWC and GDR). In both cases, higher
minimum temperatures during winter were associated
with higher fecundity, and more winter precipitation was
associated with lower fecundity, but all 95% CIs for the
WMT and WP covariate coefficients overlapped 0, except
for the effects of WMT in the Barred Owl treatment areas
in the GDR study area. The Southern Oscillation Index
(SOI) occurred in a competitive model for only 1 study
area (OLY), where the 95% CI around the covariate
coefficient slightly overlapped 0, suggesting weak support
for this effect (Table 10, 14).
Estimation of spatial (site-to-site), temporal (year-to-
year), and residual variance in the territory-specific data
indicated that the proportion of variance in NYF
attributable to territories (spatial variance) was generally
low (,6%; Table 15). The proportion of variance
attributable to fluctuations over time (temporal variance)
ranged from 5% to 20%, while the proportion of
unexplained variation (residual variance) was generally
high (.77%). As a consequence, the variation in NYF thatwas able to be explained by time and territory was
overwhelmed by unexplained residual variation (i.e. other
factors not considered).
Meta-analysis of fecundity. The meta-analysis offecundity produced 6 competitive models, all of which
included the additive effects of region and time (Table
16). These models all suggested that fecundity varied by
time, and was parallel across regions (Figure 10). A
linear time trend (T) in fecundity was not supported
because of the complex pattern in fecundity over time
that resulted due to the dissipation of the even–odd year
effect in most study areas after about 1999. Model
weights were fairly evenly distributed among the 6
competitive models, but the 2 models with the highest
model weights were a model that included the negative
effect of core habitat (CORE; b ¼�0.14, 95% CI: �0.25to �0.02), and a model that included the additive
negative effects of Barred Owls (BO; b ¼�0.14, 95% CI:
�0.30 to 0.01) and the amount of edge habitat (EDGE; b¼ �0.60, 95% CI: �1.20 to 0.00; Table 16). Three other
competitive models included 1 or more of these 3
covariates (CORE, BO, EDGE), and the amount of
nesting and roosting habitat (HAB; b ¼ �0.23, 95% CI:
�0.46 to 0.01) was also included in a competitive model.
However, only for core habitat did the 95% CI for the
covariate coefficient not overlap 0, although this
relationship suggested that more core habitat was
associated with decreased fecundity, contrary to predic-
tions. None of the models that included the effects of
land ownership, latitude, prey species richness, habitat
FIGURE 9. Annual fluctuations in mean fecundity (number offemale young fledged per female) of Northern Spotted Owls in(A) 3 study areas in Washington, (B) 5 study areas in Oregon, and(C) 3 study areas in California, USA. Mean fecundity was graphedseparately for the areas within the Green Diamond (GDR) studyarea where Barred Owls were removed (2009–2013; GDR–Treatment) and where Barred Owls were not removed (1990–2013; GDR–Control). See Table 2 for study area abbreviations.
The Condor: Ornithological Applications 118:57–116, Q 2016 Cooper Ornithological Society
K. M. Dugger, E. D. Forsman, A. B. Franklin, et al. Northern Spotted Owl demography 83

disturbance, or climate were competitive, indicating that
these covariates did not explain variation in fecundity
across the range of the Northern Spotted Owl. The
region effect on fecundity (Figure 10) appeared to be
largely related to the pattern previously described in the
individual study area analysis (Table 9, Figure 9), in
which the east slope of the Cascades in Washington
(region: Washington mixed conifer; 1 study area: CLE)
had much higher fecundity than all other areas (Figure
9, 10).
TABLE 12. Best model including the effect of Barred Owls (BO) on the mean annual number of young fledged per adult femaleNorthern Spotted Owl (NYF) for each of 11 study areas in Washington, Oregon, and California, USA, 1985–2013. Model covariatecoefficients (b), standard errors, and 95% confidence limits (lower: LCL; upper: UCL) are included for the Barred Owl effect in eachmodel.
Study area a Best model b DAICcc b SE LCL UCL
WashingtonCLE A þ ENT þ BO 3.94 �0.038 0.791 �1.626 1.550RAI A þ EO þ BO 7.54 �0.325 0.240 �0.812 0.163OLY A þ EO þ BO 4.35 �0.139 0.243 �0.631 0.354
OregonCOA A þ EO þ BO 0.71 �0.186 0.059 �0.305 �0.068HJA A þ EO þ BO 3.70 �0.081 0.122 �0.327 0.164TYE A þ TT þ BO þ AR(1) 2.78 0.294 0.290 �0.289 0.876KLA A þ LNP*BO d 0.00 �1.734 0.415 �2.564 �0.905
0.095 0.038 0.020 0.170CAS A þ TT þ BO þ AR(1) þ HAB 7.22 0.482 0.573 �0.675 1.639
CaliforniaNWC A þ BO þ HAB 3.27 0.126 0.452 �0.775 1.027HUP A þ ENT þ BO 5.93 �0.083 0.102 �0.288 0.121GDR A þ EO þ BO þ T 5.08 0.054 0.537 �1.019 1.128GDR-C A þ WP þ BO 7.85 �1.336 0.381 �2.100 �0.571GDR-T A þ EO þ BO 4.15 �0.668 0.401 �1.471 0.135
a See Table 2 for general study area codes and Table 10 for GDR study area notation.b See Table 10 for model covariate notation.c See Table 10 for model AICc values.d First estimate is the main BO effect, second is the interactive effect of BO and LNP.
FIGURE 10. Annual fluctuations in mean fecundity (number of female young fledged per female) of Northern Spotted Owls in 6geographic regions from the meta-analysis of 11 study areas in Washington, Oregon, and California, USA, 1985–2013.
The Condor: Ornithological Applications 118:57–116, Q 2016 Cooper Ornithological Society
84 Northern Spotted Owl demography K. M. Dugger, E. D. Forsman, A. B. Franklin, et al.

TABLE 13. Best model containing the effect of habitat on the mean annual number of young fledged per adult female NorthernSpotted Owl (NYF) for each of 11 study areas in Washington, Oregon, and California, USA, 1985–2013. Model covariate coefficients(b), standard errors (SE), and 95% confidence limits (lower: LCL; upper: UCL) are included for the habitat effect in each model.
Study area a Best model b DAICcc b SE LCL UCL
WashingtonCLE A þ AR(1) þ HAB 1.78 1.183 1.411 �1.684 4.050RAI A þ CORE þ ENT*ENP 3.27 �2.484 3.460 �9.541 4.574OLY EO þ HAB 2.47 �0.566 8.682 �18.160 17.024
OregonCOA A þ EO þ HAB þ Y09S 1.33 2.056 1.299 –0.558 4.669HJA A*EO þ HAB 0.88 3.571 2.549 �1.564 8.705TYE A þ AR(1) þ HAB 0.00 2.048 0.528 0.981 3.115KLA A þ EO þ TT þ HAB 2.06 6.115 3.405 �0.696 12.925CAS A þ EO þ ENT þ CORE 0.04 2.448 1.516 �0.595 5.490
CaliforniaNWC A þ HAB þ WMT þ WP 0.00 5.273 1.195 2.889 7.657HUP A þ CORE þ ENT*ENP 2.77 0.125 0.644 �1.172 1.423GDR A þ EO þ WP þ CORE 0.00 0.494 0.187 0.121 0.867GDR-C A þ EO þ WP þ CORE 0.00 0.951 0.237 0.476 1.426GDR-T A þ EO þ WP þ WMT þ HAB 1.13 0.557 0.447 �0.340 1.454
a See Table 2 for general study area codes and Table 10 for GDR study area notation.b See Table 10 for model covariate notation.c See Table 10 for model AICc values.
TABLE 14. Best model containing the effect(s) of climate or weather on the mean annual number of young fledged per adult femaleNorthern Spotted Owl (NYF) for each of 11 study areas in Washington, Oregon, and California, USA, 1985–2013. Model covariatecoefficients (b), standard errors (SE), and 95% confidence limits (lower: LCL; upper: UCL) are included for the climate or weathereffect(s) in each model.
Study area a Best model b DAICcc b SE LCL UCL
WashingtonCLE A þ ENT 1.44 0.105 0.041 0.023 0.188RAI A þ ENT*ENP d 0.00 �0.036 0.008 �0.053 �0.020
0.437 0.101 0.231 0.642�0.010 0.003 �0.016 �0.005
OLY A þ EO þ SOI 1.86 �0.101 0.059 �0.220 0.019Oregon
COA A þ EO þ ENT þ HAB 3.26 0.023 0.018 �0.013 0.058HJA A þ EO þ ENT 1.19 0.039 0.022 �0.006 0.084TYE A þ LNT*BO e 5.59 �0.136 0.044 �0.223 �0.049
0.324 0.130 0.065 0.584KLA A þ LNP*BO e 0.00 �0.015 0.005 �0.025 �0.005
0.095 0.038 0.020 0.170CAS A þ EO þ ENT 0.00 0.078 0.019 0.040 0.116
CaliforniaNWC A þ HAB þ WP þ WMT f 0.00 �0.002 0.001 �0.003 –0.000
0.047 0.021 0.005 0.089HUP A þ ENT*ENP d 0.00 �0.008 0.003 �0.014 �0.001
�0.137 0.048 �0.233 �0.0400.003 0.001 0.000 0.005
GDR A þ EO þ WP þ CORE 0.00 –0.001 0.000 �0.002 –0.000GDR-C A þ EO þ WP þ CORE 0.00 �0.001 0.000 �0.003 –0.001GDR-T A þ EO þ WP þ WMT 0.00 �0.002 0.001 �0.003 –0.001
0.039 0.023 –0.008 0.085
a See Table 2 for general study area codes and Table 10 for GDR study area notation.b PDO indicates the Pacific Decadal Oscillation. See Table 10 for additional model covariate notation.c See Table 10 for model AICc values.d The first and second estimates are the main effects of ENT and ENP, respectively, and the third is the interactive effect.e The first estimate is the main effect of LNT or LNP, the second estimate is the interactive effect with BO.f The first estimate is the main effect of WP and the second estimate is the main effect of WMT.
The Condor: Ornithological Applications 118:57–116, Q 2016 Cooper Ornithological Society
K. M. Dugger, E. D. Forsman, A. B. Franklin, et al. Northern Spotted Owl demography 85

Apparent SurvivalIndividual study areas. We used the encounter
histories of 5,090 owls (excluding 1-yr-olds [S1]; see
Appendix H) to estimate apparent survival in individual
study areas (Table 2, 17). The best fixed effects model
that we used as the basis for random effects modeling
included time effects on apparent survival and capture
rates for 6 areas (/(t) p(t); RAI, OLY, COA, TYE, CAS,
and HUP), and a time effect on survival and an additive
time and sex effect (males higher than females) on
capture rates for 5 areas (/(t) p(sexþ t); CLE, HJA, KLA,
NWC, and GDR). For the GDR study area the fixed
effects model structure also included an interactive effect
of the Barred Owl treatment effect and time on survival,
and additive effects of Barred Owl treatment, sex, and
time on recapture rates [/(Trt*t) p(sex þ t þ Trt)].
Survival and captures rates in the GDR study area were
higher in treatment areas after Barred Owl removals
began in 2009, and males had higher recapture rates
than females. The best random effects model varied
widely by study area, with temporal variation best
modeled by a trend or explained by a variety of factors,
including Barred Owls, climate, and habitat (Appendix I
Figure 16). Mean estimates of apparent survival ranged
from a low of 0.804 6 0.032 in GDR control areas after
Barred Owl removals began in 2009, to a high of 0.870
6 0.009 in the HJA study area and 0.870 6 0.021 in
the GDR treatment areas after Barred Owl removals
began.
Five of the 11 study areas included either a negative
linear (T) or log-linear (lnT) time trend on survival in the
best model (GDR) or competitive models (CLE, RAI, CAS,
and HUP), but the effect was strong in only 1 area (RAI) as
evidenced by a 95% CI for the covariate coefficient that did
TABLE 15. Variance components of the mean annual number of young fledged per adult female Northern Spotted Owl (NYF) fromthe mixed-model analysis of year- and territory-specific effects in 11 study areas in Washington, Oregon, and California, USA, 1985–2013.
Study area a
Spatial b Temporal c Residual
TotalEstimate % total Estimate % total Estimate % total
WashingtonCLE 0.058 6% 0.132 15% 0.708 79% 0.898RAI 0.000 0% 0.016 4% 0.404 96% 0.420OLY 0.010 2% 0.102 21% 0.385 77% 0.497
OregonCOA 0.007 1% 0.087 16% 0.451 83% 0.545HJA 0.007 1% 0.073 11% 0.572 88% 0.652TYE 0.022 4% 0.073 11% 0.540 85% 0.635KLA 0.012 1% 0.045 7% 0.626 92% 0.683CAS 0.024 3% 0.137 18% 0.588 79% 0.749
CaliforniaNWC 0.010 1% 0.045 7% 0.654 92% 0.708HUP 0.033 6% 0.057 10% 0.480 84% 0.570GDR 0.015 2% 0.038 6% 0.584 92% 0.636GDR-C 0.010 1% 0.043 7% 0.574 92% 0.626GDR-T 0.020 3% 0.037 6% 0.592 91% 0.649
a See Table 2 for general study area codes and Table 10 for GDR study area notation.b Spatial process variance is the random effects estimate of territory variability.c Temporal process variance is the random effects estimate of annual variability.
TABLE 16. Model selection results for models with DAICc , 5from the meta-analysis of the mean annual number of youngfledged per adult female Northern Spotted Owl (NYF) in 11study areas in Washington, Oregon, and California, USA, 1985–2013. Models were ranked according to Akaike’s InformationCriterion adjusted for small sample size (AICc) and the differencein AICc between each model and the model with the lowest AICc
(DAICc). The number of parameters (K), Akaike weight (wi), andmodel deviance (�2logL) are included for each candidate model.
Model a DAICc K wi �2logL
REG þ t þ CORE 0.00 b 36 0.18 12.95REG þ t þ BO þ EDGE 0.03 37 0.18 10.40REG þ t þ EDGE 0.64 36 0.13 13.59REG þ t þ BO þ CORE 1.01 37 0.11 11.39REG þ t þ BO 1.30 36 0.10 14.25REG þ t þ HAB 1.90 36 0.07 14.84REG þ t þ BO þ HAB 2.29 37 0.06 12.67REG þ t 2.77 35 0.05 18.27REG þ t þ BO þ PR 3.02 37 0.04 13.39REG þ t þ BO þ HD 3.36 37 0.03 13.73REG þ t þ PR 3.42 36 0.03 16.37
a Model notation indicates structure for effects of geographicregion (REG), prey species richness index (PR), and percentageof suitable habitat that was disturbed (HD). See Table 10 foradditional model covariate notation.
b The AICc value of the top model ¼ 94.60.
The Condor: Ornithological Applications 118:57–116, Q 2016 Cooper Ornithological Society
86 Northern Spotted Owl demography K. M. Dugger, E. D. Forsman, A. B. Franklin, et al.

not overlap 0 (Table 18). However, in 9 of the 10 study
areas where it was investigated, the Barred Owl covariate
(BO), which exhibited increasing positive trends over time
in all areas (Appendix C Figure 13), was included in the
random effects structure in the best model or a
competitive model (Table 19). The 95% CIs around the
covariate coefficients for the Barred Owl effect did not
overlap 0 for 4 areas (RAI, COA, HJA, and NWC) and
barely overlapped 0 for 3 others (CLE, CAS, and HUP),
and in all cases coefficients (or interactions) were negative,
suggesting that the presence of Barred Owls was negatively
associated with apparent survival in many study areas.
Although the Barred Owl covariate was not modeled for
GDR (because it was confounded with treatment effects),
the best random effects survival model for GDR included
higher apparent survival in treatment areas where Barred
Owls were removed, although the 95% CI around the
covariate coefficient for the treatment effect included 0
(After*Trt*T interaction; Table 19). Based on the best
survival models that included either time trends or the
negative effect of Barred Owl detections, we concluded
that there was strong support for declining apparent
survival in at least 8 of 11 study areas (CLE, RAI, HJA,
TYE, CAS, NWC, HUP, and GDR).
The effect of population-level reproductive rates (R)
occurred in top models of apparent survival for 2 areas
(RAI and OLY), and in competitive models for 3 areas
(CLE, CAS, and HUP; Table 20). However, 95% CIs around
the covariate coefficients for R overlapped 0 in all but 1
study area (RAI), suggesting that there was no support for
an effect of R on survival in most study areas.
The amount of nesting and roosting habitat (HAB) did
not occur in top or competitive models of apparent
survival for any of the 10 areas for which it was
investigated (Table 21). The amount of core habitat was
the best habitat covariate overall for 1 area (KLA) and
occurred in competitive models for 2 other areas (RAI and
HUP); however, 95% CIs for all CORE covariate coeffi-
cients widely overlapped 0, suggesting little support for
this effect. Where investigated, the amount of interface
between nesting and roosting habitat and other cover types
(EDGE) occurred in a top or competitive model for only 2
of 9 areas (CLE and COA). In both cases the 95% CIs
around the EDGE covariate coefficients slightly overlapped
0, but, similarly to the fecundity analysis, the coefficients
were positive, which was contrary to what we predicted.
The annual amount of nesting and roosting habitat
disturbance (HD) occurred in a top or competitive model
TABLE 17. Estimates of mean apparent survival ( ˆ/) and temporal process variance (rtemporal), with associated standard errors and95% lower (LCL) and upper (UCL) confidence limits, for adult female Northern Spotted Owls in 11 study areas in Washington,Oregon, and California, USA, 1985–2013. Estimates of mean apparent survival were generated using the intercept-only randomeffects model [RE(.)]. Estimates of temporal process variance were based on the best random effects model (Mean, T, lnT, TT, orSPLINE) for each study area using time-specific estimates of apparent survival (/) and capture probability (p).
Study area a Model b ˆ/ SE LCL UCL rtemporal LCL UCL
WashingtonCLE /(t) p(sex þ t) RE /(T) 0.836 0.013 0.811 0.862 0.033 0.000 0.079RAI /(t) p(t) RE /(T) 0.835 0.020 0.758 0.874 0.065 0.029 0.121OLY /(t) p(t) RE /(TT) 0.852 0.010 0.832 0.872 0.033 0.000 0.079
OregonCOA /(t) p(t) RE /(T) 0.861 0.014 0.834 0.888 0.058 0.034 0.099HJA /(t) p(sex þ t) RE /(SPLINE) 0.870 0.009 0.852 0.888 0.029 0.000 0.059TYE /(t) p(t) RE /(T) 0.858 0.010 0.838 0.878 0.034 0.015 0.060KLA /(t) p(sex þ t) RE /(T) 0.848 0.009 0.830 0.866 0.033 0.015 0.059CAS /(t) p(t) RE /(T) 0.851 0.011 0.829 0.873 0.043 0.022 0.075
CaliforniaNWC /(t) p(sex þ t) RE /(lnT) 0.844 0.010 0.824 0.834 0.036 0.010 0.065HUP /(t) p(t) RE /(lnT) 0.858 0.011 0.836 0.879 0.023 0.000 0.063GDR-CB /(Trt*t) p(sex þ t þ Trt) RE /[B(T), A(Trt*T)] 0.858 0.008 0.840 0.875 0.008 c 0.000 0.036GDR-TB /(Trt*t) p(sex þ t þ Trt) RE /[B(T), A(Trt*T)] 0.857 0.009 0.841 0.872GDR-CA /(Trt*t) p(sex þ t þ Trt) RE /[B(T), A(Trt*T)] 0.804 0.032 0.741 0.867GDR-TA /(Trt*t) p(sex þ t þ Trt) RE /[B(T), A(Trt*T)] 0.870 0.021 0.828 0.911
a See Table 2 for general study area codes, and Table 4 for GDR study area notation.b Best Random Effects (RE) model structure from analyses of the a priori model set based on the best time or sex fixed effects base
model for each area. Model notation indicates structure for effects of time (t), sex (sex), linear time trend (T), log-linear time trend(lnT), quadratic time trend (TT), spline (SPLINE, with knots every 5 yr backward from 2013), or constant (.) models. The best fixedeffects model for the GDR study area included a treatment effect (Trt) to distinguish areas in which Barred Owl removal occurredboth before (1992–2008) and after (2009–2013) removals began.
c Survival estimates for all 4 treatment and control groups in the GDR study area were generated from the single best model, so asingle estimate of temporal process variance applies.
The Condor: Ornithological Applications 118:57–116, Q 2016 Cooper Ornithological Society
K. M. Dugger, E. D. Forsman, A. B. Franklin, et al. Northern Spotted Owl demography 87

for 2 of 10 areas (TYE and CAS), and was the best habitat
covariate overall for the GDR study area. In both cases,
higher estimates of the amount of reduction in nesting and
roosting habitat were associated with lower survival, and in
the TYE area this effect was included as part of a complex
interaction with the proportion of territories in which
Barred Owls were detected.
Climate covariates included in the analysis of survival
(PDSI, SOI, PDO, ENP, ENT, LNP, LNT, WP, and WMT)
occurred in top or competitive models for all study areas
except GDR, but there was little consistency among areas as
to which covariate was important (Table 22). In the CLE
study area, the Palmer Drought Severity Index (PDSI) was
positively related to apparent survival, and 95% CI for the
covariate coefficient slightly overlapped 0. The Southern
Oscillation Index (SOI) occurred in the top model for COA
and as an additive effect with PDSI for CLE. In both cases the
covariate coefficients were negative and the 95% CIs either
did not overlap 0 (COA) or only slightly overlapped 0 (CLE).
The Pacific Decadal Oscillation (PDO) covariate occurred in
competitive models for 2 areas and in both areas the
relationship with apparent survival was positive, with 95% CI
around covariate coefficients that either did not overlap 0
(RAI), or slightly overlapped 0 (OLY). Precipitation during
the early nesting period (ENP) occurred as a main effect in a
competitive model for OLY, with the 95% CI slightly
overlapping 0. In addition, ENP occurred in the best model
for NWC as part of an interaction with temperature during
the early nesting period (ENT). In both cases, increased
precipitation during the early nesting period (ENP) was
associated with decreased survival rates, but for NWC there
was an ameliorating effect of temperature (ENT) associated
with the interaction. Mean minimum temperature during
the early nesting season (ENT) was negatively associated
with survival for NWC, where it occurred in an interaction
with ENP, and although the 95% CI for the ENT coefficient
overlapped 0, the 95% CIs for the ENP and the ENT*ENP
interaction term coefficients did not. In contrast, the effect of
ENTwas positive for GDR, with higher temperatures during
the early nesting season associated with higher survival. Total
precipitation during the late nesting season (LNP) was in a
top or competitive model only for the KLA area, where it
occurred in an interaction with late nesting season
temperature (LNT). The main effects of LNTand LNP were
TABLE 18. Best model containing a time effect on apparent survival of nonjuvenile Northern Spotted Owls for each of 11 study areasin Washington, Oregon, and California, USA, 1985–2013. Model covariate coefficients (b), standard errors (SE), and 95% confidencelimits (lower: LCL; upper: UCL) are included for the specified effect in each model.
Study area a Best model b DAICcc Effect b SE LCL UCL
WashingtonCLE /(t) p(sex þ t) RE /(T) 1.64 T �0.0023 0.0021 �0.0064 0.0019RAI /(t) p(t) RE /(T) 1.08 T �0.0068 0.0033 �0.0133 �0.0003OLY /(t) p(t) RE /(TT) 3.12 T �0.0066 0.0079 �0.0221 0.0089
TT 0.0002 0.0004 �0.0005 0.0009Oregon
COA /(t) p(t) RE /(T) 4.05 T �0.0034 0.0022 �0.0077 0.0010HJA /(t) p(sex þ t) RE /(SPLINE) 4.67 T �0.0052 0.0169 �0.0384 0.0280
TT 0.0008 0.0015 �0.0022 0.0038TTT �0.0004 0.0001 �0.0006 �0.0001Knot1 0.0003 0.0001 0.0000 0.0006Knot2 0.0000 0.0000 0.0000 0.0000Knot3 0.0000 0.0000 0.0000 0.0000
TYE /(t) p(t) RE /(T) 6.11 T �0.0007 0.0016 �0.0038 0.0025KLA /(t) p(sex þ t) RE /(T) 2.13 T �0.0011 0.0015 �0.0041 0.0018CAS /(t) p(t) RE /(T) 1.74 T �0.0013 0.0020 �0.0052 0.0026
CaliforniaNWC /(t) p(sex þ t) RE /(lnT) 16.97 lnT �0.0243 0.0118 �0.0474 �0.0013HUP /(t) p(t) RE /(lnT) 1.46 lnT �0.0160 0.0141 �0.0435 0.0116GDR /(Trt*t) p(sex þ t þTrt) RE
/[B(T), A(Trt*T)]0.00 T �0.0019 0.0011 �0.0041 0.0002
After 1.7947 0.9742 �0.1148 3.7041After*T �0.0869 0.0463 �0.1777 0.0040After*Trt �1.0606 1.0984 �3.2135 1.0923After*Trt*T 0.0535 0.0523 �0.0491 0.1560
a See Table 2 for study area codes.b See Table 17 for model covariate notation.c Lowest AICc value from the top-ranking model for each study area: CLE¼ 1880.93; RAI¼ 2111.78; OLY¼ 3621.57; COA¼ 5766.12;
HJA ¼ 6399.33; TYE ¼ 3315.49; KLA ¼ 4571.47; CAS¼ 5112.13; NWC ¼ 3802.80; HUP ¼ 1728.54; and GDR ¼ 7256.91.
The Condor: Ornithological Applications 118:57–116, Q 2016 Cooper Ornithological Society
88 Northern Spotted Owl demography K. M. Dugger, E. D. Forsman, A. B. Franklin, et al.

positively related to survival, with 95% CIs around the
covariate coefficients not overlapping 0, but the interaction
was negative, suggesting that both high precipitation and
high temperature in combination had a negative effect on
survival. Mean minimum temperature during the late
nesting season (LNT) was also in a competitive model for
TYE; the effect was positive, with a 95% CI for the covariate
coefficient that did not overlap 0. Mean minimum winter
temperature (WMT) was in the top or competitive model for
3 study areas (HJA, CAS, and HUP), and the fact that 95% CI
for the WMT coefficient did not overlap 0 suggested strong
support for a positive relationship with apparent survival in
the Oregon Cascades (HJA and CAS), but less support for an
association with survival in the HUP area in northern
California, where the 95% CI around the WMT covariate
coefficient slightly overlapped 0. Total winter precipitation
(WP) did not occur in a top or competitive model for any
study area.
Meta-analysis of apparent survival. We based the
meta-analysis of apparent survival on the same encounter
histories that we used for birds in the individual study
areas (5,090 nonjuvenile owls [�2 yr of age]; Table 2).
There was no indication that survival rates of owls in the 8
study areas associated with the monitoring program
(NWFP in Table 23) differed from survival rates of owls
in the 3 nonfederal study areas (b¼ 0.007 6 0.092 SE, 95%
CI:�0.012 to 0.024; Table 23, 24). Therefore, we proceeded
with the meta-analysis of all 11 study areas combined. The
best random effects model included a common intercept
across all study areas, positive effects of PDO, and negative
effects of SOI (Table 23, 24). The 95% CI around PDO and
SOI slightly overlapped 0 (Table 24), suggesting some
support for higher survival when the PDO was in a
warming phase (warmer, drier winters in the Pacific
Northwest) and when the SOI was negative, with a
strongly negative SOI indicative of El Nino events (warmer,
drier winters in the Pacific Northwest; Figure 11).
Compared with the random effects model with no
covariates [RE(.)], the best model with PDO and SOI
explained ~12% of the variation in apparent survival. The
TABLE 19. Best model containing a Barred Owl (BO) effect on apparent survival of nonjuvenile Northern Spotted Owls for each of 11study areas in Washington, Oregon, and California, USA, 1985–2013. Model covariate coefficients (b), standard errors (SE), and 95%confidence limits (lower: LCL; upper: UCL), are included for the specified Barred Owl effect in each model.
Study area a Best model b DAICcc Effect b SE LCL UCL
WashingtonCLE /(t) p(sex þ t) RE /(BO) 0.14 BO �0.40 0.23 �0.86 0.05RAI /(t) p(t) RE /(R þ BO) 0.00 BO �0.31 0.14 �0.58 �0.04OLY /(t) p(t) RE /(BO) 2.42 BO �0.05 0.08 �0.20 0.09
OregonCOA /(t) p(t) RE /(BO*SOI) 1.09 BO �0.01 0.05 �0.11 0.09
BO*SOI �0.20 0.06 �0.32 �0.08HJA /(t) p(sex þ t) RE /(BO þ WMT) 0.00 BO �0.16 0.01 �0.17 �0.14TYE /(t) p(t) RE /(BO*HD) 0.00 BO �0.49 0.15 �0.79 �0.19
BO*HD 15.58 5.68 4.45 26.71KLA /(t) p(sex þ t) RE /(LNT þ BO) 1.63 BO �0.05 0.10 �0.25 0.16CAS /(t) p(t) RE /(WMT þ BO) 0.09 BO �0.19 0.13 �0.44 0.06
CaliforniaNWC /(t) p(sex þ t) RE /(BO þ ENT*ENP) 0.00 BO �0.26 0.11 �0.47 �0.05HUP /(t) p(t) RE /(BO) 0.00 BO �0.14 0.08 �0.30 0.02GDR d /(Trt*t) p(sex þ t þ Trt:2009) RE
/[B(T), A(Trt*T)]0.00 T –0.00 0.00 0.00 –0.00
After 1.80 0.97 –0.12 3.70After*T –0.09 0.05 –0.18 0.00After*Trt �1.06 1.11 �3.24 1.12After*Trt*T 0.05 0.05 –0.05 0.16
a See Table 2 for study area codes.b Model notation indicates structure for effects of owl sex (sex), time variation (t), the annual percentage of suitable habitat that was
disturbed (HD), reproduction (R), mean monthly minimum temperature during the early nesting season (ENT), total precipitationduring the early nesting season (ENP), mean monthly minimum temperature during the late nesting season (LNT), mean monthlyminimum temperature during winter (WMT), the southern oscillation index (SOI), proportion of territories with Barred Owldetections (BO), and a treatment effect to distinguish areas where Barred Owl removals occurred (Trt) starting in 2009 in the GDRstudy area.
c See Table 18 for AICc value from top-ranked model for each study area.d Barred Owl effects were not modeled directly in this study area due to the Barred Owl removal experiment that was conducted
from 2009 to 2013; however, the best model included a BACI design and a positive treatment effect (After*Trt*T) after Barred Owlremovals began.
The Condor: Ornithological Applications 118:57–116, Q 2016 Cooper Ornithological Society
K. M. Dugger, E. D. Forsman, A. B. Franklin, et al. Northern Spotted Owl demography 89

best model that included the Barred Owl covariate was
ranked 4th and also included PDO (Table 23). Compared
with the model that included only the random effect of
area [RE(Area)], the model that included Area, PDO, and
BO explained ~13% of the variation in survival (Figure 12).
The Barred Owl covariate was negatively associated with
apparent survival across all study areas as predicted (b ¼�0.057 6 0.030 SE, 95% CI: �0.117 to �0.001; Table 24).
TABLE 20. Best model containing a reproductive (R) effect on apparent survival of nonjuvenile Northern Spotted Owls for each of 11study areas in Washington, Oregon, and California, USA, 1985–2013. Model covariate coefficients (b), standard errors (SE), and 95%confidence limits (lower: LCL; upper: UCL) are included for the reproductive effect in each model.
Study area a Best model b DAICcc b SE LCL UCL
WashingtonCLE /(t) p(sex þ t) RE /(R þ BO) 1.69 �0.02 0.03 �0.09 0.04RAI /(t) p(t) RE /(R þ BO) 0.00 �0.12 0.05 �0.22 �0.01OLY /(t) p(t) RE /(R) 0.00 �0.05 0.03 �0.10 0.01
OregonCOA /(t) p(t) RE /(R) 4.34 0.01 0.05 �0.09 0.10HJA d
TYE /(t) p(t) RE /(R þ HD) 5.67 0.02 0.04 �0.05 0.09KLA /(t) p(sex þ t) RE /(R) 2.39 0.00 0.04 �0.08 0.07CAS /(t) p(t) RE /(R) 1.61 �0.02 0.03 �0.09 0.04
CaliforniaNWC /(t) p(sex þ t) RE /(R þ HD) 16.57 0.03 0.04 �0.06 0.12HUP /(t) p(t) RE /(R þ BO) 0.76 0.05 0.05 �0.04 0.15GDR e
a See Table 2 for study area codes.b See Table 19 for model covariate notation.c See Table 18 for AICc value from top-ranked model for each study area.d Reproductive covariates were not available during the first 3 yr of the study. Consequently, models that included a reproduction
covariate were not considered for this study area.e Reproductive effects were not modeled for the GDR study area due to the confounding effects of Barred Owl removal.
TABLE 21. Best model containing a habitat effect on apparent survival of nonjuvenile Northern Spotted Owls for each of 11 studyareas in Washington, Oregon, and California, USA, 1985�2013. Model covariate coefficients (b), standard errors (SE), and 95%confidence limits (lower: LCL; upper: UCL) are included for the specified habitat effect(s) in each model.
Study area a Best model b DAICcc Effect b SE LCL UCL
WashingtonCLE /(t) p(sex þ t) RE /(EDGE) 0.00 EDGE 2.23 1.29 �0.30 4.76RAI /(t) p(t) RE /(R þ CORE) 0.86 CORE 3.79 2.21 �0.54 8.11OLY d
OregonCOA /(t) p(t) RE /(SOI*EDGE) 0.00 EDGE 1.76 1.15 �0.50 4.01
SOI*EDGE 6.68 1.74 3.27 10.10HJA /(t) p(sex þ t) RE /(HAB) 4.82 HAB 1.14 0.86 �0.55 2.83TYE /(t) p(t) RE /(BO*HD) 0.00 HD �3.34 0.84 �4.99 �1.69
BO*HD 15.58 5.68 4.45 26.71KLA /(t) p(sex þ t) RE /(CORE) 2.04 CORE 0.15 0.16 �0.17 0.46CAS /(t) p(t) RE /(WMT þ HD) 0.32 HD �1.03 1.11 �3.20 1.15
CaliforniaNWC /(t) p(sex þ t) RE /(HD þ BO) 15.09 HD �1.51 0.88 �3.23 0.21HUP /(t) p(t) RE /(CORE þ BO) 1.01 CORE �0.88 1.01 �2.87 1.10GDR /(Trt*t) p(sex þ t þ Trt) RE /(HD þ Trt) 5.50 HD �0.06 0.73 �1.50 1.37
a See Table 2 for study area codes.b Model notation indicates structure for effects of annual percent cover of suitable owl habitat (HAB), a neighborhood focal statistic
that defines the annual number of 30 m2 pixels with �50% suitable habitat within 800 m of each pixel in each owl site (CORE), andthe annual amount of interface between suitable habitat and other cover types within each owl site (EDGE). See Table 19 for othermodel covariate notation.
c See Table 18 for AICc value from top-ranked model for each study area.d Habitat covariates at this study area varied little over the course of the study, which resulted in habitat covariates being
confounded with the intercept. Consequently, models that included effects of habitat were not considered for this study area.
The Condor: Ornithological Applications 118:57–116, Q 2016 Cooper Ornithological Society
90 Northern Spotted Owl demography K. M. Dugger, E. D. Forsman, A. B. Franklin, et al.

The best annual time trend model included the additive
effects of study area and a cubic spline with 4 knots (Table
23). Negative trends in survival were evident from all trend
models (Table 24). However, the trend models were all
ranked relatively low, indicating that other covariates (e.g.,
PDO, SOI, and BO) better captured the overall temporal
variation in survival across study areas (Table 23).
DISCUSSION
Estimates of annual rates of population change and
occupancy rates from our study indicated that Northern
Spotted Owls were continuing to decline in all parts of
their range (Figure 5), and that the rate of decline was
increasing in many areas, including southern Oregon and
northern California. The only exception was the treat-
ment area within GDR, where populations started
increasing after Barred Owl removals were initiated in
2009. Our analysis was the first range-wide assessment ofNorthern Spotted Owl population status to include
estimates of occupancy dynamics, which revealed that
territory occupancy of Northern Spotted Owls was
declining in all 11 study areas. The lowest occupancy
rates were observed in 2013 in the COA study area in
Oregon (28%) and the 3 study areas in Washington (11–
26%; Figure 8).
With the exception of the Barred Owl treatment area
within the GDR study area after the removal of Barred
Owls (GDR-TA), estimates of mean k for Northern
Spotted Owls were ,1.0 in all our study areas (range:
0.878–0.988; Figure 4). Annual rates of population decline
were highest in study areas inWashington, the COA study
area in northwestern Oregon, and control areas in the
GDR study area in northwestern California (Table 25).
Estimates of realized population change (Figure 5) clearly
illustrated these declines in the numbers of territorial owls
in all study areas over the study period, with an indication
of accelerated rates of decline in some areas since the last
meta-analysis (Forsman et al. 2011). In all study areas
except RAI and the GDR treatment areas, estimates of
population decline were higher than, and in some cases
more than twice as high as, estimates of population decline
from earlier studies (Forsman et al. 2011). The one
exception was the GDR treatment areas, where the
population appeared to be increasing and had nearly
recovered to initial levels, in association with the removal
of Barred Owls (Figure 5C). We observed declines in 3
(KLA, CAS, and HUP) of the 4 areas that had stable
population trends through 2006 (TYE, KLA, CAS, and
HUP; Forsman et al. 2011). The weighted mean estimate of
k ¼ 0.962 for all years and study areas (excluding GDR
treatment areas) indicated an average rate of decline of
3.8% per year. This estimated rate of decline was nearly 1%
higher than the estimate of Forsman et al. (2011), but was
comparable with rates reported by Franklin et al. (1999)
and Anthony et al. (2006; Table 26).
Consistent with previous studies of Spotted Owls (e.g.,
Anthony et al. 2006, Blakesley et al. 2010, Forsman et al.
2011) and birds in general (Clutton-Brock 1988, Sæther
1990), we found that annual fecundity was highest for
adult females, intermediate for 2-yr-old females, and
lowest for 1-yr-old females. One- and 2-yr-old Spotted
Owls rarely nested, and comprised only 3% and 6%,
respectively, of the territorial population. Our estimate of
mean annual adult fecundity (x ¼ 0.309 6 0.027) was
lower than any reported in previous meta-analyses of
Northern Spotted Owls, including Burnham et al. (1996; x
¼ 0.339 6 0.010), Anthony et al. (2006; x ¼ 0.372 6
0.029), and Forsman et al. (2011; x¼ 0.330 6 0.049). The
estimated mean annual adult fecundity from our study
was also lower than estimates of mean fecundity reported
for 2 populations of Mexican Spotted Owl (Strix
occidentalis lucida) by Seamans et al. (1999; x ¼ 0.494
6 0.022; x ¼ 0.380 6 0.019), and 4 California Spotted
Owl (S. o. occidentalis) populations reported by Blakesley
et al. (2010; adult females: x ¼ 0.562 6 0.117). As
observed in previous studies (Anthony et al. 2006,
Forsman et al. 2011), we found that fecundity in theCLE study area in Washington was higher than in other
study areas. Whether this difference was related to life-
history tradeoffs by a species at the northern edge of its
range compared with populations from the center of the
range (Anthony et al. 2006), unique climatic attributes
(Hicks et al. 2003), or high prey biomass in Washington
mixed-conifer forests (Forsman et al. 2011) remains
unknown.
We found substantial annual variation in fecundity
among study areas, with support for declining trends in 8
areas (CLE, COA, HJA, TYE, KLA, NWC, HUP, and GDR;
Table 25). The biennial cycle of high fecundity in even-
numbered years and low fecundity in odd-numbered
years was still important in several study areas, although
best models also included climate and habitat effects in
some study areas. This pattern likely incorporated
variation in the breeding propensity of individuals
combined with some complex interaction between
climate, prey cycles, and territory quality (Forsman et
al. 2011, Stoelting et al. 2015). However, despite the
importance and persistence of the even–odd year cyclical
pattern of fecundity, we still do not know what causes this
synchronization. This pattern has also been observed in
California Spotted Owls (Franklin et al. 2004, Blakesley et
al. 2010), but in this subspecies the costs of reproduction
were generally not high enough to cause this reoccurring
cycle in fecundity (Stoelting et al. 2015).
Results from individual study areas suggested that
apparent annual survival rates were declining in 8 of 11
study areas, and that declines were most strongly
The Condor: Ornithological Applications 118:57–116, Q 2016 Cooper Ornithological Society
K. M. Dugger, E. D. Forsman, A. B. Franklin, et al. Northern Spotted Owl demography 91

FIGURE 11. Estimates of the effects of the Pacific Decadal Oscillation (PDO) and Southern Oscillation Index (SOI) on apparent survivalof Northern Spotted Owls generated from the best random effects (RE) model from the meta-analysis [RE /(PDOþ SOI)] based onthe fixed effects model [/(Area*t) p(sex*Area*t)] with study area (Area) and general time variation (t) on apparent survival (/), andstudy area, time, and sex effects on capture probability (p). Random effects model estimates are plotted with shrinkage estimates (S-tilde) for the (A) 3 study areas in Washington, (B) 5 study areas in Oregon, and (C) 3 study areas in California, USA. Only sites whereBarred Owls were not removed (control areas) were included for the Green Diamond study area (GDR-C). See Table 2 for study areaabbreviations.
The Condor: Ornithological Applications 118:57–116, Q 2016 Cooper Ornithological Society
92 Northern Spotted Owl demography K. M. Dugger, E. D. Forsman, A. B. Franklin, et al.

associated with increased detections of Barred Owls in 7
areas. If this trend continues there should be increased
concern regarding the continued persistence of the
Northern Spotted Owl subspecies, because adult survival
is the most important vital rate influencing the rate of
population change in long-lived birds such as Spotted
Owls (Franklin et al. 2000). Whereas Forsman et al. (2011)
found that low rates of apparent survival were largely
confined toWashington, we found that this trend extended
to COA in Oregon and 2 study areas in California (NWC
and GDR). Our results indicated that declines in apparent
annual survival in the southern portion of the range of the
Northern Spotted Owl may be reaching rates of decline
previously observed only in Washington.
Barred OwlsThe 2-species approach used in our occupancy analysis
allowed us to investigate the effects of Barred Owl
presence on colonization and extinction rates of territo-
rial Northern Spotted Owls while accounting for both
Barred Owl and Spotted Owl detection rates (Bailey et al.
2009, Yackulic et al. 2012, 2014). Our results suggested
that Barred Owls were having substantial negative effects
on occupancy dynamics of Northern Spotted Owls,
which was consistent with previous findings (Kelly et
al. 2003, Olson et al. 2005, Anthony et al. 2006, Dugger
et al. 2011, Forsman et al. 2011, Sovern et al. 2014,
Yackulic et al. 2014). The presence of Barred Owls was a
predominant factor associated with increased extinction
rates of Spotted Owls in all study areas, consistent with
results from single-species occupancy studies where
presence of Barred Owls was incorporated as a time-
varying, individual covariate (Olson et al. 2005, Kroll et
al. 2010, Dugger et al. 2011, Sovern et al. 2014). Barred
Owl presence had less consistent effects on colonization
rates of Spotted Owls, which was also consistent with
previous findings (Olson et al. 2005, Kroll et al. 2010,
Dugger et al. 2011, Sovern et al. 2014, Yackulic et al.
2014).
In addition to a strong association with occupancy
dynamics, we observed a negative association between
Barred Owl detections and apparent survival in more
study areas in this analysis (7 with strong evidence, 3
with less support) than in the 2 previous meta-analyses
that investigated this effect (2 of 11 areas, Anthony et al.
2006; 6 of 11 areas, Forsman et al. 2011). These results
supported the conclusion that the negative effect of
Barred Owls on apparent survival of Spotted Owls was
increasing as Barred Owl populations increased in
density farther south in Oregon and California (Forsman
et al. 2011; Appendix A). We estimated apparent
survival, i.e. mortality was not distinguished from
TABLE 22. Best model containing a climate effect on apparent survival of nonjuvenile Northern Spotted Owls for each of 11 studyareas in Washington, Oregon, and California, USA, 1985�2013. Model covariate coefficients (b), standard errors (SE), and 95%confidence limits (lower: LCL; upper: UCL) are included for the specified climate effect(s) in each model.
Study area a Best model b DAICcc Effect b SE LCL UCL
WashingtonCLE /(t) p(sex þ t) RE /(PDSI þ SOI) 0.57 PDSI 0.015 0.008 �0.001 0.030
SOI �0.025 0.018 �0.060 0.010RAI /(t) p(t) RE /(PDO) 0.36 PDO 0.055 0.020 0.015 0.096OLY /(t) p(t) RE /(ENP þ PDO) 1.23 ENP �0.001 0.001 �0.003 0.001
PDO 0.022 0.014 �0.006 0.049Oregon
COA /(t) p(t) RE /(SOI*EDGE) 0.00 SOI �1.398 0.358 �2.099 �0.697SOI*EDGE 6.684 1.743 3.268 10.101
HJA /(t) p(sex þ t) RE /(BO þ WMT) 0.00 WMT 0.027 0.009 0.010 0.044TYE /(t) p(t) RE /(LNT þ BO*HD) 0.60 LNT 0.008 0.008 �0.007 0.024KLA /(t) p(sex þ t) RE /(LNT*LNP) 0.00 LNT 0.046 0.019 0.008 0.084
LNP 0.021 0.010 0.001 0.041LNT*LNP �0.003 0.001 �0.006 0.001
CAS /(t) p(t) RE /(WMT) 0.00 WMT 0.016 0.008 0.001 0.032California
NWC /(t) p(sex þ t) RE /(BO þ ENT*ENP) 0.00 ENT �0.021 0.020 �0.060 0.018ENP �0.003 0.001 �0.005 �0.002ENT*ENP 0.002 0.001 0.001 0.003
HUP /(t) p(t) RE /(WMT) 0.47 WMT �0.014 0.009 �0.032 0.003GDR /(Trt*t) p(sex þ t þ Trt) RE /(ENT þ Trt) 3.17 ENT 0.016 0.007 0.003 0.029
a See Table 2 for study area codes.b Model notation indicates structure for effects of total precipitation during the late nesting season (LNP), Pacific Decadal Oscillation
(PDO), and Palmer Drought Severity Index (PDSI). See Table 19 and Table 20 for additional model covariate notation.c See Table 18 for AICc value from top-ranked model for each study area.
The Condor: Ornithological Applications 118:57–116, Q 2016 Cooper Ornithological Society
K. M. Dugger, E. D. Forsman, A. B. Franklin, et al. Northern Spotted Owl demography 93

TABLE 23. Model selection criteria for a priori random effectsmodels (RE) in the meta-analysis of apparent survival of adultNorthern Spotted Owls in 11 demographic study areas inWashington, Oregon, and California, USA, 1985�2013. The bestfixed effects model, which included the interaction betweenarea and year on survival and interactions among sex, studyarea, and year on detection rates [/(Area*t) p(Sex*Area*t)], wasused for all random effects modeling. Models were rankedaccording to Akaike’s Information Criterion adjusted for smallsample size (AICc). The model deviance (Deviance), number ofparameters (K), difference in AICc between each model and themodel with the lowest AICc (DAICc), and Akaike model weights(wi) are given for all models.
Model a DAICc K wi Deviance
Random EffectsRE /(PDO þ SOI) 0.00 b 706.40 0.35 19671.78RE /(LAT þ PDO þ
SOI) 1.63 706.53 0.16 19673.14RE /(PREY þ PDO þ
SOI) 1.68 706.58 0.15 19673.08RE /(Area þ BO þ
PDO) 4.24 708.99 0.04 19670.55RE /(Area þ BO*PDO) 4.62 709.11 0.03 19670.68RE /(Area þ PDO*SOI) 5.07 709.31 0.03 19670.70RE /(Area þ SPLINE) 5.09 709.39 0.03 19670.57RE /(Area þ PDO þ
SOI) 5.18 709.26 0.03 19670.93RE /(Area þ PDO) 5.37 709.55 0.02 19670.49RE /(BO þ HAB) 5.86 710.41 0.02 19699.18RE /(Area þ SOI) 6.28 709.59 0.02 19671.33RE /(BO*HAB) 6.48 710.85 0.01 19668.86RE /(Area þ BO þ R) 7.01 710.57 0.01 19669.98RE /(Area þ
ENT*ENP) 7.42 710.72 0.01 19670.08RE /(.) 7.52 710.73 0.01 19670.17RE /(Area þ ENT þ
ENP) 7.52 710.77 0.01 19670.08RE /(R þ HAB) 7.58 710.92 0.01 19669.83RE /(Area þ T) 7.69 710.94 0.01 19669.88RE /(HAB) 7.77 710.98 0.01 19669.88RE /(CORE) 7.80 710.98 0.01 19669.91RE /(Area þ BO þ
CORE) 7.90 711.18 0.01 19669.60RE /(Area þ BO) 7.95 711.03 0.01 19669.97RE /(EDGE) 8.01 711.14 0.01 19669.79RE /(NWFP) 8.02 711.06 0.01 19669.97RE /(Area þ BO þ
HAB)8.02 711.25 0.01 19669.56
RE /(HD) 8.17 711.04 0.01 19670.16RE /(AREA*PDO) 8.19 709.30 0.01 19673.84RE /(R*HAB) 8.32 711.40 0.01 19669.55RE /(Area þ
BO*CORE) 8.47 711.49 0.01 19669.51RE /(Area þ BO*HAB) 8.58 711.56 0.00 19669.47RE /(CORE þ EDGE) 8.62 711.31 0.00 19670.05RE /(Area þ lnT) 8.82 711.42 0.00 19670.01RE /(Area þ R þ
CORE) 8.82 711.70 0.00 19669.42RE /(Area þ R þ
HAB) 8.85 711.80 0.00 19669.25RE /(LAT) 9.00 710.91 0.00 19671.26RE /(PREY) 9.09 710.92 0.00 19671.34RE /(Area þ ENT) 9.44 711.74 0.00 19669.95
TABLE 23. Continued.
Model a DAICc K wi Deviance
RE /(Area þ HAB) 9.53 712.13 0.00 19669.22RE /(Area þ R*CORE) 9.54 712.18 0.00 19669.12RE /(Area þ CORE) 9.58 712.09 0.00 19669.34RE /(Area þ R*HAB) 9.57 712.28 0.00 19668.94RE /(REG) 10.11 712.14 0.00 19669.77RE /(Area þ CORE þ
EDGE) 10.22 712.44 0.00 19669.25RE /(Area þ ENP) 11.03 712.83 0.00 19669.24RE /(Area þ WMT) 11.27 712.53 0.00 19670.12RE /(Area þ WMT þ
WP) 11.67 712.62 0.00 19670.31RE /(Area þ
WMT*WP) 12.30 713.03 0.00 19670.08RE /(Area) 12.61 713.55 0.00 19669.30RE /(Area þ EDGE) 12.62 713.81 0.00 19668.76RE /(Area þ R) 12.68 713.63 0.00 19669.21RE /(Area þ LNT) 12.74 713.44 0.00 19669.66RE /(Area þ LNT*LNP) 12.83 713.58 0.00 19669.45RE /(Area þ LNT þ
LNP) 12.83 713.38 0.00 19669.88RE /(Area þ LNP) 12.89 713.68 0.00 19669.30RE /(Area þ SOI þ
Area*SOI) 13.14 712.64 0.00 19671.76RE /(Area þ WP) 13.17 713.91 0.00 19669.11RE /(Area þ HD) 13.17 713.96 0.00 19669.00RE /(Area þ PDSI) 13.23 713.96 0.00 19669.06
Fixed Effects/(Area*t)
p(sex*Area*t) 104.56 774 0.00 19633.41/(sex*Area*t)
p(sex*Area*t) 106.68 775 0.00 19633.41/(t) p(t) 485.15 55 0.00 21497.47/(t) p(.) 567.53 29 0.00 21632.01/(.) p(t) 597.32 29 0.00 21661.80/(.) p(.) 694.58 2 0.00 21813.13
a Model notation indicates structure for effects of study area(Area), sex (sex), general time variation (t), no time variation (.),linear time trend (T), log-linear time trend (lnT), a 3-knot cubicspline time effect (SPLINE), reproduction (R), proportion ofterritories with Barred Owl detections (BO), indicator variablefor geographic region (REG), biodiversity of prey species withinstudy area (PREY), latitude of study area (LAT), Pacific DecadalOscillation (PDO), Palmer Drought Severity Index (PDSI),southern oscillation index (SOI), mean monthly minimumtemperature during the early nesting season (ENT), totalprecipitation during the early nesting season (ENP), meanmonthly minimum temperature during the late nesting season(LNT), mean monthly minimum temperature during winter(WMT), total precipitation during winter (WP), percent cover ofsuitable owl habitat (HAB), a neighborhood focal statistic thatdefined the number of 30 m2 pixels with �50% suitable habitatwithin 800 m of each pixel in each owl site (CORE), the amountof interface between suitable habitat and other cover typeswithin each owl site (EDGE), percentage of suitable habitat thatwas disturbed (HD), and a binary covariate that distinguishedthe 8 Northwest Forest Plan study areas from the 3 nonfederalstudy areas (NWFP).
b The AICc value of the top model ¼ 43570.63.
The Condor: Ornithological Applications 118:57–116, Q 2016 Cooper Ornithological Society
94 Northern Spotted Owl demography K. M. Dugger, E. D. Forsman, A. B. Franklin, et al.

movements and/or behavioral changes that made birds
unavailable to detection during our standard breeding
season surveys. Thus, whether Barred Owls were
associated with increased mortality of Spotted Owls
(which we could not rule out) or increased permanent
emigration through displacement of breeding birds from
territories (where they become undetectable floaters) or
from entire study areas remains unknown. However, the
reoccupation of territories by Spotted Owls that had
been missing prior to removal of Barred Owls in the
GDR study area (L. Diller personal observation) suggests
that displacement from territories into a nonbreeding
floater population was at least one mechanism by which
apparent survival and occupancy rates were negatively
affected by Barred Owls. We do not know how long
Spotted Owls can survive as nonterritorial floaters, but
anecdotal evidence suggests that individuals can remain
undetected for as long as 7 yr, yet recolonize their
original or adjacent territories after Barred Owls are
removed (L. Diller personal observation).
TABLE 24. Best random effects (RE) model that included the specified covariate in the meta-analysis of apparent survival ofnonjuvenile Northern Spotted Owls in each of 11 study areas in Washington, Oregon, and California, USA, 1985–2013. Modelcovariate coefficients (b), standard errors (SE), and 95% confidence limits (lower: LCL; upper: UCL) are included for the effect listed(b c label).
Model a DAICcb b c label b SE LCL UCL
RE /(Area þ BO þ PDO) 4.24 BO �0.0589 0.0295 �0.1167 �0.0010RE /(Area þ BO þ R) 7.01 R �0.0248 0.0128 �0.0500 0.0004RE /(REG) d 10.11 Intercept 0.8488 0.0120 0.8243 0.8712
REG1 0.0128 0.0145 �0.0156 0.0413REG2 �0.0064 0.0140 �0.0338 0.0210REG3 0.0125 0.0161 �0.0191 0.0441REG4 0.0124 0.0147 �0.0164 0.0413REG5 �0.0032 0.0188 �0.0400 0.0335
RE /(NWFP) 8.02 NWFP 0.0065 0.0092 �0.0115 0.0245RE /(PREY þ PDO þ SOI) 1.68 PREY �0.0020 0.0018 �0.0055 0.0015RE /(LAT þ PDO þ SOI) 1.63 LAT 0.0020 0.0017 �0.0013 0.0052RE /(PDO þ SOI) 0.00 PDO 0.0112 0.0063 �0.0011 0.0235RE /(Area þ PDSI) 13.23 PDSI �0.0007 0.0020 �0.0045 0.0032RE /(PDO þ SOI) 0.00 SOI �0.0134 0.0075 �0.0281 0.0014RE /(Area þ ENT*ENP) 7.42 ENT 0.0084 0.0055 �0.0023 0.0191
ENP �0.0008 0.0003 �0.0014 �0.0002ENT*ENP 0.0001 0.0001 –0.0001 0.0003
RE /(Area þ LNT) 12.75 LNT 0.0047 0.0031 �0.0014 0.0109RE /(Area þ LNT*LNP) 12.83 LNT 0.0108 0.0058 –0.0005 0.0221
LNP 0.0030 0.0019 �0.0008 0.0068LNT*LNP �0.0003 0.0003 �0.0010 0.0003
RE /(Area þ WMT) 11.27 WMT 0.0083 0.0034 0.0017 0.0150RE /(Area þ WMT þ WP) 11.67 WP �0.0002 0.0001 �0.0004 0.0001RE /(Area þ T) 7.69 T �0.0021 0.0006 �0.0033 �0.0009RE /(Area þ lnT) 8.82 lnT �0.0248 0.0077 �0.0398 �0.0098RE /(Area þ SPLINE) 5.09 T 0.0073 0.0035 0.0005 0.0141
TT �0.2639 0.0903 �0.4409 �0.0869TTT 0.0263 0.0145 �0.0022 0.0548Knot1 0.0054 0.0039 �0.0022 0.0131Knot2 �0.0080 0.0042 �0.0163 0.0003Knot3 0.0041 0.0041 �0.0040 0.0121Knot4 0.0096 0.0045 0.0007 0.0184
RE /(BO þ HAB) 5.86 HAB �0.0009 0.0417 �0.0826 0.0809RE /(CORE) 7.80 CORE 0.0170 0.0201 �0.0223 0.0564RE /(EDGE) 8.01 EDGE 0.0197 0.0898 �0.1564 0.1957RE /(HD) 8.17 HD �0.2125 0.3136 �0.8272 0.4021
a Model notation indicates the structure of best random effects models based on the fixed effects model /(Area*t) p(sex*Area*t). SeeTable 23 for model covariate notation.
b See Table 23 for AICc values.c Labels designating covariate coefficients (b) associated with continuous and categorical main effects and interactions.d Geographic region was a categorical variable with 5 geographic regions coded as dummy variables relative to the sixth reference
region as the intercept. Coding is as follows: Intercept¼ California Coast, REG1¼ Oregon Cascades Douglas-fir, REG2¼ Oregon–California mixed conifer, REG3 ¼Washington Douglas-fir, REG4 ¼ Oregon coastal Douglas-fir, REG5¼Washington mixed conifer.
The Condor: Ornithological Applications 118:57–116, Q 2016 Cooper Ornithological Society
K. M. Dugger, E. D. Forsman, A. B. Franklin, et al. Northern Spotted Owl demography 95

We observed little evidence that temporal variation in
fecundity in individual study areas or recruitment across
all areas (meta-analysis) was strongly associated with the
presence of Barred Owls, which was consistent with
results for fecundity but contradicted results for recruit-
ment from previous meta-analyses (Forsman et al. 2011).
However, our meta-analysis of fecundity suggested that
Barred Owl presence had a weak negative effect on
fecundity across all study areas, again consistent with the
findings of Forsman et al. (2011). Weak relationships
between Spotted Owl fecundity and Barred Owl presence
likely represented the complex competitive and displace-
ment interactions that occurred between these 2 species
(Wiens et al. 2014). For example, Barred Owls can
displace territorial Spotted Owls (see occupancy results),
and displaced birds may then exist as nonterritorial
nonbreeders that are difficult to detect and hence are no
longer part of the territorial population, which is what we
monitored. In addition, while the per capita rate of
production (NYF) was not directly associated with Barred
Owl presence, our results showed that the total number
of pairs occupying territories had declined. Thus, the total
number of young produced per study area declined in
association with the expansion of Barred Owls.
HabitatWe observed strong positive associations between habitat
characteristics, especially increased amounts of nesting
and roosting habitat, and territory colonization rates by
Northern Spotted Owls across all study areas, as reported
elsewhere (Sovern et al. 2014). An increased amount of
nesting and roosting habitat (HABa) was associated with
decreased extinction rates in many areas, as was also
reported by Dugger et al. (2011) and Sovern et al. (2014).
Results were counterintuitive for the GDR study area in
northern California, where we observed higher estimates
of habitat disturbance (HD) and edge habitat associated
with higher colonization rates, and more core habitat
associated with increased extinction rates. Northern
Spotted Owls occupied younger-aged stands in the GDR
study area compared with most other study areas, and it is
possible that they responded differently to habitat
disturbance and the amount of edge and core habitat in
these study areas because of their local dependence on
dusky-footed woodrats (Neotoma fuscipes) as prey (Sakai
and Noon 1993, Hamm and Diller 2009).
The effects of habitat were not strongly supported in our
fecundity analyses (individual study areas and the meta-
analysis), although in some study areas increasing amounts
FIGURE 12. Estimates of the effects of Barred Owls (BO), the Pacific Decadal Oscillation (PDO), and study area (Area) on apparentsurvival (/) of Northern Spotted Owls generated from the best meta-analysis random effects model (RE; ranked 4th) that included aBarred Owl effect [RE /(Area þ BO þ PDO)] and was based on a fixed effect model [/(Area*t) p(sex*Area*t)] with study area andgeneral time variation (t) on apparent survival, and study area, time, and sex on capture probability (p). Random effects modelestimates are plotted with original time-dependent survival estimates (MLE) and shrinkage estimates (S-tilde) for (A) 1 study area inWashington (CLE), (B, C) 2 study areas in Oregon (HJA, CAS), and (D) 1 study area in California (NWC). See Table 2 for study areaabbreviations.
The Condor: Ornithological Applications 118:57–116, Q 2016 Cooper Ornithological Society
96 Northern Spotted Owl demography K. M. Dugger, E. D. Forsman, A. B. Franklin, et al.

of suitable nesting and roosting habitat had positive
effects on the number of young fledged (NYF). We
observed almost no relationship between NYF and the
amount of edge habitat, which was contrary to our
prediction that the EDGE covariate would be a measure
of woodrat (Neotoma spp.) habitat and would therefore
be important in areas in the southern portion of the
Spotted Owl’s range (Franklin et al. 2000, Olson et al.
2004). However, we defined EDGE differently (at the
population level) than other studies (individual territory
level; Franklin et al. 2000, Olsen et al. 2004, Dugger et al.
2005), which might explain why we found few strong
habitat effects on fecundity. This finding may be
important, because it implies that managing the amount
of edge habitat at the individual territory scale rather than
at the study area scale may be most relevant for managing
Spotted Owl reproductive rates. Finally, as we have noted
in the past, the amount of temporal variation in fecundity
was large, and none of the covariates that we investigated
explained much of the variation in this parameter
(Anthony et al. 2006, Forsman et al. 2011).
Adoption of the Northwest Forest Plan (NWFP), which
included a network of late-successional reserves on federal
lands, was expected to eventually reverse the declines of
species associated with old-growth forests (USDA Forest
Service and USDI Bureau of Land Management 1994). The
Northern Spotted Owl was expected to continue its
decline in the short term, and then stabilize or increase
after 50–100 yr (Thomas et al. 1990, Lint et al. 1999).
Previous demographic analyses suggested that Spotted
Owl populations continued to decline range-wide after the
NWFP was implemented, but that the rates of decline
began to slow through 2009 (Table 26), although there was
still much variation among study areas (Anderson and
Burnham 1992, Burnham et al. 1996, Franklin et al. 1999,
Anthony et al. 2006, Forsman et al. 2011). Our results
suggested that rates of decline have now increased range-
wide compared with the previous meta-analysis (Forsman
et al. 2011), and that the proximate causes of population
TABLE 25. Summary of trends in demographic parameters including fecundity, apparent survival (/), occupancy rates (W), andlambda (k) for Northern Spotted Owls from 11 study areas in Washington, Oregon, and California, USA, 1985–2013. Mean lambda (k)and percent population change (%D) based on estimates of realized population change (Dk) from the best random effects modelswith temporal trends on lambda are also included. Evidence of trends in parameters denoted below if DAICc , 2.0 for models withtime trends or Barred Owl effects, and/or if the 95% confidence limits on regression coefficients for the time trend or the Barred Owleffect did not include zero.
Study Area a Fecundity / W k k %D b
WashingtonCLE Declining Declining Declining No trend 0.916 –77%RAI No trend Declining Declining No trend 0.953 –61%OLY No trend No trend Declining No trend 0.961 –59%
OregonCOA Declining No trend Declining Declining 0.949 –64%HJA Declining Declining Declining Declining 0.965 –47%TYE Declining Declining Declining Declining 0.976 –31%KLA Declining No trend Declining Declining 0.972 –34%CAS No trend Declining Declining No trend 0.963 –44%
CaliforniaNWC Declining Declining Declining Declining 0.970 –55%HUP Declining Declining Declining Declining 0.977 –32%GDR-CB Declining Declining Declining Declining 0.988 –31%GDR-TB Declining Declining Declining Declining 0.961 –26%GDR-CA ** ** Declining ** 0.878 –41%GDR-TA ** ** N/A c ** 1.030 –9%
a See Table 2 for general study area codes and Table 4 for GDR study area notation.b With the exception of the GDR study area, percent population change (%D) was based on estimates of Dk in 2011, the last year for
which an estimate of k could be generated.c Data used for occupancy modeling in the GDR study area excluded treatment areas after Barred Owl removals began in 2009.** Too few years since Barred Owl removal to evaluate a trend.
TABLE 26. Comparison of estimate of annual rate of populationchange from reverse Jolly-Seber models (kRJS) from this studywith estimates from previous analyses of long-term demograph-ic data for Northern Spotted Owls in Washington, Oregon, andCalifornia, USA.
Study yearrange
No.studyareas k (SE)
Annualdecline
(%) Citation
1985–1998 15 0.961 (0.017) 3.9% Franklin et al. (1999)1985–2003 14 0.963 (0.009) 3.7% Anthony et al. (2006)1985–2008 11 0.971 (0.007) 2.9% Forsman et al. (2011)1985–2013 11 0.962 (0.019) 3.8% This study
The Condor: Ornithological Applications 118:57–116, Q 2016 Cooper Ornithological Society
K. M. Dugger, E. D. Forsman, A. B. Franklin, et al. Northern Spotted Owl demography 97

declines included both recruitment (including fecundity)
and survival, which were declining in most study areas.
Local Weather and Regional ClimateOur meta-analysis of k suggested that recruitment into the
population of territorial owls for all study areas was most
affected by the interaction between total winter precipita-
tion (WP) and mean monthly minimum temperature
during winter (WMT), with the lowest levels of recruit-
ment occurring when conditions during the previous
winter were cold and wet, and the highest levels of
recruitment occurring when the previous winter was cold
and dry. There was no support for a lag effect of these
covariates, so the relationships likely reflected direct effects
on survival of nonterritorial birds (potential recruits),
particularly first-year birds, in the previous winter. The
survival rate of nonterritorial or nonbreeding birds is
usually difficult to measure, and, when estimated, is usually
lower than the survival of territorial birds (Lenda et al.
2012). For example, nonterritorial Crested Caracaras
(Caracara cheriway) experienced lower apparent survival
than territorial breeding birds (Dwyer et al. 2012). In
addition, Rohner (1996) found that survival of non-
territorial Great Horned Owls (Bubo virginianus) was
substantially lower than for individuals holding territories
during years when food resources were reduced, and that
nonterritorial birds were negatively affected by a decline in
prey resources before territorial birds were affected.
We also observed evidence of an association between
climate and apparent adult survival rates for more study
areas than previously reported (Forsman et al. 2011), with
important covariates including both regional climate
indices and local weather covariates. The meta-analysis
of survival suggested that regional climate cycles were
strongly associated with apparent survival across all studyareas, consistent with previous findings for Northern
Spotted Owls (Forsman et al. 2011) and other raptors
(e.g., Peregrine Falcon [Falco peregrinus]; Franke et al.
2011, Tawny Owl [Strix aluco]; Millon et al. 2014). We
observed higher survival rates when winters were warm
(positive association with PDO) and dry (negative associ-
ation with SOI), rather than higher survival when
conditions were warm (positive association with PDO)
and wet (positive association with SOI) as observed in a
meta-analysis of 6 Northern Spotted Owl study areas by
Glenn et al. (2011a). Regional climate cycles have been
associated with vital rates for other birds (e.g., Wright et al.
1999, Sillett et al. 2000, LaManna et al. 2012, Wolfe et al.
2015), including other raptors (e.g., Franke et al. 2011,
Jonker et al. 2014), but in most cases a clear understanding
of the environmental change that climatic cycles represent
(i.e. prey densities or habitat conditions) and the causal
relationships that link that change to avian demographics
is poorly understood.
ConclusionsOur results indicate that competition with Barred Owls
may be the primary cause of Northern Spotted Owl
population declines across their range. We observed
declines in apparent survival and increased local extinction
rates of Spotted Owls in sites where Barred Owls were
present, and a positive association between Barred Owl
removals and Spotted Owl vital rates. Apparent survival
and local extinction rates appeared to be the key vital rates
through which Barred Owls influenced Northern Spotted
Owl populations, but both parameters reflected some
combination of mortality, movements of owls off territo-
ries into an undetectable, nonbreeding floater population,
and permanent movements out of study areas. In the Coast
Range of Oregon, Wiens et al. (2014) observed lower
survival rates for Spotted Owls (0.81) compared with
Barred Owls (0.92) based on telemetry data where fates
were known for individuals that co-occurred spatially, and
where no permanent emigration of Spotted Owls was
observed. Conversely, Spotted Owls that had not been
detected in the GDR study area for many years sometimes
reappeared in historical territories after the removal of
Barred Owls (L. Diller personal observation). Given the
high densities of Barred Owls that have been observedacross most of the range of the Spotted Owl, our estimated
declines in survival and increased local extinction rates of
Spotted Owl territories likely reflected mortality rather
than movement, but clearly both processes were occurring
and likely interacted (i.e. displacement from territories
may have increased Spotted Owl mortality). In addition,
the relative importance of each process likely will continue
to vary by study area relative to how long Barred Owls
have been present and at what density.
While results from our study supported the hypothesis
that competition with Barred Owls is an important stressor
of Spotted Owl populations, nesting and roosting habitat
loss and climatic patterns also were related to survival,
occupancy, recruitment, and, to a lesser extent, fecundity,
although there was little consistency in regard to which
covariates were important for particular demographic
parameters or across study areas. Our findings were
consistent with other studies that have found links
between habitat and demographic rates of Northern
Spotted Owls (Franklin et al. 2000, Olson et al. 2004,
Dugger et al. 2005, 2011, Forsman et al. 2011, Yackulic et
al. 2014), and provided support for previous recommen-
dations to preserve as much high-quality habitat in late-
successional forests as possible across the range of the
subspecies (Forsman et al. 2011). However, Barred Owl
densities may now be high enough across the range of the
Northern Spotted Owl that, despite the continued
management and conservation of suitable owl habitat on
federal lands (Davis et al. 2011, 2015), the long-term
prognosis for the persistence of Northern Spotted Owls
The Condor: Ornithological Applications 118:57–116, Q 2016 Cooper Ornithological Society
98 Northern Spotted Owl demography K. M. Dugger, E. D. Forsman, A. B. Franklin, et al.

may be in question without additional management
intervention. For example, based on our study, the removal
of Barred Owls in the GDR study area had rapid, positive
effects on Northern Spotted Owl survival and rates of
population change, suggesting that, along with habitat
conservation and management, Barred Owl removal may
be able to slow or reverse Northern Spotted Owl
population declines on at least a localized scale (Diller et
al. 2014).
We observed relationships between climate and survival
rates for more study areas than previously reported
(Forsman et al. 2011), and, in our analysis, recruitment
was more strongly associated with climatic factors than the
presence of Barred Owls. These relationships likely
reflected the longer time series available for our analysis,
rather than new relationships between owl demographics
and climate, and, given predictions regarding climate
change in the Pacific Northwest (warmer, wetter winters),
these relationships warrant further exploration. Because
rates of population change were a function of both survival
and recruitment, lowered survival due to Barred Owls
coupled with reduced recruitment due to climate change
could lead to steeper future declines in Spotted Owl
populations.
ACKNOWLEDGMENTS
This paper is the culmination of many years of work anddedication by a large number of biologists and researchers,one of whom we lost suddenly just before this analysis. Fewhad a greater impact on Spotted Owl conservation andmanagement than Dr. Robert G. Anthony. His intelligence,energy, professionalism, and contagious sense of humor willbe sorely missed. He was a good friend and mentor and we aregrateful for having known him. This paper is dedicated to hismemory. In addition, we are particularly indebted to RichFredrickson, Rocky Gutierrez, Patti Happe, Lorin Hicks, PeteLoschl, Chuck Meslow, Gary Miller, Bruce Moorhead, FrankOliver, Len Ruggiero, Erran Seaman, and Pat Ward, who wereinstrumental in the initiation of one or more of thedemographic studies. Frank Oliver shaped, drilled, andpolished over 12,000 color bands that we used to markSpotted Owls. This study would not have been possiblewithout the assistance of a small army of dedicated fieldbiologists who helped collect the data. There have been somany of them that we can’t remember all their names, but theones who contributed the most were: Steve Adams, SteveAdey, Garth Alling, Meg Amos, David Anderson, ScottArmentrout, Duane Aubuchon, Keith Bagnall, Doug Barrett,Greg Bennett, Ryan Besser, Wendi Bonds, John Bottelli, RobinBown, Cheryl Broyles, Mathew Brunner, Erin Burke, TimBurnett, Joe Burns, Patty Buettner, Sue Canniff, Adam Canter,Chris Cantway, Bruce Casler, Doug Chamblin, Rita Clare-mont, David Clarkson, Billy Colegrove, Alan Comulada,Caroline Crowley, Ron Crutchley, Sam Cuenca, Natalie Cull,Amy Cunkelman, David Delaney, Glenn Desy, Diane Doersch,
Michelle Dragoo, Desiree Early, Amy Ellingson, Roli Espinosa,Thomas Evans, Annie Farris, Mark Fasching, Tim Fetz, HelenFitting, David Fix, Ernest Fliegel, Tracy Ford, Ray Forson, GilaFox, Tim Fox, Shawna Franklin, Laura Friar, Ken Fukuda,Rudy Galindo, Dawn Garcia, Daniel George, Alan Giese,David Giessler, Charles Goddard, Teresa Godfrey, Jim Goode,Scott Graham, Eric Grant, Ashley Green, Allison Greenleaf,Tim Grubert, Gillian Hadley, Terry Hall, Tammy Hamer, AndyHamilton, Keith Hamm, Timothy Hanks, Rick Hardy, MeganHarrigan, Steve Hayner, Amanda Heffner, Thomas Heinz,Marisa Herrera, Connie Holloway, Taryn Hoover, Eric Hop-son, Scott Horton, Gay Hunter, John Hunter, ElizabethHurkes, Mark Irwin, Eugene Jackson, Ryan Jackson, ColinJewett, Aaron Johnston, Jennifer Jones, Leilani Jones, TimmKaminski, Marc Kasper, Tom Kay, Debaran Kelso, LeahKenney, Wendy King, Wes King, Charles Knight, MikeKoranda, Richard Kosteke, Stan Kott, Amy Krause, DavidLamphear, Chris Larson, Megan Larsson, Kurt Laubenheimer,Richard Leach, Rich Lechleitner, Doug Leslie, Krista Lewicki,Jeff Lewis, Patrick Loafman, Dan Loughman, Joanne Lowden,Rich Lowell, Hunter Lowry, Jessica Lux, Devin Malkin, DaveManson, Kevin Maurice, Aaron McKarley, Dawn McCovey,Andrew McLain, Brian Meiering, Larry Melampy, MerriMelde, Joel Merriman, William Meyer, Christine Moen, SeanMohren, Jason Mowdy, Ellen Meyers, Ben Murphy, MichaelMurray, Suzanne Nelson, Matt Nixon, Timothy Parker, HeidiPederson, Kim Pederson, Nicole Nielson-Pincus, MelanieO’Hara, Mary Oleri, Eduardo Olmeda, Michell O’Malley, IvyOtto, Rob Owens, Antonio Padilla, Lyle Page, David Pavlack-ey, John Perkins, Jim Petterson, Mark Phillip, Tom Phillips,Tim Plawman, Aaron Pole, Andrew Pontius, Clayton Pope,Amy Price, Laura Quattrini, Laura Ratti, Elise Raymond, MaryRasmussen, Reba Reidner, Angela Rex, Gail Rible, KurtRichardson, Melanie Roan, Ana Roberts, Susan Roberts, RobRoninger, Trish Roninger, Jen Sanborn, Jim Schaberl, TedSchattenkerk, Anthony Scheiff, Britta Schielke, Jason Schil-ling, Matthew Schlesinger, Kary Schlick, Doreen Schmidt,Michael Schwerdt, Tim Selim, Shawn Servoss, Paula Shaklee,Erica Sisson, Gail Sitter, Kristian Skybak, Steve Small, DeniseSmith, Don Smith, Spencer Smith, Alexis Smoluk, TomSnetsinger, Maurice Somme, Noel Soucy, Susannah Spock,Amy Stabins, Peter Steele, Cynthia Stern, Lori Stonum,Michael Storms, Bob Straub, Denise Strejc, Keith Swindle,Jim Swingle, Margy Taylor, Campbell Thompson, JoelThompson, Jim Thrailkill, Trinity Tippin, Sheila Turner-Hane,Shem Unger, Jennifer Van Gelder, Andrew Van Lanen, NickVan Lanen, Veronica Vega, Frank F. Wagner, Fred Wahl,StephanieWaldo, AbeWalston, Fred Way, KevinWhite, MarkWilliams, Kari Williamson, Heather Wise, Jim Woodford,Sarah Wyshynski, Lance Wyss, Bryan Yost, Kendall Young,Jessica Zeldt, and Joe Zisa. Brooke Morris at the OregonCooperative Wildlife Research Unit, and Ann Leen and KimHoward at the Department of Fisheries and Wildlife, OregonState University, provided administrative support for theworkshop, and we could not have hosted this event withouttheir help.Funding statement: Funding for demographic studies ofNorthern Spotted Owls on federal lands was provided
The Condor: Ornithological Applications 118:57–116, Q 2016 Cooper Ornithological Society
K. M. Dugger, E. D. Forsman, A. B. Franklin, et al. Northern Spotted Owl demography 99

primarily by the USDA Forest Service, USDI Bureau of LandManagement, and USDI National Park Service. Funding forstudies on nonfederal lands came from the Green DiamondResource Company, Plum Creek Timber Company, LouisianaPacific Lumber Company, Hancock Forest Management, andthe Hoopa Tribe. Funding for the workshop was provided bythe USDA Forest Service and USDI Bureau of LandManagement via a Cost Reimbursable Research Agreementwith Oregon State University. The U.S. Geological Survey andUSDA Forest Service required approval of the final manu-script before publication, but none of the funding agenciesassociated with this meta-analysis had any influence on thecontent of the submitted or published manuscript. Any use oftrade, firm, or product names is for descriptive purposes onlyand does not imply endorsement by the U.S. Government.
Ethics statement: All data from study areas in which K.M.D.,E.D.F., and A.B.F. were principal investigators (CLE, OLY,COA, HJA, TYE, CAS, and NWC) were collected followingprotocols approved under animal care and use permitsoverseen by Oregon State University’s and Colorado StateUniversity’s Institutional Animal Care and Use Committees.These protocols were followed and all relevant state andfederal permits were acquired and maintained for all studyareas included in this meta-analysis.
Author contributions: (1) K.M.D., E.D.F., A.B.F., R.J.D.,G.C.W, C.J.S., K.P.B., J.D.N., J.E.H., C.B.Y., P.F.D., L.B., L.V.D.,D.R.H., J.M.H., and T.M. conceived the idea, design, andexperiment; (2) K.M.D., E.D.F., A.B.F., R.J.D., S.H.A., L.S.A.,B.L.B., J.B., P.C.C., L.V.D., E.M.G., S.A.G., D.R.H., J.M.H., J.H.,R.B.H., C.M., J.A.R., J.R., and S.G.S. conducted the research;(3) K.M.D., E.D.F., A.B.F., R.J.D., K.P.B., G.C.W., J.D.N., C.J.S.,C.B.Y, D.A.C., M.J.C., and P.C.C. wrote the paper; (4) K.M.D.,E.D.F., A.B.F., R.J.D., G.C.W., C.J.S., K.P.B., J.D.N., J.E.H.,C.B.Y., P.F.D., L.B., T.M., and J.A.R. developed and designedthe methods; (5) R.J.D., G.C.W., C.J.S., J.E.H., C.B.Y., L.B., B.A.,J.B., P.C.C., M.J.C., E.M.G., A.G., J.M.H., J.H., K.P.H., T.M.,K.M., G.S.O., J.R., V.R., and J.S. analyzed the data; and (6)R.J.D. contributed substantial materials, resources, andfunding.
LITERATURE CITED
Albright, W. L., and D. L. Peterson (2013). Tree growth andclimate in the Pacific Northwest, North America: A broad-scale analysis of changing growth environments. Journal ofBiogeography 40:2119–2133.
Alley, W. M. (1984). The Palmer Drought Severity Index:Limitations and assumptions. Journal of Climate and AppliedMeteorology 23:1100–1109.
Anderson, D. R., and K. P. Burnham (1992). Demographic analysisof Northern Spotted Owl populations. In Final Draft RecoveryPlan for the Northern Spotted Owl, Volume 2. USDI Fish andWildlife Service, Region 1, Portland, OR, USA. pp. 66–75.
Anderson, D. R., K. P. Burnham, A. B. Franklin, R. J. Gutierrez, E. D.Forsman, R. G. Anthony, G. C. White, and T. M. Shenk (1999). Aprotocol for conflict resolution in analyzing empirical datarelated to natural resource controversies. Wildlife SocietyBulletin 27:1050–1058.
Anthony, R. G., E. D. Forsman, A. B. Franklin, D. R. Anderson, K. P.Burnham, G. C. White, C. J. Schwarz, J. D. Nichols, J. E. Hines,G. S. Olson, S. H. Ackers, et al. (2006). Status and Trends inDemography of Northern Spotted Owls, 1985–2003. WildlifeMonographs 163.
Arnold, T. W. (2010). Uninformative parameters and modelselection using Akaike’s Information Criterion. Journal ofWildlife Management 74:1175–1178.
Bailey, L. L., J. A. Reid, E. D. Forsman, and J. D. Nichols (2009).Modeling co-occurrence of Northern Spotted and Barredowls: Accounting for detection probability differences.Biological Conservation 142:2983–2989.
Bent, A. C. (1938). Life Histories of North American Birds of Prey,Volume II. U.S. National Museum Bulletin 170, Washington,D.C., USA.
Bingham, B. B., and B. R. Noon (1997). Mitigation of habitat‘‘take’’: Application to habitat conservation planning. Con-servation Biology 11:127–138.
Blakesley, J. A., M. E. Seamans, M. M. Conner, A. B. Franklin, G. C.White, R. J. Gutierrez, J. E. Hines, J. D. Nichols, T. E. Munton, D.W. H. Shaw, J. J. Keane, et al. (2010). Population dynamics ofSpotted Owls in the Sierra Nevada, California. WildlifeMonographs 174.
Bonner, S. J., D. L. Thomson, and C. J. Schwarz (2009). Time-varying covariates and semi-parametric regression in cap-ture–recapture: An adaptive spline approach. In ModelingDemographic Processes in Marked Populations (D. L.Thomson, E. G. Cooch, and M. J. Conroy, Editors). Environ-mental and Ecological Statistics Series Volume 3, Springer,New York, USA. pp. 657–675.
Boyce, M. S., L. L. Irwin, and R. Barker (2005). Demographic meta-analysis: Synthesizing vital rates for Spotted Owls. Journal ofApplied Ecology 42:38–49.
Burnham, K. P. (2013). Appendix D: Variance components andrandom effects models in MARK. In Program MARK: A GentleIntroduction, thirteenth edition (E. Cooch and G. White,Editors). http://www.phidot.org/software/mark/docs/index.html
Burnham, K. P., and D. R. Anderson (2002). Model Selection andMultimodel Inference: A Practical Information-TheoreticApproach, second edition. Springer-Verlag, New York, NY,USA.
Burnham, K. P., and G. C. White (2002). Evaluation of somerandom effects methodology applicable to bird ringing data.Journal of Applied Statistics 29:245–264.
Burnham, K. P., D. R. Anderson, and G. C. White (1994).Estimation of vital rates of the Northern Spotted Owl. InAppendix J of the Final Supplemental Environmental ImpactStatement on Management of Habitat for Late-Successionaland Old-Growth Forest Related Species within the Range ofthe Northern Spotted Owl. Volume 2. USDA Forest Serviceand USDI Bureau of Land Management, Portland, OR, USA.pp. 1–26.
Burnham, K. P., D. R. Anderson, and G. C. White (1996). Meta-analysis of vital rates of the Northern Spotted Owl. InDemography of the Northern Spotted Owl (E. D. Forsman, S.DeStefano, M. G. Raphael, and R. J. Gutierrez, Editors). Studiesin Avian Biology 17:92–101.
Cam, E. (2009). Contribution of capture-mark-recapture model-ing to studies of evolution by natural selection. In ModelingDemographic Processes in Marked Populations (D. L.
The Condor: Ornithological Applications 118:57–116, Q 2016 Cooper Ornithological Society
100 Northern Spotted Owl demography K. M. Dugger, E. D. Forsman, A. B. Franklin, et al.

Thomson, E. G. Cooch, and M. J. Conroy, Editors). Springer,New York, NY, USA. pp. 83–130.
Carey, A. B., S. B. Horton, and B. L. Biswell (1992). NorthernSpotted Owls: Influence of prey base and landscapecharacter. Ecological Monographs 62:223–250.
Carothers, A. D. (1973). The effects of unequal catchability onJolly-Seber estimates. Biometrics 29:79–100.
Clutton-Brock, T. (Editor) (1988). Reproductive Success: Studiesof Individual Variation in Contrasting Breeding Systems.University of Chicago Press, Chicago, IL, USA.
Cutler, T. L., and D. W. Hays (1991). Food habits of NorthernSpotted Owls in high elevation forests of Pelican Butte,southwestern Oregon. Northwestern Naturalist 72:66–69.
Daly, C. (2006). Guidelines for assessing the suitability of spatialclimate data sets. International Journal of Climatology 26:707–721.
Davis, R. J., K. M. Dugger, S. Mohoric, L. Evers, and W. C. Aney(2011). Northwest Forest Plan—The first 15 years (1994–2008): Status and trends of Northern Spotted Owl popula-tions and habitats. USDA Forest Service General TechnicalReport PNW-GTR-850.
Davis, R. J., B. Hollen, J. Hobson, J. E. Gower, and D. Keenum(2015). Northwest Forest Plan—The first 20 years (1994–2013): Status and trends of Northern Spotted Owl habitats.USDA Forest Service General Technical Report PNW-GTR-000.
Diller, L. V., and D. M. Thome (1999). Population density ofNorthern Spotted Owls in managed young-growth forests incoastal northern California. Journal of Raptor Research 33:275–286.
Diller, L. V., J. P. Dumbacher, R. P. Bosch, R. R. Bown, and R. J.Gutierrez (2014). Removing Barred Owls from local areas:Techniques and feasibility. Wildlife Society Bulletin 38:211–216.
Doherty, P. F., G. C. White, and K. P. Burnham (2012). Comparisonof model building and selection strategies. Journal ofOrnithology 152 (Supplement 2):S317–S323.
Dugger, K. M., R. G. Anthony, and L. S. Andrews (2011). Transientdynamics of invasive competition: Barred Owls, SpottedOwls, habitat, and the demons of competition present.Ecological Applications 21:2459–2468.
Dugger, K. M., F. Wagner, R. G. Anthony, and G. S. Olson (2005).The relationship between habitat characteristics and demo-graphic performance of Northern Spotted Owls in southernOregon. The Condor 107:863–878.
Dwyer, J. F., J. D. Fraser, and J. L. Morrison (2012). Within-yearsurvival of nonbreeding Crested Caracaras. The Condor 114:295–301.
Faaborg, J., W. J. Arendt, J. D. Toms, K. M. Dugger, W. A. Cox, andM. C. Mora (2013). Long-term decline of a winter-residentbird community in Puerto Rico. Biodiversity Conservation 22:63–75.
Fleming, T. L., J. L. Halverson, and J. B. Buchanan (1996). Use ofDNA analysis to identify sex of Northern Spotted Owls (Strixoccidentalis caurina). Journal of Raptor Research 30:118–122.
Forsman, E. D. (1981). Molt of the Spotted Owl. The Auk 98:735–742.
Forsman, E. D., R. G. Anthony, K. M. Dugger, E. M. Glenn, A. B.Franklin, G. C. White, C. J. Schwartz, K. P. Burnham, D. R.Anderson, J. E. Nichols, J. E. Hines, et al. (2011). PopulationDemography of Northern Spotted Owls. Studies in AvianBiology 40.
Forsman, E. D., R. G. Anthony, E. C. Meslow, and C. J. Zabel(2004). Diets and foraging behavior of Northern Spotted Owlsin Oregon. Journal of Raptor Research 38:214–230.
Forsman, E. D., R. G. Anthony, J. A. Reid, P. J. Loschl, S. G. Sovern,M. Taylor, B. L. Biswell, A. Ellingson, E. C. Meslow, G. S. Miller,K. A. Swindle, et al. (2002). Natal and breeding dispersal ofNorthern Spotted Owls. Wildlife Monographs 149.
Forsman, E. D., S. DeStefano, M. G. Raphael, and R. J. Gutierrez(Editors) (1996a). Demography of the Northern Spotted Owl.Studies in Avian Biology 17.
Forsman, E. D., A. B. Franklin, F. M. Oliver, and J. P. Ward (1996b).A color band for Spotted Owls. Journal of Field Ornithology67:507–510.
Forsman, E. D., I. A. Otto, S. G. Sovern, M. Taylor, D. W. Hays, H.Allen, S. L. Roberts, and D. E. Seaman (2001). Spatial andtemporal variation in diets of Spotted Owls in Washington.Journal of Raptor Research 35:141–150.
Franke, A., J.-F. Therrien, S. Descamps, and J. Bety (2011).Climatic conditions during outward migration affect appar-ent survival of an Arctic top predator, the Peregrine FalconFalco peregrinus. Journal of Avian Biology 42:544–551.
Franklin, A. B., D. R. Anderson, and K. P. Burnham (2002).Estimation of long-term trends and variation in avian survivalprobabilities using random effects models. Journal of AppliedStatistics 29:267–287.
Franklin, A. B., D. R. Anderson, E. D. Forsman, K. P. Burnham, andF. W. Wagner (1996). Methods for collecting and analyzingdemographic data on the Northern Spotted Owl. InDemography of the Northern Spotted Owl (E. D. Forsman,S. DeStefano, M. G. Raphael, and R. J. Gutierrez, Editors).Studies in Avian Biology 17:12–20.
Franklin, A. B., D. R. Anderson, R. J. Gutierrez, and K. P. Burnham(2000). Climate, habitat quality, and fitness in NorthernSpotted Owl populations in northwestern California. Ecolog-ical Monographs 70:539–590.
Franklin, A. B., K. P. Burnham, G. C. White, R. G. Anthony, E. D.Forsman, C. Schwarz, J. D. Nichols, and J. Hines (1999). Range-wide Status and Trends in Northern Spotted Owl Populations.USGS Colorado Cooperative Fish and Wildlife Research Unit,Colorado State University, Fort Collins, CO, USA.
Franklin, A. B., R. J. Gutierrez, J. D. Nichols, M. E. Seamans, G. C.White, G. S. Zimmerman, J. E. Hines, T. E. Munton, W. S.LaHaye, J. A. Blakesley, G. N. Steger, et al. (2004). Populationdynamics of the California Spotted Owl (Strix occidentalisoccidentalis): A meta-analysis. Ornithological Monographs 54:1–54.
Franklin, A. B., J. D. Nichols, R. G. Anthony, K. P. Burnham, G. C.White, E. D. Forsman, and D. R. Anderson (2006). Commenton ‘‘Are survival rates of Northern Spotted Owls biased?’’Canadian Journal of Zoology 84:1375–1379.
Franklin, J. F., and C. T. Dyrness (1973). Natural vegetation ofOregon and Washington. USDA Forest Service GeneralTechnical Report PNW-8.
Glenn, E. M., R. G. Anthony, and E. D. Forsman (2010). Populationtrends in Northern Spotted Owls: Associations with climate inthe Pacific Northwest. Biological Conservation 143:2543–2552.
Glenn, E. M., R. G. Anthony, E. D. Forsman, and G. S. Olson(2011b). Reproduction of Northern Spotted Owls: The role oflocal weather and regional climate. Journal of WildlifeManagement 75:1279–1294.
The Condor: Ornithological Applications 118:57–116, Q 2016 Cooper Ornithological Society
K. M. Dugger, E. D. Forsman, A. B. Franklin, et al. Northern Spotted Owl demography 101

Glenn, E. M., R. G. Anthony, E. D. Forsman, and G. S. Olson(2011a). Local weather, regional climate, and annual survivalof the Northern Spotted Owl. The Condor 113:159–176.
Glenn, E. M., M. C. Hansen, and R. G. Anthony (2004). SpottedOwl home-range and habitat use in young forests of westernOregon. Journal of Wildlife Management 68:33–50.
Hamer, T. E., E. D. Forsman, and E. M. Glenn (2007). Home rangeattributes and habitat selection of Barred Owls and SpottedOwls in an area of sympatry. The Condor 109:750–768.
Hamer, T. E., D. L. Hayes, C. M. Senger, and E. D. Forsman (2001).Diets of Northern Barred Owls and Northern Spotted Owls inan area of sympatry. Journal of Raptor Research 35:221–227.
Hamm, K. E., and L. V. Diller (2009). Forest management effectson abundance of woodrats in northern California. North-western Naturalist 90:97–106.
Hicks, L. L., D. R. Herter, and R. J. Early (2003). Clines in life historycharacteristics of the Spotted Owl in Washington. North-western Naturalist 84:57–67.
Hines, J. E., and J. D. Nichols (2002). Investigations of potentialbias in the estimation of k using Pradel’s (1996) model forcapture-recapture data. Journal of Applied Statistics 29:573–587.
Howell, T. R. (1964). Notes on incubation and nestling temper-atures and behavior of captive owls. Wilson Bulletin 76:28–36.
Hwang, W.-D., and A. Chao (1995). Quantifying the effects ofunequal catchabilities on Jolly-Seber estimators via samplecoverage. Biometrics 51:128–141.
Jenouvrier, S. (2013). Impacts of climate change on avianpopulations. Global Change Biology 19:2036–2057.
Jonker, R. M., N. Chakarov, and O. Kruger (2014). Climate changeand habitat heterogeneity drive a population increase inCommon Buzzards Buteo buteo through effects on survival.Ibis 156:97–106.
Kelly, E. G., E. D. Forsman, and R. G. Anthony (2003). Are BarredOwls displacing Spotted Owls? The Condor 105:45–53.
Kennedy, R. E., Z. Yang, and W. B. Cohen (2010). Detecting trendsin forest disturbance and recovery using yearly Landsat timeseries: 1. LandTrendr—Temporal segmentation algorithms.Remote Sensing of Environment 114:2897–2910.
Koons, D. N., R. F. Rockwell, and L. M. Aubry (2014). Effects ofexploitation on an overabundant species: The Lesser SnowGoose predicament. Journal of Animal Ecology 83:365–374.
Kroll, A. J., T. L. Fleming, and L. L. Irvin (2010). Site occupancydynamics of Northern Spotted Owls in the Eastern Cascades,Washington, USA, 1990–2003. Journal of Wildlife Manage-ment 74:1264–1274.
LaHaye, W. S., G. S. Zimmerman, and R. J. Gutierrez (2004).Temporal variation in the vital rates of an insular populationof Spotted Owls (Strix occidentalis occidentalis): Contrastingeffects of weather. The Auk 121:1056–1069.
LaManna, J. A., T. L. George, J. F. Saracco, M. P. Nott, and D. F.DeSante (2012). El Nino–Southern Oscillation influencesannual survival of a migratory songbird at a regional scale.The Auk 129:734–743.
Lebreton, J.-D., K. P. Burnham, J. Clobert, and D. R. Anderson(1992). Modeling survival and testing biological hypothesesusing marked animals: A unified approach with case studies.Ecological Monographs 62:67–118.
Lenda, M., B. Maciusik, and P. Skorka (2012). The evolutionary,ecological and behavioural consequences of the presence of
floaters in bird populations. North-Western Journal ofZoology 8:394–408.
Lint, J., B. Noon, R. Anthony, E. Forsman, M. Raphael, M. Collopy,and E. Starkey (1999). Northern Spotted Owl EffectivenessMonitoring Plan for the Northwest Forest Plan. USDA ForestService General Technical Report PNW-GTR-440.
Littell, J. S., E. E. Oneil, D. McKenzie, J. A. Hicke, J. A. Lutz, R. A.Norheim, and M. M. Elsner (2010). Forest ecosystems,disturbance, and climatic change in Washington State, USA.Climatic Change 102:129–158.
Livezey, K. B. (2007). Barred Owl habitat and prey: A review andsynthesis of the literature. Journal of Raptor Research 41:177–201.
Livezey, K. B. (2009). Range expansion of Barred Owls, Part I:Chronology and distribution. American Midland Naturalist161:49–56.
Loehle, C., L. Irwin, B. F. J. Manly, and A. Merrill (2015). Range-wide analysis of Northern Spotted Owl nesting habitatrelations. Forest Ecology and Management 341:8–20.
Loehle, C., L. Irwin, D. Rock, and S. Rock (2005). Are survival ratesfor Northern Spotted Owls biased? Canadian Journal ofZoology 83:1386–1390.
MacKenzie, D. I., L. L. Bailey, and J. D. Nichols (2004).Investigating species co-occurrence patterns when speciesare detected imperfectly. Journal of Animal Ecology 73:546–555.
MacKenzie, D. I., J. D. Nichols, J. A. Royle, K. H. Pollack, L. L. Bailey,and J. E. Hines (2006). Occupancy Estimation and Modeling:Inferring Patterns and Dynamics of Species Occurrence.Academic Press, Burlington, MA, USA.
Manly, B. F. J., L. L. McDonald, and T. L. McDonald (1999). Therobustness of mark–recapture methods: A case study for theNorthern Spotted Owl. Journal of Agricultural, Biological, andEnvironmental Statistics 4:78–101.
McDonald, T. L., and G. C. White (2010). A comparison ofregression models for small counts. Journal of WildlifeManagement 74:514–521.
Mckann, P. C., B. R. Gray, and W. E. Thogmartin (2013). Smallsample bias in dynamic occupancy models. Journal ofWildlife Management 77:172–180.
Miller, D. A. W., C. S. Brehme, J. E. Hines, J. D. Nichols, and R. N.Fisher (2012). Joint estimation of habitat dynamics andspecies interactions: Disturbance reduces co-occurrence ofnon-native predators with an endangered toad. Journal ofAnimal Ecology 81:1288–1297.
Millon, A., S. J. Petty, B. Little, O. Gimenez, T. Cornulier, and X.Lambin (2014). Dampening prey cycle overrides the impactof climate change on predator population dynamics: A long-term demographic study in Tawny Owls. Global ChangeBiology 20:1770–1781.
Moen, C. A., A. B. Franklin, and R. J. Gutierrez (1991). Agedetermination of subadult Northern Spotted Owls innorthwest California. Wildlife Society Bulletin 19:489–493.
Nichols, J. D. (2004). Evolution of quantitative methods for thestudy and management of avian populations: On theimportance of individual contributions. Animal Biodiversityand Conservation 27:3–19.
Nichols, J. D., J. E. Hines, D. I. MacKenzie, M. E. Seamans, and R. J.Gutierrez (2007). Occupancy estimation with multiple statesand state uncertainty. Ecology 88:1395–1400.
The Condor: Ornithological Applications 118:57–116, Q 2016 Cooper Ornithological Society
102 Northern Spotted Owl demography K. M. Dugger, E. D. Forsman, A. B. Franklin, et al.

Ohmann, J. L., and M. J. Gregory (2002). Predictive mapping offorest composition and structure with direct gradient analysisand nearest neighbor imputation in coastal Oregon, USA.Canadian Journal of Forest Research 32:725–741.
Olson, G. S., R. G. Anthony, E. D. Forsman, S. H. Ackers, P. J.Loschl, J. A. Reid, K. M. Dugger, E. M. Glenn, and W. J. Ripple(2005). Modeling of site occupancy dynamics for NorthernSpotted Owls, with emphasis on the effects of Barred Owls.Journal of Wildlife Management 69:918–932.
Olson, G. S., E. M. Glenn, R. G. Anthony, E. D. Forsman, J. A. Reid,P. J. Loschl, and W. J. Ripple (2004). Modeling demographicperformance of Northern Spotted Owls relative to foresthabitat in Oregon. Journal of Wildlife Management 68:1039–1053.
Pardo, D., C. Barbraud, M. Authier, and H. Weimerskirch (2013).Evidence for an age-dependent influence of environmentalvariations on a long-lived seabird’s life-history traits. Ecology94:208–220.
Peterson, D. W., B. K. Kerns, and E. K. Dodson (2014). Climatechange effects on vegetation in the Pacific Northwest: Areview and synthesis of the scientific literature and simula-tion model projections. USDA Forest Service GeneralTechnical Report PNW-GTR-900.
Phillips, S., and M. Dudık (2008). Modeling of species distribu-tions with MaxEnt: New extensions and a comprehensiveevaluation. Ecography 31:161–175.
Phillips, S., R. P. Anderson, and R. E. Shapire (2006). Maximumentropy modeling of species geographic distributions.Ecological Modelling 190:231–239.
Pollock, K. H., J. D. Nichols, C. Brownie, and J. E. Hines (1990).Statistical inference of capture–recapture experiments. Wild-life Monographs 107.
Pradel, R. (1996). Utilization of capture–mark–recapture for thestudy of recruitment and population growth rate. Biometrics52:703–709.
Ramsey, F. L., and D. W. Schafer (2002). The Statistical Sleuth: ACourse in Methods of Data Analysis, second edition. Duxbury,Thompson Learning, Pacific Grove, CA, USA.
Raphael, M. G., R. G. Anthony, S. DeStefano, E. D. Forsman, A. B.Franklin, R. Holthausen, E. C. Meslow, and B. R. Noon (1996).Use, interpretation, and implications of demographic analy-ses of Northern Spotted Owl populations. In Demography ofthe Northern Spotted Owl (E. D. Forsman, S. DeStefano, M. G.Raphael, and R. J. Gutierrez, Editors). Studies in Avian Biology17:102–112.
Reid, J. A., R. B. Horn, and E. D. Forsman (1999). Detection ratesof Spotted Owls based on acoustic-lure and live-lure surveys.Wildlife Society Bulletin 27:986–990.
Richmond, O. M., J. E. Hines, and S. R. Beissinger (2010). Two-species occupancy models: A new parameterization appliedto co-occurrence of secretive rails. Ecological Applications 20:2036–2046.
Rohner, C. (1996). The numerical response of Great Horned Owlsto the snowshoe hare cycle: Consequences of non-territorial‘‘floaters’’ on demography. Journal of Animal Ecology 65:359–370.
Rosenberg, D. K., K. A. Swindle, and R. G. Anthony (2003).Influence of prey abundance on Northern Spotted Owlreproductive success in western Oregon. Canadian Journal ofZoology 81:1715–1725.
Sæther, B. E. (1990). Age-specific variation in the reproductiveperformance of birds. Current Ornithology 7:251–283.
Sakai, H. F., and B. R. Noon (1993). Dusky-footed woodratabundance in different-aged forests in northwestern Cal-ifornia. Journal of Wildlife Management 57:373–382.
SAS Institute (2008). SAS/STAT 9.2 User’s Guide. SAS Institute,Cary, NC, USA.
Schilling, J. W., K. M. Dugger, and R. G. Anthony (2013). Survivaland home-range size of Northern Spotted Owls in south-western Oregon. Journal of Raptor Research 47:1–14.
Seamans, M. E., and R. J. Gutierrez (2007). Habitat selection in achanging environment: The relationship between habitatalteration and Spotted Owl occupancy and breedingdispersal. The Condor 109:566–576.
Seamans, M. E., R. J. Gutierrez, and C. A. May (2002). MexicanSpotted Owl (Strix occidentalis) population dynamics: Influ-ence of climatic variation on survival and reproduction. TheAuk 119:321–334.
Seamans, M. E., R. J. Gutierrez, C. A. May, and M. Z. Peery (1999).Demography of two Mexican Spotted Owl populations.Conservation Biology 13:744–754.
Seber, G. A. F., and C. J. Schwarz (2002). Capture-recapture:Before and after EURING 2000. Journal of Applied Statistics29:5–18.
Sillett, T. S., R. T. Holmes, and T. W. Sherry (2000). Impacts of aglobal climate cycle on population dynamics of a migratorysongbird. Science 288:2040–2042.
Singleton, P. H., J. F. Lehmkuhl, W. L. Gaines, and S. A. Graham(2010). Barred Owl space use and habitat selection in theeastern Cascades, Washington. Journal of Wildlife Manage-ment 74:285–294.
Soille, P., and P. Vogt (2009). Morphological segmentation ofbinary patterns. Pattern Recognition Letters 30:456–459.
Sovern, S. G., E. D. Forsman, G. S. Olson, B. L. Biswell, M. Taylor,and R. G. Anthony (2014). Barred Owls and landscapeattributes influence territory occupancy of Northern SpottedOwls. Journal of Wildlife Management 78:1436–1443.
Stavros, E. N., J. T. Abatzoglou, D. McKenzie, and N. K. Larkin(2014). Regional projections of the likelihood of very largewildland fires under a changing climate in the contiguousWestern United States. Climatic Change 126:455–468.
Stewart-Oaten, W., W. Murdock, and K. R. Parker (1986).Environmental impact assessment: ‘‘Pseudoreplication’’ intime? Ecology 67:929–940.
Stoelting, R. E., R. J. Gutierrez, W. L. Kendall, and M. Z. Peery(2015). Life-history tradeoffs and reproductive cycles inSpotted Owls. The Auk: Ornithological Advances 132:46–64.
Tautin, J., L. Metras, and G. Smith (1999). Large-scale studies ofmarked birds in North America. Bird Study 46 (Supplement 1):S271–S278.
Tempel, D. J., and R. J. Gutierrez (2013). Relation betweenoccupancy and abundance for a territorial species, theCalifornia Spotted Owl. Conservation Biology 27:1087–1095.
Thomas, J. W., E. D. Forsman, J. B. Lint, E. C. Meslow, B. R. Noon,and J. Verner (1990). A Conservation Strategy for theNorthern Spotted Owl: Report of the Interagency ScientificCommittee to Address the Conservation of the NorthernSpotted Owl. USDA Forest Service, USDI Bureau of LandManagement, Fish and Wildlife Service, and National ParkService, Portland, OR, USA.
The Condor: Ornithological Applications 118:57–116, Q 2016 Cooper Ornithological Society
K. M. Dugger, E. D. Forsman, A. B. Franklin, et al. Northern Spotted Owl demography 103

USDA Forest Service and USDI Bureau of Land Management(1994). Final Supplemental Environmental Impact Statementon Management of Habitat for Late-Successional and Old-Growth Forest Related Species within the Range of theNorthern Spotted Owl. USDA Forest Service and USDI Bureauof Land Management, Portland, OR, USA.
U.S. Fish and Wildlife Service (1990). Endangered and threatenedwildlife and plants: Determination of Threatened status forthe Northern Spotted Owl. Federal Register 55:26114–26194.
U.S. Fish and Wildlife Service (2011). Revised Recovery Plan forthe Northern Spotted Owl (Strix occidentalis caurina). U.S. Fishand Wildlife Service, Portland, OR, USA.
Van Deusen, P. C., L. L. Irwin, and T. L. Fleming (1998). Survivalestimates for the Northern Spotted Owl. Canadian Journal ofForest Research 28:1681–1685.
Van Lanen, N. J., A. B. Franklin, K. P. Huyvaert, R. F. Reiser, II, andP. C. Carlson (2011). Who hits and hoots at whom? Potentialfor interference competition between Barred and NorthernSpotted owls. Biological Conservation 144:2194–2201.
Ward, J. P., Jr., R. J. Gutierrez, and B. R. Noon (1998). Habitatselection by Northern Spotted Owls: The consequences ofprey selection and distribution. The Condor 100:79–92.
Westerling, A. L., H. G. Hidalgo, D. R. Cayan, and T. W. Swetnam(2006). Warming and earlier spring increase Western U.S.forest fire activity. Science 313:940–943.
White, G. C., and R. E. Bennetts (1996). Analysis of frequencycount data using the negative binomial distribution. Ecology77:2549–2557.
White, G. C., and K. P. Burnham (1999). Program MARK: Survivalestimation from populations of marked animals. Bird Study46:S120–S138.
White, G. C., K. P. Burnham, and D. R. Anderson (2001). Advancedfeatures of program MARK. In Wildlife, Land, and People:Priorities for the 21st Century (R. Field, R. J. Warren, H.Okarma, and P. R. Sievert, Editors). Proceedings of the SecondInternational Wildlife Management Congress, The WildlifeSociety, Bethesda, MD, USA.
White, G. C., K. P. Burnham, and R. J. Barker (2009). Evaluation ofa Bayesian MCMC random effects inference methodology forcapture-mark-recapture data. In Modeling DemographicProcesses in Marked Populations (D. L. Thomson, E. G. Cooch,and M. J. Conroy, editors). Springer, New York, NY, USA. pp1119–1127.
Wiens, J. D., R. G. Anthony, and E. D. Forsman (2011). Barred Owloccupancy surveys within the range of the Northern SpottedOwl. Journal of Wildlife Management 75:531–538.
Wiens, J. D., R. G. Anthony, and E. D. Forsman (2014).Competitive interactions and resource partitioning betweenNorthern Spotted Owls and Barred Owls in western Oregon.Wildlife Monographs 185.
Williams, B. K., J. D. Nichols, and M. J. Conroy (2002). Analysis andManagement of Animal Populations. Academic Press, NewYork, NY, USA.
Wolfe, J. D., C. J. Ralph, and P. Elizondo (2015). Changes in theapparent survival of a tropical bird in response to the El NinoSouthern Oscillation in mature and young forest in CostaRica. Oecologia 178:715–721.
Wright, S. J., C. Carrasco, O. Calderon, and S. Paton (1999). The ElNino Southern Oscillation, variable fruit production, andfamine in a tropical forest. Ecology 80:1632–1647.
Yackulic, C. B., J. Reid, J. D. Nichols, J. E. Hines, R. J. Davis, and E.Forsman (2012). Neighborhood and habitat effects on vitalrates: Expansion of the Barred Owl in the Oregon CoastRanges. Ecology 93:1953–1966.
Yackulic, C. B., J. Reid, J. D. Nichols, J. E. Hines, R. J. Davis, and E.Forsman (2014). The roles of competition and habitat in thedynamics of populations and species distributions. Ecology95:265–279.
Zabel, C. J., K. McKelvey, and J. P. Ward, Jr. (1995). Influence ofprimary prey on home-range size and habitat use patterns ofNorthern Spotted Owls (Strix occidentalis caurina). CanadianJournal of Zoology 73:433–439.
Zimmerman, G. S., R. Gutierrez, and W. S. Lahaye (2007). Finitestudy areas and vital rates: Sampling effects on estimates ofSpotted Owl survival and population trends. Journal ofApplied Ecology 44:963–971.
APPENDIX A
Study Area CharacteristicsStudy areas in the Cascade Mountains and on the Olympic
Peninsula (Olympic [OLY], Rainier [RAI], Cle Elum [CLE],
H. J. Andrews [HJA], and South Cascades [CAS]) were
characterized by rugged mountains where forests extended
from the lowlands (~180–1200 m elevation) up to the
timberline (.1500 m elevation). Study areas in the Oregon
Coast Ranges (Coast Ranges [COA] and Tyee [TYE]) and
Klamath Mountains in southwestern Oregon and north-
western California (Klamath [KLA], NW California
[NWC], Green Diamond Resources [GDR], and Hoopa
[HUP]) also were mountainous, with elevations ranging
from ~120 to 760 m. Mean annual precipitation was
variable among and within study areas, ranging from ~120cm per year in the Klamath study area to .350 cm per
year on the western side of the Olympic Peninsula (Table
3). Variation in precipitation within a study area was most
pronounced on the Olympic Peninsula, where average
annual precipitation was ~350 cm yr�1 on the west side of
the Olympic Mountains, but only ~41 cm yr�1 on the east
side of the Olympic Mountains. Most precipitation
occurred as rain during fall and winter in study areas in
the Coastal Mountains of western Oregon and northwest-
ern California (COA, TYE, KLA, NWC, GDR, and HUP),
whereas precipitation in study areas in the Cascade
Mountains (CLE, RAI, HJA, and CAS) and on the Olympic
Peninsula (OLY) occurred as a mixture of snow in winter
and rain in spring and fall.
The vegetation in all study areas was predominantly
coniferous forest, but the age and species composition of
forests varied widely among areas depending upon
latitude, climate, and management history. InWashington,
the OLY study area was dominated by coastal forests of
western hemlock (Tsuga heterophylla), Sitka spruce (Picea
sitchensis), western redcedar (Thuja plicata), and Douglas-
fir (Pseudotsuga menziesii), and the CLE study area was
The Condor: Ornithological Applications 118:57–116, Q 2016 Cooper Ornithological Society
104 Northern Spotted Owl demography K. M. Dugger, E. D. Forsman, A. B. Franklin, et al.

dominated by mixed conifer and ponderosa pine (Pinus
ponderosa) forests that included mixtures of Douglas-fir,
grand fir (Abies grandis), ponderosa pine, and western
larch (Larix occidentalis). The RAI study area in the
western Washington Cascades and the COA and HJA
study areas in northwestern Oregon were dominated by
mesic forests of Douglas-fir, western hemlock, and western
redcedar.
In southwestern Oregon, the TYE and KLA study areas
were dominated by Douglas-fir and incense cedar (Calo-
cedrus decurrens), with highly variable amounts of ponder-
osa pine, white fir (Abies concolor), western white pine
(Pinus monticola), sugar pine (P. lambertiana), canyon live
oak (Quercus chrysolepis), Oregon white oak (Q. garryana),
Pacific madrone (Arbutus menziesii), giant chinquapin
(Chrysolepis chrysophylla), and California laurel (Umbellu-
laria californica). Vegetation in the CAS study area in the
southern Oregon Cascades was similar to vegetation in the
TYE and KLA areas, except at higher elevations, where
forests were dominated by Shasta red fir (Abies magnifica
var. shastensis), Douglas-fir, and western hemlock.
Study areas in northwestern California were dominated
by mixed conifer or mixed evergreen forests in which the
overstory conifers were typically Douglas-fir, grand fir,
white fir, or coastal redwood (Sequoia sempervirens), and
common understory trees were tanoak (Notholithocarpus
densiflorus), Pacific madrone, California laurel, Oregon
white oak, and California black oak (Quercus kelloggii;Franklin and Dyrness 1973).
The age distribution and structure of forests varied
widely among study areas depending on the history of fire
and timber harvest. Most study areas (OLY, RAI, HJA,COA, TYE, CAS, KLA, NWC, and HUP) were character-
ized by a mixture of mature forest (100–200 yr old) and
old-growth forest (.200 yr old) interspersed with young
forests regenerating in areas that had been clear-cut or
burned. Dominant overstory trees in mature and old-
growth forests commonly exceeded 100 cm in diameter at
breast height (DBH), and occasionally exceeded 200 cm
DBH in the more mesic study areas. Portions of the CAS,
OLY, and RAI study areas were inside National Parks,
where forests had never been harvested and were mostly
mature and old-growth stands that had developed after
historical fires and windstorms. In several study areas,
where thinning or partial overstory removal was a
common method of forest management (CLE, KLA, and
CAS), the age structure both within and among stands was
highly variable because of the removal of selected trees in
the overstory or understory. This was particularly the case
in the CLE study area, where many stands had been
entered to ‘‘high-grade’’ the large overstory trees, leaving
stands dominated by small trees and scattered old,
dominant trees. In the GDR study area in California,
nearly all stands of old trees had been clear-cut and
converted to young forests that were ,70 yr old (Diller
and Thome 1999).
As described in previous publications, the 11 study areas
in our analysis were not selected randomly (Franklin et al.
1996, Anthony et al. 2006, Forsman et al. 2011). They were
initially selected based on many different factors, including
lobbying by local interest groups, opportunistic funding
sources, land ownership boundaries, and agency attempts
to improve sampling coverage by adding study areas in
different regions within the range of the Northern Spotted
Owl. Although the study areas were not randomly selected,
they did include samples from most of the geographic
provinces within the range of the Northern Spotted Owl
(Figure 1), and they covered a total area of 19,813 km2, or
~9% of the range of the Northern Spotted Owl, which has
been estimated at 230,690 km2 (USDA Forest Service and
USDI Bureau of Land Management 1994). In addition, the
percentage of suitable Spotted Owl habitat in the 8 study
areas that were part of the Northwest Forest Plan (NWFP)
effectiveness monitoring program (OLY, CLE, COA, HJA,
TYE, KLA, CAS, and NWC) was similar to that in
surrounding areas (Anthony et al. 2006; Appendix F); thus,
we believe that the habitat conditions within these study
areas characterized the range of forest conditions on
federal and matrix forest lands within the range of the owl,
and likely reflected conditions on federal forest lands in
general. We were less certain that our sample reflected
general patterns on nonfederal lands because managers on
the 3 nonfederal study areas in our sample (RAI, GDR, and
HUP) were actively managing to protect Spotted Owls and
their habitat. This differed from practices on most
nonfederal lands in the range of the owl, where
management of habitat for Northern Spotted Owls was
not a high priority.
APPENDIX B
Survey Methods and Workshop ProtocolsSurvey methods. Surveys were conducted during the
breeding season (March through August) using vocal
imitation or playback of owl calls to elicit territorial
vocalizations from Spotted Owls, thereby revealing their
presence (Reid et al. 1999). The number of surveys of each
owl territory in each year was normally �3, although the
survey protocol allowed for fewer visits in cases in which a
pair was detected and the female had no brood patch or
showed no evidence of nesting during the period when she
should have been incubating or brooding young. After
surveyors became familiar with the distribution of owl
territories in their study areas, it was often possible to
locate owls by simply calling quietly while visually
searching the historical roost or nest areas during the
day. If owls were not located during diurnal visits,
surveyors searched the entire territory at night by calling
The Condor: Ornithological Applications 118:57–116, Q 2016 Cooper Ornithological Society
K. M. Dugger, E. D. Forsman, A. B. Franklin, et al. Northern Spotted Owl demography 105

from survey stations distributed throughout the area (Lint
et al. 1999).
When nonjuvenile owls were first located, they werecaptured and banded with a U.S. Geological Survey
(USGS) numbered band on one leg and an acrylic band
that was uniquely patterned and colored on the other leg
(Forsman et al. 1996b). Juveniles were banded with
identical acrylic color bands on one leg and a numbered
USGS band on the opposite leg. If a bird banded as a
juvenile was detected holding a territory in later years, it
was retrapped, and its color band was replaced with auniquely patterned color band used for nonjuveniles. The
uniquely patterned color bands made it possible to identify
owls visually without retrapping them. The procedure for
identifying marked owls without recapturing them was to
lure them in with a live mouse or artificial lure and
examine their bands at close range with binoculars
(Franklin et al. 1996, Reid et al. 1999).
Because it often took several years for surveyors tobecome familiar with their study areas and to settle on
study area boundaries that could be effectively surveyed,
we truncated the data to remove the first 1–5 yr of survey
data from the individual study areas. The number of years
included in the analysis of individual study areas ranged
from 22 to 29. Once owls were located each year, we
followed a standard protocol to determine whether they
were attempting to nest and to estimate the number ofyoung produced by each female (Franklin et al. 1996, Lint
et al. 1999, Reid et al. 1999). This protocol involved either
feeding live mice to owls (majority of cases) or examining
the brood patches of captured females during the nesting
season (see details in Franklin et al. 1996). The number of
young fledged per female (NYF) was defined as the
maximum number of young detected during at least 2
visits after the young had left the nest tree. We includedsome exceptions to this protocol in order to reduce bias in
estimates of NYF. For example, females were given a ‘‘0’’ for
NYF if they: (1) did not appear to be nesting during 1 or
more visits during early spring and then could not be
relocated on multiple return visits, or (2) appeared to be
nesting, but then could not be relocated on multiple return
visits to the nest area. These exceptions were allowed
because females that did not nest or whose nesting
attempts were unsuccessful sometimes quickly disap-
peared and could not be relocated before the full protocolcould be met, and we were concerned that we would
overestimate NYF if we excluded these females from the
data.
Workshop protocols. Instructions and protocols for
data formatting were developed and reviewed several
months before the workshop and then implemented by
participants to create datasets for all analyses. Data from
each study area were then checked for errors by randomlydrawing a sample of 10 records from the files submitted
and checking the original data sheets to ensure that the
data were correctly entered and that field personnel had
followed established protocols for locating, banding, and
identifying individual Northern Spotted Owls, and for
documenting the number of young produced. If the data
were correctly formatted and the field forms for the 10
randomly sampled records supported the data coding, thenthe data were approved for analysis. If there were problems
with the data or formatting, the study area leader was
apprised of the problem, and told to review and correct
their files and then resubmit another set of 10 randomly
selected records for a second round of error-checking. This
correction, resampling, and review process continued until
the data passed inspection.
After participants arrived at the workshop, for the first2 days the entire group of biologists and analysts met to
discuss and agree on plausible hypotheses, analytical
protocols, and a priori models that would be used in the
analysis (Anderson et al. 1999). Once these discussions
were concluded, and everyone was in agreement
regarding hypotheses and protocols, study area leaders
were required to sign a form stating that their data had
passed the error-checking process and were ready foranalysis. This form also stipulated that once the
participant released their data for analysis during the
workshop, it could not be withdrawn, regardless of the
outcome of the analysis. Once the analysis began, any
refinements to models or analysis protocols were
discussed and agreed upon by all participants as the
workshop progressed.
The Condor: Ornithological Applications 118:57–116, Q 2016 Cooper Ornithological Society
106 Northern Spotted Owl demography K. M. Dugger, E. D. Forsman, A. B. Franklin, et al.
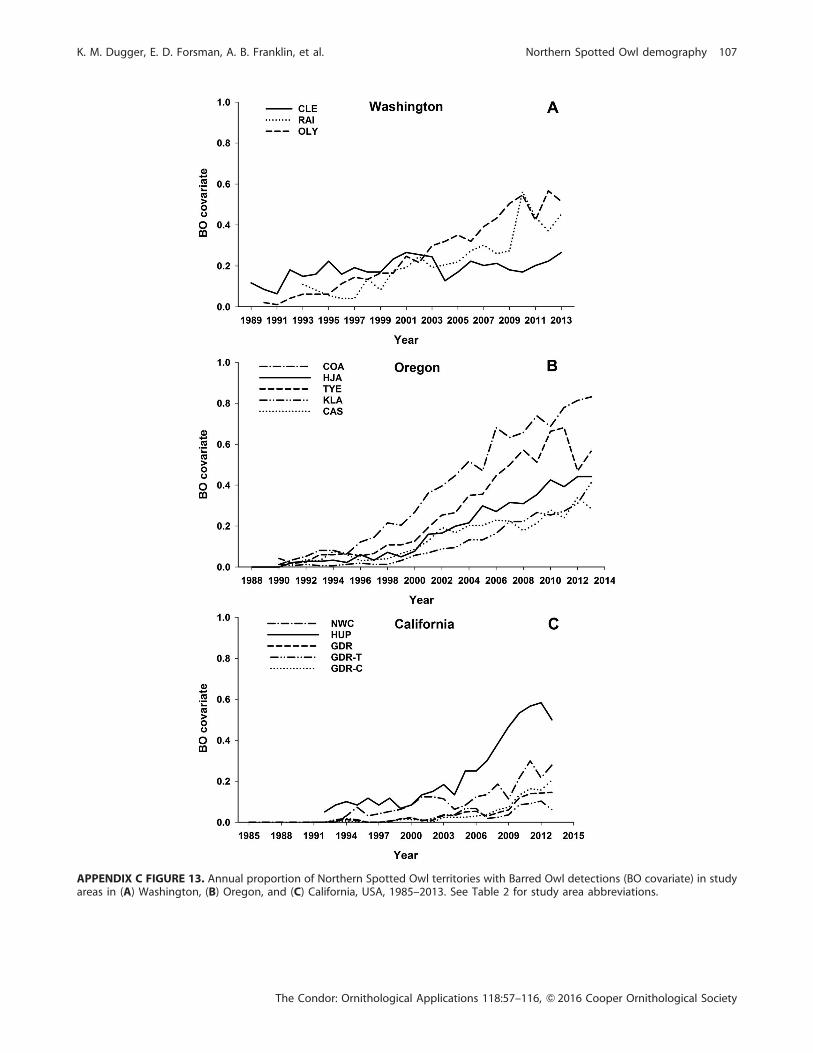
APPENDIX C FIGURE 13. Annual proportion of Northern Spotted Owl territories with Barred Owl detections (BO covariate) in studyareas in (A) Washington, (B) Oregon, and (C) California, USA, 1985–2013. See Table 2 for study area abbreviations.
The Condor: Ornithological Applications 118:57–116, Q 2016 Cooper Ornithological Society
K. M. Dugger, E. D. Forsman, A. B. Franklin, et al. Northern Spotted Owl demography 107

APPENDIX D FIGURE 14. Habitat covariates, including (A) the percent cover of suitable owl habitat within a 2.4-km radius of owlactivity centers (HAB), (B) a neighborhood focal statistic defined as the proportion of 30 m2 pixels with �50% suitable habitat within800 m of each pixel (CORE), (C) the amount of interface between suitable owl nesting habitat and other cover types (EDGE), and (D)the percentage of suitable habitat that was disturbed (HD), used to model fecundity, survival, recruitment, lambda, and occupancyof Northern Spotted Owls in 11 study areas in Washington, Oregon, and California, USA, 1985–2013. See Table 2 for study areaabbreviations.
The Condor: Ornithological Applications 118:57–116, Q 2016 Cooper Ornithological Society
108 Northern Spotted Owl demography K. M. Dugger, E. D. Forsman, A. B. Franklin, et al.

APPENDIX F
The Why and What of Random Effects (by Kenneth P.
Burnham)
Standard likelihood inference treats parameters as fixed
effects; hence, all inference is based only on sampling
variation, which is estimated from the likelihood function.
However, that source of variation ignores the ‘‘process’’
variation (r2) in a set of parameters, such as annual
survival probabilities. Hence, a linear model for trend, such
as Si¼ aþ b*iþ �i, embedded into the likelihood results in
inference being based only on conditional sampling
variation. The expected value of (�i)2 is var(Si j Si), but
its sampling variation excludes process variation. Process
variation is the conceptual, unexplained (‘‘random’’)
variation in the true, unknown set of Si beyond any
variation explained by a model structure. Viewed this way,
Si is considered a random variable, not a fixed constant.
Now, rather than using Si¼aþ b*iþ �i for inference, thecorrect model for proper inference must involve Si ¼ a þ
APPENDIX E FIGURE 15. Reproductive covariate (mean number of young fledged per pair per year) used to model survival andrecapture probabilities of Northern Spotted Owls in 11 study areas in (A) Washington, (B) Oregon, and (C) California, USA, during1985–2013. See Table 2 for study area abbreviations.
The Condor: Ornithological Applications 118:57–116, Q 2016 Cooper Ornithological Society
K. M. Dugger, E. D. Forsman, A. B. Franklin, et al. Northern Spotted Owl demography 109

b*i þ di, where the expected value of (di)2 is r2. However,
process variation cannot be estimated from the likelihood.
Moreover, ignoring process variation when making infer-
ence about parameters a and b is a logical mistake and can
result in the seriously flawed inference of unjustifiably
claiming ‘‘significance.’’ So, what to do?
It is not generally correct to do standard regression on
the maximum likelihood estimates (MLEs) Si to make
inference about the effect of a covariate, Xi, or about time
trends, Xi ¼ i. The model structure one needs is Si ¼ a þb*Xiþ diþ �i, and the variance–covariance structure must
now account for any sampling covariances among the
MLEs. The sampling variances and covariances are
estimated based on the model likelihood that produces
the MLEs. Let that conditional sampling variance–
covariance (VC) matrix be denoted as W. Also, we use
here vector notation for the parameters in the likelihood S.
If interest is in a general linear model such as S ¼ Xbþ d,the actual model we must use is represented as:
S ¼ Xbþ dþ �;VCðdþ �Þ ¼ D ¼ r2I þW :
(Note: Full mathematical rigor is not being used here
as this material focuses on concepts.) A further
complication can be overdispersion in the data, esti-
mated as c. If overdispersion must be allowed for, then
W is replaced by cW.
Given this framework for correct frequentist inference
about population-level parameters, b, all the requisite
theory is known and can be used in program MARK. For
details, the interested reader is referred primarily to
Burnham (2013), which is freely available. Burnham
(2013) presents the full relevant theory when random
effects issues arise for sets of capture–recapture parameters,
as well as additional concepts such as shrinkage estimates.
See also Burnham and White (2002), Franklin et al. (2002),
and White et al. (2009) for additional discussion.
Now we look further at the issue of overdispersion.Consider the simplest case, wherein the Si are independentand all with the same sampling variation, var; hence:
VCðdþ �Þ ¼ D ¼ r2I þ cðvarÞI ¼ ðr2 þ cðvarÞÞI:
The linear model is now a standard one: The Si are
uncorrelated, with equal variability, and therefore standard
regression can be used. The issue of overdispersion is then
irrelevant, and inference can be based on the observed
empirical variation among the set of Si. In this case, there is
total robustness to overdispersion. In the general case
(correlated Si and unequal sampling variances), there is
considerable robustness to overdispersion because the
observed variation among the Si is central to estimation of
r2 and somewhat compensates for imperfect information
about c. In fact, conceptually, scaled total variation in the
set of Si equals r2Iþ cW. Consequently, as c increases, r2
decreases, and this inverse relationship is what provides
some robustness of inference about b to overdispersion
using the random effects approach. However, we note thatr2 is quite sensitive to c, but its isolated value is not central
to inference about b.It appears that evidence (such as a t-statistic) about a
covariate parameter (such as a linear time trend) is
minimized at c ¼ 1; thus, use of c ¼ 1 is conservative.
For any random effects analysis it is easy to check this
supposition by trying several values of c. Program MARK
is distributed with a lot of examples. The files denoted
MPM14.* have real data on adult male Mallards (Anas
platyrhynchos) banded preseason over 42 yr. For these
data, the best estimate of the overdispersion factor is c ¼1.195. Below are some results for these data, using the
random effects method in program MARK with a linear
time-effects model on annual survival probability (detailedresults using the Mallard banding data are available from
K. P. Burnham):
c b se t r
1.000 0.00316 0.00111 2.85 0.07811.195 0.00321 0.00103 3.12 0.07071.250 0.00322 0.00101 3.19 0.06861.500 0.00328 0.00092 3.57 0.0593
Additional exploration has supported the idea, and observa-
tion, that use of c ¼ 1.0 is conservative for inference about
population-level structural parameters, and that there is
robustness of such inference to the numerical value of c.
We note that c¼ 1.0 was used with the analyses of these
extant Northern Spotted Owl data because estimation of c
strongly supported this value. Nonetheless, it is worth
knowing that this choice will have led to conservative
inferences. The answer, then, to the implied question of
why to use random effects analysis is: because it is thecorrect analysis for using the MLE estimates for inference
on structural parameters in population-level models.
‘‘What’’ this also gives us is robustness to the over-
dispersion issue, as well as conservative inferences with c¼1.0.
APPENDIX G
Study Area Selection, Potential Biases, and Surveyand Analysis ConsiderationsIt is important to acknowledge possible biases associated
with estimates of vital rates for Northern Spotted Owls
from long-term demographic studies. Other authors havediscussed these possible biases (Raphael et al. 1996, Van
Deusen et al. 1998, Manly et al. 1999, Boyce et al. 2005,
Loehle et al. 2005, Forsman et al. 2011), some of which
The Condor: Ornithological Applications 118:57–116, Q 2016 Cooper Ornithological Society
110 Northern Spotted Owl demography K. M. Dugger, E. D. Forsman, A. B. Franklin, et al.

have been rebutted (Franklin et al. 2006). Regardless, we
believe that the most important sources of bias to consider
are as follows:
Study area selection.We note that, because we did not
randomly select our study areas, we make formal statistical
inference only from the sample of marked, territorial owls
used in our analysis to the population of owls in our study
areas. However, we believe that our results are represen-
tative of Northern Spotted Owl populations on federal and
mixed federal and private lands because our study areas:
(1) encompassed 9% of the total range of the Northern
Spotted Owl, (2) contained most habitat types used by the
species, and (3) contained elements of most of the
physiographic provinces in which the species occurs.
Habitat covariates. After investigating the habitat
covariates more closely, we found that, despite a predicted
negative relationship between the amount of nesting and
roosting habitat (HAB) and the amount of edge habitat (i.e.
as HAB declines, EDGE increases), these two covariates
were strongly positively correlated on many study areas.
This was because EDGE was defined in relation to HAB, so
as HAB declined, in some cases dramatically over time, the
amount of EDGE relative to HAB also declined.
Potential biases in estimates of demographic param-
eters. Rate of population change (k). Key assumptions
that must be met to use Pradel’s (1996) model to estimate
the finite rate of population increase (k) are: (1) similar
detection probabilities for all territorial birds, (2) similar
areas sampled each year of study, and (3) no band loss. Two
sources of variation in detection probabilities potentially
relevant to Spotted Owls are ‘‘trap response’’ andheterogeneity (Hines and Nichols 2002). Trap response
refers to the situation in which new, unmarked birds have
different (typically lower) probabilities of detection than
previously marked birds. Heterogeneity refers to variation
in detection probability among individuals that cannot be
attributed to trap response or to a measurable individual
covariate. Sampling methods in our study were designed to
minimize sources of variation in detection probabilities,
and we do not believe that such variation led to substantive
bias in our estimates of k. In some cases, study areas
surveyed for Spotted Owls were expanded, but we
eliminated any associated bias in estimates of k by
accounting for these changes in our modeling. Finally, as
reported above, Franklin et al. (1996) provided evidence
that band loss in Northern Spotted Owls was negligible.
Occupancy. Three potential sources of bias in our
parameter estimates for the occupancy analysis were: (1)
the effects of unmodeled heterogeneity in capture
probability, (2) the potential for small-sample bias in some
study areas, and (3) the way we defined occupancy for
Barred Owls. The only prior multispecies, multiseason
modeling of Northern Spotted Owls and Barred Owls was
completed in one study area (TYE), during an overlapping
time period, and using a different definition of owl
territories and different habitat covariates, in addition to
including more covariates to explain heterogeneity in
detection probabilities (Yackulic et al. 2014). Despite these
methodological differences, the results reported by
Yackulic et al. (2014) are similar to ours, suggesting that
any heterogeneity that was unmodeled in our analysis may
have been unimportant. The potential for small-sample
bias has been explored in single-species, multiseason
occupancy models (e.g., Mckann et al. 2013), but has not
been explored for 2-species, multiseason occupancy
models. Assuming that conditions identified by Mckann
et al. (2013) can be generalized to 2-species models, it is
possible that the smaller number of sites in some study
areas (RAI, NWC, and HUP) led to bias in parameter
estimates. However, Mckann et al. (2013) assumed a
relatively short time series (5 yr) in their simulations, as
compared with 19 yr for most territories in our analysis,
and longer time series may compensate for fewer
territories in some areas. Lastly, we defined Barred Owloccupancy in terms of one or more Barred Owls because
the incidental detection data that we had available did not
distinguish single owls from pairs (Yackulic et al. 2012,
2014). Moreover, as Barred Owl densities increase there
may be multiple pairs of Barred Owls occupying each
individual Spotted Owl territory (Wiens et al. 2014). Both
of these factors suggest that the impacts of Barred Owl
presence on Spotted Owl colonization and extinction may
not be constant across territories or time. Given increasing
Barred Owl densities in most study areas, the estimated
effect of Barred Owl presence on Spotted Owl extinction
and colonization in this study may have underestimated
actual effects. However, the strength of the Barred Owl
effect on extinction probabilities of Spotted Owls did not
appear to increase through time in the TYE study area
when prior data analyses were performed (C. Yackulic
personal communication), so this negative bias may be
small.
Fecundity. Although differences in the detectability of
nesting and nonnesting owls could cause positive or
negative biases in estimates of fecundity (Anthony et al.
2006), we believe that our estimates of fecundity were
reasonably accurate because they pertained only to
territorial owls and annual detection probabilities of
territorial owls in our studies were high (.75%), regardless
of nesting status. If anything, we suspect that our estimates
may have been biased slightly high because nonbreeding
territorial females might be harder to detect, but this
should not have affected our comparisons of long-term
trends, assuming that any such bias was consistent among
years.
Apparent survival. Heterogeneity in recapture probabil-
ity, temporary or permanent emigration, and band loss are
the primary factors associated with bias or decreased
The Condor: Ornithological Applications 118:57–116, Q 2016 Cooper Ornithological Society
K. M. Dugger, E. D. Forsman, A. B. Franklin, et al. Northern Spotted Owl demography 111

precision in estimates of survival from marked individuals
in Cormack-Jolly-Seber open population models (Lebreton
et al. 1992). Two of these potential sources of bias,
heterogeneity in recapture rates and temporary emigra-
tion, were investigated by Manly et al. (1999) for Northern
Spotted Owls in the eastern Cascades of Washington using
computer simulations. In their analysis, lack of indepen-
dence between capture probabilities of paired males and
females, variation in recapture rates, and temporary
emigration had little effect on estimates of apparent
survival. Potential bias associated with heterogeneity of
recapture rates was likely low because both survival and
detection probabilities were generally high (Carothers
1973, Pollock et al. 1990, Hwang and Chao 1995). As
noted above, annual detection probabilities observed in
our study were generally very high (.75%), suggesting
little unmodeled heterogeneity in recapture rates. Dispers-
al of resident, territorial Northern Spotted Owls in a subset
of the study areas included in our analysis was estimated at
~7% each year (Forsman et al. 2002), and most of theindividuals that dispersed were relocated in adjacent
territories within the study area boundaries. Thus, while
some undetected movements outside each study area
almost certainly occurred each year, the negative bias in
apparent survival associated with permanent emigration
beyond the boundaries of our study areas was likely quite
low when these studies were initiated. However, as noted
above, the increased displacement of Spotted Owls into
undetectable, nonterritorial floater populations due to
increasing Barred Owl densities may be occurring in all
our study areas. Thus, decreasing trends in apparent
survival of Spotted Owls may not reflect increased
mortality, but rather increased permanent emigration
due to competition with Barred Owls.
Lastly, Franklin et al. (1996) examined records from
.6,000 Northern Spotted Owls that were double-banded
with colored bands and numbered metal bands, and found
only 2 cases in which the color band was lost and 2 cases in
which the numbered metal band was lost (,0.07% total
band loss). Based on this evaluation, we believe that
negative bias in estimates of apparent survival associated
with band loss in our study was extremely low.
Survey and analysis considerations. Previous Spotted
Owl meta-analyses have taken advantage of both refine-
ments in existing estimation methodology and develop-
ment of new methods. Major changes in analytical
approaches in our analyses included the addition of 2-
species dynamic occupancy analyses (this study) and a shift
from projection matrices to capture–recapture approaches
for estimation of k (Franklin et al. 2004, Anthony et al.
2006). As noted above, possible differences in detection
probabilities of territorial breeders and nonbreeders is a
potential source of bias in fecundity analyses that we do
not believe to be substantial. However, we note that such
variation in detection probabilities can now be addressed
using multistate occupancy models (Nichols et al. 2007,
Stoelting et al. 2015). In addition to dealing with detection
probabilities of Spotted Owls, the dynamic 2-speciesoccupancy modeling used in our analyses could be
expanded to include the 2 Spotted Owl occupancy states
of breeding and nonbreeding, thus permitting direct
inference about territory-level effects of Barred Owls on
Spotted Owl fecundity. The addition of one state to the
dynamic occupancy analysis admittedly would complicate
the modeling, but the following benefits merit consider-
ation of this approach: (1) addressing detection probabil-
ities that may vary between breeders and nonbreeders, (2)
permitting direct inference about Barred Owl presence on
fecundity, and (3) incorporating into the analysis the extra
information of territory-level occupancy state and fecun-dity in the previous year. One additional approach that
may merit consideration is a joint analysis of Spotted Owl
survival with territory-level Barred Owl presence (based on
occupancy modeling) as a ‘‘covariate.’’
Improvements to the current study design might also
include changes to field survey protocols to include Barred
Owl–specific surveys during each breeding season, which
would increase detection rates of Barred Owls in our study
areas (Wiens et al. 2011). The additional cost of Barred
Owl surveys might not outweigh the benefits, although
incorporating such surveys into the current Spotted Owl
protocols might be possible with only relatively minorincreases in survey cost (Diller et al. 2014).
APPENDIX H
Analytical ApproachAnnual rates of population change. In addition to
derived annual estimates of lambda (kt), the Pradel reverse
Cormack-Jolly-Seber (CJS) model (Pradel 1996) allowed
for the decomposition of annual estimates of kt into 2
components, apparent survival (/t) and recruitment (ft),
where:
kt ¼ /t þ ft :
In this case , /t was local apparent survival and reflected
both survival and retention of territory holders within the
study area. Recruitment (ft) was the number of new
animals in the population at time t þ 1 per animal in the
population at time t, and reflected both in situ recruitment
and immigration of recruits from outside the study area.
Thus, estimates of kt included all losses and gains to the
study area population during each year and were used to
generate estimates of realized population change in eachstudy area.
We changed from f-parameterization to k-parameteri-
zation before running random effects models on kt in
The Condor: Ornithological Applications 118:57–116, Q 2016 Cooper Ornithological Society
112 Northern Spotted Owl demography K. M. Dugger, E. D. Forsman, A. B. Franklin, et al.

program MARK because, in order to obtain model
selection results for random effects on k, it is necessary
for the parameter to be in the model (i.e. not derived;
Pradel 1996, Hines and Nichols 2002). We used c ¼ 1 for
analyses of the rate of population change, because over-
dispersion in this parameter in previous analyses of
Spotted Owl population data was negligible (Anthony et
al. 2006, Forsman et al. 2011). We initially investigated
fixed effects models with general time dependence on
survival (/t) and recruitment (ft), and combinations of
annual time and sex effects on recapture rates (p). The best
structure of p from the model with the lowest Akaike’s
Information Criterion corrected for small sample size
(AICc) was retained and used as the base fixed effects
model for 5 random effects models of kt. The 5 random
effects models included the intercept-only (no effect),
general time (t), linear time trend (T), log-linear time trend
(lnT), and spline models (SPLINE, with knots every 5 yr
backward from 2013, such that the first interval was �5years; Bonner et al. 2009). The log-link function was used
for lambda or recruitment in fixed effects models, and the
identity link function was used for lambda in the random
effects models.
Occupancy analysis. We used an iterative model
selection process that allowed us to explore different
structures for each of the 8 model components (initial
occupancy, colonization, extinction, and detection proba-
bility, for each of the 2 species). For detection probabilities,
we considered within- and among-year variation for both
species, as well as temporal trends. We also considered
models in which Barred Owl detection probabilities
differed when Spotted Owls were present, and models in
which Spotted Owl detection probabilities differed when
Barred Owls were either: (1) present, but not necessarily
detected by survey during that specific survey period, or (2)present and detected during the same survey period. We
hypothesized that Spotted Owl detection probabilities
would be lower when Barred Owls were present, and lower
still when Barred Owls were present and detected, because
of the aggressiveness of Barred Owls (Van Lanen et al.
2011). At the same time, the presence of Spotted Owls
could have led to lower detection rates of Barred Owls
because surveyors ceased calling once Spotted Owls were
detected. Field survey protocols were solely focused on
detecting Spotted Owls, so only Spotted Owl calls were
used to conduct surveys (Forsman et al. 1996a), and the
detection of Barred Owls was incidental to that effort.
Therefore, we also included a ‘‘trap response’’ model on
detection probabilities for each species. For example, if
Spotted Owls were detected during a previous visit,
detection probabilities for Spotted Owls were predicted
to increase during subsequent visits due to knowledge
gained by surveyors regarding Spotted Owl locations
within a territory, resulting in a more focused calling
effort around those previous locations (Tempel and
Gutierrez 2013). Conversely, this same process might be
expected to result in decreased detection probabilities for
Barred Owls as surveys were then potentially focused on a
smaller area within the Spotted Owl territory.
Fecundity. We used the normal distribution regression
model on annual averages for the analysis of the number of
young fledged per female (NYF) by age class in each study
area (Anthony et al. 2006, Forsman et al. 2011). We
averaged across owl territories by year in each area to
equalize the variance-to-mean relationship for NYF in
order to meet the homoscedasticity assumption inherent
in the normal distribution model. Covariates of interest
(Barred Owls [BO], habitat, and weather) were measured
at the population (study area) level. Thus, the appropriate
sample unit for this analysis was not owl territories but
study area and age class combinations that responded to
yearly effects that influenced entire study areas. In
addition, by averaging NYF and treating study areas as
sampling units, we avoided autocorrelation issues over
time for individual owl territories. The pattern of the
variance-to-mean ratio was consistent with a truncated
Poisson distribution because Spotted Owl pairs seldom
raise more than 2 young (underlying data structure¼ 0, 1,
2). However, the mean NYF per year by age class and study
area was not Poisson distributed (Forsman et al. 2011).
Normal models are more accurate than Poisson models
when data depart from a Poisson distribution (White and
Bennetts 1996), and are just as accurate as multinomial
models when averages are analyzed (McDonald and White
2010). Thus, we used a regression model based on a
normal distribution to model mean annual NYF in each
study area as:
PROC MIXED;MODEL MEAN NYF¼ fixed effects:
Residual variation was a combination of year-to-year
variation and estimated variation around the actual mean
and was approximately equal to:
varðresidualÞ ¼ varðyear effectsÞ þ varðNYFÞ=n;
where n ¼ number of territorial females checked in a
particular year. We performed several diagnostics to justify
this approach. First, we conducted a variance components
analysis on individual NYF records for adult females
(adjusted for obvious even–odd year affects) to confirm
that spatial variance among territories tended to be small
relative to temporal variance among years and other
residual effects. This negated the need to include owl
territories as a random effect, because ignoring spatial
variance within study areas would not bias results. In
addition, we were able to support the key assumption that
residual variation (var(residual)) was relatively constant
based on the following: (1) var(NYF)/n was small relative
The Condor: Ornithological Applications 118:57–116, Q 2016 Cooper Ornithological Society
K. M. Dugger, E. D. Forsman, A. B. Franklin, et al. Northern Spotted Owl demography 113

to var(year effects), (2) relatively few (,10%) territorial
subadults were encountered, such that var(NYF)/n was
also approximately constant, even though var(NYF) maydecline with increasing age class, and (3) there was no
evidence of heterogeneous variances based on a Levene’s
test (Ramsey and Schafer 2002). Finally, we assumed that
residual effects were approximately normally distributed
based on the central limit theorem, which states that the
average of the measurements will have an approximately
normal distribution with large sample sizes even if the
individual measurements are discrete.Apparent survival. We did not estimate juvenile
survival rates because high rates of permanent emigration
bias estimates of apparent survival for juveniles (Burnham
et al. 1996). We assumed that permanent emigration did
not result in a large difference between apparent survival
(estimated here) and true survival of nonjuveniles, because
previous studies have indicated that permanent emigration
by adult Spotted Owls is uncommon, and that most casesof breeding dispersal in adult Northern Spotted Owls
involve short movements between adjacent territories (i.e.
within a study area; Forsman et al. 2002, Zimmerman et al.
2007).
In contrast to previous survival analyses, we excluded
captures of birds when they were first captured as S1 (1 yr
old), but retained the S2 (2 yr old) and adult (�3 yr old)
portions of their capture histories. We also combined theS2 and adult age classes into a single age class, and used
this combined age class (S2 þ Adults) in the survival
analysis for individual study areas and in the meta-analysis
(5,090 individuals). We did this for the following reasons:
(1) survival of the S2 and adult age classes was similar,
whereas survival for the S1 age class was lower than for the
older age classes (Burnham et al. 1996, Anthony et al.
2006, Forsman et al. 2011), (2) the number of S1 owls inthe territorial population was small and therefore unim-
portant for estimating trends, (3) S1 owls were more likely
to permanently emigrate compared with S2 and adult owls
(Forsman et al. 2002); thus, excluding them resulted in
estimates that were closer to true survival, and (4)
excluding S1 owls and combining the S2 and adult age
classes made the survival analyses in individual study areas
and the meta-analysis directly comparable as they relied onthe same data.
We used c ¼ 1 to estimate overdispersion in all study
areas because: (1) this was very close to the mean c across
all study areas in previous analyses (Anthony et al. 2006,
Forsman et al. 2011), and (2) regression inferences about
covariate effects on parameters such as / and k based on
random effects models are robust to overdispersion
(Burnham and White 2002; Appendix F).
To avoid developing a large a priori model set byinvestigating all possible covariate combinations of model
structures on each parameter for each study area, we used
an ad hoc, hierarchical strategy to develop model sets,
which generally results in model selection results compa-
rable to an ‘‘all possible combinations’’ strategy (Doherty et
al. 2012). Our strategy for analyses of apparent survival
included initially modeling recapture probabilities (p) to
first determine the best structure for p. We used a generaltime structure on survival [/(t)] and investigated 3
recapture probability models for each study area: p(sex*t),
p(sex þ t), and p(t). The recapture probability structure
from the fixed effects model with the lowest AICc was
retained, and we fit the annual time plus sex fixed effects
model [/(tþ sex)] to survival using the best structure for
recapture probabilities to determine whether sex effects
were important. If the ratio of the weight of the sex effectmodel [/(t þ sex) p(best)] divided by the weight of the
model without sex effects [/(t) p(best)] was .10, we
considered the weight of evidence strong enough to retain
the sex effect in the base fixed effects model used for the
random effects modeling of covariates (Burnham and
Anderson 2002).
Meta-analysis of apparent survival. We removed S1
captures from the dataset and combined S2 and adult owlsinto a single age class, consistent with the apparent
survival analysis in individual study areas. The fixed effects
global model included the study area (g) by annual time (t)
interaction on survival [/(g*t)] and the sex by study area by
time interaction on capture rates [p(g*sex*t)]. We hypoth-
esized that there would be a minimal effect of sex on
survival (e.g., Anthony et al. 2006, Forsman et al. 2011),
and verified this with an additional model that included anadditive sex effect [/(g*tþ sex)]. If the ratio of the weight
of the sex effect model divided by the weight of the model
without sex effects was .10, we considered the strength of
evidence strong enough to retain the sex effect in the base
fixed effects model used for the random effects modeling
of covariates (Burnham and Anderson 2002). We also used
a binomial categorical variable (NWFP) to test the
hypothesis that survival differed between the 8 primarilyfederally owned study areas and the 3 nonfederally owned
study areas. If the ratio of the weight of the NWFP model
divided by the weight of the model without the NWFP
covariate was .10, we considered the weight of evidence
strong enough to retain the NWFP effect for the random
effects modeling (Burnham and Anderson 2002).
The Condor: Ornithological Applications 118:57–116, Q 2016 Cooper Ornithological Society
114 Northern Spotted Owl demography K. M. Dugger, E. D. Forsman, A. B. Franklin, et al.

APPENDIX I FIGURE 16. Estimates from the best random effects models for each study area from the meta-analysis of apparentsurvival of Northern Spotted Owls during 1985–2013 plotted with estimates of survival from fixed effects base models (MLE) andshrinkage estimates (S-Tilde) in individual study areas in (A) Washington, (B) Oregon, and (C) California, USA. Control and Treatmentareas in the GDR study area are plotted separately. Model notation indicates structure for effects of a linear time trend (T), the annualamount of interface between suitable habitat and other cover types within each owl site (EDGE), the annual percentage of suitablehabitat that was disturbed (HD), reproduction (R), mean monthly minimum temperature during the early nesting season (ENT), totalprecipitation during the early nesting season (ENP), mean monthly minimum temperature during the late nesting season (LNT), totalprecipitation during the late nesting season (LNT), mean monthly minimum temperature during winter (WMT), the SouthernOscillation Index (SOI), proportion of territories with Barred Owl detections (BO), and, for GDR, a time trend on survival in bothtreatment and control areas before removal started (1992–2008; B(T)) and different time trends in treatment vs. control areas afterremovals began in 2009 [A(Trt*T)] in a BACI design.
The Condor: Ornithological Applications 118:57–116, Q 2016 Cooper Ornithological Society
K. M. Dugger, E. D. Forsman, A. B. Franklin, et al. Northern Spotted Owl demography 115

APPENDIX I FIGURE 16. Continued.
The Condor: Ornithological Applications 118:57–116, Q 2016 Cooper Ornithological Society
116 Northern Spotted Owl demography K. M. Dugger, E. D. Forsman, A. B. Franklin, et al.


![static.cambridge.orgcambridge.org:id:... · Web view[page break—case studies randomly presented—Vignette 1: Owls] In the Pacific Northwest, decades of habitat loss have caused](https://img.pdfslide.us/doc/110x75/5cab5a2a88c993fb328c513e/cambridgeorgid-web-viewpage-breakcase-studies-randomly-presentedvignette.jpg)