Embed Size (px)
Citation preview
THE EFFECTS OF GROUP SIZE ON READING
OUTCOMES OF IDENTIFIED NONRESPONDERS
By
Caresa Lynn Young
Dissertation
Submitted to the Faculty of the
Graduate School of Vanderbilt University
in partial fulfillment of the requirements
for the degree of
DOCTOR OF PHILOSOPHY
in
Special Education
May, 2008
Nashville, Tennessee
Approved
Professor Douglas Fuchs
Professor Lynn Fuchs
Professor Donald Compton
Professor Kathleen Lane
Professor Daniel Ashmead

ii
Copyright © 2008 by Caresa Lynn Young All Rights Reserved
iii
ACKNOWLEDGMENTS
I would like to thank my wonderful family and friends for all of your support.
Mike, Mom, Dad, Candy, and David: You have all been there for me during this entire
process cheering me along, nudging me along, and supporting all the other life events that
can sometimes get in the way. For my children, Tyler and Jenna, you are my inspiration
and my hope for the future. I love you all.
My sincere appreciation to my advisor, Doug Fuchs, who never gave up on me
and has given me so many wonderful opportunities. I have learned so much from him and
his work. Also, to my entire committee for your wonderful suggestions.
iv
TABLE OF CONTENTS
Page
ACKNOWLDEGMENTS ................................................................................................. iii LIST OF TABLES ............................................................................................................. vi LIST OF FIGURES ......................................................................................................... viii Chapter
I. INTRODUCTION ...................................................................................................1
Treatment Nonresponders ........................................................................................1 Increasing Responsiveness to Reading Instruction ..................................................4 Purpose .....................................................................................................................7 Importance ...............................................................................................................8
II. LITERATURE REVIEW ........................................................................................9
Rationale for the Importance of Research on Grouping Arrangements For Instruction ..........................................................................................................9 Literature Search ....................................................................................................10 Findings..................................................................................................................11 Implications for Further Research .........................................................................33
III. METHODS ............................................................................................................35
Participants .............................................................................................................35 Treatment ...............................................................................................................42 Measures ................................................................................................................48 Procedures ..............................................................................................................53 Data Analysis .........................................................................................................58
IV. RESULTS ..............................................................................................................59
Descriptive Information .........................................................................................59 Effect Sizes ............................................................................................................63 Post Hoc Analysis ..................................................................................................67 Growth Model of CBM ..........................................................................................71
v
V. DISCUSSION ........................................................................................................79
Study Group Differences .......................................................................................79 Study Limitations ...................................................................................................84 Conclusions and Implications ................................................................................85 Future Analyses .....................................................................................................97
Appendix
A. Scope and Sequence of Tutoring Activities .....................................................89
REFERENCES ..................................................................................................................93
vi
LIST OF TABLES
Table Page 1. Methodological Information for Meta-Analyses and Narrative Reviews on 1:1
Instruction ....................................................................................................................13
2. Relevant Findings for Meta-Analyses and Narrative Reviews on 1:1 Instruction ......14
3. Methodological Information for Meta-Analyses and Narrative Reviews on Small Group Instruction .........................................................................................................19
4. Relevant Findings for Meta-Analyses and Narrative Reviews on Small Groups ........20
5. Methodological Information for Meta-Analyses and Narrative Reviews of 1:1
Versus Small-Group Instruction ..................................................................................24
6. Relevant Findings for Meta-Analyses and Narrative Reviews of 1:1 Versus Small-Group Instruction ..............................................................................................25
7. Number of Groups (and Students) by Tutoring Group and PALS Treatment .............38
8. Number of Groups (and Students) by Tutoring Group Placed in Each Type of
School ..........................................................................................................................38 9. Number of Students in each Tutoring Group by School ..............................................40 10. Descriptive Statistics for Monitoring Measures (October to December) by
Tutoring Group ............................................................................................................41 11. Time Spent on Each Tutoring Activity ........................................................................43 12. Pre and Post-Treatment Reading Raw Scores by Study Group ...................................60 13. Average Improvement of Nonresponsive Students by Study Group ...........................62 14. Number of Words Correct Per Minute on CBM Measures .........................................64 15. Effect Sizes on Reading Measures ...............................................................................65 16. Comparison of Sound Coverage in Each Study Group ...............................................69 17. Comparison of Sight Words Coverage in Each Study Group......................................70

vii
18. Unconditional Linear Growth Models for CBM .........................................................74 19. Conditional Linear Growth Models for CBM .............................................................77
viii
LIST OF FIGURES
Figure Page 1. Mean Performance at Each CBM Assessment ............................................................72
2. Individual CBM Growth Trajectories ..........................................................................75 3. Growth of ELL Versus Non-ELL Students .................................................................78
1 1
CHAPTER I
INTRODUCTION
Students with specific learning disabilities comprise 47% of the placements in
special education, with reading disabilities being the most common classification (Lyon,
1995). Much research has focused on remediating reading deficits in young students
because researchers have documented the long-term negative consequences of early
reading failure (e.g., Juel, 1988). In 1998, a panel of reading experts published a report
that synthesized the available research in reading (National Reading Panel, 1998). The
report claimed that the best reading instruction included direct, systematic instruction in
phonemic awareness, phonics, fluency, vocabulary, and reading comprehension. These
essential skills have been termed the building blocks of reading (Center for the
Improvement of Early Reading Achievement, 2001). Intervention studies (e.g.
Blachman, Ball, Black, & Tangel, 1994; Foorman, Francis, Fletcher, & Schatschneider,
1998; Torgesen, Alexander, Wagner, Rashotte, Voeller, and Conway, 2001) have found
that teaching these building blocks of reading can significantly increase students’
phonological awareness skills and word recognition skills.
Treatment Nonresponders
Many students nevertheless do not respond to generally effective reading
instruction (e.g., Vellutino, Scanlon, Sipay, et al., 1996). Approximately 50% of students
with disabilities (e.g., Fuchs, Fuchs, Thompson, Al Otaiba et al., 2001; Torgesen, 2000),
2 2
and 20% to 30% of students at-risk for reading failure, do not benefit from best practices
in reading instruction (e.g., Al Otaiba & Fuchs, 2002; Blachman, et al., 1994; Mathes,
Howard, Allen, & Fuchs, 1998). This translates to approximately 2-6% of the total school
population. These students are typically referred to as “nonresponders.”
With the President’s signing of the No Child Left Behind legislation (2002), these
findings are troublesome to advocates, practitioners, researchers, and policy makers.
Funding has increased for additional research on how to identify and treat nonresponders,
which has led to national concern over current methods of LD identification. Specifically,
the IQ-achievement discrepancy model has been widely criticized on several fronts (see
Kavale, 2002 for a full review). Most notably, critics say, students are not identified for
special education services until they have already experienced long-term failure in the
general education classroom. Some have proposed a new identification procedure that
includes three tiers of identification. In tier I, all students’ performance is monitored in
general education. In tier II, group instruction is provided to those unresponsive to
classroom instruction, and their performance at this second tier is monitored. Finally, tier
III, would be special education placement. The final tier would be reserved for the
children unresponsive to instruction at tiers I and II; that is, chronically unresponsive
students. It is important for the policy makers, researchers, school administrators, and
school teachers to understand the characteristics of nonresponders, the definition of
nonresponsiveness, and how to best educate these students.
Study of nonresponders has had several dimensions. First, characteristics of
nonresponders have been examined (Al Otaiba & Fuchs, 2002; Torgesen & Davis, 1996;
Vellutino et al., 1996). This research is important because it can lead to earlier
3 3
intervention as well as better intervention plans for these students. Students could be
identified earlier as being at-risk for reading failure and placed in appropriate research-
based interventions.
Second, researchers are studying how best to define nonresponsiveness to
treatment. Togesen et al. (2001), for example, defines nonresponsiveness as scoring
below 90 on a standardized test. This is a stringent criterion. It is difficult to increase
students’ standard scores because they are being compared to their peer group, which is
always improving more or less. Therefore, to close the gap between targeted students and
peers the targeted students must make relatively large gains. To say that students one
standard deviation below the mean prior to intervention are “nonresponsive” to a
treatment because their performance is unequal to the group mean at posttest is likely to
be insensitive to whether growth may have occurred. If one considers that a student must
make progress to maintain a standard score, it would seem to make little sense to expect
students with disabilities to be “average” after intervention.
As an alternative to Torgesen’s definition of nonresponsiveness, Fuchs, Fuchs,
and Speece (2002) have suggested use of a dual discrepancy model. Students are
identified as nonresponsive using both the slope and level of reading achievement using
curriculum-based measures (CBM). This model accounts for how low the student’s
achievement is at a point in time as well as growth of skills over time. Moreover, CBM is
a reliable and valid measure of student progress. The dual-discrepancy method eliminates
several serious problems with current methods of nonresponder identification. But it still
does not answer the question; What level and how much growth is desirable? Criteria for
performance level and growth are still arbitrary.
4 4
A third line of research has focused on determining ways to bolster effectiveness
of reading programs for children not responsive to effective teaching strategies. While the
National Reading Panel Report (1998) documented best practices in reading, the focus
has shifted to what elements of intervention (i.e., pacing, intensity, duration, group size,
expertise of the instructor) can increase student responsiveness.
Increasing Responsiveness to Reading Instruction
Group Size
Grouping for reading instruction has been a major area of contention in the field
of education. In the 1960’s and 1970’s, students were often placed in small groups with
other children who were at a similar instructional level. More recently, students are
placed in multiple-ability groups (Schumm, Moody, & Vaughn, 2000). The rationale
behind this shift from homogeneous grouping to heterogeneous grouping has been to
prevent low self-esteem in students in low-achieving groups and to provide good reading
models for the poor readers. The inclusion movement (placing students with disabilities
in the general education classroom) has also decreased homogeneous grouping and
increased heterogeneous grouping.
Moody, Vaughn, and Schumm (1997) interviewed general and special education
teachers to determine their grouping practices. They found that general education
teachers typically relied on whole-class instruction. In contrast, special education teachers
typically grouped students based on their developmental level. Elbaum, Schumm, and
Vaughn (1997) followed up these teacher interviews with interviews with students to
5 5
determine how they felt about grouping. Overall, students said that participating in
multiple-ability groups was more beneficial than whole-class instruction or homogeneous
grouping.
Surprisingly little research has been conducted to explore possible differential
effects of group size (e.g., whole class instruction vs. small groups of three to five
children vs. individual instruction) on students’ reading performance. Whereas intensive,
individualized instruction has been shown to remediate severe reading deficits of many
children (e.g., Torgesen, Wagner, Rashotte, & Herron, 1999), scant resources in schools
often make individualized programs uneconomical and infeasible. That is, whereas
Torgesen et al. (1999) provided instruction 4 days a week for 2.5 years for all at-risk
students in one district, special education in most districts provide little, if any,
individualized instruction (Vaughn, Moody & Schumm, 1998). According to Vaughn et
al., most special education instruction is provided in groups of 5 to 19 students.
Although it is widely assumed that 1:1 intervention is superior to small group
direct instruction, little research has systematically been conducted to test this belief. In
fact, the National Reading Panel (1998) found that 1:3 instruction may be as effective as
1:1 instruction if students are on the same developmental reading level. Elbaum, Vaughn,
Hughes, and Moody (1999) conducted a meta-analytic review to determine the grouping
practices that had the best academic outcomes for students with disabilities. They found
that students in small groups or in peer tutoring made impressive gains in decoding,
suggesting that small group instruction may be as effective as individual tutoring. Peer
tutoring, they pointed out, can be used with an entire class (e.g., classwide peer tutoring),
limiting the amount of teacher time and resources needed. However, the researchers of
6 6
the work included in Elbaum et al’s meta-analysis did not directly compare effects of
small group instruction to 1:1 instruction in the same experimental design. The research
studies were reviewed separately and conclusions were drawn based on effect sizes, not
direct comparisons.
Thurlow, Ysseldyke, Wortuba, & Algozzine (1993) conducted a descriptive study
of small groups. She examined how eight variables were affected by different grouping
formats. For students in 1:1 tutoring, there were no differences in academic responding
time, academic engagement time, task management, or inappropriate behavior when
compared to students in 1:3 tutoring. However, as group size increased beyond three
students, 1:1 instruction was superior. An obvious inference is that students will perform
equally well in a group of three as in 1:1 tutoring. However, Thurlow, like Elbaum et al.
(1999), did not directly examine the differences in academic outcomes of students in
small groups versus individual tutoring.
Standardized Versus Individualize Instruction
Another major issue in increasing responsiveness to intervention is the extent to
which academic materials must be individualized for each student. Large-scale research
studies (e.g., Torgesen et al., 1999) typically implement comprehensive and standardized
tutoring packages that are, by definition, the same for all the participants. What is not
clear is the extent to which materials should be modified to meet the needs of individual
students. No studies could be found that directly examined this issue despite apparently
important implications. If standard and individualized approaches were found equally
effective, then the standard approach would probably be seen as more useful because it
7 7
would be easier to implement. That is, teachers and/or tutors could be trained on a set of
tutoring materials and they would implement these for all struggling readers.
Individualizing instruction, by contrast, requires extensive training in reading methods,
recognizing when progress is not being made, and modifying instruction in reasonable
ways. In addition, effective individualized tutoring depends a great deal on rigorous
training, professional experience, and clinical judgment. A standardized tutoring
program reduces the amount of training, experience, and judgment required to implement
the program.
Purpose
The purpose of this study was to involve second-graders unresponsive to
research-validated classroom instruction (i.e., Peer Assisted Learning Strategies; PALS)
in four treatments: one to one standardized, one to one individualized, one to three
standardized, and continuation in large-class PALS. The research questions were: (a)
Does individualizing tutoring promote greater reading growth than a standardized
approach? (b) Do students in standard 1:1 instruction show greater improvement than
those in small group standard instruction? Students’ reading ability in class-wide PALS
was monitored to identify those who were not responding to the PALS program.
Nonresponders were identified as dually (level and slope) discrepant. They were assigned
randomly to individualized 1:1 tutoring, standardized 1:1 tutoring, and standardized 1:3
tutoring. Or they were chosen randomly to remain in the PALS class-wide program.
Nonresponders were monitored weekly to determine which method of instruction
increased the reading performance. Thus this research explores the importance of group
8 8
size (1:1 versus 1:3) and standardized instruction versus individualized instruction in
terms of students’ reading growth.
Importance
Whereas teams of researchers have documented the efficacy of small group
instruction for students with disabilities (e.g., Elbaum et al., 1999; Moody et al., 1997),
there has not been experimental study of how well small groups work for students
unresponsive to research-based, generally effective instruction. In addition, there has
been no direct comparison between 1:1 tutoring and 1:3 tutoring. If small-group tutoring
is as effective as 1:1 tutoring, special education resources could potentially be used more
efficiently to support instruction in small groups. This study may also shed light on
whether individualized and standardized tutoring are equally effective for students who
are nonresponsive to classwide instruction. Standardized instruction requires much less
training, experience, and judgment thereby reducing costs for teacher training.
This study also incorporates several desirable methodological components.
Random assignment was used to place students in treatment groups. Treatments
represented practices validated as effective for many at-risk students. Fidelity of
treatment implementation was established for all study groups. Identification of
nonresponders was based on a dual discrepancy model (i.e., level and slope of reading
scores were taken into account). That is emerging as a valid index of nonresponsiveness
(e.g., Fuchs, Fuchs, & Compton, 2004).
9 9
CHAPTER II
LITERATURE REVIEW
This chapter reviews the literature in which researchers have compared different
grouping practices for students with and without disabilities to determine most effective
instructional arrangements. First, a rationale for the importance of this topic is provided.
Second, methods of the literature search will be defined. Finally, findings of the literature
search will be described, organized in terms of (a) meta-analyses and prior non-
quantitative reviews of the effects of 1:1 instruction, (b) meta-analyses and prior reviews
of small-group instruction, (c) meta-analyses and prior reviews of 1:1 versus small-group
instruction, and (d) studies in which researchers directly compared 1:1 and small- group
instruction. Finally, implications for future research are provided.
Rationale for the Importance of Research on Grouping Arrangements for Instruction
Determining the most effective interventions for students at risk of reading failure
and those with reading disabilities has constituted a large part of the research in the past
two decades. A systematic review of this literature by the National Reading Panel (1998)
highlighted the components of effective reading instruction. These components were
phonemic awareness, decoding, vocabulary, comprehension, and fluency instruction.
However, with the implementation of the policy of inclusion, many students with reading
disabilities are being served in the general education classroom. Classroom teachers must
10 10
meet the particular needs of all their students. The question becomes, what is the best
way to meet students’ needs who experience serious reading difficultie. Do students
require one to one instruction to be successful? Are small-group arrangements as
effective as 1:1 instruction? Are there classwide methods as effective as 1:1 instruction or
small-group instruction? These questions are very important because schools generally
have very limited resources, and they are understandably interested in identifying
effective instructional procedures that are also economical. In addition, as the nation
moves toward using Response-To-Instruction as the means of providing early
intervention and identifying students with learning disabilities, there is a need to
determine if Tier 2 intervention (i.e., group instruction) is differentially effective than
Tier 3 intervention (i.e., 1:1 instruction in special education).
Literature Search
Inclusion Criteria and Search Strategies
Published and unpublished scholarly articles were selected using four criteria.
First, the articles described interventions targeting reading skills. Second, study outcomes
included reading measures. Third, study participants were at-risk for reading disabilities
or had a documented reading disability. Fourth, the studies either reviewed the literature
on different grouping formats or directly compared small group versus one to one
instruction.
The literature search was conducted in the following way. The terms learning
disabilities, reading disabilities, intervention, treatment, remediation, instruction, small
11 11
group instruction, one to one instruction, and whole class instruction were entered into a
computer search using Educational Resources Information Center (ERIC) from 1966-
2004; Psych Lit from 1967-2004; and Exceptional Child Educational Resources (ECER)
from 1969-2004. Second, the abstracts produced by this search were reviewed to
determine which articles met the inclusion criteria. Third, articles were obtained and their
respective reference sections were examined for other articles that were likely to meet the
inclusion criteria. Finally, a manual search was conducted of the following journals from
January, 1980, to December, 2004: Journal of Educational Psychology, Journal of
Experimental Child Psychology, Journal of Learning Disabilities, Journal of Special
Education, Learning Disabilities Research and Practice, Reading Research Quarterly,
Remedial and Special Education, and Scientific Studies of Reading. If the title of an
article indicated that the study involved a reading intervention, the abstract was read to
determine its usefulness for this review. As a result of this entire search, 12 articles were
identified. These articles are signified by asterisks in the reference section.
Results
Meta-Analyses and Reviews of One-to-One Instruction
Table 1 provides methodological information for all meta-analyses and narrative
reviews of 1:1 instruction. Table 2 summarizes the relevant findings.
Elbaum, Vaughn, Hughes, Moody, & Schumm (2000) conducted a meta-analysis
to determine the effectiveness of 1:1 instruction for students at-risk of reading failure.
12 12
Thirty one studies were reviewed and analyzed to answer the following questions: (a)
how effective is 1:1 instruction for children at-risk of reading failure, (b) what features of
the intervention relate to intervention outcomes, (c) what research methodologies are
associated with intervention outcomes, (d) how does Reading Recovery compare to other
interventions, and (e) how does 1:1 instruction outcomes compare to small group
intervention outcomes? The first three questions are most relevant here. The last two
questions will be addressed later.
Elbaum et al. (2000) reviewed 31 studies which were published between 1975 and
1998. Participants were at-risk of reading failure or they had a diagnosed learning
disability. A majority of participants across the studies were first graders (N=1164).
There were 182 second and third graders, 130 fourth through sixth graders, and 63 first
through fourth graders. There were a total of 216 ES comparisons. ESs ranged from -1.32
to 3.34. The authors then looked at seven variables to determine what mediated the
instructional effectiveness. The variables included qualifications of instructors, tutor
training, students’ grade level, focus of intervention, outcome measures, intensity of the
intervention, and treatment fidelity. Results indicated that college students were the most
effective tutors (d = 1.65), followed by paraprofessionals (d = .68), teachers (d = .36),
and volunteers (d = .26). Tutors’ training was important. The ES for trained tutors was
.59; 0.17 for untrained tutors. ESs for studies with and without fidelity of treatment were
0.85 and .06, respectively.
Students in grades 1-3 made statistically significant gains in 1:1 instruction (d =
0.37 to 0.49), whereas those in grades 4-6 did not make reliable gains. Students in
interventions targeting reading comprehension had the greatest ES (d = 2.41), followed

13 13
Table 1 Methodological Information for Meta-Analyses and Narrative Reviews on 1:1 Instruction
Citation
Number of
studies
Grade level
Risk Status
Inclusion Criteria
Inter-rater
Agreement for Inclusion Criteria
Elbaum et al.
(2000) *
31
1-6
at risk and LD
1. published or available between 1975 and 1998
2. participants scored in lowest 20-30 percentile on reading tests or labeled LD
3. outcomes compared to comparable students who did not receive 1:1 instruction
4. outcome data could be converted to effect sizes
not reported
Wasik & Slavin (1993)
16
1
at risk
not reported
14 14
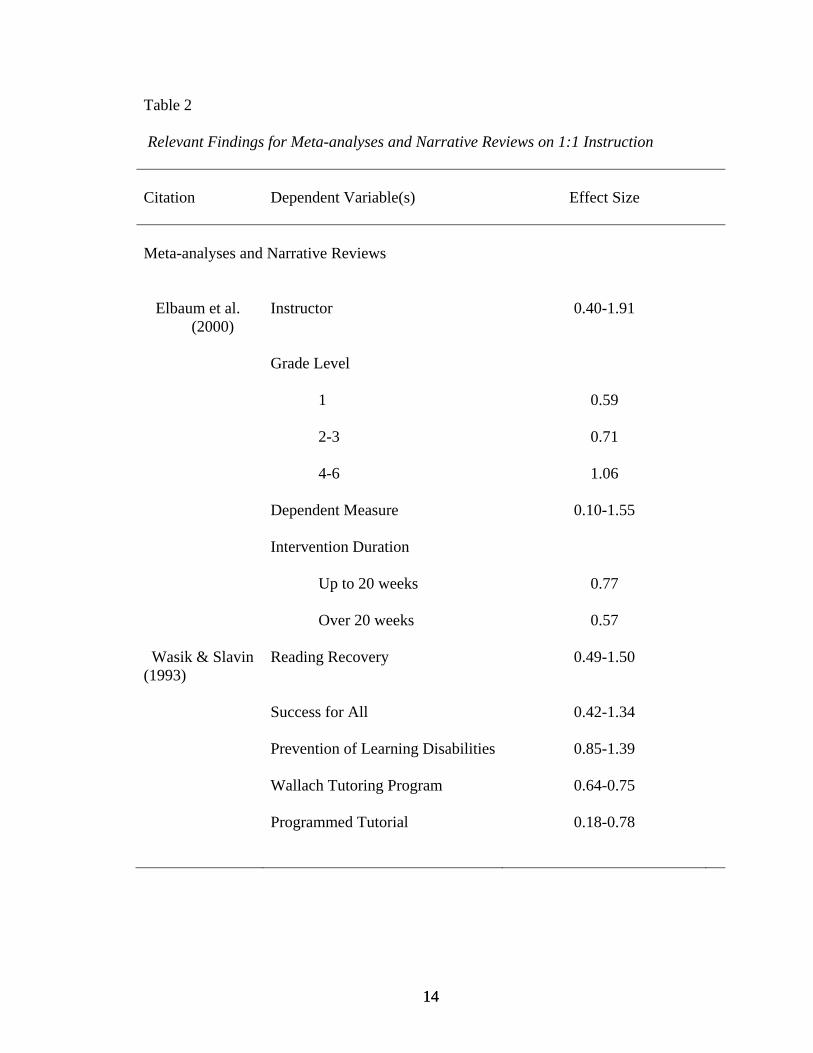
Table 2
Relevant Findings for Meta-analyses and Narrative Reviews on 1:1 Instruction
Citation
Dependent Variable(s)
Effect Size
Meta-analyses and Narrative Reviews
Elbaum et al.
(2000)
Instructor
0.40-1.91
Grade Level
1
0.59
2-3
0.71
4-6
1.06
Dependent Measure
0.10-1.55
Intervention Duration
Up to 20 weeks
0.77
Over 20 weeks
0.57
Wasik & Slavin (1993)
Reading Recovery
0.49-1.50
Success for All
0.42-1.34
Prevention of Learning Disabilities
0.85-1.39
Wallach Tutoring Program
0.64-0.75
Programmed Tutorial
0.18-0.78
15 15
by interventions that included both decoding and comprehension (d = .50), decoding and
word recognition (d = .44), and phonemic awareness intervention (d = 0.43).
Interventions focusing on visual perceptual skills were associated with statistically non-
significant ESs near zero. The outcome measures used in each study yielded the
following ESs: Writing vocabulary, .94; listening comprehension, .68; decoding, .41 to
.54; reading comprehension, .28; spelling, .14; and phonemic awareness, -.29.
Standardized tests yielded smaller ESs (d = .53) than did non-standardized measures (d =
.62). The average ES for interventions lasting up to 20 weeks was .65; whereas ES for
those with a duration greater than 20 weeks was .37. The authors found that the same
amount of instructional time delivered more intensively has more powerful effects.
In sum, Elbaum et al. (2000) found that college students were the most effective
tutors, trained tutors were more effective than untrained tutors, and implementing
interventions correctly is important. Younger students made more significant gains than
older students. Reading comprehension interventions were more effective than decoding
and word recognition interventions. And finally, non-standardized measures yielded
greater effect sizes than standardized measures.
Wasik and Slavin (1993) conducted a best evidence synthesis of five 1:1 reading
programs to determine their success in preventing early reading failure among graders.
The reading programs were Reading Recovery, Success for All, Prevention of Learning
Disabilities, Wallach Tutoring Program, and Programmed Tutorial Reading. Sixteen
studies met Wasik and Slavin’s inclusion criteria.
For Reading Recovery, the authors reviewed two longitudinal studies conducted
by the Ohio State group and two other primary studies. In the first longitudinal study,

16 16
Reading Recovery was compared to general education instruction or Title I pull out for
the lowest 20% of first graders in the schools. Students in the Reading Recovery group
outperformed those in Title I small groups and those in the general education classroom
on all measures except letter identification and word recognition. At the end of the year,
the ES was .72 which diminished at 1 year follow up (.29) and lessened further at 2 year
follow up (.14). In the second longitudinal study, students in Reading Recovery were
compared to those in the general education classroom. At the end of the implementation
year, the ES was .78 versus .46 at 1 year follow up and versus .25 at the 2 year follow up.
However, 27% of the students were still performing below average at the end of the two
year follow up. Moreover, these findings in favor of Reading Recovery should be taken
with a grain of salt because the measurements were text-level reading assessments that
directly correlated to what was taught in the reading program. In two other studies
conducted by the Ohio State group to evaluate Reading Recovery, similar results were
found. The ES at the end of the first year was .35 for dictation and .75 for text reading
level.
The second program reviewed by Wasik and Slavin (1993) was Success for All.
Like Reading Recovery, it focuses on teaching reading in context but also adds a word
attack component. Tutoring was continued as long as the student needed it: Some
students were tutored for 8 weeks; others for an entire year. This is different than Reading
Recovery in which students were discontinued after 60 lessons regardless of whether they
had made sufficient gains. Tutored students were in grades 1-3 and scored in the lowest
25% on the WRMT-R Letter-Word Identification and Word Attack subtest. The
comparison group came from a matched comparison school. The overall mean ES after
17 17
year 1 was 1.01 for the first graders. The measures were letter word identification, word
attack, oral reading and silent reading. The ES was 2.37 for year 2, .84 for year 3, and
1.83 for year 4. Similar results were found for students in grades 2 and 3.
The third program reviewed by Wasik and Slavin (1993) was the Prevention of
Learning Disabilities. It differs significantly from the previous two programs in that there
is very little reading for meaning. Students are taught word attack skills based on learning
letter sounds. However, there is also no systematic phonics instruction. Students in grades
1-3 received instruction for two years, 3 to 5 days a week, 30 minutes per day. ESs
indicated a significant increase in oral reading (d = .85), word identification (d = .94) and
word attack (d = 1.39) when compared to no treatment controls. However, ESs were
smaller when compared to other 1:1 treatment phonics-related programs.
The Wallach Tutoring Program was the fourth reviewed program. At-risk students
received tutoring for one full year, 30 minutes per day. The program is very similar to
Success for All in that it teaches reading in connected text as well as phonics rules.
However, paraprofessionals are tutors instead of trained teachers. In two research studies,
moderate to large ESs were obtained for children in the tutoring groups compared to no
treatment controls. In the first study (Wallach & Wallach, 1976), ESs were .64 for word
recognition, .66 for consonant sounds test. In the second study (Dorval, Wallach, &
Wallach, 1978), ESs were .75 for a group administered test of reading skills including
word identification, passage comprehension, and word analysis.
The final tutoring program reviewed by Wasik and Slavin (1993) was the
Programmed Tutorial Reading. It is a supplement to the general education curriculum and
is administered by parents, paraprofessionals, or volunteers. Its primary goal is sight
18 18
word identification, not reading in text or learning phonics rules. Across three studies,
(Ellson, Barber, Engle, & Kampwerth, 1965; Ellson, Harris, & Barber, 1968; McCleary,
1971) there were no effects on the Stanford Achievement Tests.
Summary of 1:1 Tutoring Reviews
1:1 tutoring programs are effective for at-risk students. Elbaum et al. (2000)
determined that trained tutors were much more effective than untrained tutors, younger
children made more impressive gains than students in grades 4-6, and more intensive
intervention was more important than amount of instructional time. Wasik and Slavin
(1993) reviewed five 1:1 programs. They found that in four of the five programs, tutored
students made more gains than those who stayed in the general education classroom or
were pulled out for Title I instruction. Wasik and Slavin also found that one year of
intervention may not be sufficient for all students. Ongoing programs are the best way to
reduce the number of children who are at risk for reading failure.
Meta-analyses and Reviews of Small-Group Instruction
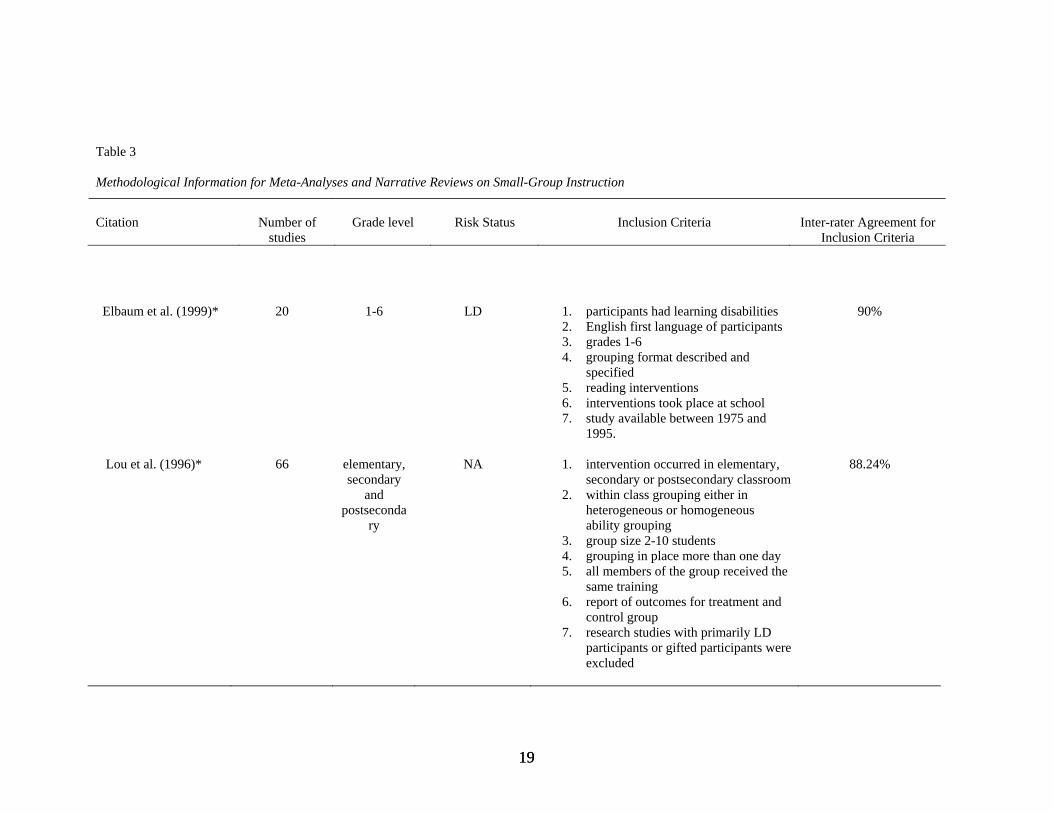
Table 3 provides methodological information for meta-analyses and narrative
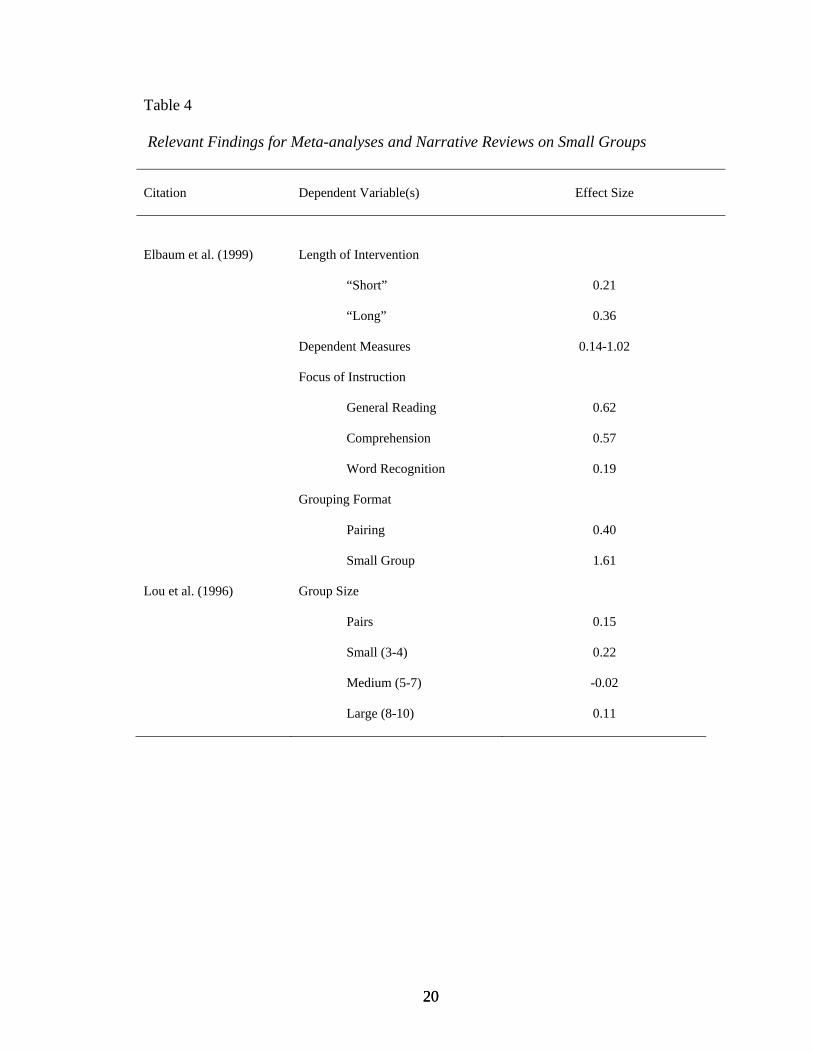
reviews of small-group instruction. Table 4 summarizes the relevant findings.
Lou et al. (1996) conducted a meta-analysis to determine the effects of different
classroom grouping formats on the reading outcomes of students in elementary,
secondary, and postsecondary settings. Sixty-six studies were reviewed. For the first
analysis, grouping students in the classroom was compared to whole class instruction.
The ES for those in small groups was .17 for achievement measures, a statistically
19 19
Table 3 Methodological Information for Meta-Analyses and Narrative Reviews on Small-Group Instruction
Citation
Number of
studies
Grade level
Risk Status
Inclusion Criteria
Inter-rater Agreement for
Inclusion Criteria
Elbaum et al. (1999)*
20
1-6
LD
1. participants had learning disabilities 2. English first language of participants 3. grades 1-6 4. grouping format described and
specified 5. reading interventions 6. interventions took place at school 7. study available between 1975 and
1995.
90%
Lou et al. (1996)*
66
elementary, secondary
and postseconda
ry
NA
1. intervention occurred in elementary,
secondary or postsecondary classroom 2. within class grouping either in
heterogeneous or homogeneous ability grouping
3. group size 2-10 students 4. grouping in place more than one day 5. all members of the group received the
same training 6. report of outcomes for treatment and
control group 7. research studies with primarily LD
participants or gifted participants were excluded
88.24%
20 20
Table 4
Relevant Findings for Meta-analyses and Narrative Reviews on Small Groups
Citation
Dependent Variable(s)
Effect Size
Elbaum et al. (1999)
Length of Intervention
“Short”
0.21
“Long”
0.36
Dependent Measures
0.14-1.02
Focus of Instruction
General Reading
0.62
Comprehension
0.57
Word Recognition
0.19
Grouping Format
Pairing
0.40
Small Group
1.61
Lou et al. (1996)
Group Size
Pairs
0.15
Small (3-4)
0.22
Medium (5-7)
-0.02
Large (8-10)
0.11
21 21
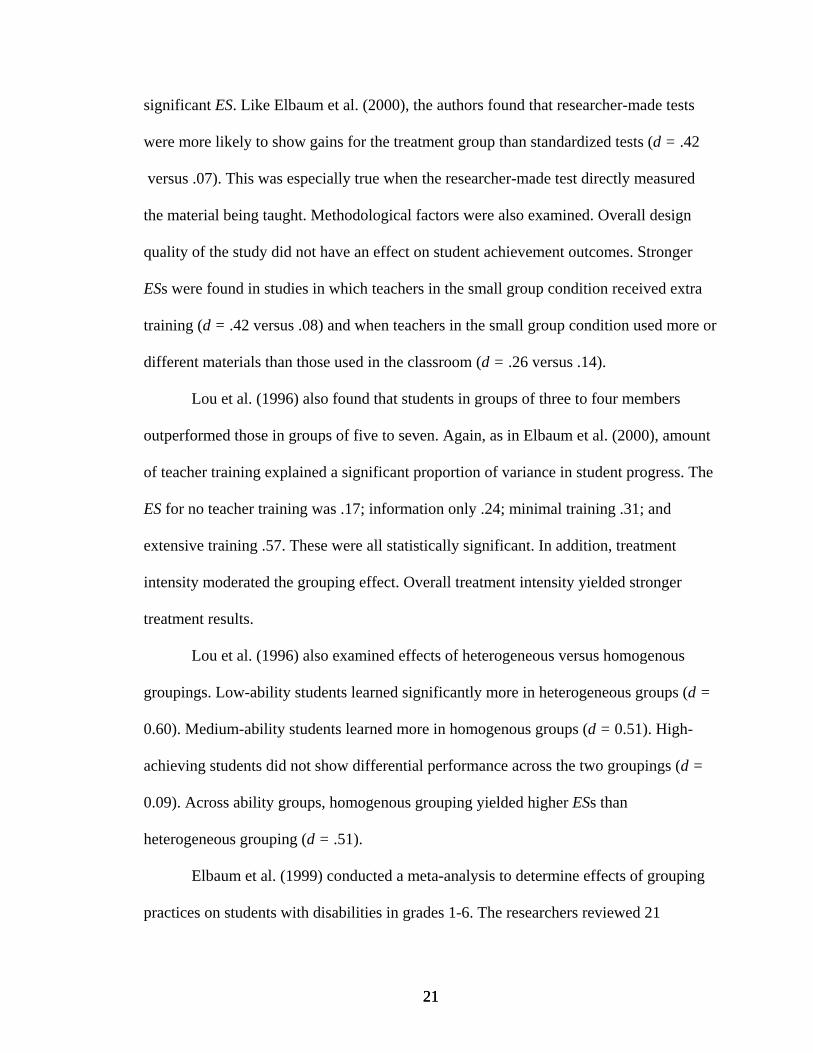
significant ES. Like Elbaum et al. (2000), the authors found that researcher-made tests
were more likely to show gains for the treatment group than standardized tests (d = .42
versus .07). This was especially true when the researcher-made test directly measured
the material being taught. Methodological factors were also examined. Overall design
quality of the study did not have an effect on student achievement outcomes. Stronger
ESs were found in studies in which teachers in the small group condition received extra
training (d = .42 versus .08) and when teachers in the small group condition used more or
different materials than those used in the classroom (d = .26 versus .14).
Lou et al. (1996) also found that students in groups of three to four members
outperformed those in groups of five to seven. Again, as in Elbaum et al. (2000), amount
of teacher training explained a significant proportion of variance in student progress. The
ES for no teacher training was .17; information only .24; minimal training .31; and
extensive training .57. These were all statistically significant. In addition, treatment
intensity moderated the grouping effect. Overall treatment intensity yielded stronger
treatment results.
Lou et al. (1996) also examined effects of heterogeneous versus homogenous
groupings. Low-ability students learned significantly more in heterogeneous groups (d =
0.60). Medium-ability students learned more in homogenous groups (d = 0.51). High-
achieving students did not show differential performance across the two groupings (d =
0.09). Across ability groups, homogenous grouping yielded higher ESs than
heterogeneous grouping (d = .51).
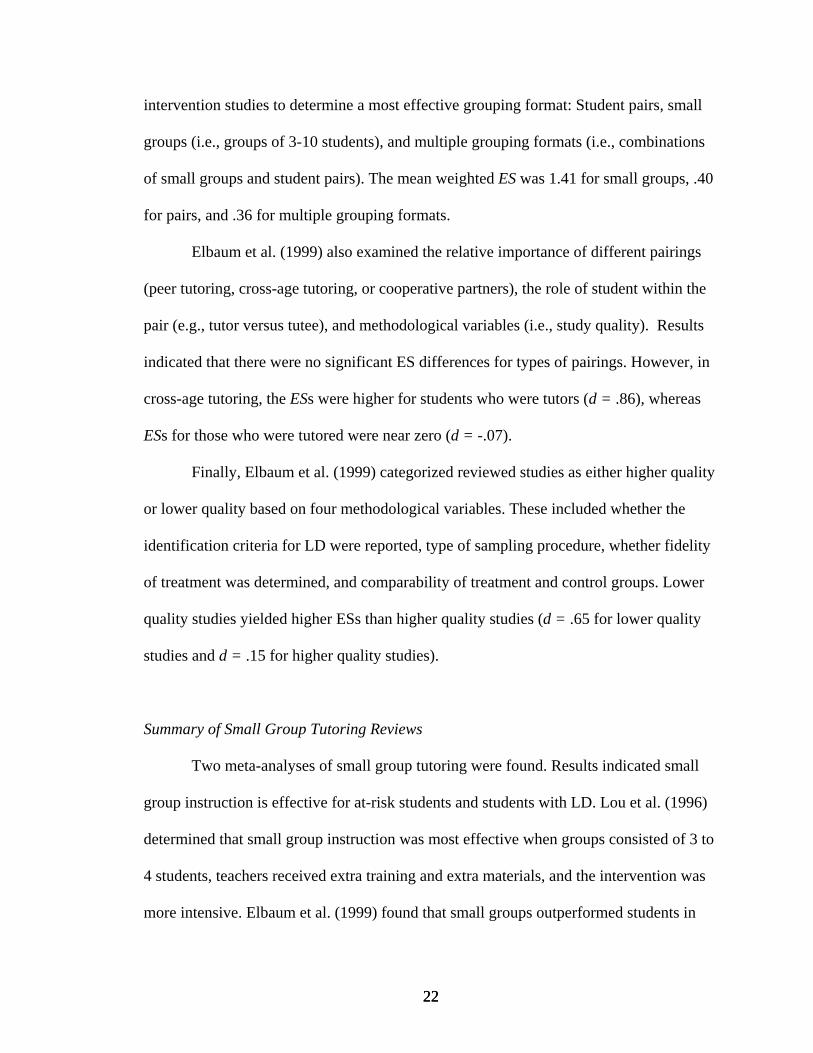
Elbaum et al. (1999) conducted a meta-analysis to determine effects of grouping
practices on students with disabilities in grades 1-6. The researchers reviewed 21
22 22
intervention studies to determine a most effective grouping format: Student pairs, small
groups (i.e., groups of 3-10 students), and multiple grouping formats (i.e., combinations
of small groups and student pairs). The mean weighted ES was 1.41 for small groups, .40
for pairs, and .36 for multiple grouping formats.
Elbaum et al. (1999) also examined the relative importance of different pairings
(peer tutoring, cross-age tutoring, or cooperative partners), the role of student within the
pair (e.g., tutor versus tutee), and methodological variables (i.e., study quality). Results
indicated that there were no significant ES differences for types of pairings. However, in
cross-age tutoring, the ESs were higher for students who were tutors (d = .86), whereas
ESs for those who were tutored were near zero (d = -.07).
Finally, Elbaum et al. (1999) categorized reviewed studies as either higher quality
or lower quality based on four methodological variables. These included whether the
identification criteria for LD were reported, type of sampling procedure, whether fidelity
of treatment was determined, and comparability of treatment and control groups. Lower
quality studies yielded higher ESs than higher quality studies (d = .65 for lower quality
studies and d = .15 for higher quality studies).
Summary of Small Group Tutoring Reviews
Two meta-analyses of small group tutoring were found. Results indicated small
group instruction is effective for at-risk students and students with LD. Lou et al. (1996)
determined that small group instruction was most effective when groups consisted of 3 to
4 students, teachers received extra training and extra materials, and the intervention was
more intensive. Elbaum et al. (1999) found that small groups outperformed students in
23 23
whole classroom instruction by 1.5 standard deviations while those in student pairs only
outperformed those in whole classroom instruction by 0.4 standard deviations. These
reviews indicate small group instruction is an effective means of intervening with many
poor readers. In some cases, it may be more effective than student pairs especially when
the groups are composed of 5 or fewer students.
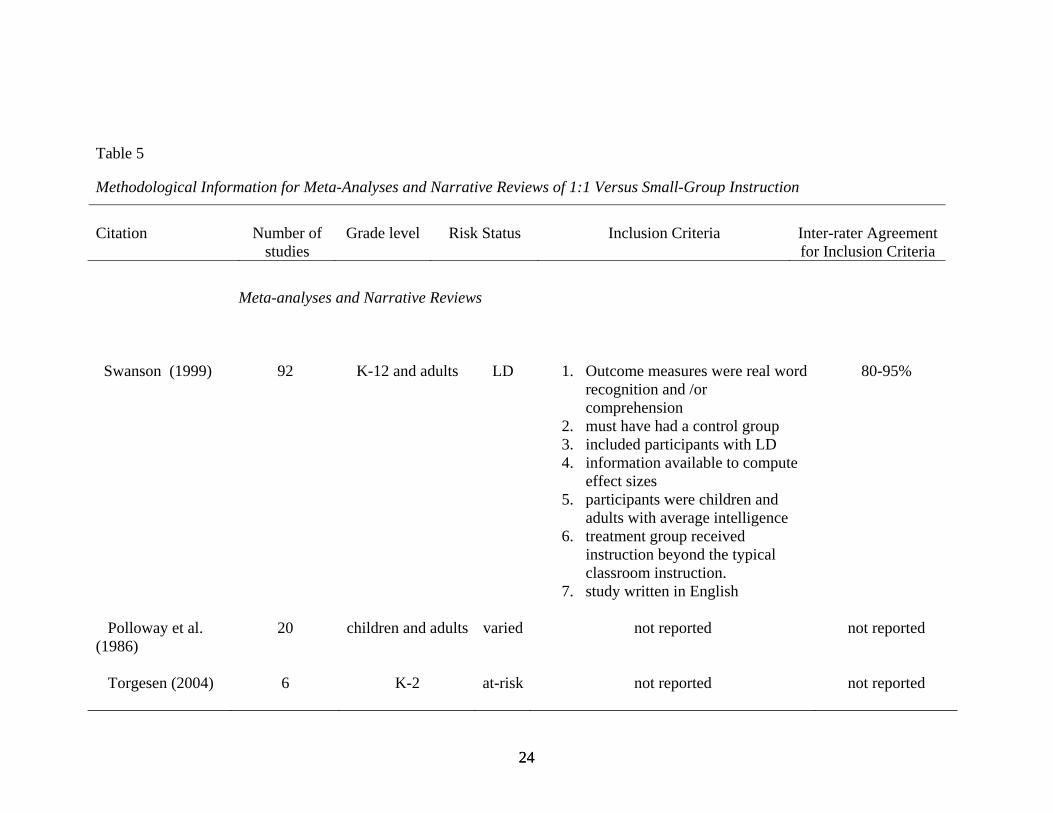
Meta-Analyses and Reviews of 1:1 Versus Small-Group Instruction
Table 5 provides methodological information for the meta-analyses and narrative
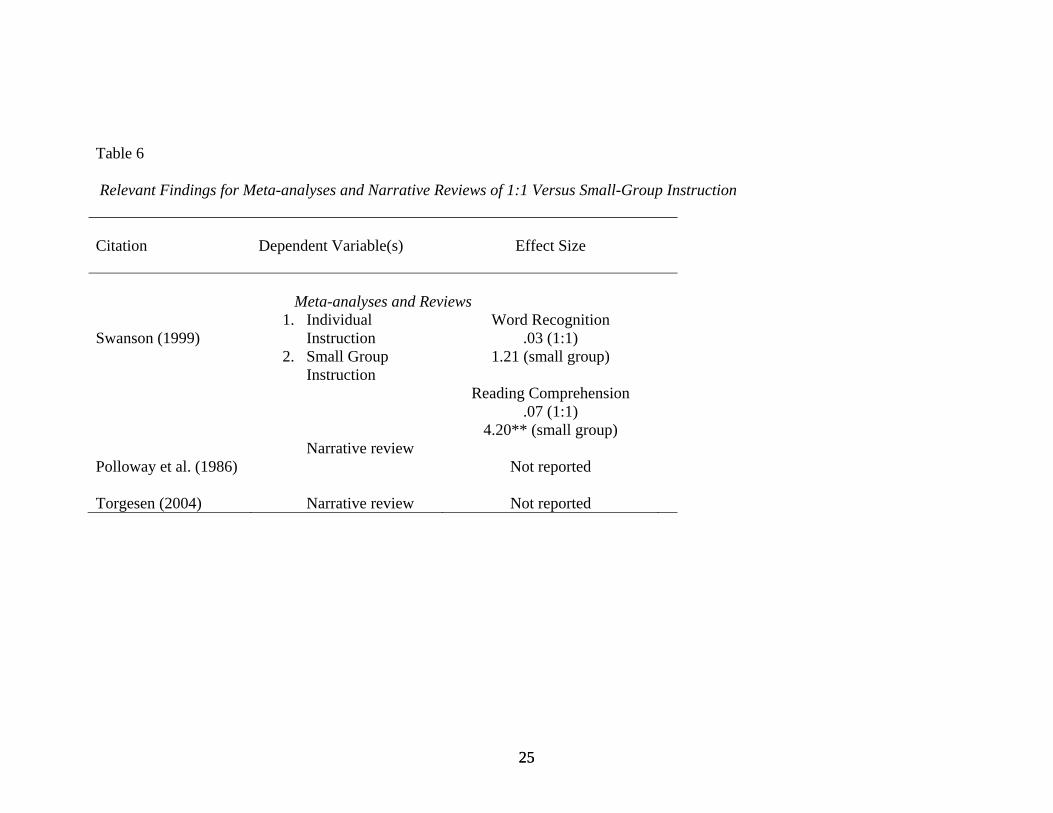
reviews of 1:1 versus small-group instruction. Table 6 summarizes the relevant findings.
A meta-analysis was found comparing individual versus small group instruction.
Two additional reviews examined this contrast, but without reporting of ESs.
Swanson (1999) conducted a meta-analysis to answer several important questions.
For this chapter, the pertinent question he explored was whether certain models of
instruction are broadly effective across word recognition and reading comprehension or
whether effects of the models are domain specific. Swanson reviewed 92 studies. All
included a measure of real-word recognition and/or reading comprehension and a control
group or within design. Participants in the studies were LD. They all scored above a
standard score of 84 on an intelligence test, the treatment groups received instruction
above and beyond the typical classroom instruction, the studies were written in English,
and ESs could be derived from each.
Swanson (1999) used exploratory analyses to determine whether group size
significantly predicted word recognition and reading comprehension scores. Results of a
hierarchical regression indicated that adding small group and individual instruction into
24 24
Table 5 Methodological Information for Meta-Analyses and Narrative Reviews of 1:1 Versus Small-Group Instruction
Citation
Number of
studies
Grade level
Risk Status
Inclusion Criteria
Inter-rater Agreement for Inclusion Criteria
Meta-analyses and Narrative Reviews
Swanson (1999)
92
K-12 and adults
LD
1. Outcome measures were real word
recognition and /or comprehension
2. must have had a control group 3. included participants with LD 4. information available to compute
effect sizes 5. participants were children and
adults with average intelligence 6. treatment group received
instruction beyond the typical classroom instruction.
7. study written in English
80-95%
Polloway et al. (1986)
20
children and adults
varied
not reported
not reported
Torgesen (2004)
6
K-2
at-risk
not reported
not reported
25 25
Table 6
Relevant Findings for Meta-analyses and Narrative Reviews of 1:1 Versus Small-Group Instruction
Citation
Dependent Variable(s)
Effect Size
Meta-analyses and Reviews
Swanson (1999)
1. Individual Instruction
2. Small Group Instruction
Word Recognition .03 (1:1)
1.21 (small group)
Reading Comprehension .07 (1:1)
4.20** (small group)
Polloway et al. (1986)
Narrative review Not reported
Torgesen (2004)
Narrative review
Not reported
26 26
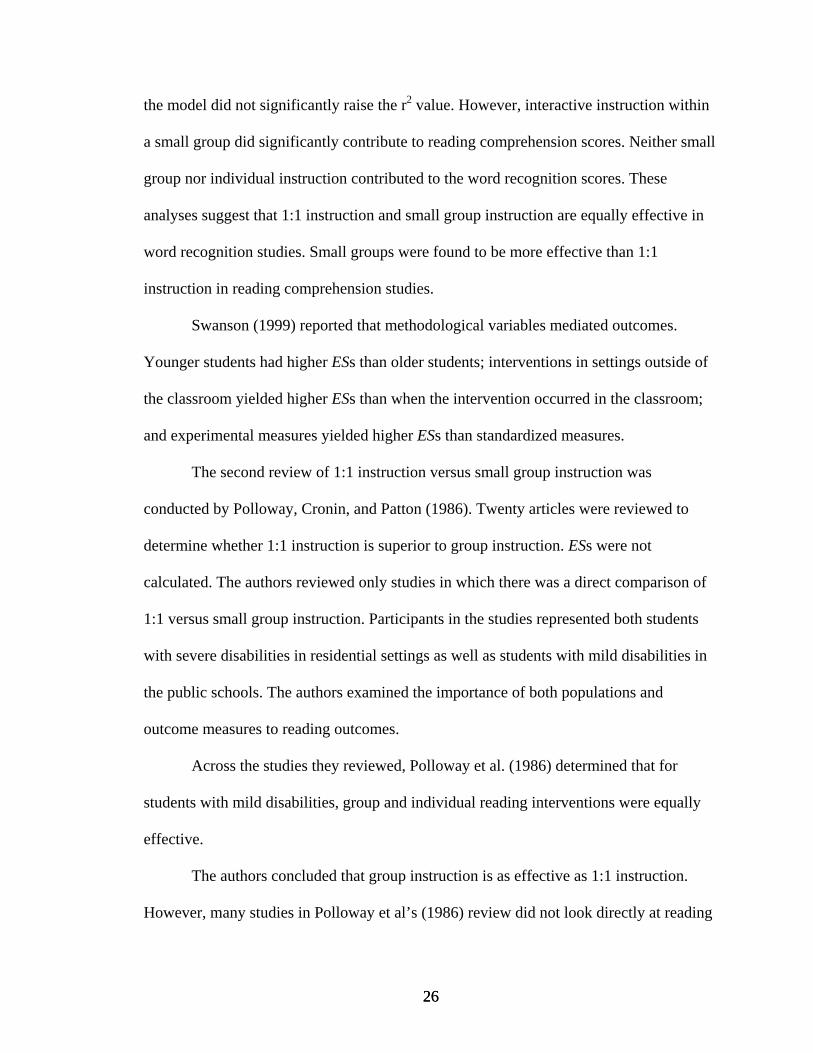
the model did not significantly raise the r2 value. However, interactive instruction within
a small group did significantly contribute to reading comprehension scores. Neither small
group nor individual instruction contributed to the word recognition scores. These
analyses suggest that 1:1 instruction and small group instruction are equally effective in
word recognition studies. Small groups were found to be more effective than 1:1
instruction in reading comprehension studies.
Swanson (1999) reported that methodological variables mediated outcomes.
Younger students had higher ESs than older students; interventions in settings outside of
the classroom yielded higher ESs than when the intervention occurred in the classroom;
and experimental measures yielded higher ESs than standardized measures.
The second review of 1:1 instruction versus small group instruction was
conducted by Polloway, Cronin, and Patton (1986). Twenty articles were reviewed to
determine whether 1:1 instruction is superior to group instruction. ESs were not
calculated. The authors reviewed only studies in which there was a direct comparison of
1:1 versus small group instruction. Participants in the studies represented both students
with severe disabilities in residential settings as well as students with mild disabilities in
the public schools. The authors examined the importance of both populations and
outcome measures to reading outcomes.
Across the studies they reviewed, Polloway et al. (1986) determined that for
students with mild disabilities, group and individual reading interventions were equally
effective.
The authors concluded that group instruction is as effective as 1:1 instruction.
However, many studies in Polloway et al’s (1986) review did not look directly at reading
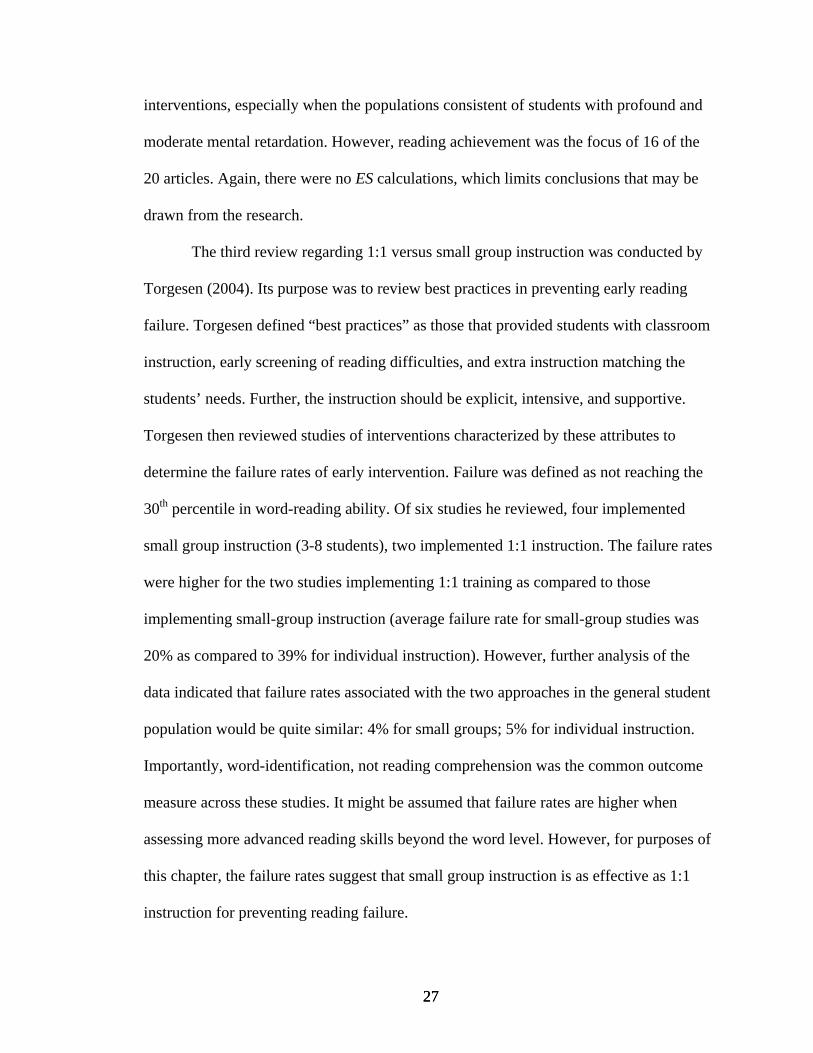
27 27
interventions, especially when the populations consistent of students with profound and
moderate mental retardation. However, reading achievement was the focus of 16 of the
20 articles. Again, there were no ES calculations, which limits conclusions that may be
drawn from the research.
The third review regarding 1:1 versus small group instruction was conducted by
Torgesen (2004). Its purpose was to review best practices in preventing early reading
failure. Torgesen defined “best practices” as those that provided students with classroom
instruction, early screening of reading difficulties, and extra instruction matching the
students’ needs. Further, the instruction should be explicit, intensive, and supportive.
Torgesen then reviewed studies of interventions characterized by these attributes to
determine the failure rates of early intervention. Failure was defined as not reaching the
30th percentile in word-reading ability. Of six studies he reviewed, four implemented
small group instruction (3-8 students), two implemented 1:1 instruction. The failure rates
were higher for the two studies implementing 1:1 training as compared to those
implementing small-group instruction (average failure rate for small-group studies was
20% as compared to 39% for individual instruction). However, further analysis of the
data indicated that failure rates associated with the two approaches in the general student
population would be quite similar: 4% for small groups; 5% for individual instruction.
Importantly, word-identification, not reading comprehension was the common outcome
measure across these studies. It might be assumed that failure rates are higher when
assessing more advanced reading skills beyond the word level. However, for purposes of
this chapter, the failure rates suggest that small group instruction is as effective as 1:1
instruction for preventing reading failure.
28 28
Summary of Meta-Analyses and Reviews of 1:1 Versus Small-Group Instruction
The one meta-analysis comparing small-group and 1:1 instruction (Swanson,
1999) indicated that small-group instruction was just as effective as 1:1 instruction in
producing gains in word recognition and reading comprehension when the intervention
focused on word recognition. However, small groups were more effective in advancing
reading comprehension. Polloway et al. (1986) reviewed 20 studies and determined that
small groups were as effective as 1:1 instruction for students with moderate mental
retardation and students with mild disabilities such as LD. However, for students with
profound mental retardation, group instruction was more effective. Torgesen (2004)
found a similar pattern. That is, small-group instruction was just as effective as 1:1
instruction.
Direct Comparison of Small Group and 1:1 Instruction
Baker et al. (1990) examined the effectiveness of 1:1 tutoring versus 1:3 tutoring.
Six students with LD were chosen to participate in the study. All six students were males
in the fifth grade. They were placed into two groups of 3 students. Two teachers were
randomly assigned to each of the groups. The students were instructed using the SRA
Spelling Mastery program and the SRA Fractions program which were designed for use
with small groups. The programs were altered by the authors to make the wording more
consistent with a 1:1 format. The programs were implemented 1 hour each day for 4
weeks. One of the groups received group instruction while the second group was
instructed one-on-one for 20 minutes. During the 1:1 condition, the other two students in
29 29
the group were provided with worksheets from the classroom that were not part of the
SRA programs.
The following data were collected: the number of minutes required to reach
mastery on each task in the program and the amount of time students were actively
engaged in their work. Students in the 1:3 spelling instructional group required a mean of
570 minutes for mastery, whereas those in the 1:1 condition required 324.7 minutes.
Students in the 1:3 fractions instructional group required an average of 253.3 minutes to
mastery while students in the 1:1 condition required 201.8 minutes.
Results indicated that the students in the 1:1 condition learned at a faster rate than
those in the 1:3 condition. However, further analyses indicated that the amount of teacher
time required was much greater for the 1:1 condition because teachers worked with each
child individually. For fractions, total instructional time for the 1:1 session was 605
minutes while the same instruction for the one-to three session was 247.5 minutes. For
spelling, the total instructional time was 598 minutes versus 244 minutes. So, even
though students learned at a quicker pace, the amount of instructional time needed was
much greater for the 1:1 condition. There were no differences between time on-task for
the 1:1 and 1:3 conditions.
Schumm et al. (2000) conducted two studies to determine teachers’ perceptions
and practices of grouping and the effects of teachers’ grouping practices on students’
attitude, academic progress and social progress. For Study 1, 29 third grade teachers were
interviewed and observed to determine their practices and attitudes about grouping in
their classroom. Results indicated that teachers most use whole class instruction followed
by individual activities, group activities and then student pairs. Of the 29 teachers, only 3
30 30
used same-ability grouping in their classroom. Four used mixed-ability grouping.
Overall, teachers did not differentiate instruction for children but generally used the same
method regardless of individual student’s ability.
Schumm et al.’s second study (2000) was conducted to determine the effects of
whole class grouping practices on high, average, and low achieving students educational
and social progress. Twenty-one teachers from Study 1 were asked to choose two
students for the following categories: high achieving (HA), average achieving (AA), low
achieving (LA), and learning disabled (LD). One hundred and forty seven students were
given the following measures: The decoding and comprehension subtests of the
Kaufman Test of Educational Achievement, the Piers-Harris Children’s Concept Scale,
and the Elementary Reading Attitude Survey. For the reading measures, students in the
HA group progressed the most from Fall to Spring. Those in the AA group made
significant progress in decoding but not in comprehension. Those in the LA and LD
group made no significant progress the entire year. For self-concept, there were no
significant changes for any of the groups. The students’ scores on the reading attitude
measure were combined for all 4 groups. The students’ attitudes about reading declined
significantly over the school year.
In sum, Schumm et al. (2000) found that third grade teachers most often used
whole class instruction in the classroom. High achieving students progressed in decoding
and comprehension significantly while average achievers only progressed in decoding.
Whole-class instruction was not effective for students with learning disabilities and those
labeled as low achievers.
31 31
Thurlow et al. (1993) examined the effects of group size on the academic
achievement of 139 students in grades 1 through 6 who were diagnosed with LD (n=114),
EBD (n=19), or MR (n=6). All students were receiving special education services in 27
different schools with 54 different teachers. Trained observers used The Code for
Instructional Structure and Student Academic Response (CISSAR). Eight composite
variables were observed. These were academic activity, nonacademic activity, paper
tasks, teacher tasks, academic engaged time, active responding time, task management
time, and inappropriate response time. Five different grouping structures were used: 1:1,
1:3, 1:6, 1:9, and 1:12 in the special education classrooms.
Results indicated that students in the 1:1 and 1:3 conditions gave more academic
responses than those in larger groups. In addition, students in the 1:1 group were more
engaged than students in larger groups. Teachers spent significantly less time in task
management in the 1:1 groups. Inappropriate behaviors were highest in the 1:12 group.
Hence, smaller student-teacher ratios were important in terms of time spent on task,
teacher management of students and student behavior. However, this study did not
examine the effects of these variables on student achievement.
The final direct comparison of 1:1 versus small group instruction was submitted
for publication in 2001. However, a published version of the paper could not be found.
Hence, this research study will be referred to as “Anonymous” (2001). Three different
grouping formats were examined: 1:1, 1:3, and 1:10. Participants were 77 second graders
who were struggling with reading. Among these students, 74% were English Language
Learners of Hispanic origin. The students were in 10 different schools and all students
were nominated by their teachers as struggling readers and had failed the second grade
32 32
state level screening. Students were assigned to groups based on the DIBELS phoneme
segmentation task. Based on their scores, students were given a rating of high, medium
and low. Equal distributions of high, medium, and low rated students were assigned to
1:1, 1:3, or 1:10 conditions.
Students were assessed before and after treatment and then 5 weeks after
intervention on the WRMT-R Word Attack and Passage Comprehension, the Test of
Reading Fluency (TORF), and DIBELS phoneme segmentation and nonsense word
reading. The intervention focused on five areas: fluency building, phonological
awareness, vocabulary, comprehension strategies, and word analysis. Students were
tutored for 30 minutes each day for 13 weeks.
Students in the 1:1 and 1:3 condition outperformed students in the 1:10 condition
in passage comprehension. For phoneme segmentation and reading fluency, the 1:1 group
outperformed the 1:10 condition. There were no differences between 1:3 and 1:1 or 1:3
and 1:10. There were no differences between the groups on word attack performance.
Generally, as in the Thurlow et al. (1993) study, smaller groups were generally more
effective than larger groups. However, 1:1 was not superior to 1:3 indicating that 1:3 is
just as effective for academic outcomes and student engagement.
Summary of 1:1 Versus Small Group Instruction
Four studies directly compared 1:1 instruction with group instruction.
Overwhelmingly, small groups of 3 to 5 students were found to be as effective as
individual instruction for students struggling with reading skills. Baker (1990) found that
students mastered fractions concepts and spelling faster when taught individually.
33 33
However, the amount of teacher time required was much greater for 1:1 instruction.
Schumm et al. (2000) compared high, middle, and low achievers, as well as those with
LD, in academic achievement, reading attitudes, and self-concept when instructed in a
large group format. Their results indicated that whole-group instruction was only
effective for the high and average achievers for reading progress and reading attitudes.
Low-achievers and those with LD need more intensive instruction than is provided in the
general education classroom. Thurlow (1993) examined classroom environment variables
that affected achievement in different group structures. Their results indicated that
students in 1:1 and 1:3 instruction gave more academic responses than those in 1:6, 1:9,
or 1:12 groups. In addition, students in the 1:12 instruction exhibited the most
problematic behaviors during instruction. Of the four studies found, “Anonymous”
(2001) was the only primary study that compared pre and posttest scores on academic
measures using group size as the independent variable. Anonymous’ results indicated that
1:1 and 1:3 instruction was more effective than 1:10 instruction in the areas of phoneme
segmentation, reading fluency, and decoding.
Implications for Future Research
The results of this review indicate that small group instruction is effective for
teaching reading skills. There are several research questions that have not been answered
in this review. First, how effective is 1:1 versus 1:3 instruction when compared to
research-based classroom instruction? Much of the research on group size compares one
to one versus small group instruction but the comparison group is often a no-treatment
control. Second, does intervention have to be individualized for every student or can
34 34
school personnel implement a standardized approach? These questions are very important
as we move to a response to intervention model of special education placement
procedure. With new criteria, programs such as PALS are to be implemented in the
general education classroom. It is important to examine the effect of tutoring programs on
students reading skills that aren’t making progress in the classroom. Second, what are the
characteristics of a good reading program. While the National Reading Panel identified
the five necessary building blocks of teaching reading, there is still not hard evidence on
the effects of individualizing for every student. A standardized approach is much easier
implemented in that it requires much less training and clinical judgment by those
implementing the intervention (i.e., teachers in the schools). The present study was
designed to specifically address these questions in a careful, systematic way.
35 35
CHAPTER III
METHODS
Participants
This study was part of a larger study of the effects of PALS (see Fuchs et al.,
2001; Mathes et al., 1998) on the reading performance of second-grade students. PALS is
a class-wide reading approach in which students work cooperatively in pairs. Students
learn and review sounds, practice decoding and blending decodable words, read sight
words, and read controlled and uncontrolled text. Each participant had received about 17
hours of class-wide PALS during fall semester of second grade. Forty classrooms in the
larger study were assigned randomly to one of three treatments: PALS, PALS + Fluency,
or PALS + Comprehension. There were 10 classrooms in each condition. Another 10
classrooms served as controls. Controls did not participate in this study. We directed our
intervention to the second-grade children who failed to respond to the class-wide PALS
program during fall semester. Students were identified as nonresponders in stages. First,
students were identified as at-risk for reading failure. Second, at-risk students were
monitored from October until December. Third, students were identified as
nonresponders based on the monitoring data. These stages are described below.
Identification of the risk pool. At the beginning of the school year, four to eight of
the lowest performing children were identified as at-risk for reading problems from each
of 30 treatment classrooms in the larger PALS study. Teachers were given a rank-ordered
list of their students’ performance on the Word Identification subtest of the Woodcock
36 36
Reading Mastery Test-Revised (WRMT-R; Woodcock, 1987). Teachers were then asked
to designate 4 high achievers, 4 average achievers, and 8 low achievers. Some teachers
did not have enough students to designate 8 low achievers. As a result, across the 30
classes, 214 students were considered “at risk” for nonresponiveness to the PALS
program.
Monitoring progress of the risk pool. Research assistants (RAs) in the PALS
study monitored students using curriculum based measurement reading passages (CBM;
Fuchs, Hamlett, & Fuchs, 1990) and PALS chapter tests once every week for 5 weeks.
The PALS chapter tests were created to directly measure whether sounds and words had
been learned. The chapter tests had the same format as the PALS lesson. The CBM
reading passages were written at the second grade level. Students were asked to read two
passages each for one minute. Performance on the chapter tests was expressed as a
percent correct; performance on the CBM passages was expressed as the number of
words read correctly in one minute.
Identification of nonresponders. In December, the monitoring data were analyzed
to determine which from the at risk pool had not responded to the PALS program. First,
level and slope calculations were calculated on the CBM passages. The level was the
mean of the students’ last two monitoring scores (i.e., words correct per minute; wcpm).
A linear regression between wcpm and monitoring sessions was used to calculate the
slope. The level and slope needed to reach 75 wcpm by the end of second grade was then
computed for each student. This is considered a minimum level of reading competence
for second grade (Fuchs & Deno, 1992; Fuchs, Fuchs, Hamlett, Walz, & Germann, 1993;
Hasbrouck & Tindal, 1992; Hosp & Fuchs, 2001; Marston & Mangnusson, 1988). A
37 37
proportion was then calculated that reflected the students’ actual slope in comparison to
their required slope to reach 75 wcpm by year’s end. I identified students whose slopes
were less than 35% of that needed to reach 75 wcpm at the end of treatment.
Next, percentages were calculated for each child on the last PALS chapter test
administered. I identified all students who had scores of less than 90%. Students were
identified as nonresponders if they met two criteria: (1) their actual slope was less than
35% of the slope needed to reach 75 wcpm, and (2) their percentage correct on the last
PALS chapter test administered to them was less than 90. On these bases, 65 students
were identified as unresponsive to the PALS program. One student moved before
assignment to groups occurred, leaving 64 students for assignment to one of four tutoring
conditions.
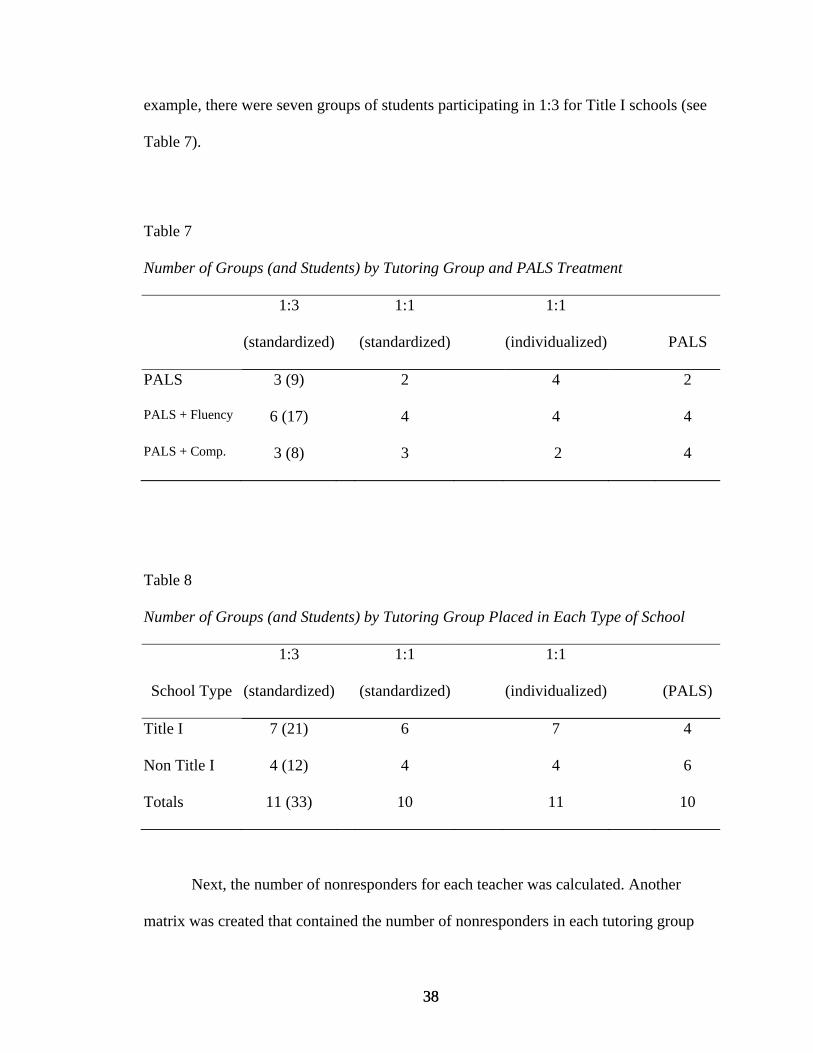
Assignment to Tutoring Group. The 64 students were assigned randomly to: (1)
remain in PALS, (2) standardized 1:1 tutoring, (3) standardized 1:3 tutoring, or (4)
individualized 1:1 tutoring. The number of students from each PALS treatment (i.e.,
PALS only, PALS + Comprehension, PALS + Fluency) that was assigned to tutoring
groups can be found in Table 3.2. Assignment to tutoring groups was accomplished in a
three-step process. First, a matrix was created that contained the total number of students
in Title I and non-Title I schools who had been identified as nonresponders. I attempted
to place an equal number of students in each tutoring group based on the type of school.
Table 8 lists the number of students placed in each tutoring group by type of school.
Because tutoring group was used as the unit of analyses, rather than individual students,
the total number of students placed in the 1:3 condition is in parentheses. So, for
38 38
example, there were seven groups of students participating in 1:3 for Title I schools (see
Table 7).
Table 7
Number of Groups (and Students) by Tutoring Group and PALS Treatment
1:3 1:1 1:1
(standardized) (standardized) (individualized) PALS
PALS 3 (9) 2 4 2
PALS + Fluency 6 (17) 4 4 4
PALS + Comp. 3 (8) 3 2 4
Table 8
Number of Groups (and Students) by Tutoring Group Placed in Each Type of School
1:3 1:1 1:1
School Type (standardized) (standardized) (individualized) (PALS)
Title I 7 (21) 6 7 4
Non Title I 4 (12) 4 4 6
Totals 11 (33) 10 11 10
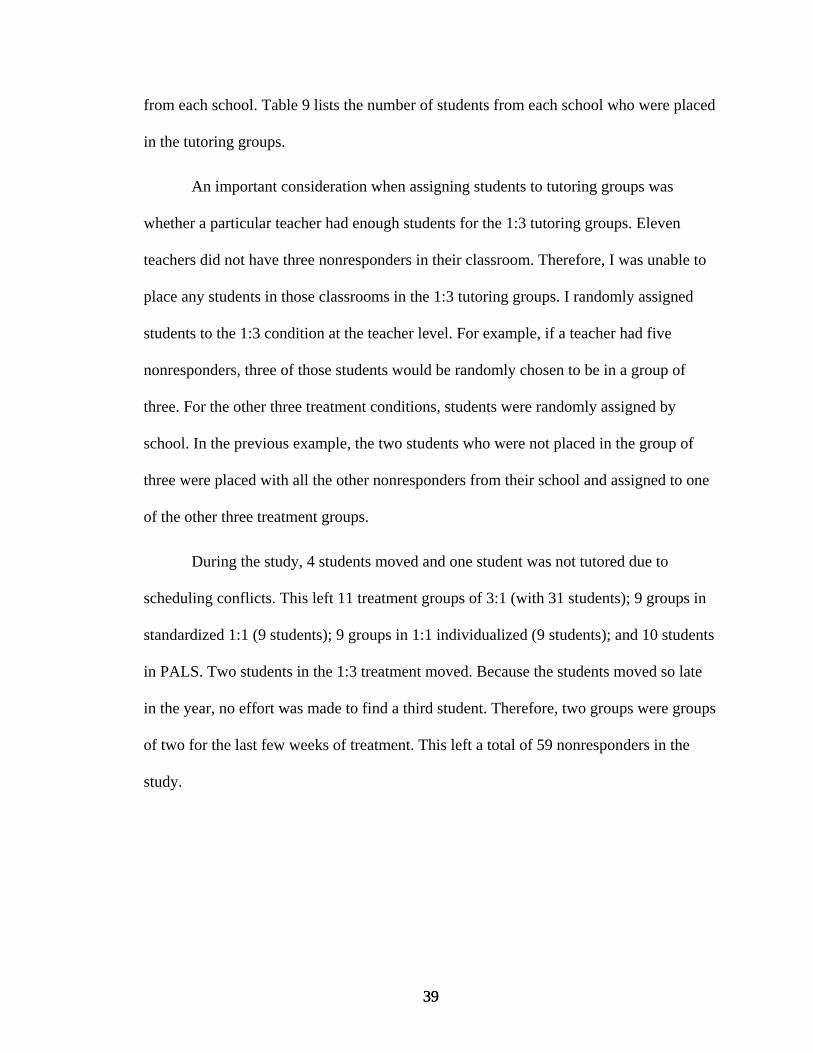
Next, the number of nonresponders for each teacher was calculated. Another
matrix was created that contained the number of nonresponders in each tutoring group
39 39
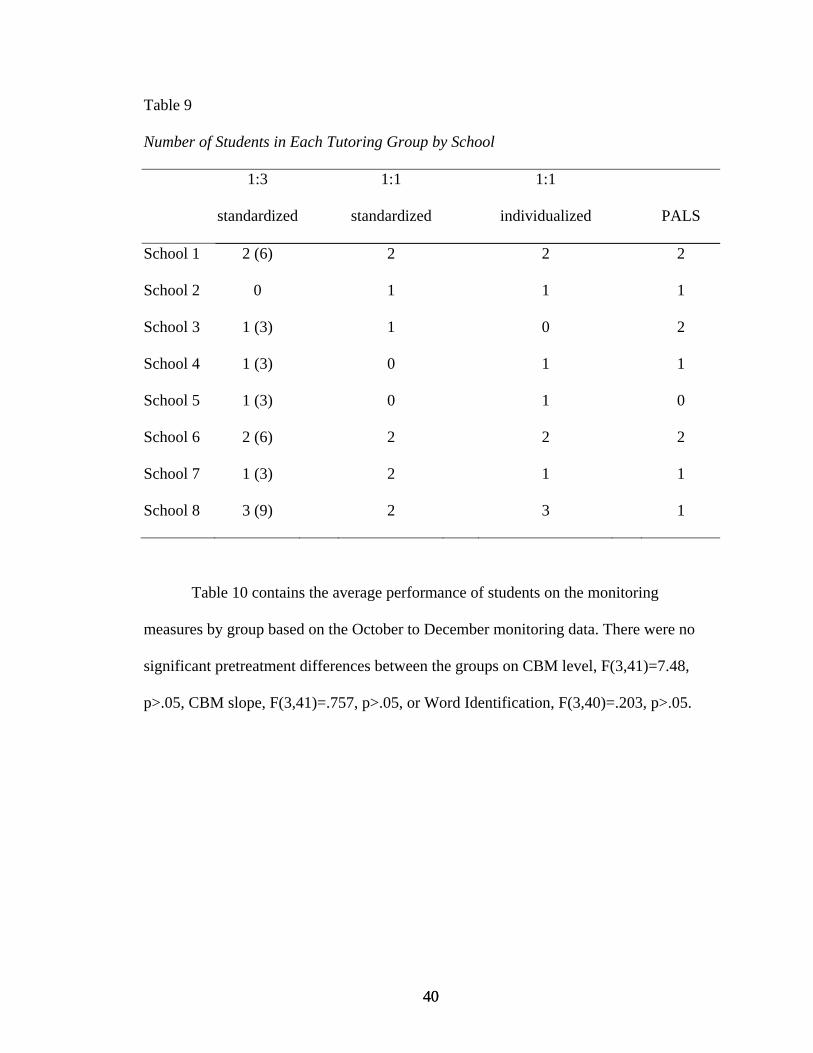
from each school. Table 9 lists the number of students from each school who were placed
in the tutoring groups.
An important consideration when assigning students to tutoring groups was
whether a particular teacher had enough students for the 1:3 tutoring groups. Eleven
teachers did not have three nonresponders in their classroom. Therefore, I was unable to
place any students in those classrooms in the 1:3 tutoring groups. I randomly assigned
students to the 1:3 condition at the teacher level. For example, if a teacher had five
nonresponders, three of those students would be randomly chosen to be in a group of
three. For the other three treatment conditions, students were randomly assigned by
school. In the previous example, the two students who were not placed in the group of
three were placed with all the other nonresponders from their school and assigned to one
of the other three treatment groups.
During the study, 4 students moved and one student was not tutored due to
scheduling conflicts. This left 11 treatment groups of 3:1 (with 31 students); 9 groups in
standardized 1:1 (9 students); 9 groups in 1:1 individualized (9 students); and 10 students
in PALS. Two students in the 1:3 treatment moved. Because the students moved so late
in the year, no effort was made to find a third student. Therefore, two groups were groups
of two for the last few weeks of treatment. This left a total of 59 nonresponders in the
study.
40 40
Table 9
Number of Students in Each Tutoring Group by School
1:3 1:1 1:1
standardized standardized individualized PALS
School 1 2 (6) 2 2 2
School 2 0 1 1 1
School 3 1 (3) 1 0 2
School 4 1 (3) 0 1 1
School 5 1 (3) 0 1 0
School 6 2 (6) 2 2 2
School 7 1 (3) 2 1 1
School 8 3 (9) 2 3 1
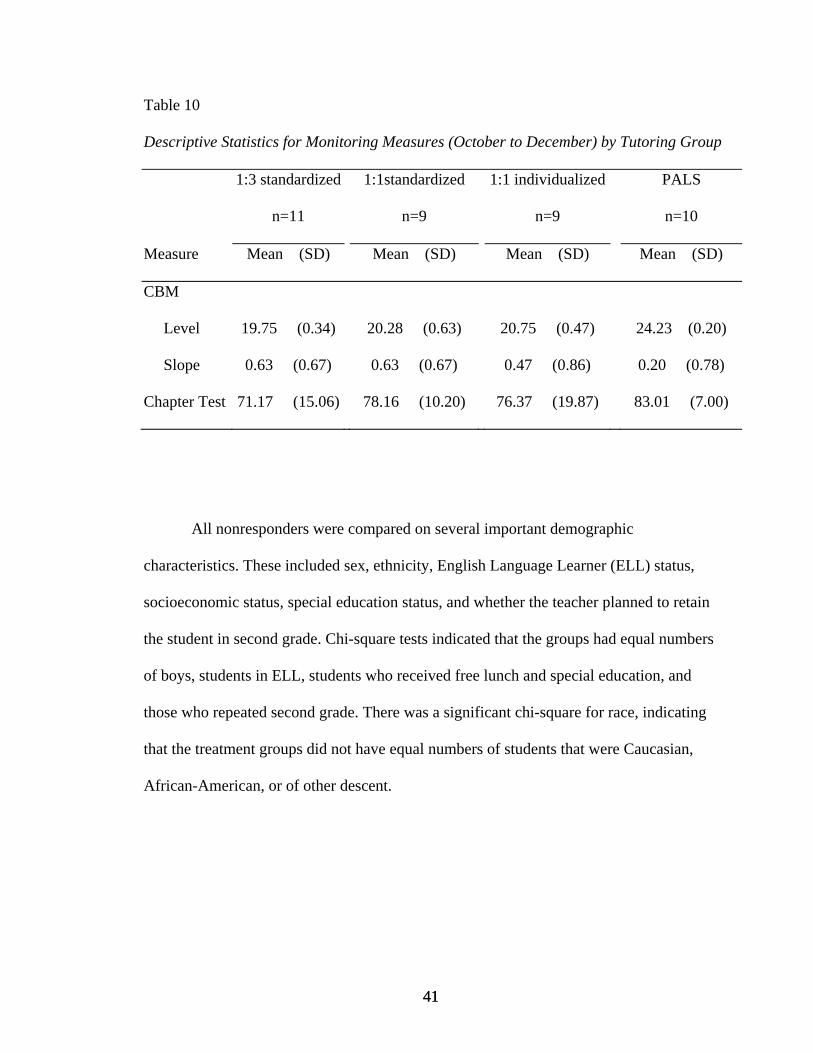
Table 10 contains the average performance of students on the monitoring
measures by group based on the October to December monitoring data. There were no
significant pretreatment differences between the groups on CBM level, F(3,41)=7.48,
p>.05, CBM slope, F(3,41)=.757, p>.05, or Word Identification, F(3,40)=.203, p>.05.
41 41
Table 10
Descriptive Statistics for Monitoring Measures (October to December) by Tutoring Group
1:3 standardized 1:1standardized 1:1 individualized PALS
n=11 n=9 n=9 n=10
Measure Mean (SD) Mean (SD) Mean (SD) Mean (SD)
CBM
Level 19.75 (0.34) 20.28 (0.63) 20.75 (0.47) 24.23 (0.20)
Slope 0.63 (0.67) 0.63 (0.67) 0.47 (0.86) 0.20 (0.78)
Chapter Test 71.17 (15.06) 78.16 (10.20) 76.37 (19.87) 83.01 (7.00)
All nonresponders were compared on several important demographic
characteristics. These included sex, ethnicity, English Language Learner (ELL) status,
socioeconomic status, special education status, and whether the teacher planned to retain
the student in second grade. Chi-square tests indicated that the groups had equal numbers
of boys, students in ELL, students who received free lunch and special education, and
those who repeated second grade. There was a significant chi-square for race, indicating
that the treatment groups did not have equal numbers of students that were Caucasian,
African-American, or of other descent.
42 42
Research Staff
Eleven RAs participated in the large-scale second-grade PALS study. Of these, a
subset of 6 RAs was chosen as tutors for this study based on their previous work with
children. The other five RAs continued their work in the classrooms assisting teachers in
implementing PALS and monitoring all nonresponders. Four tutors were doctoral
students in Special Education and two were masters students in Special Education.
Treatment
Tutoring sessions. All students placed in the 3 tutoring groups received
instruction in phonological awareness, decoding, sight word recognition, reading fluency,
and writing. Students were tutored 3 days a week for 40 minutes over a 12 week period
by a trained RA. The tutoring activities were organized into 3 units with 8 sets in each
unit. Students were placed in sets based on their last PALS chapter test. The test was
examined to determine what sounds and words the student had not yet learned. The tutors
were instructed to use the first week of tutoring to determine whether students were
placed appropriately. The tutoring sets increased in difficulty as the students progressed
through each set. A scope and sequence for the tutoring activities can be found in
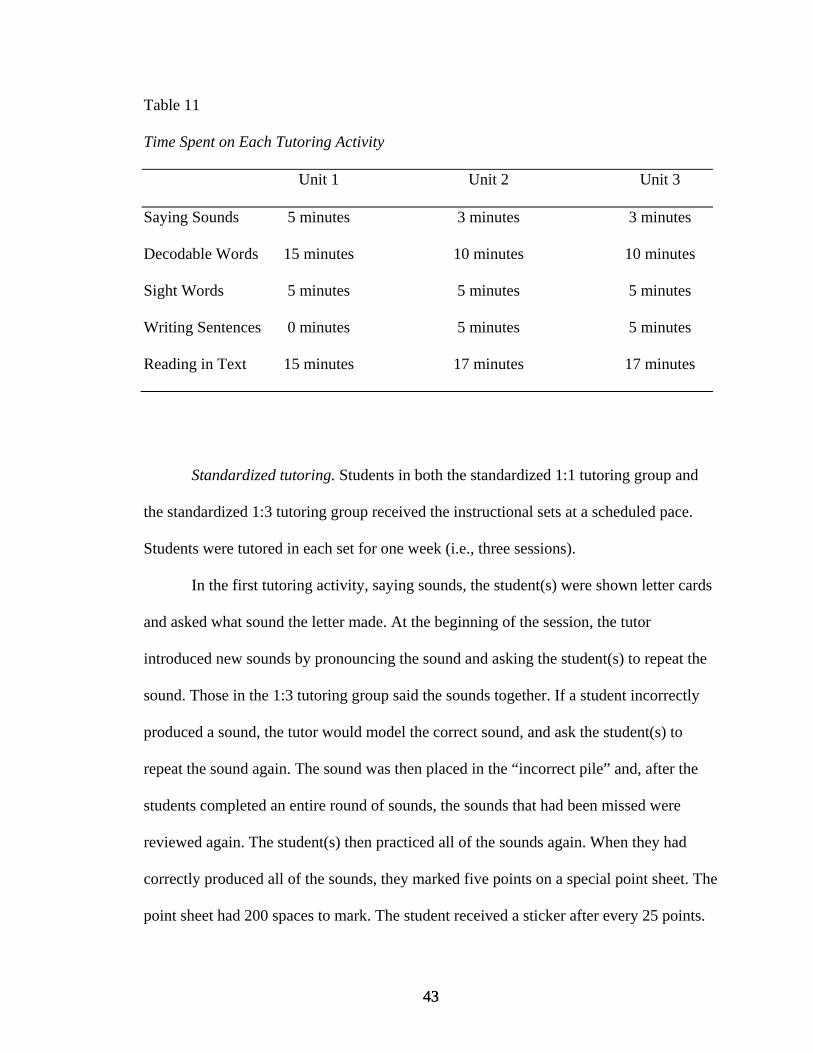
Appendix 1. Table 11 lists each of the tutoring activities and the time spent on that
activity for each unit.
43 43
Table 11
Time Spent on Each Tutoring Activity
Unit 1 Unit 2 Unit 3
Saying Sounds 5 minutes 3 minutes 3 minutes
Decodable Words 15 minutes 10 minutes 10 minutes
Sight Words 5 minutes 5 minutes 5 minutes
Writing Sentences 0 minutes 5 minutes 5 minutes
Reading in Text 15 minutes 17 minutes 17 minutes
Standardized tutoring. Students in both the standardized 1:1 tutoring group and
the standardized 1:3 tutoring group received the instructional sets at a scheduled pace.
Students were tutored in each set for one week (i.e., three sessions).
In the first tutoring activity, saying sounds, the student(s) were shown letter cards
and asked what sound the letter made. At the beginning of the session, the tutor
introduced new sounds by pronouncing the sound and asking the student(s) to repeat the
sound. Those in the 1:3 tutoring group said the sounds together. If a student incorrectly
produced a sound, the tutor would model the correct sound, and ask the student(s) to
repeat the sound again. The sound was then placed in the “incorrect pile” and, after the
students completed an entire round of sounds, the sounds that had been missed were
reviewed again. The student(s) then practiced all of the sounds again. When they had
correctly produced all of the sounds, they marked five points on a special point sheet. The
point sheet had 200 spaces to mark. The student received a sticker after every 25 points.
44 44
In the 1:1 tutoring group, the tutor continued in this manner until the time was up. For the
1:3 tutoring group, the tutor provided each child with individual practice. This task was
completed in the same way across all three units. In Unit 1, this activity lasted for 5
minutes, while in Units 2 and 3, saying sounds lasted 3 minutes.
The second tutoring activity was decoding words. In Unit 1, students were given
15 minutes to complete this activity. Each set contained eight words that contained all of
the sounds that had been practiced in that set. First, the tutor said all the sounds in a word,
approximately one second apart and told the students to “Guess my word”. The students
then said the word and said each sound in the word. The student was then shown the
word on a card with a dot under each sound. The student was told to point to the dots and
sound the word out, and read the word fast. If the student performed any of the steps
incorrectly, the tutor modeled the correct response and placed the word in the “incorrect
pile” to be reviewed again. When the student blended, sounded out, and read each word
correctly, he could mark five points on the point sheet. In the group of three, the students
responded together, and were then given individual practice.
In Units 2 and 3, the decodable section of the tutoring changed. The time was
reduced to 10 minutes, and the students no longer played “Guess my word.” Instead,
students were shown the word card, asked to say the sounds in the word, then sound out
the word and read it fast. The students then opened their notebooks and wrote the word.
Combining writing with decoding and phonological awareness instruction has been found
to increase success in a reading program (Ehri, 1989). If the students made any mistakes
on any step, the tutor modeled the correct response, placed the word card in a different
45 45
pile, and reviewed the word again. In these two Units, the students marked two points
after each word that was written.
When the students responded correctly to all the words, the tutor played a game
with the students using the sight words. For example, the tutors were provided game
cards that were duplicates of all the words. The tutor could then play a game such as
Memory or Go Fish with the student. Other games included timed pick-up games in
which the student would pick up as many words as they could as the words were dictated
by the tutor.
The third tutoring activity involved practicing sight words for 5 minutes. First,
second, and third-grade Dolch words were placed on small cards. The students read each
sight word. If one was missed, the tutor modeled the correct word and had the student
repeat the word. This method remained constant throughout the three units. Again, the
same types of games as described in the decodable word section were played with the
sight words.
The fourth tutoring activity was writing sentences with the sight words for five
minutes. Students in Unit 1 did not do this activity. In Units 2 and 3, the student or the
tutor chose a sight word, and the student wrote a sentence using that word. The student
then read the sentence to the tutor and marked five points. The student was encouraged to
use invented spelling for unknown words, but the sight word had to be spelled correctly.
The last activity of the tutoring session involved reading in connected text. In Unit
1, this activity lasted 15 minutes, and in Units 2 and 3, the students read stories for 17
minutes. Reading stories included two parts: (1) reading short stories with controlled text,
and (2) Partner reading.

46 46
Short stories were created for each set that contained controlled text. In general,
only words and sounds that had been taught and practiced were used in the stories with
the exception of the “rocket words.” Because all of the stories were taken from the PALS
lessons, there may have been some sounds or words that the student had not yet learned.
If the student had difficulty with these words, the tutor would help the student by
modeling the word and having the student repeat it.
The tutor would first introduce new “rocket words” for the story. These were
words that contained sounds or features that the student had not yet learned. Those words
were placed in the story to make the story more interesting. The tutor modeled reading
the story for the student, and then the student read the story. In the one-to three condition,
the story was divided, and each student read his or her part. If the student missed a word,
the tutor would model the correct word and have the student repeat it. The students then
read the story three times for one minute each (each student read the story only two times
in the 1:3 tutoring group due to time constraints). Their highest score was placed on a
graph, and a goal was set to read 2 more words correct than their highest score. On
subsequent days, if students met or passed their goal, a star was marked on a star chart.
After four stars were marked, the student was able to pick a treat from a treat bag. Treats
included items such as pencils, erasers, or pencil grippers.
Partner reading involved stories chosen from the students’ books in their class.
The books were on the students’ instructional level. The tutor read a page first and then
the student read the same page. Each book was read at least three times before a new
book was chosen. In Unit 3, a comprehension component was added. The student was
asked to summarize the story after one or two pages had been read and retell the story at
47 47
the end. Repeated reading, summarizing, and retelling have been shown to increase
reading comprehension (see Mastropieri & Scruggs, 1997).
Individualized tutoring. The individualized tutoring group differed from the
standardized tutoring group in several ways. The activities described in standardized
tutoring were initially implemented exactly the same with the exception that a mastery
component was built in to the tutoring. At the beginning of every activity, the tutor
checked for mastery on the words and sounds in that particular set. Once the student had
mastered all sounds and words, he or she was moved to the next set. In standardized
tutoring, the students were moved to the next set after three sessions regardless of
whether they had mastered that set. After the first two weeks of tutoring, all tutors met
weekly to discuss each child in the individualized condition. Each week, the tutor
administered two first-grade CBM passages. Performance was graphed and discussed at
each meeting. If a child was making inadequate progress, defined by not making progress
toward the 75 wcpm goal for the end of the year, the group brainstormed how to improve
the child’s performance. One child had difficulty remembering the sight words. The tutor
highlighted all of the sight words in the story. Importantly, not every student needed
modifications. Three students made adequate progress with no modifications being made.
Another important distinction between standardized and individualized tutoring is
that the tutor could spend more time on activities that were problematic for the student
and less time on tasks that were clearly mastered. For example, in standardized tutoring, a
student must spend 3 minutes on saying sounds, whereas in individualized tutoring, the
tutor could move on as soon as the student had mastered all of the sounds. This would
48 48
leave more time for other tasks that may be problematic. If there was extended time left
at the end of the session, the student often read connected text.
Control group. Students randomly assigned to the control group remained in the
PALS class-wide treatment. Teachers were permitted to move students back lessons to
provide more practice on particular skills. Control students were also continually
monitored for the entire school year to measure their progress in reading.
Measures
Pretest Measures
All participants in the PALS study were given the following pretest measures in
October, 2001. These included measures of rapid naming, phonological awareness,
reading words, spelling, fluency, and comprehension. All pretesting was conducted in a
one-to-one session with a trained RA.
Rapid naming. A Rapid Letter Naming (RLN) test was given to determine the
speed in which students could recognize letters. The RLN test has been used as a
selection tool in previous PALS studies (e.g., Fuchs et al., 2001) because it is a strong
predictor of future reading ability (e.g., Torgesen, Wagner, & Rashotte, 1997). All letters
of the alphabet, both upper and lower case, were presented randomly in black type on a
sheet of paper. The student was instructed to name the letters as quickly as he/she could
in one minute. The score was recorded as the number of letters named correctly in one
minute. If a student finished the test before the minute was up, the score was prorated

49 49
using the following formula: number of seconds it took to finish the test divided by the
number of letters named correctly multiplied by 60.
Phonological awareness. The Elision subtest of the Comprehensive Test of
Phonological Awareness (CTOPP; Wagner, Torgeson, & Rashotte, 1999) was given to
measure phonological awareness. Students are told to say a word, and then say the same
word without one of the phonemes (e.g., say ‘meat’; now say ‘meat’ without the /m/. The
test was discontinued after the student missed four items in a row. The score was
recorded as the number correct. The Elision subtest has a test-retest reliability of .88 and
moderately correlates with the Word Identification (.73) and Word Attack (.74) subtest of
the Woodcock Reading Mastery Test-Revised (WRMT-R; Woodcock, 1987)
Reading words. The Word Identification and Word Attack subtests of the
Woodcock Reading Mastery Test-Revised (WRMT-R; Woodcock, 1987) were given to
measure word recognition and decoding skills. On the word attack subtest, the students
are asked to read words that are not really words (e.g., ift). This measures the students’
ability to decode unknown words. The test is discontinued when the student misses six
consecutive items. On the Word Identification subtest, the student is asked to read words
of increasing difficulty. The test is discontinued when the student misses six words in a
row. The WRMT-R is a standardized, norm-referenced test. The scores on the WRMT-R
Word identification and Word Attack subtests correlate highly with other tests of reading,
and internal consistency exceeds .80.
Spelling. The spelling subtest of the Wechsler Individual Achievement Test
(WIAT; Wechsler, 1992) begins by asking students to write letters and letters that make a
particular sound. The student is then given a word to spell, a sentence containing the
50 50
word, and the word is repeated. The student is given 10 seconds to spell each word. The
test is discontinued when the student misses five words in a row. The WIAT has a
moderate to high correlation with other achievement tests (.70 to .85) and has a high test-
retest reliability (.94).
Fluency/Comprehension. A passage from the Comprehensive Reading
Assessment Battery (CRAB; Fuchs, Fuchs, & Hamlett, 1989) was given to the students.
The passage is a 400 word traditional folk tale that is written on the second grade level.
The students were instructed to read the passage quickly and correctly. The number of
words read correctly in one minute and the number of words read correctly in three
minutes was recorded. The student is then asked 10 questions about the passage. Test-
retest reliability for the CRAB ranges from .93 to .96. Concurrent validity with the Stanford
Achievement Test (SAT) Reading Comprehension subtest was .91 (Fuchs, Fuchs, &
Maxwell, l988).
Monitoring Measures
During the first five weeks of PALS treatment implementation, the 214 students
who had been identified as at-risk for reading failure were administered weekly tests to
monitor their progress in reading. These measures included weekly chapter tests and
CBM passages. After the 64 nonresponders were identified using these tests, all 214 at-
risk readers were administered the CBM passages once every two weeks. All tests were
administered in a one-to-one session conducted by trained RAs.
Chapter tests. Chapter tests were given during the last three monitoring sessions.
The chapter tests were developed to directly measure the sounds and words that the
51 51
students had learned in PALS. Five chapter tests were developed that covered up to
Lessons 8, 11, 14, 17, and 20. Students were given the test that most closely matched the
lesson they were on in the classroom. For example, if a student’s class was on lesson 13,
the child would be given the chapter test for Lesson 11. No student was given any chapter
test that was above the lesson they had reached in their classroom. The tests were
composed of only the sounds and words that had been learned in the lessons. The chapter
tests were cumulative and untimed. The score was recorded as the number of sounds and
words read correctly.
CBM. Every week, two curriculum-based reading measures were given to all
students. These measures were developed at Vanderbilt University (Fuchs et al., 1990).
The passages are between 1.5 and 2.5 grade levels. Students read passages for one minute
each and the number of words read and the number of words read correctly are recorded.
The average number of words read for the two passages was used as the students’ score.
Midpoint Testing In December, all 214 at-risk students were readministered the WRMT-R Word
Attack and Word Identification subtests to evaluate their decoding and word
identification skills following their participation in 17 hours of PALS treatment in the
classroom. The students were tested by the RAs in a one to one session.
Posttest Measures
All 214 nonresponders in the PALS study were administered all posttest
measures. These measures included all of the pretest measures and a CBM measure
described below.
52 52
CBM. Two additional second-grade CBM passages were given at the end of the
year. One passage was given to test fluency; the other to test fluency and comprehension.
Questions were written for each of the passages by the Principal Investigator of the study.
The questions included three open-ended questions and 10 multiple-choice questions.
The number of words read correctly in one minute was calculated for each passage.
Additional Nonresponder Testing
In addtion to the posttesting, three other tests were given to all 59 nonresponders.
These were the Vocabulary and Matrix Reasoning subtests of the Wechsler Abbreviated
Intelligence Scale (WASI; Psychological Corporation, 1999), the Digit Span subtest of
the Wechsler Intelligence Scale for Children-Revised (WISC-R; Wechsler, 1974), and the
Colorado Perceptual Speed Test.
WASI IQ. An estimated intelligence score can be derived by administering two
subtests of the WASI. On the Vocabulary subtest of the WASI, the student is asked to
define words of increasing difficulty. Each response is scored as either a 0 (incorrect), 1
(partially correct), or 2 (completely correct). The test is discontinued when the student
scores a 0 on five consecutive items or when the child has completed all the items for his
or her age range. Internal consistency reliability coefficients range from .86 to .93 for the
Vocabulary subtest. The Matrix Reasoning subtest requires the student to determine what
shape is missing in a series of pictures. The child chooses the best answer from several
choices. Each item is scored as a 1 (correct) or 0 (incorrect). A ceiling is established
when the child misses four items in a row or receives four 0’s on five consecutive items.
53 53
Using these two subtest, an estimated intelligence score is obtained. The internal
consistency reliability coefficient for the Matrix Reasoning subtest is .96.
Digit Span. The Digit Span subtest of the WISC-R (Wechsler, 1974) is a
supplemental test that assesses verbal memory. For Digits Forward, the examiner says a
series of numbers that the child must repeat back in the same order. For Digits Backward,
the examiner says a series of numbers, and the students must repeat the numbers back in
reverse order. Each item consists of two trials. Each trial was scored as a 1 (correct) or a
0 (incorrect). The test was discontinued when a student missed both items on a trial.
Reliability coefficients for the Digit Span subtest range from .71 to .84.
Colorado Perceptual Speed Test. The Colorado Perceptual Speed Test (CPST)
assesses the speed with which the students can match a random string of alphanumeric
figures. The test consists of the target item and four similar strings. The student must
match the target item with one of the four strings by circling the string that matches the
target. The test has 30 test items and the student completes as many as possible in 60
seconds. The total score is the number of correct responses.
Procedures
Pre- and Posttesting. Prior to pretesting in October, 2001, 10 RAs were trained on
all pretest measures in one four hour training session. All RAs observed the tests being
administered and practiced administering the tests under the supervision of the project
coordinator. When everyone was comfortable with each test, an interrater agreement
session was held. Two project coordinators administered each test and the RAs all scored
54 54
separate protocols. Interrater agreement was calculated by comparing each answer on
each test to a project coordinator’s protocol. Number of agreements was divided by
number of agreements plus disagreements, and then multiplied by 100. No RA scored
below 90% on any test.
Following pretest training, parental consent forms were sent home with all
students in the 40 classrooms (i.e., 10 PALS only classrooms, 10 PALS + fluency
classrooms, 10 PALS + comprehension classrooms, and 10 control classrooms). Signed
consent forms were returned for 739 out of 759 students.
Testing sessions were divided into two sections to help prevent student fatigue.
During the first session, students were administered the Rapid Letter Naming subtest and
then Word Identification on the WRMT-R. The third test for the first round was
randomly chosen from the remaining four tests. On the second day of testing, the
remaining three tests were administered in random order.
For each testing session, examiners spent several minutes establishing rapport
with each child. Testing did not begin until the examiner believed that the child was
comfortable and relaxed. Rapport was established by talking with the student about how
they liked school, their favorite animal, color, or other topics of interest to the child.
In April, 2002, the PALS project coordinator conducted another training session
to ensure that all RAs remembered how to administer all tests, and to instruct them how
to administer the new CBM test that was added to the posttest battery. Training took
place in two, 2-hour sessions. Again, all staff members observed and practiced testing
procedures. Inter-rater agreement was collected for all tests in the same way described in
the pretest section. No RA was below 90%.
55 55
Immediately following posttest training, RAs tested each student in two, one-to-
one testing sessions. The examiners only tested children with whom they were familiar
(i.e., had assisted the teacher in the classroom at some point during the year). However,
examiners did not test any child whom they tutored.
All posttests were given numbers and randomly ordered for administration for
each child. The only exception was that the CBM fluency probe was always given at the
beginning of the second session, and the CBM comprehension probe was always given at
the end of the second session. The two CBM passages were randomly ordered so that one
child would get one story for comprehension, while another child got that story for
fluency. All examiners made certain that the children were comfortable and relaxed prior
to the start of the testing session.
Monitoring progress of the risk pool. Following pretesting, the project coordinator
trained all RAs to administer the CBM and chapter tests for monitoring the risk pool.
One, two-hour training session was held in which staff observed and practiced test
administration. An interrater agreement session was determined. Agreement for CBM
was 99.8; for chapter tests, 98.5.
For the first five weeks of PALS implementation, RAs monitored the 4-8 students
in each class who had been designated by their teachers as nonresponders. Monitoring
was conducted one day per week. The RAs were told told to make sure that each child
received the correct chapter test based on the lesson that the teacher was currently on in
the classroom.
After the identification of the nonresponders, based on the monitoring from
October to December, the monitoring continued in a different manner. From January,
56 56
2002, until April, 2002, students were monitored every other week instead of every week.
Only those students who were identified as nonresponders were monitored. Low-
achieving students who were making adequate progress in the PALS program were no
longer monitored. Also, the chapter tests were no longer given.
Additional nonresponder testing. In April, the 11 RAs were trained in
administering the three extra tests given only to the nonresponders. Staff members were
given the opportunity to observe and practice administering the tests. Inter-rater
agreement was conducted on the Digit Span and Matrix Reasoning tests. All RAs scored
100%. All students were tested in a one-to-one testing condition, and they were not
tested until the examiner had established rapport with the child.
Inter-scorer agreement sessions were not conducted for the Vocabulary subtest
during training because scoring of this test was performed by the project coordinator and
I after the tests were administered. We first scored 10% of the same protocols to establish
inter-rater agreement, which was 98%. We then divided the remaining tests and scored
them independently.
For the Colorado Pereceptual Speed Test, there was no way to establish inter-rater
because the examiner merely had to time the students circling the correct answer. These
tests were then scored by one person using a template of correct answers.
Training Tutors
Six RAs were chosen to tutor all nonresponders. Each RA had a least one
student/group from each tutoring group. The six RAs were chosen to tutor based on their
57 57
previous experience working with children. The RAs who were chosen to tutor were not
in classrooms to support any of the PALS treatments and did not monitor any of the
students they were tutoring.
In January, 2002, the project coordinator and I conducted a 4 hour training session
for all the tutoring procedures. RAs observed the tutoring activities and practiced in pairs
with supervision. In addition, a weekly meeting was held to discuss all students in the
individualized tutoring group (i.e., their progress and any modifications needed) as well
as any other issues that had come up during tutoring.
Tutoring group sessions were conducted three times per week for 40 minutes.
Students were tutored during their classroom PALS time; however, seven students were
unable to be tutored during PALS due to scheduling conflicts. These students remained in
the classroom during PALS but read books, completed teacher-assigned work, or worked
on the computer, and so forth.
Treatment Fidelity
Tutoring fidelity was established in two ways. First, in early February, all tutors
were observed administering the tutoring activities to another RA not involved in
tutoring. A tutoring checklist was developed, which reflected the major tutoring
procedures. The project coordinator and I each observed two tutors. The tutor was then
asked questions about the differences between 1:1 standardized, 1:1 individualized, and
1:3 standardized. A checklist was completed for each tutor and feedback was given based
58 58
on their performance. Overall, fidelity for the tutoring simulations was 97% with a range
of 91 to 100%.
Next, in March, all tutors were asked to tape record one session with each student
or group. The project coordinator and I listened to 10% of these tapes to establish
interrater agreement among ourselves. Our interrater agreement for the tapes was 96%.
We then divided the remaining tapes and scored each of them. Overall, fidelity of
treatment implementation was 96%. For the 1:1 standardized tutoring, 1:1 individualized
tutoring, and the 1:3 tutoring, fidelity was 95%, 97%, and 95% respectively.
Data Analysis
Treatment Results
To compare the relative effectiveness of 1:1 standardized, 1:3 standardized, 1:1
individualized and remaining in PALS, effect sizes were calculated to analyze pre and
post test treatment group differences on all reading measures. In addition, growth curve
analyses were performed on all six CBM points. Five individual factors were entered into
a regression formula to determine the differences that predicted growth and response to
instruction. The factors were treatment group membership, initial reading performance on
word identification and word attack, WASI IQ scores, free lunch status, and English
Language Learners.
59 59
CHAPTER IV
RESULTS
First, I report the effect sizes that compare the study groups (1:1 individual, 1:1
standard, 1:3 standard, and PALS) on all reading measures. Inferential statistics were not
used due to small sample sizes and lack of power in the study. Second, I describe growth
curve analyses performed on the six CBM data points. Finally, I present findings from an
exploration of individual differences that predicted growth and response to instruction.
These individual differences included initial performance on Word Identification and
Word Attack subtests of the WRMT-R, free lunch status, English Language Learner
status, and study group.
Descriptive Information
Table 12 provides descriptive statistics by study groups for each of the reading
measures administered. For Word Identification and Word Attack, the pretreatment
administration was conducted in December immediately before tutoring began. For all
other measures, pretreatment administration was in September. As reported in Chapter
III, there were no statistically significant differences between study groups at
pretreatment on any of the measures. However, again, because of the small number of
students in each group, I cannot rule out the possibility of important between-group
differences. Table 13 reports the mean gain scores by study group. The table indicates
that on most measures students in the PALS group outperformed those in the other study
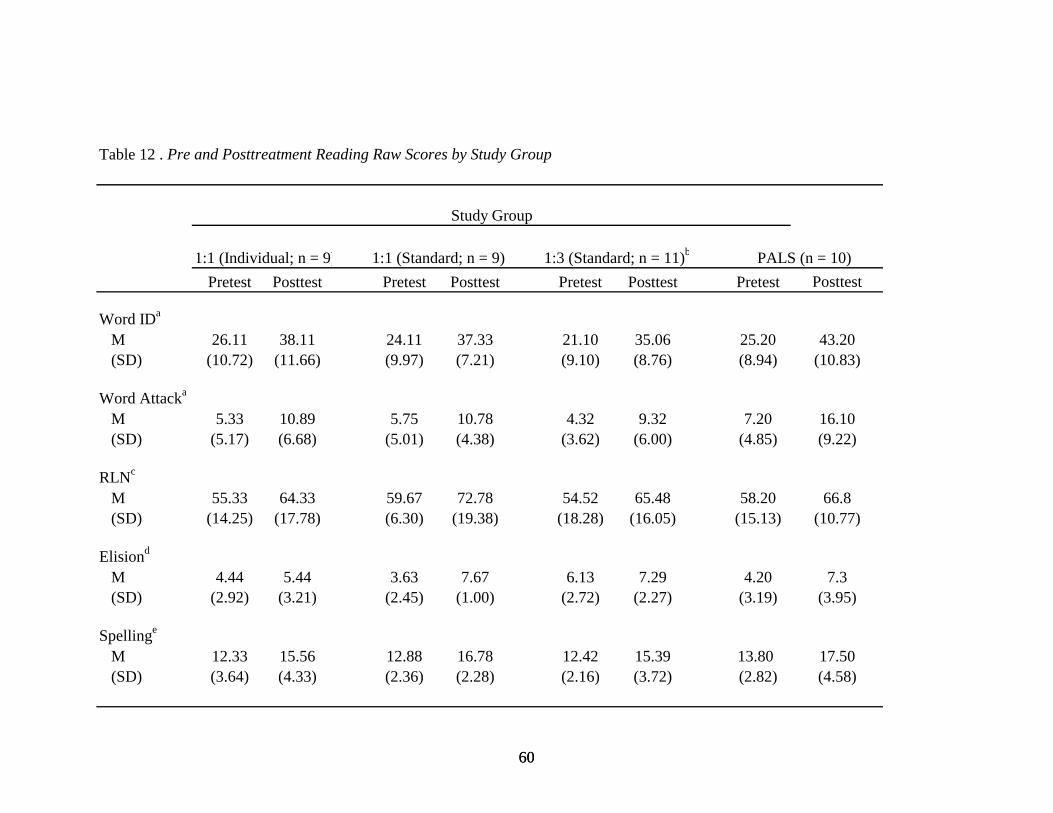
60 60
Table 12 . Pre and Posttreatment Reading Raw Scores by Study Group
Pretest Posttest Pretest Posttest Pretest Posttest Pretest Posttest
Word IDa
M 26.11 38.11 24.11 37.33 21.10 35.06 25.20 43.20 (SD) (10.72) (11.66) (9.97) (7.21) (9.10) (8.76) (8.94) (10.83)
Word Attacka
M 5.33 10.89 5.75 10.78 4.32 9.32 7.20 16.10 (SD) (5.17) (6.68) (5.01) (4.38) (3.62) (6.00) (4.85) (9.22)
RLNc
M 55.33 64.33 59.67 72.78 54.52 65.48 58.20 66.8 (SD) (14.25) (17.78) (6.30) (19.38) (18.28) (16.05) (15.13) (10.77)
Elisiond
M 4.44 5.44 3.63 7.67 6.13 7.29 4.20 7.3 (SD) (2.92) (3.21) (2.45) (1.00) (2.72) (2.27) (3.19) (3.95)
Spellinge
M 12.33 15.56 12.88 16.78 12.42 15.39 13.80 17.50 (SD) (3.64) (4.33) (2.36) (2.28) (2.16) (3.72) (2.82) (4.58)
Study Group
1:1 (Individual; n = 9) 1:1 (Standard; n = 9) 1:3 (Standard; n = 11)b PALS (n = 10)
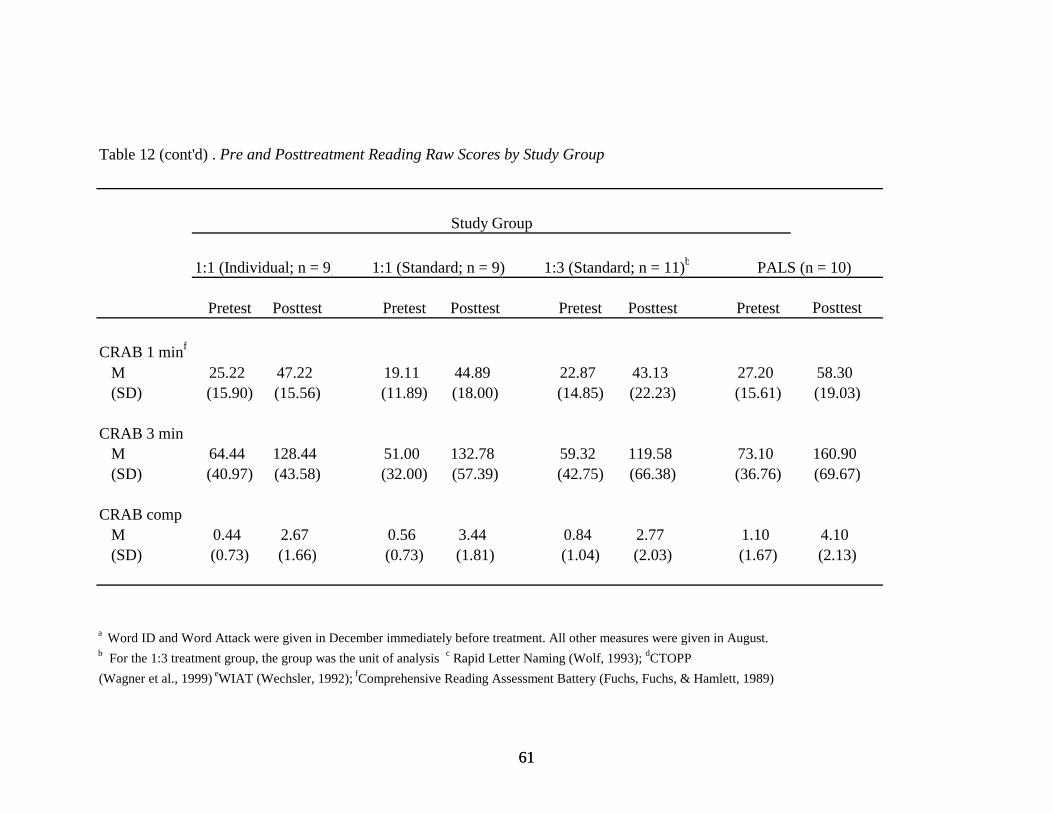
61 61
Table 12 (cont'd) . Pre and Posttreatment Reading Raw Scores by Study Group
Pretest Posttest Pretest Posttest Pretest Posttest Pretest Posttest
CRAB 1 minf
M 25.22 47.22 19.11 44.89 22.87 43.13 27.20 58.30 (SD) (15.90) (15.56) (11.89) (18.00) (14.85) (22.23) (15.61) (19.03)
CRAB 3 min M 64.44 128.44 51.00 132.78 59.32 119.58 73.10 160.90 (SD) (40.97) (43.58) (32.00) (57.39) (42.75) (66.38) (36.76) (69.67)
CRAB comp M 0.44 2.67 0.56 3.44 0.84 2.77 1.10 4.10 (SD) (0.73) (1.66) (0.73) (1.81) (1.04) (2.03) (1.67) (2.13)
a Word ID and Word Attack were given in December immediately before treatment. All other measures were given in August.b For the 1:3 treatment group, the group was the unit of analysis c Rapid Letter Naming (Wolf, 1993); dCTOPP (Wagner et al., 1999) eWIAT (Wechsler, 1992); fComprehensive Reading Assessment Battery (Fuchs, Fuchs, & Hamlett, 1989)
Study Group
1:1 (Individual; n = 9) 1:1 (Standard; n = 9) 1:3 (Standard; n = 11)b PALS (n = 10)
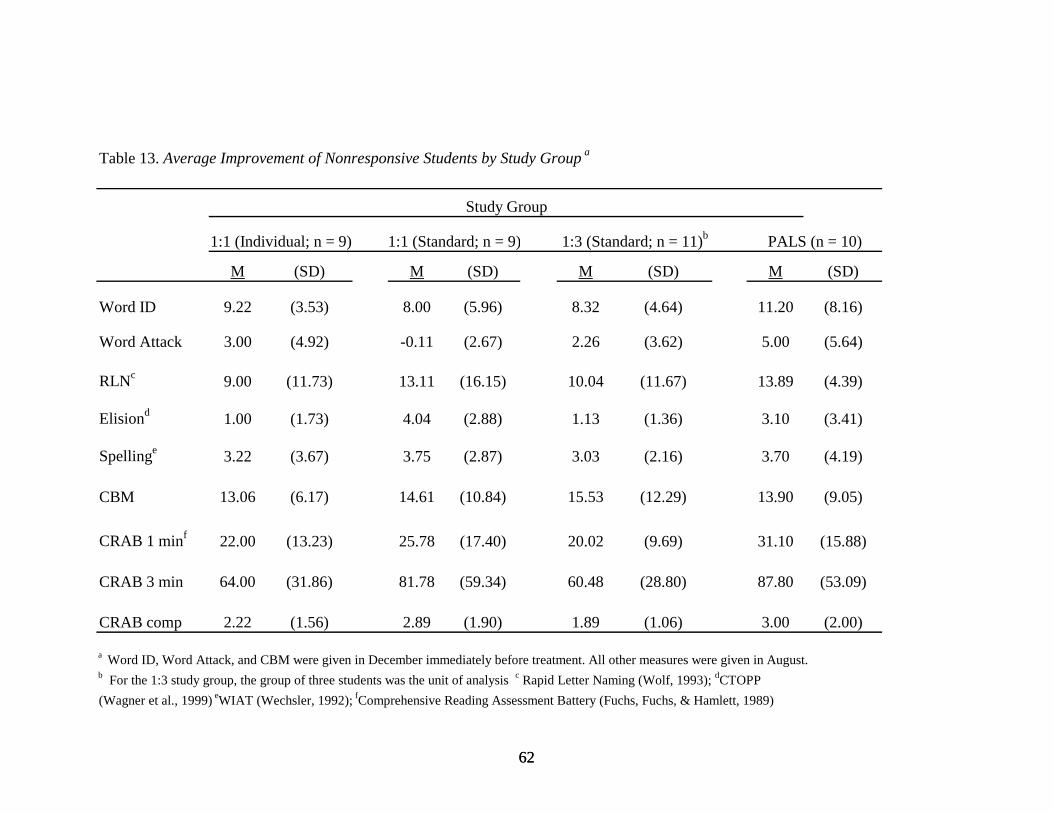
62 62
Table 13. Average Improvement of Nonresponsive Students by Study Group a
M (SD) M (SD) M (SD) M (SD)
Word ID 9.22 (3.53) 8.00 (5.96) 8.32 (4.64) 11.20 (8.16)
Word Attack 3.00 (4.92) -0.11 (2.67) 2.26 (3.62) 5.00 (5.64)
RLNc 9.00 (11.73) 13.11 (16.15) 10.04 (11.67) 13.89 (4.39)
Elisiond 1.00 (1.73) 4.04 (2.88) 1.13 (1.36) 3.10 (3.41)
Spellinge 3.22 (3.67) 3.75 (2.87) 3.03 (2.16) 3.70 (4.19)
CBM 13.06 (6.17) 14.61 (10.84) 15.53 (12.29) 13.90 (9.05)
CRAB 1 minf 22.00 (13.23) 25.78 (17.40) 20.02 (9.69) 31.10 (15.88)
CRAB 3 min 64.00 (31.86) 81.78 (59.34) 60.48 (28.80) 87.80 (53.09)
CRAB comp 2.22 (1.56) 2.89 (1.90) 1.89 (1.06) 3.00 (2.00)
a Word ID, Word Attack, and CBM were given in December immediately before treatment. All other measures were given in August.b For the 1:3 study group, the group of three students was the unit of analysis c Rapid Letter Naming (Wolf, 1993); dCTOPP (Wagner et al., 1999) eWIAT (Wechsler, 1992); fComprehensive Reading Assessment Battery (Fuchs, Fuchs, & Hamlett, 1989)
Study Group
1:1 (Individual; n = 9) 1:1 (Standard; n = 9) 1:3 (Standard; n = 11)b PALS (n = 10)
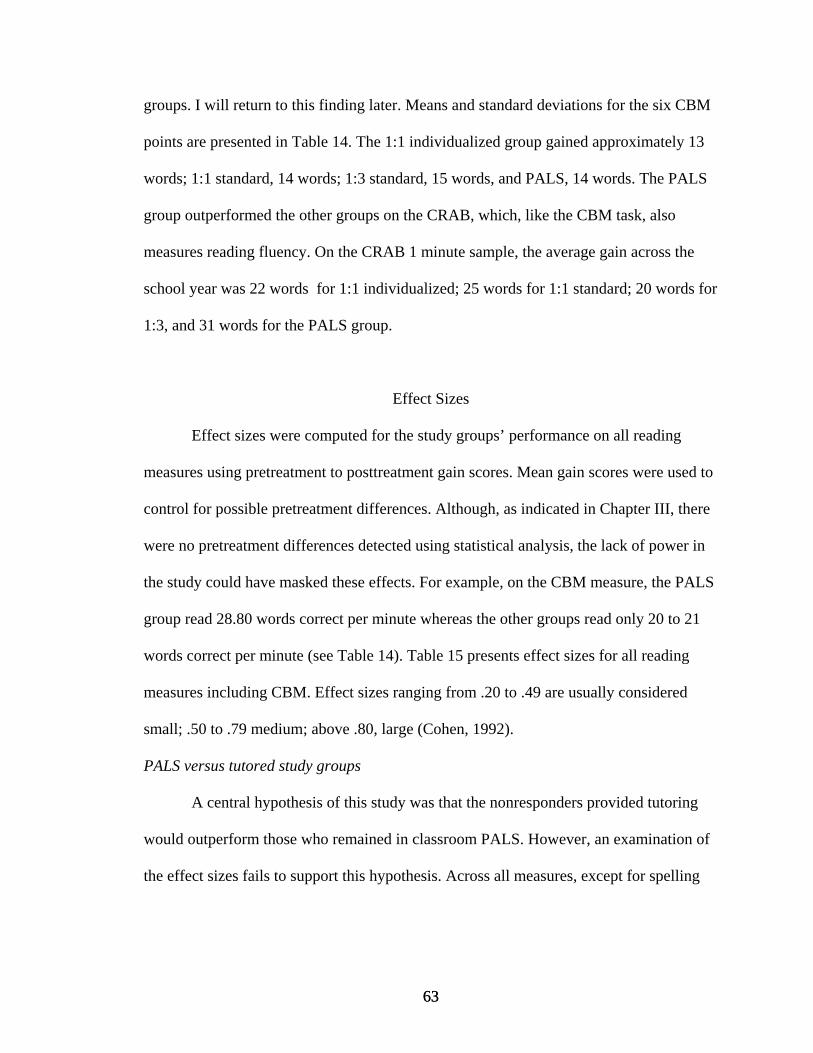
63 63
groups. I will return to this finding later. Means and standard deviations for the six CBM
points are presented in Table 14. The 1:1 individualized group gained approximately 13
words; 1:1 standard, 14 words; 1:3 standard, 15 words, and PALS, 14 words. The PALS
group outperformed the other groups on the CRAB, which, like the CBM task, also
measures reading fluency. On the CRAB 1 minute sample, the average gain across the
school year was 22 words for 1:1 individualized; 25 words for 1:1 standard; 20 words for
1:3, and 31 words for the PALS group.
Effect Sizes
Effect sizes were computed for the study groups’ performance on all reading
measures using pretreatment to posttreatment gain scores. Mean gain scores were used to
control for possible pretreatment differences. Although, as indicated in Chapter III, there
were no pretreatment differences detected using statistical analysis, the lack of power in
the study could have masked these effects. For example, on the CBM measure, the PALS
group read 28.80 words correct per minute whereas the other groups read only 20 to 21
words correct per minute (see Table 14). Table 15 presents effect sizes for all reading
measures including CBM. Effect sizes ranging from .20 to .49 are usually considered
small; .50 to .79 medium; above .80, large (Cohen, 1992).
PALS versus tutored study groups
A central hypothesis of this study was that the nonresponders provided tutoring
would outperform those who remained in classroom PALS. However, an examination of
the effect sizes fails to support this hypothesis. Across all measures, except for spelling
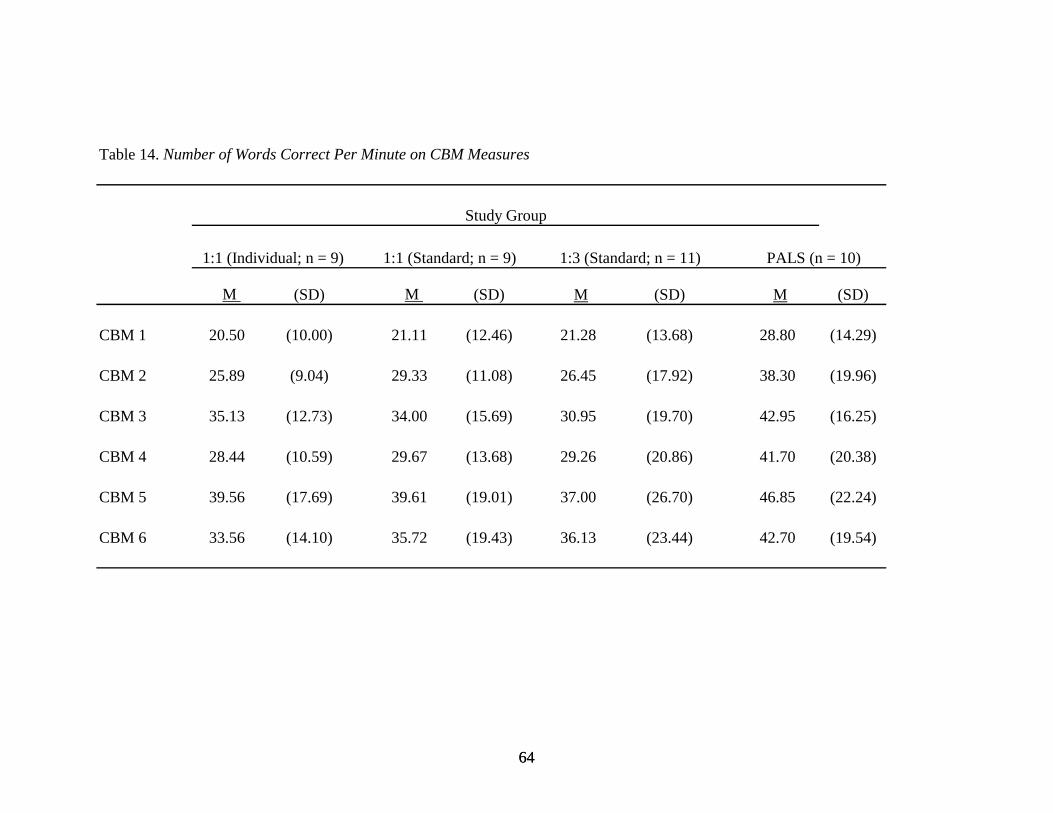
64 64
Table 14. Number of Words Correct Per Minute on CBM Measures
M (SD) M (SD) M (SD) M (SD)
CBM 1 20.50 (10.00) 21.11 (12.46) 21.28 (13.68) 28.80 (14.29)
CBM 2 25.89 (9.04) 29.33 (11.08) 26.45 (17.92) 38.30 (19.96)
CBM 3 35.13 (12.73) 34.00 (15.69) 30.95 (19.70) 42.95 (16.25)
CBM 4 28.44 (10.59) 29.67 (13.68) 29.26 (20.86) 41.70 (20.38)
CBM 5 39.56 (17.69) 39.61 (19.01) 37.00 (26.70) 46.85 (22.24)
CBM 6 33.56 (14.10) 35.72 (19.43) 36.13 (23.44) 42.70 (19.54)
Study Group
1:1 (Individual; n = 9) 1:1 (Standard; n = 9) 1:3 (Standard; n = 11) PALS (n = 10)
65 65
Table 15. Effect Sizes - Second Grade Nonresponders
1:1 Indiv. 1:1 Standard. 1:3 Standard. 1:1 Indiv. 1:1 Indiv. 1:1 Standard.
vs. vs. vs. vs. vs. vs.
PALS PALS PALS 1:1 Standard. 1:3 Standard. 1:3 Standard.
Word Identification -0.44 -0.63 -0.62 0.35 0.30 -0.09
Word Attack -0.53 -1.61 -0.83 1.11 0.25 -1.04
RLN -0.80 -0.09 -0.61 -0.41 -0.13 0.31
Elision -1.08 0.42 -1.09 -1.81 -0.12 1.90
Spelling -0.17 0.02 -0.29 -0.23 0.09 0.41
CBM -0.15 0.10 0.21 -0.25 -0.35 -0.11
CRAB 1 min -0.88 -0.45 -1.21 -0.35 0.25 0.60
CRAB 3 min -0.76 -0.15 -0.92 -0.53 0.16 0.67
CRAB comp -0.61 -0.08 -1.00 -0.55 0.36 0.95
Comparisons
Measures
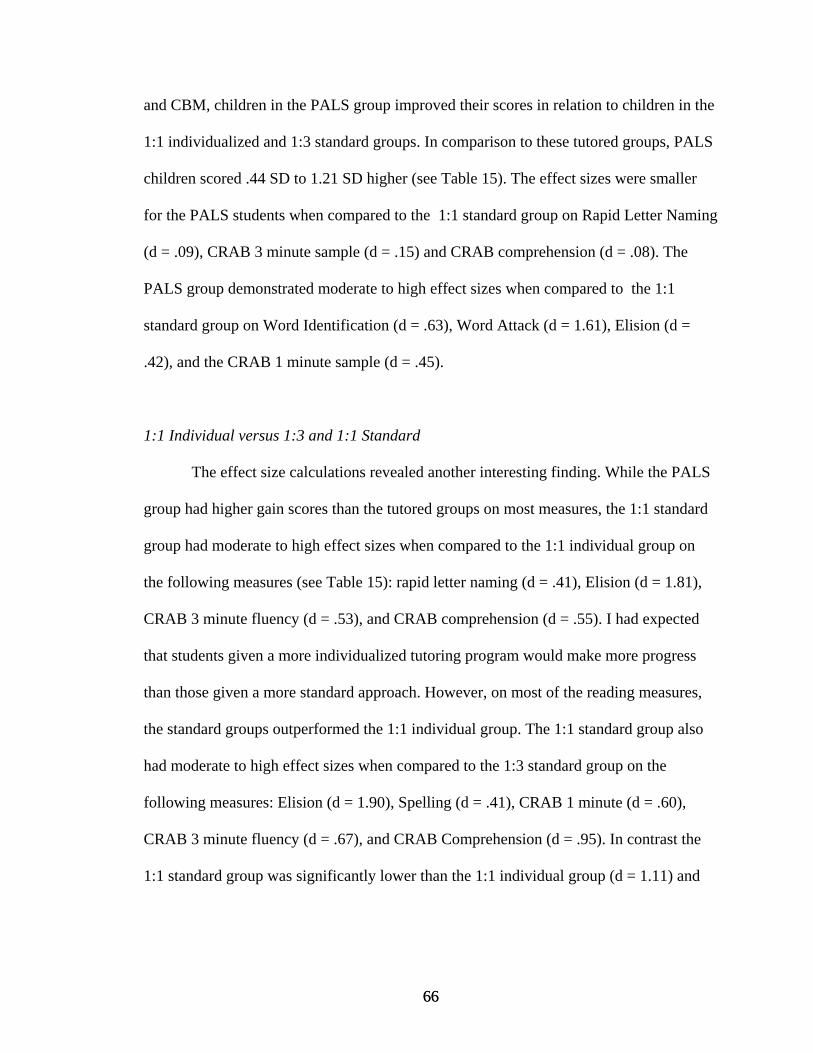
66 66
and CBM, children in the PALS group improved their scores in relation to children in the
1:1 individualized and 1:3 standard groups. In comparison to these tutored groups, PALS
children scored .44 SD to 1.21 SD higher (see Table 15). The effect sizes were smaller
for the PALS students when compared to the 1:1 standard group on Rapid Letter Naming
(d = .09), CRAB 3 minute sample (d = .15) and CRAB comprehension (d = .08). The
PALS group demonstrated moderate to high effect sizes when compared to the 1:1
standard group on Word Identification (d = .63), Word Attack (d = 1.61), Elision (d =
.42), and the CRAB 1 minute sample (d = .45).
1:1 Individual versus 1:3 and 1:1 Standard
The effect size calculations revealed another interesting finding. While the PALS
group had higher gain scores than the tutored groups on most measures, the 1:1 standard
group had moderate to high effect sizes when compared to the 1:1 individual group on
the following measures (see Table 15): rapid letter naming (d = .41), Elision (d = 1.81),
CRAB 3 minute fluency (d = .53), and CRAB comprehension (d = .55). I had expected
that students given a more individualized tutoring program would make more progress
than those given a more standard approach. However, on most of the reading measures,
the standard groups outperformed the 1:1 individual group. The 1:1 standard group also
had moderate to high effect sizes when compared to the 1:3 standard group on the
following measures: Elision (d = 1.90), Spelling (d = .41), CRAB 1 minute (d = .60),
CRAB 3 minute fluency (d = .67), and CRAB Comprehension (d = .95). In contrast the
1:1 standard group was significantly lower than the 1:1 individual group (d = 1.11) and
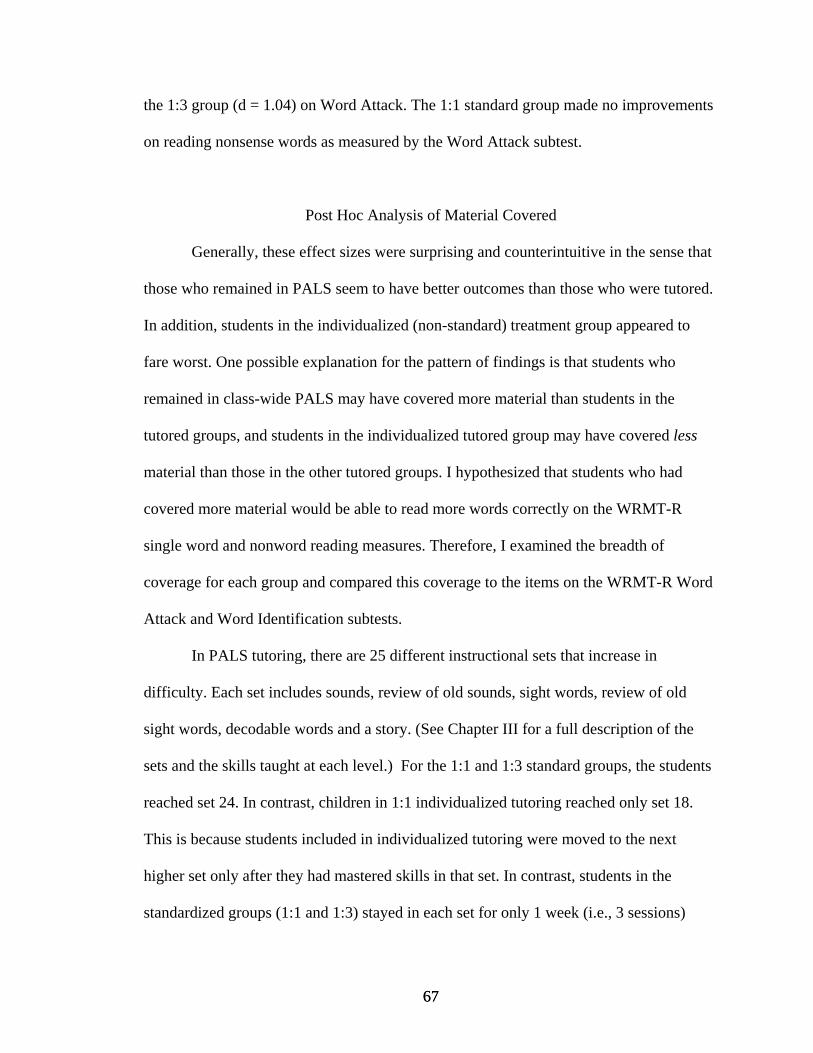
67 67
the 1:3 group (d = 1.04) on Word Attack. The 1:1 standard group made no improvements
on reading nonsense words as measured by the Word Attack subtest.
Post Hoc Analysis of Material Covered
Generally, these effect sizes were surprising and counterintuitive in the sense that
those who remained in PALS seem to have better outcomes than those who were tutored.
In addition, students in the individualized (non-standard) treatment group appeared to
fare worst. One possible explanation for the pattern of findings is that students who
remained in class-wide PALS may have covered more material than students in the
tutored groups, and students in the individualized tutored group may have covered less
material than those in the other tutored groups. I hypothesized that students who had
covered more material would be able to read more words correctly on the WRMT-R
single word and nonword reading measures. Therefore, I examined the breadth of
coverage for each group and compared this coverage to the items on the WRMT-R Word
Attack and Word Identification subtests.
In PALS tutoring, there are 25 different instructional sets that increase in
difficulty. Each set includes sounds, review of old sounds, sight words, review of old
sight words, decodable words and a story. (See Chapter III for a full description of the
sets and the skills taught at each level.) For the 1:1 and 1:3 standard groups, the students
reached set 24. In contrast, children in 1:1 individualized tutoring reached only set 18.
This is because students included in individualized tutoring were moved to the next
higher set only after they had mastered skills in that set. In contrast, students in the
standardized groups (1:1 and 1:3) stayed in each set for only 1 week (i.e., 3 sessions)
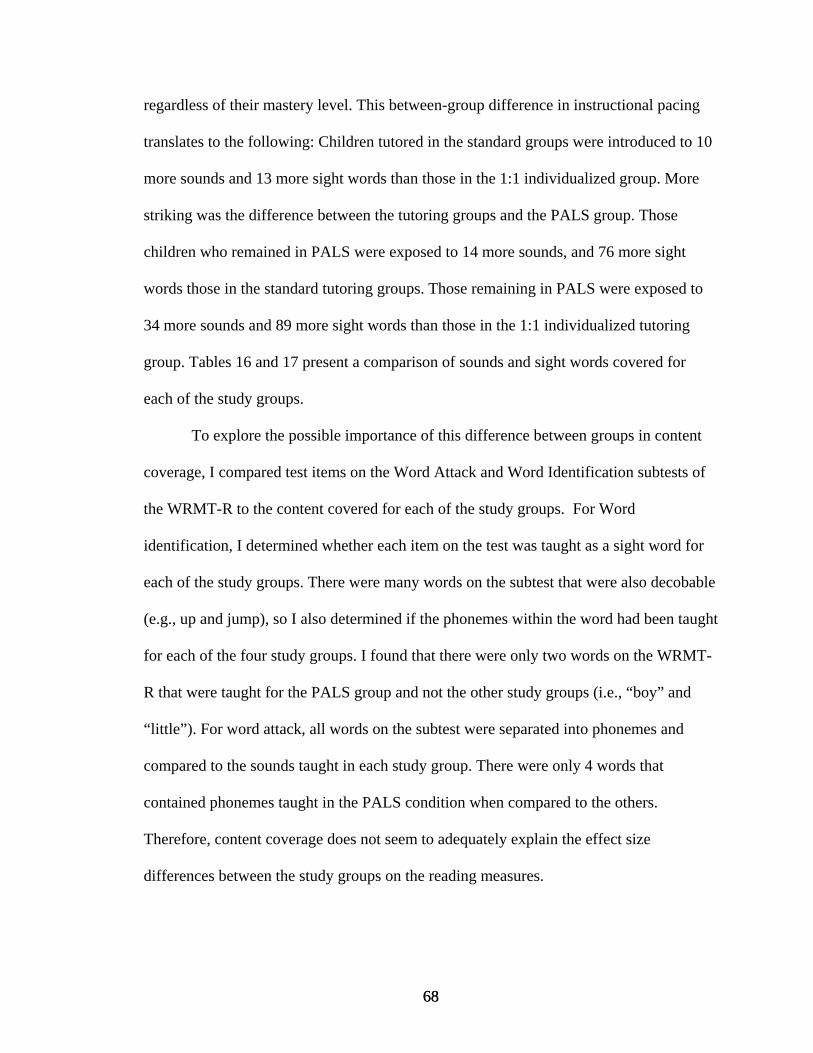
68 68
regardless of their mastery level. This between-group difference in instructional pacing
translates to the following: Children tutored in the standard groups were introduced to 10
more sounds and 13 more sight words than those in the 1:1 individualized group. More
striking was the difference between the tutoring groups and the PALS group. Those
children who remained in PALS were exposed to 14 more sounds, and 76 more sight
words those in the standard tutoring groups. Those remaining in PALS were exposed to
34 more sounds and 89 more sight words than those in the 1:1 individualized tutoring
group. Tables 16 and 17 present a comparison of sounds and sight words covered for
each of the study groups.
To explore the possible importance of this difference between groups in content
coverage, I compared test items on the Word Attack and Word Identification subtests of
the WRMT-R to the content covered for each of the study groups. For Word
identification, I determined whether each item on the test was taught as a sight word for
each of the study groups. There were many words on the subtest that were also decobable
(e.g., up and jump), so I also determined if the phonemes within the word had been taught
for each of the four study groups. I found that there were only two words on the WRMT-
R that were taught for the PALS group and not the other study groups (i.e., “boy” and
“little”). For word attack, all words on the subtest were separated into phonemes and
compared to the sounds taught in each study group. There were only 4 words that
contained phonemes taught in the PALS condition when compared to the others.
Therefore, content coverage does not seem to adequately explain the effect size
differences between the study groups on the reading measures.
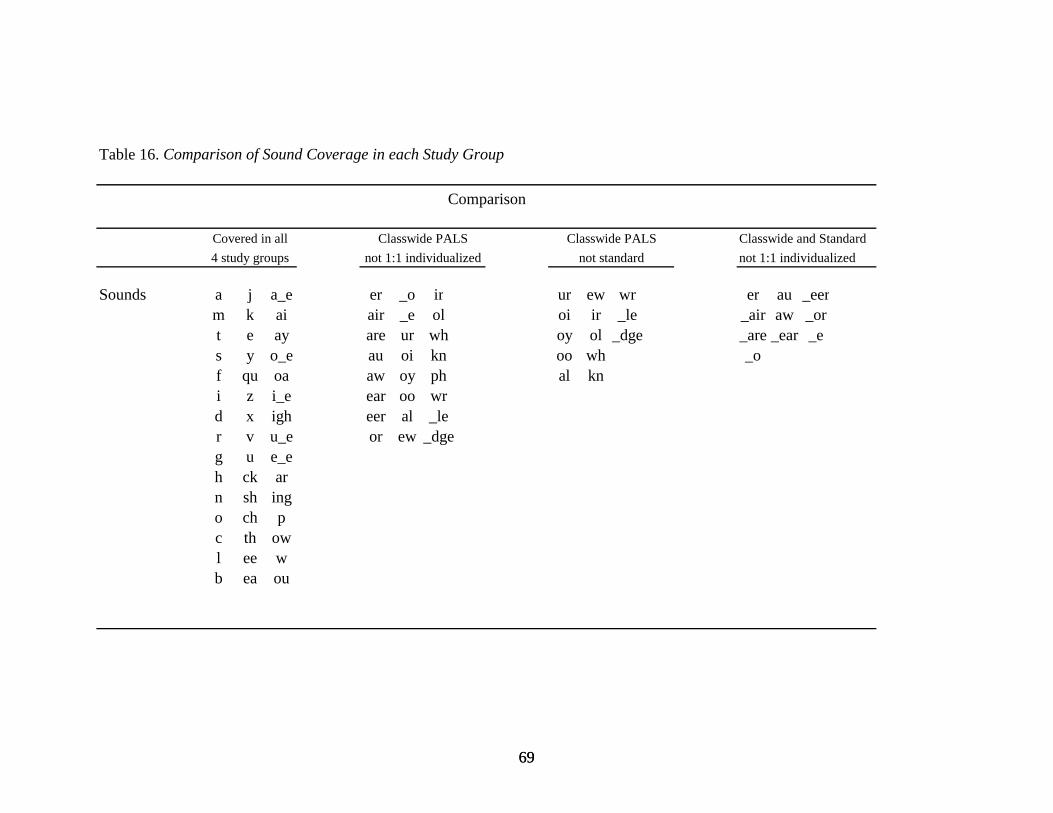
69 69
Table 16. Comparison of Sound Coverage in each Study Group
Sounds a j a_e er _o ir ur ew wr er au _eerm k ai air _e ol oi ir _le _air aw _ort e ay are ur wh oy ol _dge _are _ear _es y o_e au oi kn oo wh _of qu oa aw oy ph al kni z i_e ear oo wrd x igh eer al _ler v u_e or ew _dgeg u e_eh ck arn sh ingo ch pc th owl ee wb ea ou
Comparison
Covered in all4 study groups
Classwide and Standardnot 1:1 individualized
Classwide PALSnot 1:1 individualized
Classwide PALSnot standard
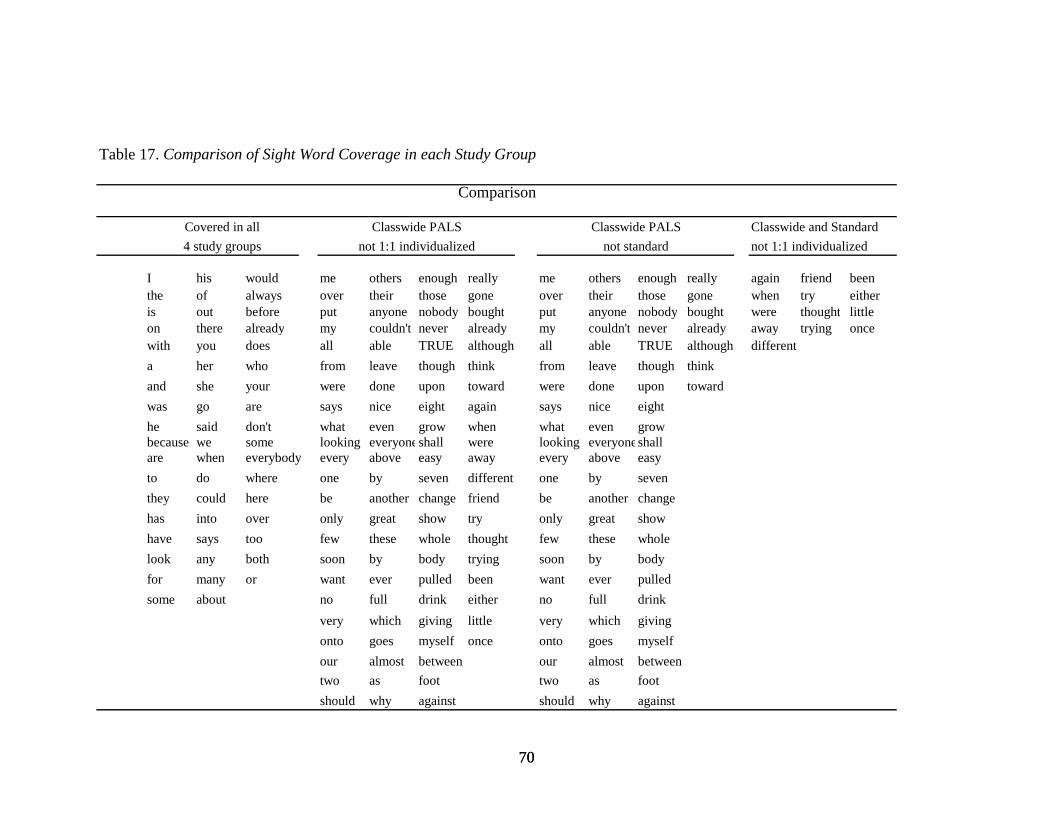
70 70
Table 17. Comparison of Sight Word Coverage in each Study Group
I his would me others enough really me others enough really again friend beenthe of always over their those gone over their those gone when try eitheris out before put anyone nobody bought put anyone nobody bought were thought littleon there already my couldn't never already my couldn't never already away trying oncewith you does all able TRUE although all able TRUE although differenta her who from leave though think from leave though thinkand she your were done upon toward were done upon towardwas go are says nice eight again says nice eighthe said don't what even grow when what even growbecause we some looking everyoneshall were looking everyoneshallare when everybody every above easy away every above easyto do where one by seven different one by seventhey could here be another change friend be another changehas into over only great show try only great showhave says too few these whole thought few these wholelook any both soon by body trying soon by bodyfor many or want ever pulled been want ever pulledsome about no full drink either no full drink
very which giving little very which givingonto goes myself once onto goes myselfour almost between our almost betweentwo as foot two as footshould why against should why against
Comparison
Covered in all4 study groups
Classwide and Standardnot 1:1 individualized
Classwide PALSnot 1:1 individualized
Classwide PALSnot standard
71 71
Growth Model of CBM
For the 6 CBM scores per student, individual growth curve analysis was
conducted using hierarchical linear modeling (HLM; Bryk, Raudenbush, & Congdon,
1996). Only the performance of students in the three tutored groups were used in the
analysis (i.e., students in the classwide PALS group were not included). Growth rates
were modeled for each of the six CBM points per child. In addition, individual predictor
variables were added to the model to determine the extent of variance each explained.
The predictor variables were tutoring group, free lunch status, pre-treatment performance
on Word Identification and Word Attack, ELL status, and WASI IQ scores.
Students in the 1:3 standard tutoring group were treated individually instead of as
a group because HLM requires this. For some of the predictor variables, there were no
feasible group mean. For example, it is impossible to assign a mean for free lunch status
or ELL status because these variables are discontinuous by nature. Table 4 provides
descriptive statistics for each of the CBM measurements (from January to April, 2002).
Figure 1 provides a plot of the students’ mean CBM performance scores.
A linear model was used to best fit the data for the six CBM measurement points
for the following reasons: the duration between measurements was relatively brief (4
months) so linear modeling was reasoned to be appropriate (see Bryk & Raudenbush,
1992). In addition, visual examination of the data indicated that mean growth over time
was linear (see Figure 1), despite a dip at the fourth measurement point.
The linear model for CBM was fitted on 49 students. Again, the 10 students who
remained in the PALS classroom without tutoring were not added to the analysis.
Because each CBM assessment was spaced 2 weeks apart, the six observations were
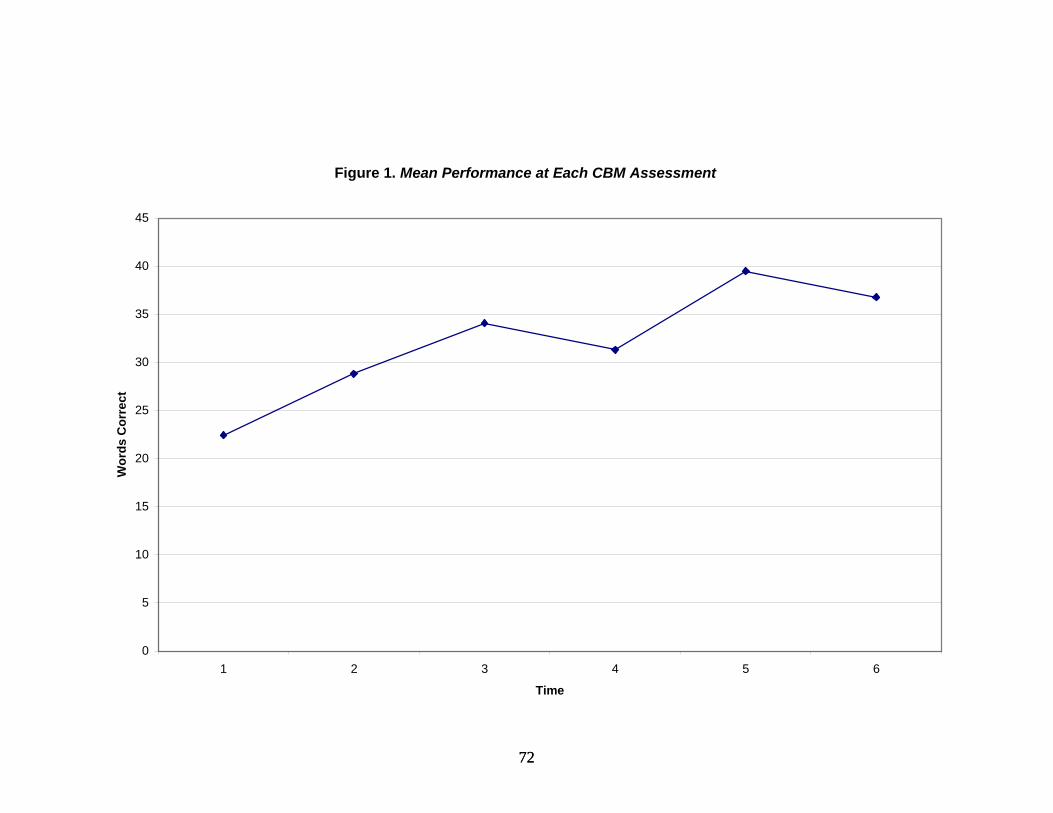
72 72
Figure 1. Mean Performance at Each CBM Assessment
0
5
10
15
20
25
30
35
40
45
1 2 3 4 5 6
Time
Wor
ds C
orre
ct
73 73
coded as -5, -4, -3, -2, -1, 0. When using this coding scheme, the intercept is the expected
performance on the last observation (Time 6—April). The results of the unconditional
linear growth model (no predictor variables entered into the equation) are presented in
Table 18. The intercept for CBM represents the estimated mean of the last observation.
The estimated intercept was 38.02 words correct per minute. The actual mean for
the students was 36.79 (see Table 14). The slope in the model represents average growth
over the 6 measures. Therefore, the 49 students gained an average of 2.98 words every
two weeks. The students’ intercept values ranged from 8.52 to 110. The slopes ranged
from -0.04 to 11.97.
Individual growth trajectories were plotted and are presented in Figure 2. Visual
examination of these trajectories highlights the heterogeneity of the students’ growth.
Those who were pretested at a higher level generally made greater gains during the
treatment period. Conversely, those with virtually no reading skills at the beginning of
treatment made smaller gains.
The hypothesis testing of fixed effects yielded highly statistically significant t
scores for the CBM measures. This indicates that both slope and intercept terms are
necessary for modeling the students’ growth. There was great variability in the students’
scores on the CBM measures based on the significant chi-square statistic. There was
especially large variance for the intercept. That is, there are important individual
differences in slope and intercept, indicating that CBM can be modeled using HLM.
An additional analysis was conducted to determine whether there were differences
between the tutoring groups, (1:1 standard, 1:1 individualized, 1:3 standard) slope and
level terms. A one-way ANOVA was conducted. There were no statistically significant
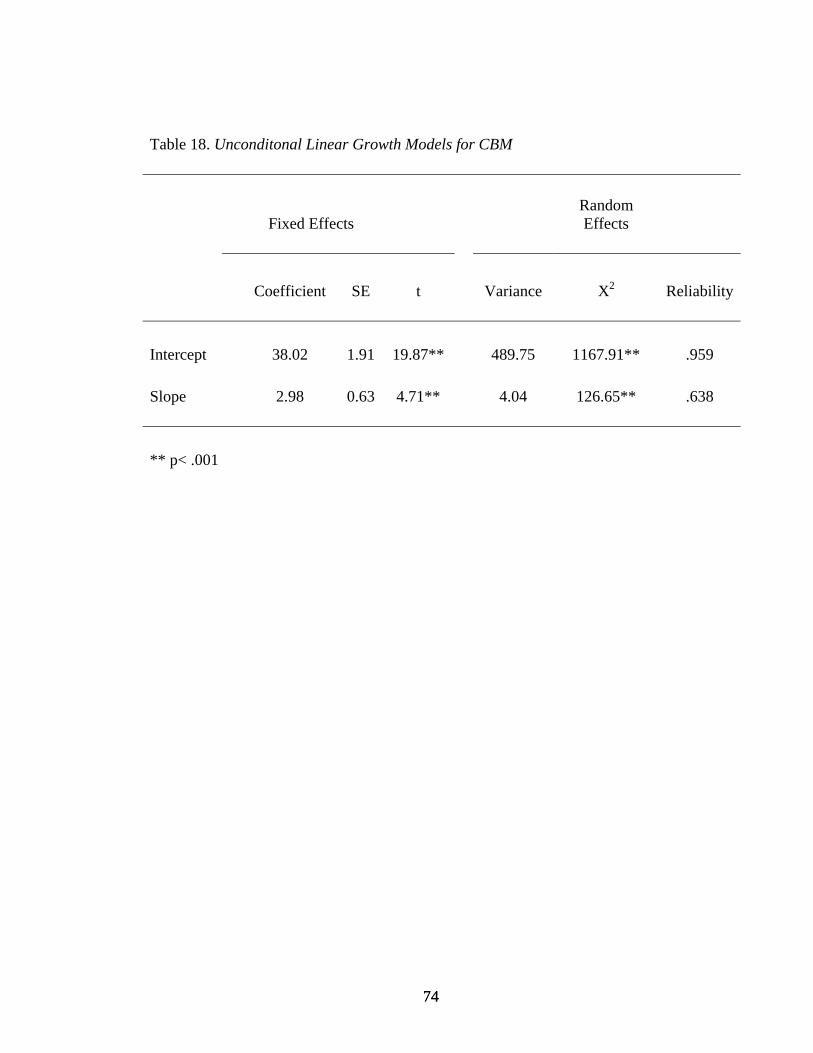
74 74
Table 18. Unconditonal Linear Growth Models for CBM
Fixed Effects Random Effects
Coefficient SE t Variance X2 Reliability
Intercept 38.02 1.91 19.87** 489.75 1167.91** .959 Slope 2.98 0.63 4.71** 4.04 126.65** .638 ** p< .001
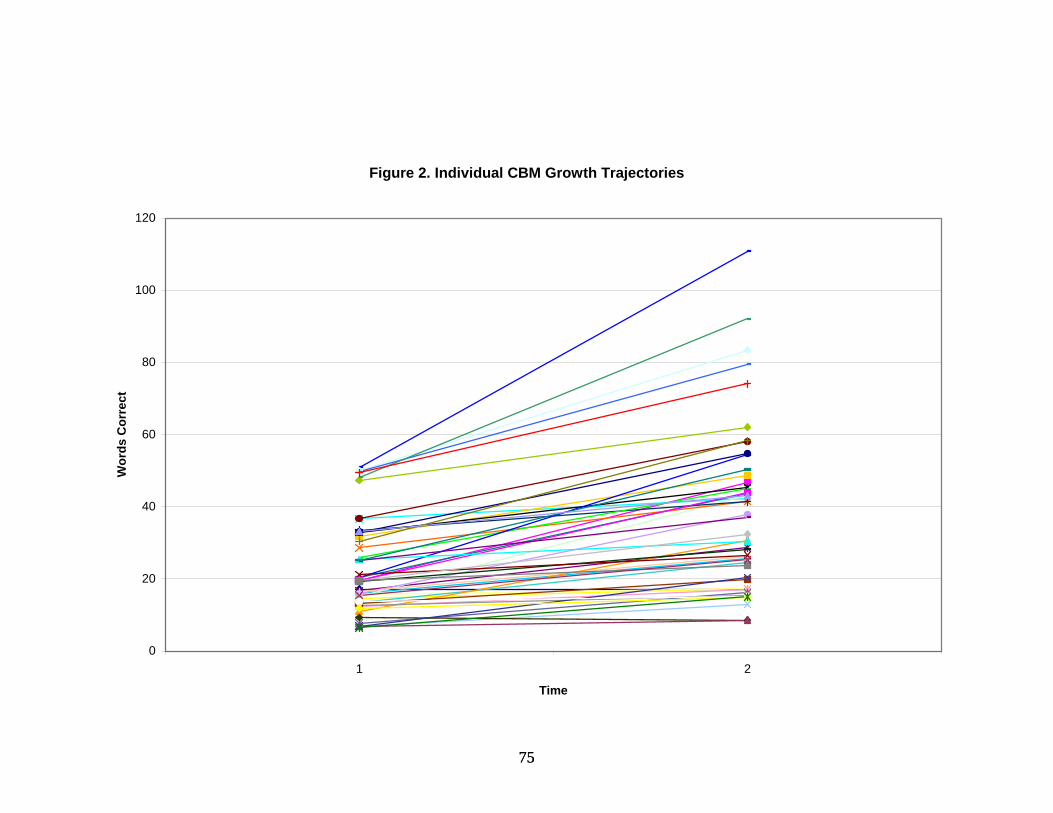
75 75
Figure 2. Individual CBM Growth Trajectories
0
20
40
60
80
100
120
1 2
Time
Wor
ds C
orre
ct
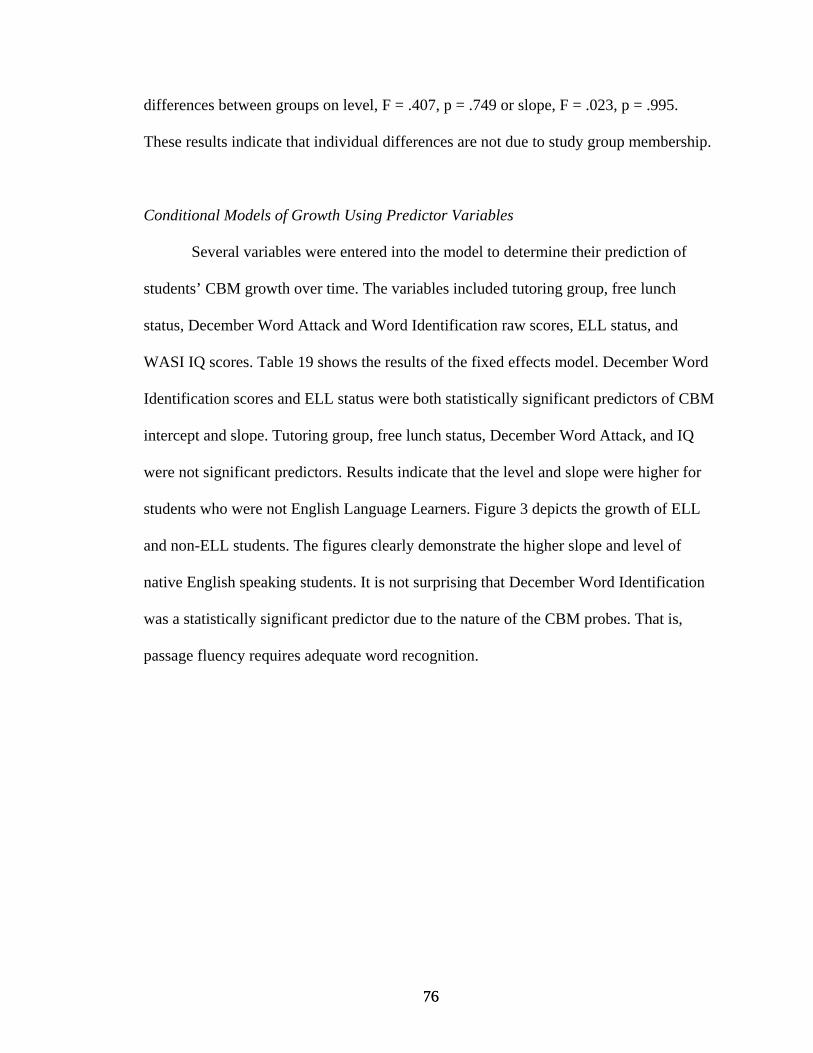
76 76
differences between groups on level, F = .407, p = .749 or slope, F = .023, p = .995.
These results indicate that individual differences are not due to study group membership.
Conditional Models of Growth Using Predictor Variables
Several variables were entered into the model to determine their prediction of
students’ CBM growth over time. The variables included tutoring group, free lunch
status, December Word Attack and Word Identification raw scores, ELL status, and
WASI IQ scores. Table 19 shows the results of the fixed effects model. December Word
Identification scores and ELL status were both statistically significant predictors of CBM
intercept and slope. Tutoring group, free lunch status, December Word Attack, and IQ
were not significant predictors. Results indicate that the level and slope were higher for
students who were not English Language Learners. Figure 3 depicts the growth of ELL
and non-ELL students. The figures clearly demonstrate the higher slope and level of
native English speaking students. It is not surprising that December Word Identification
was a statistically significant predictor due to the nature of the CBM probes. That is,
passage fluency requires adequate word recognition.
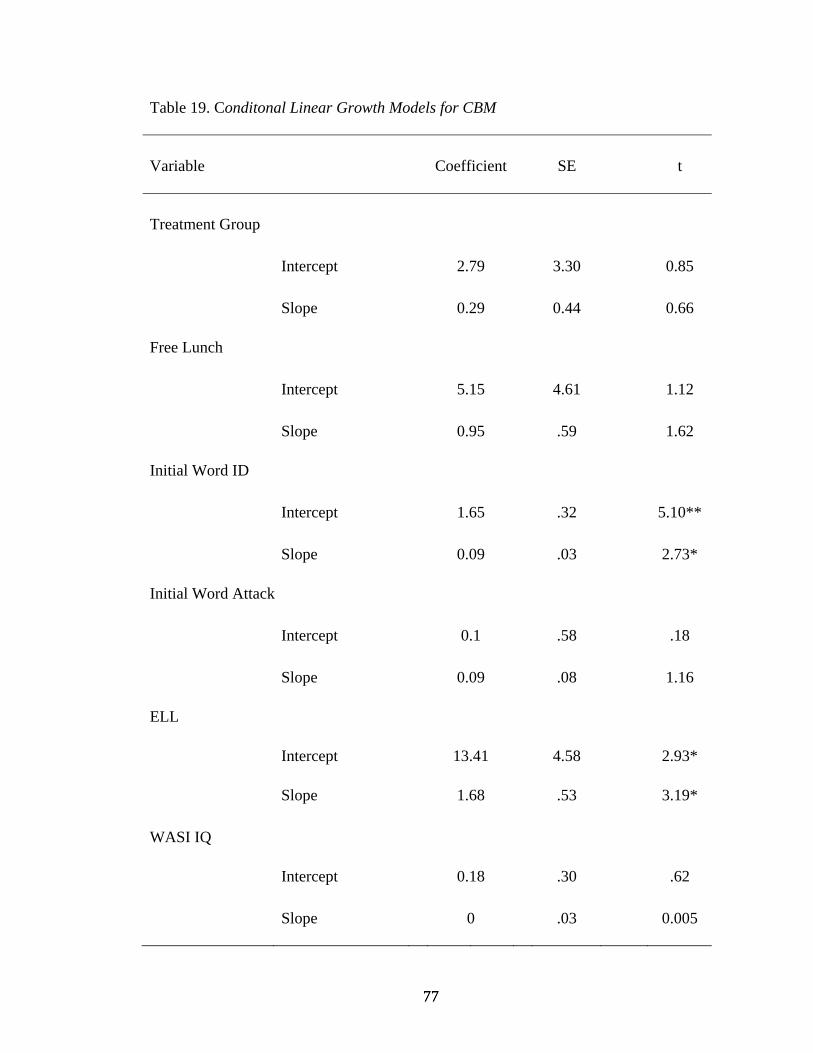
77 77
Table 19. Conditonal Linear Growth Models for CBM
Variable Coefficient SE t Treatment Group
Intercept 2.79 3.30 0.85 Slope 0.29 0.44 0.66 Free Lunch Intercept 5.15 4.61 1.12 Slope 0.95 .59 1.62 Initial Word ID Intercept 1.65 .32 5.10** Slope 0.09 .03 2.73* Initial Word Attack Intercept 0.1 .58 .18 Slope 0.09 .08 1.16 ELL Intercept 13.41 4.58 2.93* Slope 1.68 .53 3.19* WASI IQ Intercept 0.18 .30 .62 Slope 0 .03 0.005
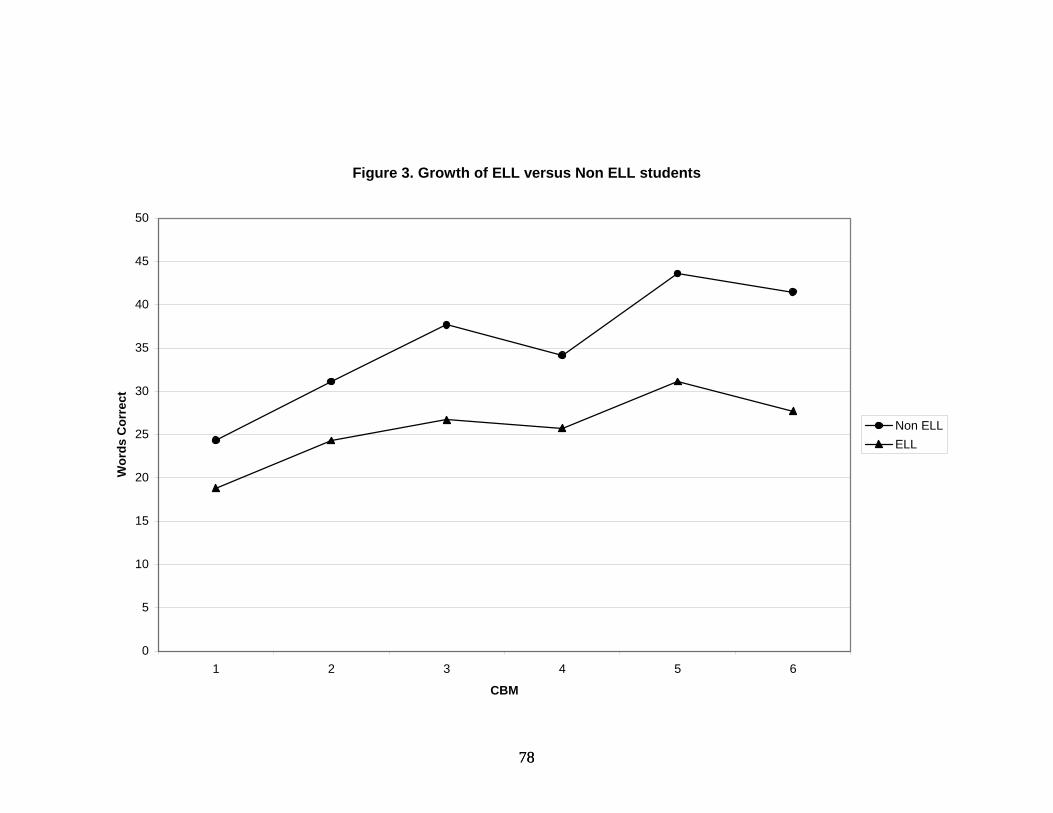
78 78
Figure 3. Growth of ELL versus Non ELL students
0
5
10
15
20
25
30
35
40
45
50
1 2 3 4 5 6
CBM
Wor
ds C
orre
ct
Non ELLELL
79 79
CHAPTER V
DISCUSSION
In this chapter, I discuss the results of the study. As already indicated, students
who were nonresponsive to generally effective reading instruction were randomly
assigned to one of four study groups: (a) 1:1 individualized, (b) 1:1 standardized, (c) 1:3
standardized, and (d) classwide PALS. The groups were compared to each other to
answer the following questions: (a) Is small group standard instruction a valid treatment
for young readers who are nonresponsive to generally effective classroom instruction or
is 1:1 standard instruction a better option? (b) Should the reading intervention be
individualized for each student or is a research-based standardized treatment protocol
(irrespective of whether it is conducted in groups of 1 or 3 students) sufficient? (c) Are
there individual student characteristics that predict responsiveness to the reading
intervention? I will discuss each of these questions in light of the results obtained. I will
also discuss their practical implications, the limitations of this study design, and future
research.
Study Group Differences
One purpose of this investigation was to determine whether there were differences
in early reading performance between the four study groups: (a) 1:1 individualized, (b)
1:1 standardized, (c) 1:3 standardized, and (d) classwide PALS. Within this design, there
were two important questions to answer. First, is 1:1 standard reading instruction better
80 80
than 1:3 standard reading instruction for low-achieving students in the second grade.
Second, is it important to individualize this instruction? Put differently, do children in the
1:1 individualized instructional group outperform children in the two standardized
reading groups and classwide PALS group?
Before continuing, it is important to note that a major challenge in conducting this
kind of research--that is, the study of nonresponders--is that the researcher always ends
up with a relatively small number of study participants, both in an absolute sense and
relative to the initial number of participants. The nonresponders in this study came from a
pool of 739 students in 40 classrooms. Of the 739 students, 214 were identified as at-risk
and only 59 were eventually identified as nonresponders. So, despite that the larger study
had many hundreds of students, very few were ultimately identified as nonresponders.
Because the sample size was small, statistical power was necessarily reduced and effect
sizes were calculated.
A basic assumption connected to both of the just-mentioned study purposes was
that students in the three tutoring groups would make more progress than those who
remained in the class-wide PALS instruction. Previous research (e.g., Torgesen et. al,
1999) documents the effectiveness of intensive, small-group reading interventions. I
hypothesized that small group (1:3) standard instruction would be as effective as 1:1
standard instruction (National Reading Panel, 1998). However, I also predicted that
children participating in the individualized 1:1 group would make the most progress of all
instructional groups because instruction in this group was tailored to meet the needs of
each individual child. Remember that children in this group were permitted to advance to
the next tutoring set only when they had reached 90% mastery on all tasks. In addition,
81 81
tutors of children in this group met weekly with other project staff to discuss each
student’s progress, and to brainstorm ways to modify materials and strategies. The
instruction in this study group was meant to represent good individualized instruction in
special education.
Effect size calculations did not support my predictions. Overall, students who
remained in the classroom (classwide PALS group) seemed to make the most progress of
the study groups on many of the reading measures. In addition, those who received
individualized instruction seemed to make the least amount of progress. These results
motivated me to conduct post hoc analyses to determine possible differences among the
four study groups that may have led to our unexpected findings.
Breadth of Material Covered
One consideration was breadth of material covered during instruction. As
discussed in Chapter 4, there were striking differences between students who remained in
the classroom (classwide PALS) and those who were pulled out for tutoring with regards
to the amount of new material covered. Students in the 1:1 standardized and 1:3
standardized tutoring condition were introduced to 10 more sounds and 13 more sight
words than those in the 1:1 individualized tutoring. Children in classwide PALS were
exposed to 34 more sounds and 89 more sight words than those in individualized
tutoring. In addition, classwide PALS students were asked to learn 14 more sounds and
76 more sight words than those in the standardized (1:1 and 1:3) tutoring conditions. It is
also noteworthy that both tutoring PALS and classwide PALS include a great deal of
repetition and review. Therefore, those in the standardized and classwide PALS
82 82
instructional groups were exposed to old sounds and sight words throughout the scope
and sequence of the tutoring. If a sound or sight word was not mastered, there was
opportunity within the review to master the words and sounds. It occurred to us that
teaching to mastery in the individualized condition was unnecessary, and perhaps even
detrimental, to students’ progress. However, an examination of the words on two subtests
of the WRMT-R (Word Identification and Word Attack) did not seem to support this
hypothesis. That is, there were only 2 words on Word Identification covered by the PALS
group and not the tutoring groups; only 4 words on the Word Attack subtest that
contained phonemes learned only by the PALS group. This between-groups difference
does not adequately explain the differential performance of the four study groups.
Individual Student Characteristics
A plot of individual growth curves demonstrated dramatic variability in students’
response to instruction based on the CBM measures. The mean number of words gained
across the 49 students in the three treatment groups (not the control PALS condition) was
2.98 words every two weeks. Rate of growth (slope) ranged from a low of -.04 to 11.97
with an average number of words read as 36.79. Again, the intercept values were highly
variable ranging from 8.52 words read correctly per minute to 110 words. Whereas the
expected number of words read correctly per minute at the end of 2nd grade is
approximately 70, tutored students read an average of only 37 words at the end of
tutoring. (At the beginning of tutoring, their average was 22 words.) Although the
tutoring did not significantly help the students approach the goal of 70 words read
correctly per minute, an average of 3 words per every other week gain is considered

83 83
acceptable. Visual inspection of the individual growth curves indicated that those who
started out with higher scores made the most progress. Those with little or no reading
skills at the start of instruction made the least amount of gains. Others (e.g., Al Otaiba &
Fuchs, 2006; Torgesen, 2004; Torgesen et al., 1999) have found this same pattern of
differential growth.
Several variables were entered into a growth curve analysis to determine what, if
any, individual student characteristics predicted growth on the CBM measures. The
variables included study group, free lunch status, initial scores on Word Identification
and Word Attack, ELL status, and WASI IQ scores. Significant predictors were ELL
status and pretest Word Identification scores. Those who were not ELL had a higher level
and slope that those who were. Those with higher pretest Word Identification scores also
had higher performance levels and slope on the CBM probes.
Results from this growth curve analysis did highlight the heterogeneity of the
sample, described in detail in Chapter IV. Specifically, the intercept values on the CBM
measures ranged from 8.52 words read correctly per mintute to 110.0. Practically, this
means that at the end of tutoring, some students were reading an average of 8 words
correctly per minute while others were reading 110 words. In addition, the students’
growth rate, or slope, ranged from -.04 to 11.97 words gained every two weeks. This has
potentially important implications in the classroom. Teachers are expected to teach large
numbers of students with very different performance levels and growth rates. Even in our
clearly defined sample of lowest- performing students (59 lowest achievers from more
than 700 students), there was still a large range in performance. Teachers need to be able
to group students with similar needs. In addition, the grouping would need to be flexible
84 84
based on ongoing assessment. For example, three children who are performing similarly
at the beginning of tutoring, may progress at very different rates. Therefore, ongoing
assessment should be used to “regroup” students as the tutoring progresses. This will
require ongoing vigilance from teachers.
Study Limitations
Whereas there were several strengths associated with this study design (random
assignment of students to study groups, well-trained and experienced tutors, research-
based treatments, documentation of treatment fidelity, and identification of
nonresponsive students using a dual discrepancy approach) there were also limitations.
First, as mentioned, sample size was relatively small to support exploration of the
importance of three tutoring groups and a control condition. However, in defense of the
study design, the 59 nonresponsive students identified during the course of the study were
drawn from a sample of more than 700 students and 200 at-risk students.
Second, the failure to find differences between the study groups may have been
due to other factors, including that the content of the tutoring lessons was based on the
classroom PALS lessons (i.e., decoding words, practicing sounds, reading controlled
text). Although the pace of tutoring was slowed down and more repetition was added, one
could question why nonresponders were continued in a treatment program that had not
been successful for them. Third, this study did not include a no-treatment control.
Students were compared to a successful, research-based reading curriculum. It would
have been useful to compare the tutoring groups to more conventional general classroom
instruction. Past research has used no treatment control conditions to compare groups and
85 85
the results were different than what we found: Tutored groups performed better than
those who stayed in the classroom (e.g., Elbaum, et al, 1999; Swanson, 1999).
Conclusions and Implications for Future Research
The topic of reading failure was given great importance and visibility in national
policy making with the signing of the No Child Left Behind legislation in 2002. Since
then, much research has focused on remediating reading difficulties among students who
are unresponsive to generally effective interventions. In this study, we found the most
impaired readers across 40 second grade classrooms and implemented relatively intensive
research-based reading interventions.
One focus was to determine whether small group instruction is as effective as
individual instruction. Research has documented that small group instruction is just as
effective as 1:1 instruction for many students (Baker, et al., 1990; Polloway, et al., 1986;
Swanson, 1999; Torgesen, 2004). In addition, group sizes of up to 6 students have been
shown to be as effective as individual instruction (Anonymous, 2001; Thurlow, 1993).
We sought to determine if this finding remained true for the most impaired readers.
Across reading measures, students in 1:3 standard tutoring fared as well as those in 1:1
individualized tutoring. However, those who participated in 1:1 standardized tutoring had
medium effect sizes on fluency measures (d = .60 for 1 the minute fluency measure and
d = .67 for the 3 minute fluency measures) when compared to students in the 1:3 standard
tutoring. In addition, those in 1:1 standard tutoring performed almost 1 SD higher on
comprehension (d = .95) and almost 2 SDs higher on elision (d = 1.90) than students in
the 1:3 standard tutoring. Conversely, students who were not tutored and who remained
86 86
in the classroom performed better than students in 1:3 standard tutoring on all measures
except for spelling. However, we interpreted these finding with caution because children
remaining in the classroom also performed better than those in the 1:1 standard tutoring
condition. Thus, our conclusions are limited to the comparison between 1:1 standard
tutoring and 1:3 standard tutoring conditions. Overall, our findings seem to support
previous research that shows that small-group instruction is as effective as 1:1
instruction. If our findings and others’ findings are valid, they have important practical
implications: More students may be served with less resources. An important
consideration is how to increase the reading comprehension in the 1:3 tutoring groups.
Remember that reading comprehension was not addressed in any of our tutoring variants,
so direct instruction in comprehension might benefit all students and decrease
dependence on incidental learning. Elbaum et al. (2000) found that reading
comprehension instruction was the most effective reading intervention. Future research
might focus on this possibility.
A second question was whether tailoring instruction to the needs of each
individual student is necessary. Children in the individualized 1:1 tutoring group were the
least likely to respond to the tutoring. This finding surprised us. It seems to strengthen the
argument for a standard treatment protocol approach that requires less resources in terms
of teacher training and time. A standard-treatment-protocol approach should be research
based and rely less on teacher judgement of what might work for a particular child. Our
analysis also indicates that students in individualized 1:1 tutoring received less coverage
of concepts and skills. Future research should specifically address the balance between
teaching to mastery and content coverage.
87 87
Finally, the study examined whether individual student characteristics predict
response to treatment. Only two characteristics were found predictive: reading skill
before tutoring began and ELL status. Those with higher reading skills before tutoring
made the most progress during tutoring. This is consistent with the available literature on
treatment outcomes (e.g., Al Otaiba & Fuchs, 2006; Torgesen, 2004; Torgesen et al.,
1999). In addition, ELL children made the least amount of progress. Future research
should explore how to best serve their needs.
Again, study results must be interpreted with caution. It is important to remember
that the “control group” in this study was receiving research-based instruction that has
been shown to be effective for young students at all achievement levels (i.e., classwide
PALS). A possible research question is how tutored students would fare compared to
students in a typical classroom or a typical special education classroom. A more
comprehensive approach to reading instruction that includes decoding, phonological
awareness, spelling, fluency, vocabulary and comprehension should also be considered as
part of the tutoring of struggling young readers.
Future Analyses
Given this study’s unexpected results and its limited power due to small sample
sizes, there are additional analyses one might conduct that are beyond the scope of this
paper. I would like to discuss several of these below.
One approach that would increase power would be to reconceptualize
comparisons between and among the study groups. Instead of calculating effect sizes for
every comparison possible, one could combine two or more groups to increase the sample
88 88
size and statistical power. For example, the group of students who remained in PALS
could be compared to all tutored study groups. Another comparison might combine both
1:1 groups (i.e., standard and individualized) and compare the combination to the 1:3
group.
In a different vein, one might conduct repeated measures analysis of pre- and post
treatment data to determine what if any student growth occurred (i.e., student growth on
reading measures) using time as the dependent variable instead of tutoring group. This
analysis would determine whether tutoring was effective in increasing reading skills
rather than looking at differences between the study groups. In addition, a so-called dual
discrepancy criterion using slope and level on CBM passages (e.g., 70 words correct per
minute; number of words gained per week) could be used to determine what students in
which tutoring groups reached that level of success.
Finally, nonparametric analyses would be appropriate for these data. Using CBM,
one might use something like an AB design in single subject research; specifically, use
the data from September to December as a baseline for all study groups because all
students were in classwide PALS at that point. Then, at the start of the tutoring (January),
determine the progress in tutoring by examining the change in slope for each study group.
This would arguably control for pretreatment differences before tutoring that were not
detectable due to the lack of statistical power.

89 89
APPENDIX
SCOPE AND SEQUENCE OF TUTORING
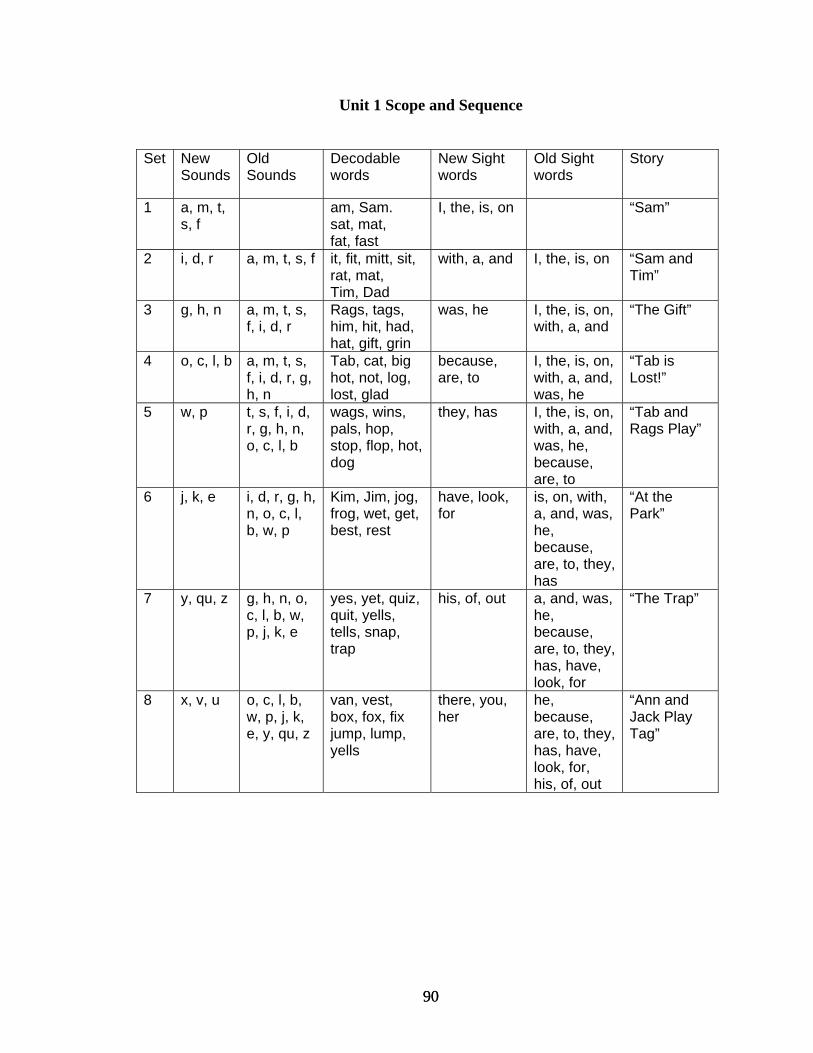
90 90
Unit 1 Scope and Sequence
Set New
Sounds Old Sounds
Decodable words
New Sight words
Old Sight words
Story
1 a, m, t, s, f
am, Sam. sat, mat, fat, fast
I, the, is, on “Sam”
2 i, d, r a, m, t, s, f it, fit, mitt, sit, rat, mat, Tim, Dad
with, a, and I, the, is, on “Sam and Tim”
3 g, h, n a, m, t, s, f, i, d, r
Rags, tags, him, hit, had, hat, gift, grin
was, he I, the, is, on, with, a, and
“The Gift”
4 o, c, l, b a, m, t, s, f, i, d, r, g, h, n
Tab, cat, big hot, not, log, lost, glad
because, are, to
I, the, is, on, with, a, and, was, he
“Tab is Lost!”
5 w, p t, s, f, i, d, r, g, h, n, o, c, l, b
wags, wins, pals, hop, stop, flop, hot, dog
they, has I, the, is, on, with, a, and, was, he, because, are, to
“Tab and Rags Play”
6 j, k, e i, d, r, g, h, n, o, c, l, b, w, p
Kim, Jim, jog, frog, wet, get, best, rest
have, look, for
is, on, with, a, and, was, he, because, are, to, they, has
“At the Park”
7 y, qu, z g, h, n, o, c, l, b, w, p, j, k, e
yes, yet, quiz, quit, yells, tells, snap, trap
his, of, out a, and, was, he, because, are, to, they, has, have, look, for
“The Trap”
8 x, v, u o, c, l, b, w, p, j, k, e, y, qu, z
van, vest, box, fox, fix jump, lump, yells
there, you, her
he, because, are, to, they, has, have, look, for, his, of, out
“Ann and Jack Play Tag”
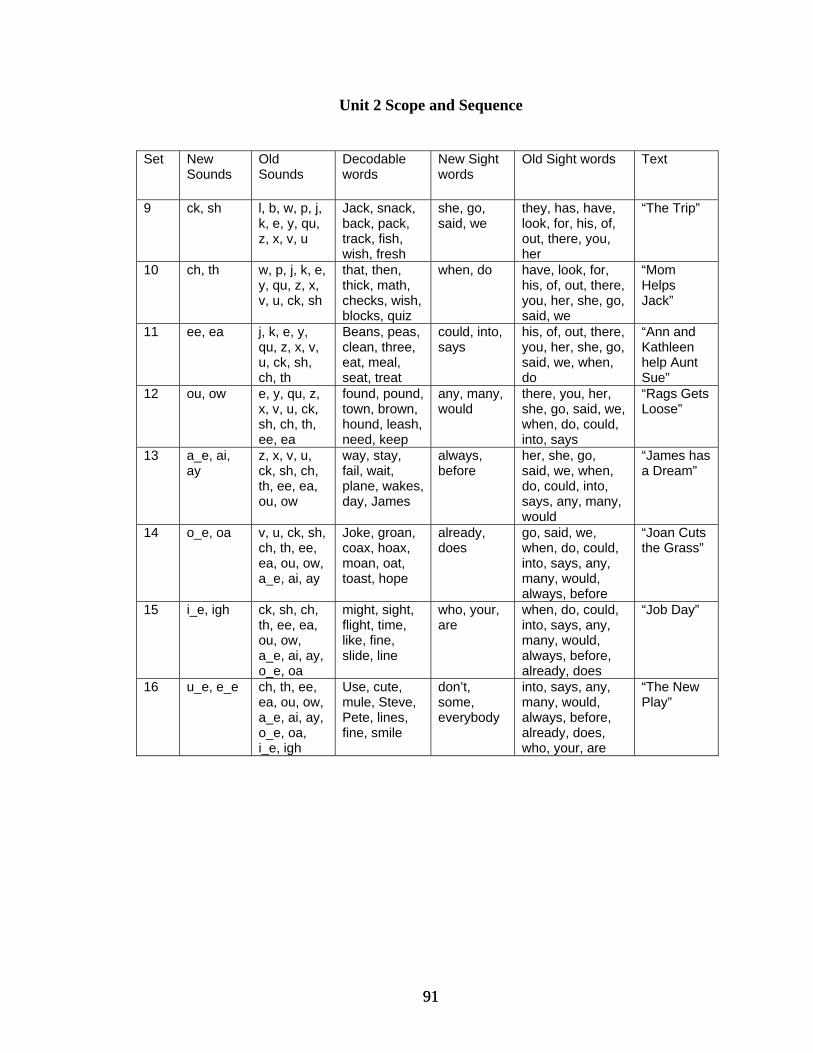
91 91
Unit 2 Scope and Sequence
Set New
Sounds Old Sounds
Decodable words
New Sight words
Old Sight words Text
9 ck, sh l, b, w, p, j, k, e, y, qu, z, x, v, u
Jack, snack, back, pack, track, fish, wish, fresh
she, go, said, we
they, has, have, look, for, his, of, out, there, you, her
“The Trip”
10 ch, th w, p, j, k, e, y, qu, z, x, v, u, ck, sh
that, then, thick, math, checks, wish, blocks, quiz
when, do have, look, for, his, of, out, there, you, her, she, go, said, we
“Mom Helps Jack”
11 ee, ea j, k, e, y, qu, z, x, v, u, ck, sh, ch, th
Beans, peas, clean, three, eat, meal, seat, treat
could, into, says
his, of, out, there, you, her, she, go, said, we, when, do
“Ann and Kathleen help Aunt Sue”
12 ou, ow e, y, qu, z, x, v, u, ck, sh, ch, th, ee, ea
found, pound, town, brown, hound, leash, need, keep
any, many, would
there, you, her, she, go, said, we, when, do, could, into, says
“Rags Gets Loose”
13 a_e, ai, ay
z, x, v, u, ck, sh, ch, th, ee, ea, ou, ow
way, stay, fail, wait, plane, wakes, day, James
always, before
her, she, go, said, we, when, do, could, into, says, any, many, would
“James has a Dream”
14 o_e, oa v, u, ck, sh, ch, th, ee, ea, ou, ow, a_e, ai, ay
Joke, groan, coax, hoax, moan, oat, toast, hope
already, does
go, said, we, when, do, could, into, says, any, many, would, always, before
“Joan Cuts the Grass”
15 i_e, igh ck, sh, ch, th, ee, ea, ou, ow, a_e, ai, ay, o_e, oa
might, sight, flight, time, like, fine, slide, line
who, your, are
when, do, could, into, says, any, many, would, always, before, already, does
“Job Day”
16 u_e, e_e ch, th, ee, ea, ou, ow, a_e, ai, ay, o_e, oa, i_e, igh
Use, cute, mule, Steve, Pete, lines, fine, smile
don’t, some, everybody
into, says, any, many, would, always, before, already, does, who, your, are
“The New Play”
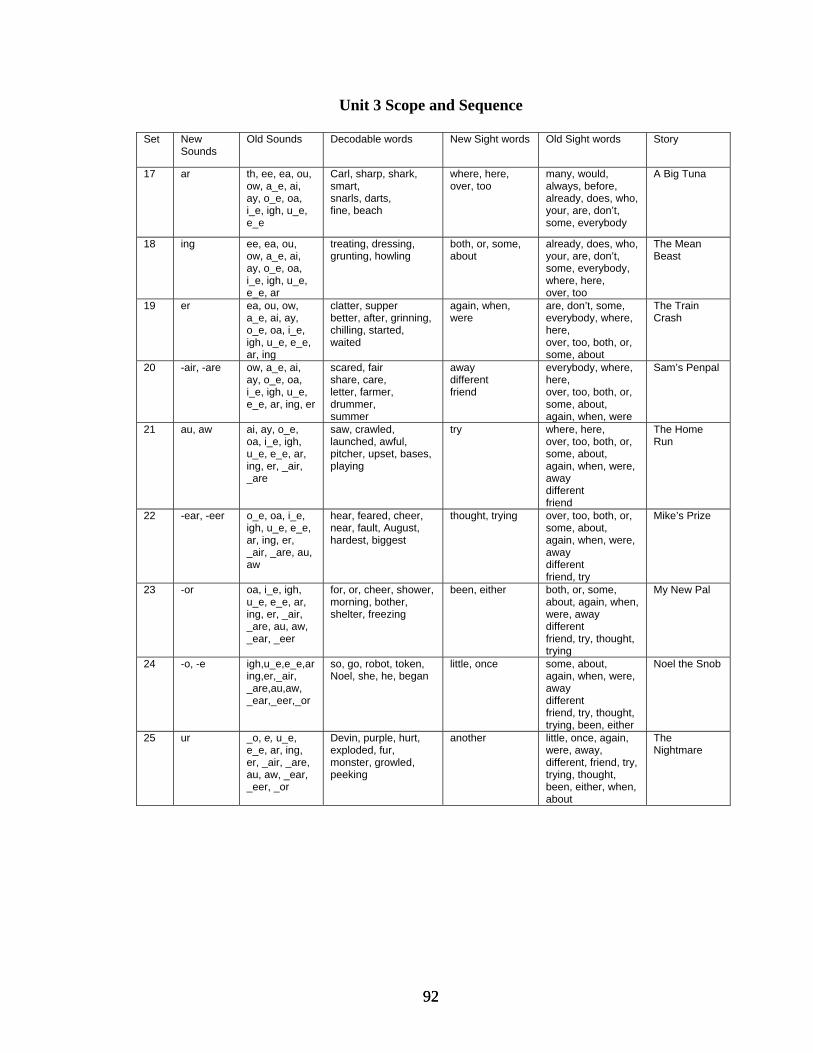
92 92
Unit 3 Scope and Sequence
Set New Sounds
Old Sounds Decodable words New Sight words Old Sight words Story
17 ar th, ee, ea, ou, ow, a_e, ai, ay, o_e, oa, i_e, igh, u_e, e_e
Carl, sharp, shark, smart, snarls, darts, fine, beach
where, here, over, too
many, would, always, before, already, does, who, your, are, don’t, some, everybody
A Big Tuna
18 ing ee, ea, ou, ow, a_e, ai, ay, o_e, oa, i_e, igh, u_e, e_e, ar
treating, dressing, grunting, howling
both, or, some, about
already, does, who, your, are, don’t, some, everybody, where, here, over, too
The Mean Beast
19 er ea, ou, ow, a_e, ai, ay, o_e, oa, i_e, igh, u_e, e_e, ar, ing
clatter, supper better, after, grinning, chilling, started, waited
again, when, were
are, don’t, some, everybody, where, here, over, too, both, or, some, about
The Train Crash
20 -air, -are ow, a_e, ai, ay, o_e, oa, i_e, igh, u_e, e_e, ar, ing, er
scared, fair share, care, letter, farmer, drummer, summer
away different friend
everybody, where, here, over, too, both, or, some, about, again, when, were
Sam’s Penpal
21 au, aw ai, ay, o_e, oa, i_e, igh, u_e, e_e, ar, ing, er, _air, _are
saw, crawled, launched, awful, pitcher, upset, bases, playing
try
where, here, over, too, both, or, some, about, again, when, were, away different friend
The Home Run
22 -ear, -eer o_e, oa, i_e, igh, u_e, e_e, ar, ing, er, _air, _are, au, aw
hear, feared, cheer, near, fault, August, hardest, biggest
thought, trying over, too, both, or, some, about, again, when, were, away different friend, try
Mike’s Prize
23 -or oa, i_e, igh, u_e, e_e, ar, ing, er, _air, _are, au, aw, _ear, _eer
for, or, cheer, shower, morning, bother, shelter, freezing
been, either both, or, some, about, again, when, were, away different friend, try, thought, trying
My New Pal
24 -o, -e igh,u_e,e_e,ar ing,er,_air, _are,au,aw, _ear,_eer,_or
so, go, robot, token, Noel, she, he, began
little, once some, about, again, when, were, away different friend, try, thought, trying, been, either
Noel the Snob
25 ur _o, e, u_e, e_e, ar, ing, er, _air, _are, au, aw, _ear, _eer, _or
Devin, purple, hurt, exploded, fur, monster, growled, peeking
another little, once, again, were, away, different, friend, try, trying, thought, been, either, when, about
The Nightmare
93 93
REFERENCES
AlOtaiba, S. & Fuchs, D. (2002). Characteristics of children who are unresponsive to early literacy intervention: A review of the literature. Remedial and Special Education, 23, 300-316.
Baker, J., Young, M., & Martin, M. (1990). The effectiveness of small-group versus one-to-one remedial instruction for six students with learning difficulties. Elementary School Journal, 91, 65-76. Blachman, B. A., Ball, E., Black, R., & Tangel, D. (1994). Kindergarten teachers develop phoneme awareness in low-income, inner-city classrooms: Does it make a difference? Reading and Writing: An Interdisciplinary Journal, 6, 1-17. Bryk, A. S., & Raudenbush, S. W. (1992). Hierarchical linear models: Applications and data analysis methods. London: Sage. Bryk, A. S., Raudenbush, S. W., & Congdon, R. T. (1996). Hierarchical linear and nonlinear modeling with the HLM/2L and HLM/3L programs: Computer program and users guide. Chicago, IL: Scientific Software International, Inc. Dorval, B., Wallach, L, & Wallach, M. A. (1978). Field evaluation of a tutorial reading program emphasizing phoneme identification skills. The Reading Teacher, 31, 784-790. Elbaum, B. E., Schumm, J. S., & Vaughn, S. (1997). Urban middle-school elementary students’ perceptions of grouping formats for reading instruction. Elementary School Journal, 97, 475-500. Elbaum, B. Vaughn, S., Hughes, M., & Moody, S. W. (1999). Grouping practices and reading outcomes for students with disabilities. Exceptional Children, 65, 399-415. Elbaum, B., Vaughn, S., Hughes, M., Moody, S. W., & Schumm, J. S. (2000). How reading outcomes of students with disabilities are related to instructional grouping formats: A meta-analytic review. In R. Gersten, E. P. Schiller, & S. Vaughn (Eds.), Contemporary Special Education Research: Syntheses of Knowledge Base on Critical Instructional Issues. Mahwah, N. J.: Erlbaum and Associates. Ellson, D. G., Barber, L., Engle, T. L., & Kampworth, L. (1965). Programmed tutoring: a teaching aid and a research tool. Reading Research Quarterly, 1, 77-127. Ellson, D. G., Harris, P., & Barber, L. (1968). A field test of programmed and directed tutoring. Reading Research Quarterly, 3, 307-367. Foorman, B. R. Francis, D. J., Fletcher, J. M., Schatschneider, C., & Mehta, P. (1998). The role of instruction in learning to read: Preventing reading failure in at-risk children. Journal of Educational Psychology, 68, 70-74.
94 94
Fuchs, L. S., & Deno, S. L. (1992). Effects of curriculum within curriculum-based measurement. Exceptional Children, 58, 232-243. Fuchs, D., Fuchs, L. S., & Compton, D. L (2004). Identifying reading disabilities by responsiveness-to-instruction: Specifying measures and criteria. Learning Disability Quarterly, 27, 216-227. Fuchs, D., Fuchs, L. S., Thompson, A., Svenson, E., Yen, L., Al Otaiba, S., Yang, N., McMaster, K. N., Prentice, K., Kazdan, S., & Saenz, L. (2001). Peer-assisted learning strategies in reading: Extensions for kindergarten, first grade, and high school. Remedial and Special Education, 22, 15-21. Fuchs, L. S., Fuchs, D., & Hamlett, C. L. (1989). Monitoring reading growth using student recalls: Effects of two teacher feedback systems. Journal of Educational Research, 83, 103-111. Fuchs, L. S., Fuchs, D., & Hamelett, C. L. (1990). Curriculum-based measurement: a standardized, long-term goal approach to monitoring student progress. Academic Therapy, 25, 615-632. Fuchs, L. S., Fuchs, D., Hamlett, C. L., Walz, L., & Germann, G. (1993). Formative evaluation of academic progress: How much growth can we expect? School Psychology Review, 22, 27-48. Fuchs, L. S., Fuchs, D., & Maxwell, L. (1988). The validity of informal reading comprehension measures. Remedial and Special Education, 20-29. Fuchs, L. S., Fuchs, D., & Speece, D. L. (2002). Treatment validity as a unifying construct for identifying learning disabilities, Learning Disability Quarterly, 25, 33-45. Hasbrouck, J. E., Tindal, G. (1992). Curriculum-based oral reading fluency norms for students in grades 2 through 5. Teaching Exceptional Children, 24, 41-44. Juel, C. (1988). Learning to read and write: A longitudinal study of fifty-four children from first through fourth grade. Journal of Educational Psychology, 80, 437-447. Kavale, K. A. (2002). Mainstreaming to full inclusion: from orthogenesis to pathogenesis of an idea. International Journal of Disability, Development, and Education, 49, 201- 214. Lou, Y. Abrami, P. C., Spence, J. C., Poulsen, C., Chambers, B., & d”Apollonia, S. (1996). Within-class grouping: A meta-analysis. Review of Education Research, 66, 423-458.
95 95
Mastropieri, M. A., & Scruggs, T. E. (1997). Best practices in promoting reading comprehension in students with learning disabilities: 1977 to 1996. Remedial and Special Education, 18, 197-213. Marston, D. (1988). The effectiveness of special education: a time series analysis of reading performance in regular and special education settings. Journal of Special Education, 21, 13-26. Mathes, P. M., Howard, J. K., Allen, S. H., & Fuchs, D. (1998). Peer-assisted learning strategies for first-grade readers: Responding to the needs of diversity. Reading Research Quarterly, 33, 62-94. McCleary, E. (1971). Report of results of Tutorial Reading Project. The Reading Teacher, 24, 556-559. Moody, S. W., Vaughn, S., & Schumm, J. S. (1997). Instructional grouping for reading. Remedial and Special Education, 18, 347-356. National Reading Panel (1998). Teaching Children to Read: An Evidence-Based Assessment of the Scientific Research Literature on Reading and its Implications for Reading Instruction. Washington, DC: National Academy Press. Polloway, E. A., Cronin, M. E., & Patton, J. R. (1986). The efficacy of group versus one to-one instruction: A review. Remedial and Special Education, 7, 22-30. Schumm, J. S., Moody, S. W., & Vaughn, S. (2000). Grouping for reading instruction: Does one size fit all? Journal of Learning Disabilities, 33, 477-488. Swanson, H. L. (1999). Reading Research for students with LD: A metaanalysis of intervention outcomes. Journal of Learning Disabilities, 32, 504-532.
Thurlow, M. L., Ysseldyke, J. E., Wotruba, J. W., & Algozzine, B. (1993). Instruction in special education classrooms under varying student-teacher ratios. The Elementary School Journal, 93, 305-320. Torgesen, J. K. (2004). Preventing Early Reading Failure—and its devastating downward spiral. American Educator, Fall, 2004. Torgesen, J. K. (2002). The prevention of reading difficulties. Journal of School Psychology, 40, 7-26. Torgesen, J. K. (2000). Individual differences in response to early interventions in reading: The lingering problem of treatment resisters. Learning Disabilities Research & Practice, 15, 55-64. Torgesen, J. K., Alexander, A. W., Wagner, R. K., Rashotte, C. A., Voeller, K. K. S., &
96 96
Conway, T. (2001). Intensive remedial instruction for children with severe reading disabilities: Immediate and long-term outcomes from two instructional approaches. Journal of Learning Disabilities, 34, 33-58, 78. Torgesen, J. K., & Davis, C. (1996). Individual difference variables that predict response to training in phonological awareness. Journal of Experimental Child Psychology, 63, 1- 21. Torgesen, J. K., Wagner, R. K., & Rashotte, C. A. (1997). Prevention and remediation of severe reading disabilities: Keeping the end in mind. Scientific Studies of Reading, 217- 234. Torgesen, J. K., Wagner, R. K., Rashotte, C. A., & Herron, J. (1999). A comparison of two computer assisted approaches to the prevention of reading disabilities in young children. Unpublished manuscript, Florida State University, Tallahassee. Vaughn, S., Hughes, M. T., Moody, S. W. & Elbaum, B. (2001). Instructional grouping for reading for students with LD: Implications for practice. Intervention in School and Clinic, 36, 131-137. Vaughn, S., Moody, S. W., & Schumm, J. S. (1998). Broken Promises: Reading instruction in the resource room. Exceptional Children, 64, 211-225. Vellutino, F. R., Scanlon, D. M., Sipay, E. R., Small, S., Chen, R., Pratt, A., Denckla, M. B. (1996). Cognitive profiles of difficult-to-remediate and readily remediated poor readers: Early intervention as a vehicle for distinguishing between cognitive and experiential deficits as basic causes of specific reading disability. Journal of Educational Psychology, 88, 601-638. Wallach, M. A., & Wallach, L. (1976). Teaching all children to read. Chicago: University of Chicago Press. Wasik, B. A., & Slavin, R. E. (1993). Preventing early reading failure with one-to-one tutoring: A review of five programs. Reading Research Quarterly, ??, 179-200. Wechsler, D. (1974). Wechsler Intelligence Scale for Children-Revised. New York: Psychological Corporation.