Embed Size (px)
Citation preview
6.1.2014
Supervisor: Guenter Sartor | Ambuehl Alisha
MATURA PAPER
KANTONSSCHULE
SARGANS
THE EFFECTS OF GLUTAMIC ACID ON
INSECT GROWTH
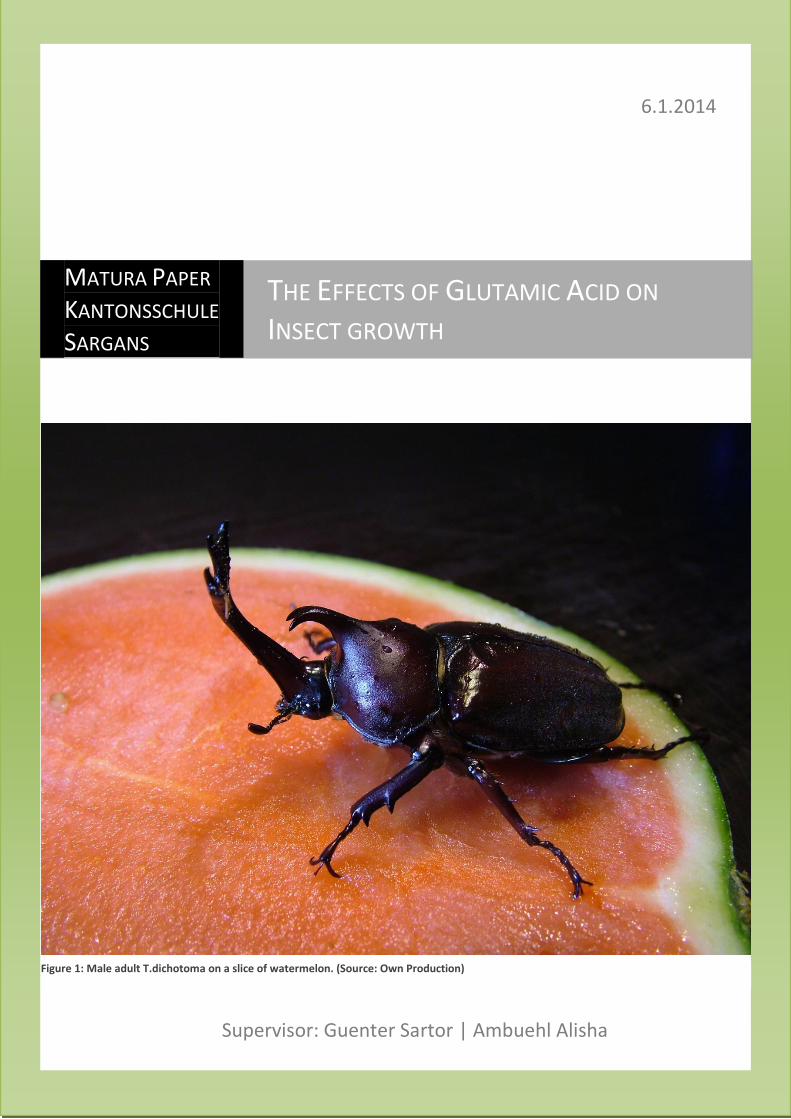
Figure 1: Male adult T.dichotoma on a slice of watermelon. (Source: Own Production)

Abstract II
Abstract
Glutamic acid is a proteinogenic non-essential amino acid that has become very popular in the form
of monosodium glutamate as a food additive that is found in the ingredient lists of almost all
processed foods. Glutamic acid is also used as a supplement in larvae food, where it is claimed to
enhance growth, especially in Asian cultures where beetles are reared and kept as pets.
This paper focuses on the scientific investigation of the effects of glutamic acid on the growth of
Trypoxylus (Allomyrina) dichotoma tsunobosonus larvae. The results of the described experiment
show that no statistically significant change to weight increase occurs when glutamic acid is added to
the food substrate of the beetle larvae in a specified proportion.

Preface III
Preface
Here, I would like to thank my father for helping provide me the resources for my experiment and my
mother for providing me with emotional support and daily meals.
I would also like to thank Mr. Sartor Guenter, my supervisor, for assisting me with answers to my
many questions and his insightful response to any situations that presented themselves during this
experiment.
Conducting this experiment was both fascinating and stunning; it has changed my view not only
about scientific work but also about the beauty of beetles and larvae.
Table of Contents IV
Table of Contents
Abstract ....................................................................................................................................... II
Preface ........................................................................................................................................ III
Table of Contents ........................................................................................................................ IV
1.1 Introduction ................................................................................................................................. 1 1.2 Objectives and Focus Questions .................................................................................................. 2 1.3 Materials and Methods ................................................................................................................ 2 1.3.1 Materials ...................................................................................................................................... 2 1.3.2 Methods ....................................................................................................................................... 3
2 Glutamic Acid ..................................................................................................................... 5
2.1 Definition ..................................................................................................................................... 5 2.2 Functions of Proteinogenic Amino Acids ..................................................................................... 5 2.3 Areas of Usage ............................................................................................................................. 6
3 Beetle Breeding.................................................................................................................. 8
3.1 Background .................................................................................................................................. 8 3.2 Test Organism: Trypoxylus (Allomyrina) dichotoma tsunobosonus ............................................ 8 3.3 Glutamic Acid in Beetle Breeding ................................................................................................ 9
4 Experiment ...................................................................................................................... 10
4.1 Protocol ...................................................................................................................................... 10 4.2 Data Tables ................................................................................................................................ 12 4.2.1 1st Weight Check (11/06/ 2013) ................................................................................................. 12 4.2.2 2nd Weight Check (11/20/2013) ................................................................................................. 14 4.2.3 3rd Weight Check (12/04/ 2013) ................................................................................................ 16 4.2.4 4th Weight Check (12/18/2013) ................................................................................................. 18 4.2.5 5th Weight Check (01/01/2014) ................................................................................................. 20 4.3 Analysis of Data .......................................................................................................................... 22
5 Summary/Discussion ........................................................................................................ 24
6 List of References ............................................................................................................... V
7 Table of Figures ................................................................................................................ VII
Appendices .................................................................................................................................. 1
1 Declaration of Authenticity................................................................................................. 1
Table of Contents 1
1.1 Introduction
Outside of the biochemical community, the amino acid glutamic acid and its salts, known as
glutamates, are mostly understood to be enhancers of palatability through conferring the “fifth”
taste sense called umami. A well known representative for this flavour enhancing property is the
widely used food additive, monosodium glutamate, a sodium salt of glutamic acid.
This paper’s main objective lies in investigating the role glutamic acid plays as one of the 20
proteinogenic amino acids, by adding it to the food of living organisms. Glutamic acid and glutamine,
an amino acid synthesised from glutamic acid and ammonia, are proteinogenic, which means they
can be condensed into peptides and polypeptides through translation (the second stage of protein
synthesis). Those polypeptides then serve as building blocks for protein synthesis. Glutamic acid, as
well as glutamine, is a non-essential amino acid, meaning that our body can natively synthesize it;
this is in contrast to essential amino acids, which can only be obtained through our diet. Outside their
use as a precursor to protein synthesis, the amino acid glutamine has various other functions,
including preserving the acid-base balance in the kidney by producing ammonium and being a source
for cellular energy, similar to glucose. This has led glutamine to be marketed as a supplement for
supporting muscle growth in the weightlifting and bodybuilding communities.
An interesting use of glutamic acid has occurred in Asian cultures. In Japan, for example, where
insects are bred as pets, it is generally put into insect food in belief that it somehow enhances their
growth. However, there has never been a study investigating whether the addition of glutamic acid
to their diet really does affect their size, or not.
The experiment described in this paper will analyse and document the effects of the proteinogenic
amino acid; glutamic acid on the living organisms: Trypoxylus (Allomyrina) dichotoma tsunobosonus a
subfamily of the Dynastinae.
Table of Contents 2
1.2 Objectives and Focus Questions
The main objective of this paper is to investigate the effects glutamic acid has on the larval growth of
Trypoxylus (Allomyrina) dichotoma tsunobosonus, when added to their diet.
Some of the main questions will be:
-How can we, to some extent biochemically, explain the outcome of the experiment? Can the
outcome be explained by what we already know about glutamic acid?
-How clearly can we say that glutamic acid affects insect growth? What are possible confounders
contributing to any result bias?
-Are there any anticipated or unanticipated side effects? For example, sudden death, body
deformities, etc.? Can we say that, if they occur, they are related to glutamic acid?
-Do other properties of glutamic acid play a role in the experiment and the outcome? For example,
does its flavour enhancing property affect the insect larvae in any way?
1.3 Materials and Methods
1.3.1 Materials
- Saw dust of Fagus sylvatica, dried and untreated, FSC standard wood form Emmental in Switzerland.
Grain size: 2-10mm with 10% part of wood dust (<2mm)
- Beetle jelly, made in Taiwan, imported by Beetlejelly.eu
-Ikea Samla boxes of 65l, 45l and 5l volumes (two 65l, four 15l and twelve 5l boxes)
-Tap water from Unterterzen, Switzerland
-Wheat bran, 100% swiss made, CNf compliant, from the LANDI in Flums, Switzerland.
- Camera; FinePix S7000, Fujifilm.
Substances:
Glutamic acid (C5H9NO4), in solid form, produced by Hänseler AG, obtained in the Städtli Apotheke in
Walenstadt.
Ammonium nitrate (NH4NO3), in solid form, obtained in the Kantonsschule Sargans’ school
laboratory.
Test Organisms:
The organisms used in the experiment are larvae of (Trypoxylus (Allomyrina) dichotoma
tsunobosonus) a rhinoceros beetle species.
This specific species is chosen for various reasons:
Firstly and mainly, out of all the rhinoceros beetles, Trypoxylus dichotoma has the shortest
incubation period and it takes less than a year for the larvae to become adult beetles.
Table of Contents 3
Furthermore T.dichotoma is one of the most commonly kept pet beetles in Asia, therefore making it
a representational member of the subfamily Dynastinae.
1.3.2 Methods
The experiment was conducted utilizing the following steps:
1. Preparation of the breeding boxes for retrieving the needed beetle eggs:
One male and three female T.dichotoma beetles are brought together in a 65 l box filled to ¾ with
substrate. The substrate basis consisted of flake soil, a 8 to 2 parts mixture of beech sow dust and
wheat bran, which underwent six months of fermentation. 4-5 beetle jellies were added to the box
and had to be exchanged with fresh ones every ten days to ensure a nutritious diet. Pieces of oak
bark were put on top of the substrate to help beetles grip onto it in case they fall over.
Two such breeding boxes were prepared in total and then left alone for about 3 weeks so that the
beetles could mate and lay eggs undisturbed.
2. Preparation of the test groups:
Four 45l volume boxes of larvae food, which consisted of the same substrate used for the breeding
boxes, were prepared two weeks in advance of the retrieval of the beetle eggs.
Each box formed an experimental group to which the substances that are mentioned below were
added dissolved in 1.5l of boiling tap water (for Group A only water is added):
A) Control Group with no added supplements in the substrate (larvae food).
B) Glutamic acid Group 1 with 10g of glutamic acid added to the substrate.
C) Glutamic acid Group 2 with 20g of glutamic acid (doubled amount of Group B)added to their
substrate
D) Control Group 2, with nitrogen supplement( in form of ammonium nitrate) that equals the
amount of nitrogen contained in glutamic acid. For 10g of glutamic acid the calculated amount of
nitrogen is 5.44g.
Explanation: Because of the nitrogen content of glutamic acid, it acts as a nitrogen fertilizer in any
substrate. To ensure that the experiment outcome was not only related to the nitrogen content of
glutamic acid a second control group was set up with a nitrogen source comparable to the amount of
nitrogen contained in the chemical structure of glutamic acid.
The finished 45l of substrate per group was put into four different boxes that were labelled
respectively.
3. Retrieval of beetle eggs and distribution into groups:
After 20 days the female beetles should have laid eggs, which are ready to be harvested.
The parent beetles were removed from the boxes as well as the bark and the beetle jellies. The
substrate was very carefully searched for beetle eggs, which have a clear white colour and are about
2-5mm in diameter (Figure 1). The eggs were then put into separate small containers, which were
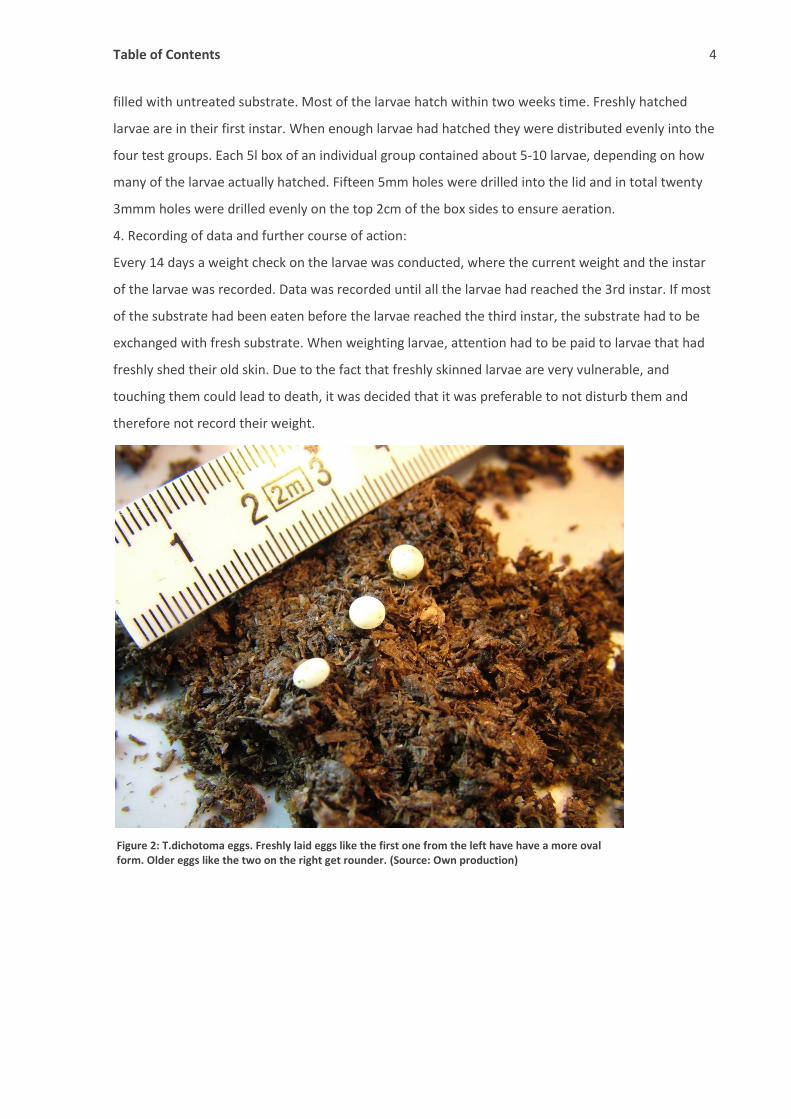
Table of Contents 4
filled with untreated substrate. Most of the larvae hatch within two weeks time. Freshly hatched
larvae are in their first instar. When enough larvae had hatched they were distributed evenly into the
four test groups. Each 5l box of an individual group contained about 5-10 larvae, depending on how
many of the larvae actually hatched. Fifteen 5mm holes were drilled into the lid and in total twenty
3mmm holes were drilled evenly on the top 2cm of the box sides to ensure aeration.
4. Recording of data and further course of action:
Every 14 days a weight check on the larvae was conducted, where the current weight and the instar
of the larvae was recorded. Data was recorded until all the larvae had reached the 3rd instar. If most
of the substrate had been eaten before the larvae reached the third instar, the substrate had to be
exchanged with fresh substrate. When weighting larvae, attention had to be paid to larvae that had
freshly shed their old skin. Due to the fact that freshly skinned larvae are very vulnerable, and
touching them could lead to death, it was decided that it was preferable to not disturb them and
therefore not record their weight.
Figure 2: T.dichotoma eggs. Freshly laid eggs like the first one from the left have have a more oval form. Older eggs like the two on the right get rounder. (Source: Own production)
Glutamic Acid 5
2 Glutamic Acid
This paper focuses on the amino acid glutamic acid (abbreviated as Glu or E).
2.1 Definition
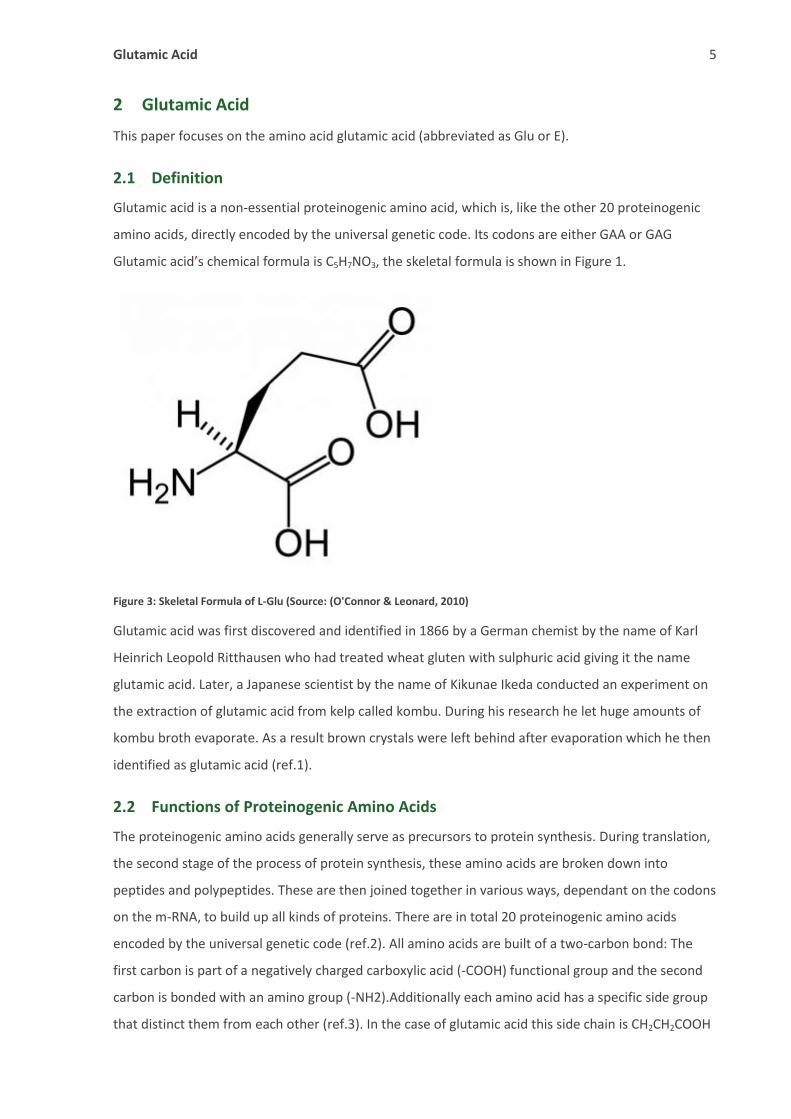
Glutamic acid is a non-essential proteinogenic amino acid, which is, like the other 20 proteinogenic
amino acids, directly encoded by the universal genetic code. Its codons are either GAA or GAG
Glutamic acid’s chemical formula is C5H7NO3, the skeletal formula is shown in Figure 1.
Figure 3: Skeletal Formula of L-Glu (Source: (O'Connor & Leonard, 2010)
Glutamic acid was first discovered and identified in 1866 by a German chemist by the name of Karl
Heinrich Leopold Ritthausen who had treated wheat gluten with sulphuric acid giving it the name
glutamic acid. Later, a Japanese scientist by the name of Kikunae Ikeda conducted an experiment on
the extraction of glutamic acid from kelp called kombu. During his research he let huge amounts of
kombu broth evaporate. As a result brown crystals were left behind after evaporation which he then
identified as glutamic acid (ref.1).
2.2 Functions of Proteinogenic Amino Acids
The proteinogenic amino acids generally serve as precursors to protein synthesis. During translation,
the second stage of the process of protein synthesis, these amino acids are broken down into
peptides and polypeptides. These are then joined together in various ways, dependant on the codons
on the m-RNA, to build up all kinds of proteins. There are in total 20 proteinogenic amino acids
encoded by the universal genetic code (ref.2). All amino acids are built of a two-carbon bond: The
first carbon is part of a negatively charged carboxylic acid (-COOH) functional group and the second
carbon is bonded with an amino group (-NH2).Additionally each amino acid has a specific side group
that distinct them from each other (ref.3). In the case of glutamic acid this side chain is CH2CH2COOH
Glutamic Acid 6
as one can read from Figure 1.
Out of the 20 proteinogenic amino acids, humans can produce ten themselves. The remaining ten
must be supplied through diet. The 20 proteinogenic amino acids each convey a vast array of
chemical versatility, because the chemical property of each amino acid determines a protein’s
biological activity. Enzymes catalyse almost all biological reactions therefore amino acids virtually
control almost all the cellular processes. In addition, a protein’s amino acid sequence contains the
necessary information on how this protein will fold into its three dimensional structure and the
resulting stability of this structure.
Because of the important role the proteinogenic amino acids play in cellular activity, deficiency of
one can lead to drastic consequences where the body’s proteins, in the form of muscle tissue, for
example, can degenerate. Humans do not store excessive amounts of amino acids like they do fat
and starch; therefore it is of great importance that the essential amino acids are supplied every day
anew through food (ref.4).
2.3 Areas of Usage
A important aspect of the usage of glutamic acid is the flavour-enhancing ability of its salts. This
made them popular additives for all types of processed foods like potato chips, hamburgers, canned
soups, pre-packaged meals, fish sticks etc.(ref.5)
Since 1959 glutamic acid and its salt have been classified as generally recognised as safe (GRAS) by
the U.S. Food and Drug Administration (ref.6 & 7). Even so, monosodium and potassium glutamate
are steadily disappearing on the ingredient lists of European foods due to the fact that consumers
are being made more aware of the questionable side effects of excessive consumption of the popular
flavour-enhancer. One such example is the famous “Chinese restaurant syndrome”, where persons
reported symptoms like headache, chest pain and excessive sweating after eating Chinese food that
contained a lot of MSG (ref.8). Nonetheless, because of the scientific controversy over a link in
symptoms to overdose of MSG (Monosodium glutamate), the substance is still highly popular in
Asian culture. The best example for this statement is China, who made up 67% of the annual demand
of MSG in 2009 and is the world’s largest MSG producing and consuming country (ref.9).
Another area where glutamic acid comes into use is the domain of sports such as weightlifting and
bodybuilding. There, glutamine, an amino acid synthesised from ammonium and glutamic acid
through the enzyme glutamine synthetase (ref.10), is used as a supplement to support muscle
growth. Glutamine is the most abundant amino acid found in our muscle tissue and it plays a role in
various biochemical reactions; in addition to the proteinogenic function, it serves, next to glucose, as
a source for cellular energy. The supplement industry claims that during anaerobic exercise, the
body’s natural glutamine stores are depleted faster than it is produced, therefore glutamine should
be supplied in addition to the body’s own production to ensure that the muscles always have a ready
Glutamic Acid 7
supply of the amino acid (ref.11). Nonetheless, scientific proof to the muscle-enhancing benefits of
glutamine is still missing.
Glutamic acid plays a role in medicine as well, as it serves as a precursor for GABA (gamma-
aminobutyric acid), an important neurotransmitter in the central nervous system. Glutamic acid also
supports the transport of potassium into the spinal fluid and is itself an excitatory neurotransmitter
in contrast to GABA, who is inhibitory. It is thus used in the medical treatment of fatigue,
parkinsonism, schizophrenia, mental retardation, muscular dystrophy, and alcoholism (ref.12).
Beetle Breeding 8
3 Beetle Breeding
Beetle Breeding is mainly practised in Asia, where a beetle is kept as a pet in a terrarium similar to
the way reptile pets are kept.
3.1 Background
People have kept insects as pets for a very long time; in China for example it was a custom to
organize cricket fights where the best and strongest where kept to breed another generation of
stronger fighting crickets. Other insects where kept to harvest their products. The tradition to keep
and breed silkworms and silk moths has been around for almost 5000 years.
It is hard to say when exactly we can speak of the beginnings of beetle breeding as it is practised
today, because documents of such “private” activities are hardly available. However it is known that
around the year 1700 Japanese people kept crickets and katydids in cages to enjoy their melodic
sounds.
Nowadays people keep insects for all kinds of reasons. They are fascinated by both their colours and
shapes or by their behaviour or their different way of life from ordinary pet animals such as
mammals and birds. All over the world, but mainly in western countries, people today keep all kinds
of insects like butterflies and beetles.
Additionally, in developing countries, butterfly farms that breed caterpillars and butterflies are a
nature-friendly way to sell insects to zoos and museums all over the world. This also provides
valuable jobs for people living in these countries where nature is preserved by only catching wild
bugs and breeding them. (ref.13)
3.2 Test Organism: Trypoxylus (Allomyrina) dichotoma tsunobosonus
The Japanese rhinoceros beetle (Trypoxylus (Allomyrina) dichotoma), or in Japan referred to as
kabutomushi (Samurai helmet beetle), is species of rhinoceros beetle mainly found in tropical Asian
countries. T.dichotoma is mainly reared in Japan and Taiwan and its adult form size can vary from
35mm up to 90mm. The male beetle has a cephalic horn that splits into four sharp points at the end
and a smaller horn that splits into two ends on the pronotum. The female has no horns and is usually
smaller than the male beetle. The elytra are dark brown sometimes almost black in colour in both the
male and female.
T.dichotoma is considered to be a species that can be bred and kept very easily and is therefore a
good choice for a newcomer to beetle breeding.
Female beetles lay 30-50 eggs on average and the complete metamorphosis from larvae to adult
beetle takes about 10 months. The Larvae are usually reared together but they cannibalize as soon as
there is not enough food available.
Beetle Breeding 9
In the wild, the beetles feed on tree saps or the liquid of rotten fruits. In captivity, they can be fed
easily on every day grocery fruits such as apples, watermelon, bananas grapes and pears which can
be presented as slices on a little plastic dish. As for all rhinoceros beetles, including T.dichotoma,
humidity is very important. If not enough humidity is present a beetle dehydrates within hours and
looses the ability to walk as a consequence (ref. 14 & 15).
3.3 Glutamic Acid in Beetle Breeding
Glutamic acid is used in two different ways in the beetle breeding scene; it is either put in the
substrate of larvae in belief that it positively affects their growth, or it is mixed with the food of the
adult female beetles in belief that they will produce more eggs when glutamic acid is added to their
diet.
Even though scientific proof is still missing, japanese instruction manuals on substrate preparation
always have glutamic acid or glutamine on their material lists and stores that specialize on beetle
breeding items sell glutamic acid as a nutritional additive for beetles (ref.16, 17&18)
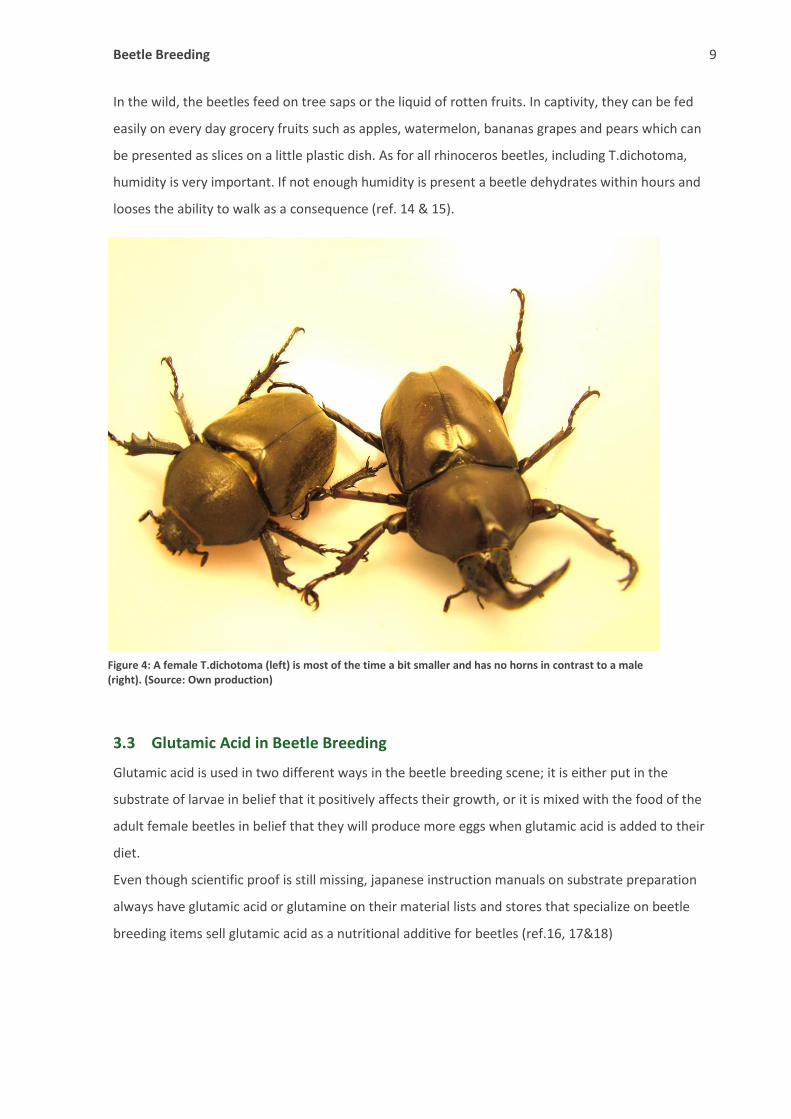
Figure 4: A female T.dichotoma (left) is most of the time a bit smaller and has no horns in contrast to a male (right). (Source: Own production)
Experiment 10
4 Experiment
The experiment was conducted according to the steps mentioned in chapter 1.3.2 Methods.
4.1 Protocol
1. Preparation of the breeding boxes:
On the 09/06/2013, the beetles for the breeding boxes were chosen and the breeding boxes
prepared. The parent T.dichotomas originate from Taiwan and had hatched from their cocoons about
a month earlier. The beetles for the breeding boxes measured the following sizes from head to elytra
for females, respectively from horn to elytra for males :
BB1 (Breeding Box 1): Female 1= 42mm, Female 2= 44mm, Female 3= 45mm, Male 1= 75mm
BB2 (Breeding Box 2): Female 4= 45mm,Female 5= 43mm, Female 6= 52mm, Male 2= 75mm
5 beetle jellies were added to each box plus one slice of Mango.
The finished boxes are closed and fixed with tape so that the beetles stayed inside and then stored in
the same place with equal air and temperature conditions. .
On the 09/16/2013 the beetle jellies were exchanged with fresh ones.
2. Preparation of the test groups:
On the 09/25/2013, the four test groups of larvae substrate were prepared. In a concrete mixer 10l
of flake soil from four boxes and 5l from one box were mixed so that a total of 45l of flake soil was
obtained for one test group. This was repeated four times for each test group.
The added substances were as described in chapter 1.3.1 Methods, dissolved in 1.5l of boiling tap
water and then each mixed with 45l of flake soil in the concrete mixer. The finished substrate was
put into boxes, which were labelled respectively and then dry-freezed in a deep-freezer to kill off
unwanted organisms (like worms and other insect larvae that might have come into the flake soil).
After dry-freezing, the substrate was stored at room temperature until further use.
3. Retrieval of beetle eggs:
On the 10/02/2013, the beetle breeding boxes were searched for eggs.
In BB1 one female had died, all other beetles of BB1 & BB2 had survived and were removed together
with the bark and rest of the beetle jellies to search the containers. The substrate was carefully
turned over and eggs were moved with a plastic spoon into a small plastic container filled with the
substrate of the beetle breeding boxes. The containers each held five eggs and were labelled with
the date and the breeding box number that the eggs had been found in. A total of 115 eggs from BB1
and a total of 60 eggs from BB2 were received. The small containers were closed and stored until all
the eggs had hatched.
On the 10/09/2013, a check was conducted to see if the larvae had hatched. Out of a five egg
container, three had hatched, one egg had died and one egg had not yet hatched. The decision was
Experiment 11
made to wait another 10 days to make sure all larvae had hatched.
On the 10/20/2013, the larvae were selected and distributed into the different test groups.
Firstly three 5l boxes (with holes drilled into them as mentioned in step 3 of chapter 1.3.2 Methods)
of the according substrate were prepared for each test group and labelled according to the test
group to which they belonged and with the numbers 1 through 3.
Due to the fact that almost 2/3 of all the eggs had died, it was decided to put five larvae into one box
as their own group. The finished three boxes with a total of fifteen larvae of each test group were
stored in the same room with a constant temperature of 25 degrees Celsius.
4. Recording of data:
The weight and instar of the larvae was checked every fourteen days and recorded. During the
weight checks, the boxes were turned over into a flat plastic container and the substrate searched
for the larvae. When weighing the larvae, they were put into separate small plastic containers, laid
onto the scale and then put back into the box together with the substrate. The larvae died within this
period of fourteen days and were either eaten or decayed completely. Only seldom were the dead
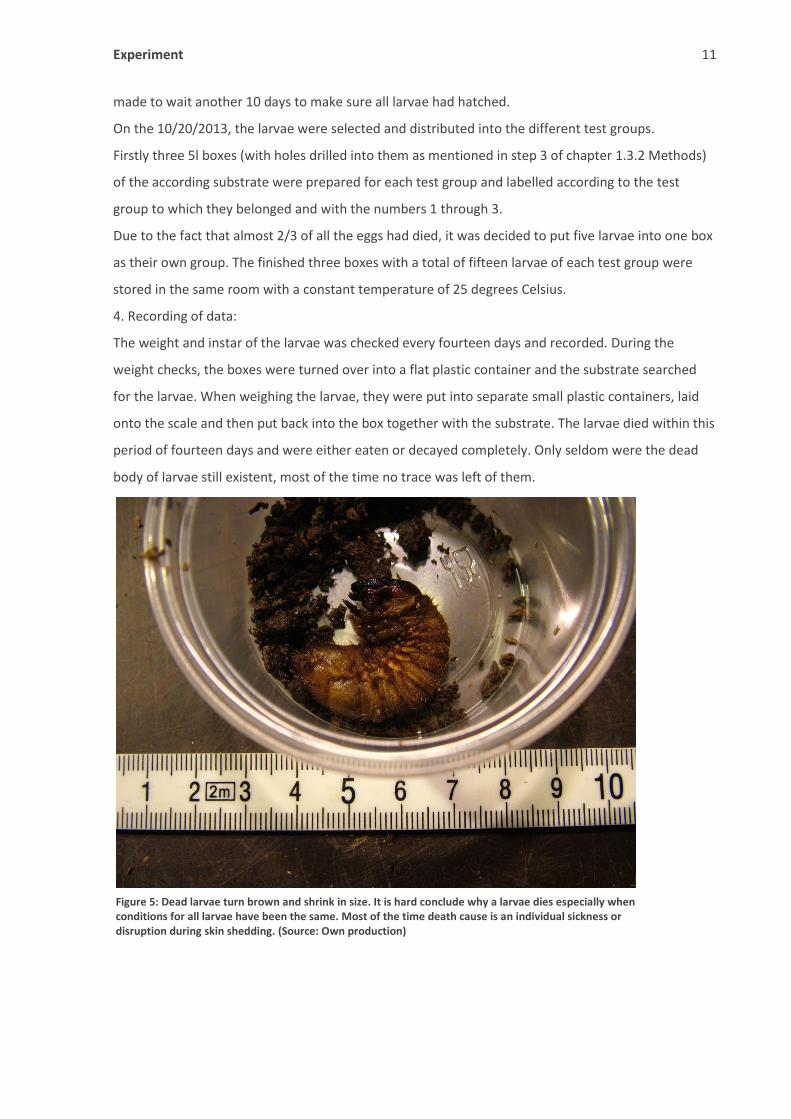
body of larvae still existent, most of the time no trace was left of them.
Figure 5: Dead larvae turn brown and shrink in size. It is hard conclude why a larvae dies especially when conditions for all larvae have been the same. Most of the time death cause is an individual sickness or disruption during skin shedding. (Source: Own production)
Experiment 12
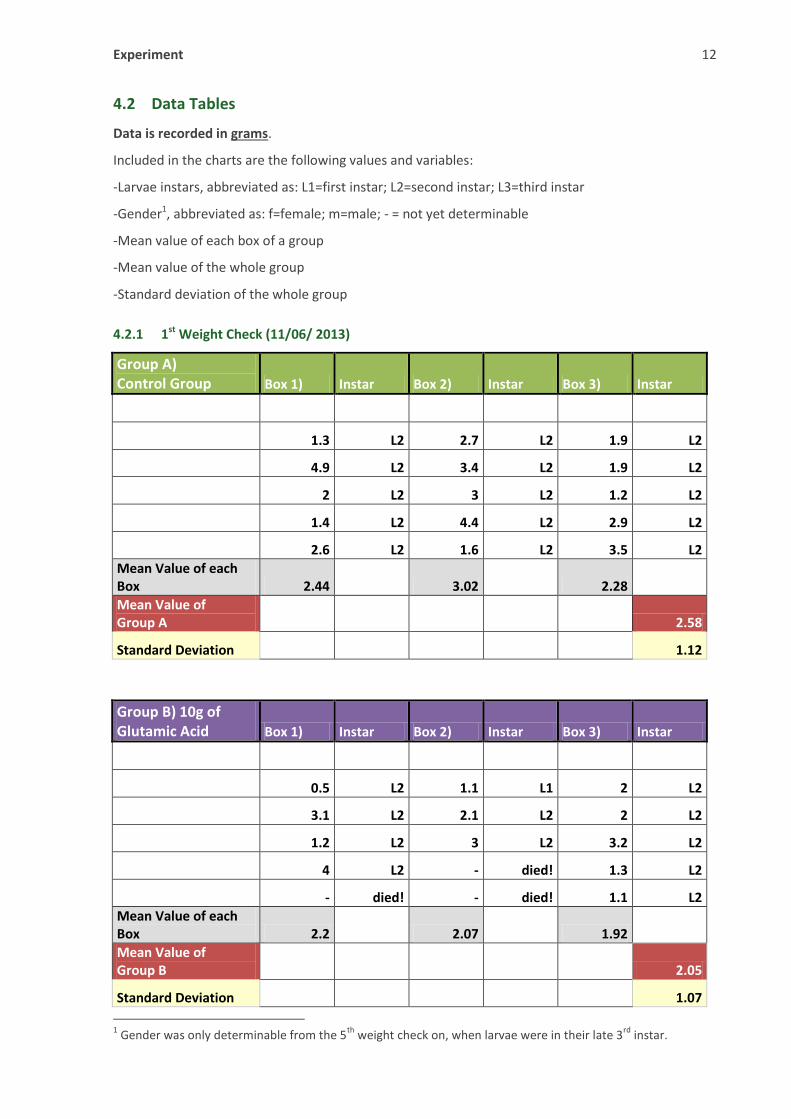
4.2 Data Tables
Data is recorded in grams.
Included in the charts are the following values and variables:
-Larvae instars, abbreviated as: L1=first instar; L2=second instar; L3=third instar
-Gender1, abbreviated as: f=female; m=male; - = not yet determinable
-Mean value of each box of a group
-Mean value of the whole group
-Standard deviation of the whole group
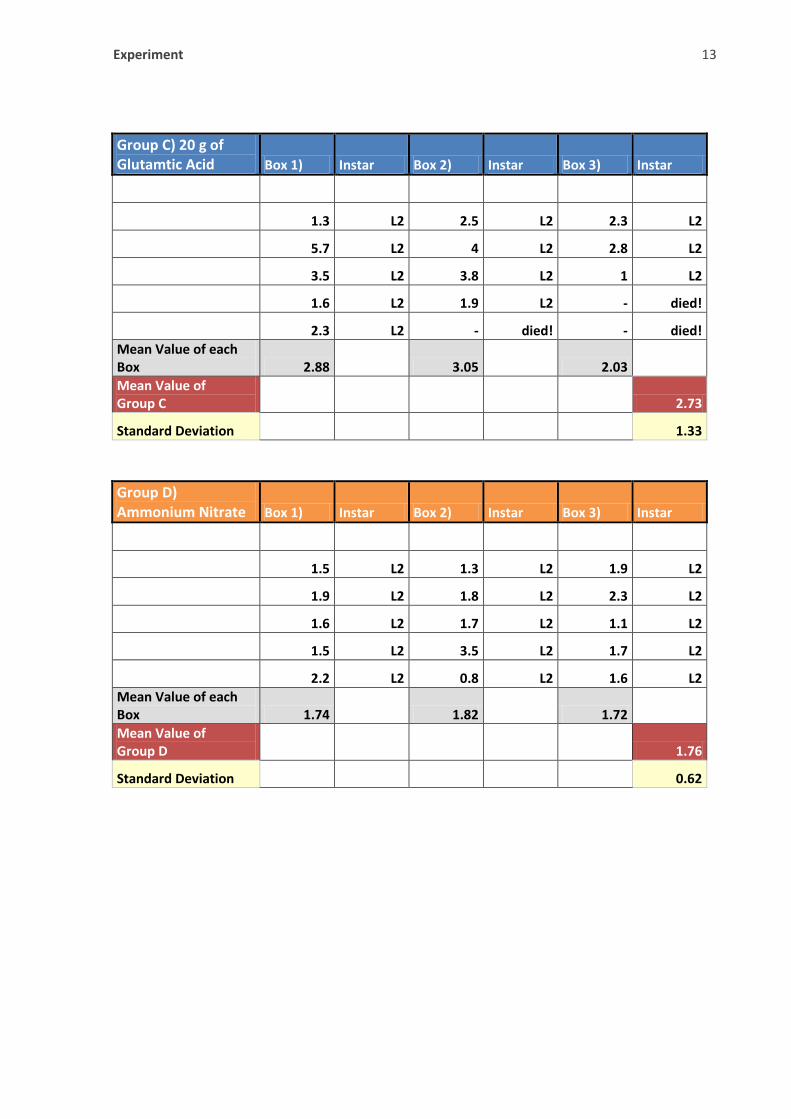
4.2.1 1st Weight Check (11/06/ 2013)
Group A) Control Group Box 1) Instar Box 2) Instar Box 3) Instar
1.3 L2 2.7 L2 1.9 L2
4.9 L2 3.4 L2 1.9 L2
2 L2 3 L2 1.2 L2
1.4 L2 4.4 L2 2.9 L2
2.6 L2 1.6 L2 3.5 L2
Mean Value of each Box 2.44
3.02
2.28
Mean Value of Group A
2.58
Standard Deviation 1.12
Group B) 10g of Glutamic Acid Box 1) Instar Box 2) Instar Box 3) Instar
0.5 L2 1.1 L1 2 L2
3.1 L2 2.1 L2 2 L2
1.2 L2 3 L2 3.2 L2
4 L2 - died! 1.3 L2
- died! - died! 1.1 L2
Mean Value of each Box 2.2
2.07
1.92
Mean Value of Group B 2.05
Standard Deviation 1.07
1 Gender was only determinable from the 5
th weight check on, when larvae were in their late 3
rd instar.
Experiment 13
Group C) 20 g of Glutamtic Acid Box 1) Instar Box 2) Instar Box 3) Instar
1.3 L2 2.5 L2 2.3 L2
5.7 L2 4 L2 2.8 L2
3.5 L2 3.8 L2 1 L2
1.6 L2 1.9 L2 - died!
2.3 L2 - died! - died!
Mean Value of each Box 2.88
3.05
2.03
Mean Value of Group C
2.73
Standard Deviation 1.33
Group D) Ammonium Nitrate Box 1) Instar Box 2) Instar Box 3) Instar
1.5 L2 1.3 L2 1.9 L2
1.9 L2 1.8 L2 2.3 L2
1.6 L2 1.7 L2 1.1 L2
1.5 L2 3.5 L2 1.7 L2
2.2 L2 0.8 L2 1.6 L2
Mean Value of each Box 1.74
1.82
1.72
Mean Value of Group D
1.76
Standard Deviation 0.62
Experiment 14
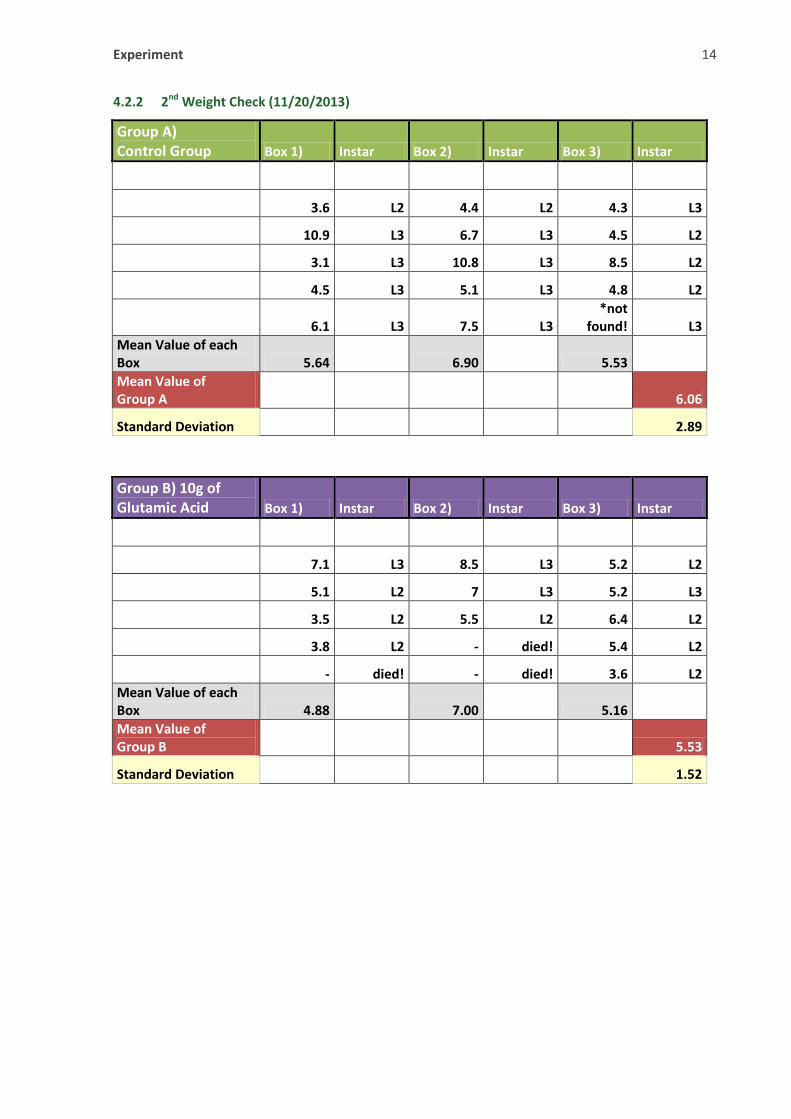
4.2.2 2nd Weight Check (11/20/2013)
Group A) Control Group Box 1) Instar Box 2) Instar Box 3) Instar
3.6 L2 4.4 L2 4.3 L3
10.9 L3 6.7 L3 4.5 L2
3.1 L3 10.8 L3 8.5 L2
4.5 L3 5.1 L3 4.8 L2
6.1 L3 7.5 L3
*not found! L3
Mean Value of each Box 5.64
6.90
5.53
Mean Value of Group A
6.06
Standard Deviation 2.89
Group B) 10g of Glutamic Acid Box 1) Instar Box 2) Instar Box 3) Instar
7.1 L3 8.5 L3 5.2 L2
5.1 L2 7 L3 5.2 L3
3.5 L2 5.5 L2 6.4 L2
3.8 L2 - died! 5.4 L2
- died! - died! 3.6 L2
Mean Value of each Box 4.88
7.00
5.16
Mean Value of Group B
5.53
Standard Deviation 1.52

Experiment 15
Group C) 20 g of Glutamtic Acid Box 1) Instar Box 2) Instar Box 3) Instar
12.6 L3 5.2 L3 7.9 L3
3.6 L2 3.8 L2 4.6 L2
5.4 L2 7 L3 - died!
3.3 L2 8.6 L3 - died!
5.3 L2 3.9 L2 - died!
Mean Value of each Box 6.04
5.70
6.25
Mean Value of Group C
5.93
Standard Deviation 2.71
Group D) Ammonium Nitrate Box 1) Instar Box 2) Instar Box 3) Instar
4.2 L2 6.2 L2 3.4 L3
5 L2 8.5 L3 4.9 L2
3.6 L2 2.2 L2 4 L2
4.5 L2 4.2 L2 4.5 L2
5.4 L3 4.3 L2 5.7 L3
Mean Value of each Box 4.54
5.08
4.50
Mean Value of Group D
4.71
Standard Deviation 1.43
Experiment 16
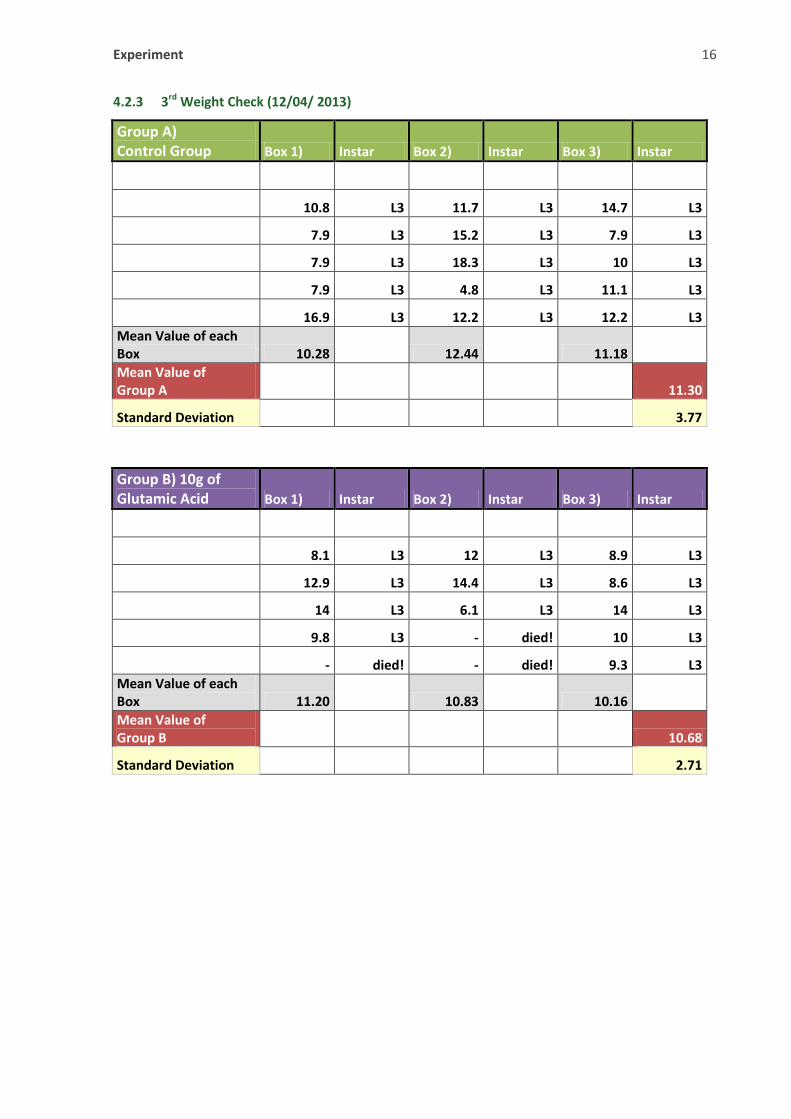
4.2.3 3rd Weight Check (12/04/ 2013)
Group A) Control Group Box 1) Instar Box 2) Instar Box 3) Instar
10.8 L3 11.7 L3 14.7 L3
7.9 L3 15.2 L3 7.9 L3
7.9 L3 18.3 L3 10 L3
7.9 L3 4.8 L3 11.1 L3
16.9 L3 12.2 L3 12.2 L3
Mean Value of each Box 10.28
12.44
11.18
Mean Value of Group A
11.30
Standard Deviation 3.77
Group B) 10g of Glutamic Acid Box 1) Instar Box 2) Instar Box 3) Instar
8.1 L3 12 L3 8.9 L3
12.9 L3 14.4 L3 8.6 L3
14 L3 6.1 L3 14 L3
9.8 L3 - died! 10 L3
- died! - died! 9.3 L3
Mean Value of each Box 11.20
10.83
10.16
Mean Value of Group B
10.68
Standard Deviation 2.71
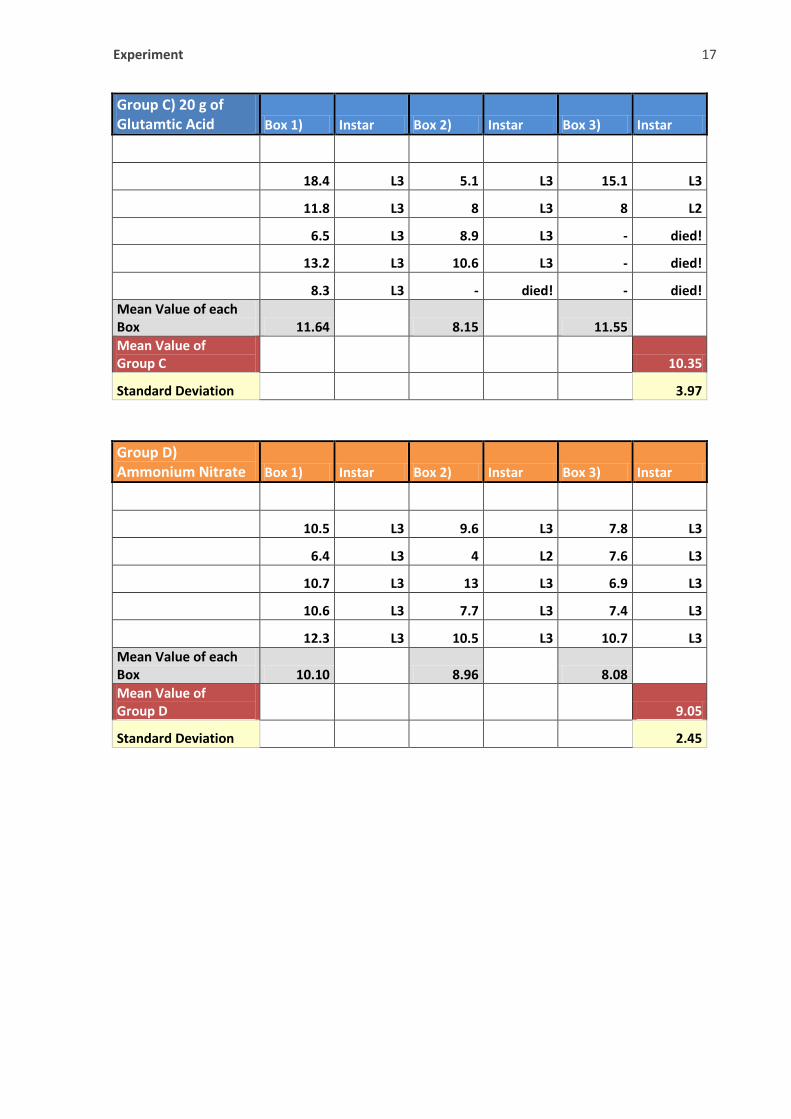
Experiment 17
Group C) 20 g of Glutamtic Acid Box 1) Instar Box 2) Instar Box 3) Instar
18.4 L3 5.1 L3 15.1 L3
11.8 L3 8 L3 8 L2
6.5 L3 8.9 L3 - died!
13.2 L3 10.6 L3 - died!
8.3 L3 - died! - died!
Mean Value of each Box 11.64
8.15
11.55
Mean Value of Group C
10.35
Standard Deviation 3.97
Group D) Ammonium Nitrate Box 1) Instar Box 2) Instar Box 3) Instar
10.5 L3 9.6 L3 7.8 L3
6.4 L3 4 L2 7.6 L3
10.7 L3 13 L3 6.9 L3
10.6 L3 7.7 L3 7.4 L3
12.3 L3 10.5 L3 10.7 L3
Mean Value of each Box 10.10
8.96
8.08
Mean Value of Group D
9.05
Standard Deviation 2.45
Experiment 18
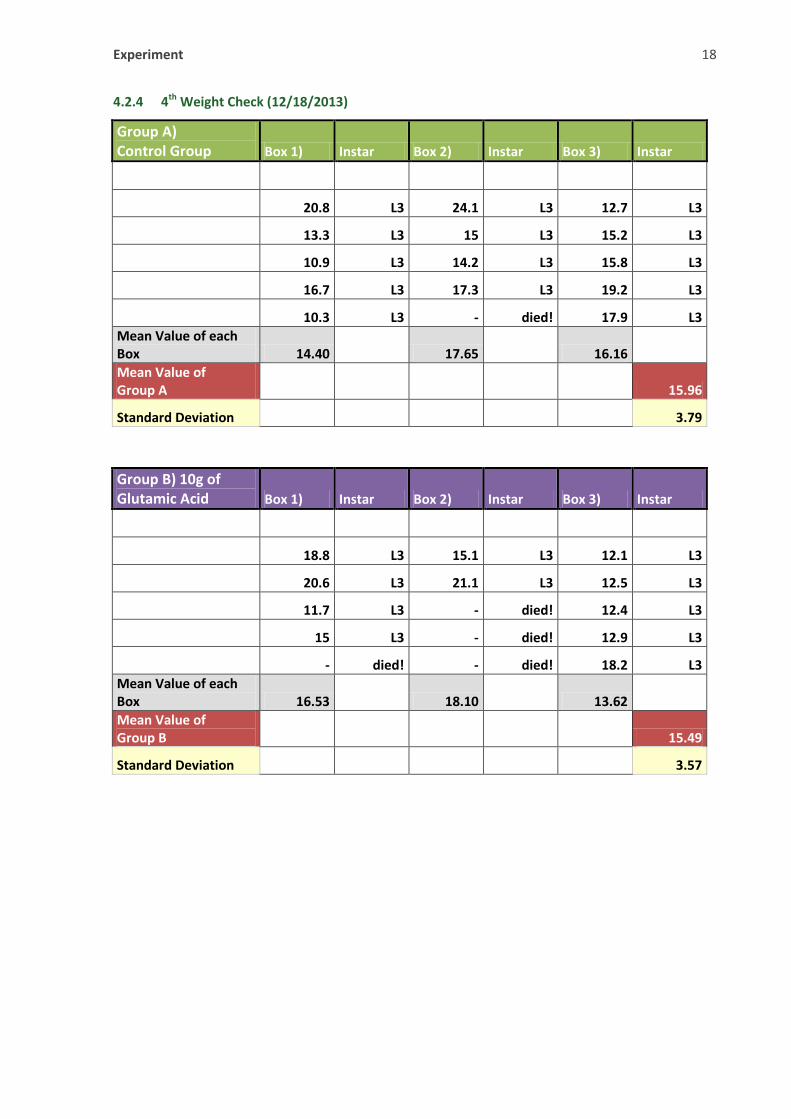
4.2.4 4th Weight Check (12/18/2013)
Group A) Control Group Box 1) Instar Box 2) Instar Box 3) Instar
20.8 L3 24.1 L3 12.7 L3
13.3 L3 15 L3 15.2 L3
10.9 L3 14.2 L3 15.8 L3
16.7 L3 17.3 L3 19.2 L3
10.3 L3 - died! 17.9 L3
Mean Value of each Box 14.40
17.65
16.16
Mean Value of Group A
15.96
Standard Deviation 3.79
Group B) 10g of Glutamic Acid Box 1) Instar Box 2) Instar Box 3) Instar
18.8 L3 15.1 L3 12.1 L3
20.6 L3 21.1 L3 12.5 L3
11.7 L3 - died! 12.4 L3
15 L3 - died! 12.9 L3
- died! - died! 18.2 L3
Mean Value of each Box 16.53
18.10
13.62
Mean Value of Group B
15.49
Standard Deviation 3.57
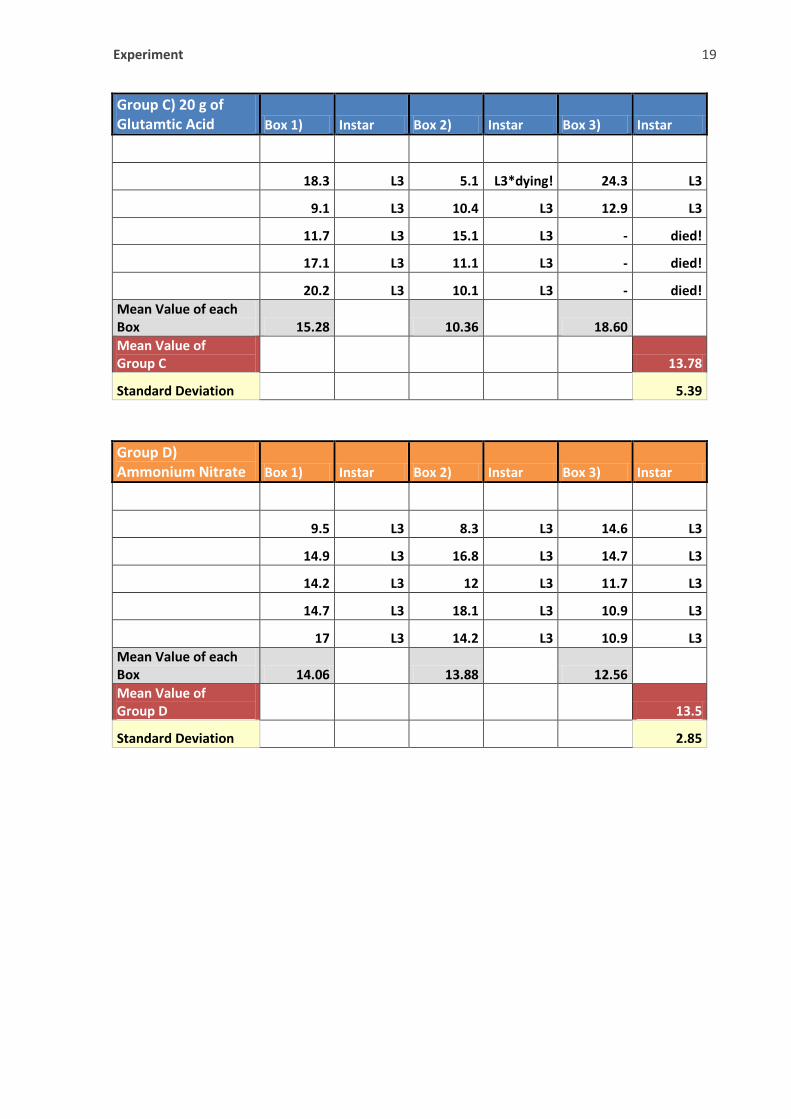
Experiment 19
Group C) 20 g of Glutamtic Acid Box 1) Instar Box 2) Instar Box 3) Instar
18.3 L3 5.1 L3*dying! 24.3 L3
9.1 L3 10.4 L3 12.9 L3
11.7 L3 15.1 L3 - died!
17.1 L3 11.1 L3 - died!
20.2 L3 10.1 L3 - died!
Mean Value of each Box 15.28
10.36
18.60
Mean Value of Group C
13.78
Standard Deviation 5.39
Group D) Ammonium Nitrate Box 1) Instar Box 2) Instar Box 3) Instar
9.5 L3 8.3 L3 14.6 L3
14.9 L3 16.8 L3 14.7 L3
14.2 L3 12 L3 11.7 L3
14.7 L3 18.1 L3 10.9 L3
17 L3 14.2 L3 10.9 L3
Mean Value of each Box 14.06
13.88
12.56
Mean Value of Group D
13.5
Standard Deviation 2.85
Experiment 20
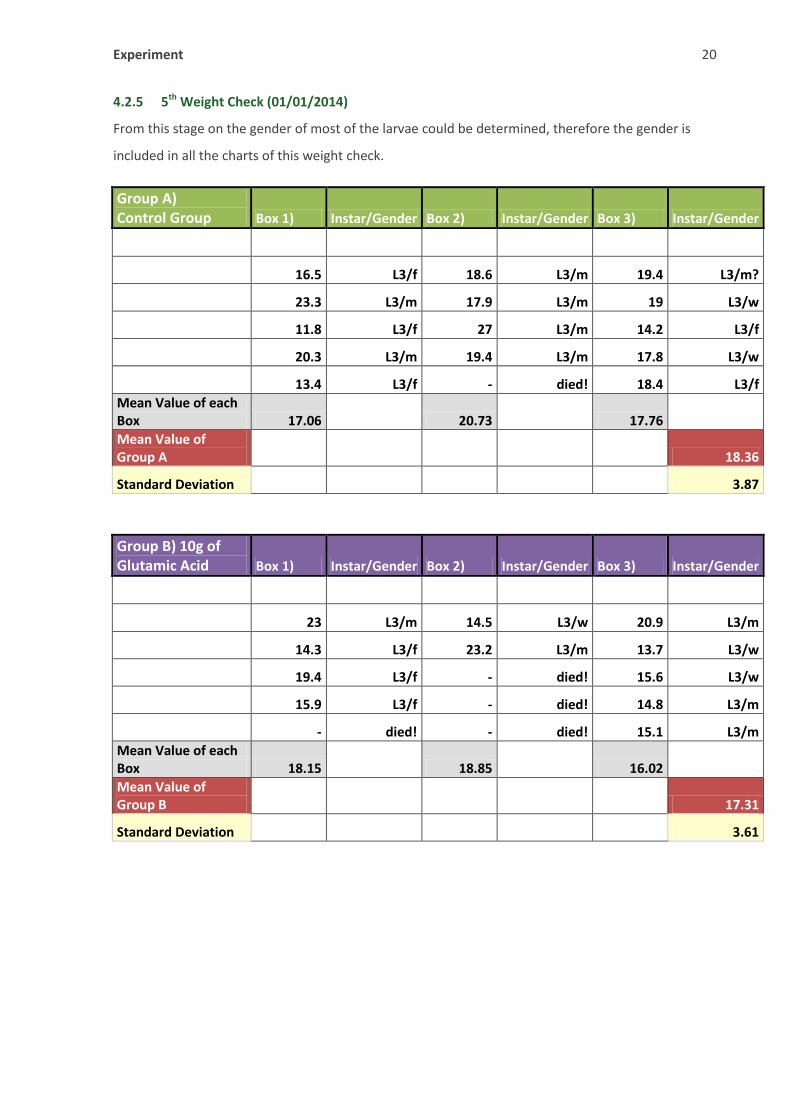
4.2.5 5th Weight Check (01/01/2014)
From this stage on the gender of most of the larvae could be determined, therefore the gender is
included in all the charts of this weight check.
Group A) Control Group Box 1) Instar/Gender Box 2) Instar/Gender Box 3) Instar/Gender
16.5 L3/f 18.6 L3/m 19.4 L3/m?
23.3 L3/m 17.9 L3/m 19 L3/w
11.8 L3/f 27 L3/m 14.2 L3/f
20.3 L3/m 19.4 L3/m 17.8 L3/w
13.4 L3/f - died! 18.4 L3/f
Mean Value of each Box 17.06
20.73
17.76
Mean Value of Group A
18.36
Standard Deviation 3.87
Group B) 10g of Glutamic Acid Box 1) Instar/Gender Box 2) Instar/Gender Box 3) Instar/Gender
23 L3/m 14.5 L3/w 20.9 L3/m
14.3 L3/f 23.2 L3/m 13.7 L3/w
19.4 L3/f - died! 15.6 L3/w
15.9 L3/f - died! 14.8 L3/m
- died! - died! 15.1 L3/m
Mean Value of each Box 18.15
18.85
16.02
Mean Value of Group B
17.31
Standard Deviation 3.61
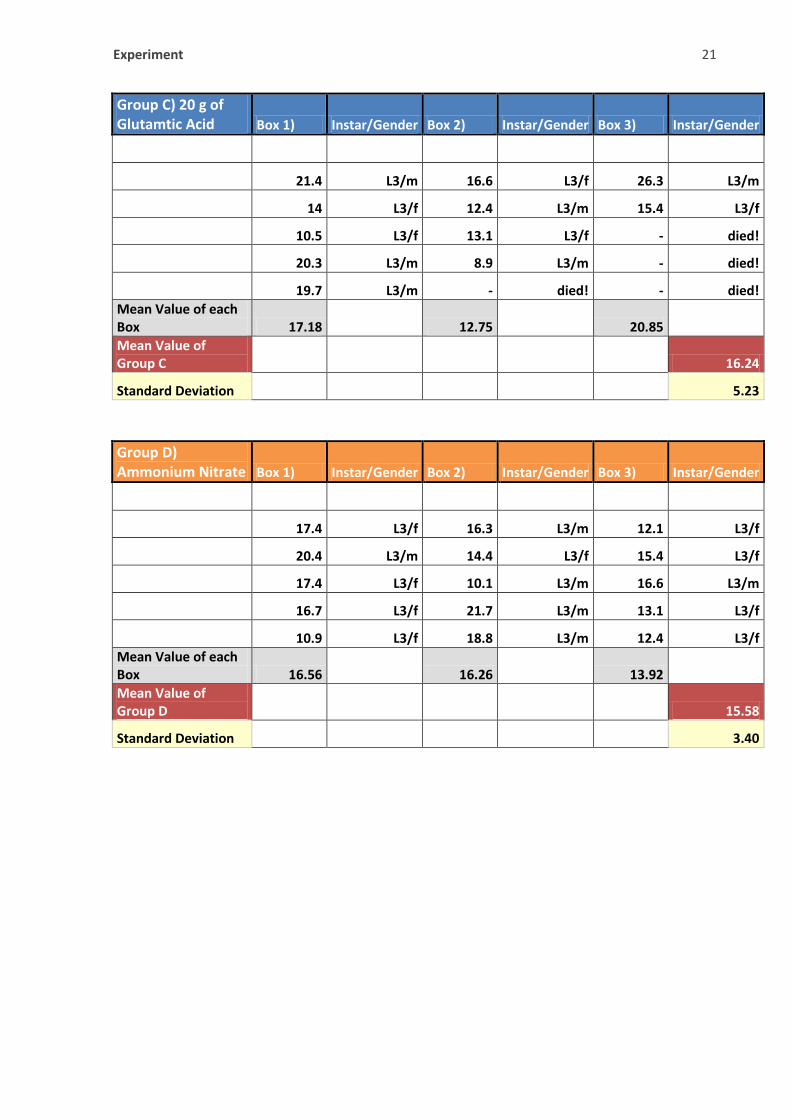
Experiment 21
Group C) 20 g of Glutamtic Acid Box 1) Instar/Gender Box 2) Instar/Gender Box 3) Instar/Gender
21.4 L3/m 16.6 L3/f 26.3 L3/m
14 L3/f 12.4 L3/m 15.4 L3/f
10.5 L3/f 13.1 L3/f - died!
20.3 L3/m 8.9 L3/m - died!
19.7 L3/m - died! - died!
Mean Value of each Box 17.18
12.75
20.85
Mean Value of Group C
16.24
Standard Deviation 5.23
Group D) Ammonium Nitrate Box 1) Instar/Gender Box 2) Instar/Gender Box 3) Instar/Gender
17.4 L3/f 16.3 L3/m 12.1 L3/f
20.4 L3/m 14.4 L3/f 15.4 L3/f
17.4 L3/f 10.1 L3/m 16.6 L3/m
16.7 L3/f 21.7 L3/m 13.1 L3/f
10.9 L3/f 18.8 L3/m 12.4 L3/f
Mean Value of each Box 16.56
16.26
13.92
Mean Value of Group D
15.58
Standard Deviation 3.40
Experiment 22
0
2
4
6
8
10
12
14
16
18
20
0 10 20 30 40 50 60
We
igh
t in
Gra
ms
Time in Days
Growth Curve
Group A
Group B
Group C
Group D
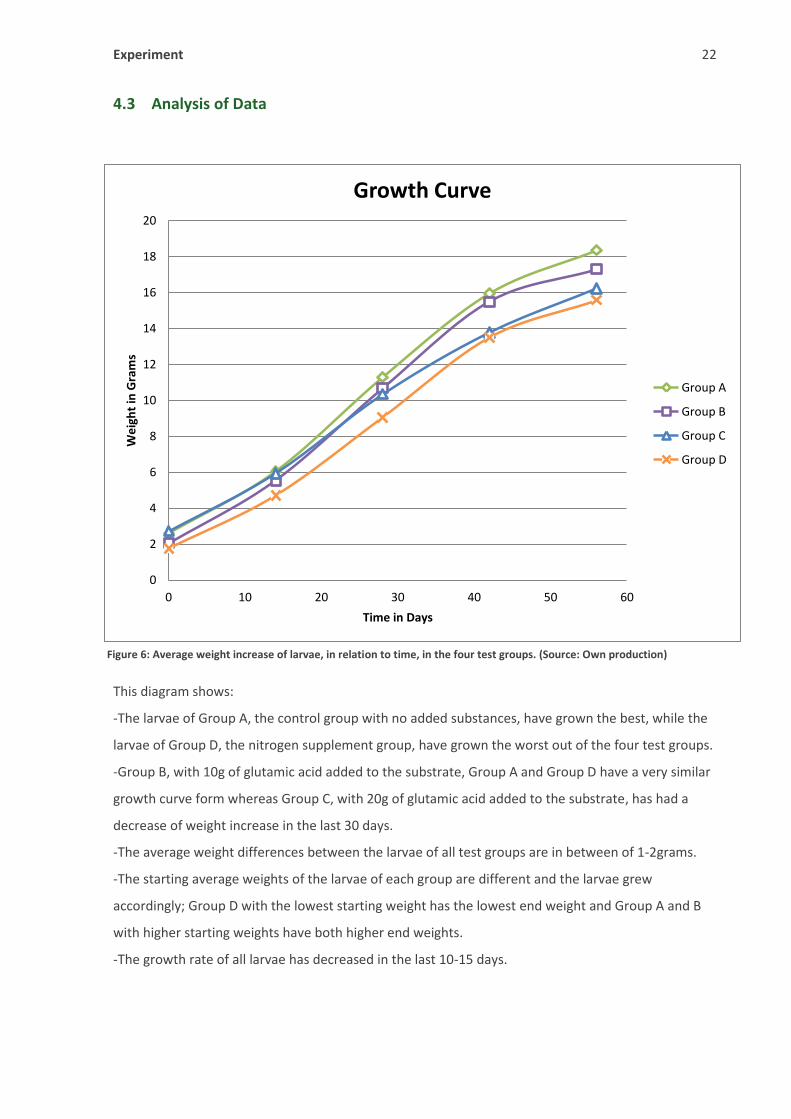
4.3 Analysis of Data
This diagram shows:
-The larvae of Group A, the control group with no added substances, have grown the best, while the
larvae of Group D, the nitrogen supplement group, have grown the worst out of the four test groups.
-Group B, with 10g of glutamic acid added to the substrate, Group A and Group D have a very similar
growth curve form whereas Group C, with 20g of glutamic acid added to the substrate, has had a
decrease of weight increase in the last 30 days.
-The average weight differences between the larvae of all test groups are in between of 1-2grams.
-The starting average weights of the larvae of each group are different and the larvae grew
accordingly; Group D with the lowest starting weight has the lowest end weight and Group A and B
with higher starting weights have both higher end weights.
-The growth rate of all larvae has decreased in the last 10-15 days.
Figure 6: Average weight increase of larvae, in relation to time, in the four test groups. (Source: Own production)
Experiment 23
Significant changes in the end weight between the control group and the groups with added
substances:
When a student’s t-test is performed on the four different groups the following values are obtained:
-Group A and Group B: 0.699299, for df=23 and significance level of 5%, the difference in average
end weight between Group A and Group B is statistically not significant. (p-value = 0.4914)
-Group A and Group C: 0.596107, for df=23 and significance level of 5%, the difference in average
end weight between Group A and Group C is statistically not significant. (p-value = 0.5569)
-Group A and Group D: 2.049195, for df=27 and significance level of 5%, the difference in average
end weight between Group A and Group D is statistically significant. (p-value= 0.0503)
Out of these results it can be said, that it does not make a statistically significant difference in weight
of the T.dichotoma larvae if 10 or 20 grams of glutamic acid is added to 45l of substrate.
It can also be said that the nitrogen supplement ammonium nitrate does statistically have significant
negative influence on the end weight of the T.dichtoma larvae and therefore no fertilizing effects can
be expected from the nitrogen content of glutamic acid.
Summary/Discussion 24
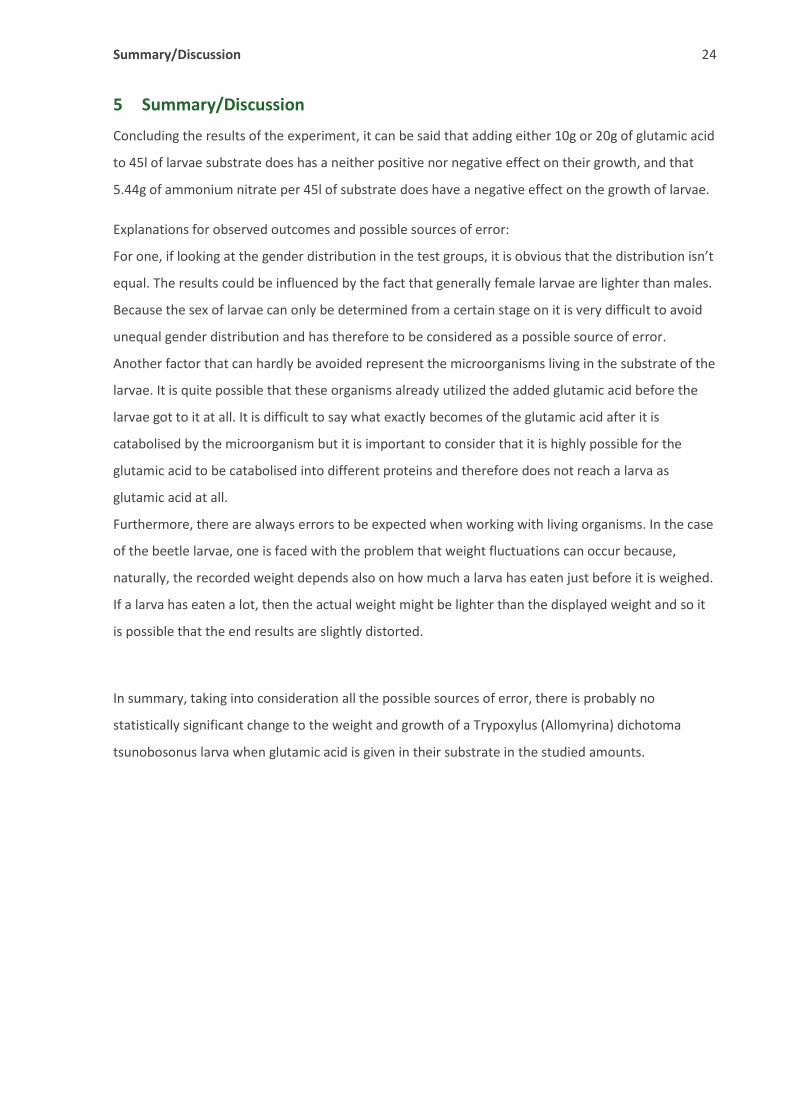
5 Summary/Discussion
Concluding the results of the experiment, it can be said that adding either 10g or 20g of glutamic acid
to 45l of larvae substrate does has a neither positive nor negative effect on their growth, and that
5.44g of ammonium nitrate per 45l of substrate does have a negative effect on the growth of larvae.
Explanations for observed outcomes and possible sources of error:
For one, if looking at the gender distribution in the test groups, it is obvious that the distribution isn’t
equal. The results could be influenced by the fact that generally female larvae are lighter than males.
Because the sex of larvae can only be determined from a certain stage on it is very difficult to avoid
unequal gender distribution and has therefore to be considered as a possible source of error.
Another factor that can hardly be avoided represent the microorganisms living in the substrate of the
larvae. It is quite possible that these organisms already utilized the added glutamic acid before the
larvae got to it at all. It is difficult to say what exactly becomes of the glutamic acid after it is
catabolised by the microorganism but it is important to consider that it is highly possible for the
glutamic acid to be catabolised into different proteins and therefore does not reach a larva as
glutamic acid at all.
Furthermore, there are always errors to be expected when working with living organisms. In the case
of the beetle larvae, one is faced with the problem that weight fluctuations can occur because,
naturally, the recorded weight depends also on how much a larva has eaten just before it is weighed.
If a larva has eaten a lot, then the actual weight might be lighter than the displayed weight and so it
is possible that the end results are slightly distorted.
In summary, taking into consideration all the possible sources of error, there is probably no
statistically significant change to the weight and growth of a Trypoxylus (Allomyrina) dichotoma
tsunobosonus larva when glutamic acid is given in their substrate in the studied amounts.

List of References V
6 List of References
(1) Wikimedia Foundation. (2013, December 23 at 22:36.). Retrieved from Wikipedia.org:
http://en.wikipedia.org/wiki/Glutamic_acid_(flavor)
(2) ChemPep Inc. (2005). ChemPep. Retrieved from http://www.chempep.com/ChemPep-Amino-
Acid-Overview.htm
(3) Andrew Rader Studios. (1997). Chem4Kids. Retrieved from
http://www.chem4kids.com/files/bio_aminoacid.html
(4) William and Flora Hewlett Foundation. (1996). The Biology Project. Retrieved from
http://www.biology.arizona.edu/biochemistry/problem_sets/aa/aa.html
(5) Conjecture Corporation. (2003). wiseGEEK. Retrieved from http://www.wisegeek.com/which-
foods-commonly-contain-msg.htm
(6) Wikimedia Foundation . (2013, 23 December 23 at 22:36). Wikipedia.org. Retrieved from
http://en.wikipedia.org/wiki/Glutamic_acid_(flavor)#cite_note-12
(7) U.S. Department of Health & Human Services. (2013 , April 18). HHS.gov. Retrieved from
http://www.fda.gov/food/ingredientspackaginglabeling/gras/scogs/ucm260903.htm
(8) National Library of Medicine. (2013, October 31). MedlinePlus. Retrieved from
http://www.nlm.nih.gov/medlineplus/ency/article/001126.htm
(9) O'Brien, R. (1959). IHS. Retrieved from
http://www.ihs.com/products/chemical/planning/ceh/monosodium-glutamate.aspx
(10) Wikimedia Foundation. (2013 , December 23 at 22:36.). Wikipedia.org. Retrieved from
http://en.wikipedia.org/wiki/Glutamine_synthetase
(11) DeLuc, R. R. (1999, February 16). bodybuilding.com. Retrieved from
http://www.bodybuilding.com/fun/schultz9.htm
(12) Haas, E. M., & Levin, B. (2006). Staying Healthy With Nutrition. Celestial Arts.
(13) van Zomeren, L. (2013). Keeping Insects. Retrieved from
http://www.keepinginsects.com/introduction/history/
(14) McMonigle, O. (2012). The Ultimate Guide to Breeding Beetles. Landisville, Pennsylvania:
Coachwhip Publications.

List of References VI
(15) Lai, J. T. (2008). For the Love of the Rhinoceros and Stag Beetles. Taiwan: Morning Star
Publishers.
(16). (n.d.). 腐葉土(発酵マット)のつくり方. Retrieved from
http://www104.sakura.ne.jp/~revenge/Kabuto/kabuto.huyoudo.htm
(17) Nakae Advertising Office. (1990, January 4). nakaead.com. Retrieved from
http://nakaead.com/hobby/okuwa.html
(18) Omma Formation König. (1999). kingss.com. Retrieved from
http://www.kingss.com/youhin/tenka.html
List of References VII
7 Table of Figures
Figure 1: Male adult T.dichotoma on a slice of watermelon. (Source: Own Production) ......................................... I
Figure 2: T.dichotoma eggs. Freshly laid eggs like the first one from the left have have a more oval form. Older
eggs like the two on the right get rounder. (Source: Own production) ................................................................... 4
Figure 3: Skeletal Formula of L-Glu (Source: (O'Connor & Leonard, 2010) .............................................................. 5
Figure 4: A female T.dichotoma (left) is most of the time a bit smaller and has no horns in contrast to a male
(right). (Source: Own production) ............................................................................................................................ 9
Figure 5: Dead larvae turn brown and shrink in size. It is hard conclude why a larvae dies especially when
conditions for all larvae have been the same. Most of the time death cause is an individual sickness or disruption
during skin shedding. (Source: Own production) ................................................................................................... 11
Figure 6: Average weight increase of larvae, in relation to time, in the four test groups. (Source: Own
production) ............................................................................................................................................................ 22
Note: All pictures with own production as source were taken with the camera enlisted in chapter
1.3.1 Materials.

Appendices 1
Appendices
1 Declaration of Authenticity
I hereby declare that the work submitted is my own and that all passages and ideas that are not mine
have been fully and properly acknowledged.
Unterterzen; Submitted January/06/2014 by