Embed Size (px)
Citation preview

Energy for Sustainable Development 23 (2014) 99–109
Contents lists available at ScienceDirect
Energy for Sustainable Development
The effects of fuel type and stove design on emissions and efficiency ofnatural-draft semi-gasifier biomass cookstoves
Jessica Tryner, Bryan D. Willson, Anthony J. Marchese ⁎Department of Mechanical Engineering, Colorado State University, 1374 Campus Delivery, Fort Collins, CO 80523-1374, USA
⁎ Corresponding author. Tel.: +1 970 491 4796.E-mail address: [email protected] (A.J. Marches
http://dx.doi.org/10.1016/j.esd.2014.07.0090973-0826/© 2014 International Energy Initiative. Publish
a b s t r a c t
a r t i c l e i n f oArticle history:Received 9 April 2014Revised 7 July 2014Accepted 21 July 2014Available online 30 August 2014
Keywords:Biomass combustionCookstovesTop-lit up-draft gasifierCarbon monoxide emissionsParticulate matter emissionsCookstove design
To assess the effects of stove design and fuel type on efficiency and emissions, five configurations of natural-draft,top-lit up-draft (TLUD) semi-gasifier cookstoves were tested with two biomass fuels. An energy balance modelwas developed using measured temperature data to identify the major sources of efficiency loss. Emissionsand efficiency varied substantially with stove design and fuel type, and transient increases in CO emission corre-lated with refueling. The highest measured thermal efficiency was 42%. The lowest CO and PM emissions were0.6 g MJd−1 and 48 gMJd−1. These results fall within Tier 3 for high-power efficiency and emissions and suggestthat development of a Tier 4 natural-draft semi-gasifier cookstove is possible. The energy balance illustrates thatup to 60% of the energy input as fuel can remain as char once the fuel has gasified. This result suggests that boththermal and overall efficiencies should be calculated when evaluating TLUD cookstoves.
© 2014 International Energy Initiative. Published by Elsevier Inc. All rights reserved.
Introduction
It is estimated that forty percent of the global population relies oncombustion of solid biomass fuel to fulfill some or all of their householdenergy needs (Bonjour et al., 2013). Themajority of this population usesbiomass cookstoves that are characterized by incomplete combustion.Public health researchers have linked exposure to the carbonmonoxide(CO) and particulate matter (PM) emissions from incomplete combus-tion of solid biomass to numerous health effects such as acute lower re-spiratory infections and chronic obstructive pulmonary disease (Bruceet al., 2006). Some have suggested that a transition to affordable liquidor gaseous cooking fuels would be necessary to completely eliminatethese health impacts (Goldemberg et al., 2004). However, even if atransition to liquid or gaseous fuels is ultimately necessary, such atransition would take many years to accomplish given the size andgeographic distribution of the affected population. Consequently, asubstantial fraction of the global population is expected to continuecooking with solid biomass fuel for the foreseeable future (Rehfuesset al., 2006).
In recent years, designers of household cookstoves have focusedon improving efficiency and reducing emissions to mitigate healthimpacts associated with the use of solid biomass fuel. Rocket elbowcookstoves have been shown to reduce emissions by up to 60% com-pared to a three-stone fire (Jetter and Kariher, 2009). However, ongoing
e).
ed by Elsevier Inc. All rights reserved
public health research is expected to reveal that greater emission reduc-tions are needed to substantially reduce health risks (Smith and Peel,2010).
Semi-gasifier cookstoves have been shown to be the lowest-emittingtype of solid biomass cookstove based on emissionmeasurements takenin the laboratory (Jetter and Kariher, 2009; Jetter et al., 2012). Mostof the semi-gasifier cookstoves that have been developed utilize thetop-lit up-draft (TLUD) design (Anderson and Reed, 2007). In theTLUD design, solid fuel is batch fed into the combustion chamber andignited from the top as shown in Fig. 1. Consumption of the fuel pro-ceeds downward (Reed and Larson, 1996). A primary air source thatenters at the bottom of the fuel bed results in partial oxidization of thefuel into CO, H2, hydrocarbons, CO2 and H2O in the primary combustionzone. The hot char bed above the primary combustion zone reducessome of the CO2 and H2O produced in the primary combustion zoneback to CO and H2 (Quaak et al., 1999). A secondary air source, whichis preheated by the walls of the combustion chamber, is then mixedwith the combustible gases exiting the char zone to form the secondarycombustion zone (Reed and Larson, 1996). Burning the combustiblegases in a location that is separate from the solid fuel bed enables bettermixing of the gases with air and, consequently, more complete combus-tion (Anderson and Reed, 2007). Primary and secondary airflow can bedriven externally (e.g. by a fan or blower) or buoyantly via natural con-vection. A stove in which airflow is driven externally is referred to as a“forced‐air” cookstove and a stove in which airflow is driven buoyantlyis referred to as a “natural-draft” cookstove.
Forced-air semi-gasifier cookstoves have been shown to reduce COand PM emissions by 90% relative to a three-stone fire in laboratory
.
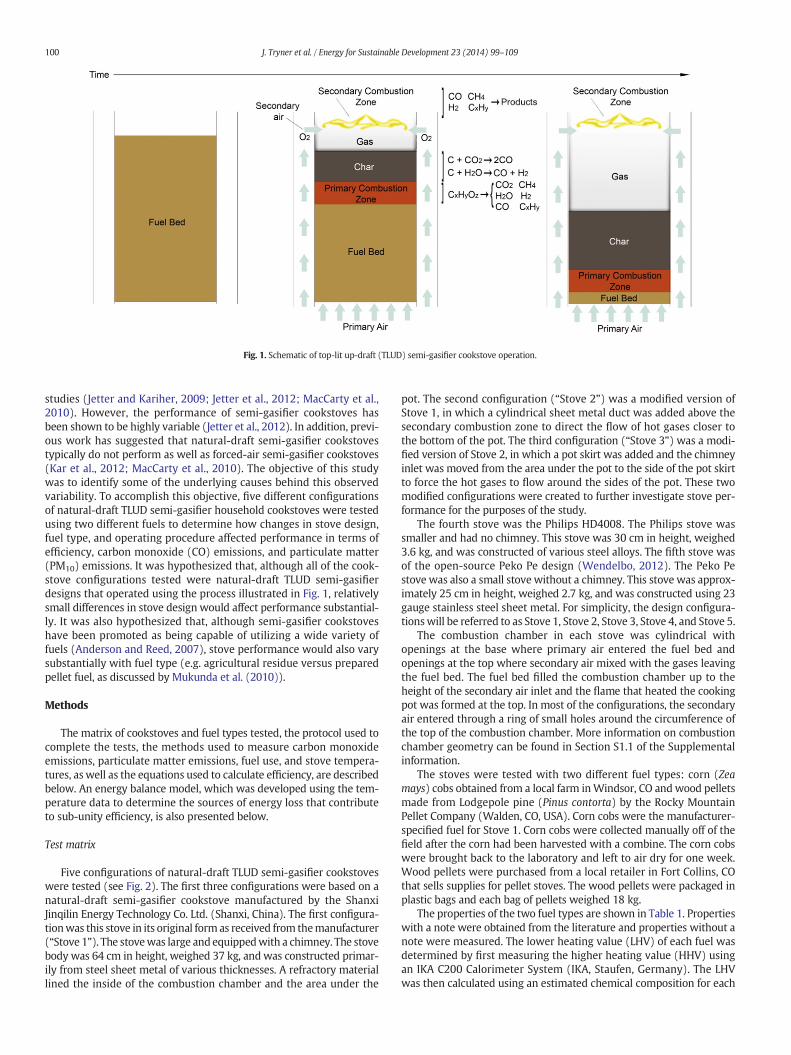
Fig. 1. Schematic of top-lit up-draft (TLUD) semi-gasifier cookstove operation.
100 J. Tryner et al. / Energy for Sustainable Development 23 (2014) 99–109
studies (Jetter and Kariher, 2009; Jetter et al., 2012; MacCarty et al.,2010). However, the performance of semi-gasifier cookstoves hasbeen shown to be highly variable (Jetter et al., 2012). In addition, previ-ous work has suggested that natural-draft semi-gasifier cookstovestypically do not perform as well as forced-air semi-gasifier cookstoves(Kar et al., 2012; MacCarty et al., 2010). The objective of this studywas to identify some of the underlying causes behind this observedvariability. To accomplish this objective, five different configurationsof natural-draft TLUD semi-gasifier household cookstoves were testedusing two different fuels to determine how changes in stove design,fuel type, and operating procedure affected performance in terms ofefficiency, carbon monoxide (CO) emissions, and particulate matter(PM10) emissions. It was hypothesized that, although all of the cook-stove configurations tested were natural-draft TLUD semi-gasifierdesigns that operated using the process illustrated in Fig. 1, relativelysmall differences in stove design would affect performance substantial-ly. It was also hypothesized that, although semi-gasifier cookstoveshave been promoted as being capable of utilizing a wide variety offuels (Anderson and Reed, 2007), stove performance would also varysubstantially with fuel type (e.g. agricultural residue versus preparedpellet fuel, as discussed by Mukunda et al. (2010)).
Methods
The matrix of cookstoves and fuel types tested, the protocol used tocomplete the tests, the methods used to measure carbon monoxideemissions, particulate matter emissions, fuel use, and stove tempera-tures, as well as the equations used to calculate efficiency, are describedbelow. An energy balance model, which was developed using the tem-perature data to determine the sources of energy loss that contributeto sub-unity efficiency, is also presented below.
Test matrix
Five configurations of natural-draft TLUD semi-gasifier cookstoveswere tested (see Fig. 2). The first three configurations were based on anatural-draft semi-gasifier cookstove manufactured by the ShanxiJinqilin Energy Technology Co. Ltd. (Shanxi, China). The first configura-tionwas this stove in its original form as received from themanufacturer(“Stove 1”). The stovewas large andequippedwith a chimney. The stovebody was 64 cm in height, weighed 37 kg, andwas constructed primar-ily from steel sheet metal of various thicknesses. A refractory materiallined the inside of the combustion chamber and the area under the
pot. The second configuration (“Stove 2”) was a modified version ofStove 1, in which a cylindrical sheet metal duct was added above thesecondary combustion zone to direct the flow of hot gases closer tothe bottom of the pot. The third configuration (“Stove 3”) was a modi-fied version of Stove 2, in which a pot skirt was added and the chimneyinlet was moved from the area under the pot to the side of the pot skirtto force the hot gases to flow around the sides of the pot. These twomodified configurations were created to further investigate stove per-formance for the purposes of the study.
The fourth stove was the Philips HD4008. The Philips stove wassmaller and had no chimney. This stove was 30 cm in height, weighed3.6 kg, and was constructed of various steel alloys. The fifth stove wasof the open-source Peko Pe design (Wendelbo, 2012). The Peko Pestove was also a small stove without a chimney. This stove was approx-imately 25 cm in height, weighed 2.7 kg, and was constructed using 23gauge stainless steel sheet metal. For simplicity, the design configura-tionswill be referred to as Stove 1, Stove 2, Stove 3, Stove 4, and Stove 5.
The combustion chamber in each stove was cylindrical withopenings at the base where primary air entered the fuel bed andopenings at the top where secondary air mixed with the gases leavingthe fuel bed. The fuel bed filled the combustion chamber up to theheight of the secondary air inlet and the flame that heated the cookingpot was formed at the top. In most of the configurations, the secondaryair entered through a ring of small holes around the circumference ofthe top of the combustion chamber. More information on combustionchamber geometry can be found in Section S1.1 of the Supplementalinformation.
The stoves were tested with two different fuel types: corn (Zeamays) cobs obtained from a local farm inWindsor, CO andwood pelletsmade from Lodgepole pine (Pinus contorta) by the Rocky MountainPellet Company (Walden, CO, USA). Corn cobs were the manufacturer-specified fuel for Stove 1. Corn cobs were collected manually off of thefield after the corn had been harvested with a combine. The corn cobswere brought back to the laboratory and left to air dry for one week.Wood pellets were purchased from a local retailer in Fort Collins, COthat sells supplies for pellet stoves. The wood pellets were packaged inplastic bags and each bag of pellets weighed 18 kg.
The properties of the two fuel types are shown in Table 1. Propertieswith a note were obtained from the literature and properties without anote were measured. The lower heating value (LHV) of each fuel wasdetermined by first measuring the higher heating value (HHV) usingan IKA C200 Calorimeter System (IKA, Staufen, Germany). The LHVwas then calculated using an estimated chemical composition for each

Fig. 2.Renderings of the five stoves tested. Stove 1 (Jinqilin natural-draft)was 64 cm in height, weighed 37 kg andwas equippedwith a chimney. Stoves 2 and 3weremodified versions ofStove 1. Stove 4 (Philips HD4008) was 30 cm in height and weighed 3.6 kg. Stove 5 (Peko Pe) was 25 cm in height and weighed 2.7 kg. Stoves 4 and 5 were not equippedwith chimneys.
101J. Tryner et al. / Energy for Sustainable Development 23 (2014) 99–109
fuel obtained from the literature. The HHV of the char produced by eachfuel type was also measured. The HHV of the char was used in place ofthe LHV of the char in all calculations because the chemical compositionof the char was unknown.
Table 2 contains a list of all the design configuration/fuel type com-binations tested. The number of replicates completed for each test isalso shown. All tests were conducted by the first author.
Test protocol
The Emissions and Performance Test Protocol (EPTP), which is amodified version of thewater boiling test (WBT), was used in all exper-iments (DeFoort et al., 2010). TheWBT (TheWater Boiling Test: Version4.2.3, 2014) is themost common test used to evaluate cookstove perfor-mance in the laboratory (Chiang and Farr, 2014) and has been used inmany studies on cookstove performance (Carter et al., 2014; Jetter andKariher, 2009; Jetter et al., 2012; MacCarty et al., 2010). The EPTP wascreated to reduce variability between test replicates without alteringthe general results of the WBT (L'Orange et al., 2012). In the presentstudy, only the cold start phase of the EPTP, in which 5 L of water isbrought from 15 °C to 90 °C with the stove body starting out at roomtemperature, was employed. All tests were conducted in Fort Collins,CO, at an elevation of 1519 m, where water boils at 95 °C.
The corn cobs had a low bulk energy density compared to the woodpellets. This difference necessitated changes in operating procedure be-tween tests. When the wood pellets were used, the fuel chamber of thecookstove was filled with enough wood pellets to complete the coldstart test. When the corn cob fuel was used, the fuel chamber was filledcompletely with corn cobs. If the entire fuel bed was consumed prior tothe completion of the cold start test, the stove was refueled by adding anew bed of corn cobs on top of the hot char bed while the stove was inoperation. The operating procedure was varied between tests in thismanner because a real-world user would be expected to refuel thestove to complete the cooking task that had been started. Indeed,Stove 1 had been designed by the manufacturer with a mechanism toenable refueling without removal of the pot.
Table 1Properties of the corn cob and wood pellet fuels.
Fuel type Bulkdensity(kg m−3)
Density(kg m−3)
LHVdaf
(J g−1)Moisture content(mass fraction)
Ash content(mass fraction)
Corn cobs 195a 340b 18,119 8.1% ± 0.1% b2%Wood pellets 696c 1260 ± 55 19,560 5.5% ± 0.6% b1%
a Coovattanachai (1989).b Lin et al. (1995).c Rocky Mountain Pellet Company, Inc. (2012).
Testing equipment
Tests were conducted in a fume hood with a 1.2 m × 1.2 m cross-section and a height of 4.3 m. The air flow rate through the hood was0.1 m3 s−1. The cross sectional area of the hood and the air flow ratewere designed such that they do not affect the airflow through thestove (L'Orange et al., 2012). High efficiency particle air (HEPA) filtersinstalled on the air inlet locations at the base of the hood prevented par-ticulatematter in the ambient air from entering the hood. Exhaust gaseswere transported from the top of the hood to emission analyzers by a12.7 cm diameter pipe.
Total mass emissions of particulate matter with an aerodynamicdiameter of less than 10 μm (PM10) were measured gravimetrically asdescribed by L'Orange et al. (2012)Together, the coarse (PM10–PM2.5)and fine (bPM2.5) PM fractions were collected on Teflon filters thatwere pre- and post-weighed on a Mettler Toledo MX5 microbalance(Mettler-Toledo, LLC, Columbus, OH, USA). The limit of detection(LOD) and limit of quantification (LOQ) for these measurements were16 μg and 55 μg. All PM10 mass emission measurements were found tobe above the LOQ with the exception of one measurement of 53 μg.
CO emissions were measured at 1 Hz with Testo 335 and Testo 350flue gas analyzers (Testo, Sparta, NJ, USA). These analyzers used electro-chemical sensors to measure the mole fraction of CO in the fume hoodexhaust gas. This real-time measurement of emissions allowed the ef-fects of changes in operating procedure on emissions to be observed.The steps that were taken to ensure that the Testo gas analyzers weremeasuring CO emissions accurately are described in Section S1.2 ofthe Supplemental Information.
Real-time temperature data were acquired at 1 Hz from 17 to24 type K thermocouples (Omega Engineering, Stamford, CT, USA)installed on each stove. Gas temperature measurements included inletair temperature, preheated secondary air temperature, and exhaustgas temperature. Temperatures were also recorded at various locationsin the fuel chamber and on the outside of the stove body. An additionaltype K thermocouple submerged in the pot of water measured thewater temperature at 0.6875 Hz. A program, created in LabVIEW™,monitored the water temperature, controlled the airflow rate through
Table 2Table of tests conducted.
Configuration Fuel type No. of replicates
Stove 1 (Jinqilin natural-draft) Corn cobs 4Stove 1 (Jinqilin natural-draft) Wood pellets 3Stove 2 Corn cobs 2Stove 2 Wood pellets 3Stove 3 Corn cobs 3Stove 3 Wood pellets 3Stove 4 (Philips HD4008) Corn cobs 3Stove 4 (Philips HD4008) Wood pellets 3Stove 5 (Peko Pe) Corn cobs 3Stove 5 (Peko Pe) Wood pellets 3

102 J. Tryner et al. / Energy for Sustainable Development 23 (2014) 99–109
the fume hood, and recorded the starting and ending time for each test.More information on the instrumentation used for data collection canbe found in Section S1.2 of the Supplemental Information.
Efficiency calculations
In addition to the emissions and temperature measurements de-scribed above, fuel consumption measurements were made for each ofthe configuration/fuel type combinations in Table 2. The equationsthat were used to calculate efficiency based on these measurementsare described below.
The thermal efficiency of each stove is defined as the ratio of theenergy transferred to the water to the difference between the energyavailable in the fuel and the energy contained in the char remainingat the end of the test. Thermal efficiency is calculated using Eq. (1)(DeFoort et al., 2010):
η ¼ cp;H2OmH2OΔTH2O þ hv;H2OmH2Oevap
mf 1−MC f
� �LHVf ;dry−mfMCf cp;H2OΔTH2O; f þ hv;H2O
� �−LHVcmc
ð1Þ
where cp,H2O is the specific heat of water (J g−1 K−1),mH2O is themass ofwater boiled (g),ΔTH2O is the change in thewater temperature betweenthe beginning and end of the test (K), hv,H2O is the heat of vaporizationof water (J g−1), mH2Oevap is the mass of water evaporated out of thepot during the test (g), mf is the mass of wet fuel consumed (g),MCf isthe moisture content of the fuel (as a mass fraction on a wet basis),LHVf,dry is the lower heating value of the fuel on a dry basis (J g−1),ΔTH2O,f is the temperature change that the water in the fuel had toundergo before it was evaporated (assumed to be 75 K), LHVc is thelower heating value of the charcoal produced from the fuel (J g−1),and mc is the mass of the ash and charcoal remaining at the end of thetest (g).
The overall efficiency of each stove is defined herein as the ratio of theenergy transferred to the water to the energy available in the dry massof fuel consumed (Eq. (2)).
ηOA ¼ cp;H2OmH2OΔTH2O þ hv;H2OmH2Oevap
mf 1−MCf
� �LHVf ;dry−mfMCf cp;H2OΔTH2O; f þ hv;H2O
� � ð2Þ
In this formulation, the energy remaining in the charcoal left at theend of the test represents an energy loss. Although the chemical energycontained in this char is still available for subsequent use, it should notbe assumed that it will be converted into thermal energy (Kar et al.,2012). It should be noted, however, that most studies on stove perfor-mance do account for the energy remaining in the char and report thethermal efficiency shown in Eq. (1) (Jetter and Kariher, 2009; Jetteret al., 2012; MacCarty et al., 2010).
Energy balance model
To determine the major sources of efficiency loss and to inform fu-ture design efforts, all of the energy sources, sinks, and components ofenergy transfer present during stove operation were accounted for ina thermodynamic energy balance model. The sources of energy includethe energy in the fuel and the energy in the inlet air. The energycontained in the char remaining at the end of the test was counted asan energy sink. The energy transfer components included the energytransferred to the water, the energy transferred to (and stored in) thestove body, the energy lost through convection and radiation heat trans-fer from the outside of the stove body to the surroundings, and theenergy lost through the exhaust gases.
The portion of the energy contained in the fuel that could have beenused to heat the cooking surface was calculated using Eq. (3):
Ef ¼ mf 1−MC f
� �LHVf ;dry−mfMCf cp;H2OΔTH2O; f þ hv;H2O
� �ð3Þ
wheremf is the mass of fuel consumed (g),MCf is the moisture contentof the fuel (as a mass fraction on a wet basis), LHVf,dry is the lowerheating value of the dry fuel (J g−1), ΔTH2O,f is the temperature changethat the water in the fuel had to undergo before it was evaporated(assumed to be 75 K), and hv,H2O is the heat of vaporization of water(J g−1). The second term on the right hand side of Eq. (3) representsenergy contained in the fuel that had to be used to evaporate thewater stored in the fuel.
The energy transferred to the water was calculated using Eq. (4):
EH2O ¼ mH2Ocp;H2O Tf−Ti
� �þ hv;H2OmH2Oevap ð4Þ
where EH2O is the energy transferred to thewater (J),mH2O is themass ofwater (kg), cp,H2O is the specific heat of the water (J kg−1 K−1), Tf isthe final temperature of the water (90 °C), Ti is the initial temperatureof the water (13 °C to 17 °C), hv,H2O is the heat of vaporization ofwater (2260 J g−1), and mH2Oevap is the mass of water evaporated outof the pot during the test (g).
The energy contained in the char remaining at the end of the testwas calculated using Eq. (5):
Ec ¼ mcHHVc ð5Þ
where Ec is the energy contained in the char (J), mc is the mass of char(g), and HHVc is the higher heating value of the char (J g−1).
For Stoves 4 and 5, the energy added to the stove body was calcu-lated by multiplying the mass of the stove by the specific heat of themetallic stove body and the change in temperature of the stove bodybetween the beginning and end of the test (Eq. (6)).
Estove ¼ mstoveC Tf−Ti
� �ð6Þ
where Estove is the energy stored in the stove body (J),mstove is the massof the stove (kg), C is the specific heat of the material the stove is con-structed from (J kg−1 K−1), Tf is the final temperature of the stovebody (K), and Ti is the initial temperature of the stove body (K). Thespecific alloys from which Stoves 4 and 5 were constructed were un-known and properties of plain carbon steel and AISI 304 stainlesssteel were assumed for these calculations.
Calculating the quantity of the energy stored in the bodies ofStoves 1, 2, and 3 was more complicated because, although thesestoves were constructed primarily of steel, the stove bodies alsocontained a large mass of dense refractory material. The refractorymaterial was expected to be at a higher temperature than the steelframe because the refractory material was directly exposed to thehot gases that passed under the pot. The large mass and low thermalconductivity of the refractory material (in comparison to the steel) re-quired the development of an additional heat transfer model to deter-mine the quantity of thermal energy stored in the refractory material.More information on this heat transfer model can be found in theSection S2 of the Supplemental Information.
The energy stored in the steel frame was calculated by multiplyingthe mass of the frame by the specific heat of the frame and the changein temperature between the beginning and end of the test:
Eframe ¼ msteelCsteel Tf−Ti
� �ð7Þ
where Eframe is the energy stored in the steel frame (J),msteel is the massof the steel frame (25 kg), Csteel is the specific heat of the specific heat ofplain carbon steel (434 J kg−1 K−1) (Incropera et al., 2007), Tf is the

103J. Tryner et al. / Energy for Sustainable Development 23 (2014) 99–109
temperature of the steel frame at the end of the test (K), and Ti is thetemperature of the steel frame at the beginning of the test (K). At eachtime step the entire steel frame was assumed to be at the average tem-perature measured by the four thermocouples installed on the outsidewalls of the stove.
For Stoves 1, 2, and 3, the total energy stored in the stove body wascalculated by adding the amount of energy stored in the steel frame tothe amount of energy stored in the block of refractory material:
Estove body ¼ Eframe þ Eblock: ð8Þ
The heat lost through convection from the stove bodywas calculatedusing Eq. (9):
Econv ¼Z t f
0h tð ÞA T tð Þ−T∞½ �dt ð9Þ
where Econv is the energy lost through convection (J), h is the convectioncoefficient (Wm−2 K−1), A is the surface area of the sides of the stove(m2), T is the temperature of the stove body (K), T∞ is the temperatureof the surroundings (K), and tf is the length of the test (s).
Eq. (9) was integrated numerically using the outside stove bodytemperature that was recorded every second during the test as T(t).The Rayleigh number, Nusselt number, and the convection coefficientwere recalculated at every time step. The average of the primary andsecondary air inlet temperatures at time 0 was taken as the ambientair temperature.
The outer surfaces of Stoves 1, 2, and 3 were modeled as 4 verticalplates. The outer surfaces of Stoves 4 and 5 were modeled as single ver-tical plateswith surface areas equal to the surface areas of the cylindricalouter walls. The outside walls were assumed to be isothermal at eachtime step. The convection coefficient was calculated using the Nusseltnumber correlation for natural convection over a vertical flat plateshown in Eq. (10) (Churchill and Chu, 1975).
NuL ¼ 0:68þ 0:670RaL1=4
1þ 0:492=Prð Þ9=16� �4=9 ; RaL≤109 ð10Þ
where NuL is the average Nusselt number over the length of the plate,RaL is the Rayleigh number, and Pr is the Prandtl number (0.7 for air).
The convection coefficient was calculated from the Nusselt numberas shown in Eq. (11) (Incropera et al., 2007):
hL ¼NuL k
Lð11Þ
where k is the thermal conductivity of the air (Wm−1 K−1).The radiation heat loss from the stove body was calculated using
Eq. (12):
Erad ¼Z t f
0ϵσA T tð Þ4−T∞
4h i
dt ð12Þ
where Erad is the energy lost through radiation (J), ϵ is the emissivityof the stove, σ is the Stefan–Boltzmann constant (W m−2 K−4), Ais the surface area of the stove (m2), T(t) is the temperature of thestove body (K), and T∞ is the temperature of the surroundings (K).Eq. (12) was integrated numerically using the same temperaturesused in Eq. (9).
The amount of energy transferred to thewater, contained in the charat the end of the test, stored in the stove body, and lost through radia-tion and convection from the outside walls of the stove was subtractedfrom the total energy contained in the fuel input at the beginning of thetest. The difference was taken to be the amount of energy lost throughthe exhaust from the stove.
Results and discussion
The high power carbonmonoxide emissions, high power particulatematter emissions, and thermal efficiencies measured during the exper-iments, as well as the results of the energy balance calculations, arepresented below. First, the differences between the results for eachdesign configuration/fuel type combination are presented. Second, theresults are compared to the tier ratings for biomass cookstove perfor-mance established at the ISO International Workshop on Clean andEfficient Cookstoves. Third, the real-time carbon monoxide emissionmeasurements are used to identify large, transient increases in emis-sions associated with refueling of semi-gasifier cookstoves. Fourth,some further discussion on the emissions results is provided. Fifth, theresults of the energy balance model are presented.
Influence of design configuration and fuel type on emissions and efficiency
As shown in Fig. 3, the high-power CO and PM10 emissions fromall five configurations varied substantially with fuel type. In general,the measured emissions were lower when wood pellets were used asfuel instead of corn cobs. For example, when Stove 1 was fueled withwood pellets instead of corn cobs, CO emissions decreased by a factorof 47 and PM10 emissions decreased by a factor of 6. Similarly, whenStove 4 stove was fueled with wood pellets instead of corn cobs, COemissions decreased by a factor of 2. When Stove 5 was fueled withwood pellets instead of corn cobs, CO emissions decreased by a factorof 11 and PM10 emissions decreased by a factor of 3.
Although the design changes made to Stove 1 resulted in reducedemissions, Stoves 1, 2, and 3 generally producedmuch higher emissionsthan both Stoves 4 and 5. Stove 5 exhibited the lowest emissions overall.As shown in Fig. 4, Stoves 4 and 5were alsomore efficient than Stoves 1,2, and 3.
Unlike emissions, thermal efficiency was not affected by fuel type(Fig. 4). The average thermal efficiencies for Stove 1 fueled with corncobs and Stove 1 fueled with wood pellets were 8.3% and 9.0%, respec-tively. The average thermal efficiencies for Stove 2 fueled with corncobs and Stove 2 fueled with wood pellets were 12.3% and 12.2%. Simi-larly, the average thermal efficiencies for Stove 3 fueled with corn cobsand Stove 3 fueledwithwoodpelletswere 20.1% and 19.9%. The thermalefficiency of a given design configuration is expected to depend primar-ily upon stove geometry.
Comparison to tiers for cookstove performance
In Figs. 3 and 4, the performance of each stove has been comparedto the tier ratings for high-power CO emissions, high-power PM emis-sions, and high-power efficiency established at the ISO InternationalWorkshop on Clean and Efficient Cookstoves. For each parameter,5 levels of performance ranging from Tier 0 to Tier 4 are included (ISOInternational Workshop on Clean and Efficient Cookstoves, 2012). Tier0 represents a stove that is comparable to or worse than a three stonefire or traditional stove. Tier 4 represents a highly performing stovethat would be expected to decrease health risks substantially if it wereto completely replace the traditional stove. Tiers 1 through 3 representvarious levels of improved stoves.
In terms of these tier ratings, Stoves 1, 2, and 3 had themost variableperformance, which ranged from Tier 0 to Tier 3 depending on the fueltype and design configuration implemented. The performance of Stove4 was the least variable; emissions remained within Tier 2 for bothfuel types. Emissions from Stove 5 were on the border between Tier 2and Tier 3 when the stove was fueled with corn cobs and on the borderbetween Tier 3 and Tier 4 when the stove was fueled with wood pellets(Fig. 3). Although several of the configuration/fuel type combinationsmet the Tier 4 high-power CO rating, only Stove 5 operating on woodpellets came close to meeting the Tier 4 high-power PM rating. Theemission results for Stove 5 are noteworthy since previous studies

Fig. 3. High power carbon monoxide emissions vs. high power particulate matter emissions compared to ISO tiers for biomass stove performance. Error bars represent one standarddeviation with the exception of the error bars on the data point for Stove 2 fueled with corn cobs. This data point (marked with an asterisk) is based on only two test replicates andthe error bars represent the total range of the two results.
104 J. Tryner et al. / Energy for Sustainable Development 23 (2014) 99–109
suggested that such low particulatematter emissionswere only achiev-able with forced-air semi-gasifier cookstoves (Jetter et al., 2012). Theseresults suggest that natural-draft TLUD semi-gasifier cookstoves havethe potential to meet both of the high power Tier 4 emission ratings.
Emission increases associated with refueling
The two design changes made to Stove 1 to create Stoves 2 and3 were motivated by the low efficiencies measured with Stove 1. Theefficiency increased when the cylindrical duct and pot skirt were
Fig. 4.High power carbonmonoxide emissions vs. thermal efficiency compared to ISO tiers for bof the error bars on the data point for Stove 2 fueled with corn cobs. This data point (marked wrange of the two results.
added above the secondary combustion zone. The effect of these designchanges on CO and PM10 emissions varied depending on the fuel type.Specifically, when corn cobs were used as a fuel, emissions from Stoves2 and 3 were lower than those from Stove 1. When wood pellets wereused as a fuel, emissions from Stoves 2 and 3 were higher than thosefrom Stove 1 (Fig. 4).
The high CO emissions observed when Stove 1 was operated usingcorn cob fuel resulted from the need to refuel the stove prior to comple-tion of the cold start test due to the low bulk energy content in the corncobs and high thermal mass of the stove. This determination was made
iomass stove performance. Error bars represent one standard deviationwith the exceptionith an asterisk) is based on only two test replicates and the error bars represent the total

105J. Tryner et al. / Energy for Sustainable Development 23 (2014) 99–109
by comparing real-time CO measurements with real-time temperaturemeasurements taken inside the fuel chamber. Fuel bed temperaturemeasurements allowed tracking of the primary combustion zoneduringstove operation. Data from a representative cold start performed withStove 1 and corn cob fuel are shown in Fig. 5a. CO emission levelswere lowest at the beginning of the test, just after ignition, when gasifi-cation had not yet started. CO emissions became noticeably higher oncegasification started. Emissions increased once againwhen the entire fuelbed had gasified and the char began to burn. After the char was burnt,fuel had to be added to continue the test. Subsequent batches of fuelwere consumed quickly and carbonmonoxide emissions became higherthan at any other point during the test. During these times the stovewasno longer operating purely as a TLUD semi-gasifier. Refuelingmay have
(a)
(c)
(e)
Fig. 5. CO emissions and fuel chamber temperatures during a cold start test done with (a) St(d) Stove 2 and wood pellet fuel, (e) Stove 3 and corn cob fuel, and (f) Stove 3 and wood pelle
also resulted in sharp increases in PM emissions, but real-time PMemis-sions were not measured in this study.
Similar CO emission trends were observed when Stoves 2 and 3were operated using corn cob fuel. The modifications to Stove 1 didnot reduce CO emission levels for the first batch of fuel substantially.However, because Stoves 2 and 3 exhibited improved the heat transferto the pot, the stoveswere refueled fewer times. The lower overall emis-sions for the tests were the result of reducing the number of emissionspikes. For Stove 2, consumption of the original batch of corn cob fuelproceeded more slowly than in Stove 1 and the stove only had to berefueled once during the test (Fig. 5c). For Stove 3, the approximatetime to boil was reduced from 25 min (for Stove 1) to 15 min and thestove did not have to be refueled during the test (Fig. 5e).
(b)
(d)
(f)
ove 1 and corn cob fuel, (b) Stove 1 and wood pellet fuel, (c) Stove 2 and corn cob fuel,t fuel.

106 J. Tryner et al. / Energy for Sustainable Development 23 (2014) 99–109
When Stove 1 was fueled with wood pellets, extremely low COemissions were observed (Fig. 5b). In this case, Stove 1 did not requirerefueling prior to completion of the test. Emissions from Stove 2 werenot substantially different (see Fig. 5b and d). However, emission levelsfrom Stove 3 were higher (Fig. 5f). In this configuration, the modifica-tions may have affected the airflow through the stove and enhancedheat transfer from the hot gases to the pot may have actually limitedthe oxidation of pollutants by reducing the gas temperature.
The performance of Stove 4 did not vary as substantially with fueltype in comparison to Stoves 1, 2, and 3. As shown in Fig. 6, the CO emis-sions were slightly higher for Stove 4 when the corn cob fuel was used.Stove 4 had to be refueled once during the cold start when corn cobswere used. However, a dramatic increase in emission rate was not ob-served upon refueling. Stove 5 did not require refueling during thecold start when either fuel was used (Fig. 7).
These results illustrate how the bulk energy density of the fuel im-pacts the CO emissions. It is understood that the choice of fuel typeused in the field is dictated by cost and availability. However, the resultsunderscore the need to incorporate the fuel type that the consumer isknown to be most likely to use into the stove design for TLUD semi-gasifier cookstoves.
These results also illustrate how changes in operator behavior canhave a large affect on stove performance. This point has been illustratedwith other types of cookstoves in previous studies. Jetter et al. (2012)tested a three stone fire and two rocket elbow stoves under differentoperating conditions and observed a substantial variation in emissionsperformance. If the natural-draft TLUD semi-gasifier cookstoves testedin this study were to be tested by different operators, either in the lab-oratory or under real-world conditions, the technique used by differentoperators to refuel the stove, and the frequency at which differentoperators refueled, would most likely lead to substantial variability inthe results. Since refueling has been demonstrated to result in large,transient increases in CO emission rate, semi-gasifier cookstove dissem-ination projects should be accompanied by training to educate users onthe issues associated with adding fuel onto the hot char bed.
Further discussion on the experimental results
Because only the cold start phase of the EPTPwas completed, the re-sults do not provide a complete picture of the performance of eachstove. The results of the hot start phase are also typically consideredwhen evaluating high-power performance, and ISO IWA tiers were
(a)
Fig. 6. CO emissions and fuel chamber temperatures during a cold start test d
also established for low-power emissions and fuel consumption (ISOInternationalWorkshopon Clean and Efficient Cookstoves, 2012). How-ever, the purpose of this study was not to provide a comprehensive re-view of stove performance. Rather, the purpose was to illustrate howperformance could vary between five different stove configurationsthat operate under the same natural-draft TLUD semi-gasifier operatingprinciple.
Another limitation associated with the experimental results is thesmall sample sizes used and the high variance associated with the COand PM10 measurements. This variance is illustrated by the error bars,which depict one standard deviation, in Figs. 3 and 4. The use of largersample sizes would have improved the level of confidence in the overallmagnitudes of the emission measurements. However, the experimentalresults illustrate the range of performance that is possible with natural-draft TLUD semi-gasifier cookstoves, and the real-time carbonmonoxideemission measurements illustrate how strongly performance can be af-fected by fuel type, operating conditions, and user behavior. Efficiencymeasurements, on the other hand, were less variable and the coefficientof variance for all efficiency measurements was below 20%.
Three of the design configurations tested (Stoves 1, 2, and 3) in-cluded chimneys. In addition to the tiers for overall high-power emis-sions, ISO IWA tiers for indoor emissions have been established (ISOInternational Workshopon Clean and Efficient Cookstoves, 2012) tohelp evaluate the potential for improving user health by using a chim-ney to direct emissions away from the user and out of the home. In-door emissions, which represent the difference between the totalemissions from the stove and the portion of those emissions thatwould be directed out of the home through the chimney, were notmea-sured in this study. Consequently, the total emissions from the chimneystoves may not necessarily be comparable to the total emissions fromthe non-chimney stoves from the perspective of health impacts. How-ever, field studies involving chimney stoves have shown that not all ofthe emissions produced by a chimney stove are directed out of thehome and that high concentrations of CO and PMmay still bemeasuredinside homes with chimney stoves (Naeher et al., 2000; Northcrosset al., 2010; Tian et al., 2009). Because a portion of the emissions pro-duced by a chimney stove are expected to remain in the home, loweroverall emissions from chimney stoves are expected to correlate withlower indoor emissions.
It should also be noted that all five stoves exhibited carbon monox-ide emission spikes during shut-down. These spikes are not shown inFigs. 5 through 7, however, because emissions from the shut-down
(b)
one using Stove 4 (a) with corn cob fuel and (b) with wood pellet fuel.

(a) (b)
Fig. 7. CO emissions and fuel chamber temperatures during a cold start test done using Stove 5 (a) with corn cob fuel and (b) with wood pellet fuel.
107J. Tryner et al. / Energy for Sustainable Development 23 (2014) 99–109
process are not included in the EPTP or any other water boiling test.However, the existence of shut-down emissions, as well as mitigationmethods, should be considered since users will be exposed to theseemissions during real-world use of semi-gasifier cookstoves.
Energy balance results
The results of the energy balance model are shown in Figs. 8 and 9.The calculated quantities of energy transferred to the water andstove body; remaining in the char; and transferred out of the stovevia the exhaust gases, convection and radiation are shown. For eachconfiguration/fuel type combination, the results are reported in termsof total energy required to complete the cold start test (Fig. 8) and asa fraction of the total energy contained in the fuel input into the stoveduring the test (Fig. 9).
Fig. 8. Results of the energy balance with the total energy consumption attributed to each cominput into the stove, in the form of fuel, to bring 5 L of water from 15 °C to 90 °C.
Stove 1 used the greatest amount of energy to complete the test(Fig. 8). Compared to Stoves 4 and 5, Stoves 1, 2 and 3 had more heataddition to the stove body and energy transferred out of the stove viathe exhaust gases. These larger losses were the result of the high ther-mal mass of Stoves 1, 2, and 3 as well as the presence of the chimney(MacCarty et al., 2010). The thermal efficiency of a cookstove is primar-ily dependent upon the ability to transfer heat to the cooking surfacethrough radiation from the flame and convection from the hot gases.The amount of heat transferred to the cooking surface by convection isproportional to the area over which the hot gases flow. Stoves 1 and 2only allowed heat to be transferred to the pot by radiation and by hotgases impinging on the bottom of the pot. The surface area for convec-tion was limited to the area of the bottom of the pot. Consequently,thermal efficiencies were low in these configurations. Stove 3, which in-cluded a pot skirt, had a larger area over which convective heat transferto the pot could occur because the hot gases were forced to flow around
ponent shown. The overall length of the bar for each test case represents the total energy

Fig. 9. Results of the energy balance with the total energy consumption attributed to each component shown as a percentage of total energy consumption.
108 J. Tryner et al. / Energy for Sustainable Development 23 (2014) 99–109
the sides of the pot. It should be noted that, for Stove 3, a faster time toboil also resulted in reduced energy losses due to stove body heating,despite the high thermal mass of the stove, as evidenced by the resultsfor Stoves 2 and 3 operating with corn cobs. These results suggest thatthe stove body never reached a steady state temperature.
For Stoves 4 and 5, which had lower thermal masses due to theirsmaller sizes and lack of refractory lining, energy losses due to stovebody heating, convection, and radiation were all very low (Fig. 8).Although the thermal efficiencies of Stoves 4 and 5 were comparable(Fig. 4), Stove 5 used more energy to complete the test than Stove 4(Fig. 8). This difference was due to the fact that a large amount ofthe energy input to Stove 5 was left over as char at the end of the test(Fig. 9).
As shown in Fig. 9, a large fraction of the energy input into a semi-gasifier cookstove in the form of fuel may be left over in the form ofchar at the end of the test. Most notably, an average of 52% and 59% ofthe energy input was left over as char at the end of the test for Stove 5fueled with corn cobs and wood pellets, respectively. This value was28% for Stove 1 fueled with wood pellets, 26% for Stove 2 fueled withwood pellets, 23% for Stove 3 fueled with corn cobs, 35% for Stove 3fueled with wood pellets, 23% for Stove 4 fueled with corn cobs,and 32% for Stove 4 fueled with wood pellets. These results illustratewhy it is important to consider the difference between the thermalefficiency and overall efficiency when evaluating a semi-gasifiercookstove—especially if the cookstove has been designed to producecharcoal or biochar. Although the average thermal efficiency of Stove5 was approximately 42%, the average overall efficiency was only 17%(Fig. 9).
If the char that is left over after the fuel is gasified is put to someuse (for example, as a fuel in a charcoal-burning stove or as a soilamendment), the low overall efficiency may not be a disadvantageto the stove user. For example, some combination TLUD/charcoal cook-stoves have been designed inwhich the fuel chamber can be removed totransform a semi-gasifier cookstove into a charcoal stove once the gas-ification process is complete (for an example, see Wisdom Innovations(2013)). However, it is recommended that testing protocols include acalculation of efficiency, similar to the “overall efficiency” calculationused in this study and shown in Eq. (2), in which the energy remainingin the char at the end of the test is not subtracted from the energy inputinto the stove in the form of fuel. The thermal efficiency calculationtypically used in the WBT and EPTP test protocols (DeFoort et al.,
2010; The Water Boiling Test: Version 4.2.3, 2014) is primarily a mea-sure of how efficiently heat is transferred to the pot and does not alwaysreflect how efficiently a given stove uses fuel overall.
Conclusions
The results of this study illustrate that differences in stove design canlead to a wide variation in performance among different natural-draftTLUD semi-gasifier cookstoves. In addition, changes in fuel type and op-erating procedure can have a profound effect on the exhaust emissionsfor the same natural-draft TLUD semi-gasifier cookstove. The resultsshow that natural-draft TLUD semi-gasifier cookstoves do have the po-tential to achieve lowemissionswhen operated under controlled condi-tions (specified fuel type and operating procedure). Additional work isneeded to develop a natural draft semi-gasifier cookstove that achievesTier 4 performance, but the results of this study suggest that Tier 4 high-power emissions and thermal efficiencymay be within reach using thisrelatively simple design.
The instantaneous CO and temperaturemeasurements strongly sug-gest that refueling TLUD semi-gasifier cookstoves results in a sharp in-crease in CO emissions. In the field, there is no guarantee that userswill refrain from refueling the stove during operation and thereby beexposed to high emissions. Improving the thermal efficiency of a stovecan reduce the incidence of these transient increases in CO emissionsby increasing the amount of useful energy that can be delivered to thecooking surfacewithout refueling. However, eliminating these transientincreases altogether by developing a stove design that can respond totransient conditions will be necessary to ensure low CO emissions inthe field. Overall, it is important to consider real-world operating condi-tions when designing a semi-gasifier cookstove and efforts should notfocus only on designing a stove that performs well during laboratorytests and achieves high ratings according to the ISO IWA tiers. Specifical-ly, the effects that all modes of stove operation, including refueling,transition to char combustion, and shut-down, have on emissionsshould be considered even if these operationalmodes do not necessarilyoccur during the course of a WBT.
Stoves should be tested in the laboratory using as many fuels thatmay be used in the field as possible. Existing TLUD semi-gasifier cook-stove designs should not be promoted as capable of utilizing any bio-mass as fuel. Although the stove will function using a wide variety offuels, emissions performance will vary substantially. This study clearly

109J. Tryner et al. / Energy for Sustainable Development 23 (2014) 99–109
shows that TLUD semi-gasifier cookstoves that exhibit very low emis-sions with one fuel type may exhibit very high emissions with anotherfuel type. Accordingly, further research and development efforts mustbe aimed at developing cookstove designs whose emissions and perfor-mance aremore robust and not as strongly affected by the solid biomassfuel type and/or stove operating conditions.
Furthermore, the results of the energy balance modeling illustratethat, for some designs, up to 60% of the energy contained in the fuelthat is consumed by TLUD semi-gasifier cookstoves is left over in theform of char after the fuel bed is gasified. This result illustrates the im-portance of considering the difference between the fraction of the ener-gy released from the fuel that is transferred to the cooking pot and thefraction of the energy contained in the total mass of fuel consumedthat is transferred to the cooking pot. It is also important to considerwhether or not the char that is produced will be useful to the targetconsumer.
Acknowledgments
The authors acknowledge the National Science Foundation forproviding a graduate research fellowship to Jessica Tryner (NSF DGE0801707) and Impact Carbon for funding a portion of the experiments.The authors also acknowledge the support of the U.S. Department ofEnergy award number DE-EE006086.
Appendix A. Supplementary data
Supplementary data to this article can be found online at http://dx.doi.org/10.1016/j.esd.2014.07.009.
References
Anderson PS, Reed TB. Micro-gasification: what it is and why it works. Boiling Point 2007;53:35–7.
Bonjour S, Adair-Rohani H, Wolf J, Bruce NG, Mehta S, Prüss-Ustün A, et al. Solid fuel usefor household cooking: country and regional estimates for 1980–2010. EnvironHealth Perspect 2013;121(7):784–90. http://dx.doi.org/10.1289/ehp.1205987.
Bruce N, Rehfuess E, Mehta S, Hutton G, Smith K. Indoor air pollution. In: Jamison DT,Breman JG, Measham AR, Alleyne G, Claeson M, Evans DB, Jha P, Mills A, MusgroveP, editors. Disease control priorities in developing countries. 2nd ed. WashingtonDC: The World Bank; 2006. p. 793–815.
Carter EM, Shan M, Yang X, Li J, Baumgartner J. Pollutant emissions and energy efficiencyof Chinese gasifier cooking stoves and implications for future intervention studies.Energy Sustain Dev 2014;48(11):6461–7. http://dx.doi.org/10.1021/es405723w.
Chiang R, Farr K. Stove testing update — Release of Water Boiling Test protocol 4.2.3.Online; 2014 [http://www.cleancookstoves.org/blog/release-wbt-protocol-4-2-3.html, accessed June 23, 2014].
Churchill SW, Chu HHS. Correlating equations for laminar and turbulent free convectionfrom a vertical plate. Int J Heat Mass Transfer 1975;18(11):1323–9. http://dx.doi.org/10.1016/0017-9310(75)90243-4.
Coovattanachai N. Biomass gasification research and field developments by the Prince ofSongkla University, Thailand. Biomass 1989;18(3–4):241–71. http://dx.doi.org/10.1016/0144-4565(89)90036-X.
DeFoort M, L'Orange C, Kreutzer C, Lorenz N, Kamping W, Alders J. Stove manufacturersemissions and performance test protocol (EPTP). Technical Report. Engines andEnergy Converesion Laboratory; Fort Collins; 2010. [Retrieved from http://www.cleancookstoves.org/our-work/standards-and-testing/learn-about-testing-protocols/protocols/downloads/eptp-protocol.pdf].
Goldemberg J, Johansson TB, Reddy AKN, Williams RH. A global clean cooking fuel initia-tive. Energy Sustain Dev 2004;8(3):5–12. http://dx.doi.org/10.1016/S0973-0826(08)60462-7.
Incropera FP, DeWitt DP, Bergman TL, Lavine AS. Fundamentals of heat andmass transfer.6th ed. Hoboken: John Wiley and Sons; 2007.
ISO International Workshop on Clean and Efficient Cookstoves. Online http://www.pciaonline.org/files/ISO-IWA-Cookstoves.pdf, 2012. [accessed February 25, 2014].
Jetter JJ, Kariher P. Solid-fuel household cook stoves: characterization of performance andemissions. Biomass Bioenergy 2009;33(2):294–305. http://dx.doi.org/10.1016/j.biombioe.2008.05.014.
Jetter J, Zhao Y, Smith KR, Khan B, Yelverton T, DeCarlo P, et al. Pollutant emissions andenergy efficiency under controlled conditions for household biomass cookstovesand implications for metrics useful in setting international test standards. EnvironSci Tech 2012;46(19):10827–34. http://dx.doi.org/10.1021/es301693f.
Kar A, Rehman IH, Burney J, Puppala SP, Suresh R, Singh L, et al. Real-time assessment ofblack carbon pollution in Indian households due to traditional and improved biomasscookstoves. Environ Sci Tech 2012;46(17):2993–3000. http://dx.doi.org/10.1021/es303338u.
L'Orange C, DeFoort M, Willson B. Influence of testing parameters on biomass stove per-formance and development of an improved testing protocol. Energy Sustain Dev2012;16(1):3–12. http://dx.doi.org/10.1016/j.esd.2011.10.008.
Lin JL, Keener HM, Essenhigh RH. Pyrolysis and combustion of corn cobs in a fluidizedbed: measurement and analysis of behavior. Combust Flame 1995;100(1–2):271–82. http://dx.doi.org/10.1016/0010-2180(94)00143-G.
MacCarty N, Still D, Ogle D. Fuel use and emissions performance of fifty cooking stoves inthe laboratory and related benchmarks of performance. Energy Sustain Dev 2010;14(3):161–71. http://dx.doi.org/10.1016/j.esd.2010.06.002.
Mukunda HS, Dasappa S, Paul PJ, Rajan NKS, Yagnaraman M, Kumar DR, et al. Gasifierstoves — science, technology and field outreach. Curr Sci 2010;98(5):627–38.
Naeher LP, Smith KR, Leaderer BP, Mage D, Grajeda R. Indoor and outdoor PM2.5 and CO inhigh- and low-density Guatemalan villages. J Expo Anal Environ Epidemiol 2000;10(6):544–51.
Northcross A, Chowdhury Z, McCracken J, Canuz E, Smith KR. Estimating personal PM2.5exposures using CO measurements in Guatemalan households cooking with woodfuel. J Environ Monit 2010;12(4):873–8.
Quaak P, Knoef H, Stassen H. Energy from biomass: a review of combustion and gasifica-tion technologies. Technical report WTP422. Washington DC: The World Bank; 1999.
Reed TB, Larson R. A wood-gas stove for developing countries. Energy Sustain Dev 1996;3(2):34–7. http://dx.doi.org/10.1016/S0973-0826(08)60589-X.
Rehfuess E, Mehta S, Prüss-Üstün A. Assessing household solid fuel use: multiple implica-tions for the millennium development goals. Environ Health Perspect 2006;114(3):373–8.
Rocky Mountain Pellet Company, Inc. Online http://www.rockymountainpellets.com,2012. [accessed March 24, 2012].
Smith KR, Peel JL. Mind the gap. Environ Health Perspect 2010;118(12).TheWater Boiling Test: Version 4.2.3. Online http://www.cleancookstoves.org/our-work/
standards-and-testing/learn-about-testing-protocols/protocols/downloads/wbt-protocol.pdf, 2014. [accessed June 23, 2014].
Tian L, Lan Q, Yang D, He X, Yu ITS, Hammond SK. Effect of chimneys on indoor air concen-trations of PM10 andbenzo[a]pyrene inXuanWei, China. AtmosEnviron 2009;43(21).
WendelboP. The PekoPebiomasshousehold energyprogram.Online. http://wendelborecho.wordpress.com/2012/05/10/downloads, 2012. [accessed February 25, 2014].
Wisdom Innovations. Malaika Jiko user manual. Online. http://www.wisdomstoves.org/assets/photos/malaikamanual.pdf, 2013. [accessed February 28, 2014].