Embed Size (px)
Citation preview
8/23/2019 The Effects of Fuel Additives on Diesel Engine Emissions During Steady State and Transient Operation
http://slidepdf.com/reader/full/the-effects-of-fuel-additives-on-diesel-engine-emissions-during-steady-state 1/163
The Effects of Fuel Additives on Diesel Engine Emissions during
Steady State and Transient Operation
John P. Nuszkowski
Dissertation submitted to the
College of Engineering and Mineral Resources
at West Virginia University
in partial fulfillment of the requirements
for the degree of
Doctor of Philosophy
in
Mechanical Engineering
Dr. Gregory J. Thompson, Chair
Dr. Nigel N. Clark Dr. Mridul Gautam
Dr. Scott Wayne
Dr. John Zondlo
Department of Mechanical and Aerospace Engineering
Morgantown, West Virginia
2008
Keywords: Additives, Emissions, Diesel Engines, Heat Release
8/23/2019 The Effects of Fuel Additives on Diesel Engine Emissions During Steady State and Transient Operation
http://slidepdf.com/reader/full/the-effects-of-fuel-additives-on-diesel-engine-emissions-during-steady-state 2/163
All rights reserved
INFORMATION TO ALL USERSThe quality of this reproduction is dependent on the quality of the copy submitted.
In the unlikely event that the author did not send a complete manuscriptand there are missing pages, these will be noted. Also, if material had to be removed,
a note will indicate the deletion.
All rights reserved. This edition of the work is protected againstunauthorized copying under Title 17, United States Code.
ProQuest LLC.789 East Eisenhower Parkway
P.O. Box 1346
Ann Arbor, MI 48106 - 1346
UMI 3472475
Copyright 2011 by ProQuest LLC.
UMI Number: 3472475
8/23/2019 The Effects of Fuel Additives on Diesel Engine Emissions During Steady State and Transient Operation
http://slidepdf.com/reader/full/the-effects-of-fuel-additives-on-diesel-engine-emissions-during-steady-state 3/163
Abstract
Internal combustion engines have propelled society’s transportation and power needs for the last
century. However, with the regulatory demand to reduce air pollution, internal combustion
engines are a major focus to reduce the emissions from these engines. Compression ignition or
diesel engines are a major contributor to NOx and PM pollution. However, the life of these
engines is much longer than that of their spark-ignited counterparts, causing the fleet of diesel
engines to consist of a significant number of old, higher polluting engines. Fuel additives are
one method of reducing emissions and/or enhancing performance in these older diesel engines
without the need for technology upgrades (new engines/aftertreatment). Although diesel fuel
additives’ ability to reduce harmful emissions is well known in the literature, the mechanism as
to how these additives work is not well understood.
To explore the mechanism, three cetane improvers (2-EHN, DTBP, and ODA) were investigated
on a 1992 DDC Series 60 engine and 2004 EGR-equipped Cummins ISM370 engine
incorporating sensors for in-cylinder pressure measurement and analysis. The engines were
tested on the heavy-duty FTP cycle and the steady state SET test. The cetane improvers,
depending on the additive, treat rate, and base fuel (excluding the biodiesel blends), showed
significant reduction in NOx (2.2-4.9%) on the 1992 DDC engine and no change or significantincrease (1.3-1.4%) on the 2004 Cummins engine when exercised over the transient FTP cycle.
In the SET tests, low loads produced a NOx decrease (up to 8%) and high loads a NOx increase
(up to 1.8%) with cetane improvers on the 1992 DDC engine. The 2004 Cummins engine
showed little NOx decrease (up to 1%) or a NOx increase (up to 6.1%) with cetane improvers
compared to the base fuel on the SET test. The biodiesel blends showed a similar trend with the
additized neat fuel with decreased NOx at low load and increased NOx at high load on the 1992
DDC engine, suggesting a cetane effect due to the high cetane number of biodiesel.
The heat release parameters showed that the change in NOx was due to the change in maximum
cylinder pressure, maximum cylinder gas temperature, premix fraction, and pressure at the start
of combustion on the 1992 DDC engine. Overall, the fuel additives reduced the premix fraction
of the heat release on the 1992 DDC engine at all loads and reduced the premix fraction at low
The Effects of Fuel Additives on Diesel Engine Emissions duringSteady State and Transient Operation
John P. Nuszkowski

8/23/2019 The Effects of Fuel Additives on Diesel Engine Emissions During Steady State and Transient Operation
http://slidepdf.com/reader/full/the-effects-of-fuel-additives-on-diesel-engine-emissions-during-steady-state 4/163
load (25-50% load) on the 2004 Cummins engine. The 2004 Cummins engine had higher boost
pressure, compression ratio, and manifold air temperature, which may have created the low
premix fraction. A phenomenological combustion model was developed to provide local NOx
formation characteristics. The combustion model and heat release correlations showed that
reducing the ignition delay with cetane improvers shifted the global heat release rate and
produced the NOx change on the 1992 DDC engine. The reduced ignition delay with cetane
improvers created an earlier start of combustion that shifted the in-cylinder pressure and
temperature, which resulted in the NOx increase at high load and NOx decrease at low load.
8/23/2019 The Effects of Fuel Additives on Diesel Engine Emissions During Steady State and Transient Operation
http://slidepdf.com/reader/full/the-effects-of-fuel-additives-on-diesel-engine-emissions-during-steady-state 5/163
Table of Contents
Abstract.......................................................................................................................................... ii
Table of Contents......................................................................................................................... iv
List of Tables ............................................................................................................................... vii
List of Figures............................................................................................................................... ix
Abbreviations ............................................................................................................................. xiii
List of Symbols........................................................................................................................... xvi
Acknowledgements .................................................................................................................. xviii
1 Introduction........................................................................................................................... 1
2 Background ........................................................................................................................... 5
2.1 Fuel Properties...........................................................................................................................................5
2.1.1 Cetane Number ......................................................................................................................................5
2.1.2 Specific Gravity or API Gravity ............................................................................................................6
2.1.3 Viscosity ................................................................................................................................................6
2.1.4 Energy Content ......................................................................................................................................6
2.1.5 Volatility................................................................................................................................................7
2.1.6 Aromatic Content...................................................................................................................................7
2.1.7 Sulfur .....................................................................................................................................................7
2.1.8 Summary................................................................................................................................................8
2.2 Fuel Additives.............................................................................................................................................8 2.3 Diesel Fuel Types .....................................................................................................................................10
2.3.1 Water Emulsion Diesel Fuel ................................................................................................................10
2.3.2 Biodiesel ..............................................................................................................................................11
2.3.3 Fischer-Tropsch...................................................................................................................................11
2.4 Fuel Certification Programs ....................................................................................................................12
2.5 Pollutant Formation .................................................................................................................................13
2.5.1 NOx .....................................................................................................................................................13
2.5.2 PM .......................................................................................................................................................16
2.5.3 CO........................................................................................................................................................16 2.5.4 CO2 ......................................................................................................................................................17
2.5.5 HC........................................................................................................................................................17
2.6 Combustion Analysis ................................................................................................................................17
2.6.1 In-cylinder Pressure.............................................................................................................................17
2.6.2 Heat Release ........................................................................................................................................18
iv
8/23/2019 The Effects of Fuel Additives on Diesel Engine Emissions During Steady State and Transient Operation
http://slidepdf.com/reader/full/the-effects-of-fuel-additives-on-diesel-engine-emissions-during-steady-state 6/163
2.6.3 Transient Heat Release ........................................................................................................................19
2.7 Numerical Modeling.................................................................................................................................20
3 Experimental Setup ............................................................................................................ 22
3.1 Introduction..............................................................................................................................................22
3.2 Test Engines..............................................................................................................................................22 3.3 Test Fuels .................................................................................................................................................24
3.4 Test Additives............................................................................................................................................25
3.5 Test Cycles................................................................................................................................................26
3.6 WVU Engines Research Center................................................................................................................28
3.7 Test Matrix ...............................................................................................................................................29
3.8 In-cylinder Pressure .................................................................................................................................32
3.8.1 Measured and Calculated Parameters ..................................................................................................34
3.8.1.1 Heat Release Rate.......................................................................................................................34
3.8.1.2 In-cylinder Pressure....................................................................................................................35 3.8.1.3 Needle Lift .................................................................................................................................36
3.8.1.4 Start of Combustion ...................................................................................................................36
3.8.1.5 Ignition Delay.............................................................................................................................36
3.8.1.6 Estimated End of Combustion....................................................................................................36
3.8.1.7 Indicated Mean Effective Pressure.............................................................................................37
3.8.1.8 Mass Fraction Burned ................................................................................................................37
3.8.1.9 In-Cylinder Gas Temperature.....................................................................................................38
3.8.1.10 Premix Fraction..........................................................................................................................38
3.8.1.11 Air Flow Rate.............................................................................................................................39 3.8.1.12 Ratio of Pressure at Exhaust Valve Opening to Intake Valve Closing.......................................39
3.8.1.13 Fuel Conversion Efficiency........................................................................................................40
3.8.1.14 Heat Release Approximation......................................................................................................40
3.9 Experimental Heat Release Accuracy.......................................................................................................41
3.10 Combustion Model....................................................................................................................................46
4 Results and Discussions ...................................................................................................... 51
4.1 Emissions..................................................................................................................................................51
4.1.1 1992 DDC Series 60 Engine................................................................................................................51
4.1.2 2004 Cummins ISM 370 Engine..........................................................................................................55
4.1.3 Biodiesel ..............................................................................................................................................58
4.2 Experimental Heat Release Rate ..............................................................................................................60
4.2.1 1992 DDC Engine Heat Release..........................................................................................................61
4.2.2 2004 Cummins ISM 370 Engine Heat Release....................................................................................65
4.2.3 Comparison of Heat Release Between Engines...................................................................................70
v

8/23/2019 The Effects of Fuel Additives on Diesel Engine Emissions During Steady State and Transient Operation
http://slidepdf.com/reader/full/the-effects-of-fuel-additives-on-diesel-engine-emissions-during-steady-state 7/163
4.2.4 Derived Heat Release Parameters........................................................................................................73
4.2.5 Transient Heat Release ........................................................................................................................81
4.3 Combustion Model Results .......................................................................................................................86
4.3.1 Steady State .........................................................................................................................................92
4.3.2 Transient ..............................................................................................................................................95 4.4 Significance ............................................................................................................................................100
5 Conclusions and Recommendations................................................................................ 102
5.1 Conclusions ............................................................................................................................................102
5.2 Recommendations...................................................................................................................................104
6 References.......................................................................................................................... 106
7 Appendices......................................................................................................................... 114
vi
8/23/2019 The Effects of Fuel Additives on Diesel Engine Emissions During Steady State and Transient Operation
http://slidepdf.com/reader/full/the-effects-of-fuel-additives-on-diesel-engine-emissions-during-steady-state 8/163
List of Tables
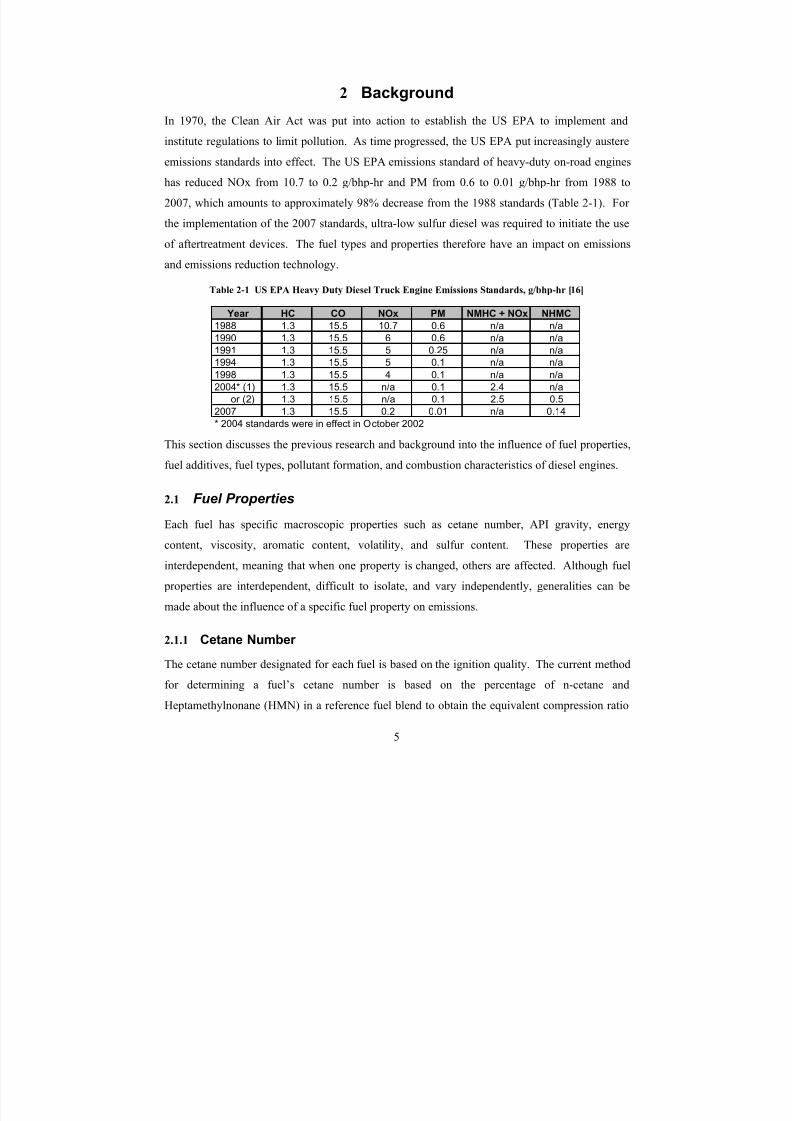
Table 2-1 US EPA Heavy Duty Diesel Truck Engine Emissions Standards, g/bhp-hr [16] ......... 5
Table 2-2 Influence of Fuel Properties on Heavy-Duty Diesel NOx and PM Emissions fromStudies Mentioned Above........................................................................................................ 8
Table 2-3 ASTM-D975-05 Diesel Fuel Specification in the US [44] ......................................... 10
Table 2-4 Reference and Candidate Fuel Specification for CARB [7] ....................................... 13
Table 3-1 Engine Specifications .................................................................................................. 24
Table 3-2 Fuel Additive Properties [71-73].................................................................................. 26
Table 3-3 Test Matrix ................................................................................................................... 30
Table 7-1 Fuel Properties............................................................................................................ 114
Table 7-2 Fuel Properties Continued .......................................................................................... 115
Table 7-3 In-Cylinder Pressure Transducer Specifications ........................................................ 116
Table 7-4 The Average Combustion Parameter Correlation Coefficients for NOx and COfrom 12 SET Tests on the 1992 DDC Engine ..................................................................... 117
Table 7-5 Correlation Coefficients for Change in Combustion Parameters and Change in NOx and CO Emissions for Low Cetane Fuel with 8ml/gal 2-EHN Fuel Compared toLow Cetane Fuel.................................................................................................................. 118
Table 7-6 The Average Combustion Parameter Correlation Coefficients for NOx and CO
from 1 SET Tests on the 2004 Cummins Engine ................................................................ 119Table 7-7 Correlation Coefficients for Change in Combustion Parameters and Change in
NOx and CO Emissions for CP Cert Fuel with 12ml/gal 2-EHN Fuel Compared to CPCert Fuel .............................................................................................................................. 120
Table 7-8 Repeatability of Heat Release Parameters from 11 SET Tests: Parameters(range/average), Ratios (range/average), Time (range in ms), and Crank Angle (range indeg) ...................................................................................................................................... 121
Table 7-9 January 2007 FTP Results for the 1992 Detroit Diesel Series 60 .............................. 123
Table 7-10 June 2007 FTP Results for the 1992 Detroit Diesel Series 60 ................................. 124
Table 7-11 July 2007 FTP Results for the 1992 Detroit Diesel Series 60.................................. 125
Table 7-12 February 2007 FTP Results for the 2004 Cummins ISM 370.................................. 126
Table 7-13 January 2007 SET Results for the 1992 Detroit Diesel Series 60............................ 127
Table 7-14 June 2007 SET Results for the 1992 Detroit Diesel Series 60................................. 131
Table 7-15 July 2007 SET Results for the 1992 Detroit Diesel Series 60.................................. 135
vii

8/23/2019 The Effects of Fuel Additives on Diesel Engine Emissions During Steady State and Transient Operation
http://slidepdf.com/reader/full/the-effects-of-fuel-additives-on-diesel-engine-emissions-during-steady-state 9/163
Table 7-16 February 2007 SET Results for the 2004 Cummins ISM 370.................................. 139
viii
8/23/2019 The Effects of Fuel Additives on Diesel Engine Emissions During Steady State and Transient Operation
http://slidepdf.com/reader/full/the-effects-of-fuel-additives-on-diesel-engine-emissions-during-steady-state 10/163
List of Figures
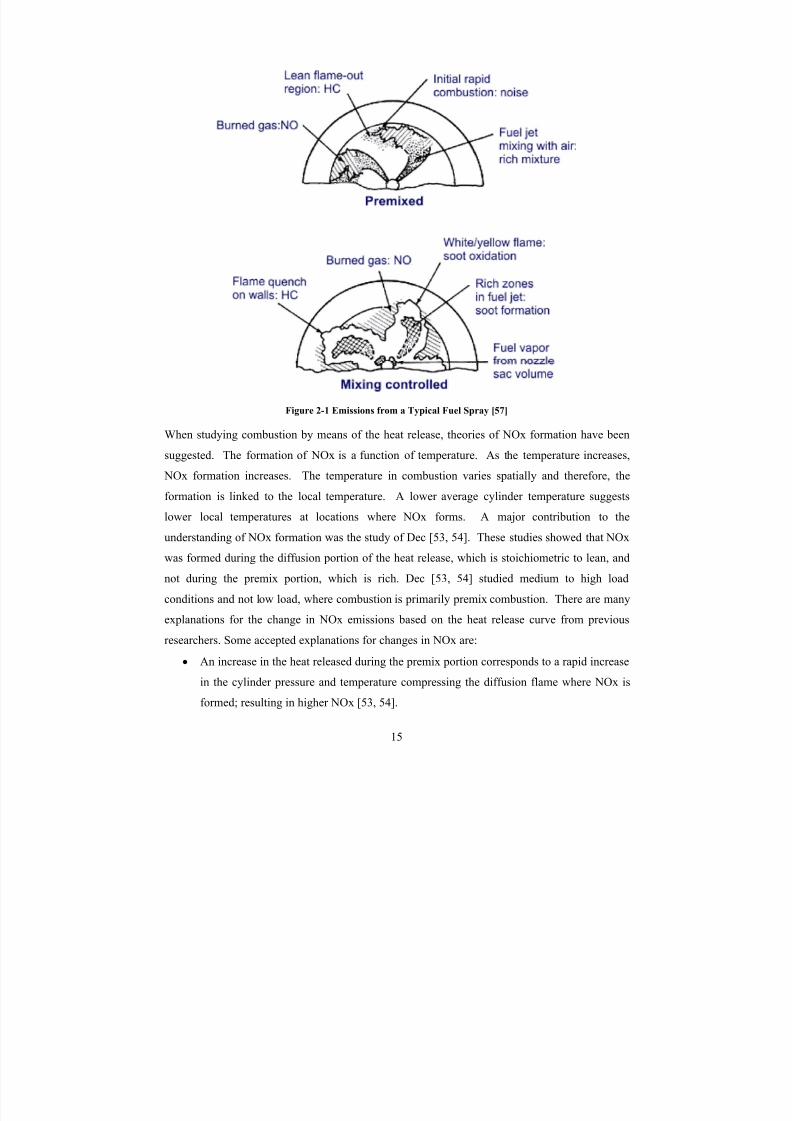
Figure 2-1 Emissions from a Typical Fuel Spray [57] ................................................................. 15
Figure 2-2 Typical Heat Release Rate Curve ............................................................................... 19Figure 3-1 1992 Detroit Diesel Series 60 Engine ......................................................................... 23
Figure 3-2 2004 Cummins ISM 370 ............................................................................................. 23
Figure 3-3 Biodiesel Fuels from Left to Right: Soy, Tallow, and Cottonseed Derived ............... 25
Figure 3-4 Heavy Duty Diesel FTP Test Cycle on the 1992 Series 60 DDC............................... 27
Figure 3-5 Supplemental Emissions Test, Numbers in the Circles Represent the Test Order ..... 28
Figure 3-6 In-Cylinder Pressure Transducers (Not to Scale): Left, 6125B and Right, 6061B[74, 75]................................................................................................................................... 33
Figure 3-7 In-Cylinder Pressure / Heat Release Analysis Software ............................................. 34
Figure 3-8 Influence of Specific Heat Ratio on the Heat Release Curve for Mode 2 (100%Load) on 1992 DDC .............................................................................................................. 42
Figure 3-9 Influence of Specific Heat Ratio on the Heat Release Curve for Mode 2 (100%Load) on 2004 Cummins ISM ............................................................................................... 43
Figure 3-10 Steady State Combustion Derived Fuel Flow Compared to Laboratory FuelFlow for the 1992 DDC Engine............................................................................................. 44
Figure 3-11 Steady State Combustion Derived Intake Air Flow Compared to Laboratory
Intake Air Flow for the 1992 DDC Engine ........................................................................... 44Figure 3-12 Steady State Combustion Derived Fuel Flow Compared to Laboratory Fuel
Flow for the 2004 Cummins Engine...................................................................................... 46
Figure 3-13 The Phenomenological Combustion Model with 10 Fuel Packages......................... 47
Figure 3-14 Energy Equation for Fuel Packages and Unburned Zone ......................................... 49
Figure 4-1 Change in Brake Specific NOx for Grad Ref Fuel Additized with 16ml/gal ODACompared to Neat Fuel for Steady State Modes on the 1992 DDC (No Column indicatesno significant difference). NOx – Primary NOx Analyzer, NOx2 – Secondary NOxAnalyzer, NO – From Secondary NO Analyzer .................................................................... 52
Figure 4-2 Change in the Brake Specific NOx for Low Cetane Fuel with Three Treat Ratesof 2-EHN Compared to Neat Fuel for Steady State Modes on the 1992 DDC (Idle notshown).................................................................................................................................... 54
Figure 4-3 Change in the Brake Specific NOx for Low Cetane Fuel with Three CetaneImprovers Compared to Neat Fuel for Steady State Modes on the 1992 DDC (Idle notshown).................................................................................................................................... 55
ix
8/23/2019 The Effects of Fuel Additives on Diesel Engine Emissions During Steady State and Transient Operation
http://slidepdf.com/reader/full/the-effects-of-fuel-additives-on-diesel-engine-emissions-during-steady-state 11/163
Figure 4-4 Change in the Brake Specific NOx for CP Cert Fuel with Two Cetane Improversand a Repeat Neat Fuel Compared to the Neat Fuel for Steady State Modes on the 2004Cummins ISM 370 (Idle and Mode 2 not shown) ................................................................. 57
Figure 4-5 Change in the Brake Specific NOx for Grad Ref Fuel Additized with 16ml/galODA with Enabled and Disabled EGR Compared to the Neat Fuel with Enabled and
Disabled EGR for Steady State Modes on the 2004 Cummins ISM 370 .............................. 58
Figure 4-6 Change in the Brake Specific NOx for Low Cetane Fuel with B20 Cottonseed,Repeat Low Cetane Fuel, and Additized B20 Cottonseed Blend Compared to the NeatFuel for Steady State Modes on the 1992 DDC Engine........................................................ 59
Figure 4-7 Change in the Brake Specific NOx for CP Cert Fuel with B20 Soy Blend andAdditized B20 Soy Blend Compared to the Neat Fuel for Steady State Modes on the2004 Cummins ISM 370........................................................................................................ 60
Figure 4-8 Heat Release for Mode 8 (100% Load) with Varying Amounts of 2-EHN on the1992 DDC Engine.................................................................................................................. 61
Figure 4-9 Heat Release for Mode 9 (25% Load) with Varying Amounts of 2-EHN on the1992 DDC Engine.................................................................................................................. 62
Figure 4-10 Shifted In-Cylinder Gas Temperature for Mode 8 (100% Load) with VaryingAmounts of 2-EHN on the 1992 DDC Engine ...................................................................... 63
Figure 4-11 Shifted In-Cylinder Gas Temperature for Mode 9 (25% Load) with VaryingAmounts of 2-EHN on the 1992 DDC Engine ...................................................................... 64
Figure 4-12 Heat Release for Mode 8 (100% Load) with Varying Amounts of 2-EHN on the2004 Cummins ISM 370 Engine ........................................................................................... 66
Figure 4-13 Heat Release for Mode 9 (25% Load) with Varying Amounts of 2-EHN on the2004 Cummins ISM 370 Engine ........................................................................................... 66
Figure 4-14 Shifted In-Cylinder Gas Temperature for Mode 9 (25% Load) with VaryingAmounts of 2-EHN on the 2004 Cummins ISM 370 Engine................................................ 67
Figure 4-15 Heat Release for Mode 8 (100% Load) and Mode 9 (25% Load) on the 2004Cummins ISM 370 Engine with and without EGR............................................................... 68
Figure 4-16 Calculated In-cylinder Gas Temperature for Mode 8 (100% Load) on the 2004Cummins ISM 370 Engine with and without EGR............................................................... 69
Figure 4-17 Calculated In-cylinder Gas Temperature for Mode 9 (25% Load) on the 2004
Cummins ISM 370 Engine with and without EGR............................................................... 69Figure 4-18 Comparison of Calculated In-cylinder Gas Temperature for Mode 8 (100%
Load) on the 1992 DDC and 2004 Cummins ISM 370 Engines on CP Cert Fuel ................ 70
Figure 4-19 Comparison of Calculated In-cylinder Gas Temperature for Mode 9 (25% Load)on the 1992 DDC and 2004 Cummins ISM 370 Engines on CP Cert Fuel........................... 71
x
8/23/2019 The Effects of Fuel Additives on Diesel Engine Emissions During Steady State and Transient Operation
http://slidepdf.com/reader/full/the-effects-of-fuel-additives-on-diesel-engine-emissions-during-steady-state 12/163
Figure 4-20 Calculated In-cylinder Pressure Curve without Combustion with MAP=302kPaand MAT=300K on the 1992 DDC, 2004 Cummins ISM 370, and 1991 DDC Engines ..... 72
Figure 4-21 In-cylinder Temperature Curve without Combustion with MAP=302kPa andMAT=300K on the 1992 DDC, 2004 Cummins ISM 370, and 1991 DDC Engines ............ 73
Figure 4-22 Change in NOx with Additized Fuels Compared to a Change in the Peak Pressure for the Steady State Modes on the 1992 DDC (Error Bars show AnApproximate One Standard Deviation Based on Repeat Tests with the Guttman Fuel)....... 76
Figure 4-23 Change in NOx with Additized Fuels Compared to a Change in the Peak GasTemperature for the Steady State Modes on the 1992 DDC (Error Bars show AnApproximate One Standard Deviation Based on Repeat Tests with the Guttman Fuel)....... 77
Figure 4-24 Change in NOx with Additized Fuels Compared to a Change in the PremixFraction for the Steady State Modes on the 1992 DDC (Error Bars show AnApproximate One Standard Deviation Based on Repeat Tests with the Guttman Fuel)....... 78
Figure 4-25 Change in NOx with Additized Fuels Compared to a Change in the Pressure atthe Start of Combustion for the Steady State Modes on the 1992 DDC (Error Bars showAn Approximate One Standard Deviation Based on Repeat Tests with the GuttmanFuel) ....................................................................................................................................... 79
Figure 4-26 Change in CO with Additized Fuels Compared to a Change in NOx for theSteady State Modes on the 1992 DDC (Error Bars show An Approximate One StandardDeviation Based on Repeat Tests with the Guttman Fuel).................................................... 80
Figure 4-27 Percent Change in NOx with Additized Fuels Compared to a Percent Change inthe Premix Fraction for the Steady State Modes on the 2004 Cummins ISM 370................ 81
Figure 4-28 Change in NOx and Gross Indicated Mean Effective Pressure during Transient
Operation for the 1992 DDC (Error Bars show One Standard Deviation from the MeanBased on the Three Hot Start FTPs for Each Fuel) ............................................................... 83
Figure 4-29 Change in NOx from a change in the Premix Fraction during TransientOperation for the 1992 DDC (Error Bars show One Standard Deviation from the MeanBased on the Three Hot Start FTPs for Each Fuel, For Error Bars on NOx, see Figure4-28)....................................................................................................................................... 84
Figure 4-30 Change in NOx from a change in Peak Gas Temperature during TransientOperation for the 1992 DDC (Error Bars show One Standard Deviation from the MeanBased on the Three Hot Start FTPs for Each Fuel, For Error Bars on NOx, see Figure4-28)....................................................................................................................................... 85
Figure 4-31 Change in NOx from change in Peak Cylinder Pressure over Transient andSteady State Operation for the 1992 DDC ............................................................................ 86
Figure 4-32 Global Cylinder Gas Temperature Predicted by Combustion Model andCalculated from In-Cylinder Pressure using the Ideal Gas Law ........................................... 88
Figure 4-33 Cylinder Volume Predicted by Combustion Model and Actual ............................... 89
xi
8/23/2019 The Effects of Fuel Additives on Diesel Engine Emissions During Steady State and Transient Operation
http://slidepdf.com/reader/full/the-effects-of-fuel-additives-on-diesel-engine-emissions-during-steady-state 13/163
Figure 4-34 Influence of Mixing Constant and Local Equivalence Ratio on NOx ...................... 90
Figure 4-35 Model CO2 and Laboratory Based CO2 for Low Cetane Fuel with and withoutAdditive ................................................................................................................................. 91
Figure 4-36 Model NOx and Laboratory Based NOx for Low Cetane Fuel with and without
Additive ................................................................................................................................. 92Figure 4-37 Percent Reduction in Exhaust NOx with Additized Low Cetane Fuel from
Model and Laboratory ........................................................................................................... 93
Figure 4-38 NOx Formation Between Low Cetane Fuel (LC) and Additized Low CetaneFuel (LCA) for Mode 7 (25% Load) .................................................................................... 94
Figure 4-39 NOx Formation Between Low Cetane Fuel (LC) and Additized Low CetaneFuel (LCA) for Mode 4 (75% Load) .................................................................................... 95
Figure 4-40 Mass Emissions of the Experimental CO2 and Combustion Model CO2 for a 45-second Section of the FTP ..................................................................................................... 96
Figure 4-41 Mass Emissions of the Experimental NOx and Combustion Model NOx for a45-second Section of the FTP................................................................................................ 97
Figure 4-42 NO Formation Rates for a 45-second Section of the FTP (Top: Low CetaneFuel, Bottom: Low Cetane Fuel with 8ml/gal 2-EHN) ......................................................... 98
Figure 4-43 Cylinder Fuel Flow Rate (Top), Air Flow Rate (Middle), and Ratio of Cylinder Pressure at EVO to IVO for a 45-second Section of the FTP ............................................... 99
Figure 4-44 NOx Reduction from the FTP cycle with 2-EHN on the 1992 DDC and 2004Cummins.............................................................................................................................. 100
xii
8/23/2019 The Effects of Fuel Additives on Diesel Engine Emissions During Steady State and Transient Operation
http://slidepdf.com/reader/full/the-effects-of-fuel-additives-on-diesel-engine-emissions-during-steady-state 14/163
Abbreviations
2-EHN 2-Ethylhexyl Nitrate
ACT Apparent Combustion Time
ATDC After Top Dead Center
BDC Bottom Dead Center
BSFC Brake-Specific Fuel Consumption
BTDC Bottom Dead Center
CAFEE Center for Alternative Fuels, Engines, and Emissions
CARB California Air Resources Board
CFD Computational Fluid Dynamics
CFR Code of Federal Regulations
CO Carbon Monoxide
CO2 Carbon Dioxide
CP Chevron Phillips
CR Compression Ratio
CVS Constant Volume Sampler
DDC Detroit Diesel Corporation
DMC Dimethyl CarbonateDME Dimethyl Ether
DMM Dimethoxy Methane
DPF Diesel Particulate Filter
DTBP Di-Tertiary Butyl Peroxide
ECU Engine Control Unit
EGR Exhaust Gas Recirculation
EOC End of Combustion
EPA Environmental Protection Agency
ER Equivalence Ratio
EVO Exhaust Valve Opening
FBP Final Boiling Point
FT Fisher-Tropsch
xiii

8/23/2019 The Effects of Fuel Additives on Diesel Engine Emissions During Steady State and Transient Operation
http://slidepdf.com/reader/full/the-effects-of-fuel-additives-on-diesel-engine-emissions-during-steady-state 15/163
FTP Federal Test Procedure
H Hydrogen
H2O Water
HC Hydrocarbon
HFID Heat Flame Ionization Detector
HMN Heptamethylnonane
IMEP Indicated Mean Effective Pressure
IMEPg Gross Indicated Mean Effective Pressure
IVC Intake Valve Closing
LANF Los Angeles Non-Freeway
LAFY Los Angeles Freeway
LC Low CetaneLFE Laminar Flow Element
LHV Lower Heating Value
MAP Manifold Air Pressure
MAT Manifold Air Temperature
MFB Mass Fraction Burned
MTBE Methyl Tertiary Butyl Ether
N2
Diatomic Nitrogen
NDIR Non-Dispersive Infrared
NMHC Non-Methane Hydrocarbons
N2O Nitrous Oxide
NO Nitric Oxide
NO2 Nitrogen Dioxide
NOx Oxides of Nitrogen
NYNF New York Non-Freeway
O Molecular Oxygen
O2 Diatomic Oxygen
ODA Organic Derived Additive
OH Hydroxyl
PAH Polycyclic Aromatic Hydrocarbons
xiv

8/23/2019 The Effects of Fuel Additives on Diesel Engine Emissions During Steady State and Transient Operation
http://slidepdf.com/reader/full/the-effects-of-fuel-additives-on-diesel-engine-emissions-during-steady-state 16/163
PM Particulate Matter
RME Rapeseed Methyl Ether
SET Supplemental Emissions Test
SO2 Sulfur Dioxide
SOC Start of Combustion
TDC Top Dead Center
THC Total Hydrocarbons
TxLED Texas Low Emission Diesel
WVU West Virginia University
VGT Variable Geometry Turbocharger
xv
8/23/2019 The Effects of Fuel Additives on Diesel Engine Emissions During Steady State and Transient Operation
http://slidepdf.com/reader/full/the-effects-of-fuel-additives-on-diesel-engine-emissions-during-steady-state 17/163
List of Symbols
∆Θd Length of Diffusion Combustion in Crank Angle Degrees
∆ΘP Length of Premix Combustion in Crank Angle Degrees
Θ Crank Angle
ΘSOC,d Start of Diffusion Combustion
ΘSOC,P Start of Premix Combustion
μ Average
ρa Density of Charge Mass in Cylinder
a Conversion Efficiency Parameter
A Mixing Factor
C Constant
hair Enthalpy of Unburned Zone
K(z) Constant for Package z
md Diffusion Shape Factor
mfuel Fuel Injected
fuel m& Fuel Flow Rate
m p Premix Shape Factor
Z m& Mass Flow of Air into Package Z
n Polytropic Constant
neff Fuel Conversion Efficiency
nS Engine Speed
nV Volumetric Efficiency
P Pressure
PΘ Pressure at Crank Angle Θ
PIVC Pressure at IVCPSTD Standard Pressure
Q Heat Released
Qd Heat Released during Diffusion
Qfv Energy to Evaporate Fuel
QGross Gross Heat Released
xvi
8/23/2019 The Effects of Fuel Additives on Diesel Engine Emissions During Steady State and Transient Operation
http://slidepdf.com/reader/full/the-effects-of-fuel-additives-on-diesel-engine-emissions-during-steady-state 18/163
IntakeQ& Intake Flow Rate
Q p Heat Released during Premix
Qw,z Wall Heat Transfer for Package z
Qw,ub
Wall Heat Transfer for Unburned Zone
R Gas Canstant
R Est Estimated Range
R S Revolutions Per Combustion Event
R/A Range over Average
T Torque
TΘ Temperature at Crank Angle Θ
tcomb Combustion Time for Package z
Tf/p Friction and Pumping Torque
TIVC Temperature at IVC
tmix Mixing Time for Package z
TSTD Standard Temperature
uo Injection Velocity
Uub Internal Energy of Unburned Zone
UZ Internal Energy of Package z
V VolumeVΘ Volume at Crank Angle Θ
VD Displacement Volume
VIVC Volume at IVC
VS Sweep Volume
Wz Work from Package z
Wub Work from Unburned Zone
X Molar Fraction
Y Mode Variable such as BSFC or NOx
z Fuel Package z
xvii
8/23/2019 The Effects of Fuel Additives on Diesel Engine Emissions During Steady State and Transient Operation
http://slidepdf.com/reader/full/the-effects-of-fuel-additives-on-diesel-engine-emissions-during-steady-state 19/163
Acknowledgements
I would like to express gratitude to several key individuals who influenced my professional
development and contributed to the completion of this dissertation. First, I would like to thank
Dr. Gregory Thompson for taking a chance on hiring me as a graduate research assistant. I
cannot thank you enough for your guidance, support, and faith in me throughout my graduate
education. I also appreciate the expertise and insight provided by my committee members, Dr.
Nigel Clark, Dr. Mridul Gautam, Dr. Scott Wayne, and Dr. John Zondlo. I am grateful for the
help and support provided by Thomas Spencer. I would also like to express appreciation to
Byron Rapp, Bradley Ralston, Ray Tincher, Wesley Hardin, Michael Ursic, and Kevin Flaim for
all those long hours spent in the engine lab. Finally, I would like to thank my family who never
questioned my desire or ability to obtain an advanced degree.
This dissertation is dedicated to my wife for standing by me through my long work hours and
delaying her own graduation so we could continue living together in Morgantown.
xviii
8/23/2019 The Effects of Fuel Additives on Diesel Engine Emissions During Steady State and Transient Operation
http://slidepdf.com/reader/full/the-effects-of-fuel-additives-on-diesel-engine-emissions-during-steady-state 20/163
1 Introduction
Alternative energy sources to hydrocarbon-based fuels have been at the forefront of the United
States and other countries, but hydrocarbon-based combustion continues to be a major source of
energy in the US. An effect of combustion is that some resultant products are hazardous and
regarded as pollution by regulatory agencies. The US air pollution of carbon monoxide (CO),
oxides of nitrogen (NOx), volatile organic compounds (VOC), sulfur dioxide (SO2), particular
matter (PM), and lead have decreased 48, 17, 51, 52, 34, and 98%, respectively, from 1970 to
2002 [1]. Even with these reductions, about 160 million tons of pollution from all sources is
emitted each year in the US alone [1].
The diesel engine is a widely used power plant due to its durability, high thermal efficiency, and
high fuel efficiency compared to other types of internal combustion engines. With no reliable
cost effective alternative method of power production with the same advantages, diesel engines
will continue to be used in the near future. Pollutants are a major issue of diesel engines, with
NOx and airborne PM of primary concern. These pollutants, and others in diesel exhaust, have
been linked to adverse health effects [2, 3]. To reduce air pollution, the U.S. Environmental
Protection Agency (US EPA) and other regulatory agencies worldwide are tightening diesel
emission regulations continuously.
Current emission standards rely on laboratory testing using an engine dynamometer with a
standard test procedure. Results are reported as an integrated value for emissions from a
transient set of engine speed and load conditions over a length of time or a set of prescribed
speed-load points. However, on-road heavy-duty diesel engines operate at different conditions
and the emissions produced are dependent on the speed, load, acceleration, and environment [4].
Therefore, researchers that utilize emission results from engine dynamometer testing to predict
“real-world” emissions of all diesel engines, such as emission inventories are therefore bound by
the limitations of these tests. Diesel engine manufacturers have also used devices that defeat
emission regulations by producing higher NOx and lower fuel consumption during real world
operation, but lower emissions when the engine is being certified on a dynamometer. As a result
of these defeat devices, the US Federal Government, in 1998, required six engine manufacturers
1
8/23/2019 The Effects of Fuel Additives on Diesel Engine Emissions During Steady State and Transient Operation
http://slidepdf.com/reader/full/the-effects-of-fuel-additives-on-diesel-engine-emissions-during-steady-state 21/163
to fund emissions reduction research with a portion of the funding going to in-use emissions
testing [5].
The fleet of diesel engines typically consists of legacy, higher polluting engines. Due to the high
reliability of diesel engines, it is common for on-road heavy-duty diesel engines to last 1,000,000
miles [6]. Assuming a modest truck operation of 100,000 miles a year, a diesel engine may be
operational for ten years. Compared to a 2008 model year on-road heavy-duty diesel engine, a
1998 model year on-road heavy-duty diesel engine emits 20 and 10 times the amount of NOx
and PM pollution, respectively.
Reduction of the emissions produced by diesel engines may be achieved by different methods.
Replacing the current older technology diesel engine fleet with newer engines incorporatingemission reduction hardware is one high cost method. However, the impact of newer technology
will be overestimated if new engines from model years 1990-2000 (with defeat devices) are
used, considering the emissions inventory models utilize emissions from certification testing.
Utilization of aftertreatment devices can reduce emissions from older technology engines;
however, the engines were not designed to operate with aftertreatment devices and the cost of
these devices would be the responsibility of the consumer.
Diesel fuel properties have been shown to effect emissions and by altering these properties,
emissions reduction can be achieved. Fuel properties can be changed by costly refinery
modification or with the addition of fuel additives (higher consumer cost). Most fuel additives
are developed and tested on a limited number of engines, so the overall effect of emissions on the
fleet of diesel engines is unknown. Consumer based reduction strategies, which require
acceptance of drivers and truck company owners to optimize engine use (such as minimizing idle
times and maximizing the use of cruise control) are being considered. Inspection and
maintenance programs periodically test engines and detect high polluters in need of repair.
However, this requires consumer acceptance because of the increased inspection and repair cost.
Each method of emissions reduction provides an additional element to the current system of
diesel engine operation, thus incurring an additional cost. This highlights the need for
economical incremental emissions reduction strategies.
2
8/23/2019 The Effects of Fuel Additives on Diesel Engine Emissions During Steady State and Transient Operation
http://slidepdf.com/reader/full/the-effects-of-fuel-additives-on-diesel-engine-emissions-during-steady-state 22/163
State programs such as TxLED and CARB look to reduce the state inventory emissions beyond
the US EPA’s requirements by reducing the sulfur content, reducing the aromatic content, and
increasing the cetane number of the diesel fuel [7]. TxLED and the CARB certified alternative
diesel fuel provide a means for showing emission equivalency to the certification diesel fuel with
10% aromatics and a minimum cetane number of 48. By using a fuel additive, fuel suppliers
have an unobtrusive method of meeting the required standards set by environmental agencies and
without the costly modification to refineries.
Cetane improvers, combustion improvers, and oxygenates are three types of fuel additives which
have been reported to result in emission changes. Mixed engine performance and emission
results have been reported with each additive type. In particular, cetane improver additives have been shown to reduce NOx [8, 9], show no NOx benefit [10], and increase NOx [11] by different
researchers. Cetane improvers reduce the time from the start of fuel injection to the start of
combustion, known as the ignition delay. Researchers have shown strong correlations between
the reduction in ignition delay and NOx created by cetane improvers [12-15]. However, there
exists limited understanding on why NOx shows no benefit or a NOx increase for some engines,
fuels, and additives.
In combustion studies, an important parameter is the premix combustion fraction. The premixed
fraction is the fraction of the heat released from the fuel injected before the start of combustion
to the total heat released. The premix portion is thought to be important to NOx formation [10].
An increase in the cetane number (for example, by adding a cetane improver) of a fuel causes a
shorter ignition delay, which has the effect of less fuel being injected before the start of
combustion and decreases the premix fraction [12-15].
The objective of this project was to investigate the combustion characteristics of fuel additives as
an emission reduction strategy. Specifically, 2-Ethylhexyl Nitrate (2-EHN), Di-Tertiary Butyl
Peroxide (DTBP), and a propriety additive were investigated at several concentration levels.
Two engines (1992 DDC Series 60 and 2004 Cummins ISM 370) were instrumented with an in-
cylinder pressure transducer during steady state and transient testing. The emissions of CO2, CO,
3

8/23/2019 The Effects of Fuel Additives on Diesel Engine Emissions During Steady State and Transient Operation
http://slidepdf.com/reader/full/the-effects-of-fuel-additives-on-diesel-engine-emissions-during-steady-state 23/163
NOx, THC, and TPM were collected. A statistical analysis using a T-test was performed to
determine when emission changes due to the additives were statistically significant. From the
measured in-cylinder pressure data, the heat release curve and heat release parameters were
calculated or measured to investigate the combustion characteristics. The heat release
parameters such as maximum in-cylinder pressure, maximum in-cylinder temperature, and
premix fraction were investigated for emission changes due to the addition of fuel additives.
Correlation coefficients were used to determine the strength of the relationship between heat
release parameters and emission changes. A phenomenological combustion model was
subsequently developed to explore how the shift in the heat release curve (caused by the cetane
improvers) affected NOx emissions.
4
8/23/2019 The Effects of Fuel Additives on Diesel Engine Emissions During Steady State and Transient Operation
http://slidepdf.com/reader/full/the-effects-of-fuel-additives-on-diesel-engine-emissions-during-steady-state 24/163
2 Background
In 1970, the Clean Air Act was put into action to establish the US EPA to implement and
institute regulations to limit pollution. As time progressed, the US EPA put increasingly austere
emissions standards into effect. The US EPA emissions standard of heavy-duty on-road engines
has reduced NOx from 10.7 to 0.2 g/bhp-hr and PM from 0.6 to 0.01 g/bhp-hr from 1988 to
2007, which amounts to approximately 98% decrease from the 1988 standards (Table 2-1). For
the implementation of the 2007 standards, ultra-low sulfur diesel was required to initiate the use
of aftertreatment devices. The fuel types and properties therefore have an impact on emissions
and emissions reduction technology.
Table 2-1 US EPA Heavy Duty Diesel Truck Engine Emissions Standards, g/bhp-hr [16]
Year HC CO NOx PM NMHC + NOx NHMC
1988 1.3 15.5 10.7 0.6 n/a n/a
1990 1.3 15.5 6 0.6 n/a n/a
1991 1.3 15.5 5 0.25 n/a n/a
1994 1.3 15.5 5 0.1 n/a n/a
1998 1.3 15.5 4 0.1 n/a n/a
2004* (1) 1.3 15.5 n/a 0.1 2.4 n/a
or (2) 1.3 15.5 n/a 0.1 2.5 0.5
2007 1.3 15.5 0.2 0.01 n/a 0.14
* 2004 standards were in effect in October 2002
This section discusses the previous research and background into the influence of fuel properties,
fuel additives, fuel types, pollutant formation, and combustion characteristics of diesel engines.
2.1 Fuel Properties
Each fuel has specific macroscopic properties such as cetane number, API gravity, energy
content, viscosity, aromatic content, volatility, and sulfur content. These properties are
interdependent, meaning that when one property is changed, others are affected. Although fuel
properties are interdependent, difficult to isolate, and vary independently, generalities can be
made about the influence of a specific fuel property on emissions.
2.1.1 Cetane Number
The cetane number designated for each fuel is based on the ignition quality. The current method
for determining a fuel’s cetane number is based on the percentage of n-cetane and
Heptamethylnonane (HMN) in a reference fuel blend to obtain the equivalent compression ratio
5
8/23/2019 The Effects of Fuel Additives on Diesel Engine Emissions During Steady State and Transient Operation
http://slidepdf.com/reader/full/the-effects-of-fuel-additives-on-diesel-engine-emissions-during-steady-state 25/163
of the tested fuel in a cetane engine [17]. An increase in cetane number causes a shorter ignition
delay, which has the effect of less fuel being injected during the premix burn and more during
the diffusion burn portion (this will be discussed in Section 2.6), thus reducing cylinder pressure
rise, which may result in lower cylinder temperatures. At the same time, a higher cetane fuel
advances ignition timing because of the shorter ignition delay, which increases combustion
pressures and temperatures. The emission effects of cetane number are engine dependent.
Cetane number has a greater effect on emissions in older engine technology, since newer
technology optimizes combustion for diffusion burning [10].
2.1.2 Specific Gravity or API Gravity
Specific gravity is the ratio of fuel density to the density of water, when both are at the same
temperature and pressure. The specific gravity of petroleum products is usually given as the APIgravity, which is an arbitrary scale that is inversely related to the specific gravity. The density of
the fuel affects the combustion in a diesel engine physically. For example, a lower density fuel
requires longer injection duration for the same fuel mass to be injected. Although density is a
physical effect, research has found that a higher density fuel increases PM [18, 19, 20] and NOx
[19, 21].
2.1.3 Viscosity
The viscosity is a property defining the resistance of the fuel to shearing (flow) and is based on
the molecular structure and temperature. At higher temperatures, the viscosity of a diesel fuel is
lower than the viscosity of the same fuel at a lower temperature. If the viscosity is too low,
leaking can occur through the seals in the fuel injection system. The viscosity affects the fuel
injection system, since an accurate amount of fuel is needed for injection. Likewise, spray
pattern is also influenced by the viscosity [22]. With a high viscosity fuel, potentially less fuel
could be injected. Density and viscosity are generally interrelated and studies generally use
density as the modeled parameter.
2.1.4 Energy Content
The energy content of fuel is the amount of energy per unit of mass or volume given when
combusted. While a high-density fuel will have greater energy content per unit volume than a
low-density fuel, the low-density fuel has greater energy content per unit mass than a high-
6
8/23/2019 The Effects of Fuel Additives on Diesel Engine Emissions During Steady State and Transient Operation
http://slidepdf.com/reader/full/the-effects-of-fuel-additives-on-diesel-engine-emissions-during-steady-state 26/163
density fuel. Fuels of different energy contents will give different power outputs on the same
engine unless the fuel injection is individually optimized for each fuel.
2.1.5 Volatility
The volatility, usually given as T50, T90, or T95 is the temperature at which 50%, 90%, or 95%,
respectively, of a fuel sample, by volume, is evaporated and then condensed in a separate
container. A high T95 temperature (low volatility), can signify that the fuel is difficult to burn.
Some studies have shown an increase in PM emissions with increasing T90 or Final Boil Point
(FBP) [23, 24], while other studies have shown the distillation has no influence on PM emissions
[20, 25] and the influence should be attributed to the density. Some studies show an influence of
the fuel volatility for other emissions such as NOx [21, 25, 26] and HC [21, 25].
2.1.6 Aromatic Content
An aromatic hydrocarbon is a hydrocarbon with a conjugated double bond carbon ring with
benzene being the most common. One ring is a monocyclic aromatic and more than one ring is a
PAH compound. The double bonds may make an aromatic hydrocarbon more difficult to break,
thus requiring greater temperature to initiate combustion. Some studies have shown that
aromatics have no effect on PM [27], while others showed that decreasing aromatics decreases
PM [28, 29, 30] and NOx [29, 30] emissions. Kidoguchi et al. [30] suggested that a higher flame
temperature is required for a higher aromatic content fuel and high flame temperatures lead to
greater NOx formation.
2.1.7 Sulfur
The use of a low-sulfur diesel fuel has been shown to reduce PM emissions in diesel engines by
reducing the sulfates formed, which are a component of the PM emissions. The sulfates
produced by the sulfur in the fuel are measured as PM in the exhaust and can have a negative
effect on aftertreatment devices and engine components. Most fuel sulfur forms oxides of sulfur (SOx). Typically, only 1-3% of the sulfur in the fuel is converted to sulfates in the PM
measurement [31] and this may be greater with an aftertreatment device. For the 2007 and later
heavy-duty on-road engines, emissions standards of 0.01 g/bhp-hr PM, and 0.2 g/bhp-hr NOx,
and a less than 15ppm sulfur content in fuel have been implemented to enable catalytic DPFs,
7
8/23/2019 The Effects of Fuel Additives on Diesel Engine Emissions During Steady State and Transient Operation
http://slidepdf.com/reader/full/the-effects-of-fuel-additives-on-diesel-engine-emissions-during-steady-state 27/163
NOx adsorbers, and limit sulfate PM. At this low sulfur level, sulfur is not seen as a significant
portion of the PM formation.
2.1.8 Summary
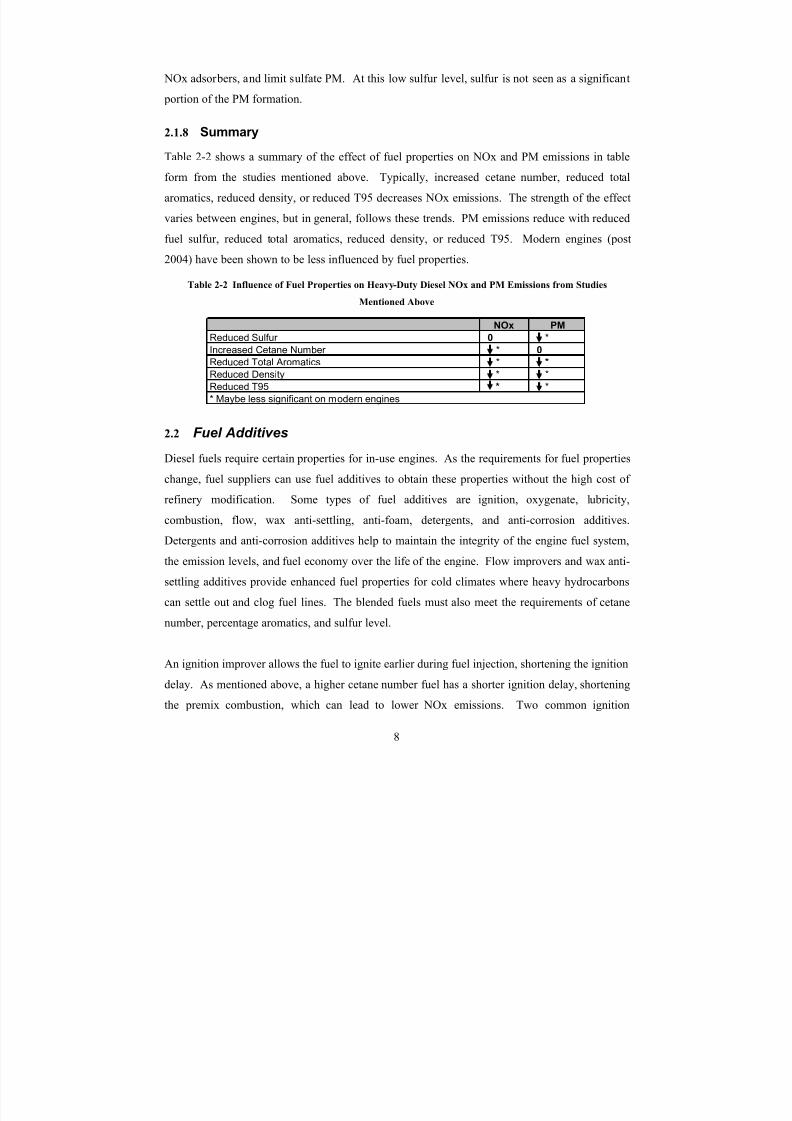
Table 2-2 shows a summary of the effect of fuel properties on NOx and PM emissions in table
form from the studies mentioned above. Typically, increased cetane number, reduced total
aromatics, reduced density, or reduced T95 decreases NOx emissions. The strength of the effect
varies between engines, but in general, follows these trends. PM emissions reduce with reduced
fuel sulfur, reduced total aromatics, reduced density, or reduced T95. Modern engines (post
2004) have been shown to be less influenced by fuel properties.
Table 2-2 Influence of Fuel Properties on Heavy-Duty Diesel NOx and PM Emissions from Studies
Mentioned Above
NOx PM
Reduced Sulfur 0 *
Increased Cetane Number * 0
Reduced Total Aromatics * *
Reduced Density * *
Reduced T95 * *
* Maybe less significant on modern engines
2.2 Fuel Additives
Diesel fuels require certain properties for in-use engines. As the requirements for fuel properties
change, fuel suppliers can use fuel additives to obtain these properties without the high cost of
refinery modification. Some types of fuel additives are ignition, oxygenate, lubricity,
combustion, flow, wax anti-settling, anti-foam, detergents, and anti-corrosion additives.
Detergents and anti-corrosion additives help to maintain the integrity of the engine fuel system,
the emission levels, and fuel economy over the life of the engine. Flow improvers and wax anti-
settling additives provide enhanced fuel properties for cold climates where heavy hydrocarbons
can settle out and clog fuel lines. The blended fuels must also meet the requirements of cetanenumber, percentage aromatics, and sulfur level.
An ignition improver allows the fuel to ignite earlier during fuel injection, shortening the ignition
delay. As mentioned above, a higher cetane number fuel has a shorter ignition delay, shortening
the premix combustion, which can lead to lower NOx emissions. Two common ignition
8
8/23/2019 The Effects of Fuel Additives on Diesel Engine Emissions During Steady State and Transient Operation
http://slidepdf.com/reader/full/the-effects-of-fuel-additives-on-diesel-engine-emissions-during-steady-state 28/163
improver additives are a nitrate-based 2-EHN and peroxide-based additive DTBP. Higgins and
colleagues [32] used a constant volume combustion system to show that the primary effect of 2-
EHN on diesel combustion is an accelerated pre-ignition radical pool with greater effect at low
temperatures and low cylinder air densities. Previous diesel emission studies have shown mixed
results of NOx reduction using 2-EHN or DTBP with some having up to 8% reduction in NOx
[8, 9] while others showing no benefit [10] or an increase in NOx [11]. McCormick et al. [33]
effectively blended biodiesel with DTBP and 2-EHN to reduce NOx and maintain the PM
emissions reduction from the use of biodiesel. Modern engines have shown lower reductions in
NOx from cetane improvers. Fuel injection in modern engines is optimized for shorter premixed
combustion, and this can be attributed to the lower influence of shortening the ignition delay
[10].
Oxygenate additives raise the air-to-fuel ratio, thus resulting in increased oxygen at locations of
fuel burning and providing a greater opportunity for soot oxidation. Some oxygenate additives
are Methyl Tertiary Butyl Ether (MTBE), Butylal (an acetal compound, C9H20O2), Dimethyl
Carbonate (DMC), Dimethoxy Methane (DMM), and bio-diesel. Previous studies [34, 35, 36]
have shown a greater than 4% reduction of PM for each 1% wt oxygen addition to the fuel. With
an increase in oxygen content using a biodiesel compound (RME) or glycol ethers, Zannis et al.
[37] reported a decrease in soot, CO, and HC emissions with an increase in NOx emissions and
Brake Specific Fuel Consumption (BSFC) on a single cylinder engine operating at 2000 rpm and
three different loads. Using a blend of DMC with diesel at an oxygen content of 15%, Lu and
colleagues [38] found that smoke decreased by 75% and NOx emissions decreased by 15-20%.
The oxygenate chemical structure seems to effect the soot reduction with glycol ethers (linear
structure) showing greater reduction of soot than with dioxolane (ring structure) [39].
Lubricity additives are used to enhance the lubricating qualities of fuels. Low lubricity fuels can
damage the fuel injection system by high wear on the components. Fuel with low aromatics and
low sulfur content such as Fischer Tropsch as well as oxygenated fuels tend to have low lubricity
[33, 40]. Esters have been shown to be good lubricity additives [41].
9
8/23/2019 The Effects of Fuel Additives on Diesel Engine Emissions During Steady State and Transient Operation
http://slidepdf.com/reader/full/the-effects-of-fuel-additives-on-diesel-engine-emissions-during-steady-state 29/163
Metal-based additives, called combustion improvers, have shown an up to 9% reduction of
BSFC [42] and up to a 25% reduction of PM [43]. An ultra low dosage (4-8ppm) of a
platinum/cerium additive was used by Valentine et al. [43]. The bimetallic additive lowered PM
by up to 25% alone, up to 50% with an oxidation catalyst, and up to 95% with an oxidation
catalyst and DPF.
2.3 Diesel Fuel Types
The diesel fuel type affects the fuel properties such as cetane number, percent aromatics,
viscosity, and these then effect the combustion process and emissions as stated in Section 2.1.
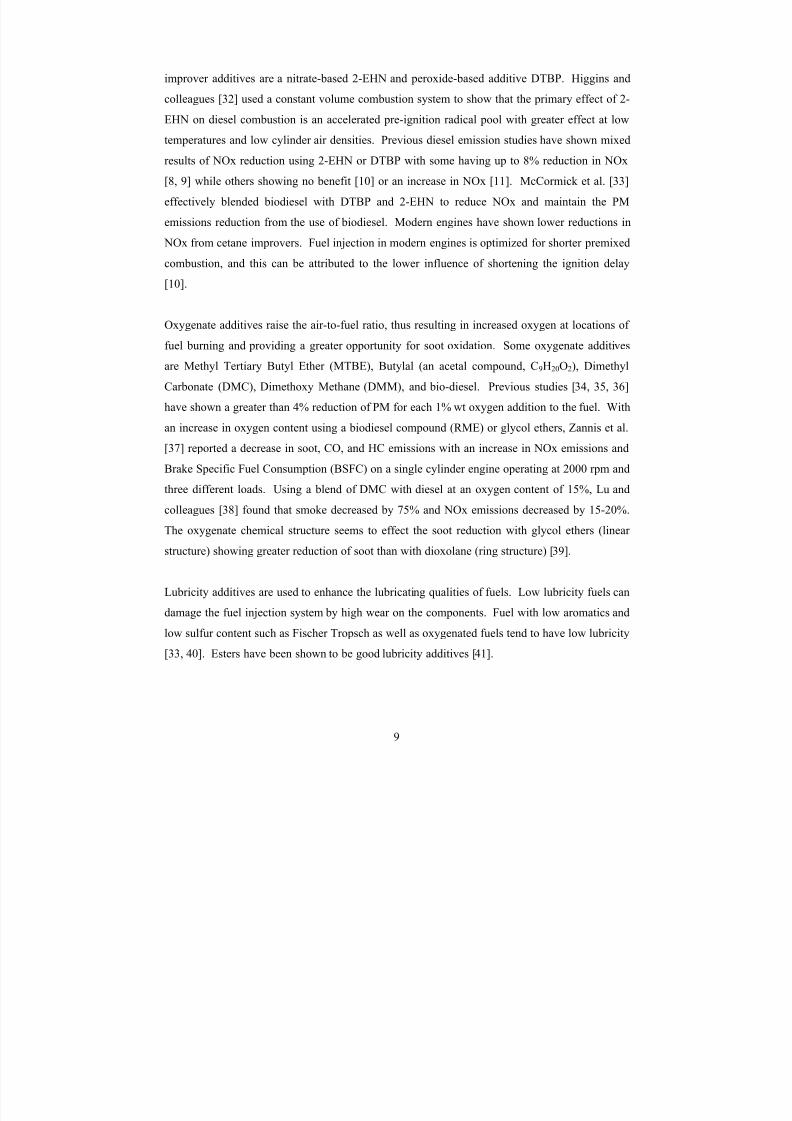
While fuel types and refineries each have different chemical composition and properties, the
requirements for grade 1-D and 2-D specific diesel fuels in the US as specified by the ASTM-
D975-05 are listed in Table 2-3. A minimum of 40 cetane number and either a minimum 40cetane index or a maximum 35% (by volume) aromatics is required to be considered a grade 1-D
or 2-D diesel. Some properties, such as lubricity, are for the consideration of engine components
and wear.
Table 2-3 ASTM-D975-05 Diesel Fuel Specification in the US [44]
Fuel Property Test Method Unit Grade 1-D Grade 2-D
Cetane Number D613 40 (min) 40 (min)
Either (1) Cetane Index D976 / D4737 40 (min) 40 (min)Or (2) Aromatics D5186 % (vol.) 35 (max) 35 (max)
Cloud Point D2500 °C location based location based
Distillation 90% (vol.) D86 °C 288 (max) 282-338
Total Sulfur D2622 % (wt.) 0.05 (max)* 0.05 (max)*
Flashpoint D93 °C 38 (min) 52 (min)
Kinematic Viscosity @ 40°C D445 mm2/s 1.3-2.4 1.9-4.1
Water & Sediment D2709 % (vol.) 0.05 (max) 0.05 (max)
Ramsbottom Carbon on 10% Residue D4530 % (wt.) 0.15 (max) 0.35 (max)
Ash D482 % (wt.) 0.01 (max) 0.01 (max)
Copper Strip Corrosion D130 No. 3 (max) No. 3 (max)
Lubricity, HFRR @60°C D6079 microns 520 max 520 max
* Effective mid 2006 15 ppm (wt.) sulfur limit (max) for highway diesel fuel
2.3.1 Water Emulsion Diesel Fuel
One type of fuel emissions reduction technology is water emulsion fuels [45]. These consist of
water mixed with diesel fuel. Water particles are suspended in the diesel fuel using an
emulsifier, which poses problems since water and diesel have different densities and physical
10
8/23/2019 The Effects of Fuel Additives on Diesel Engine Emissions During Steady State and Transient Operation
http://slidepdf.com/reader/full/the-effects-of-fuel-additives-on-diesel-engine-emissions-during-steady-state 30/163
properties and are usually not miscible. The emulsified fuel has a length of time before the
mixture separates. During combustion, the water in the diesel creates lower temperatures in the
cylinder of the engine, which decreases NOx. The lower NOx is achieved even with the
improved mixing obtained, which result in higher peak pressures and peak heat release rates than
the base diesel fuel. This specific type of fuel has been shown in previous testing to decrease
NOx by up to 20% and have conflicting results on PM. The emulsified fuel requires longer fuel
injection duration than typical diesel fuel for the same amount of fuel energy due to the addition
of water to the fuel.
2.3.2 Biodiesel
Some research has focused on biodiesel, which is derived from vegetable oil or animal fat.
Biodiesel, since it is a renewable energy source, benefits in the reduction of life cycle emissions.Some main advantages of biodiesel are the higher cetane rating, no aromatics, and low or no
sulfur content [46]. Although suffering from having lower energy content and higher NOx
emissions (up to 13%) compared to D2 fuel, the emissions of HC, CO, and PM have been shown
to decrease 13.6-63.2%, 10.1-42.7%, 8.3-55%, respectively [46, 47], depending on blending
ratio, fuel type, and test cycle. Szybist et al. [48] showed that the higher bulk modulus
(compressibility) of biodiesel increased the start of injection (0.1-0.3 crank angle degrees)
resulting in a phase shift of the maximum cylinder temperature and maximum heat release. The
most influential trends of NOx production were the location of maximum temperature and heat
release as opposed to the values of the maximum temperature and heat release. Recent studies
have offset the increase in NOx emissions of biodiesel by the addition of a cetane improver [33,
48] or the lowering the iodine number (degree of unsaturation) [48]. The use of waste cooking
oil is also a potential biodiesel fuel with a high viscosity that requires heating to prevent fuel
filter clogging. Bari and colleagues [49] showed that by reducing the head loss through the fuel
filter by raising the fuel tank level, the 10% power loss with use of waste cooking oil was
reduced to 5%.
2.3.3 Fischer-Tropsch
Fischer-Tropsch, a synthetic diesel, is produced from any carbon containing raw material by
means of the Fisher-Tropsch process. The most popular feedstock materials for creating FT fuel
are natural gas or coal. The main advantages of FT fuel are high cetane number, low aromatic
11
8/23/2019 The Effects of Fuel Additives on Diesel Engine Emissions During Steady State and Transient Operation
http://slidepdf.com/reader/full/the-effects-of-fuel-additives-on-diesel-engine-emissions-during-steady-state 31/163
content, low sulfur content, and the ability to blend with other diesels. While FT does suffer
from having low lubricity and cold flow properties, additives can be used to alleviate these
issues. A study done by Atkinson et al. [50] on a Navistar T444E engine showed average
reductions of 12%, 21%, 4.9%, 20%, 31%, for HC, CO, CO2, NOx, and PM, respectively, with
FT fuel compared to D2 fuel. The reductions were explained by the lower peak cylinder
pressure, burn rate, and exhaust temperatures. A study on an unmodified single cylinder by
Youngcheng et al. [51] showed reductions on average of 17% for NOx and 40% for smoke
emissions using FT fuel compared to conventional diesel fuel.
2.4 Fuel Certification Programs
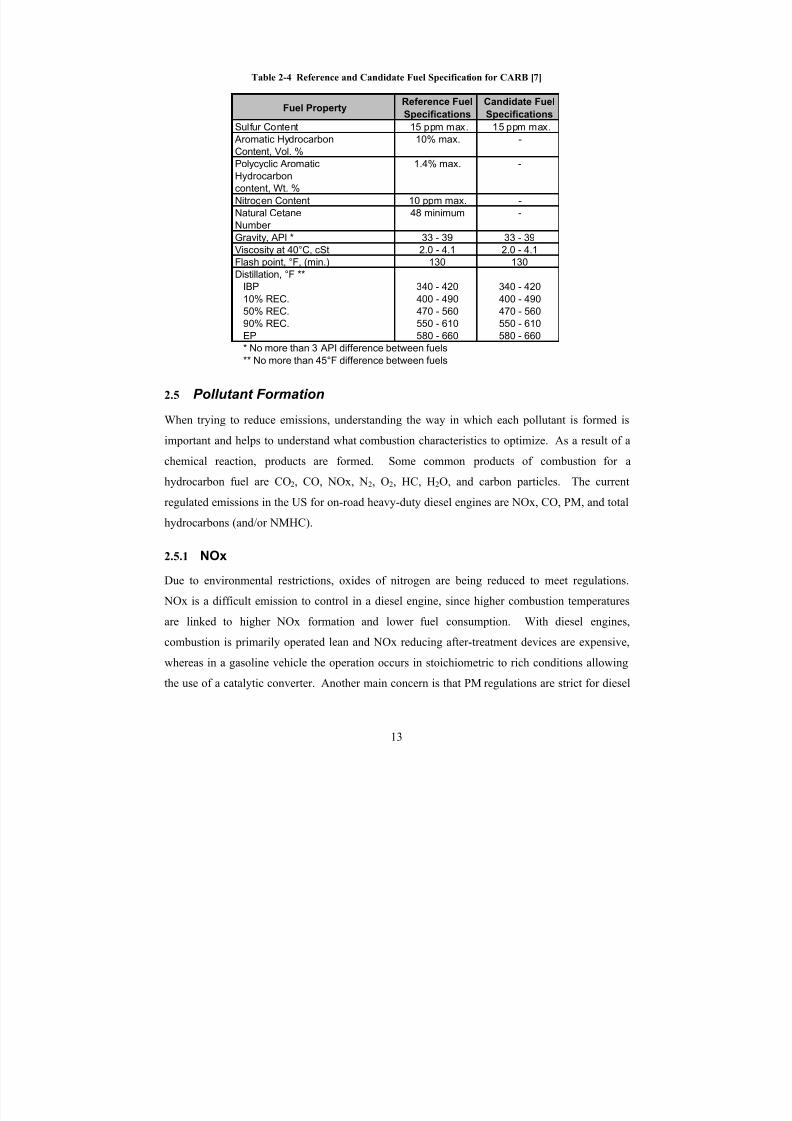
Current programs such as the TxLED and the CARB certified alternative diesel fuel provide
means for showing emission equivalency to a certification diesel fuel with 10% aromatics and aminimum cetane number of 48 [7]. The testing is done on a Detroit Diesel Series 60 engine,
which is representative of the post 1990-model year engines and tested in accordance with the
guidelines given by CARB or Texas. The candidate fuel is tested against the reference fuel and
the specifications for each of these fuels are shown in Table 2-4. Any fuel that meets the
requirements as a certified CARB diesel meets the requirements for the TxLED program.
12
8/23/2019 The Effects of Fuel Additives on Diesel Engine Emissions During Steady State and Transient Operation
http://slidepdf.com/reader/full/the-effects-of-fuel-additives-on-diesel-engine-emissions-during-steady-state 32/163
Table 2-4 Reference and Candidate Fuel Specification for CARB [7]
Fuel PropertyReference Fuel
Specifications
Candidate Fuel
Specifications
Sulfur Content 15 ppm max. 15 ppm max.
Aromatic Hydrocarbon 10% max. -
Content, Vol. %Polycyclic Aromatic 1.4% max. -
Hydrocarbon
content, Wt. %
Nitrogen Content 10 ppm max. -
Natural Cetane 48 minimum -
Number
Gravity, API * 33 - 39 33 - 39
Viscosity at 40°C, cSt 2.0 - 4.1 2.0 - 4.1
Flash point, °F, (min.) 130 130
Distillation, °F **
IBP 340 - 420 340 - 420
10% REC. 400 - 490 400 - 49050% REC. 470 - 560 470 - 560
90% REC. 550 - 610 550 - 610
EP 580 - 660 580 - 660
* No more than 3 API difference between fuels
** No more than 45°F difference between fuels
2.5 Pollutant Formation
When trying to reduce emissions, understanding the way in which each pollutant is formed is
important and helps to understand what combustion characteristics to optimize. As a result of a
chemical reaction, products are formed. Some common products of combustion for a
hydrocarbon fuel are CO2, CO, NOx, N2, O2, HC, H2O, and carbon particles. The current
regulated emissions in the US for on-road heavy-duty diesel engines are NOx, CO, PM, and total
hydrocarbons (and/or NMHC).
2.5.1 NOx
Due to environmental restrictions, oxides of nitrogen are being reduced to meet regulations.
NOx is a difficult emission to control in a diesel engine, since higher combustion temperaturesare linked to higher NOx formation and lower fuel consumption. With diesel engines,
combustion is primarily operated lean and NOx reducing after-treatment devices are expensive,
whereas in a gasoline vehicle the operation occurs in stoichiometric to rich conditions allowing
the use of a catalytic converter. Another main concern is that PM regulations are strict for diesel
13
8/23/2019 The Effects of Fuel Additives on Diesel Engine Emissions During Steady State and Transient Operation
http://slidepdf.com/reader/full/the-effects-of-fuel-additives-on-diesel-engine-emissions-during-steady-state 33/163
engines and usually a reduction in NOx coincides with an increase in PM, which is called the
NOx-PM trade-off.
Understanding how NOx forms in the combustion process provides the basis for NOx control
and reduction. NOx consists primarily of nitric oxide (NO), which represents greater than 70-
90% of the total NOx. At temperatures 1200K and below, nitrogen dioxide (NO2) forms from
the NO in the exhaust and constitutes the rest of the total NOx emitted from a diesel engine.
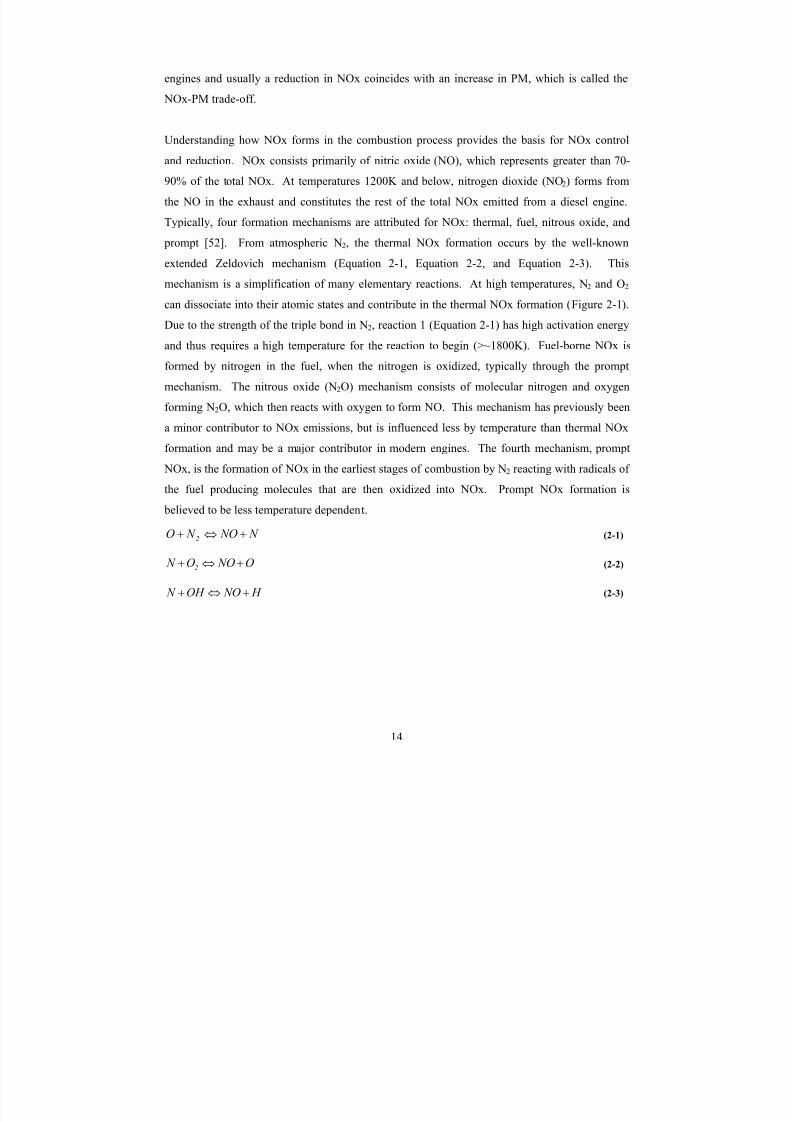
Typically, four formation mechanisms are attributed for NOx: thermal, fuel, nitrous oxide, and
prompt [52]. From atmospheric N2, the thermal NOx formation occurs by the well-known
extended Zeldovich mechanism (Equation 2-1, Equation 2-2, and Equation 2-3). This
mechanism is a simplification of many elementary reactions. At high temperatures, N2 and O2
can dissociate into their atomic states and contribute in the thermal NOx formation (Figure 2-1).Due to the strength of the triple bond in N2, reaction 1 (Equation 2-1) has high activation energy
and thus requires a high temperature for the reaction to begin (>~1800K). Fuel-borne NOx is
formed by nitrogen in the fuel, when the nitrogen is oxidized, typically through the prompt
mechanism. The nitrous oxide (N2O) mechanism consists of molecular nitrogen and oxygen
forming N2O, which then reacts with oxygen to form NO. This mechanism has previously been
a minor contributor to NOx emissions, but is influenced less by temperature than thermal NOx
formation and may be a major contributor in modern engines. The fourth mechanism, prompt
NOx, is the formation of NOx in the earliest stages of combustion by N2 reacting with radicals of
the fuel producing molecules that are then oxidized into NOx. Prompt NOx formation is
believed to be less temperature dependent.
N NO N O 2 +⇔+ (2-1)
O NOO N 2 +⇔+ (2-2)
H NOOH N +⇔+ (2-3)
14
8/23/2019 The Effects of Fuel Additives on Diesel Engine Emissions During Steady State and Transient Operation
http://slidepdf.com/reader/full/the-effects-of-fuel-additives-on-diesel-engine-emissions-during-steady-state 34/163
Figure 2-1 Emissions from a Typical Fuel Spray [57]
When studying combustion by means of the heat release, theories of NOx formation have been
suggested. The formation of NOx is a function of temperature. As the temperature increases, NOx formation increases. The temperature in combustion varies spatially and therefore, the
formation is linked to the local temperature. A lower average cylinder temperature suggests
lower local temperatures at locations where NOx forms. A major contribution to the
understanding of NOx formation was the study of Dec [53, 54]. These studies showed that NOx
was formed during the diffusion portion of the heat release, which is stoichiometric to lean, and
not during the premix portion, which is rich. Dec [53, 54] studied medium to high load
conditions and not low load, where combustion is primarily premix combustion. There are many
explanations for the change in NOx emissions based on the heat release curve from previous
researchers. Some accepted explanations for changes in NOx are:
• An increase in the heat released during the premix portion corresponds to a rapid increase
in the cylinder pressure and temperature compressing the diffusion flame where NOx is
formed; resulting in higher NOx [53, 54].
15
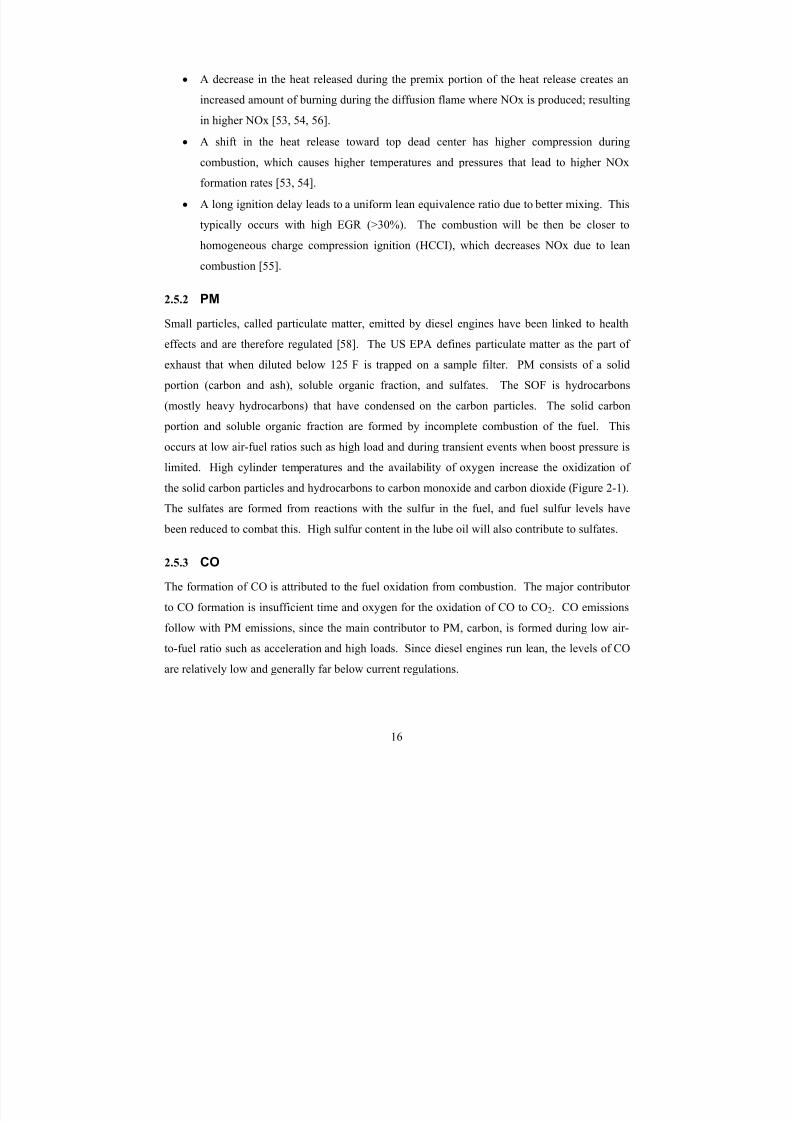
8/23/2019 The Effects of Fuel Additives on Diesel Engine Emissions During Steady State and Transient Operation
http://slidepdf.com/reader/full/the-effects-of-fuel-additives-on-diesel-engine-emissions-during-steady-state 35/163
• A decrease in the heat released during the premix portion of the heat release creates an
increased amount of burning during the diffusion flame where NOx is produced; resulting
in higher NOx [53, 54, 56].
• A shift in the heat release toward top dead center has higher compression during
combustion, which causes higher temperatures and pressures that lead to higher NOx
formation rates [53, 54].
• A long ignition delay leads to a uniform lean equivalence ratio due to better mixing. This
typically occurs with high EGR (>30%). The combustion will be then be closer to
homogeneous charge compression ignition (HCCI), which decreases NOx due to lean
combustion [55].
2.5.2 PMSmall particles, called particulate matter, emitted by diesel engines have been linked to health
effects and are therefore regulated [58]. The US EPA defines particulate matter as the part of
exhaust that when diluted below 125˚F is trapped on a sample filter. PM consists of a solid
portion (carbon and ash), soluble organic fraction, and sulfates. The SOF is hydrocarbons
(mostly heavy hydrocarbons) that have condensed on the carbon particles. The solid carbon
portion and soluble organic fraction are formed by incomplete combustion of the fuel. This
occurs at low air-fuel ratios such as high load and during transient events when boost pressure is
limited. High cylinder temperatures and the availability of oxygen increase the oxidization of
the solid carbon particles and hydrocarbons to carbon monoxide and carbon dioxide (Figure 2-1).
The sulfates are formed from reactions with the sulfur in the fuel, and fuel sulfur levels have
been reduced to combat this. High sulfur content in the lube oil will also contribute to sulfates.
2.5.3 CO
The formation of CO is attributed to the fuel oxidation from combustion. The major contributor
to CO formation is insufficient time and oxygen for the oxidation of CO to CO2. CO emissionsfollow with PM emissions, since the main contributor to PM, carbon, is formed during low air-
to-fuel ratio such as acceleration and high loads. Since diesel engines run lean, the levels of CO
are relatively low and generally far below current regulations.
16
8/23/2019 The Effects of Fuel Additives on Diesel Engine Emissions During Steady State and Transient Operation
http://slidepdf.com/reader/full/the-effects-of-fuel-additives-on-diesel-engine-emissions-during-steady-state 36/163
2.5.4 CO2
A direct product of combustion from a hydrocarbon fuel is CO2. Global warming has been
attributed to CO2, which is considered a green house gas [59]. Any increase in fuel consumption
increases the CO2
emissions. Currently in the US, CO2
emissions are not regulated, but may be
regulated in the future.
2.5.5 HC
The hydrocarbons in the exhaust are formed by incomplete combustion, as well as the heavy
hydrocarbons from engine oil on the cylinder walls. Zones that are either too lean or rich for
combustion are spots for hydrocarbon formation (Figure 2-1). Any fuel from injection that
contacts the cylinder walls or piston surface can have a quenching effect and become
hydrocarbon emissions. Another method of hydrocarbon emissions can occur from a late
injection of fuel when temperature and pressure are not high enough for combustion. Bad nozzle
seating can cause a late injection.
2.6 Combustion Analysis
By measuring the in-cylinder pressure, the combustion characteristics described by start of
ignition, ignition delay, combustion duration, heat release rate, and mass fraction burned can be
calculated. By measuring the exhaust emissions and making a comparison with the combustion
parameters mentioned above, an insight into the pollutant formation can be obtained.
2.6.1 In-cylinder Pressure
Measuring in-cylinder pressure provides the means to analyze the heat release and determine the
characteristics of combustion. A piezoelectric pressure transducer allows the measurement of
dynamic pressure at a fast rate to measure the in-cylinder pressure. During the typical
compression and expansion strokes, the in-cylinder pressure increases during the compression
stroke. When fuel is injected, a delay occurs before combustion and then a sudden increase in pressure greater than the motoring curve indicates the pressure created by combustion. The
motoring pressure is the pressure generated by compressing the volume of charge gas without
fuel injection.
17
8/23/2019 The Effects of Fuel Additives on Diesel Engine Emissions During Steady State and Transient Operation
http://slidepdf.com/reader/full/the-effects-of-fuel-additives-on-diesel-engine-emissions-during-steady-state 37/163
2.6.2 Heat Release
A well-known and highly utilized method for analyzing combustion characteristics is the heat
release rate in the combustion chamber [60]. Utilizing the first law of thermodynamics and
assuming a uniform pressure, uniform temperature, and ideal gas with the substitution of the
specific heat ratio (γ) and the substitution of crank angle for time reduces to an expression for the
gross heat release rate (Equation 2-4). By combining the heat transfer to the walls with the gross
heat release rate, the equation becomes the net heat release rate, given as Equation 2-5. A
relationship for the heat transfer to the walls is required when using the gross heat release rate.
The well-known Woshni equation [61] is generally used and was used for this study. For this
study, the gross heat release rate will be utilized for the total heat released, which will provide a
more accurate mass fraction burned. The wall heat transfer may be up to 15% of the gross heat
transfer [62].
ht gross d
dQ
d
dP *V *
1
1
d
dV * P *
1d
dQ⎥⎦
⎤⎢⎣
⎡+⎟⎟
⎠
⎞⎜⎜⎝
⎛
−+⎟⎟
⎠
⎞⎜⎜⎝
⎛
−=⎥⎦
⎤⎢⎣
⎡
θ θ γ θ γ
γ
θ
(2-4)
θ γ θ γ
γ
θ d
dP *V *
1
1
d
dV * P *
1d
dQ
net
⎟⎟ ⎠
⎞⎜⎜⎝
⎛
−+⎟⎟
⎠
⎞⎜⎜⎝
⎛
−=⎥⎦
⎤⎢⎣
⎡ (2-5)
The heat release rate has three regions: premixed, diffusion (rate-controlled), and late
combustion (Figure 2-2). The diffusion and late combustion regions are combined into solely
the diffusion combustion region in this study. The premixed burn portion is the characteristic
spike at the beginning of combustion and important to NOx formation as mentioned above. The
diffusion portion and then late combustion follow the premix portion and are usually more
gradual. Because of cycle-to-cycle combustion variation, multiple (50-300) steady state cycles
are normally collected after the engine has reached thermal equilibrium to provide for an average
cylinder pressure trace before the heat release analysis is performed.
18
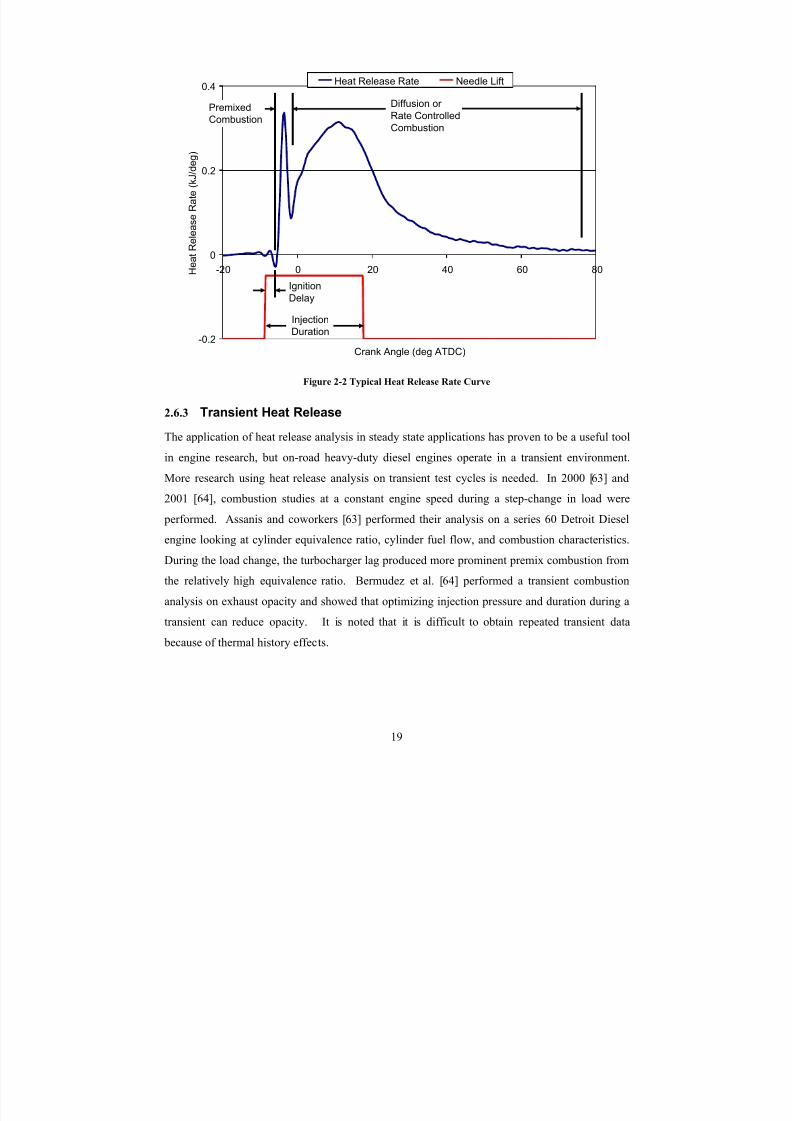
8/23/2019 The Effects of Fuel Additives on Diesel Engine Emissions During Steady State and Transient Operation
http://slidepdf.com/reader/full/the-effects-of-fuel-additives-on-diesel-engine-emissions-during-steady-state 38/163
-0.2
0
0.2
0.4
-20 0 20 40 60 80
Crank Angle (deg ATDC)
H e a t R e l e a s e R a t e ( k J / d e g )
Heat Release Rate Needle Lift
Diffusion or
Rate Controlled
Combustion
Premixed
Combustion
Ignition
Delay
Injection
Duration
Figure 2-2 Typical Heat Release Rate Curve
2.6.3 Transient Heat Release
The application of heat release analysis in steady state applications has proven to be a useful tool
in engine research, but on-road heavy-duty diesel engines operate in a transient environment.
More research using heat release analysis on transient test cycles is needed. In 2000 [63] and
2001 [64], combustion studies at a constant engine speed during a step-change in load were
performed. Assanis and coworkers [63] performed their analysis on a series 60 Detroit Diesel
engine looking at cylinder equivalence ratio, cylinder fuel flow, and combustion characteristics.
During the load change, the turbocharger lag produced more prominent premix combustion from
the relatively high equivalence ratio. Bermudez et al. [64] performed a transient combustion
analysis on exhaust opacity and showed that optimizing injection pressure and duration during atransient can reduce opacity. It is noted that it is difficult to obtain repeated transient data
because of thermal history effects.
19
8/23/2019 The Effects of Fuel Additives on Diesel Engine Emissions During Steady State and Transient Operation
http://slidepdf.com/reader/full/the-effects-of-fuel-additives-on-diesel-engine-emissions-during-steady-state 39/163
2.7 Numerical Modeling
The understanding of engine combustion from experimental testing is limited due to the multiple
processes effecting the resulting engine performance and emissions. Although not as accurate as
experimental testing, numerical modeling provides details about the fuel evaporation, mixing,chemical formation, and local temperature. Numerical modeling may provide a quicker and less
expensive method than experimental testing when examining a large parametric study.
Typically, numerical modeling is separated into three categories based on the detail level with
each level requiring greater computation time. Thermodynamic (zero dimensional) modeling
assumes a homogeneous mixture to determine the heat release rate and has no chemical
formation details. Phenomenological (quasi-dimensional) models have physical and chemical
submodels that solve the energy and mass equations. Computational Fluid Dynamics (CFD)
models (multi-dimensional) solve the mass, energy, and momentum equations with detailed
physical and chemical submodels. The accuracy of a model is typically based on a graphical
comparison of the numerical and experimental pressure and zero-dimensional heat release rate
[65, 66].
The level of detail used for the chemical formation submodel varies between studies. Some
combustion research assumes the chemical reactions to be at equilibrium for each time step. The
assumption of equilibrium has been shown to inaccurately model NOx formation [67, 68], with NOx approaching zero as the gas temperature reduces after combustion. The use of kinetics to
model chemical formation in diesel combustion provides greater accuracy since chemical
formation typically does not have sufficient time to reach equilibrium and “freeze” below certain
temperatures. This freezing occurs for NOx with temperatures below 1800K; the NOx
formation rate approaches zero [67]. The chemical formation submodel depends on the assumed
number of species and reactions. A greater number of species and reactions increase the
computation time. Using the Zeldovich mechanism for NOx tends to achieve an accuracy of +/-
20% [65]. A phenomenological combustion model by Hernandez et al. [68], which included 59
reactions and 27 chemical species, agreed within 30% of experimental NOx. Three combustion
submodels were studied with a CFD model by Singh and colleagues [66] with 30 species and 65
reactions. The models agreed within 50% of the experimental NOx. For both the
phenomenological combustion model [68] and the CFD model (with three different combustion
20

8/23/2019 The Effects of Fuel Additives on Diesel Engine Emissions During Steady State and Transient Operation
http://slidepdf.com/reader/full/the-effects-of-fuel-additives-on-diesel-engine-emissions-during-steady-state 40/163
submodels) [66], the predicted NOx trends agreed with the experiment NOx trends. Using NOx
formation as an example, a greater number of species and reactions provides more details on
chemical formation, but does not necessarily mean greater accuracy.
21
8/23/2019 The Effects of Fuel Additives on Diesel Engine Emissions During Steady State and Transient Operation
http://slidepdf.com/reader/full/the-effects-of-fuel-additives-on-diesel-engine-emissions-during-steady-state 41/163
3 Experimental Setup
3.1 Introduction
The objective of this work was to investigate the combustion characteristics during steady state
and transient cycles using fuel additives as an emission reduction strategy. The steady state and
transient cycles were tested at the WVU Engine Research Center. The capabilities of the testing
center have been documented extensively elsewhere [69]. This section will focus on the
experimental setup of the engines, fuels, and combustion analysis system.
3.2 Test Engines
The alternative diesel fuel programs, such as CARB and TxLED, specify the use of a enginerepresentative of the post 1990 model year diesel engine fleet for certification testing. A 1992
DDC Series 60 engine was acquired by WVU in poor condition (actual in-use engine from an
over-the-road truck) and required an engine re-build (Figure 3-1). A newer 2004 Cummins ISM
370 engine from prior WVU research was used to study the effects of fuel additives on more
modern diesel engines (Figure 3-2). Both engines are 4-stroke, turbocharged, intercooled, and
electronically controlled. The Cummins engine used cooled exhaust gas recirculation and a
variable geometry turbocharger to meet the 2004 emissions standards (Table 3-1). The 1992
DDC Series 60 engine was selected as part of the test matrix since this engine is specifically
listed by the CARB and TxLED programs. The 2004 Cummins engine was selected because of
availability and this engine represented a more modern on-road heavy-duty diesel engine.
22

8/23/2019 The Effects of Fuel Additives on Diesel Engine Emissions During Steady State and Transient Operation
http://slidepdf.com/reader/full/the-effects-of-fuel-additives-on-diesel-engine-emissions-during-steady-state 42/163
Figure 3-1 1992 Detroit Diesel Series 60 Engine
Figure 3-2 2004 Cummins ISM 370
23
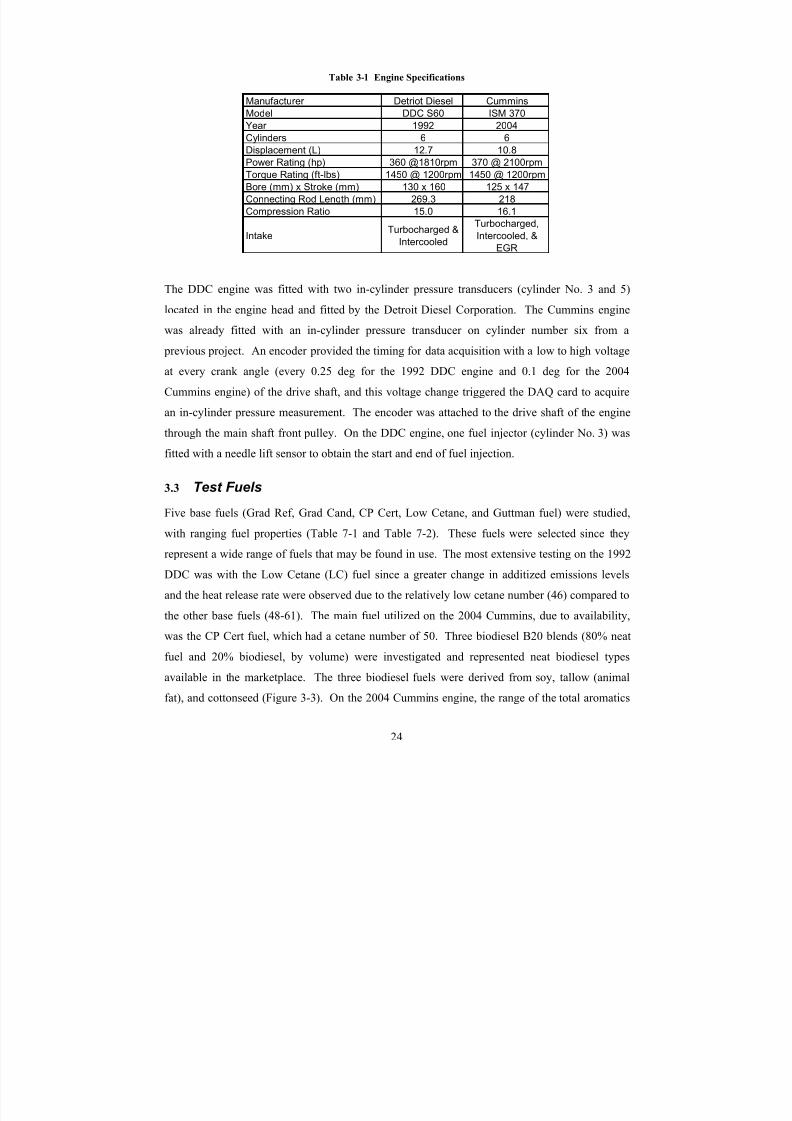
8/23/2019 The Effects of Fuel Additives on Diesel Engine Emissions During Steady State and Transient Operation
http://slidepdf.com/reader/full/the-effects-of-fuel-additives-on-diesel-engine-emissions-during-steady-state 43/163
Table 3-1 Engine Specifications
Manufacturer Detriot Diesel Cummins
Model DDC S60 ISM 370
Year 1992 2004
Cylinders 6 6
Displacement (L) 12.7 10.8Power Rating (hp) 360 @1810rpm 370 @ 2100rpm
Torque Rating (ft-lbs) 1450 @ 1200rpm 1450 @ 1200rpm
Bore (mm) x Stroke (mm) 130 x 160 125 x 147
Connecting Rod Length (mm) 269.3 218
Compression Ratio 15.0 16.1
IntakeTurbocharged &
Intercooled
Turbocharged,
Intercooled, &
EGR
The DDC engine was fitted with two in-cylinder pressure transducers (cylinder No. 3 and 5)
located in the engine head and fitted by the Detroit Diesel Corporation. The Cummins engine
was already fitted with an in-cylinder pressure transducer on cylinder number six from a
previous project. An encoder provided the timing for data acquisition with a low to high voltage
at every crank angle (every 0.25 deg for the 1992 DDC engine and 0.1 deg for the 2004
Cummins engine) of the drive shaft, and this voltage change triggered the DAQ card to acquire
an in-cylinder pressure measurement. The encoder was attached to the drive shaft of the engine
through the main shaft front pulley. On the DDC engine, one fuel injector (cylinder No. 3) was
fitted with a needle lift sensor to obtain the start and end of fuel injection.
3.3 Test Fuels
Five base fuels (Grad Ref, Grad Cand, CP Cert, Low Cetane, and Guttman fuel) were studied,
with ranging fuel properties (Table 7-1 and Table 7-2). These fuels were selected since they
represent a wide range of fuels that may be found in use. The most extensive testing on the 1992
DDC was with the Low Cetane (LC) fuel since a greater change in additized emissions levels
and the heat release rate were observed due to the relatively low cetane number (46) compared to
the other base fuels (48-61). The main fuel utilized on the 2004 Cummins, due to availability,
was the CP Cert fuel, which had a cetane number of 50. Three biodiesel B20 blends (80% neat
fuel and 20% biodiesel, by volume) were investigated and represented neat biodiesel types
available in the marketplace. The three biodiesel fuels were derived from soy, tallow (animal
fat), and cottonseed (Figure 3-3). On the 2004 Cummins engine, the range of the total aromatics
24
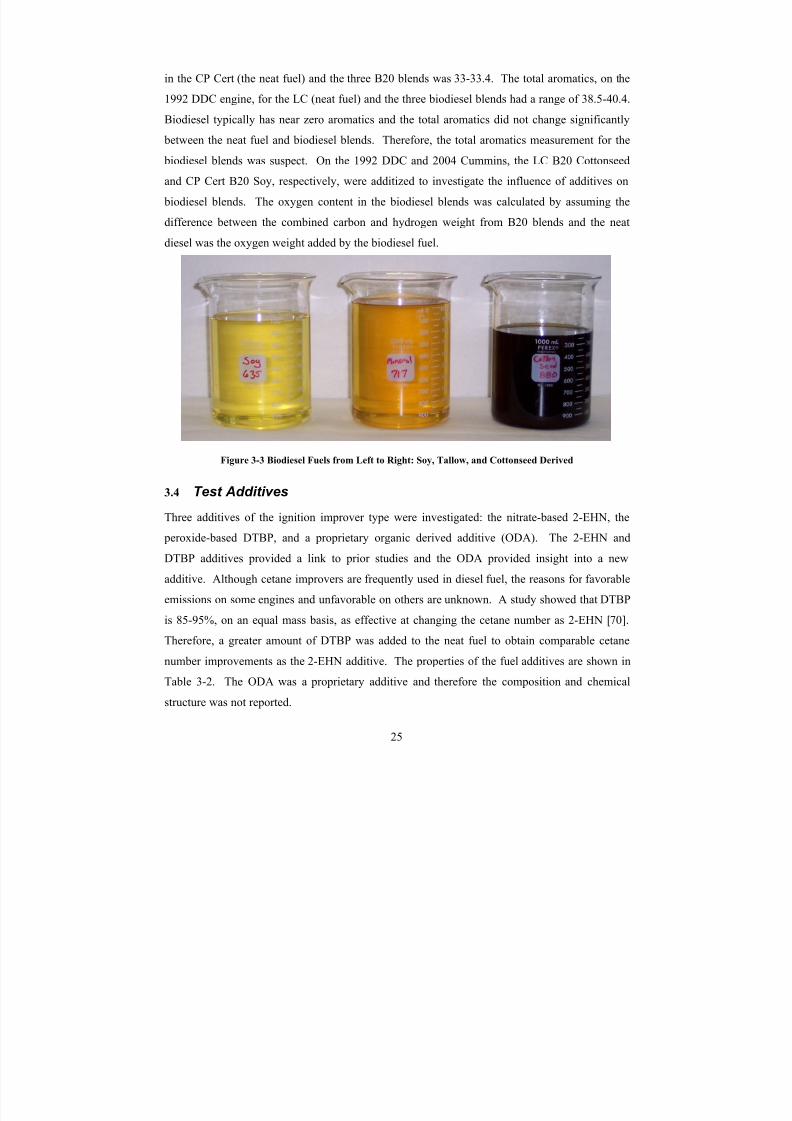
8/23/2019 The Effects of Fuel Additives on Diesel Engine Emissions During Steady State and Transient Operation
http://slidepdf.com/reader/full/the-effects-of-fuel-additives-on-diesel-engine-emissions-during-steady-state 44/163
in the CP Cert (the neat fuel) and the three B20 blends was 33-33.4. The total aromatics, on the
1992 DDC engine, for the LC (neat fuel) and the three biodiesel blends had a range of 38.5-40.4.
Biodiesel typically has near zero aromatics and the total aromatics did not change significantly
between the neat fuel and biodiesel blends. Therefore, the total aromatics measurement for the
biodiesel blends was suspect. On the 1992 DDC and 2004 Cummins, the LC B20 Cottonseed
and CP Cert B20 Soy, respectively, were additized to investigate the influence of additives on
biodiesel blends. The oxygen content in the biodiesel blends was calculated by assuming the
difference between the combined carbon and hydrogen weight from B20 blends and the neat
diesel was the oxygen weight added by the biodiesel fuel.
Figure 3-3 Biodiesel Fuels from Left to Right: Soy, Tallow, and Cottonseed Derived
3.4 Test Additives
Three additives of the ignition improver type were investigated: the nitrate-based 2-EHN, the
peroxide-based DTBP, and a proprietary organic derived additive (ODA). The 2-EHN and
DTBP additives provided a link to prior studies and the ODA provided insight into a new
additive. Although cetane improvers are frequently used in diesel fuel, the reasons for favorable
emissions on some engines and unfavorable on others are unknown. A study showed that DTBP
is 85-95%, on an equal mass basis, as effective at changing the cetane number as 2-EHN [70].
Therefore, a greater amount of DTBP was added to the neat fuel to obtain comparable cetane
number improvements as the 2-EHN additive. The properties of the fuel additives are shown in
Table 3-2. The ODA was a proprietary additive and therefore the composition and chemical
structure was not reported.
25
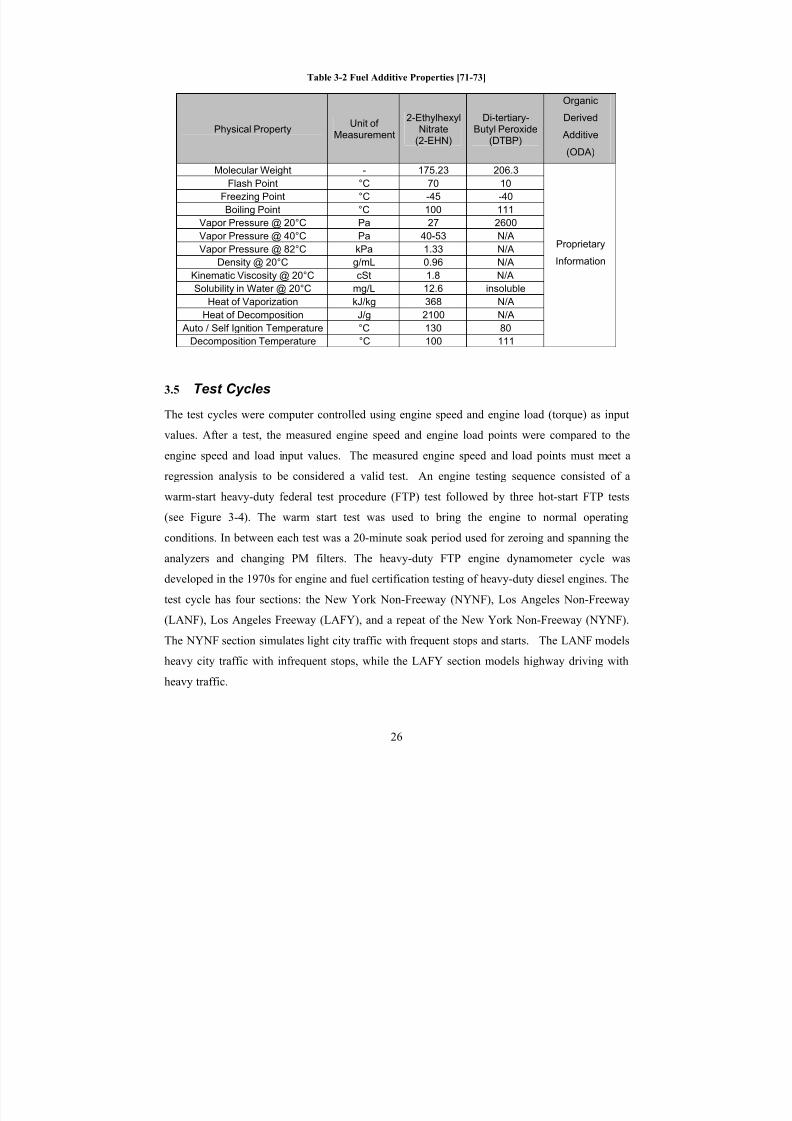
8/23/2019 The Effects of Fuel Additives on Diesel Engine Emissions During Steady State and Transient Operation
http://slidepdf.com/reader/full/the-effects-of-fuel-additives-on-diesel-engine-emissions-during-steady-state 45/163
Table 3-2 Fuel Additive Properties [71-73]
Physical PropertyUnit of
Measurement
2-EthylhexylNitrate
(2-EHN)
Di-tertiary-Butyl Peroxide
(DTBP)
Organic
Derived
Additive
(ODA)
Molecular Weight - 175.23 206.3
Flash Point °C 70 10
Freezing Point °C -45 -40
Boiling Point °C 100 111
Vapor Pressure @ 20°C Pa 27 2600
Vapor Pressure @ 40°C Pa 40-53 N/A
Vapor Pressure @ 82°C kPa 1.33 N/A
Density @ 20°C g/mL 0.96 N/A
Kinematic Viscosity @ 20°C cSt 1.8 N/A
Solubility in Water @ 20°C mg/L 12.6 insoluble
Heat of Vaporization kJ/kg 368 N/AHeat of Decomposition J/g 2100 N/A
Auto / Self Ignition Temperature °C 130 80
Decomposition Temperature °C 100 111
Proprietary
Information
3.5 Test Cycles
The test cycles were computer controlled using engine speed and engine load (torque) as input
values. After a test, the measured engine speed and engine load points were compared to the
engine speed and load input values. The measured engine speed and load points must meet aregression analysis to be considered a valid test. An engine testing sequence consisted of a
warm-start heavy-duty federal test procedure (FTP) test followed by three hot-start FTP tests
(see Figure 3-4). The warm start test was used to bring the engine to normal operating
conditions. In between each test was a 20-minute soak period used for zeroing and spanning the
analyzers and changing PM filters. The heavy-duty FTP engine dynamometer cycle was
developed in the 1970s for engine and fuel certification testing of heavy-duty diesel engines. The
test cycle has four sections: the New York Non-Freeway (NYNF), Los Angeles Non-Freeway
(LANF), Los Angeles Freeway (LAFY), and a repeat of the New York Non-Freeway (NYNF).
The NYNF section simulates light city traffic with frequent stops and starts. The LANF models
heavy city traffic with infrequent stops, while the LAFY section models highway driving with
heavy traffic.
26
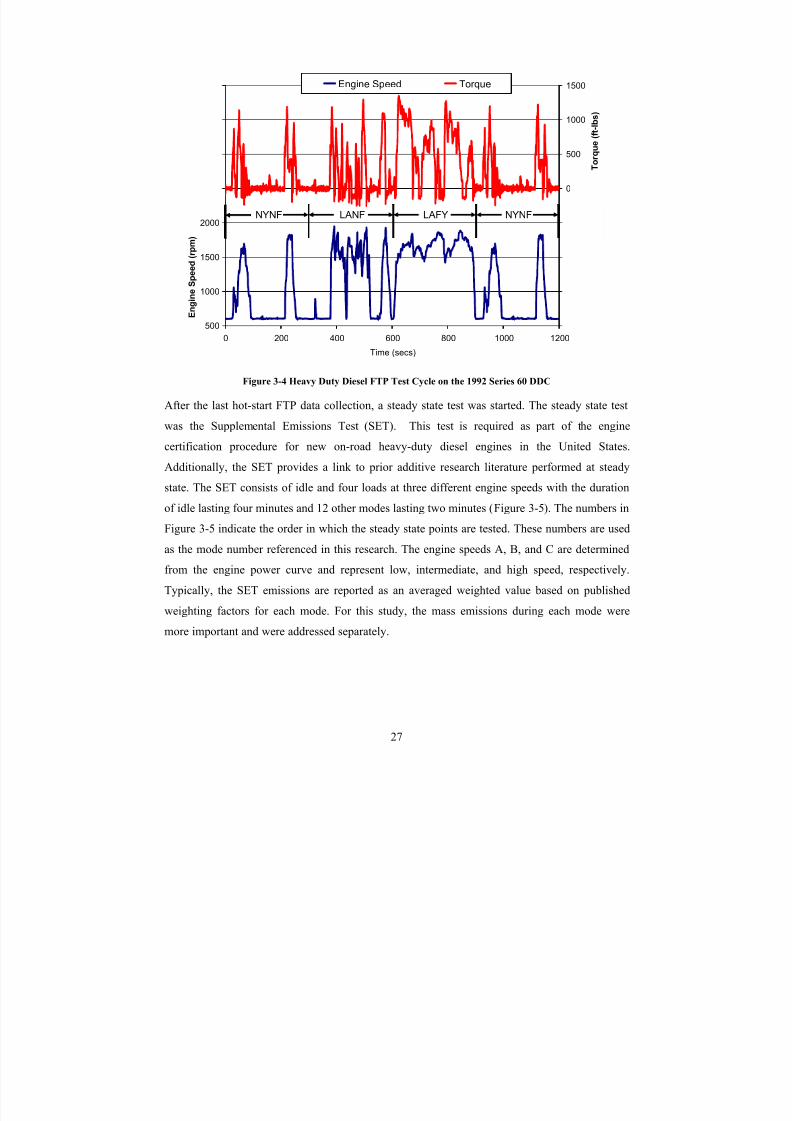
8/23/2019 The Effects of Fuel Additives on Diesel Engine Emissions During Steady State and Transient Operation
http://slidepdf.com/reader/full/the-effects-of-fuel-additives-on-diesel-engine-emissions-during-steady-state 46/163
500
1000
1500
2000
2500
3000
3500
4000
0 200 400 600 800 1000 1200
Time (secs)
E n g i n e S p e e d ( r p m )
-2000
-1500
-1000
-500
0
500
1000
1500
T o r q u e ( f t - l b s )
Engine Speed Torque
NYNF LANF LAFY NYNF
Figure 3-4 Heavy Duty Diesel FTP Test Cycle on the 1992 Series 60 DDC
After the last hot-start FTP data collection, a steady state test was started. The steady state test
was the Supplemental Emissions Test (SET). This test is required as part of the engine
certification procedure for new on-road heavy-duty diesel engines in the United States.
Additionally, the SET provides a link to prior additive research literature performed at steady
state. The SET consists of idle and four loads at three different engine speeds with the duration
of idle lasting four minutes and 12 other modes lasting two minutes (Figure 3-5). The numbers in
Figure 3-5 indicate the order in which the steady state points are tested. These numbers are used
as the mode number referenced in this research. The engine speeds A, B, and C are determined
from the engine power curve and represent low, intermediate, and high speed, respectively.
Typically, the SET emissions are reported as an averaged weighted value based on published
weighting factors for each mode. For this study, the mass emissions during each mode were
more important and were addressed separately.
27
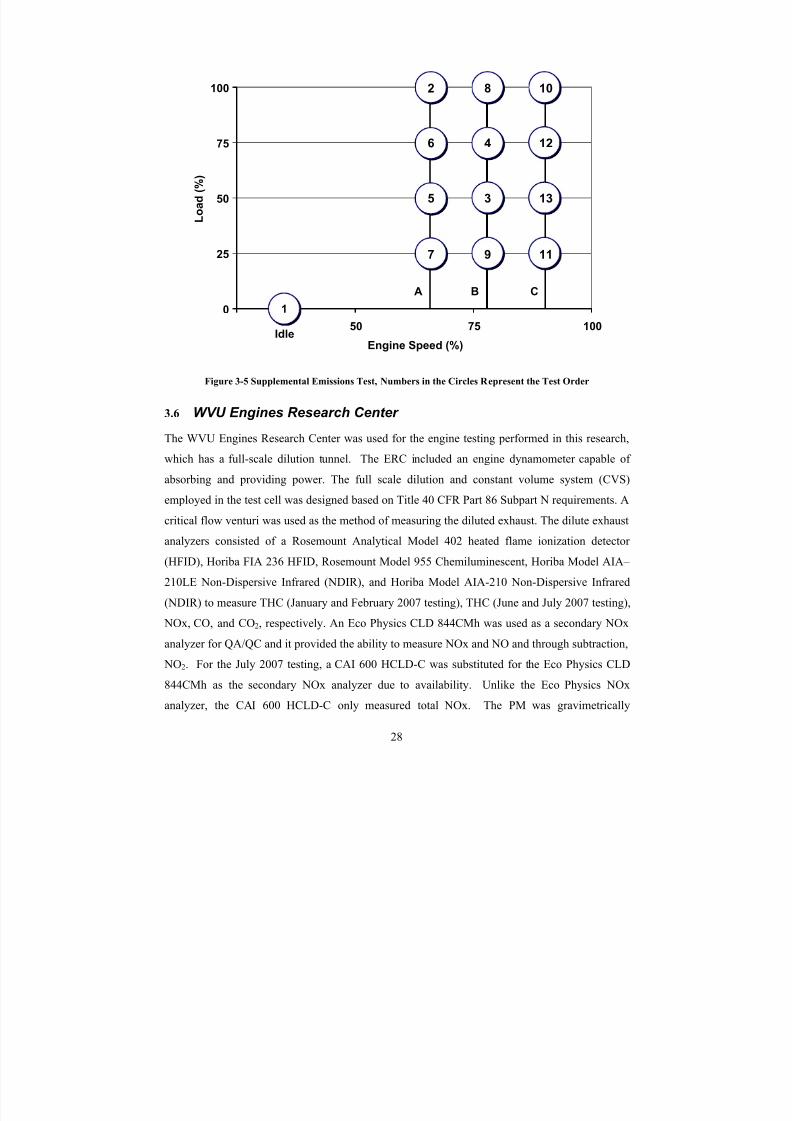
8/23/2019 The Effects of Fuel Additives on Diesel Engine Emissions During Steady State and Transient Operation
http://slidepdf.com/reader/full/the-effects-of-fuel-additives-on-diesel-engine-emissions-during-steady-state 47/163
0
25
50
75
100
25 50 75 100
Engine Speed (%)
L o a d ( % )
1
2
5
7
6
10
12
13
11
A
9
3
4
8
B C
Idle
Figure 3-5 Supplemental Emissions Test, Numbers in the Circles Represent the Test Order
3.6 WVU Engines Research Center
The WVU Engines Research Center was used for the engine testing performed in this research,
which has a full-scale dilution tunnel. The ERC included an engine dynamometer capable of
absorbing and providing power. The full scale dilution and constant volume system (CVS)
employed in the test cell was designed based on Title 40 CFR Part 86 Subpart N requirements. A
critical flow venturi was used as the method of measuring the diluted exhaust. The dilute exhaust
analyzers consisted of a Rosemount Analytical Model 402 heated flame ionization detector
(HFID), Horiba FIA 236 HFID, Rosemount Model 955 Chemiluminescent, Horiba Model AIA–
210LE Non-Dispersive Infrared (NDIR), and Horiba Model AIA-210 Non-Dispersive Infrared
(NDIR) to measure THC (January and February 2007 testing), THC (June and July 2007 testing), NOx, CO, and CO2, respectively. An Eco Physics CLD 844CMh was used as a secondary NOx
analyzer for QA/QC and it provided the ability to measure NOx and NO and through subtraction,
NO2. For the July 2007 testing, a CAI 600 HCLD-C was substituted for the Eco Physics CLD
844CMh as the secondary NOx analyzer due to availability. Unlike the Eco Physics NOx
analyzer, the CAI 600 HCLD-C only measured total NOx. The PM was gravimetrically
28
8/23/2019 The Effects of Fuel Additives on Diesel Engine Emissions During Steady State and Transient Operation
http://slidepdf.com/reader/full/the-effects-of-fuel-additives-on-diesel-engine-emissions-during-steady-state 48/163
measured in accordance with Title 40 CFR Part 86 Subpart N requirements using proportional
sampling of the diluted exhaust through a pair of Pallflex 70mm diameter Model T60A20
fluorocarbon-coated glass microfiber filters in series. For more detail information on the facility
and testing, see reference [69].
3.7 Test Matrix
The investigated base fuels and additive concentrations are shown as Table 3-3. The 1992 DDC
engine was tested with base fuels of Grad Ref, Grad Cand, CP Cert, Low Cetane, and Low
Cetane B20 Cottonseed. The base fuels tested on the 2004 Cummins engine were the Grad Ref,
Grad Cand, CP Cert, and CP Cert B20 Soy. The multiple base fuels were tested to investigate
whether the base fuel properties had any large influence on additive performance. There was
also a limited quantity of each base fuel. Cetane improvers were chosen as the studied additivesdue to the need for an improved understanding of their emissions performance. The literature
only speculates on reasons for the varied NOx reductions/increases based on engine conditions
(load and speed) and type (manufacturer, model, and year) [10-15]. The additive concentrations
ranged from 3 to 24 ml/gal and every combination of additive, concentration, and fuel type was
not tested on both engines. The wide range of additive concentrations was due to testing the
engine and base fuel responses to the additive and then later applying this knowledge to other
base fuels and additive concentrations. That is, an ad hoc test plan was used in this program.
Due to limited change in the NOx emissions with the cetane improvers on the 2004 Cummins
engine, higher concentrations of each additive were evaluated than with the 1992 DDC engine.
One main difference between the two engines was the 2004 Cummins engine had cooled EGR,
where as the 1992 DDC did not have EGR at all. To determine whether the EGR had an
influence on the effectiveness of the cetane improvers, the EGR valve was disabled with and
without additive utilizing the Grad Ref fuel. This would also give an indication of the emissions
if an EGR failure occurred on a modern engine (model year 2004 or later) with cetane-improved
fuel.
29
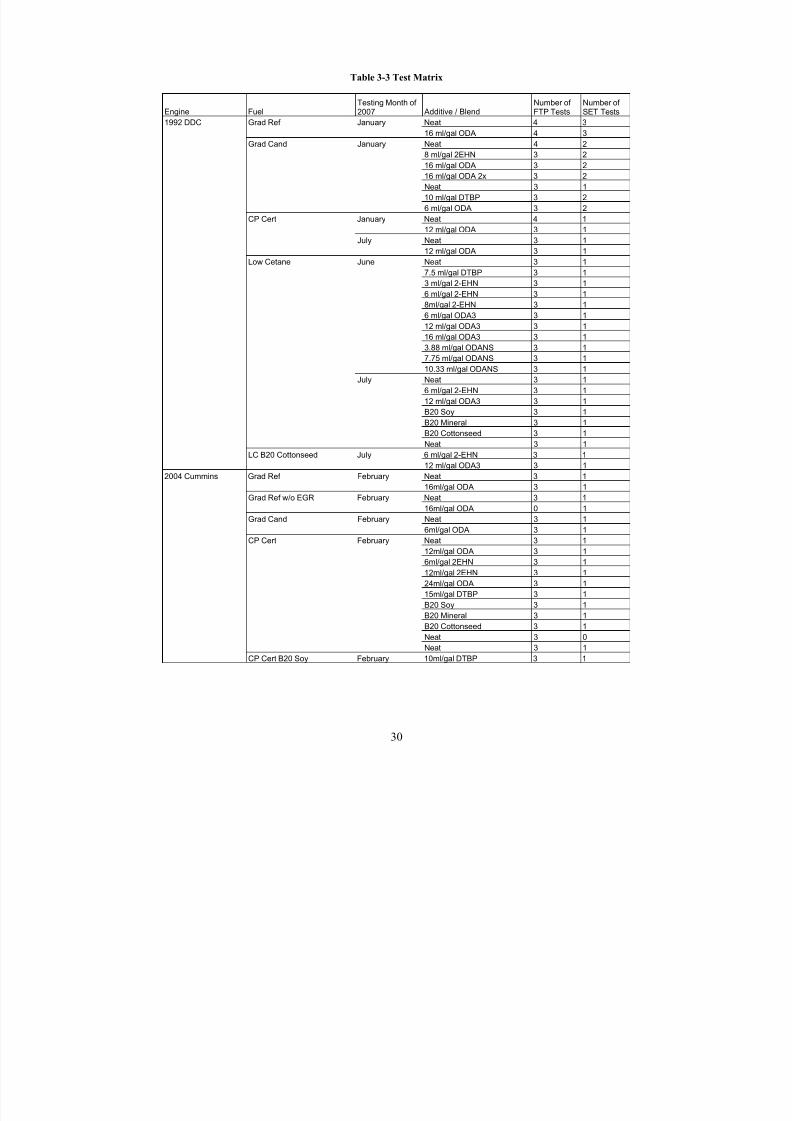
8/23/2019 The Effects of Fuel Additives on Diesel Engine Emissions During Steady State and Transient Operation
http://slidepdf.com/reader/full/the-effects-of-fuel-additives-on-diesel-engine-emissions-during-steady-state 49/163
Table 3-3 Test Matrix
Engine FuelTesting Month of 2007 Additive / Blend
Number of FTP Tests
Number of SET Tests
1992 DDC Grad Ref January Neat 4 3
16 ml/gal ODA 4 3
Grad Cand January Neat 4 2
8 ml/gal 2EHN 3 2
16 ml/gal ODA 3 2
16 ml/gal ODA 2x 3 2
Neat 3 1
10 ml/gal DTBP 3 2
6 ml/gal ODA 3 2
CP Cert January Neat 4 1
12 ml/gal ODA 3 1
July Neat 3 1
12 ml/gal ODA 3 1
Low Cetane June Neat 3 1
7.5 ml/gal DTBP 3 1
3 ml/gal 2-EHN 3 1
6 ml/gal 2-EHN 3 1
8ml/gal 2-EHN 3 16 ml/gal ODA3 3 1
12 ml/gal ODA3 3 1
16 ml/gal ODA3 3 1
3.88 ml/gal ODANS 3 1
7.75 ml/gal ODANS 3 1
10.33 ml/gal ODANS 3 1
July Neat 3 1
6 ml/gal 2-EHN 3 1
12 ml/gal ODA3 3 1
B20 Soy 3 1
B20 Mineral 3 1
B20 Cottonseed 3 1
Neat 3 1
LC B20 Cottonseed July 6 ml/gal 2-EHN 3 112 ml/gal ODA3 3 1
2004 Cummins Grad Ref February Neat 3 1
16ml/gal ODA 3 1
Grad Ref w/o EGR February Neat 3 1
16ml/gal ODA 0 1
Grad Cand February Neat 3 1
6ml/gal ODA 3 1
CP Cert February Neat 3 1
12ml/gal ODA 3 1
6ml/gal 2EHN 3 1
12ml/gal 2EHN 3 1
24ml/gal ODA 3 1
15ml/gal DTBP 3 1
B20 Soy 3 1B20 Mineral 3 1
B20 Cottonseed 3 1
Neat 3 0
Neat 3 1
CP Cert B20 Soy February 10ml/gal DTBP 3 1
30
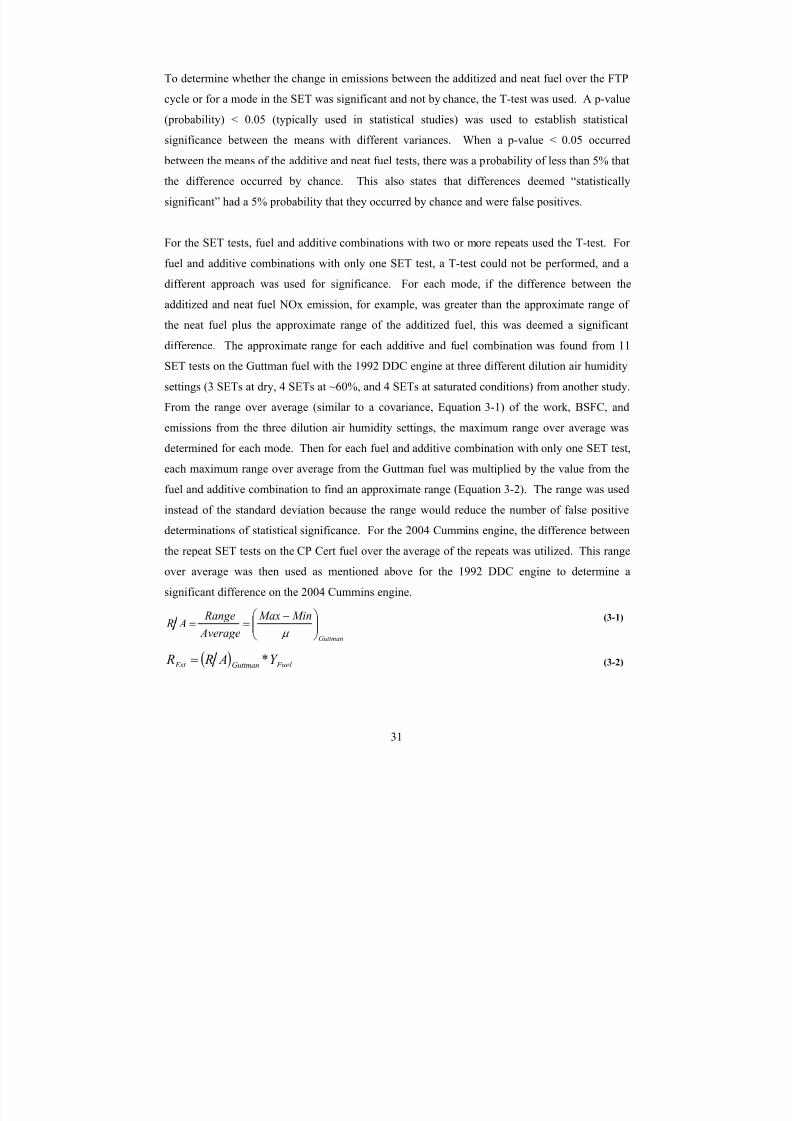
8/23/2019 The Effects of Fuel Additives on Diesel Engine Emissions During Steady State and Transient Operation
http://slidepdf.com/reader/full/the-effects-of-fuel-additives-on-diesel-engine-emissions-during-steady-state 50/163
To determine whether the change in emissions between the additized and neat fuel over the FTP
cycle or for a mode in the SET was significant and not by chance, the T-test was used. A p-value
(probability) < 0.05 (typically used in statistical studies) was used to establish statistical
significance between the means with different variances. When a p-value < 0.05 occurred
between the means of the additive and neat fuel tests, there was a probability of less than 5% that
the difference occurred by chance. This also states that differences deemed “statistically
significant” had a 5% probability that they occurred by chance and were false positives.
For the SET tests, fuel and additive combinations with two or more repeats used the T-test. For
fuel and additive combinations with only one SET test, a T-test could not be performed, and a
different approach was used for significance. For each mode, if the difference between the
additized and neat fuel NOx emission, for example, was greater than the approximate range of the neat fuel plus the approximate range of the additized fuel, this was deemed a significant
difference. The approximate range for each additive and fuel combination was found from 11
SET tests on the Guttman fuel with the 1992 DDC engine at three different dilution air humidity
settings (3 SETs at dry, 4 SETs at ~60%, and 4 SETs at saturated conditions) from another study.
From the range over average (similar to a covariance, Equation 3-1) of the work, BSFC, and
emissions from the three dilution air humidity settings, the maximum range over average was
determined for each mode. Then for each fuel and additive combination with only one SET test,
each maximum range over average from the Guttman fuel was multiplied by the value from the
fuel and additive combination to find an approximate range (Equation 3-2). The range was used
instead of the standard deviation because the range would reduce the number of false positive
determinations of statistical significance. For the 2004 Cummins engine, the difference between
the repeat SET tests on the CP Cert fuel over the average of the repeats was utilized. This range
over average was then used as mentioned above for the 1992 DDC engine to determine a
significant difference on the 2004 Cummins engine.
Guttman
Min Max
Average
Range A R ⎟⎟
⎠
⎞⎜⎜⎝
⎛ −==
μ
(3-1)
( ) Fuel Guttman Est Y * A R R = (3-2)
31
8/23/2019 The Effects of Fuel Additives on Diesel Engine Emissions During Steady State and Transient Operation
http://slidepdf.com/reader/full/the-effects-of-fuel-additives-on-diesel-engine-emissions-during-steady-state 51/163
To find a relationship between the heat release parameters (see Section 3.8.1) and emissions of
the additized and neat fuel, the Pearson product-moment correlation coefficient was used. The
correlation coefficient is a measure of the linear relationship between two variables and ranges
from -1 to 1, with “-1” being a “perfect” negative linear relation, and “+1” being a “perfect”
positive linear relationship, and zero having no linear relationship. Therefore, higher correlation
coefficients indicate a stronger relationship between variables, but not necessarily a cause and
effect relationship. It should be noted that plots of the heat release parameters and the emissions
were observed to determine if any outlier(s) might have caused a low or high correlation; no
outliers were found.
3.8 In-cylinder Pressure
The pressure transducers were of the piezoelectric type, which measures dynamic pressure. Astatic pressure measurement is required to “peg” or provide a reference point. The pressure
transducer connects to a charge amplifier, which converts the charge provided by the pressure
transducer to an amplified voltage. This voltage can then be read by a data acquisition system.
The 1992 DDC engine and the 2004 Cummins utilized Kistler quartz pressure transducer models
6125B and 6061B, respectively (Figure 3-6). The model 6061B pressure transducer utilizes
cooling water to minimize any temperature influences such as thermal shock and sensitivity.
The manufacturer specifications for the transducers are provided in the Appendix as Table 7-3.
A low-pass filter was applied to the measured in-cylinder pressure to minimize fluctuations
caused by the pressure wave. A low-pass filter with cut-off frequencies of 2500Hz and 1500Hz
was applied to the in-cylinder pressure of the 1992 DDC engine and 2004 Cummins engine,
respectively, to reduce the high frequency combustion noise. The 2004 Cummins engine had
greater combustion noise, so a lower cut-off frequency was required. The low-pass filter is a
type of averaging filter, which unfortunately causes a reduction in the premix spike. It was
assumed that since this averaging was applied to all data equally, the relative differences
between fuels should not be impacted significantly.
32
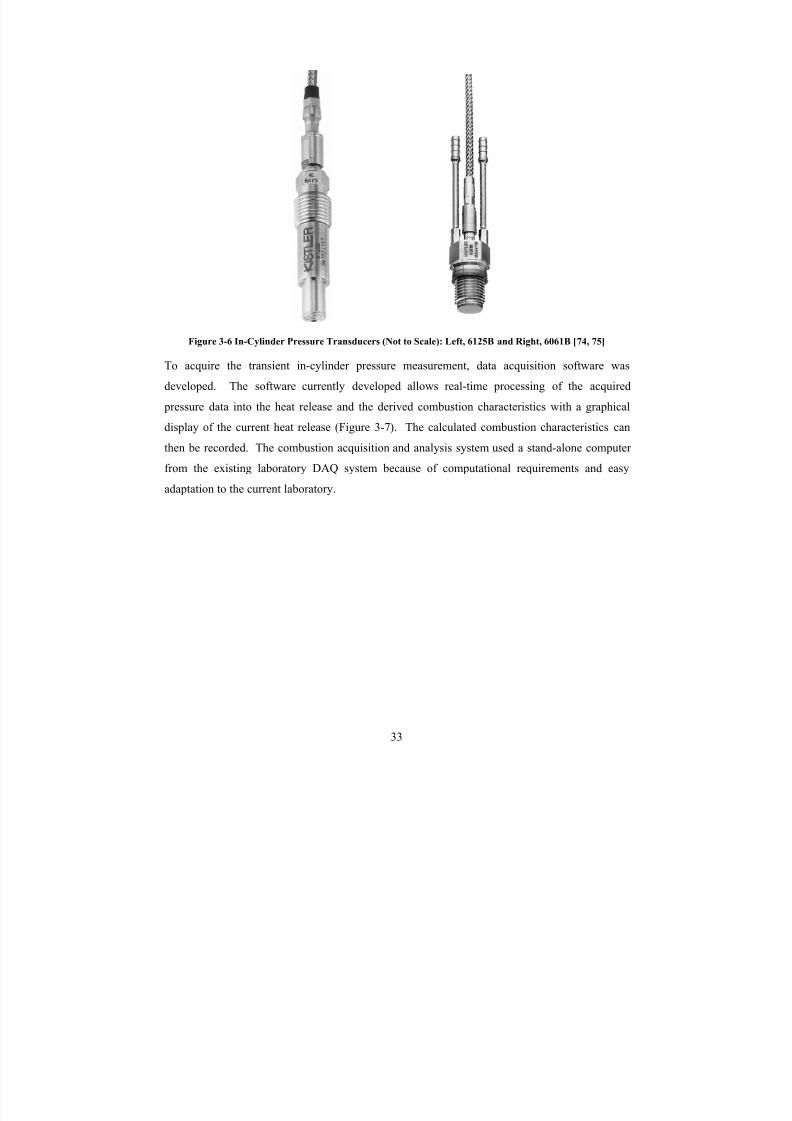
8/23/2019 The Effects of Fuel Additives on Diesel Engine Emissions During Steady State and Transient Operation
http://slidepdf.com/reader/full/the-effects-of-fuel-additives-on-diesel-engine-emissions-during-steady-state 52/163
Figure 3-6 In-Cylinder Pressure Transducers (Not to Scale): Left, 6125B and Right, 6061B [74, 75]
To acquire the transient in-cylinder pressure measurement, data acquisition software was
developed. The software currently developed allows real-time processing of the acquired
pressure data into the heat release and the derived combustion characteristics with a graphical
display of the current heat release (Figure 3-7). The calculated combustion characteristics can
then be recorded. The combustion acquisition and analysis system used a stand-alone computer
from the existing laboratory DAQ system because of computational requirements and easy
adaptation to the current laboratory.
33
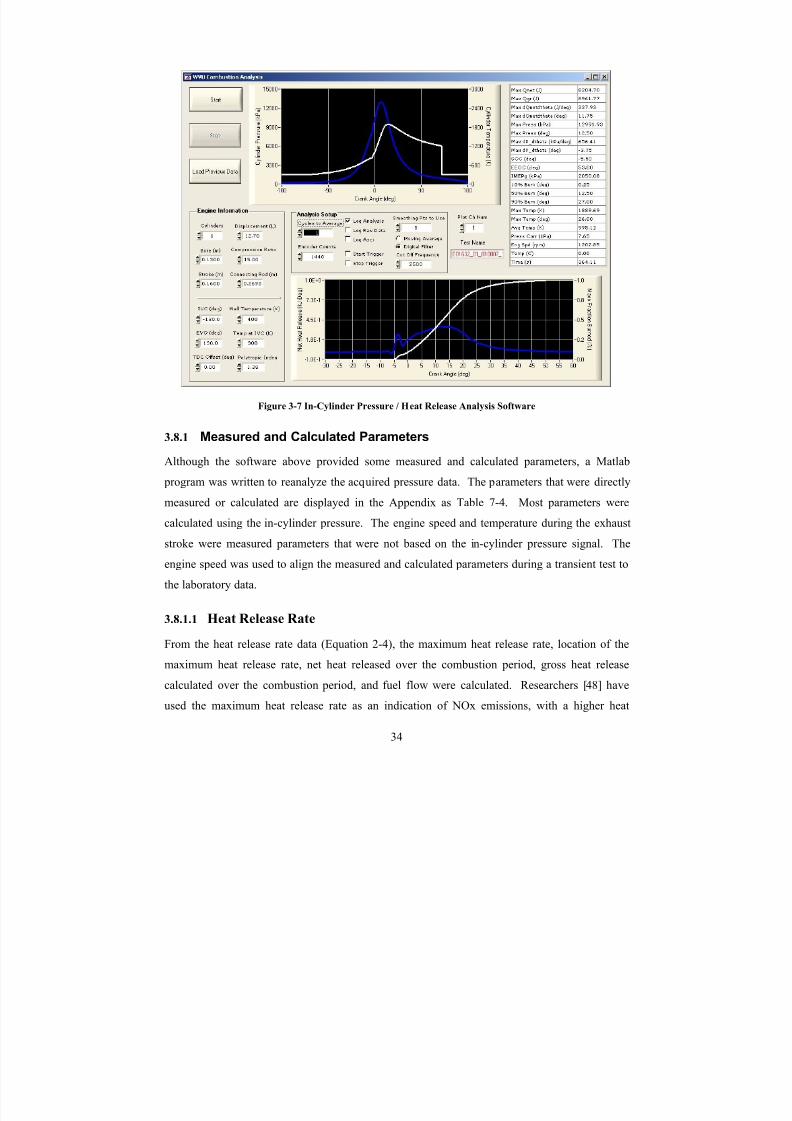
8/23/2019 The Effects of Fuel Additives on Diesel Engine Emissions During Steady State and Transient Operation
http://slidepdf.com/reader/full/the-effects-of-fuel-additives-on-diesel-engine-emissions-during-steady-state 53/163
Figure 3-7 In-Cylinder Pressure / Heat Release Analysis Software
3.8.1 Measured and Calculated Parameters
Although the software above provided some measured and calculated parameters, a Matlab
program was written to reanalyze the acquired pressure data. The parameters that were directly
measured or calculated are displayed in the Appendix as Table 7-4. Most parameters were
calculated using the in-cylinder pressure. The engine speed and temperature during the exhaust
stroke were measured parameters that were not based on the in-cylinder pressure signal. The
engine speed was used to align the measured and calculated parameters during a transient test to
the laboratory data.
3.8.1.1 Heat Release Rate
From the heat release rate data (Equation 2-4), the maximum heat release rate, location of the
maximum heat release rate, net heat released over the combustion period, gross heat release
calculated over the combustion period, and fuel flow were calculated. Researchers [48] have
used the maximum heat release rate as an indication of NOx emissions, with a higher heat
34
8/23/2019 The Effects of Fuel Additives on Diesel Engine Emissions During Steady State and Transient Operation
http://slidepdf.com/reader/full/the-effects-of-fuel-additives-on-diesel-engine-emissions-during-steady-state 54/163
release rate correlating to higher NOx. The net and gross heat released (Equation 3-3 and
Equation 3-4) is the summation of the heat released during each crank angle resolution from the
start of combustion (SOC) to the end of combustion (EOC). From the gross heat released, lower
heating value of the fuel (LHV), and engine speed (rpm), the fuel flow in the cylinder with in-
cylinder pressure measurement was calculated. By multiplying the fuel flow in one cylinder by
the number of cylinders, an estimation for the total fuel consumption of the engine was obtained,
assuming all cylinders have the same fuel flow (Equation 3-5).
∑= EOC
SOC
net net dQQ (3-3)
∑= EOC
SOC
gross gross dQQ (3-4)
rev
cycle
2
1*n*
LHV
Qm s
gross
fuel =& (3-5)
3.8.1.2 In-cylinder Pressure
With the direct measurement of in-cylinder pressure, the maximum pressure and the location of
maximum pressure were calculated. The maximum pressure provides an indication of the engine
load and the in-cylinder temperature. Higher pressure typically indicates higher loads and in-
cylinder gas temperatures.
Since the piezoelectric transducer provided dynamic pressure, the pressure signal needed
referencing each cycle to give an absolute pressure. The two most common methods are using
the manifold air pressure or assuming a constant polytropic constant [76]. The method used for
this study was a constant polytropic constant. This method has been recommended by Brunt et
al. [76] for combustion studies since the measurement of manifold air pressure is not required,
which can be inaccurate with tuned intake manifolds. The corrected pressure was the average of the calculated corrected pressures over a 40 crank angle degree window during the compression
stroke between 120 and 60 degrees BTDC. Since the laboratory intake manifold air pressure
(MAP) was not used in the pressure correction, the MAP was obtained from the in-cylinder
pressure trace at the location of intake valve closing and compared to the laboratory MAP.
35
8/23/2019 The Effects of Fuel Additives on Diesel Engine Emissions During Steady State and Transient Operation
http://slidepdf.com/reader/full/the-effects-of-fuel-additives-on-diesel-engine-emissions-during-steady-state 55/163
Obtaining the MAP from the pressure trace removed the dependency of another sensor and the
need for interpolation of the laboratory MAP pressure during transient tests.
3.8.1.3 Needle Lift
A needle lift sensor was installed inside a single injector on the 1992 DDC Series 60 engine by
Wolff Controls. The sensor was a Hall Effect sensor, which provided a voltage signal
proportional to height of the fuel injection needle at a frequency response of 25kHz. From the
needle lift, the start and end of the fuel injection was obtained.
3.8.1.4 Start of Combustion
The start of combustion is defined here, as the first measurable quantity of combustion in the
cylinder (Figure 2-2). When comparing two fuels on the same engine at the same set points of engine speed and load, the start of combustion is an indication of ignition delay if the start of
ignition was the same. Other researchers have used the point at which the pressure deviates from
the motoring curve [50] or the point at which 10% of the mass fraction has burned [77].
3.8.1.5 Ignition Delay
The time from the start of fuel injection to the start of combustion is the ignition delay. Ignition
delay provides an indication of the combustibility of the fuel injected and the mixing of the fuel
and air. A longer ignition delay indicates the need for higher pressures and temperatures for the
fuel to combust. A higher cetane fuel has a smaller ignition delay and therefore more fuel is
injected during the diffusion burn, potentially resulting in lower NOx emissions.
3.8.1.6 Estimated End of Combustion
The duration of combustion is from the start of combustion to the end of combustion. With the
injection of more fuel, the duration of combustion can be longer. Long combustion duration
might indicate that too much fuel is injected as the cylinder cools down during the expansionstroke, potentially causing incomplete combustion. The end of combustion was estimated from
the maximum heat released over ten crank angle degrees and adding twenty degrees. After the
end of combustion the heat released should maintain the same level for tens of degrees [78], thus
over estimation of the end of combustion should be a better assumption than under estimation,
especially when the mass fraction burned is of concern.
36
8/23/2019 The Effects of Fuel Additives on Diesel Engine Emissions During Steady State and Transient Operation
http://slidepdf.com/reader/full/the-effects-of-fuel-additives-on-diesel-engine-emissions-during-steady-state 56/163
3.8.1.7 Indicated Mean Effective Pressure
A useful combustion parameter was the indicated mean effective pressure (IMEP), which is the
cylinder work normalized by the cylinder displaced volume. A study done by Brunt and Emtage
[79] explored five methods of calculating the IMEP, and the method least effected byexperimental error was used here (Equation 3-6). The gross IMEP is the IMEP over the
compression and expansion strokes only and gross IMEP was used in this study. The gross
engine torque (Equation 3-7) may be calculated from the IMEP, displacement volume of the
engine (VD), and the number of revolutions per combustion cycle (R S). The friction and
pumping torque (Equation 3-8) was approximated from a polynomial of engine speed and intake
air flow [80]. Subtracting friction/pumping torque from the gross torque yielded the brake
torque. The polynomial coefficients for the friction/pumping torque relationship were fit using
the gross torque from the combustion parameters and the brake torque from the dynamometer
during steady state testing. Using the brake torque and engine speed from the combustion
program, the engine power may be calculated for each combustion cycle during transient testing.
∑=
=
= BDC i
BDC i D d
)i( dV * )i( P
V imep
θ
θ Δ (3-6)
S
D
R
imep*V T = (3-7)
( ) aS 432S 2S 1o p / f m*n*aan*an*aaT ++++= (3-8)
3.8.1.8 Mass Fraction Burned
The mass fraction burned (MFB) gives the percentage of injected fuel that burned at a particular
crank angle. Common values of interest are the durations of 10, 50, and 90% MFB [78]. The
duration, in crank angle, of start of combustion to 10% or 50% MFB indicates the intensity of
premix combustion, while from 50 to 90% MFB indicates the strength of the diffusion burn. The
equation for the mass fraction burned used in this research was from the first law of thermodynamics and calculated by normalizing the cumulative gross heat release at each crank
angle to the total heat released (Equation 3-9).
37
8/23/2019 The Effects of Fuel Additives on Diesel Engine Emissions During Steady State and Transient Operation
http://slidepdf.com/reader/full/the-effects-of-fuel-additives-on-diesel-engine-emissions-during-steady-state 57/163
gross
i
SOC i
gross ,i
Q
dQ
mfb∑=
==
θ
θ (3-9)
3.8.1.9 In-Cylinder Gas Temperature
The uniform or mean gas temperature in the cylinder can be calculated at each crank angle by
making the ideal gas assumption with a known reference location and temperature such as at
inlet valve closure. Since pollutant formation, especially NOx, is a function of temperature, the
mean cylinder temperature was a useful variable to analyze. Szybist and coworkers [48] showed
a relationship between NOx emissions and the location of maximum cylinder temperature that
was not dependent on fuel type when testing conventional diesel, biodiesel (B20, B40, and
B100), or FT fuels (FT20, FT40, FT100).
The method for calculation of the mean cylinder gas temperature was done by rearranging the
ideal gas equation for any crank angle with gas temperature on the left side (Equation 3-10). The
ideal gas equation at inlet valve closure was rearranged to give Equation 3-11. By assuming that
the molecular weight does not vary significantly during combustion, the two equations (Equation
3-10 and Equation 3-11) are combined into Equation 3-12, resulting in the mean cylinder gas
temperature being a function of known quantities.
⎟ ⎠
⎞⎜⎝
⎛ =
R*n
1*V * P T θ θ θ (3-10)
⎟ ⎠
⎞⎜⎝
⎛ =
R*n
1
V * P
T
IVC IVC
IVC (3-11)
⎟⎟ ⎠
⎞⎜⎜⎝
⎛ =
IVC IVC
IVC
V * P
T *V * P T θ θ θ (3-12)
3.8.1.10 Premix Fraction
As mentioned in the Literature review section, the heat release rate may be divided into two
parts: the premix and diffusion sections. Particular interest with combustion studies has been the
premix section. The end of the premix section has been defined as the dip after the premix spike
38
8/23/2019 The Effects of Fuel Additives on Diesel Engine Emissions During Steady State and Transient Operation
http://slidepdf.com/reader/full/the-effects-of-fuel-additives-on-diesel-engine-emissions-during-steady-state 58/163
leading to the diffusion section (Figure 2-2). The summation of the heat released during the
premix section to the total heat released was the premix fraction.
3.8.1.11 Air Flow Rate
Fuel-to-air ratio strongly influences combustion conditions. From the intake air flow and the
fuel flow, a fuel-to-air ratio was calculated. The combustion-based intake air flow (Equation
3-13) was compared to the laboratory laminar flow element (LFE) measured (Equation 3-14)
intake air flow as a quality check. The in-cylinder pressure-based engine intake flow at standard
conditions was calculated, assuming a volumetric efficiency (nv), with engine speed (C E ), engine
displacement (V D), MAP, and manifold air temperature ( MAT ) using Equation 3-13. The
revolutions per cycle (R S) is a conversion for the number of revolutions per combustion cycle.
For a 4-stroke engine, the R S value is two, and for a 2-stroke engine, the value is one. The LFEconsisted of a tube bundle creating laminar flow (low Reynolds number). The pressure drop
across the element was measured and corrected to standard conditions. The LFE (Equation 3-14)
has constants B and C with known standard conditions (μstd, Pstd, and Tstd) and measured fluid
conditions (Pf , Tf , and μf calculated from Tf ).
⎟ ⎠
⎞⎜⎝
⎛ ⎟⎟ ⎠
⎞⎜⎜⎝
⎛ =
MAT
T *
P
MAP *
R
V *n*nQ std
std S
DS V
akeint & (3-13)
( ) ⎟⎟ ⎠
⎞
⎜⎜⎝
⎛
⎟⎟ ⎠
⎞⎜⎜⎝
⎛
⎟⎟ ⎠
⎞
⎜⎜⎝
⎛ +=
f
std
std
f
f
std 2akeint
T T *
P
P **dP *C dP * BQ
μ μ & (3-14)
3.8.1.12 Ratio of Pressure at Exhaust Valve Opening to Intake Valve Closing
The boost pressure provided by the turbocharger changes the pressure inside the cylinder, which
alters the created power. The turbocharger provides greater boost as the exhaust pressure
increases. When the engine transitions from low to high load, the exhaust pressure is low, but
the engine is commanded to increase the power. Large amounts of fuel are injected and the
exhaust pressure increases, creating higher turbocharger speeds and more boost, but a time delay,
or turbocharger “lag,” is created from the sudden engine demand of the turbocharger to the actual
boost created. The ratio of the exhaust pressure at exhaust valve opening to intake valve closing
(or MAP in this study’s case) showed the current boost ratio. The boost ratio provided an
indication of load change. Steady state conditions and transient operation at the same engine
39
8/23/2019 The Effects of Fuel Additives on Diesel Engine Emissions During Steady State and Transient Operation
http://slidepdf.com/reader/full/the-effects-of-fuel-additives-on-diesel-engine-emissions-during-steady-state 59/163
speed and load condition may have different boost ratios due to the turbocharger lag. The
cylinder boost ratio provided another parameter based on the heat release.
3.8.1.13 Fuel Conversion Efficiency
To investigate whether the cetane improver additives used in this study changed the efficiency of
combustion, the fuel conversion efficiency was calculated (Equation 3-15). The fuel conversion
efficiency provided how much power was converted from the energy in the fuel for each
combustion event. The fuel flow and power were from the in-cylinder combustion-based
parameters.
LHV *m
Power n
fuel
eff &
= (3-15)
3.8.1.14 Heat Release Approximation
Mathematical representations of the heat release curve include the double Weibe function [81]
and the polygon-hyperbola combustion profile [82]. This study used the double Weibe function,
since this function includes combustion parameters studied in this work as shown in Equation
3-16. By fitting the experimental heat release curve to the double Weibe function using a least
squares method, a continuous curve was reduced to six constants. The equation includes a
premix and a diffusion portion. With a = 6.908, this assumes a conversion efficiency of 99.9%
of the fuel energy to heat. The eight fitting parameters are the premix portion heat released (Q p),
shape parameter (m p), start of combustion (θsoc,p), length of combustion ( Δθ p), diffusion portion
heat released (Qd), shape parameter (md), start of combustion (θsoc,d), and length of combustion
( Δθd). The start of combustion (θsoc,p and θsoc,d) was determined before the least square
approximation routine, resulting in six fitting parameters.
( )
( )⎥⎥
⎦
⎤
⎢⎢
⎣
⎡
⎟⎟ ⎠
⎞⎜⎜⎝
⎛ −−⎟
⎟ ⎠
⎞⎜⎜⎝
⎛ −++
⎥⎥⎦
⎤
⎢⎢⎣
⎡
⎟⎟ ⎠
⎞
⎜⎜⎝
⎛ −−⎟⎟
⎠
⎞
⎜⎜⎝
⎛ −+=
⎥⎦
⎤⎢⎣
⎡
+
+
1m
d ,c
d , soc
m
d ,c
d , soc
d d
1m
p ,c
p , soc
m
p ,c
p , soc p p
gross
d d
p p
aexp1maQ
aexp1maQ
d
dQ
θ Δ
θ θ
θ Δ
θ θ
θ Δθ θ
θ Δθ θ
θ
(3-16)
40
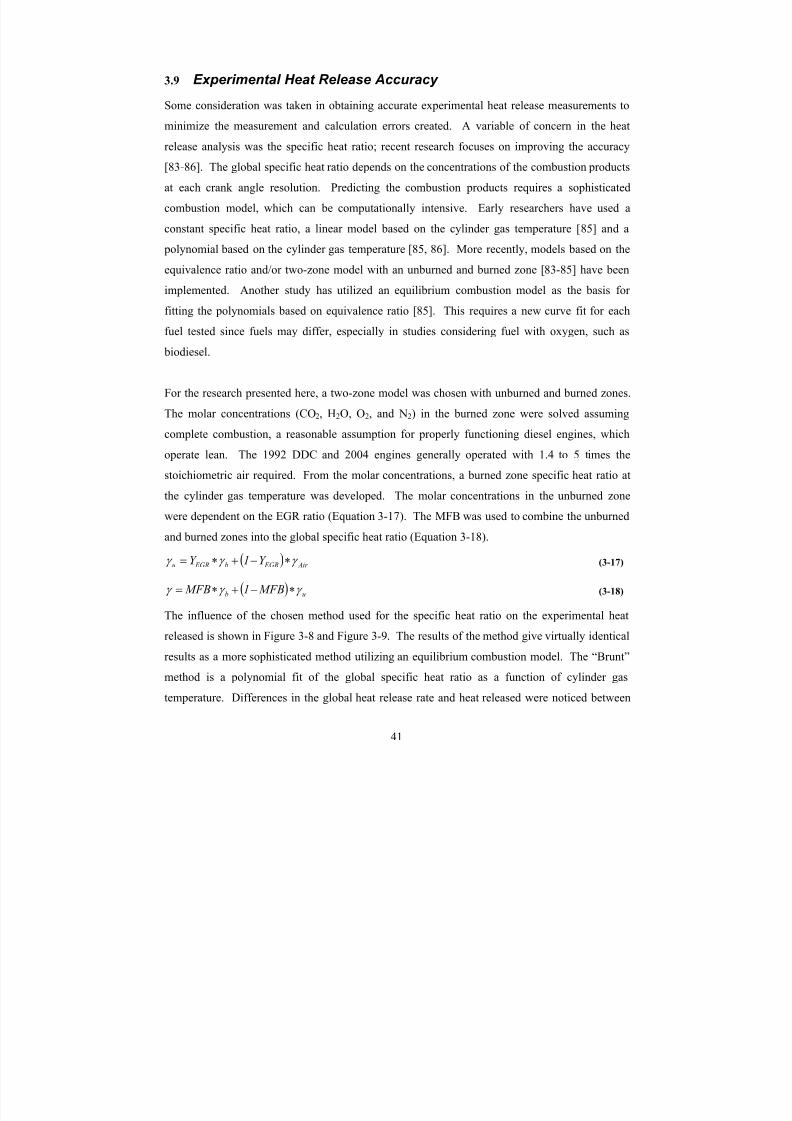
8/23/2019 The Effects of Fuel Additives on Diesel Engine Emissions During Steady State and Transient Operation
http://slidepdf.com/reader/full/the-effects-of-fuel-additives-on-diesel-engine-emissions-during-steady-state 60/163
3.9 Experimental Heat Release Accuracy
Some consideration was taken in obtaining accurate experimental heat release measurements to
minimize the measurement and calculation errors created. A variable of concern in the heat
release analysis was the specific heat ratio; recent research focuses on improving the accuracy[83-86]. The global specific heat ratio depends on the concentrations of the combustion products
at each crank angle resolution. Predicting the combustion products requires a sophisticated
combustion model, which can be computationally intensive. Early researchers have used a
constant specific heat ratio, a linear model based on the cylinder gas temperature [85] and a
polynomial based on the cylinder gas temperature [85, 86]. More recently, models based on the
equivalence ratio and/or two-zone model with an unburned and burned zone [83-85] have been
implemented. Another study has utilized an equilibrium combustion model as the basis for
fitting the polynomials based on equivalence ratio [85]. This requires a new curve fit for each
fuel tested since fuels may differ, especially in studies considering fuel with oxygen, such as
biodiesel.
For the research presented here, a two-zone model was chosen with unburned and burned zones.
The molar concentrations (CO2, H2O, O2, and N2) in the burned zone were solved assuming
complete combustion, a reasonable assumption for properly functioning diesel engines, which
operate lean. The 1992 DDC and 2004 engines generally operated with 1.4 to 5 times thestoichiometric air required. From the molar concentrations, a burned zone specific heat ratio at
the cylinder gas temperature was developed. The molar concentrations in the unburned zone
were dependent on the EGR ratio (Equation 3-17). The MFB was used to combine the unburned
and burned zones into the global specific heat ratio (Equation 3-18).
( ) Air EGRb EGRu Y 1Y γ γ γ ∗−+∗= (3-17)
( ) ub MFB1 MFB γ γ γ ∗−+∗= (3-18)
The influence of the chosen method used for the specific heat ratio on the experimental heat
released is shown in Figure 3-8 and Figure 3-9. The results of the method give virtually identical
results as a more sophisticated method utilizing an equilibrium combustion model. The “Brunt”
method is a polynomial fit of the global specific heat ratio as a function of cylinder gas
temperature. Differences in the global heat release rate and heat released were noticed between
41
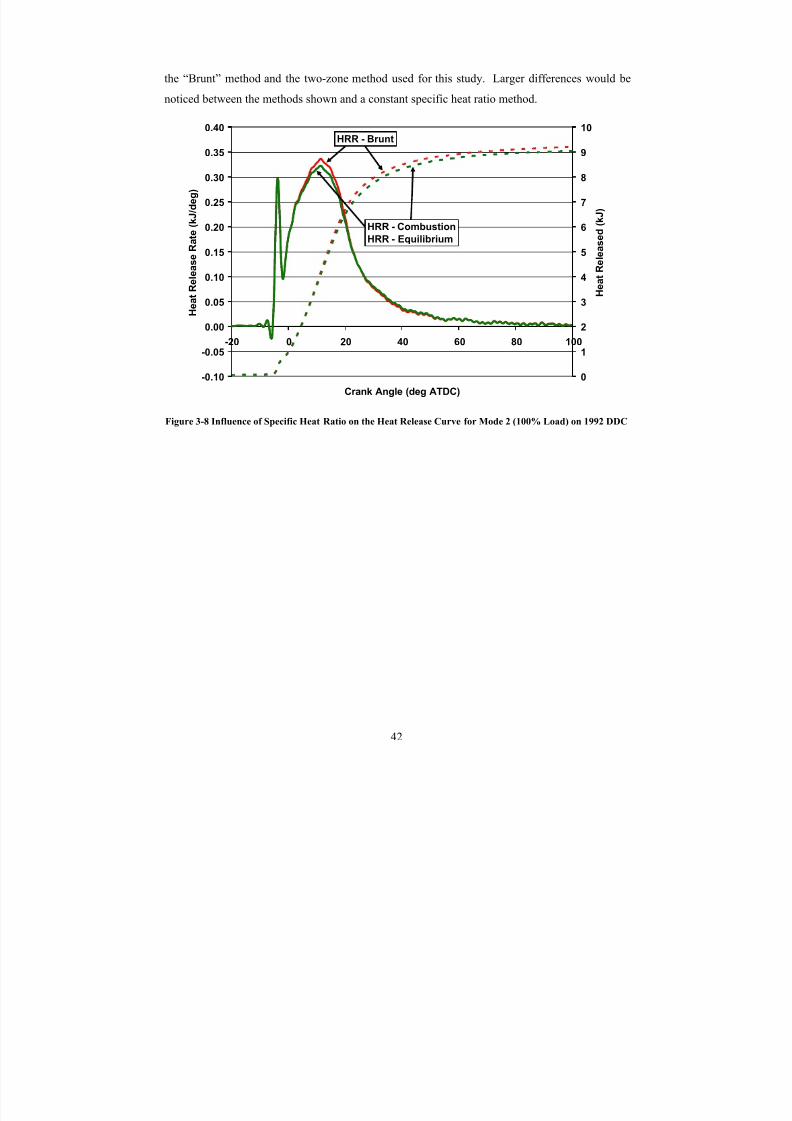
8/23/2019 The Effects of Fuel Additives on Diesel Engine Emissions During Steady State and Transient Operation
http://slidepdf.com/reader/full/the-effects-of-fuel-additives-on-diesel-engine-emissions-during-steady-state 61/163
the “Brunt” method and the two-zone method used for this study. Larger differences would be
noticed between the methods shown and a constant specific heat ratio method.
-0.10
-0.05
0.00
0.05
0.10
0.15
0.20
0.25
0.30
0.35
0.40
-20 0 20 40 60 80 100
Crank Angle (deg ATDC)
H e a
t R e l e a s e R a t e ( k J / d e g )
0
1
2
3
4
5
6
7
8
9
10
H e a t R e l e a s e d ( k J )
HRR - Brunt
HRR - Combustion
HRR - Equilibrium
Figure 3-8 Influence of Specific Heat Ratio on the Heat Release Curve for Mode 2 (100% Load) on 1992 DDC
42
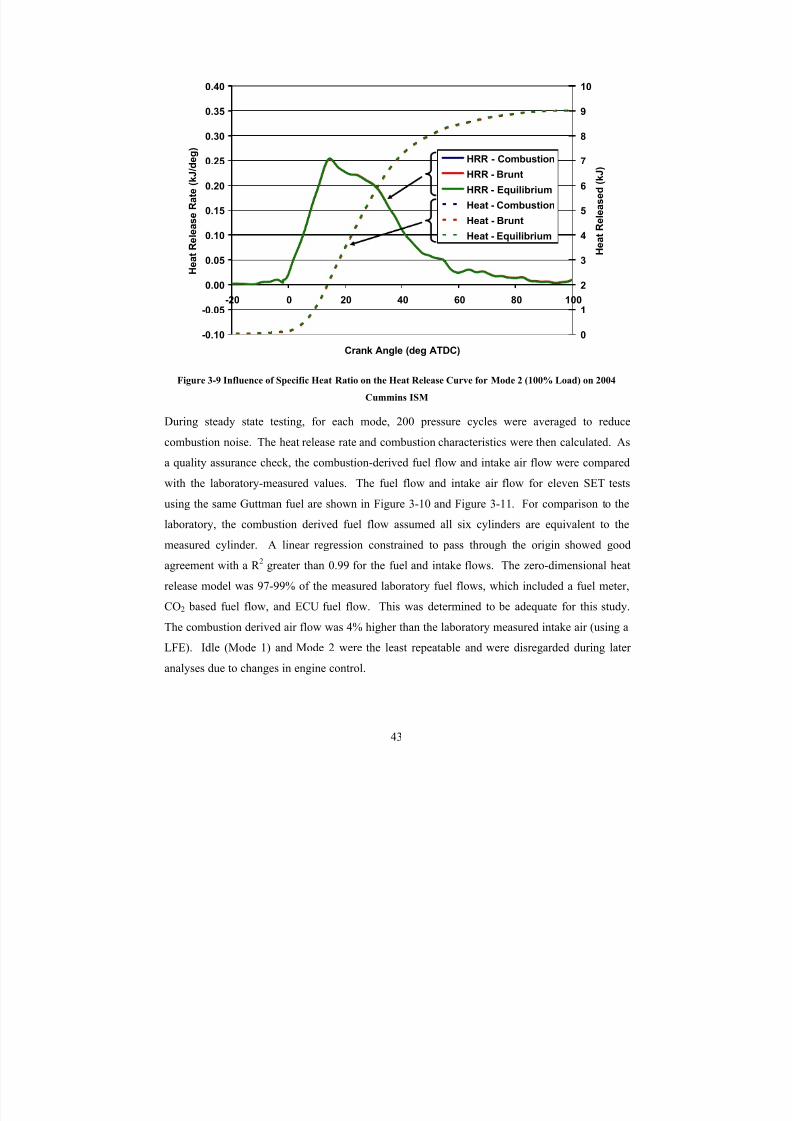
8/23/2019 The Effects of Fuel Additives on Diesel Engine Emissions During Steady State and Transient Operation
http://slidepdf.com/reader/full/the-effects-of-fuel-additives-on-diesel-engine-emissions-during-steady-state 62/163
-0.10
-0.05
0.00
0.05
0.10
0.15
0.20
0.25
0.30
0.35
0.40
-20 0 20 40 60 80 100
Crank Angle (deg ATDC)
H e a t R e l e a s e R a t e ( k J / d e g )
0
1
2
3
4
5
6
7
8
9
10
H e a t R e l e a s e d ( k J )
HRR - Combustion
HRR - Brunt
HRR - Equilibrium
Heat - Combustion
Heat - Brunt
Heat - Equilibrium
Figure 3-9 Influence of Specific Heat Ratio on the Heat Release Curve for Mode 2 (100% Load) on 2004
Cummins ISM
During steady state testing, for each mode, 200 pressure cycles were averaged to reduce
combustion noise. The heat release rate and combustion characteristics were then calculated. As
a quality assurance check, the combustion-derived fuel flow and intake air flow were compared
with the laboratory-measured values. The fuel flow and intake air flow for eleven SET tests
using the same Guttman fuel are shown in Figure 3-10 and Figure 3-11. For comparison to the
laboratory, the combustion derived fuel flow assumed all six cylinders are equivalent to the
measured cylinder. A linear regression constrained to pass through the origin showed good
agreement with a R 2 greater than 0.99 for the fuel and intake flows. The zero-dimensional heat
release model was 97-99% of the measured laboratory fuel flows, which included a fuel meter,
CO2 based fuel flow, and ECU fuel flow. This was determined to be adequate for this study.The combustion derived air flow was 4% higher than the laboratory measured intake air (using a
LFE). Idle (Mode 1) and Mode 2 were the least repeatable and were disregarded during later
analyses due to changes in engine control.
43
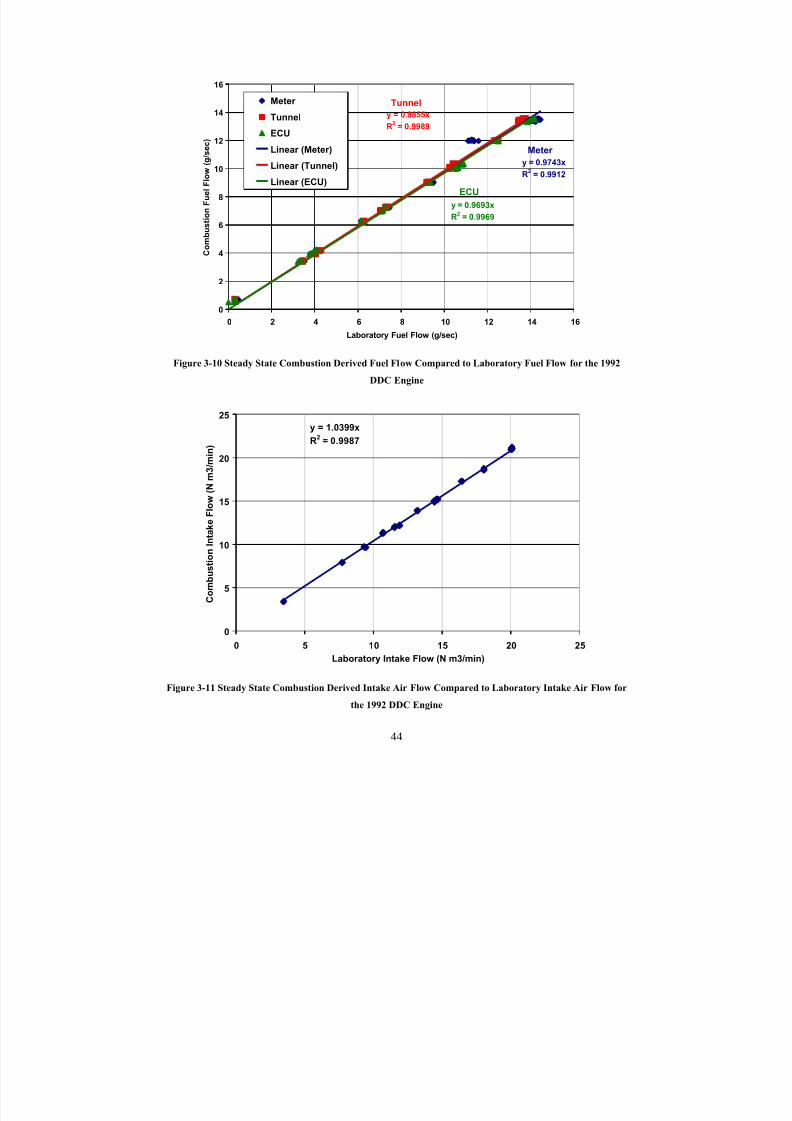
8/23/2019 The Effects of Fuel Additives on Diesel Engine Emissions During Steady State and Transient Operation
http://slidepdf.com/reader/full/the-effects-of-fuel-additives-on-diesel-engine-emissions-during-steady-state 63/163
y = 0.9743x
R2
= 0.9912
y = 0.9855x
R2
= 0.9989
y = 0.9693x
R2
= 0.9969
0
2
4
6
8
10
12
14
16
0 2 4 6 8 10 12 14 16
Laboratory Fuel Flow (g/sec)
C o m b u s t i o n F u e l F l o w
( g / s e c )
Meter Tunnel
Tunnel
ECU
Linear (Meter)Linear (Tunnel)
Linear (ECU)
Meter
ECU
Figure 3-10 Steady State Combustion Derived Fuel Flow Compared to Laboratory Fuel Flow for the 1992
DDC Engine
y = 1.0399x
R2
= 0.9987
0
5
10
15
20
25
0 5 10 15 20 25
Laboratory Intake Flow (N m3/min)
C o m b u s t i o n I n t a k e F l o w
( N m 3 / m i n )
Figure 3-11 Steady State Combustion Derived Intake Air Flow Compared to Laboratory Intake Air Flow for
the 1992 DDC Engine
44
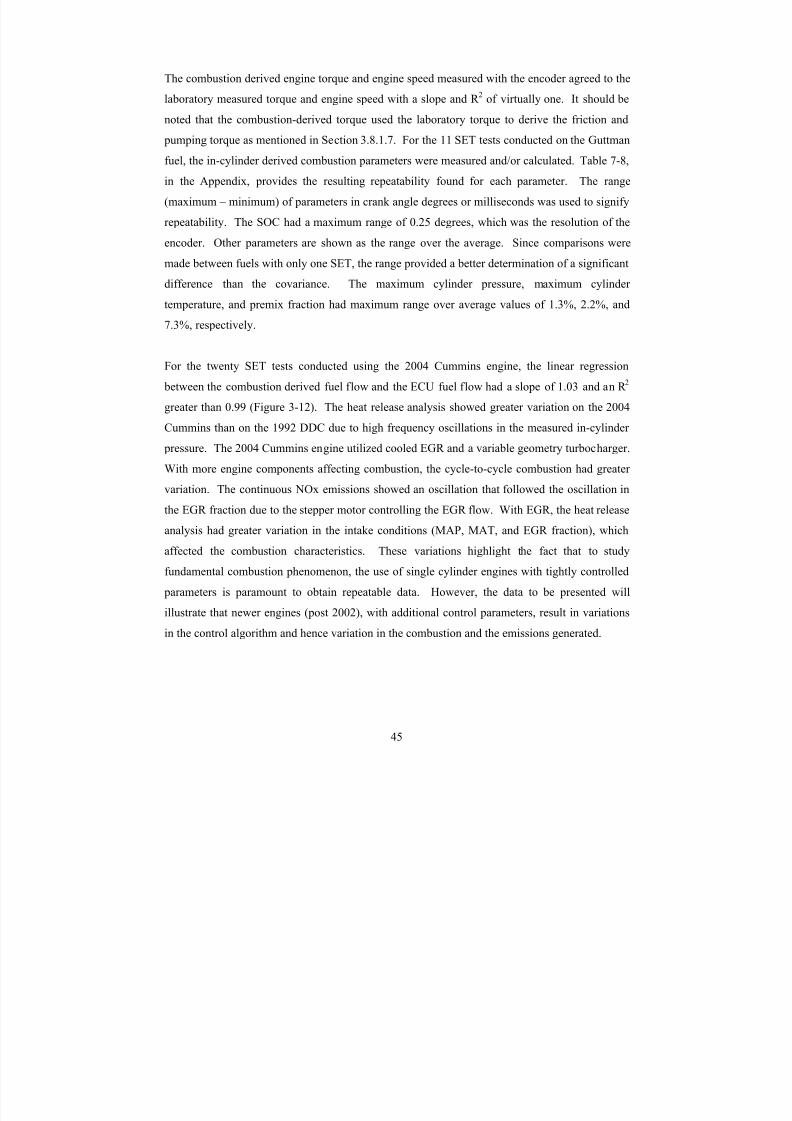
8/23/2019 The Effects of Fuel Additives on Diesel Engine Emissions During Steady State and Transient Operation
http://slidepdf.com/reader/full/the-effects-of-fuel-additives-on-diesel-engine-emissions-during-steady-state 64/163
The combustion derived engine torque and engine speed measured with the encoder agreed to the
laboratory measured torque and engine speed with a slope and R 2 of virtually one. It should be
noted that the combustion-derived torque used the laboratory torque to derive the friction and
pumping torque as mentioned in Section 3.8.1.7. For the 11 SET tests conducted on the Guttman
fuel, the in-cylinder derived combustion parameters were measured and/or calculated. Table 7-8,
in the Appendix, provides the resulting repeatability found for each parameter. The range
(maximum – minimum) of parameters in crank angle degrees or milliseconds was used to signify
repeatability. The SOC had a maximum range of 0.25 degrees, which was the resolution of the
encoder. Other parameters are shown as the range over the average. Since comparisons were
made between fuels with only one SET, the range provided a better determination of a significant
difference than the covariance. The maximum cylinder pressure, maximum cylinder
temperature, and premix fraction had maximum range over average values of 1.3%, 2.2%, and7.3%, respectively.
For the twenty SET tests conducted using the 2004 Cummins engine, the linear regression
between the combustion derived fuel flow and the ECU fuel flow had a slope of 1.03 and an R 2
greater than 0.99 (Figure 3-12). The heat release analysis showed greater variation on the 2004
Cummins than on the 1992 DDC due to high frequency oscillations in the measured in-cylinder
pressure. The 2004 Cummins engine utilized cooled EGR and a variable geometry turbocharger.
With more engine components affecting combustion, the cycle-to-cycle combustion had greater
variation. The continuous NOx emissions showed an oscillation that followed the oscillation in
the EGR fraction due to the stepper motor controlling the EGR flow. With EGR, the heat release
analysis had greater variation in the intake conditions (MAP, MAT, and EGR fraction), which
affected the combustion characteristics. These variations highlight the fact that to study
fundamental combustion phenomenon, the use of single cylinder engines with tightly controlled
parameters is paramount to obtain repeatable data. However, the data to be presented will
illustrate that newer engines (post 2002), with additional control parameters, result in variations
in the control algorithm and hence variation in the combustion and the emissions generated.
45
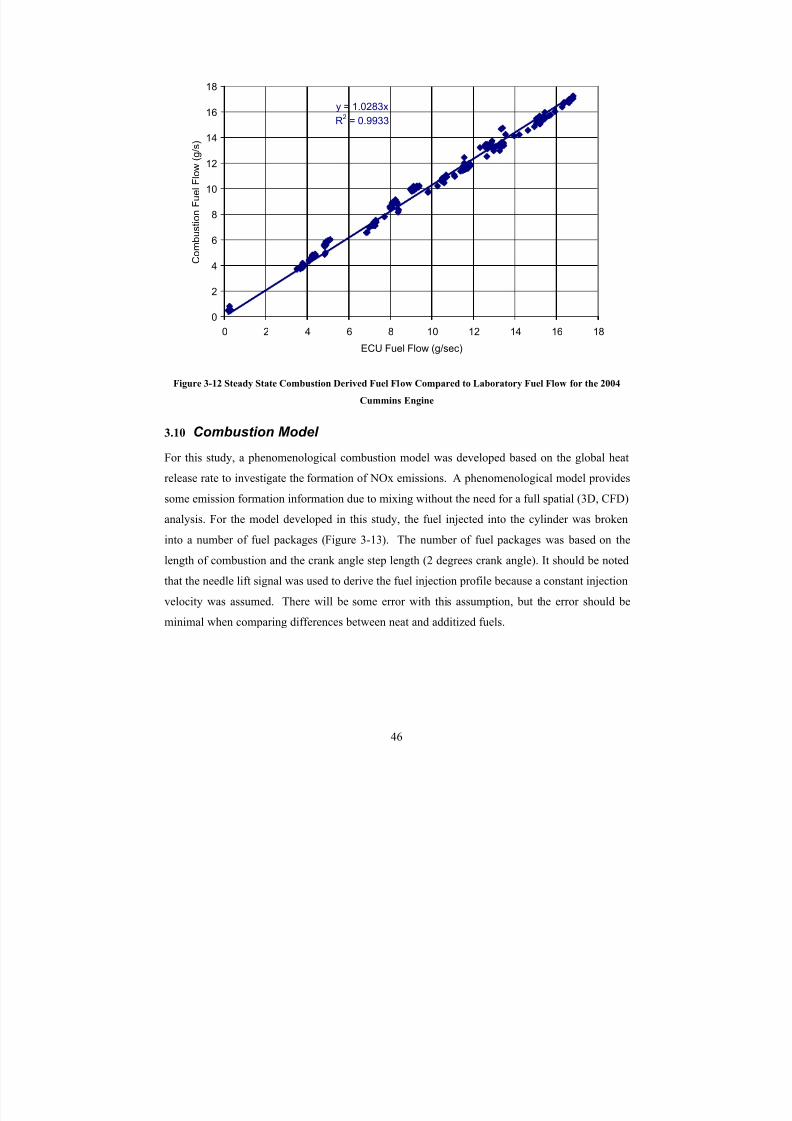
8/23/2019 The Effects of Fuel Additives on Diesel Engine Emissions During Steady State and Transient Operation
http://slidepdf.com/reader/full/the-effects-of-fuel-additives-on-diesel-engine-emissions-during-steady-state 65/163
y = 1.0283x
R2
= 0.9933
0
2
4
6
8
10
12
14
16
18
0 2 4 6 8 10 12 14 16 1
ECU Fuel Flow (g/sec)
C o m b u s t i o n F u e l F l o w ( g /
s )
8
Figure 3-12 Steady State Combustion Derived Fuel Flow Compared to Laboratory Fuel Flow for the 2004
Cummins Engine
3.10 Combustion Model
For this study, a phenomenological combustion model was developed based on the global heat
release rate to investigate the formation of NOx emissions. A phenomenological model provides
some emission formation information due to mixing without the need for a full spatial (3D, CFD)
analysis. For the model developed in this study, the fuel injected into the cylinder was broken
into a number of fuel packages (Figure 3-13). The number of fuel packages was based on the
length of combustion and the crank angle step length (2 degrees crank angle). It should be noted
that the needle lift signal was used to derive the fuel injection profile because a constant injection
velocity was assumed. There will be some error with this assumption, but the error should beminimal when comparing differences between neat and additized fuels.
46
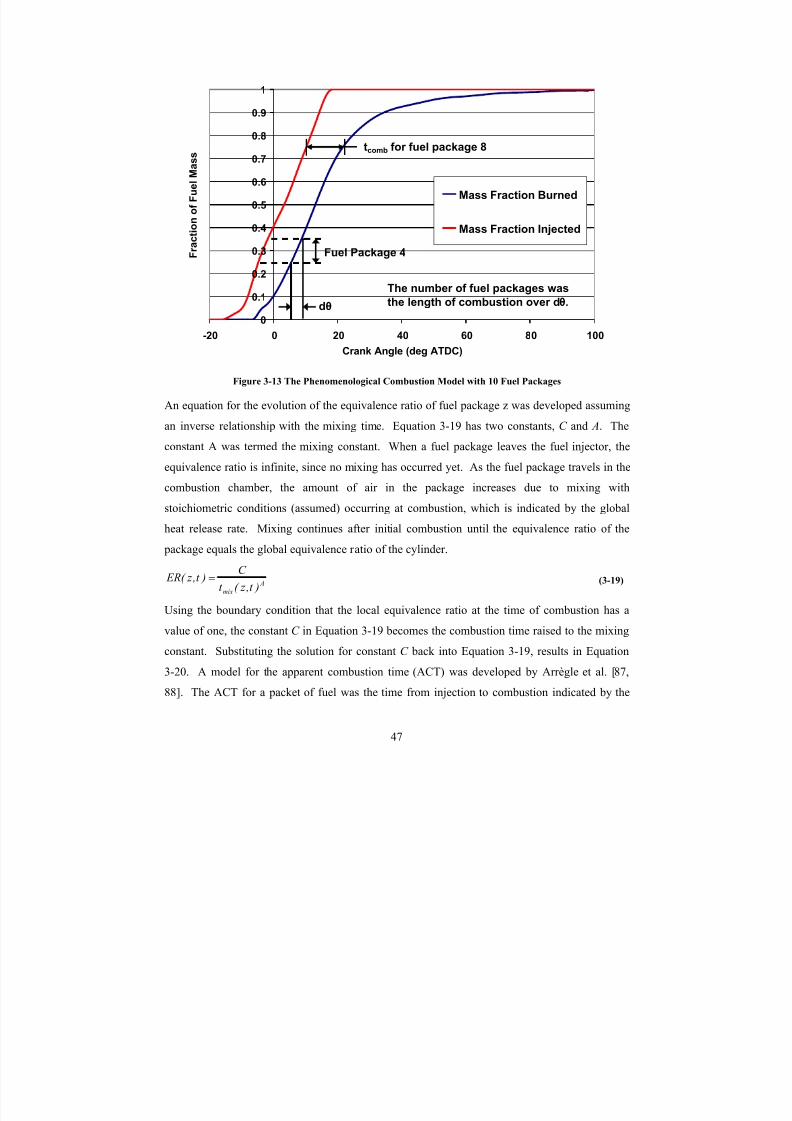
8/23/2019 The Effects of Fuel Additives on Diesel Engine Emissions During Steady State and Transient Operation
http://slidepdf.com/reader/full/the-effects-of-fuel-additives-on-diesel-engine-emissions-during-steady-state 66/163
0
0.1
0.2
0.3
0.4
0.5
0.6
0.7
0.8
0.9
1
-20 0 20 40 60 80 100
Crank Angle (deg ATDC)
F r a c t i o n o f F u e l M a s s
Mass Fraction Burned
Mass Fraction Injected
tcomb for fuel package 8
dθ
Fuel Package 4
The number of fuel packages was
the length of combustion over dθ.
Figure 3-13 The Phenomenological Combustion Model with 10 Fuel Packages
An equation for the evolution of the equivalence ratio of fuel package z was developed assuming
an inverse relationship with the mixing time. Equation 3-19 has two constants, C and A. The
constant A was termed the mixing constant. When a fuel package leaves the fuel injector, the
equivalence ratio is infinite, since no mixing has occurred yet. As the fuel package travels in the
combustion chamber, the amount of air in the package increases due to mixing with
stoichiometric conditions (assumed) occurring at combustion, which is indicated by the global
heat release rate. Mixing continues after initial combustion until the equivalence ratio of the
package equals the global equivalence ratio of the cylinder.
A
mix )t , z ( t
C )t , z ( ER = (3-19)
Using the boundary condition that the local equivalence ratio at the time of combustion has a
value of one, the constant C in Equation 3-19 becomes the combustion time raised to the mixing
constant. Substituting the solution for constant C back into Equation 3-19, results in Equation
3-20. A model for the apparent combustion time (ACT) was developed by Arrègle et al. [87,
88]. The ACT for a packet of fuel was the time from injection to combustion indicated by the
47
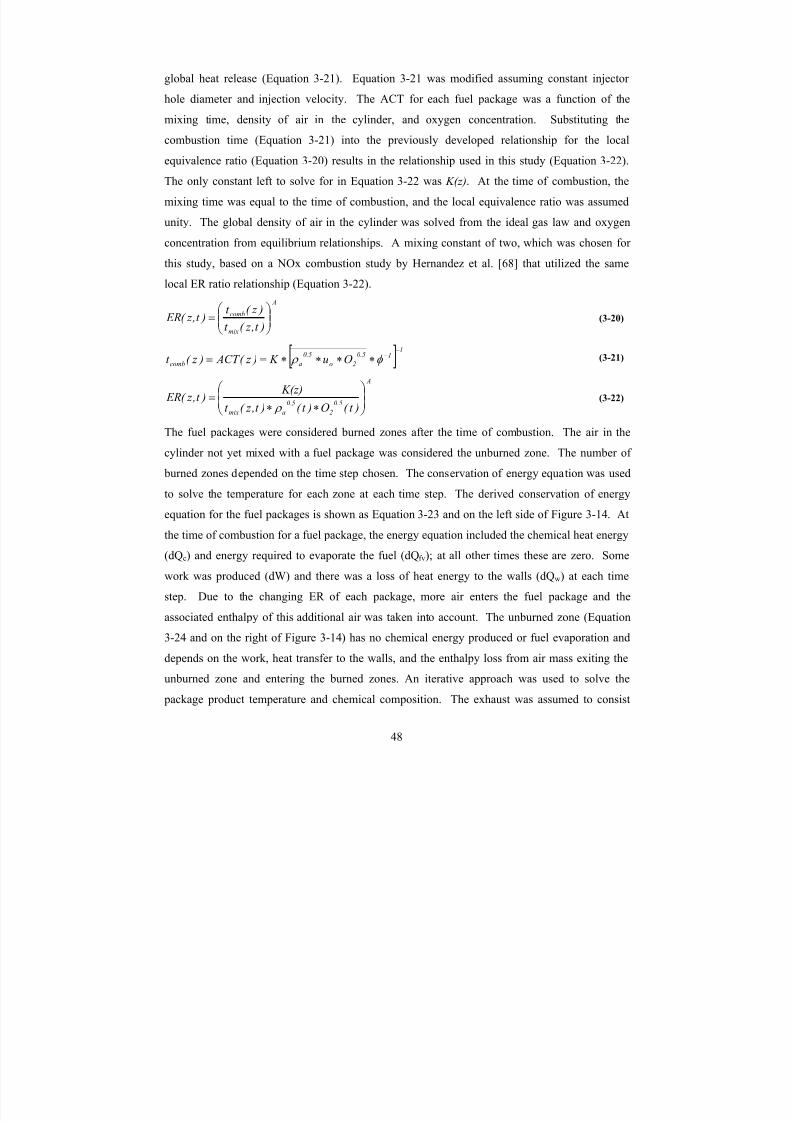
8/23/2019 The Effects of Fuel Additives on Diesel Engine Emissions During Steady State and Transient Operation
http://slidepdf.com/reader/full/the-effects-of-fuel-additives-on-diesel-engine-emissions-during-steady-state 67/163
global heat release (Equation 3-21). Equation 3-21 was modified assuming constant injector
hole diameter and injection velocity. The ACT for each fuel package was a function of the
mixing time, density of air in the cylinder, and oxygen concentration. Substituting the
combustion time (Equation 3-21) into the previously developed relationship for the local
equivalence ratio (Equation 3-20) results in the relationship used in this study (Equation 3-22).
The only constant left to solve for in Equation 3-22 was K(z). At the time of combustion, the
mixing time was equal to the time of combustion, and the local equivalence ratio was assumed
unity. The global density of air in the cylinder was solved from the ideal gas law and oxygen
concentration from equilibrium relationships. A mixing constant of two, which was chosen for
this study, based on a NOx combustion study by Hernandez et al. [68] that utilized the same
local ER ratio relationship (Equation 3-22).
A
mix
comb
)t , z ( t
) z ( t )t , z ( ER ⎟⎟
⎠
⎞⎜⎜⎝
⎛ = (3-20)
[ ] 115.0
2o
5.0
acomb Ou K ) z ( ACT ) z ( t −
−∗∗∗∗== φ ρ (3-21)
)t ( O )t ( )t , z ( t
K(z) )t , z ( ER
A
5.0
2
5.0
amix⎟⎟
⎠
⎞
⎜⎜
⎝
⎛
∗∗=
ρ (3-22)
The fuel packages were considered burned zones after the time of combustion. The air in the
cylinder not yet mixed with a fuel package was considered the unburned zone. The number of burned zones depended on the time step chosen. The conservation of energy equation was used
to solve the temperature for each zone at each time step. The derived conservation of energy
equation for the fuel packages is shown as Equation 3-23 and on the left side of Figure 3-14. At
the time of combustion for a fuel package, the energy equation included the chemical heat energy
(dQc) and energy required to evaporate the fuel (dQfv); at all other times these are zero. Some
work was produced (dW) and there was a loss of heat energy to the walls (dQ w) at each time
step. Due to the changing ER of each package, more air enters the fuel package and the
associated enthalpy of this additional air was taken into account. The unburned zone (Equation
3-24 and on the right of Figure 3-14) has no chemical energy produced or fuel evaporation and
depends on the work, heat transfer to the walls, and the enthalpy loss from air mass exiting the
unburned zone and entering the burned zones. An iterative approach was used to solve the
package product temperature and chemical composition. The exhaust was assumed to consist
48
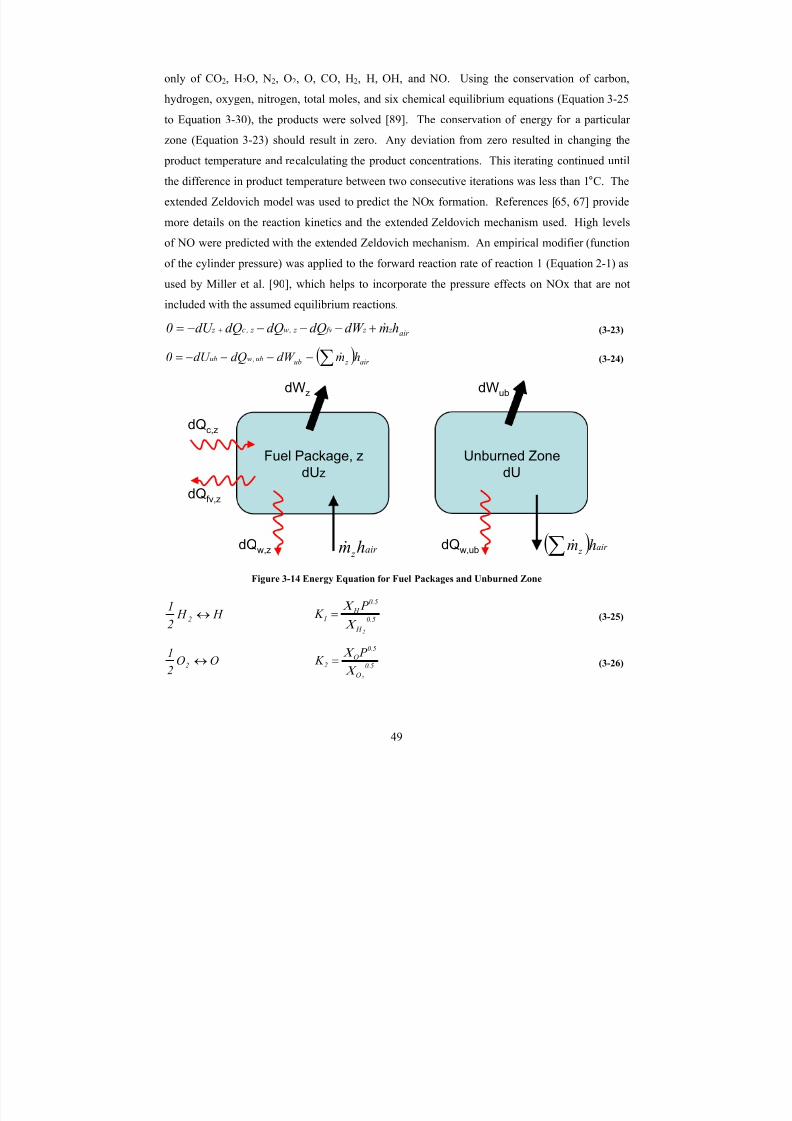
8/23/2019 The Effects of Fuel Additives on Diesel Engine Emissions During Steady State and Transient Operation
http://slidepdf.com/reader/full/the-effects-of-fuel-additives-on-diesel-engine-emissions-during-steady-state 68/163
only of CO2, H2O, N2, O2, O, CO, H2, H, OH, and NO. Using the conservation of carbon,
hydrogen, oxygen, nitrogen, total moles, and six chemical equilibrium equations (Equation 3-25
to Equation 3-30), the products were solved [89]. The conservation of energy for a particular
zone (Equation 3-23) should result in zero. Any deviation from zero resulted in changing the
product temperature and recalculating the product concentrations. This iterating continued until
the difference in product temperature between two consecutive iterations was less than 1°C. The
extended Zeldovich model was used to predict the NOx formation. References [65, 67] provide
more details on the reaction kinetics and the extended Zeldovich mechanism used. High levels
of NO were predicted with the extended Zeldovich mechanism. An empirical modifier (function
of the cylinder pressure) was applied to the forward reaction rate of reaction 1 (Equation 2-1) as
used by Miller et al. [90], which helps to incorporate the pressure effects on NOx that are not
included with the assumed equilibrium reactions.
air z z fv z ,w z ,c z hmdW dQdQdQdU 0 &+−−−−= + (3-23)
( )air z ubub ,wub hmdW dQdU 0 ∑−−−−= & (3-24)
Fuel Package, zdUz
Unburned ZonedU
dQfv,z
dQw,z air z hm& ( ) air z hm∑ &dQw,ub
dWz dWub
dQc,z
Figure 3-14 Energy Equation for Fuel Packages and Unburned Zone
H H 21
2 ↔ 5.0
H
5.0
H 1
2
P K Χ Χ = (3-25)
OO2
12 ↔ 5.0
O
5.0
O2
2
P K
Χ
Χ = (3-26)
49

8/23/2019 The Effects of Fuel Additives on Diesel Engine Emissions During Steady State and Transient Operation
http://slidepdf.com/reader/full/the-effects-of-fuel-additives-on-diesel-engine-emissions-during-steady-state 69/163
OH O2
1 H
2
122 ↔+
5.0
O
5.0
H
OH
3
22
K Χ Χ
Χ = (3-27)
NO N 2
1O
2
122 ↔+ 5.0
O
5.0
N
NO4
22
K Χ Χ
Χ = (3-28)
O H O2
1 H 222 ↔+
5.05.0
O H
O H
5 P
K
22
2
Χ Χ
Χ = (3-29)
22COO
2
1CO ↔+
5.05.0
OCO
CO
6
P K
2
2
Χ Χ
Χ = (3-30)
50
8/23/2019 The Effects of Fuel Additives on Diesel Engine Emissions During Steady State and Transient Operation
http://slidepdf.com/reader/full/the-effects-of-fuel-additives-on-diesel-engine-emissions-during-steady-state 70/163
4 Results and Discussions
This research examined the combustion characteristics and resulting emissions formation of fuels
with additives from heavy-duty diesel engines through in-cylinder pressure analysis and
emission measurement. The emissions results consisted of modal steady state tests and
integrated transient tests. In-cylinder pressure was collected for each mode during steady state
testing and for each combustion cycle during transient testing. Using the heat release calculated
from the in-cylinder pressure, a combustion model of the emissions formation was developed to
aid the understanding of the significance of the change in global heat release due to additizing
neat fuels. These results will be presented in this section. The data presentation has been
divided between the two different engines and by different test campaigns.
4.1 Emissions
The three additives tested were 2-EHN, DTBP, and ODA. Multiple concentrations of the
additives were tested with different base fuels. To compare different fuel-additive combinations,
a T-test with a p-value < 0.05 was used to establish statistical significance between the means
with difference variances. The FTP test typically consisted of a sample size of three hot starts
per fuel; although some tests had up to five repeat runs. Repeat steady state testing was limited
due to fuel constraints, so a sample size of one was typical for the steady state testing. Some
steady state tests had repeats (two tests). Only one base fuel and one additized fuel had three
tests, allowing a statistical significance for each mode. These tests were used to draw statistical
significance criteria. The single steady state tests were used for trends or possible conclusions,
but without the confidence of a statistical analysis. The focus was on NOx emissions due to the
difficulty of reducing NOx, while maintaining the same fuel economy. Typically, reducing NOx
means lower combustion temperatures, which result in lower fuel economy.
4.1.1 1992 DDC Series 60 Engine
For the January 2007 testing on the 1992 DDC engine, CP Cert, Grad Ref, and Grad Cand were
the three base fuels tested. A NOx reduction was achieved on the FTP cycle with the use of
additives (Table 7-9). For each additized base fuel, a statistical significant NOx reduction (2.2-
3.6%) was noticed. The emissions of CO, HC, and TPM were significantly reduced as well. The
51

8/23/2019 The Effects of Fuel Additives on Diesel Engine Emissions During Steady State and Transient Operation
http://slidepdf.com/reader/full/the-effects-of-fuel-additives-on-diesel-engine-emissions-during-steady-state 71/163
achieved reductions were 5.8-9.3%, 10.9-19.8%, and 4.3–6.6%, for CO, HC, and TPM,
respectively. For the CP Cert fuel additized with 12ml/gal ODA, a 1% increase in TPM was
found.
For the Grad Ref fuel additized with 16 ml/gal ODA, three repeat SET tests were conducted
allowing a Student’s T-test for statistical significance (Figure 4-1) for NO and NOx. Mode 0
was the cycle weighted emissions and mode 1* was the mass emissions at idle (grams/hr). At
100% load (modes 2, 8, and 10), NOx increased by 1.3-1.6% with respect to the neat fuel, while
at 25% load (modes 7, 9, and 11), NOx decreased by 4.2-5.6%.
-7%
-6%
-5%
-4%
-3%
-2%
-1%
0%
1%
2%
3%
0 1* 2 3 4 5 6 7 8 9 10 11 12 13
Modes
C h a n g e i n N O x f r o m N e a t F u e l
NOx NOx2 NO
Figure 4-1 Change in Brake Specific NOx for Grad Ref Fuel Additized with 16ml/gal ODA Compared to Neat
Fuel for Steady State Modes on the 1992 DDC (No Column indicates no significant difference). NOx –
Primary NOx Analyzer, NOx2 – Secondary NOx Analyzer, NO – From Secondary NO Analyzer
The FTP test consists of the engine being exercised over many different speeds and loads, as
mentioned in Section 3.5, with the emissions integrated over the entire cycle. Depending on the
mode, as shown in Figure 4-1, NOx decreased or increased. The percent reductions of emissions
from the additized fuel results are then dependent on the test cycle. With the FTP test cycle
primarily at low load, NOx would show a greater reduction than for a high load test cycle. As
52
8/23/2019 The Effects of Fuel Additives on Diesel Engine Emissions During Steady State and Transient Operation
http://slidepdf.com/reader/full/the-effects-of-fuel-additives-on-diesel-engine-emissions-during-steady-state 72/163
illustrated in Figure 4-1, the two NOx analyzers demonstrated similar changes. The NO
reduction was comparable to the NOx reduction, indicating that there is no significant NO2
production due to the additive.
Based on the outcome from the January 2007 tests, additional testing was conducted in June
2007, with one base fuel, named Low Cetane, which indicated the lowest cetane number (46.2)
of the base fuels tested. A single treat rate of DTBP and three different treat rates of 2-EHN,
ODA3 (ODA version 3), and ODANS (ODA with a new formulation) were tested. On the FTP
cycle, all treat rates and additives showed a significant difference in CO, NOx, and HC compared
to the neat fuel. The emissions of CO decreased 5-8.9%, NOx decreased 2.6-4.9%, and HC
decreased 16.7-37% (Table 7-10). Statistically significant differences in work, BSFC, and CO2
were noticed for some tests, although the changes were small (less than 0.5%).
With increasing treat rates from 3 to 8ml/gal, 2-EHN showed a NOx decrease at 25% load of
approximately 3.1%, while at 100% load a NOx increase of 0.6% was found (Figure 4-2). The
primary mechanism of increasing 2-EHN concentrations on NOx reduction was prominent at low
load with less influence at high load. Idle (Mode 1*) was not shown in the figure, due to the
low accuracy of the sampling system and variability of combustion (no fuel injected into the
cylinder) for this mode. For Mode 2, the Low Cetane fuel had low NOx on the primary NOx
analyzer, which then caused a high percent NOx increases for Mode 1 and the weighted
emissions (Mode 0). It should be noted that the June 2007 testing only consisted of a single SET
test. The Student’s T-test requires at least two tests, so a statistical analysis was not performed.
53
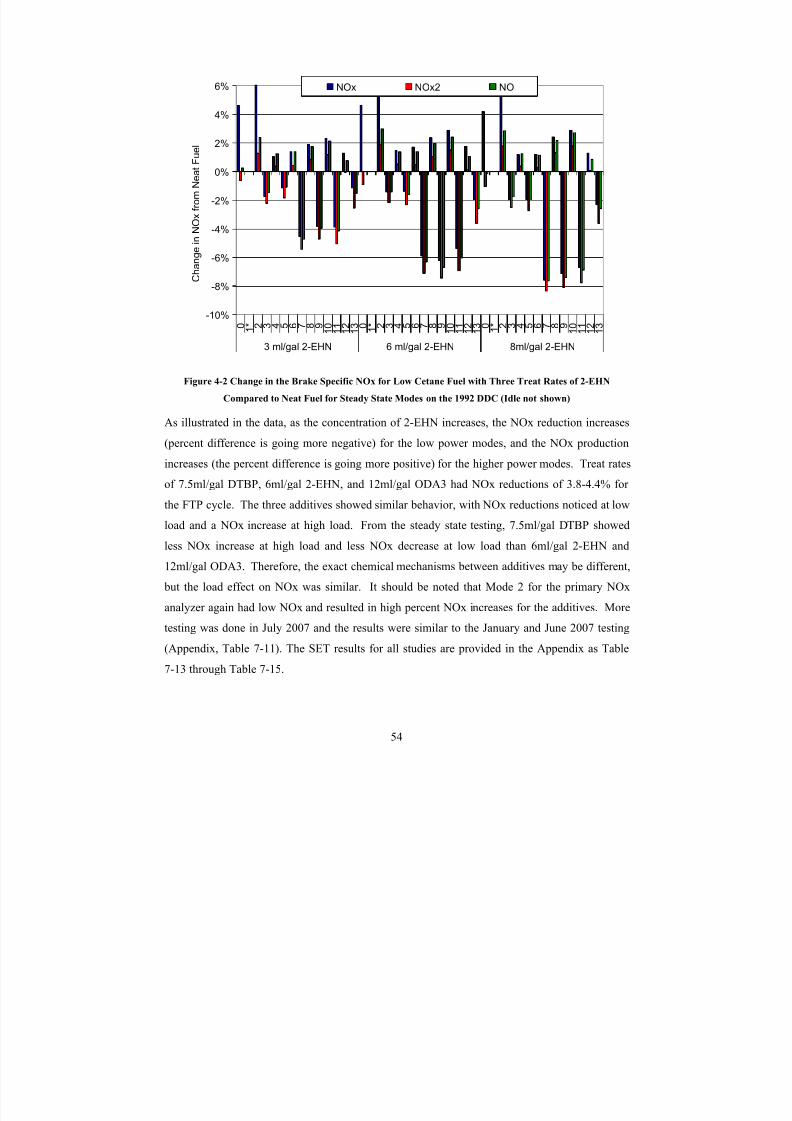
8/23/2019 The Effects of Fuel Additives on Diesel Engine Emissions During Steady State and Transient Operation
http://slidepdf.com/reader/full/the-effects-of-fuel-additives-on-diesel-engine-emissions-during-steady-state 73/163
-10%
-8%
-6%
-4%
-2%
0%
2%
4%
6%
0 1 * 2 3 4 5 6 7 8 9
1 0 1 1 1 2 1 3 0 1
* 2 3 4 5 6 7 8 9 1 0 1 1 1 2 1 3 0 1
* 2 3 4 5 6 7 8 9 1 0 1 1 1 2 1 3
3 ml/gal 2-EHN 6 ml/gal 2-EHN 8ml/gal 2-EHN
C h a n g e i n N O x f r o m N e a t F u e
l
NOx NOx2 NO
Figure 4-2 Change in the Brake Specific NOx for Low Cetane Fuel with Three Treat Rates of 2-EHN
Compared to Neat Fuel for Steady State Modes on the 1992 DDC (Idle not shown)
As illustrated in the data, as the concentration of 2-EHN increases, the NOx reduction increases
(percent difference is going more negative) for the low power modes, and the NOx production
increases (the percent difference is going more positive) for the higher power modes. Treat rates
of 7.5ml/gal DTBP, 6ml/gal 2-EHN, and 12ml/gal ODA3 had NOx reductions of 3.8-4.4% for
the FTP cycle. The three additives showed similar behavior, with NOx reductions noticed at low
load and a NOx increase at high load. From the steady state testing, 7.5ml/gal DTBP showed
less NOx increase at high load and less NOx decrease at low load than 6ml/gal 2-EHN and
12ml/gal ODA3. Therefore, the exact chemical mechanisms between additives may be different,
but the load effect on NOx was similar. It should be noted that Mode 2 for the primary NOx
analyzer again had low NOx and resulted in high percent NOx increases for the additives. Moretesting was done in July 2007 and the results were similar to the January and June 2007 testing
(Appendix, Table 7-11). The SET results for all studies are provided in the Appendix as Table
7-13 through Table 7-15.
54
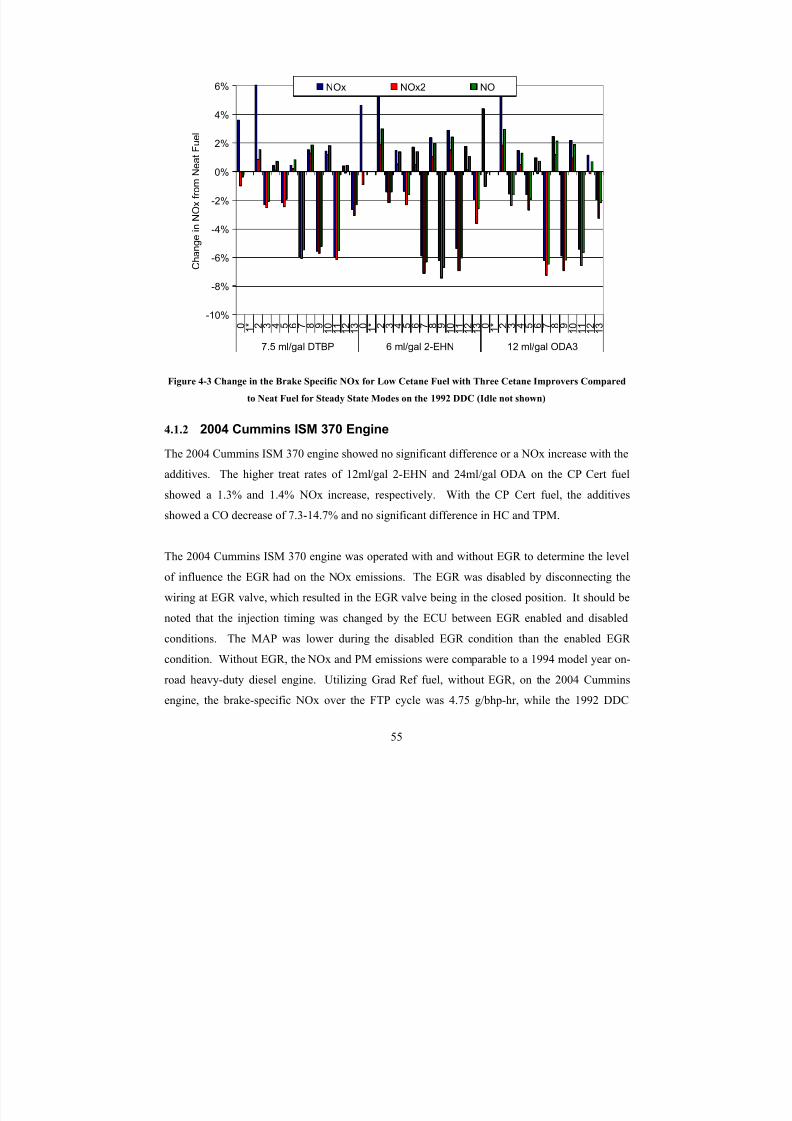
8/23/2019 The Effects of Fuel Additives on Diesel Engine Emissions During Steady State and Transient Operation
http://slidepdf.com/reader/full/the-effects-of-fuel-additives-on-diesel-engine-emissions-during-steady-state 74/163
-10%
-8%
-6%
-4%
-2%
0%
2%
4%
6%
0 1 * 2 3 4 5 6 7 8 9
1 0 1 1 1 2 1 3 0 1
* 2 3 4 5 6 7 8 9 1 0 1 1 1 2 1 3 0 1
* 2 3 4 5 6 7 8 9 1 0 1 1 1 2 1 3
7.5 ml/gal DTBP 6 ml/gal 2-EHN 12 ml/gal ODA3
C h a n g e i n N O x f r o m N e a t F
u e l
NOx NOx2 NO
Figure 4-3 Change in the Brake Specific NOx for Low Cetane Fuel with Three Cetane Improvers Compared
to Neat Fuel for Steady State Modes on the 1992 DDC (Idle not shown)
4.1.2 2004 Cummins ISM 370 Engine
The 2004 Cummins ISM 370 engine showed no significant difference or a NOx increase with theadditives. The higher treat rates of 12ml/gal 2-EHN and 24ml/gal ODA on the CP Cert fuel
showed a 1.3% and 1.4% NOx increase, respectively. With the CP Cert fuel, the additives
showed a CO decrease of 7.3-14.7% and no significant difference in HC and TPM.
The 2004 Cummins ISM 370 engine was operated with and without EGR to determine the level
of influence the EGR had on the NOx emissions. The EGR was disabled by disconnecting the
wiring at EGR valve, which resulted in the EGR valve being in the closed position. It should be
noted that the injection timing was changed by the ECU between EGR enabled and disabled
conditions. The MAP was lower during the disabled EGR condition than the enabled EGR
condition. Without EGR, the NOx and PM emissions were comparable to a 1994 model year on-
road heavy-duty diesel engine. Utilizing Grad Ref fuel, without EGR, on the 2004 Cummins
engine, the brake-specific NOx over the FTP cycle was 4.75 g/bhp-hr, while the 1992 DDC
55
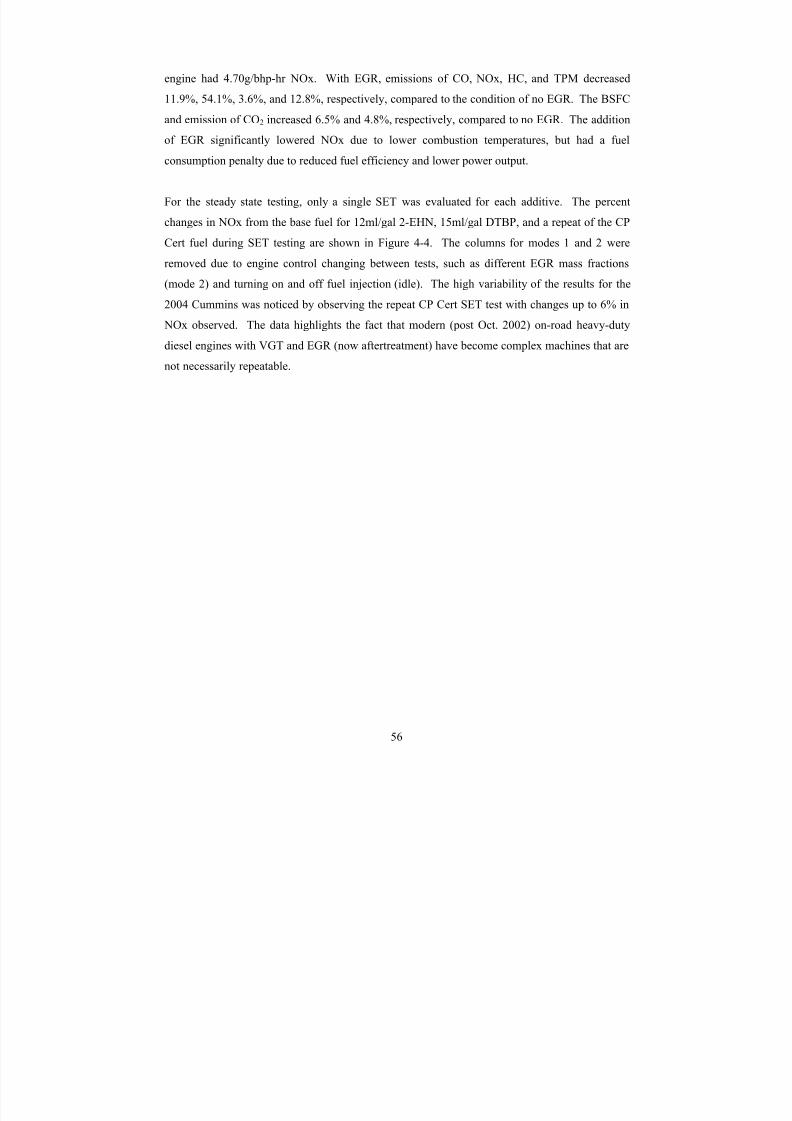
8/23/2019 The Effects of Fuel Additives on Diesel Engine Emissions During Steady State and Transient Operation
http://slidepdf.com/reader/full/the-effects-of-fuel-additives-on-diesel-engine-emissions-during-steady-state 75/163
engine had 4.70g/bhp-hr NOx. With EGR, emissions of CO, NOx, HC, and TPM decreased
11.9%, 54.1%, 3.6%, and 12.8%, respectively, compared to the condition of no EGR. The BSFC
and emission of CO2 increased 6.5% and 4.8%, respectively, compared to no EGR. The addition
of EGR significantly lowered NOx due to lower combustion temperatures, but had a fuel
consumption penalty due to reduced fuel efficiency and lower power output.
For the steady state testing, only a single SET was evaluated for each additive. The percent
changes in NOx from the base fuel for 12ml/gal 2-EHN, 15ml/gal DTBP, and a repeat of the CP
Cert fuel during SET testing are shown in Figure 4-4. The columns for modes 1 and 2 were
removed due to engine control changing between tests, such as different EGR mass fractions
(mode 2) and turning on and off fuel injection (idle). The high variability of the results for the
2004 Cummins was noticed by observing the repeat CP Cert SET test with changes up to 6% in NOx observed. The data highlights the fact that modern (post Oct. 2002) on-road heavy-duty
diesel engines with VGT and EGR (now aftertreatment) have become complex machines that are
not necessarily repeatable.
56

8/23/2019 The Effects of Fuel Additives on Diesel Engine Emissions During Steady State and Transient Operation
http://slidepdf.com/reader/full/the-effects-of-fuel-additives-on-diesel-engine-emissions-during-steady-state 76/163
-6%
-4%
-2%
0%
2%
4%
6%
8%
10%
0 1 * 2 3 4 5 6 7 8 9
1 0 1 1 1 2 1 3 0 1
* 2 3 4 5 6 7 8 9 1 0 1 1 1 2 1 3 0 1
* 2 3 4 5 6 7 8 9 1 0 1 1 1 2 1 3
12ml/gal 2EHN 15ml/gal DTBP Neat
C h a n g e i n N O x R e l a t i v e t o N e
a t F u e l
NOx NOx2 NO
Figure 4-4 Change in the Brake Specific NOx for CP Cert Fuel with Two Cetane Improvers and a Repeat
Neat Fuel Compared to the Neat Fuel for Steady State Modes on the 2004 Cummins ISM 370 (Idle and Mode
2 not shown)
To test the influence of EGR on the additive, the EGR valve was enabled and disabled for the
neat and additized Grad Ref fuels (Figure 4-5). On average, the NOx increased approximately
1.7% with the EGR enabled, with most modes showing a NOx increase of up to 4%. With the
EGR disabled, NOx had no change, but some modes showed a slight NOx increase (~1%) and
others a slight NOx decrease (~1%). With disabled EGR, the neat fuel produced emissions
similar to the 1992 DDC Series 60 engine, but the addition of cetane improver had little
influence on emissions. It should be noted that other research done at WVU on a 1999 Cummins
engine also showed little response to cetane improvers [69]. The 1999 Cummins did not have
EGR.
57
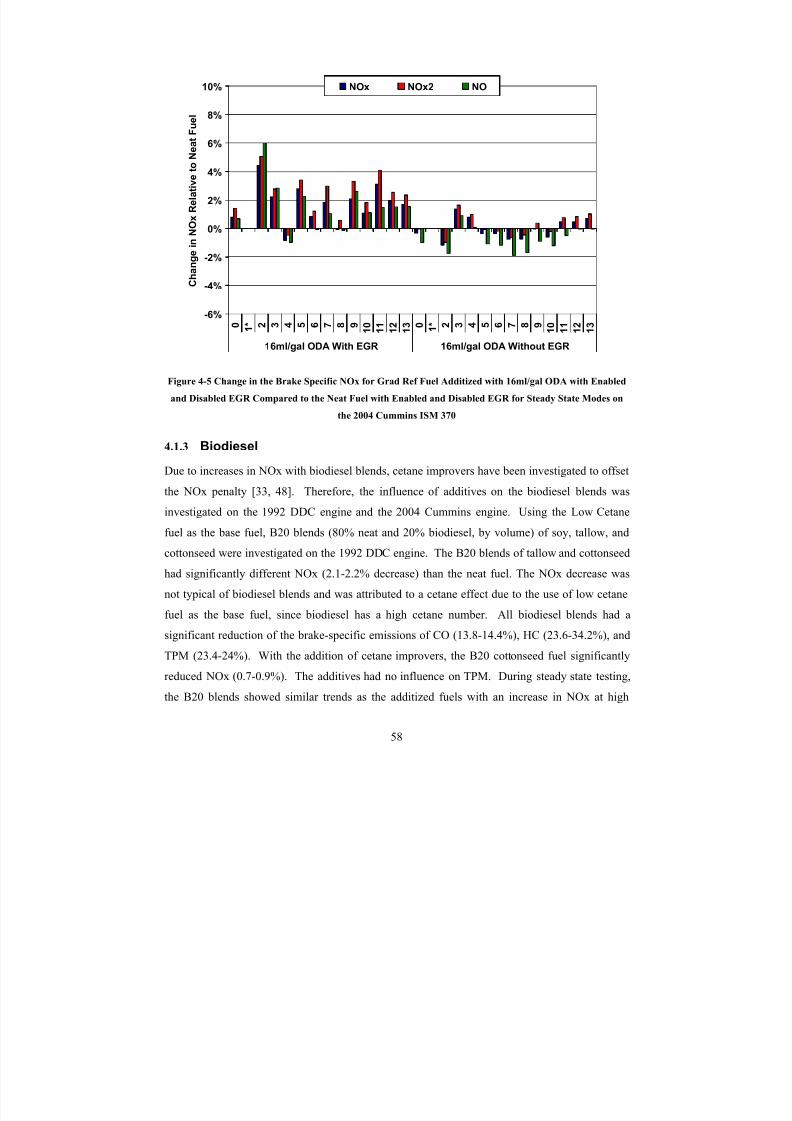
8/23/2019 The Effects of Fuel Additives on Diesel Engine Emissions During Steady State and Transient Operation
http://slidepdf.com/reader/full/the-effects-of-fuel-additives-on-diesel-engine-emissions-during-steady-state 77/163
-6%
-4%
-2%
0%
2%
4%
6%
8%
10%
0 1 * 2 3 4 5 6 7 8 9
1 0 1 1 1 2 1 3 0 1
* 2 3 4 5 6 7 8 9 1 0 1 1 1 2 1 3
16ml/gal ODA With EGR 16ml/gal ODA Without EGR
C h a n g e i n N O x R e l a t i v e t o N e
a t F u e l
NOx NOx2 NO
Figure 4-5 Change in the Brake Specific NOx for Grad Ref Fuel Additized with 16ml/gal ODA with Enabled
and Disabled EGR Compared to the Neat Fuel with Enabled and Disabled EGR for Steady State Modes on
the 2004 Cummins ISM 370
4.1.3 Biodiesel
Due to increases in NOx with biodiesel blends, cetane improvers have been investigated to offset
the NOx penalty [33, 48]. Therefore, the influence of additives on the biodiesel blends was
investigated on the 1992 DDC engine and the 2004 Cummins engine. Using the Low Cetane
fuel as the base fuel, B20 blends (80% neat and 20% biodiesel, by volume) of soy, tallow, and
cottonseed were investigated on the 1992 DDC engine. The B20 blends of tallow and cottonseed
had significantly different NOx (2.1-2.2% decrease) than the neat fuel. The NOx decrease was
not typical of biodiesel blends and was attributed to a cetane effect due to the use of low cetane
fuel as the base fuel, since biodiesel has a high cetane number. All biodiesel blends had a
significant reduction of the brake-specific emissions of CO (13.8-14.4%), HC (23.6-34.2%), and
TPM (23.4-24%). With the addition of cetane improvers, the B20 cottonseed fuel significantly
reduced NOx (0.7-0.9%). The additives had no influence on TPM. During steady state testing,
the B20 blends showed similar trends as the additized fuels with an increase in NOx at high
58
8/23/2019 The Effects of Fuel Additives on Diesel Engine Emissions During Steady State and Transient Operation
http://slidepdf.com/reader/full/the-effects-of-fuel-additives-on-diesel-engine-emissions-during-steady-state 78/163
loads and a decrease in NOx at low loads (Figure 4-6). By adding 6ml/gal 2-EHN to the B20
cottonseed fuel, the NOx increase and decrease for each mode was greater in magnitude, relative
to the unadditized B20 cottonseed fuel.
-15%
-10%
-5%
0%
5%
10%
15%
0 1 * 2 3 4 5 6 7 8 9
1 0 1 1 1 2 1 3 0 1
* 2 3 4 5 6 7 8 9 1 0 1 1 1 2 1 3 0 1
* 2 3 4 5 6 7 8 9 1 0 1 1 1 2 1 3
B20 Cottonseed Neat 6 ml/gal 2-EHN
C h a n g e i n
N O x R e l a t i v e t o N e a t F u e l
NOx NOx2
Figure 4-6 Change in the Brake Specific NOx for Low Cetane Fuel with B20 Cottonseed, Repeat Low Cetane
Fuel, and Additized B20 Cottonseed Blend Compared to the Neat Fuel for Steady State Modes on the 1992
DDC Engine
With the 2004 Cummins ISM 370 engine results, Table 7-12in Appendix, the B20 blends
significantly increased NOx (2.8-4.3%) and decreased CO (9.8-10.7%), HC (12-14.3%), and
TPM (23.2-34.7%) compared to the neat fuel. Both the 1992 DDC and the 2004 Cummins had
decreased CO, HC, and TPM, while NOx decreased for the 1992 DDC and increased for the
2004 Cummins. The base diesel fuel used on the B20 blends for the 2004 Cummins was the CP
Cert fuel, which had a cetane number of 49.9. The Low Cetane fuel used as the base fuel on the1992 DDC engine had a cetane number of 46.2. Another difference between the engines was
their cetane response. The addition of cetane improvers had little effect on the 2004 Cummins
engine. For the biodiesel blends, NOx showed an increase relative to the neat fuel during each
mode, as seen in Figure 4-7. The addition of 10ml/gal DTBP to the B20 soy showed no
significant difference in NOx on the FTP cycle compared to the B20 Soy. The steady state
59
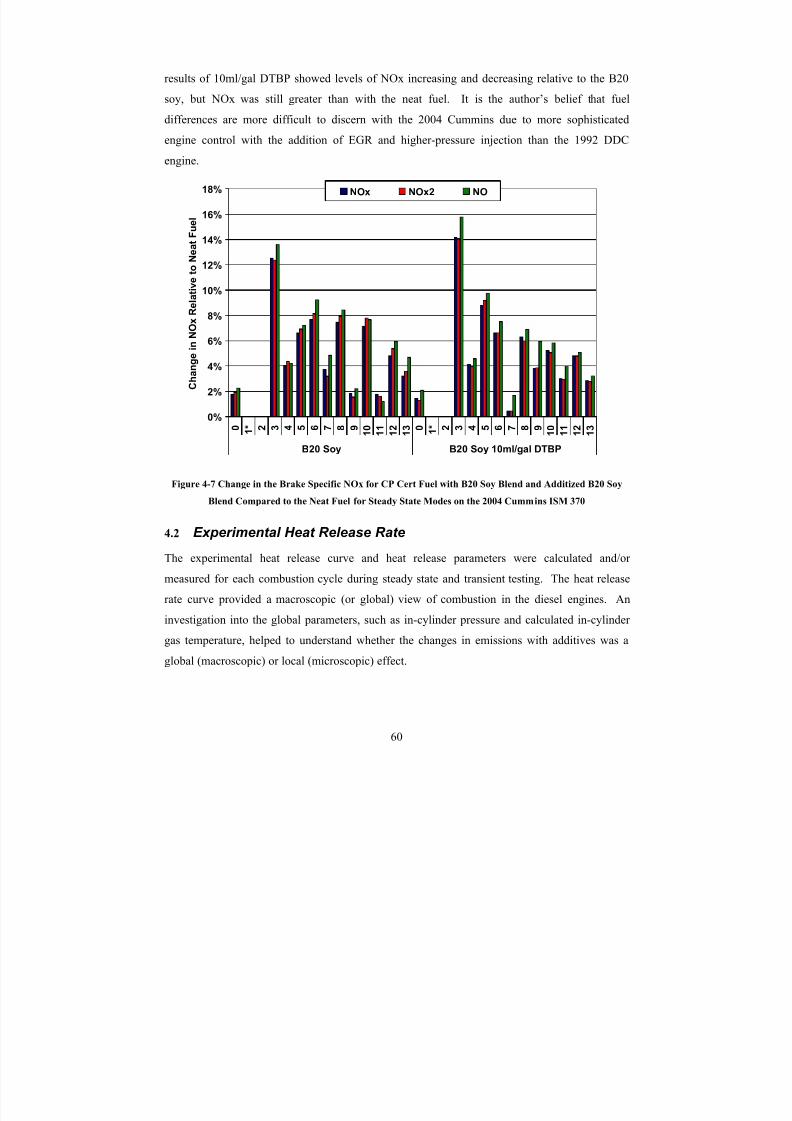
8/23/2019 The Effects of Fuel Additives on Diesel Engine Emissions During Steady State and Transient Operation
http://slidepdf.com/reader/full/the-effects-of-fuel-additives-on-diesel-engine-emissions-during-steady-state 79/163
results of 10ml/gal DTBP showed levels of NOx increasing and decreasing relative to the B20
soy, but NOx was still greater than with the neat fuel. It is the author’s belief that fuel
differences are more difficult to discern with the 2004 Cummins due to more sophisticated
engine control with the addition of EGR and higher-pressure injection than the 1992 DDC
engine.
0%
2%
4%
6%
8%
10%
12%
14%
16%
18%
0 1 * 2 3 4 5 6 7 8 9
1 0 1 1 1 2 1 3 0 1
* 2 3 4 5 6 7 8 9 1 0 1 1 1 2 1 3
B20 Soy B20 Soy 10ml/gal DTBP
C h a n g e i n N O x R e l a t i v e t o N e a t F u e l
NOx NOx2 NO
Figure 4-7 Change in the Brake Specific NOx for CP Cert Fuel with B20 Soy Blend and Additized B20 Soy
Blend Compared to the Neat Fuel for Steady State Modes on the 2004 Cummins ISM 370
4.2 Experimental Heat Release Rate
The experimental heat release curve and heat release parameters were calculated and/or
measured for each combustion cycle during steady state and transient testing. The heat release
rate curve provided a macroscopic (or global) view of combustion in the diesel engines. An
investigation into the global parameters, such as in-cylinder pressure and calculated in-cylinder
gas temperature, helped to understand whether the changes in emissions with additives was a
global (macroscopic) or local (microscopic) effect.
60

8/23/2019 The Effects of Fuel Additives on Diesel Engine Emissions During Steady State and Transient Operation
http://slidepdf.com/reader/full/the-effects-of-fuel-additives-on-diesel-engine-emissions-during-steady-state 80/163
4.2.1 1992 DDC Engine Heat Release
From the experimental heat release rate curve during steady state testing, the ignition improver
decreases ignition delay and the premix spike. Figure 4-8 and Figure 4-9 show a high and low
load mode, respectively, with increasing levels of 2-EHN. At low load, the premix spike was
more substantial than at high load, and referring back to the prior NOx emission plots, low load
was where NOx reduction was noticed. At the high loads, either no NOx change or an increase
in NOx was observed. The noticeable differences between neat fuel and additized fuels occurred
earlier in the heat release rate with the later section of diffusion burning being close to identical.
After 15 crank angle degrees from the SOC, the heat release rate curves were identical between
additized and neat fuels for mode 9 and after 25 degrees for mode 8. The premix spike is related
to the amount of fuel injected before the start of combustion. With cetane improvers causing an
earlier SOC, the premix spike was reduced, although the premix fraction may be similar between
the neat and additized fuel. The reduction of the premix fraction provided by cetane improvers
(or natural cetane) has been demonstrated by other researchers [12-15].
-0.1
0
0.1
0.2
0.3
0.4
0.5
0.6
-15 -10 -5 0 5 10 15 20
Crank Angle (deg ATDC)
H e a t R e l e a s e R a t e ( k J / d e g )
LC 3ml/gal 2-EHN 6ml/gal 2-EHN 8ml/gal 2-EHN
- Increased Ignition Improver
- Earlier Combustion
- Decreased Premix Spike
Figure 4-8 Heat Release for Mode 8 (100% Load) with Varying Amounts of 2-EHN on the 1992 DDC Engine
61
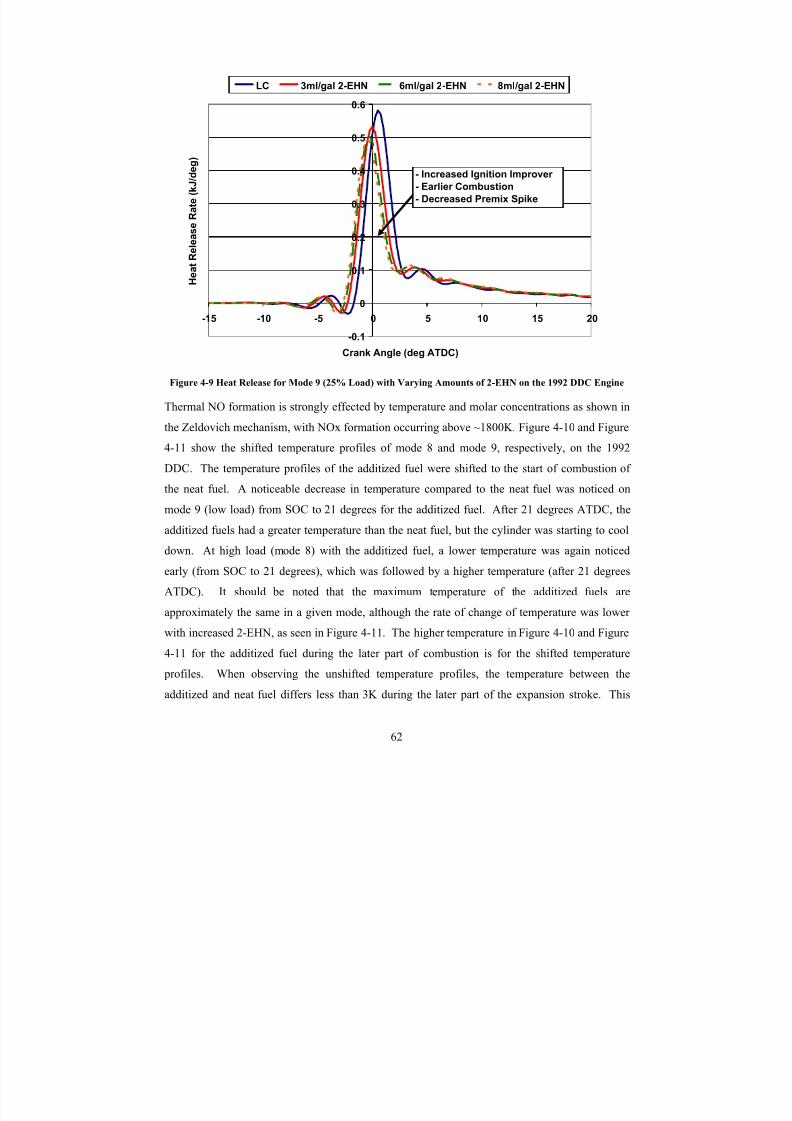
8/23/2019 The Effects of Fuel Additives on Diesel Engine Emissions During Steady State and Transient Operation
http://slidepdf.com/reader/full/the-effects-of-fuel-additives-on-diesel-engine-emissions-during-steady-state 81/163
-0.1
0
0.1
0.2
0.3
0.4
0.5
0.6
-15 -10 -5 0 5 10 15 20
Crank Angle (deg ATDC)
H e a t R e l e a s e R a t e ( k J / d e g )
LC 3ml/gal 2-EHN 6ml/gal 2-EHN 8ml/gal 2-EHN
- Increased Ignition Improver
- Earlier Combustion
- Decreased Premix Spike
Figure 4-9 Heat Release for Mode 9 (25% Load) with Varying Amounts of 2-EHN on the 1992 DDC Engine
Thermal NO formation is strongly effected by temperature and molar concentrations as shown in
the Zeldovich mechanism, with NOx formation occurring above ~1800K. Figure 4-10 and Figure
4-11 show the shifted temperature profiles of mode 8 and mode 9, respectively, on the 1992
DDC. The temperature profiles of the additized fuel were shifted to the start of combustion of
the neat fuel. A noticeable decrease in temperature compared to the neat fuel was noticed on
mode 9 (low load) from SOC to 21 degrees for the additized fuel. After 21 degrees ATDC, the
additized fuels had a greater temperature than the neat fuel, but the cylinder was starting to cool
down. At high load (mode 8) with the additized fuel, a lower temperature was again noticed
early (from SOC to 21 degrees), which was followed by a higher temperature (after 21 degrees
ATDC). It should be noted that the maximum temperature of the additized fuels are
approximately the same in a given mode, although the rate of change of temperature was lower
with increased 2-EHN, as seen in Figure 4-11. The higher temperature in Figure 4-10 and Figure
4-11 for the additized fuel during the later part of combustion is for the shifted temperature
profiles. When observing the unshifted temperature profiles, the temperature between the
additized and neat fuel differs less than 3K during the later part of the expansion stroke. This
62
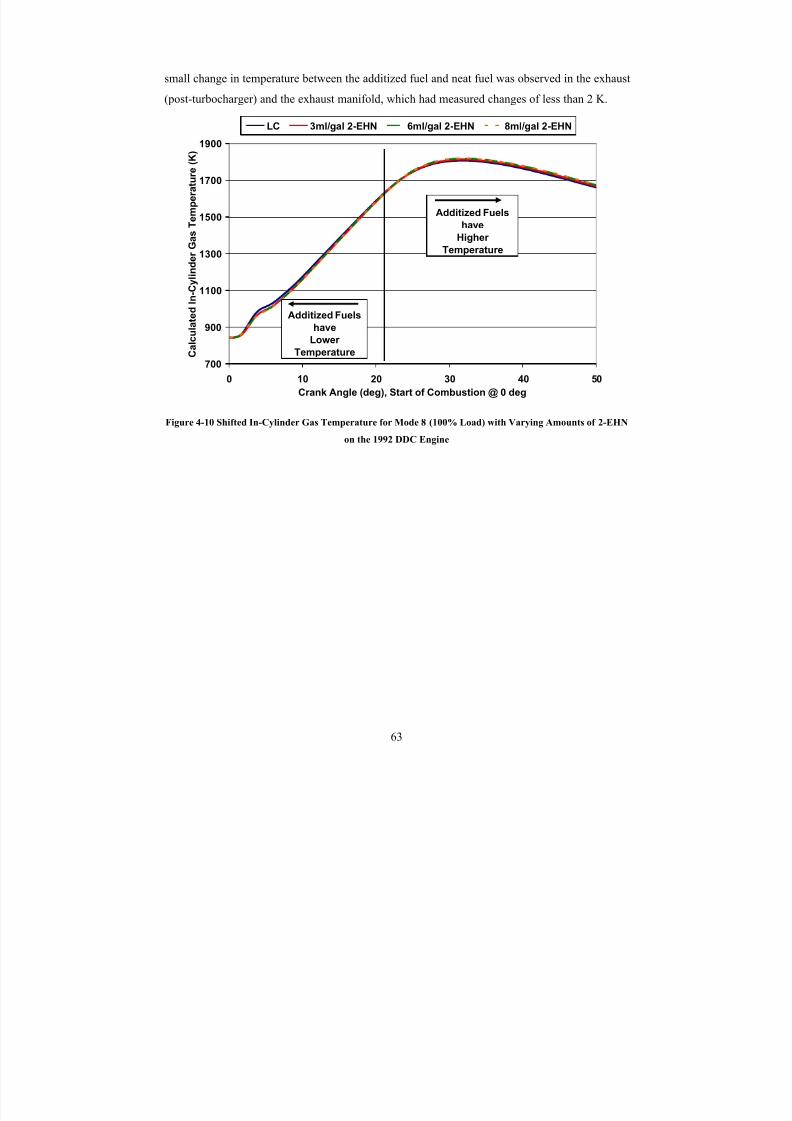
8/23/2019 The Effects of Fuel Additives on Diesel Engine Emissions During Steady State and Transient Operation
http://slidepdf.com/reader/full/the-effects-of-fuel-additives-on-diesel-engine-emissions-during-steady-state 82/163
small change in temperature between the additized fuel and neat fuel was observed in the exhaust
(post-turbocharger) and the exhaust manifold, which had measured changes of less than 2 K.
700
900
1100
1300
1500
1700
1900
0 10 20 30 40 5
Crank Angle (deg), Start of Combustion @ 0 deg
C a l c u l a t e d I n - C y l i n d e r G a s T e m p e r a t u r e ( K )
0
LC 3ml/gal 2-EHN 6ml/gal 2-EHN 8ml/gal 2-EHN
Additized Fuels
have
Lower
Temperature
Additized Fuels
have
Higher
Temperature
Figure 4-10 Shifted In-Cylinder Gas Temperature for Mode 8 (100% Load) with Varying Amounts of 2-EHN
on the 1992 DDC Engine
63
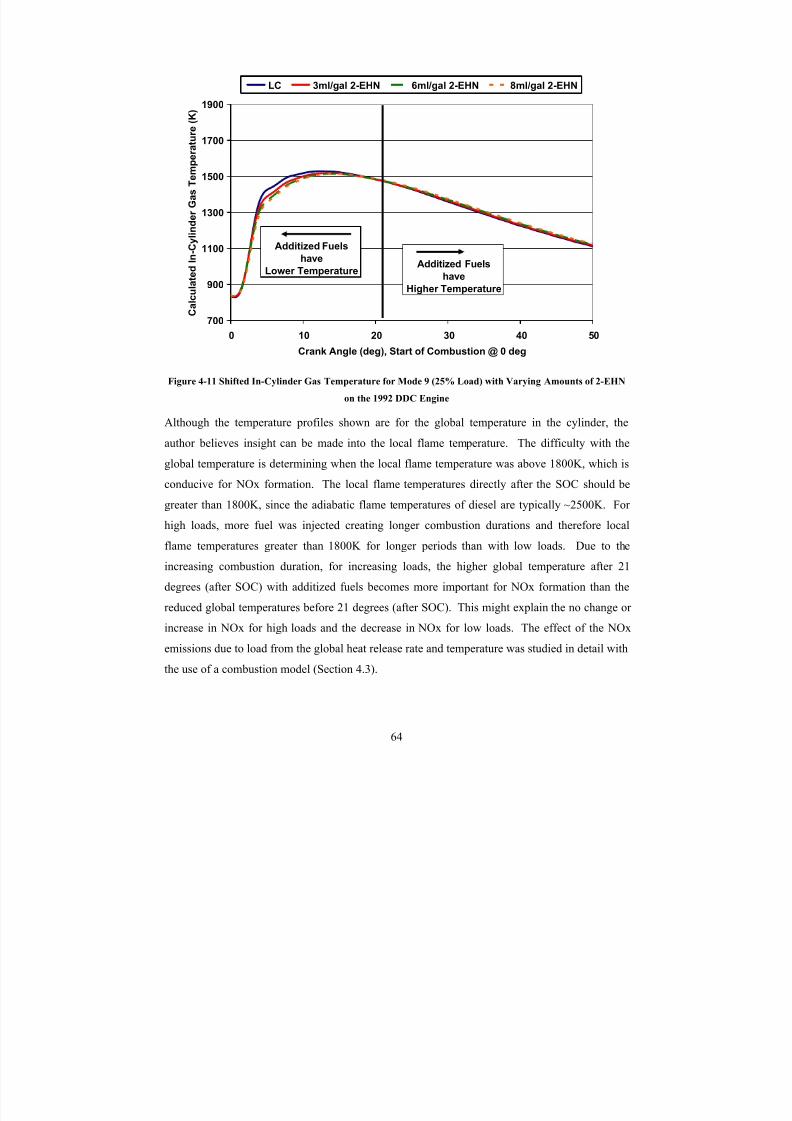
8/23/2019 The Effects of Fuel Additives on Diesel Engine Emissions During Steady State and Transient Operation
http://slidepdf.com/reader/full/the-effects-of-fuel-additives-on-diesel-engine-emissions-during-steady-state 83/163
700
900
1100
1300
1500
1700
1900
0 10 20 30 40 5
Crank Angle (deg), Start of Combustion @ 0 deg
C a l
c u l a t e d I n - C y l i n d e r G a s T e m p e r a t u r e ( K )
0
LC 3ml/gal 2-EHN 6ml/gal 2-EHN 8ml/gal 2-EHN
Additized Fuels
have
Lower TemperatureAdditized Fuels
have
Higher Temperature
Figure 4-11 Shifted In-Cylinder Gas Temperature for Mode 9 (25% Load) with Varying Amounts of 2-EHN
on the 1992 DDC Engine
Although the temperature profiles shown are for the global temperature in the cylinder, the
author believes insight can be made into the local flame temperature. The difficulty with the
global temperature is determining when the local flame temperature was above 1800K, which is
conducive for NOx formation. The local flame temperatures directly after the SOC should be
greater than 1800K, since the adiabatic flame temperatures of diesel are typically ~2500K. For
high loads, more fuel was injected creating longer combustion durations and therefore local
flame temperatures greater than 1800K for longer periods than with low loads. Due to the
increasing combustion duration, for increasing loads, the higher global temperature after 21
degrees (after SOC) with additized fuels becomes more important for NOx formation than the
reduced global temperatures before 21 degrees (after SOC). This might explain the no change or increase in NOx for high loads and the decrease in NOx for low loads. The effect of the NOx
emissions due to load from the global heat release rate and temperature was studied in detail with
the use of a combustion model (Section 4.3).
64
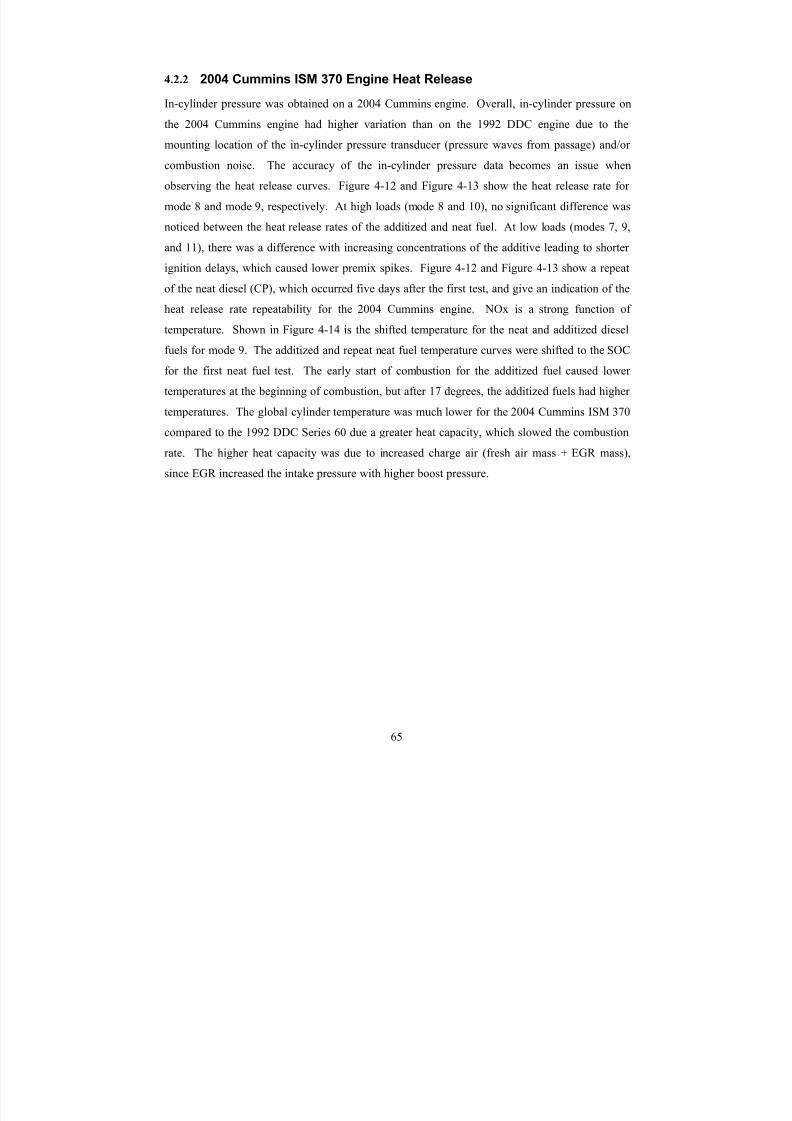
8/23/2019 The Effects of Fuel Additives on Diesel Engine Emissions During Steady State and Transient Operation
http://slidepdf.com/reader/full/the-effects-of-fuel-additives-on-diesel-engine-emissions-during-steady-state 84/163
4.2.2 2004 Cummins ISM 370 Engine Heat Release
In-cylinder pressure was obtained on a 2004 Cummins engine. Overall, in-cylinder pressure on
the 2004 Cummins engine had higher variation than on the 1992 DDC engine due to the
mounting location of the in-cylinder pressure transducer (pressure waves from passage) and/or
combustion noise. The accuracy of the in-cylinder pressure data becomes an issue when
observing the heat release curves. Figure 4-12 and Figure 4-13 show the heat release rate for
mode 8 and mode 9, respectively. At high loads (mode 8 and 10), no significant difference was
noticed between the heat release rates of the additized and neat fuel. At low loads (modes 7, 9,
and 11), there was a difference with increasing concentrations of the additive leading to shorter
ignition delays, which caused lower premix spikes. Figure 4-12 and Figure 4-13 show a repeat
of the neat diesel (CP), which occurred five days after the first test, and give an indication of the
heat release rate repeatability for the 2004 Cummins engine. NOx is a strong function of
temperature. Shown in Figure 4-14 is the shifted temperature for the neat and additized diesel
fuels for mode 9. The additized and repeat neat fuel temperature curves were shifted to the SOC
for the first neat fuel test. The early start of combustion for the additized fuel caused lower
temperatures at the beginning of combustion, but after 17 degrees, the additized fuels had higher
temperatures. The global cylinder temperature was much lower for the 2004 Cummins ISM 370
compared to the 1992 DDC Series 60 due a greater heat capacity, which slowed the combustion
rate. The higher heat capacity was due to increased charge air (fresh air mass + EGR mass),since EGR increased the intake pressure with higher boost pressure.
65
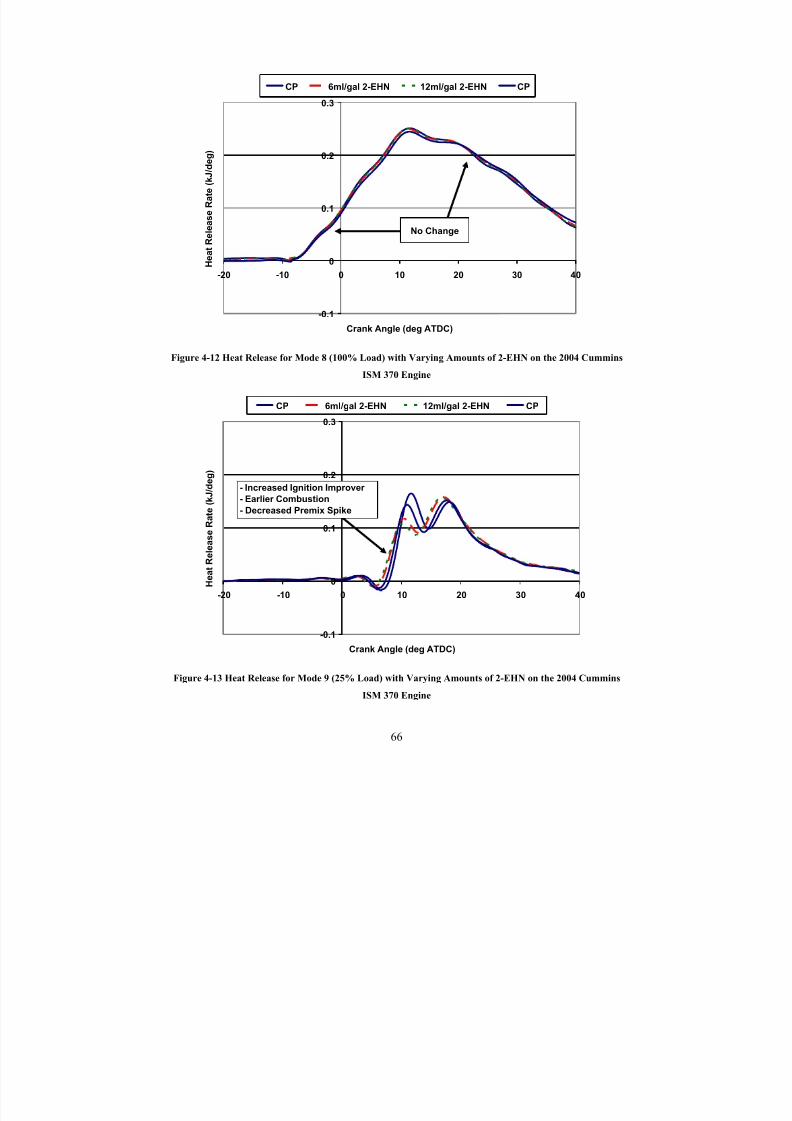
8/23/2019 The Effects of Fuel Additives on Diesel Engine Emissions During Steady State and Transient Operation
http://slidepdf.com/reader/full/the-effects-of-fuel-additives-on-diesel-engine-emissions-during-steady-state 85/163
-0.1
0
0.1
0.2
0.3
-20 -10 0 10 20 30 4
Crank Angle (deg ATDC)
H e a t R e l e a s e R a t e ( k J / d e g )
0
CP 6ml/gal 2-EHN 12ml/gal 2-EHN CP
No Change
Figure 4-12 Heat Release for Mode 8 (100% Load) with Varying Amounts of 2-EHN on the 2004 Cummins
ISM 370 Engine
-0.1
0
0.1
0.2
0.3
-20 -10 0 10 20 30 4
Crank Angle (deg ATDC)
H e a t R e l e a s e R a t e ( k J / d e g )
0
CP 6ml/gal 2-EHN 12ml/gal 2-EHN CP
- Increased Ignition Improver
- Earlier Combustion
- Decreased Premix Spike
Figure 4-13 Heat Release for Mode 9 (25% Load) with Varying Amounts of 2-EHN on the 2004 Cummins
ISM 370 Engine
66
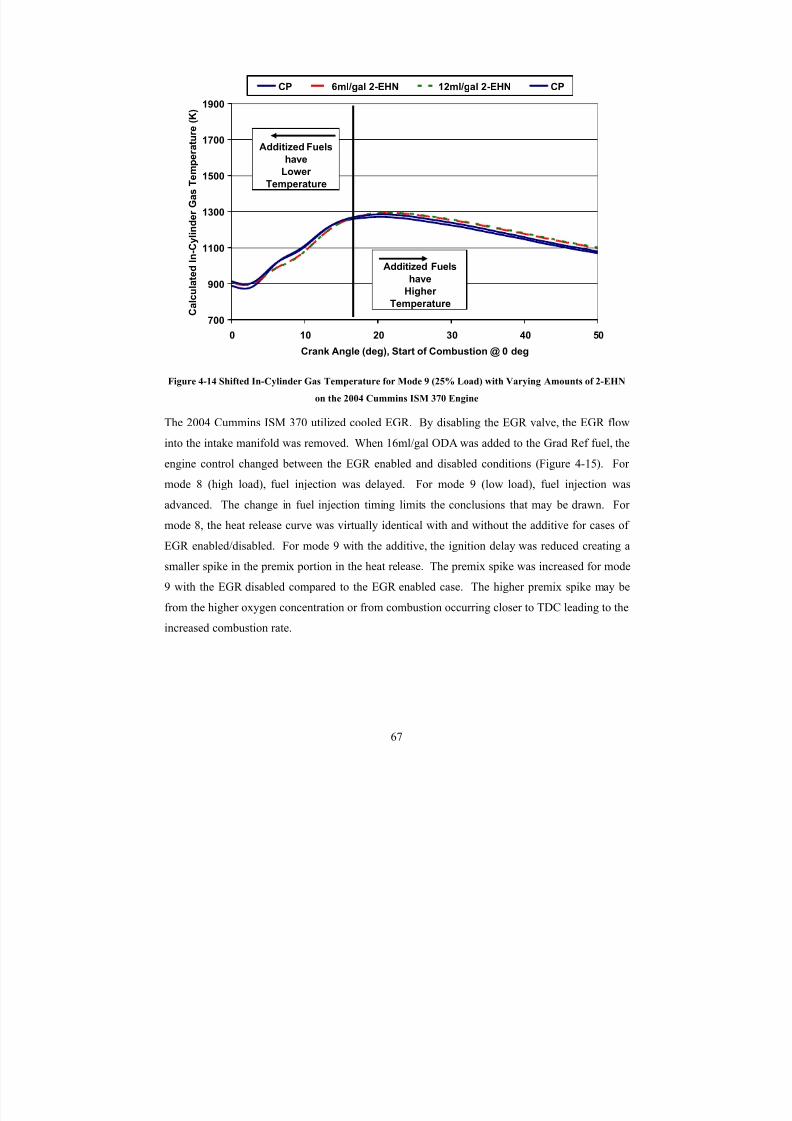
8/23/2019 The Effects of Fuel Additives on Diesel Engine Emissions During Steady State and Transient Operation
http://slidepdf.com/reader/full/the-effects-of-fuel-additives-on-diesel-engine-emissions-during-steady-state 86/163
700
900
1100
1300
1500
1700
1900
0 10 20 30 40 5
Crank Angle (deg), Start of Combustion @ 0 deg
C a l c u l a t e d I n - C y l i n d e r G a s T e m p e r a t u r e ( K )
0
CP 6ml/gal 2-EHN 12ml/gal 2-EHN CP
Additized Fuelshave
Lower
Temperature
Additized Fuels
have
Higher
Temperature
Figure 4-14 Shifted In-Cylinder Gas Temperature for Mode 9 (25% Load) with Varying Amounts of 2-EHN
on the 2004 Cummins ISM 370 Engine
The 2004 Cummins ISM 370 utilized cooled EGR. By disabling the EGR valve, the EGR flow
into the intake manifold was removed. When 16ml/gal ODA was added to the Grad Ref fuel, the
engine control changed between the EGR enabled and disabled conditions (Figure 4-15). For
mode 8 (high load), fuel injection was delayed. For mode 9 (low load), fuel injection was
advanced. The change in fuel injection timing limits the conclusions that may be drawn. For
mode 8, the heat release curve was virtually identical with and without the additive for cases of
EGR enabled/disabled. For mode 9 with the additive, the ignition delay was reduced creating a
smaller spike in the premix portion in the heat release. The premix spike was increased for mode
9 with the EGR disabled compared to the EGR enabled case. The higher premix spike may be
from the higher oxygen concentration or from combustion occurring closer to TDC leading to theincreased combustion rate.
67
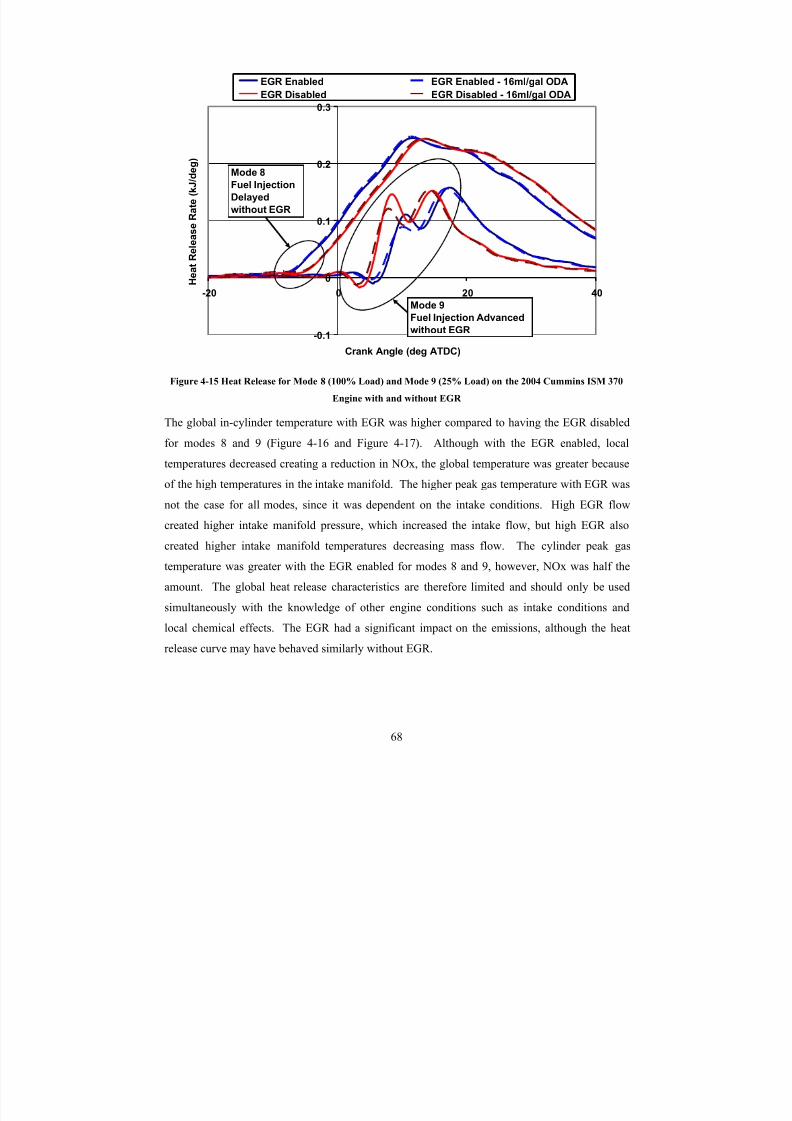
8/23/2019 The Effects of Fuel Additives on Diesel Engine Emissions During Steady State and Transient Operation
http://slidepdf.com/reader/full/the-effects-of-fuel-additives-on-diesel-engine-emissions-during-steady-state 87/163
-0.1
0
0.1
0.2
0.3
-20 0 20 40
Crank Angle (deg ATDC)
H e a t R e l e a s e R a t e ( k J / d e g )
EGR Enabled EGR Enabled - 16ml/gal ODA
EGR Disabled EGR Disabled - 16ml/gal ODA
Mode 9Fuel Injection Advanced
without EGR
Mode 8
Fuel Injection
Delayed
without EGR
Figure 4-15 Heat Release for Mode 8 (100% Load) and Mode 9 (25% Load) on the 2004 Cummins ISM 370
Engine with and without EGR
The global in-cylinder temperature with EGR was higher compared to having the EGR disabled
for modes 8 and 9 (Figure 4-16 and Figure 4-17). Although with the EGR enabled, local
temperatures decreased creating a reduction in NOx, the global temperature was greater because
of the high temperatures in the intake manifold. The higher peak gas temperature with EGR was
not the case for all modes, since it was dependent on the intake conditions. High EGR flow
created higher intake manifold pressure, which increased the intake flow, but high EGR also
created higher intake manifold temperatures decreasing mass flow. The cylinder peak gas
temperature was greater with the EGR enabled for modes 8 and 9, however, NOx was half the
amount. The global heat release characteristics are therefore limited and should only be used
simultaneously with the knowledge of other engine conditions such as intake conditions andlocal chemical effects. The EGR had a significant impact on the emissions, although the heat
release curve may have behaved similarly without EGR.
68
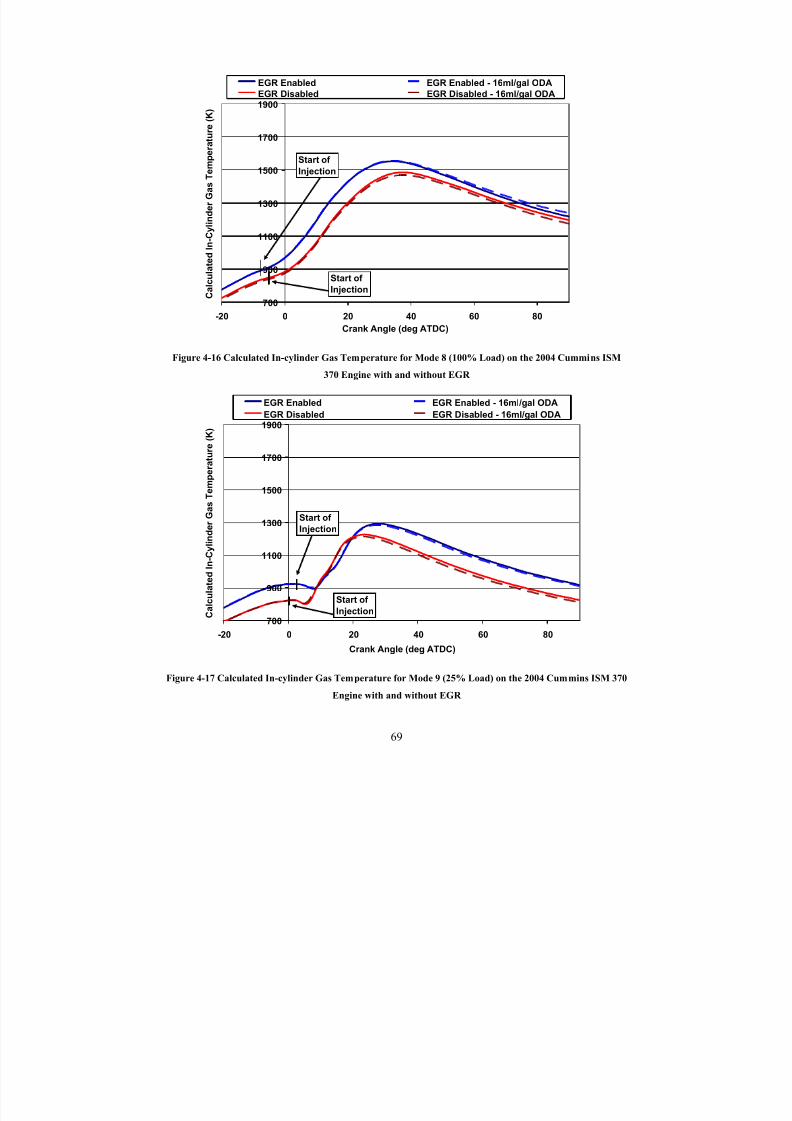
8/23/2019 The Effects of Fuel Additives on Diesel Engine Emissions During Steady State and Transient Operation
http://slidepdf.com/reader/full/the-effects-of-fuel-additives-on-diesel-engine-emissions-during-steady-state 88/163
700
900
1100
1300
1500
1700
1900
-20 0 20 40 60 80
Crank Angle (deg ATDC)
C a l c u l a t e d I n - C y l i n d e r G a s T e m p e r a t u r e ( K )
EGR Enabled EGR Enabled - 16ml/gal ODA
EGR Disabled EGR Disabled - 16ml/gal ODA
Start of
Injection
Start of
Injection
Figure 4-16 Calculated In-cylinder Gas Temperature for Mode 8 (100% Load) on the 2004 Cummins ISM
370 Engine with and without EGR
700
900
1100
1300
1500
1700
1900
-20 0 20 40 60 80
Crank Angle (deg ATDC)
C a l c u l a t e d I n - C y l i n d e r G a s T e m p e r a t u
r e ( K )
EGR Enabled EGR Enabled - 16ml/gal ODA
EGR Disabled EGR Disabled - 16ml/gal ODA
Start of
Injection
Start of
Injection
Figure 4-17 Calculated In-cylinder Gas Temperature for Mode 9 (25% Load) on the 2004 Cummins ISM 370
Engine with and without EGR
69
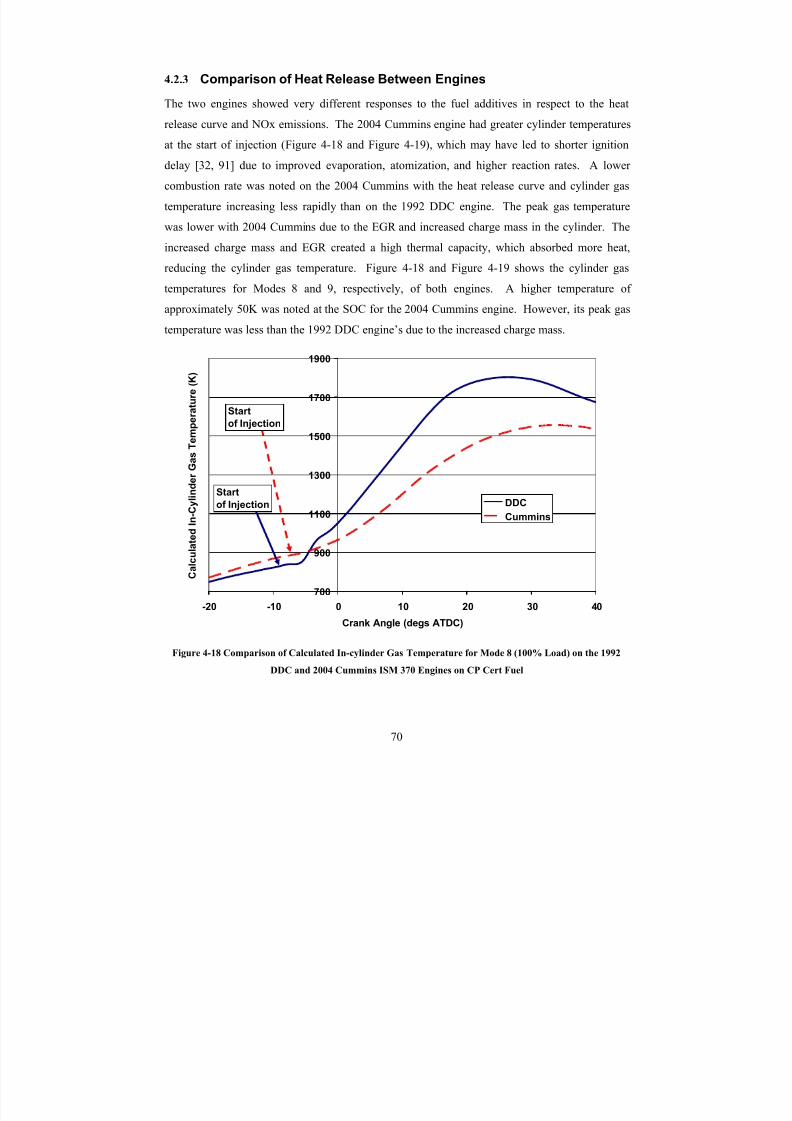
8/23/2019 The Effects of Fuel Additives on Diesel Engine Emissions During Steady State and Transient Operation
http://slidepdf.com/reader/full/the-effects-of-fuel-additives-on-diesel-engine-emissions-during-steady-state 89/163
4.2.3 Comparison of Heat Release Between Engines
The two engines showed very different responses to the fuel additives in respect to the heat
release curve and NOx emissions. The 2004 Cummins engine had greater cylinder temperatures
at the start of injection (Figure 4-18 and Figure 4-19), which may have led to shorter ignition
delay [32, 91] due to improved evaporation, atomization, and higher reaction rates. A lower
combustion rate was noted on the 2004 Cummins with the heat release curve and cylinder gas
temperature increasing less rapidly than on the 1992 DDC engine. The peak gas temperature
was lower with 2004 Cummins due to the EGR and increased charge mass in the cylinder. The
increased charge mass and EGR created a high thermal capacity, which absorbed more heat,
reducing the cylinder gas temperature. Figure 4-18 and Figure 4-19 shows the cylinder gas
temperatures for Modes 8 and 9, respectively, of both engines. A higher temperature of
approximately 50K was noted at the SOC for the 2004 Cummins engine. However, its peak gas
temperature was less than the 1992 DDC engine’s due to the increased charge mass.
700
900
1100
1300
1500
1700
1900
-20 -10 0 10 20 30 4
Crank Angle (degs ATDC)
C a l c u l a t e d I n - C y l i n d e r G a s
T e m p e r a t u r e ( K )
0
DDC
Cummins
Start
of Injection
Start
of Injection
Figure 4-18 Comparison of Calculated In-cylinder Gas Temperature for Mode 8 (100% Load) on the 1992
DDC and 2004 Cummins ISM 370 Engines on CP Cert Fuel
70
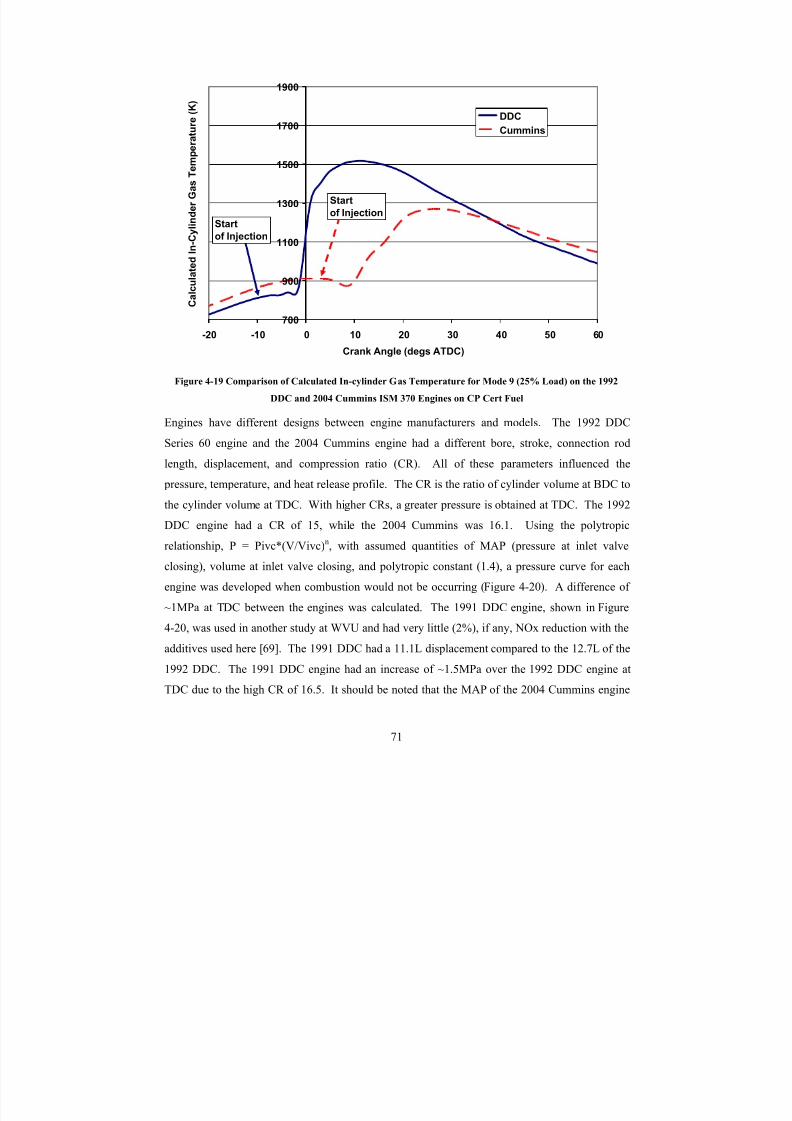
8/23/2019 The Effects of Fuel Additives on Diesel Engine Emissions During Steady State and Transient Operation
http://slidepdf.com/reader/full/the-effects-of-fuel-additives-on-diesel-engine-emissions-during-steady-state 90/163
700
900
1100
1300
1500
1700
1900
-20 -10 0 10 20 30 40 50 6
Crank Angle (degs ATDC)
C
a l c u l a t e d I n - C y l i n d e r G a s T e m p e r a t u r e ( K )
0
DDC
Cummins
Start
of Injection
Start
of Injection
Figure 4-19 Comparison of Calculated In-cylinder Gas Temperature for Mode 9 (25% Load) on the 1992
DDC and 2004 Cummins ISM 370 Engines on CP Cert Fuel
Engines have different designs between engine manufacturers and models. The 1992 DDC
Series 60 engine and the 2004 Cummins engine had a different bore, stroke, connection rod
length, displacement, and compression ratio (CR). All of these parameters influenced the
pressure, temperature, and heat release profile. The CR is the ratio of cylinder volume at BDC to
the cylinder volume at TDC. With higher CRs, a greater pressure is obtained at TDC. The 1992
DDC engine had a CR of 15, while the 2004 Cummins was 16.1. Using the polytropic
relationship, P = Pivc*(V/Vivc)n, with assumed quantities of MAP (pressure at inlet valve
closing), volume at inlet valve closing, and polytropic constant (1.4), a pressure curve for each
engine was developed when combustion would not be occurring (Figure 4-20). A difference of
~1MPa at TDC between the engines was calculated. The 1991 DDC engine, shown in Figure4-20, was used in another study at WVU and had very little (2%), if any, NOx reduction with the
additives used here [69]. The 1991 DDC had a 11.1L displacement compared to the 12.7L of the
1992 DDC. The 1991 DDC engine had an increase of ~1.5MPa over the 1992 DDC engine at
TDC due to the high CR of 16.5. It should be noted that the MAP of the 2004 Cummins engine
71
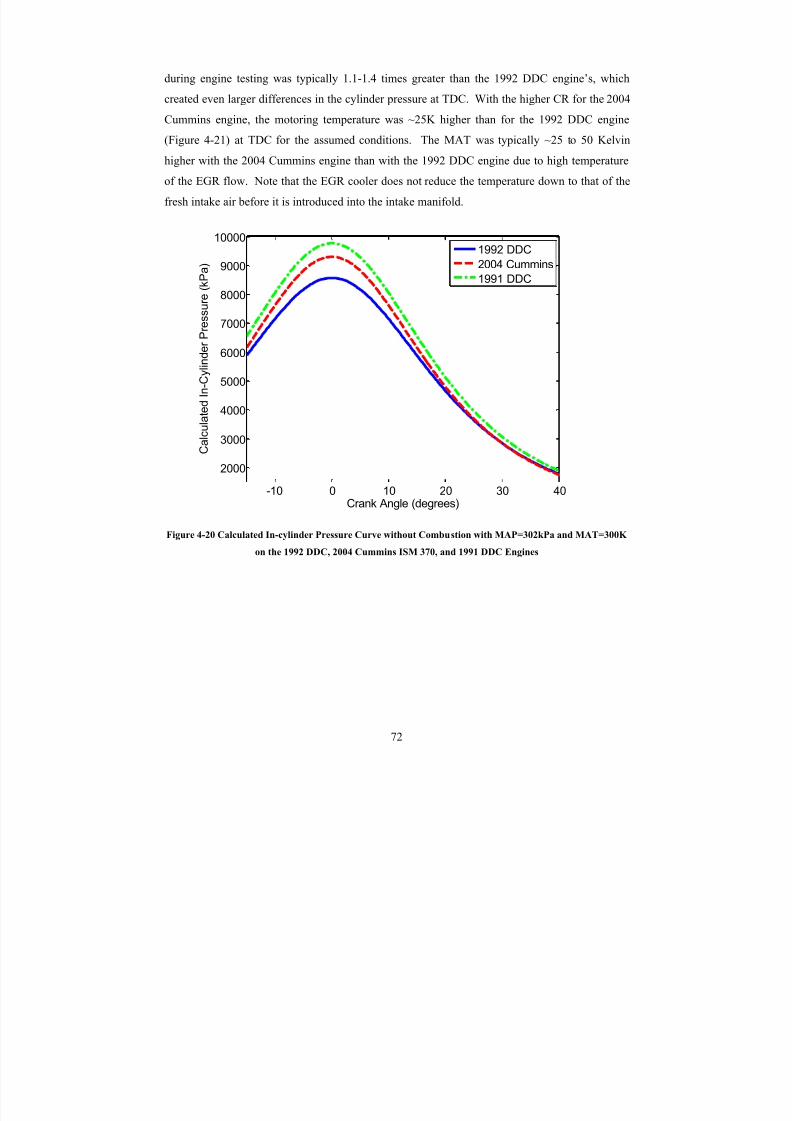
8/23/2019 The Effects of Fuel Additives on Diesel Engine Emissions During Steady State and Transient Operation
http://slidepdf.com/reader/full/the-effects-of-fuel-additives-on-diesel-engine-emissions-during-steady-state 91/163
during engine testing was typically 1.1-1.4 times greater than the 1992 DDC engine’s, which
created even larger differences in the cylinder pressure at TDC. With the higher CR for the 2004
Cummins engine, the motoring temperature was ~25K higher than for the 1992 DDC engine
(Figure 4-21) at TDC for the assumed conditions. The MAT was typically ~25 to 50 Kelvin
higher with the 2004 Cummins engine than with the 1992 DDC engine due to high temperature
of the EGR flow. Note that the EGR cooler does not reduce the temperature down to that of the
fresh intake air before it is introduced into the intake manifold.
-10 0 10 20 30 40
2000
3000
4000
5000
6000
7000
8000
9000
10000
Crank Angle (degrees)
C a l c u l a t e d I n - C y l i n d e r P r e s s u r
e ( k P a )
1992 DDC
2004 Cummins
1991 DDC
Figure 4-20 Calculated In-cylinder Pressure Curve without Combustion with MAP=302kPa and MAT=300K
on the 1992 DDC, 2004 Cummins ISM 370, and 1991 DDC Engines
72
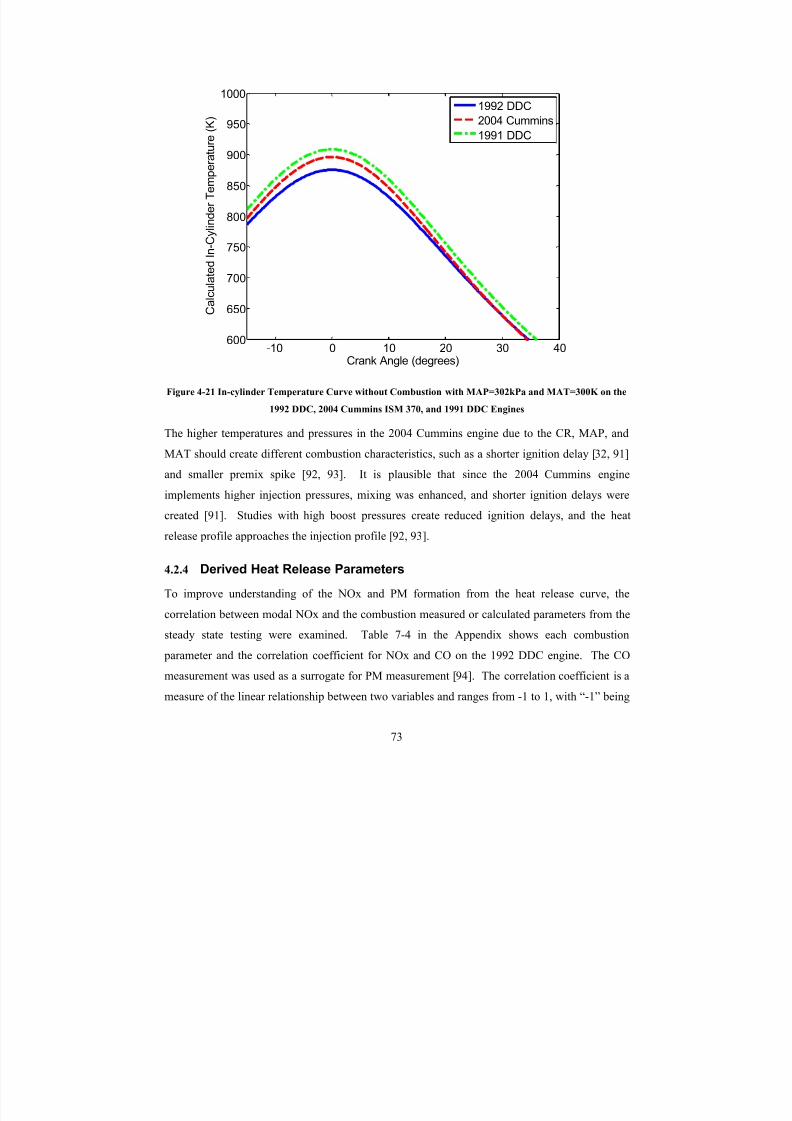
8/23/2019 The Effects of Fuel Additives on Diesel Engine Emissions During Steady State and Transient Operation
http://slidepdf.com/reader/full/the-effects-of-fuel-additives-on-diesel-engine-emissions-during-steady-state 92/163
-10 0 10 20 30 40600
650
700
750
800
850
900
950
1000
Crank Angle (degrees)
C a
l c u l a t e d I n - C y l i n d e r T e m p e r a t u
r e ( K )
1992 DDC
2004 Cummins
1991 DDC
Figure 4-21 In-cylinder Temperature Curve without Combustion with MAP=302kPa and MAT=300K on the
1992 DDC, 2004 Cummins ISM 370, and 1991 DDC Engines
The higher temperatures and pressures in the 2004 Cummins engine due to the CR, MAP, and
MAT should create different combustion characteristics, such as a shorter ignition delay [32, 91]and smaller premix spike [92, 93]. It is plausible that since the 2004 Cummins engine
implements higher injection pressures, mixing was enhanced, and shorter ignition delays were
created [91]. Studies with high boost pressures create reduced ignition delays, and the heat
release profile approaches the injection profile [92, 93].
4.2.4 Derived Heat Release Parameters
To improve understanding of the NOx and PM formation from the heat release curve, the
correlation between modal NOx and the combustion measured or calculated parameters from the
steady state testing were examined. Table 7-4 in the Appendix shows each combustion
parameter and the correlation coefficient for NOx and CO on the 1992 DDC engine. The CO
measurement was used as a surrogate for PM measurement [94]. The correlation coefficient is a
measure of the linear relationship between two variables and ranges from -1 to 1, with “-1” being
73
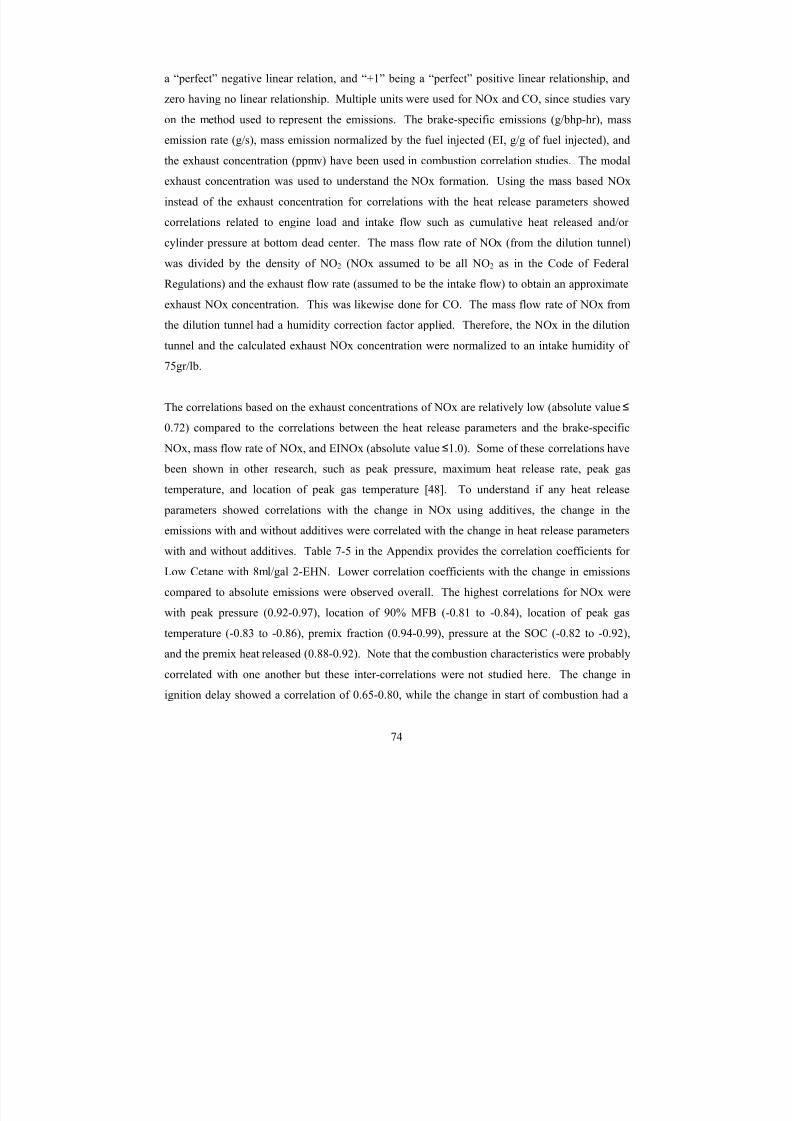
8/23/2019 The Effects of Fuel Additives on Diesel Engine Emissions During Steady State and Transient Operation
http://slidepdf.com/reader/full/the-effects-of-fuel-additives-on-diesel-engine-emissions-during-steady-state 93/163
a “perfect” negative linear relation, and “+1” being a “perfect” positive linear relationship, and
zero having no linear relationship. Multiple units were used for NOx and CO, since studies vary
on the method used to represent the emissions. The brake-specific emissions (g/bhp-hr), mass
emission rate (g/s), mass emission normalized by the fuel injected (EI, g/g of fuel injected), and
the exhaust concentration (ppmv) have been used in combustion correlation studies. The modal
exhaust concentration was used to understand the NOx formation. Using the mass based NOx
instead of the exhaust concentration for correlations with the heat release parameters showed
correlations related to engine load and intake flow such as cumulative heat released and/or
cylinder pressure at bottom dead center. The mass flow rate of NOx (from the dilution tunnel)
was divided by the density of NO2 (NOx assumed to be all NO2 as in the Code of Federal
Regulations) and the exhaust flow rate (assumed to be the intake flow) to obtain an approximate
exhaust NOx concentration. This was likewise done for CO. The mass flow rate of NOx fromthe dilution tunnel had a humidity correction factor applied. Therefore, the NOx in the dilution
tunnel and the calculated exhaust NOx concentration were normalized to an intake humidity of
75gr/lb.
The correlations based on the exhaust concentrations of NOx are relatively low (absolute value ≤
0.72) compared to the correlations between the heat release parameters and the brake-specific
NOx, mass flow rate of NOx, and EINOx (absolute value ≤1.0). Some of these correlations have
been shown in other research, such as peak pressure, maximum heat release rate, peak gas
temperature, and location of peak gas temperature [48]. To understand if any heat release
parameters showed correlations with the change in NOx using additives, the change in the
emissions with and without additives were correlated with the change in heat release parameters
with and without additives. Table 7-5 in the Appendix provides the correlation coefficients for
Low Cetane with 8ml/gal 2-EHN. Lower correlation coefficients with the change in emissions
compared to absolute emissions were observed overall. The highest correlations for NOx were
with peak pressure (0.92-0.97), location of 90% MFB (-0.81 to -0.84), location of peak gas
temperature (-0.83 to -0.86), premix fraction (0.94-0.99), pressure at the SOC (-0.82 to -0.92),
and the premix heat released (0.88-0.92). Note that the combustion characteristics were probably
correlated with one another but these inter-correlations were not studied here. The change in
ignition delay showed a correlation of 0.65-0.80, while the change in start of combustion had a
74

8/23/2019 The Effects of Fuel Additives on Diesel Engine Emissions During Steady State and Transient Operation
http://slidepdf.com/reader/full/the-effects-of-fuel-additives-on-diesel-engine-emissions-during-steady-state 94/163
correlation of 0.76-0.85. The ignition delay is the time difference between the start of injection
and the start of combustion. Previous researchers have stated that the ignition delay changes the
premix fraction [81], which may change NOx [54].
The change in peak pressure and change in exhaust NOx concentration are shown in Figure 4-22.
A high correlation was noticed, with increased pressure causing a NOx increase and reduced
pressure causing a NOx reduction. Higher pressure typically means higher temperature, which
may then create a higher NOx formation rate. For Figure 4-22 through Figure 4-26, the error
bars shown are an approximate one standard deviation. The error bars for the heat release
parameters are based on 11 repeat tests with the Guttman fuel. The error bars for the exhaust
constituents are based on four repeat tests with the Guttman fuel. For more details on calculating
the approximate standard deviation, see Section 3.7, which showed how the approximate rangewas calculated.
75

8/23/2019 The Effects of Fuel Additives on Diesel Engine Emissions During Steady State and Transient Operation
http://slidepdf.com/reader/full/the-effects-of-fuel-additives-on-diesel-engine-emissions-during-steady-state 95/163
y = 0.650x - 31.116
R2
= 0.947
y = 0.723x - 5.173
R2
= 0.938
y = 0.656x - 8.098
R2
= 0.938
-120
-100
-80
-60
-40
-20
0
20
40
60
-200 -150 -100 -50 0 50 100 150
Change in Peak Pressure (kPa)
C h a n g e i n E x h a u s t N O x ( p p m
v )
3ml/gal 2-EHN
6ml/gal 2-EHN
8ml/gal 2-EHN
Figure 4-22 Change in NOx with Additized Fuels Compared to a Change in the Peak Pressure for the Steady
State Modes on the 1992 DDC (Error Bars show An Approximate One Standard Deviation Based on Repeat
Tests with the Guttman Fuel)
Since higher temperatures create more thermal NOx, the change in peak gas temperature and
change in exhaust NOx concentration is shown in Figure 4-23. A lower R 2 was noticed with this
correlation, although the general trend shows an increase in NOx with increased peak gas
temperatures and a decrease in NOx with a decrease in the peak gas temperature. The peak gas
temperature only provides a single characteristic and not the length of combustion time that
occurred at high temperatures. The length of time at high temperatures with and without
additives may play a greater role than the peak gas temperature. The peak gas temperature used
in Figure 4-23 was from the calculated cylinder temperature, which gave an indication of NOx production, but NOx formation depends on the local flame temperature and the residence time of
combustion zones at high local temperatures. The combustion model in Section 4.3 addressed
the NOx formation dependence on local temperature and the residence time of combustion zones
at high local temperatures.
76
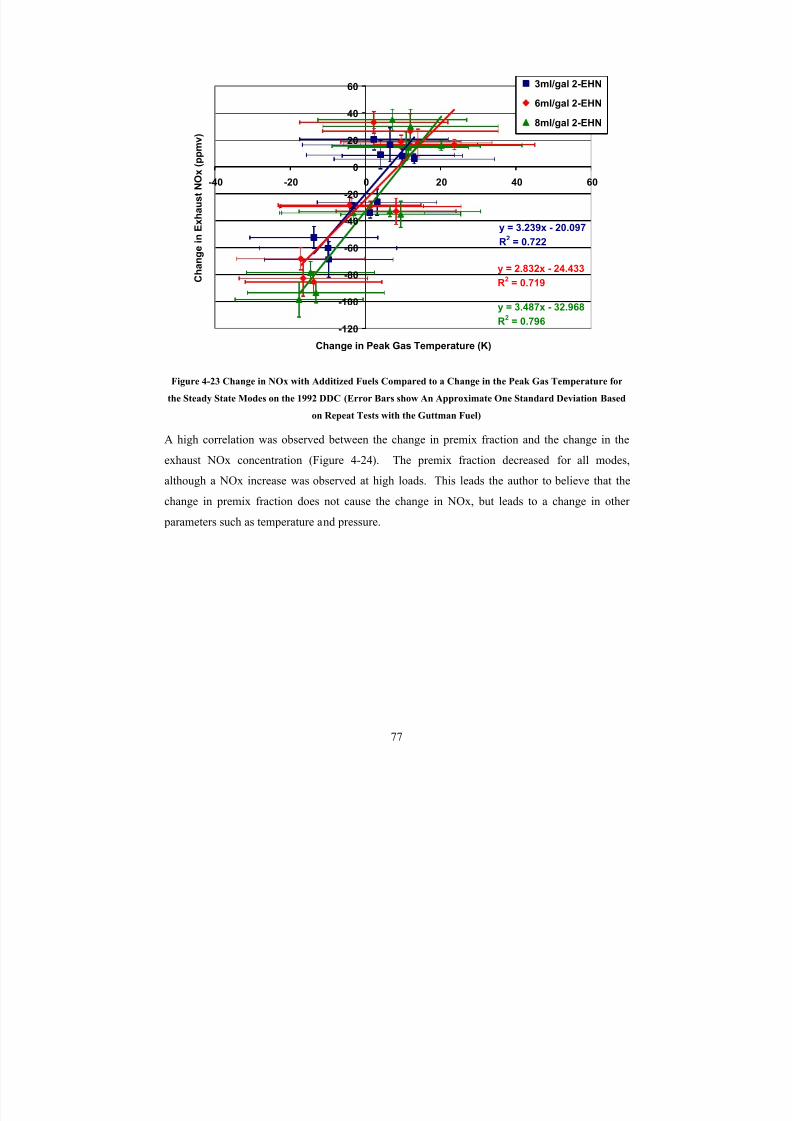
8/23/2019 The Effects of Fuel Additives on Diesel Engine Emissions During Steady State and Transient Operation
http://slidepdf.com/reader/full/the-effects-of-fuel-additives-on-diesel-engine-emissions-during-steady-state 96/163
y = 3.239x - 20.097
R2
= 0.722
y = 2.832x - 24.433
R2
= 0.719
y = 3.487x - 32.968
R2
= 0.796-120
-100
-80
-60
-40
-20
0
20
40
60
-40 -20 0 20 40 60
Change in Peak Gas Temperature (K)
C h a n g e i n E x h a u s t N O x ( p p m v )
3ml/gal 2-EHN
6ml/gal 2-EHN
8ml/gal 2-EHN
Figure 4-23 Change in NOx with Additized Fuels Compared to a Change in the Peak Gas Temperature for
the Steady State Modes on the 1992 DDC (Error Bars show An Approximate One Standard Deviation Based
on Repeat Tests with the Guttman Fuel)
A high correlation was observed between the change in premix fraction and the change in the
exhaust NOx concentration (Figure 4-24). The premix fraction decreased for all modes,
although a NOx increase was observed at high loads. This leads the author to believe that the
change in premix fraction does not cause the change in NOx, but leads to a change in other
parameters such as temperature and pressure.
77

8/23/2019 The Effects of Fuel Additives on Diesel Engine Emissions During Steady State and Transient Operation
http://slidepdf.com/reader/full/the-effects-of-fuel-additives-on-diesel-engine-emissions-during-steady-state 97/163
y = 1863.1x + 65.880
R2
= 0.967
y = 1952.4x + 62.726
R2
= 0.946
y = 2036.7x + 39.881
R2
= 0.900
-120
-100
-80
-60
-40
-20
0
20
40
60
-0.10 -0.08 -0.06 -0.04 -0.02 0.00
Change in Premix Fraction (-)
C h a n g e i n E x h a u s t N O x ( p p m v )
3ml/gal 2-EHN
6ml/gal 2-EHN
8ml/gal 2-EHN
Figure 4-24 Change in NOx with Additized Fuels Compared to a Change in the Premix Fraction for the
Steady State Modes on the 1992 DDC (Error Bars show An Approximate One Standard Deviation Based on
Repeat Tests with the Guttman Fuel)
A decrease in ignition delay caused by the additives would change the pressure at which
combustion occurred. If combustion occurred on the compression stroke, a decrease in the
ignition delay would make the pressure at the SOC decrease. On the expansion stroke, a
decrease in ignition delay would cause an increase in pressure at SOC. The greater NOx
reduction was observed with lower SOC pressure changes, which has combustion occurring near
TDC (Figure 4-25). The pressure at SOC typically decreased, with greater decreases having a
NOx increase. At high loads compared to low loads, the same percent reduction in pressure at
SOC (with and without additive) would have higher-pressure changes due to higher boost
creating greater compression pressure.
78

8/23/2019 The Effects of Fuel Additives on Diesel Engine Emissions During Steady State and Transient Operation
http://slidepdf.com/reader/full/the-effects-of-fuel-additives-on-diesel-engine-emissions-during-steady-state 98/163
y = -0.496x - 41.673
R2
= 0.743
y = -0.739x - 84.676
R2 = 0.787
y = -0.564x - 62.799
R2
= 0.617
-140
-120
-100
-80
-60
-40
-20
0
20
40
60
-300 -250 -200 -150 -100 -50 0 50 100
Change in Pressure at the SOC (kPa)
C h a n g e i n E x h u a s t N O x ( p p m v )
3ml/gal 2-EHN
6ml/gal 2-EHN
8ml/gal 2-EHN
Figure 4-25 Change in NOx with Additized Fuels Compared to a Change in the Pressure at the Start of
Combustion for the Steady State Modes on the 1992 DDC (Error Bars show An Approximate One Standard
Deviation Based on Repeat Tests with the Guttman Fuel)
For CO, the correlations were less favorable. The highest correlation coefficients were with the
10% MFB (-0.73 to -0.90). This relationship would suggest that an increase in the burning time
at the beginning of the heat release would decrease CO (and PM). An increase in burning time
would suggest an increase in the oxidization rate of CO, which would decrease CO, which is
contrary to the correlation found. This high correlation may be due to an interrelated cause. A
high degree of scatter was also noticed with this relationship. The additives caused a decrease in
CO during all modes with greater reductions occurring at high load, which was when the NOx
increase occurred. Figure 4-26 illustrated a NOx/CO trade-off like the typical NOx/PM trade-off
shown in the literature. The increased radical pool caused by the ignition improvers mayincrease local oxidation of CO and PM.
79
8/23/2019 The Effects of Fuel Additives on Diesel Engine Emissions During Steady State and Transient Operation
http://slidepdf.com/reader/full/the-effects-of-fuel-additives-on-diesel-engine-emissions-during-steady-state 99/163
y = -0.0112x2
- 1.6323x - 70.458
R2
= 0.546
y = -0.0042x2
- 0.6605x - 51.808
R2
= 0.456
y = -0.0061x2
- 0.8225x - 49.529
R2
= 0.504
-200
-180
-160
-140
-120
-100
-80
-60
-40
-20
0
-120 -100 -80 -60 -40 -20 0 20 40 60
Change in Exhaust NOx (ppmv)
C h a n g e i n E x h a u s t C O ( p p m
v )
3ml/gal 2-EHN
6ml/gal 2-EHN
8ml/gal 2-EHN
Figure 4-26 Change in CO with Additized Fuels Compared to a Change in NOx for the Steady State Modes
on the 1992 DDC (Error Bars show An Approximate One Standard Deviation Based on Repeat Tests with the
Guttman Fuel)
For the 2004 Cummins engine, lower correlations were observed for heat release parameters with
the absolute NOx/CO and change in NOx/CO compared to the 1992 DDC engine (Table 7-6 and
Table 7-7, in the Appendix). Although the change in maximum cylinder pressure and maximum
cylinder gas temperature due to the cetane improvers showed good correlation on the 1992 DDC
engine, the 2004 Cummins engine did not have high correlations (-0.51 to 0.11). The absolute
NOx emissions did correlate well with the absolute maximum cylinder pressure (0.67–0.97) and
maximum cylinder gas temperature (0.15-0.8). The change in premix fraction had a correlation
coefficient of 0.66 with the change in exhaust NOx (ppmv) at the higher treat rates of 12ml/gal
2-EHN and 15ml/gal DTBP. This correlation was due to the change in the exhaust NOx levelsand not reductions due to the additives. Figure 4-27 shows the percent change in premix fraction
and the percent change in exhaust NOx. Overall, with changes in premix fraction (except for
15ml/gal DTBP), the exhaust NOx increased 0-4.2% with the fuel additives. The change in
exhaust NOx due to the additives could not be explained with the 2004 Cummins engine, if any
change occurred. The FTP tests only showed a 1.3% and 1.4% increase in brake-specific NOx
80
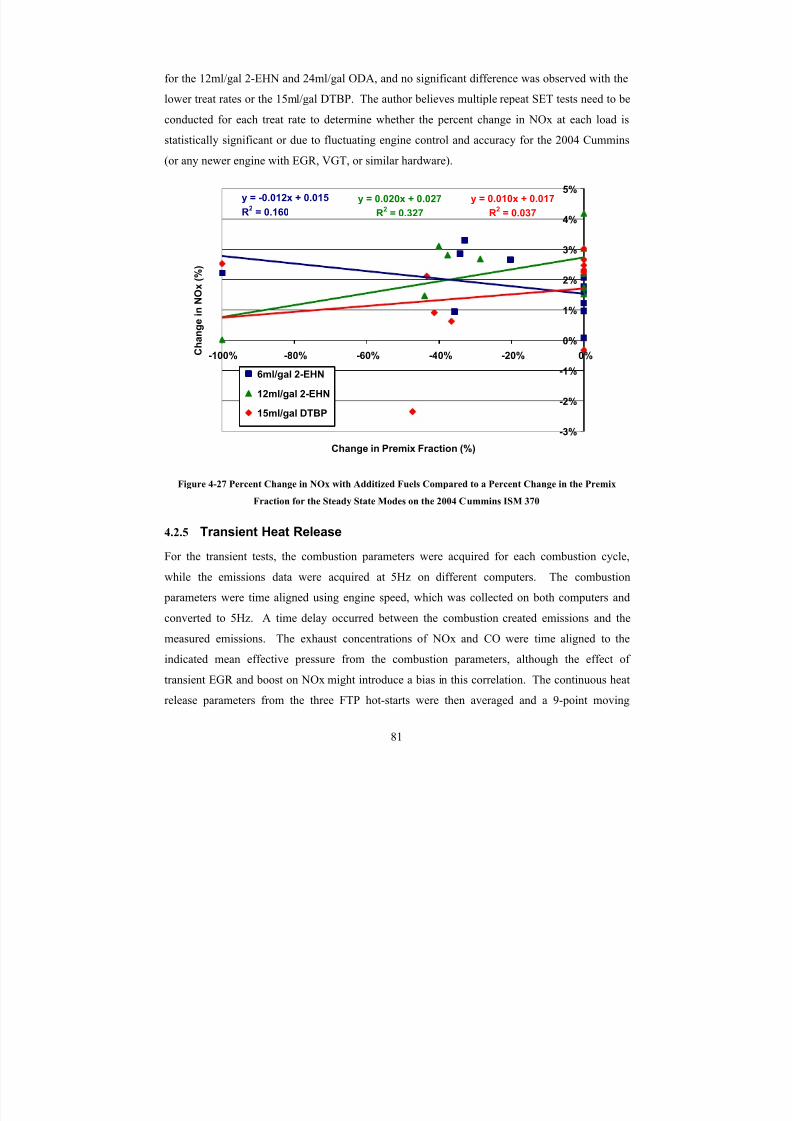
8/23/2019 The Effects of Fuel Additives on Diesel Engine Emissions During Steady State and Transient Operation
http://slidepdf.com/reader/full/the-effects-of-fuel-additives-on-diesel-engine-emissions-during-steady-state 100/163
for the 12ml/gal 2-EHN and 24ml/gal ODA, and no significant difference was observed with the
lower treat rates or the 15ml/gal DTBP. The author believes multiple repeat SET tests need to be
conducted for each treat rate to determine whether the percent change in NOx at each load is
statistically significant or due to fluctuating engine control and accuracy for the 2004 Cummins
(or any newer engine with EGR, VGT, or similar hardware).
y = 0.020x + 0.027
R2
= 0.327
y = -0.012x + 0.015
R2
= 0.160
-3%
-2%
-1%
0%
1%
2%
3%
4%
5%
-100% -80% -60% -40% -20% 0%
Change in Premix Fraction (%)
C h a n g e i n N
O x ( % )
y = 0.010x + 0.017
R2
= 0.037
6ml/gal 2-EHN
12ml/gal 2-EHN
15ml/gal DTBP
Figure 4-27 Percent Change in NOx with Additized Fuels Compared to a Percent Change in the Premix
Fraction for the Steady State Modes on the 2004 Cummins ISM 370
4.2.5 Transient Heat Release
For the transient tests, the combustion parameters were acquired for each combustion cycle,
while the emissions data were acquired at 5Hz on different computers. The combustion
parameters were time aligned using engine speed, which was collected on both computers and
converted to 5Hz. A time delay occurred between the combustion created emissions and the
measured emissions. The exhaust concentrations of NOx and CO were time aligned to the
indicated mean effective pressure from the combustion parameters, although the effect of
transient EGR and boost on NOx might introduce a bias in this correlation. The continuous heat
release parameters from the three FTP hot-starts were then averaged and a 9-point moving
81

8/23/2019 The Effects of Fuel Additives on Diesel Engine Emissions During Steady State and Transient Operation
http://slidepdf.com/reader/full/the-effects-of-fuel-additives-on-diesel-engine-emissions-during-steady-state 101/163
average was done to minimize variation when comparing to the laboratory obtained emissions
data. In Figure 4-28 through Figure 4-30, the error bars show one standard deviation from the
mean based on the three hot start FTPs for each fuel.
Figure 4-28 shows the LAFY section of the FTP as an example to describe the transient in-
cylinder data analysis. The IMEPg and difference in exhaust NOx concentration between the LC
fuel and the LC fuel with 8ml/gal 2-EHN are shown. During idle sections and the beginning of
the idle to load transition, large differences in parameters and exhaust NOx concentration were
noticed due to the high combustion variation at idle and misalignments from time aligning the
data. For any IMEPg less than 450kPa, the combustion parameters and NOx differences were
set equal to zero to minimize this effect. The choice of 450kPa for IMEPg corresponded
approximately to 20% load, which was slightly less than the 25% load points (lowest loads) inthe SET tests. At IMEPg less than ~1250KPa, a NOx decrease was noticed. No NOx change or
a NOx increase occurred at an IMEPg greater than ~1250kPa. This behavior of NOx with load
was observed with the SET testing and previously shown in the steady state testing section.
82
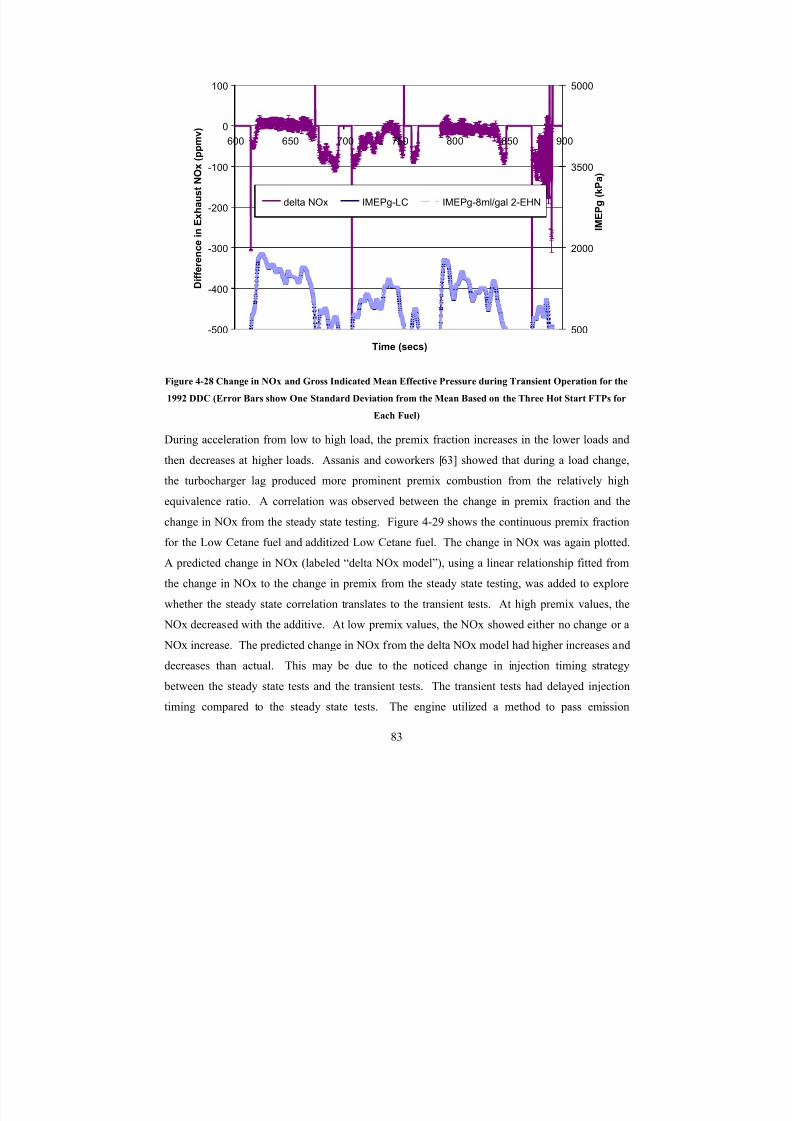
8/23/2019 The Effects of Fuel Additives on Diesel Engine Emissions During Steady State and Transient Operation
http://slidepdf.com/reader/full/the-effects-of-fuel-additives-on-diesel-engine-emissions-during-steady-state 102/163
-500
-400
-300
-200
-100
0
100
600 650 700 750 800 850 900
Time (secs)
D i f f e r e n c e i n E x h a u s t N O x ( p p
m v )
500
2000
3500
5000
I M E P g ( k P a )
delta NOx IMEPg-LC IMEPg-8ml/gal 2-EHN
Figure 4-28 Change in NOx and Gross Indicated Mean Effective Pressure during Transient Operation for the
1992 DDC (Error Bars show One Standard Deviation from the Mean Based on the Three Hot Start FTPs for
Each Fuel)
During acceleration from low to high load, the premix fraction increases in the lower loads and
then decreases at higher loads. Assanis and coworkers [63] showed that during a load change,
the turbocharger lag produced more prominent premix combustion from the relatively high
equivalence ratio. A correlation was observed between the change in premix fraction and the
change in NOx from the steady state testing. Figure 4-29 shows the continuous premix fraction
for the Low Cetane fuel and additized Low Cetane fuel. The change in NOx was again plotted.
A predicted change in NOx (labeled “delta NOx model”), using a linear relationship fitted from
the change in NOx to the change in premix from the steady state testing, was added to explore
whether the steady state correlation translates to the transient tests. At high premix values, the NOx decreased with the additive. At low premix values, the NOx showed either no change or a
NOx increase. The predicted change in NOx from the delta NOx model had higher increases and
decreases than actual. This may be due to the noticed change in injection timing strategy
between the steady state tests and the transient tests. The transient tests had delayed injection
timing compared to the steady state tests. The engine utilized a method to pass emission
83
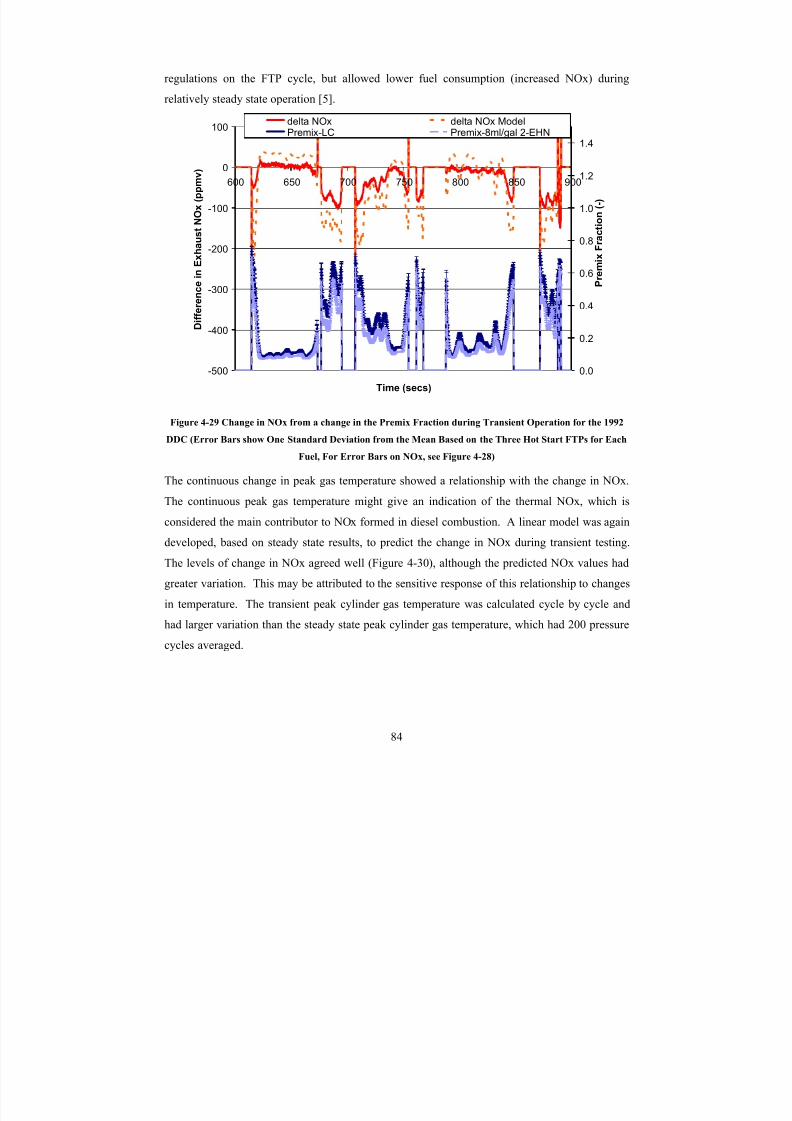
8/23/2019 The Effects of Fuel Additives on Diesel Engine Emissions During Steady State and Transient Operation
http://slidepdf.com/reader/full/the-effects-of-fuel-additives-on-diesel-engine-emissions-during-steady-state 103/163
regulations on the FTP cycle, but allowed lower fuel consumption (increased NOx) during
relatively steady state operation [5].
-500
-400
-300
-200
-100
0
100
600 650 700 750 800 850 900
Time (secs)
D i f f e r e
n c e i n E x h a u s t N O x ( p p m v )
0.0
0.2
0.4
0.6
0.8
1.0
1.2
1.4
P r e m i x F r a c t i o n ( - )
delta NOx delta NOx ModelPremix-LC Premix-8ml/gal 2-EHN
Figure 4-29 Change in NOx from a change in the Premix Fraction during Transient Operation for the 1992
DDC (Error Bars show One Standard Deviation from the Mean Based on the Three Hot Start FTPs for Each
Fuel, For Error Bars on NOx, see Figure 4-28)
The continuous change in peak gas temperature showed a relationship with the change in NOx.
The continuous peak gas temperature might give an indication of the thermal NOx, which is
considered the main contributor to NOx formed in diesel combustion. A linear model was again
developed, based on steady state results, to predict the change in NOx during transient testing.
The levels of change in NOx agreed well (Figure 4-30), although the predicted NOx values had
greater variation. This may be attributed to the sensitive response of this relationship to changes
in temperature. The transient peak cylinder gas temperature was calculated cycle by cycle andhad larger variation than the steady state peak cylinder gas temperature, which had 200 pressure
cycles averaged.
84
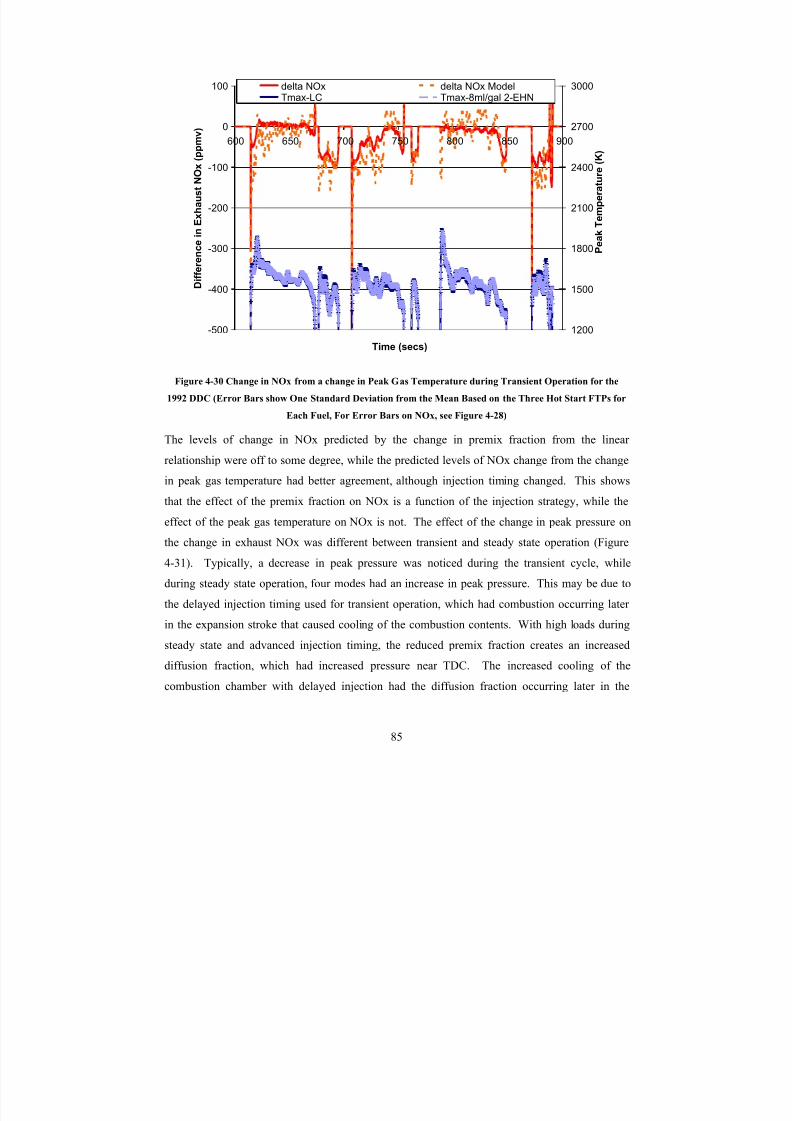
8/23/2019 The Effects of Fuel Additives on Diesel Engine Emissions During Steady State and Transient Operation
http://slidepdf.com/reader/full/the-effects-of-fuel-additives-on-diesel-engine-emissions-during-steady-state 104/163
-500
-400
-300
-200
-100
0
100
600 650 700 750 800 850 900
Time (secs)
D i f f e r e n c e i n E x h a u s t N O x ( p p
m v )
1200
1500
1800
2100
2400
2700
3000
P e a k T e m p e r a t u r e ( K )
delta NOx delta NOx ModelTmax-LC Tmax-8ml/gal 2-EHN
Figure 4-30 Change in NOx from a change in Peak Gas Temperature during Transient Operation for the
1992 DDC (Error Bars show One Standard Deviation from the Mean Based on the Three Hot Start FTPs for
Each Fuel, For Error Bars on NOx, see Figure 4-28)
The levels of change in NOx predicted by the change in premix fraction from the linear
relationship were off to some degree, while the predicted levels of NOx change from the change
in peak gas temperature had better agreement, although injection timing changed. This shows
that the effect of the premix fraction on NOx is a function of the injection strategy, while the
effect of the peak gas temperature on NOx is not. The effect of the change in peak pressure on
the change in exhaust NOx was different between transient and steady state operation (Figure
4-31). Typically, a decrease in peak pressure was noticed during the transient cycle, while
during steady state operation, four modes had an increase in peak pressure. This may be due to
the delayed injection timing used for transient operation, which had combustion occurring later in the expansion stroke that caused cooling of the combustion contents. With high loads during
steady state and advanced injection timing, the reduced premix fraction creates an increased
diffusion fraction, which had increased pressure near TDC. The increased cooling of the
combustion chamber with delayed injection had the diffusion fraction occurring later in the
85

8/23/2019 The Effects of Fuel Additives on Diesel Engine Emissions During Steady State and Transient Operation
http://slidepdf.com/reader/full/the-effects-of-fuel-additives-on-diesel-engine-emissions-during-steady-state 105/163
combustion cycle, which may reduce the burning rate; allowing less opportunity for NOx
reduction.
-300
-250
-200
-150
-100
-50
0
50
100
-300 -250 -200 -150 -100 -50 0 50 100
Change in Peak Pressure (kPa)
C h a n g e i n E x h a u s t N O x ( p p m v )
Transient
Steady State
Figure 4-31 Change in NOx from change in Peak Cylinder Pressure over Transient and Steady State
Operation for the 1992 DDC
4.3 Combustion Model Results
For the fuel additives used in this study, a change in the global heat release rate was observed
with the 1992 DDC engine. The fuel additives increased or decreased NOx depending on the
mode. A more in depth analysis of the how the global heat release rate curve effects the NOx
emissions was needed. The combustion model shown in Section 3.10 was applied to the 1992
DDC engine. The model utilized the global heat release rate, a mixing model, and the extended
Zeldovich mechanism to investigate how the change in the global heat release with additive
effected the NOx formation.
The conceptual combustion model produced by Dec [53, 54] from Laser-Sheet Imaging found
the premix portion of the heat release to have a high ER (3-4). Based on this, the ER for the
combusting fuel packages during the premix portion was investigated with a setting of two for
86
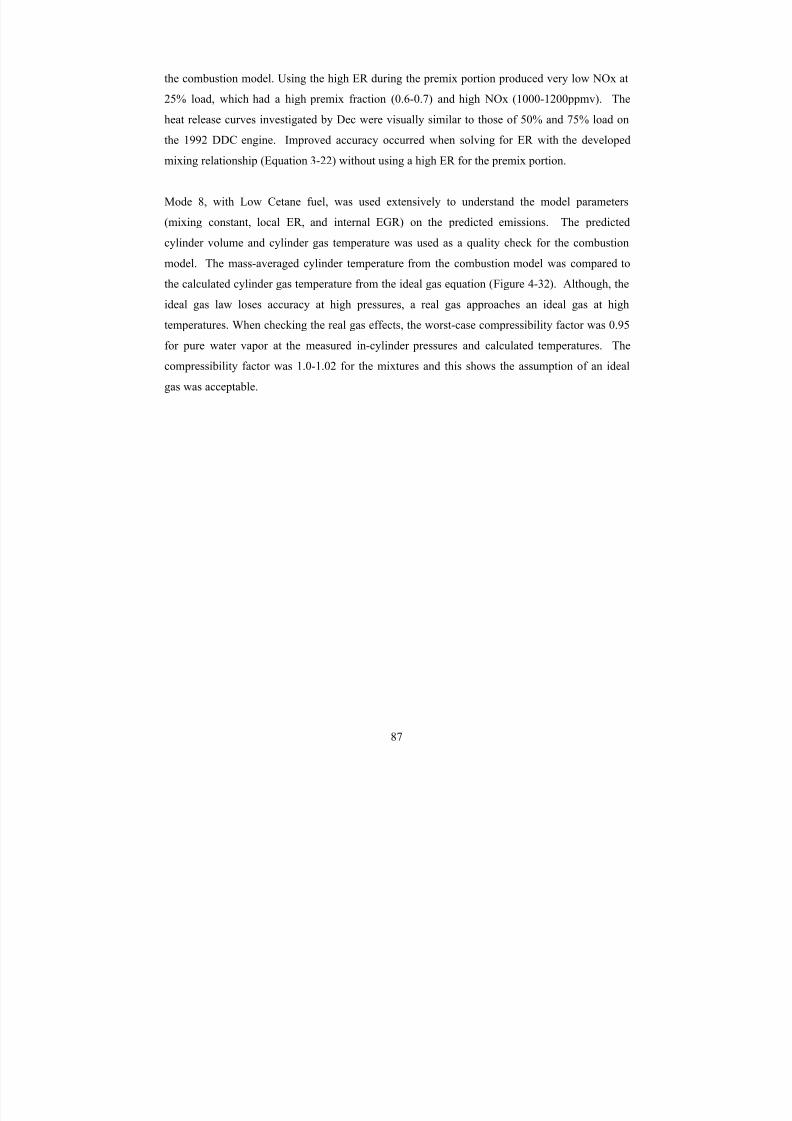
8/23/2019 The Effects of Fuel Additives on Diesel Engine Emissions During Steady State and Transient Operation
http://slidepdf.com/reader/full/the-effects-of-fuel-additives-on-diesel-engine-emissions-during-steady-state 106/163
the combustion model. Using the high ER during the premix portion produced very low NOx at
25% load, which had a high premix fraction (0.6-0.7) and high NOx (1000-1200ppmv). The
heat release curves investigated by Dec were visually similar to those of 50% and 75% load on
the 1992 DDC engine. Improved accuracy occurred when solving for ER with the developed
mixing relationship (Equation 3-22) without using a high ER for the premix portion.
Mode 8, with Low Cetane fuel, was used extensively to understand the model parameters
(mixing constant, local ER, and internal EGR) on the predicted emissions. The predicted
cylinder volume and cylinder gas temperature was used as a quality check for the combustion
model. The mass-averaged cylinder temperature from the combustion model was compared to
the calculated cylinder gas temperature from the ideal gas equation (Figure 4-32). Although, the
ideal gas law loses accuracy at high pressures, a real gas approaches an ideal gas at hightemperatures. When checking the real gas effects, the worst-case compressibility factor was 0.95
for pure water vapor at the measured in-cylinder pressures and calculated temperatures. The
compressibility factor was 1.0-1.02 for the mixtures and this shows the assumption of an ideal
gas was acceptable.
87
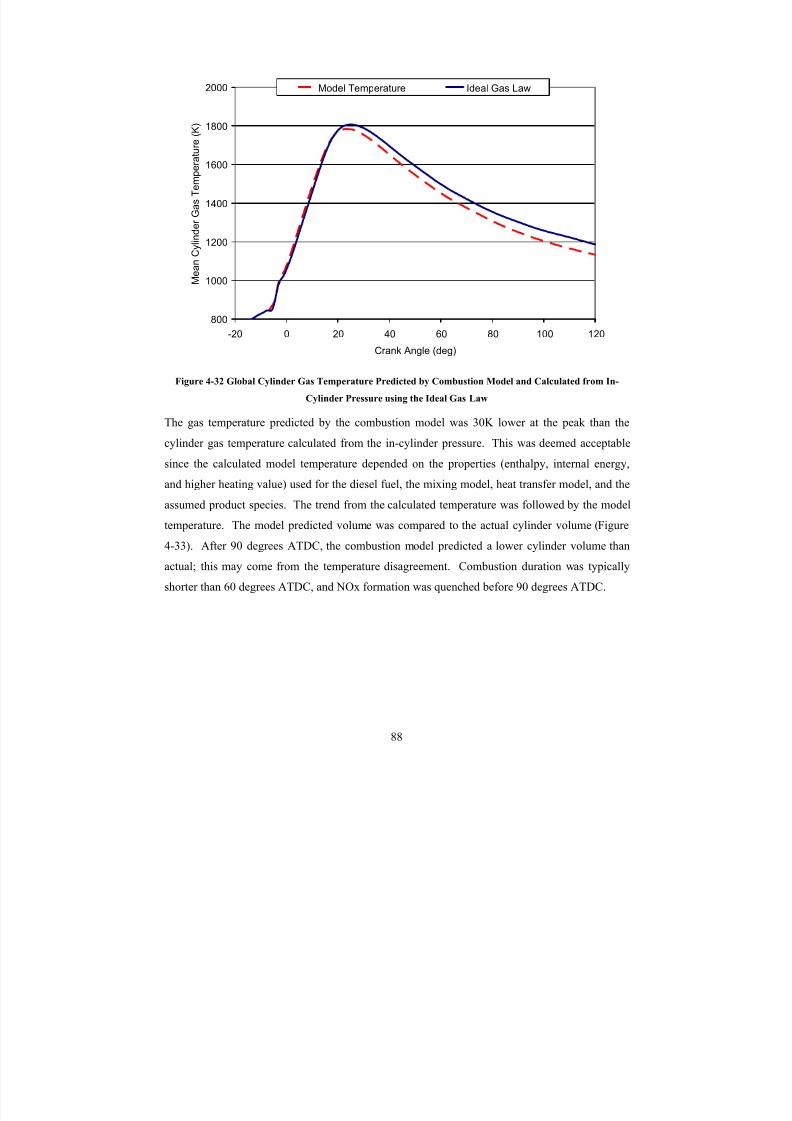
8/23/2019 The Effects of Fuel Additives on Diesel Engine Emissions During Steady State and Transient Operation
http://slidepdf.com/reader/full/the-effects-of-fuel-additives-on-diesel-engine-emissions-during-steady-state 107/163
800
1000
1200
1400
1600
1800
2000
-20 0 20 40 60 80 100 120
Crank Angle (deg)
M e a n C y l i n d e r G a s T e m p e r a t u
r e ( K )
Model Temperature Ideal Gas Law
Figure 4-32 Global Cylinder Gas Temperature Predicted by Combustion Model and Calculated from In-
Cylinder Pressure using the Ideal Gas Law
The gas temperature predicted by the combustion model was 30K lower at the peak than the
cylinder gas temperature calculated from the in-cylinder pressure. This was deemed acceptable
since the calculated model temperature depended on the properties (enthalpy, internal energy,
and higher heating value) used for the diesel fuel, the mixing model, heat transfer model, and the
assumed product species. The trend from the calculated temperature was followed by the model
temperature. The model predicted volume was compared to the actual cylinder volume (Figure
4-33). After 90 degrees ATDC, the combustion model predicted a lower cylinder volume than
actual; this may come from the temperature disagreement. Combustion duration was typically
shorter than 60 degrees ATDC, and NOx formation was quenched before 90 degrees ATDC.
88

8/23/2019 The Effects of Fuel Additives on Diesel Engine Emissions During Steady State and Transient Operation
http://slidepdf.com/reader/full/the-effects-of-fuel-additives-on-diesel-engine-emissions-during-steady-state 108/163
0.0000
0.0005
0.0010
0.0015
0.0020
-20 0 20 40 60 80 100 120
Crank Angle (deg)
V o l u m e ( m 3 )
Volume Model Volume
Figure 4-33 Cylinder Volume Predicted by Combustion Model and Actual
The combustion model parameters of mixing constant, local equivalence ratio at initial
combustion, and internal EGR were varied for mode 8. With increasing mixing (a higher mixing
constant), the predicted exhaust NOx generally decreased (Figure 4-34). The predicted CO2 was
insensitive to the mixing constant in the studied range of 1.5 to 2.5. A lower mixing constant
would result in a richer fuel package for a longer duration, but as long as the burned zone
reached the global equivalence ratio, all CO was converted to CO2, since equilibrium was
assumed and the global equivalence ratio was lean. Higher internal EGR decreased the predicted
NOx as expected. Three percent internal EGR was assumed since Heywood [60] states the
residual gas fraction has an order of a few percent for diesel engines.
89
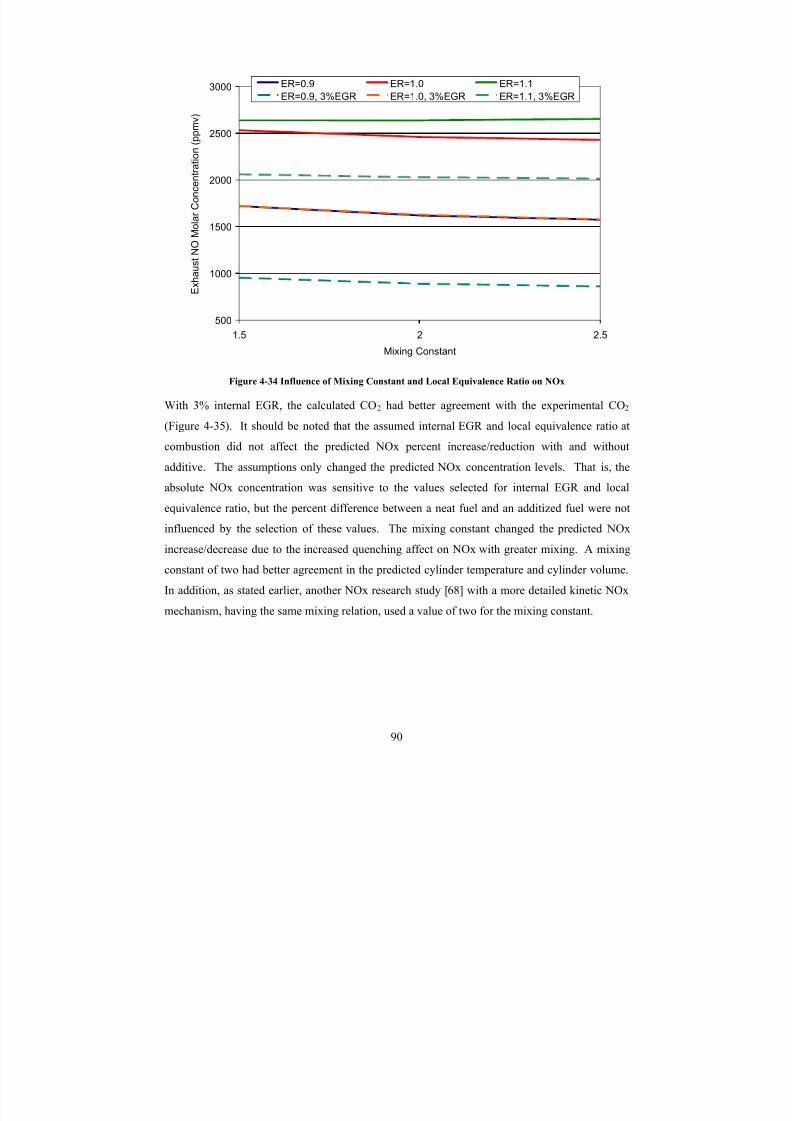
8/23/2019 The Effects of Fuel Additives on Diesel Engine Emissions During Steady State and Transient Operation
http://slidepdf.com/reader/full/the-effects-of-fuel-additives-on-diesel-engine-emissions-during-steady-state 109/163
500
1000
1500
2000
2500
3000
1.5 2 2.5
Mixing Constant
E x h a u s t N O
M o l a r C o n c e n t r a t i o n
( p p m v )
ER=0.9 ER=1.0 ER=1.1
ER=0.9, 3%EGR ER=1.0, 3%EGR ER=1.1, 3%EGR
Figure 4-34 Influence of Mixing Constant and Local Equivalence Ratio on NOx
With 3% internal EGR, the calculated CO2 had better agreement with the experimental CO2
(Figure 4-35). It should be noted that the assumed internal EGR and local equivalence ratio at
combustion did not affect the predicted NOx percent increase/reduction with and without
additive. The assumptions only changed the predicted NOx concentration levels. That is, the
absolute NOx concentration was sensitive to the values selected for internal EGR and local
equivalence ratio, but the percent difference between a neat fuel and an additized fuel were not
influenced by the selection of these values. The mixing constant changed the predicted NOx
increase/decrease due to the increased quenching affect on NOx with greater mixing. A mixing
constant of two had better agreement in the predicted cylinder temperature and cylinder volume.
In addition, as stated earlier, another NOx research study [68] with a more detailed kinetic NOx
mechanism, having the same mixing relation, used a value of two for the mixing constant.
90
8/23/2019 The Effects of Fuel Additives on Diesel Engine Emissions During Steady State and Transient Operation
http://slidepdf.com/reader/full/the-effects-of-fuel-additives-on-diesel-engine-emissions-during-steady-state 110/163
y = 0.992xR
2= 0.993
0.040
0.050
0.060
0.070
0.080
0.090
0.040 0.050 0.060 0.070 0.080 0.090
Lab CO2 Molar Fraction (-)
M o d e l C O 2 M o l a r F r a c t i o n ( - )
Figure 4-35 Model CO2 and Laboratory Based CO2 for Low Cetane Fuel with and without Additive
Utilizing the combustion model for modes 3-13, the NOx was predicted for the base (Low
Cetane) and additized (8ml/gal 2-EHN) fuels. Figure 4-36 shows the exhaust NOx
concentrations from the laboratory and the combustion model. The agreement in the predicted
NOx to the experimental NOx was 17% to 59%. If the average predicted NOx level was
adjusted to the average experimental NOx level using a constant factor, the agreement would be
±21%. Better agreement would be shown with fewer modes studied due to easier adjustment of
model parameters. Three-dimensional CFD combustion models utilizing more reactions and
kinetic mechanisms have shown NOx agreement with a difference as high as 44% [95], where
fewer modes are typically analyzed than the 11 modes at different engine load and speeds
investigated here. The bars depicted in Figure 4-36 are from a study utilizing the Guttman fuel
with four repeat SET tests. The predicted range over the average (similar to a covariance) and
the experiment NOx were computed utilizing the four repeat tests. The range over average from
the Guttman fuel was then multiplied by NOx from the additized and unadditized Low Cetane
fuels. The range was used instead of the standard deviation because the additized and
unadditized Low Cetane fuels had no repeats, and the range would give a better indication of
91

8/23/2019 The Effects of Fuel Additives on Diesel Engine Emissions During Steady State and Transient Operation
http://slidepdf.com/reader/full/the-effects-of-fuel-additives-on-diesel-engine-emissions-during-steady-state 111/163
variability from repeat tests. As shown in Figure 4-36, test-to-test variability was only a few
percent. The combustion model was shown to predict NOx trends. Research in the literature
with similar agreement to the experimental NOx has also been used to predict NOx trends [65,
66, 68].
0
300
600
900
1200
1500
1800
2100
3 4 5 6 7 8 9 10 11 12 13
Modes
E x h a u s
t N O x ( p p m v )
Laboratory - LC Model - LC Laboratory - LCA Model - LCA
Figure 4-36 Model NOx and Laboratory Based NOx for Low Cetane Fuel with and without Additive
4.3.1 Steady State
The agreement between experimental and model predicted percent NOx increase/reduction is
shown as Figure 4-37. Good agreement was obtained, particularly between the 25-75% loads.
At 100% load, the combustion model predicted a NOx decrease. The model constituents of CO2,
H2O, N2, O2, O, CO, H2, H, and OH are a function of pressure and temperature due to the
assumed equilibrium reactions. A decrease in temperature decreases NOx formation, but anincrease in pressure at the same temperature decreases the formation of O and OH, which leads
to lower NOx. For the equilibrium reaction of dioxygen and oxygen, O2→2O, at higher
pressures, Le Chatelier's principle indicates the reaction is forced to the left due to the lower
number of moles. At 100% load, the temperature profiles were very similar between the
additized and unadditized fuel, but the pressure was slightly higher with the additized fuel, which
92
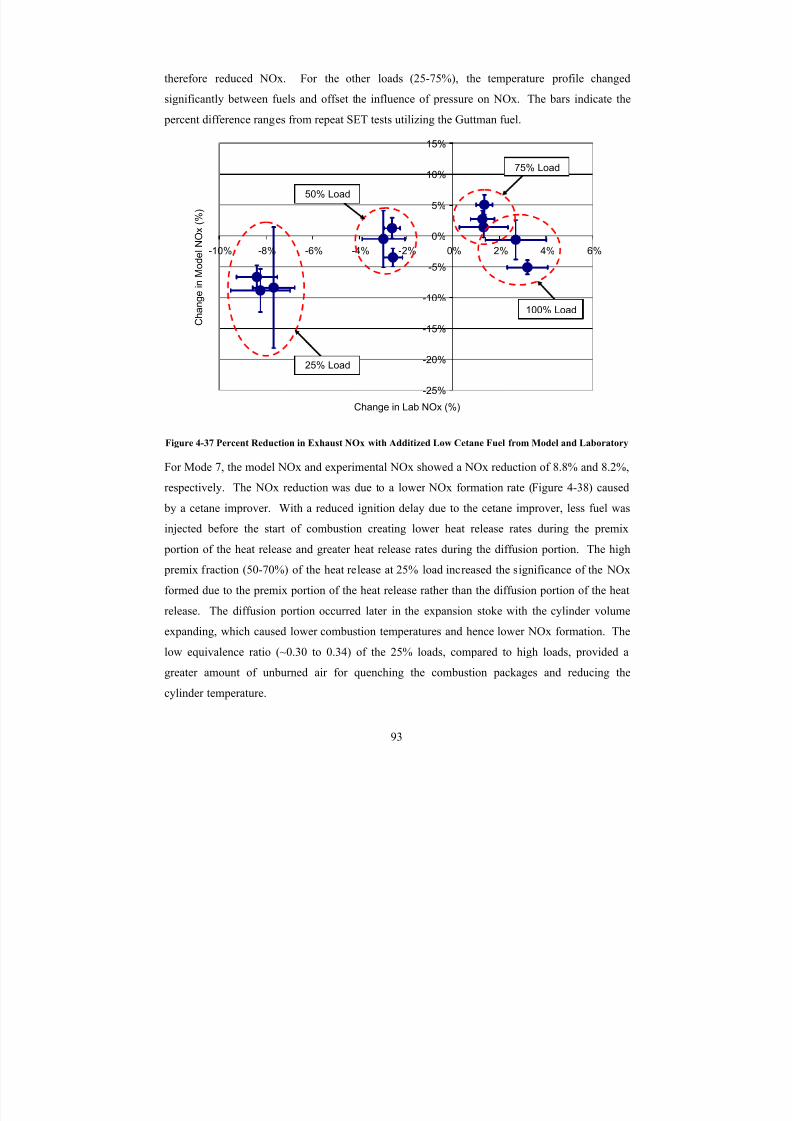
8/23/2019 The Effects of Fuel Additives on Diesel Engine Emissions During Steady State and Transient Operation
http://slidepdf.com/reader/full/the-effects-of-fuel-additives-on-diesel-engine-emissions-during-steady-state 112/163
therefore reduced NOx. For the other loads (25-75%), the temperature profile changed
significantly between fuels and offset the influence of pressure on NOx. The bars indicate the
percent difference ranges from repeat SET tests utilizing the Guttman fuel.
-25%
-20%
-15%
-10%
-5%
0%
5%
10%
15%
-10% -8% -6% -4% -2% 0% 2% 4% 6%
Change in Lab NOx (%)
C h a n g e i n M o d e l N O x ( % )
100% Load
75% Load
50% Load
25% Load
Figure 4-37 Percent Reduction in Exhaust NOx with Additized Low Cetane Fuel from Model and Laboratory
For Mode 7, the model NOx and experimental NOx showed a NOx reduction of 8.8% and 8.2%,
respectively. The NOx reduction was due to a lower NOx formation rate (Figure 4-38) caused
by a cetane improver. With a reduced ignition delay due to the cetane improver, less fuel was
injected before the start of combustion creating lower heat release rates during the premix
portion of the heat release and greater heat release rates during the diffusion portion. The high
premix fraction (50-70%) of the heat release at 25% load increased the significance of the NOx
formed due to the premix portion of the heat release rather than the diffusion portion of the heat
release. The diffusion portion occurred later in the expansion stoke with the cylinder volume
expanding, which caused lower combustion temperatures and hence lower NOx formation. The
low equivalence ratio (~0.30 to 0.34) of the 25% loads, compared to high loads, provided a
greater amount of unburned air for quenching the combustion packages and reducing the
cylinder temperature.
93
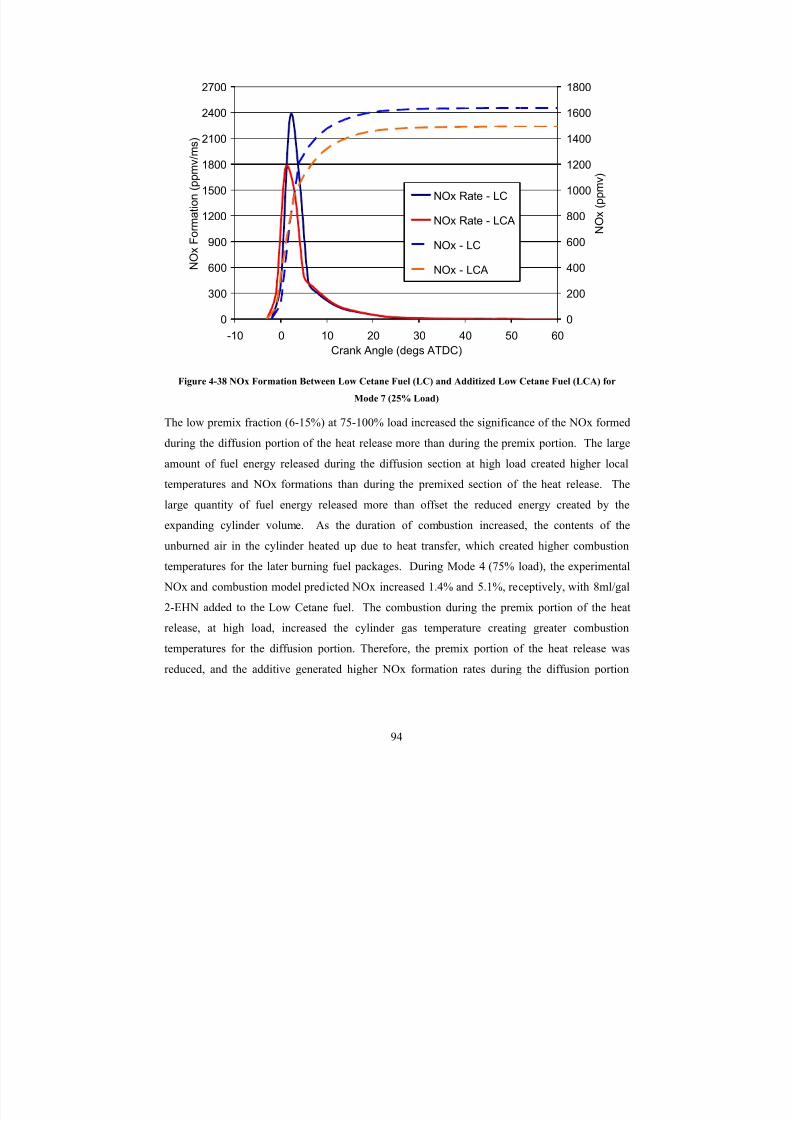
8/23/2019 The Effects of Fuel Additives on Diesel Engine Emissions During Steady State and Transient Operation
http://slidepdf.com/reader/full/the-effects-of-fuel-additives-on-diesel-engine-emissions-during-steady-state 113/163
0
300
600
900
1200
1500
1800
2100
2400
2700
-10 0 10 20 30 40 50 60
Crank Angle (degs ATDC)
N O x F o r m a t i o n ( p p m v / m
s )
0
200
400
600
800
1000
1200
1400
1600
1800
N O x ( p p m v )
NOx Rate - LC
NOx Rate - LCA
NOx - LC
NOx - LCA
Figure 4-38 NOx Formation Between Low Cetane Fuel (LC) and Additized Low Cetane Fuel (LCA) for
Mode 7 (25% Load)
The low premix fraction (6-15%) at 75-100% load increased the significance of the NOx formed
during the diffusion portion of the heat release more than during the premix portion. The large
amount of fuel energy released during the diffusion section at high load created higher local
temperatures and NOx formations than during the premixed section of the heat release. The
large quantity of fuel energy released more than offset the reduced energy created by the
expanding cylinder volume. As the duration of combustion increased, the contents of the
unburned air in the cylinder heated up due to heat transfer, which created higher combustion
temperatures for the later burning fuel packages. During Mode 4 (75% load), the experimental
NOx and combustion model predicted NOx increased 1.4% and 5.1%, receptively, with 8ml/gal
2-EHN added to the Low Cetane fuel. The combustion during the premix portion of the heatrelease, at high load, increased the cylinder gas temperature creating greater combustion
temperatures for the diffusion portion. Therefore, the premix portion of the heat release was
reduced, and the additive generated higher NOx formation rates during the diffusion portion
94
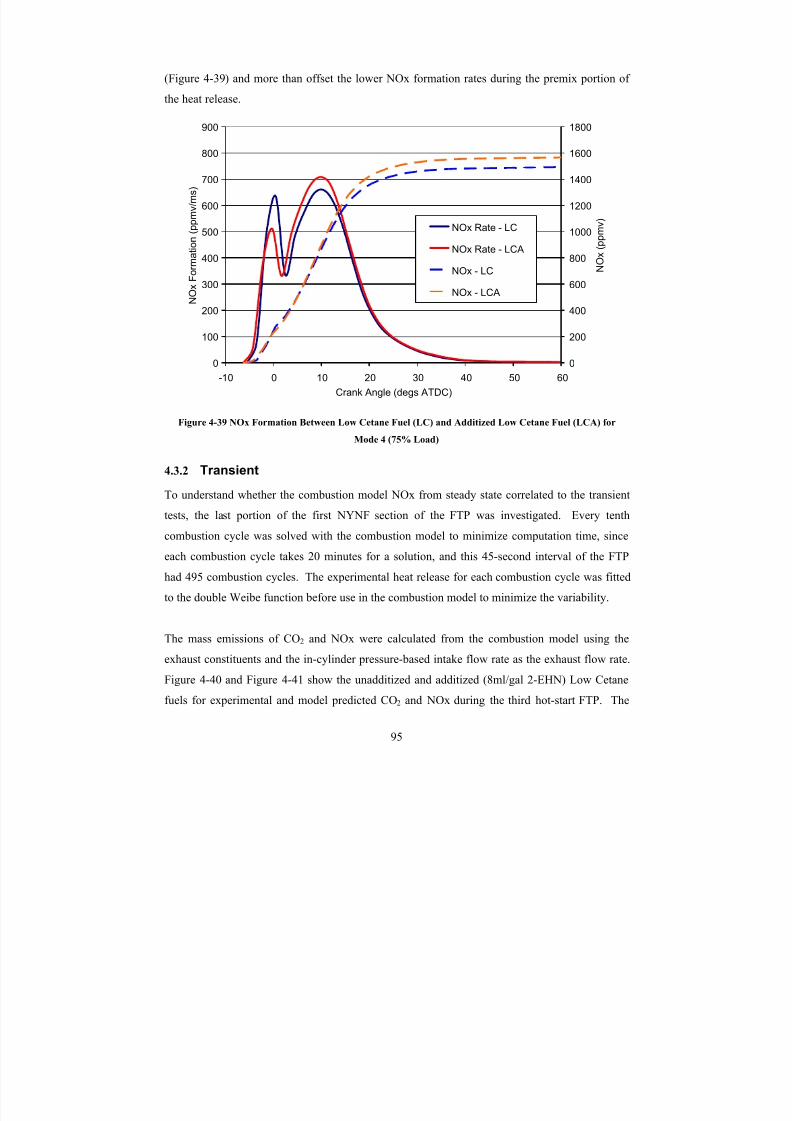
8/23/2019 The Effects of Fuel Additives on Diesel Engine Emissions During Steady State and Transient Operation
http://slidepdf.com/reader/full/the-effects-of-fuel-additives-on-diesel-engine-emissions-during-steady-state 114/163
(Figure 4-39) and more than offset the lower NOx formation rates during the premix portion of
the heat release.
0
100
200
300
400
500
600
700
800
900
-10 0 10 20 30 40 50 60
Crank Angle (degs ATDC)
N
O x F o r m a t i o n ( p p m v / m s )
0
200
400
600
800
1000
1200
1400
1600
1800
N O x ( p p m v )
NOx Rate - LC
NOx Rate - LCA
NOx - LC
NOx - LCA
Figure 4-39 NOx Formation Between Low Cetane Fuel (LC) and Additized Low Cetane Fuel (LCA) for
Mode 4 (75% Load)
4.3.2 Transient
To understand whether the combustion model NOx from steady state correlated to the transient
tests, the last portion of the first NYNF section of the FTP was investigated. Every tenth
combustion cycle was solved with the combustion model to minimize computation time, since
each combustion cycle takes 20 minutes for a solution, and this 45-second interval of the FTP
had 495 combustion cycles. The experimental heat release for each combustion cycle was fitted
to the double Weibe function before use in the combustion model to minimize the variability.
The mass emissions of CO2 and NOx were calculated from the combustion model using the
exhaust constituents and the in-cylinder pressure-based intake flow rate as the exhaust flow rate.
Figure 4-40 and Figure 4-41 show the unadditized and additized (8ml/gal 2-EHN) Low Cetane
fuels for experimental and model predicted CO2 and NOx during the third hot-start FTP. The
95
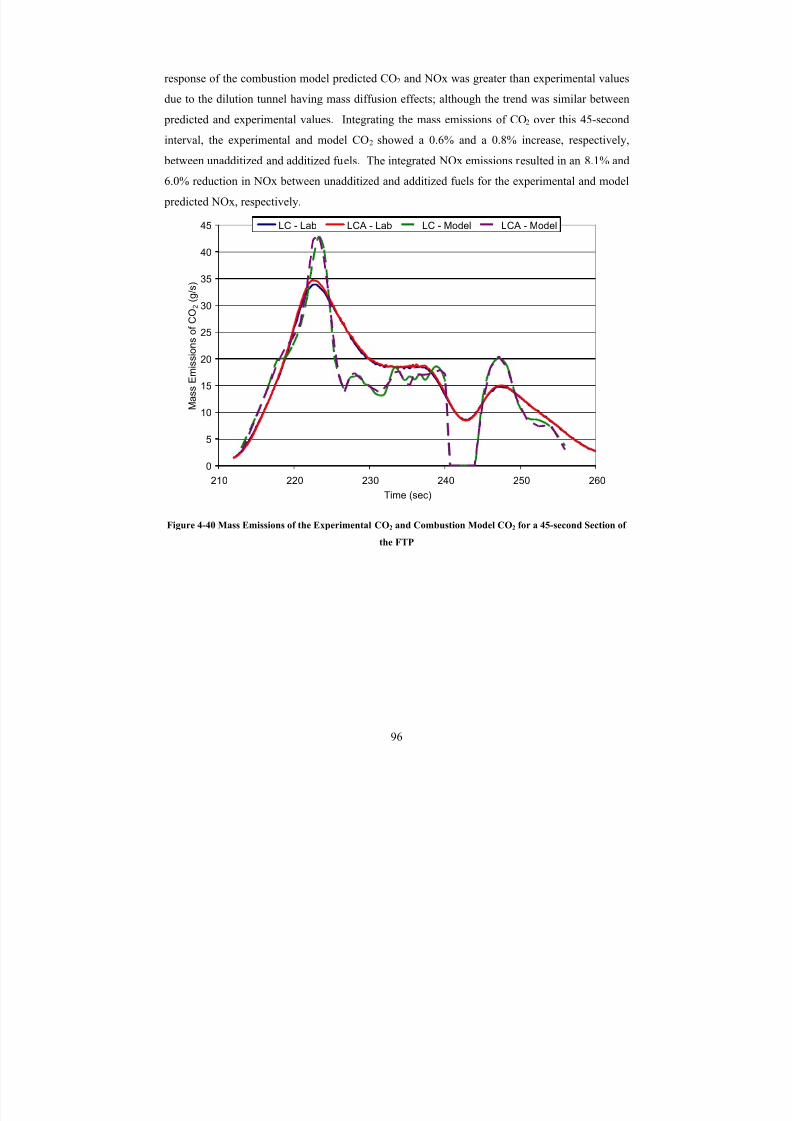
8/23/2019 The Effects of Fuel Additives on Diesel Engine Emissions During Steady State and Transient Operation
http://slidepdf.com/reader/full/the-effects-of-fuel-additives-on-diesel-engine-emissions-during-steady-state 115/163
response of the combustion model predicted CO2 and NOx was greater than experimental values
due to the dilution tunnel having mass diffusion effects; although the trend was similar between
predicted and experimental values. Integrating the mass emissions of CO2 over this 45-second
interval, the experimental and model CO2 showed a 0.6% and a 0.8% increase, respectively,
between unadditized and additized fuels. The integrated NOx emissions resulted in an 8.1% and
6.0% reduction in NOx between unadditized and additized fuels for the experimental and model
predicted NOx, respectively.
0
5
10
15
20
25
30
35
40
45
210 220 230 240 250 260
Time (sec)
M a s s E m i s s i o n s o f C O 2 ( g / s )
LC - Lab LCA - Lab LC - Model LCA - Model
Figure 4-40 Mass Emissions of the Experimental CO2 and Combustion Model CO2 for a 45-second Section of
the FTP
96
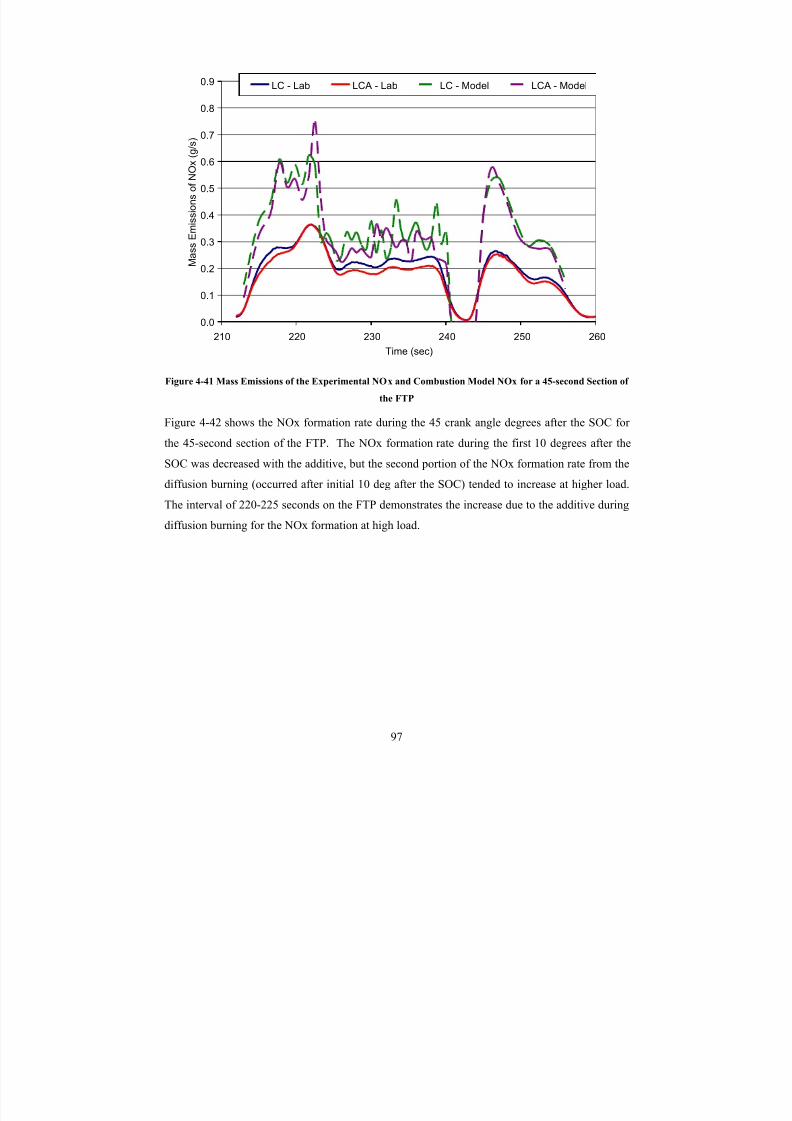
8/23/2019 The Effects of Fuel Additives on Diesel Engine Emissions During Steady State and Transient Operation
http://slidepdf.com/reader/full/the-effects-of-fuel-additives-on-diesel-engine-emissions-during-steady-state 116/163
0.0
0.1
0.2
0.3
0.4
0.5
0.6
0.7
0.8
0.9
210 220 230 240 250 260
Time (sec)
M a s s E m i s s i o n s o f N O x ( g
/ s )
LC - Lab LCA - Lab LC - Model LCA - Model
Figure 4-41 Mass Emissions of the Experimental NOx and Combustion Model NOx for a 45-second Section of
the FTP
Figure 4-42 shows the NOx formation rate during the 45 crank angle degrees after the SOC for
the 45-second section of the FTP. The NOx formation rate during the first 10 degrees after the
SOC was decreased with the additive, but the second portion of the NOx formation rate from the
diffusion burning (occurred after initial 10 deg after the SOC) tended to increase at higher load.
The interval of 220-225 seconds on the FTP demonstrates the increase due to the additive during
diffusion burning for the NOx formation at high load.
97
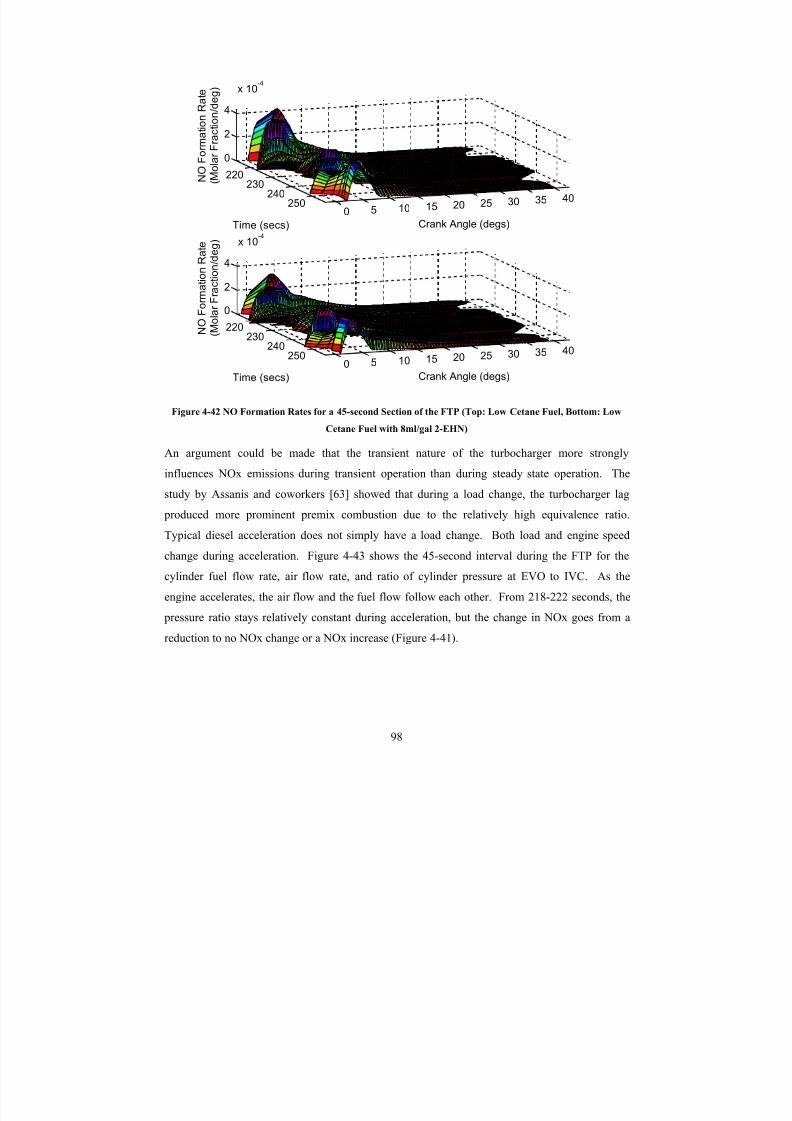
8/23/2019 The Effects of Fuel Additives on Diesel Engine Emissions During Steady State and Transient Operation
http://slidepdf.com/reader/full/the-effects-of-fuel-additives-on-diesel-engine-emissions-during-steady-state 117/163
220230
240250
0 5 10 15 20 25 30 35 40
0
2
4
x 10-4
Crank Angle (degs)Time (secs)
N O F o r m a t i o n R a t e
( M o l a r F r a c t i o n / d e g )
220230
240250
0 5 10 15 20 25 30 35 40
0
2
4
x 10-4
Crank Angle (degs)Time (secs)
N O
F o r m a t i o n R a t e
( M o l a r F
r a c t i o n / d e g )
Figure 4-42 NO Formation Rates for a 45-second Section of the FTP (Top: Low Cetane Fuel, Bottom: Low
Cetane Fuel with 8ml/gal 2-EHN)
An argument could be made that the transient nature of the turbocharger more stronglyinfluences NOx emissions during transient operation than during steady state operation. The
study by Assanis and coworkers [63] showed that during a load change, the turbocharger lag
produced more prominent premix combustion due to the relatively high equivalence ratio.
Typical diesel acceleration does not simply have a load change. Both load and engine speed
change during acceleration. Figure 4-43 shows the 45-second interval during the FTP for the
cylinder fuel flow rate, air flow rate, and ratio of cylinder pressure at EVO to IVC. As the
engine accelerates, the air flow and the fuel flow follow each other. From 218-222 seconds, the
pressure ratio stays relatively constant during acceleration, but the change in NOx goes from a
reduction to no NOx change or a NOx increase (Figure 4-41).
98
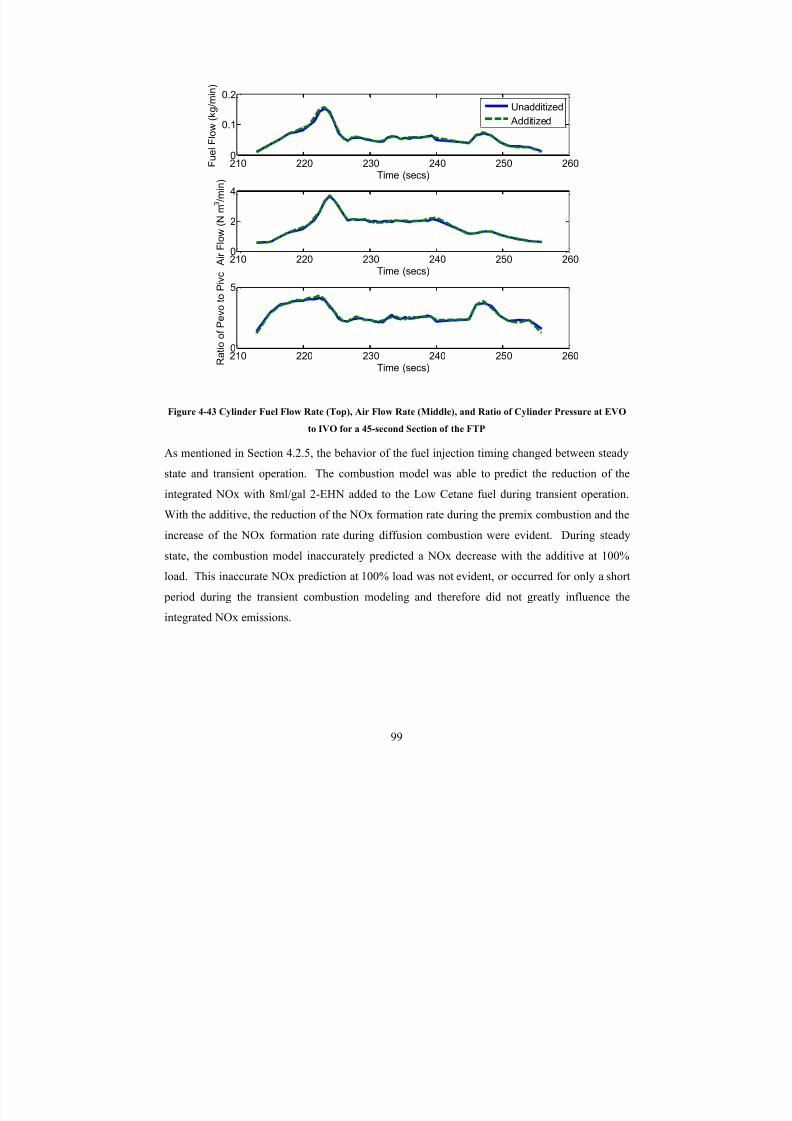
8/23/2019 The Effects of Fuel Additives on Diesel Engine Emissions During Steady State and Transient Operation
http://slidepdf.com/reader/full/the-effects-of-fuel-additives-on-diesel-engine-emissions-during-steady-state 118/163
210 220 230 240 250 2600
0.1
0.2
Time (secs) F u e l F l o w ( k g / m i n )
210 220 230 240 250 2600
2
4
Time (secs) A i r F l o w ( N m
3 / m i n )
210 220 230 240 250 2600
5
Time (secs) R a t i o o f P e v o t o P i v c
Unadditized
Additized
Figure 4-43 Cylinder Fuel Flow Rate (Top), Air Flow Rate (Middle), and Ratio of Cylinder Pressure at EVO
to IVO for a 45-second Section of the FTP
As mentioned in Section 4.2.5, the behavior of the fuel injection timing changed between steadystate and transient operation. The combustion model was able to predict the reduction of the
integrated NOx with 8ml/gal 2-EHN added to the Low Cetane fuel during transient operation.
With the additive, the reduction of the NOx formation rate during the premix combustion and the
increase of the NOx formation rate during diffusion combustion were evident. During steady
state, the combustion model inaccurately predicted a NOx decrease with the additive at 100%
load. This inaccurate NOx prediction at 100% load was not evident, or occurred for only a short
period during the transient combustion modeling and therefore did not greatly influence the
integrated NOx emissions.
99
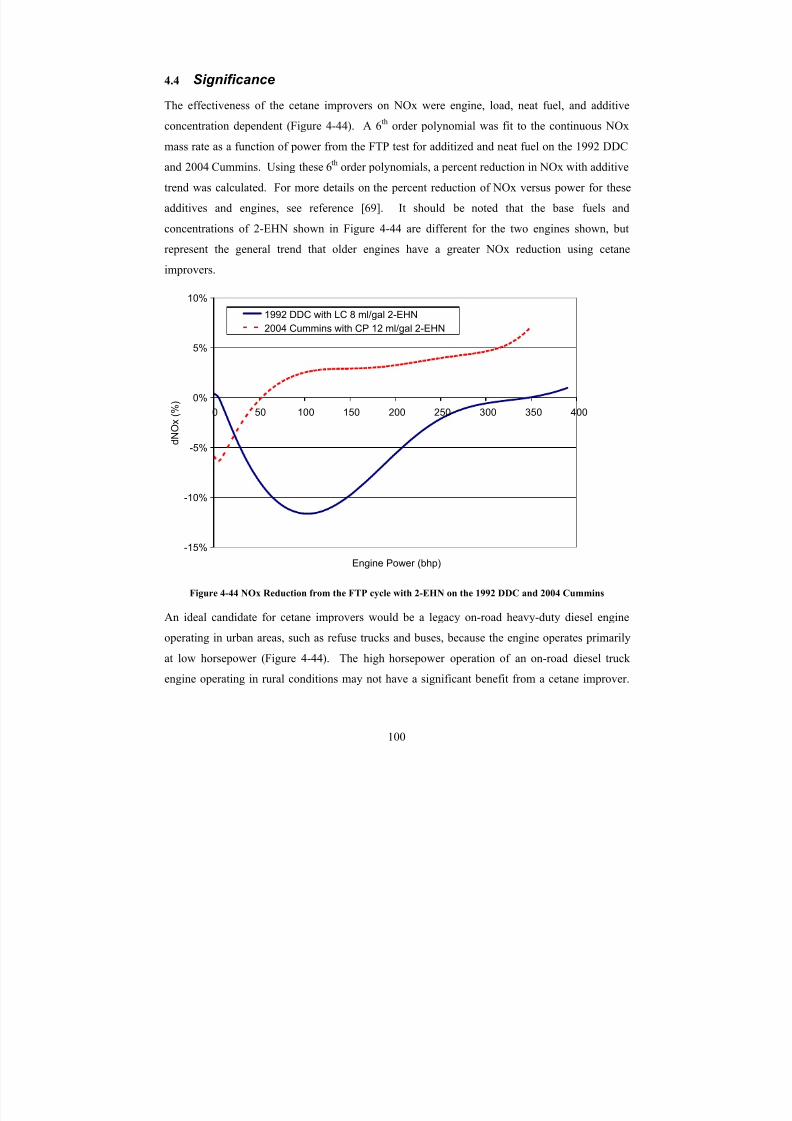
8/23/2019 The Effects of Fuel Additives on Diesel Engine Emissions During Steady State and Transient Operation
http://slidepdf.com/reader/full/the-effects-of-fuel-additives-on-diesel-engine-emissions-during-steady-state 119/163
4.4 Significance
The effectiveness of the cetane improvers on NOx were engine, load, neat fuel, and additive
concentration dependent (Figure 4-44). A 6th order polynomial was fit to the continuous NOx
mass rate as a function of power from the FTP test for additized and neat fuel on the 1992 DDCand 2004 Cummins. Using these 6th order polynomials, a percent reduction in NOx with additive
trend was calculated. For more details on the percent reduction of NOx versus power for these
additives and engines, see reference [69]. It should be noted that the base fuels and
concentrations of 2-EHN shown in Figure 4-44 are different for the two engines shown, but
represent the general trend that older engines have a greater NOx reduction using cetane
improvers.
-15%
-10%
-5%
0%
5%
10%
0 50 100 150 200 250 300 350 400
Engine Power (bhp)
d N O x ( % )
1992 DDC with LC 8 ml/gal 2-EHN
2004 Cummins with CP 12 ml/gal 2-EHN
Figure 4-44 NOx Reduction from the FTP cycle with 2-EHN on the 1992 DDC and 2004 Cummins
An ideal candidate for cetane improvers would be a legacy on-road heavy-duty diesel engine
operating in urban areas, such as refuse trucks and buses, because the engine operates primarily
at low horsepower (Figure 4-44). The high horsepower operation of an on-road diesel truck
engine operating in rural conditions may not have a significant benefit from a cetane improver.
100

8/23/2019 The Effects of Fuel Additives on Diesel Engine Emissions During Steady State and Transient Operation
http://slidepdf.com/reader/full/the-effects-of-fuel-additives-on-diesel-engine-emissions-during-steady-state 120/163
Modern engines with higher compression ratios and/or EGR may not benefit from a cetane
improver at higher average engine loads.
101
8/23/2019 The Effects of Fuel Additives on Diesel Engine Emissions During Steady State and Transient Operation
http://slidepdf.com/reader/full/the-effects-of-fuel-additives-on-diesel-engine-emissions-during-steady-state 121/163
5 Conclusions and Recommendations
5.1 Conclusions
Three cetane improver additives of DTBP, 2-EHN, and ODA (proprietary) were investigated
with a variety of base fuels on 1992 DDC and 2004 Cummins engines. The engines were
exercised over the transient heavy-duty FTP cycle and the steady state SET test, with in-cylinder
pressure collected. A zero-dimensional heat release model was applied to an averaged pressure
trace for the steady state modes and cycle-by-cycle during transient testing. The emissions of
CO, CO2, THC, NOx, and TPM were collected. A phenomenological combustion model was
developed to investigate the influence of the shift in global heat release due to the additives on
the NOx emissions.
On the FTP cycle, the cetane improvers showed a statistically significant NOx decrease of 2.2-
4.9% with the 1992 DDC engine and a 0-1.4% increase of NOx with the 2004 Cummins engine
compared to the base fuels (excluding biodiesel blends). The emissions of CO, THC, and TPM
showed percent reductions of 4.6-8.9%, 10.9-37.0%, and 6.6 to -1.0% (increase), respectively, on
the 1992 DDC engine. On the 2004 Cummins engine, the emissions of CO with the cetane
improvers either showed no significant difference or reductions of up to 14.7% compared to the
base fuels (excluding biodiesel blends), while THC and TPM had no significant difference.
Compared to the base fuel (excluding biodiesel blends) during steady state testing, the emissions
of NOx showed up to a 1.8% increase at 100% load and up to an 8% decrease at 25% load on the
1992 DDC engine. The emissions of CO reduced (up to 26%) for all modes, and THC had no
change for some modes and reductions (up to 39%) for others when compared to the base fuels
(excluding biodiesel blends). For the 2004 Cummins engine, no change in NOx or a 6% NOx
increase with additives was noticed during SET tests when compared to the base fuel (excluding
biodiesel blends).
For both engines on the FTP cycle, the B20 biodiesel blends of soy, tallow, and cottonseed fuels
significantly reduced CO (9.8-14.4%), THC (12-34.2%), and TPM (23.2-34.7%) compared to the
102
8/23/2019 The Effects of Fuel Additives on Diesel Engine Emissions During Steady State and Transient Operation
http://slidepdf.com/reader/full/the-effects-of-fuel-additives-on-diesel-engine-emissions-during-steady-state 122/163
neat fuel. The NOx emissions significantly decreased (2.1-2.2%) on the 1992 DDC engine and
significantly increased (2.8-4.3%) on the 2004 Cummins engine compared to the neat fuel. The
neat fuel used for the biodiesel blends on the 1992 DDC engine was of lower cetane (46.2) than
the neat fuel (49.9) on the 2004 Cummins engine. The addition of a cetane improver to the
biodiesel blends resulted in no significant difference on the 2004 Cummins, while the NOx
emissions were reduced (0.7-0.9%) on the 1992 DDC engine. During the SET tests, the
biodiesel blends showed similar trends as the additized neat fuel with reduced NOx at low load
and increased NOx at high load on the 1992 DDC engine, suggesting a cetane effect created by
the biodiesel.
The fuel additives reduced the premix fraction of the heat release for all loads on the 1992 DDC
engine and low load on the 2004 Cummins engine. The reduction of the premix fraction with thecetane improvers on the 1992 DDC engine correlated with NOx change, although the premix
fraction was a function of injection timing. The change in peak cylinder gas temperature and the
change in NOx with the cetane improvers showed consistent correlations between steady state
and transient testing on the 1992 DDC engine.
The 2004 Cummins engine had higher boost pressure, MAT, and intake air flow, which may
have reduced the premix fraction. Disabling the EGR had no effect on the ability of the cetane
improvers to reduce NOx on the 2004 Cummins engine. More control over the 2004 Cummins
engine is needed to determine cetane improver effects, since large variations in the steady state
emissions were noticed for repeat tests. These variations were attributed to changes in the ECU
engine control.
On the transient heat release cycles, a similar change in heat release was obtained with the use of
fuel additives as in the steady state modes. As the engine accelerated from low load to high load,
the NOx decreased then had no change or a NOx increase with the premix fraction being high at
low load and low at high load.
The phenomenological combustion model showed that the change in global heat release by the
cetane improvers on the 1992 DDC engine was the cause of the fuel additives’ changes in NOx.
103
8/23/2019 The Effects of Fuel Additives on Diesel Engine Emissions During Steady State and Transient Operation
http://slidepdf.com/reader/full/the-effects-of-fuel-additives-on-diesel-engine-emissions-during-steady-state 123/163
The combustion model was applied to the steady state modes and a 45-second section of the FTP
cycle. The steady state percent change in NOx trend with the cetane improvers agreed with the
experimental values, except at 100% load. The percent reduction of the integrated NOx from the
combustion model for the base and additized fuels agreed within 1.1% of the experimental NOx
over the 45-second section of the FTP.
The strong correlations between the change in NOx and the change in heat release parameters
showed that cetane improvers shift the heat release profile creating reduced NOx at low load and
increased NOx at high load. The phenomenological combustion model related the shifted heat
release profile to the change in NOx, thereby solidifying that the reduced ignition delay creates
the conditions for both reduced NOx at low load and increased NOx at high load. The tools of
analyzing the heat release parameters and the phenomenological combustion model provided atechnique to separate the influence of a shifted heat release profile (and therefore, a shifted
cylinder temperature and pressure) from other effects (chemical formation, lower adiabatic flame
temperature, and increased EGR). The application of the heat release analysis and combustion
model was able to distinguish differences between steady state and transient operation.
5.2 Recommendations
Emissions testing, a detailed heat release analysis, and a NOx combustion model were used to
determine the influence of cetane improvers on emissions. The heat release analysis and
combustion model were applied to steady state and transient testing. The analysis methods (heat
release parameters and combustion model) could be applied to any number of fuel studies
including biodiesel, combustion improver additives, or oxygenates. A change in the fuel may
create a chemical formation effect and a shifted heat release rate profile. Correlating the change
in heat release parameters to the change in emissions would help determine how much a shifted
global heat release effects the emissions. The NOx combustion model provides more
understanding of how a shifted global heat release rate effects emissions.
These methodologies could be applied in engine control studies to help adjust fuel injection
characteristics. With engine control dependent on operating conditions (steady state or
104
8/23/2019 The Effects of Fuel Additives on Diesel Engine Emissions During Steady State and Transient Operation
http://slidepdf.com/reader/full/the-effects-of-fuel-additives-on-diesel-engine-emissions-during-steady-state 124/163
transient), applying the heat release analysis and combustion model to transient conditions could
be used to improve engine tuning.
Some recommendations for further studying of the effect of fuel additives on diesel engine
emissions and performance are:
• The use of a more complex combustion model, with full kinetics, may improve the
correlation with experimental results.
• The SET tests, especially on the 2004 Cummins engine or newer engines, should have
multiple tests for statistical significance.
• Based on the results of the 1992 DDC engine, the use of a fuel additive that ignites early
after injection, but slows burning (low premix spike and high diffusion) may provide
maximum NOx reduction.
• Due to the nature of how cetane improvers cause increased NOx at high load, a fuel
additive that reduces ignition delay at low load, but increases the ignition delay at high
load may provide the most NOx reduction for the 1992 DDC engine.
• A greater number of additives varieties could be investigated, such as metal-based
additives (platinum/cerium).
• Increasing levels of nitrogen in the fuel might be interesting to investigate since verylittle, if any, literature has looked into fuel-borne NOx for diesel engines. However,
nitrogen levels in present United States on-road fuels are typically low (< 300 ppmw). A
100% fuel-borne nitrogen conversion rate from 24ml/gal 2-EHN on the 2004 Cummins
engine would be up to 6% of the total NOx mass produced by the engine.
105
8/23/2019 The Effects of Fuel Additives on Diesel Engine Emissions During Steady State and Transient Operation
http://slidepdf.com/reader/full/the-effects-of-fuel-additives-on-diesel-engine-emissions-during-steady-state 125/163
6 References
1. September 2003 Report: National Air Quality and Emissions Trends Report, 2003 Special
Studies Edition, Environmental Protection Agency, Washington, DC, USEPA #454/R-03-
005, 2003.
2. Pope, C. III, “Air Pollution and Health -- Good News and Bad,” The New England Journal of
Medicine, Vol. 351, pgs. 1132-1134, 2004.
3. Maitre, A., Bonneterre, V., Huillard, L., Sabatier, P., and de Gaudemaris, R., “Impact of
Urban Atmospheric Pollution on Coronary Disease,” Vol. 27, pgs. 2275-2284, European
Heart Journal, 2006.
4. Frey, H., Unal, A., Rouphall, N., and Colyar, J., “On-Road Measurement of Vehicle Tailpipe
Emissions Using a Portable Instrument,” Journal of the Air & Waste Management
Association, Vol. 53, pgs. 992-1002, 2003.
5. “Notice of Filing of Consent Decree under the Clean Air Act,” Office of the Federal
Register National Archives and Records Administration, Vol. 63, No. 212, Washington, D.C,
1998.
6. Seneczko, M., “Quest for a Million-Mile Vehicle,” Machine Design, Vol. 55, No. 21, pgs.
40-48, 1983.
7. The California Diesel Fuel Regulations, in Title 13, California Code of Regulations, 2004.8. Kullnowski, A., Henly, T., and Growcott, P., “Diesel Fuel Additives to Meet Worldwide
Performance and Emissions Requirements,” Warrendale, PA, SAE Paper No. 932737, 1993.
9. Lange, W., Cooke, J., Gadd, P., Zurner, H., Schlogl, H., and Richter, K., “Influence of Fuel
Properties on Exhaust Emissions from Advanced Heavy-Duty Engines Considering the
Effect of Natural and Additive Enhanced Cetane Number,” Warrendale, PA, SAE Paper No.
972894, 1997.
10. Ryan III, T., Buckingham, J., Dodge, L., and Olikara, C., “The Effects of Fuel Properties on
Emissions from a 2.5gm NOx Heavy-Duty Diesel Engine,” Warrendale, PA, SAE Paper No.
982491, 1998.
11. Barbier, P., “Evaluation of Cetane Improver Effects on Regulated Emissions from a
Passenger Car Equipped with a Common Rail Diesel Engine,” Warrendale, PA, SAE Paper
No. 2000-01-1853, 2000.
106
8/23/2019 The Effects of Fuel Additives on Diesel Engine Emissions During Steady State and Transient Operation
http://slidepdf.com/reader/full/the-effects-of-fuel-additives-on-diesel-engine-emissions-during-steady-state 126/163
12. Wong, C. and Gilbert, J., “Investigation of the Performance of a Heavy Duty Diesel Truck
Engine Operating on Low Cetane Diesel Fuel,” Warrendale, PA, SAE Paper No. 881647,
1988.
13. McMillan, M. and Halsall, R., “Fuel Effects on Combustion and Emissions in a Direct
Injection Diesel Engine,” Warrendale, PA, SAE Paper No. 881650, 1988.
14. Sienicki, E., Jass, R., Slodowske, W., McCarthy, C., and Krodel, A., “Diesel Fuel Aromatic
and Cetane Number Effects on Combustion and Emissions From a Prototype 1991 Diesel
Engine,” Warrendale, PA, SAE Paper No. 902172, 1990.
15. Li, X., Chippior, W., and G ϋlder, Ö., “Effects of Cetane Enhancing Additives and Ignition
Quality on Diesel Engine Emissions,” Warrendale, PA, SAE Paper No. 972968, 1992.
16. Code of Federal Regulations, “Control of Emissions from New and In-Use Highway
Vehicles and Engines,” CFR Title 40 Part 86, Office of the Federal Register NationalArchives and Records Administration, Washington, DC, 2004.
17. “Standard Test Method for Cetane Number of Diesel Fuel Oil,” American Society for
Testing and Materials, West Conshohocken, PA, ASTM-D613-05, 2005.
18. Lange, W., “The Effect of Fuel Properties on Particulates Emissions in Heavy-Duty Truck
Engines Under Transient Operating Conditions,” Warrendale, PA, SAE Paper No. 912425,
1991.
19. McCarthy, C., Slodowske, W., Sien.0icki, E., and Jass, R., “Diesel Fuel Property Effects on
Exhaust Emissions from a Heavy Duty Diesel Engine that Meets 1994 Emissions
Requirements,” Warrendale, PA, SAE Paper No. 922267, 1992.
20. Singal, S. and Pundir, B., “Diesel Fuel Quality and Particulate Emissions: An Overview,”
Warrendale, PA, SAE Paper No. 961185, 1996.
21. Reddy, V., “Evaluation of Current and Early Production Electronically Controlled Heavy-
Duty Diesel Engine Emissions Based on Fuel Property Differences,” Master's Thesis, West
Virginia University, 2006.
22. Ochoterena, R., Larsson, M., Andersson, S., and Denbratt, I., “Optical Studies of Spray
Development and Combustion Characterisation of Oxygenated and Fischer-Tropsch
FuelsGTL Fuels,” Warrendale, PA, SAE Paper No. 2008-01-1393, 2008.
23. Wall, J. and Hoekman, S., “Fuel Composition Effects on Heavy-Duty Diesel Particulate
Emissions,” Warrendale, PA, SAE Paper No. 841364, 1984.
107
8/23/2019 The Effects of Fuel Additives on Diesel Engine Emissions During Steady State and Transient Operation
http://slidepdf.com/reader/full/the-effects-of-fuel-additives-on-diesel-engine-emissions-during-steady-state 127/163
24. Bello, A., Torres, J., Herrera J., and Sarmiento, J., “Effect of the Diesel Properties on the
Emissions of Particulate Matter,” Warrendale, PA, SAE Paper No. 2000-01-2888, 2000.
25. Ullman, T., “Investigation of the Effects of Fuel Composition on Heavy-Duty Diesel Engine
Emissions,” Warrendale, PA, SAE Paper No. 892072, 1989.
26. Signer, M., Heinze, P., Mercogliano, R., and Stein H., “European Programme on Emissions,
Fuels and Engine Technologies (EPEFE) – Heavy Duty Diesel Study,” Warrendale, PA, SAE
Paper No. 961074, 1996.
27. Den Ouden, C., Clark, R., Cowley, L., Stradling R., Lange, W., and Maillard, C., “Fuel
Quality Effects on Particulate Matter Emissions from Light-and Heavy-Duty Diesel
Engines,” Warrendale, PA, SAE Paper No. 942022, 1994.
28. Flanigan, C., Litzinger, T., and Graves, R. “The Effect of Aromatics and Cycloparaffins on
DI Diesel Emissions,” Warrendale, PA, SAE Paper No. 892130, 1989.29. Bertoli, C., Giacomo, N., Iorio, B., and Prati, M., “The Influence of Fuel Composition on
Particulate Emissions of DI Diesel Engines,” Warrendale, PA, SAE Paper No. 932733, 1993.
30. Kidoguchi, Y., Yang, C., and Miwa, K., “Effects of Fuel Properties on Combustion and
Emission Characteristics of a Direct-Injection Diesel Engine,” Warrendale, PA, SAE Paper
No. 2000-01-1851, 2000.
31. Baranescu, R., “Influence of Fuel Sulfur on Diesel Particulate Emissions,” Warrendale, PA,
SAE Paper No. 881174, 1988.
32. Higgins, B., Siebers, D., Mueller, C., and Aradi, A., “Effects of an Ignition-Enhancing,
Diesel-Spray Evaporation, Mixing, Ignition, and Combustion,” Twenty-Seventh Symposium
(International) on Combustion, The Combustion Institute, pgs.1873-1880, 1998.
33. McCormick, R., Alvarez, J., Graboski, M., Tyson, K., and Vertin, K., “Fuel Additive and
Blending Approaches to Reducing NOx Emissions from Biodiesel,” Warrendale, PA, SAE
Paper No. 2002-01-1658, 2002.
34. Hess, H., Boehman, A., Tijm, P., and Waller, F., “Experimental Studies of the Impact of
CETANER on Diesel Combustion and Emissions,” Warrendale, PA, SAE Paper No. 2000-
01-2886, 2000.
35. Liotta, F. and Mantalvo, D., “The Effect of Oxygenated Fuels on Emissions from a Modern
Heavy-Duty Diesel Engine,” Warrendale, PA, SAE Paper No. 932734, 1993.
108
8/23/2019 The Effects of Fuel Additives on Diesel Engine Emissions During Steady State and Transient Operation
http://slidepdf.com/reader/full/the-effects-of-fuel-additives-on-diesel-engine-emissions-during-steady-state 128/163
36. Ullman, T., Spreen, K., and Mason, R., “Effects of Cetane Number, Cetane Improver,
Aromatics, and Oxygenates on 1994 Heavy Duty Diesel Engine Emissions,” Warrendale,
PA, SAE Paper No. 941020, 1994.
37. Zannis, T., Hountalas, D., and Kouremenos, D., “Experimental Investigation to Specify the
Effect of Oxygenated Additive Content and Type on DI Diesel Engine Performance and
Emissions” Warrendale, PA, SAE Paper No. 2004-01-0097, 2004.
38. Lu, X., Yang, J., Zhang, W., and Huang, Z., “Improving Combustion and Emissions of
Direct Injection Compression and Emissions of Direct Injection Compression Ignition
Engines Using Oxygenated Fuel Additives Combined with a Cetane Improver,” Energy &
Fuels, Vol. 19 No. 5, pgs. 1879 -1888, 2005.
39. Song, J., Zello, V., Boehman, A., and Waller, F., “Comparison of the Impact of Intake
Oxygen Enrichment and Fuel Oxygenation on Diesel Combustion and Emissions,” Energy &Fuels, Vol. 18 No. 5, 2004.
40. Bertola, A. and Boulouchos, K., “Oxygenated Fuels for Particulate Emissions Reduction in
Heavy-Duty DI-Diesel Engines with Common-Rail Fuel Injection,” Warrendale, PA, SAE
Paper No. 2000-01-2885, 2000.
41. Nylund, N. and Aakko, P., “Characterization of New Fuel Qualities,” Warrendale, PA, SAE
Paper No. 2000-01-2009, 2000.
42. Caton, J., Ruemmele, W., Kelso, D., and Epperly, W., “Performance and Fuel Consumption
of a Single-Cylinder, Direct-Injection Diesel Engine Using a Platinum Fuel Additive,”
Warrendale, PA, SAE Paper No. 910229, 1991.
43. Valentine, J., Peter-Hoblyn, J., and Acres, G., “Emissions Reduction and Improved Fuel
Economy Performance from a Bimetallic Paltinum/Cerium Diesel Fuel Additive at Ultra-
Low Dose Rates,” Warrendale, PA, SAE Paper No. 2000-01-1934, 2000.
44. “Standard Specification for Diesel Fuel Oils,” American Society for Testing and Materials,
West Conshohocken, PA, ASTM-D975-06, 2006.
45. Langer, D., Petek, N., and Schiferl, E., “Maximizing the Effectiveness of Water Blended
Fuel in Reducing Emissions by Varying Injection Timing or Using Aftertreatment Device,”
Warrendale, PA, SAE Paper No. 2001-01-0513, 2001.
46. Kowalewicz, A. and Wojtyniak, M., “Alternative Fuels and their Application to Combustion
Engines,” Journal of Automobile Engineering, Vol. 219, pgs. 103-125, 2005.
109
8/23/2019 The Effects of Fuel Additives on Diesel Engine Emissions During Steady State and Transient Operation
http://slidepdf.com/reader/full/the-effects-of-fuel-additives-on-diesel-engine-emissions-during-steady-state 129/163
47. Canakci, M., “Performance and Emissions Characteristics of Biodiesel from Soybean Oil,”
Journal of Automobile Engineering, Vol. 219, pgs. 915-922, 2005.
48. Szybist, J., Kirby, S., and Boehman, A., “NOx Emissions of Alternative Diesel Fuels: A
Comparative Analysis of Biodiesel and FT Diesel,” Energy & Fuels, Vol. 19 No. 4, pgs.
1484-1492, 2005.
49. Bari, S., Yu, C., and Lim, T., “Filter Clogging and Power Loss Issues while Running a Diesel
Engine with Waste Cooking Oil,” Journal of Automobile Engineering, Vol. 216, pgs. 993-
1001, 2002.
50. Atkinson, C., Thompson, G., Traver, M., and Clark, N., “In-Cylinder Combustion Pressure
Characteristics of Fischer-Tropsch and Conventional Diesel Fuels in a Heavy Duty CI
Engine,” Warrendale, PA, SAE Paper No. 1999-01-1472, 1999.
51. Yongcheng, H., Longbao, Z., Shangxue, W., and Shenghua, L., “Study on the Performanceand Emissions of a Compression Ignition Engine Fuelled with Fischer-Tropsch Diesel Fuel,”
Journal of Automobile Engineering, Vol. 220, pgs. 827-835 2006.
52. Warnatz, J., Maas, U., and Dibble, R. W., Combustion, Physical and Chemical
Fundamentals, Modeling and Simulation, Springer-Verlag, New York City, NY, 1996.
53. Dec, J.., “A Conceptual Model of DI Diesel Combustion Based on Laser-Sheet Imaging,”
Warrendale, PA, SAE Paper No. 970873, 1997.
54. Dec, J. and Canaan, R., “PLIF Imaging of NO Formation in a DI Diesel Engine,”
Warrendale, PA, SAE Paper No. 980147, 1998.
55. Aceves, S., Flowers, D., Martinez-Frias, J., Smith, J., Dibble, R., Au, M., and Girard, J.,
"HCCI Combustion: Analysis and Experiments," Warrendale, PA, SAE Paper No. 2001-01-
2077, 2001.
56. Alkidas, A., “On the Premixed Combustion in a Direct Injection Diesel Engine,” Journal of
Engineering for Gas Turbines and Power, Vol. 109, pgs.187-192, 1987.
57. “Emission Formation in Diesel Engines,” DieselNet, Brampton, ON, Canada, 2006.
http://www.dieselnet.com/tech/diesel_emiform.html (accessed June 24, 2008).
58. Health Effects Institute, “Diesel Exhaust: Critical Analysis of Emissions, Exposure, and
Health Effects,” Health Effects Institute, Cambridge, MA, 1995.
59. Inventory of U.S. Greenhouse Gas Emissions and Sinks: 1990-2004, Environmental
Protection Agency, Washington, DC, USEPA #430-R-06-002, 2006.
110
8/23/2019 The Effects of Fuel Additives on Diesel Engine Emissions During Steady State and Transient Operation
http://slidepdf.com/reader/full/the-effects-of-fuel-additives-on-diesel-engine-emissions-during-steady-state 130/163
60. Heywood, J.B., Internal Combustion Engine Fundamentals, McGraw-Hill, New York City,
NY, 1988.
61. Woshni, G., “A Universally Applicable Equation for the Instantaneous Heat Transfer
Coefficient in the Internal Combustion Engine,” Warrendale, PA, SAE Paper No. 670931,
1967.
62. Brunt, M. and Platts, K., “Calculation of Heat Release in Direct Injection Diesel Engines,”
Warrendale, PA, SAE Paper No. 1999-01-0187, 1999.
63. Assanis, D., Filipi, Z., Fiveland, S., and Syrimis, M., “A Methodology for Cycle-By-Cycle
Transient Heat Release Analysis in a Turbocharged Direct Injection Diesel Engine,”
Warrendale, PA, SAE Paper No. 2000-01-1185, 2000.
64. Galindo, J., Bermudez, V., Serrano, J., and Lopez, J., “Cycle to Cycle Diesel Combustion
Characterization during Engine Transient Operation,” Warrendale, PA, SAE Paper No. 2001-01-3262, 2001.
65. Stiesch, G., Modeling Engine Spray and Combustion Processes, Springer, New York City,
NY, 2003.
66. Singh, S., Reitz, R., and Musculus, M., “Comparison of the Characteristic Time (CTC),
Representative Interactive Flamelet (RIF), and Direct Integration with Detailed Chemistry
Combustion Models against Optical Diagnostic Data for Multi-Mode in a Heavy-Duty DI
Diesel Engine,” Warrendale, PA, SAE Paper No. 2006-01-0055, 2006.
67. Turns, S.R., An Introduction to Combustion: Concepts and Applications, Second Edition,
McGraw-Hill, New York City, NY, 2000.
68. Hernandez, J., Lapuerta, M., and Perez-Collado, J., A Combustion Kinetic Model for
Estimating Diesel Engine NOx Emissions,” Combustion Theory and Modeling, Vol. 10, pgs.
639-657, 2006.
69. Tincher, R., “Evaluation of Heavy Duty Diesel Engines Regulated Emissions Based on
Variation of Fuel Properties by Use of Additives,” M.S. Thesis, Department of Mechanical
and Aerospace Engineering, West Virginia University, Morgantown, WV, 2007.
70. Nandi, M. and Jacobs, D., “Cetane Response of Di-tertiary-butyl Peroxide in Different Diesel
Fuels,” Warrendale, PA, SAE Paper No. 952368, 1995.
71. “Fuel Additive Packages Containing 2-Ethylhexyl Nitrate (2-EHN) – Best Practices
Manual,” Additives Technical Committee, Europe, 2004.
111

8/23/2019 The Effects of Fuel Additives on Diesel Engine Emissions During Steady State and Transient Operation
http://slidepdf.com/reader/full/the-effects-of-fuel-additives-on-diesel-engine-emissions-during-steady-state 131/163
72. “Material Safety Data Sheet – NOROX DTBP,” Norac Inc., Azusa, CA, 2006.
73. “DI-tert-BUTYL PEROXIDE,” International Programme on Chemical Safety, CAS No.
110-05-4, Switzerland, 1999.
74. “6125B Specifications”, Kistler Instrumentation Corporation, Amherst, NY, 2008.
75. “6061B Specifications”, Kistler Instrumentation Corporation, Amherst, NY, 2008.
76. Brunt, M. and Pond, C., “Evaluation of Techniques for Absolute Cylinder Pressure
Correction,” Warrendale, PA, SAE Paper No. 970036, 1997.
77. Lyn, W. and Valdmanis, E., “The Effects of Physical Factors on Ignition Delay,”
Warrendale, PA, SAE Paper No. 680102, 1968.
78. Brunt, M. and Emtage, A., “Evaluation of Burn Rate Routines and Analysis Errors,”
Warrendale, PA, SAE Paper No. 970037, 1997.
79. Brunt, M. and Emtage, A., “Evaluation of IMEP Routines and Analysis Errors,” Warrendale,PA, SAE Paper No. 960609, 1996.
80. Park, S. and Sunwoo, M., “Torque Estimation of Spark Ignition Engines via Cylinder
Pressure Measurement,” Journal of Automobile Engineering, Vol. 217, pgs. 809-817, 2003.
81. Miyamoto, N., Chikahisa, T., Murayama, T., and Sawyer, R., “Description and Analysis of
Diesel Engine Rate of Combustion and Performance Using Weibe’s Functions,” Warrendale,
PA, SAE Paper No. 850107, 1985.
82. Schreiner, K., “Equivalent Combustion Rate with the Polygon-Hyperbola Function:
Investigations into the Dependence of the Parameters in the Performance Map,” Proc 5th
Symposium, “The Working Process of the Internal Combustion Engine,” Technical
University Graz, Austria, pgs. 239-257, 1995.
83. Ceviz, M., Kaymaz, İ., “Temperature and air-fuel ratio dependent specific heat ratio
functions for lean burned and unburned mixture,” Energy Conversion and Management, Vol.
46, pp. 2387-2404, 2005.
84. Lanzafame, R. and Messina, M., “ICE Gross Heat Release Strongly Influenced by Specific
Heat Ratio Values,” International Journal of Automotive Technology, Vol. 4, No. 3, pp. 125-
1333, 2003.
85. Klein, M. and Eriksson, L., “A Specific Heat Ratio Model for Single-Zone Heat Release
Models,” SAE International, Warrendale, PA, SAE Paper No. 2004-01-1464, 2004.
112

8/23/2019 The Effects of Fuel Additives on Diesel Engine Emissions During Steady State and Transient Operation
http://slidepdf.com/reader/full/the-effects-of-fuel-additives-on-diesel-engine-emissions-during-steady-state 132/163
86. Brunt, M. and Platts, K., “Calculation of Heat Release in Direct Injection Diesel Engines,”
SAE International, Warrendale, PA, SAE Paper No. 1999-01-0187, 1999.
87. Arrègle, J., López, J., García, J., and Fenollosa, C., “Development of a Zero-Dimensional
Diesel Combustion Model. Part 1: Analysis of the Quasi-Steady Diffusion Combustion
Phase,” Applied Thermal Engineering, Vol. 23, pp 1301-1317, 2003.
88. Arrègle, J., López, J., García, J., and Fenollosa, C., “Development of a Zero-Dimensional
Diesel Combustion Model. Part 2: Analysis of the Transient Initial and Final Diffusion
Combustion Phases,” Applied Thermal Engineering, Vol. 23, pgs. 1319-1331, 2003.
89. Ferguson, C. and Kirkpatrick, A., Internal Combustion Engines, John Wiley & Sons, Inc.,
Hoboken, NJ, 2000.
90. Miller, R., Davis, G., Lavoie, G., Newman, C., and Gardner, T., “A Super-Extended
Zeldovich Mechanism and Engine Calibration,” SAE International, Warrendale, PA, SAEPaper No. 980781, 1998.
91. Kobori, S., Kamimoto, T., and Aradi, A., “A Study of Ignition Delay of Diesel Fuel Sprays,”
International Journal of Engine Research, Vol. 1, pgs.29-39, 2000.
92. Aoyagi, Y., Kunishima, E., Asaumi, Y., Aihara, Y., Odaka, M. and Goto, Y., “Diesel
Combustion and Emission Using High Boost and High Injection Pressure in a Single
Cylinder Engine,” JSME International Journal, Series B: Fluids and Thermal Engineering,
Vol. 48, pgs.648-655, 2006.
93. Kim, S., Wakisaka, T., and Aoyagi, Y., “A Numerical Study of the Effects of Boost Pressure
and Exhaust Gas Recirculation Ratio on the Combustion Process and Exhaust Emissions in a
Diesel Engine,” International Journal of Engine Research, Vol. 8, pgs.147-162, 2007.
94. Clark, N., Jarrett, R., and Atkinson, C., “Field Measurements of Particulate Matter
Emissions, Carbon Monoxide, and Exhaust Opacity from Heavy-Duty Diesel Vehicles,”
Journal of the Air & Waste Management Assoc., Vol. 49, pgs.76-84, 1999.
95. Brakora, J., Ra, Y., Reitz, R., Mcfarlane, J., and Daw, C., “Development and Validation of a
Reduced Reaction Mechanism for Biodiesel Fueled Engine Simulations,” SAE International,
Warrendale, PA, SAE Paper No. 2008-01-1378, 2008.
113
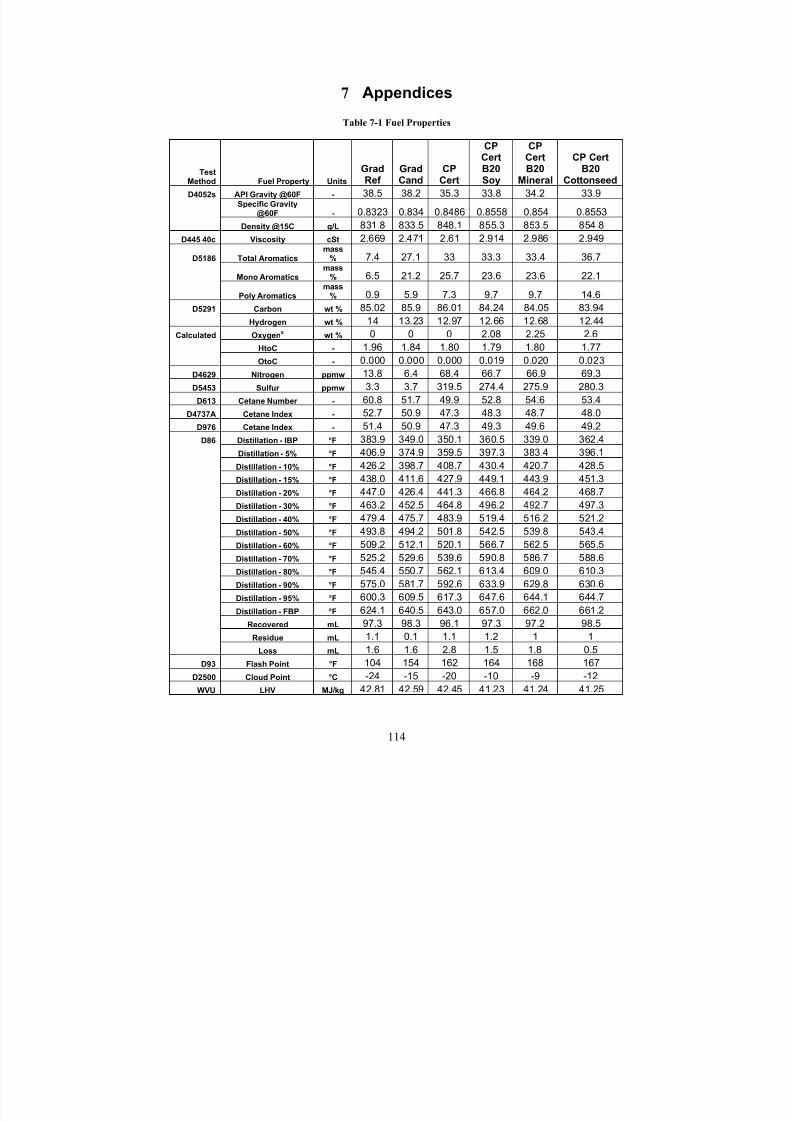
8/23/2019 The Effects of Fuel Additives on Diesel Engine Emissions During Steady State and Transient Operation
http://slidepdf.com/reader/full/the-effects-of-fuel-additives-on-diesel-engine-emissions-during-steady-state 133/163
7 Appendices
Table 7-1 Fuel Properties
TestMethod Fuel Property Units
GradRef
GradCand
CPCert
CPCertB20Soy
CPCertB20
Mineral
CP CertB20
Cottonseed
D4052s API Gravity @60F - 38.5 38.2 35.3 33.8 34.2 33.9Specific Gravity
@60F - 0.8323 0.834 0.8486 0.8558 0.854 0.8553
Density @15C g/L 831.8 833.5 848.1 855.3 853.5 854.8
D445 40c Viscosity cSt 2.669 2.471 2.61 2.914 2.986 2.949
D5186 Total Aromaticsmass
% 7.4 27.1 33 33.3 33.4 36.7
Mono Aromaticsmass
% 6.5 21.2 25.7 23.6 23.6 22.1
Poly Aromaticsmass
% 0.9 5.9 7.3 9.7 9.7 14.6
D5291 Carbon wt % 85.02 85.9 86.01 84.24 84.05 83.94
Hydrogen wt % 14 13.23 12.97 12.66 12.68 12.44
Calculated Oxygena
wt % 0 0 0 2.08 2.25 2.6
HtoC - 1.96 1.84 1.80 1.79 1.80 1.77
OtoC - 0.000 0.000 0.000 0.019 0.020 0.023
D4629 Nitrogen ppmw 13.8 6.4 68.4 66.7 66.9 69.3
D5453 Sulfur ppmw 3.3 3.7 319.5 274.4 275.9 280.3
D613 Cetane Number - 60.8 51.7 49.9 52.8 54.6 53.4
D4737A Cetane Index - 52.7 50.9 47.3 48.3 48.7 48.0
D976 Cetane Index - 51.4 50.9 47.3 49.3 49.6 49.2
D86 Distillation - IBP °F 383.9 349.0 350.1 360.5 339.0 362.4
Distillation - 5% °F 406.9 374.9 359.5 397.3 383.4 396.1Distillation - 10% °F 426.2 398.7 408.7 430.4 420.7 428.5
Distillation - 15% °F 438.0 411.6 427.9 449.1 443.9 451.3
Distillation - 20% °F 447.0 426.4 441.3 466.8 464.2 468.7
Distillation - 30% °F 463.2 452.5 464.8 496.2 492.7 497.3
Distillation - 40% °F 479.4 475.7 483.9 519.4 516.2 521.2
Distillation - 50% °F 493.8 494.2 501.8 542.5 539.8 543.4
Distillation - 60% °F 509.2 512.1 520.1 566.7 562.5 565.5
Distillation - 70% °F 525.2 529.6 539.6 590.8 586.7 588.6
Distillation - 80% °F 545.4 550.7 562.1 613.4 609.0 610.3
Distillation - 90% °F 575.0 581.7 592.6 633.9 629.8 630.6
Distillation - 95% °F 600.3 609.5 617.3 647.6 644.1 644.7
Distillation - FBP °F 624.1 640.5 643.0 657.0 662.0 661.2
Recovered mL 97.3 98.3 96.1 97.3 97.2 98.5
Residue mL 1.1 0.1 1.1 1.2 1 1
Loss mL 1.6 1.6 2.8 1.5 1.8 0.5
D93 Flash Point °F 104 154 162 164 168 167
D2500 Cloud Point °C -24 -15 -20 -10 -9 -12
WVU LHV MJ/kg 42.81 42.59 42.45 41.23 41.24 41.25
114

8/23/2019 The Effects of Fuel Additives on Diesel Engine Emissions During Steady State and Transient Operation
http://slidepdf.com/reader/full/the-effects-of-fuel-additives-on-diesel-engine-emissions-during-steady-state 134/163
Table 7-2 Fuel Properties Continued
TestMethod Fuel Property Units LC
LCB20Soy
LC B20Mineral
LC B20Cottonseed Guttman
D4052s API Gravity @60F - 33.1 31.6 31.7 31.5 44.7
Specific Gravity@60F - 0.8598 0.8675 0.8668 0.8682 0.8032
Density @15C g/L 859.3 867 866.3 867.7 802.8
D445 40c Viscosity cSt 2.67 2.847 2.888 2.848 2.091
D5186 Total Aromaticsmass
% 39.3 38.5 39.4 40.4 9.3
Mono Aromaticsmass
% 31.2 34 35 34.1 8.8
Poly Aromaticsmass
% 8.1 4.5 4.4 6.3 5.6
D5291 Carbon wt % 85.23 83.77 84.11 83.59 85.35
Hydrogen wt % 12.56 12.31 12.22 12.32 14
Calculated Oxygena
wt % 0 1.71 1.46 1.88 0
HtoC - 1.76 1.75 1.73 1.76 1.95
OtoC - 0.000 0.015 0.013 0.017 0.000
D4629 Nitrogen ppmw 16.5 27.5 31.4 31.7 5.6
D5453 Sulfur ppmw 8 5.1 5.6 5.2 13.9
D613 Cetane Number - 46.2 48.8 48.9 47.7 58.3
D4737A Cetane Index - 43.0 42.7 42.7 42.3 58.7
D976 Cetane Index - 43.4 43.8 43.7 43.3 57.9
D86 Distillation - IBP °F 354.1 360.7 370.9 366.5 321.7
Distillation - 5% °F 381.2 410.1 409.6 406.6 352.1
Distillation - 10% °F 414.2 432.1 432.6 431.7 365.8
Distillation - 15% °F 431.5 445.2 446.5 445.2 374.9
Distillation - 20% °F 441.8 457.6 459.3 458.0 385.9
Distillation - 30% °F 463.5 480.7 480.6 481.2 408.7Distillation - 40% °F 482.8 504.4 502.4 501.2 434.2
Distillation - 50% °F 500.8 526.2 524.0 523.3 464.5
Distillation - 60% °F 520.8 550.9 547.8 547.5 498.8
Distillation - 70% °F 542.0 578.2 574.2 573.2 536.0
Distillation - 80% °F 565.5 604.7 600.0 599.4 570.7
Distillation - 90% °F 595.2 627.7 622.9 623.4 600.1
Distillation - 95% °F 619.3 640.4 636.7 636.7 616.6
Distillation – FBP °F 641.7 655.1 654.1 654.4 631.8
Recovered mL 96.9 97.9 98.4 98.1 98.3
Residue mL 1 1.2 1 0.9 1.0
Loss mL 2.1 0.9 0.6 1.0 0.7
D93 Flash Point °F 151 167 173 173 127
D2500 Cloud Point °C -20 -15 -10 -14 -16
WVU LHV MJ/kg 42.31 41.05 41.17 41.11 42.81
115
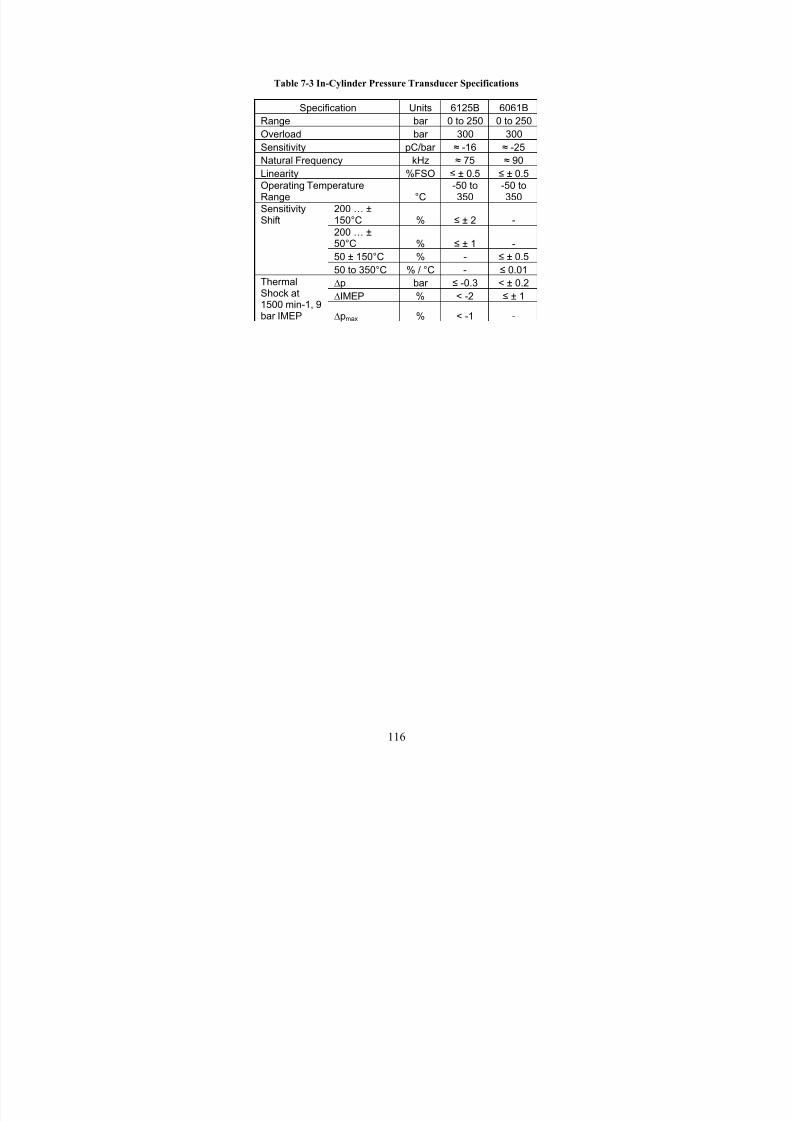
8/23/2019 The Effects of Fuel Additives on Diesel Engine Emissions During Steady State and Transient Operation
http://slidepdf.com/reader/full/the-effects-of-fuel-additives-on-diesel-engine-emissions-during-steady-state 135/163
Table 7-3 In-Cylinder Pressure Transducer Specifications
Specification Units 6125B 6061B
Range bar 0 to 250 0 to 250
Overload bar 300 300
Sensitivity pC/bar ≈ -16 ≈ -25Natural Frequency kHz ≈ 75 ≈ 90
Linearity %FSO ≤ ± 0.5 ≤ ± 0.5
Operating TemperatureRange °C
-50 to350
-50 to350
SensitivityShift
200 … ±150°C % ≤ ± 2 -
200 … ±50°C % ≤ ± 1 -
50 ± 150°C % - ≤ ± 0.5
50 to 350°C % / °C - ≤ 0.01
∆p bar ≤ -0.3 < ± 0.2
∆IMEP % < -2 ≤ ± 1
ThermalShock at
1500 min-1, 9bar IMEP ∆pmax % < -1 -
116
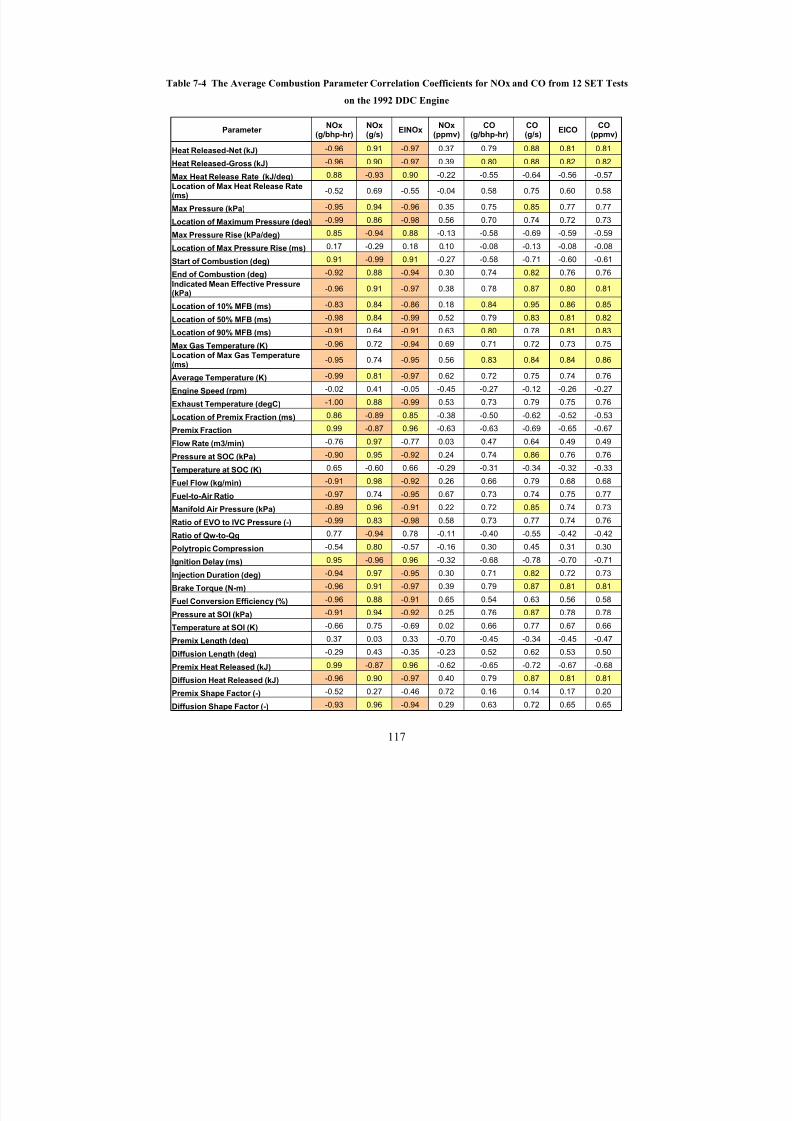
8/23/2019 The Effects of Fuel Additives on Diesel Engine Emissions During Steady State and Transient Operation
http://slidepdf.com/reader/full/the-effects-of-fuel-additives-on-diesel-engine-emissions-during-steady-state 136/163
Table 7-4 The Average Combustion Parameter Correlation Coefficients for NOx and CO from 12 SET Tests
on the 1992 DDC Engine
Parameter NOx
(g/bhp-hr)NOx(g/s)
EINOxNOx
(ppmv)CO
(g/bhp-hr)CO(g/s)
EICOCO
(ppmv)
Heat Released-Net (kJ) -0.96 0.91 -0.97 0.37 0.79 0.88 0.81 0.81Heat Released-Gross (kJ) -0.96 0.90 -0.97 0.39 0.80 0.88 0.82 0.82
Max Heat Release Rate (kJ/deg) 0.88 -0.93 0.90 -0.22 -0.55 -0.64 -0.56 -0.57
Location of Max Heat Release Rate(ms)
-0.52 0.69 -0.55 -0.04 0.58 0.75 0.60 0.58
Max Pressure (kPa) -0.95 0.94 -0.96 0.35 0.75 0.85 0.77 0.77
Location of Maximum Pressure (deg) -0.99 0.86 -0.98 0.56 0.70 0.74 0.72 0.73
Max Pressure Rise (kPa/deg) 0.85 -0.94 0.88 -0.13 -0.58 -0.69 -0.59 -0.59
Location of Max Pressure Rise (ms) 0.17 -0.29 0.18 0.10 -0.08 -0.13 -0.08 -0.08
Start of Combustion (deg) 0.91 -0.99 0.91 -0.27 -0.58 -0.71 -0.60 -0.61
End of Combustion (deg) -0.92 0.88 -0.94 0.30 0.74 0.82 0.76 0.76
Indicated Mean Effective Pressure(kPa)
-0.96 0.91 -0.97 0.38 0.78 0.87 0.80 0.81
Location of 10% MFB (ms) -0.83 0.84 -0.86 0.18 0.84 0.95 0.86 0.85
Location of 50% MFB (ms) -0.98 0.84 -0.99 0.52 0.79 0.83 0.81 0.82
Location of 90% MFB (ms) -0.91 0.64 -0.91 0.63 0.80 0.78 0.81 0.83
Max Gas Temperature (K) -0.96 0.72 -0.94 0.69 0.71 0.72 0.73 0.75
Location of Max Gas Temperature(ms)
-0.95 0.74 -0.95 0.56 0.83 0.84 0.84 0.86
Average Temperature (K) -0.99 0.81 -0.97 0.62 0.72 0.75 0.74 0.76
Engine Speed (rpm) -0.02 0.41 -0.05 -0.45 -0.27 -0.12 -0.26 -0.27
Exhaust Temperature (degC) -1.00 0.88 -0.99 0.53 0.73 0.79 0.75 0.76
Location of Premix Fraction (ms) 0.86 -0.89 0.85 -0.38 -0.50 -0.62 -0.52 -0.53
Premix Fraction 0.99 -0.87 0.96 -0.63 -0.63 -0.69 -0.65 -0.67
Flow Rate (m3/min) -0.76 0.97 -0.77 0.03 0.47 0.64 0.49 0.49
Pressure at SOC (kPa) -0.90 0.95 -0.92 0.24 0.74 0.86 0.76 0.76
Temperature at SOC (K) 0.65 -0.60 0.66 -0.29 -0.31 -0.34 -0.32 -0.33
Fuel Flow (kg/min) -0.91 0.98 -0.92 0.26 0.66 0.79 0.68 0.68
Fuel-to-Air Ratio -0.97 0.74 -0.95 0.67 0.73 0.74 0.75 0.77
Manifold Air Pressure (kPa) -0.89 0.96 -0.91 0.22 0.72 0.85 0.74 0.73
Ratio of EVO to IVC Pressure (-) -0.99 0.83 -0.98 0.58 0.73 0.77 0.74 0.76
Ratio of Qw-to-Qg 0.77 -0.94 0.78 -0.11 -0.40 -0.55 -0.42 -0.42
Polytropic Compression -0.54 0.80 -0.57 -0.16 0.30 0.45 0.31 0.30
Ignition Delay (ms) 0.95 -0.96 0.96 -0.32 -0.68 -0.78 -0.70 -0.71
Injection Duration (deg) -0.94 0.97 -0.95 0.30 0.71 0.82 0.72 0.73
Brake Torque (N-m) -0.96 0.91 -0.97 0.39 0.79 0.87 0.81 0.81
Fuel Conversion Efficiency (%) -0.96 0.88 -0.91 0.65 0.54 0.63 0.56 0.58
Pressure at SOI (kPa) -0.91 0.94 -0.92 0.25 0.76 0.87 0.78 0.78
Temperature at SOI (K) -0.66 0.75 -0.69 0.02 0.66 0.77 0.67 0.66
Premix Length (deg) 0.37 0.03 0.33 -0.70 -0.45 -0.34 -0.45 -0.47
Diffusion Length (deg) -0.29 0.43 -0.35 -0.23 0.52 0.62 0.53 0.50
Premix Heat Released (kJ) 0.99 -0.87 0.96 -0.62 -0.65 -0.72 -0.67 -0.68
Diffusion Heat Released (kJ) -0.96 0.90 -0.97 0.40 0.79 0.87 0.81 0.81
Premix Shape Factor (-) -0.52 0.27 -0.46 0.72 0.16 0.14 0.17 0.20
Diffusion Shape Factor (-) -0.93 0.96 -0.94 0.29 0.63 0.72 0.65 0.65
117
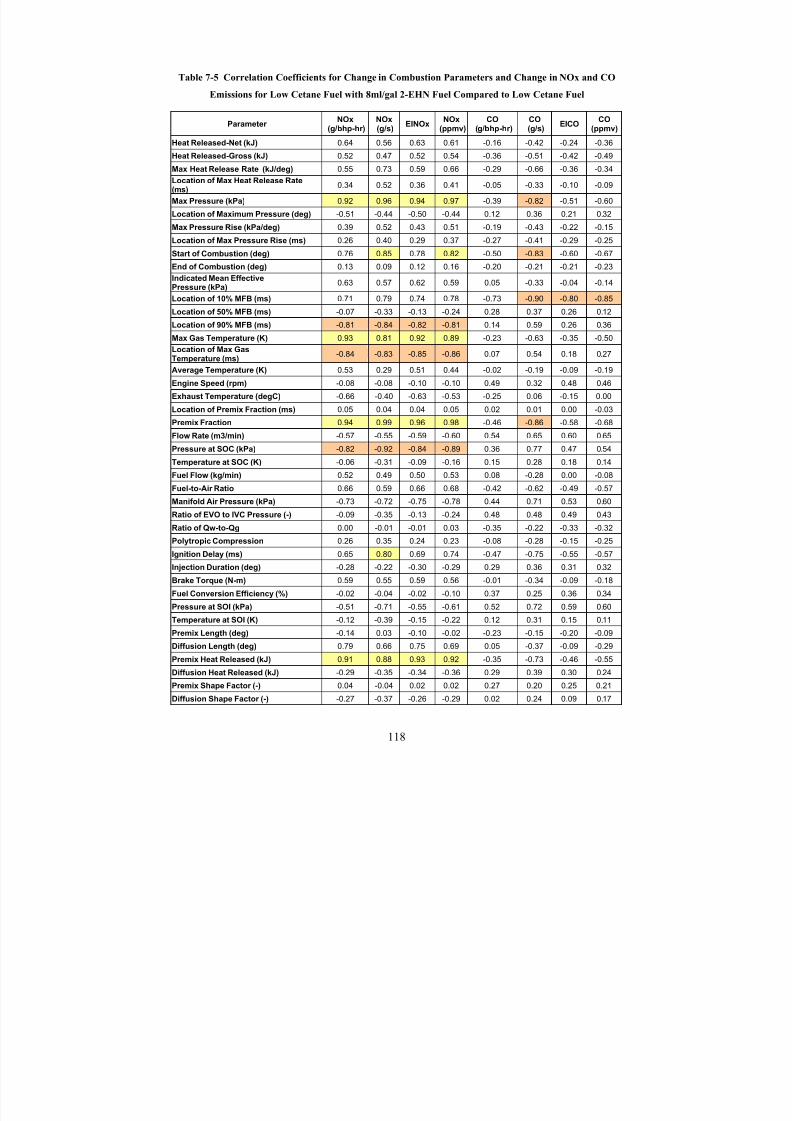
8/23/2019 The Effects of Fuel Additives on Diesel Engine Emissions During Steady State and Transient Operation
http://slidepdf.com/reader/full/the-effects-of-fuel-additives-on-diesel-engine-emissions-during-steady-state 137/163
Table 7-5 Correlation Coefficients for Change in Combustion Parameters and Change in NOx and CO
Emissions for Low Cetane Fuel with 8ml/gal 2-EHN Fuel Compared to Low Cetane Fuel
NOx NOx NOx CO COParameter
(g/s)EINOx
(g/bhp-hr) (ppmv) (g/bhp-hr) (g/s)EICO
CO(ppmv)
Heat Released-Net (kJ) 0.64 0.56 0.63 0.61 -0.16 -0.42 -0.24 -0.36
Heat Released-Gross (kJ) 0.52 0.47 0.52 0.54 -0.36 -0.51 -0.42 -0.49
Max Heat Release Rate (kJ/deg) 0.55 0.73 0.59 0.66 -0.29 -0.66 -0.36 -0.34
Location of Max Heat Release Rate(ms)
0.34 0.52 0.36 0.41 -0.05 -0.33 -0.10 -0.09
Max Pressure (kPa) 0.92 0.96 0.94 0.97 -0.39 -0.82 -0.51 -0.60
Location of Maximum Pressure (deg) -0.51 -0.44 -0.50 -0.44 0.12 0.36 0.21 0.32
Max Pressure Rise (kPa/deg) 0.39 0.52 0.43 0.51 -0.19 -0.43 -0.22 -0.15
Location of Max Pressure Rise (ms) 0.26 0.40 0.29 0.37 -0.27 -0.41 -0.29 -0.25
Start of Combustion (deg) 0.76 0.85 0.78 0.82 -0.50 -0.83 -0.60 -0.67
End of Combustion (deg) 0.13 0.09 0.12 0.16 -0.20 -0.21 -0.21 -0.23
Indicated Mean EffectivePressure (kPa)
0.63 0.57 0.62 0.59 0.05 -0.33 -0.04 -0.14
Location of 10% MFB (ms) 0.71 0.79 0.74 0.78 -0.73 -0.90 -0.80 -0.85
Location of 50% MFB (ms) -0.07 -0.33 -0.13 -0.24 0.28 0.37 0.26 0.12
Location of 90% MFB (ms) -0.81 -0.84 -0.82 -0.81 0.14 0.59 0.26 0.36
Max Gas Temperature (K) 0.93 0.81 0.92 0.89 -0.23 -0.63 -0.35 -0.50
Location of Max GasTemperature (ms)
-0.84 -0.83 -0.85 -0.86 0.07 0.54 0.18 0.27
Average Temperature (K) 0.53 0.29 0.51 0.44 -0.02 -0.19 -0.09 -0.19
Engine Speed (rpm) -0.08 -0.08 -0.10 -0.10 0.49 0.32 0.48 0.46
Exhaust Temperature (degC) -0.66 -0.40 -0.63 -0.53 -0.25 0.06 -0.15 0.00
Location of Premix Fraction (ms) 0.05 0.04 0.04 0.05 0.02 0.01 0.00 -0.03
Premix Fraction 0.94 0.99 0.96 0.98 -0.46 -0.86 -0.58 -0.68
Flow Rate (m3/min) -0.57 -0.55 -0.59 -0.60 0.54 0.65 0.60 0.65
Pressure at SOC (kPa) -0.82 -0.92 -0.84 -0.89 0.36 0.77 0.47 0.54
Temperature at SOC (K) -0.06 -0.31 -0.09 -0.16 0.15 0.28 0.18 0.14
Fuel Flow (kg/min) 0.52 0.49 0.50 0.53 0.08 -0.28 0.00 -0.08
Fuel-to-Air Ratio 0.66 0.59 0.66 0.68 -0.42 -0.62 -0.49 -0.57
Manifold Air Pressure (kPa) -0.73 -0.72 -0.75 -0.78 0.44 0.71 0.53 0.60
Ratio of EVO to IVC Pressure (-) -0.09 -0.35 -0.13 -0.24 0.48 0.48 0.49 0.43
Ratio of Qw-to-Qg 0.00 -0.01 -0.01 0.03 -0.35 -0.22 -0.33 -0.32
Polytropic Compression 0.26 0.35 0.24 0.23 -0.08 -0.28 -0.15 -0.25
Ignition Delay (ms) 0.65 0.80 0.69 0.74 -0.47 -0.75 -0.55 -0.57
Injection Duration (deg) -0.28 -0.22 -0.30 -0.29 0.29 0.36 0.31 0.32
Brake Torque (N-m) 0.59 0.55 0.59 0.56 -0.01 -0.34 -0.09 -0.18
Fuel Conversion Efficiency (%) -0.02 -0.04 -0.02 -0.10 0.37 0.25 0.36 0.34
Pressure at SOI (kPa) -0.51 -0.71 -0.55 -0.61 0.52 0.72 0.59 0.60
Temperature at SOI (K) -0.12 -0.39 -0.15 -0.22 0.12 0.31 0.15 0.11
Premix Length (deg) -0.14 0.03 -0.10 -0.02 -0.23 -0.15 -0.20 -0.09
Diffusion Length (deg) 0.79 0.66 0.75 0.69 0.05 -0.37 -0.09 -0.29
Premix Heat Released (kJ) 0.91 0.88 0.93 0.92 -0.35 -0.73 -0.46 -0.55
Diffusion Heat Released (kJ) -0.29 -0.35 -0.34 -0.36 0.29 0.39 0.30 0.24
Premix Shape Factor (-) 0.04 -0.04 0.02 0.02 0.27 0.20 0.25 0.21
Diffusion Shape Factor (-) -0.27 -0.37 -0.26 -0.29 0.02 0.24 0.09 0.17
118
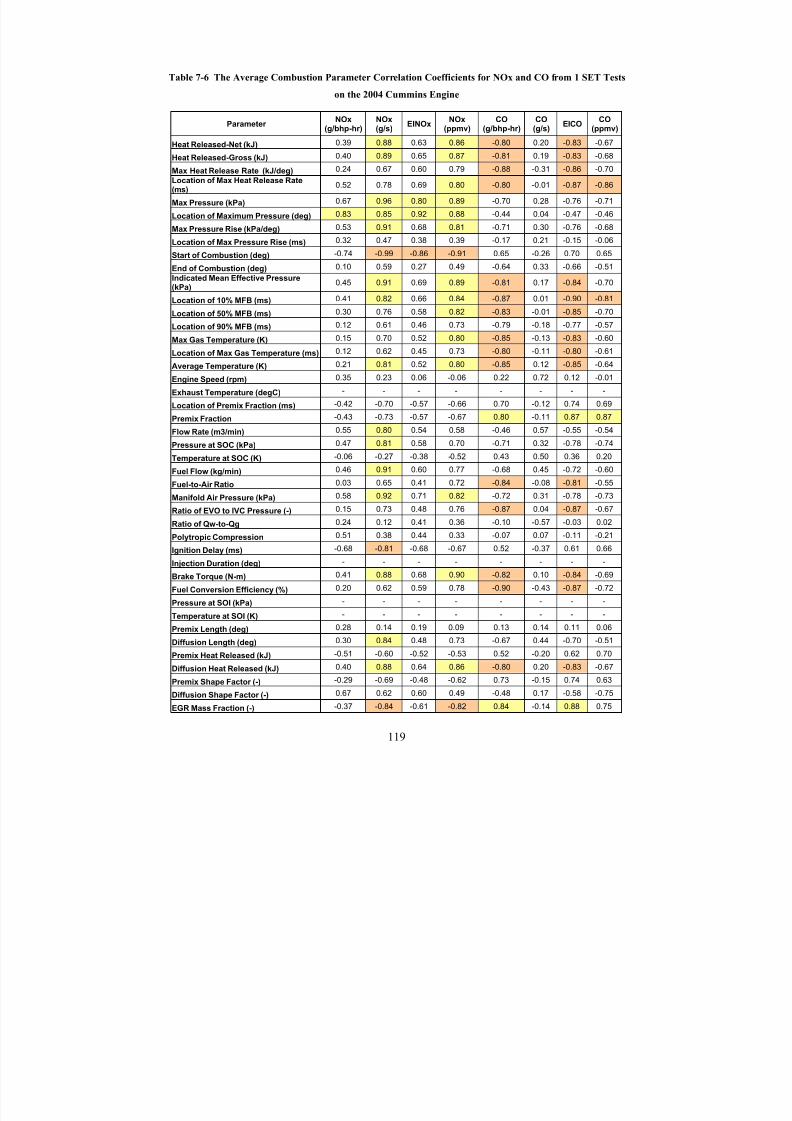
8/23/2019 The Effects of Fuel Additives on Diesel Engine Emissions During Steady State and Transient Operation
http://slidepdf.com/reader/full/the-effects-of-fuel-additives-on-diesel-engine-emissions-during-steady-state 138/163
Table 7-6 The Average Combustion Parameter Correlation Coefficients for NOx and CO from 1 SET Tests
on the 2004 Cummins Engine
Parameter NOx
(g/bhp-hr)NOx(g/s)
EINOxNOx
(ppmv)CO
(g/bhp-hr)CO
(g/s)EICO
CO(ppmv)
Heat Released-Net (kJ) 0.39 0.88 0.63 0.86 -0.80 0.20 -0.83 -0.67
Heat Released-Gross (kJ) 0.40 0.89 0.65 0.87 -0.81 0.19 -0.83 -0.68
Max Heat Release Rate (kJ/deg) 0.24 0.67 0.60 0.79 -0.88 -0.31 -0.86 -0.70
Location of Max Heat Release Rate(ms)
0.52 0.78 0.69 0.80 -0.80 -0.01 -0.87 -0.86
Max Pressure (kPa) 0.67 0.96 0.80 0.89 -0.70 0.28 -0.76 -0.71
Location of Maximum Pressure (deg) 0.83 0.85 0.92 0.88 -0.44 0.04 -0.47 -0.46
Max Pressure Rise (kPa/deg) 0.53 0.91 0.68 0.81 -0.71 0.30 -0.76 -0.68
Location of Max Pressure Rise (ms) 0.32 0.47 0.38 0.39 -0.17 0.21 -0.15 -0.06
Start of Combustion (deg) -0.74 -0.99 -0.86 -0.91 0.65 -0.26 0.70 0.65
End of Combustion (deg) 0.10 0.59 0.27 0.49 -0.64 0.33 -0.66 -0.51
Indicated Mean Effective Pressure(kPa)
0.45 0.91 0.69 0.89 -0.81 0.17 -0.84 -0.70
Location of 10% MFB (ms)0.41 0.82 0.66 0.84 -0.87 0.01 -0.90 -0.81
Location of 50% MFB (ms) 0.30 0.76 0.58 0.82 -0.83 -0.01 -0.85 -0.70
Location of 90% MFB (ms) 0.12 0.61 0.46 0.73 -0.79 -0.18 -0.77 -0.57
Max Gas Temperature (K) 0.15 0.70 0.52 0.80 -0.85 -0.13 -0.83 -0.60
Location of Max Gas Temperature (ms) 0.12 0.62 0.45 0.73 -0.80 -0.11 -0.80 -0.61
Average Temperature (K) 0.21 0.81 0.52 0.80 -0.85 0.12 -0.85 -0.64
Engine Speed (rpm) 0.35 0.23 0.06 -0.06 0.22 0.72 0.12 -0.01
Exhaust Temperature (degC) - - - - - - - -
Location of Premix Fraction (ms) -0.42 -0.70 -0.57 -0.66 0.70 -0.12 0.74 0.69
Premix Fraction -0.43 -0.73 -0.57 -0.67 0.80 -0.11 0.87 0.87
Flow Rate (m3/min) 0.55 0.80 0.54 0.58 -0.46 0.57 -0.55 -0.54
Pressure at SOC (kPa) 0.47 0.81 0.58 0.70 -0.71 0.32 -0.78 -0.74
Temperature at SOC (K) -0.06 -0.27 -0.38 -0.52 0.43 0.50 0.36 0.20
Fuel Flow (kg/min) 0.46 0.91 0.60 0.77 -0.68 0.45 -0.72 -0.60
Fuel-to-Air Ratio 0.03 0.65 0.41 0.72 -0.84 -0.08 -0.81 -0.55
Manifold Air Pressure (kPa) 0.58 0.92 0.71 0.82 -0.72 0.31 -0.78 -0.73
Ratio of EVO to IVC Pressure (-) 0.15 0.73 0.48 0.76 -0.87 0.04 -0.87 -0.67
Ratio of Qw-to-Qg 0.24 0.12 0.41 0.36 -0.10 -0.57 -0.03 0.02
Polytropic Compression 0.51 0.38 0.44 0.33 -0.07 0.07 -0.11 -0.21
Ignition Delay (ms) -0.68 -0.81 -0.68 -0.67 0.52 -0.37 0.61 0.66
Injection Duration (deg) - - - - - - - -
Brake Torque (N-m) 0.41 0.88 0.68 0.90 -0.82 0.10 -0.84 -0.69
Fuel Conversion Efficiency (%) 0.20 0.62 0.59 0.78 -0.90 -0.43 -0.87 -0.72
Pressure at SOI (kPa)- - - - - - - -
Temperature at SOI (K) - - - - - - - -
Premix Length (deg) 0.28 0.14 0.19 0.09 0.13 0.14 0.11 0.06
Diffusion Length (deg) 0.30 0.84 0.48 0.73 -0.67 0.44 -0.70 -0.51
Premix Heat Released (kJ) -0.51 -0.60 -0.52 -0.53 0.52 -0.20 0.62 0.70
Diffusion Heat Released (kJ) 0.40 0.88 0.64 0.86 -0.80 0.20 -0.83 -0.67
Premix Shape Factor (-) -0.29 -0.69 -0.48 -0.62 0.73 -0.15 0.74 0.63
Diffusion Shape Factor (-) 0.67 0.62 0.60 0.49 -0.48 0.17 -0.58 -0.75
EGR Mass Fraction (-) -0.37 -0.84 -0.61 -0.82 0.84 -0.14 0.88 0.75
119
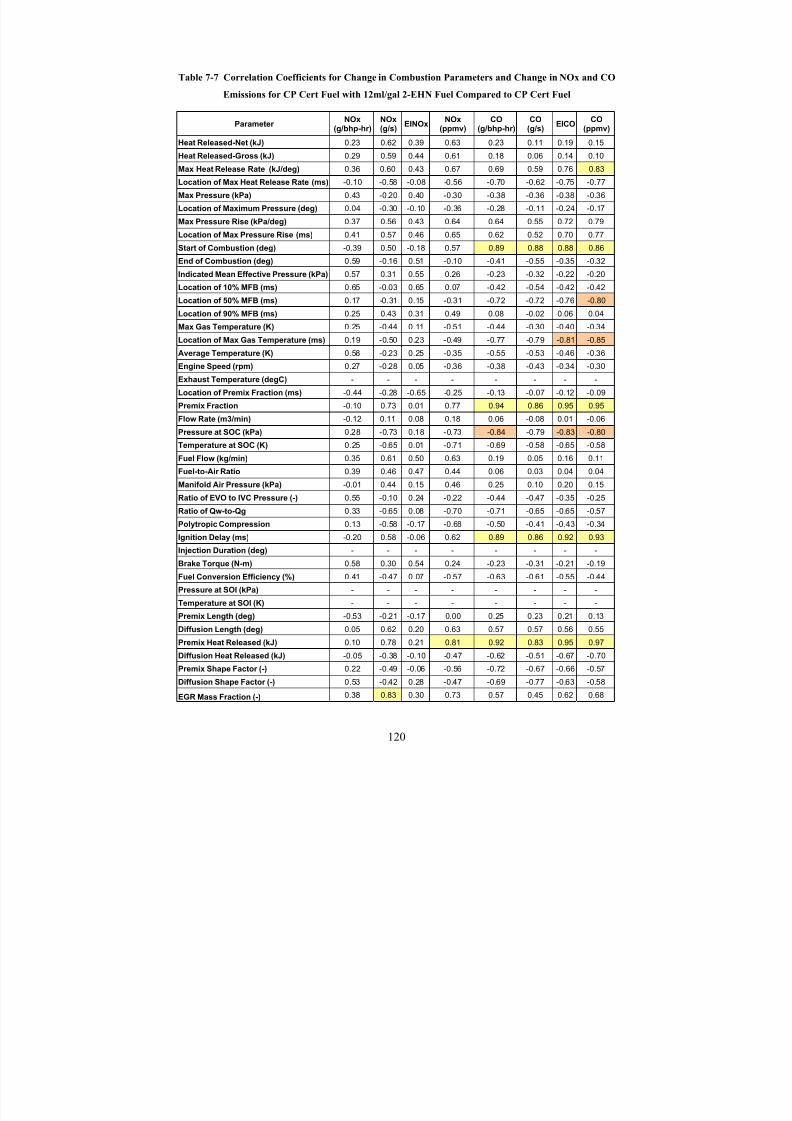
8/23/2019 The Effects of Fuel Additives on Diesel Engine Emissions During Steady State and Transient Operation
http://slidepdf.com/reader/full/the-effects-of-fuel-additives-on-diesel-engine-emissions-during-steady-state 139/163
120
Table 7-7 Correlation Coefficients for Change in Combustion Parameters and Change in NOx and CO
Emissions for CP Cert Fuel with 12ml/gal 2-EHN Fuel Compared to CP Cert Fuel
Parameter NOx
(g/bhp-hr)NOx(g/s)
EINOxNOx
(ppmv)CO
(g/bhp-hr)CO
(g/s)EICO
CO(ppmv)
Heat Released-Net (kJ) 0.23 0.62 0.39 0.63 0.23 0.11 0.19 0.15
Heat Released-Gross (kJ) 0.29 0.59 0.44 0.61 0.18 0.06 0.14 0.10
Max Heat Release Rate (kJ/deg) 0.36 0.60 0.43 0.67 0.69 0.59 0.76 0.83
Location of Max Heat Release Rate (ms) -0.10 -0.58 -0.08 -0.56 -0.70 -0.62 -0.75 -0.77
Max Pressure (kPa) 0.43 -0.20 0.40 -0.30 -0.38 -0.36 -0.38 -0.36
Location of Maximum Pressure (deg) 0.04 -0.30 -0.10 -0.36 -0.28 -0.11 -0.24 -0.17
Max Pressure Rise (kPa/deg) 0.37 0.56 0.43 0.64 0.64 0.55 0.72 0.79
Location of Max Pressure Rise (ms) 0.41 0.57 0.46 0.65 0.62 0.52 0.70 0.77
Start of Combustion (deg) -0.39 0.50 -0.18 0.57 0.89 0.88 0.88 0.86
End of Combustion (deg) 0.59 -0.16 0.51 -0.10 -0.41 -0.55 -0.35 -0.32
Indicated Mean Effective Pressure (kPa) 0.57 0.31 0.55 0.26 -0.23 -0.32 -0.22 -0.20
Location of 10% MFB (ms) 0.65 -0.03 0.65 0.07 -0.42 -0.54 -0.42 -0.42
Location of 50% MFB (ms) 0.17 -0.31 0.15 -0.31 -0.72 -0.72 -0.76 -0.80Location of 90% MFB (ms) 0.25 0.43 0.31 0.49 0.08 -0.02 0.06 0.04
Max Gas Temperature (K) 0.25 -0.44 0.11 -0.51 -0.44 -0.30 -0.40 -0.34
Location of Max Gas Temperature (ms) 0.19 -0.50 0.23 -0.49 -0.77 -0.79 -0.81 -0.85
Average Temperature (K) 0.58 -0.23 0.25 -0.35 -0.55 -0.53 -0.46 -0.36
Engine Speed (rpm) 0.27 -0.28 0.05 -0.36 -0.38 -0.43 -0.34 -0.30
Exhaust Temperature (degC) - - - - - - - -
Location of Premix Fraction (ms) -0.44 -0.28 -0.65 -0.25 -0.13 -0.07 -0.12 -0.09
Premix Fraction -0.10 0.73 0.01 0.77 0.94 0.86 0.95 0.95
Flow Rate (m3/min) -0.12 0.11 0.08 0.18 0.06 -0.08 0.01 -0.06
Pressure at SOC (kPa) 0.28 -0.73 0.18 -0.73 -0.84 -0.79 -0.83 -0.80
Temperature at SOC (K) 0.25 -0.65 0.01 -0.71 -0.69 -0.58 -0.65 -0.58
Fuel Flow (kg/min) 0.35 0.61 0.50 0.63 0.19 0.05 0.16 0.11
Fuel-to-Air Ratio 0.39 0.46 0.47 0.44 0.06 0.03 0.04 0.04
Manifold Air Pressure (kPa) -0.01 0.44 0.15 0.46 0.25 0.10 0.20 0.15
Ratio of EVO to IVC Pressure (-) 0.55 -0.10 0.24 -0.22 -0.44 -0.47 -0.35 -0.25
Ratio of Qw-to-Qg 0.33 -0.65 0.08 -0.70 -0.71 -0.65 -0.65 -0.57
Polytropic Compression 0.13 -0.58 -0.17 -0.68 -0.50 -0.41 -0.43 -0.34
Ignition Delay (ms) -0.20 0.58 -0.06 0.62 0.89 0.86 0.92 0.93
Injection Duration (deg) - - - - - - - -
Brake Torque (N-m) 0.58 0.30 0.54 0.24 -0.23 -0.31 -0.21 -0.19
Fuel Conversion Efficiency (%) 0.41 -0.47 0.07 -0.57 -0.63 -0.61 -0.55 -0.44
Pressure at SOI (kPa) - - - - - - - -
Temperature at SOI (K) - - - - - - - -Premix Length (deg) -0.53 -0.21 -0.17 0.00 0.25 0.23 0.21 0.13
Diffusion Length (deg) 0.05 0.62 0.20 0.63 0.57 0.57 0.56 0.55
Premix Heat Released (kJ) 0.10 0.78 0.21 0.81 0.92 0.83 0.95 0.97
Diffusion Heat Released (kJ) -0.05 -0.38 -0.10 -0.47 -0.62 -0.51 -0.67 -0.70
Premix Shape Factor (-) 0.22 -0.49 -0.06 -0.56 -0.72 -0.67 -0.66 -0.57
Diffusion Shape Factor (-) 0.53 -0.42 0.28 -0.47 -0.69 -0.77 -0.63 -0.58
EGR Mass Fraction (-) 0.38 0.83 0.30 0.73 0.57 0.45 0.62 0.68
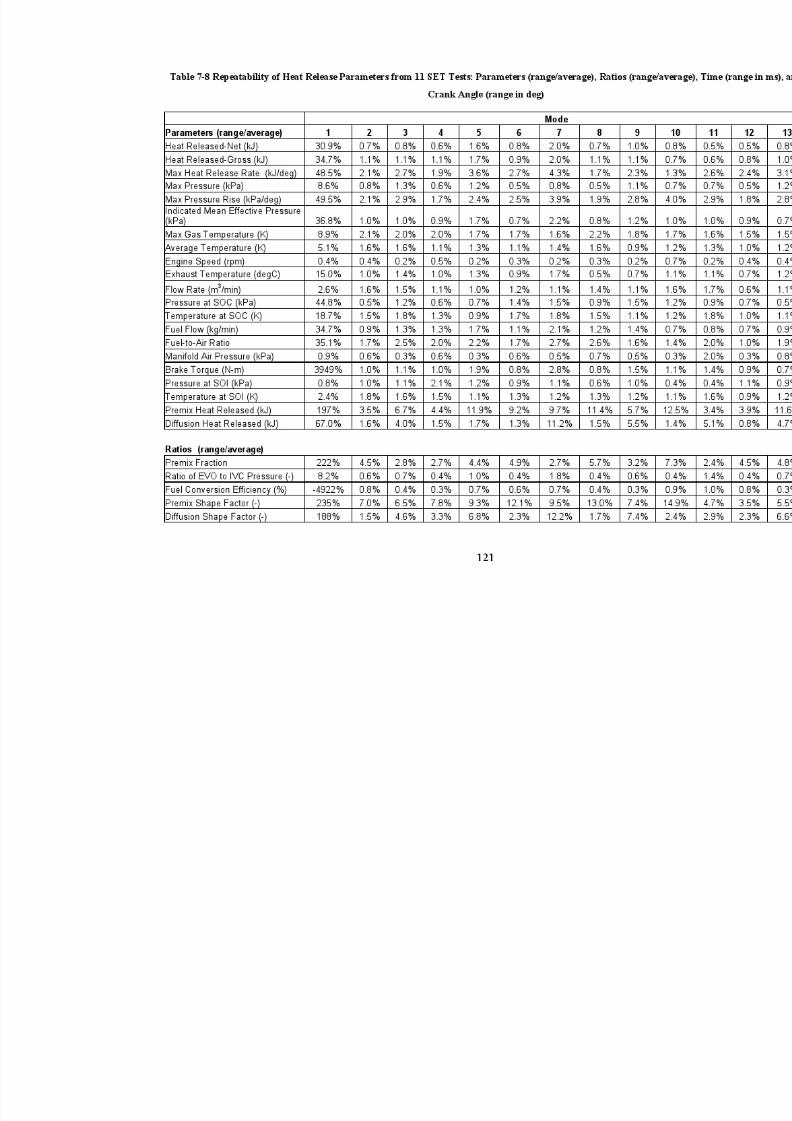
8/23/2019 The Effects of Fuel Additives on Diesel Engine Emissions During Steady State and Transient Operation
http://slidepdf.com/reader/full/the-effects-of-fuel-additives-on-diesel-engine-emissions-during-steady-state 140/163
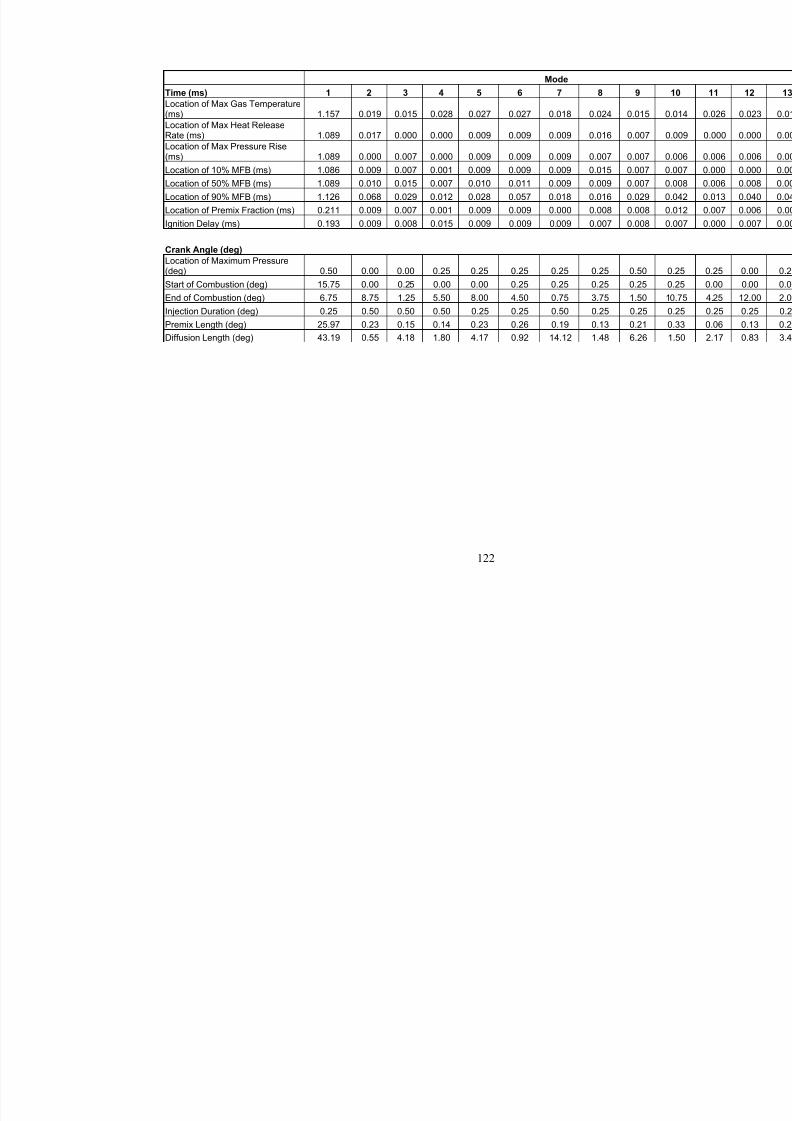
8/23/2019 The Effects of Fuel Additives on Diesel Engine Emissions During Steady State and Transient Operation
http://slidepdf.com/reader/full/the-effects-of-fuel-additives-on-diesel-engine-emissions-during-steady-state 141/163
Mode
Time (ms) 1 2 3 4 5 6 7 8 9
Location of Max Gas Temperature(ms) 1.157 0.019 0.015 0.028 0.027 0.027 0.018 0.024 0.015
Location of Max Heat ReleaseRate (ms) 1.089 0.017 0.000 0.000 0.009 0.009 0.009 0.016 0.007
Location of Max Pressure Rise(ms) 1.089 0.000 0.007 0.000 0.009 0.009 0.009 0.007 0.007
Location of 10% MFB (ms) 1.086 0.009 0.007 0.001 0.009 0.009 0.009 0.015 0.007
Location of 50% MFB (ms) 1.089 0.010 0.015 0.007 0.010 0.011 0.009 0.009 0.007
Location of 90% MFB (ms) 1.126 0.068 0.029 0.012 0.028 0.057 0.018 0.016 0.029
Location of Premix Fraction (ms) 0.211 0.009 0.007 0.001 0.009 0.009 0.000 0.008 0.008
Ignition Delay (ms) 0.193 0.009 0.008 0.015 0.009 0.009 0.009 0.007 0.008
Crank Angle (deg)
Location of Maximum Pressure(deg) 0.50 0.00 0.00 0.25 0.25 0.25 0.25 0.25 0.50
Start of Combustion (deg) 15.75 0.00 0.25 0.00 0.00 0.25 0.25 0.25 0.25
End of Combustion (deg) 6.75 8.75 1.25 5.50 8.00 4.50 0.75 3.75 1.50 Injection Duration (deg) 0.25 0.50 0.50 0.50 0.25 0.25 0.50 0.25 0.25
Premix Length (deg) 25.97 0.23 0.15 0.14 0.23 0.26 0.19 0.13 0.21
Diffusion Length (deg) 43.19 0.55 4.18 1.80 4.17 0.92 14.12 1.48 6.26
122
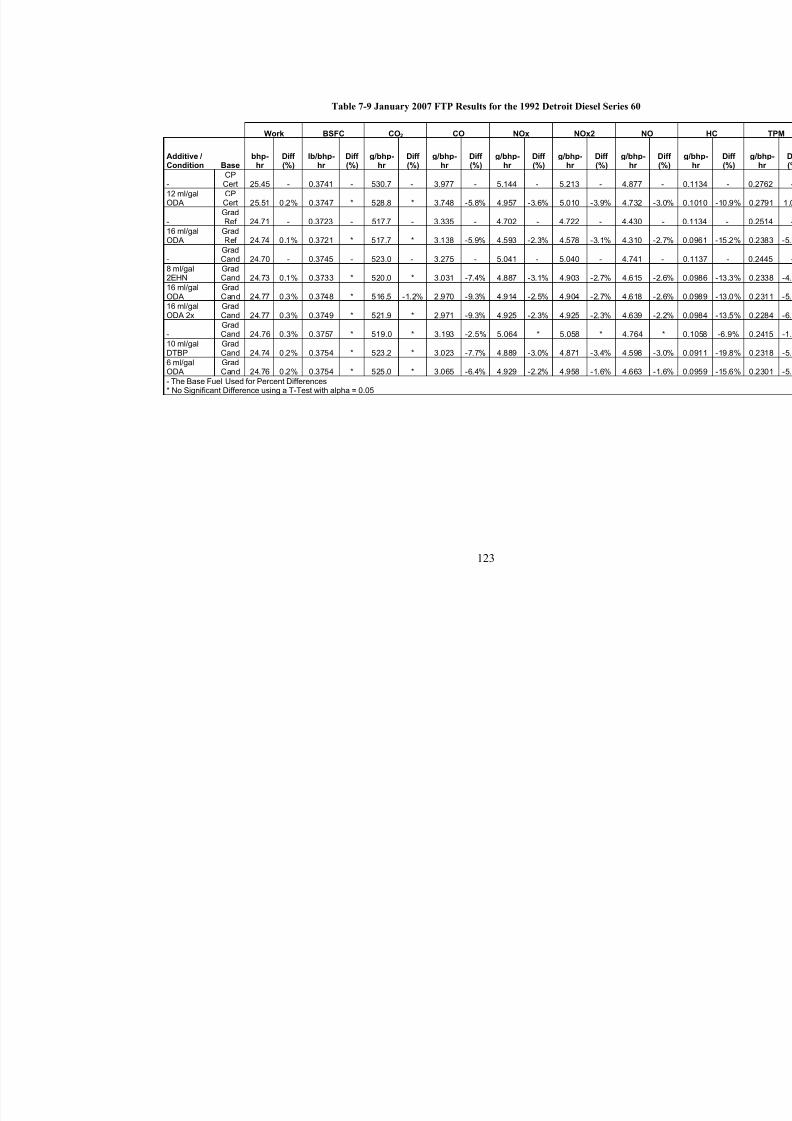
8/23/2019 The Effects of Fuel Additives on Diesel Engine Emissions During Steady State and Transient Operation
http://slidepdf.com/reader/full/the-effects-of-fuel-additives-on-diesel-engine-emissions-during-steady-state 142/163
Table 7-9 January 2007 FTP Results for the 1992 Detroit Diesel Series 60
Work BSFC CO2 CO NOx NOx2 NO
Additive /Condition Base
bhp-hr
Diff (%)
lb/bhp-hr
Diff (%)
g/bhp-hr
Diff (%)
g/bhp-hr
Diff (%)
g/bhp-hr
Diff (%)
g/bhp-hr
Diff (%)
g/bhp-hr
D(%
-CPCert 25.45 - 0.3741 - 530.7 - 3.977 - 5.144 - 5.213 - 4.877
12 ml/galODA
CPCert 25.51 0.2% 0.3747 * 528.8 * 3.748 -5.8% 4.957 -3.6% 5.010 -3.9% 4.732 -3
-GradRef 24.71 - 0.3723 - 517.7 - 3.335 - 4.702 - 4.722 - 4.430
16 ml/galODA
GradRef 24.74 0.1% 0.3721 * 517.7 * 3.138 -5.9% 4.593 -2.3% 4.578 -3.1% 4.310 -2
-GradCand 24.70 - 0.3745 - 523.0 - 3.275 - 5.041 - 5.040 - 4.741
8 ml/gal2EHN
GradCand 24.73 0.1% 0.3733 * 520.0 * 3.031 -7.4% 4.887 -3.1% 4.903 -2.7% 4.615 -2
16 ml/galODA
GradCand 24.77 0.3% 0.3748 * 516.5 -1.2% 2.970 -9.3% 4.914 -2.5% 4.904 -2.7% 4.618 -2
16 ml/galODA 2x
GradCand 24.77 0.3% 0.3749 * 521.9 * 2.971 -9.3% 4.925 -2.3% 4.925 -2.3% 4.639 -2
-GradCand 24.76 0.3% 0.3757 * 519.0 * 3.193 -2.5% 5.064 * 5.058 * 4.764
10 ml/galDTBP
GradCand 24.74 0.2% 0.3754 * 523.2 * 3.023 -7.7% 4.889 -3.0% 4.871 -3.4% 4.598 -3
6 ml/galODA
GradCand 24.76 0.2% 0.3754 * 525.0 * 3.065 -6.4% 4.929 -2.2% 4.958 -1.6% 4.663 -1
- The Base Fuel Used for Percent Differences* No Significant Difference using a T-Test with alpha = 0.05
123
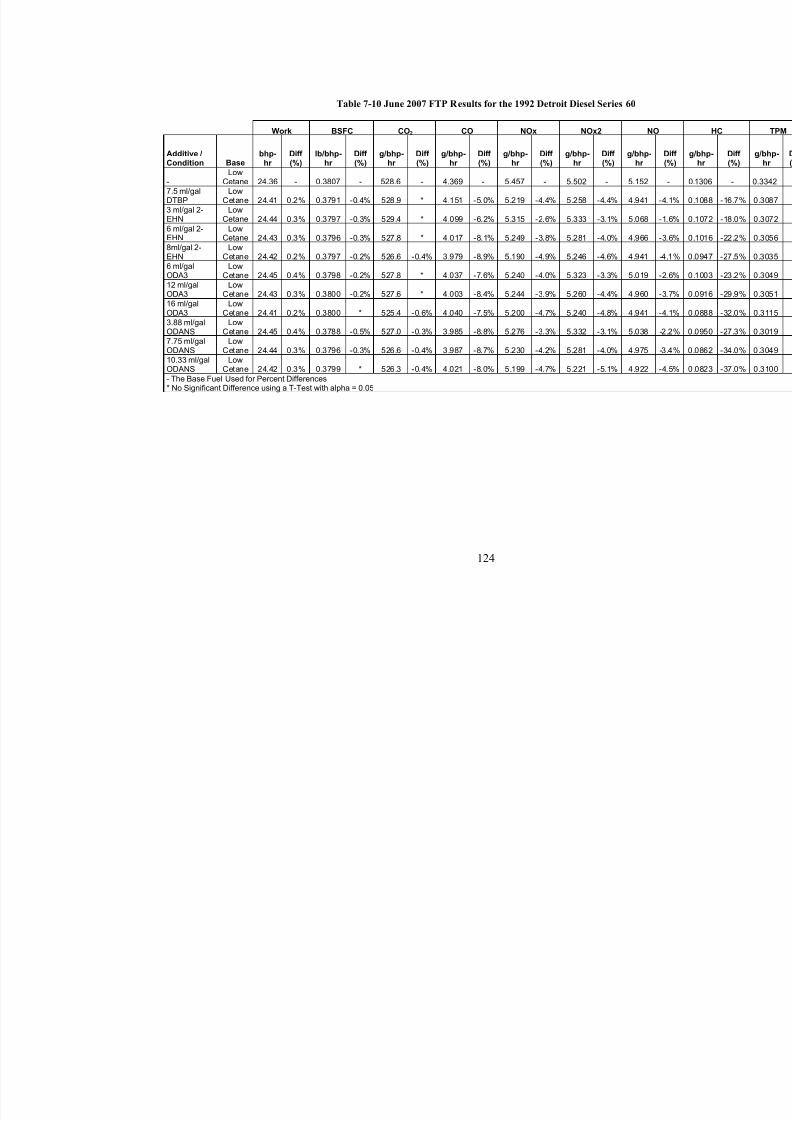
8/23/2019 The Effects of Fuel Additives on Diesel Engine Emissions During Steady State and Transient Operation
http://slidepdf.com/reader/full/the-effects-of-fuel-additives-on-diesel-engine-emissions-during-steady-state 143/163
Table 7-10 June 2007 FTP Results for the 1992 Detroit Diesel Series 60
Work BSFC CO2 CO NOx NOx2 NO
Additive /Condition Base
bhp-hr
Diff (%)
lb/bhp-hr
Diff (%)
g/bhp-hr
Diff (%)
g/bhp-hr
Diff (%)
g/bhp-hr
Diff (%)
g/bhp-hr
Diff (%)
g/bhp-hr
-Low
Cetane 24.36 - 0.3807 - 528.6 - 4.369 - 5.457 - 5.502 - 5.152
7.5 ml/galDTBP
LowCetane 24.41 0.2% 0.3791 -0.4% 528.9 * 4.151 -5.0% 5.219 -4.4% 5.258 -4.4% 4.941 -
3 ml/gal 2-EHN
LowCetane 24.44 0.3% 0.3797 -0.3% 529.4 * 4.099 -6.2% 5.315 -2.6% 5.333 -3.1% 5.068 -
6 ml/gal 2-EHN
LowCetane 24.43 0.3% 0.3796 -0.3% 527.8 * 4.017 -8.1% 5.249 -3.8% 5.281 -4.0% 4.966 -
8ml/gal 2-EHN
LowCetane 24.42 0.2% 0.3797 -0.2% 526.6 -0.4% 3.979 -8.9% 5.190 -4.9% 5.246 -4.6% 4.941 -
6 ml/galODA3
LowCetane 24.45 0.4% 0.3798 -0.2% 527.8 * 4.037 -7.6% 5.240 -4.0% 5.323 -3.3% 5.019 -
12 ml/galODA3
LowCetane 24.43 0.3% 0.3800 -0.2% 527.6 * 4.003 -8.4% 5.244 -3.9% 5.260 -4.4% 4.960 -
16 ml/galODA3
LowCetane 24.41 0.2% 0.3800 * 525.4 -0.6% 4.040 -7.5% 5.200 -4.7% 5.240 -4.8% 4.941 -
3.88 ml/galODANS
LowCetane 24.45 0.4% 0.3788 -0.5% 527.0 -0.3% 3.985 -8.8% 5.276 -3.3% 5.332 -3.1% 5.038 -
7.75 ml/galODANS
LowCetane 24.44 0.3% 0.3796 -0.3% 526.6 -0.4% 3.987 -8.7% 5.230 -4.2% 5.281 -4.0% 4.975 -
10.33 ml/galODANS
LowCetane 24.42 0.3% 0.3799 * 526.3 -0.4% 4.021 -8.0% 5.199 -4.7% 5.221 -5.1% 4.922 -
- The Base Fuel Used for Percent Differences* No Significant Difference using a T-Test with alpha = 0.05
124
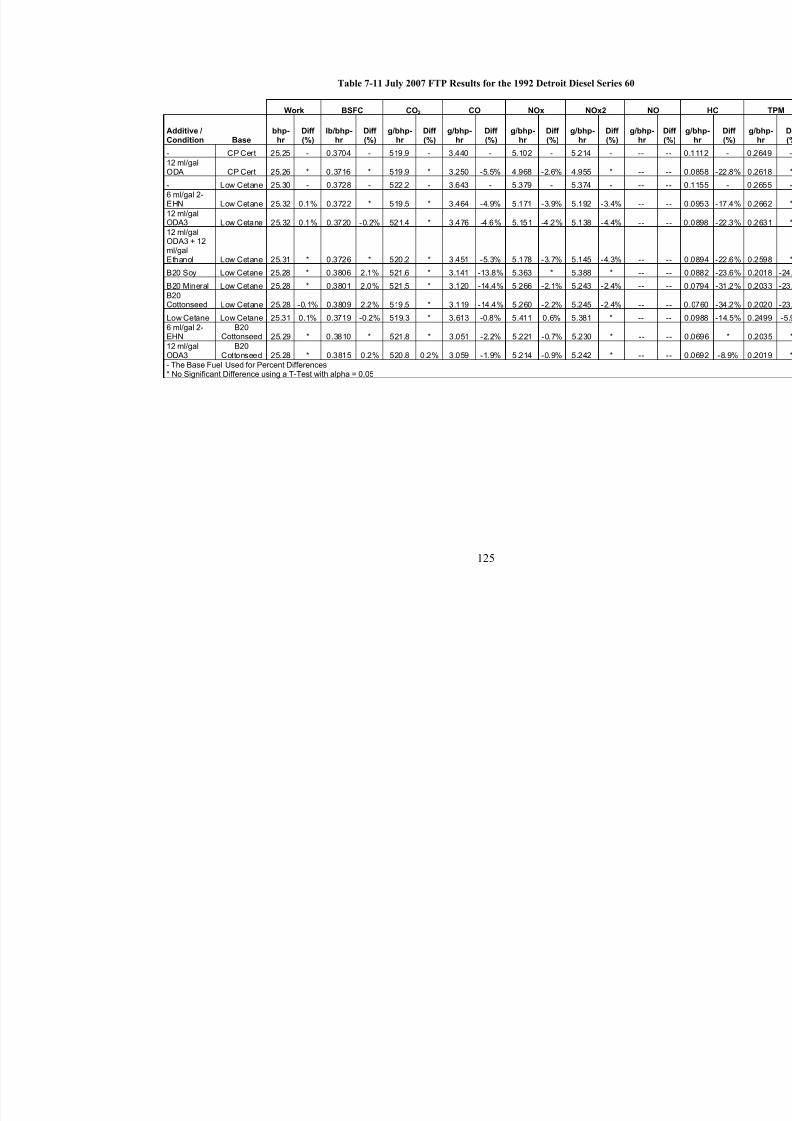
8/23/2019 The Effects of Fuel Additives on Diesel Engine Emissions During Steady State and Transient Operation
http://slidepdf.com/reader/full/the-effects-of-fuel-additives-on-diesel-engine-emissions-during-steady-state 144/163
Table 7-11 July 2007 FTP Results for the 1992 Detroit Diesel Series 60
Work BSFC CO2 CO NOx NOx2 NO
Additive /Condition Base
bhp-hr
Diff (%)
lb/bhp-hr
Diff (%)
g/bhp-hr
Diff (%)
g/bhp-hr
Diff (%)
g/bhp-hr
Diff (%)
g/bhp-hr
Diff (%)
g/bhp-hr
- CP Cert 25.25 - 0.3704 - 519.9 - 3.440 - 5.102 - 5.214 - -- 12 ml/galODA CP Cert 25.26 * 0.3716 * 519.9 * 3.250 -5.5% 4.968 -2.6% 4.955 * --
- Low Cetane 25.30 - 0.3728 - 522.2 - 3.643 - 5.379 - 5.374 - --
6 ml/gal 2-EHN Low Cetane 25.32 0.1% 0.3722 * 519.5 * 3.464 -4.9% 5.171 -3.9% 5.192 -3.4% --
12 ml/galODA3 Low Cetane 25.32 0.1% 0.3720 -0.2% 521.4 * 3.476 -4.6% 5.151 -4.2% 5.138 -4.4% --
12 ml/galODA3 + 12ml/galEthanol Low Cetane 25.31 * 0.3726 * 520.2 * 3.451 -5.3% 5.178 -3.7% 5.145 -4.3% --
B20 Soy Low Cetane 25.28 * 0.3806 2.1% 521.6 * 3.141 -13.8% 5.363 * 5.388 * --
B20 Mineral Low Cetane 25.28 * 0.3801 2.0% 521.5 * 3.120 -14.4% 5.266 -2.1% 5.243 -2.4% --
B20
Cottonseed Low Cetane 25.28 -0.1% 0.3809 2.2% 519.5 * 3.119 -14.4% 5.260 -2.2% 5.245 -2.4% --
Low Cetane Low Cetane 25.31 0.1% 0.3719 -0.2% 519.3 * 3.613 -0.8% 5.411 0.6% 5.381 * --
6 ml/gal 2-EHN
B20Cottonseed 25.29 * 0.3810 * 521.8 * 3.051 -2.2% 5.221 -0.7% 5.230 * --
12 ml/galODA3
B20Cottonseed 25.28 * 0.3815 0.2% 520.8 0.2% 3.059 -1.9% 5.214 -0.9% 5.242 * --
- The Base Fuel Used for Percent Differences* No Significant Difference using a T-Test with alpha = 0.05
125
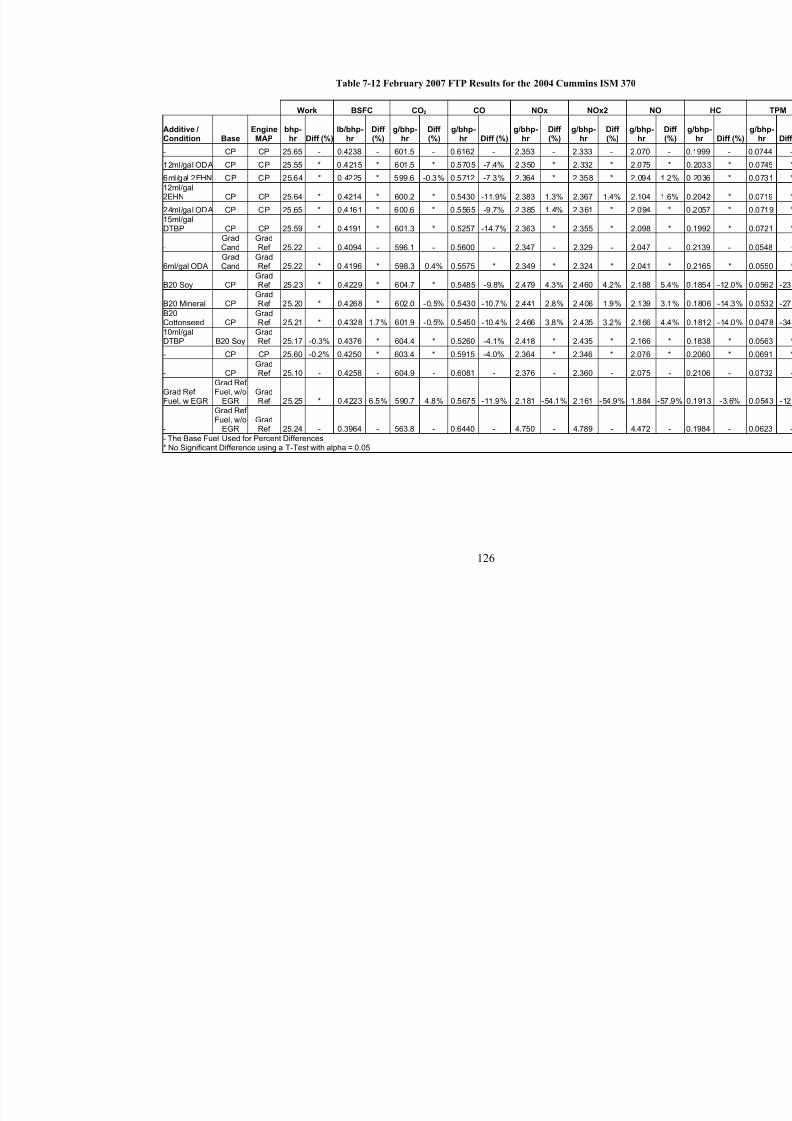
8/23/2019 The Effects of Fuel Additives on Diesel Engine Emissions During Steady State and Transient Operation
http://slidepdf.com/reader/full/the-effects-of-fuel-additives-on-diesel-engine-emissions-during-steady-state 145/163
Work BSFC CO2 CO NOx NOx2 NO
Additive /Condition Base
EngineMAP
bhp-hr Diff (%)
lb/bhp-hr
Diff (%)
g/bhp-hr
Diff (%)
g/bhp-hr Diff (%)
g/bhp-hr
Diff (%)
g/bhp-hr
Diff (%)
g/bhp-hr
- CP CP 25.65 - 0.4238 - 601.5 - 0.6162 - 2.353 - 2.333 - 2.070
12ml/gal ODA CP CP 25.55 * 0.4215 * 601.5 * 0.5705 -7.4% 2.350 * 2.332 * 2.075
6ml/gal 2EHN CP CP 25.64 * 0.4225 * 599.6 -0.3% 0.5712 -7.3% 2.364 * 2.358 * 2.094
12ml/gal2EHN CP CP 25.64 * 0.4214 * 600.2 * 0.5430 -11.9% 2.383 1.3% 2.367 1.4% 2.104
24ml/gal ODA CP CP 25.65 * 0.4161 * 600.6 * 0.5565 -9.7% 2.385 1.4% 2.361 * 2.094
15ml/galDTBP CP CP 25.59 * 0.4191 * 601.3 * 0.5257 -14.7% 2.363 * 2.355 * 2.098
-GradCand
GradRef 25.22 - 0.4094 - 596.1 - 0.5600 - 2.347 - 2.329 - 2.047
6ml/gal ODAGradCand
GradRef 25.22 * 0.4196 * 598.3 0.4% 0.5575 * 2.349 * 2.324 * 2.041
B20 Soy CPGradRef 25.23 * 0.4229 * 604.7 * 0.5485 -9.8% 2.479 4.3% 2.460 4.2% 2.188
B20 Mineral CP
Grad
Ref 25.20 * 0.4268 * 602.0 -0.5% 0.5430 -10.7% 2.441 2.8% 2.406 1.9% 2.139 B20Cottonseed CP
GradRef 25.21 * 0.4328 1.7% 601.9 -0.5% 0.5450 -10.4% 2.466 3.8% 2.435 3.2% 2.166 4
10ml/galDTBP B20 Soy
GradRef 25.17 -0.3% 0.4376 * 604.4 * 0.5260 -4.1% 2.418 * 2.435 * 2.166
- CP CP 25.60 -0.2% 0.4250 * 603.4 * 0.5915 -4.0% 2.364 * 2.346 * 2.076
- CPGradRef 25.10 - 0.4258 - 604.9 - 0.6081 - 2.376 - 2.360 - 2.075
Grad Ref Fuel, w EGR
Grad Ref Fuel, w/o
EGRGradRef 25.25 * 0.4223 6.5% 590.7 4.8% 0.5675 -11.9% 2.181 -54.1% 2.161 -54.9% 1.884 -5
-
Grad Ref Fuel, w/o
EGRGradRef 25.24 - 0.3964 - 563.8 - 0.6440 - 4.750 - 4.789 - 4.472
- The Base Fuel Used for Percent Differences* No Significant Difference using a T-Test with alpha = 0.05
Table 7-12 February 2007 FTP Results for the 2004 Cummins ISM 370
126
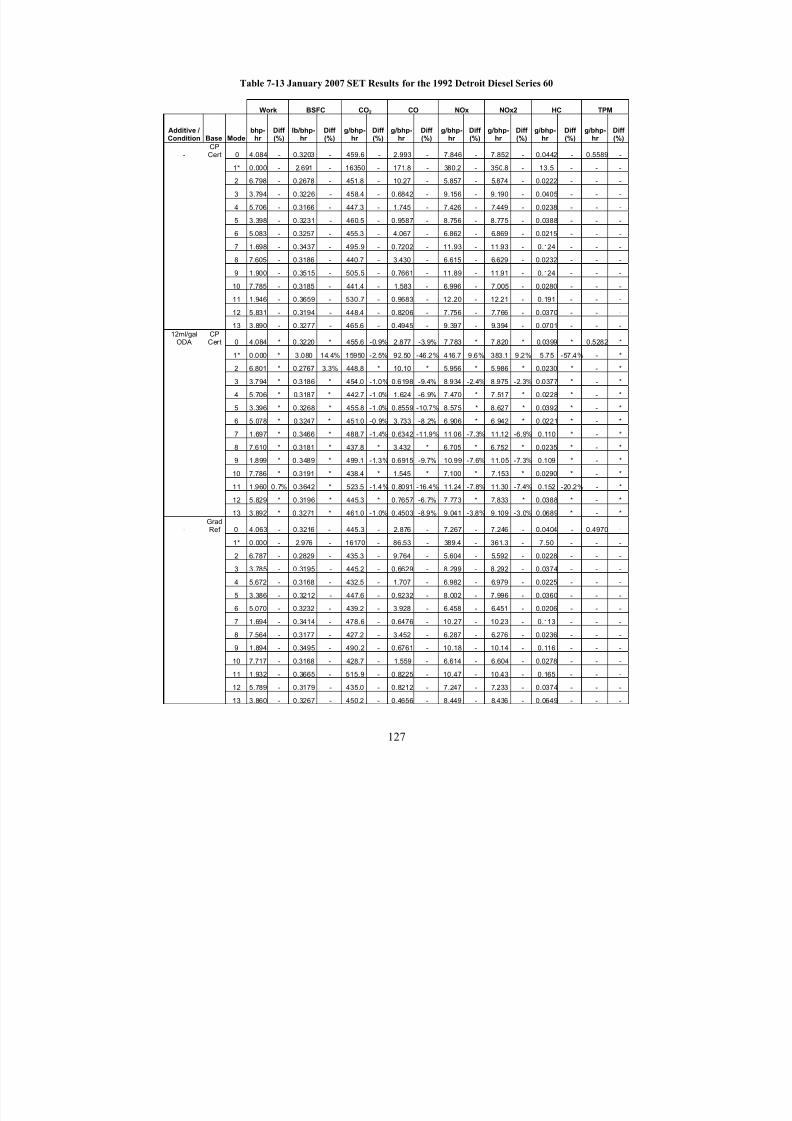
8/23/2019 The Effects of Fuel Additives on Diesel Engine Emissions During Steady State and Transient Operation
http://slidepdf.com/reader/full/the-effects-of-fuel-additives-on-diesel-engine-emissions-during-steady-state 146/163
Table 7-13 January 2007 SET Results for the 1992 Detroit Diesel Series 60
Work BSFC CO2 CO NOx NOx2 HC TPM
Additive /Condition Base Mode
bhp-hr
Diff (%)
lb/bhp-hr
Diff (%)
g/bhp-hr
Diff (%)
g/bhp-hr
Diff (%)
g/bhp-hr
Diff (%)
g/bhp-hr
Diff (%)
g/bhp-hr
Diff (%)
g/bhp-hr
Diff (%)
-CPCert 0 4.084 - 0.3203 - 459.6 - 2.993 - 7.846 - 7.852 - 0.0442 - 0.5589 -
1* 0.000 - 2.691 - 16350 - 171.8 - 380.2 - 350.8 - 13.5 - - -
2 6.798 - 0.2678 - 451.8 - 10.27 - 5.857 - 5.874 - 0.0222 - - -
3 3.794 - 0.3226 - 458.4 - 0.6842 - 9.156 - 9.190 - 0.0405 - - -
4 5.706 - 0.3166 - 447.3 - 1.745 - 7.426 - 7.449 - 0.0238 - - -
5 3.398 - 0.3231 - 460.5 - 0.9587 - 8.756 - 8.775 - 0.0388 - - -
6 5.083 - 0.3257 - 455.3 - 4.067 - 6.862 - 6.869 - 0.0215 - - -
7 1.698 - 0.3437 - 495.9 - 0.7202 - 11.93 - 11.93 - 0.124 - - -
8 7.605 - 0.3186 - 440.7 - 3.430 - 6.615 - 6.629 - 0.0232 - - -
9 1.900 - 0.3515 - 505.5 - 0.7661 - 11.89 - 11.91 - 0.124 - - -
10 7.785 - 0.3185 - 441.4 - 1.583 - 6.996 - 7.005 - 0.0280 - - -
11 1.946 - 0.3659 - 530.7 - 0.9683 - 12.20 - 12.21 - 0.191 - - -12 5.831 - 0.3194 - 448.4 - 0.8206 - 7.756 - 7.766 - 0.0370 - - -
13 3.890 - 0.3277 - 465.6 - 0.4945 - 9.397 - 9.394 - 0.0701 - - -
12ml/galODA
CPCert 0 4.084 * 0.3220 * 455.6 -0.9% 2.877 -3.9% 7.783 * 7.820 * 0.0399 * 0.5282 *
1* 0.000 * 3.080 14.4% 15950 -2.5% 92.50 -46.2% 416.7 9.6% 383.1 9.2% 5.75 -57.4% - *
2 6.801 * 0.2767 3.3% 448.8 * 10.10 * 5.956 * 5.986 * 0.0230 * - *
3 3.794 * 0.3186 * 454.0 -1.0% 0.6198 -9.4% 8.934 -2.4% 8.975 -2.3% 0.0377 * - *
4 5.706 * 0.3187 * 442.7 -1.0% 1.624 -6.9% 7.470 * 7.517 * 0.0228 * - *
5 3.396 * 0.3268 * 455.8 -1.0% 0.8559 -10.7% 8.575 * 8.627 * 0.0392 * - *
6 5.078 * 0.3247 * 451.0 -0.9% 3.733 -8.2% 6.906 * 6.942 * 0.0221 * - *
7 1.697 * 0.3466 * 488.7 -1.4% 0.6342 -11.9% 11.06 -7.3% 11.12 -6.9% 0.110 * - *
8 7.610 * 0.3181 * 437.8 * 3.432 * 6.705 * 6.752 * 0.0235 * - *
9 1.899 * 0.3489 * 499.1 -1.3% 0.6915 -9.7% 10.99 -7.6% 11.05 -7.3% 0.109 * - *
10 7.786 * 0.3191 * 438.4 * 1.545 * 7.100 * 7.153 * 0.0290 * - *
11 1.960 0.7% 0.3642 * 523.5 -1.4% 0.8091 -16.4% 11.24 -7.8% 11.30 -7.4% 0.152 -20.2% - *
12 5.829 * 0.3196 * 445.3 * 0.7657 -6.7% 7.773 * 7.833 * 0.0388 * - *
13 3.892 * 0.3271 * 461.0 -1.0% 0.4503 -8.9% 9.041 -3.8% 9.109 -3.0% 0.0689 * - *
-GradRef 0 4.063 - 0.3216 - 445.3 - 2.876 - 7.267 - 7.246 - 0.0404 - 0.4970 -
1* 0.000 - 2.976 - 16170 - 86.53 - 389.4 - 361.3 - 7.50 - - -
2 6.787 - 0.2829 - 435.3 - 9.764 - 5.604 - 5.592 - 0.0228 - - -
3 3.785 - 0.3195 - 445.2 - 0.6629 - 8.299 - 8.292 - 0.0374 - - -
4 5.672 - 0.3168 - 432.5 - 1.707 - 6.982 - 6.979 - 0.0225 - - -
5 3.386 - 0.3212 - 447.6 - 0.9232 - 8.002 - 7.996 - 0.0360 - - -
6 5.070 - 0.3232 - 439.2 - 3.928 - 6.458 - 6.451 - 0.0206 - - -
7 1.694 - 0.3414 - 478.6 - 0.6476 - 10.27 - 10.23 - 0.113 - - -
8 7.564 - 0.3177 - 427.2 - 3.452 - 6.287 - 6.276 - 0.0236 - - -
9 1.894 - 0.3495 - 490.2 - 0.6761 - 10.18 - 10.14 - 0.116 - - -
10 7.717 - 0.3168 - 428.7 - 1.559 - 6.614 - 6.604 - 0.0278 - - -
11 1.932 - 0.3665 - 515.9 - 0.8225 - 10.47 - 10.43 - 0.165 - - -
12 5.789 - 0.3179 - 435.0 - 0.8212 - 7.247 - 7.233 - 0.0374 - - -
13 3.860 - 0.3267 - 450.2 - 0.4656 - 8.449 - 8.436 - 0.0649 - - -
127
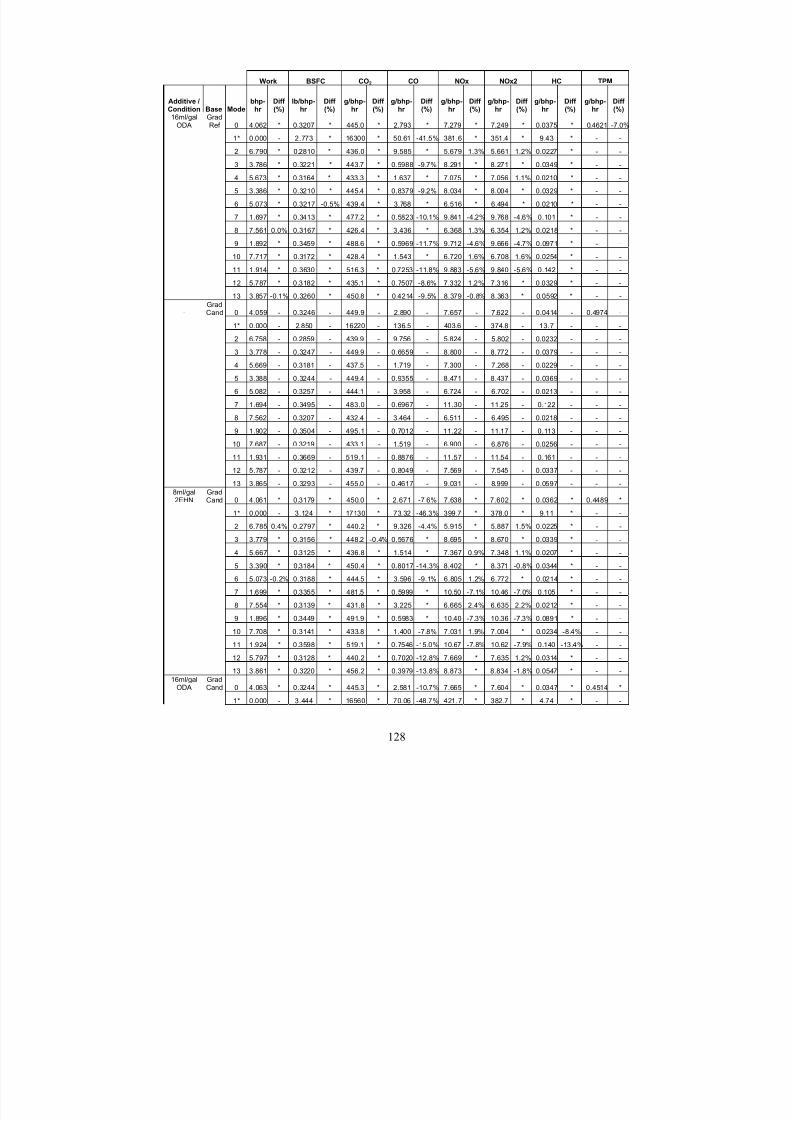
8/23/2019 The Effects of Fuel Additives on Diesel Engine Emissions During Steady State and Transient Operation
http://slidepdf.com/reader/full/the-effects-of-fuel-additives-on-diesel-engine-emissions-during-steady-state 147/163
Work BSFC CO2 CO NOx NOx2 HC TPM
Additive /Condition Base Mode
bhp-hr
Diff (%)
lb/bhp-hr
Diff (%)
g/bhp-hr
Diff (%)
g/bhp-hr
Diff (%)
g/bhp-hr
Diff (%)
g/bhp-hr
Diff (%)
g/bhp-hr
Diff (%)
g/bhp-hr
Diff (%)
16ml/galODA
GradRef 0 4.062 * 0.3207 * 445.0 * 2.793 * 7.279 * 7.249 * 0.0375 * 0.4621 -7.0%
1* 0.000 - 2.773 * 16300 * 50.61 -41.5% 381.6 * 351.4 * 9.43 * - -
2 6.790 * 0.2810 * 436.0 * 9.585 * 5.679 1.3% 5.661 1.2% 0.0227 * - -
3 3.786 * 0.3221 * 443.7 * 0.5988 -9.7% 8.291 * 8.271 * 0.0349 * - -
4 5.673 * 0.3164 * 433.3 * 1.637 * 7.075 * 7.056 1.1% 0.0210 * - -
5 3.386 * 0.3210 * 445.4 * 0.8379 -9.2% 8.034 * 8.004 * 0.0329 * - -
6 5.073 * 0.3217 -0.5% 439.4 * 3.768 * 6.516 * 6.494 * 0.0210 * - -
7 1.697 * 0.3413 * 477.2 * 0.5823 -10.1% 9.841 -4.2% 9.768 -4.6% 0.101 * - -
8 7.561 0.0% 0.3167 * 426.4 * 3.436 * 6.368 1.3% 6.354 1.2% 0.0218 * - -
9 1.892 * 0.3459 * 488.6 * 0.5969 -11.7% 9.712 -4.6% 9.666 -4.7% 0.0971 * - -
10 7.717 * 0.3172 * 428.4 * 1.543 * 6.720 1.6% 6.708 1.6% 0.0254 * - -
11 1.914 * 0.3630 * 516.3 * 0.7253 -11.8% 9.883 -5.6% 9.840 -5.6% 0.142 * - -
12 5.787 * 0.3182 * 435.1 * 0.7507 -8.6% 7.332 1.2% 7.316 * 0.0329 * - -
13 3.857 -0.1% 0.3260 * 450.8 * 0.4214 -9.5% 8.379 -0.8% 8.363 * 0.0592 * - -
-GradCand 0 4.059 - 0.3246 - 449.9 - 2.890 - 7.657 - 7.622 - 0.0414 - 0.4974 -
1* 0.000 - 2.850 - 16220 - 136.5 - 403.6 - 374.8 - 13.7 - - -
2 6.758 - 0.2859 - 439.9 - 9.756 - 5.824 - 5.802 - 0.0232 - - -
3 3.778 - 0.3247 - 449.9 - 0.6659 - 8.800 - 8.772 - 0.0379 - - -
4 5.669 - 0.3181 - 437.5 - 1.719 - 7.300 - 7.268 - 0.0229 - - -
5 3.388 - 0.3244 - 449.4 - 0.9355 - 8.471 - 8.437 - 0.0369 - - -
6 5.082 - 0.3257 - 444.1 - 3.958 - 6.724 - 6.702 - 0.0213 - - -
7 1.694 - 0.3495 - 483.0 - 0.6967 - 11.30 - 11.25 - 0.122 - - -
8 7.562 - 0.3207 - 432.4 - 3.464 - 6.511 - 6.495 - 0.0218 - - -
9 1.902 - 0.3504 - 495.1 - 0.7012 - 11.22 - 11.17 - 0.113 - - -
10 7.687 - 0.3219 - 433.1 - 1.519 - 6.900 - 6.876 - 0.0256 - - -
11 1.931 - 0.3669 - 519.1 - 0.8876 - 11.57 - 11.54 - 0.161 - - -
12 5.787 - 0.3212 - 439.7 - 0.8049 - 7.569 - 7.545 - 0.0337 - - -
13 3.865 - 0.3293 - 455.0 - 0.4617 - 9.031 - 8.999 - 0.0597 - - -
8ml/gal2EHN
GradCand 0 4.061 * 0.3179 * 450.0 * 2.671 -7.6% 7.638 * 7.602 * 0.0362 * 0.4489 *
1* 0.000 - 3.124 * 17130 * 73.32 -46.3% 399.7 * 378.0 * 9.11 * - -
2 6.785 0.4% 0.2797 * 440.2 * 9.326 -4.4% 5.915 * 5.887 1.5% 0.0225 * - -
3 3.779 * 0.3156 * 448.2 -0.4% 0.5676 * 8.695 * 8.670 * 0.0339 * - -
4 5.667 * 0.3125 * 436.8 * 1.514 * 7.367 0.9% 7.348 1.1% 0.0207 * - -
5 3.390 * 0.3184 * 450.4 * 0.8017 -14.3% 8.402 * 8.371 -0.8% 0.0344 * - -
6 5.073 -0.2% 0.3188 * 444.5 * 3.596 -9.1% 6.805 1.2% 6.772 * 0.0214 * - -
7 1.699 * 0.3355 * 481.5 * 0.5999 * 10.50 -7.1% 10.46 -7.0% 0.105 * - -
8 7.554 * 0.3139 * 431.8 * 3.225 * 6.665 2.4% 6.635 2.2% 0.0212 * - -
9 1.896 * 0.3449 * 491.9 * 0.5983 * 10.40 -7.3% 10.36 -7.3% 0.0891 * - -
10 7.708 * 0.3141 * 433.8 * 1.400 -7.8% 7.031 1.9% 7.004 * 0.0234 -8.4% - -
11 1.924 * 0.3598 * 519.1 * 0.7546 -15.0% 10.67 -7.8% 10.62 -7.9% 0.140 -13.4% - -
12 5.797 * 0.3128 * 440.2 * 0.7020 -12.8% 7.669 * 7.635 1.2% 0.0314 * - -
13 3.861 * 0.3220 * 456.2 * 0.3979 -13.8% 8.873 * 8.834 -1.8% 0.0547 * - -
16ml/galODA
GradCand 0 4.063 * 0.3244 * 445.3 * 2.581 -10.7% 7.665 * 7.604 * 0.0347 * 0.4514 *
1* 0.000 - 3.444 * 16560 * 70.06 -48.7% 421.7 * 382.7 * 4.74 * - -
128
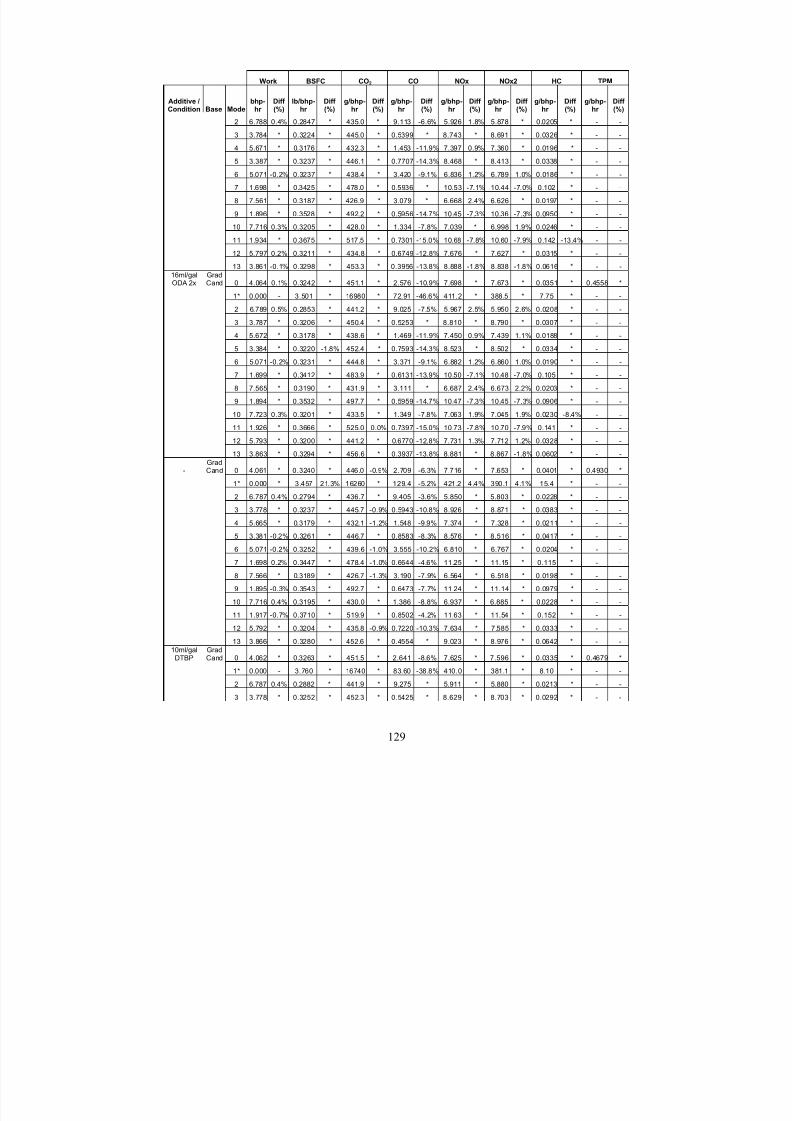
8/23/2019 The Effects of Fuel Additives on Diesel Engine Emissions During Steady State and Transient Operation
http://slidepdf.com/reader/full/the-effects-of-fuel-additives-on-diesel-engine-emissions-during-steady-state 148/163
Work BSFC CO2 CO NOx NOx2 HC TPM
Additive /Condition Base Mode
bhp-hr
Diff (%)
lb/bhp-hr
Diff (%)
g/bhp-hr
Diff (%)
g/bhp-hr
Diff (%)
g/bhp-hr
Diff (%)
g/bhp-hr
Diff (%)
g/bhp-hr
Diff (%)
g/bhp-hr
Diff (%)
2 6.788 0.4% 0.2847 * 435.0 * 9.113 -6.6% 5.926 1.8% 5.878 * 0.0205 * - -
3 3.784 * 0.3224 * 445.0 * 0.5399 * 8.743 * 8.691 * 0.0326 * - -
4 5.671 * 0.3176 * 432.3 * 1.453 -11.9% 7.397 0.9% 7.360 * 0.0196 * - -5 3.387 * 0.3237 * 446.1 * 0.7707 -14.3% 8.468 * 8.413 * 0.0338 * - -
6 5.071 -0.2% 0.3237 * 438.4 * 3.420 -9.1% 6.836 1.2% 6.789 1.0% 0.0186 * - -
7 1.698 * 0.3425 * 478.0 * 0.5936 * 10.53 -7.1% 10.44 -7.0% 0.102 * - -
8 7.561 * 0.3187 * 426.9 * 3.079 * 6.668 2.4% 6.626 * 0.0197 * - -
9 1.896 * 0.3528 * 492.2 * 0.5956 -14.7% 10.45 -7.3% 10.36 -7.3% 0.0950 * - -
10 7.716 0.3% 0.3205 * 428.0 * 1.334 -7.8% 7.039 * 6.998 1.9% 0.0246 * - -
11 1.934 * 0.3675 * 517.5 * 0.7301 -15.0% 10.68 -7.8% 10.60 -7.9% 0.142 -13.4% - -
12 5.797 0.2% 0.3211 * 434.8 * 0.6749 -12.8% 7.676 * 7.627 * 0.0315 * - -
13 3.861 -0.1% 0.3298 * 453.3 * 0.3956 -13.8% 8.888 -1.8% 8.838 -1.8% 0.0616 * - -
16ml/galODA 2x
GradCand 0 4.064 0.1% 0.3242 * 451.1 * 2.576 -10.9% 7.698 * 7.673 * 0.0351 * 0.4558 *
1* 0.000 - 3.501 * 16980 * 72.91 -46.6% 411.2 * 388.5 * 7.75 * - -
2 6.789 0.5% 0.2853 * 441.2 * 9.025 -7.5% 5.967 2.5% 5.950 2.6% 0.0208 * - -
3 3.787 * 0.3206 * 450.4 * 0.5253 * 8.810 * 8.790 * 0.0307 * - -
4 5.672 * 0.3178 * 438.6 * 1.469 -11.9% 7.450 0.9% 7.439 1.1% 0.0188 * - -
5 3.384 * 0.3220 -1.8% 452.4 * 0.7593 -14.3% 8.523 * 8.502 * 0.0334 * - -
6 5.071 -0.2% 0.3231 * 444.8 * 3.371 -9.1% 6.882 1.2% 6.860 1.0% 0.0190 * - -
7 1.699 * 0.3412 * 483.9 * 0.6131 -13.9% 10.50 -7.1% 10.48 -7.0% 0.105 * - -
8 7.565 * 0.3190 * 431.9 * 3.111 * 6.687 2.4% 6.673 2.2% 0.0203 * - -
9 1.894 * 0.3532 * 497.7 * 0.5959 -14.7% 10.47 -7.3% 10.45 -7.3% 0.0906 * - -
10 7.723 0.3% 0.3201 * 433.5 * 1.349 -7.8% 7.063 1.9% 7.045 1.9% 0.0230 -8.4% - -
11 1.926 * 0.3666 * 525.0 0.0% 0.7397 -15.0% 10.73 -7.8% 10.70 -7.9% 0.141 * - -
12 5.793 * 0.3200 * 441.2 * 0.6770 -12.8% 7.731 1.3% 7.712 1.2% 0.0328 * - -
13 3.863 * 0.3294 * 456.6 * 0.3937 -13.8% 8.881 * 8.867 -1.8% 0.0602 * - -
-GradCand 0 4.061 * 0.3240 * 446.0 -0.9% 2.709 -6.3% 7.716 * 7.653 * 0.0401 * 0.4930 *
1* 0.000 * 3.457 21.3% 16260 * 129.4 -5.2% 421.2 4.4% 390.1 4.1% 15.4 * - -
2 6.787 0.4% 0.2794 * 436.7 * 9.405 -3.6% 5.850 * 5.803 * 0.0228 * - -
3 3.778 * 0.3237 * 445.7 -0.9% 0.5943 -10.8% 8.926 * 8.871 * 0.0383 * - -
4 5.665 * 0.3179 * 432.1 -1.2% 1.548 -9.9% 7.374 * 7.328 * 0.0211 * - -
5 3.381 -0.2% 0.3261 * 446.7 * 0.8583 -8.3% 8.576 * 8.516 * 0.0417 * - -
6 5.071 -0.2% 0.3252 * 439.6 -1.0% 3.555 -10.2% 6.810 * 6.767 * 0.0204 * - -
7 1.698 0.2% 0.3447 * 478.4 -1.0% 0.6644 -4.6% 11.25 * 11.15 * 0.115 * - -
8 7.566 * 0.3189 * 426.7 -1.3% 3.190 -7.9% 6.564 * 6.518 * 0.0198 * - -
9 1.895 -0.3% 0.3543 * 492.7 * 0.6473 -7.7% 11.24 * 11.14 * 0.0979 * - -
10 7.716 0.4% 0.3195 * 430.0 * 1.386 -8.8% 6.937 * 6.885 * 0.0228 * - -
11 1.917 -0.7% 0.3710 * 519.9 * 0.8502 -4.2% 11.63 * 11.54 * 0.152 * - -
12 5.792 * 0.3204 * 435.8 -0.9% 0.7220 -10.3% 7.634 * 7.585 * 0.0333 * - -
13 3.866 * 0.3280 * 452.6 * 0.4554 * 9.023 * 8.976 * 0.0642 * - -
10ml/galDTBP
GradCand 0 4.062 * 0.3263 * 451.5 * 2.641 -8.6% 7.625 * 7.596 * 0.0335 * 0.4679 *
1* 0.000 - 3.760 * 16740 * 83.60 -38.8% 410.0 * 381.1 * 8.10 * - -
2 6.787 0.4% 0.2882 * 441.9 * 9.275 * 5.911 * 5.880 * 0.0213 * - -
3 3.778 * 0.3252 * 452.3 * 0.5425 * 8.629 * 8.703 * 0.0292 * - -
129
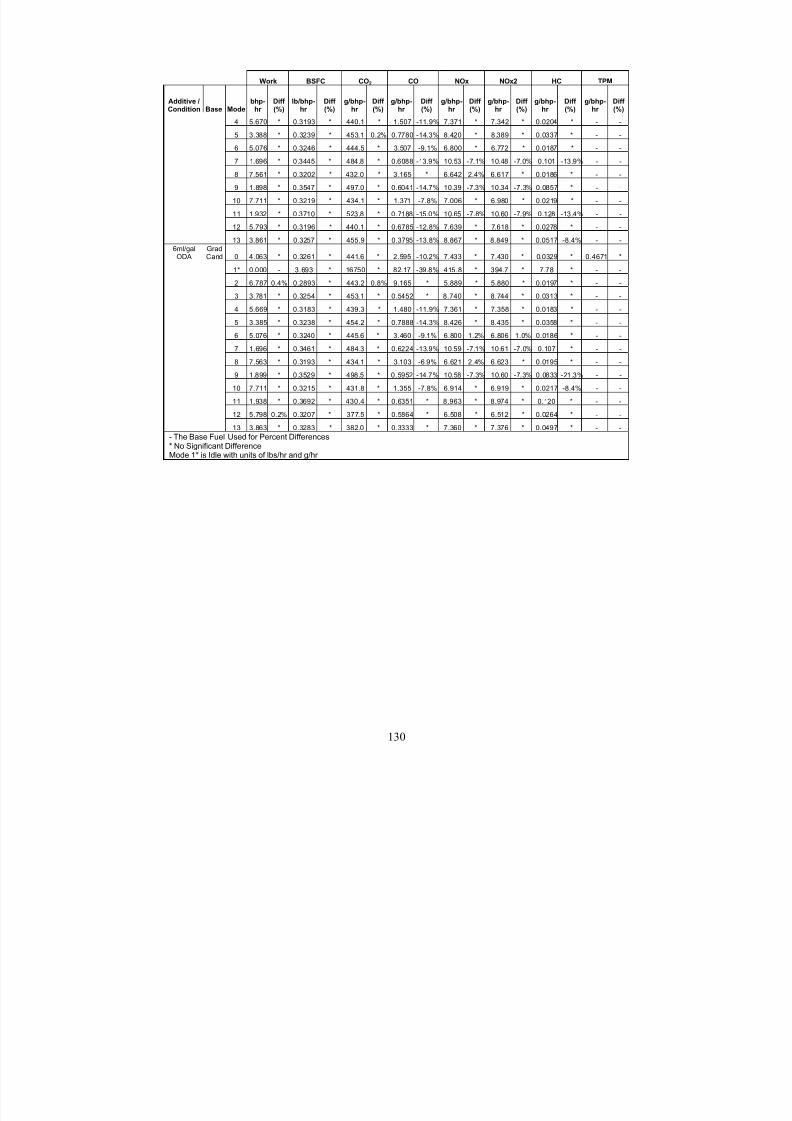
8/23/2019 The Effects of Fuel Additives on Diesel Engine Emissions During Steady State and Transient Operation
http://slidepdf.com/reader/full/the-effects-of-fuel-additives-on-diesel-engine-emissions-during-steady-state 149/163
Work BSFC CO2 CO NOx NOx2 HC TPM
Additive /Condition Base Mode
bhp-hr
Diff (%)
lb/bhp-hr
Diff (%)
g/bhp-hr
Diff (%)
g/bhp-hr
Diff (%)
g/bhp-hr
Diff (%)
g/bhp-hr
Diff (%)
g/bhp-hr
Diff (%)
g/bhp-hr
Diff (%)
4 5.670 * 0.3193 * 440.1 * 1.507 -11.9% 7.371 * 7.342 * 0.0204 * - -
5 3.388 * 0.3239 * 453.1 0.2% 0.7780 -14.3% 8.420 * 8.389 * 0.0337 * - -
6 5.076 * 0.3246 * 444.5 * 3.507 -9.1% 6.800 * 6.772 * 0.0187 * - -7 1.696 * 0.3445 * 484.8 * 0.6088 -13.9% 10.53 -7.1% 10.48 -7.0% 0.101 -13.9% - -
8 7.561 * 0.3202 * 432.0 * 3.165 * 6.642 2.4% 6.617 * 0.0186 * - -
9 1.898 * 0.3547 * 497.0 * 0.6041 -14.7% 10.39 -7.3% 10.34 -7.3% 0.0857 * - -
10 7.711 * 0.3219 * 434.1 * 1.371 -7.8% 7.006 * 6.980 * 0.0219 * - -
11 1.932 * 0.3710 * 523.8 * 0.7188 -15.0% 10.65 -7.8% 10.60 -7.9% 0.128 -13.4% - -
12 5.793 * 0.3196 * 440.1 * 0.6785 -12.8% 7.639 * 7.618 * 0.0278 * - -
13 3.861 * 0.3257 * 455.9 * 0.3795 -13.8% 8.867 * 8.849 * 0.0517 -8.4% - -
6ml/galODA
GradCand 0 4.063 * 0.3261 * 441.6 * 2.595 -10.2% 7.433 * 7.430 * 0.0329 * 0.4671 *
1* 0.000 - 3.693 * 16750 * 82.17 -39.8% 415.8 * 394.7 * 7.78 * - -
2 6.787 0.4% 0.2893 * 443.2 0.8% 9.165 * 5.889 * 5.880 * 0.0197 * - -
3 3.781 * 0.3254 * 453.1 * 0.5452 * 8.740 * 8.744 * 0.0313 * - -
4 5.669 * 0.3183 * 439.3 * 1.480 -11.9% 7.361 * 7.358 * 0.0183 * - -
5 3.385 * 0.3238 * 454.2 * 0.7888 -14.3% 8.426 * 8.435 * 0.0358 * - -
6 5.076 * 0.3240 * 445.6 * 3.460 -9.1% 6.800 1.2% 6.806 1.0% 0.0186 * - -
7 1.696 * 0.3461 * 484.3 * 0.6224 -13.9% 10.59 -7.1% 10.61 -7.0% 0.107 * - -
8 7.563 * 0.3193 * 434.1 * 3.103 -6.9% 6.621 2.4% 6.623 * 0.0195 * - -
9 1.899 * 0.3529 * 498.5 * 0.5952 -14.7% 10.58 -7.3% 10.60 -7.3% 0.0833 -21.3% - -
10 7.711 * 0.3215 * 431.8 * 1.355 -7.8% 6.914 * 6.919 * 0.0217 -8.4% - -
11 1.938 * 0.3692 * 430.4 * 0.6351 * 8.963 * 8.974 * 0.120 * - -
12 5.798 0.2% 0.3207 * 377.5 * 0.5864 * 6.508 * 6.512 * 0.0264 * - -
13 3.863 * 0.3283 * 382.0 * 0.3333 * 7.360 * 7.376 * 0.0497 * - -
- The Base Fuel Used for Percent Differences* No Significant Difference
Mode 1* is Idle with units of lbs/hr and g/hr
130

8/23/2019 The Effects of Fuel Additives on Diesel Engine Emissions During Steady State and Transient Operation
http://slidepdf.com/reader/full/the-effects-of-fuel-additives-on-diesel-engine-emissions-during-steady-state 150/163
Table 7-14 June 2007 SET Results for the 1992 Detroit Diesel Series 60
Work BSFC CO2 CO NOx NOx2 HC TPM
Additive /Condition Base Mode
bhp-hr
Diff (%)
lb/bhp-hr
Diff (%)
g/bhp-hr
Diff (%)
g/bhp-hr
Diff (%)
g/bhp-hr
Diff (%)
g/bhp-hr
Diff (%)
g/bhp-hr
Diff (%)
g/bhp-hr
Diff (%)
-Low
Cetane 0 4.038 - 0.3335 - 455.0 - 3.761 - 7.597 - 8.017 - 0.0450 - 0.7453 -
1* 0.000 - 3.014 - 15080 - 223.5 - -9.202 - 325.8 - 26.2 - - -
2 6.728 - 0.3171 - 445.2 - 11.81 - 4.046 - 5.738 - 0.0198 - - -
3 3.768 - 0.3266 - 454.8 - 0.7878 - 9.306 - 9.418 - 0.0342 - - -
4 5.661 - 0.3257 - 442.7 - 2.443 - 7.406 - 7.475 - 0.0225 - - -
5 3.355 - 0.3288 - 455.0 - 1.080 - 9.082 - 9.222 - 0.0427 - - -
6 5.036 - 0.3309 - 449.0 - 5.001 - 6.865 - 6.960 - 0.0232 - - -
7 1.675 - 0.3451 - 491.6 - 0.8093 - 12.99 - 13.26 - 0.137 - - -
8 7.546 - 0.3272 - 436.5 - 4.815 - 6.545 - 6.602 - 0.0219 - - -
9 1.884 - 0.3522 - 502.4 - 0.8368 - 12.80 - 13.05 - 0.120 - - -
10 7.652 - 0.3283 - 439.0 - 2.304 - 6.977 - 7.037 - 0.0245 - - -
11 1.918 - 0.3708 - 526.3 - 1.012 - 13.15 - 13.43 - 0.161 - - -12 5.738 - 0.3265 - 445.6 - 1.144 - 7.827 - 7.932 - 0.0321 - - -
13 3.825 - 0.3327 - 460.4 - 0.5141 - 9.625 - 9.798 - 0.0591 - - -
7.5 ml/galDTBP
LowCetane 0 4.034 * 0.3329 * 455.5 * 3.560 -5.4% 7.872 3.6% 7.939 * 0.0402 * 0.6373 *
1* 0.000 * 2.971 * 14710 * 136.0 -39.2% 352.1 -3926% 340.5 * 19.3 * - -
2 6.717 * 0.3167 * 446.4 * 11.56 * 5.771 42.6% 5.788 * 0.0189 * - -
3 3.772 * 0.3256 * 453.2 * 0.7287 * 9.093 -2.3% 9.181 -2.5% 0.0417 * - -
4 5.656 * 0.3243 * 442.9 * 2.227 -8.8% 7.438 * 7.484 * 0.0239 * - -
5 3.357 * 0.3278 * 456.6 * 0.9707 * 8.886 * 8.998 -2.4% 0.0377 * - -
6 5.034 * 0.3322 * 450.8 * 4.706 -5.9% 6.897 * 6.975 * 0.0221 * - -
7 1.676 * 0.3494 * 488.1 * 0.6921 -14.5% 12.22 -5.9% 12.45 -6.1% 0.113 * - -
8 7.542 * 0.3274 * 438.0 * 4.597 * 6.645 * 6.686 * 0.0207 * - -
9 1.869 * 0.3535 * 500.2 * 0.7250 -13.4% 12.08 -5.6% 12.31 -5.7% 0.0971 * - -
10 7.647 * 0.3258 * 441.1 * 2.149 -6.7% 7.077 * 7.121 * 0.0234 * - -
11 1.923 * 0.3723 * 524.2 * 0.8305 -17.9% 12.37 -5.9% 12.61 -6.1% 0.120 -25.2% - -
12 5.729 -0.2% 0.3265 * 446.2 * 1.022 -10.6% 7.859 * 7.924 * 0.0309 * - -
13 3.813 * 0.3318 * 461.9 * 0.4841 * 9.371 * 9.496 -3.1% 0.0557 * - -
3 ml/gal 2-EHN
LowCetane 0 4.034 * 0.3328 * 455.4 * 3.444 -8.4% 7.949 4.6% 7.967 * 0.0386 * 0.6203 *
1* 0.000 * 3.028 * 15250 * 154.4 * 370.0 -4121% 358.6 10.1% 14.9 * - -
2 6.716 * 0.3169 * 446.7 * 11.31 * 5.814 43.7% 5.812 * 0.0176 * - -
3 3.775 * 0.3258 * 453.5 * 0.6683 -15.2% 9.146 -1.7% 9.209 -2.2% 0.0333 * - -
4 5.658 * 0.3235 * 442.8 * 2.132 -12.7% 7.484 * 7.504 * 0.0204 * - -
5 3.359 * 0.3282 * 454.3 * 0.9218 -14.6% 8.979 * 9.053 * 0.0370 * - -
6 5.034 * 0.3316 * 448.9 * 4.435 -11.3% 6.961 * 6.992 * 0.0194 * - -
7 1.677 * 0.3505 * 487.7 * 0.7337 * 12.41 -4.5% 12.54 -5.4% 0.127 * - -
8 7.541 * 0.3267 * 438.0 * 4.395 -8.7% 6.671 * 6.659 * 0.0192 -12.2% - -
9 1.874 * 0.3572 * 499.6 * 0.7344 * 12.31 -3.8% 12.44 -4.7% 0.108 * - -
10 7.635 * 0.3240 * 440.4 * 2.047 -11.2% 7.139 * 7.121 * 0.0236 * - -
11 1.916 * 0.3725 * 524.4 * 0.8961 -11.4% 12.64 -3.9% 12.75 -5.1% 0.147 * - -
12 5.723 -0.3% 0.3271 * 446.4 * 1.003 -12.3% 7.930 * 7.929 * 0.0328 * - -
13 3.815 * 0.3326 * 462.5 * 0.4821 * 9.516 * 9.550 * 0.0561 * - -
131
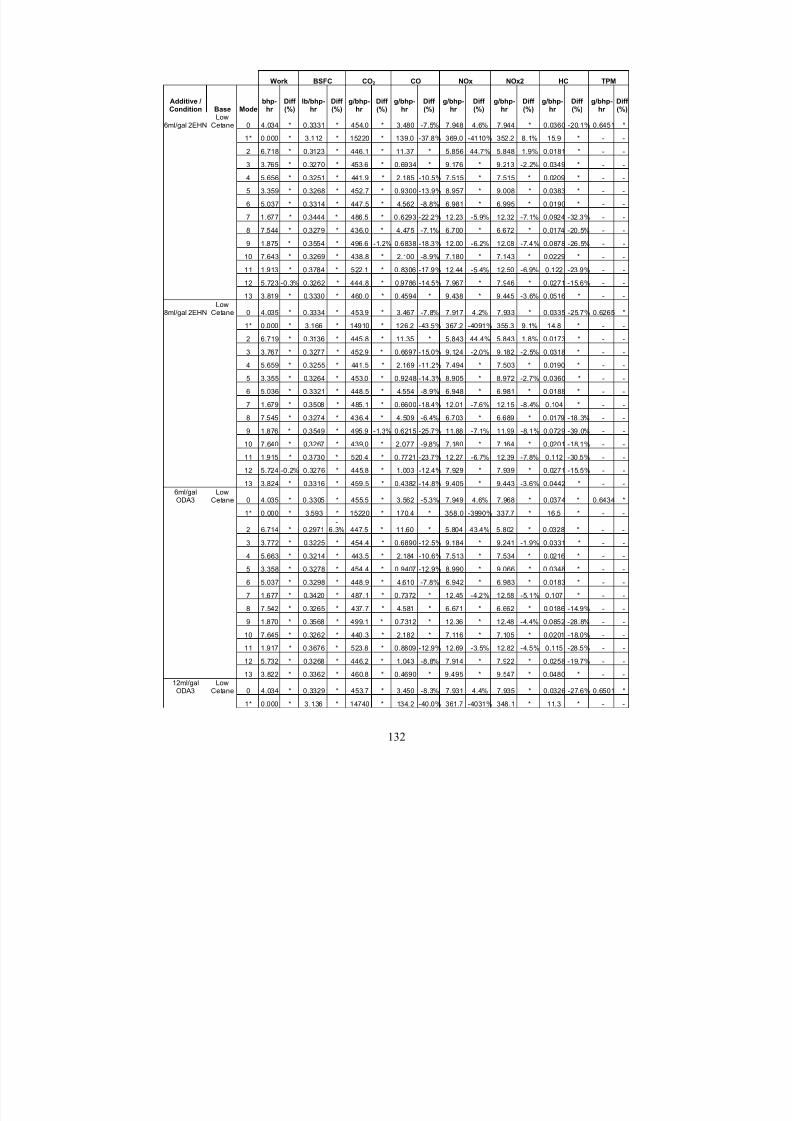
8/23/2019 The Effects of Fuel Additives on Diesel Engine Emissions During Steady State and Transient Operation
http://slidepdf.com/reader/full/the-effects-of-fuel-additives-on-diesel-engine-emissions-during-steady-state 151/163
Work BSFC CO2 CO NOx NOx2 HC TPM
Additive /Condition Base Mode
bhp-hr
Diff (%)
lb/bhp-hr
Diff (%)
g/bhp-hr
Diff (%)
g/bhp-hr
Diff (%)
g/bhp-hr
Diff (%)
g/bhp-hr
Diff (%)
g/bhp-hr
Diff (%)
g/bhp-hr
Diff (%)
6ml/gal 2EHNLow
Cetane 0 4.034 * 0.3331 * 454.0 * 3.480 -7.5% 7.948 4.6% 7.944 * 0.0360 -20.1% 0.6451 *
1* 0.000 * 3.112 * 15220 * 139.0 -37.8% 369.0 -4110% 352.2 8.1% 15.9 * - -
2 6.718 * 0.3123 * 446.1 * 11.37 * 5.856 44.7% 5.848 1.9% 0.0181 * - -
3 3.765 * 0.3270 * 453.6 * 0.6934 * 9.176 * 9.213 -2.2% 0.0349 * - -
4 5.656 * 0.3251 * 441.9 * 2.185 -10.5% 7.515 * 7.515 * 0.0209 * - -
5 3.359 * 0.3268 * 452.7 * 0.9300 -13.9% 8.957 * 9.008 * 0.0383 * - -
6 5.037 * 0.3314 * 447.5 * 4.562 -8.8% 6.981 * 6.995 * 0.0190 * - -
7 1.677 * 0.3444 * 486.5 * 0.6293 -22.2% 12.23 -5.9% 12.32 -7.1% 0.0924 -32.3% - -
8 7.544 * 0.3279 * 436.0 * 4.475 -7.1% 6.700 * 6.672 * 0.0174 -20.5% - -
9 1.875 * 0.3554 * 496.6 -1.2% 0.6838 -18.3% 12.00 -6.2% 12.08 -7.4% 0.0878 -26.5% - -
10 7.643 * 0.3269 * 438.8 * 2.100 -8.9% 7.180 * 7.143 * 0.0229 * - -
11 1.913 * 0.3784 * 522.1 * 0.8306 -17.9% 12.44 -5.4% 12.50 -6.9% 0.122 -23.9% - -
12 5.723 -0.3% 0.3262 * 444.8 * 0.9786 -14.5% 7.967 * 7.946 * 0.0271 -15.6% - -
13 3.819 * 0.3330 * 460.0 * 0.4594 * 9.438 * 9.445 -3.6% 0.0516 * - -
8ml/gal 2EHNLow
Cetane 0 4.035 * 0.3334 * 453.9 * 3.467 -7.8% 7.917 4.2% 7.933 * 0.0335 -25.7% 0.6265 *
1* 0.000 * 3.166 * 14910 * 126.2 -43.5% 367.2 -4091% 355.3 9.1% 14.8 * - -
2 6.719 * 0.3136 * 445.8 * 11.35 * 5.843 44.4% 5.843 1.8% 0.0173 * - -
3 3.767 * 0.3277 * 452.9 * 0.6697 -15.0% 9.124 -2.0% 9.182 -2.5% 0.0318 * - -
4 5.659 * 0.3255 * 441.5 * 2.169 -11.2% 7.494 * 7.503 * 0.0190 * - -
5 3.355 * 0.3264 * 453.0 * 0.9248 -14.3% 8.905 * 8.972 -2.7% 0.0360 * - -
6 5.036 * 0.3321 * 448.5 * 4.554 -8.9% 6.948 * 6.981 * 0.0188 * - -
7 1.679 * 0.3508 * 485.1 * 0.6600 -18.4% 12.01 -7.6% 12.15 -8.4% 0.104 * - -
8 7.545 * 0.3274 * 436.4 * 4.509 -6.4% 6.703 * 6.689 * 0.0179 -18.3% - -
9 1.876 * 0.3549 * 495.9 -1.3% 0.6215 -25.7% 11.88 -7.1% 11.99 -8.1% 0.0729 -39.0% - -
10 7.640 * 0.3267 * 439.0 * 2.077 -9.8% 7.180 * 7.164 * 0.0201 -18.1% - -
11 1.915 * 0.3730 * 520.4 * 0.7721 -23.7% 12.27 -6.7% 12.39 -7.8% 0.112 -30.5% - -
12 5.724 -0.2% 0.3276 * 445.8 * 1.003 -12.4% 7.929 * 7.939 * 0.0271 -15.5% - -
13 3.824 * 0.3316 * 459.5 * 0.4382 -14.8% 9.405 * 9.443 -3.6% 0.0442 * - -
6ml/galODA3
LowCetane 0 4.035 * 0.3305 * 455.5 * 3.562 -5.3% 7.949 4.6% 7.968 * 0.0374 * 0.6434 *
1* 0.000 * 3.593 * 15220 * 170.4 * 358.0 -3990% 337.7 * 16.5 * - -
2 6.714 * 0.2971-
6.3% 447.5 * 11.60 * 5.804 43.4% 5.802 * 0.0328 * - -
3 3.772 * 0.3225 * 454.4 * 0.6890 -12.5% 9.184 * 9.241 -1.9% 0.0331 * - -
4 5.663 * 0.3214 * 443.5 * 2.184 -10.6% 7.513 * 7.534 * 0.0216 * - -
5 3.358 * 0.3278 * 454.4 * 0.9407 -12.9% 8.990 * 9.066 * 0.0348 * - -
6 5.037 * 0.3298 * 448.9 * 4.610 -7.8% 6.942 * 6.983 * 0.0183 * - -
7 1.677 * 0.3420 * 487.1 * 0.7372 * 12.45 -4.2% 12.58 -5.1% 0.107 * - -
8 7.542 * 0.3265 * 437.7 * 4.581 * 6.671 * 6.662 * 0.0186 -14.9% - -
9 1.870 * 0.3568 * 499.1 * 0.7312 * 12.36 * 12.48 -4.4% 0.0852 -28.8% - -
10 7.645 * 0.3262 * 440.3 * 2.182 * 7.116 * 7.105 * 0.0201 -18.0% - -
11 1.917 * 0.3676 * 523.8 * 0.8809 -12.9% 12.69 -3.5% 12.82 -4.5% 0.115 -28.5% - -
12 5.732 * 0.3268 * 446.2 * 1.043 -8.8% 7.914 * 7.922 * 0.0258 -19.7% - -
13 3.822 * 0.3362 * 460.8 * 0.4690 * 9.495 * 9.547 * 0.0480 * - -
12ml/galODA3
LowCetane 0 4.034 * 0.3329 * 453.7 * 3.450 -8.3% 7.931 4.4% 7.935 * 0.0326 -27.6% 0.6501 *
1* 0.000 * 3.136 * 14740 * 134.2 -40.0% 361.7 -4031% 348.1 * 11.3 * - -
132
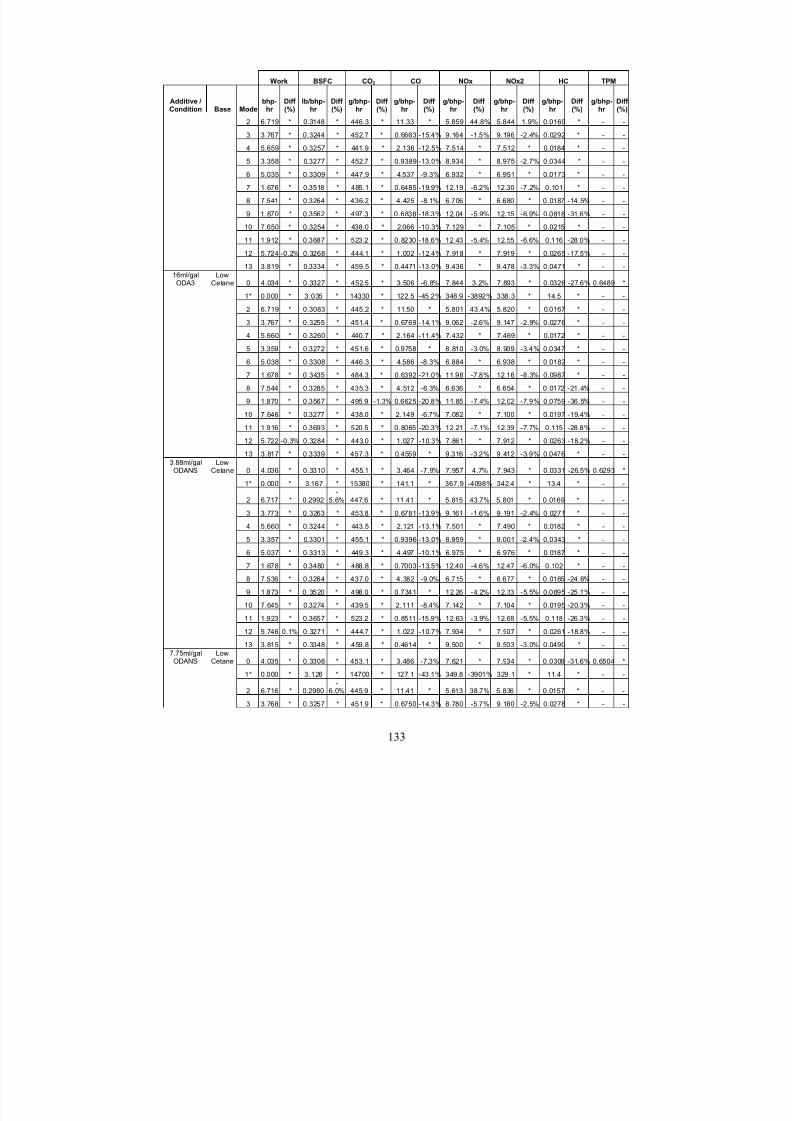
8/23/2019 The Effects of Fuel Additives on Diesel Engine Emissions During Steady State and Transient Operation
http://slidepdf.com/reader/full/the-effects-of-fuel-additives-on-diesel-engine-emissions-during-steady-state 152/163
Work BSFC CO2 CO NOx NOx2 HC TPM
Additive /Condition Base Mode
bhp-hr
Diff (%)
lb/bhp-hr
Diff (%)
g/bhp-hr
Diff (%)
g/bhp-hr
Diff (%)
g/bhp-hr
Diff (%)
g/bhp-hr
Diff (%)
g/bhp-hr
Diff (%)
g/bhp-hr
Diff (%)
2 6.719 * 0.3148 * 446.3 * 11.33 * 5.859 44.8% 5.844 1.9% 0.0160 * - -
3 3.767 * 0.3244 * 452.7 * 0.6663 -15.4% 9.164 -1.5% 9.196 -2.4% 0.0292 * - -
4 5.659 * 0.3257 * 441.9 * 2.136 -12.5% 7.514 * 7.512 * 0.0184 * - -5 3.358 * 0.3277 * 452.7 * 0.9389 -13.0% 8.934 * 8.975 -2.7% 0.0344 * - -
6 5.035 * 0.3309 * 447.9 * 4.537 -9.3% 6.932 * 6.951 * 0.0173 * - -
7 1.676 * 0.3518 * 485.1 * 0.6485 -19.9% 12.19 -6.2% 12.30 -7.2% 0.101 * - -
8 7.541 * 0.3264 * 436.2 * 4.425 -8.1% 6.706 * 6.680 * 0.0187 -14.5% - -
9 1.870 * 0.3562 * 497.3 * 0.6838 -18.3% 12.04 -5.9% 12.15 -6.9% 0.0818 -31.6% - -
10 7.650 * 0.3254 * 438.0 * 2.066 -10.3% 7.129 * 7.105 * 0.0215 * - -
11 1.912 * 0.3687 * 523.2 * 0.8230 -18.6% 12.43 -5.4% 12.55 -6.6% 0.116 -28.0% - -
12 5.724 -0.2% 0.3268 * 444.1 * 1.002 -12.4% 7.918 * 7.919 * 0.0265 -17.5% - -
13 3.819 * 0.3334 * 459.5 * 0.4471 -13.0% 9.436 * 9.478 -3.3% 0.0471 * - -
16ml/galODA3
LowCetane 0 4.034 * 0.3327 * 452.5 * 3.506 -6.8% 7.844 3.2% 7.893 * 0.0326 -27.6% 0.6489 *
1* 0.000 * 3.035 * 14330 * 122.5 -45.2% 348.9 -3892% 338.3 * 14.5 * - -
2 6.719 * 0.3083 * 445.2 * 11.50 * 5.801 43.4% 5.820 * 0.0167 * - -
3 3.767 * 0.3255 * 451.4 * 0.6769 -14.1% 9.062 -2.6% 9.147 -2.9% 0.0276 * - -
4 5.660 * 0.3260 * 440.7 * 2.164 -11.4% 7.432 * 7.469 * 0.0172 * - -
5 3.359 * 0.3272 * 451.6 * 0.9758 * 8.810 -3.0% 8.909 -3.4% 0.0347 * - -
6 5.038 * 0.3308 * 446.3 * 4.586 -8.3% 6.884 * 6.938 * 0.0182 * - -
7 1.678 * 0.3435 * 484.3 * 0.6392 -21.0% 11.98 -7.8% 12.16 -8.3% 0.0987 * - -
8 7.544 * 0.3285 * 435.3 * 4.512 -6.3% 6.636 * 6.654 * 0.0172 -21.4% - -
9 1.870 * 0.3567 * 495.9 -1.3% 0.6625 -20.8% 11.85 -7.4% 12.02 -7.9% 0.0759 -36.5% - -
10 7.646 * 0.3277 * 438.0 * 2.149 -6.7% 7.082 * 7.100 * 0.0197 -19.4% - -
11 1.916 * 0.3693 * 520.5 * 0.8065 -20.3% 12.21 -7.1% 12.39 -7.7% 0.115 -28.8% - -
12 5.722 -0.3% 0.3284 * 443.0 * 1.027 -10.3% 7.861 * 7.912 * 0.0263 -18.2% - -
13 3.817 * 0.3339 * 457.3 * 0.4559 * 9.316 -3.2% 9.412 -3.9% 0.0476 * - -3.88ml/galODANS
LowCetane 0 4.036 * 0.3310 * 455.1 * 3.464 -7.9% 7.957 4.7% 7.943 * 0.0331 -26.5% 0.6293 *
1* 0.000 * 3.167 * 15380 * 141.1 * 367.9 -4098% 342.4 * 13.4 * - -
2 6.717 * 0.2992-
5.6% 447.6 * 11.41 * 5.815 43.7% 5.801 * 0.0169 * - -
3 3.773 * 0.3263 * 453.8 * 0.6781 -13.9% 9.161 -1.6% 9.191 -2.4% 0.0271 * - -
4 5.660 * 0.3244 * 443.5 * 2.121 -13.1% 7.501 * 7.490 * 0.0182 * - -
5 3.357 * 0.3301 * 455.1 * 0.9396 -13.0% 8.959 * 9.001 -2.4% 0.0343 * - -
6 5.037 * 0.3313 * 449.3 * 4.497 -10.1% 6.975 * 6.976 * 0.0187 * - -
7 1.678 * 0.3480 * 488.8 * 0.7003 -13.5% 12.40 -4.6% 12.47 -6.0% 0.102 * - -
8 7.536 * 0.3264 * 437.0 * 4.382 -9.0% 6.715 * 6.677 * 0.0165 -24.6% - -
9 1.873 * 0.3520 * 498.0 * 0.7341 * 12.26 -4.2% 12.33 -5.5% 0.0895 -25.1% - -
10 7.645 * 0.3274 * 439.5 * 2.111 -8.4% 7.142 * 7.104 * 0.0195 -20.3% - -
11 1.923 * 0.3657 * 523.2 * 0.8511 -15.9% 12.63 -3.9% 12.68 -5.5% 0.118 -26.3% - -
12 5.746 0.1% 0.3271 * 444.7 * 1.022 -10.7% 7.934 * 7.907 * 0.0261 -18.8% - -
13 3.815 * 0.3348 * 459.8 * 0.4614 * 9.500 * 9.503 -3.0% 0.0490 * - -
7.75ml/galODANS
LowCetane 0 4.035 * 0.3308 * 453.1 * 3.486 -7.3% 7.621 * 7.934 * 0.0308 -31.6% 0.6504 *
1* 0.000 * 3.126 * 14700 * 127.1 -43.1% 349.8 -3901% 329.1 * 11.4 * - -
2 6.716 * 0.2980-
6.0% 445.9 * 11.41 * 5.613 38.7% 5.836 * 0.0157 * - -
3 3.768 * 0.3257 * 451.9 * 0.6750 -14.3% 8.780 -5.7% 9.180 -2.5% 0.0278 * - -
133
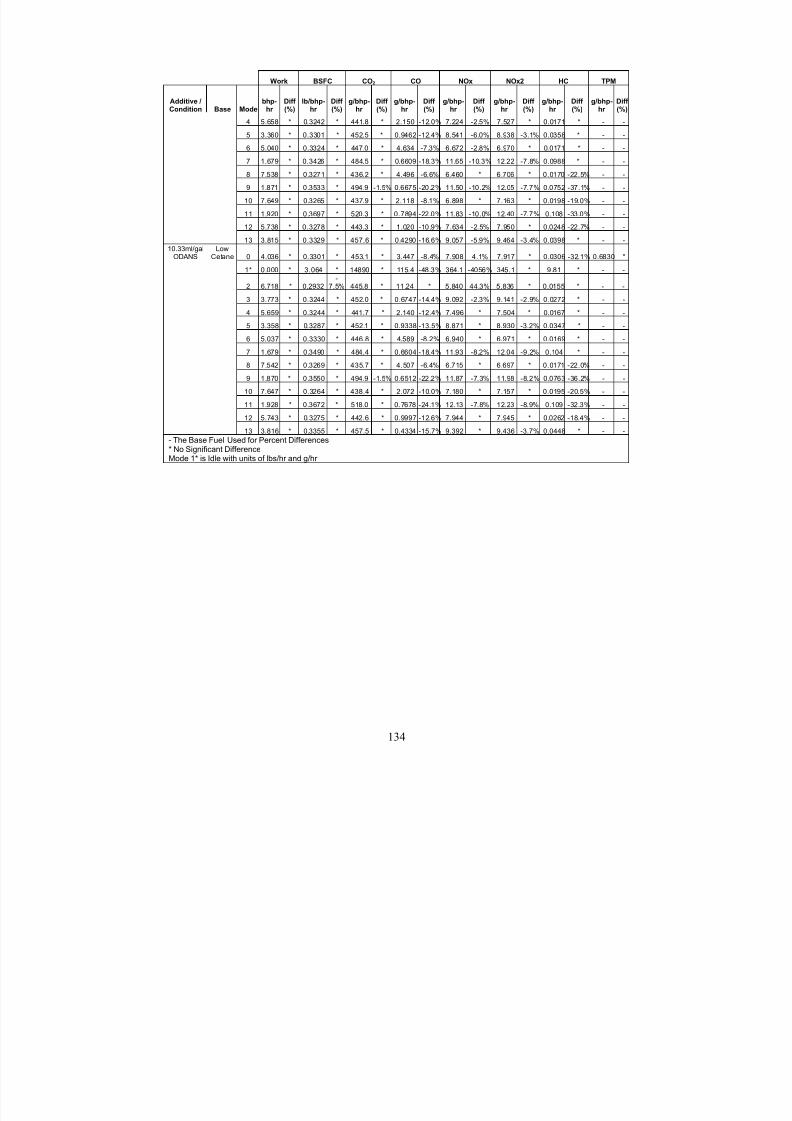
8/23/2019 The Effects of Fuel Additives on Diesel Engine Emissions During Steady State and Transient Operation
http://slidepdf.com/reader/full/the-effects-of-fuel-additives-on-diesel-engine-emissions-during-steady-state 153/163
Work BSFC CO2 CO NOx NOx2 HC TPM
Additive /Condition Base Mode
bhp-hr
Diff (%)
lb/bhp-hr
Diff (%)
g/bhp-hr
Diff (%)
g/bhp-hr
Diff (%)
g/bhp-hr
Diff (%)
g/bhp-hr
Diff (%)
g/bhp-hr
Diff (%)
g/bhp-hr
Diff (%)
4 5.658 * 0.3242 * 441.8 * 2.150 -12.0% 7.224 -2.5% 7.527 * 0.0171 * - -
5 3.360 * 0.3301 * 452.5 * 0.9462 -12.4% 8.541 -6.0% 8.938 -3.1% 0.0358 * - -
6 5.040 * 0.3324 * 447.0 * 4.634 -7.3% 6.672 -2.8% 6.970 * 0.0171 * - -7 1.679 * 0.3426 * 484.5 * 0.6609 -18.3% 11.65 -10.3% 12.22 -7.8% 0.0988 * - -
8 7.538 * 0.3271 * 436.2 * 4.496 -6.6% 6.460 * 6.706 * 0.0170 -22.5% - -
9 1.871 * 0.3533 * 494.9 -1.5% 0.6675 -20.2% 11.50 -10.2% 12.05 -7.7% 0.0752 -37.1% - -
10 7.649 * 0.3265 * 437.9 * 2.118 -8.1% 6.898 * 7.163 * 0.0198 -19.0% - -
11 1.920 * 0.3697 * 520.3 * 0.7894 -22.0% 11.83 -10.0% 12.40 -7.7% 0.108 -33.0% - -
12 5.738 * 0.3278 * 443.3 * 1.020 -10.9% 7.634 -2.5% 7.950 * 0.0248 -22.7% - -
13 3.815 * 0.3329 * 457.6 * 0.4290 -16.6% 9.057 -5.9% 9.464 -3.4% 0.0398 * - -
10.33ml/galODANS
LowCetane 0 4.036 * 0.3301 * 453.1 * 3.447 -8.4% 7.908 4.1% 7.917 * 0.0306 -32.1% 0.6830 *
1* 0.000 * 3.064 * 14890 * 115.4 -48.3% 364.1 -4056% 345.1 * 9.81 * - -
2 6.718 * 0.2932-
7.5% 445.8 * 11.24 * 5.840 44.3% 5.836 * 0.0155 * - -
3 3.773 * 0.3244 * 452.0 * 0.6747 -14.4% 9.092 -2.3% 9.141 -2.9% 0.0272 * - -4 5.659 * 0.3244 * 441.7 * 2.140 -12.4% 7.496 * 7.504 * 0.0167 * - -
5 3.358 * 0.3287 * 452.1 * 0.9338 -13.5% 8.871 * 8.930 -3.2% 0.0347 * - -
6 5.037 * 0.3330 * 446.8 * 4.589 -8.2% 6.940 * 6.971 * 0.0169 * - -
7 1.679 * 0.3490 * 484.4 * 0.6604 -18.4% 11.93 -8.2% 12.04 -9.2% 0.104 * - -
8 7.542 * 0.3269 * 435.7 * 4.507 -6.4% 6.715 * 6.697 * 0.0171 -22.0% - -
9 1.870 * 0.3550 * 494.9 -1.5% 0.6512 -22.2% 11.87 -7.3% 11.98 -8.2% 0.0763 -36.2% - -
10 7.647 * 0.3264 * 438.4 * 2.072 -10.0% 7.180 * 7.157 * 0.0195 -20.5% - -
11 1.928 * 0.3672 * 518.0 * 0.7678 -24.1% 12.13 -7.8% 12.23 -8.9% 0.109 -32.3% - -
12 5.743 * 0.3275 * 442.6 * 0.9997 -12.6% 7.944 * 7.945 * 0.0262 -18.4% - -
13 3.816 * 0.3355 * 457.5 * 0.4334 -15.7% 9.392 * 9.436 -3.7% 0.0448 * - -
- The Base Fuel Used for Percent Differences* No Significant DifferenceMode 1* is Idle with units of lbs/hr and g/hr
134
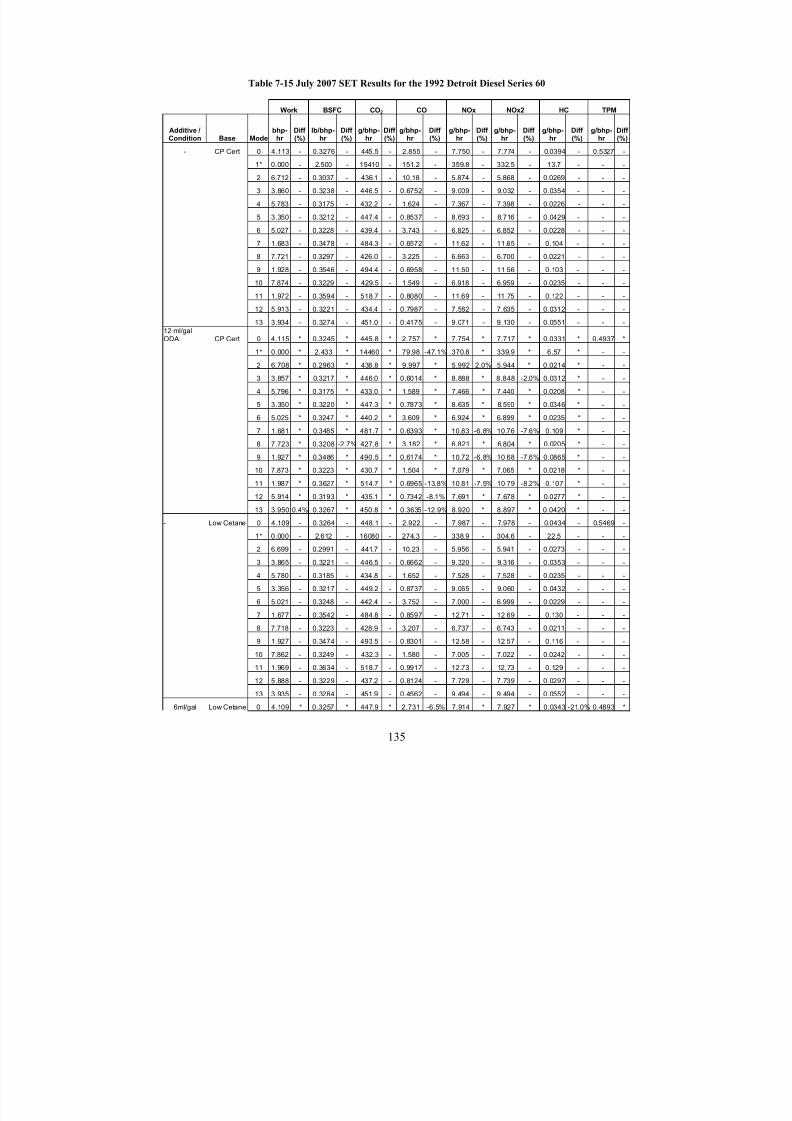
8/23/2019 The Effects of Fuel Additives on Diesel Engine Emissions During Steady State and Transient Operation
http://slidepdf.com/reader/full/the-effects-of-fuel-additives-on-diesel-engine-emissions-during-steady-state 154/163
Table 7-15 July 2007 SET Results for the 1992 Detroit Diesel Series 60
Work BSFC CO2 CO NOx NOx2 HC TPM
Additive /Condition Base Mode
bhp-hr
Diff (%)
lb/bhp-hr
Diff (%)
g/bhp-hr
Diff (%)
g/bhp-hr
Diff (%)
g/bhp-hr
Diff (%)
g/bhp-hr
Diff (%)
g/bhp-hr
Diff (%)
g/bhp-hr
Diff (%)
- CP Cert 0 4.113 - 0.3276 - 445.5 - 2.855 - 7.750 - 7.774 - 0.0394 - 0.5327 -
1* 0.000 - 2.500 - 15410 - 151.2 - 359.8 - 332.5 - 13.7 - - -
2 6.712 - 0.3037 - 436.1 - 10.18 - 5.874 - 5.868 - 0.0269 - - -
3 3.860 - 0.3238 - 446.5 - 0.6752 - 9.009 - 9.032 - 0.0354 - - -
4 5.783 - 0.3175 - 432.2 - 1.624 - 7.367 - 7.398 - 0.0226 - - -
5 3.350 - 0.3212 - 447.4 - 0.8537 - 8.693 - 8.716 - 0.0429 - - -
6 5.027 - 0.3228 - 439.4 - 3.743 - 6.825 - 6.852 - 0.0228 - - -
7 1.683 - 0.3478 - 484.3 - 0.6572 - 11.62 - 11.65 - 0.104 - - -
8 7.721 - 0.3297 - 426.0 - 3.225 - 6.663 - 6.700 - 0.0221 - - -
9 1.928 - 0.3546 - 494.4 - 0.6958 - 11.50 - 11.56 - 0.103 - - -
10 7.874 - 0.3229 - 429.5 - 1.549 - 6.918 - 6.959 - 0.0235 - - -
11 1.972 - 0.3594 - 518.7 - 0.8080 - 11.69 - 11.75 - 0.122 - - -
12 5.913 - 0.3221 - 434.4 - 0.7987 - 7.582 - 7.635 - 0.0312 - - -
13 3.934 - 0.3274 - 451.0 - 0.4175 - 9.071 - 9.130 - 0.0551 - - -
12 ml/galODA CP Cert 0 4.115 * 0.3245 * 445.8 * 2.757 * 7.754 * 7.717 * 0.0331 * 0.4937 *
1* 0.000 * 2.433 * 14460 * 79.98 -47.1% 370.8 * 339.9 * 6.57 * - -
2 6.708 * 0.2963 * 438.8 * 9.997 * 5.992 2.0% 5.944 * 0.0214 * - -
3 3.857 * 0.3217 * 446.0 * 0.6014 * 8.888 * 8.848 -2.0% 0.0312 * - -
4 5.796 * 0.3175 * 433.0 * 1.589 * 7.466 * 7.440 * 0.0208 * - -
5 3.350 * 0.3220 * 447.3 * 0.7873 * 8.635 * 8.590 * 0.0346 * - -
6 5.025 * 0.3247 * 440.2 * 3.609 * 6.924 * 6.899 * 0.0235 * - -
7 1.681 * 0.3485 * 481.7 * 0.6393 * 10.83 -6.8% 10.76 -7.6% 0.109 * - -
8 7.723 * 0.3208 -2.7% 427.8 * 3.182 * 6.821 * 6.804 * 0.0205 * - -
9 1.927 * 0.3486 * 490.5 * 0.6174 * 10.72 -6.8% 10.68 -7.6% 0.0865 * - -
10 7.873 * 0.3223 * 430.7 * 1.504 * 7.079 * 7.065 * 0.0218 * - -
11 1.987 * 0.3627 * 514.7 * 0.6965 -13.8% 10.81 -7.5% 10.79 -8.2% 0.107 * - -
12 5.914 * 0.3193 * 435.1 * 0.7342 -8.1% 7.691 * 7.678 * 0.0277 * - -
13 3.950 0.4% 0.3267 * 450.8 * 0.3635 -12.9% 8.920 * 8.897 * 0.0420 * - -
- Low Cetane 0 4.109 - 0.3264 - 448.1 - 2.922 - 7.987 - 7.978 - 0.0434 - 0.5469 -
1* 0.000 - 2.612 - 16080 - 274.3 - 338.9 - 304.6 - 22.5 - - -
2 6.699 - 0.2991 - 441.7 - 10.23 - 5.956 - 5.941 - 0.0273 - - -
3 3.865 - 0.3221 - 446.5 - 0.6662 - 9.320 - 9.316 - 0.0353 - - -
4 5.780 - 0.3185 - 434.8 - 1.652 - 7.528 - 7.528 - 0.0235 - - -
5 3.356 - 0.3217 - 449.2 - 0.8737 - 9.065 - 9.060 - 0.0432 - - -
6 5.021 - 0.3248 - 442.4 - 3.752 - 7.000 - 6.999 - 0.0229 - - -
7 1.677 - 0.3542 - 484.8 - 0.8597 - 12.71 - 12.69 - 0.130 - - -
8 7.718 - 0.3223 - 428.9 - 3.207 - 6.737 - 6.743 - 0.0211 - - -
9 1.927 - 0.3474 - 493.5 - 0.8301 - 12.58 - 12.57 - 0.116 - - -
10 7.862 - 0.3249 - 432.3 - 1.580 - 7.005 - 7.022 - 0.0242 - - -
11 1.969 - 0.3634 - 518.7 - 0.9917 - 12.73 - 12.73 - 0.129 - - -
12 5.888 - 0.3229 - 437.2 - 0.8124 - 7.729 - 7.739 - 0.0297 - - -
13 3.935 - 0.3284 - 451.9 - 0.4562 - 9.494 - 9.494 - 0.0552 - - -
6ml/gal Low Cetane 0 4.109 * 0.3257 * 447.9 * 2.731 -6.5% 7.914 * 7.927 * 0.0343 -21.0% 0.4893 *
135
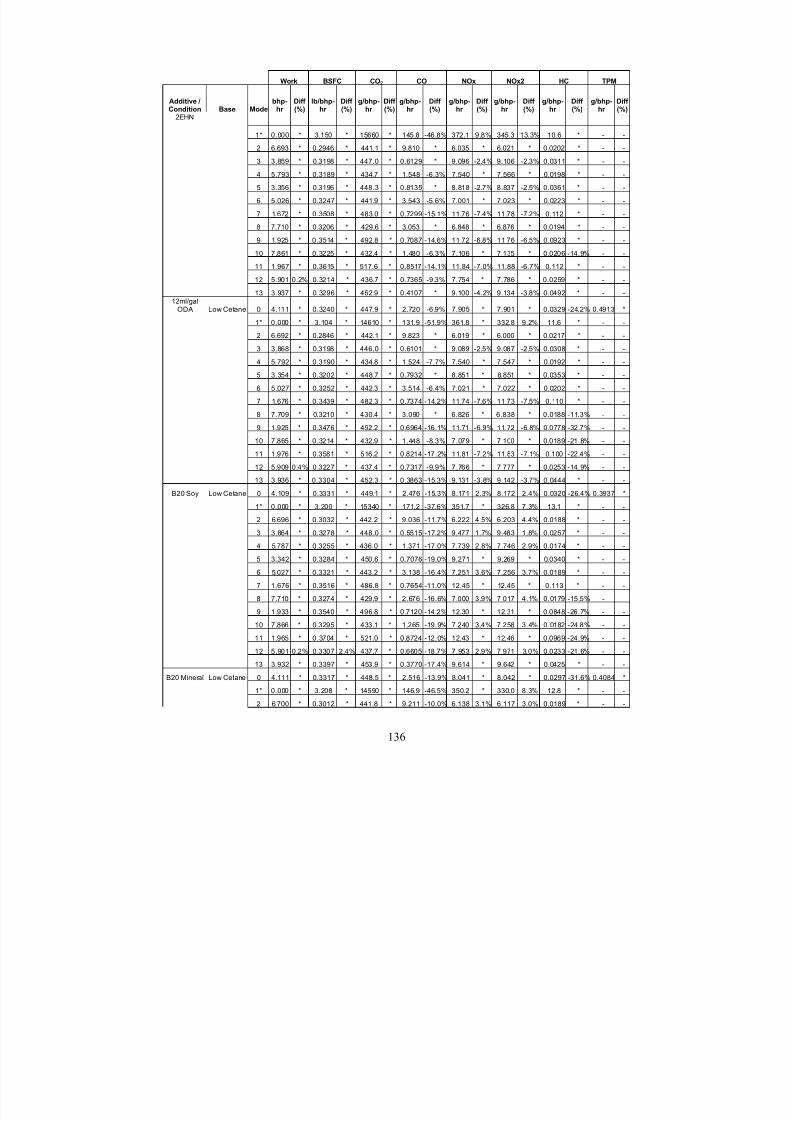
8/23/2019 The Effects of Fuel Additives on Diesel Engine Emissions During Steady State and Transient Operation
http://slidepdf.com/reader/full/the-effects-of-fuel-additives-on-diesel-engine-emissions-during-steady-state 155/163
Work BSFC CO2 CO NOx NOx2 HC TPM
Additive /Condition Base Mode
bhp-hr
Diff (%)
lb/bhp-hr
Diff (%)
g/bhp-hr
Diff (%)
g/bhp-hr
Diff (%)
g/bhp-hr
Diff (%)
g/bhp-hr
Diff (%)
g/bhp-hr
Diff (%)
g/bhp-hr
Diff (%)
2EHN
1* 0.000 * 3.150 * 15660 * 145.8 -46.8% 372.1 9.8% 345.3 13.3% 10.6 * - -
2 6.693 * 0.2946 * 441.1 * 9.810 * 6.035 * 6.021 * 0.0202 * - -3 3.859 * 0.3198 * 447.0 * 0.6129 * 9.096 -2.4% 9.106 -2.3% 0.0311 * - -
4 5.793 * 0.3189 * 434.7 * 1.548 -6.3% 7.540 * 7.566 * 0.0198 * - -
5 3.356 * 0.3196 * 448.3 * 0.8135 * 8.818 -2.7% 8.837 -2.5% 0.0361 * - -
6 5.026 * 0.3247 * 441.9 * 3.543 -5.6% 7.001 * 7.023 * 0.0223 * - -
7 1.672 * 0.3508 * 483.0 * 0.7299 -15.1% 11.76 -7.4% 11.78 -7.2% 0.112 * - -
8 7.710 * 0.3206 * 429.6 * 3.053 * 6.848 * 6.876 * 0.0194 * - -
9 1.925 * 0.3514 * 492.8 * 0.7087 -14.6% 11.72 -6.8% 11.76 -6.5% 0.0923 * - -
10 7.861 * 0.3225 * 432.4 * 1.480 -6.3% 7.106 * 7.135 * 0.0206 -14.9% - -
11 1.967 * 0.3615 * 517.6 * 0.8517 -14.1% 11.84 -7.0% 11.88 -6.7% 0.112 * - -
12 5.901 0.2% 0.3214 * 436.7 * 0.7365 -9.3% 7.754 * 7.786 * 0.0259 * - -
13 3.937 * 0.3296 * 452.9 * 0.4107 * 9.100 -4.2% 9.134 -3.8% 0.0492 * - -
12ml/galODA Low Cetane 0 4.111 * 0.3240 * 447.9 * 2.720 -6.9% 7.905 * 7.901 * 0.0329 -24.2% 0.4913 *
1* 0.000 * 3.104 * 14610 * 131.9 -51.9% 361.8 * 332.8 9.2% 11.6 * - -
2 6.692 * 0.2846 * 442.1 * 9.823 * 6.019 * 6.000 * 0.0217 * - -
3 3.868 * 0.3198 * 446.0 * 0.6101 * 9.089 -2.5% 9.087 -2.5% 0.0308 * - -
4 5.792 * 0.3190 * 434.8 * 1.524 -7.7% 7.540 * 7.547 * 0.0192 * - -
5 3.354 * 0.3202 * 448.7 * 0.7932 * 8.851 * 8.851 * 0.0353 * - -
6 5.027 * 0.3252 * 442.3 * 3.514 -6.4% 7.021 * 7.022 * 0.0202 * - -
7 1.676 * 0.3439 * 482.3 * 0.7374 -14.2% 11.74 -7.6% 11.73 -7.5% 0.110 * - -
8 7.709 * 0.3210 * 430.4 * 3.090 * 6.826 * 6.838 * 0.0188 -11.3% - -
9 1.925 * 0.3476 * 492.2 * 0.6964 -16.1% 11.71 -6.9% 11.72 -6.8% 0.0778 -32.7% - -
10 7.865 * 0.3214 * 432.9 * 1.448 -8.3% 7.079 * 7.100 * 0.0189 -21.8% - -
11 1.976 * 0.3581 * 516.2 * 0.8214 -17.2% 11.81 -7.2% 11.83 -7.1% 0.100 -22.4% - -
12 5.909 0.4% 0.3227 * 437.4 * 0.7317 -9.9% 7.766 * 7.777 * 0.0253 -14.9% - -
13 3.936 * 0.3304 * 452.3 * 0.3863 -15.3% 9.131 -3.8% 9.142 -3.7% 0.0444 * - -
B20 Soy Low Cetane 0 4.109 * 0.3331 * 449.1 * 2.476 -15.3% 8.171 2.3% 8.172 2.4% 0.0320 -26.4% 0.3937 *
1* 0.000 * 3.200 * 15340 * 171.2 -37.6% 351.7 * 326.8 7.3% 13.1 * - -
2 6.696 * 0.3032 * 442.2 * 9.036 -11.7% 6.222 4.5% 6.203 4.4% 0.0188 * - -
3 3.864 * 0.3278 * 448.0 * 0.5515 -17.2% 9.477 1.7% 9.483 1.8% 0.0257 * - -
4 5.787 * 0.3255 * 436.0 * 1.371 -17.0% 7.739 2.8% 7.746 2.9% 0.0174 * - -
5 3.342 * 0.3284 * 450.6 * 0.7076 -19.0% 9.271 * 9.269 * 0.0340 * - -
6 5.027 * 0.3321 * 443.2 * 3.138 -16.4% 7.251 3.6% 7.256 3.7% 0.0189 * - -
7 1.676 * 0.3516 * 486.8 * 0.7654 -11.0% 12.45 * 12.45 * 0.113 * - -
8 7.710 * 0.3274 * 429.9 * 2.676 -16.6% 7.000 3.9% 7.017 4.1% 0.0179 -15.5% - -
9 1.933 * 0.3540 * 496.8 * 0.7120 -14.2% 12.30 * 12.31 * 0.0848 -26.7% - -
10 7.866 * 0.3295 * 433.1 * 1.265 -19.9% 7.240 3.4% 7.258 3.4% 0.0182 -24.8% - -
11 1.965 * 0.3704 * 521.0 * 0.8724 -12.0% 12.43 * 12.46 * 0.0969 -24.9% - -
12 5.901 0.2% 0.3307 2.4% 437.7 * 0.6605 -18.7% 7.953 2.9% 7.971 3.0% 0.0233 -21.6% - -
13 3.932 * 0.3397 * 453.9 * 0.3770 -17.4% 9.614 * 9.642 * 0.0425 * - -
B20 Mineral Low Cetane 0 4.111 * 0.3317 * 448.5 * 2.516 -13.9% 8.041 * 8.042 * 0.0297 -31.6% 0.4084 *
1* 0.000 * 3.208 * 14590 * 146.9 -46.5% 350.2 * 330.0 8.3% 12.8 * - -
2 6.700 * 0.3012 * 441.8 * 9.211 -10.0% 6.138 3.1% 6.117 3.0% 0.0189 * - -
136
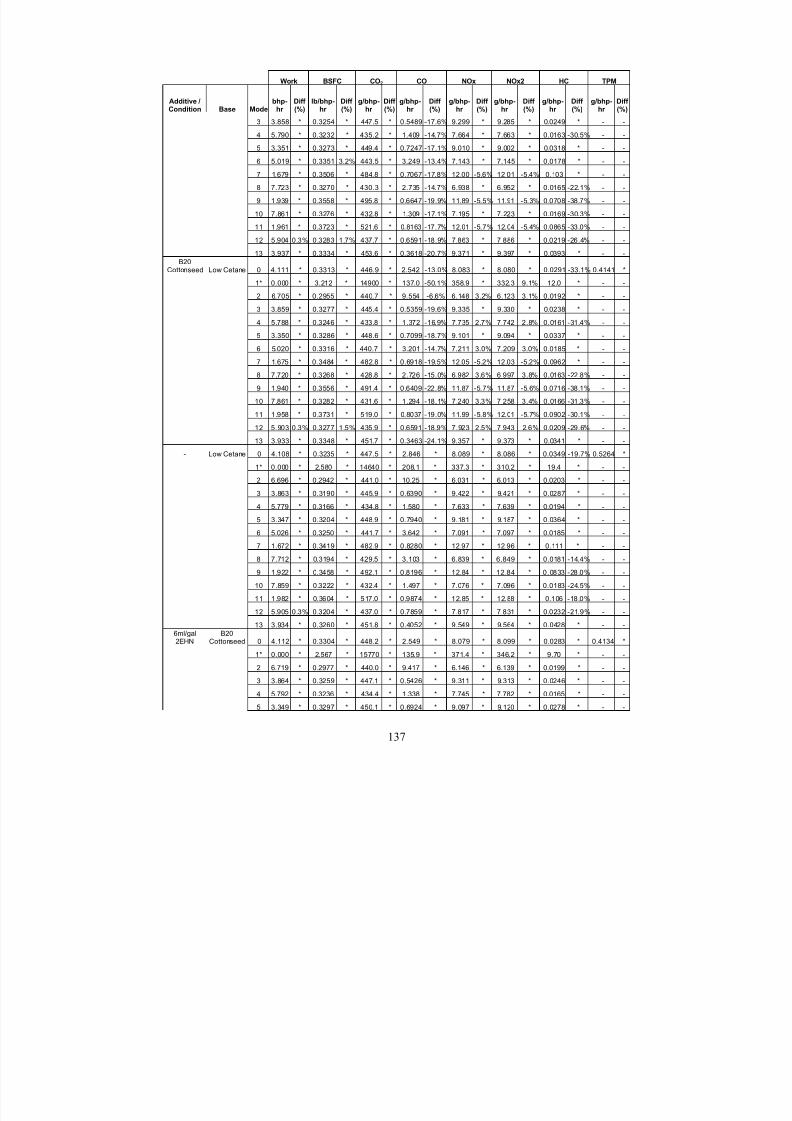
8/23/2019 The Effects of Fuel Additives on Diesel Engine Emissions During Steady State and Transient Operation
http://slidepdf.com/reader/full/the-effects-of-fuel-additives-on-diesel-engine-emissions-during-steady-state 156/163
Work BSFC CO2 CO NOx NOx2 HC TPM
Additive /Condition Base Mode
bhp-hr
Diff (%)
lb/bhp-hr
Diff (%)
g/bhp-hr
Diff (%)
g/bhp-hr
Diff (%)
g/bhp-hr
Diff (%)
g/bhp-hr
Diff (%)
g/bhp-hr
Diff (%)
g/bhp-hr
Diff (%)
3 3.858 * 0.3254 * 447.5 * 0.5489 -17.6% 9.299 * 9.285 * 0.0249 * - -
4 5.790 * 0.3232 * 435.2 * 1.409 -14.7% 7.664 * 7.663 * 0.0163 -30.5% - -
5 3.351 * 0.3273 * 449.4 * 0.7247 -17.1% 9.010 * 9.002 * 0.0318 * - -6 5.019 * 0.3351 3.2% 443.5 * 3.249 -13.4% 7.143 * 7.145 * 0.0178 * - -
7 1.679 * 0.3506 * 484.8 * 0.7067 -17.8% 12.00 -5.6% 12.01 -5.4% 0.103 * - -
8 7.723 * 0.3270 * 430.3 * 2.735 -14.7% 6.938 * 6.952 * 0.0165 -22.1% - -
9 1.939 * 0.3558 * 495.8 * 0.6647 -19.9% 11.89 -5.5% 11.91 -5.3% 0.0708 -38.7% - -
10 7.861 * 0.3276 * 432.8 * 1.309 -17.1% 7.195 * 7.223 * 0.0169 -30.3% - -
11 1.961 * 0.3723 * 521.6 * 0.8163 -17.7% 12.01 -5.7% 12.04 -5.4% 0.0865 -33.0% - -
12 5.904 0.3% 0.3283 1.7% 437.7 * 0.6591 -18.9% 7.863 * 7.886 * 0.0219 -26.4% - -
13 3.937 * 0.3334 * 453.6 * 0.3618 -20.7% 9.371 * 9.397 * 0.0393 * - -
B20Cottonseed Low Cetane 0 4.111 * 0.3313 * 446.9 * 2.542 -13.0% 8.083 * 8.080 * 0.0291 -33.1% 0.4141 *
1* 0.000 * 3.212 * 14900 * 137.0 -50.1% 358.9 * 332.3 9.1% 12.0 * - -
2 6.705 * 0.2955 * 440.7 * 9.554 -6.6% 6.148 3.2% 6.123 3.1% 0.0192 * - -
3 3.859 * 0.3277 * 445.4 * 0.5359 -19.6% 9.335 * 9.330 * 0.0238 * - -
4 5.788 * 0.3246 * 433.8 * 1.372 -16.9% 7.735 2.7% 7.742 2.8% 0.0161 -31.4% - -
5 3.350 * 0.3286 * 448.6 * 0.7099 -18.7% 9.101 * 9.094 * 0.0337 * - -
6 5.020 * 0.3316 * 440.7 * 3.201 -14.7% 7.211 3.0% 7.209 3.0% 0.0185 * - -
7 1.675 * 0.3484 * 482.8 * 0.6918 -19.5% 12.05 -5.2% 12.03 -5.2% 0.0962 * - -
8 7.720 * 0.3268 * 428.8 * 2.726 -15.0% 6.982 3.6% 6.997 3.8% 0.0163 -22.8% - -
9 1.940 * 0.3556 * 491.4 * 0.6409 -22.8% 11.87 -5.7% 11.87 -5.6% 0.0716 -38.1% - -
10 7.861 * 0.3282 * 431.6 * 1.294 -18.1% 7.240 3.3% 7.258 3.4% 0.0166 -31.3% - -
11 1.958 * 0.3731 * 519.0 * 0.8037 -19.0% 11.99 -5.8% 12.01 -5.7% 0.0902 -30.1% - -
12 5.903 0.3% 0.3277 1.5% 435.9 * 0.6591 -18.9% 7.923 2.5% 7.943 2.6% 0.0209 -29.6% - -
13 3.933 * 0.3348 * 451.7 * 0.3463 -24.1% 9.357 * 9.373 * 0.0341 * - -
- Low Cetane 0 4.108 * 0.3235 * 447.5 * 2.846 * 8.089 * 8.086 * 0.0349 -19.7% 0.5264 *
1* 0.000 * 2.580 * 14640 * 208.1 * 337.3 * 310.2 * 19.4 * - -
2 6.696 * 0.2942 * 441.0 * 10.25 * 6.031 * 6.013 * 0.0203 * - -
3 3.863 * 0.3190 * 445.9 * 0.6390 * 9.422 * 9.421 * 0.0287 * - -
4 5.779 * 0.3166 * 434.8 * 1.580 * 7.633 * 7.639 * 0.0194 * - -
5 3.347 * 0.3204 * 448.9 * 0.7940 * 9.181 * 9.187 * 0.0364 * - -
6 5.026 * 0.3250 * 441.7 * 3.642 * 7.091 * 7.097 * 0.0185 * - -
7 1.672 * 0.3419 * 482.9 * 0.8280 * 12.97 * 12.96 * 0.111 * - -
8 7.712 * 0.3194 * 429.5 * 3.103 * 6.839 * 6.849 * 0.0181 -14.4% - -
9 1.922 * 0.3458 * 492.1 * 0.8196 * 12.84 * 12.84 * 0.0833 -28.0% - -
10 7.859 * 0.3222 * 432.4 * 1.497 * 7.076 * 7.096 * 0.0183 -24.5% - -
11 1.982 * 0.3604 * 517.0 * 0.9874 * 12.85 * 12.88 * 0.106 -18.0% - -
12 5.905 0.3% 0.3204 * 437.0 * 0.7859 * 7.817 * 7.831 * 0.0232 -21.9% - -
13 3.934 * 0.3260 * 451.8 * 0.4052 * 9.549 * 9.564 * 0.0428 * - -
6ml/gal2EHN
B20Cottonseed 0 4.112 * 0.3304 * 448.2 * 2.549 * 8.079 * 8.099 * 0.0283 * 0.4134 *
1* 0.000 * 2.567 * 15770 * 135.9 * 371.4 * 346.2 * 9.70 * - -
2 6.719 * 0.2977 * 440.0 * 9.417 * 6.146 * 6.139 * 0.0199 * - -
3 3.864 * 0.3259 * 447.1 * 0.5426 * 9.311 * 9.313 * 0.0246 * - -
4 5.792 * 0.3236 * 434.4 * 1.338 * 7.745 * 7.782 * 0.0165 * - -
5 3.349 * 0.3297 * 450.1 * 0.6924 * 9.097 * 9.120 * 0.0278 * - -
137
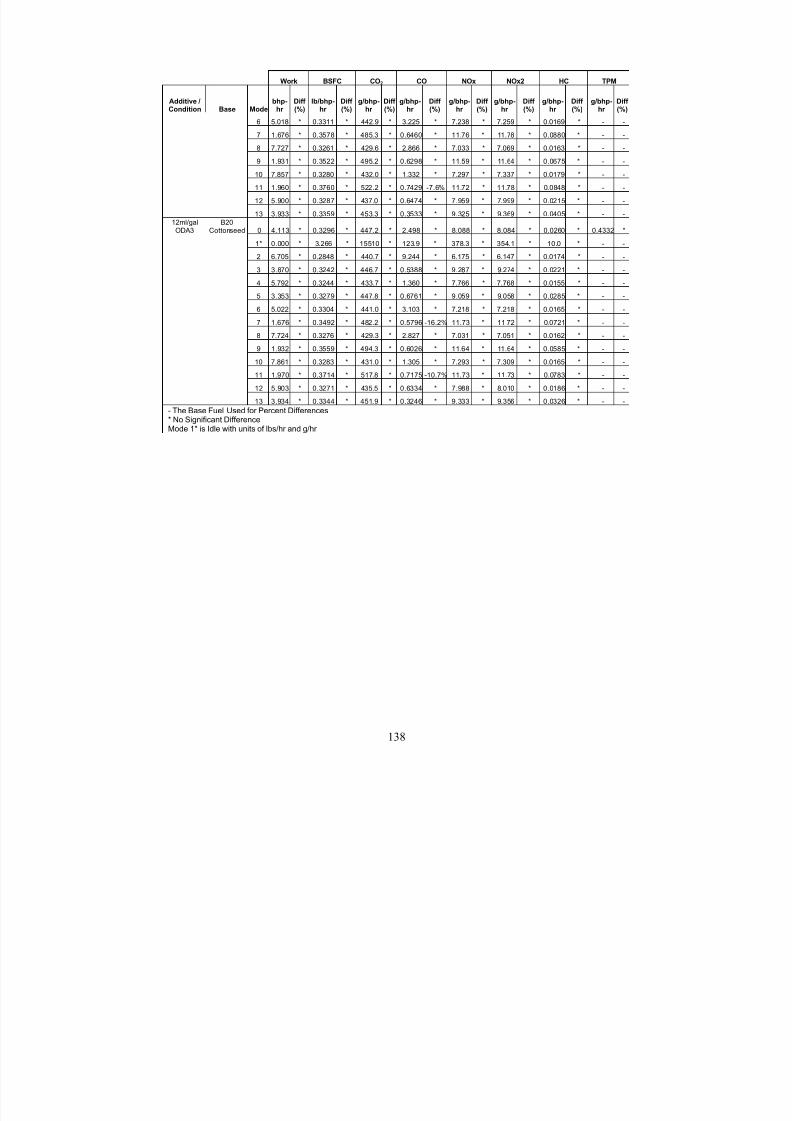
8/23/2019 The Effects of Fuel Additives on Diesel Engine Emissions During Steady State and Transient Operation
http://slidepdf.com/reader/full/the-effects-of-fuel-additives-on-diesel-engine-emissions-during-steady-state 157/163
Work BSFC CO2 CO NOx NOx2 HC TPM
Additive /Condition Base Mode
bhp-hr
Diff (%)
lb/bhp-hr
Diff (%)
g/bhp-hr
Diff (%)
g/bhp-hr
Diff (%)
g/bhp-hr
Diff (%)
g/bhp-hr
Diff (%)
g/bhp-hr
Diff (%)
g/bhp-hr
Diff (%)
6 5.018 * 0.3311 * 442.9 * 3.225 * 7.238 * 7.259 * 0.0169 * - -
7 1.676 * 0.3578 * 485.3 * 0.6460 * 11.76 * 11.78 * 0.0880 * - -
8 7.727 * 0.3261 * 429.6 * 2.866 * 7.033 * 7.069 * 0.0163 * - -9 1.931 * 0.3522 * 495.2 * 0.6298 * 11.59 * 11.64 * 0.0675 * - -
10 7.857 * 0.3280 * 432.0 * 1.332 * 7.297 * 7.337 * 0.0179 * - -
11 1.960 * 0.3760 * 522.2 * 0.7429 -7.6% 11.72 * 11.78 * 0.0848 * - -
12 5.900 * 0.3287 * 437.0 * 0.6474 * 7.959 * 7.999 * 0.0215 * - -
13 3.933 * 0.3359 * 453.3 * 0.3533 * 9.325 * 9.369 * 0.0405 * - -
12ml/galODA3
B20Cottonseed 0 4.113 * 0.3296 * 447.2 * 2.498 * 8.088 * 8.084 * 0.0260 * 0.4332 *
1* 0.000 * 3.266 * 15510 * 123.9 * 378.3 * 354.1 * 10.0 * - -
2 6.705 * 0.2848 * 440.7 * 9.244 * 6.175 * 6.147 * 0.0174 * - -
3 3.870 * 0.3242 * 446.7 * 0.5388 * 9.287 * 9.274 * 0.0221 * - -
4 5.792 * 0.3244 * 433.7 * 1.360 * 7.766 * 7.768 * 0.0155 * - -
5 3.353 * 0.3279 * 447.8 * 0.6761 * 9.059 * 9.058 * 0.0285 * - -
6 5.022 * 0.3304 * 441.0 * 3.103 * 7.218 * 7.218 * 0.0165 * - -
7 1.676 * 0.3492 * 482.2 * 0.5796 -16.2% 11.73 * 11.72 * 0.0721 * - -
8 7.724 * 0.3276 * 429.3 * 2.827 * 7.031 * 7.051 * 0.0162 * - -
9 1.932 * 0.3559 * 494.3 * 0.6026 * 11.64 * 11.64 * 0.0585 * - -
10 7.861 * 0.3283 * 431.0 * 1.305 * 7.293 * 7.309 * 0.0165 * - -
11 1.970 * 0.3714 * 517.8 * 0.7175 -10.7% 11.73 * 11.73 * 0.0783 * - -
12 5.903 * 0.3271 * 435.5 * 0.6334 * 7.988 * 8.010 * 0.0186 * - -
13 3.934 * 0.3344 * 451.9 * 0.3246 * 9.333 * 9.356 * 0.0326 * - -
- The Base Fuel Used for Percent Differences* No Significant DifferenceMode 1* is Idle with units of lbs/hr and g/hr
138
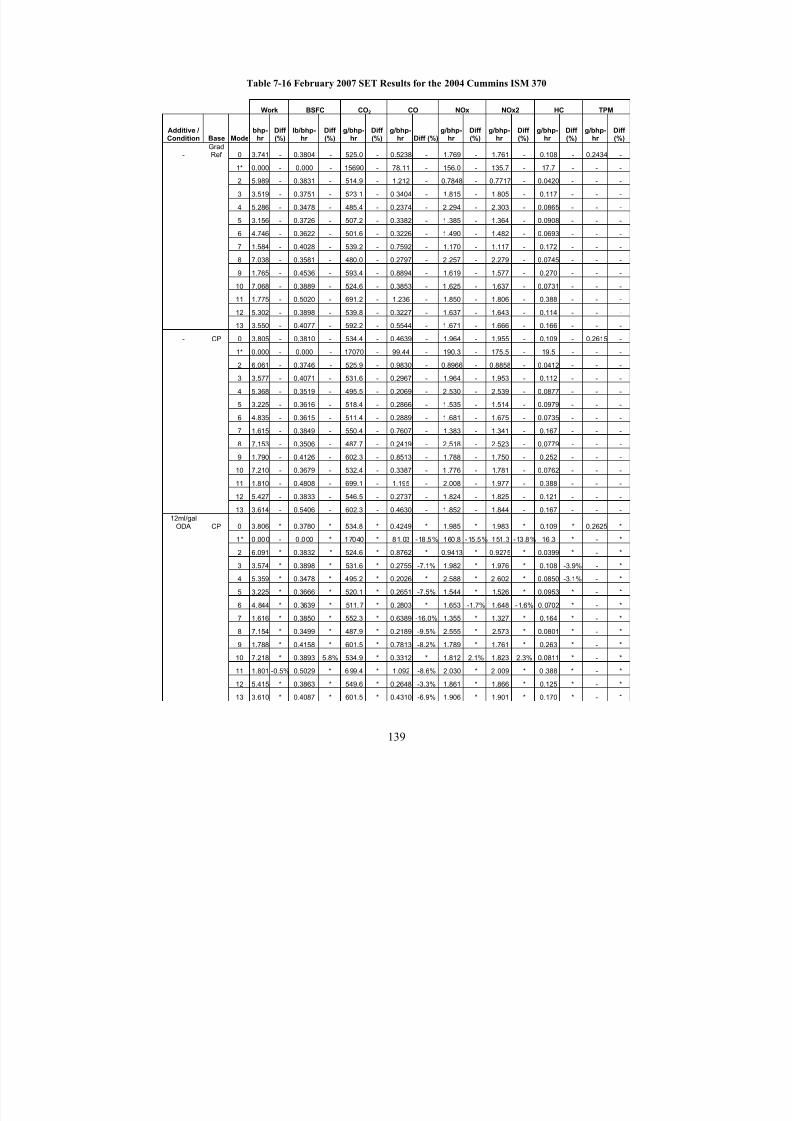
8/23/2019 The Effects of Fuel Additives on Diesel Engine Emissions During Steady State and Transient Operation
http://slidepdf.com/reader/full/the-effects-of-fuel-additives-on-diesel-engine-emissions-during-steady-state 158/163
Table 7-16 February 2007 SET Results for the 2004 Cummins ISM 370
Work BSFC CO2 CO NOx NOx2 HC TPM
Additive /Condition Base Mode
bhp-hr
Diff (%)
lb/bhp-hr
Diff (%)
g/bhp-hr
Diff (%)
g/bhp-hr Diff (%)
g/bhp-hr
Diff (%)
g/bhp-hr
Diff (%)
g/bhp-hr
Diff (%)
g/bhp-hr
Diff (%)
-GradRef 0 3.741 - 0.3804 - 525.0 - 0.5238 - 1.769 - 1.761 - 0.108 - 0.2434 -
1* 0.000 - 0.000 - 15690 - 78.11 - 156.0 - 135.7 - 17.7 - - -
2 5.989 - 0.3831 - 514.9 - 1.212 - 0.7848 - 0.7717 - 0.0420 - - -
3 3.519 - 0.3751 - 523.1 - 0.3404 - 1.815 - 1.805 - 0.117 - - -
4 5.286 - 0.3478 - 485.4 - 0.2374 - 2.294 - 2.303 - 0.0865 - - -
5 3.156 - 0.3726 - 507.2 - 0.3382 - 1.385 - 1.364 - 0.0908 - - -
6 4.746 - 0.3622 - 501.6 - 0.3226 - 1.490 - 1.482 - 0.0693 - - -
7 1.584 - 0.4028 - 539.2 - 0.7592 - 1.170 - 1.117 - 0.172 - - -
8 7.038 - 0.3581 - 480.0 - 0.2797 - 2.257 - 2.279 - 0.0745 - - -
9 1.765 - 0.4536 - 593.4 - 0.8894 - 1.619 - 1.577 - 0.270 - - -
10 7.068 - 0.3889 - 524.6 - 0.3853 - 1 .625 - 1.637 - 0.0731 - - -
11 1.775 - 0.5020 - 691.2 - 1.236 - 1.850 - 1.806 - 0.388 - - -12 5.302 - 0.3898 - 539.8 - 0.3227 - 1.637 - 1.643 - 0.114 - - -
13 3.550 - 0.4077 - 592.2 - 0.5544 - 1.671 - 1.666 - 0.166 - - -
- CP 0 3.805 - 0.3810 - 534.4 - 0.4639 - 1.964 - 1.955 - 0.109 - 0.2615 -
1* 0.000 - 0.000 - 17070 - 99.44 - 190.3 - 175.5 - 19.5 - - -
2 6.061 - 0.3746 - 525.9 - 0.9830 - 0.8966 - 0.8858 - 0.0412 - - -
3 3.577 - 0.4071 - 531.6 - 0.2967 - 1.964 - 1.953 - 0.112 - - -
4 5.368 - 0.3519 - 495.5 - 0.2069 - 2.530 - 2.539 - 0.0877 - - -
5 3.225 - 0.3616 - 518.4 - 0.2866 - 1.535 - 1.514 - 0.0979 - - -
6 4.835 - 0.3615 - 511.4 - 0.2889 - 1.681 - 1.675 - 0.0735 - - -
7 1.615 - 0.3849 - 550.4 - 0.7607 - 1.383 - 1.341 - 0.167 - - -
8 7.153 - 0.3506 - 487.7 - 0.2419 - 2.518 - 2.523 - 0.0779 - - -
9 1.790 - 0.4126 - 602.3 - 0.8513 - 1.788 - 1.750 - 0.252 - - -
10 7.210 - 0.3679 - 532.4 - 0.3387 - 1 .776 - 1.781 - 0.0762 - - -
11 1.810 - 0.4808 - 699.1 - 1.195 - 2.008 - 1.977 - 0.388 - - -
12 5.427 - 0.3833 - 546.5 - 0.2737 - 1.824 - 1.825 - 0.121 - - -
13 3.614 - 0.5406 - 602.3 - 0.4630 - 1.852 - 1.844 - 0.167 - - -
12ml/galODA CP 0 3.806 * 0.3780 * 534.8 * 0.4249 * 1.985 * 1.983 * 0.109 * 0.2625 *
1* 0.000 - 0.000 * 17040 * 81.03 -18.5% 160.8 -15.5% 151.3 -13.8% 16.3 * - *
2 6.091 * 0.3832 * 524.6 * 0.8762 * 0.9413 * 0.9275 * 0.0399 * - *
3 3.574 * 0.3898 * 531.6 * 0.2755 -7.1% 1.982 * 1.976 * 0.108 -3.9% - *
4 5.359 * 0.3478 * 495.2 * 0.2026 * 2.588 * 2 .602 * 0.0850 -3.1% - *
5 3.225 * 0.3666 * 520.1 * 0.2651 -7.5% 1.544 * 1.526 * 0.0953 * - *
6 4.844 * 0.3639 * 511.7 * 0.2803 * 1.653 -1.7% 1.648 -1.6% 0.0702 * - *
7 1.616 * 0.3850 * 552.3 * 0.6389 -16.0% 1.355 * 1.327 * 0.164 * - *
8 7.154 * 0.3499 * 487.9 * 0.2189 -9.5% 2.555 * 2.573 * 0.0801 * - *
9 1.788 * 0.4158 * 601.5 * 0.7813 -8.2% 1.789 * 1.761 * 0.263 * - *
10 7.218 * 0.3893 5.8% 534.9 * 0.3312 * 1.812 2.1% 1.823 2.3% 0.0811 * - *
11 1.801 -0.5% 0.5029 * 6 99.4 * 1.092 -8.6% 2.030 * 2 .009 * 0 .388 * - *
12 5.415 * 0.3863 * 549.6 * 0.2648 -3.3% 1.861 * 1.866 * 0.125 * - *
13 3.610 * 0.4087 * 601.5 * 0.4310 -6.9% 1.906 * 1.901 * 0.170 * - *
139
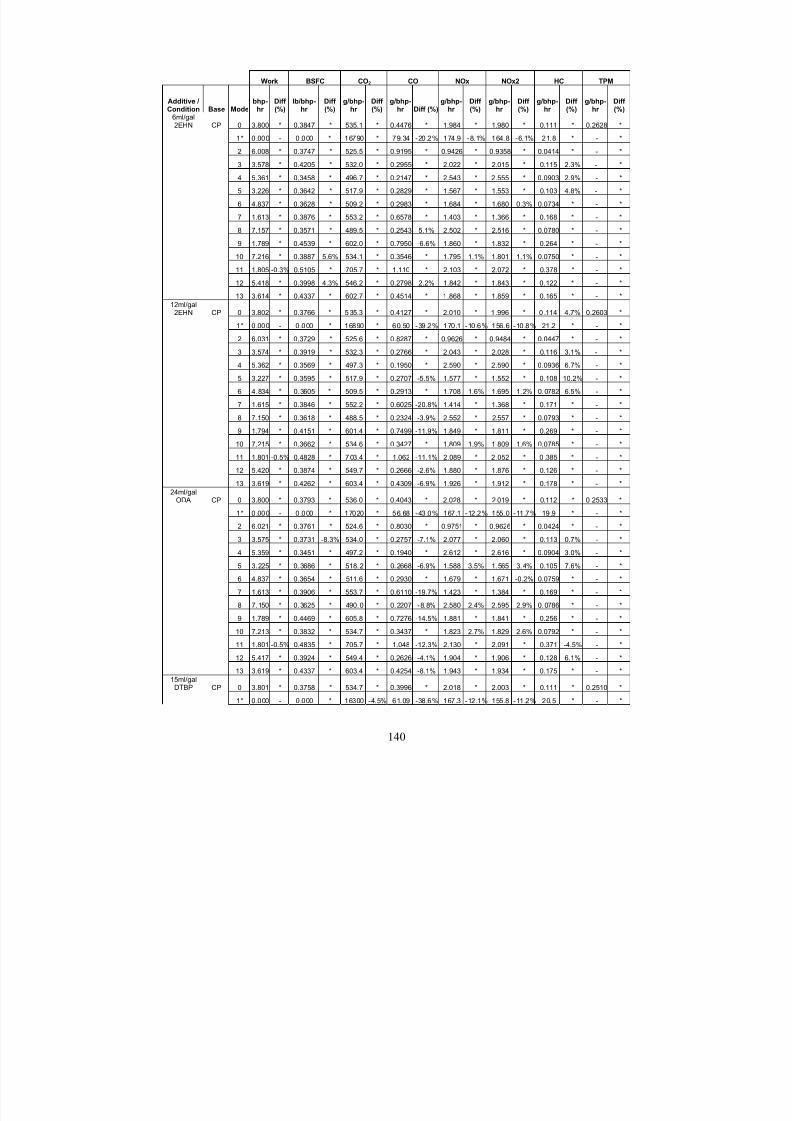
8/23/2019 The Effects of Fuel Additives on Diesel Engine Emissions During Steady State and Transient Operation
http://slidepdf.com/reader/full/the-effects-of-fuel-additives-on-diesel-engine-emissions-during-steady-state 159/163
Work BSFC CO2 CO NOx NOx2 HC TPM
Additive /Condition Base Mode
bhp-hr
Diff (%)
lb/bhp-hr
Diff (%)
g/bhp-hr
Diff (%)
g/bhp-hr Diff (%)
g/bhp-hr
Diff (%)
g/bhp-hr
Diff (%)
g/bhp-hr
Diff (%)
g/bhp-hr
Diff (%)
6ml/gal2EHN CP 0 3.800 * 0.3847 * 535.1 * 0.4476 * 1.984 * 1.980 * 0.111 * 0.2628 *
1* 0.000 - 0.000 * 16790 * 79.34 -20.2% 174.9 -8.1% 164.8 -6.1% 21.8 * - *
2 6.008 * 0.3747 * 525.5 * 0.9195 * 0.9426 * 0.9358 * 0.0414 * - *
3 3.578 * 0.4205 * 532.0 * 0.2955 * 2.022 * 2.015 * 0.115 2.3% - *
4 5.361 * 0.3458 * 496.7 * 0.2147 * 2.543 * 2.555 * 0.0903 2.9% - *
5 3.226 * 0.3642 * 517.9 * 0.2829 * 1.567 * 1.553 * 0.103 4.8% - *
6 4.837 * 0.3628 * 509.2 * 0.2983 * 1.684 * 1.680 0.3% 0.0734 * - *
7 1.613 * 0.3876 * 553.2 * 0.6578 * 1.403 * 1.366 * 0.168 * - *
8 7.157 * 0.3571 * 489.5 * 0.2543 5.1% 2.502 * 2.516 * 0.0780 * - *
9 1.789 * 0.4539 * 602.0 * 0.7950 -6.6% 1.860 * 1.832 * 0.264 * - *
10 7.216 * 0.3887 5.6% 534.1 * 0.3546 * 1.795 1.1% 1.801 1.1% 0.0750 * - *
11 1.805 -0.3% 0.5105 * 705.7 * 1.110 * 2.103 * 2.072 * 0.378 * - *
12 5.418 * 0.3998 4.3% 546.2 * 0.2798 2.2% 1.842 * 1.843 * 0.122 * - *
13 3.614 * 0.4337 * 602.7 * 0.4514 * 1.868 * 1.859 * 0.165 * - *
12ml/gal2EHN CP 0 3.802 * 0.3766 * 5 35.3 * 0.4127 * 2.010 * 1 .996 * 0 .114 4.7% 0.2603 *
1* 0.000 - 0.000 * 16890 * 60.50 -39.2% 170.1 -10.6% 156.6 -10.8% 21.2 * - *
2 6.031 * 0.3729 * 525.6 * 0.8287 * 0.9626 * 0.9484 * 0.0447 * - *
3 3.574 * 0.3919 * 532.3 * 0.2766 * 2.043 * 2.028 * 0.116 3.1% - *
4 5.362 * 0.3569 * 497.3 * 0.1950 * 2.590 * 2.590 * 0.0936 6.7% - *
5 3.227 * 0.3595 * 517.9 * 0.2707 -5.5% 1.577 * 1.552 * 0.108 10.2% - *
6 4.834 * 0.3605 * 509.5 * 0.2913 * 1.708 1.6% 1.695 1.2% 0.0782 6.5% - *
7 1.615 * 0.3846 * 552.2 * 0.6025 -20.8% 1.414 * 1.368 * 0.171 * - *
8 7.150 * 0.3618 * 488.5 * 0.2324 -3.9% 2.552 * 2.557 * 0.0793 * - *
9 1.794 * 0.4151 * 601.4 * 0.7499 -11.9% 1.849 * 1.811 * 0.269 * - *
10 7.215 * 0.3662 * 534.6 * 0.3427 * 1.809 1.9% 1.809 1.6% 0.0785 * - *
11 1.801 -0.5% 0.4828 * 703.4 * 1.062 -11.1% 2.089 * 2 .052 * 0 .385 * - *
12 5.420 * 0.3874 * 549.7 * 0.2666 -2.6% 1.880 * 1.876 * 0.126 * - *
13 3.619 * 0.4262 * 603.4 * 0.4309 -6.9% 1.926 * 1.912 * 0.178 * - *
24ml/galODA CP 0 3.800 * 0.3793 * 536.0 * 0.4043 * 2.028 * 2.019 * 0.112 * 0.2533 *
1* 0.000 - 0.000 * 17020 * 56.68 -43.0% 167.1 -12.2% 155.0 -11.7% 19.9 * - *
2 6.021 * 0.3761 * 524.6 * 0.8030 * 0.9751 * 0.9626 * 0.0424 * - *
3 3.575 * 0.3731 -8.3% 534.0 * 0.2757 -7.1% 2.077 * 2.060 * 0.113 0.7% - *
4 5.359 * 0.3451 * 497.2 * 0.1940 * 2.612 * 2.616 * 0.0904 3.0% - *
5 3.225 * 0.3686 * 518.2 * 0.2668 -6.9% 1.588 3.5% 1.565 3.4% 0.105 7.6% - *
6 4.837 * 0.3654 * 511.6 * 0.2930 * 1.679 * 1.671 -0.2% 0.0759 * - *
7 1.613 * 0.3906 * 553.7 * 0.6110 -19.7% 1.423 * 1.384 * 0.169 * - *
8 7.150 * 0.3625 * 490.0 * 0.2207 -8.8% 2.580 2.4% 2.595 2.9% 0.0786 * - *
9 1.789 * 0.4469 * 605.8 * 0.7276 -14.5% 1.881 * 1.841 * 0.256 * - *
10 7.213 * 0.3832 * 534.7 * 0.3437 * 1.823 2.7% 1.829 2.6% 0.0792 * - *
11 1.801 -0.5% 0.4835 * 705.7 * 1.048 -12.3% 2.130 * 2.091 * 0.371 -4.5% - *
12 5.417 * 0.3924 * 549.4 * 0.2626 -4.1% 1.904 * 1.906 * 0.128 6.1% - *
13 3.619 * 0.4337 * 603.4 * 0.4254 -8.1% 1.943 * 1.934 * 0.175 * - *
15ml/galDTBP CP 0 3.801 * 0.3758 * 534.7 * 0.3996 * 2.018 * 2.003 * 0.111 * 0.2510 *
1* 0.000 - 0.000 * 16300 -4.5% 61.09 -38.6% 167.3 -12.1% 155.8 -11.2% 20.5 * - *
140
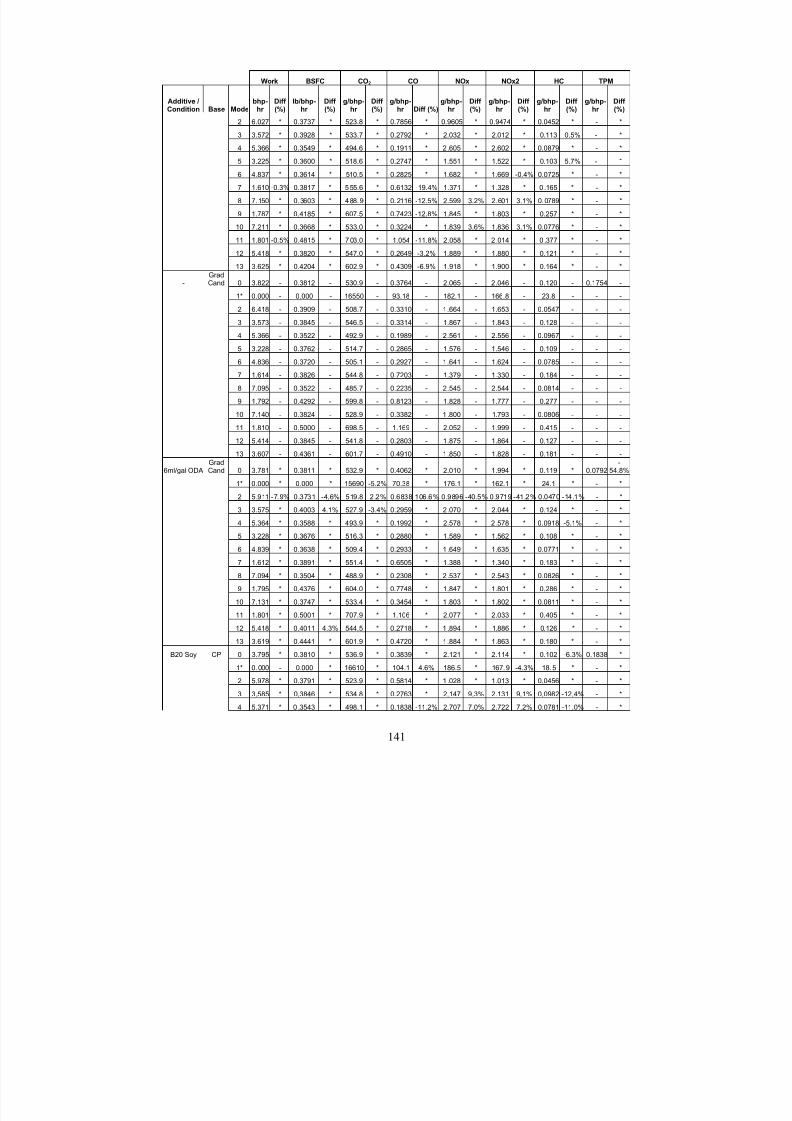
8/23/2019 The Effects of Fuel Additives on Diesel Engine Emissions During Steady State and Transient Operation
http://slidepdf.com/reader/full/the-effects-of-fuel-additives-on-diesel-engine-emissions-during-steady-state 160/163
Work BSFC CO2 CO NOx NOx2 HC TPM
Additive /Condition Base Mode
bhp-hr
Diff (%)
lb/bhp-hr
Diff (%)
g/bhp-hr
Diff (%)
g/bhp-hr Diff (%)
g/bhp-hr
Diff (%)
g/bhp-hr
Diff (%)
g/bhp-hr
Diff (%)
g/bhp-hr
Diff (%)
2 6.027 * 0.3737 * 523.8 * 0.7856 * 0.9605 * 0.9474 * 0.0452 * - *
3 3.572 * 0.3928 * 533.7 * 0.2792 * 2.032 * 2.012 * 0.113 0.5% - *
4 5.366 * 0.3549 * 494.6 * 0.1911 * 2 .605 * 2.602 * 0.0879 * - *5 3.225 * 0.3600 * 518.6 * 0.2747 * 1.551 * 1.522 * 0.103 5.7% - *
6 4.837 * 0.3614 * 510.5 * 0.2825 * 1.682 * 1.669 -0.4% 0.0725 * - *
7 1.610 -0.3% 0.3817 * 555.6 * 0.6132 -19.4% 1.371 * 1 .328 * 0 .165 * - *
8 7.150 * 0.3603 * 488.9 * 0.2116 -12.5% 2.599 3.2% 2.601 3.1% 0.0789 * - *
9 1.787 * 0.4185 * 607.5 * 0.7423 -12.8% 1.845 * 1.803 * 0.257 * - *
10 7.211 * 0.3668 * 533.0 * 0.3224 * 1.839 3.6% 1.836 3.1% 0.0776 * - *
11 1.801 -0.5% 0.4815 * 703.0 * 1.054 -11.8% 2.058 * 2 .014 * 0 .377 * - *
12 5.418 * 0.3820 * 547.0 * 0.2649 -3.2% 1.889 * 1.880 * 0.121 * - *
13 3.625 * 0.4204 * 602.9 * 0.4309 -6.9% 1.918 * 1.900 * 0.164 * - *
-GradCand 0 3.822 - 0.3812 - 530.9 - 0.3764 - 2.065 - 2.046 - 0.120 - 0.1754 -
1* 0.000 - 0.000 - 16550 - 93.18 - 182.1 - 166.8 - 23.8 - - -
2 6.418 - 0.3909 - 508.7 - 0.3310 - 1.664 - 1.653 - 0.0547 - - -
3 3.573 - 0.3845 - 546.5 - 0.3314 - 1.867 - 1.843 - 0.128 - - -
4 5.366 - 0.3522 - 492.9 - 0.1989 - 2.561 - 2.556 - 0.0967 - - -
5 3.228 - 0.3762 - 514.7 - 0.2865 - 1.576 - 1.546 - 0.109 - - -
6 4.836 - 0.3720 - 505.1 - 0.2927 - 1.641 - 1.624 - 0.0785 - - -
7 1.614 - 0.3826 - 544.8 - 0.7203 - 1.379 - 1.330 - 0.184 - - -
8 7.095 - 0.3522 - 485.7 - 0.2235 - 2.545 - 2.544 - 0.0814 - - -
9 1.792 - 0.4292 - 599.8 - 0.8123 - 1.828 - 1.777 - 0.277 - - -
10 7.140 - 0.3824 - 528.9 - 0.3382 - 1 .800 - 1.793 - 0.0806 - - -
11 1.810 - 0.5000 - 698.5 - 1.169 - 2.052 - 1.999 - 0.415 - - -
12 5.414 - 0.3845 - 541.8 - 0.2803 - 1.875 - 1.864 - 0.127 - - -
13 3.607 - 0.4361 - 601.7 - 0.4910 - 1.850 - 1.828 - 0.181 - - -
6ml/gal ODAGradCand 0 3.781 * 0.3811 * 532.9 * 0.4062 * 2.010 * 1.994 * 0.119 * 0.0792
-54.8%
1* 0.000 * 0.000 * 15690 -5.2% 70.38 * 176.1 * 162.1 * 24.1 * - *
2 5.911 -7.9% 0.3731 -4.6% 519.8 2.2% 0.6838 106.6% 0.9896 -40.5% 0.9719 -41.2% 0.0470 -14.1% - *
3 3.575 * 0.4003 4.1% 527.9 -3.4% 0.2959 * 2 .070 * 2.044 * 0.124 * - *
4 5.364 * 0.3588 * 493.9 * 0.1992 * 2.578 * 2 .578 * 0.0918 -5.1% - *
5 3.228 * 0.3676 * 516.3 * 0.2880 * 1.589 * 1.562 * 0.108 * - *
6 4.839 * 0.3638 * 509.4 * 0.2933 * 1 .649 * 1.635 * 0.0771 * - *
7 1.612 * 0.3891 * 551.4 * 0.6505 * 1.388 * 1.340 * 0.183 * - *
8 7.094 * 0.3504 * 488.9 * 0.2308 * 2 .537 * 2.543 * 0.0826 * - *
9 1.795 * 0.4376 * 604.0 * 0.7748 * 1.847 * 1.801 * 0.286 * - *
10 7.131 * 0.3747 * 533.4 * 0.3454 * 1 .803 * 1.802 * 0.0811 * - *
11 1.801 * 0.5001 * 707.9 * 1.106 * 2.077 * 2.033 * 0.405 * - *
12 5.418 * 0.4011 4.3% 544.5 * 0.2718 * 1 .894 * 1.886 * 0.126 * - *
13 3.619 * 0.4441 * 601.9 * 0.4720 * 1.884 * 1.863 * 0.180 * - *
B20 Soy CP 0 3.795 * 0.3810 * 536.9 * 0.3839 * 2.121 * 2.114 * 0.102 -6.3% 0.1838 *
1* 0.000 - 0.000 * 16610 * 104.1 4.6% 186.5 * 167.9 -4.3% 18.5 * - *
2 5.978 * 0.3791 * 523.9 * 0.5814 * 1 .028 * 1.013 * 0.0456 * - *
3 3.585 * 0.3846 * 534.8 * 0.2763 * 2.147 9.3% 2.131 9.1% 0.0982 -12.4% - *
4 5.371 * 0 .3543 * 498.1 * 0.1838 -11.2% 2.707 7.0% 2.722 7.2% 0.0781 -11.0% - *
141
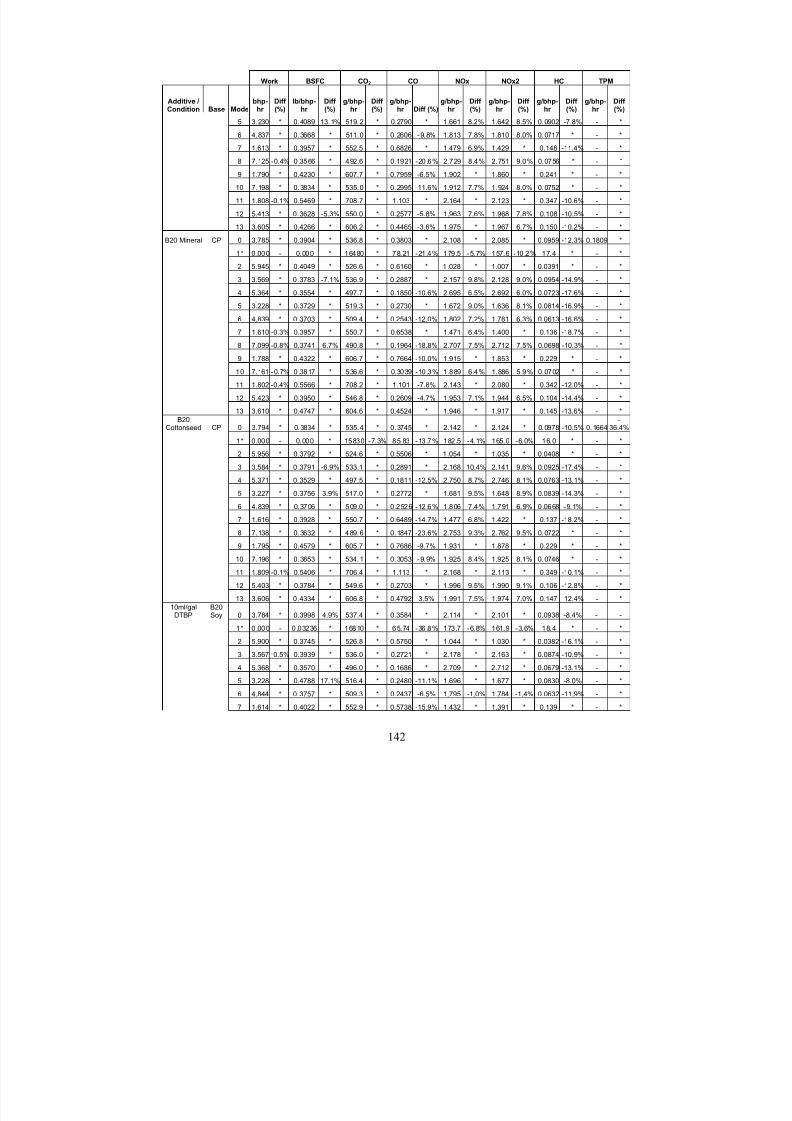
8/23/2019 The Effects of Fuel Additives on Diesel Engine Emissions During Steady State and Transient Operation
http://slidepdf.com/reader/full/the-effects-of-fuel-additives-on-diesel-engine-emissions-during-steady-state 161/163
Work BSFC CO2 CO NOx NOx2 HC TPM
Additive /Condition Base Mode
bhp-hr
Diff (%)
lb/bhp-hr
Diff (%)
g/bhp-hr
Diff (%)
g/bhp-hr Diff (%)
g/bhp-hr
Diff (%)
g/bhp-hr
Diff (%)
g/bhp-hr
Diff (%)
g/bhp-hr
Diff (%)
5 3.230 * 0.4089 13.1% 519.2 * 0.2790 * 1.661 8.2% 1.642 8.5% 0.0902 -7.8% - *
6 4.837 * 0.3668 * 511.0 * 0.2606 -9.8% 1.813 7.8% 1.810 8.0% 0.0717 * - *
7 1.613 * 0.3957 * 552.5 * 0.6826 * 1.479 6.9% 1.429 * 0.148 -11.4% - *8 7.125 -0.4% 0.3566 * 492.6 * 0.1921 -20.6% 2.729 8.4% 2.751 9.0% 0.0756 * - *
9 1.790 * 0.4230 * 607.7 * 0.7959 -6.5% 1.902 * 1.860 * 0.241 * - *
10 7.198 * 0.3834 * 535.0 * 0.2995 -11.6% 1.912 7.7% 1.924 8.0% 0.0752 * - *
11 1.808 -0.1% 0.5469 * 708.7 * 1.103 * 2.164 * 2.123 * 0.347 -10.6% - *
12 5.413 * 0 .3628 -5.3% 550.0 * 0.2577 -5.8% 1.963 7.6% 1.968 7.8% 0.108 -10.5% - *
13 3.605 * 0.4266 * 606.2 * 0.4465 -3.6% 1.975 * 1.967 6.7% 0.150 -10.2% - *
B20 Mineral CP 0 3.785 * 0.3904 * 536.8 * 0.3803 * 2.108 * 2.085 * 0.0959 -12.3% 0.1809 *
1* 0.000 - 0.000 * 16480 * 78.21 -21.4% 179.5 -5.7% 157.6 -10.2% 17.4 * - *
2 5.945 * 0.4049 * 526.6 * 0.6160 * 1 .028 * 1.007 * 0.0391 * - *
3 3.569 * 0 .3783 -7.1% 536.9 * 0.2887 * 2.157 9.8% 2.128 9.0% 0.0954 -14.9% - *
4 5.364 * 0 .3554 * 497.7 * 0.1850 -10.6% 2.695 6.5% 2.692 6.0% 0.0723 -17.6% - *
5 3.228 * 0.3729 * 519.3 * 0.2730 * 1.672 9.0% 1.636 8.1% 0.0814 -16.9% - *
6 4.839 * 0 .3703 * 509.4 * 0.2543 -12.0% 1.802 7.2% 1.781 6.3% 0.0613 -16.6% - *
7 1.610 -0.3% 0.3957 * 550.7 * 0.6538 * 1.471 6.4% 1.400 * 0.136 -18.7% - *
8 7.099 -0.8% 0.3741 6.7% 490.8 * 0.1964 -18.8% 2.707 7.5% 2.712 7.5% 0.0698 -10.3% - *
9 1.788 * 0.4322 * 606.7 * 0.7664 -10.0% 1.915 * 1.853 * 0.229 * - *
10 7.161 -0.7% 0.3817 * 536.6 * 0.3039 -10.3% 1.889 6.4% 1.886 5.9% 0.0702 * - *
11 1.802 -0.4% 0.5566 * 708.2 * 1.101 -7.8% 2.143 * 2.080 * 0.342 -12.0% - *
12 5.423 * 0.3950 * 546.8 * 0.2609 -4.7% 1.953 7.1% 1.944 6.5% 0.104 -14.4% - *
13 3.610 * 0.4747 * 604.6 * 0.4524 * 1.946 * 1.917 * 0.145 -13.6% - *
B20Cottonseed CP 0 3.794 * 0.3834 * 535.4 * 0.3745 * 2.142 * 2.124 * 0.0978 -10.5% 0.1664
-36.4%
1* 0.000 - 0.000 * 15830 -7.3% 85.83 -13.7% 182.5 -4.1% 165.0 -6.0% 16.0 * - *
2 5.956 * 0.3792 * 524.6 * 0.5506 * 1 .054 * 1.035 * 0.0408 * - *
3 3.584 * 0 .3791 -6.9% 533.1 * 0.2891 * 2.168 10.4% 2.141 9.6% 0.0925 -17.4% - *
4 5.371 * 0 .3529 * 497.5 * 0.1811 -12.5% 2.750 8.7% 2.746 8.1% 0.0763 -13.1% - *
5 3.227 * 0.3756 3.9% 517.0 * 0.2772 * 1.681 9.5% 1.648 8.9% 0.0839 -14.3% - *
6 4.839 * 0.3706 * 509.0 * 0.2526 -12.6% 1.806 7.4% 1.791 6.9% 0.0668 -9.1% - *
7 1.616 * 0.3928 * 550.7 * 0.6489 -14.7% 1.477 6.8% 1.422 * 0.137 -18.2% - *
8 7.138 * 0.3632 * 489.6 * 0.1847 -23.6% 2.753 9.3% 2.762 9.5% 0.0722 * - *
9 1.795 * 0.4579 * 605.7 * 0.7686 -9.7% 1.931 * 1.878 * 0.229 * - *
10 7.196 * 0.3853 * 534.1 * 0.3053 -9.9% 1.925 8.4% 1.925 8.1% 0.0746 * - *
11 1.809 -0.1% 0.5406 * 706.4 * 1.113 * 2.168 * 2.113 * 0.349 -10.1% - *
12 5.403 * 0.3784 * 549.6 * 0.2703 * 1.996 9.5% 1.990 9.1% 0.106 -12.8% - *
13 3.606 * 0 .4334 * 606.8 * 0.4792 3.5% 1.991 7.5% 1.974 7.0% 0.147 -12.4% - *
10ml/galDTBP
B20Soy 0 3.784 * 0.3998 4.9% 537.4 * 0.3584 * 2.114 * 2.101 * 0.0938 -8.4% - -
1* 0.000 - 0.03236 * 16810 * 65.74 -36.8% 173.7 -6.8% 161.9 -3.6% 18.4 * - *
2 5.900 * 0.3745 * 526.8 * 0.5750 * 1.044 * 1.030 * 0.0382 -16.1% - *
3 3.567 -0.5% 0.3939 * 536.0 * 0.2721 * 2.178 * 2.163 * 0.0874 -10.9% - *
4 5.368 * 0.3570 * 496.0 * 0.1686 * 2.709 * 2.712 * 0.0679 -13.1% - *
5 3.228 * 0.4788 17.1% 516.4 * 0.2480 -11.1% 1.696 * 1.677 * 0.0830 -8.0% - *
6 4.844 * 0 .3757 * 509.3 * 0.2437 -6.5% 1.795 -1.0% 1.784 -1.4% 0.0632 -11.9% - *
7 1.614 * 0.4022 * 552.9 * 0.5738 -15.9% 1.432 * 1.391 * 0.139 * - *
142
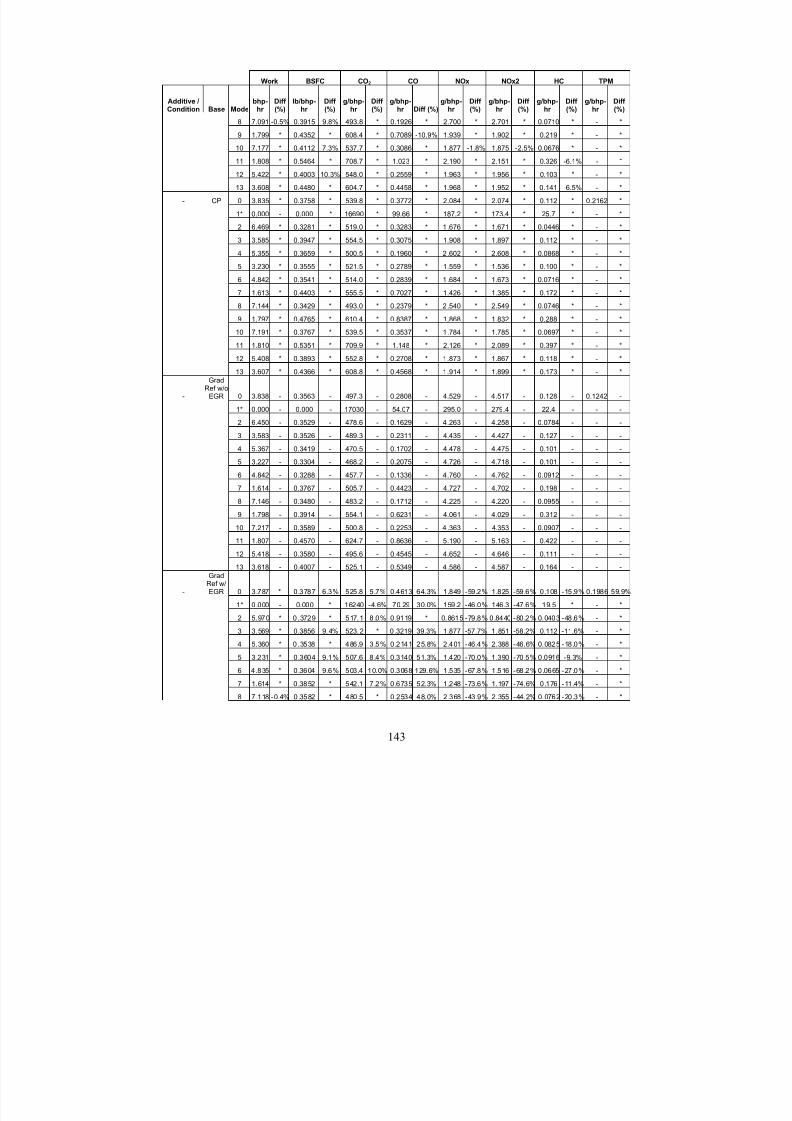
8/23/2019 The Effects of Fuel Additives on Diesel Engine Emissions During Steady State and Transient Operation
http://slidepdf.com/reader/full/the-effects-of-fuel-additives-on-diesel-engine-emissions-during-steady-state 162/163
Work BSFC CO2 CO NOx NOx2 HC TPM
Additive /Condition Base Mode
bhp-hr
Diff (%)
lb/bhp-hr
Diff (%)
g/bhp-hr
Diff (%)
g/bhp-hr Diff (%)
g/bhp-hr
Diff (%)
g/bhp-hr
Diff (%)
g/bhp-hr
Diff (%)
g/bhp-hr
Diff (%)
8 7.091 -0.5% 0.3915 9.8% 493.8 * 0.1926 * 2.700 * 2.701 * 0.0710 * - *
9 1.799 * 0.4352 * 608.4 * 0.7089 -10.9% 1.939 * 1.902 * 0.219 * - *
10 7.177 * 0.4112 7.3% 537.7 * 0.3086 * 1.877 -1.8% 1.875 -2.5% 0.0676 * - *11 1.808 * 0.5464 * 708.7 * 1.023 * 2.190 * 2.151 * 0.326 -6.1% - *
12 5.422 * 0.4003 10.3% 548.0 * 0.2559 * 1.963 * 1.956 * 0.103 * - *
13 3.608 * 0.4480 * 604.7 * 0.4458 * 1.968 * 1.952 * 0.141 -6.5% - *
- CP 0 3.835 * 0.3758 * 539.8 * 0.3772 * 2.084 * 2.074 * 0.112 * 0.2162 *
1* 0.000 - 0.000 * 16690 * 99.66 * 187.2 * 173.4 * 25.7 * - *
2 6.469 * 0.3281 * 519.0 * 0.3283 * 1 .676 * 1.671 * 0.0446 * - *
3 3.585 * 0.3947 * 554.5 * 0.3075 * 1.908 * 1.897 * 0.112 * - *
4 5.355 * 0.3659 * 500.5 * 0.1960 * 2 .602 * 2.608 * 0.0868 * - *
5 3.230 * 0.3555 * 521.5 * 0.2789 * 1.559 * 1.536 * 0.100 * - *
6 4.842 * 0.3541 * 514.0 * 0.2839 * 1 .684 * 1.673 * 0.0716 * - *
7 1.613 * 0.4403 * 555.5 * 0.7027 * 1.426 * 1.385 * 0.172 * - *
8 7.144 * 0.3429 * 493.0 * 0.2379 * 2 .540 * 2.549 * 0.0746 * - *
9 1.797 * 0.4765 * 610.4 * 0.8387 * 1.868 * 1.832 * 0.288 * - *
10 7.191 * 0.3767 * 539.5 * 0.3537 * 1 .784 * 1.785 * 0.0697 * - *
11 1.810 * 0.5351 * 709.9 * 1.148 * 2.126 * 2.089 * 0.397 * - *
12 5.408 * 0.3893 * 552.8 * 0.2708 * 1.873 * 1.867 * 0.118 * - *
13 3.607 * 0.4366 * 608.8 * 0.4568 * 1.914 * 1.899 * 0.173 * - *
-
GradRef w/o
EGR 0 3.838 - 0.3563 - 497.3 - 0.2808 - 4.529 - 4.517 - 0.128 - 0.1242 -
1* 0.000 - 0.000 - 17030 - 54.07 - 295.0 - 279.4 - 22.4 - - -
2 6.450 - 0.3529 - 478.6 - 0.1629 - 4.263 - 4.258 - 0.0784 - - -
3 3.583 - 0.3526 - 489.3 - 0.2311 - 4.435 - 4.427 - 0.127 - - -
4 5.367 - 0.3419 - 470.5 - 0.1702 - 4.478 - 4.475 - 0.101 - - -
5 3.227 - 0.3304 - 468.2 - 0.2075 - 4.726 - 4.718 - 0.101 - - -
6 4.842 - 0.3288 - 457.7 - 0.1336 - 4.760 - 4.762 - 0.0912 - - -
7 1.614 - 0.3767 - 505.7 - 0.4423 - 4.727 - 4.702 - 0.198 - - -
8 7.146 - 0.3480 - 483.2 - 0.1712 - 4.225 - 4.220 - 0.0955 - - -
9 1.798 - 0.3914 - 554.1 - 0.6231 - 4.061 - 4.029 - 0.312 - - -
10 7.217 - 0.3589 - 500.8 - 0.2253 - 4 .363 - 4.353 - 0.0907 - - -
11 1.807 - 0.4570 - 624.7 - 0.8636 - 5.190 - 5.163 - 0.422 - - -
12 5.418 - 0.3580 - 495.6 - 0.4545 - 4.652 - 4.646 - 0.111 - - -
13 3.618 - 0.4007 - 525.1 - 0.5349 - 4.586 - 4.587 - 0.164 - - -
-
GradRef w/EGR 0 3.787 * 0.3787 6.3% 525.8 5.7% 0.4613 64.3% 1.849 -59.2% 1.825 -59.6% 0.108 -15.9% 0.1986 59.9%
1* 0.000 - 0.000 * 16240 -4.6% 70.29 30.0% 159.2 -46.0% 146.3 -47.6% 19.5 * - *
2 5.970 * 0.3729 * 517.1 8.0% 0.9119 * 0.8615 -79.8% 0.8440 -80.2% 0.0403 -48.6% - *
3 3.569 * 0.3856 9.4% 523.2 * 0 .3219 39.3% 1.877 -57.7% 1.851 -58.2% 0.112 -11.6% - *
4 5.360 * 0.3538 * 486.9 3.5% 0.2141 25.8% 2.401 -46.4% 2.388 -46.6% 0.0825 -18.0% - *
5 3.231 * 0.3604 9.1% 507.6 8.4% 0.3140 51.3% 1.420 -70.0% 1.390 -70.5% 0.0916 -9.3% - *
6 4.835 * 0.3604 9.6% 503.4 10.0% 0.3068 129.6% 1.535 -67.8% 1.516 -68.2% 0.0665 -27.0% - *
7 1.614 * 0.3852 * 542.1 7.2% 0.6735 52.3% 1.248 -73.6% 1.197 -74.6% 0.176 -11.4% - *
8 7.118 -0.4% 0.3582 * 480.5 * 0.2534 48.0% 2.368 -43.9% 2.355 -44.2% 0.0762 -20.3% - *
143
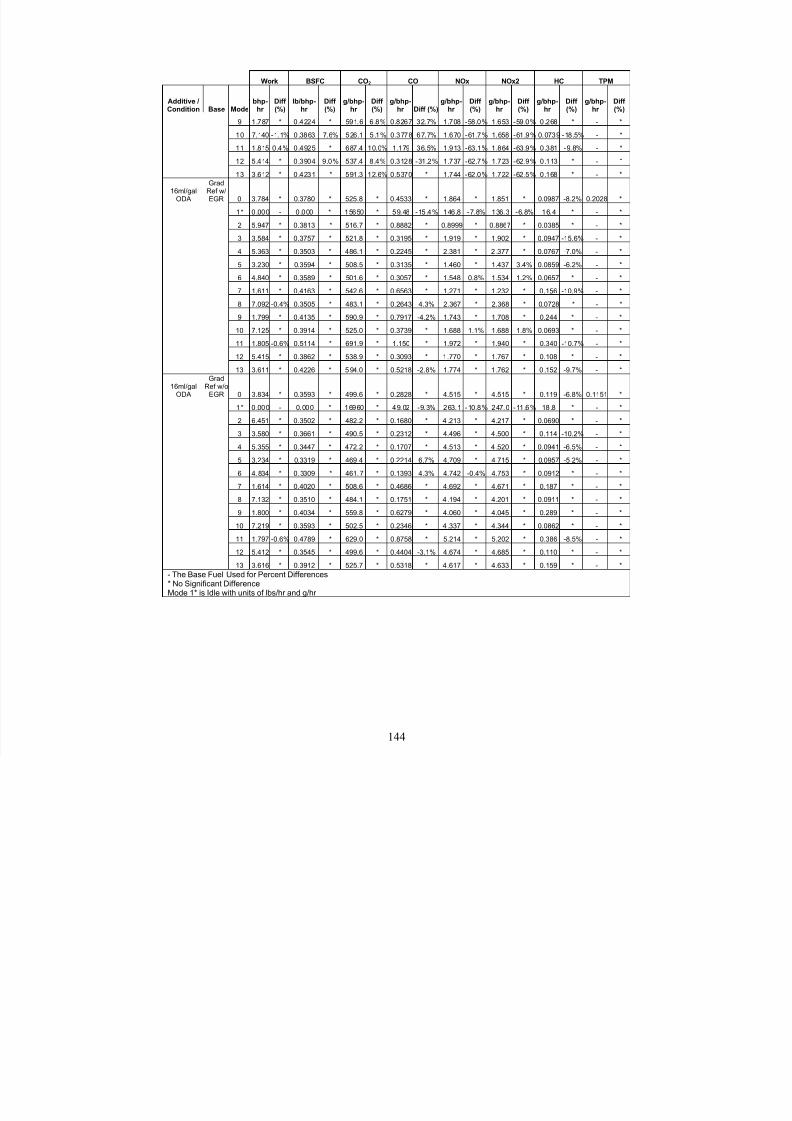
8/23/2019 The Effects of Fuel Additives on Diesel Engine Emissions During Steady State and Transient Operation
http://slidepdf.com/reader/full/the-effects-of-fuel-additives-on-diesel-engine-emissions-during-steady-state 163/163
Work BSFC CO2 CO NOx NOx2 HC TPM
Additive /Condition Base Mode
bhp-hr
Diff (%)
lb/bhp-hr
Diff (%)
g/bhp-hr
Diff (%)
g/bhp-hr Diff (%)
g/bhp-hr
Diff (%)
g/bhp-hr
Diff (%)
g/bhp-hr
Diff (%)
g/bhp-hr
Diff (%)
9 1.787 * 0.4224 * 591.6 6.8% 0.8267 32.7% 1.708 -58.0% 1.653 -59.0% 0.268 * - *
10 7.140 -1.1% 0.3863 7.6% 526.1 5.1% 0.3778 67.7% 1.670 -61.7% 1.658 -61.9% 0.0739 -18.5% - *
11 1.815 0.4% 0.4925 * 687.4 10.0% 1.179 36.5% 1.913 -63.1% 1.864 -63.9% 0.381 -9.8% - *12 5.414 * 0.3904 9.0% 537.4 8.4% 0.3128 -31.2% 1.737 -62.7% 1.723 -62.9% 0.113 * - *
13 3.612 * 0.4231 * 591.3 12.6% 0.5370 * 1.744 -62.0% 1.722 -62.5% 0.168 * - *
16ml/galODA
GradRef w/EGR 0 3.784 * 0.3780 * 525.8 * 0.4533 * 1.864 * 1.851 * 0.0987 -8.2% 0.2028 *
1* 0.000 - 0.000 * 15650 * 59.48 -15.4% 146.8 -7.8% 136.3 -6.8% 16.4 * - *
2 5.947 * 0.3813 * 516.7 * 0.8882 * 0.8999 * 0.8867 * 0.0385 * - *
3 3.584 * 0.3757 * 521.8 * 0.3195 * 1.919 * 1.902 * 0.0947 -15.6% - *
4 5.363 * 0.3503 * 486.1 * 0.2245 * 2.381 * 2 .377 * 0.0767 -7.0% - *
5 3.230 * 0.3594 * 508.5 * 0.3135 * 1.460 * 1.437 3.4% 0.0859 -6.2% - *
6 4.840 * 0.3589 * 501.6 * 0.3057 * 1.548 0.8% 1.534 1.2% 0.0657 * - *
7 1.611 * 0.4163 * 542.6 * 0.6563 * 1.271 * 1.232 * 0.156 -10.9% - *
8 7.092 -0.4% 0.3505 * 483.1 * 0.2643 4.3% 2.367 * 2.368 * 0.0728 * - *
9 1.799 * 0.4135 * 590.9 * 0.7917 -4.2% 1.743 * 1.708 * 0.244 * - *
10 7.125 * 0.3914 * 525.0 * 0.3739 * 1.688 1.1% 1.688 1.8% 0.0693 * - *
11 1.805 -0.6% 0.5114 * 691.9 * 1.150 * 1.972 * 1.940 * 0.340 -10.7% - *
12 5.415 * 0.3862 * 538.9 * 0.3093 * 1.770 * 1.767 * 0.108 * - *
13 3.611 * 0.4226 * 594.0 * 0.5218 -2.8% 1.774 * 1 .762 * 0 .152 -9.7% - *
16ml/galGrad
Ref w/o