Embed Size (px)
Citation preview

THE EFFECTS OF EXTERNAL CUES ON MEDIA HABIT AND USE: PUSH
NOTIFICATION ALERTS AND MOBILE APPLICATION USAGE HABITS
By
Mijung Kim
A DISSERTATION
Submitted to
Michigan State University
in partial fulfillment of the requirements
for the degree of
Media and Information Studies – Doctor of Philosophy
2014

ABSTRACT
THE EFFECTS OF EXTERNAL CUES ON MEDIA HABIT AND USE: PUSH
NOTIFICATION ALERTS AND MOBILE APPLICATION USAGE HABITS
By
Mijung Kim
This dissertation is an examination of how push notifications affect habit formation and
the relationship between habit and mobile application use. For the purpose of this study, we
created a simple weather forecast mobile application for a 20-day panel study of two randomly
assigned groups: one received push notification alerts and the other did not. During the period of
study, participants were asked to use the application every day and completed four surveys five
days apart. This dissertation examined the temporal sequencing and mutual influence between
habit strength for visiting the application and application usage behaviors (i.e., frequency of
visits and duration on the application use) using bivariate latent difference score structural
equation modeling. Longitudinal data from 115 smartphone application users revealed level of
habit strength for visiting the application through push notification alerts to be positively
associated with changes in frequency of visits. Higher scores on habit strength anticipated
increases in frequency of visits. Repeated-measured ANOVAs showed a significant difference
between users who received push notification alerts and the other users who did not in frequency
of visits and push notification receivers visited the application more during the study period. In
addition, users who clicked push notification alert messages visited more than users who
received push notifications but did not click. These findings highlight the role of external media
prompts in media habit formation and usage and provides evidence of causation in media use –

adding to our understanding of the cognitive mechanisms of media habit formation in ways that
were absent in prior research.

Copyright by
MIJUNG KIM
2014

iv
This dissertation is dedicated to
my supportive parents, Jungsun Choi and Ginho Kim,
my love, Chonghoon Kim,
our precious daughter, Jiyu Kim,
and all my wonderful friends I met at Michigan State University
and Campus Mission Church at New York

v
ACKNOWLEDGEMENTS
Thanks to my advisor, Dr. Robert LaRose, I pushed myself to finish my Ph.D. I will always
remember what you said, “Contribute to Science.”
Thanks to my committee, I improved my research.
Thanks to my parents, I finished my doctoral program.
Thanks to my love, CK, I was happy while writing my dissertation.
Thanks to my precious daughter, Jiyu, I learned how to manage time and energy.
Thanks to my friends, I survived the stress.
But without God, I couldn’t do anything.

vi
TABLE OF CONTENTS
LIST OF TABLES ........................................................................................................................ vii
LIST OF FIGURES ....................................................................................................................... ix
INTRODUCTION .......................................................................................................................... 1
LITERATURE REVIEW ............................................................................................................... 5 Mobile Phone and Smartphone Use ........................................................................................... 5
Uses and Gratifications (U&Gs) .............................................................................................. 6 Technology Acceptance Model (TAM) and Related Models. ................................................ 6 Individual Differences ........................................................................................................... 10
Media Habits under Social Cognitive Theory ....................................................................... 10 Acquiring Media Habits ........................................................................................................... 18
Effects of External Cues on Media Habits ............................................................................... 22 Push Notifications and Habits of Media Use ........................................................................... 26 Relationship between Habits and Media Use........................................................................... 28
METHOD ..................................................................................................................................... 34 Research Design and Instrumentation ...................................................................................... 34
Participants ............................................................................................................................... 39
Measurement ............................................................................................................................ 42
Pretest questionnaire. ............................................................................................................. 42 Main Questionnaire ............................................................................................................... 43
Data Analyses and Modeling Procedures ................................................................................ 44
RESULTS ..................................................................................................................................... 47 Weather changes ...................................................................................................................... 49
Model Viability ........................................................................................................................ 50 Descriptive Statistics ................................................................................................................ 52 Habit Development .................................................................................................................. 55 Effect of Push Notification Alerts on Habit Strength and Application Use ............................ 56
Causal Relationship between Habit for Mobile Application Visitation and the Behaviors of
Frequency of Visitation and Duration on Application ............................................................. 62
DISCUSSION ............................................................................................................................... 75
APPENDICES .............................................................................................................................. 88 APPENDIX A .......................................................................................................................... 89 APPENDIX B .......................................................................................................................... 91
REFERENCES ............................................................................................................................. 93

vii
LIST OF TABLES
Table 1 Different Approaches of Mobile Phone Usage Behaviors ............................................... 14
Table 2 Fit Indices from the Confirmatory Factor Analysis and Cronbach’s Alpha Reliabilities of
Repeated Habit Strength Measures ............................................................................................... 44
Table 3 Demographics of Push Group and Non-Push Group ....................................................... 47
Table 4 Descriptive Statistics of Variables of Interest by Group ................................................. 48
Table 5 Weather Information During the 20-Day Study Period ................................................... 49
Table 6 Univariate Latent Growth Model Results, Model Fit Indices, and Parameter Estimates by
Variable ......................................................................................................................................... 51
Table 7 Correlations for Observed Variables for Non-Push Group ............................................. 53
Table 8 Correlations for Observed Variables for Push Group ...................................................... 54
Table 9 Correlations for Weather Information and Mobile Application Usage Behaviors .......... 55
Table 10 Repeated-Measures ANOVA Results for Habit Strength over Time between Push
Group and Non-Push Group ......................................................................................................... 56
Table 11 Correlations for Habit Strength, Demographic, and Background Variables ................. 58
Table 12 Repeated-Measures ANOVA Results for Frequency of Visits over Time between Non-
Push Group, Non Responding Group, and Responding Group .................................................... 59
Table 13 Repeated-Measures ANOVA Results for Frequency of Visits over Time between Push
Group and Non-Push Group ......................................................................................................... 60
Table 14 Repeated-Measures ANOVA Results for Duration per Visit over Time between Push
Group and Non-Push Group ......................................................................................................... 61
Table 15 Bivariate Latent Difference Score Model for Habit Strength for Overall Visitation and
Frequency of Visiting Weather Story for Both Groups ................................................................ 64
Table 16 Bivariate Latent Difference Score Model for Habit Strength for Overall Visitation and
Frequency of Visiting Weather Story for Non-Push Group ......................................................... 65
Table 17 Bivariate Latent Difference Score Model for Habit Strength for Overall Visitation and
Frequency of Visiting Weather Story for Push Group.................................................................. 66
Table 18 Bivariate Latent Difference Score Model for Habit Strength for Overall Visitation and
Duration per Visit to Weather Story for Both Groups .................................................................. 67

viii
Table 19 Bivariate Latent Difference Score Model for Habit Strength for Overall Visitation and
Duration per Visit to Weather Story for Non-Push Group ........................................................... 69
Table 20 Bivariate Latent Difference Score Model for Habit Strength for Overall Visitation and
Duration per Visit to Weather Story for Push Group ................................................................... 70
Table 21 Bivariate Latent Difference Score Model for Frequency of Visiting and Duration per
Visit to Weather Story for Both Groups ....................................................................................... 71
Table 22 Bivariate Latent Difference Score Model for Frequency of Visiting and Duration per
Visit to Weather Story for Non-Push Group................................................................................. 72
Table 23 Bivariate Latent Difference Score Model for Frequency of Visiting and Duration per
Visit to Weather Story for Push Group ......................................................................................... 73

ix
LIST OF FIGURES
Figure 1. Proposed model for associations among push notifications, habit for visiting through
push notification, habit for overall visitation, frequency of visits, and duration of application visit.
....................................................................................................................................................... 33
Figure 2. Depiction of the Weather Story application’s front page on iPhone (left) and Android
phone (right).................................................................................................................................. 35
Figure 3. Depiction of the Weather Story application’s second page on iPhone (left) and Android
phone (right).................................................................................................................................. 35
Figure 4. Depiction of push notification delivered at 9 a.m. ........................................................ 38
Figure 5. Depiction of push notifications in the lock screen ........................................................ 38
Figure 6. Depiction of push notifications for temperature change notification ............................ 39
Figure 7. Bivariate dual change latent difference score model. To simplify presentation, single-
indicator measurement components are depicted. ........................................................................ 46
Figure 8. Temperature change during the 20-day study period .................................................... 49
Figure 9. Plot of habit strength for overall Weather Story visitation for the push and non-push
groups across the four time points. ............................................................................................... 57
Figure 10. Plot of frequency of Weather Story visitation for the push and non-push groups across
the four time points. ...................................................................................................................... 61
Figure 11. Plot of duration per visit to Weather Story for the push and non-push group across the
four time points. ............................................................................................................................ 62

1
INTRODUCTION
Mobile phones are becoming so widely used that there are now 6.8 billion mobile
subscribers worldwide (International Telecommunication Union, 2013). As mobile phones
become popular as a media platform as well as a communication tool, recent design and
technological improvements in mobile phones have been aimed at increasing the mobile phone’s
connectivity in order to facilitate immediate access for users (Soror, Steelman, & Limayem,
2012). Moreover, as the number of features and applications available on mobile phones
increases, so do the kinds of activities people can carry out on them at any time and location.
Mobile technology continues to advance both in terms of the functionality of mobile
devices and the quality of connections. The burgeoning choices of applications for data-enabled
mobile phones (i.e., smartphones) are largely responsible for the expanded range of decision
making processes these devices provide. A lot of this content is useful and enjoyable to users.
Overall, mobile phone users experience fast and efficient information consumption and enhanced
social networking. Notifications from push notification services transform smartphones into
communication hubs that notify users of incoming information or events as people on the go
engage with social networks, information services, location-based services, and interactive
games.
Push notification services also allow “third-party application servers to actively send data
to their installed applications, even when the installed application is currently not running” (Xu
& Zhu, 2012, p. 11). To get push notification service, mobile application users are asked whether
they want to receive notifications when they install applications. Through push notification
services, mobile application providers can feed information to users in efficient ways and in a

2
timely fashion. Notifications from push notification services serve as reminders leading people to
ultimately use the installed mobile applications.
However, one of the most important concerns associated with mobile phone use is that it
may become habitual, and eventually uncontrolled in ways that can impact our daily lives
(Billieux, 2012; Soror et al., 2012). Nonstop information feeding by mobile applications also
causes frequently repeated use by users without having conscious control over these behaviors.
Many people answer their mobile phones without considering whether doing so interferes with
more important ongoing tasks, such as driving a car (e.g., White, Eiser, & Harris, 2004).
Dangerously, some people automatically respond to the push notifications on their mobile
phones while driving and, accordingly, several states in the US as well as Washington D.C.,
Guam and the U.S. Virgin Islands, have banned mobile phone use while driving (Governors
Highway Safety Association, 2013). Text messaging while driving has also been prohibited in 39
US states. There are other uncontrolled consequences of mobile phone use. They have infiltrated
classrooms and threatened to undermine schools’ authority and control over students by
disrupting learning in a classroom setting (Campbell, 2005; Geser, 2004). Frequently a social
nuisance, people also use their mobile phones in public places where their use can be distracting,
at work meetings, in movie theaters and restaurants, and otherwise in places and situations in
which their use is not considered appropriate (Turkle, 2008). In this respect, how push
notifications are used can influence mobile phone usage behavior and its usage habits.
Regarding media use, studies found that habit was a significant and strong predictor (see
LaRose & Eastin, 2004 for the Internet; Soror et al., 2012; Peters, 2007, 2009 for mobile phone
use; Lee & LaRose, 2007 for video games). In particular, LaRose and colleagues used self-
regulation mechanisms to explain habitual media use (see LaRose, 2010; LaRose & Eastin,

3
2004; LaRose, Lin & Eastin, 2003), which was defined as a form of automaticity in media use
that develops as people repeat media consumption (LaRose, 2010). Specifically, self-regulation
mechanisms (i.e., self-control and self-monitoring) are deficient when media use is habitual.
When dealing with the relationship between media use and media habits, the inevitable
“chicken and egg” question raises its head: Which comes first? One train of thought is that as
people use media repeatedly and spend more and more time using it, they eventually lose self-
control over managing their media use. Alternatively, it is also thought that people spend more
time on media because they cannot control their behavior. The third and perhaps most likely
possibility is that the causal relationship is reciprocal. The relevance of this study is both based
on this classic conundrum, and also because previous researchers could not identify the causal
direction of the relationship since their studies were purely based on cross-sectional data (see
Tokunaga & Rains, 2010).
Regarding the factors influencing habits, researchers argue that habitual behaviors are
elicited by internal cues (e.g., mood states and motivations) (see LaRose & Eastin, 2004; Lee &
LaRose, 2007; Peters, 2007, 2009; Soror et al., 2012) external cues or both (e.g., people, events,
locations, etc.) (see Ouellette & Wood, 1998; Wood, Tam, &Witt, 2005; Verplanken & Wood,
2006). However, how features of media providing external cues influence media habit and media
use has received scant attention. In mobile application use, the affordances of media devices,
especially the notification function, may provide these powerful external cues, thereby
influencing media usage habits. In other words, notifications from push notification services
provide the cues that may trigger people to use their corresponding applications. In effect, people
sometimes use their mobile phones in a way that is a counter to the users’ intentions but as a
habitual behavior, an automatic impulse to check push notifications. Furthermore, media

4
technology design and artifact studies have focused on improving the external triggers, but they
have paid little attention to their effects on actual user behavior (Barkhuus & Dey, 2003).
Because of these tendencies, and the fact that push notifications are the obvious
affordance of interactive media that comes from the environment rather than directly from the
person, push notification service was examined vis-à-vis users and non-users in this dissertation.
The push notifications involved sending notifications, including potentially useful or interesting
information in the form of messages that were shown on a mobile phone screen. In this
dissertation, tests were run to see if push notifications had an effect on forming the habit of
application usage. Push notifications for smartphones included initial information that could
ignite internal cues, like curiosity or motivation. Thus, this dissertation will help us to more fully
understand how push notifications influence users’ controllability in mobile application use in
terms of habitual behavior and the relationship between habit strength and mobile application use.
This dissertation begins with a review of existing literature addressing mobile phone use,
including smartphones and automatic/uncontrolled mobile phone use. Then, this dissertation
contains some conceptual groundwork and definitions of habit. The discussion of habit in media
use is based on a theoretical framework by LaRose and his colleagues (LaRose & Eastin, 2004;
LaRose et al., 2003; LaRose, Mestro, & Eastin, 2001). The present work focuses on the role of
external cues provided by mobile devices in habit development and activation and the effect on
the relationship between habit and the mobile application use.

5
LITERATURE REVIEW
This dissertation investigates the relationship between push notifications and habit
formation with the aim of better understanding the causal direction of mobile application usage
behavior. As a basis for understanding such behavior, this review considers literature dealing
with the use of mobile phones and smartphones, including mobile phone use that is automatic or
uncontrolled.
Mobile Phone and Smartphone Use
Mobile phones have become an indispensable medium for socializing and working
(Takao, Takahashi, & Kitamura, 2009) as well as entertainment (Wei, 2008). As mobile
technology has advanced, mobile phones’ functions have expanded beyond calling and texting.
Common uses now include exploring the Internet, managing emails, playing video games,
purchasing products, watching videos, and working on documents. Data-enabled “smart”
functions are not only common to mobile devices such as smartphones, but subscribers are using
them at a high rate. Among mobile subscribers in the US, there was a 61% penetration rate of
smart phones in 2013 (Nielsen, 2013).
Previous studies have approached the wide range of factors influencing mobile phone
usage behaviors using a diverse array of theoretical frameworks and perspectives. Among them
are Uses and Gratifications (U&Gs), Technology Acceptance Model (TAM)/ Unified Theory of
Acceptance and Use of Technology (UTAUT), the effect of individual differences, and media
habit based on Social Cognitive Theory (SCT). These studies provide a sense of how one’s
intentions affects mobile phone use, and conversely, how habit explains mobile phone use.

6
Further, some studies have specifically explored people’s behavior vis-à-vis push notifications
such as SMS in mobile phones.
Uses and Gratifications (U&Gs). U&Gs proposes that people are goal-directed in their
media selection and usage; they actively choose a certain medium to satisfy their needs (Li,
2007; Park, Lee, & Cheong, 2008; Rubin, 2002). Previous U&Gs studies on media have
consistently found that people are motivated to use communication technologies and other media
and that their motivations play a critical role in influencing their actual use (Park et al., 2008).
The common motives for using mobile phones are: social interaction, entertainment, immediate
access, mobility, and fashion/status (Leung & Wei, 2000; Ozcan & Kogak, 2003; Peters &
Allouch, 2005; Wei & Lo, 2006). Though researchers have targeted overall mobile phone use in
several studies, some have also identified the motives for using specific functions and mobile
technologies. For instance, the motives for using Short Message Service (SMS) via mobile
phones were social interaction, immediate access, entertainment, and time-efficiency (Peters,
Almekinders, Van Buuren, Snippers & Wessels, 2003). However, the motives found from the
latter results are similar to those for overall mobile phone use.
Even though the defined motives of mobile phone use from U&Gs based studies reflect
new ways in which users interact through mobile technology, the specific results of factor
analyses of motivations and gratifications are inconsistent. Moreover, the variance explained by
internal motives of mobile phone use among these studies using the U&Gs perspective was less
than 20%, indicating that U&Gs do not fully account for mobile phone usage.
Technology Acceptance Model (TAM) and Related Models. A second perspective
used to explain mobile phone use is TAM. According to TAM, an individual’s behavioral
intention to use a medium is determined by two beliefs: perceived usefulness (PU) and perceived
7
ease of use (PEU) (Davis, 1989; Venkatesh & Davis, 2000). However, researchers have
incorporated certain additional variables into TAM to account for the lack of social factors and
consideration of other factors that could influence PU and PEU. In mobile phone research, for
instance, ease of use and anxiety about using a new medium (apprehensiveness) predicted both
extrinsic and intrinsic motivations of using mobile phone. Additionally, motivations as well as
social pressure predicted worked-related mobile phone use (i.e., the number of calls) (Kwon &
Chidambaram, 2000). In research focusing on wireless application protocol (WAP) -enabled
mobile phone use, attitude and social norms positively related to behavioral intentions, whereas
behavioral-control factors such as self-efficacy, mobile operator’s facilitation (i.e., increasing the
awareness of WAP-enabled mobile phones among users), and government actions (i.e.,
educating and facilitating new technology) had no effect on behavioral intentions (Teo & Pok,
2003). Regarding research on smartphone use, technical barriers negatively predicted behavioral
control and behavioral control and social norms positively predicted both perceived enjoyment
and perceived usefulness for mobile Internet service users. Both perceived enjoyment and
perceived usefulness positively predicted usage intentions for advanced mobile service users
(Verkasalo, Lopez-Nicolas, Molina-Castillo, & Bouwman, 2010). On the other hand, device
characteristics and user characteristics positively predicted PU and PEU but design did not
predict PEU (Kang, Cho, & Lee, 2011). However, those studies using TAM approaches include
inconsistent additional factors to explain mobile phone use.
Venkatesh, Morris, Davis, and Davis (2003) formulated the Unified Theory of
Acceptance and Use of Technology (UTAUT) to overcome the shortcomings of TAM by
integrating main competing user acceptance models including the following: The theory of
reasoned action (Fishbein & Ajzen, 1975), the technology acceptance model (Davis, 1989), the
8
motivational model (Davis, Bagozzi, & Warshaw, 1992), the theory of planned behavior (Ajzen,
1991), a model combining the technology acceptance model and the theory of planned behavior
(Taylor & Todd, 1995), the model of PC utilization (Thompson, Higgins, & Howell, 1994), the
diffusion of innovations paradigm (Rogers, 1995), and social cognitive theory (Bandura, 1986).
The UTAUT model includes four core determinants of technology adoption and use: (1),
performance expectancy, (2), effort expectancy, (3) social influence, and (4), facilitating
conditions. Research using UTAUT explored mobile phone adoption and use. The studies
consistently found that performance expectancy, effort expectancy, and social influence
explained mobile phone usage intentions, while facilitating conditions did not (see Carlsson,
Carlsson, Hyvonen, Puhakainen, & Walden, 2006; Park, Yang, & Lehto, 2007)
Meanwhile, TAM and UTAUT researchers argued for the influence of past experience
and habit in technology use as well. Prior experience of using similar technology was found to be
a significant factor. In particular, past experience with similar technology predicted PEU of a
new one (Agarwal & Prasad, 1996; 1999) and behavioral intention was strongly related to actual
information technology use for those who had prior experience with similar technology
compared to inexperienced users (Taylor & Todd, 1995). Furthermore, smartphone acceptance
research showed that adopters are more likely to have use intention when they believe the
technology is reliable and have confidence that the technology would be secure (Ally & Gardiner,
2012). The findings of Ally and Gardiner (2012) also supported the argument that prior
experience is an important factor in technology use since belief in functions of technology is
based on their experience, especially with a long-term and sustained interaction with the
technology in question (Kim, 2012).

9
Regarding what leads to actual technology usage behaviors, the assumption of TAM is
that technology use is determined by continuance intentions (Kim, 2012). However frequently
performed past behaviors were likely to become habitual (Kim, 2012; Quellette & Wood, 1998;
Wood, Quinn, & Kashy, 2002). In this respect, the effects of habits on actual media usage were
tested in various studies. In particular, habit (β = .53, p < .001) was a stronger predictor of actual
use than continuance intention (β = .11, p < .05) for mobile data services and applications (Kim,
2012).
UTAUT2 extended TAM and UTAUT by focusing on the consumer context including (1)
habit, which is defined as an automatic behavior; (2) hedonic motivations, which are
conceptualized as perceived enjoyment; and (3) price value, which is “consumers’ cognitive
tradeoff between the perceived benefits of the applications and the monetary cost for using them”
(Venkatesh et al., 2012, p. 161). In the context of mobile Internet technology use, the UTAUT
model explained additional variance in comparison to UTAUT, UTAUT2 (R2 = .44 for
behavioral intention and .35 for usage behavior, respectively). It was superior to UTAUT (R2 =
.35 of behavioral intention and .26 of usage behavior, respectively). Moreover, the findings of
Venkatesh et al. (2012) demonstrated a strong effect of habit on mobile technology use. Hedonic
motivations and price value positively predicted behavioral intension and habit directly and
positively predicted both behavioral intentions and use of mobile Internet technology. The
standardized path coefficient of habit (β = .32) was larger than the conventional UTAUT
variables (β = .21 for performance expectancy, β = .16 for effort expectancy, β = .14 for social
influence, and β = .15 for facilitating conditions, respectively) and new variables in UTAUT2 (β
= .23 for hedonic motivations and β = .14 for price value, respectively) also predicted behavioral
intentions.

10
Individual Differences. Other research focused on relationships among individual
differences and mobile phone use. Major individual difference factors include personality traits.
Correlations between the “Big Five” personality traits (i.e., extroversion, agreeableness,
conscientiousness, neuroticism, and openness to experience) and mobile phone use were tested in
various studies (e.g., Bianchi & Phillips, 2005; Butt & Phillips, 2007; Chittaranjan, Blom, &
Gatica-Perez, 2011). The common findings from those studies showed that extroversion was
positively related to spending more time on calling and texting whereas neuroticism was not.
Other individual difference variables such as age, self-esteem, and loneliness were found
to be significant predictors of uncontrolled mobile phone use (i.e., problematic mobile phone
use). For example, problematic mobile phone use was a function of age, extroversion, and low
self-esteem (Bianchi & Phillips, 2005). Age was negatively related to problematic mobile phone
usage whereas extraversion and low self-esteem positively predicted problematic use (Bianchi &
Phillips, 2005). Gender, self-monitoring (i.e., extroversion, acting, and directness), and approval
motivation (i.e., need for favorable evaluation from others) were significant positive predictors
of problematic mobile phone use (Takao et al., 2009). Loneliness did not predict problematic
mobile phone use, but it was related to overall mobile phone use. Overall, in problematic mobile
phone use studies, habit was the strong predictor: loneliness, need for cognition, arousal, and
habit positively predicted mobile phone “addiction,” defined in terms of negative life outcomes
and guilt, and habit was a stronger predictor than loneliness (Park. 2005).
Media Habits under Social Cognitive Theory. A third approach to explore mobile
phone use is based on self-regulative mechanism from SCT (Bandura, 2001). SCT was adapted
to explain media consumption by combining both conscious and non-conscious determinants of
media usage behavior (see LaRose, 2010; LaRose & Eastin, 2004; LaRose et al., 2003).

11
According to SCT, self-regulation describes the role of self-direction and forethought as humans
engage in long-range planning in pursuit of their goals. They do so through the sub-mechanisms
of self-observation, the judgmental process, and self-reaction (Bandura, 2001). Self-observation
is the process of monitoring one’s own behavior to provide diagnostic information about its
impact. These observations are then compared with relevant personal, social, or collective
standards through the judgmental process (LaRose, 2010). Behaviors that are observed and
judged to be inconsistent with those standards may be modified through self-reaction (control)
by applying self-generated rewards or punishments, as well as by responding to one’s self-
evaluations.
LaRose et al. (2001) extended self-regulation to situations in which self-observation and
self-control are ineffective in explaining the effect of habit on media use. Deficient self-
regulation is defined as the state in which the self-regulatory process becomes impaired and self-
control over media use is diminished (LaRose & Eastin, 2004). In the state of deficient self-
regulation, self-observation is deficient when individuals act without awareness of the expected
outcomes of their media-use behavior (LaRose, 2010).
In the context of mobile phone use, habit as a state of deficient self-regulation was a
significant and a stronger predictor of ongoing mobile phone use than expected outcomes (Peters,
2009) and deficient self-regulation related to loneliness and anxiety influenced mobile phone use
(Soror et al., 2012). Specifically, deficient self-observation predicted making a phone call and
sending Short Message Service (SMS) messages (Peters, 2009). The frequency of habitual
checking of a smartphone increased the overall amount of smartphone application use
(Oulasvirta, Rattenbury, Ma, & Raita, 2011).

12
What some call “media addictions” are habits with deficient self-reaction, which may
cause negative life outcomes (LaRose, 2013 in press). Scholars have argued that “addictions can
be habits (Graybiel, 2008; Marlatt, Baer, Donovan, & Kivlahan, 1988), but not all habits are
pathological addictions.” (LaRose, 2013, p. 20). Moreover, it is hard to find pathological cases of
media use among the normal populations from the previous media addiction studies. LaRose
(2013) found through a re-analysis of published data that interactive media induce low to
moderate levels of deficient self-regulation in surveys of problematic use among of normal
populations (e.g., Caplan, 2002). LaRose also argued that operational measures of addiction
parallel those of deficient self-regulation (LaRose, 2013). Compulsivity in the media addiction
literature is interchangeable with deficient self-reaction, which indicates lack of controllability in
automatic behavior (i.e., habits). Losing track of time spent on media use, tolerance and
withdrawal in the addiction literature are interchangeable with deficient self-observation
(LaRose, 2013). In this sense, mobile phone use in inappropriate situations while driving, in
class, or during a meeting certainly qualifies as a “bad” habit that annoys others and subjects
users to social and physical risks.
Included in this dissertation are different perspectives related to mobile phone use. Two
of them are seen in U&Gs studies, which focused on motivations for using mobile phones, and
TAM, which tested PU and PEU as determinants of mobile phone use. Included here is also a
discussion of UTAUT and UTAUT2, which are the extended versions of TAM. UTAUT2
seemed to have stronger power in terms of the amount of variance explained. Habit was the
strongest predictor of mobile technology use as well as behavioral intentions. The SCT approach
employing a dual process model focused on deficient self-regulation mechanisms and examined

13
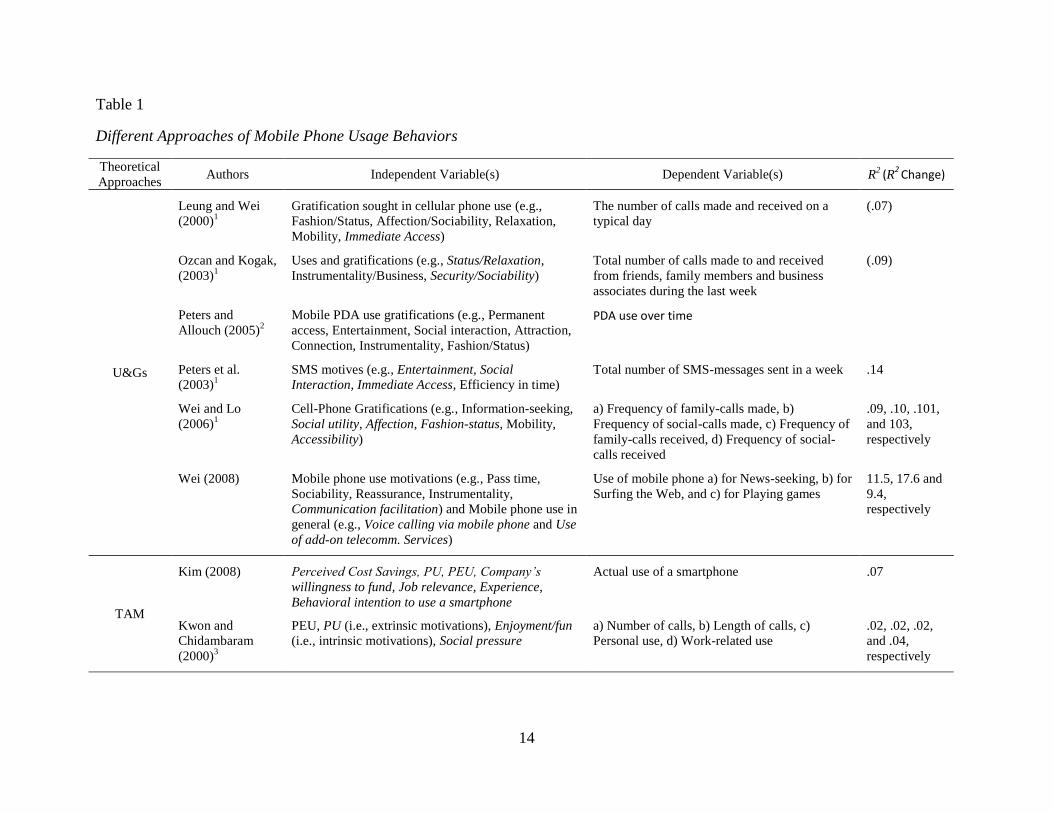
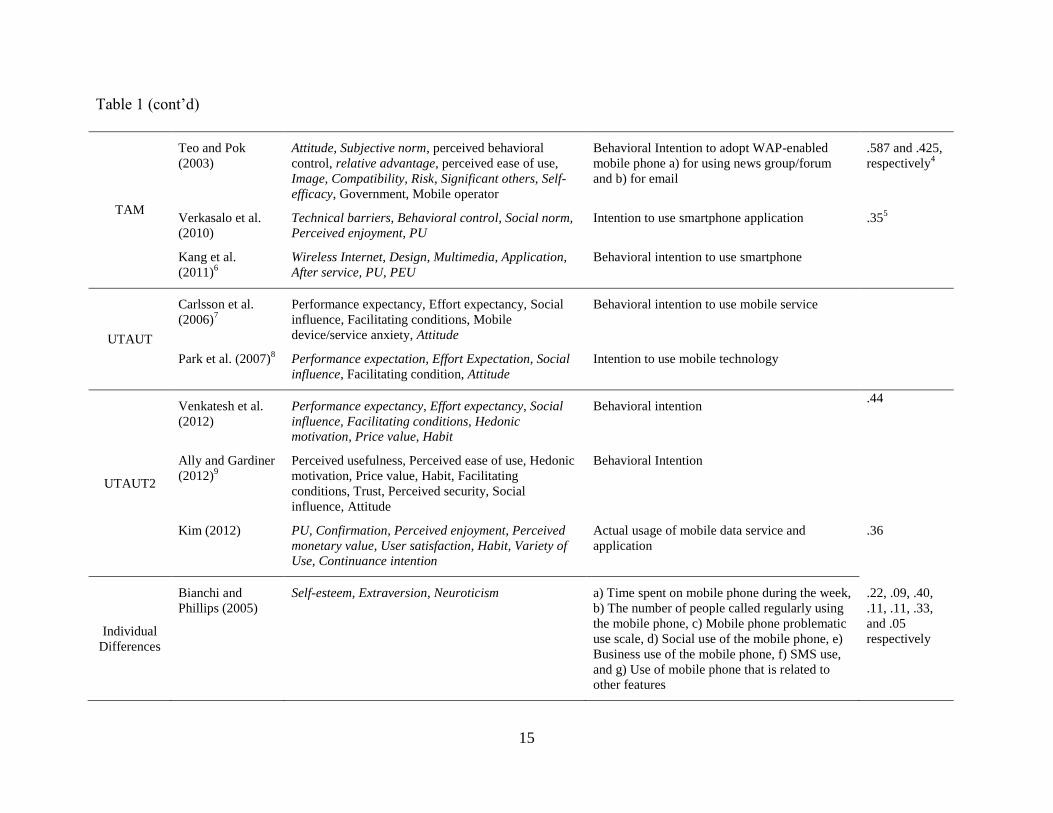
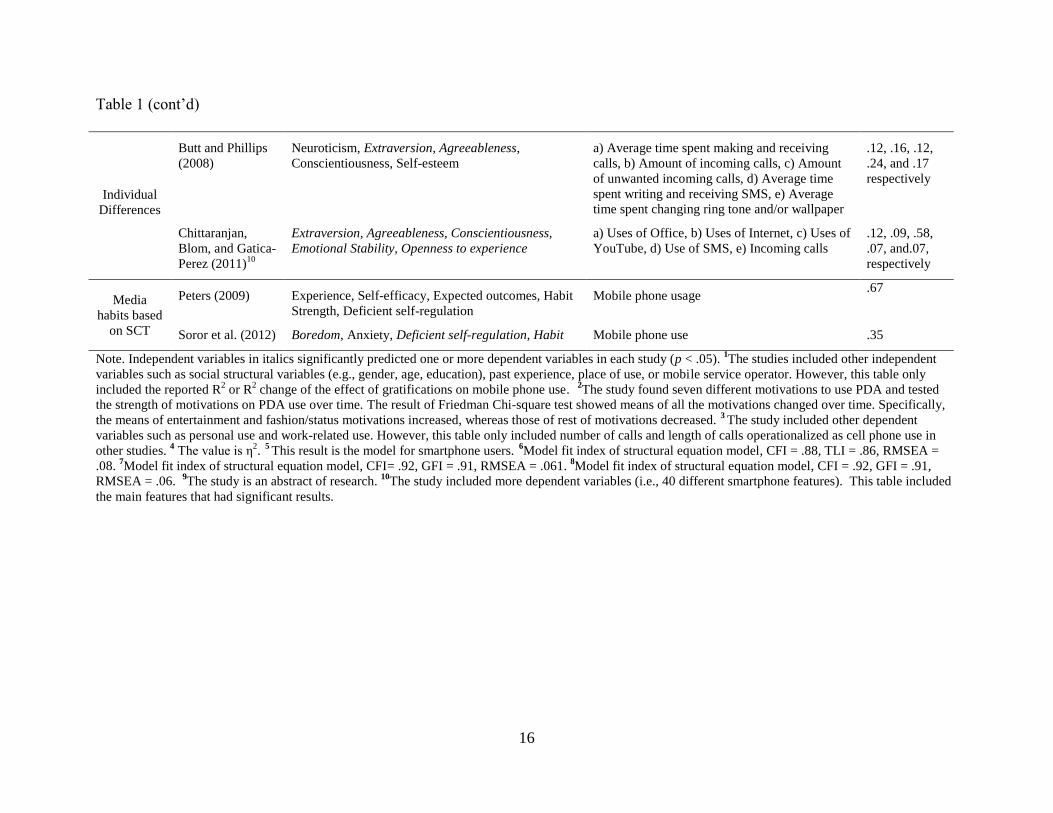
how habits work in media use. Table 1 lists different approaches of mobile phone usage behavior
and reports the variance explained by each model from the previous studies reviewed above.
Previous studies including habits as a variable showed more variance explained and
demonstrated that habit was a stronger predictor of media use than other motivational and social
factors, or individual differences (see Table 1). For this reason, this dissertation centers on the
effect of habit in mobile application use. The next section deals with definitions of habits and the
process of habit formation.
14
Table 1
Different Approaches of Mobile Phone Usage Behaviors
Theoretical
Approaches Authors Independent Variable(s) Dependent Variable(s) R
2 (R2
Change)
U&Gs
Leung and Wei
(2000)1
Gratification sought in cellular phone use (e.g.,
Fashion/Status, Affection/Sociability, Relaxation,
Mobility, Immediate Access)
The number of calls made and received on a
typical day
(.07)
Ozcan and Kogak,
(2003)1
Uses and gratifications (e.g., Status/Relaxation,
Instrumentality/Business, Security/Sociability)
Total number of calls made to and received
from friends, family members and business
associates during the last week
(.09)
Peters and
Allouch (2005)2
Mobile PDA use gratifications (e.g., Permanent
access, Entertainment, Social interaction, Attraction,
Connection, Instrumentality, Fashion/Status)
PDA use over time
Peters et al.
(2003)1
SMS motives (e.g., Entertainment, Social
Interaction, Immediate Access, Efficiency in time)
Total number of SMS-messages sent in a week .14
Wei and Lo
(2006)1
Cell-Phone Gratifications (e.g., Information-seeking,
Social utility, Affection, Fashion-status, Mobility,
Accessibility)
a) Frequency of family-calls made, b)
Frequency of social-calls made, c) Frequency of
family-calls received, d) Frequency of social-
calls received
.09, .10, .101,
and 103,
respectively
Wei (2008) Mobile phone use motivations (e.g., Pass time,
Sociability, Reassurance, Instrumentality,
Communication facilitation) and Mobile phone use in
general (e.g., Voice calling via mobile phone and Use
of add-on telecomm. Services)
Use of mobile phone a) for News-seeking, b) for
Surfing the Web, and c) for Playing games
11.5, 17.6 and
9.4,
respectively
TAM
Kim (2008) Perceived Cost Savings, PU, PEU, Company’s
willingness to fund, Job relevance, Experience,
Behavioral intention to use a smartphone
Actual use of a smartphone .07
Kwon and
Chidambaram
(2000)3
PEU, PU (i.e., extrinsic motivations), Enjoyment/fun
(i.e., intrinsic motivations), Social pressure
a) Number of calls, b) Length of calls, c)
Personal use, d) Work-related use
.02, .02, .02,
and .04,
respectively
15
Table 1 (cont’d)
TAM
Teo and Pok
(2003)
Attitude, Subjective norm, perceived behavioral
control, relative advantage, perceived ease of use,
Image, Compatibility, Risk, Significant others, Self-
efficacy, Government, Mobile operator
Behavioral Intention to adopt WAP-enabled
mobile phone a) for using news group/forum
and b) for email
.587 and .425,
respectively4
Verkasalo et al.
(2010)
Technical barriers, Behavioral control, Social norm,
Perceived enjoyment, PU
Intention to use smartphone application .355
Kang et al.
(2011)6
Wireless Internet, Design, Multimedia, Application,
After service, PU, PEU
Behavioral intention to use smartphone
UTAUT
Carlsson et al.
(2006)7
Performance expectancy, Effort expectancy, Social
influence, Facilitating conditions, Mobile
device/service anxiety, Attitude
Behavioral intention to use mobile service
Park et al. (2007)8 Performance expectation, Effort Expectation, Social
influence, Facilitating condition, Attitude
Intention to use mobile technology
UTAUT2
Venkatesh et al.
(2012)
Performance expectancy, Effort expectancy, Social
influence, Facilitating conditions, Hedonic
motivation, Price value, Habit
Behavioral intention .44
Ally and Gardiner
(2012)9
Perceived usefulness, Perceived ease of use, Hedonic
motivation, Price value, Habit, Facilitating
conditions, Trust, Perceived security, Social
influence, Attitude
Behavioral Intention
Kim (2012) PU, Confirmation, Perceived enjoyment, Perceived
monetary value, User satisfaction, Habit, Variety of
Use, Continuance intention
Actual usage of mobile data service and
application
.36
Individual
Differences
Bianchi and
Phillips (2005)
Self-esteem, Extraversion, Neuroticism a) Time spent on mobile phone during the week,
b) The number of people called regularly using
the mobile phone, c) Mobile phone problematic
use scale, d) Social use of the mobile phone, e)
Business use of the mobile phone, f) SMS use,
and g) Use of mobile phone that is related to
other features
.22, .09, .40,
.11, .11, .33,
and .05
respectively
16
Table 1 (cont’d)
Individual
Differences
Butt and Phillips
(2008)
Neuroticism, Extraversion, Agreeableness,
Conscientiousness, Self-esteem
a) Average time spent making and receiving
calls, b) Amount of incoming calls, c) Amount
of unwanted incoming calls, d) Average time
spent writing and receiving SMS, e) Average
time spent changing ring tone and/or wallpaper
.12, .16, .12,
.24, and .17
respectively
Chittaranjan,
Blom, and Gatica-
Perez (2011)10
Extraversion, Agreeableness, Conscientiousness,
Emotional Stability, Openness to experience
a) Uses of Office, b) Uses of Internet, c) Uses of
YouTube, d) Use of SMS, e) Incoming calls
.12, .09, .58,
.07, and.07,
respectively
Media
habits based
on SCT
Peters (2009) Experience, Self-efficacy, Expected outcomes, Habit
Strength, Deficient self-regulation
Mobile phone usage .67
Soror et al. (2012) Boredom, Anxiety, Deficient self-regulation, Habit Mobile phone use .35
Note. Independent variables in italics significantly predicted one or more dependent variables in each study (p < .05). 1The studies included other independent
variables such as social structural variables (e.g., gender, age, education), past experience, place of use, or mobile service operator. However, this table only
included the reported R2 or R
2 change of the effect of gratifications on mobile phone use.
2The study found seven different motivations to use PDA and tested
the strength of motivations on PDA use over time. The result of Friedman Chi-square test showed means of all the motivations changed over time. Specifically,
the means of entertainment and fashion/status motivations increased, whereas those of rest of motivations decreased. 3 The study included other dependent
variables such as personal use and work-related use. However, this table only included number of calls and length of calls operationalized as cell phone use in
other studies. 4 The value is η
2. 5
This result is the model for smartphone users. 6
Model fit index of structural equation model, CFI = .88, TLI = .86, RMSEA =
.08. 7Model fit index of structural equation model, CFI= .92, GFI = .91, RMSEA = .061.
8Model fit index of structural equation model, CFI = .92, GFI = .91,
RMSEA = .06. 9The study is an abstract of research.
10The study included more dependent variables (i.e., 40 different smartphone features). This table included
the main features that had significant results.

17

18
Acquiring Media Habits
Although the debate continues over how habits should be conceptualized and
operationalized (LaRose, 2010; 2013), scholars generally agree that “habits are acquired through
incremental strengthening of the association between a situation (cue) and a behavior” (Lally et
al., 2010, p. 998). Furthermore, researchers have suggested the automaticity with which a
behavior is performed when the cue is encountered is the key characteristic of habitual behaviors.
Verplanken and Melkevik (2008) defined habit as a form of automaticity in responding that
develops as a person repeats a particular behavior in stable contexts. Wood and Neal (2007)
stated that “habits are sub-served by a form of automaticity that involves the direct association
between a context and a response but that interfaces with goals during learning and performance”
(p. 843). Habit has three central aspects: (a) repetition of behavior, (b) automaticity of behavior,
and (c) contextual cues (Verplanken, 2006; Wood & Neal, 2007). Habit can be characterized as a
form of automaticity that involves the association of a cue and a response (Hull, 1943; Lally,
Jaarsveld, Potts, & Wardle, 2010; Ouellette & Wood, 1998).
Current perspectives of habits identify themselves as examples of automaticity
(Verplanken & Orbell, 2003; LaRose, 2010). A dual process model supports this perspective.
When people first decide to perform a certain behavior, they might go through a phase in which
the behavior has to be carefully planned and incorporated into existing routines. During this
phase, the decision to perform the behavior is likely to be made consciously and deliberately.
However, once the behavior has been satisfactorily established as part of the individual’s
everyday routine, the behavior in this phase is carried out repeatedly without necessarily forming
a conscious intention to perform it. Such behavior is characterized by a lack of awareness and
mental efficiency, and, possibly, difficulty in controlling the behavior. This is called a habit.

19
Such an automatic and routinized activity involves a restructuring of cognitive tasks with more
efficient cognitive algorithms (Saling & Phillips, 2007). In other words, as a frequently repeated
and automatic behavior, a habit achieves cognitive efficiency by protecting individuals from
being overwhelmed when processing information related to routine activities (LaRose, 2010;
Limayem et al., 2007; Verplanken & Melkevik, 2008). Whereas new or infrequent behavior
requires mental effort and conscious thinking, less energy is required—in terms of mental effort
and conscious thinking—when a behavior is continually repeated. Automaticity in a behavior
can be detected in people using some or all of the following features: mental efficiency, lack of
awareness, lack of conscious intention, and difficulty controlling the behavior (Bargh, 1994;
Bargh & Ferguson, 2000). By defining habit as a form of automaticity, one can understand how
uncontrolled less conscious behavior is executed.
Then, what is the role of cues in habits? When looking at how habits are formed, one can
understand how scholars defined habits as behaviors that are cued. Neuroscientists explain habits
by stimuli-response (S-R)/reinforcement theory. That is, “all behavior is elicited by some
antecedent stimuli from the external environment, and that the consequence of behavior, by
providing satisfaction or dissatisfaction to the organism, merely reinforces or weakens the S-R
association” (Yin & Knowlton, 2006, p. 465). The consistent conclusion of neurological research
on habits is that instrumental behaviors are controlled by either the goal-directed (action-
outcome) system or the S-R system, where goal-directed actions are shifted to S-R habits by the
function of the basal ganglia (Ashby, Turner, & Horvitz, 2010; Yin & Knowlton, 2006). Hull
(1943) stated that habit strength reflects the extent to which a behavior was reinforced in the past.
In this sense, habit formation is a function of repetition when reinforcements are received for
performing the behavior upon encountering a cue (Lally et al., 2010). Research has shown that

20
behavior becomes habitual when it is over-trained and over-learned (i.e., degrading the
contingency between an action and reward has no effect on performance). Thus, one can perform
an action not to earn rewards but as a response to external stimuli (LaRose, 2010; Yin &
Knowlton, 2006). In this case, immediate reinforcement is no longer needed as long-run average
outcome expectations take over immediate reinforcement (LaRose, 2010).
Concerning factors that influence habit formation, there are debates over the effect of
goals and internal cues versus those of external cues. Some scholars focused on the effect of
internal cues on habit and argued that habitual media use is goal or motive-directed rather than
externally cue-directed (e.g., Neal, Wood, Wu, & Kurlander, 2011). Their argument is that goals
are the driving force in the initial stage of habit formation as people repeat particular actions to
fulfill their expected outcomes (Neal et al., 2011). In this sense, media use may be initially
thought of as an active, controlled process under the conscious control of the user (LaRose,
2010). As time passes with repetition of media use, there are opportunities for active, volitional
behaviors to become automated to free up mental resources for other tasks (LaRose, 2010;
LaRose et al., 2003). As a result, initial goals, such as the gratifications that individuals initially
seek when sampling new media content, lose their influencing power on habitual behaviors
(Triandis, 1979) and behaviors are cued by recurring contextual cues (Neal et al., 2011;
Limayem et al., 2007; Verplanken & Wood, 2006). Hence, the term “force of habit,” as if
appearing externally or automatically, may be aptly titled.
However, the operationalization of habit was inconsistent. One party operationalized
habit as the frequency of past behavior rather than the automaticity of behavior (Ouellette and
Wood, 1998). However, using frequency of past behavior for habit measures was criticized by
other scholars who argued that frequently repeated behaviors could have been controlled by

21
conscious goals on each repetition (Ajzen, 2002; LaRose, 2010). Moreover, the findings studying
frequency of past behavior could not provide clear evidence of automaticity in behaviors. Habit
strength did not have a linear relationship with frequency of behavior performance; rather, it
displayed an asymptotic curve (Lally et al., 2010). The findings indicated that habit strength was
unlikely to further increase after it was formed (Verplanken et al., 2005; Yin & Knowlton, 2006).
This finding violated the assumption that frequency of past behavior indicates habit strength. In
this respect, recent scholars have focused on automaticity in habitual behaviors.
Regarding the factors evoking habitual behaviors, some empirical studies have shown
that both internal states, such as goals, motives, or mood, and external cues (e.g., physical
location, time, or people) influenced habitual behaviors. Mood has been found to be related to
habitual fast food purchases, watching television news, and riding the bus. For these three habits,
the external cues of physical location, time, and people are related (Ji & Wood, 2007). External
events or situations (i.e., attending a lecture, taking a bus trip, and being at home) and internal
states (i.e., expected outcomes such as killing time) are related to smartphone usage habits
(Oulasvirta et al. 2011). Another study examined an eating behavior (i.e., popcorn eating) and
found that the habit was not related to current motivational states (e.g., hunger) but was
performed rigidly in the recurring context associated with frequent past consumption (i.e., a
movie theater) (Neal et al., 2011).
However, there are relatively fewer studies on the effect of external cues than those
focusing on internal cues, especially regarding media use. Specifically, in mobile phone use, the
notification function may provide these external cues. This dissertation tests how external cues
(in this case, push notifications) influence habit and media use. The next section addresses the
role of external cues in habits and discusses their effects in media use.

22
Effects of External Cues on Media Habits
Little has been said regarding how media features with external cues may influence the
formation of habit connected to media use. Media technology design and artifact studies have
focused on improving external triggers (Barkhuus & Dey, 2003) and many researchers have
studied the role of external cues in habits. Scholars have argued that external cues that elicit
specific responses form habits (Guinea & Markus, 2009; Markus, 2005; Markus & Silver, 2008;
Wood & Neal, 2007; Verplanken & Wood, 2006) in that a conditioned response where the
stimulus is provided by the environment and the responses always follow relatively immediately
upon the presentation or incidence of the stimulus (Watson, 1919, p.10).
According to Fogg’s (2009a) behavioral model, not only habits but also all behaviors
need three factors to be performed: (1) sufficient motivation, (2) sufficient ability, and (3)
effective trigger. Fogg emphasizes that people should have these all three factors at the same
instant to perform a behavior. In habitual behaviors, people already and fully have the first two
factors; for them, the role of the third factor, triggers, is critical. According to his behavior
model, the trigger, defined as “something that tells people to perform a behavior now” (p. 5)
must be present to occur with sufficient motivation and sufficient ability to perform a target
behavior (Fogg, 2009). Fogg (2009a) specified three types of triggers: (1) spark, (2) facilitator,
and (3) signal. A spark is a type of trigger that can leverage motivational elements such as
pleasure, hope, or social acceptance. The second type of trigger is a facilitator, which can make
people with high motivation and no ability perform a target behavior. A facilitator tells people
the target behavior is easy to do. The last type of trigger is a signal. This trigger works as a
reminder; thus, it works best for people with relatively high motivation and the ability to perform
a target behavior.
23
Wood and Neal (2007) asserted that “context cues refer broadly to the many elements of
the performance environment that potentially can recur as actions are repeated, including
physical locations, other people, and preceding actions in a sequence” (p. 845). Thus, external
cues can directly activate a previously learned performance, especially overlearned, habitual
behavior. Regarding the role of external cues in habit acquisition and performance, Wood and
Neal (2007) suggested two types of cuing: direct cuing and motivated cuing. Direct cuing
emerges from simple, direct context-response associations that develop from repeated co-
activation of the context and response. Thus, when directly cued, habits are represented in
memory (Wood & Neal, 2007), where “direct cuing involves the cognitive neural changes that
result from repeated co-activation of responses and context” (p. 845). This direct cuing can be
found in classical conditioning. In Pavlov’s (1927) experiments, after the repeated association
with a ringing bell and food, the ringing bell became a conditional stimulus that caused the dog
to salivate. As classical conditioning shows, habit is consistently activated in conjunction with
representation of a context (e.g., hearing a bell ringing), and the association between the habit
and the context is gradually formed through repetition (Wood & Neal, 2007).
Motivated cuing emerges from the value of the rewarding experiences associated with
past contexts and responses (Wood & Neal, 2007). The external cues are contiguous with a
rewarded response and the reward value becomes conditioned onto the cues. As in direct cuing,
sufficient repetition between the cues and the rewarded response is required in order for the habit
to be formed. As a result, the cues themselves have the power to motivate the response because
they signal an opportunity to acquire the associated reward (Neal, Wood, & Quinn, 2006; Wood
& Neal, 2007). Therefore, direct cuing and motivational cuing are related to each other rather

24
than mutually exclusive since it is possible that motivational cuing can enhance the cue-response
association within direct cuing (Wood & Neal, 2007).
Fogg’s three types of triggers and Wood and Neal’s direct vs. motivating cues share the
idea that external cues are a critical booster to make people perform a target behavior by by
reminding them it is time to perform it. More importantly, when the association between cues
and a target behavior is developed, the target behavior becomes an automatic response to the cue
and motivation and ability are no longer relevant. Habits of eating, drinking or exercising
behavior could be formed in response to a salient cue (e.g., the next activity in a habitual
morning routine after one finishes breakfast) as an automatic response to the cue (Lally et al.,
2010).
However, unlike other habitual behaviors, such as exercising, eating, smoking, or
drinking (e.g., Lally et al., 2012), there are only few studies testing the effect of external context
cues on habitual media use and their findings are conflicting compared to other behavioral
domains. Specifically, in those studies external context cues were conceptualized as context
stability focusing on the interruption or instability of a setting. For example, Newell (2003)
examined the effect of environmental stability as a contextual cue on the habit of media choice
with Verplanken and Orbell’s (2003) Self Reported Habit Index (SRHI), which measures
automaticity and ability of behavior control. Newell’s (2003) study borrowed Ouellette and
Wood’s (1998) concept of the stability of the environment by focusing on the interruption or the
instability of a setting rather than specific elements of environmental influence on habitual
behavior. “Tonight was a typical weeknight for me” was the only indicator of stability. Habit
was correlated to media choice but there was no moderating effect of stability. When the
contexts of newspaper and television viewing habits were disrupted, the effect of context
25
stability was more significant for those who had weak habits than strong habits in media use
(Wood, Tam, & Witt, 2005). However, Ajzen’s (2002) analysis revisited the findings of Ouelette
and Wood (1998) concerning the role of context stability for the habit of television viewing.
Consistent with Newell (2003), the difference in the correlation of past behavior to future
behavior between consistent contexts and inconsistent contexts was not statistically significant.
Overall, the effect of external cues on media habits still remains a question since there are few
empirical studies testing it and previous findings are conflicting in part because of inconsistent
operationalization of habit and external cues, and unreliable self-reported measures of contextual
cues. Also, media habits were not solely reliant on context stability for their performance; rather,
they “may be elicited by a wider range of stimuli (LaRose, 2010, p. 206)”.
To date, the existing literature has not addressed the potentially powerful role that
external media prompts may have in guiding media users to respond to their devices. In essence,
such prompts, as stimuli, may affect conditioned responses unless users make serious usage
errors or the technology fails (Guinea & Markus, 2009). Like those contained in stabile real
world environments environment, external media prompts given by media technologies (e.g.,
sounds, notifications or visual cues) are direct cues for the performance of a consistent activity
just prior to usage behavior. As technology develops, scholars have focused on the effects of
interactive technologies on people’s attitudes and behavior changes. Specifically, they have
suggested the role of external media prompts in various situations such as learning, shopping,
and media using. For instance, especially in social media use, Fogg (2009b) speculated that
repeated and continued behaviors cued by Facebook use include users’ poking back friends,
reading others’ posts, joining an event, responding to friend’s post, and sending birthday
messages. Fogg speculated that Facebook users developed certain usage habits through
26
responding and associating cues and the behaviors. In this sense, this dissertation proposes that
push notifications in smartphone applications can be the salient external cues that stimulate
media use and activate media habits..
The next section will provide explanation of what push notifications and how it works in
forming habits of smartphone use.
Push Notifications and Habits of Media Use
Push notification service is a popular functionality provided by almost all data-enabled
mobile phone platforms, especially smartphones. The mobile applications, which send push
notifications, are usually Internet-based and use the push technology to actively send information
to the users who install the applications, even when the installed application is currently not
running (Edmunds & Morris, 2000; Xu & Zhu, 2012). To send a notification, the sending
application first prepares a notification object and registers a trigger event for it. Mostly, trigger
events include information updates. When the trigger event occurs, the notification fires.
Depending upon the user profile or handling function defined in the installed application, the
pushed data may or may not be displayed directly on the screen (Xu & Zhu, 2012; Zakaria,
2003).
In use of mobile phone for texting and calling, push notifications have been found to be
used in decision making process by users because push notifications provide the initial
information about the sender of text messages or calling. Research found that people first
determine who is calling them or sending text message to them before responding, especially in
inappropriate situations such as while driving (Walsh, White, Hyde, and Watson, 2008). In other
research regarding mobile phone use in the workplace, people first check the sender of text
messages, evaluate the importance of him or her in their relationship, and then decide whether to

27
ignore the messages or respond to them (Fischer et al., 2010; Grandihi & Jones, 2010).
Then, how are push notifications, as external media prompts, related to mobile
application usage behaviors? In particular, when considering the fact that use of mobile
technology (i.e., mobile phone use and mobile data service and application use) was found as a
habit (e.g., Peters, 2007; Soror et al., 2012; Venkatesh et al., 2012), how do push notifications
influence habit formation and habitual usage behavior of mobile applications?
Compared to other external cues such as location or time, push notifications might more
directly influence the shift from a goal-directed action to an uncontrolled, habitual one. As the
application continues sending push notifications and the user repeatedly responds and uses the
application, the notifications initiate application usage behavior, the launching of the application,
and cause automatic behavior as a result of repeated association: push notifications precede the
launching of the application. The process of habit formation through push notifications is the
shift from goal-directed actions to S-R habit. Goal-directed action is involved as users launch the
application through clicking the first notifications they receive to get new information, which is
the initial goal of using the application, while the new information works as the reward. However,
as this application usage behavior is performed repeatedly in response to notifications, the users
automatically respond to the notifications even when they are not in appropriate situations, such
as while driving or attending a meeting, or when the information has not immediate reward value,
showing S-R habit. After the application usage habit forms, the action is not goal-directed
anymore and the initial goal of using the application is long forgotten. Also, the reward becomes
no longer effective. This indicates that automatic response to push notifications would precede
automatic application visiting behavior. Then, are push notifications as media prompt salient and

28
active cues to lead growth in habit strength and in turn, lead application use? Based on this
discussion, this dissertation proposes the following hypotheses.
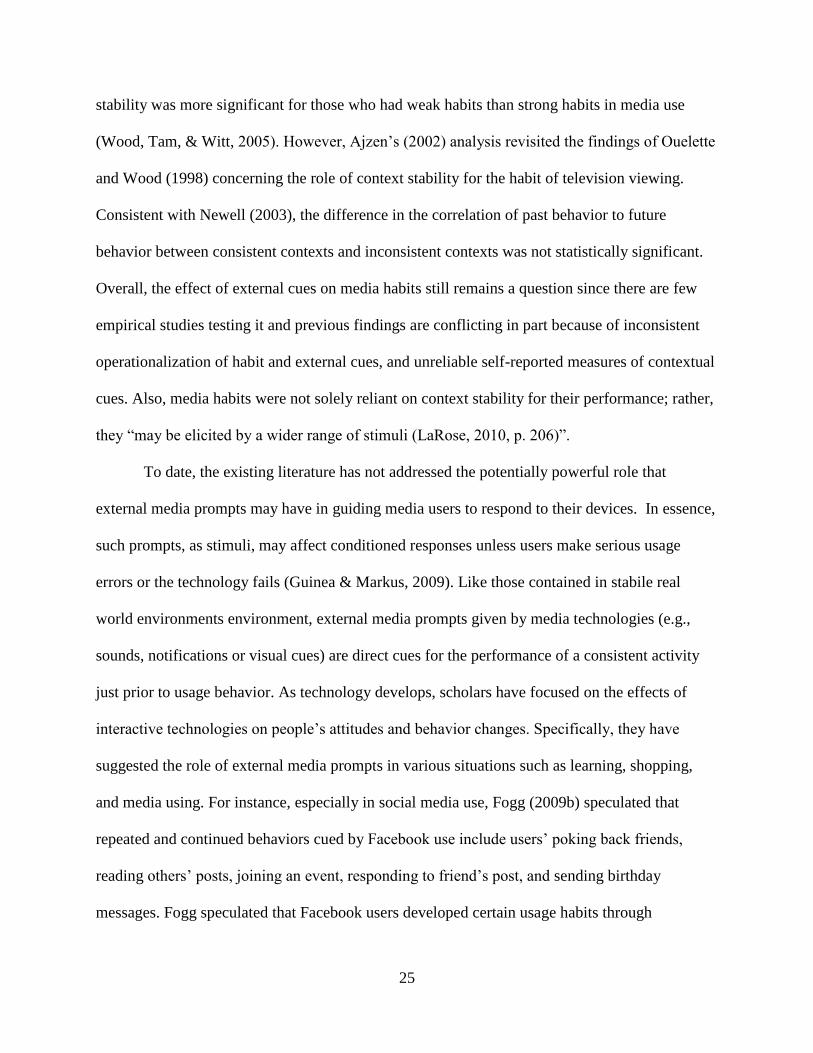
H1a: Users who receive push notifications from a mobile application will have higher
levels of habit strength for overall mobile application visitation than those who do not
receive notifications.
H1b: Users who receive push notifications from a mobile application will visit the
application more frequently than those who do not receive push notifications.
Relationship between Habits and Media Use
In testing the relationship between habit and media use, there are two approaches
(Tokunaga & Rains, 2010). The first approach suggests that underlying psychological problems
make people use media and that the amount of time spent using media causes the habit. The logic
is that the deeper the psychological problems that individuals have, the less they can regulate
their behavior (e.g., Chou & Hsiao, 2000; Young, 1998). The second perspective suggests that
habits influence one’s behavior; the less ability audiences have to control their behavior, the
more they use media (e.g., LaRose & Eastin, 2004; LaRose et al., 2003; Soror et al., 2010).
For the former approach just mentioned, researchers characterize uncontrolled and
problematic media use as a clinical pathology (e.g., Chou & Hsiao, 2000; Hur, 2006; Jenaro et
al., 2007; Koo, 2010; Young, 1998) and conceptualize uncontrolled media use as a psychological
dependence marked by the increased investment in media usage activities (Tokunaga & Rains,
2010). This pathological approach suggests psychosocial problems as antecedent to the
relationship between habit and media use. That is, psychosocial problems may contribute to
people spending more time using media and later becoming unable to control behavior. In this
respect, this approach proposes that individuals use media more and more to mitigate or cope
with the ill effects of their psychosocial problems, such as social anxiety, loneliness and
depression, which can lead to uncontrolled media use. Therefore, uncontrolled media use may

29
require clinical or professional intervention to remedy the problem called “media addiction”
(Young, 1999; Tokunaga &Rains, 2010).
Arguing that media addiction cannot be applied to all uncontrolled media use, LaRose
and his colleagues consider uncontrolled media use as a marker of deficient self-regulation
(LaRose, 2010; LaRose & Eastin, 2004; LaRose et al, 2003). The rationale for viewing
uncontrolled mobile phone use differently from other behavioral addictions, such as problem
gambling, is that it can be hard to pinpoint uncontrolled media use since almost everyone has a
mobile phone and uses it regularly. It would be difficult to find cases where people experienced
serious negative life outcomes among normal populations due to uncontrolled and excessive
mobile phone use, such as, say, losing a job, a marriage, or a position in school. LaRose et al.
(2003) recognized deficient self-regulation as both habitual and impulsive behaviors, one of the
main characteristics of which is loss of control. This perspective proposes that the loss of self-
control or insufficient self-regulation results in increased media consumption. Thus, from this
perspective, psychosocial problems impair successful self-regulation associated with media use
and uncontrolled media use results in increased time spent on media consumption through the
formation of habits (LaRose et al., 2003; Schaeffer, Hall, & Vander Bilt, 2000; Tokunaga &
Rains, 2010).
To test this relationship between habit and media use in the context of problematic
Internet use (PIU), Tokunaga and Rains (2010) conducted two path analyses using weighted
mean correlations among the variables (i.e., habit1, time on the Internet, and psychosocial
1 Tokunaga and Rains (2010) operationalized PIU as failure to control Internet use, withdrawal
symptoms, and substitution of face-to-face social interaction, so this dissertation refers to failure
to control as habit.

30
problems) derived from meta-analysis. The habit model, the latter model, was supported but the
pathology model was not. This indicates that habit can explain media use. But their data still had
serious limitations. Since the analyses of Tokunaga and Rains (2010) were based on the cross-
sectional data, their results cannot conclusively demonstrate the direction of the causal
relationship between habits and media use. Tokunaga (2013) used a time series analysis similar
to the present dissertation but examined general Internet use rather than the role of push
notification cues.
Researchers have used the deficient self-regulation approach to test the relationship
between habit and mobile phone use. Peters (2009) found that deficient self-regulation, deficient
self-observation2 in particular, predicted making a phone call and sending Short Message Service
(SMS) messages. Soror et al. (2012) also found deficient self-regulation affected mobile phone
use. Habitual checking on a smartphone increased the use of a smartphone application
(Oulasvirta et al., 2011). In Billieux’s (2012) pathways of problematic mobile phone use, a lack
of control influenced mobile phone use.
The third possibility of the causal direction between habit and media use is reciprocal
causation. For instance, when people feel lonely or depressed, they use media such as Internet or
mobile phones (Caplan, 2002, 2003; Davis, 2001) and their self-regulation ability may become
deficient (Soror et al., 2012). This deficient self-regulation increases time spent on media causing
negative consequences in their lives, and in turn, exacerbates psychosocial problems. And again,
to compound the effect, increased time spent on media inhibits self-regulation ability.
2 In the original articles by Peters (2009), the authors referred to deficient self-observation as
habit strength.
31
A fourth possibility in the causal direction between habit and media use is that both the
pathological approach and deficient self-regulation approach are correct and that the direction
depends upon the phase of habit formation (LaRose, 2013). The process of habit formation is
described as shifting from goal-directed actions to S-R habits. If we focus on the shifting process
causing severe negative life consequences, the pathological approach may be able to explain
more variance in the relationship between habit and media use. The pathological approach
suggests that increased media use causes media habits, which indicates that the goal-directed
media use (i.e., to escape from reality or to get social support) becomes automatic and
uncontrolled through repetitive media use. If we are interested in continually excessive media
use and how S-R “habit” works in such an ongoing scenario, the deficient self-regulation
approach may provide a clear explanation for the causal direction between habit and media use.
The assertion with the deficient self-regulation approach is that different levels of habit strength
lead to different levels of media use for those where the habit is preexisting. The important
emphasis of this approach allows researchers more insight into the mechanics of habits, or, to
understand better how habits “work” as well as how they are formed.
Unlike actions such as running a mile every day or drinking water after breakfast (Lally
et al., 2012), there is no specific study to show the causal relationship between habit and media
use. Previous studies are based on cross-sectional survey data, which does not validly establish
the direction of the causal relationship between them. Although media use seems to involve
repetitive behavior (e.g., watching television and surfing the Internet), the contents the users
consume dynamically and constantly change. Therefore, there has been debate about whether
habit causes media use or vice versa. Based on the argument of the relationship between habit
and media use, this dissertation proposes the following hypotheses.

32
H2a: Habit strength for mobile application visitation will positively predict the frequency
of mobile application visits.
H2b: Overall habit strength for mobile application visitation will positively predict the
duration of visits to the mobile application.
To fully understand the above-mentioned association, it is worth considering how media
use was conceptualized in previous studies. Those focusing on mobile phone use, used frequency
as a measure of media use (e.g., Peters, 2009; Soror et al., 2012). Perhaps, differences in the
physical settings of Internet use, mainly with desktop versus mobile phone use along with what
content users seek from each medium, influence the patterns of media usage behaviors. Although
media habits predicted both duration and frequency and accumulated frequent visits might
contribute to longer durations in media use, no research exist that examines the hidden
differences between duration and frequency. In this respect, the following research question is
proposed to explore the association between frequency and duration in media use.
RQ1: Will frequency of application visits positively predict the average duration of
application visits on mobile applications?
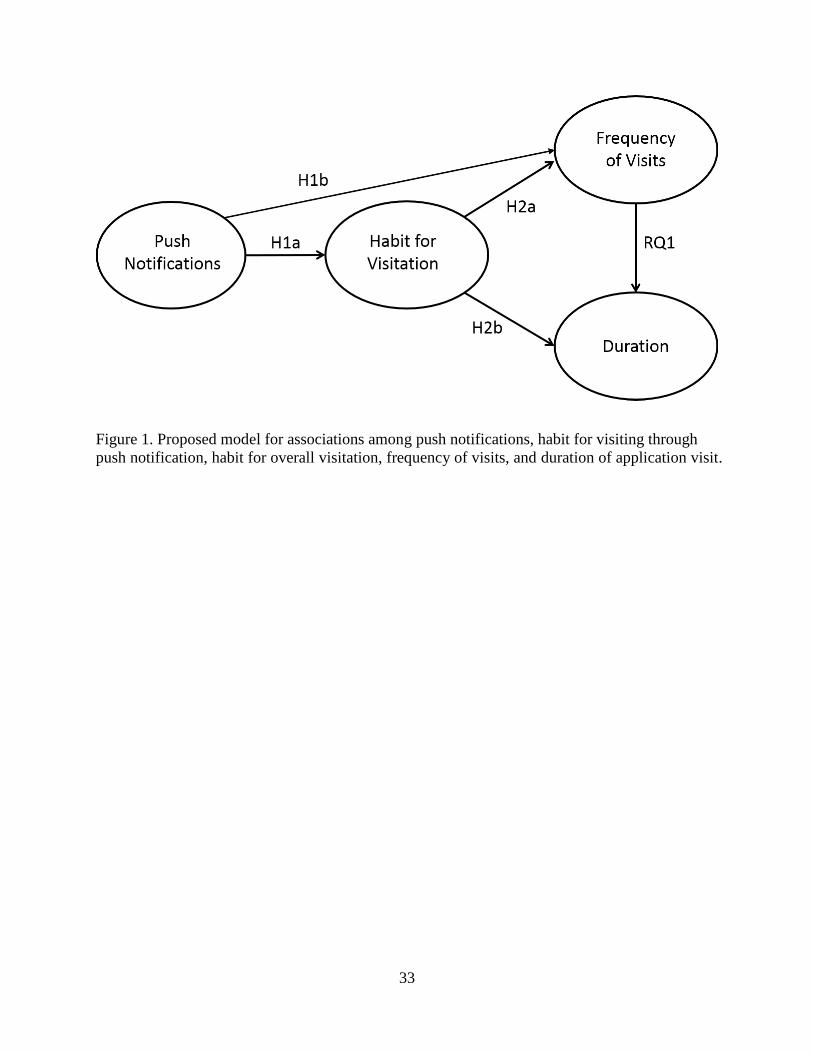
33
Figure 1. Proposed model for associations among push notifications, habit for visiting through
push notification, habit for overall visitation, frequency of visits, and duration of application visit.

34
METHOD
The aim of this dissertation is to investigate how push notification alerts influence mobile
application habits and application use as well as the causal direction of the relationship between
habit strength and application use.
Research Design and Instrumentation
To explore how external media prompts (push notifications) influence habit formation
and application visiting behavior as well as duration using the application, a weather forecast
application was developed for this dissertation. The application, Weather Story, provided current
weather information such as temperature, humidity, weather condition (e.g., sunny, cloudy,
rainy, or snowy), and a three-hour weather forecast on the front page. On the second page, it
provided a three-day weather forecast including highest temperature, humidity, and overall
weather conditions. The weather information was sourced through the free website, Weather
Underground (www.wundergroud.com). Weather Story was developed for smartphones running
either iOS and could be installed on any version of the iOS system (iOS 3, 4, 5, or 6) as well as
the Android operating system supported by all versions from 2.2 through 4.0.1. See Figure 2 and
3 for depictions of the Weather Story.

35
Figure 2. Depiction of the Weather Story application’s front page on iPhone (left) and Android
phone (right)
Figure 3. Depiction of the Weather Story application’s second page on iPhone (left) and Android
phone (right)

36
To test the effects of push notifications on habits and application usage behaviors, two
different versions of Weather Story were developed: one provided push notifications by sending
notification alerts and the other did not. Concomitantly, this study involved two groups: (1), the
push group receiving notification alerts from Weather Story, and (2), the non-push group not
receiving alerts. Participants were randomly assigned to either group.
To examine the relationship between habit strength and application usage behaviors,
habit strength and behaviors were measured for 20 days. Prior research found that people
developed new habits and strengths of the habits stabilized at a constant level around 20 days
after starting doing the actions (Lally et al., 2010).
During the training session, participants were informed that the researcher was interested
in users’ experience in mobile application and they were asked to use Weather Story for 20 days
and complete four surveys throughout their participation in this study to get $20 incentive. Both
push group and non-push group were instructed how to install and use Weather Story on their
smartphones in the training session led by the researcher. The push group was asked to enable
the push notification function on their phone settings and shown how the push notifications
would work by the researcher. All participants were asked to use Weather Story rather than any
other weather applications during the study.
This dissertation combined time and event cues in the form of external cues generated by
a smartphone. Participants in the push group received notification alerts at different times
between 9 a.m. and 9 p.m. based on weather changes of the day. To avoid the occurrence that the
push group might not get any push notification in a day, the author designed the application to
send a push notification at 9 a.m. every day. Besides the push notifications delivered at 9 a.m.,
weather updates provided an uncongenial situation in which to establish habits according to

37
previous thinking about habit formation stressing context stability. Specifically, push notification
alerts were sent based on the weather changes rather than specific time since time cues are
readily available and don’t require careful smartphone monitoring to identify when to act,
facilitate the automaticity associated with habitual behaviors that are repeatedly enacted at the
same time each day (Lally et al., 2010). Indeed, an influential operational definition of habits
(Wood et al., 2002) defined them in terms of actions that occurred at the same time each day.
However, unexpected specific situations (i.e., changes in the weather) can also evoke automatic,
uncontrolled actions if they are consistently associated with external cues (i.e., smartphone
notifications) (Lally et al., 2010, p. 999).
During the 20-day course of the study, a total of 77 push notification alerts were sent to
the push group. The average number of notifications sent was 2.57 (SD = .63) with a range of 1
to 4 push notification alerts per day. The push group received an external time cue notification
saying “Check Today’s Weather” every morning at 9 a.m. (Figure 4). When there was a
temperature change of five degrees Fahrenheit or more, or when the chance of rain or snow
reached 90%, the application sent a push notification alert to all participants. In these cases, the
alerts read, “Temperature has changed. Please check it out!” and “It’s about to rain/snow. Please
check it out!” (Figure 5).
Push notifications required an action before proceeding (i.e., launch or close the
application). Push group participants were able to launch the Weather Story application and see
the front page by clicking through the “launch” button in the push notification alerts they
received or clicking the “close” button if they did not want to open the application. Push
notification alerts were also designed to disappear from the screen when participants pushed the
home button of their devices (for iPhone users) or touch screen (for Android users). Push

38
notification alerts were also visible in the lock screen. The application is designed to launch after
unlocking the screen thus leading the participants to the front page of the application. As an
alternative method to open the application, both push and non-push group participants were able
to launch the application by clicking the Weather Story application icon on their devices. See
Figure 4 and Figure 5 for a depiction of push notification alerts sent from Weather Story.
Figure 4. Depiction of push notification delivered at 9 a.m.
Figure 5. Depiction of push notifications in the lock screen
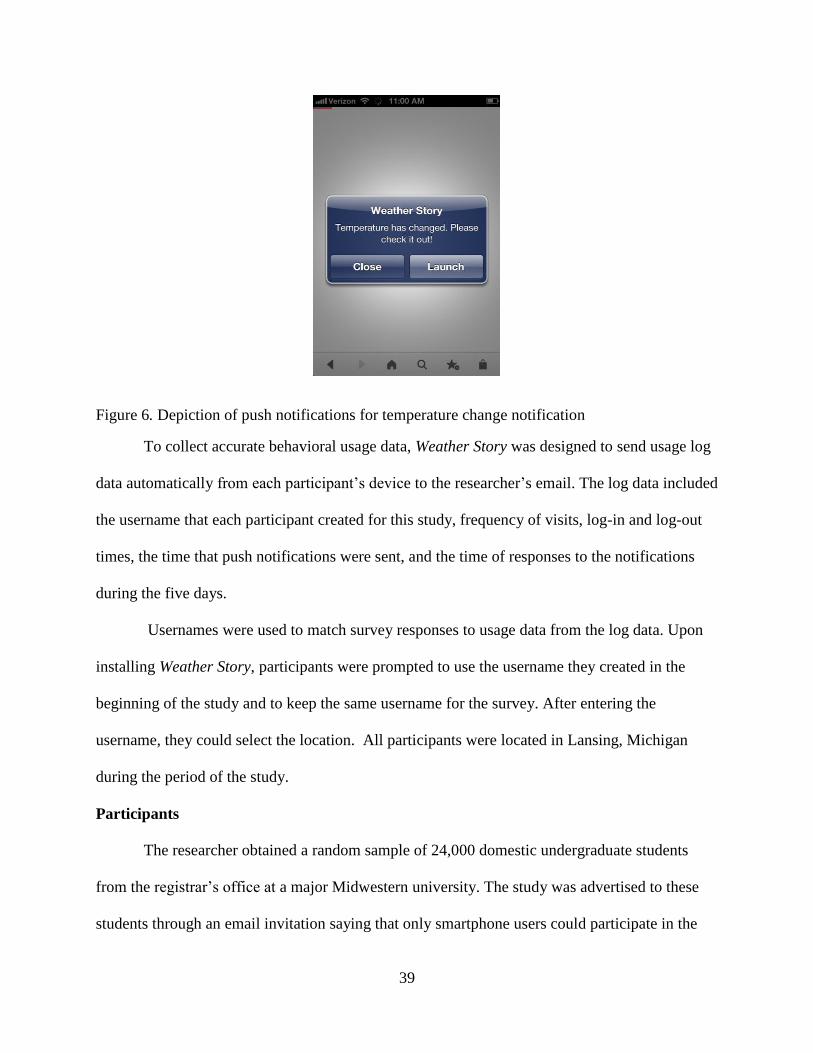
39
Figure 6. Depiction of push notifications for temperature change notification
To collect accurate behavioral usage data, Weather Story was designed to send usage log
data automatically from each participant’s device to the researcher’s email. The log data included
the username that each participant created for this study, frequency of visits, log-in and log-out
times, the time that push notifications were sent, and the time of responses to the notifications
during the five days.
Usernames were used to match survey responses to usage data from the log data. Upon
installing Weather Story, participants were prompted to use the username they created in the
beginning of the study and to keep the same username for the survey. After entering the
username, they could select the location. All participants were located in Lansing, Michigan
during the period of the study.
Participants
The researcher obtained a random sample of 24,000 domestic undergraduate students
from the registrar’s office at a major Midwestern university. The study was advertised to these
students through an email invitation saying that only smartphone users could participate in the

40
20-day study. From the invitation email, the students were informed that this study was to test
mobile application usage behaviors and they needed to complete five surveys including a pretest
questionnaire (See Appendix B). Interested participants were first asked to make an appointment
for an individual initial meeting to install the application that the researcher developed for this
study. However, the response rates to the invitation email were less than 5% and only 135
students participated in the study. More participants were recruited from classes at the university.
The researcher physically visited those classes and explained the study. In addition, the
researcher asked instructors of the classes to send online invitations. Additional participants
(37.3%) were recruited from several large communication classes with the same invitation
message. In exchange for participating in the 20-day study, there was a $20 payment offered.
The incentive for the participants was not contingent on behavior change or habit development.
At the initial meeting, participants were welcomed and briefed on the purpose of this
study and requirements of the study (i.e., smartphone users, agreement to install new mobile
application and complete several surveys). Those who agreed to participate in the study were
randomly assigned to one of the groups and were asked to complete a short questionnaire
regarding their smartphone ownership, experiences using mobile weather applications, interest in
and familiarity with using any weather forecast application, and their habit strength for any
weather application. After completing the pretest questionnaire, participants learned how to
install the application and the researcher showed the configuration of the application and
explained how to use it. For the push group, the researcher showed an example of push
notifications and what would happen when the “launch” button or “close” button was clicked.
Those participants who had little interest in using a weather application and low
familiarity were excluded (a score lower than 3 on a 7-point scale, 1 = Not at all and 7 = Very

41
much). Those who had high level of habit for any weather application use were included in this
dissertation since research finds that current habits (i.e., habit strength for using mobile phone)
predicted adoption of a similar technology (i.e., mobile video phone) (Peters, 2007). This
dissertation developed a weather forecast application similar to popular ones such as Weather
Channel and Weather Bug.
Every five days, participants received an online survey request link via email. Hence, a
total of four online survey links were emailed to the participants during the course of the 20-day
study. Participants were also informed that their application usage data, including the number of
visits and duration of using the application, would be exported automatically from their devices
to the researcher’s email. On the 20th
day of the application trial, the participants received an
email requesting their mailing address to receive a $20 paycheck as compensation. The 20-day
study period, during which participants were asked to use the application, began March 20th
2013
and ended April 8th
2013.
A total of 214 enrolled students came to the initial meeting and 166 students actually
used the application and completed at least one survey. For all participants who installed the
application in Wave 1, the completion rate was 71 %. Over 89% of these participants were
retained in the sample from wave to wave. However, the researcher found a technical problem in
sending log files. The log files were supposed to be sent automatically from participants’ devices
to the researcher’s email account, but some log files were not sent. Because of this problem some
cases were excluded as incomplete data. There was one outlier in the duration variable (2827
seconds at Time1) from the non-push group and this case was also excluded. After attrition, the
present data analysis is based on the 115 students who completed surveys and whose application
log files were successfully delivered at all four waves of data collection. Data was used for 63

42
participants in the group receiving push notifications and for 52 in the group not receiving push
notifications. In comparing those who dropped out of the study by Wave 4 or those who were
excluded from the data with those in the original sample, the former showed no differences with
respect to either their familiarity (F = .42, p > .05) or interest (F = .07, p > .05) using a weather
application or past experience (F = .35, p > .05). Gender (r = -.13p > .05), race (r = .08, p > .05),
age (r = -.02, p > .05), length of the current smartphone use (r = -.08p > .05), and the type of OS
(r = .03, p > .05) were not correlated with dropping out of the sample.
Measurement
Pretest questionnaire. Familiarity and interest in using weather forecast mobile
applications. Participants’ familiarity and interest in using weather forecast mobile applications
were considered since they might influence the level of involvement using this study’s
application. Familiarity and interest were measured by participants’ agreement ratings on a 7-
point scale (1 = Not at all; 7 = Very much). The questions are read as: “Are you familiar with
mobile weather forecast applications?” (M = 5.36, SD = 1.29), and “Are you interested in using a
mobile weather forecast application?” (M = 5.79, SD = 1.10).
Prior experience using weather forecast mobile applications. Prior experience using any
type of weather forecast mobile application by the participants was addressed using a
dichotomous question (i.e., yes/no). As with other habit strength measures used in this study,
prior mobile application usage habit strength was measured using four question items borrowed
from Soror et al.’s (2012) study and slightly modified for the purpose (i.e., changing the term
“checking cellphone” to “using a weather application”) of rating participants’ levels of
agreement on an 11-point scale (1 = strongly disagree; 11 = strongly agree). The question items
are as follows: (1) “Using a weather application has become a habit for me,” (2), “I don’t even
43
think twice before using a weather application,” (3), “Using a weather application is part of my
usual routine,” and (4), “I use weather application without really thinking about it.” (M = 7.91,
SD = 2.11, α = .84)
Main Questionnaire. Frequency and duration of application visits. The two dependent
measurements in this dissertation, the frequency and duration of application visits, were
measured by averaging the number of application visits per day and averaging the time spent per
visit (in seconds) using the differences between log-in and log-out times per visit across each 5-
day reporting period.
Log-in times were determined as the time when the application was opened on users’
smartphone screen and log-out times were determined as the time when the application
disappeared from the screen (i.e., when users closed the application, powered off their
smartphones, or switched to other applications).
Habit strength for frequency of visits. In this study, habit strength is defined as the
extent to which people tend to perform a behavior automatically. In relation to the application in
this study, habit strength was determined using four items borrowed from Soror et al.’s (2012)
study and modified for the purpose of this study (i.e., changing the term “checking cellphone” to
“using Weather Story”). Participants rated their level of agreement on an 11-point scale (1 =
strongly disagree; 11 = strongly agree). The question items are as follows: (1) “Using Weather
Story has become a habit for me,” (2) “I don’t even think twice before using Weather Story,” (3)
“Using Weather Story is part of my usual routine,” and (4) “I use Weather Story without really
thinking about it.” Specifically, application use was implied frequency of visits.

44
Table 2
Fit Indices from the Confirmatory Factor Analysis and Cronbach’s Alpha Reliabilities of
Repeated Habit Strength Measures
Prior experience using weather forecast mobile applications
(N = 94 including participants who had previous experience of using a weather application)
M SD α χ2 p CFI RMSEA SRMR
Pretest 6.86 3.53 .80 .629 .43 1.00 .00 .011
Overall habit strength for frequency of visits
(N = 115 including push and non-push groups)
Time1 5.99 2.01 .85 .225 .64 1.00 .00 .007
Time2 6.29 2.29 .94 .639 .42 1.00 .00 .003
Time3 6.29 2.66 .97 .043 .84 1.00 .00 .001
Time4 6.62 2.74 .98 .172 .68 1.00 .00 .001
Note. In some instances, the proposed model did not fit the data well. The modifications were made for the model
for both scales: error terms for item 1 and 3 were correlated to each other. CFI = comparative fit index; RMSEA =
root mean square error of approximation; SRMR = standardized root mean square residual.
Data Analyses and Modeling Procedures
This dissertation used panel data with four time points. The data included self-reported
survey data in four time points and behavioral mobile application usage data (frequency of
visitation, duration per visitation, and push notifications response latency) for 20-day study
period.
To test the relationships between habit strength and mobile application use, this study
implements Latent Growth Curve (LGC) models to describe group and individual differences in
change within a variable and Latent Difference Scores (LDS) to examine the sequential
dependency among variables based on dynamic principles (McArdle & Hamagami, 2001).
Specifically, LDS analysis provides evaluations of change coupled from one variable to another
over time (McArdle & Hamagami, 2001). LGC and LDS models were estimated in Mplus V.7
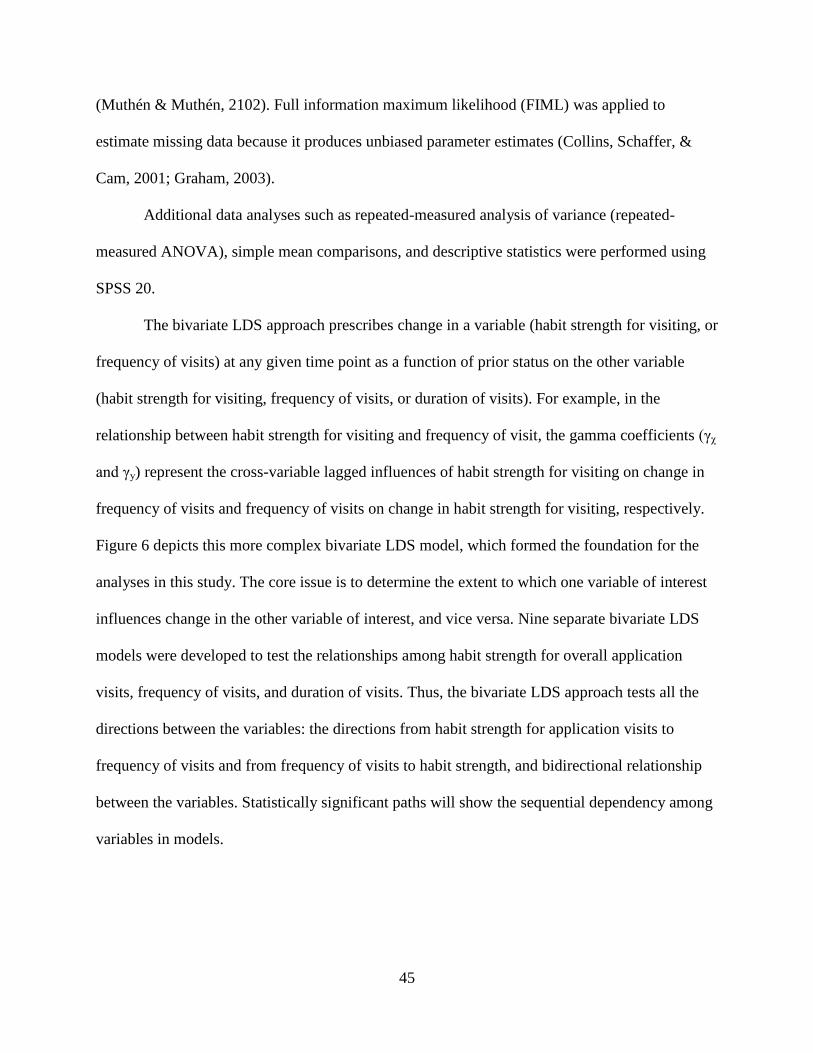
45
(Muthén & Muthén, 2102). Full information maximum likelihood (FIML) was applied to
estimate missing data because it produces unbiased parameter estimates (Collins, Schaffer, &
Cam, 2001; Graham, 2003).
Additional data analyses such as repeated-measured analysis of variance (repeated-
measured ANOVA), simple mean comparisons, and descriptive statistics were performed using
SPSS 20.
The bivariate LDS approach prescribes change in a variable (habit strength for visiting, or
frequency of visits) at any given time point as a function of prior status on the other variable
(habit strength for visiting, frequency of visits, or duration of visits). For example, in the
relationship between habit strength for visiting and frequency of visit, the gamma coefficients (γχ
and γу) represent the cross-variable lagged influences of habit strength for visiting on change in
frequency of visits and frequency of visits on change in habit strength for visiting, respectively.
Figure 6 depicts this more complex bivariate LDS model, which formed the foundation for the
analyses in this study. The core issue is to determine the extent to which one variable of interest
influences change in the other variable of interest, and vice versa. Nine separate bivariate LDS
models were developed to test the relationships among habit strength for overall application
visits, frequency of visits, and duration of visits. Thus, the bivariate LDS approach tests all the
directions between the variables: the directions from habit strength for application visits to
frequency of visits and from frequency of visits to habit strength, and bidirectional relationship
between the variables. Statistically significant paths will show the sequential dependency among
variables in models.

46
Figure 7. Bivariate dual change latent difference score model. To simplify presentation, single-
indicator measurement components are depicted.

47
RESULTS
Data analysis was based on the 115 participants who completed surveys and used the
application throughout the four waves of data collection. Table 3 illustrates the demographics of
the push group and the non-push group.
Table 3
Demographics of Push Group and Non-Push Group
Push Group
(n = 63)
Non Push Group
(n = 52)
Gender
Male 19 (30.2%) 22 (42.3%)
Female 40 (63.5%) 28 (53.8%)
Missing 4 (6.3%) 2 (3.8%)
Total 63 52
Age (years) M = 21.25, SD = 2.59 M = 21.64, SD = 2.83
Race
Black 5 (7.9%) 4 (7.7%)
White 35 (55.6%) 25 (48.1%)
Latino 1 (1.6%) 1 (1.9%)
Asian 14 (22.2%) 15 (28.8%)
Multiracial 3 (4.8%) 4 (7.7%)
Other 1 (1.6%) 0%
Missing 4 (6.3%) 3 (5.8%)
Weather App experience
Yes 54 (85.7%) 38 (73.1%)
No 8 (12.7%) 7 (13.5%)
Missing 1 (1.6%) 7 (13.5%)
Operating System
iOS 45 (71.4%) 23 (44.2%)
Android 18 (28.6%) 29 (55.8%)
The mean age was 21.43 years of age (SD = 2.70) with a range from 19 to 34 years, and
59.1% of the participants were female. Over half (58.8%) of the participants had been using their
current smartphone for less than 11 months (M = 10.89 months, SD = 9.89). Racially, the sample
comprised of 60 Whites (52.2%), 29 Asians (25.2%), nine Blacks (7.8%), two Latinos (1.7%),
eight from other racial groups (7.0%), with seven missing values. Among the 115 participants,
80% had previous experience using a weather forecast application with their smartphone and had

48
weather application usage habit (M = 6.86, SD = 3.36). There were no significant differences
between the two groups with respect to gender, χ2 (1, N = 110) = 1.40, p > .05, age t(108) = .97,
p > .05, race, χ2 (5, N = 109) = 2.32, p > .05, prior experience using a mobile weather application,
χ2 (1, N = 108) = .12, p > .05, and dropout rate, χ2 (1, N = 115) = .39, p > .05. There was a
significant group difference between type of operating system, χ2 (1, N = 115) = 9.33, p < .05.
The majority of participants in the push group were iOS users (71.4%), whereas the non-push
group included more Android users (56.6%). There was also no significant difference between
treatment groups for the age of the mobile phone in current use, t(108) = .01, p > .05.
There was no significant differences between groups on familiarity with a mobile weather
application, t(106) = 1.83, p > .05, interest in using a weather application, t(106) = 1.13 p > .05,
and prior habit strength for visiting a weather application, t(106) = .96, p > .05. Table 4 presents
the age of the mobile phone in current use, level of familiarity and interest in using mobile
weather application, and participant habit strength of visiting the weather application for each
group.
Table 4
Descriptive Statistics of Variables of Interest by Group
Push Group
(n = 63)
Non-Push Group
(n = 52)
M SD M SD
Age of the mobile phone in current use 10.85 months 11.08 10.95 months 7.13
Familiarity 5.18 1.30 5.62 1.25
Interest 5.69 1.15 5.91 1.02
Prior weather app habit strength 6.59 3.31 7.19 3.45

49
Weather changes
Information on temperature changes, precipitation, and weather conditions (e.g., clear,
cloud, snow, or rain) was collected from the website Weather Underground
(www.wundergroud.com). Figure 8 displays temperature change over time and Table 5 presents
the weather data during the study.
Source. Weather Underground http://www.wunderground.com/
Figure 8. Temperature change during the 20-day study period
Table 5
Weather Information During the 20-Day Study Period
Time Point Date Precipitation
(inch) Weather Event
T1
3-20-2013 0.07 Snow
3-21-2013 0.01 Snow
3-22-2013 0.07 Snow
3-23-2013 0
3-24-2013 0
T2
3-25-2013 0.01 Snow
3-26-2013 0.01 Snow
3-27-2013 0
3-28-2013 0
3-29-2013 0
T3
3-30-2013 0
3-31-2013 0.02 Rain
4-1-2013 0.09 Snow
4-2-2013 0.1 Snow
4-3-2013 0

50
Table 5 (Cont’d)
T4
4-4-2013 0
4-5-2013 0
4-6-2013 0.1
4-7-2013 0.1 Rain
4-8-2013 0.35 Rain Source. http://www.wunderground.com/
Model Viability
The first stage of analysis was to construct and evaluate a latent growth model for the
habit strength measures and mobile application usage measures. An initial step in the modeling
process was to test the viability of models for each manifest variable: (1) habit strength for
visitation, (2) frequency of visiting, and (3) duration per visit (Barnes, Reifman, Farrell, &
Dintcheff, 2000). Three separate univariate LGC models of each variable were tested in order to
determine the functional forms of the growth curve with the Mplus V.7 program using FIML
estimation. Two latent factors were estimated in each LGC model, one representing the intercept
(i.e., the participant’s initial score of each variable) and the other representing the slope (i.e.,
changes in each variable over time). To represent participants’ initial levels, the intercept factor
was created with a fixed loading of 1.0 at each wave. To represent change in those three
variables over time, the slope factor’s loadings at all waves were left to be freely estimated
(Duncan, Duncan, & Stoolmiller, 1994). The fit of the models was evaluated with Hu and
Bentler’s (1999) criteria, which suggests a cutoff value close to .95 for TLI and CFI, .06 for
RMSEA, and .08 for SRMR.
A separate univariate latent growth model of each variable (i.e., habit strength for
visiting, frequency of visitation, and duration per visit) were fitted in order to determine the
functional form of the growth curve (Peterson et al., 2011). For all three variables, a linear

51
growth model provided good fit. Table 6 shows results of the univariate latent growth models
including model fit indices and parameter estimates.
Table 6
Univariate Latent Growth Model Results, Model Fit Indices, and Parameter Estimates by
Variable
Note. N = 115 for the models. Parameter estimates in bold are significant (p < .05). CFI = comparative fit index; TLI
= Tucker-Lewis index; RMSEA = root mean square error of approximation.
First, for habit strength for overall application visitation, results indicate that individuals’
habit strength scores for visiting significantly changed over time. The positive value of the mean
slope is consistent with an increase over time and the change was significant. Second, the results
of the model analysis for frequency of visits indicated that there was no difference among
individuals at the beginning of the study in frequency of visitation and no significant changes
over time. The mean slope’s negative value is consistent with a decrease in application checking
frequency, but it was not significant. Lastly, the results of the model analysis for duration
Habit strength Frequency of visit Duration
Fit indices
χ2/df 3.80/3 2.64/3 3.39/3
CFI 1.00 1.00 1.00
TLI 1.00 1.00 .99
RMSEA .048 .000 .034
SRMR .038 .039 .060
Parameter estimates
Initial status means 5.93 13.44 24.66
Initial status variances .67 -8.17 -7.43
Change means 3.78 9.67 123.60
Change variances 5.55 -.93 49.67

52
indicated that there was a difference among individuals at the beginning of the study in
frequency of visitation but the changes over time were not significant. The mean slope’s negative
value is consistent with a decrease in duration per visit to Weather Story.
Descriptive Statistics
Descriptive statistics for each group are provided separately in Tables 7 and 8. For the
non-push group, results of the bivariate correlation tests showed a positive correlation between
visiting habit strength and frequency of visitation. Prior habit strength for visiting a weather
application was positively correlated with habit strength for visiting Weather Story at T1 only.
For the push group, however, visiting habit strength was not correlated with either
frequency of visiting or duration per visit. Duration per visit at T2 was negatively correlated with
habit strength for visiting Weather Story at T3. Prior habit strength for visiting a weather
application was also positively correlated with habit strength for visiting Weather Story for the
push group.
For both groups, prior habit strength for visiting a weather application was positively
correlated with familiarity with a mobile weather application and interest in using a weather
application.
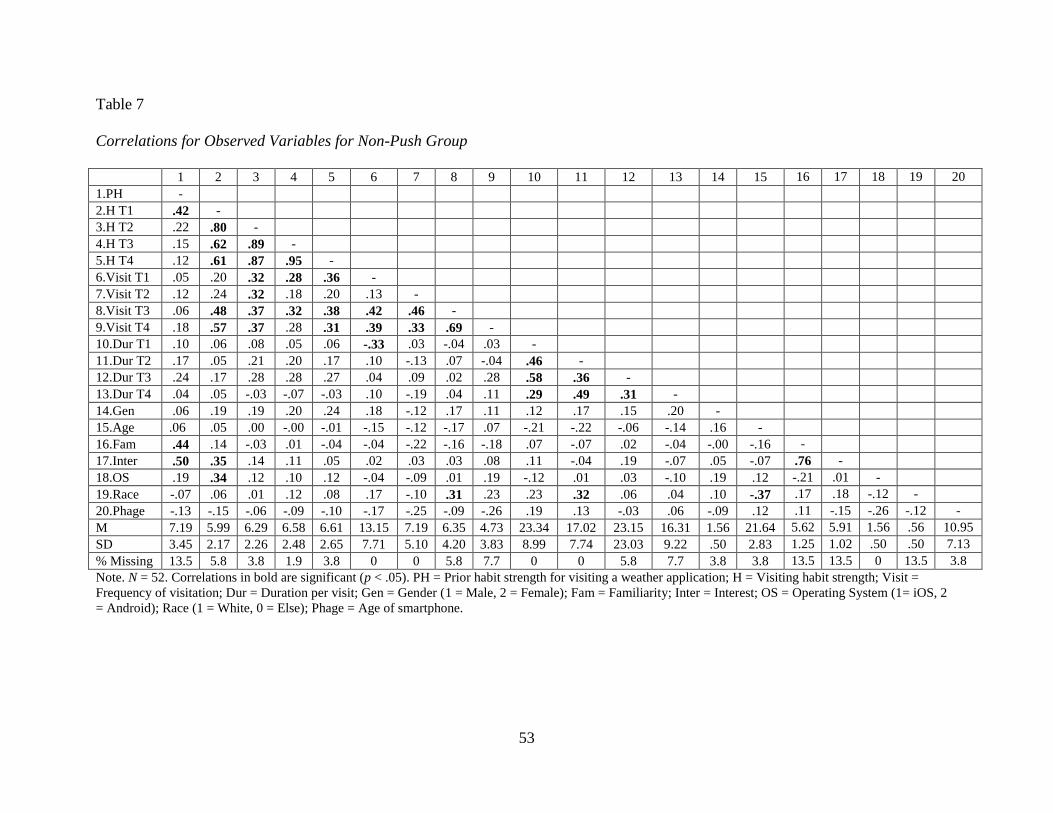
53
Table 7
Correlations for Observed Variables for Non-Push Group
1 2 3 4 5 6 7 8 9 10 11 12 13 14 15 16 17 18 19 20
1.PH -
2.H T1 .42 -
3.H T2 .22 .80 -
4.H T3 .15 .62 .89 -
5.H T4 .12 .61 .87 .95 -
6.Visit T1 .05 .20 .32 .28 .36 -
7.Visit T2 .12 .24 .32 .18 .20 .13 -
8.Visit T3 .06 .48 .37 .32 .38 .42 .46 -
9.Visit T4 .18 .57 .37 .28 .31 .39 .33 .69 -
10.Dur T1 .10 .06 .08 .05 .06 -.33 .03 -.04 .03 -
11.Dur T2 .17 .05 .21 .20 .17 .10 -.13 .07 -.04 .46 -
12.Dur T3 .24 .17 .28 .28 .27 .04 .09 .02 .28 .58 .36 -
13.Dur T4 .04 .05 -.03 -.07 -.03 .10 -.19 .04 .11 .29 .49 .31 -
14.Gen .06 .19 .19 .20 .24 .18 -.12 .17 .11 .12 .17 .15 .20 -
15.Age .06 .05 .00 -.00 -.01 -.15 -.12 -.17 .07 -.21 -.22 -.06 -.14 .16 -
16.Fam .44 .14 -.03 .01 -.04 -.04 -.22 -.16 -.18 .07 -.07 .02 -.04 -.00 -.16 -
17.Inter .50 .35 .14 .11 .05 .02 .03 .03 .08 .11 -.04 .19 -.07 .05 -.07 .76 -
18.OS .19 .34 .12 .10 .12 -.04 -.09 .01 .19 -.12 .01 .03 -.10 .19 .12 -.21 .01 -
19.Race -.07 .06 .01 .12 .08 .17 -.10 .31 .23 .23 .32 .06 .04 .10 -.37 .17 .18 -.12 -
20.Phage -.13 -.15 -.06 -.09 -.10 -.17 -.25 -.09 -.26 .19 .13 -.03 .06 -.09 .12 .11 -.15 -.26 -.12 -
M 7.19 5.99 6.29 6.58 6.61 13.15 7.19 6.35 4.73 23.34 17.02 23.15 16.31 1.56 21.64 5.62 5.91 1.56 .56 10.95
SD 3.45 2.17 2.26 2.48 2.65 7.71 5.10 4.20 3.83 8.99 7.74 23.03 9.22 .50 2.83 1.25 1.02 .50 .50 7.13
% Missing 13.5 5.8 3.8 1.9 3.8 0 0 5.8 7.7 0 0 5.8 7.7 3.8 3.8 13.5 13.5 0 13.5 3.8
Note. N = 52. Correlations in bold are significant (p < .05). PH = Prior habit strength for visiting a weather application; H = Visiting habit strength; Visit =
Frequency of visitation; Dur = Duration per visit; Gen = Gender (1 = Male, 2 = Female); Fam = Familiarity; Inter = Interest; OS = Operating System (1= iOS, 2
= Android); Race (1 = White, 0 = Else); Phage = Age of smartphone.

54
Table 8
Correlations for Observed Variables for Push Group
1 2 3 4 5 6 7 8 9 10 11 12 13 14 15 16 17 18 19 20
1.PH -
2.H T1 .26 -
3.H T2 .15 .69 -
4.H T3 .32 .38 .58 -
5.H T4 .27 .43 .77 .71 -
6.Visit T1 .18 .02 .09 .11 .05 -
7.Visit T2 .09 .01 .05 -.01 .08 .33 -
8.Visit T3 .16 -.02 .09 .07 .24 .25 .71 -
9.Visit T4 -.03 -.06 .06 .02 .27 .30 .37 .78 -
10.Dur T1 .04 .07 .08 -.13 .09 -.13 -.18 .15 .13 -
11.Dur T2 .00 .08 -.09 -.29 -.14 -.07 .00 .04 .05 .54 -
12.Dur T3 -.13 -.12 -.18 -.20 -.24 .05 .16 .21 .14 .29 .51 -
13.Dur T4 .22 -.12 -.26 -.27 -.13 -.11 .02 .11 .19 .38 .37 .37 -
14.Gen .10 -.14 .05 .15 .18 -.02 -.14 .06 .07 .00 -.13 -.18 .03 -
15.Age -.05 -.02 .01 -.00 -.02 -.07 -.02 -.00 .06 -.09 -.04 -.05 .02 -.19 -
16.Fam .60 -.12 .02 .15 .16 .11 .11 .16 .02 -.08 -.19 -.03 .08 .12 -.05 -
17.Inter .42 .23 .18 .14 .25 -.07 .11 .25 .08 .18 .23 .03 .13 -.09 .07 .31 -
18.OS .01 .20 .08 -.07 -.03 -.25 -.18 -.15 -.12 .20 .17 .21 .12 -.25 .08 -.14 .11 -
19.Race -.14 -.12 -.15 -.22 -.19 .08 .05 -.06 -.01 .10 .16 .07 .01 -.07 -.16 .05 -.10 -.15 -
20.Phage .15 .10 .13 .07 -.03 .20 -.16 -.07 -.13 -.12 -.02 -.14 -.30 .02 .01 .20 .22 -.19 .15 -
M 6.59 5.99 6.29 6.03 6.58 13.60 9.33 7.77 6.25 25.81 20.31 19.98 18.33 1.68 21.25 5.18 5.69 1.29 .64 10.85
SD 3.31 2.01 2.46 2.88 2.97 6.77 6.46 5.62 5.15 14.74 12.84 17.30 12.54 .47 2.59 1.3 1.15 .46 .49 11.80
% Missing 1.6 4.8 6.3 3.2 6.3 0 12.7 15.9 17.5 0 12.7 15.9 17.5 6.3 6.3 1.6 1.6 0 12.7 6.3
Note. N = 63. Correlations in bold are significant (p < .05). PH = Prior habit strength for visiting a weather application; H = Visiting habit strength; Visit =
Frequency of visitation; Dur = Duration per visit; Gen = Gender (1 = Male, 2 = Female); Fam = Familiarity; Inter = Interest; OS = Operating System (1= iOS, 2
= Android); Race (1 = White, 0 = Else); Phage = Age of smartphone.
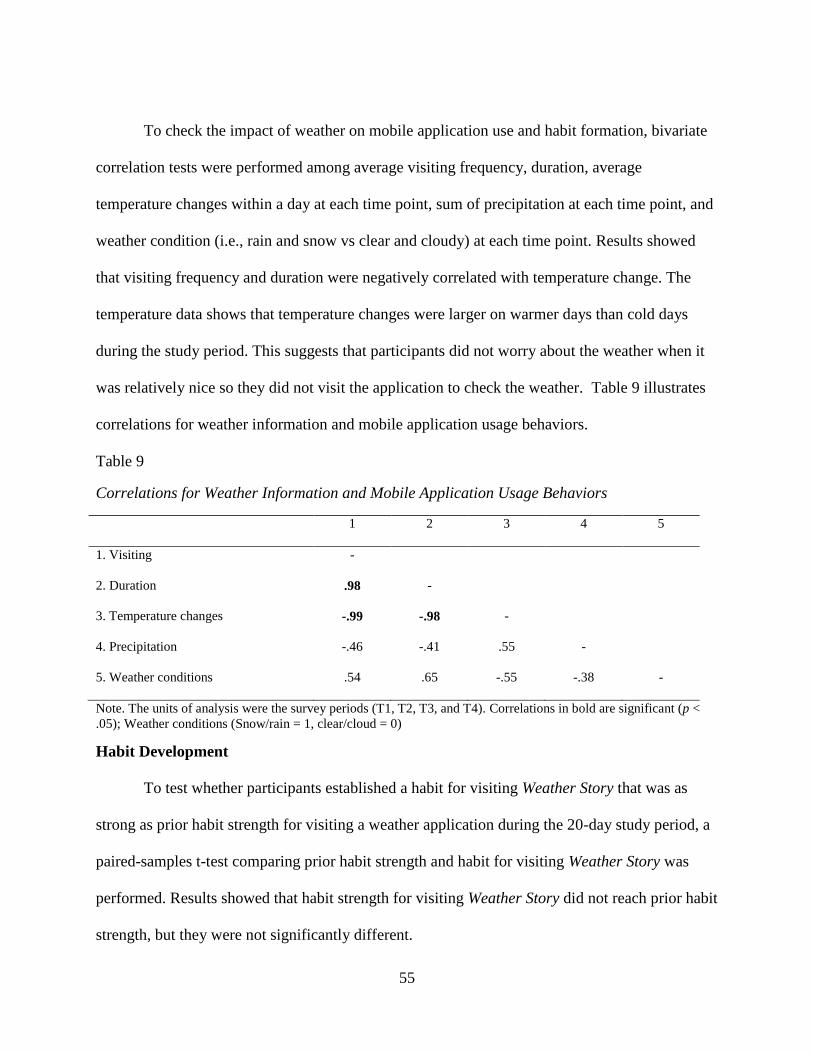
55
To check the impact of weather on mobile application use and habit formation, bivariate
correlation tests were performed among average visiting frequency, duration, average
temperature changes within a day at each time point, sum of precipitation at each time point, and
weather condition (i.e., rain and snow vs clear and cloudy) at each time point. Results showed
that visiting frequency and duration were negatively correlated with temperature change. The
temperature data shows that temperature changes were larger on warmer days than cold days
during the study period. This suggests that participants did not worry about the weather when it
was relatively nice so they did not visit the application to check the weather. Table 9 illustrates
correlations for weather information and mobile application usage behaviors.
Table 9
Correlations for Weather Information and Mobile Application Usage Behaviors
1 2 3 4 5
1. Visiting -
2. Duration .98 -
3. Temperature changes -.99 -.98 -
4. Precipitation -.46 -.41 .55 -
5. Weather conditions .54 .65 -.55 -.38 -
Note. The units of analysis were the survey periods (T1, T2, T3, and T4). Correlations in bold are significant (p <
.05); Weather conditions (Snow/rain = 1, clear/cloud = 0)
Habit Development
To test whether participants established a habit for visiting Weather Story that was as
strong as prior habit strength for visiting a weather application during the 20-day study period, a
paired-samples t-test comparing prior habit strength and habit for visiting Weather Story was
performed. Results showed that habit strength for visiting Weather Story did not reach prior habit
strength, but they were not significantly different.

56
For the non-push group, a paired-samples t-test showed that prior habit strength was
significantly higher than habit strength for visiting Weather Story at T1, p < .05, but not higher at
T2, T3, and T4, p > .05. For the push group, prior habit strength was not significantly higher than
habit strength for visiting Weather Story at any of the four time points, p > .05.
Effect of Push Notification Alerts on Habit Strength and Application Use
The first hypothesis proposed that push notification alerts would act as salient external
cues influencing habit formation for mobile application visitation and frequency of visits. In
particular, H1a predicted that users who receive push notifications from the application would
have higher levels of habit strength for application use than the non-push group through faster
growth in habit strength for visiting the application than those who did not receive push
notification alerts. This hypothesis was tested by comparing the scores of habit strength for
overall application visitation between the push and non-push groups. A repeated-measures
ANOVA was conducted with habit strength for mobile application use over time as the within-
subjects factor and push notification condition (push group versus non-push group) as the
between-subjects factor.
Table 10
Repeated-Measures ANOVA Results for Habit Strength over Time between Push Group and
Non-Push Group
DF F P
Habit Strength 3 4.20 <.05
Group 1 .03 >.05
Habit Strength X Group 3 .47 >.05
Note. Using Mauchly’s test, it was found that the assumption of sphericity was violated, Mauchly’s W = .55, χ2 (5)
= 57.45, p < .05, therefore degrees of freedom were corrected using Greenhouse-Geisser estimates of sphericity (ɛ <
.75) (Girden, 1992).
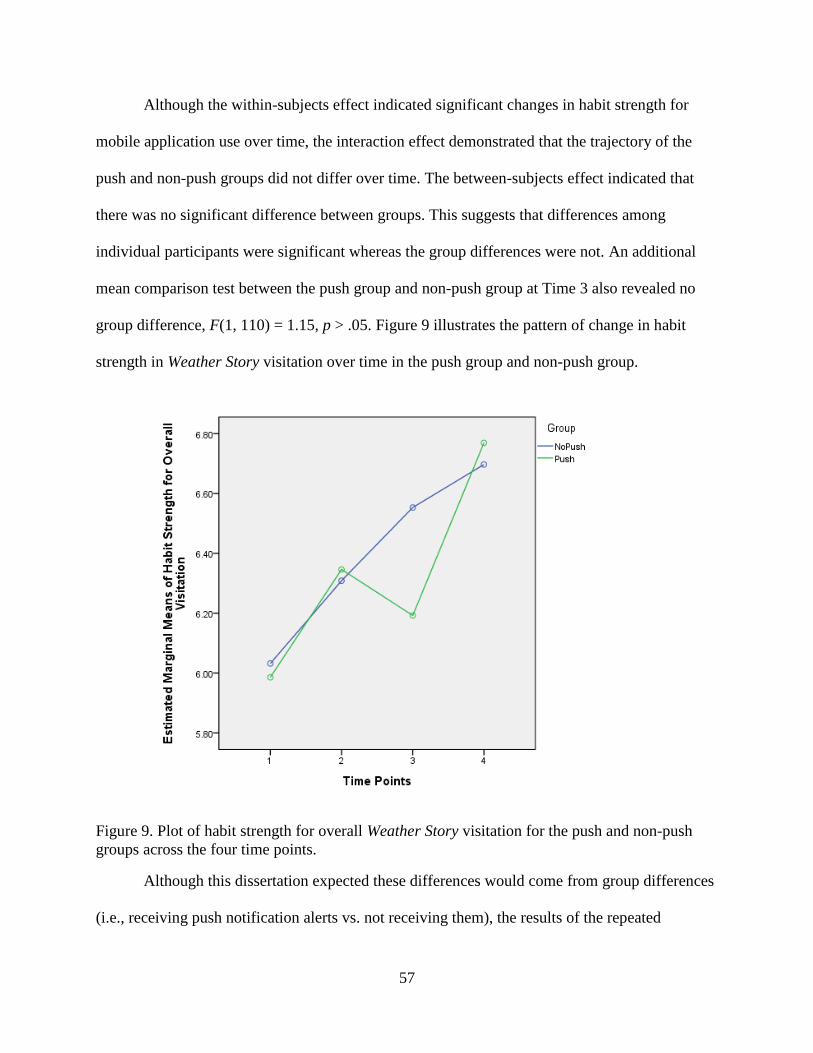
57
Although the within-subjects effect indicated significant changes in habit strength for
mobile application use over time, the interaction effect demonstrated that the trajectory of the
push and non-push groups did not differ over time. The between-subjects effect indicated that
there was no significant difference between groups. This suggests that differences among
individual participants were significant whereas the group differences were not. An additional
mean comparison test between the push group and non-push group at Time 3 also revealed no
group difference, F(1, 110) = 1.15, p > .05. Figure 9 illustrates the pattern of change in habit
strength in Weather Story visitation over time in the push group and non-push group.
Figure 9. Plot of habit strength for overall Weather Story visitation for the push and non-push
groups across the four time points.
Although this dissertation expected these differences would come from group differences
(i.e., receiving push notification alerts vs. not receiving them), the results of the repeated

58
ANOVA test showed the variance in habit strength for overall visitation over time was not
related to push notifications. Based on the results, this dissertation explored what factors were
related to individual differences in habit strength for overall visitation. Gender, age, race, age of
smartphone in current use, initial interest and familiarity using weather application, and prior
habit strength were tested. Results of a bivariate correlation test showed that prior habit strength
for a weather application visitation was a significant factor that influenced habit strength for
visiting Weather Story at Time1, Time 3, and Time 4.
Table 11
Correlations for Habit Strength, Demographic, and Background Variables
1 2 3 4 5 6 7 8 9 10 11
1. HT1 -
2. HT2 .74 -
3. HT3 .48 .71 -
4. HT4 .51 .81 .81 -
5. Gender .03 .11 .17 .21 -
6. Age .02 .00 .02 .01 -.01 -
7. Race -.03 -.08 -.10 -.09 .01 -.29 -
8. Phage .01 .07 .02 -.05 -.02 .04 .04 -
9. Familiarity -.01 .01 .11 .09 .04 -.07 .08 .17 -
10. Interest .28 .16 .14 .18 -.04 .04 .00 .11 .49 -
11. PH .33 .18 .26 .21 .07 .01 -.11 .06 .54 .45 -
M 6.00 6.29 6.29 6.62 1.63 21.49 .59 10.86 5.37 5.80 6.86
SD 2.07 2.35 2.70 2.81 .49 2.76 .49 9.86 1.29 1.10 3.36
% Missing 5.2 5.2 2.6 5.2 5.2 5.2 12.9 5.2 6.9 6.9 6.9
Note. N = 115. Correlations in bold are significant (p < .05). Phage = Age of mobile phone in current use; PH =
Prior habit strength; HT1, 2, 3, and 4 = Habit Strength for overall Weather Story visitation at Time1, Time2, Time3,
and Time 4; Gender (1 = Male, 2 = Female); Race (1 = White, 0 = Else)
Response latency was calculated by comparing the time at which the push notification
was delivered with the time of the visit to the application. A total of 77 push notification
messages were sent to the group receiving push notifications, and the average number of push
notification sent per day was 2.57 (SD = .63) with a range of two to four push notifications.
Descriptive statistics show the use of push notifications (clicking push notification delivered)
was highly negatively skewed. Among the 63 users receiving push notification messages, 32
participants actually clicked the notifications at least once (range from 1 to 16). The average

59
number of clicked push notifications was 1.08 (SD = 1.60) at Time 1, .68 (SD = 1.35) at Time
2, .48 (SD = 1.09) at Time 3, and .40 (SD = .91) at Time 4. The average response latency to push
notification (the time notification delivered – the time notification clicked) was 3.98 minutes (SD
= 8.45) at Time 1, 5.32 minutes (SD = 20.52) at Time 2, 1.66 minutes (SD = 4.92) at Time 3, and
1.19 minutes (SD = 4.58) at Time 4.
To fully understand the effect of push notification on habit formation, this study
conducted post hoc analysis with three groups: (1) a non-push group who did not received any
push notification, (2) a non-responding group who received push notifications but never clicked,
and (3) a responding group who received push notifications and clicked at least once. Repeated-
measured ANOVA tests were conducted with habit strength for mobile application use over time
as the within-subjects factor and the condition of use of push notification (i.e., non-push group
who did not received any push notification vs non-responding group who received push
notifications but never clicked vs responding group who received push notifications and clicked
at least once) as the between-subjects factor. The results are presented in Table 12.
Table 12
Repeated-Measures ANOVA Results for Frequency of Visits over Time between Non-Push Group,
Non Responding Group, and Responding Group
DF F P
Habit Strength 3 4.02 <.05
Group 2 .01 >.05
Habit Strength X Group 6 1.53 >.05
Note. Using Mauchly’s test, it was found that the assumption of sphericity was violated, Mauchly’s W = .53, χ2 (5)
= 58.73, p < .05, therefore degrees of freedom were corrected using Greenhouse-Geisser estimates of sphericity (ɛ <
.75) (Girden, 1992).
The within-subjects effect indicated significant changes in habit strength for mobile
application use over time in all three groups. However, the interaction effect demonstrated that

60
the trajectory of those three groups did not differ over time and there was no significant
difference in habit strength scores among the groups at any of the time points. This indicates that
participants’ habit strength significantly changed over time whereas there were no group
differences to changes in habit strength.
H1b predicted that users who receive push notifications from the application would visit
the application more frequently than those who did not receive push notification alerts.
Repeated-measures ANOVA tests were performed to determine if there were group differences
in frequency of visits to Weather Story. Table 13 presents the results between the push group and
non-push group.
Table 13
Repeated-Measures ANOVA Results for Frequency of Visits over Time between Push Group and
Non-Push Group
DF F P
Frequency 3 81.76 <.05
Group 1 4.33 <.05
Frequency X Group 3 .24 >.05
Note. Using Mauchly’s test, it was found that the assumption of sphericity was violated, Mauchly’s W = .54, χ2 (5)
= 59.16, p < .05, therefore degrees of freedom were corrected using Greenhouse-Geisser estimates of sphericity (ɛ <
.75) (Girden, 1992).
The within-subjects effect indicated significant changes in frequency of visitation over
time. The between-subjects effect found that there was a significant difference between groups.
However, the interaction effect demonstrated that the trajectory of visitation between the push
group and non-push group did not differ over time. Figure 10 illustrates the pattern of change in
frequency of visitation over time in the push group and non-push group.
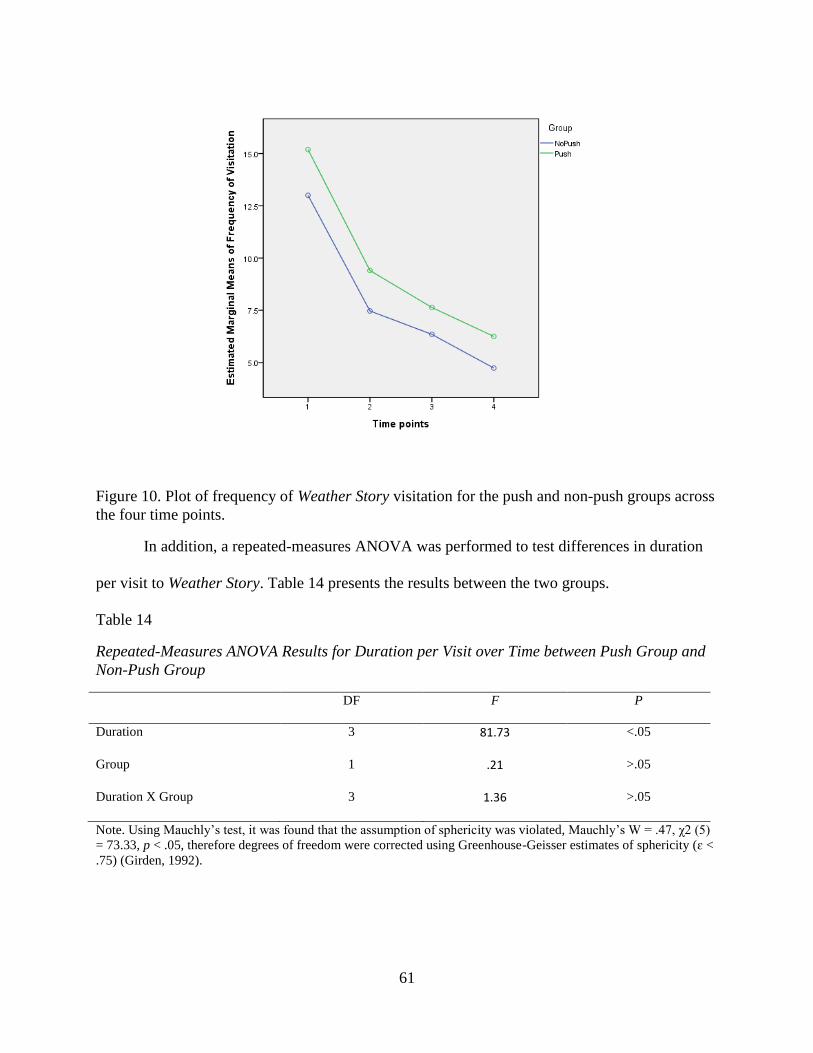
61
Figure 10. Plot of frequency of Weather Story visitation for the push and non-push groups across
the four time points.
In addition, a repeated-measures ANOVA was performed to test differences in duration
per visit to Weather Story. Table 14 presents the results between the two groups.
Table 14
Repeated-Measures ANOVA Results for Duration per Visit over Time between Push Group and
Non-Push Group
DF F P
Duration 3 81.73 <.05
Group 1 .21 >.05
Duration X Group 3 1.36 >.05
Note. Using Mauchly’s test, it was found that the assumption of sphericity was violated, Mauchly’s W = .47, χ2 (5)
= 73.33, p < .05, therefore degrees of freedom were corrected using Greenhouse-Geisser estimates of sphericity (ɛ <
.75) (Girden, 1992).

62
The within-subjects effect indicated significant changes in duration per visit to Weather
Story over time. However, the between-subjects effect and interaction effect demonstrated that
there was no significant group difference and that the trajectory of visitation between the push
group and non-push group did not differ over time. Figure 11 illustrates the pattern of change in
frequency of visitation over time in the push group and non-push group.
Figure 11. Plot of duration per visit to Weather Story for the push and non-push group across the
four time points.
Causal Relationship between Habit for Mobile Application Visitation and the Behaviors of
Frequency of Visitation and Duration on Application
The second set of hypotheses proposed a causal relationship between habit strength for
overall visitation and frequency of visitation (H2a) and a causal relationship between habit
strength and duration per visit on application (H2b). In addition, the research question proposed
an association between frequency of visitation and duration per visit to the application (RQ).
This study took the perspective that suggests that habits influence media use based on evidence

63
of the effects of habit in technology use (LaRose & Eastin, 2004; LaRose et al., 2003; Soror et
al., 2010)
This dissertation had two different strategies to test relationships among habit strength for
application visitation, frequency of visitation, and duration per visit to the application. First,
bivariate LDS models combining two groups together were estimated. According to the repeated
ANOVA that tested the group difference in habit strength for application visitation, individual
differences were significant whereas group differences were not. Focusing on individual
differences, the models including both groups together would explain the association between
habit strength and application usage behaviors. Second, bivariate LDS models for each group
were estimated separately to see the effect of push notifications on the association between habit
strength and application usage behaviors. In addition, since habit strength for overall visitation
correlated with prior habit strength for visiting a weather application, this dissertation also tested
the effect of prior habit strength in the model. For this, prior habit strength was added to each
LDS model as a covariate.
H2a predicted that habit strength for mobile application visitation would positively
predict the frequency of mobile application visits. Three separated bivariate dual change models
were tested for H2a: one including both groups together, another including only the non-push
group, and one including only the push group.
First, Table 15 presents results of the model including both groups and the association
between habit strength for overall visitation and frequency of visits.
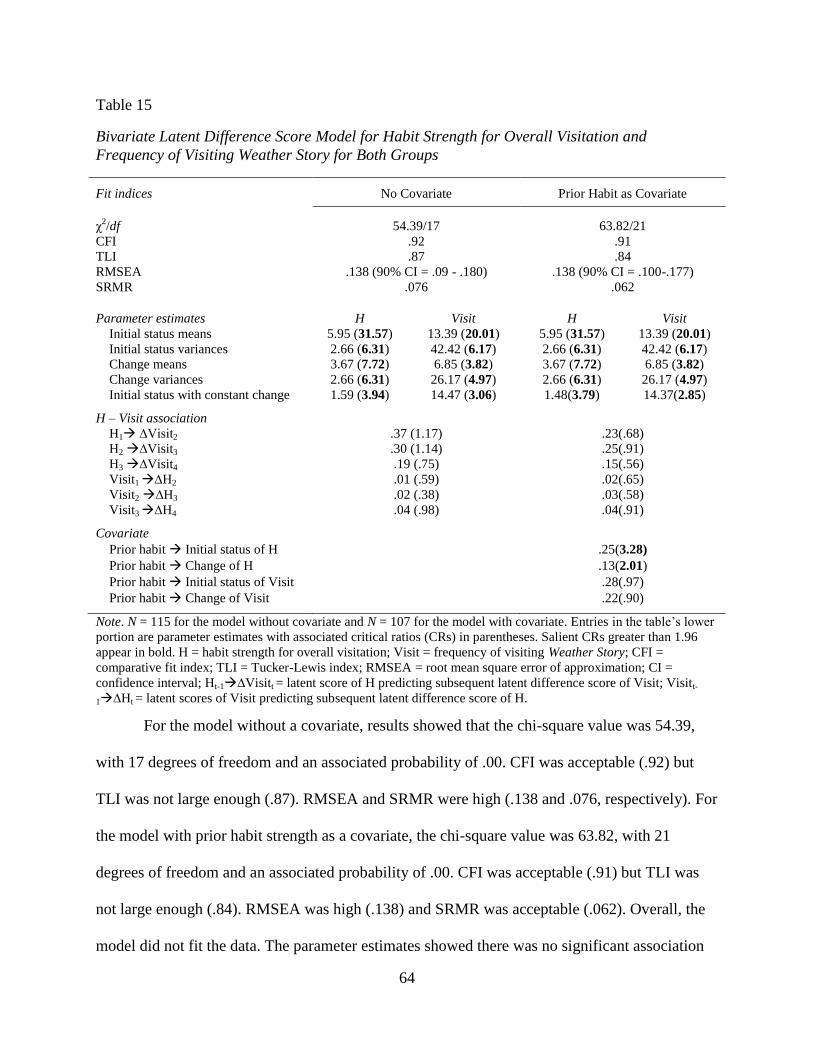
64
Table 15
Bivariate Latent Difference Score Model for Habit Strength for Overall Visitation and
Frequency of Visiting Weather Story for Both Groups
Fit indices No Covariate Prior Habit as Covariate
χ2/df 54.39/17 63.82/21
CFI .92 .91
TLI .87 .84
RMSEA .138 (90% CI = .09 - .180) .138 (90% CI = .100-.177)
SRMR .076 .062
Parameter estimates H Visit H Visit
Initial status means 5.95 (31.57) 13.39 (20.01) 5.95 (31.57) 13.39 (20.01)
Initial status variances 2.66 (6.31) 42.42 (6.17) 2.66 (6.31) 42.42 (6.17)
Change means 3.67 (7.72) 6.85 (3.82) 3.67 (7.72) 6.85 (3.82)
Change variances 2.66 (6.31) 26.17 (4.97) 2.66 (6.31) 26.17 (4.97)
Initial status with constant change 1.59 (3.94) 14.47 (3.06) 1.48(3.79) 14.37(2.85)
H – Visit association
H1 ∆Visit2 .37 (1.17) .23(.68)
H2 ∆Visit3 .30 (1.14) .25(.91)
H3 ∆Visit4 .19 (.75) .15(.56)
Visit1 ∆H2 .01 (.59) .02(.65)
Visit2 ∆H3 .02 (.38) .03(.58)
Visit3 ∆H4 .04 (.98) .04(.91)
Covariate Prior habit Initial status of H .25(3.28)
Prior habit Change of H .13(2.01)
Prior habit Initial status of Visit .28(.97)
Prior habit Change of Visit .22(.90)
Note. N = 115 for the model without covariate and N = 107 for the model with covariate. Entries in the table’s lower
portion are parameter estimates with associated critical ratios (CRs) in parentheses. Salient CRs greater than 1.96
appear in bold. H = habit strength for overall visitation; Visit = frequency of visiting Weather Story; CFI =
comparative fit index; TLI = Tucker-Lewis index; RMSEA = root mean square error of approximation; CI =
confidence interval; Ht-1∆Visitt = latent score of H predicting subsequent latent difference score of Visit; Visitt-
1∆Ht = latent scores of Visit predicting subsequent latent difference score of H.
For the model without a covariate, results showed that the chi-square value was 54.39,
with 17 degrees of freedom and an associated probability of .00. CFI was acceptable (.92) but
TLI was not large enough (.87). RMSEA and SRMR were high (.138 and .076, respectively). For
the model with prior habit strength as a covariate, the chi-square value was 63.82, with 21
degrees of freedom and an associated probability of .00. CFI was acceptable (.91) but TLI was
not large enough (.84). RMSEA was high (.138) and SRMR was acceptable (.062). Overall, the
model did not fit the data. The parameter estimates showed there was no significant association
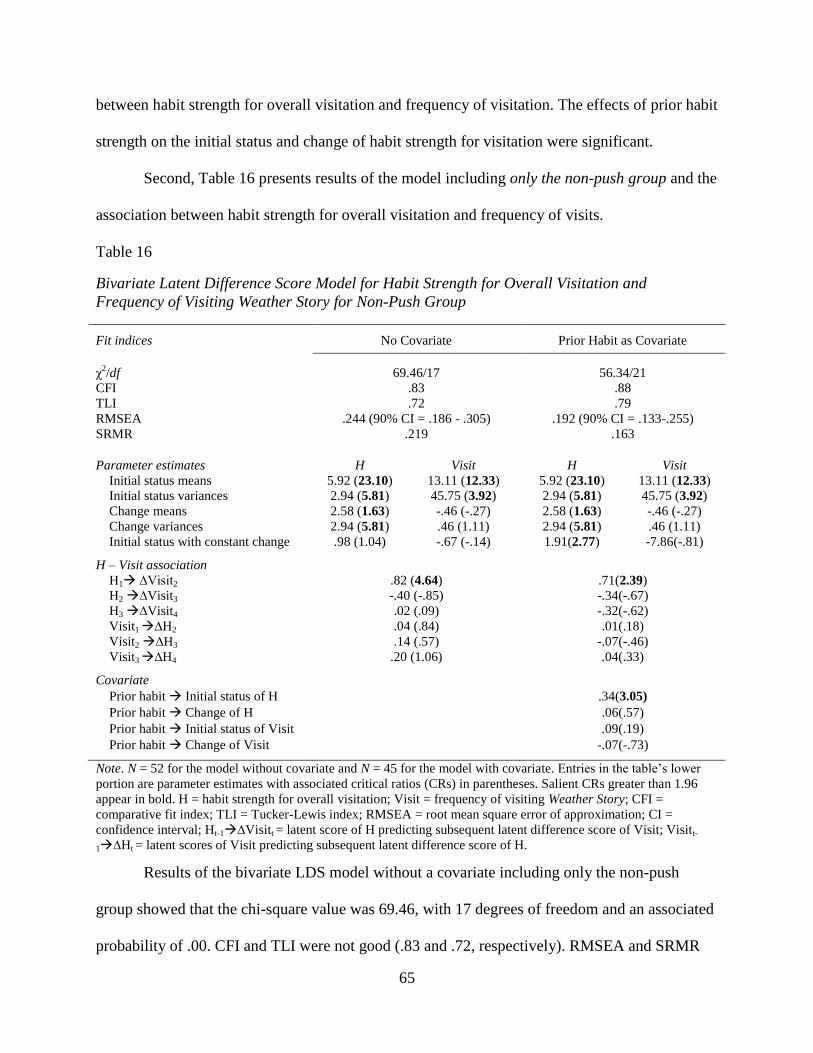
65
between habit strength for overall visitation and frequency of visitation. The effects of prior habit
strength on the initial status and change of habit strength for visitation were significant.
Second, Table 16 presents results of the model including only the non-push group and the
association between habit strength for overall visitation and frequency of visits.
Table 16
Bivariate Latent Difference Score Model for Habit Strength for Overall Visitation and
Frequency of Visiting Weather Story for Non-Push Group
Fit indices No Covariate Prior Habit as Covariate
χ2/df 69.46/17 56.34/21
CFI .83 .88
TLI .72 .79
RMSEA .244 (90% CI = .186 - .305) .192 (90% CI = .133-.255)
SRMR .219 .163
Parameter estimates H Visit H Visit
Initial status means 5.92 (23.10) 13.11 (12.33) 5.92 (23.10) 13.11 (12.33)
Initial status variances 2.94 (5.81) 45.75 (3.92) 2.94 (5.81) 45.75 (3.92)
Change means 2.58 (1.63) -.46 (-.27) 2.58 (1.63) -.46 (-.27)
Change variances 2.94 (5.81) .46 (1.11) 2.94 (5.81) .46 (1.11)
Initial status with constant change .98 (1.04) -.67 (-.14) 1.91(2.77) -7.86(-.81)
H – Visit association
H1 ∆Visit2 .82 (4.64) .71(2.39)
H2 ∆Visit3 -.40 (-.85) -.34(-.67)
H3 ∆Visit4 .02 (.09) -.32(-.62)
Visit1 ∆H2 .04 (.84) .01(.18)
Visit2 ∆H3 .14 (.57) -.07(-.46)
Visit3 ∆H4 .20 (1.06) .04(.33)
Covariate Prior habit Initial status of H .34(3.05)
Prior habit Change of H .06(.57)
Prior habit Initial status of Visit .09(.19)
Prior habit Change of Visit -.07(-.73)
Note. N = 52 for the model without covariate and N = 45 for the model with covariate. Entries in the table’s lower
portion are parameter estimates with associated critical ratios (CRs) in parentheses. Salient CRs greater than 1.96
appear in bold. H = habit strength for overall visitation; Visit = frequency of visiting Weather Story; CFI =
comparative fit index; TLI = Tucker-Lewis index; RMSEA = root mean square error of approximation; CI =
confidence interval; Ht-1∆Visitt = latent score of H predicting subsequent latent difference score of Visit; Visitt-
1∆Ht = latent scores of Visit predicting subsequent latent difference score of H.
Results of the bivariate LDS model without a covariate including only the non-push
group showed that the chi-square value was 69.46, with 17 degrees of freedom and an associated
probability of .00. CFI and TLI were not good (.83 and .72, respectively). RMSEA and SRMR

66
were high (.244 and .219, respectively). Meanwhile, for the model with prior habit strength as a
covariate, the chi-square value was 56.34, with 21 degrees of freedom and an associated
probability of .00. CFI and TLI were not good (.88 and .79, respectively). RMSEA and SRMR
were high (.192 and .163, respectively). Habit strength at T1 positively predicted the subsequent
change of frequency of visits for both the models with and without a covariate. The effect of
prior habit strength influenced the initial status of habit strength for overall visitation. Overall,
the model did not fit the data.
Lastly, Table 17 presents results of the model including only the push group and the
association between habit strength for overall visitation and frequency of visits.
Table 17
Bivariate Latent Difference Score Model for Habit Strength for Overall Visitation and
Frequency of Visiting Weather Story for Push Group
Fit indices No Covariate Prior Habit as Covariate
χ2/df 53.05/17 64.55/21
CFI .84 .82
TLI .73 .68
RMSEA .183 (90% CI = .129 - .240) .183 (90% CI = .133-.235)
SRMR .171 .142
Parameter estimates H Visit H Visit
Initial status means 5.93 (22.04) 13.67 (17.57) 5.93 (22.04) 13.67 (17.57)
Initial status variances 2.38 (3.86) 23.81 (3.54) 2.38 (3.86) 23.81 (3.54)
Change means 3.17 (4.16) -4.46 (-1.67) 3.17 (4.16) -4.46 (-1.67)
Change variances 2.38 (3.86) 1.97 (.58) 2.38 (3.86) 1.97 (.58)
Initial status with constant change 1.18 (2.32) -7.32 (-1.18) .94(2.03) -5.51(-.95)
H – Visit association H1 ∆Visit2 -1.54 (-3.65) -1.53(-3.50) H2 ∆Visit3 .45 (1.67) .40(1.47) H3 ∆Visit4 .12 (.43) .13(.45) Visit1 ∆H2 .02 (.36) -.01(-.14) Visit2 ∆H3 .04 (.72) .03(.62) Visit3 ∆H4 .03 (.45) -.00(-.05) Covariate Prior habit Initial status of H .15(1.49) Prior habit Change of H .20(2.19) Prior habit Initial status of Visit .55(1.90) Prior habit Change of Visit -.17(-.96)

67
Table 17 (Cont’d)
Note. N = 63 for the model without covariate and N = 62 for the model with covariate. Entries in the table’s lower
portion are parameter estimates with associated critical ratios (CRs) in parentheses. Salient CRs greater than 1.96
appear in bold. H = habit strength for overall visitation; Visit = frequency of visiting Weather Story; CFI =
comparative fit index; TLI = Tucker-Lewis index; RMSEA = root mean square error of approximation; CI =
confidence interval; Ht-1∆Visitt = latent score of H predicting subsequent latent difference score of Visit; Visitt-
1∆Ht = latent scores of Visit predicting subsequent latent difference score of H.
Like the other two models, results of the bivariate LDS model including only the push
group showed a bad model fit to the data. Overall, based on the results of the three
separatebivariate dual change models examining the association between habit strength for
overall visitation and frequency of visits, H2a was not supported; this study did not clearly
determine the causal relationship between habit strength and frequency of visits. However, both
groups showed similar patterns of association.
H2b proposed that habit strength for mobile application visitation would positively
predict the duration of application visits on the mobile application. To test this hypothesis, three
separated bivariate dual change models were tested: one including both groups together, another
including only the non-push group, and one including only the push group. Table 18 presents
results of the model including both groups and the association between habit strength for overall
visitation and duration per visit to Weather Story.
Table 18
Bivariate Latent Difference Score Model for Habit Strength for Overall Visitation and Duration
per Visit to Weather Story for Both Groups
Fit indices No Covariate Prior Habit as Covariate
χ2/df 71.56/17 78.77/21
CFI .86 .85
TLI .77 .75
RMSEA .167 (90% CI = .128 - .208) .160 (90% CI = .124 -.199)
SRMR .143 .130

68
Table 18 (Cont’d)
Parameter estimates H Duration H Duration
Initial status means 5.94 (32.41) 24.38 (20.69) 5.94 (32.41) 24.38 (20.69)
Initial status variances 2.47 (6.15) 34.02 (1.51) 2.47 (6.15) 34.02 (1.51)
Change means 3.45 (6.14) 31.39 (5.42) 3.45 (6.14) 31.39 (5.42)
Change variances 2.47 (6.15) 251.29 (4.24) 2.47 (6.15) 251.29 (4.24)
Initial status with constant change 1.45 (3.72) 135.56 (4.22) .94(2.03) -5.51(-.95)
H – Duration association
H1 ∆Duration2 1.30 (1.70) .94(1.13)
H2 ∆Duration3 -1.85 (-2.15) -2.56(-2.52)
H3 ∆Duration4 -.49 (-.67) -.88(-1.04)
Duration1 ∆H2 .02 (.98) .05(2.15)
Duration2 ∆H3 -.03 (-1.36) -.02(-1.09)
Duration3 ∆H4 .02 (1.76) .03(2.45)
Covariate Prior habit Initial status of H .27(3.50)
Prior habit Change of H .13(1.99)
Prior habit Initial status of Duration .16(.036)
Prior habit Change of Duration .60(.77)
Note. N = 115 for the model without covariate and N = 107 for the model with covariate. Entries in the table’s lower
portion are parameter estimates with associated critical ratios (CRs) in parentheses. Salient CRs greater than 1.96
appear in bold. H = habit strength for overall visitation; Duration = duration per visit to Weather Story; CFI =
comparative fit index; TLI = Tucker-Lewis index; RMSEA = root mean square error of approximation; CI =
confidence interval; Ht-1∆Durationt = latent score of H predicting subsequent latent difference score of Duration;
Durationt-1∆Ht = latent scores of Duration predicting subsequent latent difference score of H.
The effects of prior habit strength for visiting a weather application were tested as a
covariate for the models including habit strength for overall visitation. For the model without a
covariate, results showed that the chi-square value was 71.56, with 17 degrees of freedom and an
associated probability of .00. CFI and TLI were not good (.86 and .77, respectively). RMSEA
and SRMR were high (.167 and .143, respectively). For the model with a covariate, the chi-
square value was 78.77, with 21 degrees of freedom and an associated probability of .00. CFI
and TLI were not good (.85 and .75, respectively). RMSEA and SRMR were high (.160 and .130,
respectively). For the model without a covariate, habit strength for overall visitation at T2
predicted subsequent changes in duration per visit. However, for the model with prior habit
strength as a covariate, duration at T1 and at T3 positively predicted subsequent changes in habit

69
strength for visitation. The effects of prior habit strength on initial status and changes of habit
strength for overall visitation were significant. Overall, the model did not fit the data.
Table 19 presents results of the model including only the non-push group and the
association between habit strength for overall visitation and duration per visit.
Table 19
Bivariate Latent Difference Score Model for Habit Strength for Overall Visitation and Duration
per Visit to Weather Story for Non-Push Group
Fit indices No Covariate Prior Habit as Covariate
χ2/df 72.02/17 61.87/21
CFI .81 .86
TLI .68 .75
RMSEA .249 (90% CI = .192 - .310) .208 (90% CI = .149 -.269)
SRMR .338 .308
Parameter estimates H Duration H Duration
Initial status means 5.91 (22.16) 22.37 (14.49) 5.91 (22.16) 22.37 (14.49)
Initial status variances 3.19 (5.19) 8.00 (.37) 3.19 (5.19) 8.00 (.37)
Change means 4.05 (7.60) 28.53 (4.14) 4.05 (7.60) 28.53 (4.14)
Change variances 3.19 (5.19) 206.46 (2.95) 3.19 (5.19) 206.46 (2.95)
Initial status with constant change 1.91 (3.25) 88.01 (2.51) .94(2.03) -5.51(-.95)
H – Duration association
H1 ∆Duration2 2.55 (4.23) 2.70(4.40)
H2 ∆Duration3 -2.11 (-1.90) -1.76(-1.70)
H3 ∆Duration4 -.07 (-.08) .24(.25)
Duration1 ∆H2 -.00 (-.16) .01(.64)
Duration2 ∆H3 -.03 (-1.49) -.00(-.18)
Duration3 ∆H4 -.00 (-.22) .00(.16)
Covariate Prior habit Initial status of H .37(3.32)
Prior habit Change of H .06(.56)
Prior habit Initial status of Duration .52(.95)
Prior habit Change of Duration .98(.95)
Note. N = 52 for the model without covariate and N = 45 for the model with covariate. Entries in the table’s lower
portion are parameter estimates with associated critical ratios (CRs) in parentheses. Salient CRs greater than 1.96
appear in bold. H = habit strength for overall visitation; Duration = duration per visit to Weather Story; CFI =
comparative fit index; TLI = Tucker-Lewis index; RMSEA = root mean square error of approximation; CI =
confidence interval; Ht-1∆Durationt = latent score of H predicting subsequent latent difference score of Duration;
Durationt-1∆Ht = latent scores of Duration predicting subsequent latent difference score of H.
Results of the bivariate LDS model without a covariate including only the non-push
group showed that the chi-square value was 72.02, with 17 degrees of freedom and an associated
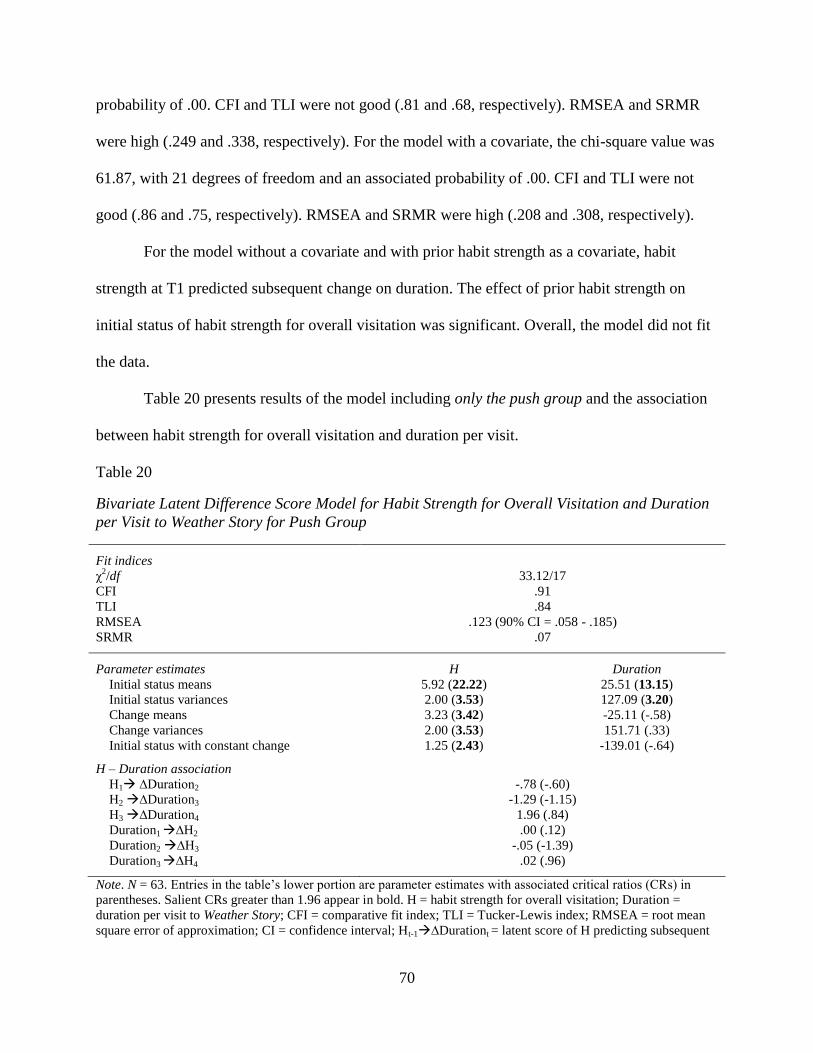
70
probability of .00. CFI and TLI were not good (.81 and .68, respectively). RMSEA and SRMR
were high (.249 and .338, respectively). For the model with a covariate, the chi-square value was
61.87, with 21 degrees of freedom and an associated probability of .00. CFI and TLI were not
good (.86 and .75, respectively). RMSEA and SRMR were high (.208 and .308, respectively).
For the model without a covariate and with prior habit strength as a covariate, habit
strength at T1 predicted subsequent change on duration. The effect of prior habit strength on
initial status of habit strength for overall visitation was significant. Overall, the model did not fit
the data.
Table 20 presents results of the model including only the push group and the association
between habit strength for overall visitation and duration per visit.
Table 20
Bivariate Latent Difference Score Model for Habit Strength for Overall Visitation and Duration
per Visit to Weather Story for Push Group
Fit indices
χ2/df 33.12/17
CFI .91
TLI .84
RMSEA .123 (90% CI = .058 - .185)
SRMR .07
Parameter estimates H Duration
Initial status means 5.92 (22.22) 25.51 (13.15)
Initial status variances 2.00 (3.53) 127.09 (3.20)
Change means 3.23 (3.42) -25.11 (-.58)
Change variances 2.00 (3.53) 151.71 (.33)
Initial status with constant change 1.25 (2.43) -139.01 (-.64)
H – Duration association
H1 ∆Duration2 -.78 (-.60)
H2 ∆Duration3 -1.29 (-1.15)
H3 ∆Duration4 1.96 (.84)
Duration1 ∆H2 .00 (.12)
Duration2 ∆H3 -.05 (-1.39)
Duration3 ∆H4 .02 (.96)
Note. N = 63. Entries in the table’s lower portion are parameter estimates with associated critical ratios (CRs) in
parentheses. Salient CRs greater than 1.96 appear in bold. H = habit strength for overall visitation; Duration =
duration per visit to Weather Story; CFI = comparative fit index; TLI = Tucker-Lewis index; RMSEA = root mean
square error of approximation; CI = confidence interval; Ht-1∆Durationt = latent score of H predicting subsequent

71
latent difference score of Duration; Durationt-1∆Ht = latent scores of Duration predicting subsequent latent
difference score of H.
Results of the bivariate LDS model including only the push group showed that the chi-
square value was 33.12, with 17 degrees of freedom and an associated probability of .01. CFI
and TLI were not good (.91 and .84, respectively). RMSEA and SRMR were high (.123 and .07,
respectively). Overall, the model did not fit the data. The model with prior habit strength as a
covariate did not converge. Overall, based on the results of the three separate bivariate dual
change models examining the association between habit strength for overall visitation and
frequency of visits, H2b was not supported.
The research question asked whether frequency of visits would positively predict the
duration of application visits on the mobile application. Three bivariate LDS models were tested
for H2c to estimate the association between frequency of visitation and duration per visit to
Weather Story for both groups together, for the non-push group, and for the push group
separately.
First, Table 21 presents results of the model including both groups.
Table 21
Bivariate Latent Difference Score Model for Frequency of Visiting and Duration per Visit to
Weather Story for Both Groups
Fit indices
χ2/df 82.60/17
CFI .72
TLI .54
RMSEA .183 (90% CI = .145 - .224)
SRMR .155
Parameter estimates Visit Duration
Initial status means 13.38 (20.02) 24.80 (20.51)
Initial status variances 43.20 (6.14) 62.56 (3.75)
Change means 2.00 (.67) 15.87 (3.97)
Change variances 21.75 (4.03) 62.56 (3.75)
Initial status with constant change 11.75 (2.55) 54.69 (3.44)

72
Table 21 (Cont’d)
Visit - Duration association
Visit1 ∆Duration2 .12 (.73)
Visit2 ∆Duration3 -1.23 (-1.86)
Visit3 ∆Duration4 -.10 (-.18)
Duration1 ∆Visit2 .30 (1.99)
Duration2 ∆Visit3 .35 (1.84)
Duration3 ∆Visit4 .18 (2.39)
Note. N = 115. Entries in the table’s lower portion are parameter estimates with associated critical ratios (CRs) in
parentheses. Salient CRs greater than 1.96 appear in bold. Visit = frequency of visiting Weather Story; Duration =
duration per visit to Weather Story; CFI = comparative fit index; TLI = Tucker-Lewis index; RMSEA = root mean
square error of approximation; CI = confidence interval; Visitt-1∆Durationt = latent score of Visit predicting
subsequent latent difference score of Duration; Durationt-1∆Visitt = latent scores of Duration predicting
subsequent latent difference score of Visit.
For this model, results showed that the chi-square value was 82.60, with 17 degrees of
freedom and an associated probability of .00. CFI and TLI were small (.72 and .54, respectively).
RMSEA and SRMR were high (.183 and .155, respectively). Overall, the model did not fit the
data.
Second, Table 22 presents results of the model including only the non-push group and the
association between habit strength for overall visitation and frequency of visits.
Table 22
Bivariate Latent Difference Score Model for Frequency of Visiting and Duration per Visit to
Weather Story for Non-Push Group
Fit indices
χ2/df 67.47/17
CFI .53
TLI .22
RMSEA .239 (90% CI = .181 - .300)
SRMR .167
Parameter estimates Visit Duration
Initial status means 13.14 (12.74) 23.37 (19.71)
Initial status variances 40.01 (3.74) 22.66 (2.02)
Change means 5.32 (2.13) 13.76 (3.49)
Change variances 5.57 (1.60) 22.66 (2.02)
Initial status with constant change 12.91 (2.30) 25.07 (2.42)
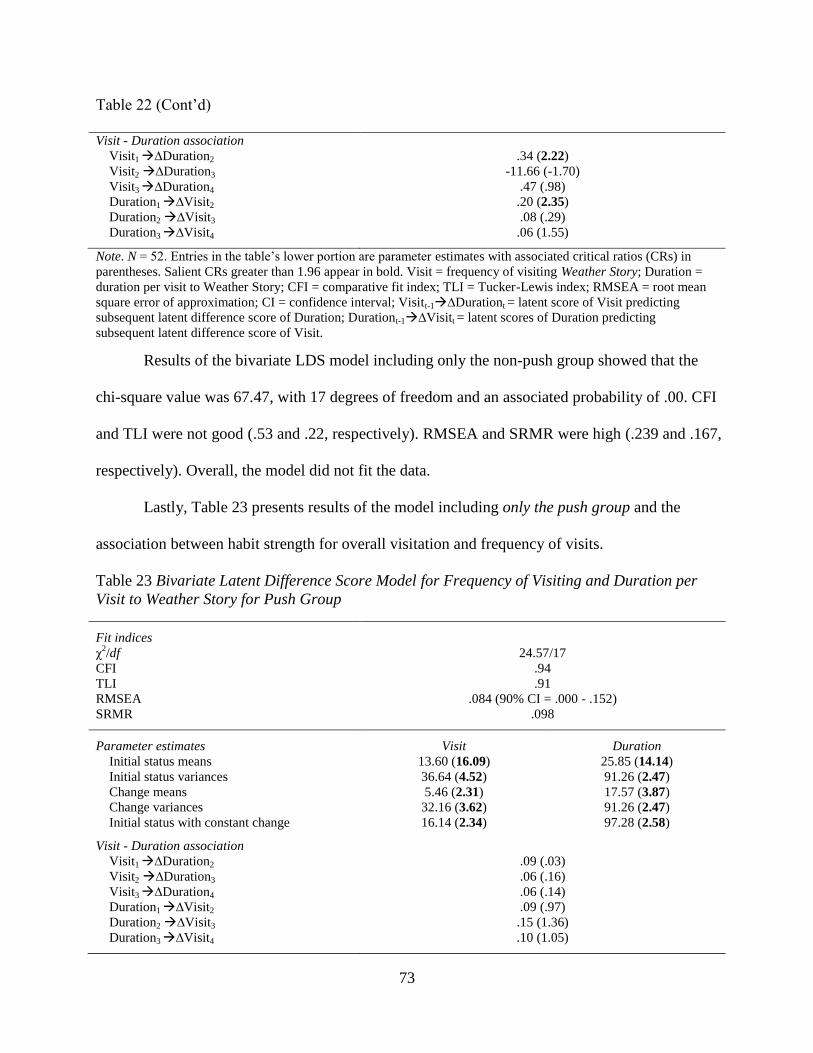
73
Table 22 (Cont’d)
Visit - Duration association
Visit1 ∆Duration2 .34 (2.22)
Visit2 ∆Duration3 -11.66 (-1.70)
Visit3 ∆Duration4 .47 (.98)
Duration1 ∆Visit2 .20 (2.35)
Duration2 ∆Visit3 .08 (.29)
Duration3 ∆Visit4 .06 (1.55)
Note. N = 52. Entries in the table’s lower portion are parameter estimates with associated critical ratios (CRs) in
parentheses. Salient CRs greater than 1.96 appear in bold. Visit = frequency of visiting Weather Story; Duration =
duration per visit to Weather Story; CFI = comparative fit index; TLI = Tucker-Lewis index; RMSEA = root mean
square error of approximation; CI = confidence interval; Visitt-1∆Durationt = latent score of Visit predicting
subsequent latent difference score of Duration; Durationt-1∆Visitt = latent scores of Duration predicting
subsequent latent difference score of Visit.
Results of the bivariate LDS model including only the non-push group showed that the
chi-square value was 67.47, with 17 degrees of freedom and an associated probability of .00. CFI
and TLI were not good (.53 and .22, respectively). RMSEA and SRMR were high (.239 and .167,
respectively). Overall, the model did not fit the data.
Lastly, Table 23 presents results of the model including only the push group and the
association between habit strength for overall visitation and frequency of visits.
Table 23 Bivariate Latent Difference Score Model for Frequency of Visiting and Duration per
Visit to Weather Story for Push Group
Fit indices
χ2/df 24.57/17
CFI .94
TLI .91
RMSEA .084 (90% CI = .000 - .152)
SRMR .098
Parameter estimates Visit Duration
Initial status means 13.60 (16.09) 25.85 (14.14)
Initial status variances 36.64 (4.52) 91.26 (2.47)
Change means 5.46 (2.31) 17.57 (3.87)
Change variances 32.16 (3.62) 91.26 (2.47)
Initial status with constant change 16.14 (2.34) 97.28 (2.58)
Visit - Duration association
Visit1 ∆Duration2 .09 (.03)
Visit2 ∆Duration3 .06 (.16)
Visit3 ∆Duration4 .06 (.14)
Duration1 ∆Visit2 .09 (.97)
Duration2 ∆Visit3 .15 (1.36)
Duration3 ∆Visit4 .10 (1.05)

74
Note. N = 63. Entries in the table’s lower portion are parameter estimates with associated critical ratios (CRs) in
parentheses. Salient CRs greater than 1.96 appear in bold. Visit = frequency of visiting Weather Story; Duration =
duration per visit to Weather Story; CFI = comparative fit index; TLI = Tucker-Lewis index; RMSEA = root mean
square error of approximation; CI = confidence interval; Visitt-1∆Durationt = latent score of Visit predicting
subsequent latent difference score of Duration; Durationt-1∆Visitt = latent scores of Duration predicting
subsequent latent difference score of Visit.
Results of the bivariate LDS model including only the push group showed that the chi-
square value was 24.57, with 17 degrees of freedom and an associated probability of .10. CFI
and TLI were good (.94 and .91, respectively). RMSEA and SRMR were .084 and .098,
respectively. Overall, the model fit was acceptable. The parameter estimates between frequency
of visitation and duration per visit to Weather Story were not significant. Thus, there was no
significant association between frequency of visitation and duration in this study.

75
DISCUSSION
In the quest to deepen the understanding of the mechanisms underlying media habits, this
dissertation proposed that push notifications, as external media prompts, would affect habit
formation, and subsequently, that higher habit strength would cause increased usage. To test the
effect of push notifications and the association between habit and usage, this dissertation
developed a simple weather forecast mobile application called Weather Story and asked
participants to use it for 20 days and complete a survey every five days, which formed the basis
for the three latent difference scores on each variable. Participants were assigned either a
condition receiving push notifications every day or another condition receiving no push
notification alerts. From the survey data and application log file data, this dissertation explored
changes in habit strength for visitation, frequency of visits, and duration of application use.
Contrary to suggestions that push notifications would influence habit formation and habit
strength would cause usage, the findings were that receiving push notification alerts on
smartphones had no effect on users’ evaluation of their habit strength but did have a direct effect
on frequency of visits to the mobile application. Prior habit strength for using a similar
application predicted the initial habit strength of using the application.
Preliminary analyses for usage behaviors and habits provided a blueprint of results for
this dissertation. First, the log file data showed steep negative slopes in frequency of visits,
especially between Time 1 and Time 2 for both the push group and non-push group (see Figure
10). In other words, users visited the application more frequently in the beginning. This
possibly indicates the users’ learning period to master the functions and features of the
application. Afterwards, the visits tapered off eventually to only once per day (average
frequency of visits for five days). Duration on application use showed mixed patterns, especially
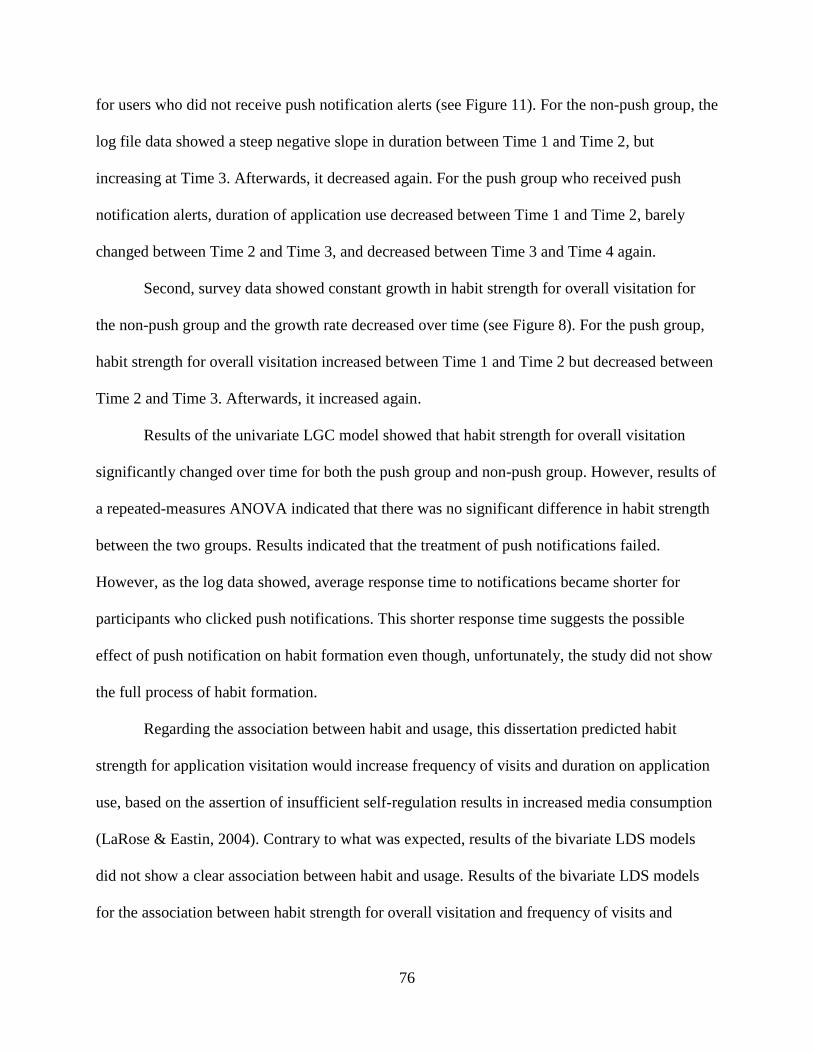
76
for users who did not receive push notification alerts (see Figure 11). For the non-push group, the
log file data showed a steep negative slope in duration between Time 1 and Time 2, but
increasing at Time 3. Afterwards, it decreased again. For the push group who received push
notification alerts, duration of application use decreased between Time 1 and Time 2, barely
changed between Time 2 and Time 3, and decreased between Time 3 and Time 4 again.
Second, survey data showed constant growth in habit strength for overall visitation for
the non-push group and the growth rate decreased over time (see Figure 8). For the push group,
habit strength for overall visitation increased between Time 1 and Time 2 but decreased between
Time 2 and Time 3. Afterwards, it increased again.
Results of the univariate LGC model showed that habit strength for overall visitation
significantly changed over time for both the push group and non-push group. However, results of
a repeated-measures ANOVA indicated that there was no significant difference in habit strength
between the two groups. Results indicated that the treatment of push notifications failed.
However, as the log data showed, average response time to notifications became shorter for
participants who clicked push notifications. This shorter response time suggests the possible
effect of push notification on habit formation even though, unfortunately, the study did not show
the full process of habit formation.
Regarding the association between habit and usage, this dissertation predicted habit
strength for application visitation would increase frequency of visits and duration on application
use, based on the assertion of insufficient self-regulation results in increased media consumption
(LaRose & Eastin, 2004). Contrary to what was expected, results of the bivariate LDS models
did not show a clear association between habit and usage. Results of the bivariate LDS models
for the association between habit strength for overall visitation and frequency of visits and

77
duration on application use did not fit the data. The estimated parameters in the models including
both users who received push notification alerts and who did not receive push notification alerts
showed contradicting results to the hypotheses of this dissertation. Habit strength for overall
visitation did not predict frequency of visits although it did negatively influence the duration of
application use. It seems that the association between habit and usage differed depending on the
condition of either receiving push notifications or not.
Results of the bivariate LDS models for each group did not support the hypothesized
effect of receiving push notifications. Results found different directions in the estimated
parameters between habit and usage. For users who did not receive push notifications, habit
strength for overall visitation at Time 1 positively predicted subsequent change in frequency of
visits (see Table 16). For users who received push notification alerts, habit strength for overall
visitation at Time 1 negatively predicted subsequent change in frequency of visits (see Table 17).
For users who did not receive push notifications, habit strength for overall visitation at Time 2
positively predicted subsequent change in duration on the application, but no significant
association was found for users who received push notifications.
Contrary to what was expected, associations between habit and usage were not clearly
revealed. The question then becomes, what is the reason for the poor model fits for the
associations in this study? Whether users visited the application periodically, repeatedly, or,
perhaps, at consistent intervals is worthy of consideration. The application usage data, however,
did not show such patterns. Both the push group and non-push group visited the application at
random times; there was no specific pattern of visiting throughout the day. Delivered push
notification alerts did not determine when users visited the application and habit was not
mutually related to specific times of the day (Lally et al., 2010). Moreover, for those who had
78
prior experience in using a weather application, their habit strength for visiting Weather Story
did not reach a level as high as their prior habit strength for visiting a weather application.
Following Lally et al. (2010), it is likely that 20 days was not long enough to establish stable
habits. In Lally’s study, the media time for participants who were either eating fruit with lunch,
drinking water with lunch, or running before dinner to reach 95% of asymptote (i.e., stable
scores in habit strength) was 66 days, with a range from 18 to 254 days. Habit strength for
overall visitation across four time points did not reach a level as high as an existing habit for
visiting a weather application, but it correlated with the existing habit.
However, users’ visiting frequency consistently decreased over time but the duration
using the application changed corresponding to weather change. Between March 31st and April
1st, the duration of using the application increased at Time 3 when the temperature dropped and
there were significant new weather events (e.g., rain or snow) that were significant. Alternatively,
the strange behavior change may be attributable to another event during Time 3. During that time,
the university’s beloved basketball team fell out of the NCAA basketball tournament. This could
have changed users’ weather application habit in unpredictable ways including disrupting a wide
range of routine activities encompassing mobile phone usage behaviors or conversely making
weather application visits more salient for some users who were planning basketball tournament
related activities outside. This increased duration of application use may reflect controlled or
conscious behavior.
Previous studies show a positive relationship between habit and media use, but this
study’s findings contradict those findings. The direction of change in application use, both
frequency of visits and duration on application use, were negative in this study, where mobile
application use decreased over time. This finding suggests that habits do not always correspond

79
to an increase in behavior. A possible explanation for this may be related to the content of the
mobile application (updating weather information). In particular, Weather Story provided a daily
summary of weather information for the whole day. Barring unexpected or abrupt weather
changes, checking weather information once a day would suffice for most users.
Besides testing the association between habit and usage, this dissertation examined the
effect of push notifications on habit formation and usage. The expected differences in habit
growth between users who did and did not receive push notifications were based on the question
of whether push notifications as a media prompt are more salient as well as active cues that lead
to application use (i.e., visits), as compared to other external cues such as location, people, or
time. In a comparison across groups of users who did or did not receive push, results of a
repeated-measures ANOVA for habit strength of overall visitation were not different between the
two groups. Meanwhile, there was a significant group difference in frequency of visits; users
who received push notifications visited the application more frequently than those who did not
receive push notifications, and the patterns of visiting behavior between two groups were the
same. Duration per visit to the application was not different between the two groups. Thus, push
notifications had no significant effect on habit strength for overall application visits or duration
on application use. However, a significant effect was observed on frequency of visits in this
study.
From testing the effects of push notifications on habits and usage behaviors, this
dissertation did not find a direct association between habit strength and application usage
behaviors, contrary to previous studies of media use, but it did find an effect of push notification
on usage behavior, especially frequency of visits. What do these findings explain then? Although
habit strength scores were not significantly different between users who received push
80
notifications and those who did not receive them, users who received notifications visited the
application more frequently than those who did not. This finding supports Fogg’s behavior
model (2009) in a very general sense, suggesting the role of triggers in performing behavior. The
time to use Weather Story was not fixed for the participants, meaning that they visited the
application at random times (i.e., when they wanted to use, needed to use, or automatically used),
but the number of visitations reached once a day. However, users who received push
notifications visited more than those who did not receive notifications. Perhaps participants in
both groups had the same level of motivation and ability to use the application but the presence
of triggers, push notifications, created additional usage behavior for push notification receivers.
However, the puzzling patterns of declining frequency of use and the anomalous duration of
visitation observed for the non-push group at T3 cannot be accounted for by Fogg’s model.
Indeed, it is not possible to determine exactly where push notifications fit in that model due to its
confounding lack of conceptual definitions.
Although this finding cannot explain the causation between usage and habits, it supports
a potential effect of push notifications as being a salient external cues that increase usage
behavior. According to stimuli-response (S-R)/reinforcement theory, behaviors are elicited by
some antecedent stimuli (Yin & Knowlton, 2006). The stimulus-behavior association is
reinforced when the consequences of the behaviors are satisfactory and, in turn, people perform
the behavior when there are the stimuli without cognitive process to respond to the stimuli. Users
who received push notifications received new and novel information (i.e., temperature change
and chances of rain or snow) via push notification alerts in an efficient and timely fashion.
Therefore, it might follow that users would develop an association between push notifications
and new and novel information through repeatedly responding to push notifications, thereby

81
increasing the likelihood of developing a habit of using mobile applications through such
notifications. Thus, even though habit strength for overall visitation did not reveal the effect of
push notifications in this study, the findings showed that users who received push notifications
may have experienced an association between push notifications and application visitation
during the study period and visited the application more frequently than users who did not
receive push notifications, reflecting a potential effect of push notifications on habit strength.
How users responded to push notifications, such as their visitation, is another
consideration. Among the 63 push group participants, 32 clicked the push notifications at least
once (range from 1 to 19) and 31 participants had no record of clicking push notifications. The
average response latency was about 3.98 minutes (SD = 8.45). Even though push notifications
were delivered with a sound or a buzz, the log file data showed that push notification clickers did
not respond to the notifications right away. Rather, they used the application at times other than
when they received push notifications. In terms of time, there was no apparent pattern of when
participants clicked the push notifications.
Another possible explanation is the technology-mediated interruption management
approach, which suggests that people consider the value of information when they experience
technology-mediated interruption (e.g., receiving push notifications) as well as context (e.g.,
mental workload, time, and locations). Users evaluate the value of information and decide
whether to accept the interruption or not (Grandihi & Jones, 2010). In this respect, the value of
weather information used in this dissertation might not be high enough to compel users to
respond to push notification interruptions. However, users came back to push notification
messages later and visited the application through push notifications. The significant differences

82
on frequency of visits between push notification clickers and non-clickers as well as between the
push group and non-push group, support the effects of push notifications as a reminder.
In conclusion, the present research tells little about the establishment and activation of
habits and the associations between habits and usage behaviors. However, it contains several
contributions to media habits literature by providing useful insights into the early development of
habits, including factors that may influence the attempts of application designers to achieve
routine use. First, the findings themselves are informative for future research. Push notifications
had a potential effect on frequent use and, in turn, habit growth. Significant differences in
frequency of visits between push notification clickers and non-clickers as well as between the
push group and non-push group support the effect of push notifications. However, push
notification alerts did not lead to immediate actions like launching the application, but may have
functioned as a reminder leading to actions later. Future researchers, therefore, would do well to
test what explains this latency. In addition, it is worth examining whether the value of
information in push notifications changes habit growth, responding actions, and application use
behaviors.
In addition, this dissertation found the effect of prior habit on habit formation and growth.
Prior experience can be a proxy for habits. For instance, In TPB literature, the frequency of past
behavior is used as a measure of habit strength (e.g., Ouelette & Wood, 1998). TAM and
UTAUT models also demonstrated that prior experience in using similar technology influences
intention to use new technology. In this study, almost 86% of participants were using a weather
forecast application. Prior habit strength was strong but habit strength for visiting Weather Story
did not reach the level of strength as high as users’ prior habit strength. Habit strength for
Weather Story was influenced by prior habit strength over time. This may reflect the impact of
83
an existing habit for using a weather application or simply the fact that, in this study, the present
manipulation was ineffective and users never established a habit. Moreover, in this study,
Weather Story is the same type of application as other weather forecast applications. However,
the findings regarding the effect of prior habit strength on habit strength contradict Peters’ (2009)
study, which demonstrated that prior mobile phone usage experience did not predict habit
strength or prospective habit strength for using mobile video phone. Future studies should
explore the effect of existing habit strength on new or similar types of application use or other
media use.
In addition, this dissertation found an association between frequency of visits and habit
strength even though the casual directions were opposite to what was expected. A possible
explanation for this contradictory result is that this study entailed the early stage of habit
formation. Future research should continue to explore the growth patterns of media habits and
change in the association between habit and media use with longer time frames.
In retrospect, a weather application was perhaps not the best choice to test habit
formation, at least not over a short period of time during a season in which weather is unstable
and when users may habitually use other weather applications. If an application provides
information that is more time sensitive, valuable, novel, or otherwise more enticing to
individuals, checking frequency and duration using the application would increase with habit
strength. Social networking sites or email provide the most common examples where checking
once a day is not enough. People seek information and content from social networking sites or
emails and other “important” sources deemed by the user more often and with more varied
expected outcomes compared to receiving weather forecast updates via an application. For
example, it is probably more rewarding to receive a personal email from a friend or receive

84
comments on a Facebook posting than to receive an impersonal update that it will rain or shine
this afternoon. When we see individuals’ media usage behavior over time, their behaviors may
increase, decrease, or become asymptotic depending on the content they access. Thus, content
and the value of information to the user determine the level of habit performance in media use by
reflecting on individuals’ motivations, expected outcomes, emotions, mental conditions, and the
effect of “flow” (see Tokunaga, 2013). In this respect, more empirical studies including various
types of application and information are needed to not only explore how media habits are formed
in different ways but also to better test whether the content and nature of information affects the
association between habit strength and media use.
A second contribution of this dissertation concerns the findings of differences between
frequency of visits and duration on application use as indicators of mobile application use.
Contrary to what was expected, frequency of visits and duration on application use were not
correlated with each other. Results of this study showed that duration on application use was
more sensitive to weather change or perhaps other external events than frequency of visits. While
frequency of visits had significant association with habit strength for visiting through push
notifications, duration of using the application did not. This finding explains why previous
studies testing mobile phone use measured the number of times a subject used a mobile phone
(Peters, 2007, 2009; Soror et al., 2012). Those studies measured the number of times subjects
used a mobile phone or ordinal measures for frequency of use to test the relationship between
habit and mobile phone use. Here, frequency of visits and duration on the application were
different indicators of application use and, thus, related to different factors influencing and
deciding behaviors. These results can be explained by the process of habit formation, otherwise
described as a shift from goal-directed action to S-R automatic behavior. It is likely that duration

85
of using the application is a better indicator of goal-directed action, whereas checking frequency
may be an indicator of S-R automatic behavior. However, Peters’ (2009) study used the number
of times users used their mobile phone as a measurement of usage and found that habit predicted
mobile phone use but expected outcomes did not.
Information-seeking style is another possible explanation for the difference between
frequency and duration in media use, particularly supporting why duration was not influenced by
push notifications. Information-seeking research suggests that information seeking behaviors
vary with many different factors such as motivations and personalities (e.g., Heinstrom, 2005,
Weiler, 2005). For example, users with low motivation do “fast surfing” and, in turn, do not
search and spend much time in using media for information seeking. Users with openness,
curiosity, and creativity do “broad scanning” and “deep diver” search information with a deep
strategic approach (Heinstrom, 2005). These types of users probably spend more time than fast
surfers in media use. Findings from previous studies support that duration is more likely
influenced by motivation, types of content, and ability to use media than by external cues and
triggers.
Third, methodologically, this study empirically introduced and examined the effects of
push notifications on habit formation and activation. Although this approach ultimately failed to
introduce a new habit, the mobile application providing a push notification service enabled the
creation, control, and use of this very tool to collect data and examine its role as part of the
subject of the research. Future experiments may benefit from the design of this study by having
longer periods of observation and using new types of applications that are less influenced by
prior habits.
86
The results of this study should be interpreted cautiously. Despite a longitudinal design
and an analytical approach that can support causal inferences, the author cannot definitively
conclude that media habits cause media use since it did not control possible confounding factors
such as physical location, events, or people. The participants might misunderstand the meaning
of “using” the application. Rather than opening the application, using the application may have
meant glancing at the notification, which may have provided the only information that was
useful to them. Moreover, this study did not provide sufficient data points to detect true growth
patterns of habit strengths for application usage. Also, the push group included significantly
more iOS users than the non-push group. However, all configurations of Weather Story for iOS
and Android versions were the same and there was no significant effect of operation system on
habit growth or application usage behavior. Further, missing data may alter the results. This
dissertation provided results using full information maximum likelihood (FIML) to estimate
missing data points, but fewer missing data would provide more accurate results. It seems that
the initial size of the panels was not large enough to cover the dropout rates. Future research
should continue to explore the growth patterns of media habits using both longitudinal designs
that cover extended time frames and robust experimental designs with large sample sizes.
A second limitation is the low response rate in recruiting participants. Although the
researcher sent out recruiting message to 24,000 students, the response rate was lower than 1%.
Also, there were 50 drop outs. A possible reason for low response rate is perceived intensity of
work. The recruiting message indicated that participants were asked to use an application for 20
days and complete four surveys. Students who received this message might feel an excessive
burden of commitment. Another possible reason is low compensation. However, higher rewards
would be unlikely to attract people to participate in the study since cash incentives of over $10

87
have diminishing returns (Dillman, 2011). Future research should pay attention to recruiting
methods and compensation to get more quality data.
A third potential limitation is the generalizability of this research to other samples and
other mobile applications. This sample was only composed of college students, who, as a group,
may display different levels of mobile application use compared to the general population, and
for whom weather information provided via the application may not be as important as it might
to other demographics. There are indications that such differences exist. A 2010 survey
conducted by the University of Colorado Boulder found that college students used mobile
phones, especially smartphones, while multitasking such as using applications while listening to
music, watching TV, and shopping (Dean, 2010). Moreover, according to the Pew Research
Center’s Internet & American Life Project in 2010, college students, particularly undergraduate
students, were more likely to use mobile phones to access the Internet or email than the overall
adult population in the survey (63% of undergraduate students versus 41% of all adults (Pew
Research Center, 2010). Consequently, the results reported in this dissertation should not be
generalized to other types of smartphone applications and information or to other demographic
groups. In this respect, future studies should test the role of importance of information with more
and different types of smartphone application user groups.

88
APPENDICES
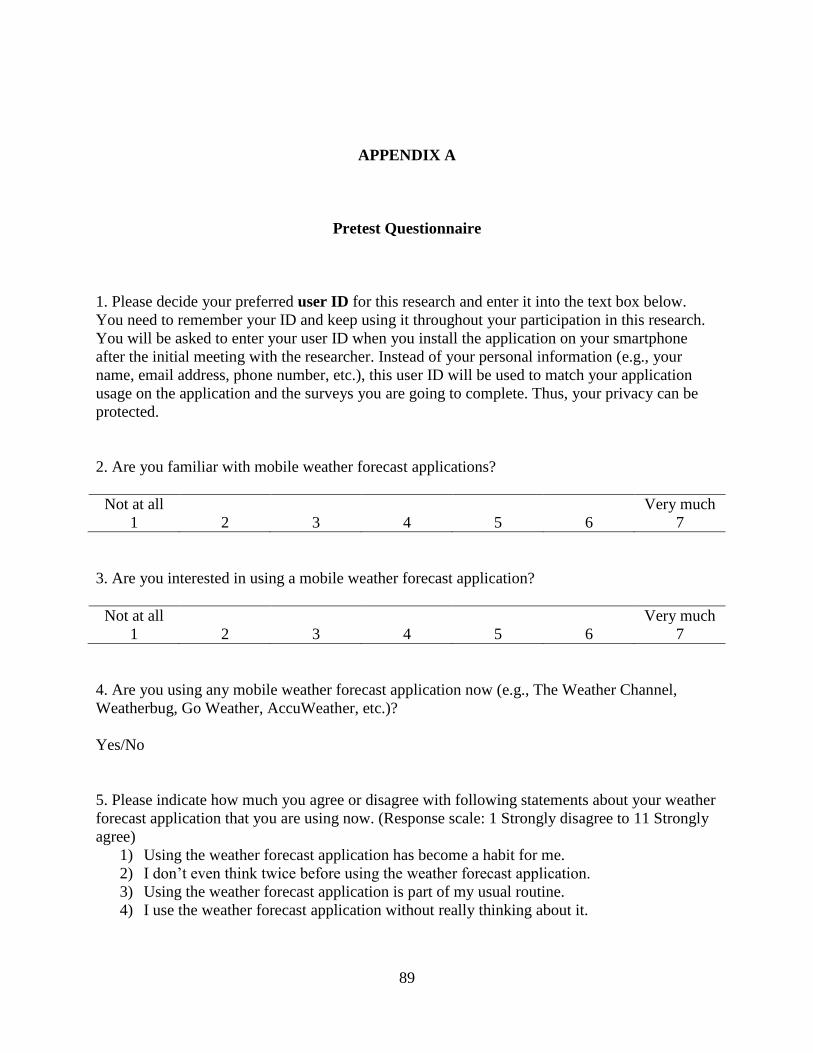
89
APPENDIX A
Pretest Questionnaire
1. Please decide your preferred user ID for this research and enter it into the text box below.
You need to remember your ID and keep using it throughout your participation in this research.
You will be asked to enter your user ID when you install the application on your smartphone
after the initial meeting with the researcher. Instead of your personal information (e.g., your
name, email address, phone number, etc.), this user ID will be used to match your application
usage on the application and the surveys you are going to complete. Thus, your privacy can be
protected.
2. Are you familiar with mobile weather forecast applications?
Not at all Very much
1 2 3 4 5 6 7
3. Are you interested in using a mobile weather forecast application?
Not at all Very much
1 2 3 4 5 6 7
4. Are you using any mobile weather forecast application now (e.g., The Weather Channel,
Weatherbug, Go Weather, AccuWeather, etc.)?
Yes/No
5. Please indicate how much you agree or disagree with following statements about your weather
forecast application that you are using now. (Response scale: 1 Strongly disagree to 11 Strongly
agree)
1) Using the weather forecast application has become a habit for me.
2) I don’t even think twice before using the weather forecast application.
3) Using the weather forecast application is part of my usual routine.
4) I use the weather forecast application without really thinking about it.

90
Main Questionnaire
1. Please enter your ID number
2. Please indicate how much you agree or disagree with following statements about your
Weather Story application usage. (Response scale: 1 Strongly disagree to 11 Strongly agree)
1) Using the Weather Story application has become a habit for me.
2) I don’t even think twice before using the Weather Story application.
3) Using the Weather Story application is part of my usual routine.
4) I use the Weather Story application without really thinking about it.
-Additional questions to push group
5) Clicking through the push notifications from Weather Story has become a habit for
me.
6) I don’t even think twice before clicking through the push notifications from Weather
Story.
7) Clicking through the push notifications from Weather Story is part of my usual
routine.
8) I click through the push notifications from Weather Story without really thinking
about it.
3. What is your gender?
Male/Female
4. What is your year of birth?
5. What is your ethnicity? Please check all that apply:
- Black or African American
- White (Not Hispanic/Not Latino)
- Hispanic or Latino
- American Indian
- Asian
- Native Hawaiian or Pacific Islander
- Multiracial (Having parents of more than one race)
- Member of race not listed above
6. For how long have you been using the current smartphone? (e.g., If you have been using your
phone since November in 2012, your answer should be 5 months. Or if you have been using your
phone since April 2012, you answer should be 12 months)
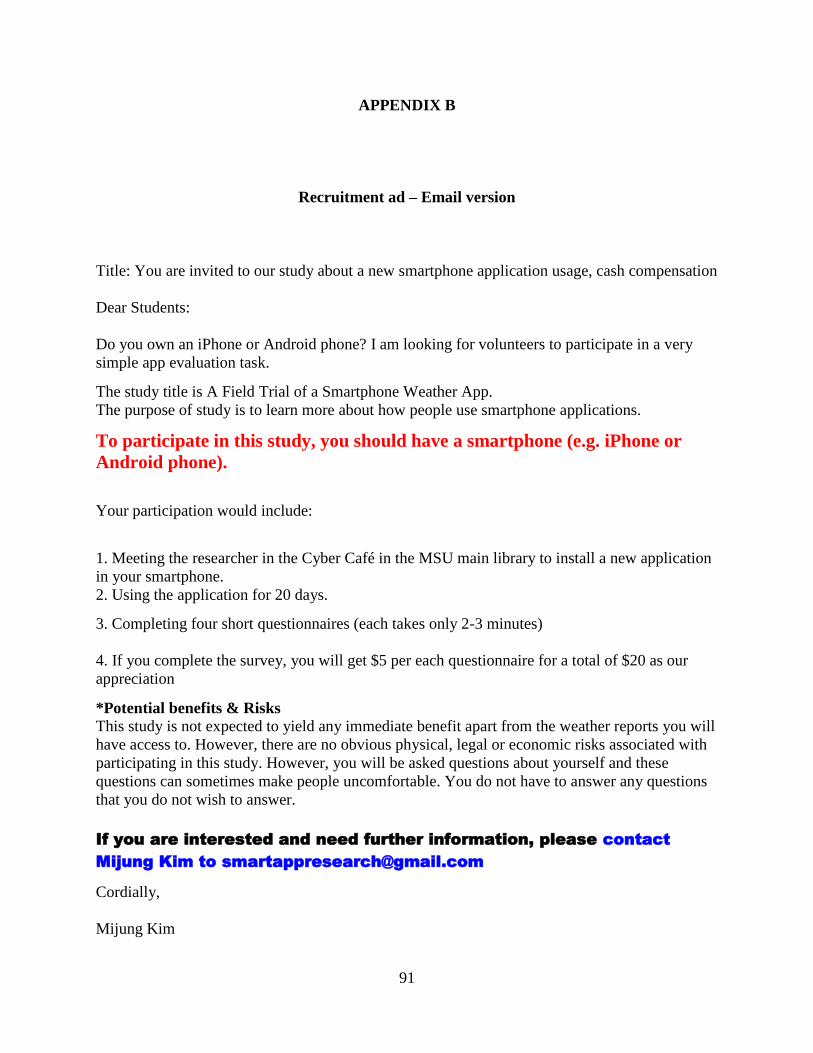
91
APPENDIX B
Recruitment ad – Email version
Title: You are invited to our study about a new smartphone application usage, cash compensation
Dear Students:
Do you own an iPhone or Android phone? I am looking for volunteers to participate in a very
simple app evaluation task.
The study title is A Field Trial of a Smartphone Weather App.
The purpose of study is to learn more about how people use smartphone applications.
To participate in this study, you should have a smartphone (e.g. iPhone or
Android phone).
Your participation would include:
1. Meeting the researcher in the Cyber Café in the MSU main library to install a new application
in your smartphone.
2. Using the application for 20 days.
3. Completing four short questionnaires (each takes only 2-3 minutes)
4. If you complete the survey, you will get $5 per each questionnaire for a total of $20 as our
appreciation
*Potential benefits & Risks This study is not expected to yield any immediate benefit apart from the weather reports you will
have access to. However, there are no obvious physical, legal or economic risks associated with
participating in this study. However, you will be asked questions about yourself and these
questions can sometimes make people uncomfortable. You do not have to answer any questions
that you do not wish to answer.
If you are interested and need further information, please contact
Mijung Kim to [email protected]
Cordially,
Mijung Kim

92
Ph.D. Candidate
Telecommunication, Information Studies, & Media
Media & Information Studies
Michigan State University

93
REFERENCES

94
REFERENCES
Agarwal. R., & Prasad, J. (1997). The role of innovation characteristics and perceived
voluntariness in the acceptance of information technologies. Decision Sciences, 28(3),
557-582. doi: 10.1111/j.1540-5915.1997.tb01322.x
Agarwal., R., & Prasad., J. (1999). Are individual differences germane to the acceptance of new
information technologies?. Decision Sciences, 30(2), 362-391. doi: 10.1111/j.1540-
5915.1999.tb01614.x
Ajzen, I. (1991). The theory of planned behavior. Organizational Behavior and Human Decision
Processes, 50(2), 179-211. doi: 10.1016/0749-5978(91)90020-T
Ajzen, I. (1996). The theory of planned behavior: A bibliography. Unpublished manuscript,
University of Massachusetts at Amherst.
Ajzen, I. (2002). Residual effects of past on later behavior: Habituation and reasoned action
perspectives. Personality and Social Psychology, 6(2), 107-122. doi:
10.1207/S15327957PSPR0602_02
Ally, M., & Gardiner, M. (2012). The moderating influence of device characteristics and usage
on user acceptance of Smart Mobile Devices. In ACIS 2012: Location, location, location:
Proceedings of the 23rd Australasian Conference on Information Systems 2012 (pp. 1-
11). ACIS/Deakin University.
Bandura, A. (1986). Social foundations of thought and action: A Social cognitive theory,
Englewood Cliffs, NJ: Prentice Hall.
Bandura, A. (2001). Social cognitive theory: An agentic perspective. Annual Review of
Psychology, 52(1), 1-26. doi: 10.1146/annurev.psych.52.1.1
Bargh, J. A. (1994). The four horsemen of automaticity: Awareness, efficiency, intention, and
control in social cognition. In R. S. Wyer, Jr., & T. K. Srull (Eds.), Handbook of social
cognition (2nd
ed., pp. 1-40), Hillsdale, NJ: Erlbaum.
Bargh, J. A., & Ferguson, M. J. (2000). Beyond Behaviorism: On the automaticity of higher
mental processes. Psychological Bulletin, 126(6), 925-945. doi: 10.1037/0033-
2909.126.6.925

95
Barkhuus, L. & Dey, A. (2003). Is context-aware computing taking control away from the user?
Three levels of interactivity examined. In Proceedings of the Fifth Annual Conference on
Ubiquitous Computing (pp.149-156). Berlin Heidelberg: Springer
Barnes, G. M., Reifman, A. S., Farrell, M. P., & Dintcheff, B. A. (2000). The effects of parenting
on the development of adolescent alcohol misuse: A six-wave latent growth model. Journal
of Marriage and Family, 62(1), 175-186. doi: 10.1111/j.1741-3737.2000.00175.x
Bianchi. A., & Phillips, J. G. (2005). Psychological predictors of problem mobile phone use.
CyberPsychology & Behavior, 8, 39–51. doi: 10.1089/cpb.2005.8.39
Billieux, J. (2012). Problematic use of the mobile phone: A literature review and a pathways
model. Current Psychiatry Reviews, 8(4), 299-307. doi: 10.1089/cpb.2005.8.39
Billieux, J., Van der Linden, M., & Rochat, L. (2008). The role of impulsivity in actual and
problematic use of the mobile phone. Applied Cognitive Psychology, 22(9), 1195-1210.
doi: 10.1002/acp.1429
Billieux, J., Van der Linden, M., d'Acremont, M., Ceschi, G., & Zermatten, A. (2007). Does
impulsivity relate to perceived dependence on and actual use of the mobile phone?.
Applied Cognitive Psychology, 21(4), 527-537. doi: 10.1002/acp.1289
Butt, S., & Phillips J. G. (2008). Personality and self reported mobile phone use. Computers in
Human Behavior, 24(2), 346-360. doi: 10.1016/j.chb.2007.01.019
Campbell, M. A. (2005). The impact of the mobile phone on young people’s social life. In
Proceedings Social Change in the 21st Century Conference, Queensland University of
Technology Carseldine, Brisbane. Retrieved from
http://eprints.qut.edu.au/archive/00003492/
Caplan, S. E. (2002). Problematic Internet use and psychosocial well-being: Development of a
theory-based cognitive-behavioral measurement instrument. Computers in Human
Behavior, 18(5), 553-575. doi: 10.1016/S0747-5632(02)00004-3
Caplan, S. E. (2003). Preference for online social interaction: A theory of problematic Internet
use and psychosocial well-being. Communication Research, 30(6), 625-648. doi:
10.1177/0093650203257842
96
Carlsson, C., Carlsson, J., Hyvönen, K., Puhakainen, J., & Walden, P. (2006). Adoption of
Mobile Devices/Services—Searching for Answers with the UTAUT. In Proceedings of the
39th Annual Hawaii International Conference on System Sciences, 2006
Cerami, E. (1998). In delivering push. New York: McGraw-Hill.
Cheung, C. M. K., & Limayen, M. (2005). The role of habit in information system continuance:
Examining the evolving relationship between intention and usage. In Proceedings of the
26th International Conference on Information Systems, D. Avison, D. Galletta, & J. I.
DeGross (Eds.), Las Vegas, NV, December 11-14, 471-482.
Chittaranjan, G., Blom, J., & Gatica-Perez, D. (2011). Who’s who with Big-Five: Analyzing and
classifying personality traits with smartphones. In Proceedings of IEEE International
Symposium on Wearable Computers (ISWC), San Francisco.
Collins, L. M, Schafer, J.L., & Kam, C.M. (2001). A comparison of inclusive and restrictive
strategies in modern missing data procedures. Structural Equation Modeling, 6, 330-351.
doi: 10.1037/1082-989X.6.4.330
Curran, P., Harford, T., & Muthén, B. (1996). The relation between heavy alcohol use and bar
patronage: A latent growth model. Journal of Studies on Alcohol and Drugs, 57(4), 410-
418.
Curran, P., Obeidat, K., & Losardo, D. (2010). Twelve frequently asked questions about growth
curve modeling. Journal of Cognition and Development, 11(2), 121-136. doi:
10.1080/15248371003699969
Davis, F. D. (1989). Perceived usefulness, perceived ease of use, and user acceptance of
information technology, MIS Quarterly, 13, 319-339.
Davis, R. A. (2001). A cognitive-behavioral model of pathological Internet use. Computers in
Human Behavior, 17(2), 187-195. doi: 10.1016/S0747-5632(00)00041-8
Davis, F. D., Bagozzi, R. P., & Warshaw, P. R. (1992). Extrinsic and intrinsic motivation to use
computers in the workplace. Journal of Applied social Psychology, 22(14), 1111-1132. doi:
10.1111/j.1559-1816.1992.tb00945.x
Dillman, D. A. (2011). Mail and Internet surveys: The tailored design method--2007 Update
with new Internet, visual, and mixed-mode guide. John Wiley & Sons.

97
Drews, F. A., Yazdani, H., Godfrey, C. N., Cooper, J. M., & Strayer, D. L. (2009). Text
messaging during simulated driving. Human Factors: The Journal of the Human Factors
and Ergonomics Society, 51(5), 762-770. doi: 10.1177/0018720809353319
Duncan, T. E., Duncan, S. C., & Stoolmiller, M. (1994). Modeling developmental processes
using latent growth structural equation methodology. Applied Psychological Measurement,
18, 343-354. doi: 10.1177/014662169401800405
Edmunds. A., & Morris, A. (2000). The problem of information overload in business
organizations: A review of the literature. International Journal of Information
Management, 20, 17-28. doi: 10.1016/S0268-4012(99)00051-1
Fischer, J. E., Yee, N., Bellotti, V., Good, N., Benford, S., & Greenhalgh, C. (2010). Effects of
content and time of delivery on receptivity to mobile interruptions. In Proceedings of the
12th
international conference on Human computer interaction with mobile devices and
services (pp. 103-112). ACM.
Fishbein, M. & Azjen, I. (1975). Belief, Attitude, intention and behavior: An introduction to
theory and research. Boston: Addison-Wesley.
Finkel, S. E. (1995). Causal analysis with panel data, Beverly Hills: Sage Publication.
Fogg, B. J. (2009a, April). A behavior model for persuasive design. In Proceedings of the 4th
international Conference on Persuasive Technology (p. 40). ACM.
Fogg, B. J. (2009b, April). The behavior grid: 35 ways behavior can change. In Proceedings of
the 4th international Conference on Persuasive Technology (p. 42). ACM.
Geser, H. (2004). Towards a sociological theory of the mobile phone. Sociology in Switzerland:
Sociology of the Mobile Phone. Retrieved from http://www.socio.ch/mobile/t_geser1.htm
Girden, E. (1992). ANOVA: Repeated measures. Newbury Park, CA: Sage.
Governors Highway Safety Association (2013). Distracted driving laws. Retrieved from
http://www.ghsa.org/html/stateinfo/laws/cellphone_laws.html
Graham, J. W. (2003). Adding missing-data-relevant variables to FIML-based structural equation
models. Structural Equation Modeling, 10, 80-100. doi: 10.1207/S15328007SEM1001_4

98
Grandhi, S. & Jones, Q. (2010). Technology-mediated interruption management. International
Journal of Human-Computer Studies, 68(2010), 288-306. doi: 10.1016/j.ijhcs.2009.12.005
Graybiel, A. M. (2008). Habits, rituals, and the evaluative brain. Annual Review of
Neuroscience, 31(1), 359-387. doi: 10.1146/annurev.neuro.29.051605.112851
Guinea, A. O. & Markus, M. L. (2009). Why break the habit of a lifetime? Rethinking the roles
of intention, habit, and emotion in continuing information technology use. MIS Quarterly,
33(3), 433-444.
Heinström, J. (2005). Fast surfing, broad scanning and deep diving: The influence of personality
and study approach on students' information-seeking behavior. Journal of documentation,
61(2), 228-247.
Hosking, S. G., Young, K. L., & Regan, M. A. (2009). The effects of text messaging on young
drivers. Human Factors, 51(4), 582-592. doi: 10.1177/0018720809341575
Hu, L. T., & Bentler, P. M. (1999). Cutoff criteria for fit indexes in covariance structure analysis:
Conventional criteria versus new alternatives. Structural Equation Modeling, 6, 1-55. doi:
10.1080/10705519909540118
Hull, C.L. (1943). Principles of behavior: An introduction to behavior theory. New York:
Appleton-Century-Crofts.
Hur, M. H. (2006). Demographic, habitual, and socioeconomic determinants of Internet
addiction disorder: An empirical study of Korean teenagers. Cyberpsychology & behavior,
9(5), 514-525. doi: 10.1089/cpb.2006.9.514
International Telecommunication Union (2013). The World in 2013: ICT facts and figures.
Retrieved from: http://www.itu.int/en/ITU-
D/Statistics/Documents/facts/ICTFactsFigures2013.pdf
Jenaro, C., Flores, N., Comez-Vela, M., Gonzalez-Gil, F., & Caballo, C. (2007). Problematic
Internet and cell-phone use: Psychological, behavioral, and health correlates. Addiction
Research and Theory, 15(3), 309-320. doi: 10.1080/16066350701350247
Jenny Dean (2010). Smartphone user survey: A glimpse into the mobile lives of college students.
Retrieved from http://testkitchen.colorado.edu/reports/smartphone/smartphone-survey/
Ji, M., & Wood, W. (2007). Purchase and consumption habits: Not necessarily what you intend.
Journal of consumer psychology, 17(4), 261-276. doi: 10.1016/S1057-7408(07)70037-2

99
Kang, Y. M., Cho, C., & Lee, S. (2011). Analysis of factors affecting the adoption of
smartphones. In Proceedings of the Technology Management Conference, 2011 (pp. 919-
925). IEEEE International.
Kanny, D. A. (2005). Cross-lagged panel design. In B. S. Everitt & D. C. Howell (Eds.),
Encyclopedia of Statistics in Behavioral Science (pp. 450-451). New York: Wiley.
Kim, B. (2012). The diffusion of mobile data services and applications: Exploring the role of
habit and its antecedents. Telecommunications Policy, 36, 69-81. doi:
10.1016/j.telpol.2011.11.011
Kim, J., LaRose, R., & Peng, W. (2009). Loneliness as the cause and the effect of problematic
Internet use: The relationship between Internet use and psychological well-being.
CyberPsychology & Behavior, 12(4), 451-455. doi: 10.1089/cpb.2008.0327
Kircher, A., Vogel, K., Tornros, J., Bolling, A., Nilsson, L., Patten, C., Malmstrom, T., Ceci, R.
(2004). Mobile telephone simulator study. Linkoping, Sweden: Swedish National Road and
Transport Research Institute. Retrieved from:
http://www.cellphonefreedriving.ca/media/VTI_Mbl_sim_report_2004_M969A.pdf
Koo, H. (2010). Cell phone addiction in high school students and its predictors. Child Health
Nursing Research. 16(3), 203-210.
Kwon, H. S., & Chidambaram, L. (2000, January). A test of the technology acceptance model:
The case of cellular telephone adoption. In Proceedings of the 33rd
Annual Hawaii
International Conference on System Sciences (pp. 1023). IEEE Computer Society.
Lally, P., Jaarsveld, C. H., Potts, H. W., & Wardle, J. (2010). How are habits formed: Modeling
habit formation in the real world. European Journal of Social Psychology, 40, 998-1009.
doi: 10.1002/ejsp.674
LaRose, R. (2010). The problem of media habits. Communication Theory, 20(2010), 194-222.
doi: 10.1111/j.1468-2885.2010.01360.x
LaRose, R. (2013). The psychology of interactive media habits.
LaRose, R., & Eastin, M. S. (2004). A social cognitive theory of Internet uses and gratifications:
Toward a new model of media attendance. Journal of Broadcasting and Electronic
Media, 48, 358-377. doi: 10.1207/s15506878jobem4803_2
100
LaRose, R., Kim, J. H., & Peng, W. (2010). Social networking: addictive, compulsive,
problematic, or just another media habit? In Z. Pappacharissi (Ed.), A Networked self:
Identity Community, and Culture on Social Network Sites (pp. 59-81). NY: Routledge.
LaRose, R., Lin, C. A., & Eastin, M. S. (2003). Unregulated Internet usage: Addiction, habit, or
deficient self-regulation? Media Psychology, 5(3), 225-253.
LaRose, R., Mastro, D., & Eastin, M.S. (2001). Understanding Internet usage – A social-
cognitive approach to uses and gratifications. Social Science Computer Review, 19, 395-
413. doi: 10.1177/089443930101900401
Lee, D., & LaRose, R. (2007). A socio-cognitive model of video game usage. Journal of
Broadcasting & Electronic Media, 51(4), 632-650. doi: 10.1080/08838150701626511
Leung, L., & Wei, R. (2000). More than just talk on the move: Uses and gratifications of the
cellular phone. Journalism and Mass Communication Quarterly, 77(2), 308–320. doi:
10.1177/107769900007700206
Li, D. (2007). Why do you blog: A uses-and-gratifications inquiry into bloggers' motivations.
Paper presented at the annual meeting of International Communication Association, San
Francisco, CA.
Limayem, M., Hirt, S. G., & Cheung, C. M. K. (2007). How habit limits the predictive power of
intention: The case of information systems continuance. Management Information
Systems Quarterly, 31(4), 705–737.
Markus, M. L. (2005). The Technology Shaping Effects of e-Collaboration Technologies—Bugs
and Features. International Journal of e-Collaboration, 1(1), 1-23. doi:
10.4018/jec.2005010101
Markus, M. L., & Silver, M. S. (2008). A Foundation for the Study of IT Effects: A New Look at
DeSanctis and Poole’s Concepts of Structural Features and Spirit. Journal of the
Association for Information Systems, 9(10), 609-632.
Marlatt, G. A., Baer, J. S., Donnovan, D. M., & Kivlahan, D. R. (1988). Addictive behaviors:
Etiology and treatment. Annual Review of Psychology, 39, 223-252. doi:
10.1146/annurev.ps.39.020188.001255
McArdle, J. J., & Hamagami, F. (2001). Latent difference score structural models for linear
dynamic analyses with incomplete longitudinal data. In L. Collins & A. Sayer (Eds.),

101
New methods for the analysis of change (pp. 137–175). Washington, DC: American
Psychological Association.
McEvoy, S. P., Stevenson, M. R., & Woodward, M. (2006). The impact of driver distraction on
road safety: Results from a representative survey in two Australian states. Injury
Prevention, 12, 242-247. doi: 10.1136/ip.2006.012336
Movemofitness (2012, February 14th
). How to create a habit: A summary of the Fogg behavioral
model in MoveMe – Motivation & Habit Building. Retrieved from
http://movemofitness.com/2012/02/how-to-create-a-habit-a-summary-of-the-fogg-
behavioral-model/
Neal, D. T., Wood, W., Labrecque, J. S., & Lally, P. (2011). How do habits guide behavior?
Perceived and actual triggers of habits in daily life. Journal of Experimental Social
Psychology (2011), doi:10.1016/j.jesp.2011.10.011
Neal, D. T., Wood, W., Wu, M., & Kurlander, D. (2011). The pull of the past: When do habits
persist despite conflict with motives?. Personality and Social Psychology Bulletin,
37(11), 1428-1437. doi: 10.1177/0146167211419863
Newell, J. (2003). The role of habit in the selection of electronic media. Doctoral dissertation,
Michigan State University.
Nielsen (2012). State of the appnation – A year of change and growth in U.S. smartphones.
Retrieved from http://www.nielsen.com/us/en/newswire/2012/state-of-the-appnation-
%C3%A2%C2%80%C2%93-a-year-of-change-and-growth-in-u-s-smartphones.html
Nielsen (2013). Mobile majority: U.S. Smartphone ownership tops 60%. Retrieved from
http://www.nielsen.com/us/en/newswire/2013/mobile-majority--u-s--smartphone-
ownership-tops-60-.html
Ouellette, J.A. (1996). How to measure habit? Subjective experience and past behavior. Doctoral
dissertation, Texas A&M University.
Ouellette, J. A., & Wood, W. (1998). Habit and intention in everyday life: The multiple
processes by which past behaviour predicts future behaviour. Psychological Bulletin,
124(1), 54–74. doi: 10.1037/0033-2909.124.1.54

102
Oulasvirta, A., Rattenbury, T., Ma, L., & Raita, E. (2012). Habits make smartphone use more
pervasive. Personal and Ubiquitous Computing, 16(1), 105-114. doi: 10.1007/s00779-
011-0412-2
Ozcan, Y. Z., & Kocak, A. (2003). Research note: A need or a status symbol?: Use of cellular
telephones in Turkey. European Journal of Communication, 18(2), 241-254. doi:
10.1177/0267323103018002004
Park, W. K. (2005). Mobile phone addiction. In R. Ling and P. E. Pedersen (Eds.) Mobile
Communications: Re-negotiation of the Social Sphere. (pp. 253-272). London: Springer.
Park, N., Lee, K. M., & Cheong, P. H. (2008). University instructors’ acceptance of electronic
courseware: An application of the technology acceptance model. Journal of Computer-
Mediated Communication, 13(2008), 163-186. doi: 10.1111/j.1083-6101.2007.00391.x
Park, J., Yang, S., & Lehto, X. (2007). Adoption of mobile technologies for Chinese consumers.
Journal of Electronic Commerce Research, 8(3), 196-206.
Pavlov I. P. (1927). Conditioned reflexes: An investigation of the physiological activation of the
cerebral cortex. London: Oxford Univ. Press.
Perlow, L. A. (2012). Sleeping with your smartphone: how to break the 24/7 habit and change
the way you work. Boston: Harvard Business Review Press.
Peters, O. (2007).Social Psychological Determinants of Mobile Communication Technology Use
and Adoption: A Comparison of Three Models to Explain and Predict Mobile
Communication Technology Behavior. Doctoral dissertation, University of Twente, The
Netherlands.
Peters, O. (2009). A social cognitive perspective on mobile communication technology use and
adoption. Social Science Computer Review, 27(1), 76-95. doi:
10.1177/0894439308322594
Peters, O., & Allouch, S. B. (2005). Always connected: A longitudinal field study of mobile
communication. Telematics and Informatics, 22(3), 239-256. doi:
10.1016/j.tele.2004.11.002
Peters, O., Almekinders, J. J., Van Buren, R. L. J., Snippers, R., & Wessels, J. T. J. (2003, May).
Motives for SMS use. Paper presented at the annual conference of the International
Communication Association, San Diego, CA.

103
Pew Research Center (2010). College students and technology. Retrieved from
http://www.pewinternet.org/Reports/2011/College-students-and-technology/Report.aspx
Quellette, J. A., & Wood, W. (1998). Habit and intention in everyday life: The multiple
processes by which past behavior predicts future behavior. Psychological bulletin,
124(1), 54-74. doi: 10.1037/0033-2909.124.1.54
Rubin, A. M. (2002). The uses-and-gratifications perspective of media effects. In Anonymous
(Ed.), Media effects: advances in theory and research (pp. 525-548). Mahwah, NJ:
Lawrence Elbaum Associates.
Rogers, E. (1995). Diffusion of Innovations. New York, NY: Free Press.
Saling, L. L., & Phillips, J. G. (2007). Automatic behavior: Efficient not mindless. Brain
Research Bulletin, 73(1-3), 1-20. doi: 10.1016/j.brainresbull.2007.02.009
Shaffer, H. J., Hall, M. N., & Vander Bilt, J. (2000). " Computer addiction": a critical
consideration. American Journal of Orthopsychiatry. 70(2), 162-168. doi:
10.1037/h0087741
Sheppard, B. H., Hartwick, J., & Warshaw, P. R. (1988). The theory of reasoned action: A meta-
analysis of past research with recommendations for modifications and future research.
Journal of Consumer Research, 15, 352-343.
Soror, A. A., Steelman, Z. R., & Limayem, M. (2012). Discipline yourself before life disciplines
you: Deficient self-regulation and mobile phone unregulated use. 2012 45th
Hawaii
International Conference on System Sciences (HICSS), 849-858.
doi:10.1109/HICSS.2101.219
Takao, M., Takahashi, S., & Kitamura, M. (2009). Addictive personality and problematic mobile
phone use. CyberPsychology & Behavior, 12(5), 501-507. doi: 10.1089/cpb.2009.0022
Taylor, S., & Todd, P. A. (1995). Understanding information technology usage: A test of
competing models. Information Systems Research, 6(4), 144-176. doi:
10.1287/isre.6.2.144
Teo, T. S. H., & Pok, S. H. (2003). Adoption of WAP-enabled mobile phones among Internet
users. International Journal of Management Science, 31, 483-498. doi:
10.1016/j.omega.2003.08.005

104
Thompson, R. L., Higgins, C. A., & Howell, J. M. (1994). Influence of experience on personal
computer utilization: Testing a conceptual model. Journal of Management Information
Systems, 11(1), 167-187.
Tokunaga, R. S. (2013). Engagement with novel virtual environments: The role of perceived
novelty and flow in the development of the deficient self-regulation of Internet use and
media habits. Human Communication Research, 13, 365-393. doi: 10.1111/hcre.12008
Tokunaga, R. S. & Rains, S. A. (2010). An evaluation of two characterizations of the
relationships between problematic Internet use, time spent using the Internet, and
psychosocial problems. Human Communication Research, 36, 512-545. doi:
10.1111/j.1468-2958.2010.01386.x
Turkle, S. (2008). Always-on/always-on-you: The tethered self. In Katz J.E (Ed.), Handbook of
Mobile Communication Studies (pp. 121-137). Cambridge, MA Press: MIT.
Venkatesh, V., & Davis, F. D. (2000). A theoretical extension of the technology acceptance
model: Four longitudinal field studies. Management Science, 46(2), 186-204. doi:
10.1287/mnsc.46.2.186.11926
Venkatesh, V., Morris, M. G., Davis, G. B., & Davis, F. D. (2003). User acceptance of
information technology: Toward a unified view. MIS Quarterly, 27(3), 425–478.
Venkantesh, V., Thong, J. Y. L., & Xu, X. (2012). Consumer acceptance and use of information
technology: Extending the unified theory of acceptance and use of technology. MIS
Quarterly, 36(1), 157-178.
Verkasalo, H., Lopez-Nicolas, C., Molina-Castillo, F. J., & Bouwman, H. (2010). Analysis of
users and non-users of smartphone applications. Telematics and Informatics, 27(3), 242-
255. doi: 10.1016/j.tele.2009.11.001
Verplanken, B. (2006). Beyond frequency: Habit as mental construct. British Journal of Social
Psychology, 45(3), 639–656. doi: 10.1348/014466605X49122
Verplanken, B., & Melkevik, O. (2008). Predicting habit: The case of physical exercise.
Psychology of Sport and Exercise, 9, 15-26. doi: 10.1016/j.psychsport.2007.01.002

105
Verplanken, B., & Orbell, S. (2002). Reflections on past behavior: A self-report index of habit
strength. Journal of Applied Social Psychology, 33(6), 1313-1330. doi: 10.1111/j.1559-
1816.2003.tb01951.x
Verplanken, B., & Wood, W. (2006). Interventions to break and create consumer habits. Journal
of Public Policy & Marketing, 25(1), 90-103. doi: 10.1509/jppm.25.1.90
Walsh, S. P., White, K. M., Cox, S., & Young. R. M. (2011). Keeping in constant touch: The
predictors of young Australians’ mobile phone. Computers in Human Behavior, 27(1), 333-
342. doi: 10.1016/j.chb.2010.08.011
Walsh, S. P., White, K. M., Hyde, M. K., & Watson, B. (2008). Dialing and driving: Factors
influencing intentions to use a mobile phone while driving. Accident Analysis & Prevention,
40(6), 1893-1900. doi: 10.1016/j.aap.2008.07.005
Watson, J. B. (1919). Psychology from the standpoint of a behaviorist. Philadelphia, PA:
Lippincott.
Wei, R. (2008). Motivations for using the mobile phone for mass communications and
entertainment. Telematics and Informatics, 25(2008), 36-46. doi:
10.1016/j.tele.2006.03.001
Wei, R., & Lo, V. (2006). Staying connected while on the move: Cell phone use and social
connectedness. New Media & Society, 8(1), 53-72. doi: 10.1177/1461444806059670
Weiler, A. (2005). Information-seeking behavior in Generation Y students: Motivation, critical
thinking, and learning theory. The Journal of Academic Librarianship, 31(1), 46-53.
White, M. P., Eiser, J. R., & Harris, P. R. (2004). Risk perceptions mobile phone use while
driving. Risk Analysis, 24(2), 323-334. doi: 10.1111/j.0272-4332.2004.00434.x
Wood, W., & Neal, D. T. (2007). A new look at habits and the habit-goal interface.
Psychological Review, 114(4), 843-863. doi: 10.1037/0033-295X.114.4.843
Xu, Z., & Zhu, S. (2012). Abusing notification services on smartphones for phishing and
spamming. Proceedings of the 6th
USENIX conference on Offensive Technologies,
WOOT’12, USA, 1-11. Paper retrieved from
https://www.usenix.org/system/files/conference/woot12/woot12-final7.pdf

106
Yin, H. H., & Knowlton, B. J. (2006). The role of the basal ganglia in habit formation. Nature
Reviews. Neuroscience, 7(6), 464-476. doi: 10.1038/nrn1919
Young, K. S. (1998). Internet addiction: The emergence of a new clinical disorder. Cyber
Psychology & Behavior, 1(3), 237-244. doi:10.1089/cpb.1998.1.237.
Zakaria, N. (2003). Push technologies: the favorable future communication technology. 4th
Annual Multimedia Systems, Electronics, and Computer Science. University of South
Hampton.