Embed Size (px)
Citation preview
Dissertação
Mestrado em Negócios Internacionais
The effects of ethical behavior on the profitability of
firms – a study of the Portuguese construction
industry
Maria Ermelinda Rendeiro Vieira
Leiria, Novembro de 2013
Dissertação
Mestrado em Negócios Internacionais
The effects of ethical behavior on the profitability of
firms – a study of the Portuguese construction
industry
Maria Ermelinda Rendeiro Vieira
Dissertação de Mestrado realizada sob a orientação da Professora Doutora Tânia de Matos
Gomes Marques, Professora da Escola Superior de Tecnologia e Gestão do Instituto Politécnico
de Leiria
Leiria, Novembro de 2013.

i
To my daughter Maria, the greatest motivation in my life

ii
Esta página foi intencionalmente deixada em branco
iii
Acknowledgements
First and above all, I would like to thank my parents, for providing me with the
most important things in life, for always being there and supporting me thorughout my
journey. A special thanks to my father for teaching me that the sky is the limit, and that I
should never settle for second base. You are the greatest hero in my life.
Thanks to my family for the absences, for putting up with the stressful days, for all
the love and understanding. To my husband, for all the patience during these last two
years. To my daughter, for always telling me that I could do it, and for being my biggest
motivation.
I would also like to thank my friends for helping me keep my sanity over the last
year. A special thanks to Eduardo who despite of being busy with his own dissertation was
always available to help with any question or doubt, or for just giving me a push!
A very special thanks to my professor, supervisor, and also coordinator of the
International Business Masters, Professor Tânia Marques, for believing in me all the way,
and for all the energy and motivation, in times when I just felt like giving up. You are a
truly an inspiration to all of us!
Also, a special thanks to Prof. Cátia Crespo for the availability and precious help
provided with the statistics analysis.
Many thanks to all of my professors in the International Business Masters, for the
teachings, dedication, willingness and constant availability: Prof. Manuel Portugal, Prof.
Liliana Pimentel, Prof. Lígia Febra, Prof. Márcio Lopes, Prof. José Dantas, Prof. Rui Rijo,
Prof. Rui Santos, Prof. Carlos Silva, Prof. Teresa Eugénio.

iv
Esta página foi intencionalmente deixada em branco
v
Resumo
O principal objectivo desta dissertação é estudar os efeitos do comportamento ético na
rentabilidade financeira das empresas. A responsabilidade social foi utilizada como
indicador do desempenho ético. Após analisar os indicadores financeiros ROA e PM, duma
amostra das vinte maiores empresas de construção civil em Portugal, entre 2007 e 2011,
concluímos que o desempenho ético está significativamente relacionado com o indicador
financeiro ROA. No entanto, não obtivemos qualquer evidência estatística que indique que
haja uma relação entre o desempenho ético e o PM. Embora a pontuação obtida seja muito
baixa em todos os índices da RSC, podemos concluir que as empresas estão mais atentas às
questões ambientais do que às questões éticas. Os gestores de topo das empresas de
construção civil devem desenvolver um olhar mais atento às suas actividades de RSC, e
não devem negligenciar o impacto da inactividade social no desempenho financeiro da
empresa. Embora existam alguns bons exemplos a seguir, ainda existe um longo caminho a
percorrer para a maioria das empresas deste sector de actividade. As limitações,
contribuições e recomendações para investigação futura são apresentadas no final desta
dissertação.
Palavras-chave: ética, responsabilidade social, rentabilidade, construção

vi
Esta página foi intencionalmente deixada em branco
vii
Abstract
The main objective of this dissertation is to analyze the effects of ethical behavior on a
firm’s financial profitability. Corporate social responsibility has been used as an indicator
of ethical performance. After analyzing the financial indicators ROA and PM, from a
sample of the twenty biggest civil construction companies in Portugal, between 2007 and
2011, we conclude that ROA is significantly related to a firm’s ethical performance.
However, we did not find any statistical evidence that relates PM to ethical performance.
Although the scores are very low on all CSR indexes, we can conclude that companies,
who are exporting, seem to be more concerned with environmental issue than ethical
issues. The top management in the civil construction should take a deeper look into their
CSR activities, and should not neglect the impact social inactivity may have on their
financial performance. Although, there are some examples to look up to, there is still a
long way to go for the majority of companies in this industry. Limitations and
recommendations for future research are provided at the end of this dissertation.
Key-Words: ethics, corporate social responsibility, profitability, construction

viii
Esta página foi intencionalmente deixada em branco
ix
Index of Figures
Figure 1. Carroll’s Social Responsibility Pyramid ................................................................ 9 Figure 2. Index of production in civil construction and public works – 2007/2013 ........... 13 Figure 3. Frequency graph - nº of times companies appear on database - 2007/2011 ........ 21

x
Esta página foi intencionalmente deixada em branco
xi
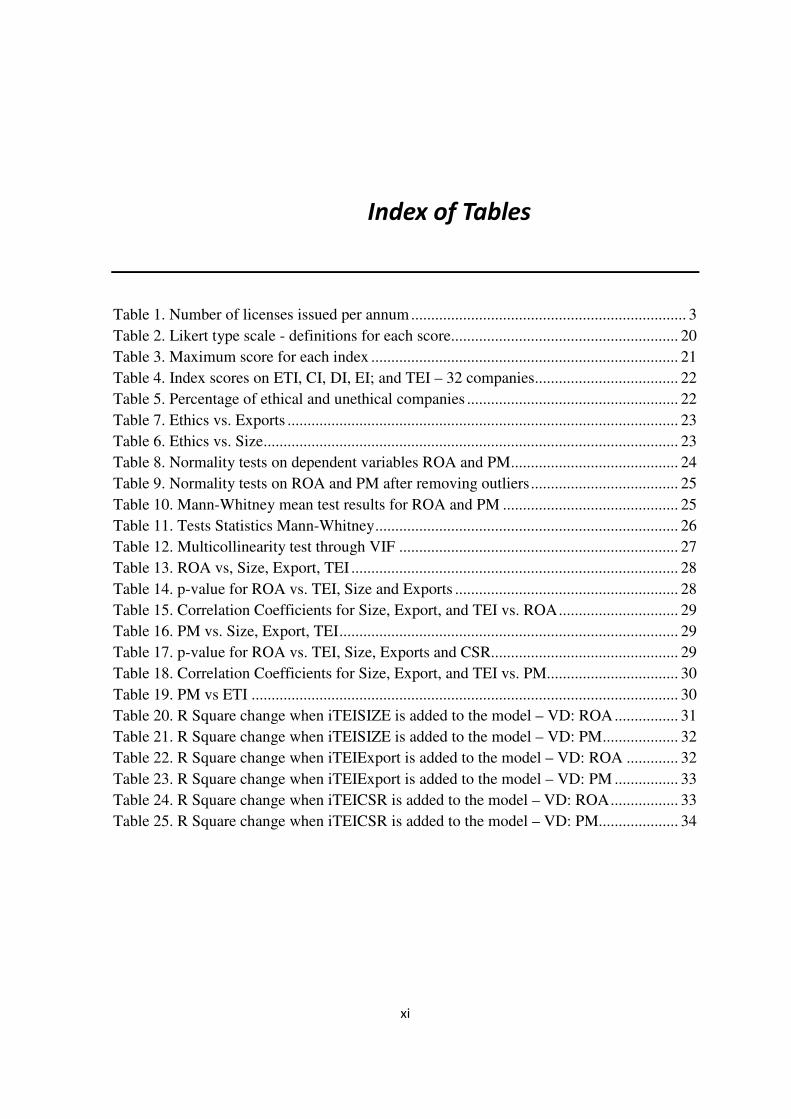
Index of Tables
Table 1. Number of licenses issued per annum ..................................................................... 3 Table 2. Likert type scale - definitions for each score......................................................... 20 Table 3. Maximum score for each index ............................................................................. 21 Table 4. Index scores on ETI, CI, DI, EI; and TEI – 32 companies.................................... 22 Table 5. Percentage of ethical and unethical companies ..................................................... 22 Table 7. Ethics vs. Exports .................................................................................................. 23 Table 6. Ethics vs. Size ........................................................................................................ 23 Table 8. Normality tests on dependent variables ROA and PM .......................................... 24 Table 9. Normality tests on ROA and PM after removing outliers ..................................... 25 Table 10. Mann-Whitney mean test results for ROA and PM ............................................ 25 Table 11. Tests Statistics Mann-Whitney ............................................................................ 26 Table 12. Multicollinearity test through VIF ...................................................................... 27 Table 13. ROA vs, Size, Export, TEI .................................................................................. 28 Table 14. p-value for ROA vs. TEI, Size and Exports ........................................................ 28 Table 15. Correlation Coefficients for Size, Export, and TEI vs. ROA .............................. 29 Table 16. PM vs. Size, Export, TEI ..................................................................................... 29 Table 17. p-value for ROA vs. TEI, Size, Exports and CSR............................................... 29 Table 18. Correlation Coefficients for Size, Export, and TEI vs. PM................................. 30 Table 19. PM vs ETI ........................................................................................................... 30 Table 20. R Square change when iTEISIZE is added to the model – VD: ROA ................ 31 Table 21. R Square change when iTEISIZE is added to the model – VD: PM ................... 32 Table 22. R Square change when iTEIExport is added to the model – VD: ROA ............. 32 Table 23. R Square change when iTEIExport is added to the model – VD: PM ................ 33 Table 24. R Square change when iTEICSR is added to the model – VD: ROA ................. 33 Table 25. R Square change when iTEICSR is added to the model – VD: PM.................... 34

xii
Esta página foi intencionalmente deixada em branco
xiii
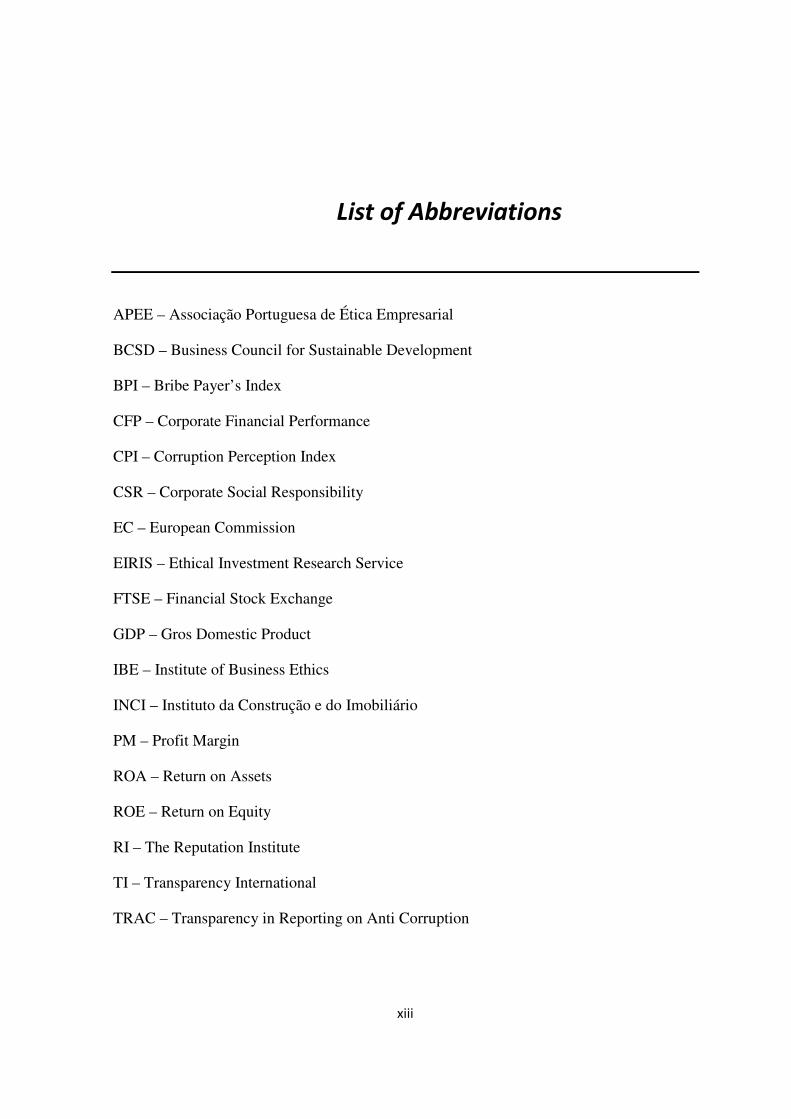
List of Abbreviations
APEE – Associação Portuguesa de Ética Empresarial
BCSD – Business Council for Sustainable Development
BPI – Bribe Payer’s Index
CFP – Corporate Financial Performance
CPI – Corruption Perception Index
CSR – Corporate Social Responsibility
EC – European Commission
EIRIS – Ethical Investment Research Service
FTSE – Financial Stock Exchange
GDP – Gros Domestic Product
IBE – Institute of Business Ethics
INCI – Instituto da Construção e do Imobiliário
PM – Profit Margin
ROA – Return on Assets
ROE – Return on Equity
RI – The Reputation Institute
TI – Transparency International
TRAC – Transparency in Reporting on Anti Corruption

xiv
Esta página foi intencionalmente deixada em branco
xv
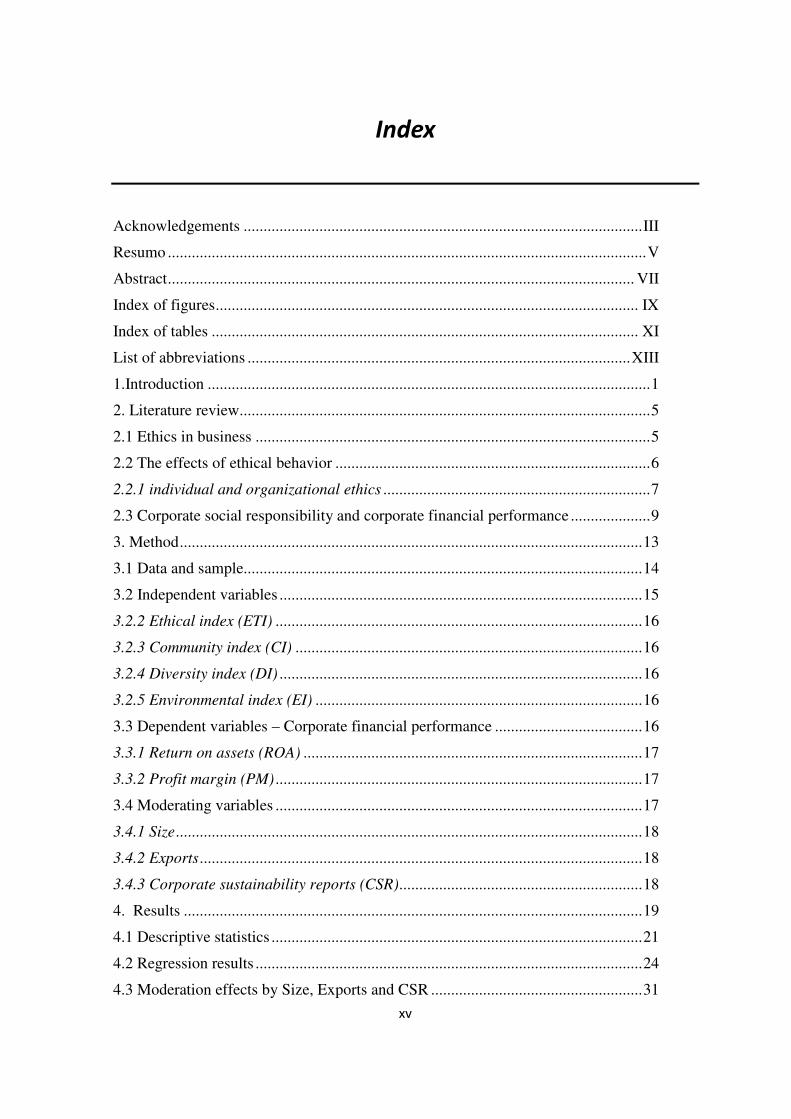
Index
Acknowledgements .................................................................................................... III
Resumo ........................................................................................................................ V
Abstract ..................................................................................................................... VII
Index of figures .......................................................................................................... IX
Index of tables ........................................................................................................... XI
List of abbreviations ................................................................................................ XIII
1.Introduction ............................................................................................................... 1
2. Literature review....................................................................................................... 5
2.1 Ethics in business ................................................................................................... 5
2.2 The effects of ethical behavior ............................................................................... 6
2.2.1 individual and organizational ethics ................................................................... 7
2.3 Corporate social responsibility and corporate financial performance .................... 9
3. Method .................................................................................................................... 13
3.1 Data and sample.................................................................................................... 14
3.2 Independent variables ........................................................................................... 15
3.2.2 Ethical index (ETI) ............................................................................................ 16
3.2.3 Community index (CI) ....................................................................................... 16
3.2.4 Diversity index (DI) ........................................................................................... 16
3.2.5 Environmental index (EI) .................................................................................. 16
3.3 Dependent variables – Corporate financial performance ..................................... 16
3.3.1 Return on assets (ROA) ..................................................................................... 17
3.3.2 Profit margin (PM) ............................................................................................ 17
3.4 Moderating variables ............................................................................................ 17
3.4.1 Size ..................................................................................................................... 18
3.4.2 Exports ............................................................................................................... 18
3.4.3 Corporate sustainability reports (CSR) ............................................................. 18
4. Results ................................................................................................................... 19
4.1 Descriptive statistics ............................................................................................. 21
4.2 Regression results ................................................................................................. 24
4.3 Moderation effects by Size, Exports and CSR ..................................................... 31
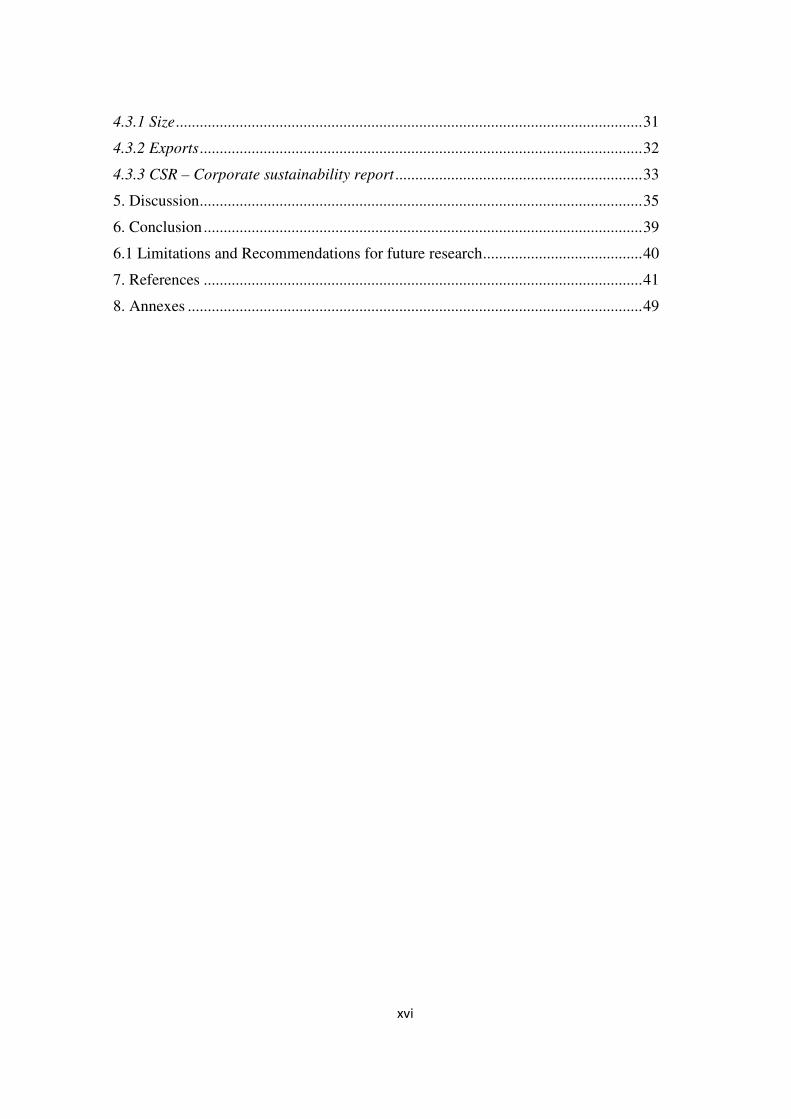
xvi
4.3.1 Size ..................................................................................................................... 31
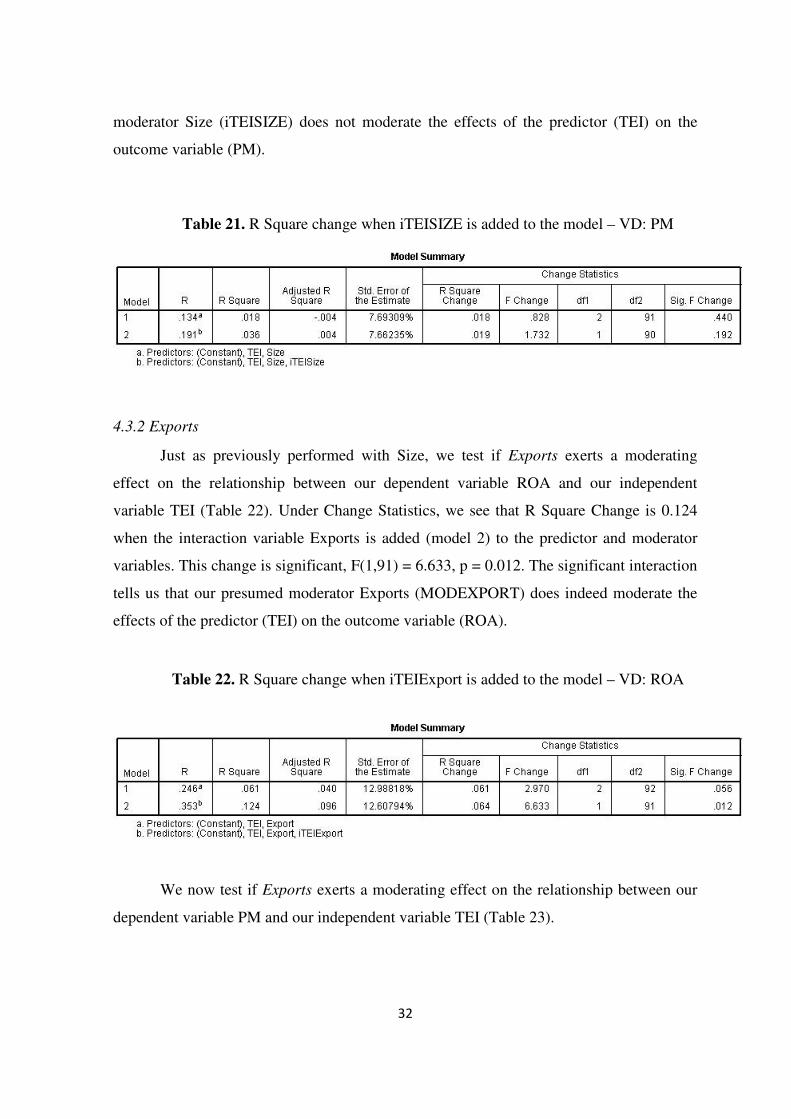
4.3.2 Exports ............................................................................................................... 32
4.3.3 CSR – Corporate sustainability report .............................................................. 33
5. Discussion ............................................................................................................... 35
6. Conclusion .............................................................................................................. 39
6.1 Limitations and Recommendations for future research ........................................ 40
7. References .............................................................................................................. 41
8. Annexes .................................................................................................................. 49
1
1. Introduction
The subject of ethics in business has gained a striving importance in today’s
business research (Chan, Fung & Yao, 2009). In the last decade, we have witnessed the
sub-prime crisis in the United States, several financial and economic scandals on a global
scale, both at public and private level (Cragg & Matten, 2011; Brassett, Rethel & Watson,
2010). The Euro crisis has spread. It is no longer a peripheral matter of countries like
Greece, Portugal, Ireland and Spain, affecting even the most solid and prosperous
economies (Longstaff, 2010; Overbeek, 2012). The economic uncertainty that has spread
throughout Europe, has resurrected old hatreds and cultural conflicts. Suddenly, countries
are culturally designated as lazy deadbeats, long-time corrupted and unable to survive, on
the long term, without external aid. Ethics can be defined as a set of principles, rules and
codes of conduct, that rule an individual or a group (Treviño & Nelson, 1999). Business
ethics is a set of rules, standards and codes, or principles which provide guidelines for
morally right behavior and truthfulness in specific situations (Lewis, 1985).
International organizations have acknowledged the importance of ethics, and in the
last years, have promoted several studies and reports, aiming to create awareness on ethical
behavior and suggest guidelines for better practices. The European Commission published
in 2012, the special Eurobarometer 374, on the perceived corruption in the member states
of the European Union (EU). This study concluded that the majority of Europeans believe
that corruption is a serious problem in their country, and that it has increased in the last
years. It also states that the majority of Europeans consider that there is corruption both at
public and private levels. Previously, in 2011, the EU Anti-Corruption Report was set up to
periodically assess the efforts carried out by the EU to fight and prevent corruption in their
member states. In the same year the EU has also made additional efforts, in inviting
companies to adopt international corporate social responsibility (CSR) Guidelines.
Transparency International (TI) published the Bribe Payer’s Index (BPI) which analyzes
2
the perceived likelihood of companies located in 28 of the largest economies in the world,
to be corrupted. Based on the results obtained, TI also launched the Transparency in
Reporting on Anti-Corruption (TRAC), which focuses on studying the extent and quality
of the information that companies publicly provide on the measures and policies they are
taking to fight corruption and bribery. The TRAC shows that companies worldwide, and
from different industries, still have much to do on what concerns promoting and publicly
disclosing their practices against corruption and bribery.
Ethical behavior has also been a subject of extensive academic research. Unethical
activities by companies such as, Lehman Brothers, Enron and WorldCom have deeply
damaged the trustful relationship that has formed the basis of marketplace relationships
between companies and stakeholders. Prahalad and Hammel (1994) stated that the
influences over strategic decisions are no longer financial or industry driven, but also
social and environmental. Corporate social responsibility (CSR) has been frequently linked
to business ethics, by different authors. Carroll (1979) stated that CSR manages the
expectations that society has towards an organization, on economical, legal, ethical and
discretionary levels. Valentine and Fleischman (2007) state that socially responsible
companies are viewed as ethical organizations. The authors associated ethics programs
with a greater perception of CSR, on behalf of employees who associate CSR as a form of
commitment towards ethical behavior. Some scholars state that codes of ethics say much
about a firm, and that there is a positive relation between CSR and financial performance
(Bowman & Haire, 1975). Waddock & Graves (1997) also argued that Corporate Social
Performance (CSP) is positively related to Corporate Financial Performance (CFP), which
indicates that good management is linked to social responsibility. An ethical management
is a responsible management that carefully includes not only stockholders, but more
importantly stakeholders in their decision making process (Goodpaster, 1991). In fact,
literature points out that an ethically responsible management can contribute to better
financial performance by reducing the cost of business transactions, building trust with
stakeholders, contributing to a successful teamwork environment and maintaining social
capital.
In this dissertation we focus on the effects of ethics on an organization’s financial
performance. The main purpose is to identify the effect of ethics on the profitability of
firms, belonging to the civil construction and public works industry, in Portugal. We will
3
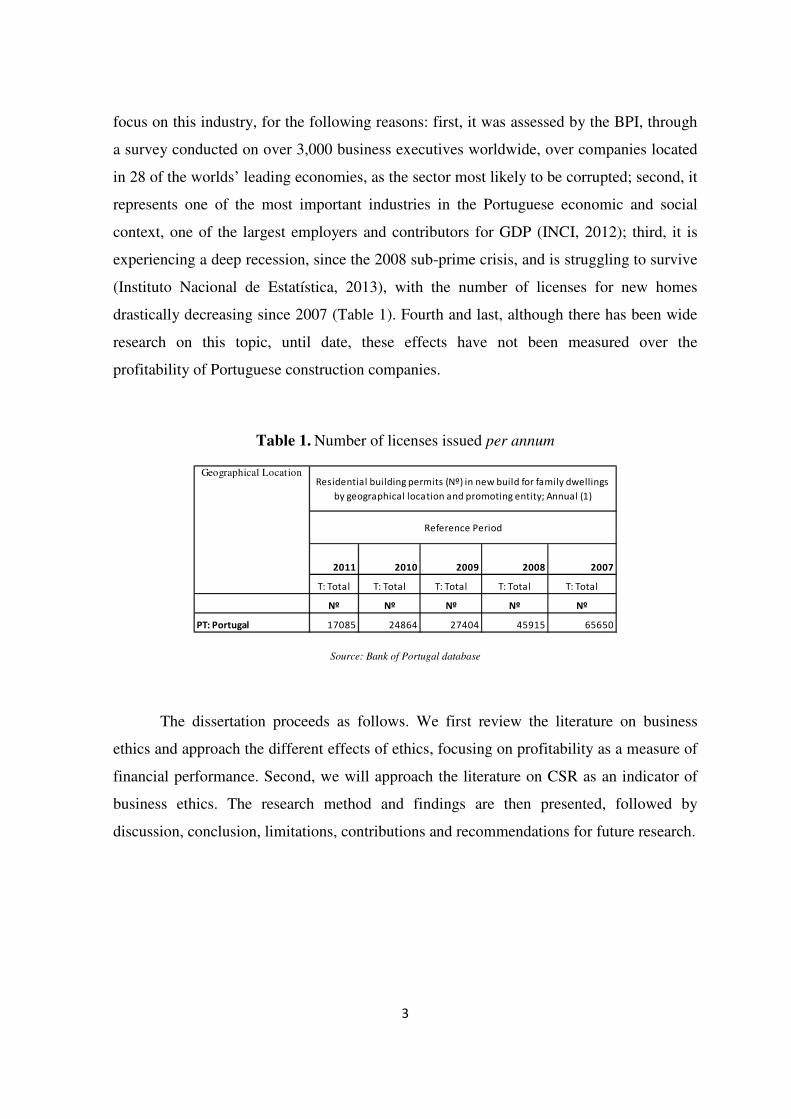
focus on this industry, for the following reasons: first, it was assessed by the BPI, through
a survey conducted on over 3,000 business executives worldwide, over companies located
in 28 of the worlds’ leading economies, as the sector most likely to be corrupted; second, it
represents one of the most important industries in the Portuguese economic and social
context, one of the largest employers and contributors for GDP (INCI, 2012); third, it is
experiencing a deep recession, since the 2008 sub-prime crisis, and is struggling to survive
(Instituto Nacional de Estatística, 2013), with the number of licenses for new homes
drastically decreasing since 2007 (Table 1). Fourth and last, although there has been wide
research on this topic, until date, these effects have not been measured over the
profitability of Portuguese construction companies.
Table 1. Number of licenses issued per annum
2011 2010 2009 2008 2007
T: Total T: Total T: Total T: Total T: Total
Nº Nº Nº Nº Nº
PT: Portugal 17085 24864 27404 45915 65650
Residential building permits (Nº) in new build for family dwellings
by geographical location and promoting entity; Annual (1)
Geographical Location
Reference Period
Source: Bank of Portugal database
The dissertation proceeds as follows. We first review the literature on business
ethics and approach the different effects of ethics, focusing on profitability as a measure of
financial performance. Second, we will approach the literature on CSR as an indicator of
business ethics. The research method and findings are then presented, followed by
discussion, conclusion, limitations, contributions and recommendations for future research.

4
5
2. Literature Review
If by anything else, an organization is comprised of people, with different
backgrounds, personalities, ideologies and beliefs. These factors will eventually influence
managers’ decisions. However, organizational ethics should also consider the role of
business “outside” of the organization. Social responsibility can be considered as the
ethical performance of an organization on a societal level, towards all of its stakeholders
(Treviño & Nelson, 1999). Stakeholders are defined as any person, individual or collective
entity that is directly or indirectly influenced by the activity of an organization, such as
customers, employees, suppliers, government, stockholders, and the surrounding
community (Freeman, 1984). A business must seek to satisfy the needs or interests of those
who are directly and indirectly part of the business’s social environment: stakeholders. The
following literature review will approach three different items: (1) the effects of ethics on
an individual level, (2) the effects of ethics on an organizational level, and (3) corporate
social responsibility, as an indicator of ethical behavior.
2.1 Ethics in business
Business ethics is described as the ultimate rules which dominate the assessment of
“what constitutes right or wrong, or good or bad human conduct in a business context”
(Shaw, 2010, p. 8). The theme of ethics in business has been widely approached on a
global scale. Sims and Gegez (2004) conducted a cross cultural study, comparing attitudes
towards business ethics, in countries such as United States of America, Western Australia,
Israel, South Africa and Turkey, confirming the idea that although there are similarities in
moral perceptions, cultural differences influence ethical behavior. Rossouw (1997) also
studied business ethics in South Africa, both on academic and practical societal levels, and
6
concluded that business ethics as an academic discipline still needed to be developed, as
well as ethical business practices. Many authors and investigators have focused their
studies on the theme of ethics in business (Tsalikis & Latour, 1995; Enderle, 1997; Trevino
& Nelson, 1999; Husted, 2001; Roussouw, 2002).
Business ethics is sometimes referred to as management ethics or organizational
ethics, limiting its framework to organizations (Beekun, 1996). However, research has
noted the impact of multiple aspects of organizational contexts on individuals’ ethical
behavior. For example, individuals’ perceptions of organizations’ ethical climate (Victor,
& Cullen, 1988), are potential influences on organization members’ ethics-related attitudes
and behavior.
2.2 The effects of ethical behavior
Much literature has been published on the effects of ethical behavior. Some authors
studied the effects of ethics on employee behavior (Ferrell & Gresham, 1985; Treviño,
1986; Abratt, Nel and Higgs, 1992; Treviño, 1992; Ashkanasy, Windsor & Treviño, 2006),
and on an organizational level (Goodpaster, 1991; Enderle, 1997; Jones, 1995; Lovett,
Simmons & Kali, 1999; Robertson & Fadil, 1999; Somers, 2001; Treviño, Weaver &
Reynolds, 2006; Singh & Del Bosque, 2008).
In the following section we will approach two different types of effects of ethics:
individual and organizational effects. There has been a long ongoing debate between
scholars, on whether unethical behavior and decision making is a consequence of “bad
apples” or “bad barrels” (Treviño & Youngblood, 1990). While the former theory argues
that organizational unethical behavior is caused by the personal characteristics of its
employees; the latter states that it is the organizational behavior or climate that influences
employee behavior. Given the main objective of this dissertation, our greatest emphasis
will be on the effect of ethics on a firm’s financial performance, more specifically, to what
extent a firm’s ethical behavior will influence its profitability, although we will briefly
mention the effects on individuals. Ethical behavior will be linked and measured in
accordance to a firm’s social responsibility.
7
2.2.1 Individual and Organizational Ethics
“In business, when people talk about ethics they’re talking about behavior”
(Treviño & Nelson, 1999, p. 148). It is stated that individual characteristics, such as values
and moral issues, influence ethical conduct (Treviño, 1986; Jones, 1995). People
frequently face ethical dilemmas such as whether to use office supplies for personal
purposes, cheat on a test, inflate their business results, or fail to report an additional source
of income on a tax return. “Employees are not just organizational drones; they are
individual human beings who are concerned about their relationships and their personal
reputation” (Treviño & Nelson, 1999, p. 28). Some scholars suggest that people engage in
unethical behavior, when they are faced with an opportunity to do so (Mazar, Amir, &
Ariely, 2008). The fact that one’s behavior is forbidden or reprehensible may strengthen
this experience (Wood, 1995). Brass, Butterfield and Scaggs (1998) suggest that unethical
behavior of one person may influence the behavior of another, enhancing the importance of
relationships among employees.
Employees are also more committed to organizations, in which the top management
represents highly ethical and credible standards, supporting and rewarding ethical conduct,
and disciplining unethical behavior (Treviño, Butterfield & McCabe, 1997). Another study
showed that managers, who believe in the credibility of their senior management, also feel
more attached and committed to the organization (Posner & Schmidt, 1992). Stevens,
Steensma, Harrison and Cochran, (2005) found that financial managers are willing to
consider the company’s code of ethics in the decision- making process when they are
obliged to do so, when faced with pressure from the company’s stakeholders or, if and
when they believe that a code can promote a better external image of the company. Much
research has focused on understanding the factors that influence ethical conduct in
organizations, specifically the conduct of its members. However, employees express the
company’s organizational ethics in the way they are personally treated. (Treviño & Nelson,
1999). Ethical climate, as introduced by Victor and Cullen (1988) and adapted by others
(Schminke, Ambrose & Neubaum, 2005) is defined as a shared perception among
organization members, reflecting organizational practices with moral consequences.
Cullen, Parboteeah and Victor (2003) found that the ethical climate of a company can
influence its compromise, stating that a favorable climate has a positive relationship with
8
organizational commitment, while a selfish climate has a negative relationship with
commitment (Victor and Cullen, 1987).
On an organizational level, “organizational ethics is a company’s adoption of
desired ethical standards and business practices” (Valentine & Fleischman, 2007, p. 160),
and therefore, organizational ethics should be a fundamental management concern, at all
levels of an organization (Treviño & Nelson, 1999). Unethical business practices can
possibly undercut the development of trusting, long-term business relationships. Among
venture partners, unethical behavior can cause conflicts between partners, creating
suspicion and lack of trust, which may end up terminating the relationship (Fassin, 2009).
Unethical behavior can lead to negative publicity, substantial fines, and ultimately
decreased sales and profits (McGuire, Sundgren & Schneeweis, 1988).
The effects of ethics on a company’s reputation have taken on particular urgency,
given the struggle with an increased media scrutiny of governance, social and
environmental issues. The Reputation Institute (RI) finds that corporate ethics has become
an indelible feature of stakeholder engagement — not just as a set of principles but as a
cultural process affecting decision-making at all levels. Ethical culture has been defined as
a slice of the organizational culture that influences employees’ ethical behavior through
formal and informal organizational structures and systems (Trevino, 1992). Ethics play in
fact a very important role in long-term business sustainability, and will gradually form the
basis of serious executive leadership (Fombrun & Foss, 2004).
Although some organizations still view ethical business decisions as an additional
cost, ethical performance can actually add value to all stakeholders, increase profitability
and improve financial performance (McMurrian & Matulich, 2011). According to Jones
(1995), companies with a higher social performance tend to have better financial results by
attracting socially responsible consumers (Bagnoli & Watts, 2003).
Based on the findings presented, we formulate our first hypothesis:
H1: Ethical firms have a higher financial performance than unethical firms.
9
2.3 Corporate Social Responsibility and Corporate Financial Performance
There is much literature suggesting that organizations should have social as well as
financial responsibilities (Swanson, 1995). Corporate social responsibility theorists defend
that management should include ethics into their strategic planning because it is the “right”
thing to do (Key & Popkin, 1998). According to the World Business Council for
Sustainable Development (BCSD), corporate social responsibility defines the continuous
commitment to corporate ethical behavior, the continuous contribution to economic
development and to the improvement of quality of life of all stakeholders, including
employees and their families (Zhang & Gu, 2012).
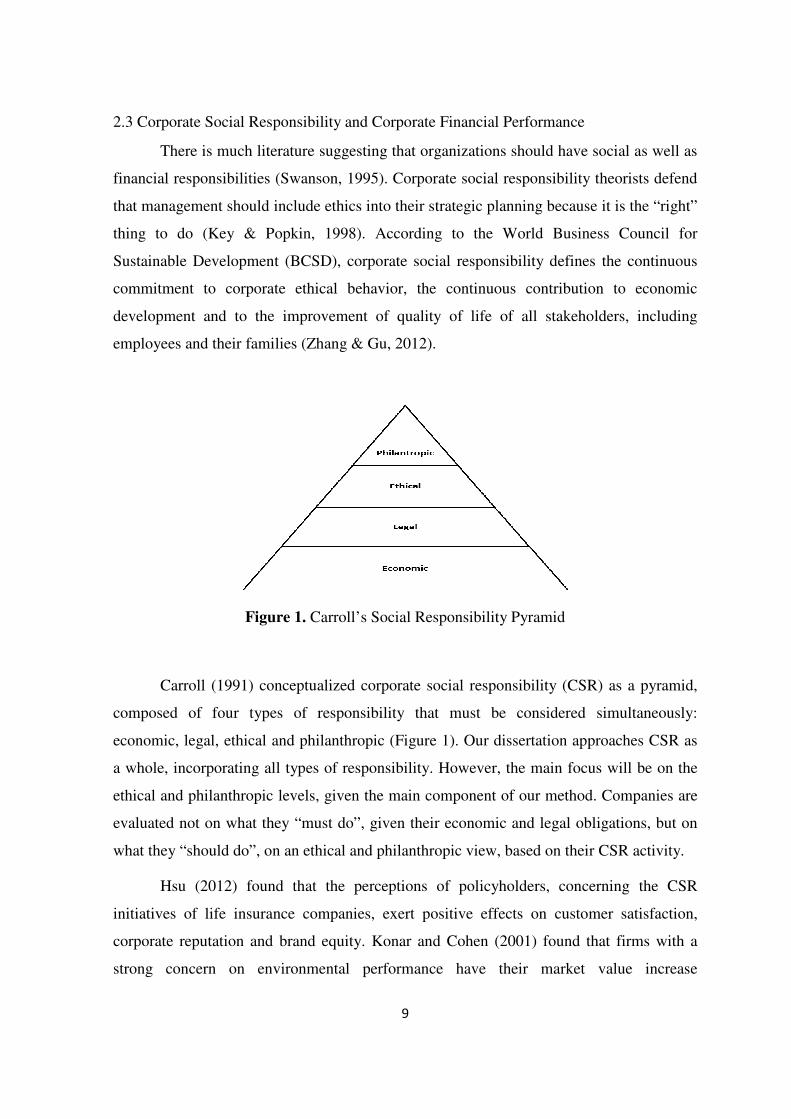
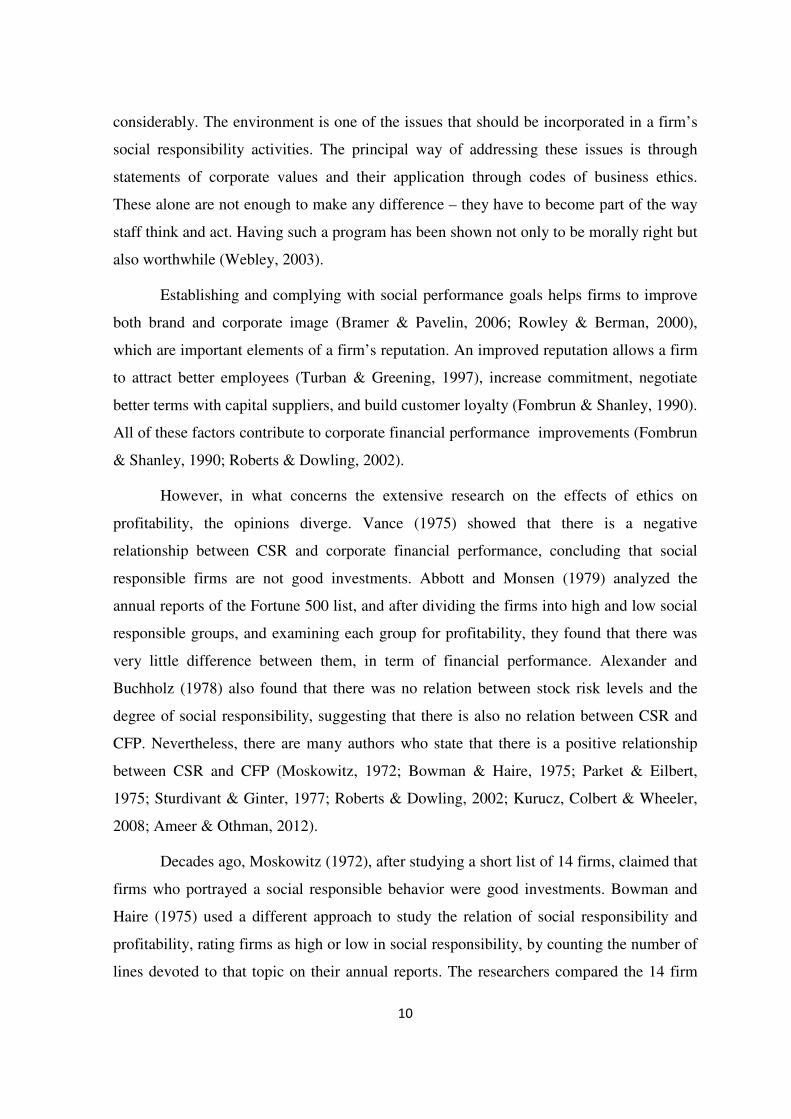
Figure 1. Carroll’s Social Responsibility Pyramid
Carroll (1991) conceptualized corporate social responsibility (CSR) as a pyramid,
composed of four types of responsibility that must be considered simultaneously:
economic, legal, ethical and philanthropic (Figure 1). Our dissertation approaches CSR as
a whole, incorporating all types of responsibility. However, the main focus will be on the
ethical and philanthropic levels, given the main component of our method. Companies are
evaluated not on what they “must do”, given their economic and legal obligations, but on
what they “should do”, on an ethical and philanthropic view, based on their CSR activity.
Hsu (2012) found that the perceptions of policyholders, concerning the CSR
initiatives of life insurance companies, exert positive effects on customer satisfaction,
corporate reputation and brand equity. Konar and Cohen (2001) found that firms with a
strong concern on environmental performance have their market value increase
10
considerably. The environment is one of the issues that should be incorporated in a firm’s
social responsibility activities. The principal way of addressing these issues is through
statements of corporate values and their application through codes of business ethics.
These alone are not enough to make any difference – they have to become part of the way
staff think and act. Having such a program has been shown not only to be morally right but
also worthwhile (Webley, 2003).
Establishing and complying with social performance goals helps firms to improve
both brand and corporate image (Bramer & Pavelin, 2006; Rowley & Berman, 2000),
which are important elements of a firm’s reputation. An improved reputation allows a firm
to attract better employees (Turban & Greening, 1997), increase commitment, negotiate
better terms with capital suppliers, and build customer loyalty (Fombrun & Shanley, 1990).
All of these factors contribute to corporate financial performance improvements (Fombrun
& Shanley, 1990; Roberts & Dowling, 2002).
However, in what concerns the extensive research on the effects of ethics on
profitability, the opinions diverge. Vance (1975) showed that there is a negative
relationship between CSR and corporate financial performance, concluding that social
responsible firms are not good investments. Abbott and Monsen (1979) analyzed the
annual reports of the Fortune 500 list, and after dividing the firms into high and low social
responsible groups, and examining each group for profitability, they found that there was
very little difference between them, in term of financial performance. Alexander and
Buchholz (1978) also found that there was no relation between stock risk levels and the
degree of social responsibility, suggesting that there is also no relation between CSR and
CFP. Nevertheless, there are many authors who state that there is a positive relationship
between CSR and CFP (Moskowitz, 1972; Bowman & Haire, 1975; Parket & Eilbert,
1975; Sturdivant & Ginter, 1977; Roberts & Dowling, 2002; Kurucz, Colbert & Wheeler,
2008; Ameer & Othman, 2012).
Decades ago, Moskowitz (1972), after studying a short list of 14 firms, claimed that
firms who portrayed a social responsible behavior were good investments. Bowman and
Haire (1975) used a different approach to study the relation of social responsibility and
profitability, rating firms as high or low in social responsibility, by counting the number of
lines devoted to that topic on their annual reports. The researchers compared the 14 firm
11
list used by Moskowitz as a list of high social responsible firms, and another list of 14
random chosen firms. The firms on Moskowitch’s list had more lines dedicated to social
responsibility. After using the line-counting method, they analyzed the firms performances
based on a five year financial performance and concluded that the firms on the Moskowitz
had better profitability ratio than those on the random list.
Parket and Eilbert (1975) sent a questionnaire to the Forbes 1971 Annual Directory,
and received a reply from 96 firms. They assumed that the respondents were more actively
engaged in social responsibility than those that didn’t. When analyzing their financial
performance with other firms of the Fortune 500 list, they stated that the firms assumed as
more socially active are also the most profitable. Sturdivant and Ginter (1977), used a
sample of 67 firms characterized by Moskowitz as examples of exceptional social
performance, divided them in four industrial groups, and studied their financial
performance, based on a 10-year earnings per share growth (EPS). Firms rated as highly or
moderately social responsible featured the best performance.
One of the advantages identified by Kurucz et al. (2008), which a company may
attain by engaging in social responsible activities, is reputation. Firms with a better
reputation can also achieve lower contract costs compared to other firms, which will
increase the return on assets (Roberts & Dowling, 2002), thus improving profitability.
Ameer and Othman (2012) measured the corporate sustainability reports of one-hundred
sustainable global companies and the following profitability measures: sales growth, return
on assets, profit before taxation and cash flow from operating activities. The authors
concluded that companies with higher sustainability performances also have higher
financial performances.
The previous arguments featured by different scholars allow us to summarize the
following hypothesis:
H2a: Ethical firms have higher ROA than unethical firms.
H2b: Ethical firms have higher PM than unethical firms.

12
13
3. Method
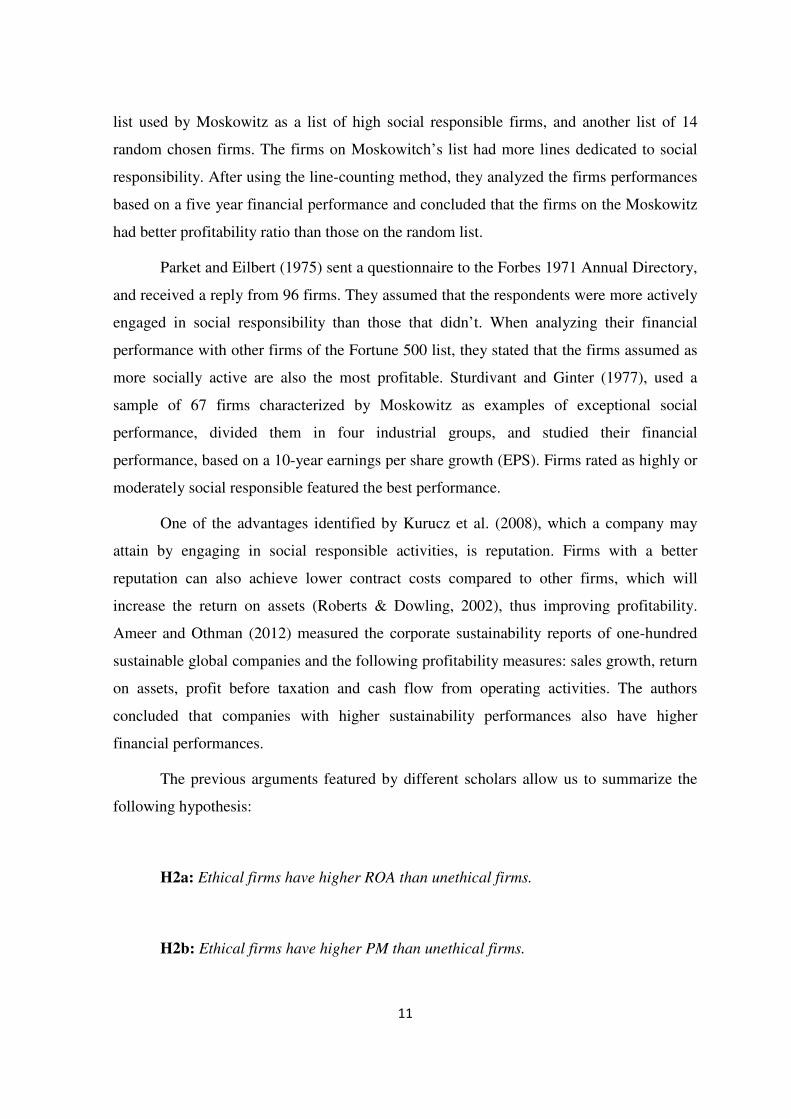
This study seeks to analyze the effects of ethical performance on a firm’s financial
performance. First, we will use the BPI Index to identify the most likely sector to be
corrupted: Public Works Contracts and Construction. Second, we will extract from the
Expresso magazine’s 1000 Maiores Empresas, a target population of the twenty largest
Portuguese companies of this sector, between 2007 and 2011, and analyze their financial
performance indicators. We chose this period of time because it is coincident with the
outbreak of the sub-prime crisis, and it will allow us to assess the firms’ performances
during a period of deep crisis and of transformation in the industry (Figure 2).
Figure 2. Index of production in civil construction and public works – 2007/2013
Source: INE – Instituto Nacional de Estatística
Third, based on the methodology used by Ameer and Othman (2012), we will use the
information publicly disclosed on the corporate sustainability reports, or/and on published
14
information on the companies’ official websites, focusing on the four (4) different
measuring indexes: the Ethical Index (EI), the Community index (CI), the Diversity Index
(DI) and the Environmental index (EI). Each index is measured based on a “likert” type
scale, from 0 to 4, in which 0 corresponds to the absence of information, and 4 to detailed
disclosed information. The scores achieved for each question add up to a total score for
each index. The score obtained on each index will allow us to distinguish ethical from
unethical firms. Fourth, we will assess the financial performance of firms belonging to
each group (ethical/unethical), analyzing the following accounting financial indicators:
return on assets (ROA) and profit margin (PM). These measures have been widely used in
previous studies (Parket & Eilbirt, 1975; Heinz, 1976; Sullivan, 1994; Delery & Doty,
1996; Griffin & Mahon, 1997; Baron, 2001; Roberts & Dowling, 2002; Schreck, 2011).
We will then test the correlation between ethical performance and financial performance,
for the firms evaluated as “ethical” and unethical”. Moderating variables such as size,
export sales and CSR are also included in the research.
3.1 Data and sample
Our sample was withdrawn from the “Expresso’s annual database, the one-
thousand (1000) biggest Portuguese companies, between 2007 and 2011. This directory
results from the strict application of a methodology based on the collection and analysis of
data by Dun and Bradstreet who, in cooperation with the “Expresso”, selected a group of
financial and economic indicators and ratios, which allow us to evaluate the performance
of each and one of these companies. The Expresso’s ranking is ordered by sales volume
and all companies listed are non-financial companies.
The annual directory features detailed information on the 20 biggest companies
from each sector/industry. Each database features, for each company, from each sector, the
following financial indicators and ratios: district, industry, sales volume, sales volume
variation, productivity, financial autonomy, return on equity (ROE), return on assets
(ROA) and profit margin (PM). We are also able to access the number of employees,
which will inform us about the size of each company.
In sum, our sample consists of the 20 biggest Portuguese companies from the
construction industry, identified by this database, between 2007 and 2011. Although we
15
analyze a sample of the 20 biggest companies in the construction industry over a 5-year
period, 32 companies appear on our list. This happens because the list is not static over
time, and each annual top list is comprised of different companies, which are the biggest
companies for that year.
As explained previously, we decided to analyze this industry because it was
assessed by the BPI as the most likely to be corrupted. Also, it is one of the most important
industries in Portugal, as one of the biggest employers and contributors for the national
GDP. We also decided to choose this timeframe, because it comprises the period before
and after the 2008 sub-prime crisis. We have not included data for 2012, because at the
time of this study, the database for the mentioned year was not yet available.
3.2 Independent Variables
When we think about the objective of any business, the most basic idea that will
come to our mind is: to make a profit. However, to make a profit, any business must offer a
service or product to others, which implies a necessary relationship with society. If the
definition of ethics is based on social consideration for others, ethics is therefore related
with business itself (Roussouw, 2002). In fact, there is no business without society, and
society needs business to prosper (Joyner &Payne, 2002). Carrol’s CSR pyramid (1991),
portrays ethical responsibility as a desired level, defining the “right thing to do” in
business. Therefore, a social responsible business must be ethical.
In this study, we will adopt the method used by Ameer and Othman (2012), to
evaluate the level of CSR activity, and through this, determine which companies are
“ethical” or “unethical”. Using a qualitative measure through content analysis, the authors
evaluated the CSR performance of firms by analyzing the four different indexes that
companies show commitment to: community, environment, diversity and ethics. Next, we
define each index in order to better understand the criterion used. These will be the
independent variables used in this dissertation (see Annex II for the Items used).
16
3.2.2 Ethical Index (ETI)
The Ethical Index assumes there is a code of ethics and /or conduct inside the
company, and comprises issues related to business conduct on: equal employment
opportunities, anti-bribery laws, health, safety and environment, political contributions
among others.
3.2.3 Community Index (CI)
The Community Index (CI) comprises several activities linked to the surrounding
community, such as: charitable foundations, volunteer programs, scholarships, corporate
giving programs and donations.
3.2.4 Diversity Index (DI)
The Diversity Index comprises many issues related to workforce diversity, such as:
women and minority hiring, training for women advancement, gender equity n ages, and
others.
3.2.5 Environmental Index (EI)
The Environmental Index comprises all issues referring to environmental
performance, such as; compliance with laws and regulations, environmental remediation
liabilities, use of renewable energy sources and voluntary recycling programs.
3.3 Dependent variables – Corporate Financial Performance
The measures used to assess a firm’s financial performance can be classified into
accounting and market value measures. In this study we will use two accounting measures:
ROA and PM as financial indicators of profitability.
17
3.3.1 Return on Assets (ROA)
The literature available concerning this measure is vast (Aupperle, Carroll &
Hatfield, 1985; Belkaoui & Karpik, 1989; Waddock & Graves, 1997; McWilliams &
Siegel, 2001). McGuire et al., (1988) found that there is a positive association between
ROA and corporate social responsibility. Preston and O’Bannon (1997) have also
concluded that ROA strengthens the relationship between corporate social and financial
performance. It is a variable, expressed as a percentage, which measures the contributions
of the assets of a company to the revenue generating process. This parameter is given by
the ratio between net income and total assets. Because the average of this measure varies
considerably depending on the economic sector, the ROA is mostly useful to compare the
profitability of the companies belonging to the same industry.
ROA = Net Income *100 Total Assets
3.3.2 Profit Margin (PM)
PM reflects the “cost of producing each dollar of sales” (Parket & Eilbirt, 1975;
Heinz, 1976; De Meuse, Vanderheiden & Bergmann, 1994; Effiok, Effiong & Usoro,
2012; Moneva & Ortas, 2010. This indicator is obtained through the relation between net
income and sales revenue, which provides us with the profit/loss obtained for each unit
sold, thus revealing the efficiency of the business.
Net Profit Margin = Net Income_ *100 Sales Revenue
3.4 Moderating Variables
A moderator variable is an independent or predictor variable (e.g., Z ) that
interacts with another independent or predictor variable (e.g., X ) in predicting scores on
and accounting for variance in a dependent or predicted variable (e.g., Y ). In this
dissertation we will test the moderation effects of the variables Size, Exports and CSR.
18
3.4.1 Size
Size has been recognized by some as a determinant of social and financial
performance (Ullmann, 1985), although other authors state that size does not have any
influence over the CSP-CFP relationship (Orlitzky, M., 2001). We measure this variable by
the logarithm of the number of employees (Waddock & Graves, 1997; Ullmann, 1985)
provided by the database. Zhou and Peng (2012) find that bribery damages firm growth, in
the cases of small and medium-sized firms, but not in the case of large firms. Considering
that CSR measures are expensive, and that bigger companies have more available financial
means to carry them out, we suggest that bigger companies will perform better financially
than smaller companies. SME firms will be distinguished from large companies, by using
the definition in the Commission Recommendation 96/280/CE, of April 3rd, 1996, in which
SME’s are defined as organizations with less than 250 employees.
3.4.2 Exports
Boehe and Cruz (2010) view CSR as a contribution of product differentiation in
export markets and that it may therefore, improve export performance. La Roche and
Flanigan (2011) studied the effectiveness of anti-corruption laws in creating a more
transparent business environment. They found that although the perception of corruption
has decreased in the last decade, it is difficult to acknowledge whether firms that are
engaged in international business have become more ethical.
3.4.3 Corporate Sustainability Reports (CSR)
Many are the authors that agree that corporate social performance can improve
financial performance (Fombrun & Shanley, 1990; Rowley & Berman, 2000; Roberts &
Dowling, 2002, Bramer & Pavelin, 2006). Ameer and Othman (2012) have verified that
companies, who are more engaged in socially responsible activities, are much more open
in terms of information disclosure than those who are less focused on social
responsibilities. Therefore, socially responsible companies issue CSR reports and publicly
disclose other information on corporate websites, such as codes of ethics and/or conduct
(Gelb & Strawser 2001).
19
4. Results
In the results section, we proceed with two types of analyses. First, and aiming at a
better characterization of our sample, we carry out a series of descriptive statistics. This
descriptive section will help us identify our sample according to the score obtained from
our qualitative analysis, separating them into two different groups: ethical and unethical
companies. Secondly, we will compare the means of the chosen profitability measures
(ROA and PM), for each group. Thirdly, we will perform a linear regression analysis on
both of our dependent variables ROA and PM to test for correlation with our ethical
performance variables (ETI, CI; DI, EI). Size, Export and CSR will be tested for
moderation, in order to verify if they have any influence on the multiple regression results.
In order to analyze whether a company is ethical (high on CSR) or unethical (low
on CSR), we use the Ameer and Othman’s (2012) qualitative methodology. The authors
first created a group of questions, which would portray the commitment of companies to
sustainability on the following levels: community (CI), environment (EI), diversity (DI),
and ethical standards (ETI). They adapted the questions/items from Fadul et al. (2004).
There are 22 items for environment, 21 items for diversity, 12 items for community, and 13
items for ethical standards. Each item was evaluated with a score from 0 to 4 using the
wording of the sustainability report based on the checklist on Annex II. Based on the final
score, the authors decided which company was more or less sustainable, and then analyzed
which feature a higher financial performance.
We adapted the method also used by Ameer and Othman (2012) by analyzing the
corporate sustainability reports and the code of ethics or conduct of each company in our
sample. Whenever a report or code was missing, information was gathered from the
corporate website. Secondly, using a Likert type scale (Table 2), we also attributed a score
20
from 0 to 4, for each question answered, in which 0 means no information on CSR activity
is reported, and 4 means that there is a significant tangible positive contribution, are
reported on CSR activity. An example of a maximum score of 4 is “a company’s
significant tangible positive contribution might be in the form of financial commitments to
needy communities, the adoption of specific codes of conduct, new technologies and/or
redesigned products to conserve energy, water, materials and/or land” (Ameer & Othman,
2012, p.66). A score of 3, is based on a company’s positive tangible contribution revealed
in the form of statistics and data related to CSR activities, as for example, “key employee
statistics such as: total number of employees, total employees - male (%), total employees
– female (%), management positions held by males (%), management positions held by
females (%), average age of employees (in years), employee turnover (in %), average
tenure per employee (in years) and annual training hours by employee” (Ameer & Othman,
2012, p.66). A score of 2, is based on “a company’s relatively small positive contribution
might be in the form of statements” (Ameer & Othman, 2012, p.66), in which companies,
for example, state that all employees will be treated equal, despite their ethnicity, gender,
sexual orientation or economic background. A score of 1 was given when a company did
not report any tangible contribution in the form of statistics and data. O was given when
no information on CSR was reported.
Table 2. Likert type scale - definitions for each score
Score Definition
4 significant tangible positive contribution report
3 positive tangible contribution report
2 relatively small positive contribution
1 no tangible contribution in the form of statistic and data
0 no information on CSR activity is reported
Thirdly, based upon the score obtained for each item, we will calculate a total ethics index
(TEI), which totals the sum of scores for each item. Considering that the maximum score
for each question is 4, we calculate the product of the number of questions by 4, for each
index (ETI = 13 x 4; CI = 12 x 4; DI = 21 x 4; EI = 22 x4) and then summarize in the
following table (Table 3) the maximum score possible for each index, and for the total
21
CSR index:
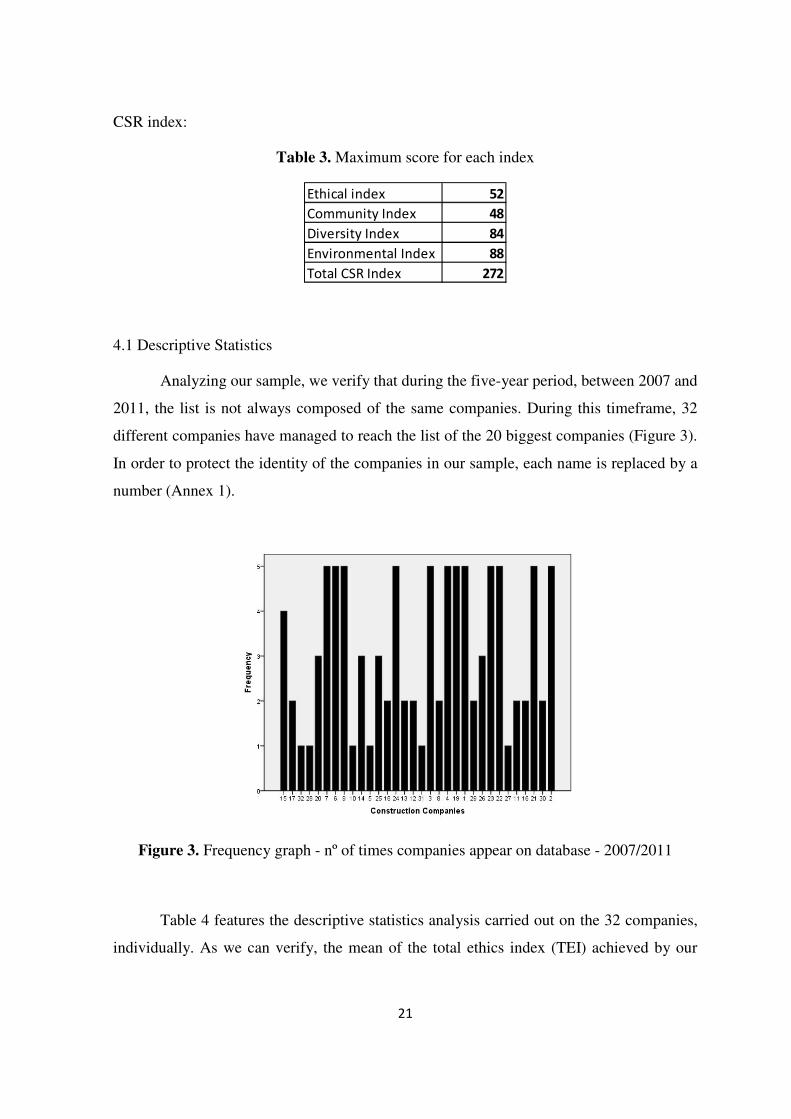
Table 3. Maximum score for each index
Ethical index 52
Community Index 48
Diversity Index 84
Environmental Index 88
Total CSR Index 272
4.1 Descriptive Statistics
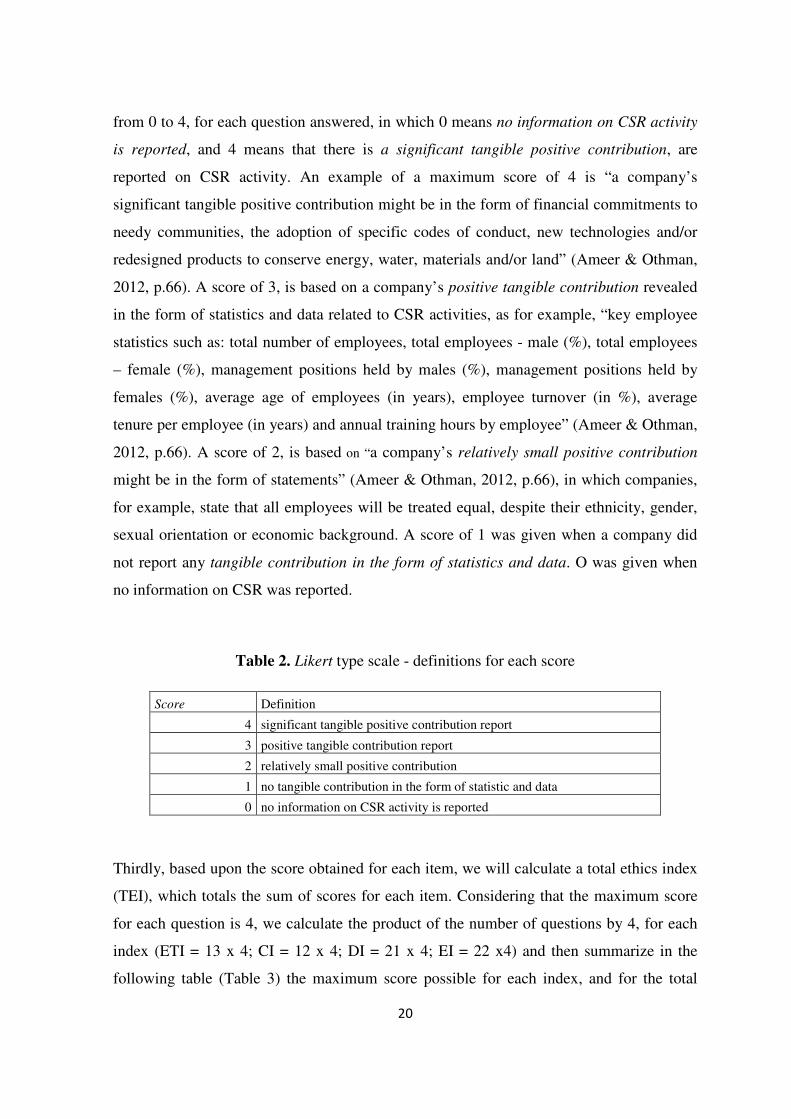
Analyzing our sample, we verify that during the five-year period, between 2007 and
2011, the list is not always composed of the same companies. During this timeframe, 32
different companies have managed to reach the list of the 20 biggest companies (Figure 3).
In order to protect the identity of the companies in our sample, each name is replaced by a
number (Annex 1).
Figure 3. Frequency graph - nº of times companies appear on database - 2007/2011
Table 4 features the descriptive statistics analysis carried out on the 32 companies,
individually. As we can verify, the mean of the total ethics index (TEI) achieved by our
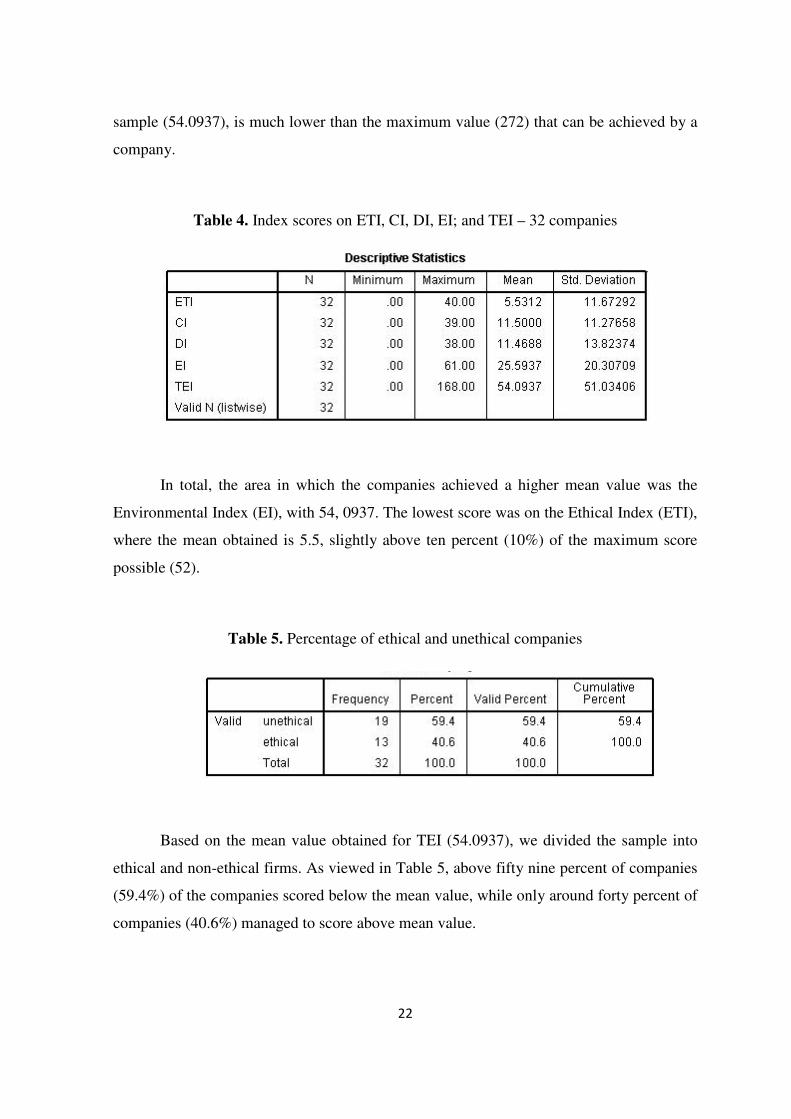
22
sample (54.0937), is much lower than the maximum value (272) that can be achieved by a
company.
Table 4. Index scores on ETI, CI, DI, EI; and TEI – 32 companies
In total, the area in which the companies achieved a higher mean value was the
Environmental Index (EI), with 54, 0937. The lowest score was on the Ethical Index (ETI),
where the mean obtained is 5.5, slightly above ten percent (10%) of the maximum score
possible (52).
Table 5. Percentage of ethical and unethical companies
Based on the mean value obtained for TEI (54.0937), we divided the sample into
ethical and non-ethical firms. As viewed in Table 5, above fifty nine percent of companies
(59.4%) of the companies scored below the mean value, while only around forty percent of
companies (40.6%) managed to score above mean value.
23
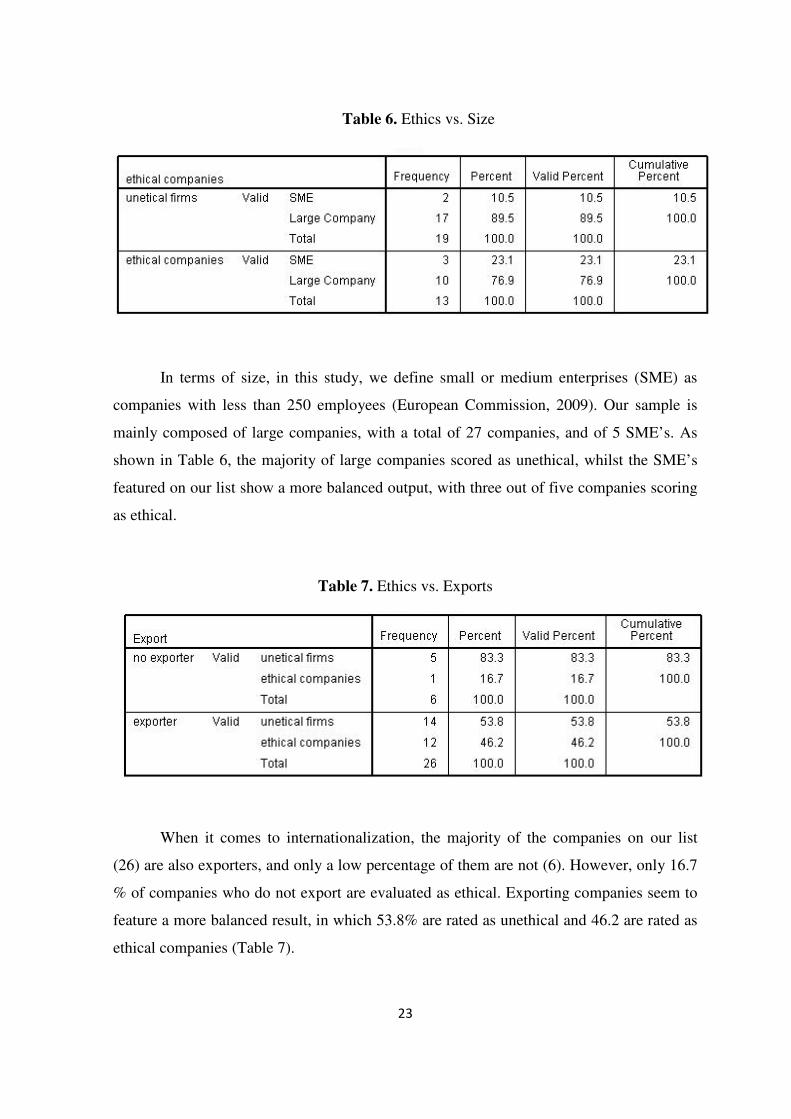
In terms of size, in this study, we define small or medium enterprises (SME) as
companies with less than 250 employees (European Commission, 2009). Our sample is
mainly composed of large companies, with a total of 27 companies, and of 5 SME’s. As
shown in Table 6, the majority of large companies scored as unethical, whilst the SME’s
featured on our list show a more balanced output, with three out of five companies scoring
as ethical.
Table 7. Ethics vs. Exports
When it comes to internationalization, the majority of the companies on our list
(26) are also exporters, and only a low percentage of them are not (6). However, only 16.7
% of companies who do not export are evaluated as ethical. Exporting companies seem to
feature a more balanced result, in which 53.8% are rated as unethical and 46.2 are rated as
ethical companies (Table 7).
Table 6. Ethics vs. Size

24
4.2 Regression Analysis
In this section we will test our hypotheses H1, H2a and H2b, whether ROA and PM
are higher in ethical firms than in unethical firms. To test these hypotheses, we used a
regression model whereby the values of four indices CI, DI, EI, and ETI (independent
variables), were regressed on ROA and PM (dependent variables) for the 20 biggest
construction companies in Portugal, between a five-year timeframe (2007 to 2011,
inclusively).
First, we start out by testing for normality for both our dependent variables, ROA
and PM, and by observing the distribution curve on the histogram, the data does not have a
normal distribution. Second, we look at the skewness and kurtosis values, and we verify
that the values are far from 0, which also leads us to a non-normal distribution, although
we must continue to analyze the information provided by the outputs. From the two well-
known normality tests, the Kolmogorov-Smirnow and the Shapiro-Wilk, the latter is more
appropriate for smaller sizes (<50 samples), but it can also be used with bigger samples.
For this reason, we use the Shapiro-Wilk test as our numerical mean of testing normality.
Erro!
From the output produced (Table 8), we can see that both dependent variables ROA
and PM are not normally distributed. The p-value of the Shapiro-Wilk is lower than 0.05
which tells us that the data significantly deviate from a normal distribution.
Given the non-normal distribution of our data, we decide to further analyze our data
and check for severe outliers in our dependent variables ROA and PM that may be
rendering our data non-normal. We find and eliminate the influence of extreme negative
outliers, transforming them into blank values. Five extremely negative outliers for ROA
and five extremely negative outliers for PM were eliminated. However, after eliminating
Table 8. Normality tests on dependent variables ROA and PM
25
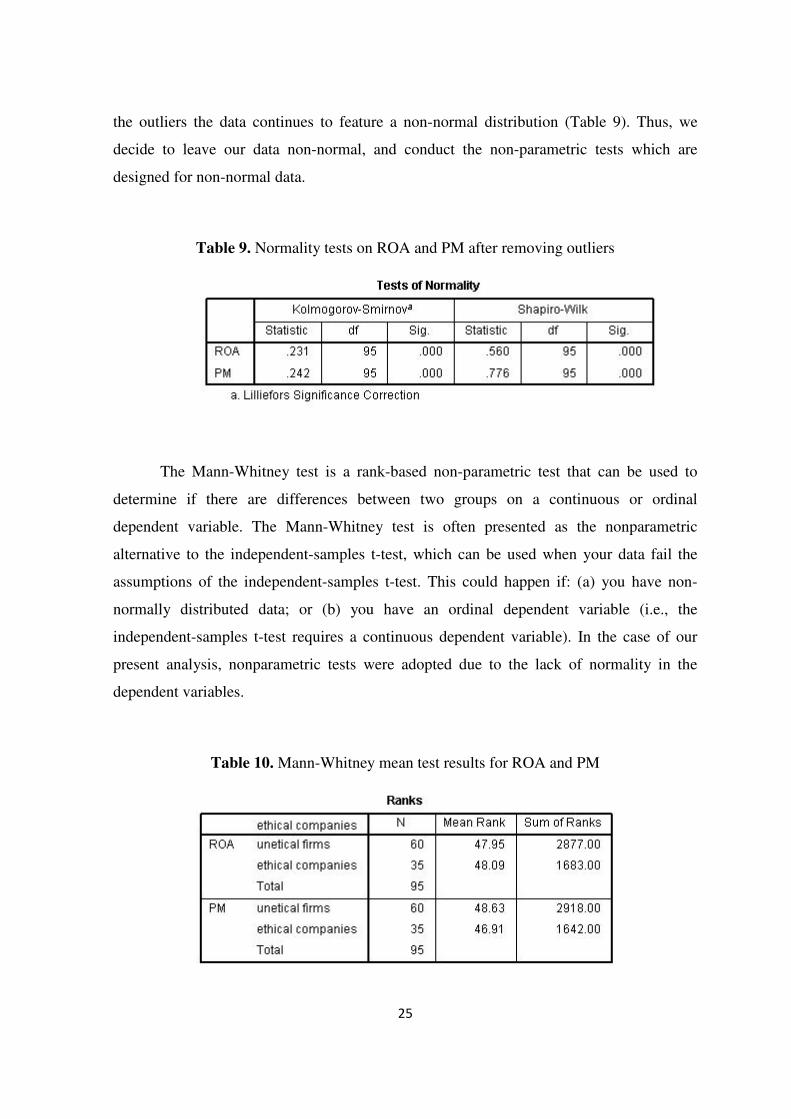
the outliers the data continues to feature a non-normal distribution (Table 9). Thus, we
decide to leave our data non-normal, and conduct the non-parametric tests which are
designed for non-normal data.
Table 9. Normality tests on ROA and PM after removing outliers
The Mann-Whitney test is a rank-based non-parametric test that can be used to
determine if there are differences between two groups on a continuous or ordinal
dependent variable. The Mann-Whitney test is often presented as the nonparametric
alternative to the independent-samples t-test, which can be used when your data fail the
assumptions of the independent-samples t-test. This could happen if: (a) you have non-
normally distributed data; or (b) you have an ordinal dependent variable (i.e., the
independent-samples t-test requires a continuous dependent variable). In the case of our
present analysis, nonparametric tests were adopted due to the lack of normality in the
dependent variables.
Table 10. Mann-Whitney mean test results for ROA and PM
26
Table 10 indicates the results on our Mann-Whitney test. It is very useful because it
indicates which group can be considered as having the highest profitability ratios, overall;
namely, the group with the highest mean rank. In this case, both groups, ethical and
unethical feature different values. While the ROA for ethical companies is higher (48.09),
the PM is higher for unethical companies (48.63).
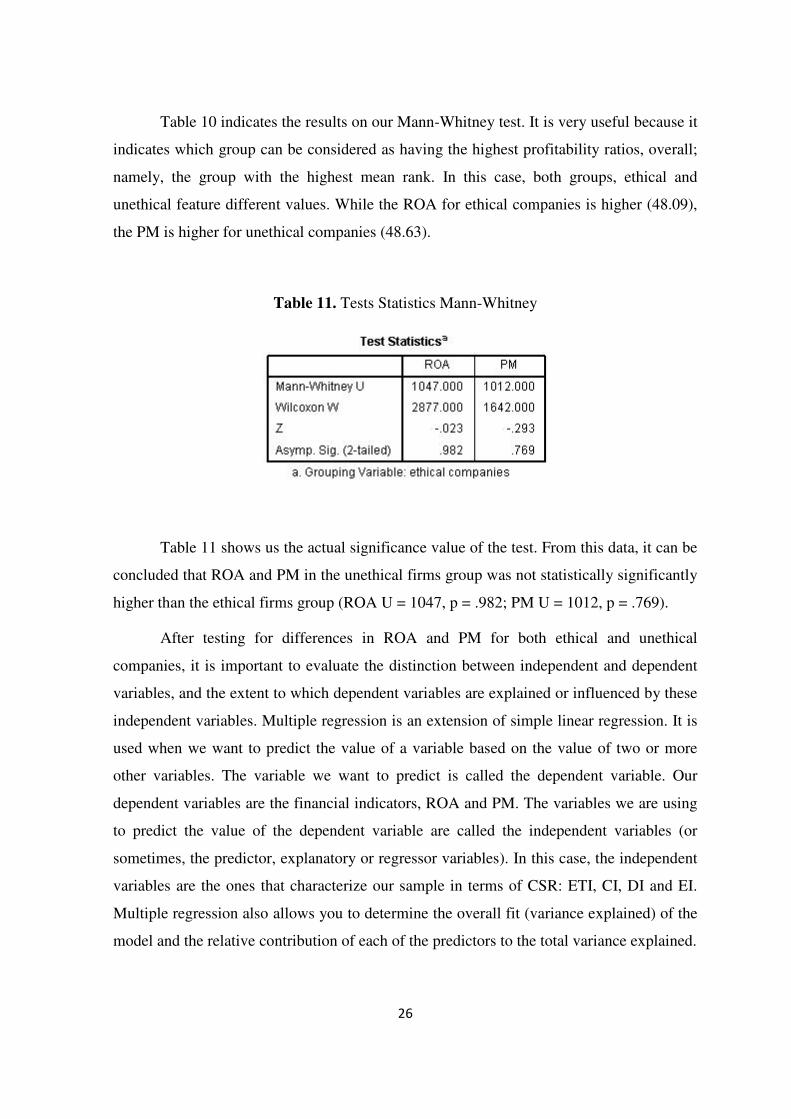
Table 11. Tests Statistics Mann-Whitney
Table 11 shows us the actual significance value of the test. From this data, it can be
concluded that ROA and PM in the unethical firms group was not statistically significantly
higher than the ethical firms group (ROA U = 1047, p = .982; PM U = 1012, p = .769).
After testing for differences in ROA and PM for both ethical and unethical
companies, it is important to evaluate the distinction between independent and dependent
variables, and the extent to which dependent variables are explained or influenced by these
independent variables. Multiple regression is an extension of simple linear regression. It is
used when we want to predict the value of a variable based on the value of two or more
other variables. The variable we want to predict is called the dependent variable. Our
dependent variables are the financial indicators, ROA and PM. The variables we are using
to predict the value of the dependent variable are called the independent variables (or
sometimes, the predictor, explanatory or regressor variables). In this case, the independent
variables are the ones that characterize our sample in terms of CSR: ETI, CI, DI and EI.
Multiple regression also allows you to determine the overall fit (variance explained) of the
model and the relative contribution of each of the predictors to the total variance explained.
27
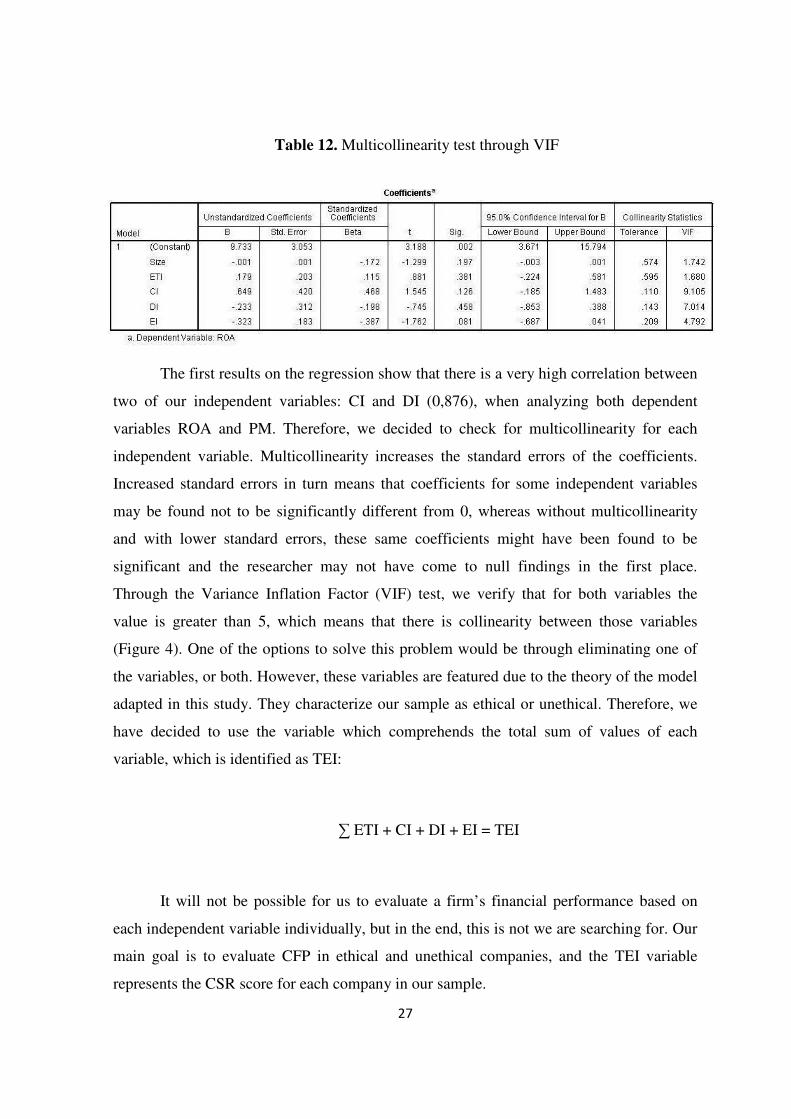
The first results on the regression show that there is a very high correlation between
two of our independent variables: CI and DI (0,876), when analyzing both dependent
variables ROA and PM. Therefore, we decided to check for multicollinearity for each
independent variable. Multicollinearity increases the standard errors of the coefficients.
Increased standard errors in turn means that coefficients for some independent variables
may be found not to be significantly different from 0, whereas without multicollinearity
and with lower standard errors, these same coefficients might have been found to be
significant and the researcher may not have come to null findings in the first place.
Through the Variance Inflation Factor (VIF) test, we verify that for both variables the
value is greater than 5, which means that there is collinearity between those variables
(Figure 4). One of the options to solve this problem would be through eliminating one of
the variables, or both. However, these variables are featured due to the theory of the model
adapted in this study. They characterize our sample as ethical or unethical. Therefore, we
have decided to use the variable which comprehends the total sum of values of each
variable, which is identified as TEI:
∑ ETI + CI + DI + EI = TEI
It will not be possible for us to evaluate a firm’s financial performance based on
each independent variable individually, but in the end, this is not we are searching for. Our
main goal is to evaluate CFP in ethical and unethical companies, and the TEI variable
represents the CSR score for each company in our sample.
Table 12. Multicollinearity test through VIF
28
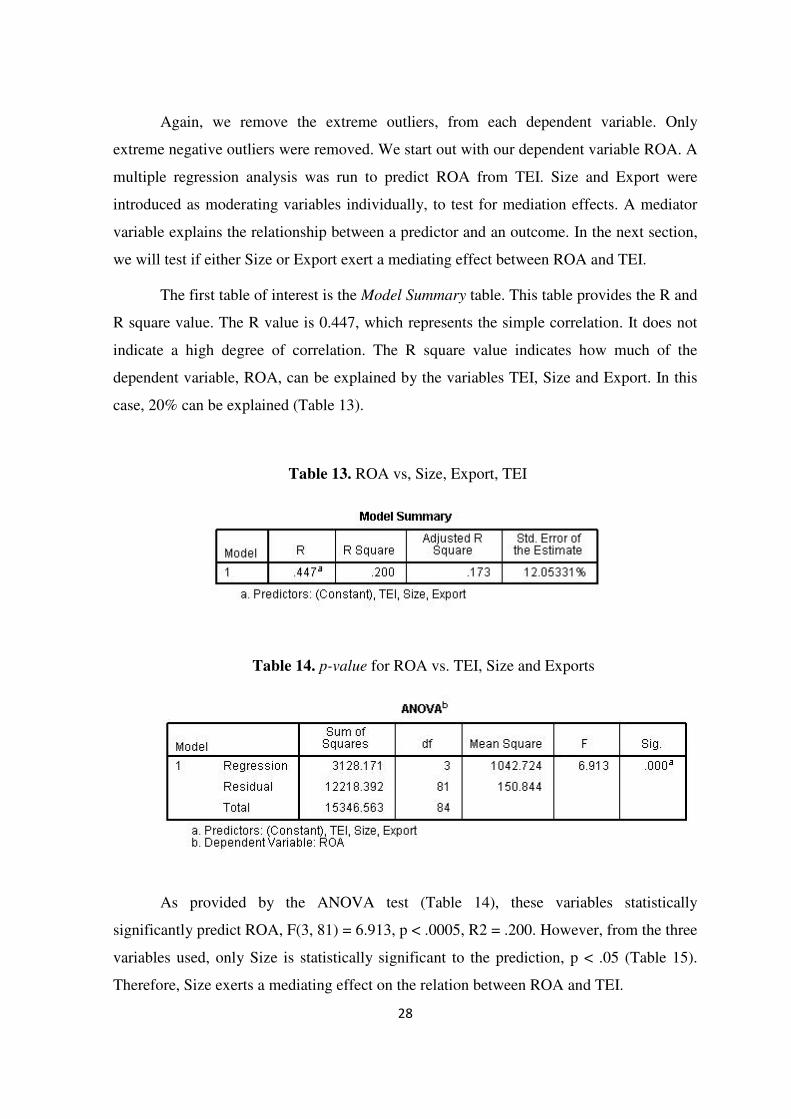
Again, we remove the extreme outliers, from each dependent variable. Only
extreme negative outliers were removed. We start out with our dependent variable ROA. A
multiple regression analysis was run to predict ROA from TEI. Size and Export were
introduced as moderating variables individually, to test for mediation effects. A mediator
variable explains the relationship between a predictor and an outcome. In the next section,
we will test if either Size or Export exert a mediating effect between ROA and TEI.
The first table of interest is the Model Summary table. This table provides the R and
R square value. The R value is 0.447, which represents the simple correlation. It does not
indicate a high degree of correlation. The R square value indicates how much of the
dependent variable, ROA, can be explained by the variables TEI, Size and Export. In this
case, 20% can be explained (Table 13).
As provided by the ANOVA test (Table 14), these variables statistically
significantly predict ROA, F(3, 81) = 6.913, p < .0005, R2 = .200. However, from the three
variables used, only Size is statistically significant to the prediction, p < .05 (Table 15).
Therefore, Size exerts a mediating effect on the relation between ROA and TEI.
Table 13. ROA vs, Size, Export, TEI
Table 14. p-value for ROA vs. TEI, Size and Exports
29
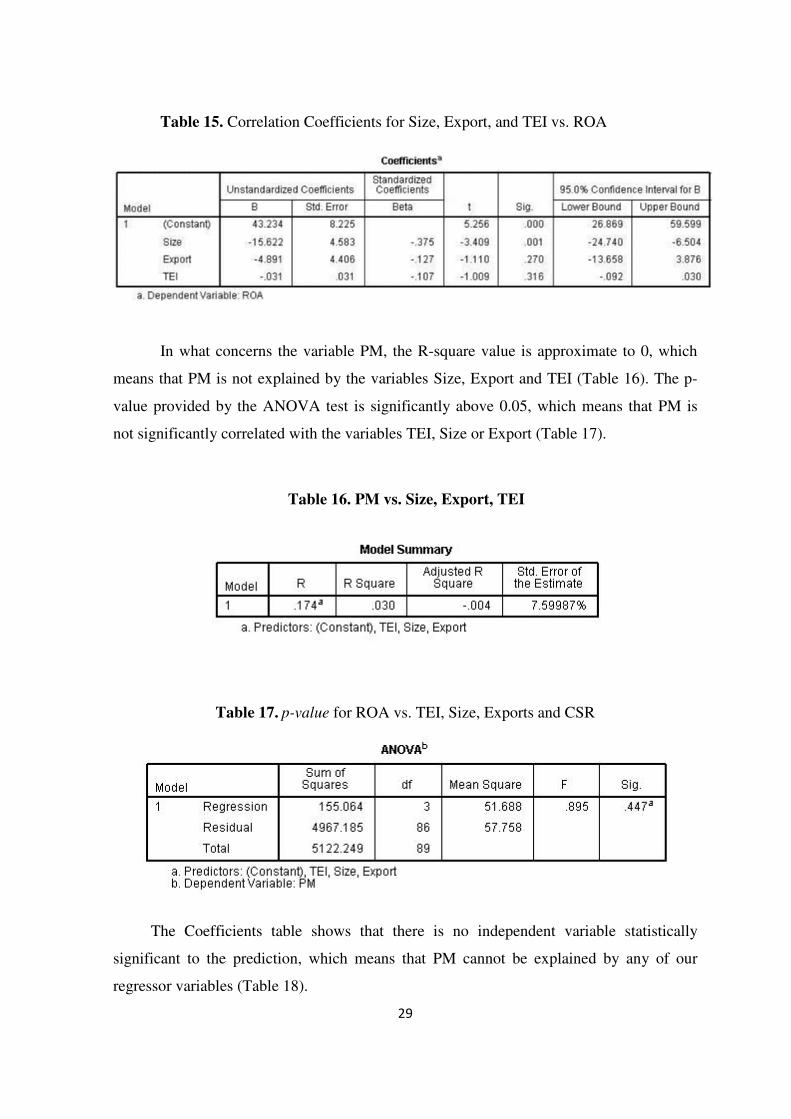
Table 15. Correlation Coefficients for Size, Export, and TEI vs. ROA
In what concerns the variable PM, the R-square value is approximate to 0, which
means that PM is not explained by the variables Size, Export and TEI (Table 16). The p-
value provided by the ANOVA test is significantly above 0.05, which means that PM is
not significantly correlated with the variables TEI, Size or Export (Table 17).
The Coefficients table shows that there is no independent variable statistically
significant to the prediction, which means that PM cannot be explained by any of our
regressor variables (Table 18).
Table 17. p-value for ROA vs. TEI, Size, Exports and CSR
Table 16. PM vs. Size, Export, TEI
30
Table 18. Correlation Coefficients for Size, Export, and TEI vs. PM
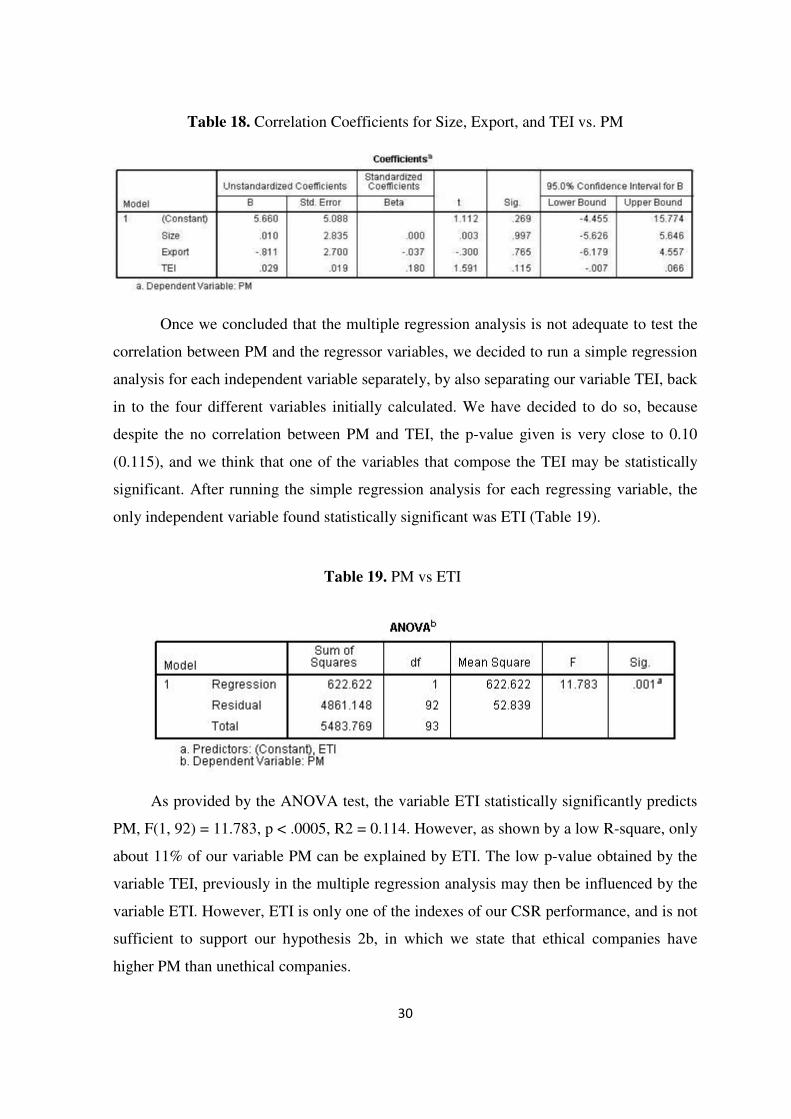
Once we concluded that the multiple regression analysis is not adequate to test the
correlation between PM and the regressor variables, we decided to run a simple regression
analysis for each independent variable separately, by also separating our variable TEI, back
in to the four different variables initially calculated. We have decided to do so, because
despite the no correlation between PM and TEI, the p-value given is very close to 0.10
(0.115), and we think that one of the variables that compose the TEI may be statistically
significant. After running the simple regression analysis for each regressing variable, the
only independent variable found statistically significant was ETI (Table 19).
As provided by the ANOVA test, the variable ETI statistically significantly predicts
PM, F(1, 92) = 11.783, p < .0005, R2 = 0.114. However, as shown by a low R-square, only
about 11% of our variable PM can be explained by ETI. The low p-value obtained by the
variable TEI, previously in the multiple regression analysis may then be influenced by the
variable ETI. However, ETI is only one of the indexes of our CSR performance, and is not
sufficient to support our hypothesis 2b, in which we state that ethical companies have
higher PM than unethical companies.
Table 19. PM vs ETI
31
4.3 Moderation Effects by Size, Exports and CSR
As defined previously, a moderator variable is an independent or predictor variable
that interacts with another independent or predictor variable in predicting scores on and
accounting for variance in a dependent or predicted variable. In this section we will test if
variables Size, Exports and CSR exert any moderating effect on the relationship between
our ethical performance variable TEI and our financial performance variables, ROA and
PM.
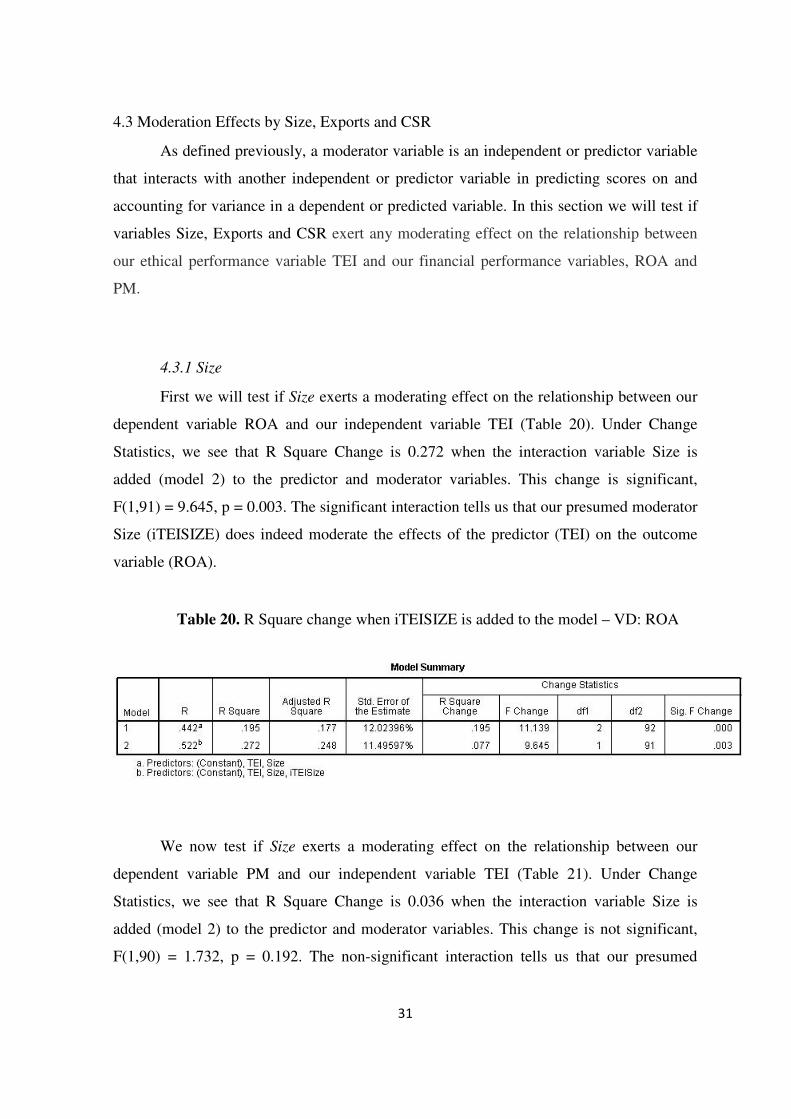
4.3.1 Size
First we will test if Size exerts a moderating effect on the relationship between our
dependent variable ROA and our independent variable TEI (Table 20). Under Change
Statistics, we see that R Square Change is 0.272 when the interaction variable Size is
added (model 2) to the predictor and moderator variables. This change is significant,
F(1,91) = 9.645, p = 0.003. The significant interaction tells us that our presumed moderator
Size (iTEISIZE) does indeed moderate the effects of the predictor (TEI) on the outcome
variable (ROA).
We now test if Size exerts a moderating effect on the relationship between our
dependent variable PM and our independent variable TEI (Table 21). Under Change
Statistics, we see that R Square Change is 0.036 when the interaction variable Size is
added (model 2) to the predictor and moderator variables. This change is not significant,
F(1,90) = 1.732, p = 0.192. The non-significant interaction tells us that our presumed
Table 20. R Square change when iTEISIZE is added to the model – VD: ROA
32
moderator Size (iTEISIZE) does not moderate the effects of the predictor (TEI) on the
outcome variable (PM).
4.3.2 Exports
Just as previously performed with Size, we test if Exports exerts a moderating
effect on the relationship between our dependent variable ROA and our independent
variable TEI (Table 22). Under Change Statistics, we see that R Square Change is 0.124
when the interaction variable Exports is added (model 2) to the predictor and moderator
variables. This change is significant, F(1,91) = 6.633, p = 0.012. The significant interaction
tells us that our presumed moderator Exports (MODEXPORT) does indeed moderate the
effects of the predictor (TEI) on the outcome variable (ROA).
We now test if Exports exerts a moderating effect on the relationship between our
dependent variable PM and our independent variable TEI (Table 23).
Table 21. R Square change when iTEISIZE is added to the model – VD: PM
Table 22. R Square change when iTEIExport is added to the model – VD: ROA
33
Under Change Statistics, we see that R Square Change is 0.016 when the
interaction variable Exports is added (model 2) to the predictor and moderator variables.
This change is not significant, F(1,90) = 0,000 p = 0.993. The non-significant interaction
tells us that our presumed moderator Exports (MODEXPORT) does not moderate the
effects of the predictor (TEI) on the outcome variable (PM).
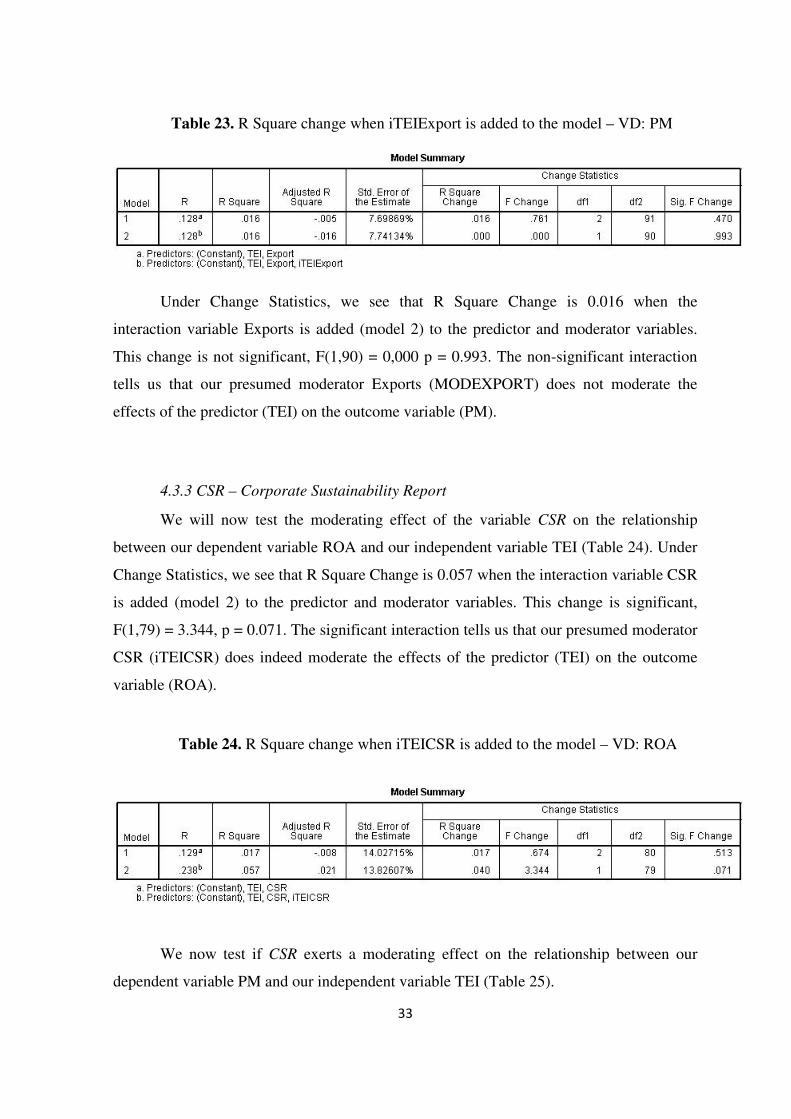
4.3.3 CSR – Corporate Sustainability Report
We will now test the moderating effect of the variable CSR on the relationship
between our dependent variable ROA and our independent variable TEI (Table 24). Under
Change Statistics, we see that R Square Change is 0.057 when the interaction variable CSR
is added (model 2) to the predictor and moderator variables. This change is significant,
F(1,79) = 3.344, p = 0.071. The significant interaction tells us that our presumed moderator
CSR (iTEICSR) does indeed moderate the effects of the predictor (TEI) on the outcome
variable (ROA).
We now test if CSR exerts a moderating effect on the relationship between our
dependent variable PM and our independent variable TEI (Table 25).
Table 23. R Square change when iTEIExport is added to the model – VD: PM
Table 24. R Square change when iTEICSR is added to the model – VD: ROA
34
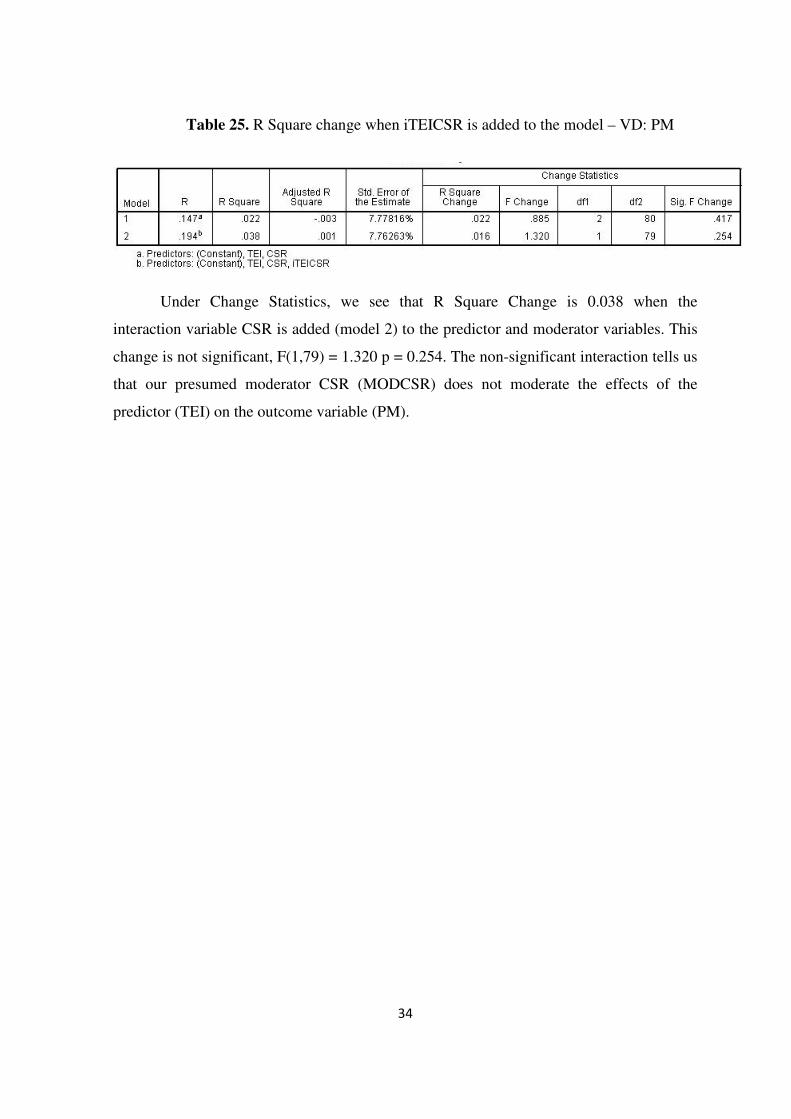
Under Change Statistics, we see that R Square Change is 0.038 when the
interaction variable CSR is added (model 2) to the predictor and moderator variables. This
change is not significant, F(1,79) = 1.320 p = 0.254. The non-significant interaction tells us
that our presumed moderator CSR (MODCSR) does not moderate the effects of the
predictor (TEI) on the outcome variable (PM).
Table 25. R Square change when iTEICSR is added to the model – VD: PM
35
5. Discussion
Starting out with our classification for ethical and unethical companies, our findings
confirm that corporate social responsibility is strongly linked to environmental
performance, by the companies in our sample underlining their strong concern about the
environment compared to other issues, which is probably related to legal requirements in
force that oblige companies to adapt and take measures, in order to reduce their
environmental impact. The lowest mean score obtained was for the ethics index (EI). For
this index, the results contrast substantially with those obtained for the other three indices,
an outcome which was mainly because most companies did not disclose their policies on
issues such as fair dealings, and contribution to political parties. Information was limited in
their reports. In most of the cases, there were no codes of ethics and/or conduct publicly
available.
When we separate ethical companies from unethical companies, based on the mean
value obtained for all entries, the majority of the companies in our sample scored as
unethical. Given the low mean obtained, which represents around thirty percent of the total
possible score achievable, we can easily conclude that, in addition to having a high
percentage of unethical companies, some of these have obtained very low classifications,
equal or very close to 0, for one or more of the indexes analyzed.
In terms of internationalization, the majority of the companies in our sample are
exporters, and only a low percentage of them are not. These companies have also been
forced to seek for new markets as a result of the real estate and construction crisis in
Portugal. However, a large percentage of companies who are exporting scored as being
ethical. These results help support the theory that companies who have engaged in
36
internationalization start to see social responsibility as a product differentiator that will
help improve their export performance (Boehe & Cruz, 2010).
By analyzing our Mann Whitney mean test on our dependent variables ROA and
PM; we verify that, while ROA for ethical companies was higher than for unethical
companies, PM was higher for unethical companies than for ethical companies. From the
data presented, it can be concluded that ROA and PM, in the unethical firms group were
not statistically significantly higher than the ROA and PM in the ethical firms group,
Therefore, we can conclude that there is no statistical evidence to support our H1, in which
we stated that ethical firms are more profitable than unethical firms.
According to our regression results, there seems to be no doubt that corporate social
performance positively influences our financial performance indicator return on assets,
which strengthens some of the findings stated in our literature review (McGuire et al,
1988; Preston & O’Bannon, 1997), and also provides supports for our hypothesis H2a, in
which we state that ethical companies have higher ROA than unethical companies..
However, our model fails to confirm that corporate social performance influences the
financial indicator profit margin. This may have to do with the financial crisis. The high
credit risk attributed to Portugal by international rating agencies, along with credit shortage
may have increased companies financial costs, thus reducing profit margins (Husted & de
Jesus Salazar, 2006). Therefore, we encountered no statistical significant data to support
our hypothesis H2b, in which we state that ethical companies have higher PM than
unethical companies. This can also be explained by investments in higher safety and
environmental standards (Sones, Grantham & Vieira, 2009), given the increasing demands
in terms of environmental legislation over the last years. Our statistical analysis suggests
that company show a great concern for environmental issues, and might be investing at this
level, thus lowering profit margins. Once no relation was found between ethical
performance and profit margin, no moderating or mediating effect was exerted by Size,
Exports or CSR on this financial indicator.
Our moderation tests show us that size moderates the relationship between ethical
performance and return on assets. This finding suggests that larger companies have a larger
financial capacity to carry our CSR measures (Zhou and Peng, 2012), and by improving
their ethical performance, they will also improve their financial performance (Fombrun &
37
Shanley, 1990; Roberts & Dowling, 2002). Exports also exert a moderating effect on the
relationship between ethical performance and return on assets, This can also suggest that
ethical exporting companies are more aware of the positive effects of corporate socially
responsible behavior on the company’s image, and also as a product differentiator. The
moderation test on CSR suggests that ethical companies are also concerned in publicly
disclosing their CSR activity because they are well aware of the positive outcomes that will
occur on their financial performance (Parket & Eilbert, 1975).

38
39
6. Conclusion
In this dissertation we focused on the study of the effects of ethics on an
organization’s financial performance. We started out by testing the hypothesis that
companies with ethical concerns have better financial performance than those companies
which are not concerned with ethical practices. Ethical behavior is evaluated according to
corporate social responsibility and we explain why they cannot be dissociated. In this
dissertation, first we examined the sustainability reports of the twenty biggest civil
construction and public works companies in Portugal. When these were not available, we
examined corporate websites, codes of ethics and conduct. Afterwards, we used the four
indices developed by Ameer and Othman (2012) which reflect global companies’
commitment to their ethical, environmental, community, and diversity responsibilities. Our
findings show that the Portuguese civil construction and public works industry is more
aware of environmental issues than ethical issues, such as codes of ethics or conduct.
However, the scores obtained are very low, for every CSR index analyzed in this study.
Also, our findings show that firms which have business in other countries seem to be more
concerned with ethical issues.
Despite limitation of sample size, overall, our statistical results confirm that there is
a bi-directional relationship between a firm’s financial performance and corporate social
responsibility. Our findings prove that, investing in ethical and social responsibility
measures is not only in the best interest of stakeholders, but also in the best interest of
shareholders, who search for a return on their investment.
The main contribution for academia is to strengthen the previous organizational and
management literature on the effects of ethical behavior on an organization’s financial
performance. Also, for management, our study demonstrates the importance of corporate
40
social performance, and the importance of promoting ethical behavior inside and outside of
their companies.
6.1 Limitations and Recommendations for Future Research
There are several limitations to this study. We only focus on one country, Portugal,
and it is only relating to one industry: civil construction and public works. We suggest that
further research be conducted on more industries, in order to be able to evaluate and
compare the effects of ethics on different sectors. We also suggest the research be extended
to other countries in order to perform a cross cultural study on the effects of ethics in
different cultural frameworks. Other variables should also be considered to evaluate ethical
performance, in order to allow us to expand our conclusions. Very few companies have
CSR reports or organizational codes of ethics and/or conduct. It would be interesting to
analyze how smaller companies perform in terms of ethics. Another interesting future
research would be to compare ethical behavior between “start-up” companies and
companies with a longer existence, in order to evaluate if unethical behavior is something
we inherit from older colleagues.
41
7. References
Abbott, W. F., & Monsen, R. J. (1979). On the measurement of corporate social responsibility:
self-reported disclosures as a method of measuring corporate social involvement. Academy
of Management Journal, 22(3), 501-515.
Abratt, R., Nel, D., & Higgs, N. S. (1992). An examination of the ethical beliefs of managers
using selected scenarios in a cross-cultural environment. Journal of Business Ethics, 11(1),
29-35.
Alexander, G. J., & Buchholz, R. A. (1978). Corporate social responsibility and stock market
performance. Academy of Management Journal, 21(3), 479-486.
Ameer, R., & Othman, R. (2012). Sustainability practices and corporate financial performance:
A study based on the top global corporations. Journal of Business Ethics, 108(1), 61-79.
Ashkanasy, N. M., Windsor, C., & Trevino, L. K. (2006). Bad apples in bad barrels revisited:
Cognitive moral development, just world beliefs, rewards, and ethical decision making.
Business Ethics Quarterly, 16(4), 449-473.
Aupperle, K. E., Carroll, A. B., & Hatfield, J. D. (1985). An empirical examination of the
relationship between corporate social responsibility and profitability. Academy of
Management Journal, 28(2), 446-463.
Bagnoli, M., & Watts, S. G. (2003). Selling to socially responsible consumers: competition and
the private provision of public goods. Journal of Economics & Management Strategy,
12(3), 419-445.
Banco de Portugal. Site: http://www.bportugal.pt/. Accessed on June 21st, 2013.
Baron, D. P. (2001). Private politics, corporate social responsibility, and integrated strategy.
Journal of Economics & Management Strategy, 10(1), 7-45.
Beekun, R. I. (1997). Islamic business ethics. IslamKotob.
42
Belkaoui, A., & Karpik, P. G. (1989). Determinants of the corporate decision to disclose social
information. Accounting, Auditing & Accountability Journal, 2(1).
Boehe, D. M., & Cruz, L. B. (2010). Corporate social responsibility, product differentiation
strategy and export performance. Journal of Business Ethics, 91(2), 325-346.
Bowman, E. H., & Haire, M. (1975). A strategic posture toward corporate social responsibility.
California Management Review, 18(2), 49-58.
Brammer, S. J., & Pavelin, S. (2006). Corporate reputation and social performance: The
importance of fit. Journal of Management Studies, 43(3), 435-455.
Brass, D. J., Butterfield, K. D., & Skaggs, B. C. (1998). Relationships and unethical behavior: A
social network perspective. Academy of Management Review, 23(1), 14-31.
Brassett, J., Rethel, L., & Watson, M. (2010). The political economy of the subprime crisis: the
economics, politics and ethics of response. New Political Economy, 15(1), 1-7.
Carroll, A. B. (1979). A three-dimensional conceptual model of corporate performance.
Academy of Management Review, 4(4), 497-505.
Cragg, W., & Matten, D. (2011). Ethics, corporations, and governance. Journal of Business
Ethics, 102(1), 1-4.
Cullen, J. B., Parboteeah, K. P., & Victor, B. (2003). The effects of ethical climates on
organizational commitment: A two-study analysis. Journal of Business Ethics, 46(2), 127-
141.
Delery, J. E., & Doty, D. H. (1996). Modes of theorizing in strategic human resource
management: Tests of universalistic, contingency, and configurational performance
predictions. Academy of Management Journal, 39(4), 802-835.
De Meuse, K. P., Vanderheiden, P. A., & Bergmann, T. J. (1994). Announced layoffs: Their
effect on corporate financial performance. Human Resource Management, 33(4), 509-530.
Effiok, S. O., Effiong, C., & Usoro, A. A. (2012). Corporate Governance, corporate strategy and
corporate performance: evidence from the financial institutions listed on the Nigerian stock
exchange. European Journal of Business and Management, 4(18), 84-95.
Enderle, G. (1997). In search of a common ethical ground: Corporate environmental
responsibility from the perspective of Christian environmental stewardship. Journal of
Business Ethics, 16(2), 173-181.
43
European Commission (2011). EU Anti-Corruption Report: Fighting Corruption in the EU.
http://ec.europa.eu/homeaffairs/news/intro/docs/110606/308/1_EN_ACT_part1_v12%5B1
%5D.pdf. Accessed in January 2013
European Commision (2012). Special EUROBAROMETER 374
http://ec.europa.eu/public_opinion/archives/ebs/ebs_374_en.pdf. Accessed in January,
2013
Fadul, J., & Maurer, R. (2004). Business ethics, corporate social responsibility, and firm value in
the oil and gas industry. In SPE Annual Technical Conference and Exhibition.
Ferrell, O. C., & Gresham, L. G. (1985). A contingency framework for understanding ethical
decision making in marketing. The Journal of Marketing, 87-96.
Fombrun, C., & Shanley, M. (1990). What's in a name? Reputation building and corporate
strategy. Academy of Management Journal, 33(2), 233-258.
Fombrun, C., & Foss, C. (2004). Business ethics: corporate responses to scandal. Corporate
Reputation Review, 7(3), 284-288.
Freeman, R. E. (1999). Divergent stakeholder theory. Academy of Management Review, 24(2),
233-236.
Gelb, D. S., & Strawser, J. A. (2001). Corporate social responsibility and financial disclosures:
an alternative explanation for increased disclosure. Journal of Business Ethics, 33(1), 1-13.
Goodpaster, K. E. (1991). Business ethics and stakeholder analysis. Business Ethics Quarterly,
53-73.
Griffin, J. J., & Mahon, J. F. (1997). The corporate social performance and corporate financial
performance debate twenty-five years of incomparable research. Business & Society, 36(1),
5-31.
Hsu, K. T. (2012). The advertising effects of corporate social responsibility on corporate
reputation and brand equity: Evidence from the Life Insurance Industry in Taiwan. Journal
of Business Ethics, 109(2), 189-201.
Husted, B. W., & de Jesus Salazar, J. (2006). Taking Friedman Seriously: Maximizing Profits
and Social Performance*. Journal of Management Studies, 43(1), 75-91.Jenkins, H.
(2006). Small business champions for corporate social responsibility. Journal of Business
Ethics, 67(3), 241-256.
INE – Instituto Nacional de Estatística. Site: http://www.ine.pt/. Accessed on June 21st, 2013.
44
Jones, T. M. (1995). Instrumental stakeholder theory: A synthesis of ethics and economics.
Academy of Management Review, 20(2), 404-437.
José M. Moneva, Eduardo Ortas, (2010). Corporate environmental and financial performance: a
multivariate approach. Industrial Management & Data Systems, 110(2), pp.193 – 210
Joyner, B. E., & Payne, D. (2002). Evolution and implementation: a study of values, business
ethics and corporate social responsibility. Journal of Business Ethics, 41(4), 297-311.
Key, S., & Popkin, S. J. (1998). Integrating ethics into the strategic management process: doing
well by doing good. Management Decision, 36(5), 331-338.
Koh, H. C. & Boo. E., H.(2004), Organizational ethics and employee satisfaction and
commitment. Management Decision, 42(5), 677-693.
Konar, S., & Cohen, M. A. (2001). Does the market value environmental performance? Review
of Economics and Statistics, 83(2), 281-289.
Kurucz, E., Colbert, B., & Wheeler, D. (2008). The business case for corporate social
responsibility. In A. Crane, A. McWilliams, D. Matten, J. Moon, & D. Siegel (Eds.), The
Oxford Handbook of Corporate social Responsibility (pp. 83–112). Oxford University
Press.
Lewis, P. V. (1985). Defining ‘business ethics’: Like nailing jello to a wall. Journal of Business
Ethics, 4(5), 377-383.
Longstaff, F. A. (2010). The subprime credit crisis and contagion in financial markets. Journal of
Financial Economics, 97(3), 436-450.
Lovett, S., Simmons, L. C., & Kali, R. (1999). Guanxi versus the market: Ethics and efficiency.
Journal of International Business Studies, 231-247.
Mazar, N., Amir, O., & Ariely, D. (2008). The dishonesty of honest people: A theory of self-
concept maintenance. Journal of Marketing Research, 45(6), 633-644.
McGuire, J. B., Sundgren, A., & Schneeweis, T. (1988). Corporate social responsibility and firm
financial performance. Academy of Management Journal, 31(4), 854-872.
McMurrian, R. C., & Matulich, E. (2011). Building customer value and profitability with
business ethics. Journal of Business & Economics Research, 4(11).
McWilliams, A., & Siegel, D. (2001). Corporate social responsibility: A theory of the firm
perspective. Academy of Management Review, 26(1), 117-127.
Moneva, J. M., & Ortas, E. (2010). Corporate environmental and financial performance: a
multivariate approach. Industrial Management & Data Systems, 110(2), 193-210.
45
Moskowitz, M. (1972). Choosing socially responsible stocks. Business and Society Review, 1(1),
71-75.
Orlitzky, M. (2001). Does Firm Size Comfound the Relationship Between Corporate Social
Performance and Firm Financial Performance?. Journal of Business Ethics, 33(2), 167-
180.
Overbeek, H. (2012). Sovereign debt crisis in euroland: Root causes and implications for
European integration. The International Spectator, 47(1), 30-48.
Posner, B. Z., & Schmidt, W. H. (1992). Values and the American manager – An update.
California Management Review, 34(3), 80-94.
Prahalad, C. K., & Hamel, G. (1994). Strategy as a field of study: why search for a new
paradigm?. Strategic Management Journal, 15(S2), 5-16.
Preston, L. E., & O’Bannon, D. P. (1997). The corporate social-financial performance
relationship. Business and Society, 36(4), 419-429.
Reidenbach, R. E., and D. P. Robin. 1991. A Conceptual Model of Corporate Moral
Development. Journal of Business Ethics 10: 273-284.
Roberts, P. W., & Dowling, G. R. (2002). Corporate reputation and sustained superior financial
performance. Strategic Management Journal, 23(12), 1077-1093.
Robertson, C., & Fadil, P. A. (1999). Ethical decision making in multinational organizations: a
culture-based model. Journal of Business Ethics, 19(4), 385-392.
Rossouw, G. J. (1997). Business Ethics in South Africa. Journal of Business Ethics, 16(14),
1539-1547.
Rossouw, G. J. (2002). Three approaches to teaching business ethics. Teaching Business Ethics,
6(4), 411-433.
Rowley, T., & Berman, S. (2000). A brand new brand of corporate social performance. Business
& Society, 39(4), 397-418.
Schminke, M., Ambrose, M. L., & Neubaum, D. O. (2005). The effect of leader moral
development on ethical climate and employee attitudes. Organizational Behavior and
Human Decision Processes, 97(2), 135-151.
Schreck, P. (2011). Reviewing the business case for corporate social responsibility: New
evidence and analysis. Journal of Business Ethics, 103(2), 167-188.
Shaw, W. H. (1999). Contemporary Ethics: Taking account of utilitarianism. Oxford: Blackwell.
Shaw, W. H. (2010). Business Ethics. CengageBrain. com.
46
Sims, R. L., & Gegez, A. E. (2004). Attitudes towards business ethics: A five nation comparative
study. Journal of Business Ethics, 50(3), 253-265.
Singh, J., & del Bosque, I. R. (2008). Understanding corporate social responsibility and product
perceptions in consumer markets: a cross-cultural evaluation. Journal of Business Ethics,
80(3), 597-611.
Somers, M. J. (2001). Ethical codes of conduct and organizational context: A study of the
relationship between codes of conduct, employee behavior and organizational values.
Journal of Business Ethics, 30(2), 185-195.
Sones, M., Grantham, S., & Vieira, E. T. (2009). Communicating CSR via pharmaceutical
company web sites: Evaluating message frameworks for external and internal stakeholders.
Corporate Communications: An International Journal, 14(2), 144-157.
Stevens, J. M., Kevin Steensma, H., Harrison, D. A., & Cochran, P. L. (2005). Symbolic or
substantive document? The influence of ethics codes on financial executives' decisions.
Strategic Management Journal, 26(2), 181-195.
Sturdivant, F. D., & Ginter, J. L. (1977). Corporate social responsiveness: Management attitudes
and economic performance. California Management Review, 19(3), 30-39.
Sullivan, D. (1994). Measuring the degree of internationalization of a firm. Journal of
International Business Studies, 325-342.
Swanson, D. L. (1995). Addressing a theoretical problem by reorienting the corporate social
performance model. Academy of Management Review, 20(1), 43-64.
Transparency International (2011). Bribe Payer’s Index (BPI).
http://bpi.transparency.org/bpi2011/results/. Accessed in January 2013.
Transparency International (2011). Corruption Perceptions Index (CPI).
http://www.transparency.org/. Accessed in January, 2013.
Transparency International. (2009). Transparency in Reporting on Anti-Corruption (TRAC).
http://ec.europa.eu/enterprise/policies/sustainable-business/corporate-social-
responsibility/reporting-disclosure/swedish-
presidency/files/surveys_and_reports/transparency_in_reporting_on_anti-
corruption_en.pdf. Accessed in January, 2013
Trevino, L. K. (1986). Ethical decision making in organizations: A person-situation interactionist
model. Academy of Management Review, 11(3), 601-617.

47
Trevino, L. K., & Youngblood, S. A. (1990). Bad apples in bad barrels: A causal analysis of
ethical decision-making behavior. Journal of Applied Psychology, 75(4), 378.
Trevino, L. K. (1992). Moral reasoning and business ethics: Implications for research, education,
and management. Journal of Business Ethics, 11(5-6), 445-459.
Treviño, L. K., Butterfield, K. D., & McCabe, D. L. (1998). The ethical context in organizations:
Influences on employee attitudes and behaviors. Business Ethics Quarterly, 447-476.
Trevino, L. K., & Nelson, K. A. (1999). Managing Business Ethics. New York: Wiley
Treviño, L. K., Weaver, G. R., & Reynolds, S. J. (2006). Behavioral ethics in organizations: A
review. Journal of Management, 32(6), 951-990.
Tsalikis, J., & LaTour, M. S. (1995). Bribery and extortion in international business: Ethical
perceptions of Greeks compared to Americans. Journal of Business Ethics, 14(4), 249-264.
Turban, D. B., & Greening, D. W. (1997). Corporate social performance and organizational
attractiveness to prospective employees. Academy of Management Journal, 40(3), 658-
672.
Ullmann, A. A. (1985). Data in search of a theory: a critical examination of the relationships
among social performance, social disclosure, and economic performance of US firms.
Academy of Management Review, 10(3), 540-557.
Valentine, S., & Fleischman, G. (2008). Ethics programs, perceived corporate social
responsibility and job satisfaction. Journal of Business Ethics, 77(2), 159-172.
Vance, S. C. (1975). Are socially responsible corporations good investment risks. Management
review, 64(8), 19-24.
Victor, B., & Cullen, J. B. (1987). A theory and measure of ethical climate in organizations.
Research in Corporate Social Performance and Policy, 9.
Victor, B., & Cullen, J. B. (1988). The organizational bases of ethical work climates.
Administrative Science Quarterly, 101-125.
Waddock, S. A., & Graves, S. B. (1997). The corporate social performance. Strategic
Management Journal, 8(4), 303-319.
Weaver, G. R., & Trevino, L. K. (2001). The role of human resources in ethics/compliance
management: A fairness perspective. Human Resource Management Review, 11(1), 113-
134.
Webley, S., & More, E. (2003). Does business ethics pay?. London: Institute of business ethics.
48
Wood, G. (1995). Ethics at the purchasing/sales interface: an international perspective.
International Marketing Review, 12(4), 7-19.
Zhang, X., & Gu, P. (2012). On the Relationship between CSR and Financial Performance: An
empirical study of US firms (Doctoral dissertation, Jönköping University).
Zhou, J. Q., & Peng, M. W. (2012). Does bribery help or hurt firm growth around the world?.
Asia Pacific Journal of Management, 29(4), 907-921.
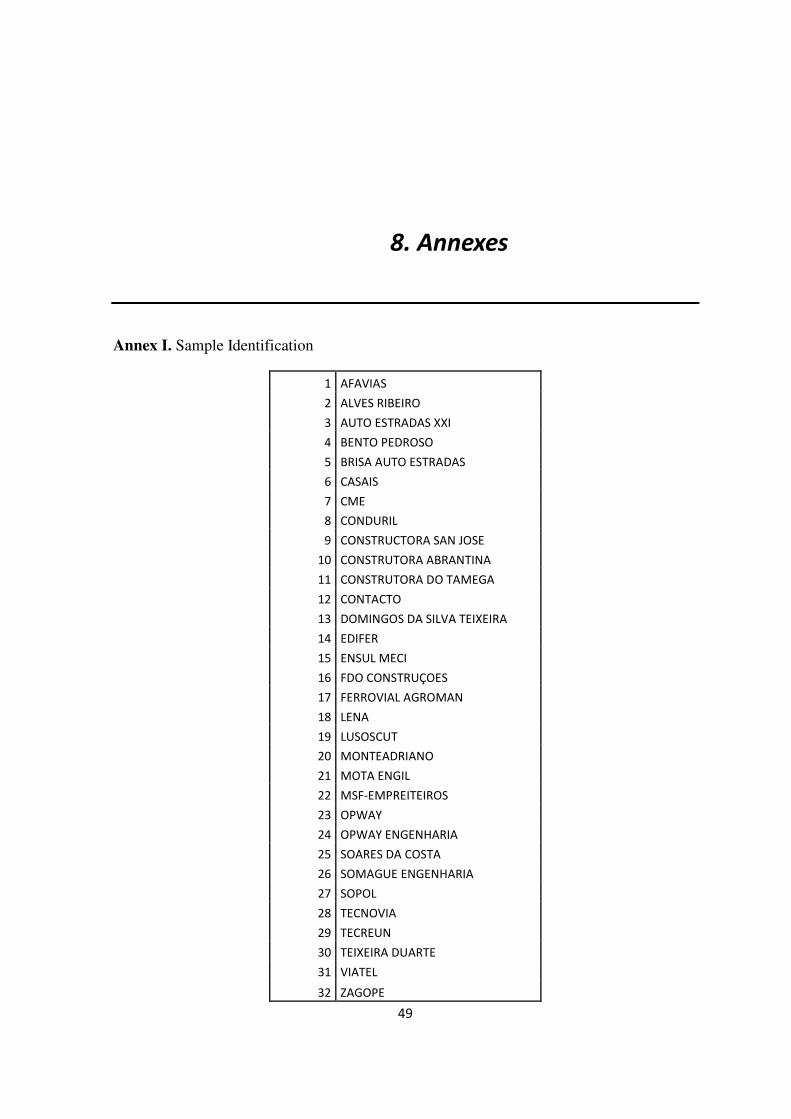
49
8. Annexes
Annex I. Sample Identification
1 AFAVIAS
2 ALVES RIBEIRO
3 AUTO ESTRADAS XXI
4 BENTO PEDROSO
5 BRISA AUTO ESTRADAS
6 CASAIS
7 CME
8 CONDURIL
9 CONSTRUCTORA SAN JOSE
10 CONSTRUTORA ABRANTINA
11 CONSTRUTORA DO TAMEGA
12 CONTACTO
13 DOMINGOS DA SILVA TEIXEIRA
14 EDIFER
15 ENSUL MECI
16 FDO CONSTRUÇOES
17 FERROVIAL AGROMAN
18 LENA
19 LUSOSCUT
20 MONTEADRIANO
21 MOTA ENGIL
22 MSF-EMPREITEIROS
23 OPWAY
24 OPWAY ENGENHARIA
25 SOARES DA COSTA
26 SOMAGUE ENGENHARIA
27 SOPOL
28 TECNOVIA
29 TECREUN
30 TEIXEIRA DUARTE
31 VIATEL
32 ZAGOPE
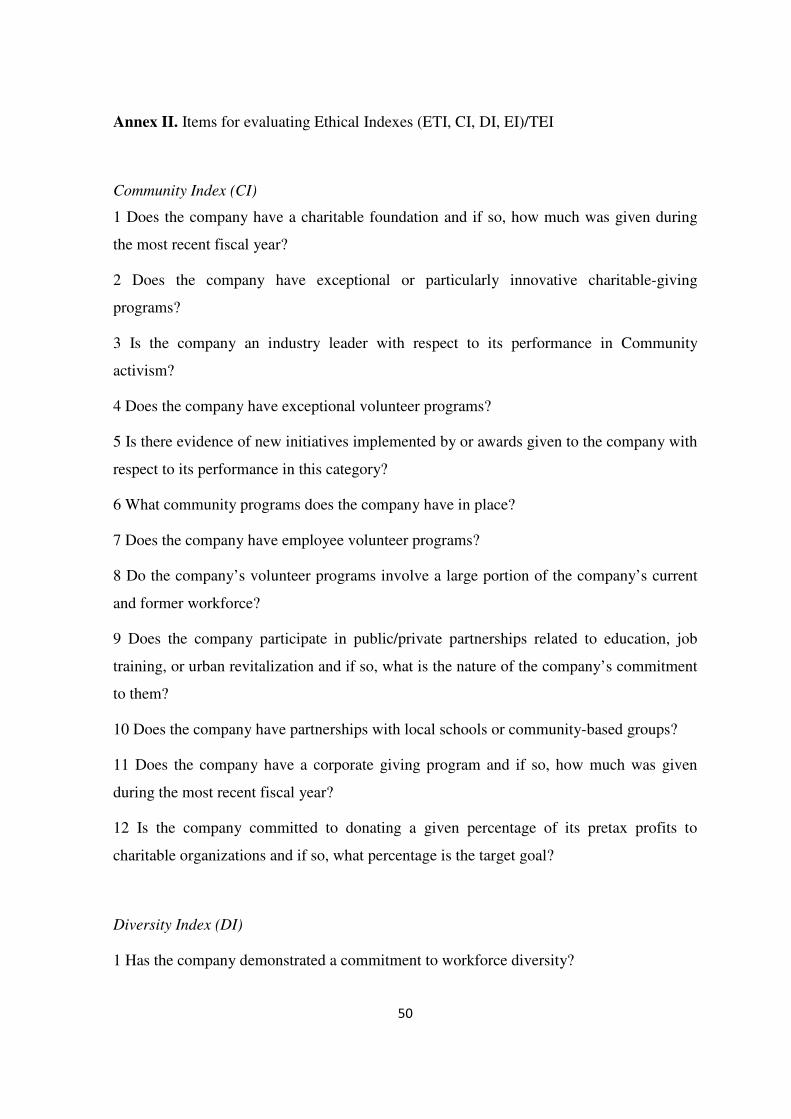
50
Annex II. Items for evaluating Ethical Indexes (ETI, CI, DI, EI)/TEI
Community Index (CI)
1 Does the company have a charitable foundation and if so, how much was given during
the most recent fiscal year?
2 Does the company have exceptional or particularly innovative charitable-giving
programs?
3 Is the company an industry leader with respect to its performance in Community
activism?
4 Does the company have exceptional volunteer programs?
5 Is there evidence of new initiatives implemented by or awards given to the company with
respect to its performance in this category?
6 What community programs does the company have in place?
7 Does the company have employee volunteer programs?
8 Do the company’s volunteer programs involve a large portion of the company’s current
and former workforce?
9 Does the company participate in public/private partnerships related to education, job
training, or urban revitalization and if so, what is the nature of the company’s commitment
to them?
10 Does the company have partnerships with local schools or community-based groups?
11 Does the company have a corporate giving program and if so, how much was given
during the most recent fiscal year?
12 Is the company committed to donating a given percentage of its pretax profits to
charitable organizations and if so, what percentage is the target goal?
Diversity Index (DI)
1 Has the company demonstrated a commitment to workforce diversity?
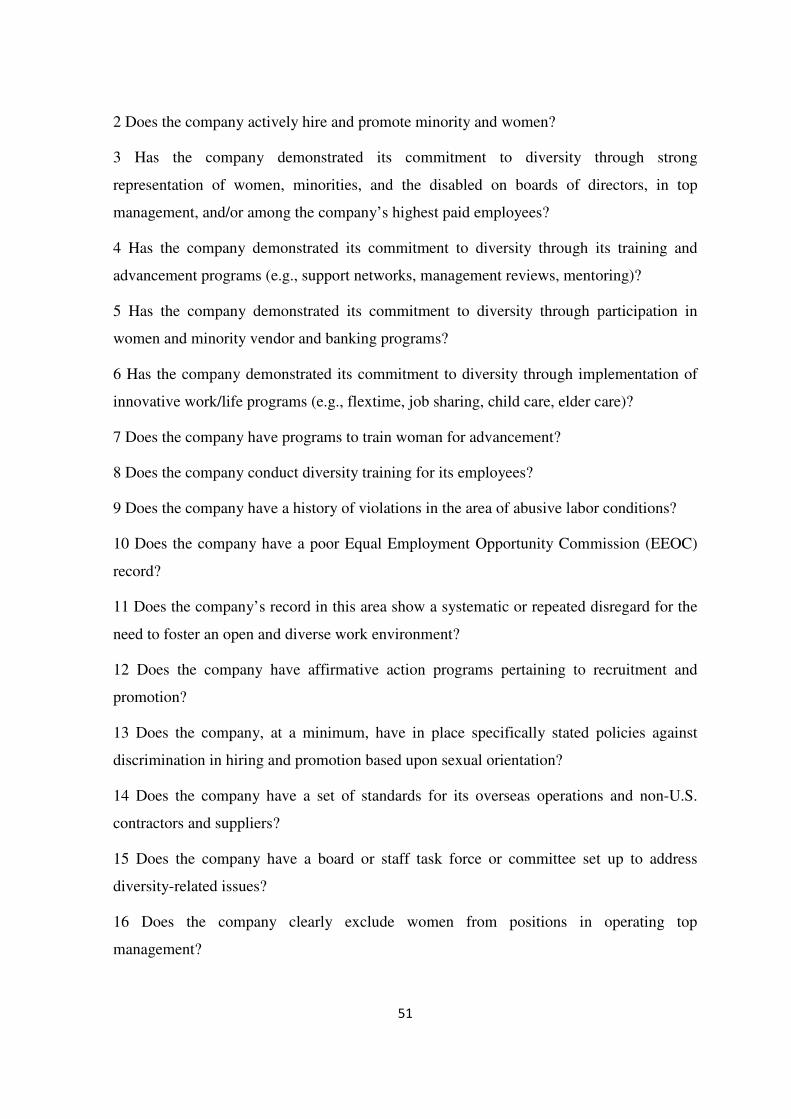
51
2 Does the company actively hire and promote minority and women?
3 Has the company demonstrated its commitment to diversity through strong
representation of women, minorities, and the disabled on boards of directors, in top
management, and/or among the company’s highest paid employees?
4 Has the company demonstrated its commitment to diversity through its training and
advancement programs (e.g., support networks, management reviews, mentoring)?
5 Has the company demonstrated its commitment to diversity through participation in
women and minority vendor and banking programs?
6 Has the company demonstrated its commitment to diversity through implementation of
innovative work/life programs (e.g., flextime, job sharing, child care, elder care)?
7 Does the company have programs to train woman for advancement?
8 Does the company conduct diversity training for its employees?
9 Does the company have a history of violations in the area of abusive labor conditions?
10 Does the company have a poor Equal Employment Opportunity Commission (EEOC)
record?
11 Does the company’s record in this area show a systematic or repeated disregard for the
need to foster an open and diverse work environment?
12 Does the company have affirmative action programs pertaining to recruitment and
promotion?
13 Does the company, at a minimum, have in place specifically stated policies against
discrimination in hiring and promotion based upon sexual orientation?
14 Does the company have a set of standards for its overseas operations and non-U.S.
contractors and suppliers?
15 Does the company have a board or staff task force or committee set up to address
diversity-related issues?
16 Does the company clearly exclude women from positions in operating top
management?
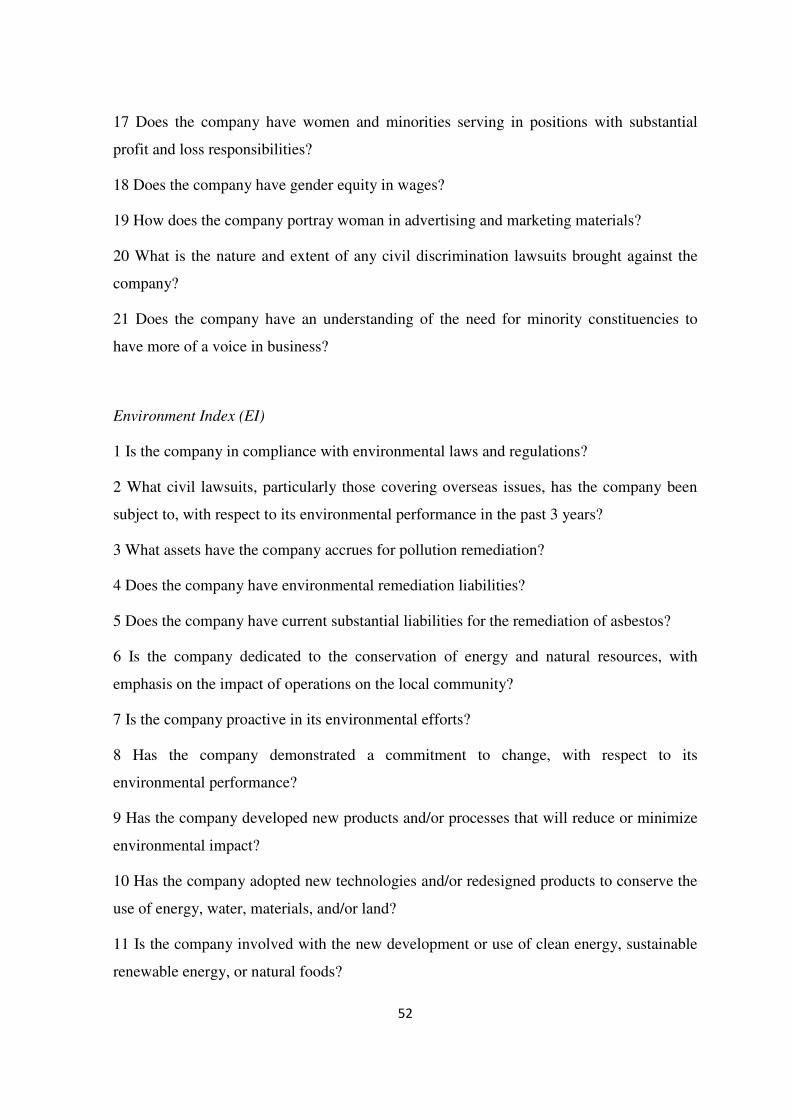
52
17 Does the company have women and minorities serving in positions with substantial
profit and loss responsibilities?
18 Does the company have gender equity in wages?
19 How does the company portray woman in advertising and marketing materials?
20 What is the nature and extent of any civil discrimination lawsuits brought against the
company?
21 Does the company have an understanding of the need for minority constituencies to
have more of a voice in business?
Environment Index (EI)
1 Is the company in compliance with environmental laws and regulations?
2 What civil lawsuits, particularly those covering overseas issues, has the company been
subject to, with respect to its environmental performance in the past 3 years?
3 What assets have the company accrues for pollution remediation?
4 Does the company have environmental remediation liabilities?
5 Does the company have current substantial liabilities for the remediation of asbestos?
6 Is the company dedicated to the conservation of energy and natural resources, with
emphasis on the impact of operations on the local community?
7 Is the company proactive in its environmental efforts?
8 Has the company demonstrated a commitment to change, with respect to its
environmental performance?
9 Has the company developed new products and/or processes that will reduce or minimize
environmental impact?
10 Has the company adopted new technologies and/or redesigned products to conserve the
use of energy, water, materials, and/or land?
11 Is the company involved with the new development or use of clean energy, sustainable
renewable energy, or natural foods?
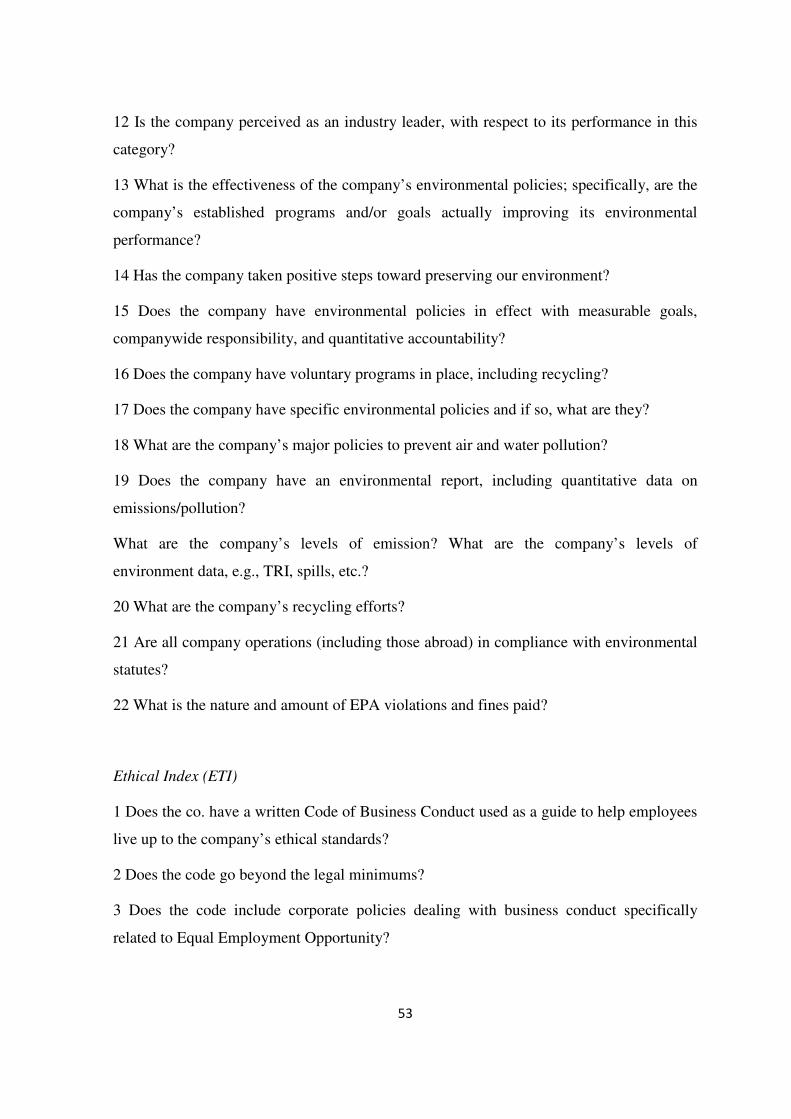
53
12 Is the company perceived as an industry leader, with respect to its performance in this
category?
13 What is the effectiveness of the company’s environmental policies; specifically, are the
company’s established programs and/or goals actually improving its environmental
performance?
14 Has the company taken positive steps toward preserving our environment?
15 Does the company have environmental policies in effect with measurable goals,
companywide responsibility, and quantitative accountability?
16 Does the company have voluntary programs in place, including recycling?
17 Does the company have specific environmental policies and if so, what are they?
18 What are the company’s major policies to prevent air and water pollution?
19 Does the company have an environmental report, including quantitative data on
emissions/pollution?
What are the company’s levels of emission? What are the company’s levels of
environment data, e.g., TRI, spills, etc.?
20 What are the company’s recycling efforts?
21 Are all company operations (including those abroad) in compliance with environmental
statutes?
22 What is the nature and amount of EPA violations and fines paid?
Ethical Index (ETI)
1 Does the co. have a written Code of Business Conduct used as a guide to help employees
live up to the company’s ethical standards?
2 Does the code go beyond the legal minimums?
3 Does the code include corporate policies dealing with business conduct specifically
related to Equal Employment Opportunity?
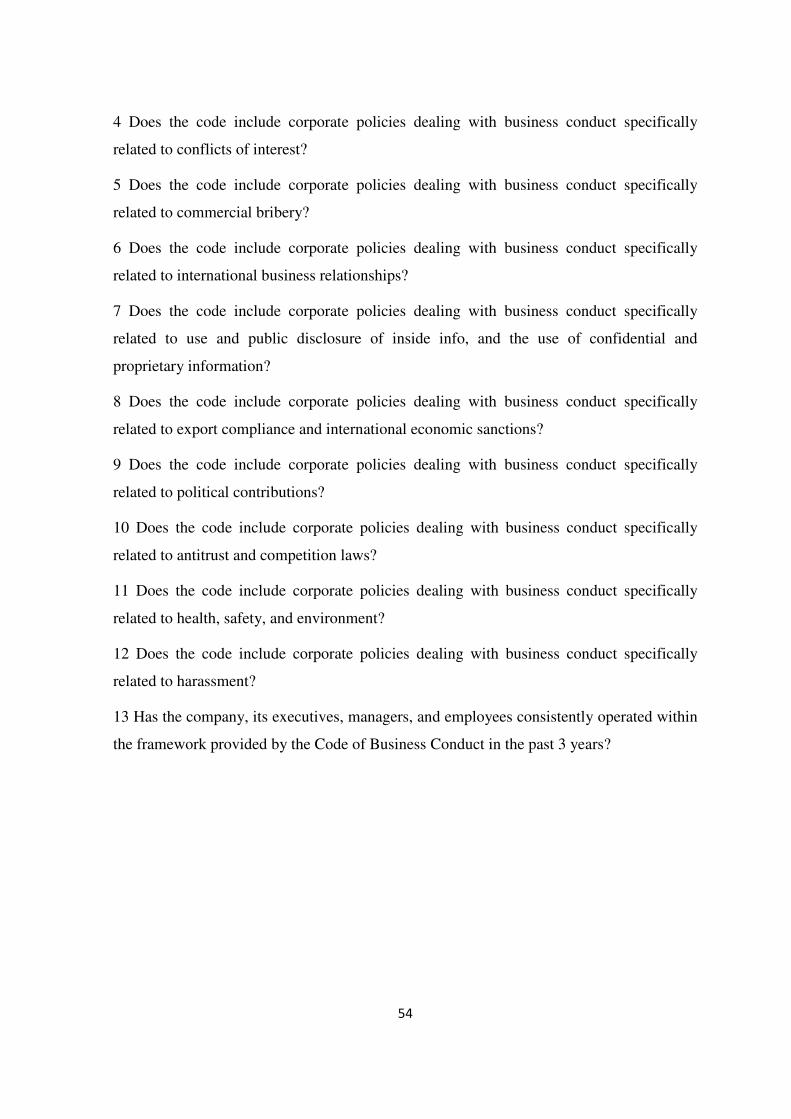
54
4 Does the code include corporate policies dealing with business conduct specifically
related to conflicts of interest?
5 Does the code include corporate policies dealing with business conduct specifically
related to commercial bribery?
6 Does the code include corporate policies dealing with business conduct specifically
related to international business relationships?
7 Does the code include corporate policies dealing with business conduct specifically
related to use and public disclosure of inside info, and the use of confidential and
proprietary information?
8 Does the code include corporate policies dealing with business conduct specifically
related to export compliance and international economic sanctions?
9 Does the code include corporate policies dealing with business conduct specifically
related to political contributions?
10 Does the code include corporate policies dealing with business conduct specifically
related to antitrust and competition laws?
11 Does the code include corporate policies dealing with business conduct specifically
related to health, safety, and environment?
12 Does the code include corporate policies dealing with business conduct specifically
related to harassment?
13 Has the company, its executives, managers, and employees consistently operated within
the framework provided by the Code of Business Conduct in the past 3 years?