Embed Size (px)
Citation preview
The Journal of Advanced Prosthodontics 333
The effects of dentin bonding agent formulas on their polymerization quality, and together with tooth tissues on their microleakage and shear bond strength: an explorative 3-step experiment
Mohmmad Erfan1, Tahereh Sadat Jafarzadeh-Kashi2, Malihe Ghadiri3, Vahid Rakhshan4,5*1Department of Pharmaceutics, School of Pharmacy, Shahid Beheshti University of Medical Sciences, Tehran, Iran2Iranian Tissue Bank and Research Center, Department of Dental Materials, Faculty of Dentistry, Research Center for Sciences and Technology in Medicine, Tehran University of Medical Sciences, Tehran, Iran3Pharmacist in private practice, Tehran, Iran4Iranian Tissue Bank and Research Center, Tehran University of Medical Sciences, Tehran, Iran5Department of Dental Anatomy and Morphology, Dental Branch, Islamic Azad University, Tehran, Iran
PURPOSE. Bonding agents (BA) are the crucial weak link of composite restorations. Since the commercial materials’ compositions are not disclosed, studies to formulize the optimum ratios of different components are of value. The aim of this study was to find a proper formula of BAs. MATERIALS AND METHODS. This explorative experimental in vitro study was composed of 4 different sets of extensive experiments. A commercial BA and 7 experimental formulas were compared in terms of degree of conversion (5 experimental formulas), shear bond strength, mode of failure, and microleakage (3 experimental formulas). Statistical analyses were performed (α=.05). The DC of selected formula was tested one year later. RESULTS. The two-way ANOVA indicated a significant difference between the shear bond strength (SBS) of two tissues (dentin vs. enamel, P=.0001) in a way that dentinal bonds were weaker. However, there was no difference between the four materials (P=.283). The adhesive mode of failure was predominant in all groups. No differences between the microleakage of the four materials at occlusal (P=.788) or gingival (P=.508) sites were detected (Kruskal-Wallis). The Mann-Whitney U test showed a significant difference between the microleakage of all materials (3 experimental formulas and a commercial material) together at the occlusal site versus the gingival site (P=.041). CONCLUSION. A formula with 62% bisphenol A-glycidyl methacrylate (Bis-GMA), 37% hydroxy ethyl methacrylate (HEMA), 0.3% camphorquinone (CQ), and 0.7% dimethyl-para-toluidine (DMPT) seems a proper formula for mass production. The microleakage and SBS might be respectively higher and lower on dentin compared to enamel. [ J Adv Prosthodont 2014;6:333-45]
KEY WORDS: Dentin bonding agents; Polymerization; Degree of conversion; Shear bond strength; Microleakage; Mode of failure; H-NMR spectroscopy; FT-IR spectroscopy
http://dx.doi.org/10.4047/jap.2014.6.5.333http://jap.or.kr J Adv Prosthodont 2014;6:333-45
INTRODUCTION
Bonding agents (BA) are an essential part of composite adhesion,1-3 and are used in various fields (e.g., repairing old composites, veneering laminates on composite restorations, and bonding orthodontic brackets).4-6 They are critical in forming proper bonding and prevention of microleakage, secondary caries, sensitization and restoration failure.3 Although BAs constitute a small proportion of a bonded restoration, they are the weak link in the system and possi-bly the most common cause of failure which might result in marginal discrepancy by their shrinkage, thermal expan-sion, or wear.1,2
pISSN 2005-7806, eISSN 2005-7814
Corresponding author: Vahid Rakhshan#22 Behruzi Alley, Karegar Shomali St. Tehran, 14188-36783, IranTel. 982166929055: e-mail, [email protected] December 31, 2013 / Last Revision April 23, 2014 / Accepted April 29, 2014
© 2014 The Korean Academy of ProsthodonticsThis is an Open Access article distributed under the terms of the Creative Commons Attribution Non-Commercial License (http://creativecommons.org/licenses/by-nc/3.0) which permits unrestricted non-commercial use, distribution, and reproduction in any medium, provided the original work is properly cited.
This study was supported by Iran National Science Foundation (Project No. 88000358).
334
The degree of conversion (DC) is the proportion of single carbon-carbon bonds in a polymer matrix to double carbon bonds between monomers.7,8 It implies the conver-sion of monomer to polymer and is an index for the extent of polymerization (EP).8-10 It can be studied via methods such as differential scanning calorimetry,8 or differential Fourier transform infrared spectroscopy, which is the most sensitive method for estimating the DC.11 The studies indi-cate that clinical performance of dental composites is affected by DC.7-10,12 An inadequate degree of conversion might weaken bonding strengths, lower the physicomechan-ical properties, release toxic materials such as monomers and initiators,13-17 and cause permeability of bonded inter-faces.18 After polymerization, BA films might behave as permeable membranes,19 allowing water to flow from the dentin substrate to the top of the adhesive layer, which can negatively affect the longevity of the bonded restora-tion.20-23 Inappropriate polymerization might lead to unfa-vorable changes causing restoration detachment, caries for-mation, or discoloration around the adhesive, which are of clinical concern.24
DC can affect shear bond strength (SBS) and microleak-age. SBS is an essential in vitro property of composite res-ins, and ref lects the retent ion of the composites. Microleakage is the main cause of tooth sensitivity and sec-ondary caries,3,25 and might cause pulpitis, or reduce resto-ration longevity.25 After the introduction of bonding agents, minimizing the microleakage has been a serious goal.3
Bonding agents have been developed to be capable of initiating the polymerization of resin monomers and its continuation in order to act as a link between the hydro-philic tooth surfaces and the hydrophobic filled composite resins.13-17 Therefore, changes in their formula may affect their characteristics; and, studying their formula is important.
Therefore, we aimed to find a proper formulation for an experimental bonding agent, by first analyzing a commer-cial product, and then creating different experimental for-
mulas with similar and dissimilar formulations to the com-mercial BA, and finally assessing their DC, SBS, mode of failure, and microleakage.
MATERIALS AND METHODS
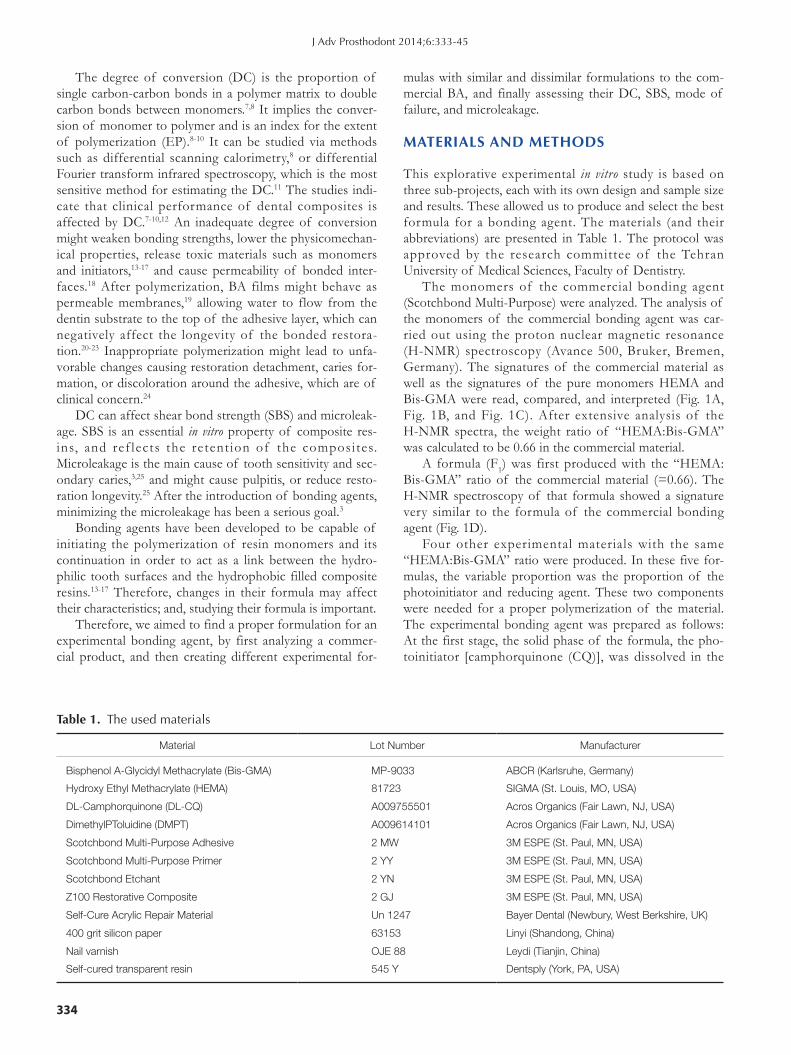
This explorative experimental in vitro study is based on three sub-projects, each with its own design and sample size and results. These allowed us to produce and select the best formula for a bonding agent. The materials (and their abbreviations) are presented in Table 1. The protocol was approved by the research committee of the Tehran University of Medical Sciences, Faculty of Dentistry.
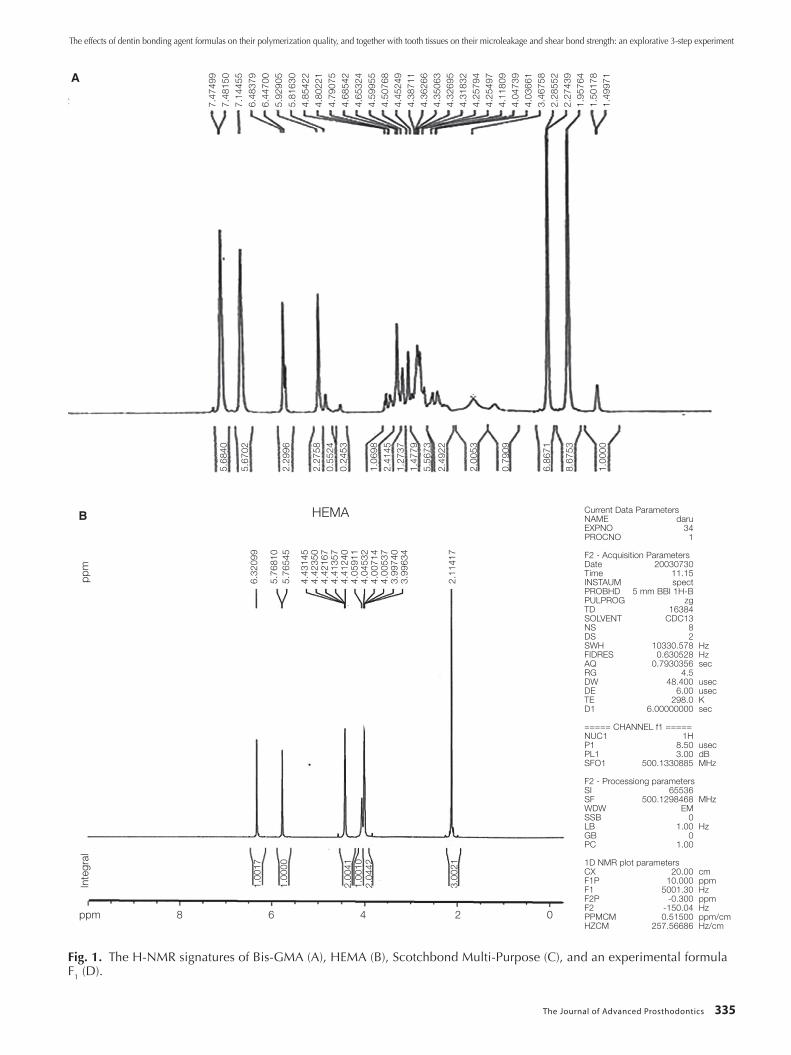
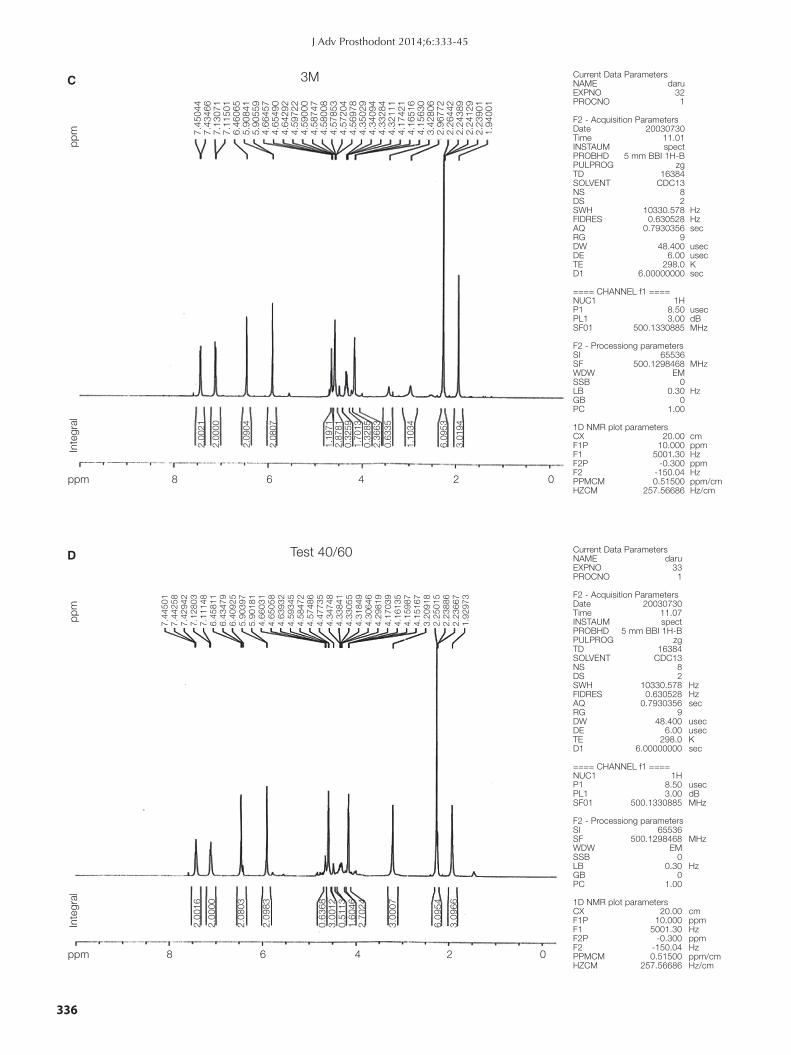
The monomers of the commercial bonding agent (Scotchbond Multi-Purpose) were analyzed. The analysis of the monomers of the commercial bonding agent was car-ried out using the proton nuclear magnetic resonance (H-NMR) spectroscopy (Avance 500, Bruker, Bremen, Germany). The signatures of the commercial material as well as the signatures of the pure monomers HEMA and Bis-GMA were read, compared, and interpreted (Fig. 1A, Fig. 1B, and Fig. 1C). After extensive analysis of the H-NMR spectra, the weight ratio of “HEMA:Bis-GMA” was calculated to be 0.66 in the commercial material.
A formula (F1) was first produced with the “HEMA: Bis-GMA” ratio of the commercial material (=0.66). The H-NMR spectroscopy of that formula showed a signature very similar to the formula of the commercial bonding agent (Fig. 1D).
Four other experimental materials with the same “HEMA:Bis-GMA” ratio were produced. In these five for-mulas, the variable proportion was the proportion of the photoinitiator and reducing agent. These two components were needed for a proper polymerization of the material. The experimental bonding agent was prepared as follows: At the first stage, the solid phase of the formula, the pho-toinitiator [camphorquinone (CQ)], was dissolved in the
Table 1. The used materials
Material Lot Number Manufacturer
Bisphenol A-Glycidyl Methacrylate (Bis-GMA) MP-9033 ABCR (Karlsruhe, Germany)
Hydroxy Ethyl Methacrylate (HEMA) 81723 SIGMA (St. Louis, MO, USA)
DL-Camphorquinone (DL-CQ) A009755501 Acros Organics (Fair Lawn, NJ, USA)
DimethylPToluidine (DMPT) A009614101 Acros Organics (Fair Lawn, NJ, USA)
Scotchbond Multi-Purpose Adhesive 2 MW 3M ESPE (St. Paul, MN, USA)
Scotchbond Multi-Purpose Primer 2 YY 3M ESPE (St. Paul, MN, USA)
Scotchbond Etchant 2 YN 3M ESPE (St. Paul, MN, USA)
Z100 Restorative Composite 2 GJ 3M ESPE (St. Paul, MN, USA)
Self-Cure Acrylic Repair Material Un 1247 Bayer Dental (Newbury, West Berkshire, UK)
400 grit silicon paper 63153 Linyi (Shandong, China)
Nail varnish OJE 88 Leydi (Tianjin, China)
Self-cured transparent resin 545 Y Dentsply (York, PA, USA)
J Adv Prosthodont 2014;6:333-45
The Journal of Advanced Prosthodontics 335
The effects of dentin bonding agent formulas on their polymerization quality, and together with tooth tissues on their microleakage and shear bond strength: an explorative 3-step experiment
Fig. 1. The H-NMR signatures of Bis-GMA (A), HEMA (B), Scotchbond Multi-Purpose (C), and an experimental formula F1 (D).
A
5.68
40
5.67
02
2.29
96
2.27
580.
5524
0.24
53
1.06
982.
4145
1.27
371.
4779
5.56
73
2.49
22
2.00
53
0.79
09
6.86
71
8.67
53
1.00
00
7.47
499
7.48
150
7.14
455
6.48
379
6.44
700
5.92
905
5.81
630
4.85
422
4.80
221
4.79
075
4.68
542
4.65
324
4.59
955
4.50
768
4.45
249
4.38
711
4.36
266
4.35
063
4.32
695
4.31
832
4.25
794
4.25
497
4.11
809
4.04
739
4.03
661
3.46
758
2.28
552
2.27
439
1.95
764
1.50
178
1.49
971
B HEMA Current Data ParametersNAME daruEXPNO 34PROCNO 1
F2 - Acquisition ParametersDate 20030730Time 11.15INSTAUM spectPROBHD 5 mm BBI 1H-BPULPROG zgTD 16384SOLVENT CDC13NS 8DS 2SWH 10330.578 HzFIDRES 0.630528 HzAQ 0.7930356 secRG 4.5DW 48.400 usecDE 6.00 usecTE 298.0 KD1 6.00000000 sec
===== CHANNEL f1 =====NUC1 1HP1 8.50 usecPL1 3.00 dBSFO1 500.1330885 MHz
F2 - Processiong parametersSI 65536SF 500.1298468 MHzWDW EMSSB 0LB 1.00 HzGB 0PC 1.00
1D NMR plot parametersCX 20.00 cmF1P 10.000 ppmF1 5001.30 HzF2P -0.300 ppmF2 -150.04 HzPPMCM 0.51500 ppm/cmHZCM 257.56686 Hz/cm
ppm 8 6 4 2 0
Inte
gral
1.00
17
1.00
00
2.00
411.
0010
2.04
42
3.00
21
6.32
099
5.76
810
5.76
545
4.43
145
4.42
350
4.42
167
4.41
357
4.41
240
4.05
911
4.04
532
4.00
714
4.00
537
3.99
740
3.99
634
2.11
417
ppm
336
C 3M Current Data ParametersNAME daruEXPNO 32PROCNO 1
F2 - Acquisition ParametersDate 20030730Time 11.01INSTAUM spectPROBHD 5 mm BBI 1H-BPULPROG zgTD 16384SOLVENT CDC13NS 8DS 2SWH 10330.578 HzFIDRES 0.630528 HzAQ 0.7930356 secRG 9DW 48.400 usecDE 6.00 usecTE 298.0 KD1 6.00000000 sec
==== CHANNEL f1 ====NUC1 1HP1 8.50 usecPL1 3.00 dBSF01 500.1330885 MHz
F2 - Processiong parametersSI 65536SF 500.1298468 MHzWDW EMSSB 0LB 0.30 HzGB 0PC 1.00
1D NMR plot parametersCX 20.00 cmF1P 10.000 ppmF1 5001.30 HzF2P -0.300 ppmF2 -150.04 HzPPMCM 0.51500 ppm/cmHZCM 257.56686 Hz/cm
ppm 8 6 4 2 0
Inte
gral
2.00
21
2.00
00
2.09
04
2.08
07
1.19
712.
8781
0.32
591.
7013
0.32
852.
3663
0.63
35
1.10
34
6.09
53
3.01
94
7.45
044
7.43
466
7.13
071
7.11
501
6.46
065
5.90
841
5.90
559
4.66
457
4.65
490
4.64
292
4.59
722
4.59
000
4.58
747
4.58
008
4.57
853
4.57
204
4.56
978
4.35
029
4.34
094
4.33
284
4.32
111
4.17
421
4.16
516
4.15
630
3.42
806
2.96
772
2.26
442
2.24
389
2.24
129
2.23
901
1.94
001
ppm
D Test 40/60 Current Data ParametersNAME daruEXPNO 33PROCNO 1
F2 - Acquisition ParametersDate 20030730Time 11.07INSTAUM spectPROBHD 5 mm BBI 1H-BPULPROG zgTD 16384SOLVENT CDC13NS 8DS 2SWH 10330.578 HzFIDRES 0.630528 HzAQ 0.7930356 secRG 9DW 48.400 usecDE 6.00 usecTE 298.0 KD1 6.00000000 sec
==== CHANNEL f1 ====NUC1 1HP1 8.50 usecPL1 3.00 dBSF01 500.1330885 MHz
F2 - Processiong parametersSI 65536SF 500.1298468 MHzWDW EMSSB 0LB 0.30 HzGB 0PC 1.00
1D NMR plot parametersCX 20.00 cmF1P 10.000 ppmF1 5001.30 HzF2P -0.300 ppmF2 -150.04 HzPPMCM 0.51500 ppm/cmHZCM 257.56686 Hz/cm
ppm 8 6 4 2 0
Inte
gral
2.00
16
2.00
00
2.08
03
2.09
83
0.63
683.
0012
0.51
131.
6046
2.70
24
3.00
07
6.09
54
3.09
66
7.44
501
7.44
258
7.42
942
7.12
803
7.11
148
6.45
811
6.43
479
6.40
925
5.90
397
5.90
181
4.66
031
4.65
058
4.63
932
4.59
345
4.58
472
4.57
486
4.47
735
4.34
748
4.33
841
4.33
055
4.31
849
4.30
646
4.29
819
4.17
039
4.16
135
4.15
987
4.15
167
3.20
918
2.25
015
2.23
886
2.23
667
1.92
973
ppm
J Adv Prosthodont 2014;6:333-45
The Journal of Advanced Prosthodontics 337
HEMA monomer. After the complete dissolution of the powder, Bis-GMA was added to the solution and blended. Finally, the reducing agent [dimethyl-para-toluidine (DMPT)], which is a flowable liquid, was added to the final system.26 All the procedures were done in a dark room at environment temperature. The materials were stored in completely light- and air-sealed dark glass boxes. The mate-rials were blended with accurate weight ratios, measured using a digital weigh (Libror AEU-210, Lot Number: 97983, Shimadzu, Kyoto, Japan).
The “photoinitiator-to-reducing agent (PI:RA)” propor-tion plays an important role in proper polymerization of bonding agents.13 Therefore, five different proportions of photoinitiator (CQ) to reducing agent (DMPT) were pro-duced in order to find the optimum formula (Table 2).
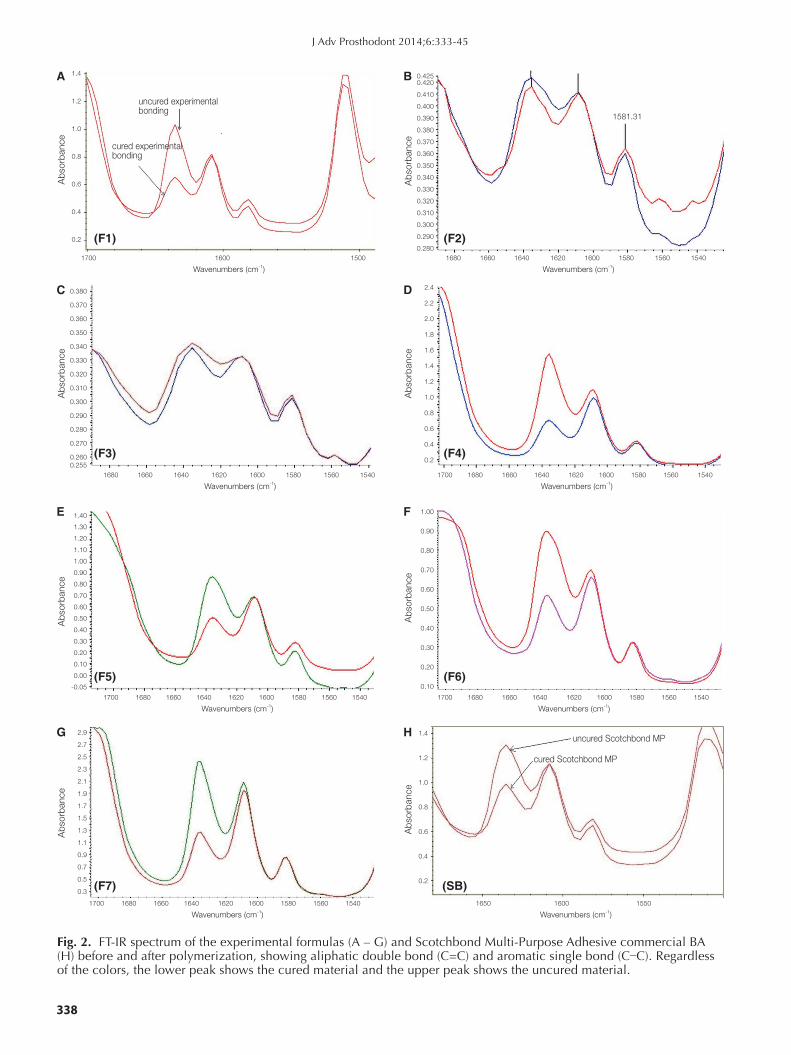
The materials’ degrees of conversion (DC) were assessed using the differential Fourier transform infrared spectros-copy (FT-IR) method. This was done by assessing their FT-IR spectra before and after light curing them, and com-paring their FT-IR signatures with that of the commercial BA (as the control).
Three different formulations with constant PI:RA for-mulas (based on the best formula [F1]) and variable “HEMA:Bis-GMA” ratios were created (2 new formulas as well as the F1 itself, Table 2).
In order to select the best proportion of “HEMA:Bis-GMA”, the three experimental formulas were studied in terms of their DC, shear bond strength (SBS) and their microleakage, while the commercial material acted as the control. The details of these two studies are as follow.
All the seven formulas and the commercial material (as the control) were assessed in terms of their DC. Three specimens were made of each material (n = 3 × 8 = 24). Using the Fourier transform infrared (FT-IR) spectroscopy (Magna-IR Spectrometer 750, Nicolet, Madison, WI, USA), the absorption rate of aliphatic double bond (C=C) that is the peak at 1635 cm-1 and the absorption rate of aromatic single bond (C–C) that is the peak at 1608 cm-1 in each sample was measured before and after light-curing (Fig. 2).
The DCs were recorded for further analyses. The F1 formula had a proper DC and a very low coefficient of variation (Table 3). Therefore, it was selected for further steps.
The sample size for the assessment of shear bond strength (SBS) of experimental versus commercial bonding agents was in accordance with the ISO TR 11405 standard: 120 specimens for the shear bond strength test (15 random-ly assigned specimens per group × [4 groups of dentin (3 experimental formulas and 1 commercial) + 4 groups of enamel (3 experimental formulas and 1 commercial)]). The
Table 2. Seven experimental formulas (all values are in percent of weight)
F1 F2 F3 F4 F5 F6 F7
Bis-GMA 0.62 0.62 0.62 0.62 0.62 0.50 0.30
HEMA 0.37 0.37 0.37 0.37 0.37 0.49 0.69
CQ 0.30 0.50 0.70 0.40 0.15 0.30 0.30
DMPT 0.70 0.50 0.30 0.60 0.85 0.70 0.70
In F1-F5, proportions of CQ and DMPT are variable, while other components are held constant. In F1, F6 and F7, proportions of HEMA and Bis-GMA are variable, while other components are held constant.
Table 3. The DC of 7 experimental BAs and one commercial BA. The raw data is as well presented in the same table (for 3 specimens per group)
F1 F2 F3 F4 F5 F6 F7 SB F1T2
Specimen 1 (%) 68.00 22.00 65.00 71.00 71.00 68.00 34.00 56.00 62.00
Specimen 2 (%) 67.00 35.00 57.00 75.00 72.00 70.00 35.00 67.00 75.00
Specimen 3 (%) 62.00 27.00 54.00 72.00 62.00 71.00 57.00 68.00 70.00
Mean (%) 65.67 28.00 58.67 72.67 68.33 69.67 42.00 63.67 69.00
SD (%) 3.21 6.56 5.69 2.08 5.51 1.53 13.00 6.66 6.56
CV (%) 4.90 23.42 9.69 2.86 8.06 2.19 30.95 10.46 9.50
P value* .822 .05 .275 .05 .275 .077 .127 – .275
SB, Scotchbond Multi-Purpose; F1T2, F1 after one year of storage; SD, standard deviation; CV, coefficient of variation.* P value is computed by comparing the DC of each group with the control.
The effects of dentin bonding agent formulas on their polymerization quality, and together with tooth tissues on their microleakage and shear bond strength: an explorative 3-step experiment
338
Fig. 2. FT-IR spectrum of the experimental formulas (A – G) and Scotchbond Multi-Purpose Adhesive commercial BA (H) before and after polymerization, showing aliphatic double bond (C=C) and aromatic single bond (C–C). Regardless of the colors, the lower peak shows the cured material and the upper peak shows the uncured material.
Abs
orba
nce
1.4
1.2
1.0
0.8
0.6
0.4
0.2
1650 1600 1550
Wavenumbers (cm-1)
uncured Scotchbond MP
cured Scotchbond MP
1700 1680 1660 1640 1620 1600 1580 1560 1540
Wavenumbers (cm-1)
Abs
orba
nce
2.4
2.2
2.0
1.8
1.6
1.4
1.2
1.0
0.8
0.6
0.4
0.2
1700 1680 1660 1640 1620 1600 1580 1560 1540
Wavenumbers (cm-1)
Abs
orba
nce
1.00
0.90
0.80
0.70
0.60
0.50
0.40
0.30
0.20
0.10
1680 1660 1640 1620 1600 1580 1560 1540
Wavenumbers (cm-1)
Abs
orba
nce
0.380
0.370
0.360
0.350
0.340
0.330
0.320
0.310
0.300
0.290
0.280
0.270
0.2600.255
1700 1680 1660 1640 1620 1600 1580 1560 1540
Wavenumbers (cm-1)
Abs
orba
nce
1.40
1.30
1.20
1.10
1.00
0.90
0.80
0.70
0.60
0.50
0.40
0.30
0.20
0.10
0.00
-0.05
1700 1680 1660 1640 1620 1600 1580 1560 1540
Wavenumbers (cm-1)
Abs
orba
nce
2.9
2.7
2.5
2.3
2.1
1.9
1.7
1.5
1.3
1.1
0.9
0.7
0.5
0.3
C D
E F
G H
Abs
orba
nce
1.4
1.2
1.0
0.8
0.6
0.4
0.2
1700 1600 1500
Wavenumbers (cm-1)
uncured experimental bonding
cured experimental bonding
A
(F1)
(F3)
(F5)
(F7)
1680 1660 1640 1620 1600 1580 1560 1540
Wavenumbers (cm-1)
Abs
orba
nce
0.4250.420
0.410
0.400
0.390
0.380
0.370
0.360
0.350
0.340
0.330
0.320
0.310
0.300
0.290
0.280
1581.31
B
(F2)
(F4)
(F6)
(SB)
J Adv Prosthodont 2014;6:333-45
The Journal of Advanced Prosthodontics 339
The effects of dentin bonding agent formulas on their polymerization quality, and together with tooth tissues on their microleakage and shear bond strength: an explorative 3-step experiment
specimens were made of 120 intact caries-free recently-extracted human third molars (extracted for treatment pur-poses only). The teeth had been rinsed and cleaned off of blood and remaining periodontal tissues and calculi. They had been disinfected using the bactericidal/bacteriostatic solution of 0.5% chloramine for 1 week. Then they were stored in distilled water at 4ºC, until being used for the experiments.27
The teeth were sectioned to obtain enamel and dentin disks. Enamel disks were obtained by sectioning through the buccal surface of the teeth. Dentin disks were picked from the tissue farthest from the pulp. These dentin disks were cut from an about 1-mm distance of dentinoenamel junction (DEJ). This was because the dentin layer close to the pulp was not as proper for bonding purposes.27 Each disk had a thickness of 1 mm.
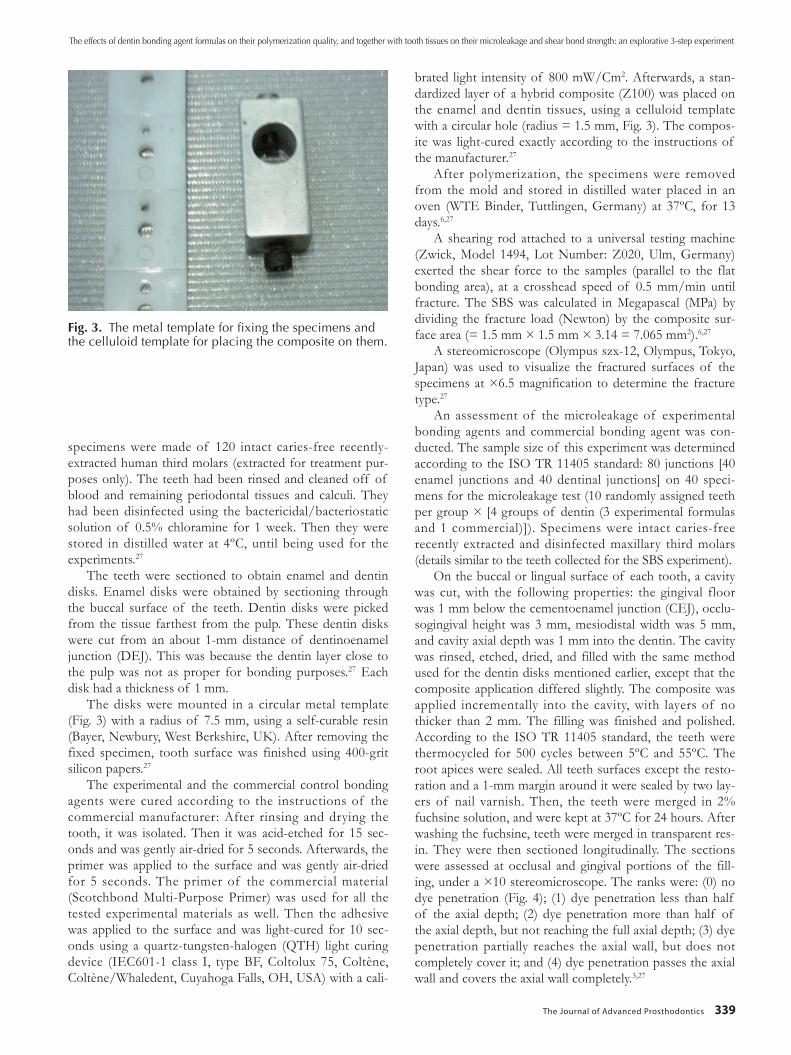
The disks were mounted in a circular metal template (Fig. 3) with a radius of 7.5 mm, using a self-curable resin (Bayer, Newbury, West Berkshire, UK). After removing the fixed specimen, tooth surface was finished using 400-grit silicon papers.27
The experimental and the commercial control bonding agents were cured according to the instructions of the commercial manufacturer: After rinsing and drying the tooth, it was isolated. Then it was acid-etched for 15 sec-onds and was gently air-dried for 5 seconds. Afterwards, the primer was applied to the surface and was gently air-dried for 5 seconds. The primer of the commercial material (Scotchbond Multi-Purpose Primer) was used for all the tested experimental materials as well. Then the adhesive was applied to the surface and was light-cured for 10 sec-onds using a quartz-tungsten-halogen (QTH) light curing device (IEC601-1 class I, type BF, Coltolux 75, Coltène, Coltène/Whaledent, Cuyahoga Falls, OH, USA) with a cali-
brated light intensity of 800 mW/Cm2. Afterwards, a stan-dardized layer of a hybrid composite (Z100) was placed on the enamel and dentin tissues, using a celluloid template with a circular hole (radius = 1.5 mm, Fig. 3). The compos-ite was light-cured exactly according to the instructions of the manufacturer.27
After polymerization, the specimens were removed from the mold and stored in distilled water placed in an oven (WTE Binder, Tuttlingen, Germany) at 37ºC, for 13 days.6,27
A shearing rod attached to a universal testing machine (Zwick, Model 1494, Lot Number: Z020, Ulm, Germany) exerted the shear force to the samples (parallel to the flat bonding area), at a crosshead speed of 0.5 mm/min until fracture. The SBS was calculated in Megapascal (MPa) by dividing the fracture load (Newton) by the composite sur-face area (= 1.5 mm × 1.5 mm × 3.14 = 7.065 mm2).6,27
A stereomicroscope (Olympus szx-12, Olympus, Tokyo, Japan) was used to visualize the fractured surfaces of the specimens at ×6.5 magnification to determine the fracture type.27
An assessment of the microleakage of experimental bonding agents and commercial bonding agent was con-ducted. The sample size of this experiment was determined according to the ISO TR 11405 standard: 80 junctions [40 enamel junctions and 40 dentinal junctions] on 40 speci-mens for the microleakage test (10 randomly assigned teeth per group × [4 groups of dentin (3 experimental formulas and 1 commercial)]). Specimens were intact caries-free recently extracted and disinfected maxillary third molars (details similar to the teeth collected for the SBS experiment).
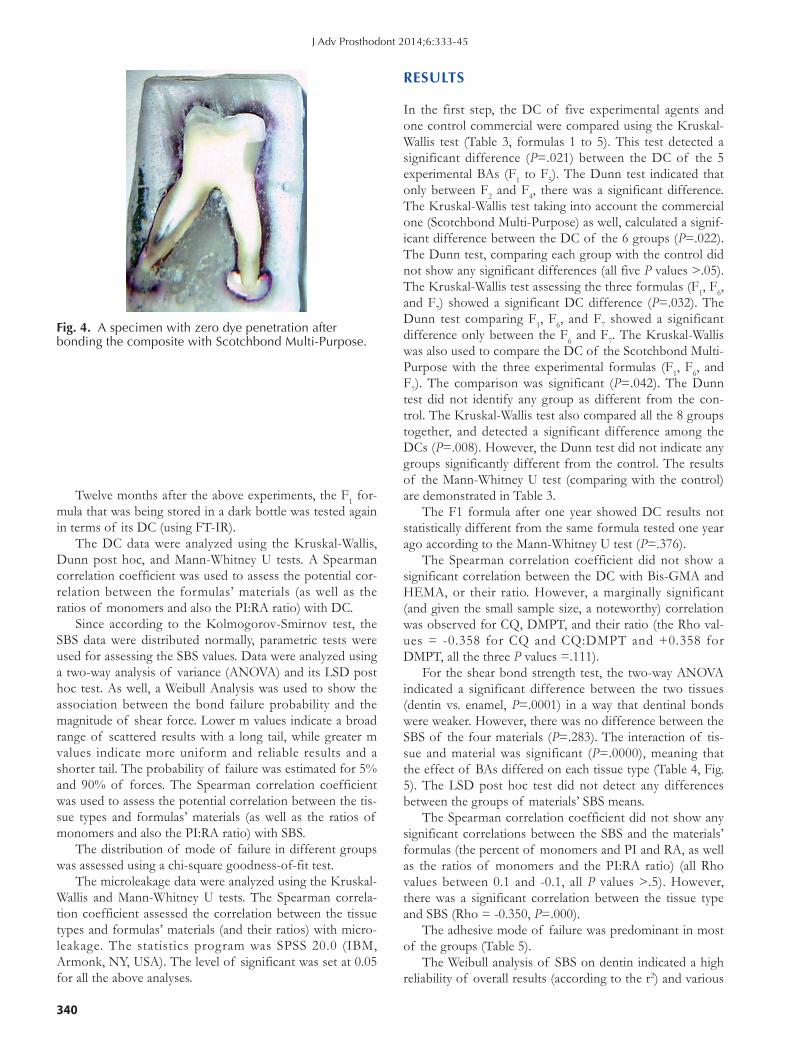
On the buccal or lingual surface of each tooth, a cavity was cut, with the following properties: the gingival floor was 1 mm below the cementoenamel junction (CEJ), occlu-sogingival height was 3 mm, mesiodistal width was 5 mm, and cavity axial depth was 1 mm into the dentin. The cavity was rinsed, etched, dried, and filled with the same method used for the dentin disks mentioned earlier, except that the composite application differed slightly. The composite was applied incrementally into the cavity, with layers of no thicker than 2 mm. The filling was finished and polished. According to the ISO TR 11405 standard, the teeth were thermocycled for 500 cycles between 5ºC and 55ºC. The root apices were sealed. All teeth surfaces except the resto-ration and a 1-mm margin around it were sealed by two lay-ers of nail varnish. Then, the teeth were merged in 2% fuchsine solution, and were kept at 37ºC for 24 hours. After washing the fuchsine, teeth were merged in transparent res-in. They were then sectioned longitudinally. The sections were assessed at occlusal and gingival portions of the fill-ing, under a ×10 stereomicroscope. The ranks were: (0) no dye penetration (Fig. 4); (1) dye penetration less than half of the axial depth; (2) dye penetration more than half of the axial depth, but not reaching the full axial depth; (3) dye penetration partially reaches the axial wall, but does not completely cover it; and (4) dye penetration passes the axial wall and covers the axial wall completely.3,27
Fig. 3. The metal template for fixing the specimens and the celluloid template for placing the composite on them.
340
Twelve months after the above experiments, the F1 for-mula that was being stored in a dark bottle was tested again in terms of its DC (using FT-IR).
The DC data were analyzed using the Kruskal-Wallis, Dunn post hoc, and Mann-Whitney U tests. A Spearman correlation coefficient was used to assess the potential cor-relation between the formulas’ materials (as well as the ratios of monomers and also the PI:RA ratio) with DC.
Since according to the Kolmogorov-Smirnov test, the SBS data were distributed normally, parametric tests were used for assessing the SBS values. Data were analyzed using a two-way analysis of variance (ANOVA) and its LSD post hoc test. As well, a Weibull Analysis was used to show the association between the bond failure probability and the magnitude of shear force. Lower m values indicate a broad range of scattered results with a long tail, while greater m values indicate more uniform and reliable results and a shorter tail. The probability of failure was estimated for 5% and 90% of forces. The Spearman correlation coefficient was used to assess the potential correlation between the tis-sue types and formulas’ materials (as well as the ratios of monomers and also the PI:RA ratio) with SBS.
The distribution of mode of failure in different groups was assessed using a chi-square goodness-of-fit test.
The microleakage data were analyzed using the Kruskal-Wallis and Mann-Whitney U tests. The Spearman correla-tion coefficient assessed the correlation between the tissue types and formulas’ materials (and their ratios) with micro-leakage. The statistics program was SPSS 20.0 (IBM, Armonk, NY, USA). The level of significant was set at 0.05 for all the above analyses.
RESULTS
In the first step, the DC of five experimental agents and one control commercial were compared using the Kruskal-Wallis test (Table 3, formulas 1 to 5). This test detected a significant difference (P=.021) between the DC of the 5 experimental BAs (F1 to F5). The Dunn test indicated that only between F2 and F4, there was a significant difference. The Kruskal-Wallis test taking into account the commercial one (Scotchbond Multi-Purpose) as well, calculated a signif-icant difference between the DC of the 6 groups (P=.022). The Dunn test, comparing each group with the control did not show any significant differences (all five P values >.05). The Kruskal-Wallis test assessing the three formulas (F1, F6, and F7) showed a significant DC difference (P=.032). The Dunn test comparing F1, F6, and F7 showed a significant difference only between the F6 and F7. The Kruskal-Wallis was also used to compare the DC of the Scotchbond Multi-Purpose with the three experimental formulas (F1, F6, and F7). The comparison was significant (P=.042). The Dunn test did not identify any group as different from the con-trol. The Kruskal-Wallis test also compared all the 8 groups together, and detected a significant difference among the DCs (P=.008). However, the Dunn test did not indicate any groups significantly different from the control. The results of the Mann-Whitney U test (comparing with the control) are demonstrated in Table 3.
The F1 formula after one year showed DC results not statistically different from the same formula tested one year ago according to the Mann-Whitney U test (P=.376).
The Spearman correlation coefficient did not show a significant correlation between the DC with Bis-GMA and HEMA, or their ratio. However, a marginally significant (and given the small sample size, a noteworthy) correlation was observed for CQ, DMPT, and their ratio (the Rho val-ues = -0.358 for CQ and CQ:DMPT and +0.358 for DMPT, all the three P values =.111).
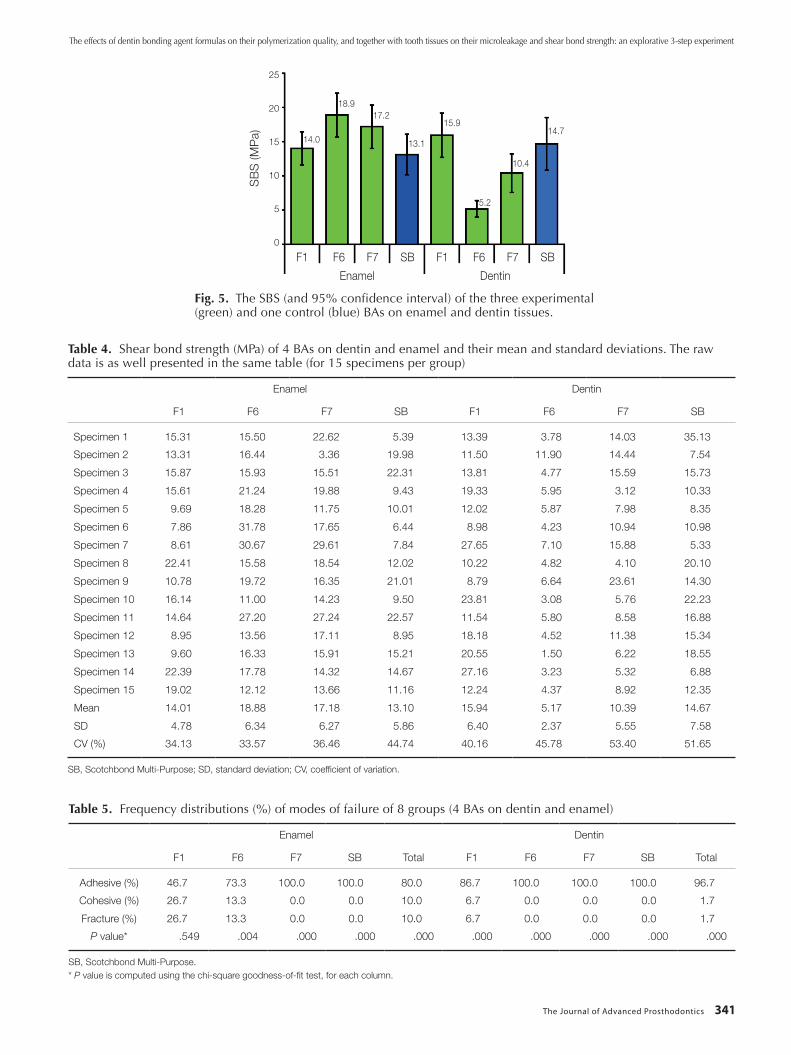
For the shear bond strength test, the two-way ANOVA indicated a significant difference between the two tissues (dentin vs. enamel, P=.0001) in a way that dentinal bonds were weaker. However, there was no difference between the SBS of the four materials (P=.283). The interaction of tis-sue and material was significant (P=.0000), meaning that the effect of BAs differed on each tissue type (Table 4, Fig. 5). The LSD post hoc test did not detect any differences between the groups of materials’ SBS means.
The Spearman correlation coefficient did not show any significant correlations between the SBS and the materials’ formulas (the percent of monomers and PI and RA, as well as the ratios of monomers and the PI:RA ratio) (all Rho values between 0.1 and -0.1, all P values >.5). However, there was a significant correlation between the tissue type and SBS (Rho = -0.350, P=.000).
The adhesive mode of failure was predominant in most of the groups (Table 5).
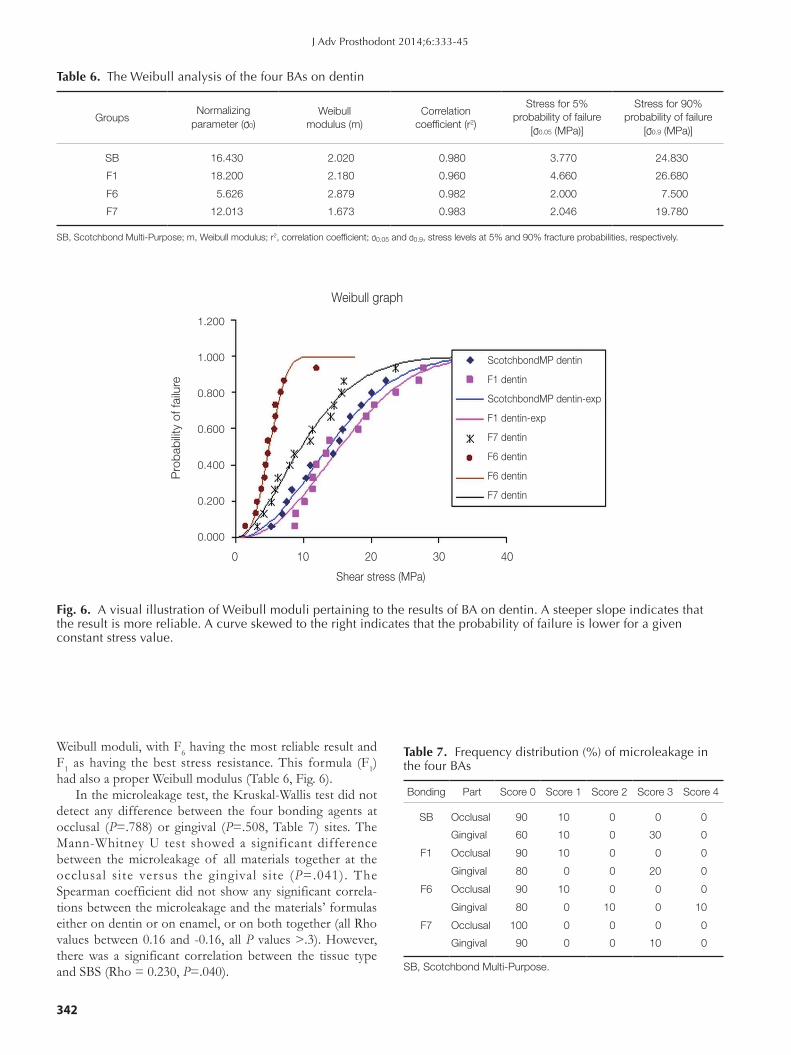
The Weibull analysis of SBS on dentin indicated a high reliability of overall results (according to the r2) and various
J Adv Prosthodont 2014;6:333-45
Fig. 4. A specimen with zero dye penetration after bonding the composite with Scotchbond Multi-Purpose.
The Journal of Advanced Prosthodontics 341
The effects of dentin bonding agent formulas on their polymerization quality, and together with tooth tissues on their microleakage and shear bond strength: an explorative 3-step experiment
Fig. 5. The SBS (and 95% confidence interval) of the three experimental (green) and one control (blue) BAs on enamel and dentin tissues.
SB
S (M
Pa)
25
20
15
10
5
0
F1 F6 F7 SB F1 F6 F7 SB
Enamel Dentin
14.0
18.917.2
13.1
15.9
5.2
10.4
14.7
Table 4. Shear bond strength (MPa) of 4 BAs on dentin and enamel and their mean and standard deviations. The raw data is as well presented in the same table (for 15 specimens per group)
Enamel Dentin
F1 F6 F7 SB F1 F6 F7 SB
Specimen 1 15.31 15.50 22.62 5.39 13.39 3.78 14.03 35.13
Specimen 2 13.31 16.44 3.36 19.98 11.50 11.90 14.44 7.54
Specimen 3 15.87 15.93 15.51 22.31 13.81 4.77 15.59 15.73
Specimen 4 15.61 21.24 19.88 9.43 19.33 5.95 3.12 10.33
Specimen 5 9.69 18.28 11.75 10.01 12.02 5.87 7.98 8.35
Specimen 6 7.86 31.78 17.65 6.44 8.98 4.23 10.94 10.98
Specimen 7 8.61 30.67 29.61 7.84 27.65 7.10 15.88 5.33
Specimen 8 22.41 15.58 18.54 12.02 10.22 4.82 4.10 20.10
Specimen 9 10.78 19.72 16.35 21.01 8.79 6.64 23.61 14.30
Specimen 10 16.14 11.00 14.23 9.50 23.81 3.08 5.76 22.23
Specimen 11 14.64 27.20 27.24 22.57 11.54 5.80 8.58 16.88
Specimen 12 8.95 13.56 17.11 8.95 18.18 4.52 11.38 15.34
Specimen 13 9.60 16.33 15.91 15.21 20.55 1.50 6.22 18.55
Specimen 14 22.39 17.78 14.32 14.67 27.16 3.23 5.32 6.88
Specimen 15 19.02 12.12 13.66 11.16 12.24 4.37 8.92 12.35
Mean 14.01 18.88 17.18 13.10 15.94 5.17 10.39 14.67
SD 4.78 6.34 6.27 5.86 6.40 2.37 5.55 7.58
CV (%) 34.13 33.57 36.46 44.74 40.16 45.78 53.40 51.65
SB, Scotchbond Multi-Purpose; SD, standard deviation; CV, coefficient of variation.
Table 5. Frequency distributions (%) of modes of failure of 8 groups (4 BAs on dentin and enamel)
Enamel Dentin
F1 F6 F7 SB Total F1 F6 F7 SB Total
Adhesive (%) 46.7 73.3 100.0 100.0 80.0 86.7 100.0 100.0 100.0 96.7
Cohesive (%) 26.7 13.3 0.0 0.0 10.0 6.7 0.0 0.0 0.0 1.7
Fracture (%) 26.7 13.3 0.0 0.0 10.0 6.7 0.0 0.0 0.0 1.7
P value* .549 .004 .000 .000 .000 .000 .000 .000 .000 .000
SB, Scotchbond Multi-Purpose.* P value is computed using the chi-square goodness-of-fit test, for each column.
342
Table 7. Frequency distribution (%) of microleakage in the four BAs
Bonding Part Score 0 Score 1 Score 2 Score 3 Score 4
SB Occlusal 90 10 0 0 0
Gingival 60 10 0 30 0
F1 Occlusal 90 10 0 0 0
Gingival 80 0 0 20 0
F6 Occlusal 90 10 0 0 0
Gingival 80 0 10 0 10
F7 Occlusal 100 0 0 0 0
Gingival 90 0 0 10 0
SB, Scotchbond Multi-Purpose.
Table 6. The Weibull analysis of the four BAs on dentin
GroupsNormalizing
parameter (σ0)Weibull
modulus (m)Correlation
coefficient (r2)
Stress for 5% probability of failure
[σ0.05 (MPa)]
Stress for 90% probability of failure
[σ0.9 (MPa)]
SB 16.430 2.020 0.980 3.770 24.830
F1 18.200 2.180 0.960 4.660 26.680
F6 5.626 2.879 0.982 2.000 7.500
F7 12.013 1.673 0.983 2.046 19.780
SB, Scotchbond Multi-Purpose; m, Weibull modulus; r2, correlation coefficient; σ0.05 and σ0.9, stress levels at 5% and 90% fracture probabilities, respectively.
Fig. 6. A visual illustration of Weibull moduli pertaining to the results of BA on dentin. A steeper slope indicates that the result is more reliable. A curve skewed to the right indicates that the probability of failure is lower for a given constant stress value.
Pro
babi
lity
of fa
ilure
1.200
1.000
0.800
0.600
0.400
0.200
0.000
0 10 20 30 40
Shear stress (MPa)
Weibull graph
ScotchbondMP dentin
F1 dentin
ScotchbondMP dentin-exp
F1 dentin-exp
F7 dentin
F6 dentin
F6 dentin
F7 dentin
Weibull moduli, with F6 having the most reliable result and F1 as having the best stress resistance. This formula (F1) had also a proper Weibull modulus (Table 6, Fig. 6).
In the microleakage test, the Kruskal-Wallis test did not detect any difference between the four bonding agents at occlusal (P=.788) or gingival (P=.508, Table 7) sites. The Mann-Whitney U test showed a significant difference between the microleakage of all materials together at the occlusal site versus the gingival site (P=.041). The Spearman coefficient did not show any significant correla-tions between the microleakage and the materials’ formulas either on dentin or on enamel, or on both together (all Rho values between 0.16 and -0.16, all P values >.3). However, there was a significant correlation between the tissue type and SBS (Rho = 0.230, P=.040).
J Adv Prosthodont 2014;6:333-45
The Journal of Advanced Prosthodontics 343
The effects of dentin bonding agent formulas on their polymerization quality, and together with tooth tissues on their microleakage and shear bond strength: an explorative 3-step experiment
DISCUSSION
The results of this study indicated that the first experimen-tal formula (62% Bis-GMA, 37% HEMA, 0.3% CQ, and 0.7% DMPT) which resembled the commercial material had an optimum characteristic. Other formulas might have better degrees of conversion or shear bond strengths on enamel, but their SBS was less on dentin. The F1 formula as well showed a proper microleakage and also showed a proper lack of autopolymerization during room storage, since its DC had not reduced after one year.
One of the most important determinants of a proper DC is the amount of photoinitiator, which is usually CQ at amounts between 0.17% to 1.03 weight percent.28 The DC might range between 55% and 75% because dimethacrylate monomers might exhibit considerable residual unsatura-tion.13-17 Reducing agent is added to the system to boost the effect of photoinitiator, and can improve the DC consider-ably.29 Most of the experimental formulas in this study revealed proper DC rates, except F2 and F7 with PI:RA ratios of 1.0 and 3:7, respectively. The latter was the ratio available in F1 as well; however, in F1, a proper DC (66%) was observed. This difference implied that not only the PI:IR ratio plays a role in DC, but also the ratio of HEMA:Bis-GMA is important to DC. Nevertheless, the statistical analyses implied that if something matters, it is not the monomers, but CQ, DMPT, and their ratio, in a way that more DMPT and less CQ could cause a higher degree of conversion; although this needs larger samples. Low CQ values have other advantages as well. The amount of CQ should be kept at the lowest possible to prevent dis-coloration.28 Excess photoinitiator amounts might also dis-rupt shelf life and also might reduce the biocompatibility.30 Another factor to determine the proper CQ amount is the coefficients of variations of the DCs of the materials. F1 and F4 had the lowest (and best) CVs. Since F1 had a less DC amount, it might favor its clinical usage.
The limitation of this part of the study was the rather small sample size. However, given the extensive total size of the study and the limited budget, it was not possible at the moment to conduct more FT-IR experiments. Besides, this method is very accurate and is not usually done in a large number of repeats.
F6 showed a very high enamel SBS. However, it had the lowest dentinal bond strength, which is always a more important determinant for selecting BAs. This is because enamel bond is already stronger and more predictable than dentinal bond strength, being reported as usually about 15 to 30 MPa.6,31,32 Thus it is much simpler to obtain that den-tinal bond, especially with its heterogeneous structure, the flow of tubular fluid, having more organic content, and being covered by a smear layer.3,33,34 Therefore, the bond strength of composite resin to dentin may be weaker.3,34,35 Therefore, F1 seemed the most appropriate material in terms of SBS. This was confirmed by the Weibull analysis. The Weibull probability of failure might be a proper substi-tute for analyzing SBS data and may be useful in selecting
less technique sensitive materials or methods.6,36 In this study, the lowest probability of failure was obtained in F1. However, the bond strengths of all experimental groups fell within the acceptable range.6 F1 had the highest Weibull modulus (m) after F6. A higher “m” means a proper reli-ability of the results. Besides, F1 had the highest value of normalizing parameter, which meant a less probability of failure for a given stress.
This section of the study could be as well benefited by thermocycling which might negatively affect the SBS.5,37 However, water storage was used as the aging protocol. Besides, a very large sample of human teeth could improve the reliability and generalizability. Human enamel contains less lattice defects and smaller crystal grains than bovine teeth, which might affect the findings related to SBS.5,38 Therefore, using a large sample of human teeth might be advantageous.5
Failure modes indicate that materials with high bond strengths show cohesive failure through the composite. However, materials with low shear bond strength might show adhesive failure rather than cohesive failure. Fractures within the composite resin (cohesive failure) seem to be more appropriate for bearing occlusal loads.6,39 All the cases except F1 bonded to the dentin showed significant predomi-nance of adhesive failure. It cannot be certainly determined using a light microscope whether failure was truly adhesive.6
Microleakage test is an important in vitro test of dentin bonding agents.29 All the materials acted well on this test. No significant difference was observed in the microleakage of all the four formulas (Scotchbond Multi-Purpose, F1, F6, and F7) either at the dentin junction (the gingival site) or the enamel junction (the occlusal site). This might be related to the similar primer of all the formulas, and was consistent with the results of another study comparing BAs from fourth and fifth generations.40 However, there was a differ-ence between the microleakage extents at the enamel versus dentin junctions. Due to the high mineral content of the enamel as well as its crystal structure, enamel etching may efficiently alter its surface profile by increasing the depth and number of micropores which leads to stronger adhe-sive tags and reduced gap size.3,41,42 However, at dentinal margins, the bonded composite had poorer results. Due to its organic matrix and having a lower fraction of mineral-ized content, dentin is naturally wet which this may inter-fere with bonding to a hydrophobic material.3,33,34
This part of the study was limited by some factors. Fuchsine solution varies in viscosity and other characteris-tics from saliva.3 However, the authors tried to increase the validity and reliability of the results by sampling several human teeth and aging them.3 Besides using many human teeth was an improvement over some recent studies that had used a smaller sample of bovine teeth.43
CONCLUSION
Considering its proper degree of conversion, its proper microleakage, and its proper shear bond strength and
344
modes of failure on both enamel and dentin, The F1 for-mula with 62% Bis-GMA, 37% HEMA, 0.3% CQ, and 0.7% DMPT seems a proper formula for mass production of bonding agents. Also, the percentages can be even more fine-tuned with creating slightly different formulas and test-ing them again. Additionally, more experiments such as evaluating its performance under different temperatures and using different light curing units are warranted. The microleakage was higher at the dentinal junction compared to the enamel junction. The shear strength of bonds to the enamel was greater compared to dentin. No correlations were observed between the SBS or microleakage with Bis-GMA, HEMA, CQ, or DMPT. However, the degree of conversion might benefit from a less amount of CQ and a higher amount of DMPT, although this pilot implication was not statistically confirmed and needs studies with a larger sample size and with a greater range of changes in CQ/DMPT values for confirmation.
REFERENCES
1. Peumans M, Van Meerbeek B, Lambrechts P, Vanherle G. Porcelain veneers: a review of the literature. J Dent 2000;28: 163-77.
2. Magne P, Douglas WH. Cumulative effects of successive re-storative procedures on anterior crown flexure: intact versus veneered incisors. Quintessence Int 2000;31:5-18.
3. Shafiei L, Mojiri P, Ghahraman Y, Rakhshan V. Microleakage of a self-adhesive class v composite on primary and perma-nent dentitions. J Contemp Dent Pract 2013;14:461-7.
4. Khosravanifard B, Nemati-Anaraki S, Faraghat S, Sajjadi SH, Rakhshan H, Rakhshan V. Efficacy of 4 surface treatments in increasing the shear bond strength of orthodontic brackets bonded to saliva-contaminated direct composites. Orthod Wave 2011;70:65-70.
5. Khosravanifard B, Rakhshan V, Saadatmand A. Effects of blood and saliva contamination on shear bond strength of metal orthodontic brackets and evaluating certain methods for reversing the effect of contamination. Orthod Wave 2010;69:156-63.
6. Jafarzadeh Kashi TS, Erfan M, Rakhshan V, Aghabaigi N, Tabatabaei FS. An in vitro assessment of the effects of three surface treatments on repair bond strength of aged compos-ites. Oper Dent 2011;36:608-17.
7. Prasanna N, Pallavi Reddy Y, Kavitha S, Lakshmi Narayanan L. Degree of conversion and residual stress of preheated and room-temperature composites. Indian J Dent Res 2007;18: 173-6.
8. Jafarzadeh-Kashi TS, Mirzai i M, Erfan M, Fazel A, Eskandarion S, Rakhshan V. Polymerization behavior and thermal characteristics of two new composites at five tem-peratures: refrigeration to preheating. J Adv Prosthodont 2011;3:216-20.
9. Cotti E, Scungio P, Dettori C, Ennas G. Comparison of the Degree of Conversion of Resin Based Endodontic Sealers Using the DSC Technique. Eur J Dent 2011;5:131-8.
10. Antonucci JM, Toth EE. Extent of polymerization of dental
resins by differential scanning calorimetry. J Dent Res 1983; 62:121-5.
11. Braem M, Davidson CL, VanHerle G, Van Doren V, Lambrechts P. The relationship between test methodology and elastic behavior of composites. J Dent Res 1987;66:1036-9.
12. Daronch M, Rueggeberg FA, De Goes MF. Monomer con-version of pre-heated composite. J Dent Res 2005;84:663-7.
13. Craig RG, Powers JM, Sakaguchi RL. Craig’s restorative den-tal materials. 12th ed. St. Louis, Mo.: Mosby Elsevier, 2006.
14. Anusavice KJ, Phillips RW. Phillips’ science of dental materi-als. 11th ed. St. Louis, Mo.: Saunders, 2003.
15. O’Br ien WJ. Denta l mater i a l s and the i r se l ec t ion . Chicago[etc.]: Quintessence Publishing Co., 2008.
16. van Noort R. Introduction to dental materials. 3rd ed. Edinburgh; New York: Mosby/Elsevier, 2007.
17. Roberson TM, Heymann H, Swift, EJ, Sturdevant CM. Sturdevant’s art and science of operative dentistry. St. Louis, Mo: Mosby, 2006.
18. Cadenaro M, Antoniolli F, Sauro S, Tay FR, Di Lenarda R, Prati C, Biasotto M, Contardo L, Breschi L. Degree of con-version and permeability of dental adhesives. Eur J Oral Sci 2005;113:525-30.
19. Tay FR, Pashley DH, Suh BI, Carvalho RM, Itthagarun A. Single-step adhesives are permeable membranes. J Dent 2002;30:371-82.
20. De Munck J, Van Meerbeek B, Yoshida Y, Inoue S, Vargas M, Suzuki K, Lambrechts P, Vanherle G. Four-year water degra-dation of total-etch adhesives bonded to dentin. J Dent Res 2003;82:136-40.
21. Hashimoto M, Ohno H, Sano H, Tay FR, Kaga M, Kudou Y, Oguchi H, Araki Y, Kubota M. Micromorphological changes in resin-dentin bonds after 1 year of water storage. J Biomed Mater Res 2002;63:306-11.
22. De Munck J, Van Landuyt K, Peumans M, Poitevin A, Lambrechts P, Braem M, Van Meerbeek B. A critical review of the durability of adhesion to tooth tissue: methods and results. J Dent Res 2005;84:118-32.
23. Breschi L, Cadenaro M, Antoniolli F, Sauro S, Biasotto M, Prati C, Tay FR, Di Lenarda R. Polymerization kinetics of dental adhesives cured with LED: correlation between extent of conversion and permeability. Dent Mater 2007;23:1066-72.
24. Usümez S, Büyükyilmaz T, Karaman AI, Gündüz B. Degree of conversion of two lingual retainer adhesives cured with different light sources. Eur J Orthod 2005;27:173-9.
25. McDonald RE, Avery DR, Dean JA. McDonald and Avery’s dentistry for the child and adolescent. Maryland Heights, Mo: Mosby/Elsevier. 2011. p. 297-9.
26. Yoshida K, Greener EH. Effect of photoinitiator on degree of conversion of unfilled light-cured resin. J Dent 1994;22: 296-9.
27. Kashi TJ, Erfan M, Niasar AN. Comparison of shear bond strength and microleakage of Scotchbond multi-purpose (MP) adhesive system and an experimental Dentin Bonding agent based on standard of ISO TR 11405. J Dent Med 2009;22:69-77.
28. Taira M, Urabe H, Hirose T, Wakasa K, Yamaki M. Analysis
J Adv Prosthodont 2014;6:333-45
The Journal of Advanced Prosthodontics 345
The effects of dentin bonding agent formulas on their polymerization quality, and together with tooth tissues on their microleakage and shear bond strength: an explorative 3-step experiment
of photo-initiators in visible-light-cured dental composite resins. J Dent Res 1988;67:24-8.
29. Barkmeier WW, Cooley RL. Shear bond strength, microleak-age and SEM study of the XR Bond adhesive system. Am J Dent 1989;2:111-5.
30. Fujisawa S, Kadoma Y, Masuhara E. Effects of photoinitia-tors for the visible-light resin system on hemolysis of dog erythrocytes and lipid peroxidation of their components. J Dent Res 1986;65:1186-90.
31. Turner CW, Meiers JC. Repair of an aged, contaminated indi-rect composite resin with a direct, visible-light-cured com-posite resin. Oper Dent 1993;18:187-94.
32. Gilpatrick RO, Ross JA, Simonsen RJ. Resin-to-enamel bond strengths with various etching times. Quintessence Int 1991; 22:47-9.
33. Cenci MS, Pereira-Cenci T, Donassollo TA, Sommer L, Strapasson A, Demarco FF. Influence of thermal stress on marginal integrity of restorative materials. J Appl Oral Sci 2008;16:106-10.
34. Silveira de Araújo C, Incerti da Silva T, Ogliari FA, Meireles SS, Piva E, Demarco FF. Microleakage of seven adhesive sys-tems in enamel and dentin. J Contemp Dent Pract 2006;7:26-33.
35. Roberson TM, Heymann H, Swift EJ, Sturdevant CM. Sturdevant’s art and science of operative dentistry. St. Louis, Mo: Mosby. 2006. p. 381-95.
36. Burrow MF, Thomas D, Swain MV, Tyas MJ. Analysis of ten-sile bond strengths using Weibull statistics. Biomaterials 2004;25:5031-5.
37. Diaz-Arnold AM, Aquilino SA. An evaluation of the bond strengths of four organosilane materials in response to ther-mal stress. J Prosthet Dent 1989;62:257-60.
38. Keçik D, Cehreli SB, Sar C, Unver B. Effect of acidulated phosphate fluoride and casein phosphopeptide-amorphous calcium phosphate application on shear bond strength of orthodontic brackets. Angle Orthod 2008;78:129-33.
39. Bouschlicher MR, Reinhardt JW, Vargas MA. Surface treat-ment techniques for resin composite repair. Am J Dent 1997; 10:279-83.
40. Pilo R, Ben-Amar A. Comparison of microleakage for three one-bottle and three multiple-step dentin bonding agents. J Prosthet Dent 1999;82:209-13.
41. Kim MJ, Lim BS, Chang WG, Lee YK, Rhee SH, Yang HC. Phosphoric acid incorporated with acidulated phosphate flu-oride gel etchant effects on bracket bonding. Angle Orthod 2005;75:678-84.
42. Fracasso MDLC, Rios D, Machado MAAM, da Silva SMB, Abdo RCC. Evaluation of marginal microleakage and depth of penetration of glass ionomer cements used as occlusal sealants. J Appl Oral Sci 2005;13:269-74.
43. Ateyah NZ, Elhejazi AA. Shear bond strengths and microle-akage of four types of dentin adhesive materials. J Contemp Dent Pract 2004;5:63-73.