Embed Size (px)
Citation preview
to appear in CLS 35, 1999
The effects of collocational strength and contextual predictability in lexical production1
Michelle L. Gregory1, William D. Raymond1, Alan Bell1,Eric Fosler-Lussier2, and Daniel Jurafsky1
1University of Colorado at Boulder 2University of California, Berkeley
0 IntroductionWord frequency and word predictability have both been proposed in the literature as explanations for word shortening or reduction. Traditionally, these two explanations have been modeled separately. Frequency models focus on the fact that words with high use frequency are shortened compared to low frequency words, whether in the lexicon (Zipf 1929) or during phonetic production (Fidelholtz 1975, Bybee 1999a). Predictability models focus on the fact that words that are highly predictable from the context are shortened during production (Jespersen 1922, Bolinger 1981, Fowler & Housum 1987). We propose that these “predictability” and “frequency” affects are actually variants of the same basic factor: the informativeness of a word as measured by its probability. In this account, words which are highly predictable or very frequent are highly probable, and hence have a lower information value.2
A consequence of considering frequency and predictability as probabilities is that they can be unified into a probabilistic model of processing together with other types of probabilistic knowledge, ultimately providing a more complete explanation of language use. Probabilistic models of human language comprehension claim that probabilistic information about words, phrases, and other linguistic structure is represented in the minds of language users and plays a role in language comprehension (Jurafsky 1996, Narayanan & Jurafsky 1998). This paper extends this probabilistic hypothesis to language production, suggesting that speakers use their knowledge of the probability of a word or combinations of words in sentence production. In particular, we present evidence that highly probable (less informative) words are shorter or more reduced in conversational speech. This is true whether the high probability of the word is based on frequency, collocation with neighboring words, repetition of the word in the conversation, or the semantic association of the word with its conversation context.
Our results are based on experiments designed to test probabilistic effects on three measures of shortening: deletion, tapping, and durational shortening. The effects of various probabilistic measures were tested on 8,472 word tokens ending in t or d taken from the phonetically transcribed Switchboard corpus of American telephone conversations (Greenberg et al. 1996). In §1 we review the range of probabilistic measures known to affect production and argue that frequency and predictability are probabilistic measures. We describe the methodology of our study in §2, defining the probabilistic measures considered as predictors in §2.3.
The results of the models are presented in §3, with a discussion following in §4. In §5, we discuss the implications of our results for probabilistic models of production.
1 Probabilistic measures and productionA good deal of support for a probabilistic model of processing comes from studies of comprehension (Ford, Bresnan, & Kaplan 1982, Resnik 1993, MacDonald 1994, Trueswell, Tanenhaus, & Garnsey 1994, Jurafsky 1996, Garnsey, Pearlmutter, Myers, & Lotocky 1997), where a variety of probabilistic measures have been investigated. For example, Trueswell et al. 1994 showed that thematic role likelihoods, as well as lexical form frequencies, can influence parsing, causing subjects to have difficulty when sentence elements have unexpected thematic roles. Jurafsky 1996 argued that during comprehension, hearers use probabilistic information about words and larger structures to produce initial parses of sentences, accounting for parsing difficulties on garden path sentences. Narayanan & Jurafsky 1998 proposed a Bayesian model for integrating different probabilistic knowledge sources in comprehension into a single model.
Less work has been done in developing probabilistic models of speech production. A starting point is the substantial literature on the effects of word frequency on production. Frequency effects in production were first reported by Oldfield and Wingfield 1965, who found that naming latencies are shorter for high frequency words in an object recognition task. Subsequently, frequency sensitivity has been shown to be associated with word forms (Jescheniak & Levelt 1994), and it has been suggested that frequency may be an organizing parameter in the lexicon (Forster 1976, Raymond & Bell 1998, inter alia). The previous work suggests that frequency of use is represented in the minds of the users and employed during production. There is also evidence for effects of predictability on production, as discussed below.
1.1 Frequency as probabilityA long-standing intuition is that high frequency words have less worth in discourse, in that they are less informative to hearers. Their low informativeness, encourages speakers to minimize effort when producing them (Jespersen 1922, Martinet 1960). One consequence of low informativeness is that high frequency words tend to become truncated, or shortened, in speech and lexically. Evidence for frequentitive durational shortening in production was noted by Schuchardt 1885 (cited by Jesperson 1922). Lexical shortening of frequent words was noticed by Zipf 1929, among others.
Frequency has also been observed to influence weakening processes. Fidelholtz 1975 looked at pairs of words in which one was of higher frequency than the other. He found that the unstressed vowels in the first syllable of higher frequency words were more likely to be reduced than the same vowel in the lower frequency words. Neu 1980 found that the high frequency word and showed a
much higher rate of final segment deletion than other words with final –nd clusters. More generally, Bybee (1999a, to appear a) found that word final t and d are deleted in high frequency spoken words significantly more often than in low frequency words. Fosler-Lussier and Morgan 1998 showed that the likelihood that a word’s pronunciation will deviate from its citation pronunciation increases as word frequency increases.
Frequency of word pairs also seems to influence some types of phonetic processes. Bybee (to appear b) found that in high frequency word pairs, the word boundary segments between words of the pair tend to behave like word internal segments with regard to palatalization. Some evidence has been reported that the frequency of word pairs may be a predictor of the use of English contracted forms, as well (Krug 1996).
One explanation for frequency effects is that frequency of use itself plays a causal role in shortening and reductive processes, perhaps via structural effects in the speaker’s lexicon (see Bybee to appear a). In this paper we explore an alternative probabilistic explanation that focuses at a different level: frequent words are more predictable to speakers and hearers because they occur often and in many contexts. High frequency words thus have a high PRIOR PROBABILITY, that is, the probability of a word independent of context.
1.2 Predictability as probabilityFowler 1988 conjectures that “talkers can get away with producing reduced versions of words in situations in which listeners have other sources of information about the words’ probable identity” (p. 308). In other words, words that are contextually predictable will be shortened in speech. In probabilistic terms, words that are highly contextually predictable are highly probable given the context. An argument for the interaction between predictability and language forms is given by Bolinger 1981, who observed that words are durationally longer in unexpected contexts. In an examination of contextual predictability, Fowler and Housum 1987 examined the effects of repetition on word duration. In an experiment where subjects were asked to spontaneously produce narratives, they found that 71 percent of second occurrences of nouns in narratives were shorter than the first occurrence of the same noun. Fowler and Housum (see also Fowler 1988) explained the results in terms of predictability, proposing that words that are predictable from the discourse because they are used more than once are durationally shorter than words new to the discourse.
Fosler-Lussier and Morgan 1998 showed that word pronunciation variation is sensitive to the probability of a word given the preceding two words. Jurafsky, Bell, Fosler-Lussier, Girand, and Raymond 1998 found that predictability of the ten highest frequency function words in a corpus, measured by the likelihood of the word given the two previous words, affects word duration for these words, and final consonant deletion in the function word of. Like frequency, predictability has effects on phonetic processes. Bush 1999 found that
the likelihood of palatalization across word boundaries increases with an increase of the frequency of the pair, normalized by the frequency of the first word in the pair.
1.3 HypothesesWe suggested earlier that probabilistic knowledge is used in language production, and in particular that frequency and predictability are both reflections of information value or probability: frequent words have high prior probability and predictable words have high contextual probability. An alternative explanation is that frequency and predictability are independent factors which play distinct roles in reduction or shortening, and that these roles are not based on probabilistic knowledge. In order to explore these hypotheses, we looked at three kinds of reductive processes (deletion, tapping, and durational shortening) and investigated the affect of many measures of the probability of a word on these processes. Our probabilistic hypothesis makes two major claims: (1) Various new measures of the probability of a word should show an effect on its pronunciation, as reflected by the three reductive processes investigated; and (2) These effects should be unidirectional: the higher the probability, the more shortening occurs. (One possible palindromic mantra: “Inform less? Less form in!”). An even stronger claim might be that probability affects shortening in a uniform way, that is, that a word which is highly probable for any reason (i.e. using any measure) is uniformly more likely to be tapped, deleted, or durationally shortened. An additional goal of this study is to identify which measures of probability are the best predictors for each of the shortening phenomena. This information will be useful in developing a probabilistic model of speech production detailing what pieces of probabilistic knowledge are used in different processes.
2 MethodologyWe considered eleven measures of prior and contextual probability as predictors of three shortening processes, t–d deletion, t–d tapping, and durational shortening. These processes were chosen in part because of the evidence already reviewed above that they are sensitive to frequency and predictability measures. In addition, these three processes have all been well studied and much is known about the structural and performance factors that affect them. Multiple regression is used to model the relation between the shortening processes and the probability measures using conversational data.
2.1. The datasetData for our analysis are derived from a subset of the Switchboard corpus of recorded telephone conversations (Godfrey, Holliman, & McDaniel 1992). The Switchboard corpus consists of conversations between unacquainted adults. The corpus contains 2430 conversations averaging six minutes each, and totaling 240 hours of speech, or 2.4 million words. A subset of 3.5 hours of this speech has
been phonetically hand transcribed (Greenberg 1996 and Greenberg et al. 1996). The dataset for this study consists of all words from this subset whose lexical entry ends in a t or d (8,472 tokens).
2.2. Three shortening measures and factors influencing themIn order to test the probabilistic variables, we used three measures of shortening: (1) Deletion of the word final t or d; (2) Tapping of the word final t or d; and (3) Word duration in milliseconds. These processes are each influenced by multiple structural and performance factors that must be controlled to assess the contribution of probabilistic measures to these processes. In this section we review previous work on these processes and enumerate the known influential factors from these studies.
Deletion. Final t–d deletion is defined as the absence of a pronounced oral stop segment corresponding to a final t or d in words. A final t or d was coded as deleted if in the Greenberg et al. 1996 transcription the t or d was not transcribed as phonetically realized, and was coded as not deleted if it was transcribed as full or tapped.3 For example, the phrase but the was often pronounced [b´D´] in the dataset, with no segment corresponding to the t in but.
The factors known to influence t–d deletion and controlled in this study (from Guy 1980 unless otherwise noted) are: (1) preceding segment class; (2) following segment class; (3) morphological status of final segment (monomorphemic–e.g., mist, irregular past–e.g., kept, or regular past–e.g., missed); (4) word frequency (Neu 1980; Bybee to appear a); and (5) planning problems (following uh, um, Jurafsky et al. 1998). Segmental environments favoring deletion are primarily those with preceding and following consonants. Words in which the t or d is not a past tense morpheme (mist) undergo more deletion than words in which it marks the past tense (e.g., missed or kept). High frequency words tend to have increased deletion, and planning problems discourage it.
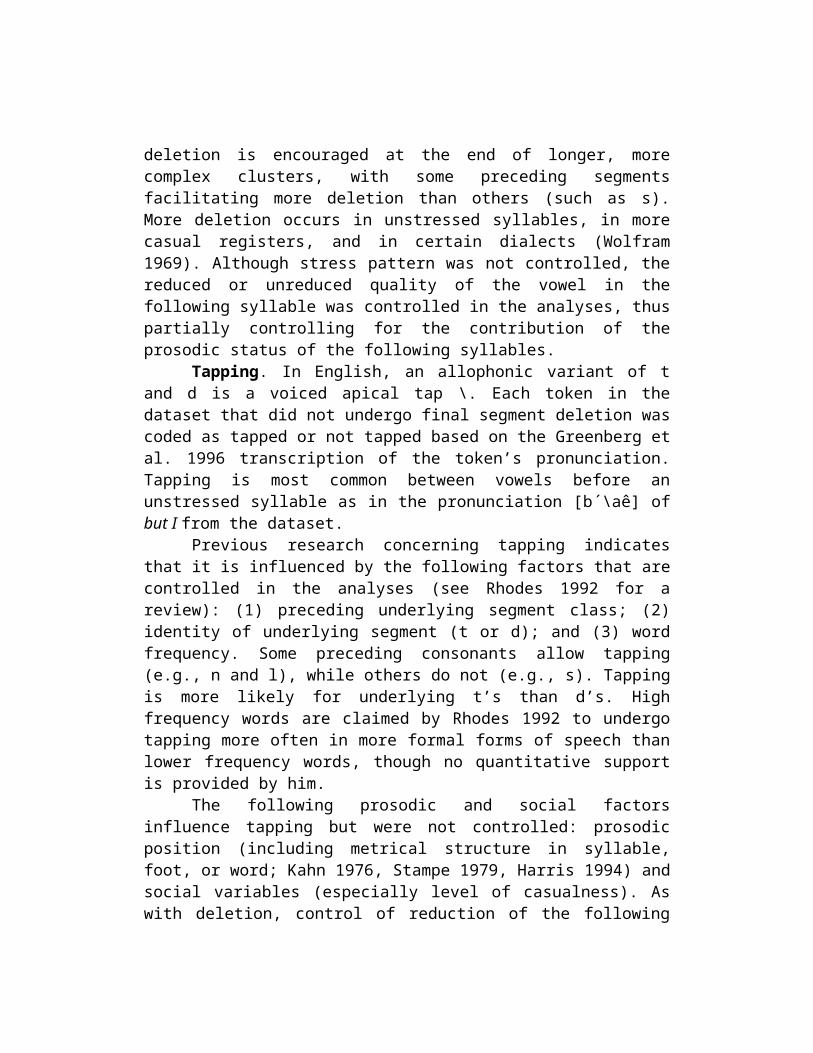
In addition to the above factors, some further variables have been reported to influence t–d deletion but were not controlled in this study, including other aspects of the preceding segment environment (e.g., segment type, cluster length, and cluster complexity), prosody, and social variables (register, age, gender, race, social class, etc.; see Wolfram 1969 for discussion). These variables reflect the fact that deletion is encouraged at the end of longer, more complex clusters, with some preceding segments facilitating more deletion than others (such as s). More deletion occurs in unstressed syllables, in more casual registers, and in certain dialects (Wolfram 1969). Although stress pattern was not controlled, the reduced or unreduced quality of the vowel in the following syllable was controlled in the analyses, thus partially controlling for the contribution of the prosodic status of the following syllables.
Tapping. In English, an allophonic variant of t and d is a voiced apical tap \. Each token in the dataset that did not undergo final segment deletion was
coded as tapped or not tapped based on the Greenberg et al. 1996 transcription of the token’s pronunciation. Tapping is most common between vowels before an unstressed syllable as in the pronunciation [b´\aê] of but I from the dataset.
Previous research concerning tapping indicates that it is influenced by the following factors that are controlled in the analyses (see Rhodes 1992 for a review): (1) preceding underlying segment class; (2) identity of underlying segment (t or d); and (3) word frequency. Some preceding consonants allow tapping (e.g., n and l), while others do not (e.g., s). Tapping is more likely for underlying t’s than d’s. High frequency words are claimed by Rhodes 1992 to undergo tapping more often in more formal forms of speech than lower frequency words, though no quantitative support is provided by him.
The following prosodic and social factors influence tapping but were not controlled: prosodic position (including metrical structure in syllable, foot, or word; Kahn 1976, Stampe 1979, Harris 1994) and social variables (especially level of casualness). As with deletion, control of reduction of the following vowel in our analyses partially controls effects of prosodic position.
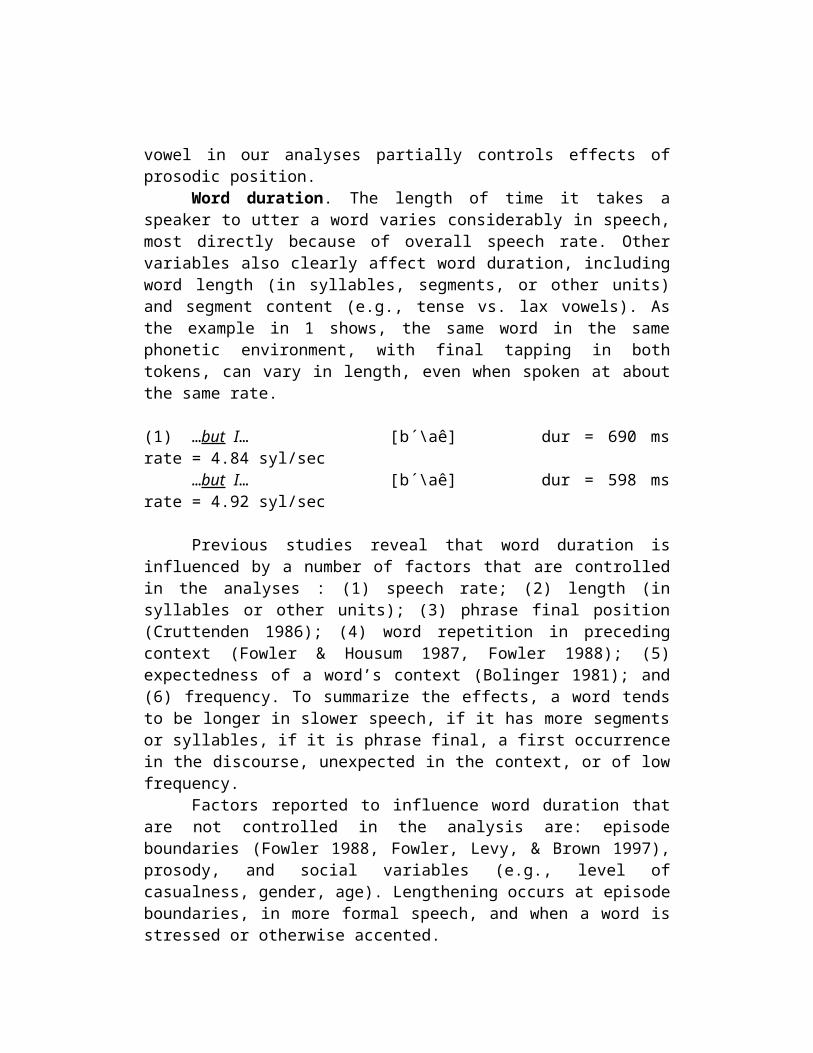
Word duration. The length of time it takes a speaker to utter a word varies considerably in speech, most directly because of overall speech rate. Other variables also clearly affect word duration, including word length (in syllables, segments, or other units) and segment content (e.g., tense vs. lax vowels). As the example in 1 shows, the same word in the same phonetic environment, with final tapping in both tokens, can vary in length, even when spoken at about the same rate.
(1) …but I… [b´\aê] dur = 690 ms rate = 4.84 syl/sec…but I… [b´\aê] dur = 598 ms rate = 4.92 syl/sec
Previous studies reveal that word duration is influenced by a number of factors that are controlled in the analyses : (1) speech rate; (2) length (in syllables or other units); (3) phrase final position (Cruttenden 1986); (4) word repetition in preceding context (Fowler & Housum 1987, Fowler 1988); (5) expectedness of a word’s context (Bolinger 1981); and (6) frequency. To summarize the effects, a word tends to be longer in slower speech, if it has more segments or syllables, if it is phrase final, a first occurrence in the discourse, unexpected in the context, or of low frequency.
Factors reported to influence word duration that are not controlled in the analysis are: episode boundaries (Fowler 1988, Fowler, Levy, & Brown 1997), prosody, and social variables (e.g., level of casualness, gender, age). Lengthening occurs at episode boundaries, in more formal speech, and when a word is stressed or otherwise accented.
2.3. The model
Multiple regression techniques were used to model each shortening variable. Logistic regression was used in the analyses of deletion and tapping, while linear regression was used for the durational shortening analysis. A regression analysis is a statistical model that predicts a dependent variable (in this case, frequency of final t–d deletion, frequency of final t–d tapping, or word duration) based on contributions from a number of other independent factors (Agresti 1996). For discussion, we divide the model factors into two groups; the control factors and the probabilistic test factors.
2.3.1 Control factorsIn an analysis involving multiple factors, there are two ways that a factor can be controlled. The first is by restricting the analysis to data with a single value of an independent variable; the second is to enter the factor in the model in order to establish its contribution as a predictor.
Five types of words were excluded from our analyses to control factors known, or suspected, to influence one or more shortening measures: (1) past tense verb forms (from all analyses); (2) words exhibiting processing trouble as identified by a significant following pause (including those at the end of an utterance) or filled pause (um, uh) in the transcription (from all analyses); (3) words with final lt, ld clusters (from all analyses); (4) words with final nt, nd clusters (from the tapping analysis); and (5) polysyllabic words (from the duration analysis).4
A number of variables were included as factors in the regression model before considering the probabilistic measures of primary interest in this study. The nonprobabilistic regression factors constitute what we will refer to as the BASE MODEL for the analyses of our three independent variables. The following list contains the factors included in the base model.
∑ Rate of speech (in syllables per second)∑ Final segment of citation form (t or d) ant vs. and∑ Following segment type (consonant or vowel) but I vs. but the∑ Preceding segment type (consonant or vowel) at vs. act∑ Following vowel quality (full or reduced) write better vs. write before ∑ Word length in syllables it vs. edit∑ Word class (function or content. For duration only)
2.3.2 Probability measuresWe examine three types of probabilistic measures in this study: prior probability, collocational probabilities, and discourse probabilities. We use only one measure of prior probability p(w), estimated by the relative FREQUENCY of the target word, where a target word is a word with final t or d. The relative frequency of the target word was computed by counting the occurrences of the target word in the
2.4 million word corpus and normalizing by the total number of words in the corpus.5,6
Collocational probabilities measure the predictability of a target word from the words immediately surrounding it. Because a conditional probability measure can be constructed using the preceding word(s) or the following word(s), we tested a variety of combinations, totaling eight measures of collocational strength. We first discuss the measures for the two word collocations, with a discussion of the three word measures following.
The first measure of collocational strength is the relative JOINT BIGRAM PROBABILITY p(w,w+1) of a target word and the next word taken together, computed by counting the occurrences of a word pair in the corpus and normalizing by the total number of such pairs. The CONDITIONAL BIGRAM (PROBABILITY) p(w|w-1) is the probability of the target word given the previous word (i.e. the predictability of a target knowing the preceding word). It is computed by dividing the joint bigram probability by the frequency of the preceding word p(w–1,w)/p(w–1). Similarly, the CONDITIONAL BIGRAM (PROBABILITY) OF THE NEXT WORD p(w+1|w) is the probability of the word following the target given the target word, computed by p(w,w+1)/p(w). We also use the target and next word pair to compute the REVERSE CONDITIONAL BIGRAM (PROBABILITY). The reverse conditional bigram is the probability of the target word given the following word p(w|w+1) = p(w,w+1)/p(w+1). Finally, we computed the ‘pointwise’ MUTUAL INFORMATION of target and next word pairs. Mutual information is a measure of how much more information is obtained about the target upon seeing the following word, and visa versa. It is similar to the conditional bigram of the target word, except that it also takes into account the prior probability of both the target word and the following word p(w,w+1)/p(w)p(w+1). The reader can obtain some idea of the ways that these different measures of local predictability rank word combinations in Appendix A. The appendix lists the target and next word combinations with the highest and lowest values of joint bigram probability, conditional bigram probability, and mutual information.
We tested three measures of three-word units. The first is the CONDITIONAL TRIGRAM probability of the target given the previous two words,p(t|w-1,w-2) = p(w–2,w–1,w)/p(w–2,w–1). We also used the REVERSE CONDITIONAL TRIGRAM probability, which is the probability of the target given
Measure Definition ExamplesPrior Probability
Frequency p(w) and, it
Collocational Probabilities
Joint bigram probability p(w,w+1) and I, kind of
Conditional bigram p(w|w–1) roughing it, adept atConditional bigram of next p(w+1|w) rid of, wound up
wordReverse conditional bigram p(w|w+1) at least, pet peevesMutual information p(w,w+1)/p(w)p(w+1) Viet Nam,
Burt ReynoldsForward conditional trigram p(w|w–1,w–2) late at night,
whether or notReverse conditional trigram p(w|w+1,t+2) at least in,
and so forthCentered conditional trigram p(w|w–1,w+1) little bit more,
to get ridDiscourse Probabilities
Discourse repetition ––––– –––––
Semantic relatedness ––––– –––––
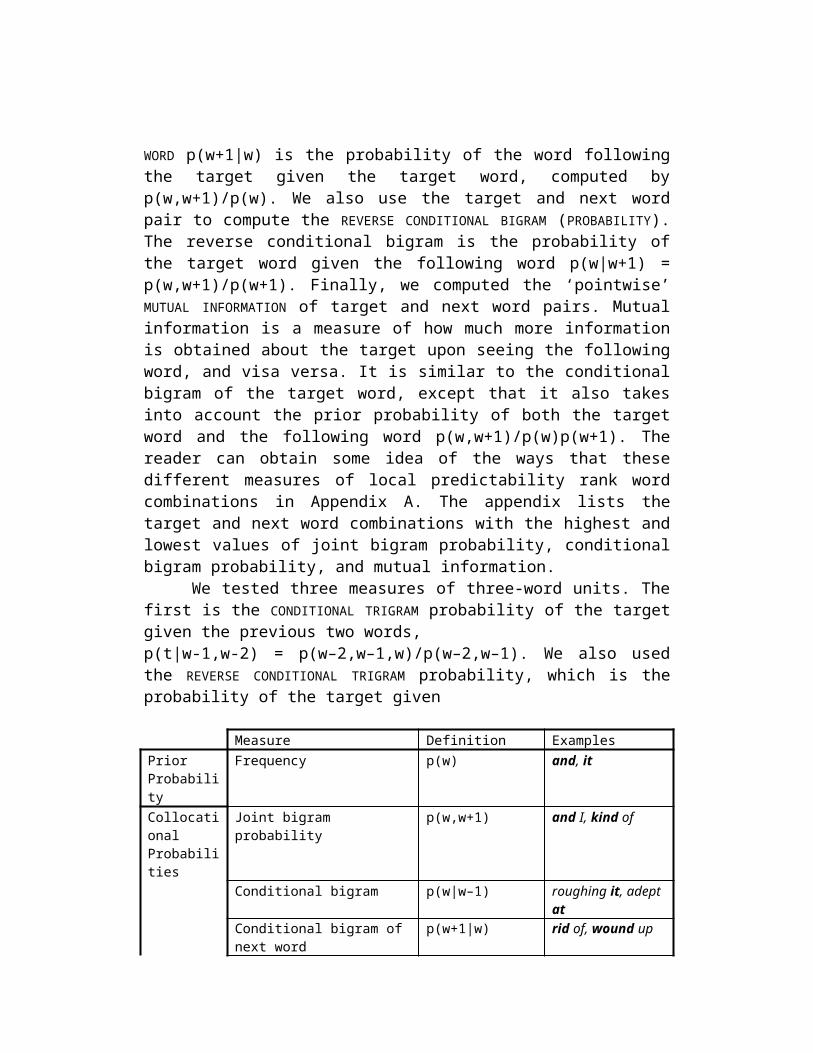
TABLE 1. Summary of probabilistic measure and high probability examples.
the next two words of the context, p(w|w+1,w+2) = p(w,w+1,w+2)/p(w+1,w+2). Finally, the CENTERED TRIGRAM probability of the target is the probability of the target given one word preceding and one word following the target p(w|w-1,w+1) = p(w-1,w,w+1)/p(w-1,w+1). TABLE 1 contains a summary of the probabilistic measures and some examples of high probability items from the dataset for each measure.
The final two probabilistic measures are probabilities that are not determined by the local surrounding words, but rather the words that occur earlier in the discourse. The DISCOURSE REPETITION of the target word is simply the number of times the target was uttered previously in the conversation. The SEMANTIC RELATEDNESS measure is a word association score between the target and all of the words in the conversation prior to it. For this measure, we used Latent Semantic Analysis (LSA) as described in Landauer and Dumais 1997. The LSA measure of semantic relatedness ranges from –1 to 1, with 1 indicating the greatest degree of semantic relatedness. A score of -1 indicates no relation between the word and the prior words. The examples in 2 show the relatedness value between the word food and two different conversations in which it occurred. The greater relatedness value of food in the restaurant conversation than in the vacation conversation is reflected by a higher LSA relatedness value.
(2) Conversation topic Target word Semantic relatedness restaurants food .45vacations food .27
Similarly, a higher relatedness measure for sad than rate is seen in a conversation about capital punishment, as shown in 3.
(3) Conversation topic Target word Semantic relatedness
capital punishment rate .15capital punishment sad .46
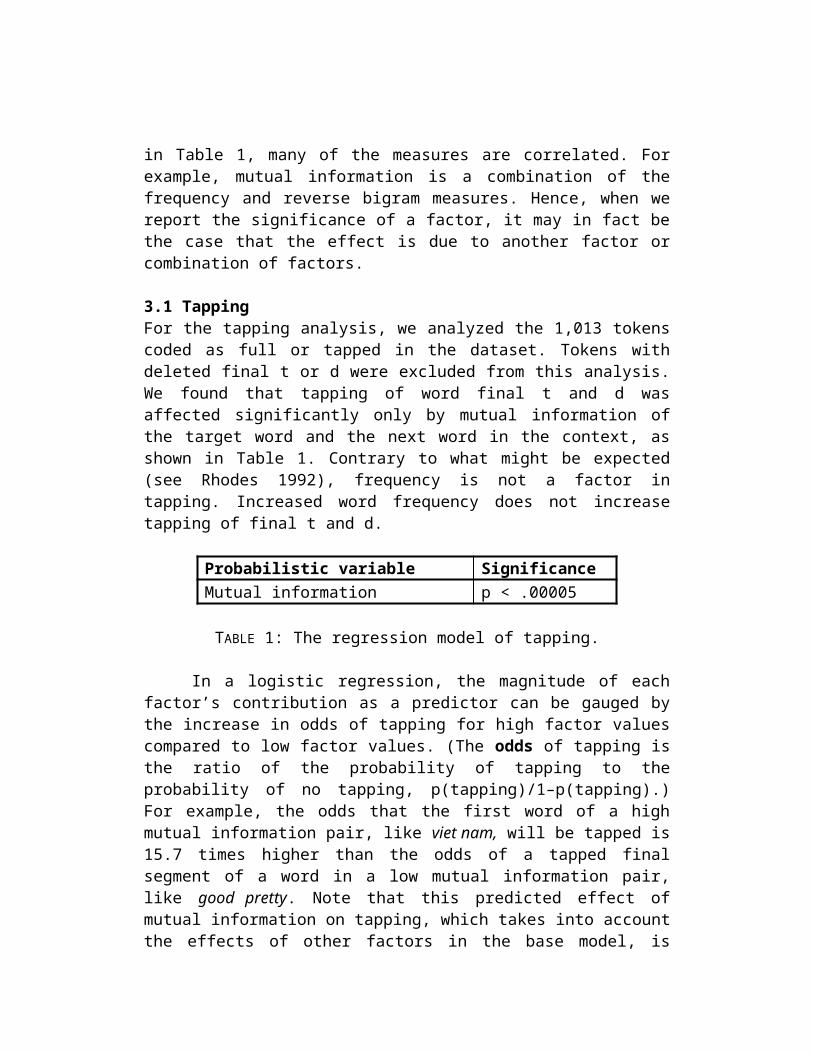
3 ResultsUsing multiple regression, the probabilistic measures were tested on the shortening variables of deletion, tapping, and duration by adding them to each of the regression models after the base model. Recall that the base model contains the nonprobabilistic structural and performance variables controlled in the study. When we report that a probabilistic measure is significant, it is meant to be understood that it is a significant parameter in a model that also includes the other significant variables, both control and test factors. In other words, after accounting for the effects of the other variables, the variable in question significantly increased the model’s predictive capacity. As can be seen by the definitions of the probabilistic measures in Table 1, many of the measures are correlated. For example, mutual information is a combination of the frequency and reverse bigram measures. Hence, when we report the significance of a factor, it may in fact be the case that the effect is due to another factor or combination of factors.
3.1 TappingFor the tapping analysis, we analyzed the 1,013 tokens coded as full or tapped in the dataset. Tokens with deleted final t or d were excluded from this analysis. We found that tapping of word final t and d was affected significantly only by mutual information of the target word and the next word in the context, as shown in Table 1. Contrary to what might be expected (see Rhodes 1992), frequency is not a factor in tapping. Increased word frequency does not increase tapping of final t and d.
Probabilistic variable SignificanceMutual information p < .00005
TABLE 1: The regression model of tapping.
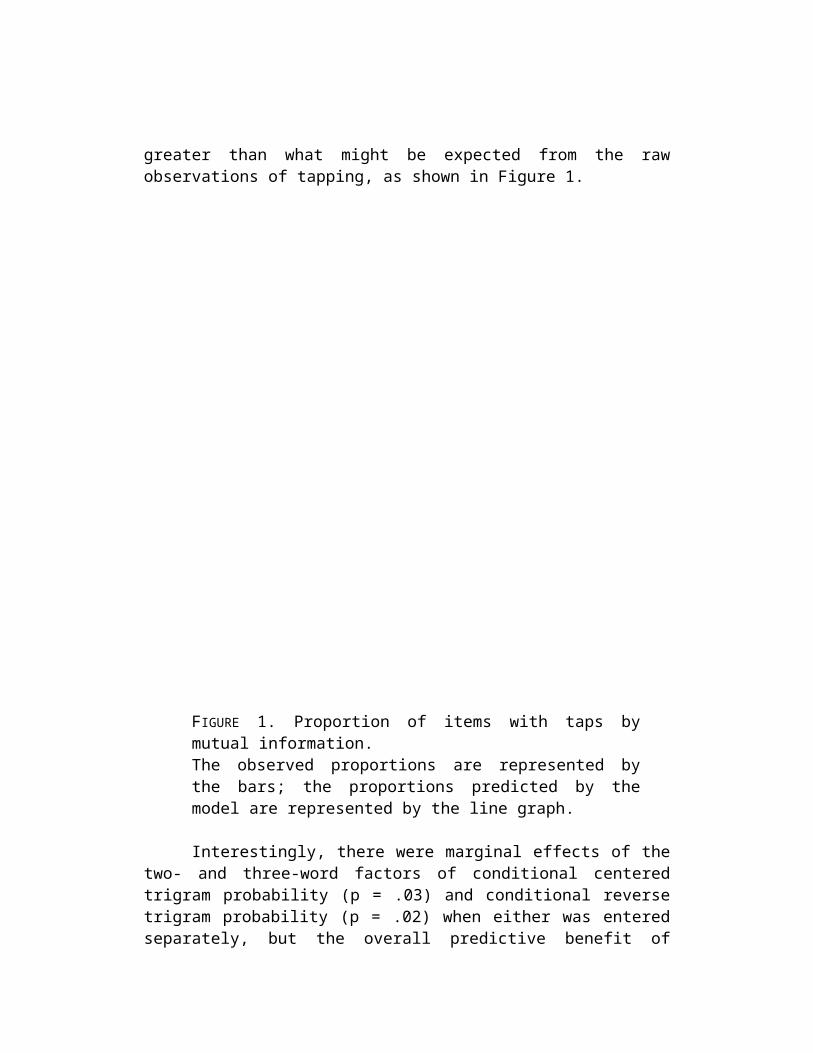
In a logistic regression, the magnitude of each factor’s contribution as a predictor can be gauged by the increase in odds of tapping for high factor values compared to low factor values. (The odds of tapping is the ratio of the probability of tapping to the probability of no tapping, p(tapping)/1–p(tapping).) For example, the odds that the first word of a high mutual information pair, like viet nam, will be tapped is 15.7 times higher than the odds of a tapped final segment of a word in a low mutual information pair, like good pretty. Note that this predicted effect of mutual information on tapping, which takes into account the effects of other factors in the base model, is greater than what might be expected from the raw observations of tapping, as shown in Figure 1.
00.20.40.60.81
1 2 3 4mutual information quartile
proportion of tapping
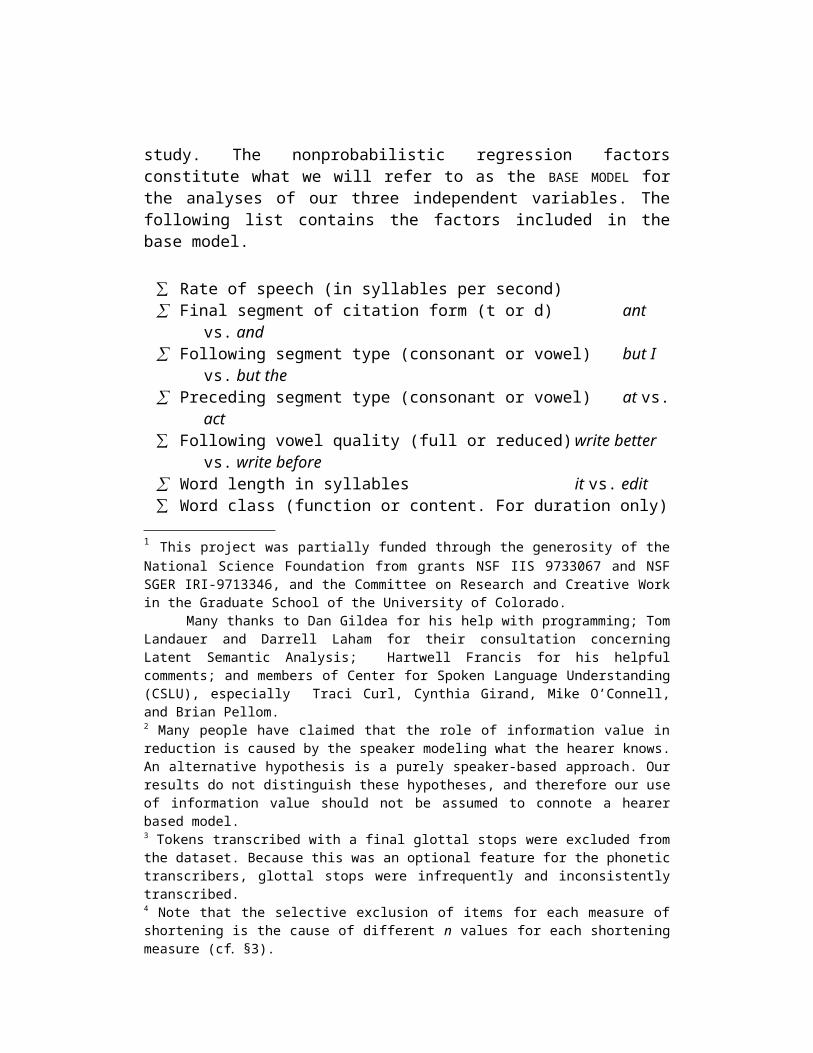
FIGURE 1. Proportion of items with taps by mutual information.The observed proportions are represented by the bars; the proportions predicted by the model are represented by the line graph.
Interestingly, there were marginal effects of the two- and three-word factors of conditional centered trigram probability (p = .03) and conditional reverse trigram probability (p = .02) when either was entered separately, but the overall predictive benefit of including these factors was slight. The effects of these three-word factors suggest that there may be some predictive contribution of three-word units to tapping, but the contribution adds little to the two-word mutual information factor.
Earlier findings suggest that some production processes that freely apply word internally (such as palatalization; Bybee to appear b, Bush 1999), or that involve the coalescence of word pairs (like contraction; Krug 1996) also tend to apply across word boundaries when word pair cohesion is high. The effect of mutual information on tapping suggests that tapping is a process that may also preferentially apply internally to highly cohesive pairs. This appears to be a gradient effect: as mutual information increases (reflecting a stronger cohesion between the two words), the likelihood of tapping increases.
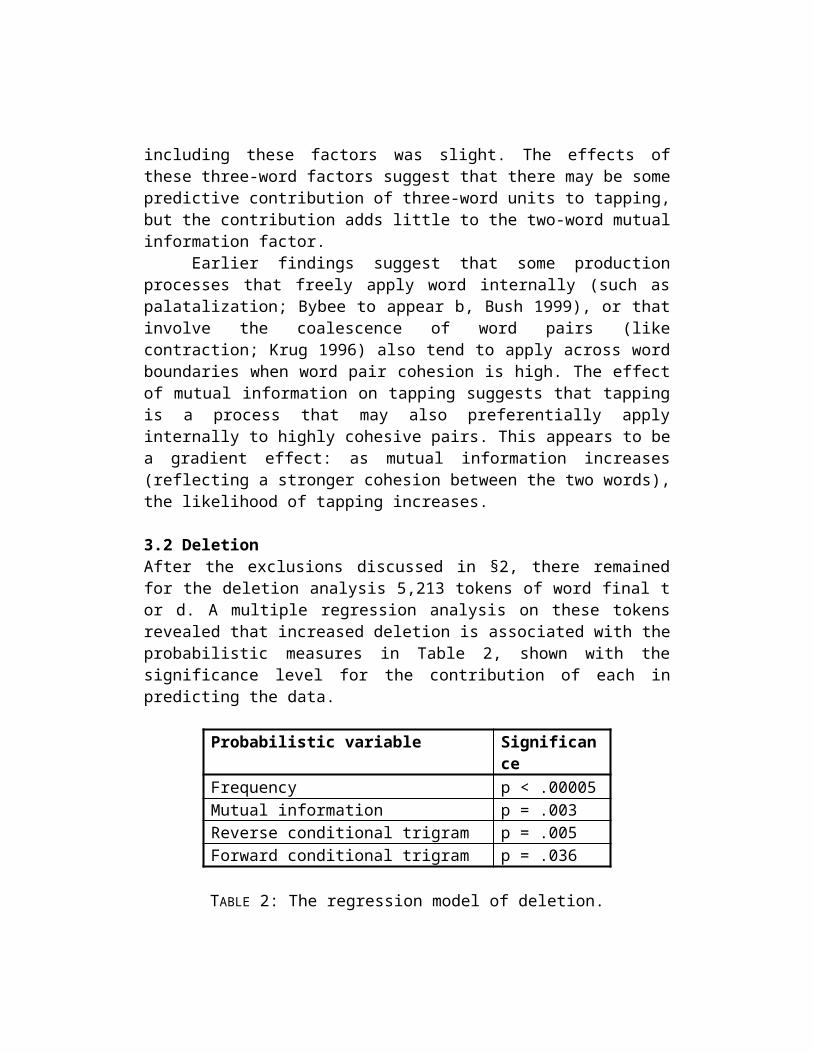
3.2 DeletionAfter the exclusions discussed in §2, there remained for the deletion analysis 5,213 tokens of word final t or d. A multiple regression analysis on these tokens revealed that increased deletion is associated with the probabilistic measures in Table 2, shown with the significance level for the contribution of each in predicting the data.
1 This project was partially funded through the generosity of the National Science Foundation from grants NSF IIS 9733067 and NSF SGER IRI-9713346, and the Committee on Research and Creative Work in the Graduate School of the University of Colorado. Many thanks to Dan Gildea for his help with programming; Tom Landauer and Darrell Laham for their consultation concerning Latent Semantic Analysis; Hartwell Francis for his helpful comments; and members of Center for Spoken Language Understanding (CSLU), especially Traci Curl, Cynthia Girand, Mike O’Connell, and Brian Pellom.2 Many people have claimed that the role of information value in reduction is caused by the speaker modeling what the hearer knows. An alternative hypothesis is a purely speaker-based approach. Our results do not distinguish these hypotheses, and therefore our use of information value should not be assumed to connote a hearer based model.3 Tokens transcribed with a final glottal stops were excluded from the dataset. Because this was an optional feature for the phonetic transcribers, glottal stops were infrequently and inconsistently transcribed.4 Note that the selective exclusion of items for each measure of shortening is the cause of different n values for each shortening measure (cf. §3).5 In the definitions, w is the target word–the word ending in a final t or d.6 Regression models used the logarithm for all probability measures, following usual practice with such asymmetrically distributed variables.
Probabilistic variable SignificanceFrequency p < .00005Mutual information p = .003Reverse conditional trigram p = .005Forward conditional trigram p = .036
TABLE 2: The regression model of deletion.
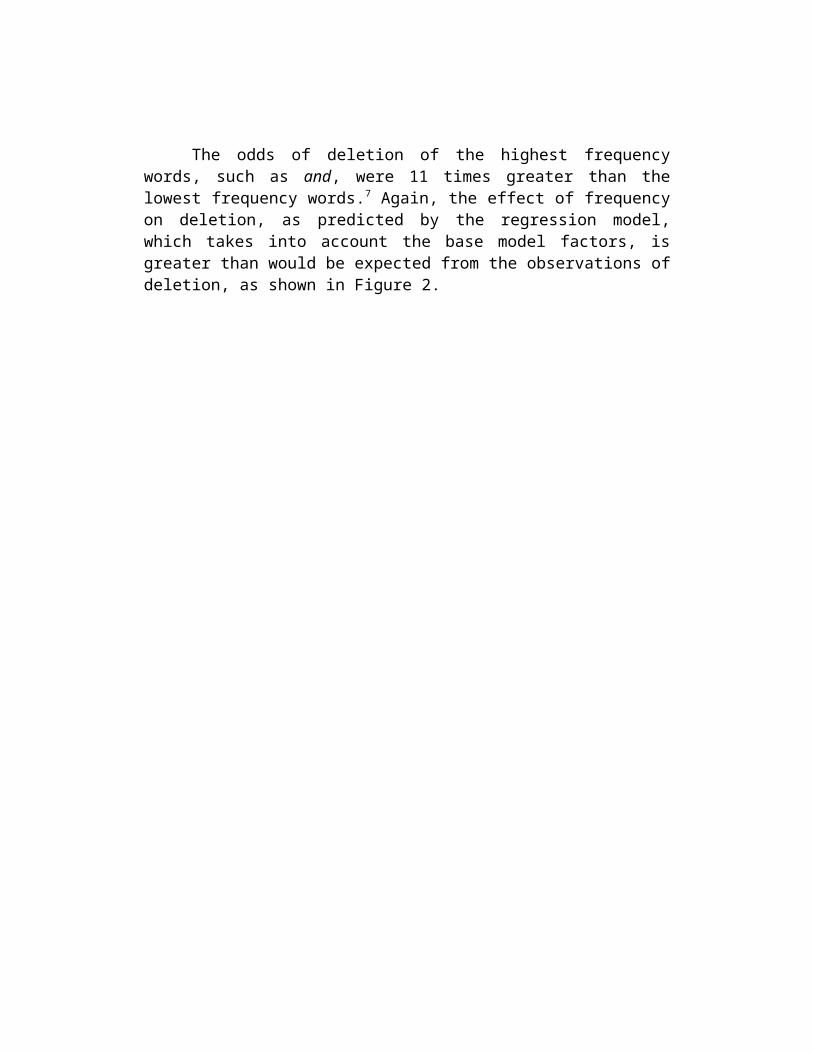
The odds of deletion of the highest frequency words, such as and, were 11 times greater than the lowest frequency words.7 Again, the effect of frequency on deletion, as predicted by the regression model, which takes into account the base model factors, is greater than would be expected from the observations of deletion, as shown in Figure 2.
7 The effect of frequency was computed from a model in which mutual information was replaced by the reverse conditional bigram probability of the target. This was done because mutual information itself contains frequency in its denominator, and thus distorts the effect of frequency in the regression model.
00.20.40.60.8
1 2 3 4frequency quartile
proportion deleted
FIGURE 2. Proportion of items with t or d deleted by frequency.The observed proportions are represented by the bars; the proportions predicted by the model are represented by the line graph.
Words in pairs that are highly mutually predictable, like grand canyon, had deletion odds twice as great as words in less predictable pairs. Word triplets with high conditional trigram and reverse conditional trigram probabilities increased the odds of deletion in the t–d word by only 40 percent and 3 percent, respectively.
It should be noted that mutual information could be replaced in the model in Table 2 with reverse conditional bigram probability and the model would have a virtually identical predictive capacity because mutual information is a combination of reverse conditional bigram and frequency (see Table 1 for a comparison). We report mutual information in order to allow a more direct comparison with the models of tapping and duration. What is important about mutual information and reverse conditional bigram probability is that they are both measures of collocation of a target and the next word.
We also found that semantic relatedness affects deletion, p < .00005. However, the results from this analysis remain puzzling. As semantic relatedness between a word and the prior conversational context increased, deletion decreased. There are several reasons why this may be so. The measure of semantic relatedness used in this study is provided by Latent Semantic Analysis (Landauer & Dumais 1997), which computes semantic relatedness using the cooccurrence of words in a set of contexts. The resulting LSA measure of semantic relatedness is not strictly probabilistic. It also conflates the relationships of function words and content words to the previous discourse. In addition, the relatedness values between the target word and the prior conversational context that were employed in this study were based on written text, unlike the other probabilistic measures. We are looking into these issues further.
In summary, deletion is affected by a high prior probability of a word, high mutual information with the following word, and high predictability of a word given the two words on either side. Note that the following context appears to be a more powerful predictor of deletion than the preceding context, but that, unlike tapping, preceding context does have an effect on deletion.
3.3 DurationFor the duration analysis, we used 4,695 monosyllabic tokens with final t–d from the dataset. Five probabilistic measures were significant in predicting durational shortening. They are summarized in Table 3.
Probabilistic variable SignificanceFrequency p < .00005Mutual information p < .00005
Semantic relatedness p < .00005Conditional bigram p = .013Discourse repetitions p = .037
TABLE 3. The regression model of durational shortening.
The strongest of these effects is the mutual information between the target word and the next word. The model predicts that the word pairs with the highest mutual information will be 47 percent shorter in duration than the pairs with the lowest mutual information.8 As in the case of deletion, mutual information could be replaced in the model in Table 3 with reverse conditional bigram probability without changing the predictive capacity of the model.
Other strong effects on duration are found for the factors of frequency and semantic relatedness. The highest frequency words are 22 percent shorter than the lowest frequency words, and the words most highly semantically related to their context are 19 percent shorter than the words with the lowest semantic relatedness. The predictability in the forward direction as measured by the conditional bigram has a shortening effect of 10 percent. The effect of discourse repetition has a shortening effect of only five percent.
Both discourse repetition and semantic relatedness increased shortening, as in the example in 4. When coast is more highly related semantically to the words in the previous discourse, it is durationally shorter than when it is less highly related.
(4) Conversation Topic Word Semantic Relatedness Duration family budgets coast .14 404 msweather coast .22 139 ms
Durational shortening was sensitive to prior probability, collocation, and discourse probabilities. The durational shortening results appear similar to the tapping and deletion results in that durational shortening was affected by probabilities in two-word contexts that measure cohesion of the target and the next word (mutual information). But an explanation evoking the notion of cohesion, used to explain tapping, does not seem useful for interpreting the durational shortening results, because duration was also affected by discourse probabilities and the previous word. The results of the durational shortening analysis have additional similarities with the deletion results in that both prior
8 These are conservative estimates based on a model that controls for whether the target word is a content word or a function word. We used these estimates to account for the greater likelihood that function words, which have high frequencies, will also have reduced vowels and thus be shorter.
probability and the collocation measures were significant factors in predicting an effect.
3.4 DiscussionThe probabilistic measures examined did not all affect each shortening process. In particular, a clear distinction is seen between tapping on the one hand and deletion and durational shortening on the other. Tapping is only affected by the mutual information of the target word and the next word in the context. It is, significantly, not affected by frequency or collocational measures other than mutual information.
Previous studies that have claimed that certain processes that freely occur word internally, such as palatalization, also occur preferentially in high frequency pairs (Bybee to appear a) or in collocations, as measured by conditional probability of the word and the next word (Bush 1999). Neither of these measures was significant in our analysis of tapping. Our results for tapping suggest that mutual information is a better measure of the cohesion for two-word pairs. The previous studies conclude that high frequency phrases are represented as one unit in the lexicon. A probabilistic model, while consistent with this claim, does not require that structural changes in the lexicon are necessary for this shortening effect. A probabilistic account allows for the possibility that tapping in cohesive pairs occurs during production.
Both deletion and durational shortening are affected by frequency and various collocational measures, including mutual information. Durational shortening is the only shortening process sensitive to discourse measures. This might suggest that duration can be manipulated by the speaker to signal information value to the hearer, as suggested by Fowler 1988. However, our results are not conclusive in this regard. It could be that deletion and durational shortening only differ quantitatively because duration, a continuous variable, is a more sensitive measure of shortening.
One of the purposes of this study was to identify what probabilistic measures are the best predictors of shortening. Mutual information was a significant factor in all three analyses, which argues that it is a good predictor of shortening. The difference between mutual information and the other two- and three-word collocational measures is that mutual information considers not only the pair frequency, but also the frequency of BOTH words in the pair. Normalizing for the frequency of both gives a measure of the bidirectional predictability of the pair. That the joint bigram probability (the normalized bigram frequency) of the target and following word was not significant for any of our shortening measures indicates the mere frequency of a word pair is not sufficient to measure the cohesion between two words.9
9 As noted, mutual information includes the frequency of the following word, as does reverse bigram. However, following word frequency was not included as a predictor in our models. Following word frequency may be responsible for the effects.
Most of the probabilistic measures used in this study were selected based on previous research. However, a semantic relatedness measure has not been previously shown to affect shortening. Intuitively, it seems that words are predictable from the semantic content of the previous discourse. The use of a semantic relatedness measure is a way to quantify this intuition. While the effects of this measure are not wholly consistent, we have provided evidence that semantic relatedness to the previous discourse is a source of predictability in speech.
4 ConclusionOur results show that a variety of probabilistic measures affect shortening in speech even after controlling for other factors known to affect shortening, confirming the first hypothesis in §1.3. These results support a probabilistic model of production in which knowledge of the likelihood of words in contexts is used by speakers and affects their pronunciation of words. Importantly, both prior probability and conditional probabilities were shown to effect shortening, which combines the two previously independent explanations of shortening, frequency and predictability, in a single model.
An alternative to a probabilistic model is that each of the factors found to significantly affect word pronunciation has an independent effect on production, and that the ability to represent each of these factors probabilistically is coincidental. Given the our results for the variety of measures investigated, we argue that a simpler explanation recognizes that the factors are all variants of the information value of a word as measured by its probability.
Our second hypothesis concerned the directionality of the probabilistic effects on shortening. With only one exception, all of the factors chosen for inclusion in the study affected shortening unidirectionally. That is, for those measures that were found to be significant predictors of a shortening process, the higher the probability of a word by the measure, the more likely the word was to undergo the shortening process. The nearly complete agreement in the results provides substantial support for the unidirectionality hypothesis, which itself reflects earlier intuitions that more predictable words are shortened in speech (Jespersen 1922).
Appendix AComparison of the 10 highest and the 10 lowest items from the text for
conditional bigram, bigram frequency, and mutual information
Conditional bigram of the next word p(w+1|w)
Joint bigram probabilityp(w,w+1)
Mutual informationp(w,w+1)/p(w)p(w+1)
high low high low high lowrid of and minimize and i out alone burt reynolds instead thatwound up and
technologieskind of weren't
preparedviet nam could time
Conditional bigram of the next word p(w+1|w)
Joint bigram probabilityp(w,w+1)
Mutual informationp(w,w+1)/p(w)p(w+1)
ought to and wally it was just details grapefruit citron
good pretty
kind of and crank lot of and oak hewlett packards
about have
compared to
and jeez but i good long twilight zone kind but
sort of and bets don't know it mom pete arnett it gettend to and gonorrhea and then about abortion acute illness but littleintend to and modifying and and socialized
behaviorsoutheast asia bit the
instead of and ironside that i get blind mount lebanon
and though
united states
and expediting
and you just overhead grand canyon and anymore
References
Agresti, Alan. 1996. An Introduction to Categorical Data Analysis. New York: John Wiley & Sons.
Bolinger, Dwight. 1981. Two kinds of vowels, two kinds of rhythm. Bloomington, Indiana: Indiana University Linguistics Club
Bush, Nathan. 1999. The predictive value of transitional probability for word-boundary palatalization in English. Thesis, University of New Mexico, Albuquerque.
Bybee, J. To appear a. The phonology of the lexicon: Evidence from lexical diffusion. Usage-based Models of Language, ed. by M. Barlow and S. Kemmer. Stanford: CSLI.
___. To appear b. Lexicalization of sound change and alternating environments. In M. Broe and J. Pierrehumbert (Eds.) Papers in Laboratory Phonology V. Cambridge, UK: Cambridge University Press.
___. 1999a. Usage-based phonology. Functionalism and Formalism in Linguistics VI, ed. by M. Darnell, E. Moravcsik, F. Newmeyer, M. Noonan, & K. Wheatley. Amsterdam: John Benjamins.
Cruttenden, Alan. 1986. Intonation. Cambridge, UK: Cambridge University Press.Fidelholtz, James L. 1975. Word frequency and vowel reduction in English. CLS 11.200-213.Fosler-Lussier, Eric, and Nelson Morgan. 1998. Effects of speaking rate and word frequency on
conversational pronunciations. ESCA Tutorial and Research Workshop on Modeling Pronunciation for Variation for Automatic Speech Recognition 1-6. Kerkrade, Netherlands .
Fowler, Carol A. 1988. Differential shortening of repeated content words produced in various communicative contexts. Language and Speech 31.307-319.
___ and Jonathan Housum. 1987. Talkers’ signaling of “new” and “old” words in speech and listeners’ perception and use of the distinction. Journal of Memory and Language 25.489-504.
___, Elena T. Levy, and Julie M. Brown. 1997. Reductions of spoken words in certain discourse contexts. Journal of Memory and Language 37.24-40.
Ford, Marilyn, Joan Bresnan, and Ronald M. Kaplan. 1982. A competence-based theory of syntactic closure. The Mental Representation of Grammatical relations, ed. by Joan Bresnan and Ronald M. Kaplan, 727-796. Cambridge, MA: MIT Press.
Forster, Kenneth I. 1976. Accessing the mental lexicon. New Approaches to Language mechanisms, ed. by R. J. Wales and Edward Walker. Amsterdam: North Holland Publishing. 257-284.
Garnsey, S., N. J. Pearlmutter, E. Myers, and M. Lotocky. 1997. The contributions of verb bias and plausibility to the comprehension of temporarily ambiguous sentences. Journal of Memory and Language 37.58-93.
Godfrey, J., E. Holliman, and J. McDaniel. 1992. SWITCHBOARD: Telephone speech corpus for research and development. Proceedings of ICASSP-92, San Francisco. 517-520.
Greenberg, S. 1996. Understanding speech understanding: Towards a unified theory of speech perception. Proceedings of the ESCA Wordshop on The Auditory Basis of Speech Perception, Keele University, 1-8.
___, Joy Hollenback, and Dan Ellis. 1996. Insights into spoken language gleaned from phonetic transcription of the Switchboard corpus. Proceedings of the International Conference on Spoken Language Processing S24-27. Philadelphia.
Guy, Gregory R. 1980. Variation in the group and the individual: The case of final stop deletion. In Labov 1980, 1-36.
Harris, John. 1994. English Sound Structure. Oxford, UK: Blackwell.Jescheniak, J. D., and W. J. M. Levelt. 1994. Word frequency effects in speech production:
Retrieval of syntactic information and of phonological form. Journal of Experimental Psychology: Learning, Memory, and Cognition 20.824-243.
Jespersen, Otto. 1922. Language: Its nature, development, and origin. New York: Henry Holt and Co.
Jurafsky, Daniel. 1996. A probabilistic model of lexical and syntactic disambiguation. Cognitive Science 20.137-194.
___, Alan Bell, Eric Fosler-Lussier, Cynthia Girand, and William Raymond. 1998. Reduction of English function words in Switchboard. Proceedings of ICSLP-98, Vol 7, p 3111-3114.
Kahn, Dan. 1976. Syllable-based generalizations in English phonology. Ph.D. Dissertation, Massachusetts Institute of Technology.
Krug, Manfred. 1996. String frequency: A cognitive motivating factor in coalescence, language processing, and linguistic change. Journal of English Linguistics 26.286-320.
Labov, William (ed.) 1980. Locating Language in Time and Space. New York: Academic Press.Landauer, T.K. and Dumais, S. T. (1997) A solution to Plato's problem: The Latent Semantic
Analysis theory of acquisition, induction and representation of knowledge. Psychological Review 104.211-240
MacDonald, Maryellen C. 1994. Probabilistic constraints and syntactic ambiguity resolutions. Language and Cognitive Processes 9.157-201.
Martinet, André. 1960. Elements of general linguistics. Chicago: University of Chicago Press.Narayanan, Srini, and Daniel Jurafsky. 1998. Bayesian models of human sentence processing. In
Proceedings of CogSci-98. Neu, Helene. 1980. Ranking of constraints on /t,d/ deletion in American English: A statistical
analysis. In Labov 1980, 37-54.Oldfield, R. C., and A. Wingfield. 1965. Response latencies in naming objects. Quarterly
Journal of Experimental Psychology 17.273-281.Resnik, P. 1993. Selection and information: A class-based approach to lexical relationships.
Ph.D. Dissertation, University of Pennsylvania. Raymond, William D., and Alan Bell. 1998. Factors influencing lexical substitution errors:
Consequences for a model of speech production. Paper presented at CUNY Sentence Processing conference. New Brunswick, NJ.
Rhodes, Richard A. 1992. Flapping in American English. Proceedings of the 7th International Phonology Meeting, ed. by Wolfgang U. Dressler, Martin Prinzhorn, and John R. Dennison, 217-232.
Stampe, David. 1979. A dissertation on natural phonology. New York: Garland.Trueswell, J. C., M. K. Tanenhaus, and S. M. Garnsey. 1994. Semantic influences on parsing:
Use of thematic role information in syntactic disambiguation. Journal of Memory and Language 33.285-318.

Wolfram, W. 1969. A sociolinguistic description of Detroit Negro speech. Washington, D.C.: Center for Applied Linguistics.
Zipf, George Kingsley. 1929. Relative frequency as a determinant of phonetic change. Harvard Studies in Classical Philology 15.1-95.