Embed Size (px)
Citation preview
Rowan University Rowan University
Rowan Digital Works Rowan Digital Works
Theses and Dissertations
5-19-2015
The effects of cognitive strategy instruction on math problem The effects of cognitive strategy instruction on math problem
solving of high school students with learning disabilities solving of high school students with learning disabilities
Joseph DeVecchis
Follow this and additional works at: https://rdw.rowan.edu/etd
Part of the Special Education and Teaching Commons
Recommended Citation Recommended Citation DeVecchis, Joseph, "The effects of cognitive strategy instruction on math problem solving of high school students with learning disabilities" (2015). Theses and Dissertations. 503. https://rdw.rowan.edu/etd/503
This Thesis is brought to you for free and open access by Rowan Digital Works. It has been accepted for inclusion in Theses and Dissertations by an authorized administrator of Rowan Digital Works. For more information, please contact [email protected].
THE EFFECTS OF COGNITIVE STRATEGY INSTRUCTION ON MATH
PROBLEM SOLVING OF HIGH SCHOOL STUDENTS WITH LEARNING
DISABILITIES
by
Joseph M. DeVecchis
A Thesis
Submitted to the
Department of Language, Literacy, and Special Education
College of Education
In partial fulfillment of the requirement
For the degree of
Master of Arts in Learning Disabilities
at
Rowan University
May 1, 2015
Thesis Chair: S. Jay Kuder, Ed. D.

© 2015 Joseph M. Devecchis
Dedications
This thesis is dedicated to my wife and children. Theresa, you are my rock and I
can’t thank you enough for all of your love and support throughout this process. Ryan
and Emily, daddy is almost done! I love the two of you very much and I hope you never
lose sight of the power of education. I would also like to dedicate this thesis to my
parents and in-laws. Mom and Dad, your unending support in everything I have ever
done has shaped me into the man I am today. The home cooked meals and babysitting
during nights when I had class will never be forgotten. I hope to continue to make you
proud each day. Joe and Phyllis, I can never repay you for watching the kids during this
process and giving me and my family the vacation of a lifetime last year when I really
needed a break before the home stretch of this program.

iv
Acknowledgments
I would like to express my appreciation to Dr. S. Jay Kuder for his guidance and
help throughout this research. I would also like to express my appreciation for my
classmates who pushed me through and welcomed me into their learning community.
v
Abstract
Joseph M. DeVecchis
THE EFFECTS OF COGNITIVE STRATEGY INSTRUCTION ON MATH PROBLEM
SOLVING OF HIGH SCHOOL STUDENTS WITH LEARNING DISABILITIES
2014/15
Dr. S. Jay Kuder Ed. D.
Masters of Arts in Learning Disabilities
The purpose of the study was to examine if Solve It! instruction, a cognitive based
strategy instruction program, along with a graphic organizer would increase students
understanding of mathematical word problems in the high school classroom setting. The
study implemented a pretest-posttest design. There were sixteen participants in the
intervention group as well as sixteen students in the control group. The study took place
in four different resource mathematics classrooms. The independent variable was a
modified version of Solve It! instruction while the dependent variable was a curriculum –
based measurement created by the intervention and control group teachers. Overall, all
students showed progress throughout the twenty-six day study, however students who
were exposed to the intervention showed significantly greater gains.
vi
Table of Contents
Abstract v
List of Figures vii
List of Tables viii
Chapter 1: Introduction 1
Chapter 2: Literature Review 7
Learning Disabilities and Math 7
Cognitive Strategy Instruction 7
Graphic Organizers 15
Chapter 3: Methodology 21
Setting and Participants 21
Procedure 22
Variables 25
Chapter 4: Results 27
Summary 27
Group Baseline Results 28
Intervention 28
Chapter 5: Discussion 32
References 35

vii
List of Figures
Figure 1. Graphic Organizer 24
Figure 2. Modeled Example 24
viii
List of Tables
Table 1. Baseline Assessment Data 28
Table 2. Post Test Assessment Data 29
Table 3. Pre/Post Test Scores 30
Table 4. Post-Test Survey Data 31
1
Chapter 1
Introduction
When secondary-age students who have received instruction in algebra are tested,
most can perform the necessary operations to complete an algebraic equation. However,
when the student is presented with a word problem where they need to generate and then
solve the equation, many have difficulty. This is probably truer for students with learning
disabilities. Students with learning disabilities often have not attained the strategies to
facilitate problem solving or may have difficulty selecting strategies that are appropriate
to the task. In contrast, where a learning disabled student often uses ineffective
strategies, students without learning difficulties have a collection of strategies and most
can use them effectively to solve problems. To address the issue of problem solving
ability, major strides have been made to reform the math curriculum from an emphasis on
memorization skills and procedural knowledge to problem analysis, interpretation, and
abstract understanding. The use of cognitive strategy based instruction in this study looks
to place an emphasis on problem analysis and a general understanding of the
mathematical problem-solving process.
The traditional and conventional mathematics curriculum is based on procedural
knowledge, such as memorizing operations with little regard to underlying meanings or a
sense of why students are using the operations, instead of developing conceptual and
strategic knowledge in students (Montague, Warger & Morgan, 2000). This line of
thinking appears to be negatively effecting our public school outcomes when it comes to
statewide test scores, as well as international scores. In 2012, among the 34 countries
who participated in the Programme for International Student Assessment (PISA), the
2
United States performed below average in mathematics with a rank of 27th
(Schleicher &
Davidson, 2012). The United States spends more money per student than most countries
but is not translating to better performance as one in four U.S. students do not reach a
proficient level in the PISA. These statistics alone indicate that more research needs to
be done on mathematic instruction in this country and the climate of our classrooms
needs to adapt in the 21st century.
In this study, I examined the effectiveness of implementing cognitive strategy
instruction into the resource math classroom. Cognitive strategy instruction is an
instructional approach which emphasizes the development of thinking skills and
processes as a means to enhance learning. The objective of using cognitive strategy
instruction is to enable students to be more strategic when solving a complex math
problem. I believe that students who receive intensive training on a cognitive strategy
instruction program such as Solve It! will perform better on a post test than students who
receive instruction that they have typically seen in their high school career. As a math
teacher at a high school for the past nine years, I have seen many initiatives come and go
without much improvement in the comprehension of math word problems. Through a
mini study on incorporating a cognitive strategy instruction in 2013, I saw immediate
results. This led my students to appear more confident and eager to take the state
assessment that year.
Similar to reading comprehension, math problem solving is a complex skill that
requires basic math skills, reading comprehension, and development of a viable process
for solution. A student with learning disabilities will have difficulties with developing a
3
process for solution of word problem. These students often lack the necessary skills to
conceptualize a problem first, and then solve it.
The two research questions examined in this study are:
-Do students who are provided with extensive cognitive based strategy instruction
along with a graphic organizer to organize problem details instead of conventional
instruction perform better on a curriculum - based measurement?
-After solving problems on a post - test, will students report they understood the
question, utilized an appropriate problem-solving strategy, and checked their answer?
This study was conducted across four classrooms in a resource mathematics
setting. Two classrooms were designated as the control group where they were instructed
to conduct business as usual, and the other two classes implemented cognitive strategy
instruction into everyday lessons. The two control classes consisted of a total of sixteen
students. Of the sixteen students, ten of them were classified Specific Learning
Disability for reading comprehension and math problem solving discrepancies, two were
Multiply Disabled and four were classified Other Health Impaired (ADHD). There were
nine female students and seven male students. Of the nine females, six were African
American and three were White, while the nine boys consisted of seven African
Americans and two Hispanic.
The intervention group also consisted of sixteen students. Of the sixteen
intervention group students, eight were classified Specific Learning Disability for reading
comprehension and math problem solving discrepancies, seven were classified Other
Health Impaired (ADHD) and one was classified Emotionally Disturbed. There were ten
4
male students and six female students. Of the ten male students, eight were African
American and two were White, while all six females were African American.
The students with disabilities included some with Specific Learning Disabilities,
some who were classified as Other Health Impaired (ADHD), one classified as
Emotionally Disturbed, and some with Multiply Disabilities. Specific Learning
Disabilities is defined as a disorder in one or more of the basic psychological processes
involved in understanding or using language that may manifest itself to struggles in
reading, writing and math. Other Health Impaired is defined as being chronically ill and
represents a disability characterized by having limited strength and alertness. Multiply
Disabled is defined as having the presence of two or more disabilities which causes
severe educational needs. Emotionally Disturbed is defined as having a general
pervasive mood or unhappiness, inability to build and maintain relations, or a fear of
developing relationships with peers or personnel. The students in this study were
classified with these four classifications in their Individual Education Programs (IEP)
written by the school district. Each student had goals and objectives that needed to be
met in their IEP’s as well.
The independent variable for this was study was the program Solve It!. Solve It!
is a research based instructional program for teaching students who have difficulty in
mathematics and solving word problems. By using Solve It!, students learn how to
understand the mathematical problems, analyze the information presented, develop a
logical plan to answer the question, and then evaluate their solutions (Montague, Warger
& Morgan, 2000). Solve It! Instruction consists of seven steps. First, students are taught
to read the problem for understanding. Second, the students paraphrase the problem by
5
putting it into their own words. Third, students visualize the problem by creating
representations that depict relationships among the problem parts. Fourth, the students
hypothesize about problem solutions by selecting appropriate operations, formulas and
equations that are needed to solve it. Fifth, the students estimate the answer as a means
of later confirming the solution outcome. Sixth, the students try to answer the problem
following the steps previously determined. Finally, the students check their answers with
their original hypothesis (Krawec, Huang, Montague, Kressler, & Alba, 2012). For the
purpose of this study, steps two and three will be eliminated and be replaced with a
graphic organizer. In my previous research in 2013, I found that the Solve It! process
was too involved and confusing for my students and needed to be modified. Together the
intervention and control group teachers created a graphic organizer. The graphic
organizer however was only used in the intervention group. Students received a
laminated graphic organizer with an example problem worked out to use as a guide.
The dependent variable in this study was a curriculum - based assessment created
by both teachers involved in the study. The assessment was composed of ten open-ended
mathematical problems. Students needed a general knowledge of percentages, percent
change, and proportions. Along with the curriculum - based assessment, students were
asked to complete five yes or no questions to demonstrate their use of strategies. They
were asked to complete this survey after they answered questions one, three, five, seven,
and nine.
In this study, a control group and an intervention group were assigned to analyze
the effects of Solve It!, a research based cognitive strategy instruction that was modified
with the use of a graphic organizer. The intervention was implemented over a three week

6
period. It is hypothesized that students who receive Solve It! instruction will perform
better on a post - test than students receiving instruction they have typically seen in their
school career. If my hypothesis is correct, it could change how we teach math in the high
school resource classroom where the instruction is implemented. This instruction could
provide teachers with a more structured way to teach and analyze algebraic word
problems and give students more strategies to use when problem solving.
7
Chapter 2
Literature Review
Learning Disabilities and Math
The process of teaching mathematics to school - aged children has drastically
changed in the last twenty years. While processes such as memorization skills and
manipulation of formulas is still prevalent, curriculums across the country are now
adhering to the Core Content Standards that demand increased academic rigor in the math
classroom including the absract thinking needed to solve word problems. For a student
with learning disabilities, mathematical problem solving is extremely difficult because it
requires them to apply knowledge of skills and strategies to novel problems (Fuchs,
Fuchs, Finelli, Courey & Hamlet, 2004). These students often fall into a trap as being
seen as incompetent problem solvers because they cannot perform the necessary steps to
successfully complete in depth mathematical problems. Mathematical word problems
continue to be a struggle for under achieving learners because of the complexity where
the correct solution depends on the accuracy of previous steps (Jitendra, Griffin,
Deatline-Buchman, & Sczesniak, 2007). Given that students with learning disabilities
have difficulties with rigorous expectations in the classroom due to their unique learning
characteristics, modifications need to be implemented in the way they are presented
information (Maccini, Mulcahy, & Wilson).
Cognitive Strategy Instruction
Cognitive strategy instruction can significantly improve problem solving in
students with learning disabilities (Chung & Tam, 2005). As the academic curriculum
8
changes, so must the instruction provided. Gone are the days where a teacher can
demonstrate procedures in a full classroom setting and then provide time for drill and
practice (Montague, Warger, & Morgan, 2000). With the 21st century classroom
becoming more and more inclusive, alternate teaching strategies need to be adapted.
Tiered instruction along with differentiated instruction has paved the way for the new
special education. Districts around the country are providing students with the Response
to Intervention (RTI) program to help alleviate struggles in the early school years so
success can be attained down the road. The RTI method has three phases. The first tier
provides students with high quality classroom instruction with screenings and group
interventions. The second tier is for students who do not progress in tier one and
provides for targeted interventions where a special education teacher assists in
instruction. If students fail to progress in this tier, they move to tier three where intensive
interventions are put into place as well as comprehensive evolutions of the student.
Providing students with multiple outlets to understand topics is becoming the new norm.
Using tiered lessons and assignments in classrooms allows the children to learn at their
level. Other interventions that have been found to improve mathematical problem
solving include peer mediated interventions, technology assisted instruction and teaching
self-monitoring techniques (Maccini, Mulcahy, & Wilson, 2007).
A review of literature from Macccini, Mulcahy and Wilson from 1995-2006
contained twenty-three articles that demonstrated significant outcomes for secondary
mathematics students of both average intelligence and students with learning disabilities.
They concluded through their literature review that mnemonic strategy instruction,
cognitive strategy instruction, schema-based instruction and video-disc instruction was
9
beneficial to students with learning disabilities. In 2008, Marjorie Montague compiled
seven studies on self- regulation and cognitive instruction in the mathematics classroom
to determine its effectiveness. Self –regulation is defined as the ability to regulate ones
cognitive activities. The process looked at how to increase student’s cognitive processes
and improve academic performance (Montague, 2008). Studies conducted by Graham
and Harris (2003), Cassel and Reid (1996), Hutchinson (1993), and Chung and Tam
(2005) all used modifications of Montague’s cognitive routine and reported positive
results in cognitive strategy instruction (Montague, 2008). Through the review of
literature Montague believed that cognitive strategies, whether cognitive or meta-
cognitive, would improve mathematical problem solving in students with Learning
Disabilities (Montague, 2008).
For this study, the focus is on cognitive strategy instruction. It is important to
understand how individuals process and acquire information to effectively teach
cognitive strategy instruction. If executed properly, cognitive strategy instruction can be
a favorable alternative to typical classroom instruction (Montague, 1997). A meta-
analysis conducted by Swanson that reviewed research over thirty years concluded that
the two most effective interventions for students with Learning Disabilities were direct
instruction and cognitive strategy instruction (Swanson, 1999).
The purpose of a study conducted by Montague, Enders and Dietz in 2011 was to
measure the effects of cognitive strategy instruction on math problem solving in middle
school aged students with learning disabilities by implementing a research-based
interventional program in inclusive general education classes. Twenty - four schools in
Miami took part in the study. Of the twenty four schools, eight were assigned the
10
intervention while sixteen were not. The intervention group contained 319 students while
the comparison group had 460 students. Seventy-eight students had learning disabilities,
344 were low achieving, and 357 were average achieving students. There were 359 boys
and 420 girls. Of this population, fifty-five were Caucasian, 497 were Hispanic, 213
were African American, eight were Asian, and six were categorized as “other”. A total of
563 students were receiving free or reduced lunch (Montague, Enders, & Dietz, 2011).
The experimenter was attempting to measure student’s ability to acquire, apply, maintain
and generalize math problem solving processes, strategies and skills (Montague, Enders,
& Dietz, 2011). This was measured by the administration of curriculum based
measurements six times, specifically a baseline and then approximately monthly for the
remainder of the school year. The curriculum - based measurements were only
administered four times to the comparison group specifically a baseline and then at the
third, fifth, and final administrations. The intervention provided was Solve It!, a program
designed to improve mathematical problem solving of middle school students with
Learning Disabilities. Solve It!, is a comprehensive strategic routine consisting of seven
cognitive processes (read, paraphrase, visualize, hypothesize, estimate, compute, and
check). The teachers implementing Solve It! instruction were given scripted lessons to
teach that incorporated the seven step process. Solve It! encorporates explicit instruction
in problem solving where highly structured lessons and guided practice are key. While
incorporating the intervention, teachers were instructed to provide immediate and
corrective feedback on performance as well as give positive reinforcement (Montague,
Warger, & Morgan, 2000). Students benefit from positive reinforcement when practicing
problem solving so they know what strategies and behaviors will guide them to further
11
success. Teachers in the comparison group were instructed to conduct business as usual
except for giving the curriculum - based measurements. The results indicated that
students who received the intervention showed significantly greater growth in math
problem solving over the school year than students in the comparison group. The data
collected showed that students in the comparison group had a mean score in the
beginning of the study of 53 and their final mean was a 56. Students in the intervention
group reported a mean score of 50 in the beginning of the study and their final mean
score was a 65. Students with learning disabilities outperformed all ability groups in the
comparison study, even the average achieving students, by the end of the school year on
the curriculum based measurement. The authors stated that the findings of the study
concluded that adopting reading and mathematics programs that research has shown to be
effective in the inclusive classroom along with progress monitoring is what is most
beneficial for students with Learning Disabilities (Montague, Enders, & Dietz, 2011).
A study conducted in 2012 by Krawec, Huang, Montague, Kressler and Melia de
Alba looked at the effectiveness of the Solve It! strategy instruction on students’
knowledge of math problem solving strategies. The researchers wanted to determine if a
cognitive strategy routine improved the strategic knowledge of math problem solving.
The study was conducted to measure the effectiveness of cognitive instruction along with
assisting students solving problems using a seven step method. The study consisted of
161 seventh and eighth grade students. Seventy-eight of the students had a learning
disability, while eighty-three were average achieving students. There were ninety-two
seventh graders and seventy-nine eight graders. Of the 161 participants, eighty-two were
male and seventy-nine were female. In terms of ethnicity, ninety - six students were
12
Hispanic, forty-three students were African American, seventeen students were White,
and five students were categorized as “other”. There were 111 students on free and
reduced lunch plans. The focus of this three year study was to investigate change in
students’ math problem solving performance following Solve It! instruction. The Math
Problem Solving Assessment (MPSA) was used to measure student outcomes. The
MPSA is a structured interview that consists of three word problems and thirty-four other
items selected from a larger version (Krawec, Huang, Montague, Kressler & Alba, 2012).
Students responded to five statements using a five point Likert scale and then solved the
math word problems. Solve It! instruction was given to the intervention group which
included scripted lessons and direct instruction. Teachers implementing the cognitive
based strategy instruction attended a three day professional development workshop prior
to the beginning of the school year (Krawec, Huang, Montague, Kressler & Alba, 2012).
Three days of intensive cognitive strategy instruction were implemented first and then
continued once weekly for thirty minute problem solving practice sessions (Krawec,
Huang, Montague, Kressler & Alba, 2012). Throughout this process, the Solve It!
instructional manual was used which included scripted lessons, materials and
manipulatives. The comparison group was instructed to conduct their classroom
normally. The students who received the intervention reported using significantly more
strategies than students in the comparison group (Krawec, Huang, Montague, Kressler &
Alba, 2012). Average achieving students reported using significantly more strategies
than students with a learning disability as well (Krawec, Huang, Montague, Kressler &
Alba, 2012). Analysis showed that the intervention group improved significantly from
pretest to posttest on their reported strategy use (p < .001), but the comparison group did
13
not (p=1.30) (Krawec, Huang, Montague, Kressler & Alba, 2012). The intervention
group reported a pretest m of 15.78 and a post - test m of 17.43 while the comparison
group showed a pretest m of 15.19 and a post - test m of 14.16 (Krawec, Huang,
Montague, Kressler & Alba, 2012). Through this research, it is concluded that Solve It!,
appears to improve students problem solving accuracy by increasing their range of
effective strategies, providing them with knowledge and confidence to successfully solve
problems.
The previous two studies were follow – ups to a smaller scale study done by
Montague, Warger and Morgan in 2000. In this study only eight-four students
participated from the Miami area. The study had a control group and intervention group.
Students in the intervention group were taught Solve It! instruction in small groups and
had to complete a ten question assessment. Results showed that students with Learning
Disabilities in the intervention group outperformed average achieving students in the
control group (Montague, Warger, & Morgan, 2000). The three studies reviewed on
Solve It! instruction all had positive results for those participating in the intervention,
which led me to want to try a modified version of it in my classroom. The positive
results for students with Learning Disabilities using this strategy has prompted me to
include this instruction in a secondary resource mathematics setting.
In 2001, Montague teamed up with Candace Bos to investigate the effect of an
eight-step cognitive strategy on verbal math problem solving. Six adolescents between
the ages of 15 and 19 were selected from remediation classes in an Arizona high school
(Montague & Bos, 2001). The student’s full-scale IQ scores were between 85-115
(which is in the normal range) on the Wechsler Intelligence Scale for Children Revised
14
(WISC-R). There were five males and one female. The subjects were given a baseline
assessment of ten questions and then re-assessed every two weeks for three months. The
cognitive strategy instruction provided was an eight step process to train the students in
verbal math problem solving. For each question the students were asked to read the
problem aloud, paraphrase the problem aloud, visualize, state the problem, hypothesize,
estimate, calculate, and self-check. Five of the six subjects made progress after receiving
the intervention on the teacher based assessment (Montague & Bos, 2001). All but one
subject showed an increase of five to six correct questions from the baseline to their
current learning. This study just adds to a plethora of research that states that cognitive
strategy instruction is a useful alternative to teach math problem solving.
Strategy based intervention has also been studied on students who are identified
as having emotional or behavioral disorders. It is a constant struggle to educate children
who exhibit these disorders because of the individual backgrounds they sometimes come
from. Students classified as having emotional disorders are typically performing below
grade level and make less progress then the typical developing student (Alter, Brown, &
Pyle). A study was conducted which used multiple baselines across participants for three
elementary school aged children. These children were identified as being Emotionally
Disturbed. It was conducted in a self-contained classroom in a public school in a
Midwestern city. There were two male participants and one female participant. All three
students were African American. Subject 1 was in fourth grade and was nine years old.
He had an overall IQ of 67, as measured on the WISC III. Subject 2 was a fourth grade
male who also was nine years old. He was diagnosed as Emotionally Disturbed, but also
with a specific learning disability in reading comprehension. He had an overall IQ of 89
15
on the WISC III. Subject 3 was a first grade female who was seven years old. She had
an IQ of 101, as measured on the WISC III (Alter, Brown, & Pyle, 2011). Baseline data
was collected by students completing a curriculum - based measurement on percent word
problems as well as the percentage of time on-task during work sessions. The teacher
involved in the intervention attended a training workshop on how to implement teaching
strategies to guide students in math problem solving. The teacher delivered explicit and
systematic instruction in fifteen minute intervals to the students using cognitive strategies
learned at the workshop. Certain strategies that were followed were modeled problem
solving, reviewing critical problem solving strategies, and providing rationales for
becoming better problem solvers. Following the lesson, the students completed 5 word
problem worksheets. After the intervention took place, the students took a post
assessment. Subject 1 increased from a 23% to a 52% from his baseline assessment, as
well as increasing his on task behavior from 54% to 86%. Subject 2 increased from a
14% to a 50% from his baseline assessment, as well as increased his on - task behavior
from 62% to 85%. Subject 3 increased from 18% to a 48% from her baseline assessment,
as well as increasing her on task behavior from 67% to 87% (Alter, Brown, & Pyle,
2011). While the study was small and in a highly contained area, it still demonstrated
positive results with using a cognitive strategy instruction with students who are
Emotionally Disturbed. This study piloted what I hope to be more research in the area of
math problem solving of students who are emotionally disturbed.
Graphic Organizers
Graphic organizers are an instructional tool in which students create a pictorial
representation of what they are learning (Zollman, 2012). They can be used to sequence
16
events, assist in comprehension and aid in putting thoughts down on paper. Many
students with learning disabilities already have a difficult time with organizational skills.
When students enter their mathematics classroom, it is assumed they can read and
comprehend complex word problems before even attempting to know the functions,
operations and rules to solve the problems. This however is not always the case. In the
current study, a graphic organizer was used to help students pull out the important
information in word problems and make hypotheses on the task at hand. With the
implementation of the Partnership for Readiness for College and Careers (PARCC)
exams, improving mathematical problem solving skills is the most important job of a
math teacher (Zollman, 2012). The PARCC implements more critical thinking and
complex word problems than previous tests administered statewide. Students need to be
systematically and explicitly taught how to focus on these problems and increase their
repertoire of problem solving strategies. As educators, we need to provide students the
tools needed to solve complex mathematical problems they encounter in the 21st century
classroom. This includes exposing and teaching the students how to use the proper
technology to perform on the exam, attaining the appropriate skills to solve the problems,
and fostering the knowledge needed to be a successful problem solver.
When a student first reads a mathematical word problem they must first sort the
information as essential and non-essential to solving the problem (Zollman, 2012).
Graphic organizers assist students in sorting out this information as well as devising a
plan to carry out operations to solve the problem. The potential for graphic organizers to
assist students with disabilities in math class is endless, but needs to be developed
17
carefully and concisely. In the current study, the graphic organizer created was done so
by modifying the cognitive strategy instruction Solve It!.
Reading mathematical world problems is a complex task. There is a combination
of words, numbers, letters, symbols and graphics that the students must comprehend
(Braselton & Decker, 1994). The PARCC assessment claims that each problem is written
at a 7th
grade reading level for Algebra 1 students (PARCC). Many students with
disabilities are not achieving a 7th
grade reading level by the time they are in the 9th
grade
and taking Algebra 1. This makes the math teacher encounter another obstacle in training
proficient math problem solvers. A study done by Maffei in 1973 found that reading
teachers were more effective in teaching word problems to students than mathematics
teachers (Maffei , 1973). Math teachers immediately recognize the numbers or
operations needed to solve the problem while a reading teacher may focus more on the
student reading the passage word for word and comprehending the meaning. Districts
across the country have adapted writing across the curriculum for this very reason. As
school districts and government officials continue to push for mainstream classrooms in
mathematics, we must understand that not all students will be at the reading competence
level of that grade level (Ives, 2007).
The use of a graphic organizer can help reduce the stress for a student who has
difficulty in reading and instead have them focus on the mathematical terminology,
numbers, and operations to successfully solve word problems (Ives, 2007). In the current
study, the graphic organizer was created by the intervention and control group teachers to
ensure its usefulness in solving word problems involving percent and proportions.
Research on Geary’s three different subtypes related to dyscalculia confirmed a
18
relationship between language skills and mathematical skills (Ives, 2007). Geary
conducted research by reviewing previous literature and found that dyscalculia was
driven by three subtypes including having difficulties in fact retrieval, learning strategies
or procedures, or experiencing visual spatial difficulties that hindered their progress
(Educeri, 2004). Students in the 21st century classroom are asked to have adequate
language and mathematical skills to pass statewide assessments. Graphic organizers can
assist in carrying the burden of reading laborious word problems and break them down
into simpler equations or expressions. An article published by Ives and Hoy in2003
looked at suggestions for modifying graphic organizers so they could be used in the 21st
century math classroom where higher level thinking and more difficult problems are the
norm. They concluded through their review that graphic organizers for the math
classroom should contain three things. First, the content of the graphic organizer must
not be too wordy and contain mathematical analogues. Second, the spatial arrangement
must be connected to the topic at hand. Lastly, the graphic organizer should not be a
substitute for instruction but rather incorporated along with systemic and explicit
instruction (Ives & Hoy, 2003).
Four years after the article published by Ives and Hoy, Ives himself conducted a
study in 2007 on the effectiveness of graphic organizers in the secondary Algebra
classroom. A two group experimental design was used to determine the effectiveness of
using graphic organizers to solve linear equations (Ives, 2007). The study took place in
Georgia in a private school. The school consisted of students in sixth through twelfth
grade. All students either had a learning disability or attention problems (Ives, 2007).
Fourteen students participated in the intervention group that received the graphic
19
organizers. Ten of the students were male and four of the students were female. The
control group consisted of sixteen students in which eleven were male and five were
female. There was one Asian-American student in the intervention group and all other
students were Caucasian. The control group consisted of all Caucasians. The
intervention group was systemically instructed to use graphic organizers in completing
system of equations problems while the control group was told to do business as usual.
Two weeks after instruction was delivered the students completed a teacher-generated
assessment. The intervention group had a mean score that was statistically significantly
higher than the mean score for the control group on the teacher-generated assessments
(F= 3.14, p = .087) (Ives, 2007). The results of the study showed that students who were
exposed to and systemically taught how to use a graphic organizer scored better on an
assessment than students who did not use a graphic organizer (Ives, 2007). While more
research is needed in this area, the positive results in this study are a step in the right
direction to assist students in solving word problems. This research is why I have
decided to include a graphic organizer into the study to assist in determining the
effectiveness of cognitive strategy instruction on math problem solving in the high school
classroom.
In summary, it is apparent that instruction in the 21st century classroom must
adapt to the academic and curricula changes ahead. With the implementation of the Core
Content Standards and PARCC, statewide assessments have evolved in containing more
complex mathematical problems. Students need to be exposed to different approaches
and techniques to assist in solving these problems. Positive results through research have
shown that cognitive strategy instruction and graphic organizers assist students with
20
Learning Disabilities in solving mathematical problems. In a mini study I conducted in
2013, I observed that the intervention Solve It!, while beneficial to students with learning
disabilities, was to laborious for them to get through on a consistent basis. Therefore, a
modified version of the Solve It! program will be used with a graphic organizer to assist
students in mathematical problem solving.
21
Chapter 3
Methodology
Setting and Participants
This study took place in two Math Foundations 3 self-contained classrooms in a
high school in New Jersey. The course covers the last third of Algebra 1 (Chapters 7-10
of the McDougall Littell Algebra 1 textbook, 2012). Topics that are covered include
percentages, proportions, exponents, factoring, polynomials and quadratic expressions.
The pre-requisite for the class is passing Math Foundations 1 & 2, which covers chapters
one through six of the Algebra 1 textbook. The intervention group started with sixteen
students, but by the end of the study had thirteen students. Two students dropped the
course due to withdrawing from the school and one student was transferred to another
self – contained classroom. The first class met from 8:20 a.m. to 9:04 a.m., while the
second class met from 9:08 a.m. to 9:54 a.m. There was one special education teacher in
the intervention classroom. Students were seated in columns facing the Smartboard in
the classroom, with no students further than three rows back. The control group, who
was instructed to conduct business as usual, also took place in two classrooms but was a
Math Foundations 2 class. Math Foundations 2 is a course designed for the middle third
of the Algebra 1 textbook (Chapters 4-6 of the McDougall Littell Algebra 1 textbook).
Topics that are covered include percentages, proportions, solving equations, graphing
linear equations and inequalities. The control group both started and finished with
sixteen students. The control group classes met from 7:25 to 8:10 a.m. and 1:15 to 1:59
a.m. The teachers in both classes taught percentages, percent of change and proportions
for the purpose of this study. As stated previously, students in the current study were
22
classified as Specific Learning Disability, Other Health Impaired, Emotionally Disturbed
and Multiply Disabled.
Procedure
The intervention began by students completing a baseline assessment created by
the intervention and control group teacher using KUTA software, as well as a McDougall
Littell Algebra 1 textbook by Larson, Boswell, Kanold & Stiff. KUTA is a mathematics
program that creates algebraic problems and answer keys to go along with them. The
baseline assessment contained ten problems which included mathematical concepts such
as percentages, percent of change and proportions. After students completed each pretest
problem, they answered a survey consisting of three questions. On this survey, students
identified if they used a strategy to solve the problem, if they comprehended the question
and if they checked their answer. The test had a time limit of forty-five minutes and all
students were able to complete the assessment. The intervention and control group
teachers created a rubric together to grade the baseline assessments. Students received
full credit or three points if they correctly solved the problem, two points if they had the
correct setup but had minor mathematical errors, one point if they correctly setup the
problem but failed to attempt to solve it and zero points for not addressing the problem.
In the twenty-six day study, the intervention group was instructed by using a
modified version of the Solve It! Instruction method. The Solve It! process was
shortened from seven to five steps. The two steps that were eliminated included when the
students had to paraphrase the problem and visualize the problem by creating
representations that depict relationships among the problem parts. In my previous
23
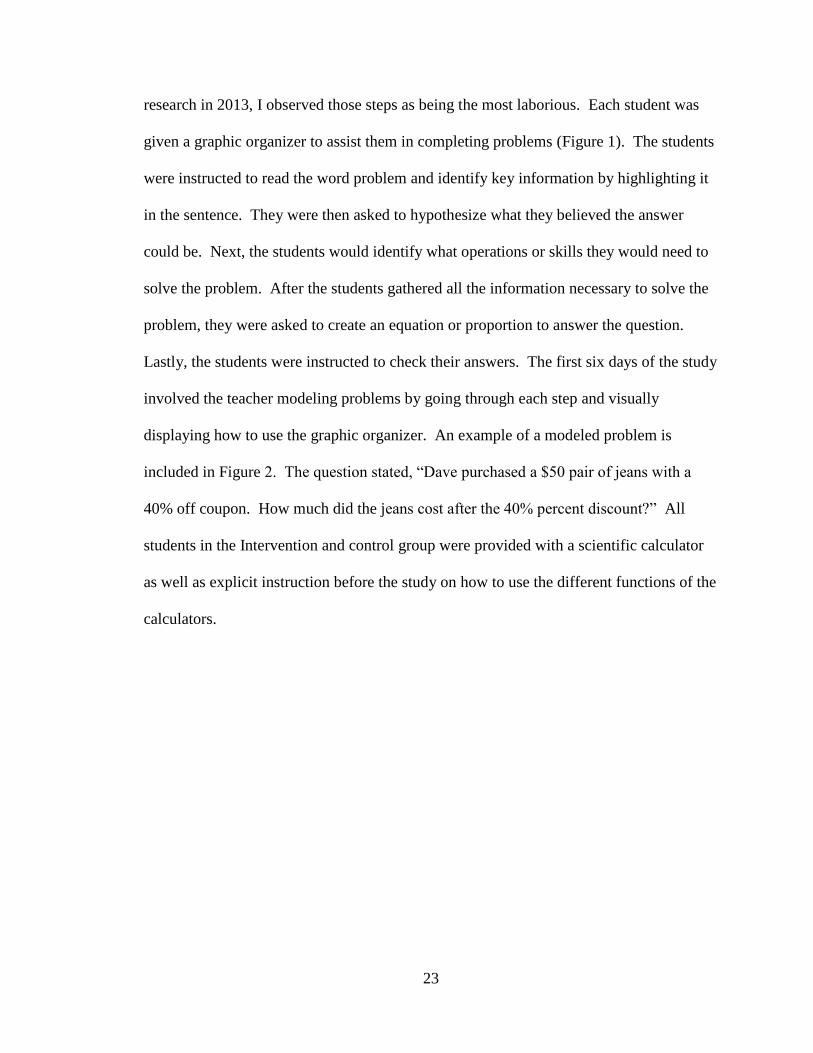
research in 2013, I observed those steps as being the most laborious. Each student was
given a graphic organizer to assist them in completing problems (Figure 1). The students
were instructed to read the word problem and identify key information by highlighting it
in the sentence. They were then asked to hypothesize what they believed the answer
could be. Next, the students would identify what operations or skills they would need to
solve the problem. After the students gathered all the information necessary to solve the
problem, they were asked to create an equation or proportion to answer the question.
Lastly, the students were instructed to check their answers. The first six days of the study
involved the teacher modeling problems by going through each step and visually
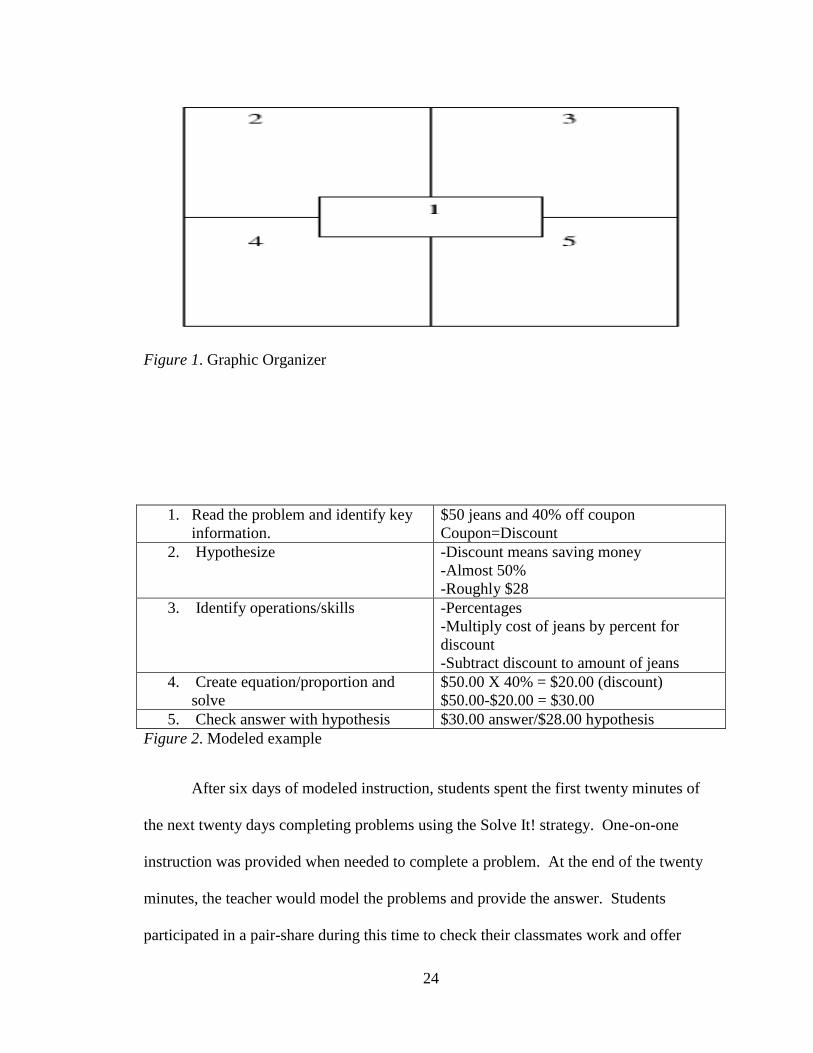
displaying how to use the graphic organizer. An example of a modeled problem is
included in Figure 2. The question stated, “Dave purchased a $50 pair of jeans with a
40% off coupon. How much did the jeans cost after the 40% percent discount?” All
students in the Intervention and control group were provided with a scientific calculator
as well as explicit instruction before the study on how to use the different functions of the
calculators.
24
Figure 1. Graphic Organizer
Figure 2. Modeled example
After six days of modeled instruction, students spent the first twenty minutes of
the next twenty days completing problems using the Solve It! strategy. One-on-one
instruction was provided when needed to complete a problem. At the end of the twenty
minutes, the teacher would model the problems and provide the answer. Students
participated in a pair-share during this time to check their classmates work and offer
1. Read the problem and identify key
information.
$50 jeans and 40% off coupon
Coupon=Discount
2. Hypothesize -Discount means saving money
-Almost 50%
-Roughly $28
3. Identify operations/skills -Percentages
-Multiply cost of jeans by percent for
discount
-Subtract discount to amount of jeans
4. Create equation/proportion and
solve
$50.00 X 40% = $20.00 (discount)
$50.00-$20.00 = $30.00
5. Check answer with hypothesis $30.00 answer/$28.00 hypothesis
25
suggestions to them if they got the problems wrong. Once a week for twenty five
minutes, students worked on the ALEKs computer program. ALEKs is a mathematics
based program that assists students in closing the achievement gap. It is an artificial
intelligence program where no two students are on the same problem at one time. This
program assists the teacher in tiering and differentiating instruction.
The control class conducted business as usual, but solved the same problems the
intervention group did during the experiment. The teacher started each day with a guided
warmup. She would then introduce the lesson using the Smartboard and students would
take notes. After notes were completed, students were given a worksheet to complete
independently. The teacher circulated the room answering any questions the students
may have had. At the end of the period, the control teacher would give the students an
exit ticket. On the exit ticket, the students would have to solve a problem based of the
day’s notes and explain in words how they came to their solution. The teacher would
then collect the exit ticket as the students left the classroom and provide one-on-one
instruction the following day based off of the results of the exit ticket. The control group
also used the ALEKs computer program once a week for twenty five minutes to assist
students in closing the achievement gap. The control group’s afternoon class had to meet
in a computer lab and not the daily class setting due to technology issues.
Variables
The independent variable for this was study was a modified version of the
program Solve It!. Students utilized a graphic organizer while going through five of the
seven steps of Solve It!. The dependent variable for this study was a curriculum based

26
assessment created by both teachers involved in the study. The assessment was
composed of ten open-ended mathematical problems. Teachers used KUTA software as
well as a McDougall Littell Algebra 1 textbook to create the assessment.
27
Chapter 4
Results
Summary
In this study, the effects of cognitive strategy instruction in the high school
mathematics classroom were analyzed. Four classes participated in the study, with two
classes receiving the intervention and two classes acting as a control group, with the
teacher conducting class as usual. The intervention implemented was the Solve It!
strategy instruction model with a graphic organizer. The research questions to be
answered were:
1. Do students who are provided with extensive cognitive based strategy
instruction along with a graphic organizer to organize problem details instead of
conventional instruction perform better on a curriculum - based measurement?
2. After solving problems on a post test, will students report that they understood
the question, utilized an appropriate problem-solving strategy, and checked their answer?
The study began with students completing a baseline assessment created by the
intervention and control group teachers using KUTA software, as well as a McDougall
Littell Algebra 1 textbook by Larson, Boswell, Kanold & Stiff. The baseline contained
ten problems that included mathematical concepts such as percentages, percent of change
and proportions. The test had a time limit of forty-five minutes and all students were able
to complete the assessment.
28
Group Baseline Results
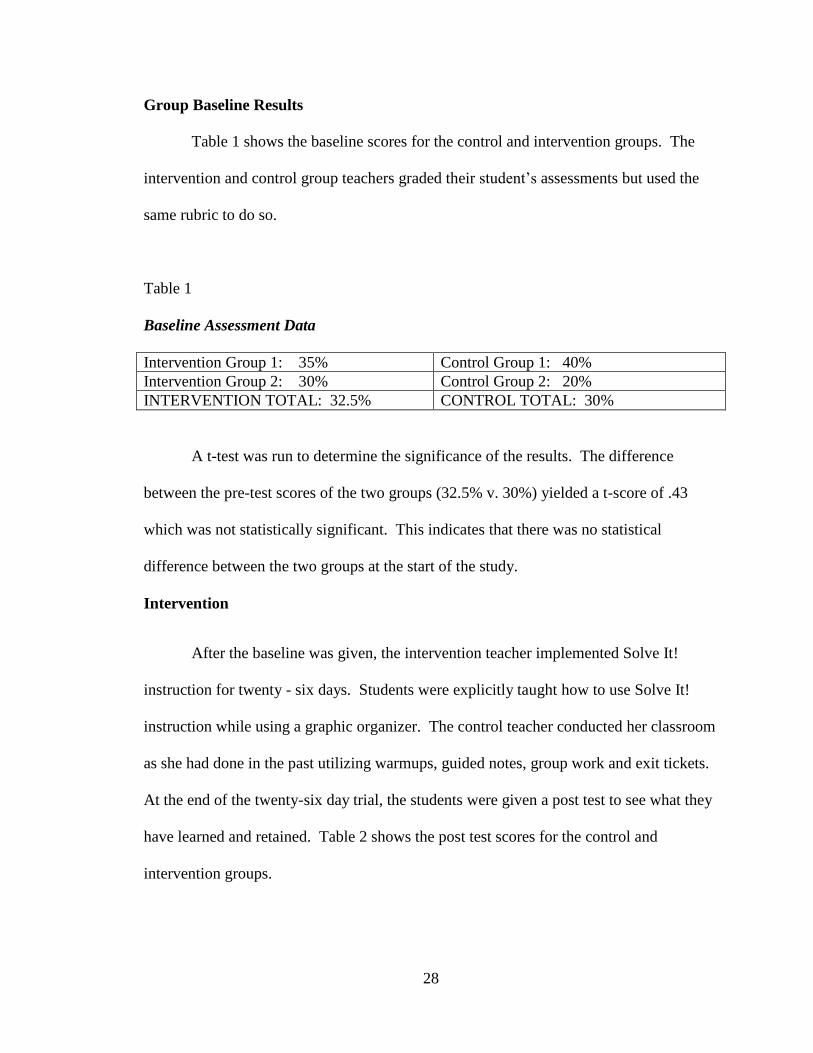
Table 1 shows the baseline scores for the control and intervention groups. The
intervention and control group teachers graded their student’s assessments but used the
same rubric to do so.
Table 1
Baseline Assessment Data
Intervention Group 1: 35% Control Group 1: 40%
Intervention Group 2: 30% Control Group 2: 20%
INTERVENTION TOTAL: 32.5% CONTROL TOTAL: 30%
A t-test was run to determine the significance of the results. The difference
between the pre-test scores of the two groups (32.5% v. 30%) yielded a t-score of .43
which was not statistically significant. This indicates that there was no statistical
difference between the two groups at the start of the study.
Intervention
After the baseline was given, the intervention teacher implemented Solve It!
instruction for twenty - six days. Students were explicitly taught how to use Solve It!
instruction while using a graphic organizer. The control teacher conducted her classroom
as she had done in the past utilizing warmups, guided notes, group work and exit tickets.
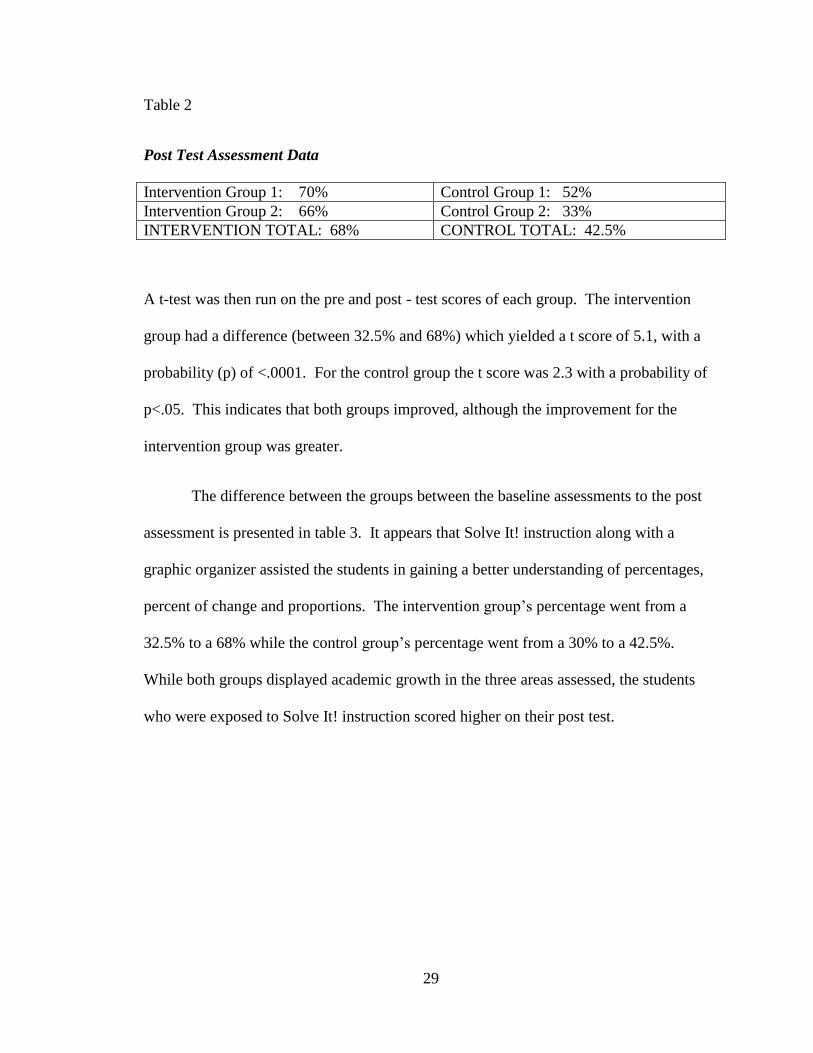
At the end of the twenty-six day trial, the students were given a post test to see what they
have learned and retained. Table 2 shows the post test scores for the control and
intervention groups.
29
Table 2
Post Test Assessment Data
Intervention Group 1: 70% Control Group 1: 52%
Intervention Group 2: 66% Control Group 2: 33%
INTERVENTION TOTAL: 68% CONTROL TOTAL: 42.5%
A t-test was then run on the pre and post - test scores of each group. The intervention
group had a difference (between 32.5% and 68%) which yielded a t score of 5.1, with a
probability (p) of <.0001. For the control group the t score was 2.3 with a probability of
p<.05. This indicates that both groups improved, although the improvement for the
intervention group was greater.
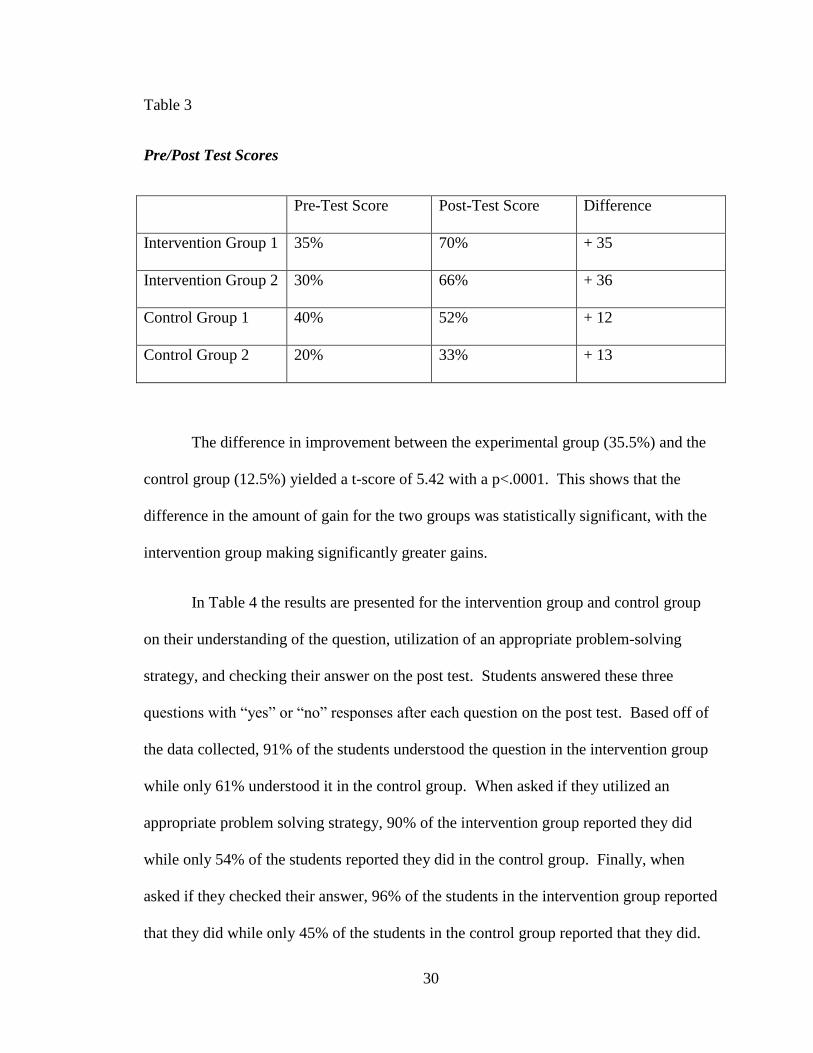
The difference between the groups between the baseline assessments to the post
assessment is presented in table 3. It appears that Solve It! instruction along with a
graphic organizer assisted the students in gaining a better understanding of percentages,
percent of change and proportions. The intervention group’s percentage went from a
32.5% to a 68% while the control group’s percentage went from a 30% to a 42.5%.
While both groups displayed academic growth in the three areas assessed, the students
who were exposed to Solve It! instruction scored higher on their post test.
30
Table 3
Pre/Post Test Scores
Pre-Test Score Post-Test Score Difference
Intervention Group 1 35% 70% + 35
Intervention Group 2 30% 66% + 36
Control Group 1 40% 52% + 12
Control Group 2 20% 33% + 13
The difference in improvement between the experimental group (35.5%) and the
control group (12.5%) yielded a t-score of 5.42 with a p<.0001. This shows that the
difference in the amount of gain for the two groups was statistically significant, with the
intervention group making significantly greater gains.
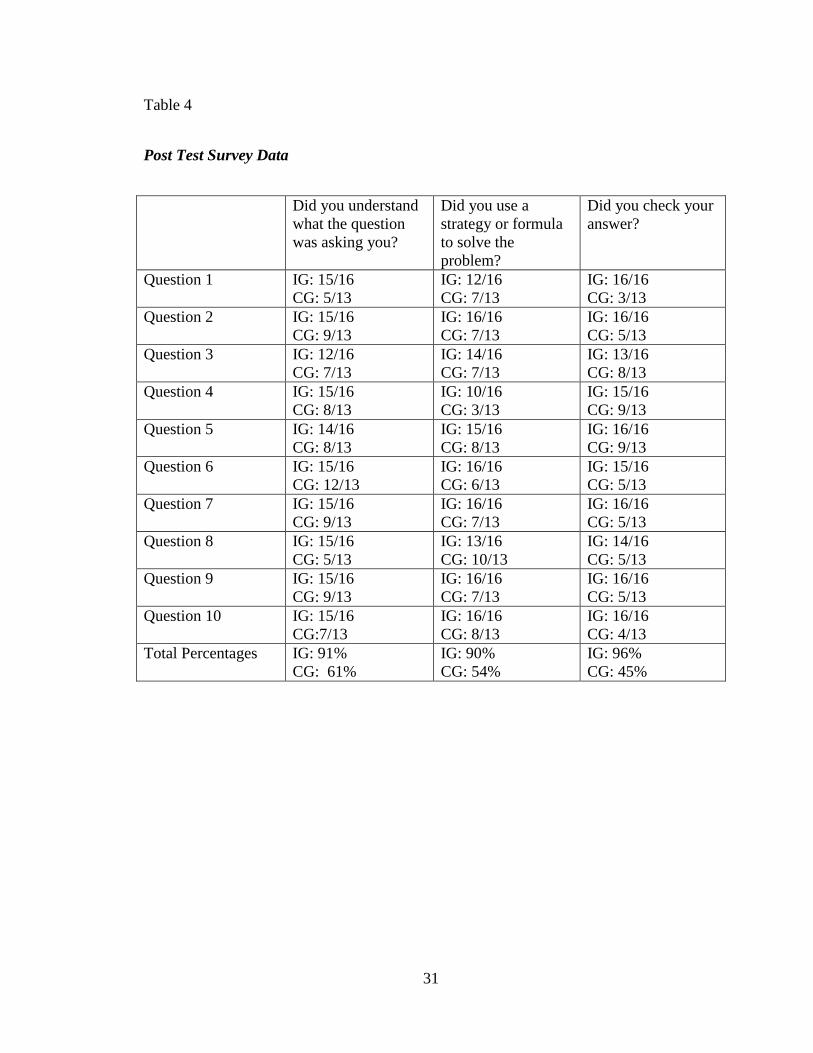
In Table 4 the results are presented for the intervention group and control group
on their understanding of the question, utilization of an appropriate problem-solving
strategy, and checking their answer on the post test. Students answered these three
questions with “yes” or “no” responses after each question on the post test. Based off of
the data collected, 91% of the students understood the question in the intervention group
while only 61% understood it in the control group. When asked if they utilized an
appropriate problem solving strategy, 90% of the intervention group reported they did
while only 54% of the students reported they did in the control group. Finally, when
asked if they checked their answer, 96% of the students in the intervention group reported
that they did while only 45% of the students in the control group reported that they did.
31
Table 4
Post Test Survey Data
Did you understand
what the question
was asking you?
Did you use a
strategy or formula
to solve the
problem?
Did you check your
answer?
Question 1 IG: 15/16
CG: 5/13
IG: 12/16
CG: 7/13
IG: 16/16
CG: 3/13
Question 2 IG: 15/16
CG: 9/13
IG: 16/16
CG: 7/13
IG: 16/16
CG: 5/13
Question 3 IG: 12/16
CG: 7/13
IG: 14/16
CG: 7/13
IG: 13/16
CG: 8/13
Question 4 IG: 15/16
CG: 8/13
IG: 10/16
CG: 3/13
IG: 15/16
CG: 9/13
Question 5 IG: 14/16
CG: 8/13
IG: 15/16
CG: 8/13
IG: 16/16
CG: 9/13
Question 6 IG: 15/16
CG: 12/13
IG: 16/16
CG: 6/13
IG: 15/16
CG: 5/13
Question 7 IG: 15/16
CG: 9/13
IG: 16/16
CG: 7/13
IG: 16/16
CG: 5/13
Question 8 IG: 15/16
CG: 5/13
IG: 13/16
CG: 10/13
IG: 14/16
CG: 5/13
Question 9 IG: 15/16
CG: 9/13
IG: 16/16
CG: 7/13
IG: 16/16
CG: 5/13
Question 10 IG: 15/16
CG:7/13
IG: 16/16
CG: 8/13
IG: 16/16
CG: 4/13
Total Percentages IG: 91%
CG: 61%
IG: 90%
CG: 54%
IG: 96%
CG: 45%
32
Chapter 5
Discussion
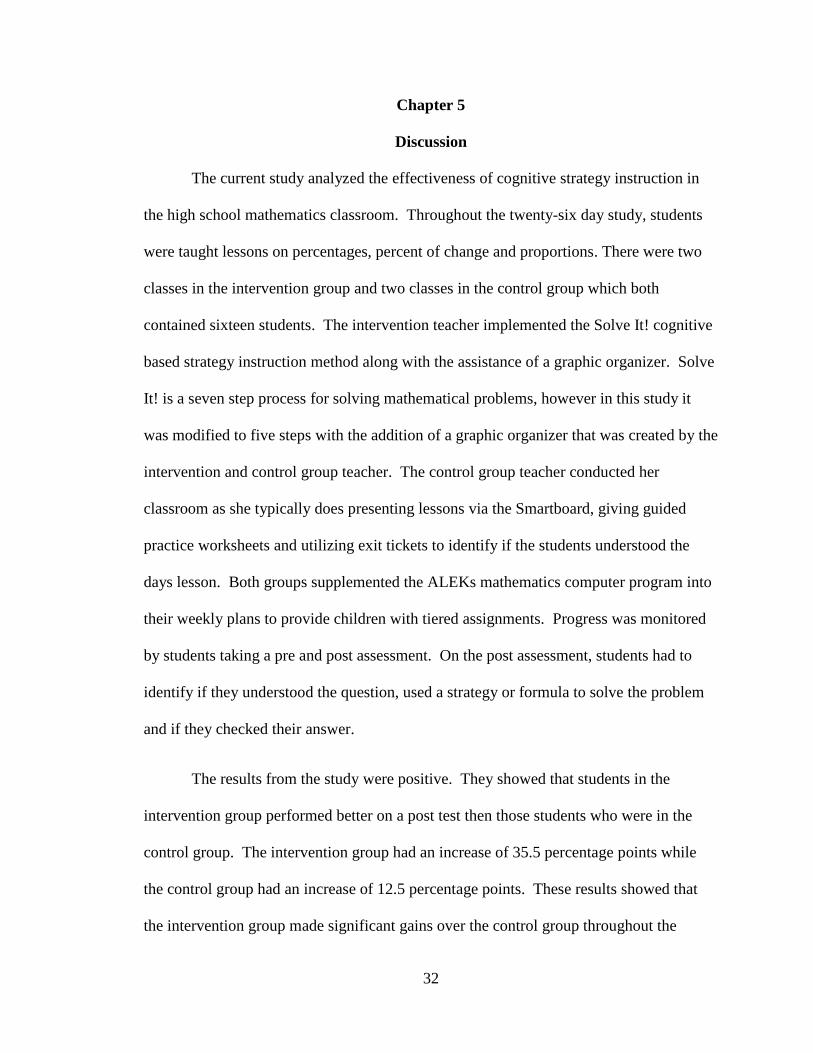
The current study analyzed the effectiveness of cognitive strategy instruction in
the high school mathematics classroom. Throughout the twenty-six day study, students
were taught lessons on percentages, percent of change and proportions. There were two
classes in the intervention group and two classes in the control group which both
contained sixteen students. The intervention teacher implemented the Solve It! cognitive
based strategy instruction method along with the assistance of a graphic organizer. Solve
It! is a seven step process for solving mathematical problems, however in this study it
was modified to five steps with the addition of a graphic organizer that was created by the
intervention and control group teacher. The control group teacher conducted her
classroom as she typically does presenting lessons via the Smartboard, giving guided
practice worksheets and utilizing exit tickets to identify if the students understood the
days lesson. Both groups supplemented the ALEKs mathematics computer program into
their weekly plans to provide children with tiered assignments. Progress was monitored
by students taking a pre and post assessment. On the post assessment, students had to
identify if they understood the question, used a strategy or formula to solve the problem
and if they checked their answer.
The results from the study were positive. They showed that students in the
intervention group performed better on a post test then those students who were in the
control group. The intervention group had an increase of 35.5 percentage points while
the control group had an increase of 12.5 percentage points. These results showed that
the intervention group made significant gains over the control group throughout the
33
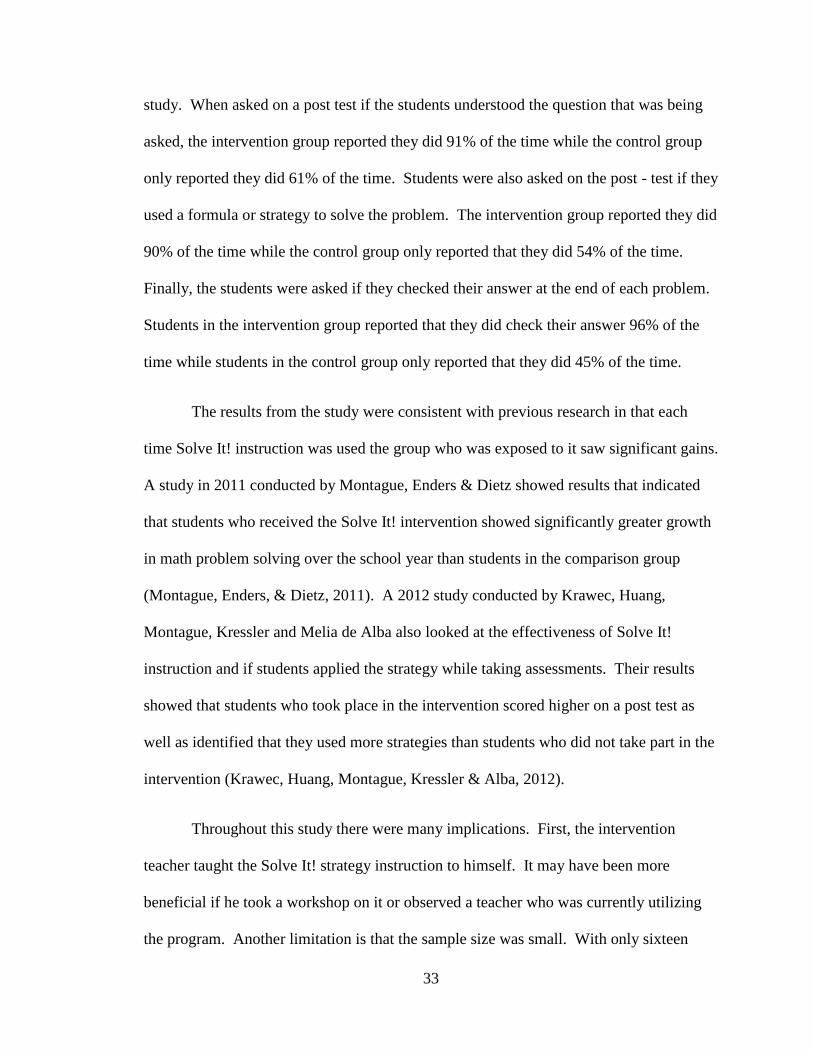
study. When asked on a post test if the students understood the question that was being
asked, the intervention group reported they did 91% of the time while the control group
only reported they did 61% of the time. Students were also asked on the post - test if they
used a formula or strategy to solve the problem. The intervention group reported they did
90% of the time while the control group only reported that they did 54% of the time.
Finally, the students were asked if they checked their answer at the end of each problem.
Students in the intervention group reported that they did check their answer 96% of the
time while students in the control group only reported that they did 45% of the time.
The results from the study were consistent with previous research in that each
time Solve It! instruction was used the group who was exposed to it saw significant gains.
A study in 2011 conducted by Montague, Enders & Dietz showed results that indicated
that students who received the Solve It! intervention showed significantly greater growth
in math problem solving over the school year than students in the comparison group
(Montague, Enders, & Dietz, 2011). A 2012 study conducted by Krawec, Huang,
Montague, Kressler and Melia de Alba also looked at the effectiveness of Solve It!
instruction and if students applied the strategy while taking assessments. Their results
showed that students who took place in the intervention scored higher on a post test as
well as identified that they used more strategies than students who did not take part in the
intervention (Krawec, Huang, Montague, Kressler & Alba, 2012).
Throughout this study there were many implications. First, the intervention
teacher taught the Solve It! strategy instruction to himself. It may have been more
beneficial if he took a workshop on it or observed a teacher who was currently utilizing
the program. Another limitation is that the sample size was small. With only sixteen
34
students in each group, the results could be skewed a little bit because of the lack of
participation. A few students dropped out of the study because their placement was
changed during the twenty-six day study. If I were to complete this study again in the
future, I would look to add regular education students and identify if they make greater
gains after learning Solve It! or if the focus should just be on children with special
education needs.
Overall, this study was a success and received the results that were hypothesized.
The intervention itself is very inexpensive and most educated people can teach
themselves the Solve It! cognitive strategy instruction process. It has become apparent
through many studies that the intervention works and needs to be put into place in more
classrooms for further research and development. Currently, I would focus the
instruction in the special education setting of schools to accommodate the needs of
students who lack a lot of the strategies needed to be proficient problem solvers. Most
general education students have a plethora of strategies at hand already and may not
benefit as much from this instruction. They may find it to be to laborious and time
consuming. However, for students with special needs the structured nature of Solve It!
instruction can help them identify key parts in mathematical word problems and solve
them using the process each time.
35
References
Alter, P., Brown, T., & Pyle, J. (2011). A strategy – based intervention to improve math
word problem solving skills of students with Emotional and Behavioral Disorders
Braselton, S., & Decker, B. (1994). Using graphic organizers to improve the reading of
mathematics. The Reading Teacher, 48 (3), 276-281.
Chung, K., & Tam, Y. (2005). Effects of cognitive-based instruction on mathematical
problem solving by learners with Mild Intellectual Disabilities. Journal of
Intellectual & Developmental Disability, 30 (4). doi:
10.1080/13668250500349409
Fuchs, L. S., Fuchs, D., Finelli, R., Courey, S. J., & Hamlett, C. L. (2004). Expanding
schema based transfer instruction to help third graders solve real-life
mathematical problems. American Educational Research Journal, 41 (1), 419-445
Haydon, T., Hawkins, R., Denune, H., Kimener, L., & McCoy, D. (2012). A comparison
of iPads and worksheets on math skills of high school students with Emotional
Disturbance. Behavioral Disorders, 37 (4), 232-243.
Ives, B., & Hoy, C. (2003). Graphic organizers applied to higher-level secondary
mathematics. Learning Disabilities Research and Practice, 18 (1), 36-51.
Ives, B., (2007). Graphic organizers applied to secondary algebra instruction for students
with learning disorders. Learning Disabilities Research and Practice, 22 (2),
110-118.
Jitendra, A. K., Griffin, C. C., Deatline-Buchman, A., & Sczesniak, E. (2007).
Mathematical word problem solving in third-grade classrooms. Journal of
Educational Research, 100, 283-302. doi: 10.2307/JOER.100.5.283-302
Krawec, J., Huang, J., Montague, M., Kressler, B., & Melia de Alba, A. (2012). The
effects of cognitive strategy instruction on knowledge of math problem solving
processes of middle school students with learning disabilities. Learning
Disabilities Quarterly, 26 (2), 80-92. doi: 10.1177/0731948712463368
Maccini, P., Mulcahy, C., & Wilson, M. (2007). A follow up of mathematics
interventions for secondary students with Learning Disabilities. Learning
Disabilities Research and Practice, 22 (1), 58-74.
Maffei, A. (1973). Reading analysis in mathematics. Journal of Reading, 16 (1), 546-
549.
Montague, M. (1997). Cognitive strategy instruction in mathematics for students with
Learning Disabilities. Journal of Learning Disabilities, 30 (2), 164-177.
36
Montague, M. (2008). Self-regulation strategies to improve mathematical problem
solving for students with Learning Disabilities. Learning Disabilities Quarterly,
(31), 37-44
Montague, M., & Bos, C. S. (2001). The effect of cognitive strategy training on verbal
math problem solving performance of learning disabled adolescents. Journal of
Learning Disabilities, 19 (1), 26-33.
Montague, M., & Dietz, S. (2009). Evaluating the evidence base for cognitive strategy
instruction and mathematical problem solving. Council for Exceptional Children,
75 (3), 285-302.
Montague, M., Enders, C., & Dietz, S. (2011). Effects of cognitive strategy instruction
on math problem solving of middle school students with learning disabilities.
Learning Disabilities Quarterly, 34 (4), 262-272. doi:
10.1177/0731948711421762
Montague, M., Warger, C., & Morgan, T. (2000). Solve It! strategy instruction to
improve mathematical problem solving. Learning Disabilities Research and
Practice, 15 (2), 110-116.
Schleicher, A., & Davidson, M. (2012). Programme for International Student
Assessment (PISA): Results from PISA 2012. Retrieved from
http://www.oecd.org/unitedstates/PISA-2012-results-US.pdf
Swanson, H. L., (1999). Interventions for students with Learning Disabilities: A meta
anaylsis of treatment outcomes. New York: Guilford Press.
Swiderski, S. (2011). Transforming principles into practice: Using cognitive active
learning strategies in the high school classroom. The Clearing House, 84 (1),
239-243. doi: 10.1080/00098655.2011.590549
Zollman, A. (2012). Write is right: Using graphic organizers to improve student
mathematical problem solving. Investigations in Mathematics Learning, 4 (3), 50-
60.