Embed Size (px)
Citation preview
The Effects of Climatic Variability on Estimatesof Recharge from Temperature Profilesby Grant Ferguson1 and Allan D. Woodbury2
AbstractUsing heat as a tracer allows for estimation of ground water recharge rates based on subsurface temperature
measurements. While possible in theory, it may be difficult in practice to discriminate the effects of climate fromthe effects of ground water advection. This study uses synthetic simulations to determine the influence of variabil-ity of ground surface temperature (GST) on the ability to estimate vertical specific discharge from temperatureprofiles. Results suggest that in cases where temperature measurements are sufficiently deep and specific dis-charge is sufficiently high, estimates of specific discharges will be reasonably accurate. Increasing the number oftimes temperatures are measured, or producing models that incorporate variations in GST, will increase the reli-ability of any studies using temperatures to estimate specific discharge. Furthermore, inversions of temperaturemeasurements should be combined with other methods of estimating recharge rates to improve the reliability ofrecharge estimates.
IntroductionLachenbruch and Sass (1977) state that ground water
flow is one of the largest obstacles in the correct estima-tion of heat flow. Conversely, the effect of ground waterflow on subsurface heat flow makes it possible to esti-mate specific discharge in some cases. Stallman (1963)and Bredehoeft and Papadopulos (1965) detailed the useof subsurface temperatures for estimating specific dis-charge in situations of one-dimensional ground waterflow. Similar techniques have been applied in variousstudies over the past four decades (e.g., Parsons 1970;Cartwright 1970; Reiter 2001; Ferguson et al. 2003).These techniques assume both steady-state thermal trans-port and ground water flow under saturated conditions.
The influence of climate on subsurface temperatureshas also been recognized since the first half of the 20th
century (e.g., Lane 1923; Birch 1948; Lachenbruch andMarshall 1986). Since the publication of the Lachenbruchand Marshall study, borehole temperatures have beenused extensively in the study of climate change (e.g.,Chapman 1995; Beltrami and Harris 2001). For variationsin climate over the scale of several decades, deviations intemperature from what would be considered a steady-state conductive profile occur over the upper 100 m ofa temperature profile (e.g., Harris and Chapman 1998).
The application of temperature profiles to study cli-mate in a region of active ground water flow is generallydifficult. It is possible that advection could mask or over-whelm climate-induced temperature changes. Alternatively,deviations from the expected steady-state conductive tem-perature profile due to climate could be mistakenly inter-preted as a result of advective heat transport. Taniguchiet al. (1999) incorporated the effect of climate change intoa study where recharge rates were estimated from tempera-ture profiles in Japan. In that study, the change in groundsurface temperature (GST) was treated as a linear increaseover the past century, which is an important case giventhe general warming trend observed in many areas (e.g.,Beltrami and Harris 2001). In addition to this long-termtrend, variations in GST on the scale of years and decadesmay also influence estimates of recharge rates calculatedfrom temperature measurements.
1Corresponding author: Department of Earth Sciences, St.Francis Xavier University, Antigonish, Nova Scotia, Canada B2G2V5; (902) 867-3614; fax (902) 867-2414; [email protected]
2Department of Civil Engineering, University of Manitoba,246 Engineering Building, 15 Gillson Street, Winnipeg, Manitoba,Canada R3T 5V6; (204) 474-9137; fax (204) 474-7513;[email protected]
Received August 2004, accepted February 2005.Copyright ª 2005 National Ground Water Association.doi: 10.1111/j.1745-6584.2005.00088.x
Vol. 43, No. 6—GROUND WATER—November–December 2005 (pages 837–842) 837
The purpose of this study is to address the extent thatvariations in surface climate may be affecting estimatesof recharge rates from temperature profiles that assumesteady-state heat flow using synthetic models and thesurface air temperature (SAT) record to estimate a GSThistory. The validity of a previous study using tempera-tures to measure recharge rates in the Sandilands areaof southeastern Manitoba (Ferguson et al. 2003) is alsoassessed.
Estimating Specific Discharge fromBorehole Temperatures
Stallman (1963) proposed a differential equation thatdescribes the flow of heat and ground water in a porousmedium for one-dimensional flow in a homogeneous andisotropic medium:
je@2T
@z2� cfqf
@ðvzTÞ@z
¼ csatqsat@T
@tð1Þ
where je is thermal conductivity, T is temperature, cf isthe specific heat of water, qf is the density of water, vz isspecific discharge, csat is the specific heat capacity of thesaturated porous medium, and qsat is the density of thesaturated porous medium. Subscripts e, f, and sat refer toeffective, fluid and saturated, respectively.
Bredehoeft and Papadopulos (1965) provided the fol-lowing steady-state solution to Equation 1 assuming uni-form vertical flow of both heat and ground water:
Tz ¼ To 1 ½TL � To�½exp ðNPeðz=LÞÞ � 1�=½exp ðNPeÞ � 1�ð2Þ
where Tz is the temperature at a given depth along theprofile, To is the temperature at the top of a semiconfininglayer, TL is the temperature at the bottom of a semi-confining layer, NPe is the Peclet number for porousmedia ( = qf cf vz L/j), z is the depth along the profile,and L is the length of the temperature profile over thesemiconfining unit. Bredehoeft and Papadopulos (1965)detail a curve-matching procedure that can be applied todetermine the Peclet number within a hydrostratigraphicunit of uniform and steady flow, which is then used tocalculate specific discharge. This technique is not onlyapplicable to semiconfining layers but is valid for any sit-uation where temperatures are constant at both ends ofthe problem domain and there is steady-state, one-dimen-sional and uniform flow of heat and ground water. In thisstudy, Equation 2 will be fitted to synthetic temperatureprofiles that are the result of a constant recharge rateand variable GST to assess the sensitivity of estimatedrecharge rates to variability in climate.
Numerical Modeling and Analysis of ResultsA series of synthetic temperature profiles over time
was produced using MULTIFLO (Lichtner et al. 2000),a code, which simulates the flow of both fluid and heat inporous media. This program makes use of the generalform of the ground water flow equation (e.g., Bear 1972)for nonisothermal flow, which can be written as follows:
r�kqflðrP1 qfgrzÞ
�¼ @ðgqfÞ
@tð3Þ
where k is the permeability, l is the viscosity, P is thepressure, g is the coefficient of gravity, and g is porosity.MULTIFLO solves Equations 1 and 3 using an integratedfinite-difference formulation.
Models created in this study were one dimensionalfor the sake of simplicity. All the parameter values usedare typical of the sands and tills found in southeasternManitoba (Ferguson 2004). The simulations used constantrecharge rates of 7.9 3 10210 m/s (25 mm/year), 3.2 3
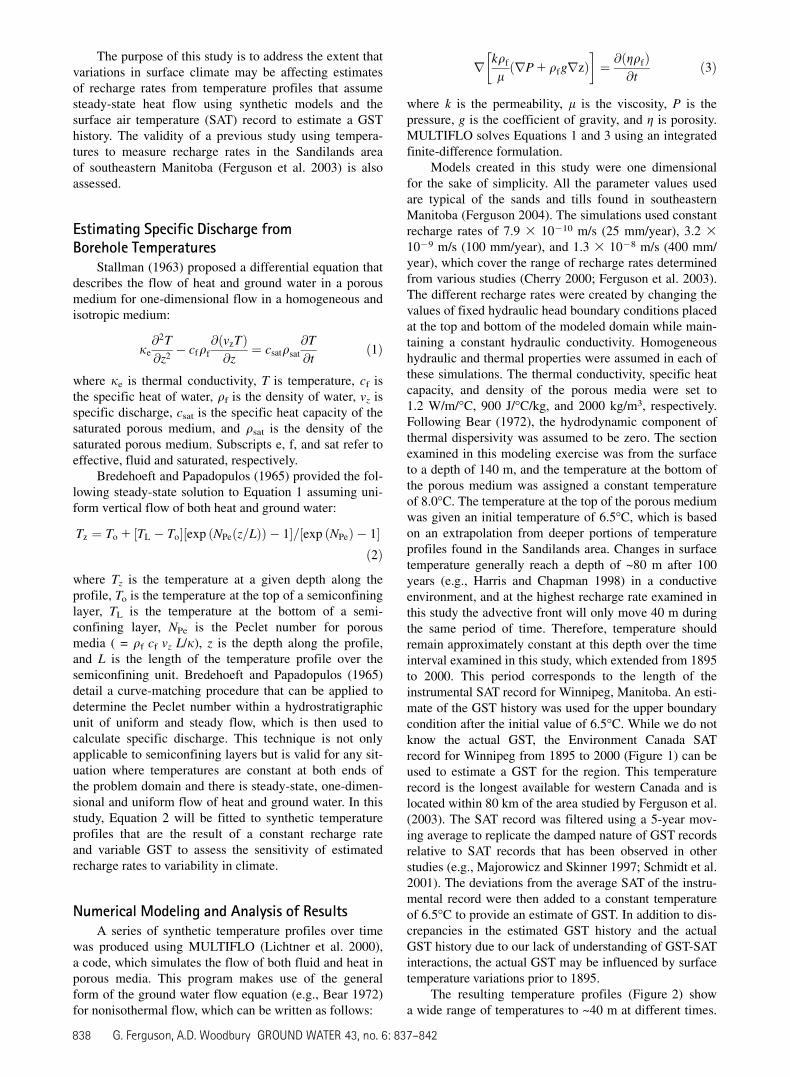
1029 m/s (100 mm/year), and 1.3 3 1028 m/s (400 mm/year), which cover the range of recharge rates determinedfrom various studies (Cherry 2000; Ferguson et al. 2003).The different recharge rates were created by changing thevalues of fixed hydraulic head boundary conditions placedat the top and bottom of the modeled domain while main-taining a constant hydraulic conductivity. Homogeneoushydraulic and thermal properties were assumed in each ofthese simulations. The thermal conductivity, specific heatcapacity, and density of the porous media were set to1.2 W/m/�C, 900 J/�C/kg, and 2000 kg/m3, respectively.Following Bear (1972), the hydrodynamic component ofthermal dispersivity was assumed to be zero. The sectionexamined in this modeling exercise was from the surfaceto a depth of 140 m, and the temperature at the bottom ofthe porous medium was assigned a constant temperatureof 8.0�C. The temperature at the top of the porous mediumwas given an initial temperature of 6.5�C, which is basedon an extrapolation from deeper portions of temperatureprofiles found in the Sandilands area. Changes in surfacetemperature generally reach a depth of ~80 m after 100years (e.g., Harris and Chapman 1998) in a conductiveenvironment, and at the highest recharge rate examined inthis study the advective front will only move 40 m duringthe same period of time. Therefore, temperature shouldremain approximately constant at this depth over the timeinterval examined in this study, which extended from 1895to 2000. This period corresponds to the length of theinstrumental SAT record for Winnipeg, Manitoba. An esti-mate of the GST history was used for the upper boundarycondition after the initial value of 6.5�C. While we do notknow the actual GST, the Environment Canada SATrecord for Winnipeg from 1895 to 2000 (Figure 1) can beused to estimate a GST for the region. This temperaturerecord is the longest available for western Canada and islocated within 80 km of the area studied by Ferguson et al.(2003). The SAT record was filtered using a 5-year mov-ing average to replicate the damped nature of GST recordsrelative to SAT records that has been observed in otherstudies (e.g., Majorowicz and Skinner 1997; Schmidt et al.2001). The deviations from the average SAT of the instru-mental record were then added to a constant temperatureof 6.5�C to provide an estimate of GST. In addition to dis-crepancies in the estimated GST history and the actualGST history due to our lack of understanding of GST-SATinteractions, the actual GST may be influenced by surfacetemperature variations prior to 1895.
The resulting temperature profiles (Figure 2) showa wide range of temperatures to ~40 m at different times.
838 G. Ferguson, A.D. Woodbury GROUND WATER 43, no. 6: 837–842
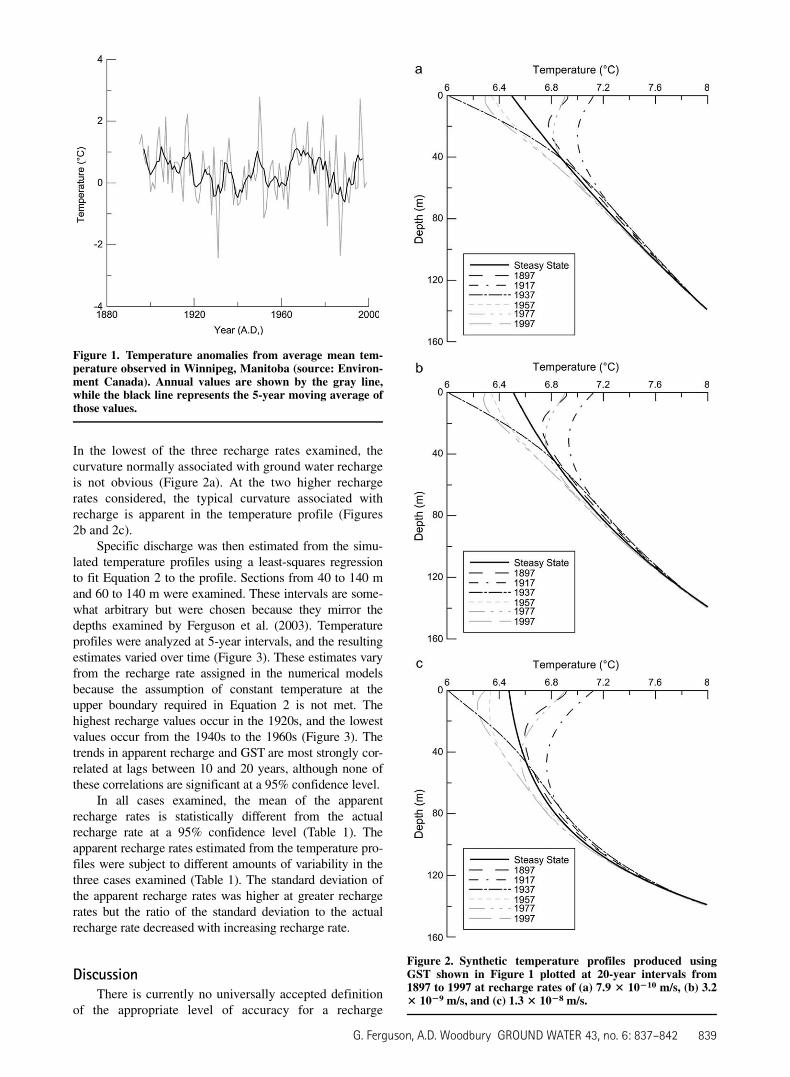
In the lowest of the three recharge rates examined, thecurvature normally associated with ground water rechargeis not obvious (Figure 2a). At the two higher rechargerates considered, the typical curvature associated withrecharge is apparent in the temperature profile (Figures2b and 2c).
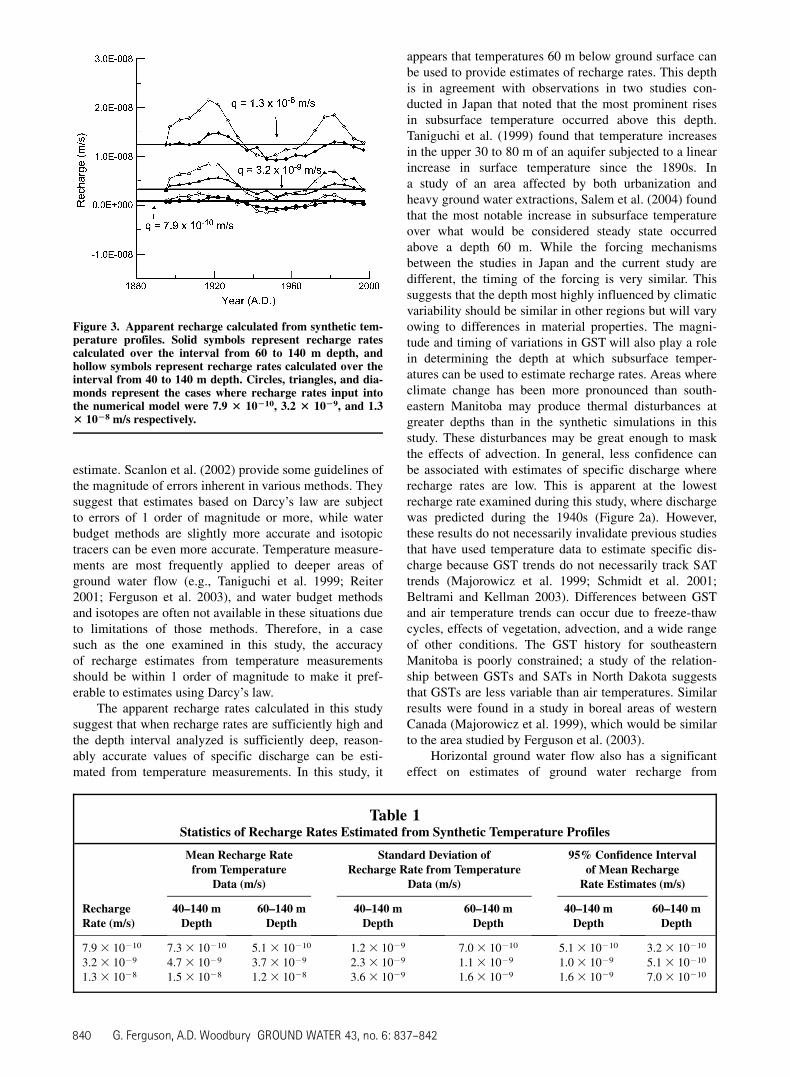
Specific discharge was then estimated from the simu-lated temperature profiles using a least-squares regressionto fit Equation 2 to the profile. Sections from 40 to 140 mand 60 to 140 m were examined. These intervals are some-what arbitrary but were chosen because they mirror thedepths examined by Ferguson et al. (2003). Temperatureprofiles were analyzed at 5-year intervals, and the resultingestimates varied over time (Figure 3). These estimates varyfrom the recharge rate assigned in the numerical modelsbecause the assumption of constant temperature at theupper boundary required in Equation 2 is not met. Thehighest recharge values occur in the 1920s, and the lowestvalues occur from the 1940s to the 1960s (Figure 3). Thetrends in apparent recharge and GST are most strongly cor-related at lags between 10 and 20 years, although none ofthese correlations are significant at a 95% confidence level.
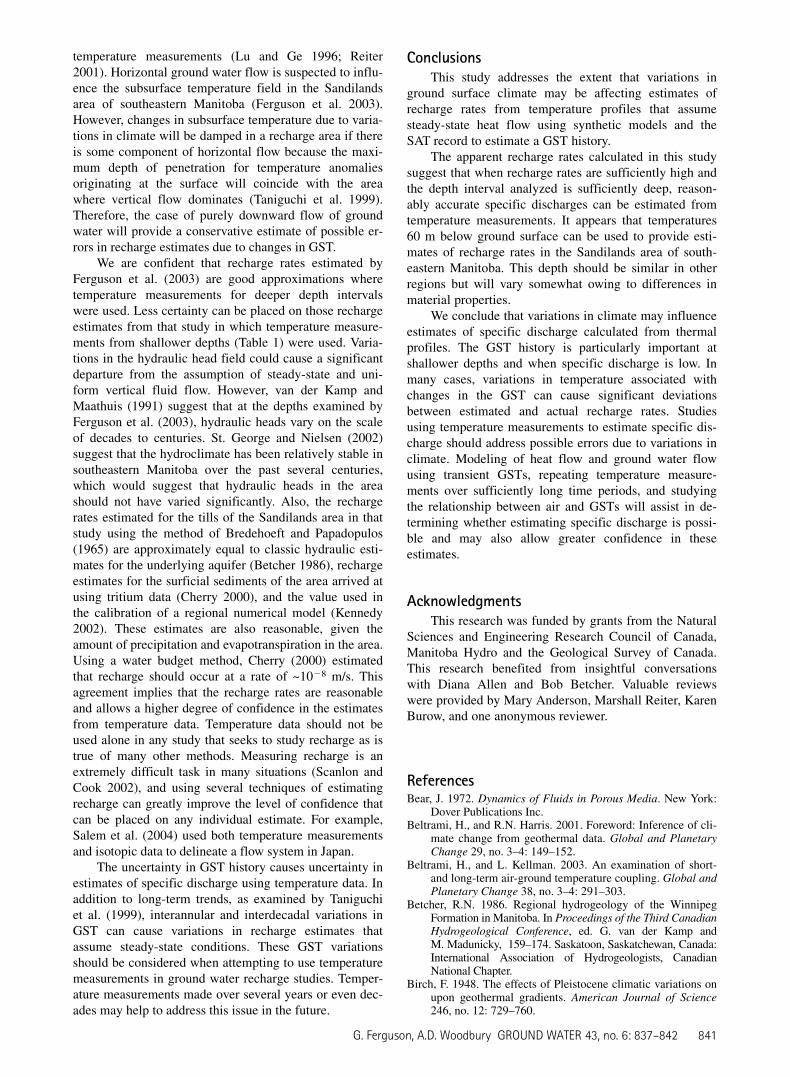
In all cases examined, the mean of the apparentrecharge rates is statistically different from the actualrecharge rate at a 95% confidence level (Table 1). Theapparent recharge rates estimated from the temperature pro-files were subject to different amounts of variability in thethree cases examined (Table 1). The standard deviation ofthe apparent recharge rates was higher at greater rechargerates but the ratio of the standard deviation to the actualrecharge rate decreased with increasing recharge rate.
DiscussionThere is currently no universally accepted definition
of the appropriate level of accuracy for a recharge
Figure 1. Temperature anomalies from average mean tem-perature observed in Winnipeg, Manitoba (source: Environ-ment Canada). Annual values are shown by the gray line,while the black line represents the 5-year moving average ofthose values.
Figure 2. Synthetic temperature profiles produced usingGST shown in Figure 1 plotted at 20-year intervals from1897 to 1997 at recharge rates of (a) 7.9 3 10210 m/s, (b) 3.23 1029 m/s, and (c) 1.3 3 1028 m/s.
G. Ferguson, A.D. Woodbury GROUND WATER 43, no. 6: 837–842 839
estimate. Scanlon et al. (2002) provide some guidelines ofthe magnitude of errors inherent in various methods. Theysuggest that estimates based on Darcy’s law are subjectto errors of 1 order of magnitude or more, while waterbudget methods are slightly more accurate and isotopictracers can be even more accurate. Temperature measure-ments are most frequently applied to deeper areas ofground water flow (e.g., Taniguchi et al. 1999; Reiter2001; Ferguson et al. 2003), and water budget methodsand isotopes are often not available in these situations dueto limitations of those methods. Therefore, in a casesuch as the one examined in this study, the accuracyof recharge estimates from temperature measurementsshould be within 1 order of magnitude to make it pref-erable to estimates using Darcy’s law.
The apparent recharge rates calculated in this studysuggest that when recharge rates are sufficiently high andthe depth interval analyzed is sufficiently deep, reason-ably accurate values of specific discharge can be esti-mated from temperature measurements. In this study, it
appears that temperatures 60 m below ground surface canbe used to provide estimates of recharge rates. This depthis in agreement with observations in two studies con-ducted in Japan that noted that the most prominent risesin subsurface temperature occurred above this depth.Taniguchi et al. (1999) found that temperature increasesin the upper 30 to 80 m of an aquifer subjected to a linearincrease in surface temperature since the 1890s. Ina study of an area affected by both urbanization andheavy ground water extractions, Salem et al. (2004) foundthat the most notable increase in subsurface temperatureover what would be considered steady state occurredabove a depth 60 m. While the forcing mechanismsbetween the studies in Japan and the current study aredifferent, the timing of the forcing is very similar. Thissuggests that the depth most highly influenced by climaticvariability should be similar in other regions but will varyowing to differences in material properties. The magni-tude and timing of variations in GST will also play a rolein determining the depth at which subsurface temper-atures can be used to estimate recharge rates. Areas whereclimate change has been more pronounced than south-eastern Manitoba may produce thermal disturbances atgreater depths than in the synthetic simulations in thisstudy. These disturbances may be great enough to maskthe effects of advection. In general, less confidence canbe associated with estimates of specific discharge whererecharge rates are low. This is apparent at the lowestrecharge rate examined during this study, where dischargewas predicted during the 1940s (Figure 2a). However,these results do not necessarily invalidate previous studiesthat have used temperature data to estimate specific dis-charge because GST trends do not necessarily track SATtrends (Majorowicz et al. 1999; Schmidt et al. 2001;Beltrami and Kellman 2003). Differences between GSTand air temperature trends can occur due to freeze-thawcycles, effects of vegetation, advection, and a wide rangeof other conditions. The GST history for southeasternManitoba is poorly constrained; a study of the relation-ship between GSTs and SATs in North Dakota suggeststhat GSTs are less variable than air temperatures. Similarresults were found in a study in boreal areas of westernCanada (Majorowicz et al. 1999), which would be similarto the area studied by Ferguson et al. (2003).
Horizontal ground water flow also has a significanteffect on estimates of ground water recharge from
Table 1Statistics of Recharge Rates Estimated from Synthetic Temperature Profiles
RechargeRate (m/s)
Mean Recharge Ratefrom Temperature
Data (m/s)
Standard Deviation ofRecharge Rate from Temperature
Data (m/s)
95% Confidence Intervalof Mean RechargeRate Estimates (m/s)
40–140 mDepth
60–140 mDepth
40–140 mDepth
60–140 mDepth
40–140 mDepth
60–140 mDepth
7.93 10210 7.33 10210 5.1 3 10210 1.2 3 1029 7.03 10210 5.13 10210 3.23 10210
3.23 1029 4.73 1029 3.7 3 1029 2.3 3 1029 1.13 1029 1.03 1029 5.13 10210
1.33 1028 1.53 1028 1.2 3 1028 3.6 3 1029 1.63 1029 1.63 1029 7.03 10210
Figure 3. Apparent recharge calculated from synthetic tem-perature profiles. Solid symbols represent recharge ratescalculated over the interval from 60 to 140 m depth, andhollow symbols represent recharge rates calculated over theinterval from 40 to 140 m depth. Circles, triangles, and dia-monds represent the cases where recharge rates input intothe numerical model were 7.9 3 10210, 3.2 3 1029, and 1.33 1028 m/s respectively.
840 G. Ferguson, A.D. Woodbury GROUND WATER 43, no. 6: 837–842
temperature measurements (Lu and Ge 1996; Reiter2001). Horizontal ground water flow is suspected to influ-ence the subsurface temperature field in the Sandilandsarea of southeastern Manitoba (Ferguson et al. 2003).However, changes in subsurface temperature due to varia-tions in climate will be damped in a recharge area if thereis some component of horizontal flow because the maxi-mum depth of penetration for temperature anomaliesoriginating at the surface will coincide with the areawhere vertical flow dominates (Taniguchi et al. 1999).Therefore, the case of purely downward flow of groundwater will provide a conservative estimate of possible er-rors in recharge estimates due to changes in GST.
We are confident that recharge rates estimated byFerguson et al. (2003) are good approximations wheretemperature measurements for deeper depth intervalswere used. Less certainty can be placed on those rechargeestimates from that study in which temperature measure-ments from shallower depths (Table 1) were used. Varia-tions in the hydraulic head field could cause a significantdeparture from the assumption of steady-state and uni-form vertical fluid flow. However, van der Kamp andMaathuis (1991) suggest that at the depths examined byFerguson et al. (2003), hydraulic heads vary on the scaleof decades to centuries. St. George and Nielsen (2002)suggest that the hydroclimate has been relatively stable insoutheastern Manitoba over the past several centuries,which would suggest that hydraulic heads in the areashould not have varied significantly. Also, the rechargerates estimated for the tills of the Sandilands area in thatstudy using the method of Bredehoeft and Papadopulos(1965) are approximately equal to classic hydraulic esti-mates for the underlying aquifer (Betcher 1986), rechargeestimates for the surficial sediments of the area arrived atusing tritium data (Cherry 2000), and the value used inthe calibration of a regional numerical model (Kennedy2002). These estimates are also reasonable, given theamount of precipitation and evapotranspiration in the area.Using a water budget method, Cherry (2000) estimatedthat recharge should occur at a rate of ~1028 m/s. Thisagreement implies that the recharge rates are reasonableand allows a higher degree of confidence in the estimatesfrom temperature data. Temperature data should not beused alone in any study that seeks to study recharge as istrue of many other methods. Measuring recharge is anextremely difficult task in many situations (Scanlon andCook 2002), and using several techniques of estimatingrecharge can greatly improve the level of confidence thatcan be placed on any individual estimate. For example,Salem et al. (2004) used both temperature measurementsand isotopic data to delineate a flow system in Japan.
The uncertainty in GST history causes uncertainty inestimates of specific discharge using temperature data. Inaddition to long-term trends, as examined by Taniguchiet al. (1999), interannular and interdecadal variations inGST can cause variations in recharge estimates thatassume steady-state conditions. These GST variationsshould be considered when attempting to use temperaturemeasurements in ground water recharge studies. Temper-ature measurements made over several years or even dec-ades may help to address this issue in the future.
ConclusionsThis study addresses the extent that variations in
ground surface climate may be affecting estimates ofrecharge rates from temperature profiles that assumesteady-state heat flow using synthetic models and theSAT record to estimate a GST history.
The apparent recharge rates calculated in this studysuggest that when recharge rates are sufficiently high andthe depth interval analyzed is sufficiently deep, reason-ably accurate specific discharges can be estimated fromtemperature measurements. It appears that temperatures60 m below ground surface can be used to provide esti-mates of recharge rates in the Sandilands area of south-eastern Manitoba. This depth should be similar in otherregions but will vary somewhat owing to differences inmaterial properties.
We conclude that variations in climate may influenceestimates of specific discharge calculated from thermalprofiles. The GST history is particularly important atshallower depths and when specific discharge is low. Inmany cases, variations in temperature associated withchanges in the GST can cause significant deviationsbetween estimated and actual recharge rates. Studiesusing temperature measurements to estimate specific dis-charge should address possible errors due to variations inclimate. Modeling of heat flow and ground water flowusing transient GSTs, repeating temperature measure-ments over sufficiently long time periods, and studyingthe relationship between air and GSTs will assist in de-termining whether estimating specific discharge is possi-ble and may also allow greater confidence in theseestimates.
AcknowledgmentsThis research was funded by grants from the Natural
Sciences and Engineering Research Council of Canada,Manitoba Hydro and the Geological Survey of Canada.This research benefited from insightful conversationswith Diana Allen and Bob Betcher. Valuable reviewswere provided by Mary Anderson, Marshall Reiter, KarenBurow, and one anonymous reviewer.
ReferencesBear, J. 1972. Dynamics of Fluids in Porous Media. New York:
Dover Publications Inc.Beltrami, H., and R.N. Harris. 2001. Foreword: Inference of cli-
mate change from geothermal data. Global and PlanetaryChange 29, no. 3–4: 149–152.
Beltrami, H., and L. Kellman. 2003. An examination of short-and long-term air-ground temperature coupling. Global andPlanetary Change 38, no. 3–4: 291–303.
Betcher, R.N. 1986. Regional hydrogeology of the WinnipegFormation in Manitoba. In Proceedings of the Third CanadianHydrogeological Conference, ed. G. van der Kamp andM. Madunicky, 159–174. Saskatoon, Saskatchewan, Canada:International Association of Hydrogeologists, CanadianNational Chapter.
Birch, F. 1948. The effects of Pleistocene climatic variations onupon geothermal gradients. American Journal of Science246, no. 12: 729–760.
G. Ferguson, A.D. Woodbury GROUND WATER 43, no. 6: 837–842 841
Bredehoeft, J.D., and I.S. Papadopulos. 1965. Rates of verticalgroundwater movement estimated from the Earth’s thermalprofile. Water Resources Research 1, no. 2: 325–328.
Cartwright, K. 1970. Groundwater discharge in the IllinoisBasin as suggested by temperature anomalies. WaterResources Research 6, no. 3: 912–918.
Chapman, D.S. 1995. Climate change inferred from boreholetemperatures: An overview. IUGG, XXI. General Assembly,p. A286.
Cherry, A.J. 2000. A multi-tracer estimation of groundwaterrecharge in a glaciofluvial aquifer in SoutheasternManitoba. M.Sc. thesis, Department of Earth Sciences,University of Ottawa.
Ferguson, G., A.D. Woodbury, and G.L.D. Matile. 2003. Esti-mating deep recharge rates beneath an interlobate moraineusing temperature logs. Ground Water 41, no. 5: 640–646.
Ferguson, G.A.G. 2004. Groundwater and heat flow in South-eastern Manitoba: Implications to water supply and thermalenergy. Ph.D. thesis, Department of Civil Engineering,University of Manitoba.
Harris, R.N., and D.S. Chapman. 1998. Geothermics and climatechange: 1. Analysis of borehole temperatures with empha-sis on resolving power. Journal of Geophysical Research103, no. B4: 7363–7370.
Kennedy, P.L. 2002. Groundwater flow and transport model ofthe Red River/Interlake area in southern Manitoba. Ph.D.thesis, Department of Civil and Geological Engineering,University of Manitoba.
Lachenbruch, A., and B.V. Marshall. 1986. Changing climate:Geothermal evidence from permafrost in the AlaskanArctic. Science 234, 689–696.
Lachenbruch, A.H., and J.H. Sass. 1977. Heat flow in the UnitedStates and the thermal regime of the crust. In The Natureand Physical Properties of the Earth’s Crust. GeophysicalMonograph Series 20, ed. G. Heacock, 626–676. Wash-ington, D.C.: American Geophysical Union.
Lane, A.C. 1923. Geotherms of Lake Superior Copper Country.Geological Society of America Bulletin 34, no. 4: 703–720.
Lichtner, P.C., M.S. Seth, and S. Painter. 2000. MULTIFLOUser’s Manual; MULTIFLO Version 1.2. San Antonio,Texas: Southwest Research Institute.
Lu, N., and S. Ge. 1996. Effects of horizontal heat andfluid flow on the vertical temperature distribution of a
semiconfining layer. Water Resources Research 32, no. 5:1449–1453.
Majorowicz, J.A., J. Safanda, R.N. Harris, and W. Skinner.1999. Large ground surface temperature changes in the lastthree centuries inferred from borehole temperatures in theSouthern Canadian Prairies, Saskatchewan. Global andPlanetary Change 20, no. 3–4: 227–241.
Majorowicz, J., and W. Skinner. 1997. Potential causes of differ-ences between ground and surface air-temperature warmingacross different ecozones in Alberta, Canada. Global andPlanetary Change 6, no. 3–4: 79–91.
Parsons, M.L. 1970. Groundwater thermal regime in a glacialcomplex.Water Resources Research 6, no. 6: 1701–1720.
Reiter, M. 2001. Using precision temperature logs to estimatehorizontal and vertical groundwater flow components.Water Resources Research 37, no. 3: 663–674.
Salem, Z.E., M. Taniguchi, and Y. Sakura. 2004. Use of temper-ature profiles and stable isotopes to trace flow lines:Nagaoka Area, Japan. Ground Water 42, no. 1: 83–91.
Scanlon, B.R., and P.G. Cook. 2002. Preface, theme issue ongroundwater recharge. Hydrogeology Journal 10, no. 1: 3–4.
Scanlon, B.R., R.W. Healy, and P.G. Cook. 2002. Choosingappropriate techniques for quantifying groundwaterrecharge. Hydrogeology Journal 10, no. 1: 18–39.
Schmidt, W.L., W.D. Gosnold, and J. Enz. 2001. A decade of air-ground temperature exchange from Fargo, North Dakota.Global and Planetary Change 29, no. 3–4: 311–325.
Stallman, R.W. 1963. Computation of vertical groundwatervelocity from temperature data. USGS Water Supply Paper1544H. Washington, D.C.:USGS.
St. George, S., and E. Nielsen. 2002. Hydroclimatic change inSouthern Manitoba since A.D. 1409 inferred from treerings. Quaternary Research 58, no. 2: 103–111.
Taniguchi, M., J. Shimada, T. Tanaka, I. Kayane, Y. Sakura, Y.Shimano, S. Dapaah-Siakwan, and S. Kawashima. 1999.Disturbances of temperature-depth profiles due to surfaceclimate change and subsurface water flow: 1. An effect oflinear increase in surface temperature caused by globalwarming and urbanization in the Tokyo metropolitan area,Japan. Water Resources Research 35, no. 5: 1507–1517.
van der Kamp, G., and H. Maathuis. 1991. Annual fluctuation ofgroundwater levels as a result of loading by surface mois-ture. Journal of Hydology 127, no. 1–4: 137–152.
842 G. Ferguson, A.D. Woodbury GROUND WATER 43, no. 6: 837–842