Embed Size (px)
Citation preview

The Effects of CDS Trading Initiation on Information Asymmetry in Syndicated Loans
Dan Amiram Columbia Business School
Columbia University
William Beaver Graduate School of Business
Stanford University
Wayne R. Landsman* Kenan-Flagler Business School
University of North Carolina and
Securities and Exchange Commission
Jianxin Zhao Kenan-Flagler Business School
University of North Carolina
March 2016
* Corresponding author: [email protected]. The Securities and Exchange Commission, as a matter of policy, disclaims responsibility for any private publication or statement by any of its employees. The views expressed herein are those of Wayne Landsman and do not necessarily reflect the views of the Commission or of the study’s other coauthors upon the staff of the Commission. We thank Mary Barth, Nittai Bergman, Robert Bushman, Ilya Dichev, Fabrizio Ferri, Jon Glover, Bjorn Jorgensen, Alon Kalay, Doron Nissim, Martin Oehmke, Shiva Rajgopal, an anonymous reviewer, and workshop participants at the Cambridge Financial Accounting Symposium, Columbia University, Emory University, IDC Herzliya, London School of Economics, the University of Toronto Rotman Research Conference, the UNC-Duke Fall Camp, and the University of North Carolina Chapel Hill for helpful comments. We appreciate funding from the Center for Finance and Accounting Research, Kenan-Flagler Business School, the Center for Global Business and the Economy, Stanford Graduate School of Business, and Columbia Business School.
The Effects of CDS Trading Initiation on Information Asymmetry in Syndicated Loans
Abstract This study shows that initiation of CDS trading for an entity’s debt increases the share of loans retained by loan syndicate lead arrangers and increases loan spread. These findings are consistent with CDS initiation reducing the effectiveness of a lead arranger’s stake in the loan to serve as a mechanism to address the adverse selection/moral hazard problem in the loan syndicate. Additional findings corroborate this interpretation by revealing a moderating effect for firms with greater transparency, for loans originated by a lead arranger with a strong reputation in this market, and for firms with relatively liquid CDS markets.

1
1. Introduction
Syndicated loans are the largest source of US corporate financing activity (Sufi, 2007;
Ivashina, 2009). Globally, the syndicated loan market plays a similarly leading role in corporate
financing, with volume growing from nearly $3 trillion in 2010 to $4.7 trillion in 2014, and
shows no signs of slowing down (Thomson and Reuters, 2014). Given the sheer size of the
syndicated loan market, academic researchers and policy makers alike have begun to express a
strong interest in examining forces affecting the loan market, particularly after the onset of the
financial crisis. One such force that has received attention is the friction arising from
information asymmetry between the lead arranger, who originates the loan with a borrower, and
the participants within the syndicate. This friction impedes the ability of the lead arranger to find
syndicate participants, which can restrict loan amounts or raise the cost of borrowing. A well
known solution to the information asymmetry problem is for the lead arranger to have ‘skin on
the game’ by holding a share of each originated loan (Sufi, 2007; Ivashina, 2009; Goplan et al,
2011).
Many believed that the development of the credit default swaps (CDSs) potentially
benefited the lending market by providing the lead arranger with more opportunities to hedge
credit risk, thereby reducing the price of risk.1 However, the financial crisis put the spotlight on
potential costs of CDSs to the lending market. These instruments, which pay their holders the
face value in a case of a reference entity (i.e., borrower) credit event (e.g., debt default) in return
for a premium, were issued first in the early 1990s and reached a peak of $62.2 trillion of
notional outstanding value in 2007 (ISDA, 2013). As with the syndication loan market, the sheer
size of the CDS market has led scholars and policy makers to question the impact of the market
1 See, e.g., Ashcraft and Santos (2009) for statements by Alan Greenspan and Paul Tucker, and Bolton and Oehmke (2011).

2
on the economy (Saretto and Tookes, 2013). The introduction of CDS trading potentially can
impede the effectiveness of the lead arranger’s ‘skin the game’ to resolve the information
asymmetry problem inherent in the loan syndicate. Because the syndicated loan market is key
source of corporate financing and CDS trading has become widespread, we investigate whether
the initiation of CDS trading exacerbates the information asymmetry problems within the loan
syndicate.
In contrast to a traditional bank loan, which involves a single lender, a syndicated loan
involves a group of lenders. Loan syndication has evolved as an efficient mechanism that
permits the lead arranger to share risk with syndicate participants, who depend on the lead
arranger to screen borrowers before loan syndication and monitor borrowers throughout the life
of the loans. The information asymmetry between the lead arranger and syndicates creates an
adverse selection problem, which provides incentives for the lead arranger to misrepresent the
quality of syndicated loans, and creates a moral hazard problem that provides incentives for the
lead arranger to underperform on its monitoring. To mitigate these information asymmetry
problems, syndicate participants can require the lead arranger to retain a larger share of a loan,
i.e., have “skin in the game,” than would otherwise be optimal from a pure risk-sharing
perspective.
Initiation of a CDS market introduces a potential positive externality to the syndicated
loan market by providing the lead arranger with an alternative mechanism to hedge exposure to
credit risk associated the portion of the loan it retains. However, the ability of the lead arranger
to hedge credit risk using CDSs introduces a potential negative externality in that CDS trading
reduces the effectiveness of lead arranger ownership to serve as a mechanism to mitigate the
information asymmetry problems of adverse selection and moral hazard. CDS initiation

3
introduces another negative externality by increasing the default risk of the reference entity
because speculators that hold CDSs on the borrower may have incentives to encourage it to
default (e.g., Che and Sethi (2013) and Subrahmanyam et al. (2014)).
We begin our study by first developing a framework for understanding the economic
effects of CDS initiation on loan syndication, which enables us to gain insight into whether CDS
initiation exacerbates adverse selection/moral hazard problems within the syndicate. We do this
by building on Ivashina (2009), which develops an equilibrium model of loan syndication in
which the observed loan spread and a lead bank’s share of a loan corresponds to the intersection
of two pricing schedules representing the syndicate participants’ demand for a proportional share
of a loan and the lead bank’s willingness to retain a proportional share of a loan. We show that
CDS initiation can lead to a variety of new equilibrium combinations of loan share retained by
the lead arranger and borrower loan spread. However, an important observation is that an
increase in neither loan share retained nor loan spread following CDS initiation is sufficient for
evidence of an increase in adverse selection/moral hazard associated with loan syndication.2
Observing simultaneous increases in both loan share retained and loan spread are necessary for
there to be an economically significant increase in adverse selection/moral hazard.
To analyze empirically the effect of CDS trading initiation on the loan share retained and
loan spread of the syndicated loan market, we obtain CDS trading information from Markit and
collect a sample of 22,406 loan contracts from Dealscan over the period 1993-2014. We use a
difference-in-difference research design to investigate the effects of CDS initiation on the share
retained by the lead arranger for loans issued by firms before and after there are CDS contracts
traded on the firms’ debt. In all tests we include as controls firm- and loan-specific
2 Although adverse selection and moral hazard problems arise at different times throughout loan syndication, we make no attempt to distinguish them in our tests. For the sake of parsimony, when referencing these information asymmetries we use the phrase “adverse selection/moral hazard” to denote the fact either or both may be present.

4
characteristics. We find that CDS initiation is associated with an increase in the loan share
retained by the lead arranger. This finding is consistent with two alternative explanations. The
first is that CDS initiation introduces a positive externality arising from the availability to the
lead arranger of an alternative means to diversify credit risk exposure to a loan. The second is
that CDS initiation introduces a negative externality arising from the reduced effectiveness of
lead arranger ownership to serve as a mechanism to mitigate adverse selection/moral hazard
problems.
As a means to help distinguish whether the ownership structure changes we document
more likely arise from the lead arranger’s diversification benefit or an increase in adverse
selection/moral hazard problems, we also test for the effect on loan spreads arising from CDS
initiation. Findings from this test indicate that average loan spread increases. As we explain in
section 2, finding an increase in both loan share retained by the lead arranger and loan spread is
evidence consistent with CDS initiation introducing a negative externality arising from an
increase in adverse selection/moral hazard that more than offsets any possible positive
externality from diversification.
To mitigate the potential for alternative explanations for our results, we also test whether
this negative externality is moderated, as expected, for firms with greater transparency. If a
borrower’s risks and activities are more transparent, then the adverse selection/moral hazard
problems are less severe and monitoring by lead arrangers is less important to syndicate
participants. As a result, the adverse selection/moral hazard problem created by CDS trading is
likely to be less severe for more transparent firms. We test our prediction of a moderating
influence of a borrower’s transparency using a measure of the debt-contracting value of
borrowers’ accounting information in explaining credit ratings (Ball et al., 2008). Findings from

5
these tests support our prediction that for firms with higher transparency there are smaller
increases in loan share retained by the lead arranger and loan spreads following CDS initiation.
Similarly, we also find that, as predicted, our documented effects of CDS initiation on loan share
retained and loan spreads are less pronounced when the lead arranger has a strong reputation in
the syndicated loan market. This is because lead arrangers with a strong reputation to protect
have greater incentives to screen and monitor borrowers, which mitigates the adverse
selection/moral hazard problems.
A key assumption in our use of CDS initiation as an indication that the cost of
anonymously hedging its retained credit risk in the borrower decreases for the lead arranger is
predicated on the existence of a liquid CDS market. As a result, we predict and find evidence of
larger share retained by the lead arranger and higher loan spreads relating to loans for which
CDS contracts are relatively liquid. These findings suggest that existence of a liquid CDS
market better enables the lead arranger to hedge its retained credit risk using CDS, thereby
exacerbating adverse selection/moral hazard effects of CDS initiation.
A research design problem common to studies on CDS initiation is that CDS initiation is
possibly endogenously related to an increase in credit risk of the reference entity. Following
prior literature, we conduct additional tests including the use of a propensity score matched
sample and the Heckman two-stage correction for self-selection bias. Findings from these tests
reveal the same inferences as those based on our tabulated findings.
Our study contributes to the literature by documenting the effects of CDS initiation on
syndicated loan ownership structure. Although prior studies find that CDS initiation is
associated with an increase in reference entity bankruptcy risk (Subarhmanyam et al., 2014) and
an increase in loan spread for relatively opaque reference entities (Ashcraft and Santos, 2009),

6
ours is the first to show that lead arranger ownership stake in the reference entity also increases.
Borrowing from Ivanshina (2009), we show that these prior literature results cannot be used to
infer or predict how CDS initiation will affect syndicated loan ownership structure, i.e., the share
retained by the lead arranger. An increase in loan spread and borrower bankruptcy risk can
result from an increase in credit risk arising from actions taken by non-lender CDS holders or
from an increase in adverse selection/moral hazard problems; whereas the former cause of an
increase in loan spread results in a decrease in share retained by the lead arranger, the latter
results in an increase. Moreover, finding an increase in both loan share retained by the lead
arranger and loan spread enables us to infer that CDS initiation results in an increase in adverse
selection/moral hazard that more than offsets possible diversification benefits to the lead
arranger. Thus, CDS initiation reduces the effectiveness of a lead arranger’s stake in the loan to
serve as a mechanism to address the adverse selection/moral hazard problem.
The remainder of the paper is organized as follows. The next section discusses the
institutional background, related literature, and provides our predictions. Section 3 presents our
research design, section 4 describes our sample and data, and section 5 presents our results.
Section 6 provides concluding remarks.
2. Institutional Background, Related Literature, and Predictions
2.1 Loan Syndication
In a syndicated loan, a lead arranger—typically a commercial or investment bank—
arranges for an entity to borrow funds from a pool of lenders that often are other commercial or
investment banks, or other institutional investors such as hedge funds and pension funds. A key
purpose of loan syndication is that it permits the primary lender, i.e., the lead arranger, to
diversify risk and to hold a portion of the loan rather than the full amount of the loan.

7
The lead arranger screens borrowers for creditworthiness and is responsible for
monitoring the borrower over the life of the loan. Because screening and monitoring efforts are
costly and unobservable, the loan syndication process suffers from adverse selection and moral
hazard problems that potentially can adversely affect the loan syndication process. The adverse
selection problem arises from syndicate participants being at an informational disadvantage
relative to the lead arranger because the lead arranger screens borrowers – many of which often
have long-term relationships with the lead arranger. At the time of loan origination and
syndication, there is no direct means for syndicate participants to observe the risk characteristics
of the borrower that are relevant to loan pricing. Subsequent to origination, syndicate
participants rely on the lead arranger to monitor the borrower for changes in creditworthiness but
have no means to observe directly efforts undertaken by the lead arranger, which creates a moral
hazard problem. If these information problems are severe enough, there could be a breakdown in
the syndication process, whereby the lead arranger cannot attract other lenders to participate in
the syndicate.
A costly means to solve the adverse selection/moral hazard problem is for the lead
arranger to hold a portion of the loan. Requiring the lead arranger to have “skin in the game”
(e.g., Sufi, 2007) serves as a commitment for the lead arranger to set loan terms that reflect the
riskiness of the loan and to exert monitoring effort subsequent to loan origination/syndication.
The solution is costly because the lead arranger is unable to diversify its risk exposure to the loan
as much as would be the case in the absence of adverse selection/moral hazard. Of course, if the
borrower’s activities and risk characteristics are observable at relatively low cost by lenders,
including loan syndication participants, then information asymmetry between the lead arranger

8
and the other lenders in the syndicate is mitigated, and the lead arranger may be required to
retain a smaller portion of the loan.
Ivashina (2009) develops an equilibrium model in which a lead bank’s share of a loan
and the observed loan spread correspond to the intersection of two pricing schedules representing
the syndicate participants’ demand for a proportional share of a loan and the lead bank’s
willingness to retain a proportional share of a loan. Figure 1, which plots loan spread and share
retained by the lead arranger, illustrates the model. In the presence of adverse selection arising
from syndicate participants being unable to observe the creditworthiness of the borrower and the
moral hazard problem arising from their inability to assess whether the lead arranger monitors
the borrower’s activities throughout the life of the loan, the syndicate participants’ demand curve
is downward-sloping. Other things equal, syndicate participants demand a higher loan spread the
greater is the adverse selection/moral hazard problem. The downward slope of their demand
curve, DSynd, reflects their requiring a lower loan spread when the lead arranger retains a larger
proportion of the loan, which reduces the adverse selection/moral hazard problem. Because of
the lead arranger’s desire to diversify loan portfolio risk, as the share retained increases, the
greater must be the loan spread to compensate the lead arranger for the greater risk exposure.
Hence, the lead arranger’s demand curve, DLeadA, is upward sloping. The intersection of the
two demand curves yields the equilibrium loan spread and share retained by the lead arranger
given by E(0).
2.2 Credit Default Swaps
A credit default swap (CDS) is an agreement that provides that the seller of the CDS
compensate the buyer in the event of a debt default or other specified credit event relating to a
specific entity. The CDS contract typically requires the buyer of the CDS to makes a series of

9
payments to the seller throughout the life of the loan and, in exchange, the buyer receives a
payoff if the debt defaults. In essence, the CDS is an insurance contract, and therefore the
seller’s premium is larger the greater is the likelihood of debt default when the CDS contract is
signed. Soon after CDS contracts were initiated in the 1990s, secondary markets for CDSs
developed, providing market participants with timely information regarding a borrower’s credit-
worthiness, regardless of whether the entity’s debt is publicly traded.
CDS contracts typically are made available to investors mostly from monoline insurers
such as AIG and Ambac, which operate primarily as CDS sellers, as well financial institutions
and hedge funds, including J.P. Morgan and Goldman Sachs, which serve as market-makers as
well as CDS sellers. CDS transactions are conducted through an over-the-counter market and
thus are unobservable to parties outside of the deal. Although the parties to CDS transactions are
not publicly disclosed, in aggregate, banks are net protection buyers of CDS (Song et al., 2013;
Suestersic, 2013; Martin and Roychowdhury, 2015).3 The buyer of a CDS need not hold the
debt security on which the CDS is written. However, if the buyer does hold the debt security,
then the risk of default is transferred from the holder of the debt security to the CDS seller. This
transfer of risk plays an important role in loan syndication.
CDS contracts can be written on bonds or loans. Bonds are publicly issued and loans are
privately placed. As a result, recovery rates generally are smaller for bonds than for loans for
two primary reasons. First, loans typically are collateralized but bonds are not. Second, whereas
loans are held by a relatively small number of syndicate participants—facilitating
3 Another important characteristic of the CDS market is that its dominant players are major banks and financial institutions. There is a concern that these banks and financial institutions may have access to material non-public information on CDS obligors through their lending activities and then trade on this information (e.g., Acharya and Johnson, 2007; Kim et al., 2014). To the extent that lenders possess private information on their borrowers’ creditworthiness, CDS sellers can take into account their own information disadvantage when pricing CDS contracts (Fink, 2004).

10
renegotiation—bonds are widely held. The most prevalent form of CDS contracts are those
written on bonds. Such contracts have been written since inception of CDS market. However,
only since 2007 have so-called “loan only” CDS contracts, LCDS, begun to be traded with some
degree of frequency (Choudhry, 2011). LCDS contracts differ from typical CDS contracts in
that the underlying protection is sold on syndicated secured loans of the reference entity rather
than on broader bond or loan categories. Because LCDS contracts are linked to secured loans
with higher recovery rates than unsecured bonds, spreads for LCDS contracts generally are
smaller than those for CDS contracts for the same reference entity. However, because loan and
bond contracts typically are cross-referenced with respect to a defining default event, the default
event date is normally the same for CDS and LCDS.
2.3 CDS and Loan Syndication
2.3.1 Effect of CDS initiation on adverse selection and moral hazard curve
If a CDS market for a firm’s debt is available, the lead arranger anonymously can
purchase CDSs to lay off credit risk associated with the portion of the loan it holds.4 Thus, lead
arranger banks that have purchased CDSs have a reduced incentive to screen and monitor
borrowers (e.g., Morrison, 2005). As a result, holding a portion of the loan no longer provides as
credible commitment as before CDS initiation that the lead arranger will provide a fair
assessment of the riskiness of the loan and exert monitoring effort.5’6
4 The lead arranger’s actions are, in principle, observable to the CDS seller only, i.e., its actions are unobservable by syndicate participants. To the extent that the lead arranger is concerned about maintaining anonymity with all parties, including the seller, it can arrange for a third party to purchase the CDS directly from the seller and then acquire the CDS from the third party. In this section, we assume no distinction between CDS and LCDS. We consider potential implications of this distinction below in section 4. 5 Moreover, because CDSs allow banks and creditors to transfer risk exposure to third parties through the purchase of CDS protection, an “empty creditor” problem is created in that creditors with CDS insurance are better off when the borrowing firm defaults and may even have incentives to push the borrower into default (Hu and Black, 2008a, 2008b) or inefficient bankruptcy because the lender’s total pay-off would be higher in that event (Bolton and Oehmke, 2011).

11
Thus, CDS initiation exposes syndicate participants to increased adverse selection/moral
hazard risk. Of course, loan syndicate participants are likely to take actions to protect
themselves from these increased risks arising from CDS initiation, resulting in a new equilibrium
loan spread and share retained by the lead arranger. In the context of the Ivashina (2009)
framework, for a given level of lead bank’s share in the loan, syndicate participants will demand
higher spreads because of CDS initiation, which results in a shift of the syndicate demand curve
to the right. This is shown in Figure 2, where DSynd_pre and Dsynd_post are the demand
curves before and after CDS initiation.7 Note that in the absence of a shift in the lead arranger’s
demand curve, DLeadA, the resulting equilibrium, E(1), is a greater share retained by the lead
arranger after CDS initiation and a larger loan spread. We refer to this shift in the syndicate
participants’ demand curve as the adverse selection/moral hazard effect arising from CDS
initiation. In the limit, if the increase in the adverse selection/moral hazard effect is sufficiently
large, the lead arranger will have to retain the entire loan, i.e., the loan will be issued as a sole
lending loan, and the syndicate structure fully breaks down.
2.3.2 Effect of CDS initiation on the diversification curve
Although CDS initiation affects the loan syndicate participants’ pricing schedule, it also
potentially affects the lead arranger’s pricing schedule for two reasons. First, the development of
the CDS market for a borrower provides the lead arranger (and other holders of a borrower’s
debt) with an additional way to hedge or lay off credit risk exposure to the borrower without
6 Even though the CDS seller will set a CDS price that takes into account the empty creditor problem, this does not imply that the lead arranger will not purchase a CDS contract. This is because the CDS seller—acting as an insurer—likely is more efficient and therefore more willing than the lead arranger to absorb the borrower’s credit risk. To the extent that this is not the case, the lead arranger will not purchase CDSs and there will be no change in the lead arranger’s incentive to screen and monitor the borrower. 7 For ease of exposition and because there is no effect on our predictions, we do not consider the slope and potential changes in the slope of the Dsynd and the DLeadA curves after CDS initiation.

12
having to sell its stake in the loan.8 This enables the lead arranger to reduce the cost of hedging
the borrower’s credit risk while maintaining a lending relationship with the borrower (Saretto
and Tookes, 2013) and provides the lead arranger with an opportunity to reduce regulatory
capital requirements (Martin and Roychowdhury, 2015). Even if lenders do not purchase CDSs
immediately, the existence of CDS markets provides a liquid resale option and makes holding
credit risk more attractive. Because CDS initiation provides an additional way for the lead
arranger to reduce the risk exposure from holding a share in a loan, in the context of the Ivashina
(2009) framework, for each level of shares retained by the lead arranger, the lead arranger is
willing to charge a lower level of loan spread. As shown in Figure 3, this implies a shift of the
lead arranger’s demand curve to the right (as indicated by the purple demand curve), where
DLeadA_pre and DLeadA_post_1 are the lead arranger’s demand curves before and after CDS
initiation. Note that in the absence of a shift in the syndicate participants’ demand curve, Dsynd,
after CDS initiation the resulting equilibrium, E(1), is a greater share retained by the lead
arranger but a lower loan spread faced by the borrower. We refer to this shift in the lead
arranger’s demand curve as the diversification effect. In the limit, if the diversification effect is
sufficiently large, the new equilibrium can result in the lead arranger retaining 100 percent of the
loan, i.e., the loan is issued as a sole lending loan.
Second, CDS initiation potentially can affect the lead arranger’s pricing schedule beyond
the diversification effect discussed above. In particular, initiation of CDS trading can also lower
the cost of speculation for investors who are not creditors. These investors may have incentives
8 Even though, in principle, syndicate participants also can purchase CDSs to reduce their exposure to the borrower’s credit risk, they have less incentive than the lead arranger to do so. Typically the lead arranger’s primary objective in arranging debt financing for the borrower is to generate origination fees, and therefore prefers to have minimal exposure to the borrower’s credit risk. In contrast, syndicate participants purchase shares of the syndicated loans with the objective of generating interest revenue from the loans. Purchasing CDSs by syndicate participants would reduce their exposure to loans at a cost of sacrificing their net revenue.

13
to cause the borrower to default on its loans (Soros, 2009; Stulz, 2010; Portes, 2010;Markose et
al., 2012; Che and Sethi, 2013), which increases the credit risk of loans in the lead arranger’s
portfolio.9 However, this increase in credit risk likely is idiosyncratic to the lead arranger and
not borne by the syndicate participants. Whereas the lead bank typically retains a large share of
the loan, each syndicate participant typically holds a small proportion and can diversify away the
extra risk arising from CDS initiation (Ivashina, 2009). The increase in default risk on the lead
arranger’s portfolio will shift the lead arranger’s curve to the left, as the lead arranger will want
to diversify more for a given level of interest spread. We refer to this shift in the lead arranger’s
demand curve as the credit risk effect. Thus, despite the potential benefits of diversification
brought about by CDS initiation, it is possible that this credit risk effect arising from CDS
initiation could result in the lead arranger’s curve shifting on net to the left, which is illustrated
as DLeadA_post_2 in Figure 3 (as indicated by the green demand curve). Note that in contrast to
the equilibrium associated with the diversification effect, E(1), the equilibrium associated with
the credit risk effect, E(2), is a smaller share retained by the lead arranger but a greater loan
spread faced by the borrower. That is E(1) and E(2) have opposite effects on share retained by
the lead arranger and loan spread when compared to E(0).
2.3.3 The new equilibrium in the syndicated loan market
The resulting equilibrium following CDS initiation depends on the relative magnitude of
the adverse selection/moral hazard effect. Returning to Figure 3, if there is little or no adverse
selection/moral hazard effect, then as noted above, the resulting equilibrium is either E(1) or
E(2). In the case of the first equilibrium, E(1), the diversification effect causes DLeadA_pre to
9 To see this, consider the hypothetical example of insurers issuing homeowner policies that provide a payoff to the policyholder in the event of a house fire for a home not owned by the policyholder. Although CDS holders cannot necessarily directly cause a borrower to default on a loan (or, by analogy, “burn down” a home), actions they take collectively in the credit markets—including “bear raiding,” i.e., spreading negative information about a borrower—can make it difficult for a borrower to secure future borrowing.

14
shift to the right, which results in an increase in the share retained by the lead arranger but a
decrease in the borrower’s loan spread. Conversely, in the case of the second equilibrium, E(2),
the credit risk effect dominates the diversification effect, causing DLeadA_pre to shift to the left
such that there is a decrease in the share retained by the lead arranger but an increase in the
borrower’s loan spread.
However, CDS initiation can result in an increase in the adverse selection/moral hazard
effect such that it is sufficiently large so as to dominate the diversification effect (a shift to the
right) or the credit risk effect (a shift to the left). In this case, as Figure 3 illustrates, the resulting
equilibrium is an increase in share retained by the lead arranger and loan spread. That is, in
Figure 3, for both of the new equilibria, E(3) and E(4), share of a loan retained by the lead
arranger and loan spread are higher than are the amounts for E(0). Thus, we will observe an
increase in both share of a loan retained by the lead arranger and loan spread only if there also is
an adverse selection/moral hazard effect that causes a shift to the right in the syndicate
participants’ demand curve.
Taken together, Figures 3 illustrates that CDS initiation can lead to a variety of new
equilibrium combinations of changes in loan share retained by the lead arranger and loan spread.
However, two other observations based on the figures are noteworthy. First, as Figure 3 makes
clear, an economically significant adverse selection/moral hazard effect following CDS initiation
will lead to an increase in both loan share retained and loan spread. Second, observing an
increase in loan spread is not sufficient for determining whether there is an adverse
selection/moral hazard effect. Alternatively stated, it is necessary to observe how share retained
by the lead arranger changes in response to CDS initiation to assess the relative magnitude of the
adverse selection/moral hazard effect relative to the other two effects.

15
One caveat is in order regarding our predictions. As noted above, we expect that the
credit risk effect of CDS initiation will only affect the lead arranger’s demand schedule and not
the syndicate participants’ demand schedule. This assumption may not hold empirically if the
syndicate participants cannot diversify away the credit risk increase. If this is the case, then the
syndicate demand curve could also shift to the right. Such a shift could result in observing an
increase in loan spread regardless of the effect of credit risk on the lead arranger’s pricing
schedule, although it is unclear what would be the resulting equilibrium share retained by the
lead arranger. In addition, observing an increase in both loan share and loan spread no longer
would imply that CDS initiation creates a net adverse selection/moral hazard effect that is caused
by lead arranger using CDSs to hedge credit risk. As a result, following Ivashina (2009) and as
described in the section below, we include a proxy for credit risk when conducting our empirical
tests as a control for the impact of change in credit risk on the syndicate participants’ pricing
schedule.
3. Research Design
In this section we describe the empirical relations between CDS initiation and changes in
loan syndication ownership structure and loan spread. Following Ashcraft and Santos (2009)
and others, we assume that the first trading date is associated with an economically significant
reduced cost of hedging and speculation.10
10 It is possible that the cost of hedging may not fall substantially until the CDS market for the borrower becomes liquid enough to make it practical for the lead arranger to hedge credit risk using CDS contracts. If this is the case, then the first date will mismeasure the date when the cost of hedging credit risk falls, which would make it more difficult for us to find a significant association between CDS initiation and changes in loan syndication ownership structure and loan spread. In addition, use of the binary event—initiation of CDS trading—precludes us from exploiting the cross-sectional and intertemporal variation in the liquidity of the CDS market. However, it is difficult to develop a continuous measure of change in the cost of hedging credit risk based on CDS market liquidity because standard liquidity measures such as bid-ask spread and trading volume generally are not publicly available. Nonetheless, in section 5.3.3 below, we extend our tests to include a measure of CDS market liquidity based on the number of CDS dealers when examining the effects of CDS trading on changes in loan syndication ownership structure and loan spread.

16
3.1 The Effect of CDS Trading on Syndicate Ownership Structure
To test whether CDS initiation leads to an increase, decrease, or no change in the share
retained by the lead arranger, we estimate the following linear regression model given by
equation (1):
LEAD _ OWN = β1TradedPost
it+Controls+ FirmFE+YearMonthFE + ε
it (1)
LEAD _ OWN is percentage of a loan retained by lead arrangers. TradedPost is an indicator
variable that equals one if a loan is issued after the month of CDS initiation, and zero otherwise.
FirmFE and YearMonthFE are firm and year-month fixed effects. This methodology, which is
borrowed directly from Bertrand and Mullainathan (2003), controls for fixed differences between
firms that have CDS contracts traded and those that do not via the firm fixed effects, and controls
for aggregate fluctuations via the year-month fixed effects. As such, equation (1) is essentially a
difference-in-difference research design. If CDS initiation is associated with an increase
(decrease, no change) in the share retained by the lead arranger, then β1 > 0 (β1 < 0 , β1 = 0 ).
Equation (1) includes a set of control variables for a variety of firm- and loan-specific
characteristics suggested by prior research to affect loan syndication. The firm characteristics
include return on assets, ROA; profit margin, Profit; the debt-to asset-ratio, Leverage; firm size
as measured by the natural logarithm of total assets, Log_asset; and credit rating, Rating. Loan
characteristics, include loan spread, LoanSpread, revolver lines, Revolver; term loan B or below,
TermLoanB; and presence of guarantors, Guarantor; the loan dollar amount in billions,
LoanAmt; the loan term in months, Maturity; the number of financial covenants, NCOV; an
indicator variable that equals one if a loan is secured and zero otherwise, Securdum; and a set of
30 indicator variables for loan purpose, e.g., whether a loan is used to finance an acquisition or

17
whether a loan is used to execute a leveraged buyout.11 The appendix provides details of all
variable definitions. We cluster standard errors at the firm level.
3.2 The Effect of CDS Trading on Loan Pricing
To examine the effect of CDS initiation on loan pricing, we estimate the following
regression model:
LoanSpreadit= β
1TradedPost
it+Controls+ FirmFE+YearMonthFE + ε
it (2)
The dependent variable, LoanSpread , is loan spread based on the all-in-drawn spreads over
LIBOR at issue date for loans issued to firm i in year t. Because loan spreads are highly skewed,
following prior studies (e.g., Graham and Qiu, 2008; Chava et al., 2009), we measure
LoanSpread as the natural logarithm of the actual loan spread. If CDS initiation is associated
with an increase (decrease, no change) in the loan spread, then β1 > 0 (β1 < 0 , β1 = 0 ).
Equation (2) includes the same set of control variables as those in equation (1), omitting
LoanSpread .12 In addition, we include in equation (2) an additional loan characteristic, the
number of lenders, Lender_num.13
11 To the extent that changes in ownership structure and loan spread are simultaneously determined, inclusion of loan characteristics, particularly LoanSpread, in equations (1) and (2), can mitigate the effects of potential simultaneity bias on the TradedPost coefficient. 12 We also estimate versions of equation (2) in which we replace LoanSpread with each of four non-price loan terms, LoanAmt, Maturity, NCOV, and Securdum, to examine whether there is any trade-off between price and non-price terms. For example, after CDS initiation borrowers may be charged a higher loan spread—CDS initiation is costly, but may be able to get expanded access to bank lending capital—CDS initiation is beneficial. If this is the case, then the effect of CDS initiation on loan contract terms is ambiguous. However, following prior research, we can interpret the effect of CDS initiation on loan pricing more definitively if the inferences are consistent across the LoanSpread and four non-price loan term estimations. Untabulated findings indicate that there is no evidence of any such trade-off between spreads and these non-price terms after CDS initiation. 13 To the extent that changes in ownership structure and loan spread are simultaneously determined, inclusion of Lender_num in equation (2) can mitigate the effects of potential simultaneity bias on the TradedPost coefficient. We include Lender_num rather than LEAD_OWN because LEAD_OWN is missing for a substantial number of observations in the loan spread equation. However, untabulated findings from estimations that include LEAD_OWN rather than Lender_num yield the same inferences regarding the TradedPost coefficient in equation (2). In addition, we also estimated equations (1) and (2) as a seemingly-unrelated-regression system. Untabulated findings also reveal the same inferences regarding the TradedPost coefficients as those based on tabulated findings.

18
4. Data and Sample
We start by merging the quarterly CRSP-Compustat database with Dealscan to identify a
sample of non-financial US firms that have private loan information and accounting and price
information.14 Each observation in the analysis corresponds to a separate loan agreement, i.e.,
loan deal. We use the following steps to identify CDS initiations for the firms in our sample.
First, we identify all the firms in our merged sample that ever had a CDS traded on their debt
according to Markit. Next, following Ashcraft and Santos (2009), for every firm we identify the
first date on which a five-year-to maturity, U.S.-dollar-denominated CDS contract is traded.15
We use this date as the date of the onset of CDS trading. We eliminate all firms that have a CDS
initiation date in January 2001 because the Markit database begins its coverage then and thus the
CDS initiation date for these firms is ambiguous. The resulting sample includes 836 CDS traded
firms with 7,046 loans over the period 1993-2014. This is the sample we use for estimation of
equation (2).
Using the Markit database to identify the initiation of CDS trading as a means to assess
when the cost of hedging credit risk changed for lead arrangers posses a few challenges. First,
Markit is a contributor-based database. Markit’s CDS User Guide states that as of March 2012,
22 global banks contributed data, with over one million data points are being contributed daily
across approximately 3,000 entity-tiers. For a given contract, Markit calculates a composite
CDS spread if Markit has received prices from at least 3 distinct dealers, of which at least 2 have
passed all data cleaning tests that are proprietary to Markit. As a result, the actual date when
CDS trading begins for a firm may not be the same as date trade information first appears on the
14 Financial firms are those with two-digit SIC between 60 and 64, inclusive (Ivashina, 2009). 15 The five-year-to-maturity CDS market is the most liquid CDS market, and for most reference entities, was the first CDS market. Therefore, using such CDS contracts to determine the onset of CDS trading likely is better for identifying when a lead arranger can effectively use CDSs to hedge credit risk than other CDS contracts.

19
Markit database. This is unlikely to be a serious problem because syndicated loan originations
are infrequent, averaging 22 months between consecutive originations for our sample firms.
Therefore, the time lag between the date of initial trading and appearance on the Markit database
would have to be several months or more to misclassify a loan a originating before or after CDS
trading.
Second, the Markit database only includes CDS contracts written on bonds, i.e., it does
not include LCDS contracts. As noted above, CDS spreads generally exceed LCDS spreads. It
is possible that the initiation of CDS trading did not lower the cost of hedging for lead arrangers,
and they had to wait until LCDS contracts appeared (if at all) later in our sample period to hedge
credit risk. To the extent that this is the case for some of our sample loans, it will be more
difficult for us to detect an effect on loan syndication based on the initiation of CDS trading.16
To develop the sample for estimation of equation (1) we exclude observations for which
shares retained by the lead arranger are unavailable. We generally follow Sufi (2007) to identify
who the lead arranger is for a loan deal.17 Lenders’ commitments, including the lead bank’s
share, are settled at the end of loan syndication. As with Ivashina (2009), information regarding
shares retained by the lead arranger is available for only approximately 30% of loans for which
we can identify a lead arranger. Ivashina (2009) notes that there is a reporting bias regarding
16 Whether the cost of hedging for the lead arranger is significantly lower using LCDS than CDS depends on whether they have substantially different spreads and the relative liquidity of the two markets. Regarding spreads, untabulated statistics reveal that 93% of our sample CDS contracts are written on senior unsecured bonds, 2% are written on senior secured bonds, and 5% are written on subordinated bonds. Recovery rates for senior bonds are closer to those for loans than for other subordinated bonds. As a result, spreads for our sample firms’ CDS contracts are likely to be closer to those for LCDS than those for other subordinated bonds. Regarding liquidity, as noted above, LCDS markets were essentially illiquid until 2007, and it is generally the case that since 2007 LCDS markets continue to be less liquid than CDS markets (Choudhry, 2011). 17 We use two variables to classify lenders as either lead arrangers or participants. Both are available from Dealscan. One variable is “Lead arranger credit” and the other is “Lender role”. We designate as lead arrangers any lender for which the field “lead arranger credit” is marked “Yes”. If this field is unavailable, then lenders that act as an administrative agent, agent, arranger, bookrunner, lead arranger, lead bank, or lead manager are defined to be lead arrangers. When a loan has more than one lead arranger, following Ivashina (2009), we treat them as a single entity when calculating share retained by the lead arranger.

20
lead arranger share in DealScan towards large loans, which implies that the sample loans we use
in our tests are likely to relate to relatively large and transparent borrowers. Other things equal,
this will make it difficult to detect changes in share retained by lead arranger and loan spread
following CDS initiation.18 The resulting sample for the lead arranger’s ownership analysis
contains 616 CDS traded firms and 2,321 loans.19
We obtain our control sample using all US private loans issued by non-CDS-traded firms
with available data in Dealscan. The sample of loans for firms that never have CDS traded
contracts during our sample period includes 4,974 firms with 15,360 loans over the same period.
Thus, our full sample of both CDS traded and non-CDS-traded firms comprises 22,406 loans
from 5,810 unique firms for the loan spread analysis, equation (2), and 6,201 syndicated loans
from 2,599 firms for the lead arranger’s ownership analysis, equation (1). Syndicated loans can
be structured in several facilities. As a result, following Ivashina (2009), when there is more than
one facility in a loan package, we use the loan characteristics of the largest facility.20
Specifically, we measure loan spread, loan amount, maturity, and other facility level variables
based on the largest facility.
Table 1 presents mean and standard deviation statistics for the full sample, as well as
separate statistics for loans before and after CDS trading for CDS traded firms. The average
natural logarithm of loan spread is 5.011 with standard deviation of 0.810. The average share of
the loan retained by the lead arranger is 33% with standard deviation of 22%. The average loan
18 Ivashina (2009) also provides evidence that the reporting bias grows stronger over time. Ivashina (2009) suggests that inclusion of time fixed effects mitigates the effects of this bias. Therefore, we include time fixed effects in our difference-in-difference research design. 19 Because lead bank share is missing more than 70% of the time when loan spread is available, the sample size for the lead arranger’ ownership analysis is different from that for the loan spread analysis. However, untabulated findings relating to our loan spread analysis using the same sample as the lead arranger’s analysis yield the same inferences as those based on the tabulated findings. 20 We also conducted our analyses at the loan facility level, i.e., using all loan facilities. Untabulated findings reveal the same inferences as those based on tabulated findings conducted at the loan deal level.
21
amount is 0.367 billion dollars with standard deviation of 0.592. Debt maturity has a mean of
44.237 months. The average number of financial covenants is 1.5097, and 50.9% of the loans
are secured. Revolvers comprise 77% of the sample. In addition, the statistics for loans before
and after CDS trading for CDS traded firms indicate that log loan spread and share of the loan
retained by the lead arranger are significantly larger after CDS trading (4.726 vs. 4.490 and
30.5% vs. 22.5%). Although we do not test for differences in means for CDS firms and the full
sample, the statistics in table 1 suggest that firms with CDS contracts are larger, more profitable,
more highly levered, and have higher credit ratings.
Comparing loans before and after CDS trading for CDS traded firms provides some
interesting observations. Although firms’ credit ratings appear to improve slightly after CDS
trading, on average they pay higher loan spreads. In addition, average loan size and average loan
maturity, LoanAmt and Maturity, increase, and the number of financial covenants for a loan and
the likelihood of collateral, NCOV and Securedum, also decrease.
5. Results
5.1 Syndicated Loan Market and CDS Initiation
Table 2, Column 1, reports the regression summary statistics associated with estimation
of equation (1). The key finding is that the TradedPost coefficient, 0.041, is significantly
positive (t-statistic = 2.60).21 The magnitudes of the coefficients are also economically
significant. In particular, the TradedPost coefficient implies that the onset of CDS trading leads
to an incremental increase in the percentage of the loan retained by the lead arranger in excess of
4.1%, which is 12.5% of the sample mean for loan share retained by CDS traded firms, 30.5%.
21 Throughout, when discussing a coefficient, we use the term significant to denote a five percent significance level under a two-sided alternative.

22
This finding is consistent with CDS initiation increasing the loan share retained by the
lead arranger. As explained in the prior section, these increases after CDS initiation could reflect
the positive effect of a more efficient alternative diversification mechanism for the lead arranger
or because the negative effect of reducing the effectiveness of ownership in mitigating adverse
selection/moral hazard problems. To identify which effect most likely accounts for such an
increase, we now turn to observing the effect of CDS initiation on loan spreads.
5.2 The Effect of CDS Trading on Loan Pricing
Table 2, Column 2, reports the regression summary statistics associated with estimation
of equation (2). The key finding is that the TradedPost coefficient is significantly positive
(coefficient = 0.131; t-statistic = 5.68). The magnitude of the coefficient is also economically
significant, implying that the onset of CDS trading leads to an increase of approximately 13% of
loan spreads. This implies that for a firm that faced a loan spread of 197bp before CDS
initiation, the average loan spread for firms in our sample, its loan spread increased to
approximately 228bp after CDS initiation. Finding an increase in loan spread following CDS
initiation, together with the finding in Column 1 showing an increase in loan share retained by
the lead arranger, is indicative of a significant increase in the adverse-selection/moral hazard
effect.22 Moreover, the findings suggest that CDS initiation results in an increase in an adverse
selection/moral hazard cost that more than offsets possible diversification benefits to the lead
arranger. Thus, CDS initiation reduces the effectiveness of a lead arranger’s stake in the loan to
serve as a mechanism to address the adverse selection/moral hazard problem.
22 Although Ashcraft and Santos (2009) does not examine the effect of CDS initiation on the share retained by the lead arranger, viewed in isolation the study’s finding of no effect of CDS trading on loan spreads for the average sample firm suggests that the adverse selection/moral hazard and diversification effects are, on average, offsetting. There are several sample and research design differences between Ashcraft and Santos (2009) and our study that likely account for different loan spread results. For example, relative to our study, Ashcraft and Santos (2009) is limited to a smaller sample (approximately 1/5 our sample size) comprised of mostly larger borrowers that, other things equal, are relatively transparent and less likely to be affected by CDS initiation.

23
The majority of the control variables’ coefficients are significant, with signs that are
largely consistent with prior research. For example, firms with high return on assets, ROA, on
average have a lower cost of debt.23 Larger firms (Log_asset) and firms with more tangible
assets (Tangible) enjoying lower load spreads, and more highly leveraged firms (Leverage)
paying higher spreads; the significantly negative coefficient on Revolver and significantly
positive coefficient on TermLoanB indicate that revolver loans and term loans B (i.e., those in
which syndicate participants are non-bank institutions) face lower and higher rates (Harjoto et
al., 2004; Zhang, 2008; Nandy and Shao, 2010; Lim et al., 2013).
Regarding the four non-price loan terms, the loan amount (LoanAmt) and the number of
covenants (NCOV) coefficients are insignificant. However, there is a significantly positive
relation between the loan spread and collateral (Securedum) (Berger and Udell, 1990; Bradley
and Roberts, 2004), and a significantly negative relation between loan spread and maturity,
which perhaps reflects the endogenous determination of loan contractual terms.24
5.3 Additional Tests
5.3.1 Effect of borrower transparency
The findings in table 2 indicate that following CDS initiation there is a significant
increase in the adverse-selection/moral hazard effect. However, if a borrower’s risks and
activities are readily transparent, then the adverse selection problem is less severe and
monitoring by lead arrangers is less important to syndicate participants (Sufi, 2007; Ball et al.,
23 In contrast, the Profit coefficient is positive, indicating that firms with higher profitability pay higher loan spreads. Note, however, that this result is incremental to the negative effect of ROA. Untabulated findings from estimations of equation (2) that omit ROA indicate that the Profit coefficient is significantly negative. 24 Untabulated findings from estimations of equation (2) that exclude the four non-price loan terms yield the same inference regarding the association between TradedPost and loan spread, i.e., the TradedPost coefficient is significantly positive. These additional findings are consistent with simultaneous determination of loan terms not being the cause of the positive relation.

24
2008).25 As a result, if a borrower’s activities are readily transparent, CDS initiation is less
likely to have any effect on adverse selection or moral hazard. In the context of the syndicate
analysis in Figure 3, other things equal, CDS initiation creates a less severe adverse
selection/moral hazard problem for a transparent borrower than for an opaque borrower. As a
result, there is a smaller shift to the right of the syndicate participants’ demand curve, DSynd, for
a transparent borrower. Thus, we predict that CDS initiation causes a smaller increase in share
retained by lead arranger and a smaller increase in loan spread for more transparent firms.
To test our prediction that greater borrower transparency leads to a smaller increase in
shares retained by the lead arranger and a smaller increase in loan spreads, we estimate equations
(1) and (2) separately for firms above and below the sample median, by year, of our financial
reporting transparency measure, DCV. DCV is the debt-contracting value of borrowers’
accounting information developed in Ball, Bushman, and Vasvari (2008) and extended by Dou
(2012). Our DCV measure reflects the inherent ability of firms’ public accounting information to
capture credit quality. DCV is the Somers’ D-statistic derived from the explanatory power of
accounting variables (i.e., earnings, leverage, equity book value and interest coverage) in an
industry-specific probit model of firm credit ratings and ranges from zero—low transparency—
to one—high transparency. As such, DCV reflects the inherent ability of firms’ accounting
amounts to capture credit quality measured at the industry rather than the firm level (see
Appendix for details). If, as we predict, financial reporting transparency mitigates the adverse
effect of CDS trading on loan syndication ownership structure and loan spread, then the
TradedPost coefficient will be smaller for firms with relatively high DCV.
25 In the context of the analysis in section 2, this implies that the DSynd curve for a borrower with higher transparency is to the left of the Dsynd curve for a borrower with lower transparency. Thus, other things equal, greater borrower transparency is expected to lead to a lower equilibrium loan spread and share retained by the lead arranger.
25
We use DCV, a measure of financial statement transparency, rather than equity bid-ask
spread or analysts’ coverage (Ashcraft and Santos, 2009) as our measure of transparency for
several reasons. First, whereas DCV relates specifically to the credit market, equity bid-ask
spread and analysts’ coverage relate primarily to the equity market. Second, DCV is particularly
relevant to the credit markets at the time of loan initiation because accounting information is
primary source of information lenders use when they initiate loans. In this regard, prior studies
provide consistent evidence that accounting information plays an important role in the design of
debt contracts (e.g., Ball et al., 2008; Graham et al., 2008; Armstrong et al., 2010; Amiram,
2013).26 In particular, Ball et al. (2008) demonstrates that when a borrower’s public accounting
information possesses higher DCV, information asymmetry between the lead arranger and other
syndicate participants is lower, which results in lead arrangers being required to retain a lower
loan share.
Table 3, panels A and B, reports summary statistics associated with estimation of
equations (1) and (2) for the subsamples of high and low financial reporting transparency, DCV,
i.e., firms for which DCV is above or below the sample median, by year. The key finding in
table 3 is that the TradedPost coefficients are significantly higher for low transparency firms for
both analyses, which is consistent with our prediction that transparency has a moderating
influence on the adverse effect of CDS initiation on the loan syndication market.
Regarding share retained by the lead arranger, panel A reveals that the TradedPost
coefficients for low and high DCV firms are 0.068 and 0.005, and the difference is significantly
26 Sufi (2007) uses whether a firm is an SEC registrant as a proxy for transparency. We cannot consider this proxy because all of our sample loans relate to borrowers that are SEC registrants.

26
positive ( χ 2 -statistic = 10.22, p-value < 0.001).27 These findings imply that CDS trading is
associated with an increase in the percentage of the loan retained by the lead arranger that is
6.3% smaller (= 0.068 – (0.005)) for high DCV firms relative to low DCV firms.
Finally, regarding loan spread, panel B reveals that the TradedPost coefficients for low
and high DCV firms are 0.160 and 0.091, and the difference is significantly positive ( χ 2 -statistic
= 5.61, p-value = 0.017). This finding implies that CDS trading is associated with an increase in
loan spread that is 6.9% (= 0.160 – 0.091) smaller for high DCV firms relative to low DCV firms,
which is consistent with the finding in Ashcraft and Santos (2009) that opaque firms pay a higher
loan spread following CDS initiation.
We also estimated versions of equations (1) and (2) that use analysts’ coverage, a
measure of transparency used in Ashcraft and Santos (2009), in place of DCV. In particular, we
estimate equations (1) and (2) separately for firms above and below the top quintile of number of
analysts based on each firm’s average number of analysts that follow the firm during our sample
period. Regarding equation (1), untabulated findings reveal that the TradedPost coefficients for
firms with number of analysts below and above the top quintile are 0.139 and 0.014, and the
difference is significantly positive ( χ 2 -statistic = 18.1, p-value < 0.001). Regarding equation
(2), untabulated findings reveal that the TradedPost coefficients for firms with number of
analysts below and above the top quintile are 0.045 and 0.007, and the difference is significantly
positive ( χ 2 -statistic = 4.58, p-value = 0.032). These findings support the tabulated findings
based on DCV that high borrower transparency has a moderating influence on the adverse effect
of CDS initiation on the loan syndication market.
27 Because we have a signed prediction for the difference in TradedPost coefficients between low and high transparency firms, we use a five percent significance level under a one-sided alternative. For ease of exposition, the reported p-values in table 3 assume a two-sided alternative.

27
5.3.2 The role of lead bank reputation
Another factor that possibly mitigates the adverse selection/moral hazard problem at the
level of the lead arranger is reputational costs of the lead arranger. The syndicated loan market is
one of repeated interactions, and most reputable lead arrangers may be able to overcome moral
hazard concerns. Sufi (2007), among other studies, finds that lead arranger reputation can serve
as an effective mechanism in reducing moral hazard, even though reputation does not eliminate
moral hazard. Thus, because we expect lead arranger banks with higher reputation are less likely
to reduce their monitoring effort, we predict that the negative effect of CDS initiation on loan
share retained and loan pricing is more pronounced for lead arrangers with a less established
reputation in the syndicated loan marketplace. To see this in the context of the syndicate
analysis in Figure 3, if a high reputation lead arranger has a greater incentive to monitor a
borrower than a lead arranger with a low reputation, then CDS initiation will result in a smaller
shift to the right of the syndicate participants’ demand curve, DSynd_pre.
To test this prediction, we estimate versions of equations (1) and (2) separately for
observations with lead arrangers that have relatively high and low reputations. Following Sufi
(2007), we measure lead arranger reputation, MKT_PCT, as the percentage market share of
syndicated loan amount initiated by the lead arranger in the prior calendar year.28 We classify
observations into high and low reputation subsamples as follows. For each year, we first sort
loans by the MKT_PCT for the loan’s lead arranger. We then classify those loans in the top
quintile of MKT_PCT as the high reputation sample for each given year. Table 4, panels A and
B, reports the regression summary statistics relating to the two sets of estimations.
28 We obtain MKT_PCT from the historical league tables in SDC Platinum. JP Morgan, Bank of American Merrill Lynch, and Citigroup are the largest banks in the syndicated loan market in terms of lending volume during our sample period. These three banks together control approximately 50% of the market share in the global syndicated loan market.

28
Regarding share retained by the lead arranger, panel A reveals that the TradedPost
coefficients for the low and high reputation subsamples are 0.047 and 0.012, and the difference is
significantly positive ( χ 2 -statistic = 3.12, p-value = 0.074).29 This finding implies that CDS
trading is associated with an increase in the percentage of the loan retained by the lead arranger
that is 3.5% smaller when a lead arranger has a high reputation.
Regarding loan spread, panel B reveals that the TradedPost coefficients for low and high
reputation subsamples are 0.144 and 0.063, and the difference is significantly positive ( χ 2 -
statistic = 7.84, p-value = 0.005). This finding implies that CDS trading is associated with an
increase in loan spread that is 8.1% smaller when the lead arranger has a high reputation.
5.3.3 CDS market liquidity
A key assumption in our use of CDS initiation as an indication that the cost of hedging
credit risk decreases for the lead arranger is predicated on the existence of a liquid CDS market.
To the extent that there is heterogeneity in our sample regarding CDS market liquidity, a
question arises whether the effects of CDS initiation on loan syndication structure and loan
spread are greater when CDS market liquidity is higher. To address this question, we re-estimate
equations (1) and (2) for subsamples of observations with relatively high and low CDS market
liquidity. Following Ashcraft and Santos (2009) and Qiu and Yu (2012), we use the number of
distinct dealers providing quotes as our proxy for the liquidity of CDS contracts. We classify a
CDS traded firm as having high (low) CDS market liquidity if the mean number of daily distinct
dealers during the post-CDS initiation period is above (below) the sample median. When
estimating equations (1) and (2) for the subsamples, we use the full control sample of non-CDS
29 Because we have a signed prediction for the difference in TradedPost coefficients between firms in the low and high reputation subsamples, we use a five percent significance level under a one-sided alternative. For ease of exposition, the reported p-values in table 4 assume a two-sided alternative.

29
traded firms.30 Table 5, panels A and B, reports the regression summary statistics relating to the
two sets of estimations.
Regarding share retained by the lead arranger, panel A reveals that the TradedPost
coefficients for the high and low CDS market liquidity subsamples are 0.068 and 0.030, and
significantly so only for the high liquidity subsample (t-statistics = 3.34 and 1.30). Moreover,
the difference is significantly positive ( χ 2 -statistic = 3.98, p-value = 0.046). These findings
indicate that CDS trading is associated with an increase in the percentage of the loan retained by
the lead arranger only when there is sufficient market liquidity for CDS trading to serve as an
efficient mechanism for the lead arranger to hedge credit risk.
Regarding loan spread, panel B reveals that the TradedPost coefficients for high and low
CDS market liquidity subsamples are 0.206 and 0.119. Although both coefficients are
significantly positive (t-statistics = 6.18 and 3.95), the difference is significantly positive ( χ 2 -
statistic = 5.15, p-value = 0.023). This finding implies that CDS trading is associated with an
increase in loan spread that is 8.7% larger for firms with relatively high levels of CDS market
liquidity.
Taken together, the findings in table 5 suggest that the moral hazard/adverse selection
effects we document in table 2 are concentrated in those loans for which CDS contracts are
relatively liquid.
5.3.4 Propensity score matching and Heckman two-stage estimation
A key assumption of the regression approach represented by equations (1) and (2) and
similarly employed in prior literature (Ashcraft and Santos, 2009; Subarhmanyam et al., 2014) is
30 We also estimated a single regression each for equations (1) and (2) that includes high and low CDS liquidity firms and the control sample. Untabulated findings reveal the same inferences to those based on the findings in table 5.

30
that the timing of CDS introduction is exogenous. However, it is possible that the initiation of
CDS trading for a reference entity is the result of an increase in its credit risk. Hence, changes in
syndicate ownership structure and loan terms could be the result of change in credit risk and not
CDS initiation. If this is the case, then the estimated parameters in equations (1) and (2) are
subject to endogeneity bias.31
We use two approaches to address potential endogeneity bias when assessing the effect of
CDS initiation on loan share retained and loan pricing, propensity score matching and the
Heckman two-stage approach. Because each of these approaches relies on different assumptions,
finding a consistent result across the different approaches provides support for inferences that we
draw. We implement propensity score matching following Ashcraft and Santo (2009) and
Subrahmanyam et al. (2014). In particular, we match each CDS traded firm-quarter beginning in
2001 until the first quarter when CDS trading is introduced with a firm-quarter for a non-CDS
traded firm. We do this by first estimating a Probit model with TradedPost as the dependent
variable and the firm-specific variables as independent variables, and then using the estimated
model parameters to calculate propensity scores for each firm. We match each CDS firm to the
non-CDS trading firm whose propensity score is closest, doing so without replacement.
The Heckman two-stage correction model treats the selection bias as an omitted variable
bias. In the first step, we estimate a selection model similar to that used in Ashcraft and Santos
(2009) and Subrahmanyam et al. (2014):
Pr(TradedPostit = 1) = F(Zit + eit ) (3) 31 Identifying whether an increase in loan spread is the result of CDS initiation or an increase in credit risk of the reference entity potentially is more problematic than identifying whether a change in the lead arranger’s ownership stake is the result CDS initiation or an increase in credit risk. This is because, if an increase in credit risk affects the lead arranger’s pricing schedule as suggested in section 2.3.2, the direct effect of an increase in credit risk is a decrease in the lead arranger’s share. Thus, even if an increase in credit risk causes CDS initiation, observing an increase in the lead arranger’s ownership implies that CDS initiation is the underlying cause of the increase in the lead arranger’s ownership. However, if there is a decrease in the lead arranger’s ownership following CDS initiation, it is difficult to identify whether CDS initiation or an increase in credit risk is the underlying cause.

31
where Z is a set of explanatory variables that are assumed to determine the likelihood of CDS
trading. These include stock return volatility, firm size, leverage, profitability, credit ratings,
whether the firm has rated debt as of last loan before CDS initiation, proportion of tangible
assets, loss given default, probability of default, ROA and stock market excess return. In the
second step, we estimate equations (1) and (2) but including the Inverse Mills ratio obtained
from the first step as an additional explanatory variable.
Untabulated findings indicate that the effect of CDS initiation on the lead arranger’s
ownership is robust to controlling for endogeneity by using the propensity score matching and
the two-stage Heckman correction for the selection of firms with CDS traded. In particular, the
TradedPost coefficient is significantly positive for the share retained by the lead arranger.
Untabulated findings also indicate that the effect of CDS initiation on loan pricing is robust to
the propensity score matching and the two-stage Heckman-correction. In particular, the
coefficients on TradedPost based on the propensity score matched sample and in the Heckman
second-stage regression are positive and significant. Taken together, these findings provide
additional support that the inferences we draw from the table 2 findings—that CDS initiation has
adverse effects on the syndicated loan market structure and loan pricing—are not the result of the
selection bias associated with the onset of CDS trading for a firm.
6. Summary and Concluding Remarks
In this paper, we provide evidence that the initiation of CDS market trading exacerbates
the information asymmetry problems within the loan syndicate. In particular, we find that, on
average, lead arrangers’ ownership in syndicated loans and loan spreads increases after CDS
initiation. Based on predictions developed using the Ivashina (2009) framework, these two
findings suggest that any potential diversification benefit lead arrangers enjoy following CDS

32
initiation is more than offset by CDS markets limiting the ability of lead arrangers’ ownership to
mitigate the adverse selection/moral hazard problems in loan syndication. We conduct our
analyses using a sample of 22,406 loan contracts from Dealscan over the period 1993-2014, and
test our predictions using a difference-in-difference research design.
We corroborate the interpretation of these results by predicting and finding evidence that
the effect of an increase in the adverse selection/moral hazard problem following CDS initiation
is larger for borrowers with lower transparency and for loans originated by a lead arranger with a
relatively low reputation in the syndicated loan market. Additional findings suggest that the
adverse selection/moral hazard effects are concentrated in those loans for which CDS contracts
are relatively liquid. Inferences from our tests of the effects of CDS initiation are robust to using
propensity score matching and the Heckman two-stage correction for self-selection bias.
Although our study provides evidence of a significant increase in the adverse
selection/moral hazard problem, it is important to note that this does not imply that there is a net
aggregate cost of CDS trading on the syndicated loan market. In particular, even though lead
arranger might have to retain a larger fraction of each loan they originate and syndicate, because
of regulatory capital and other benefits lead arrangers could be in a position to originate more
loans. We leave it to future research to assess the aggregate costs and benefits of CDS trading on
the loan syndication market.

33
APPENDIX: Variable Definition
Variables Description
Loan characteristics Log_spread The natural logarithm of loan spread, which equals the spread
between the interest rate on the loan and the relevant Libor rate, per dollar of loan, measured in basis points. This spread is for the largest facility within a loan package.
LoanAmt The dollar amount of the largest facility within a loan package in billions.
Maturity The term of the largest facility within a loan package (in months). NCOV The number of financial and net worth covenants reported on
Dealscan. If no data are available we assume the number of covenants in the contracts is zero.
Securedum An indicator variable that equals one if the debt is secured and zero otherwise; if missing collateral data, we set it equal to 0.
LEAD_OWN The fraction of the loan package owned by the lead arranger. TermLoanB An indicator variable that equals one if the largest facility within a
loan package is term loan B, C, or D, and zero otherwise. Revolver An indicator variable that equals one if the largest facility within a
loan package is a revolver, and zero otherwise. Guarantor An indicator variable that equals one when borrower has a guarantor,
and zero otherwise. Lender_num The number of lenders on a loan. MKT_PCT The percentage market share of syndicated loan amount initiated by
the lead arranger in the prior calendar year.
Firm characteristics and others TradedPost An indicator variable that equals one if a loan is issued after the
month of CDS initiation, and zero otherwise. ROA Return on assets. It is defined as operating income after depreciation
divided by total assets. Profit Profit margin. It is defined as operating income after depreciation
divided by total sales. Leverage Total debt (short-term debt plus long-term debt) divided by total
assets. (Continued)

34
APPENDIX - continued
Variables Description Tangible Property, plant and equipment (PPE) divided by total assets. Log_asset The natural logarithm of a firm’s total assets. DCV A credit market based financial reporting transparency measure computed
as the Somers’ D association statistic obtained from industry-specific probit regressions that predict credit ratings; industries are based on Fama and French(1997) industry groupings. Specifically, for any given year t, we estimate an ordered probit model using quarterly data in the past five years for each industry grouping:
P(Ratingq,i ≤ N ) = Φ( µn +n=1
N∑ α k Eq−k ,i +k=1
4∑ βkCOVq−k ,i +k=1
4∑ δ k LEVq−k ,i +k=1
4∑ γ k NWq−k ,ik=1
4∑ ) ,
where Rating is constructed by assigning 1 to firms with the highest S&P credit rating AAA in quarter q, 2 to AA+ and so on. E is EBITDA in quarter q-k divided by total assets at the beginning of the quarter. COV is interest coverage in quarter q-k (EBITDA divided by total interest expense). LEV is the long-term debt in quarter q-k divided by total assets. NW is common equity in quarter q-k divided by total assets. Each regression requires at least 100 firm-quarter observations. DCV is measured as Somers’s D, a goodness-of-fit statistic.
Rating A numeric rank of S&P credit ratings. We assign 1 to AAA, 2 to AA+, 3 to AA, etc. For firms without credit ratings, we follow the approach in Beaver et al. (1998) to use accounting measures to generate credit ratings.
35
References
Acharya, V., Johnson, T., 2007. Insider trading in credit derivatives, Journal of
Financial Economics 84: 110-141.
Amiram, D., 2013. Debt contracts and loss given default. Working Paper, Columbia University.
Ai, C., Norton, E., 2003. Interaction terms in logit and probit models. Economics letters 80: 123-
129.
Ashcraft, A., Santos, J., 2009. Has the CDS market lowered the cost of corporate debt?, Journal
of Monetary Economics 56: 514-523.
Armstrong, C., Guay, W., Weber, J., 2010. The role of information and financial reporting in
corporate governance and debt contracting. Journal of Accounting and Economics 50:
179-234.
Ball, R., Bushman, R., M., Vasvari, F., 2008. The Debt-Contracting Value of Accounting
Information and Loan Syndicate Structure. Journal of Accounting Research 46: 247-287.
Barth, M., Beaver, W., Landsman, W. 1998. Relative valuation roles of equity book value and
net income as a function of financial health. Journal of Accounting and Economics 25: 1-
34.
Berger, A., Udell, G., 1990. Collateral, loan quality and bank risk, Journal of Monetary
Economics 251: 21-42.
Bertrand, M., and Mullainathan, S, 2003. Enjoying the Quiet Life? Corporate Governance and
Managerial Preferences. Journal of Political Economy 111: 1043-75.
Bolton, P., Oehmke, M., 2011. Credit default swaps and the empty creditor problem. Review of
Financial Studies 24: 2617-2655.
Bradley, M., Roberts, M., 2004. The structure and pricing of corporate debt covenants, Working
Paper, University of Pennsylvania.
Cameron, A. C., Trivedi, K., 2005. Microeconometrics: methods and applications. Cambridge
university press.
Cebenoyan, S., Strahan, P., 2004. Risk management, capital structure and lending at banks.
Journal of Banking & Finance 28: 19-43.
Chava, S., Livdan, D., Purnanandam, A., 2009. Do shareholder rights affect the cost of bank
loans?. Review of Financial Studies 22: 2973-3004.

36
Che, Y., Sethi, R., 2013. Credit Market Speculation and the Cost of Capital, Working paper,
Columbia University
Choudhry, M., 2011. Structured credit products: Credit Derivatives and Synthetic Securitisation,
Edition 2. John Wiley & Sons.
Dou, Y., 2012. The Debt-Contracting Value of Accounting Numbers, Renegotiation, and
Investment Efficiency. Working paper, University of Toronto.
Duffee, G., Zhou, C., 2001. Credit derivatives in banking: Useful tools for managing risk?.
Journal of Monetary Economics 48: 25-54.
Fama, E., French, K., 1997. Industry costs of equity. Journal of financial economics 43(2): 153-
193.
Fink, R., 2004. Credit default swaps: Who’s doing what? CFO.com, October 7.
Gopalan, R., Nanda, V., and Yerramilli, V. 2011. Does poor performance damage the reputation
of financial intermediaries? Evidence from the loan syndication market. The Journal of
Finance 66: 2083-2120.
Graham, J., Si, L., Qiu, J., 2008. Corporate misreporting and bank loan contracting. Journal of
Financial Economics 89: 44-61.
Harjoto, M., Mullineaux, D., Yi H., 2006. Loan pricing at investment versus commercial banks,
Financial Management 35: 49-70.
Hillegeist, S., Keating, E., Cram, D., Lundstedt, K., 2004. Assessing the probability of
bankruptcy. Review of Accounting Studies 9: 5-34.
Hirtle, B., 2009. Credit derivatives and bank credit supply. Journal of Financial Intermediation
18: 125-150.
Hu, H., Black, B., 2008a. Debt, equity and hybrid decoupling: Governance and systemic risk
implications. European Financial Management 14: 663-709.
Hu, H., Black, B., 2008b, Equity and debt decoupling and empty voting II: Importance and
extensions, University of Pennsylvania Law Review 156: 625-739.
ISDA., 2013. Summaries of Market Survey Results. http://www.isda.org/statistics/recent.html
Ivashina, V., 2009. Asymmetric information effects on loan spreads. Journal of Financial
Economics, 92: 300-319.
Kim, J., Shroff, P., Vyas, D., Wittenberg M., 2014. Active CDS Trading and Managers’
Voluntary Disclosure. Working paper, University of Chicago.
37
Lim, J., Minton, B., and Weisbach, B., 2013. Syndicated Loan Spreads and the Composition of
the Syndicate. Working paper, Ohio State University
Markose, S., Giansante, S., Shaghaghi, A. R., 2012. ‘Too interconnected to fail’ financial
network of US CDS market: Topological fragility and systemic risk. Journal of
Economic Behavior & Organization, 83(3), 627-646.
Martin, X., Roychowdhury, S., 2015. Do Financial Market Developments Influence Accounting
Practices? Credit Default Swaps and Borrowers’ Reporting Conservatism. Journal of
Accounting and Economics 59: 80-104
Morrison, A., 2005. Credit derivatives, disintermediation, and investment decisions, Journal of
Business 78: 621-47.
Nandy, D., Shao, P., 2010, Institutional investment in syndicated loans. Working Paper, York
University
Norden, L., Buston, C., Wagner, W., 2011. Banks’ use of credit derivatives and the pricing of
loans: What is the channel and does it persist under adverse economic conditions?,
Working paper, Tilburg University
Portes, R. 2010. “Ban Naked CDS,” Eurointelligence, March 18.
Qiu, J., Yu, F., 2012. Endogenous liquidity in credit derivatives. Journal of Financial Economics
103: 611-631.
Ross, D.G. 2010. The “dominant bank effect:” How high lender reputation affects the
information content and terms of bank loans. Review of Financial Studies 23: 2730-
2756.
Saretto, A., Tookes, H., 2013. Corporate Leverage, Debt Maturity, and Credit Supply: The Role
of Credit Default Swaps. Review of Financial Studies 26: 1190-1247.
Soros, G., 2009. Soros slams ‘instruments of destruction.’
http://money.cnn.com/2009/06/12/news/economy/soros_swaps.reut/index.htm
Song, W., 2013. Do Credit Default Swaps Affect Lending Practices? Evidence from Syndicate
Structures and the London Whale Incident. Working paper, Louisiana State University.
Stulz, R., 2010. Credit Default Swaps and the Credit Crisis. Journal of Economic Perspectives
24 : 73-92.
Subrahmanyam, M., Tang, D., Wang, S., 2014. Does the tail wag the dog? The effect of credit
default swaps on credit risk. Review of Financial Studies, 27(10), 2927-2960.

38
Sufi, A. 2007. Information asymmetry and financing arrangements: Evidence from syndicated
loans. The Journal of Finance 62: 629-668.
Sustersic, J., 2012. Do traded credit default swaps impact lenders' monitoring activities?
Evidence from private loan agreements (Doctoral dissertation, The Ohio State
University).
Thomson Reuters., 2014. Global Syndicated Loans Review.
http://dmi.thomsonreuters.com/Content/Files/4Q2014_Global_Syndicated_Loans_Revie
w.pdf
Zhang, J., 2008. The contracting benefits of accounting conservatism to lenders and borrowers,
Journal of Accounting and Economics 45: 27-54.
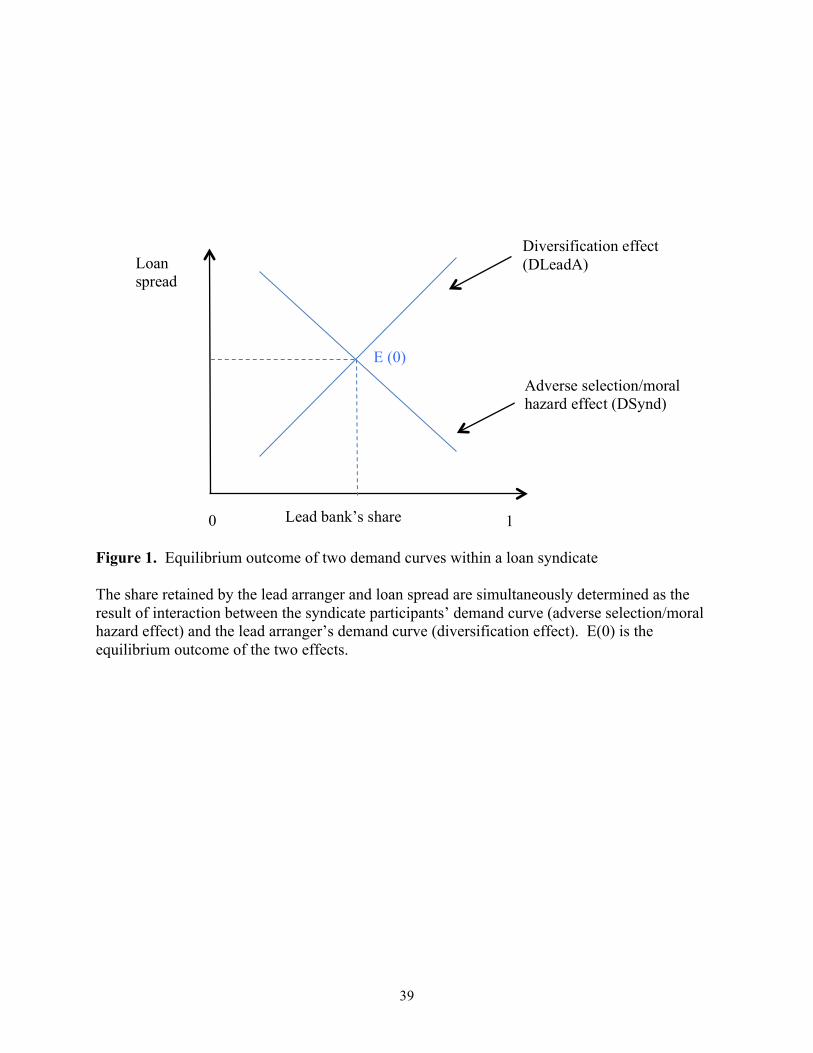
39
Figure 1. Equilibrium outcome of two demand curves within a loan syndicate The share retained by the lead arranger and loan spread are simultaneously determined as the result of interaction between the syndicate participants’ demand curve (adverse selection/moral hazard effect) and the lead arranger’s demand curve (diversification effect). E(0) is the equilibrium outcome of the two effects.
Lead bank’s share
Loan spread
0 1
Diversification effect (DLeadA)
Adverse selection/moral hazard effect (DSynd)
E (0)

40
Figure 2. CDS initiation and the adverse selection/moral hazard effect The share retained by the lead arranger and loan spread are simultaneously determined as the result of interaction between the syndicate participants’ demand curve (adverse selection/moral hazard effect) and the lead arranger’s demand curve (diversification effect). E(0) is the equilibrium outcome of the two effects before CDS initiation. After CDS initiation, if DSynd_pre shifts to the right as indicated by the red line, DSynd_post, then the new equilibrium outcome is E(1).
Loan spread
Lead bank’s share
0 1
Adverse selection/moral hazard effect (DSynd_pre)
Diversification effect (DLeadA)
Adverse selection/moral hazard effect (DSynd_post)
E (1)
E (0)
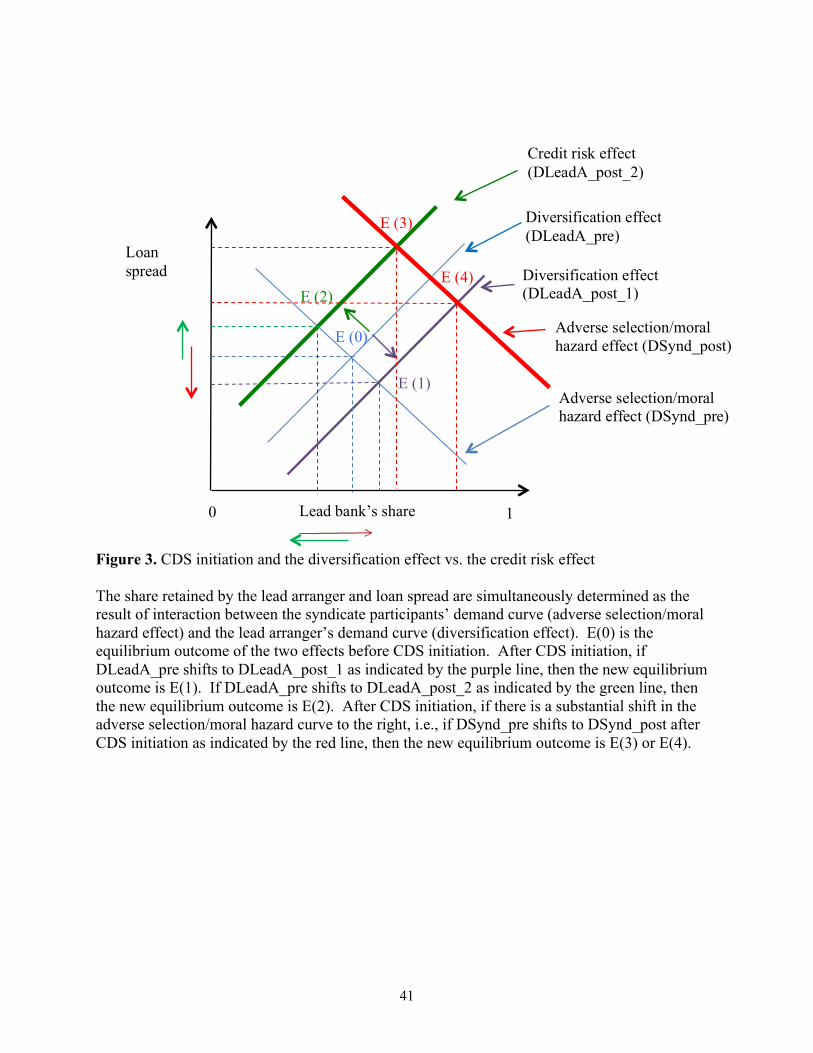
41
Figure 3. CDS initiation and the diversification effect vs. the credit risk effect The share retained by the lead arranger and loan spread are simultaneously determined as the result of interaction between the syndicate participants’ demand curve (adverse selection/moral hazard effect) and the lead arranger’s demand curve (diversification effect). E(0) is the equilibrium outcome of the two effects before CDS initiation. After CDS initiation, if DLeadA_pre shifts to DLeadA_post_1 as indicated by the purple line, then the new equilibrium outcome is E(1). If DLeadA_pre shifts to DLeadA_post_2 as indicated by the green line, then the new equilibrium outcome is E(2). After CDS initiation, if there is a substantial shift in the adverse selection/moral hazard curve to the right, i.e., if DSynd_pre shifts to DSynd_post after CDS initiation as indicated by the red line, then the new equilibrium outcome is E(3) or E(4).
Loan spread
0 1
Adverse selection/moral hazard effect (DSynd_pre)
Diversification effect (DLeadA_pre)
Lead bank’s share
Diversification effect (DLeadA_post_1)
Credit risk effect (DLeadA_post_2)
E (1)
E (2)
E (0) Adverse selection/moral hazard effect (DSynd_post)
E (3)
E (4)
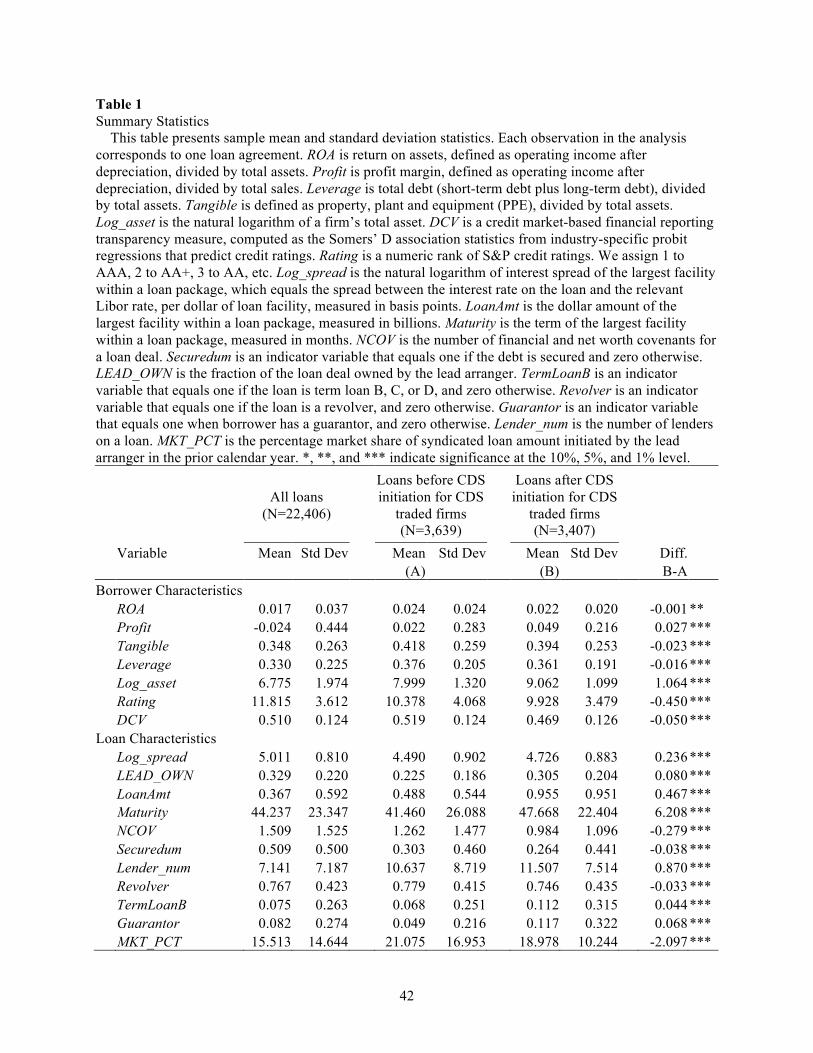
42
Table 1 Summary Statistics This table presents sample mean and standard deviation statistics. Each observation in the analysis corresponds to one loan agreement. ROA is return on assets, defined as operating income after depreciation, divided by total assets. Profit is profit margin, defined as operating income after depreciation, divided by total sales. Leverage is total debt (short-term debt plus long-term debt), divided by total assets. Tangible is defined as property, plant and equipment (PPE), divided by total assets. Log_asset is the natural logarithm of a firm’s total asset. DCV is a credit market-based financial reporting transparency measure, computed as the Somers’ D association statistics from industry-specific probit regressions that predict credit ratings. Rating is a numeric rank of S&P credit ratings. We assign 1 to AAA, 2 to AA+, 3 to AA, etc. Log_spread is the natural logarithm of interest spread of the largest facility within a loan package, which equals the spread between the interest rate on the loan and the relevant Libor rate, per dollar of loan facility, measured in basis points. LoanAmt is the dollar amount of the largest facility within a loan package, measured in billions. Maturity is the term of the largest facility within a loan package, measured in months. NCOV is the number of financial and net worth covenants for a loan deal. Securedum is an indicator variable that equals one if the debt is secured and zero otherwise. LEAD_OWN is the fraction of the loan deal owned by the lead arranger. TermLoanB is an indicator variable that equals one if the loan is term loan B, C, or D, and zero otherwise. Revolver is an indicator variable that equals one if the loan is a revolver, and zero otherwise. Guarantor is an indicator variable that equals one when borrower has a guarantor, and zero otherwise. Lender_num is the number of lenders on a loan. MKT_PCT is the percentage market share of syndicated loan amount initiated by the lead arranger in the prior calendar year. *, **, and *** indicate significance at the 10%, 5%, and 1% level.
All loans (N=22,406)
Loans before CDS initiation for CDS
traded firms (N=3,639)
Loans after CDS initiation for CDS
traded firms (N=3,407)
Variable Mean Std Dev
Mean Std Dev
Mean Std Dev
Diff.
(A) (B) B-A Borrower Characteristics
ROA 0.017 0.037
0.024 0.024
0.022 0.020
-0.001 **
Profit -0.024 0.444
0.022 0.283
0.049 0.216
0.027 ***
Tangible 0.348 0.263
0.418 0.259
0.394 0.253
-0.023 ***
Leverage 0.330 0.225
0.376 0.205
0.361 0.191
-0.016 ***
Log_asset 6.775 1.974
7.999 1.320
9.062 1.099
1.064 ***
Rating 11.815 3.612
10.378 4.068
9.928 3.479
-0.450 ***
DCV 0.510 0.124
0.519 0.124
0.469 0.126
-0.050 ***
Loan Characteristics
Log_spread 5.011 0.810
4.490 0.902
4.726 0.883
0.236 ***
LEAD_OWN 0.329 0.220
0.225 0.186
0.305 0.204
0.080 ***
LoanAmt 0.367 0.592
0.488 0.544
0.955 0.951
0.467 ***
Maturity 44.237 23.347
41.460 26.088
47.668 22.404
6.208 ***
NCOV 1.509 1.525
1.262 1.477
0.984 1.096
-0.279 ***
Securedum 0.509 0.500
0.303 0.460
0.264 0.441
-0.038 ***
Lender_num 7.141 7.187
10.637 8.719
11.507 7.514
0.870 ***
Revolver 0.767 0.423
0.779 0.415
0.746 0.435
-0.033 ***
TermLoanB 0.075 0.263
0.068 0.251
0.112 0.315
0.044 ***
Guarantor 0.082 0.274
0.049 0.216
0.117 0.322
0.068 ***
MKT_PCT 15.513 14.644 21.075 16.953 18.978 10.244 -2.097 ***
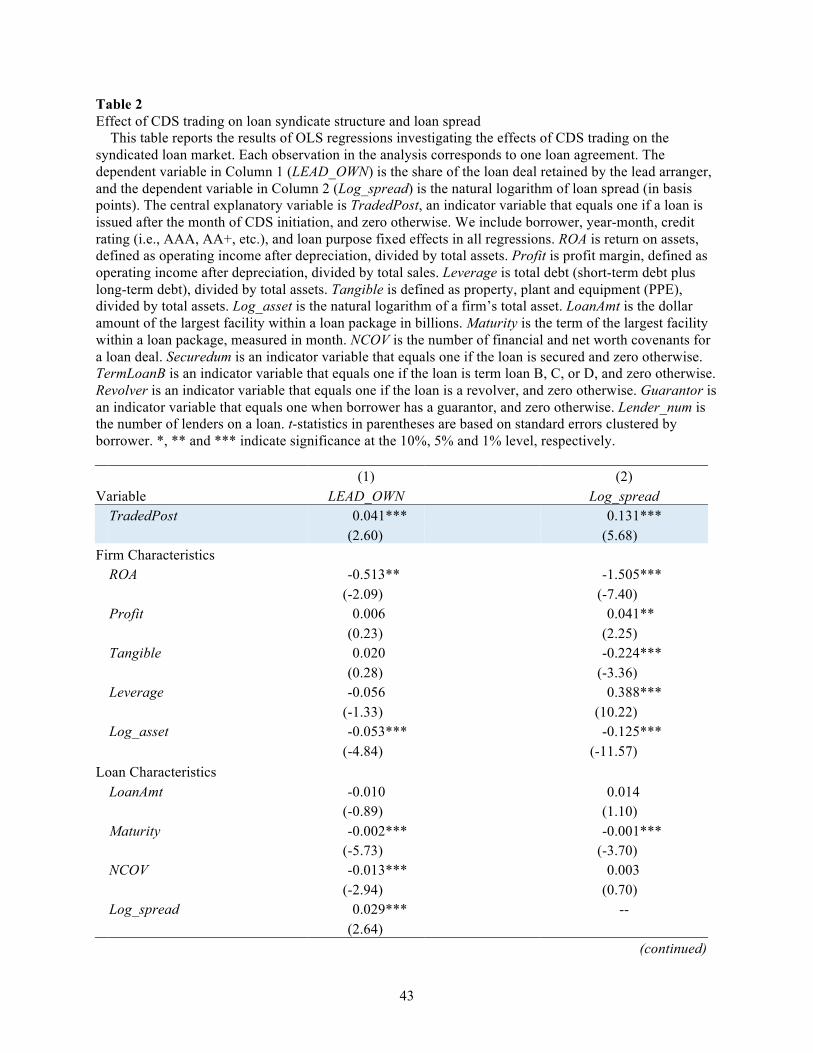
43
Table 2 Effect of CDS trading on loan syndicate structure and loan spread This table reports the results of OLS regressions investigating the effects of CDS trading on the syndicated loan market. Each observation in the analysis corresponds to one loan agreement. The dependent variable in Column 1 (LEAD_OWN) is the share of the loan deal retained by the lead arranger, and the dependent variable in Column 2 (Log_spread) is the natural logarithm of loan spread (in basis points). The central explanatory variable is TradedPost, an indicator variable that equals one if a loan is issued after the month of CDS initiation, and zero otherwise. We include borrower, year-month, credit rating (i.e., AAA, AA+, etc.), and loan purpose fixed effects in all regressions. ROA is return on assets, defined as operating income after depreciation, divided by total assets. Profit is profit margin, defined as operating income after depreciation, divided by total sales. Leverage is total debt (short-term debt plus long-term debt), divided by total assets. Tangible is defined as property, plant and equipment (PPE), divided by total assets. Log_asset is the natural logarithm of a firm’s total asset. LoanAmt is the dollar amount of the largest facility within a loan package in billions. Maturity is the term of the largest facility within a loan package, measured in month. NCOV is the number of financial and net worth covenants for a loan deal. Securedum is an indicator variable that equals one if the loan is secured and zero otherwise. TermLoanB is an indicator variable that equals one if the loan is term loan B, C, or D, and zero otherwise. Revolver is an indicator variable that equals one if the loan is a revolver, and zero otherwise. Guarantor is an indicator variable that equals one when borrower has a guarantor, and zero otherwise. Lender_num is the number of lenders on a loan. t-statistics in parentheses are based on standard errors clustered by borrower. *, ** and *** indicate significance at the 10%, 5% and 1% level, respectively. (1) (2) Variable LEAD_OWN Log_spread TradedPost 0.041*** 0.131*** (2.60) (5.68) Firm Characteristics
ROA -0.513**
-1.505***
(-2.09)
(-7.40)
Profit 0.006
0.041**
(0.23)
(2.25)
Tangible 0.020
-0.224***
(0.28)
(-3.36)
Leverage -0.056
0.388***
(-1.33)
(10.22)
Log_asset -0.053***
-0.125***
(-4.84)
(-11.57)
Loan Characteristics
LoanAmt -0.010
0.014
(-0.89)
(1.10)
Maturity -0.002***
-0.001***
(-5.73)
(-3.70)
NCOV -0.013***
0.003
(-2.94)
(0.70)
Log_spread 0.029***
--
(2.64)
(continued)
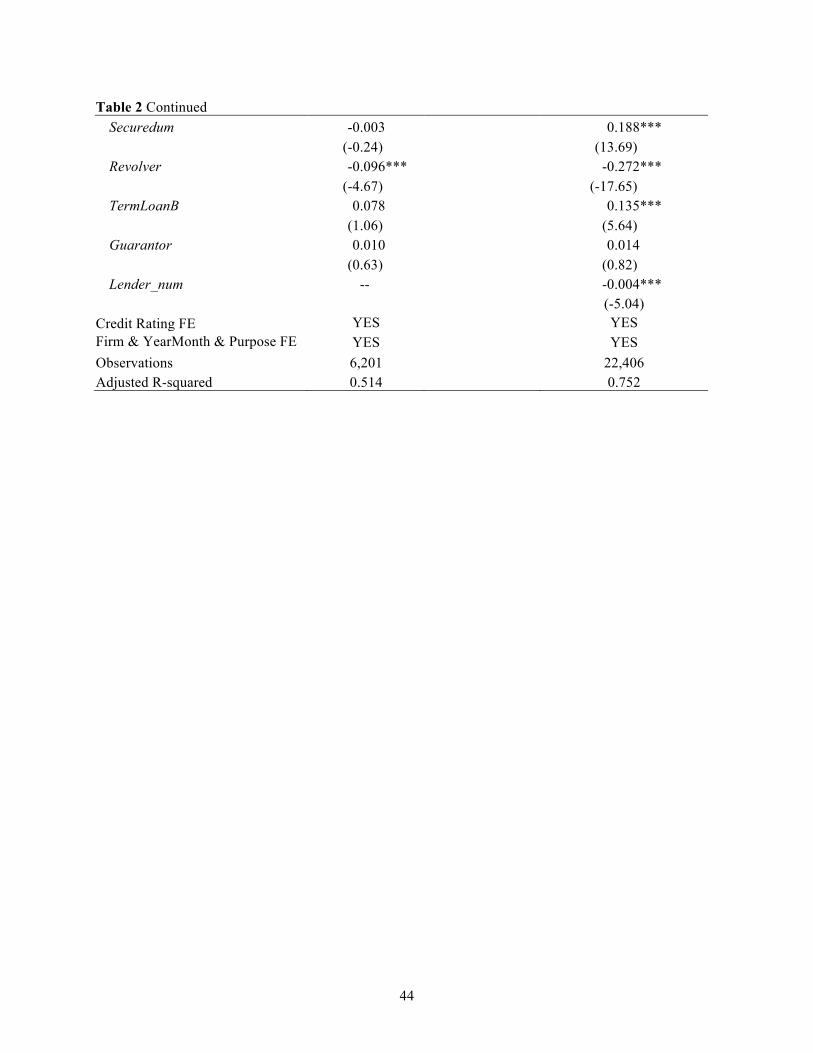
44
Table 2 Continued Securedum -0.003 0.188***
(-0.24)
(13.69)
Revolver -0.096***
-0.272***
(-4.67)
(-17.65)
TermLoanB 0.078
0.135***
(1.06)
(5.64)
Guarantor 0.010
0.014
(0.63)
(0.82)
Lender_num --
-0.004***
(-5.04)
Credit Rating FE YES YES Firm & YearMonth & Purpose FE YES YES Observations 6,201
22,406
Adjusted R-squared 0.514 0.752
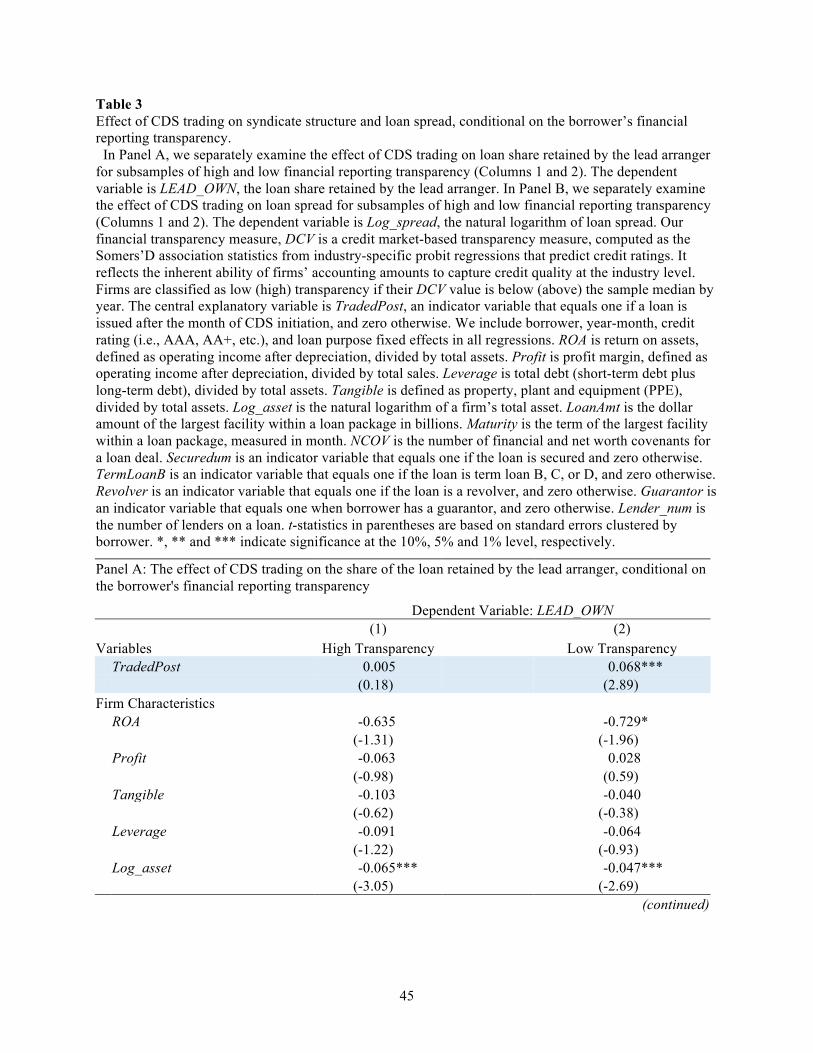
45
Table 3 Effect of CDS trading on syndicate structure and loan spread, conditional on the borrower’s financial reporting transparency. In Panel A, we separately examine the effect of CDS trading on loan share retained by the lead arranger for subsamples of high and low financial reporting transparency (Columns 1 and 2). The dependent variable is LEAD_OWN, the loan share retained by the lead arranger. In Panel B, we separately examine the effect of CDS trading on loan spread for subsamples of high and low financial reporting transparency (Columns 1 and 2). The dependent variable is Log_spread, the natural logarithm of loan spread. Our financial transparency measure, DCV is a credit market-based transparency measure, computed as the Somers’D association statistics from industry-specific probit regressions that predict credit ratings. It reflects the inherent ability of firms’ accounting amounts to capture credit quality at the industry level. Firms are classified as low (high) transparency if their DCV value is below (above) the sample median by year. The central explanatory variable is TradedPost, an indicator variable that equals one if a loan is issued after the month of CDS initiation, and zero otherwise. We include borrower, year-month, credit rating (i.e., AAA, AA+, etc.), and loan purpose fixed effects in all regressions. ROA is return on assets, defined as operating income after depreciation, divided by total assets. Profit is profit margin, defined as operating income after depreciation, divided by total sales. Leverage is total debt (short-term debt plus long-term debt), divided by total assets. Tangible is defined as property, plant and equipment (PPE), divided by total assets. Log_asset is the natural logarithm of a firm’s total asset. LoanAmt is the dollar amount of the largest facility within a loan package in billions. Maturity is the term of the largest facility within a loan package, measured in month. NCOV is the number of financial and net worth covenants for a loan deal. Securedum is an indicator variable that equals one if the loan is secured and zero otherwise. TermLoanB is an indicator variable that equals one if the loan is term loan B, C, or D, and zero otherwise. Revolver is an indicator variable that equals one if the loan is a revolver, and zero otherwise. Guarantor is an indicator variable that equals one when borrower has a guarantor, and zero otherwise. Lender_num is the number of lenders on a loan. t-statistics in parentheses are based on standard errors clustered by borrower. *, ** and *** indicate significance at the 10%, 5% and 1% level, respectively.
Panel A: The effect of CDS trading on the share of the loan retained by the lead arranger, conditional on the borrower's financial reporting transparency
Dependent Variable: LEAD_OWN
(1) (2)
Variables High Transparency
Low Transparency TradedPost 0.005 0.068*** (0.18) (2.89) Firm Characteristics
ROA -0.635
-0.729*
(-1.31)
(-1.96)
Profit -0.063
0.028
(-0.98)
(0.59)
Tangible -0.103
-0.040
(-0.62)
(-0.38)
Leverage -0.091
-0.064
(-1.22)
(-0.93)
Log_asset -0.065***
-0.047***
(-3.05) (-2.69)
(continued)

46
Table 3 Panel A Continued Loan Characteristics
LoanAmt -0.009
-0.017
(-0.41)
(-1.03)
Maturity -0.002***
-0.002***
(-3.10)
(-4.09)
NCOV -0.018*
-0.012*
(-1.91)
(-1.92)
Log_spread 0.026
0.023
(1.16)
(1.22)
Securedum -0.016
0.002
(-0.58)
(0.13)
Revolver -0.049
-0.108***
(-1.23)
(-3.60)
TermLoanB 0.117
0.049
(1.06)
(0.36)
Guarantor 0.012
-0.001
(0.41)
(-0.04)
Credit Rating FE YES YES Firm & YearMonth & Purpose FE YES YES Observations 2,977
3,224
Adjusted R-squared 0.533
0.549 Test for subsample differences:
TradedPost χ
2 = 10.22*** p-value = 0.001
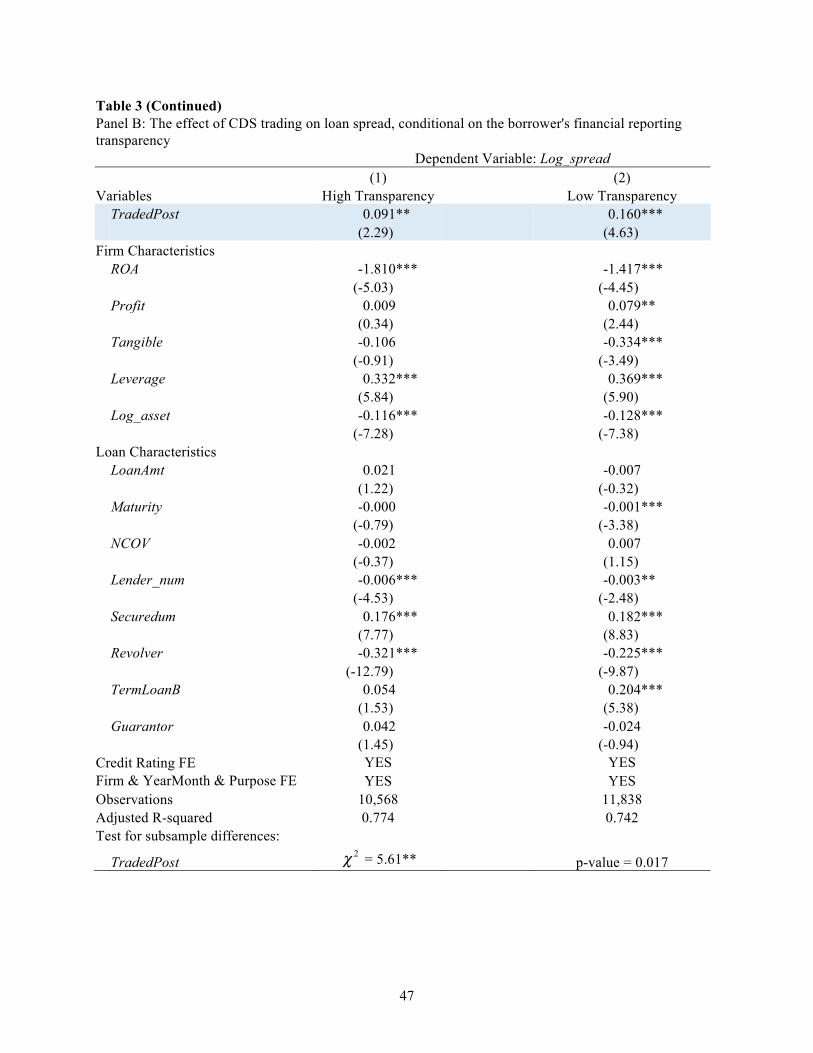
47
Table 3 (Continued) Panel B: The effect of CDS trading on loan spread, conditional on the borrower's financial reporting
transparency
Dependent Variable: Log_spread
(1) (2)
Variables High Transparency
Low Transparency TradedPost 0.091** 0.160*** (2.29) (4.63) Firm Characteristics
ROA -1.810***
-1.417***
(-5.03)
(-4.45)
Profit 0.009
0.079**
(0.34)
(2.44)
Tangible -0.106
-0.334***
(-0.91)
(-3.49)
Leverage 0.332***
0.369***
(5.84)
(5.90)
Log_asset -0.116***
-0.128***
(-7.28)
(-7.38)
Loan Characteristics
LoanAmt 0.021
-0.007
(1.22)
(-0.32)
Maturity -0.000
-0.001***
(-0.79)
(-3.38)
NCOV -0.002
0.007
(-0.37)
(1.15)
Lender_num -0.006***
-0.003**
(-4.53)
(-2.48)
Securedum 0.176***
0.182***
(7.77)
(8.83)
Revolver -0.321***
-0.225***
(-12.79)
(-9.87)
TermLoanB 0.054
0.204***
(1.53)
(5.38)
Guarantor 0.042
-0.024
(1.45)
(-0.94)
Credit Rating FE YES YES Firm & YearMonth & Purpose FE YES YES Observations 10,568
11,838
Adjusted R-squared 0.774
0.742 Test for subsample differences:
TradedPost χ
2 = 5.61** p-value = 0.017
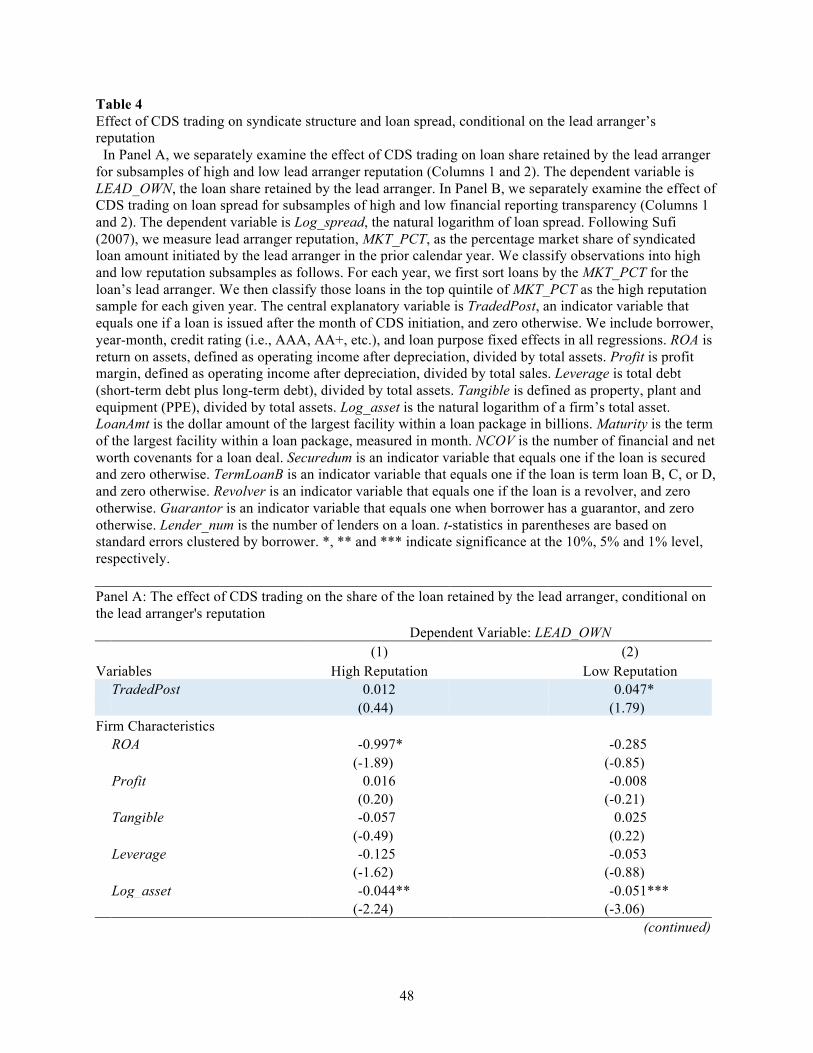
48
Table 4 Effect of CDS trading on syndicate structure and loan spread, conditional on the lead arranger’s reputation In Panel A, we separately examine the effect of CDS trading on loan share retained by the lead arranger for subsamples of high and low lead arranger reputation (Columns 1 and 2). The dependent variable is LEAD_OWN, the loan share retained by the lead arranger. In Panel B, we separately examine the effect of CDS trading on loan spread for subsamples of high and low financial reporting transparency (Columns 1 and 2). The dependent variable is Log_spread, the natural logarithm of loan spread. Following Sufi (2007), we measure lead arranger reputation, MKT_PCT, as the percentage market share of syndicated loan amount initiated by the lead arranger in the prior calendar year. We classify observations into high and low reputation subsamples as follows. For each year, we first sort loans by the MKT_PCT for the loan’s lead arranger. We then classify those loans in the top quintile of MKT_PCT as the high reputation sample for each given year. The central explanatory variable is TradedPost, an indicator variable that equals one if a loan is issued after the month of CDS initiation, and zero otherwise. We include borrower, year-month, credit rating (i.e., AAA, AA+, etc.), and loan purpose fixed effects in all regressions. ROA is return on assets, defined as operating income after depreciation, divided by total assets. Profit is profit margin, defined as operating income after depreciation, divided by total sales. Leverage is total debt (short-term debt plus long-term debt), divided by total assets. Tangible is defined as property, plant and equipment (PPE), divided by total assets. Log_asset is the natural logarithm of a firm’s total asset. LoanAmt is the dollar amount of the largest facility within a loan package in billions. Maturity is the term of the largest facility within a loan package, measured in month. NCOV is the number of financial and net worth covenants for a loan deal. Securedum is an indicator variable that equals one if the loan is secured and zero otherwise. TermLoanB is an indicator variable that equals one if the loan is term loan B, C, or D, and zero otherwise. Revolver is an indicator variable that equals one if the loan is a revolver, and zero otherwise. Guarantor is an indicator variable that equals one when borrower has a guarantor, and zero otherwise. Lender_num is the number of lenders on a loan. t-statistics in parentheses are based on standard errors clustered by borrower. *, ** and *** indicate significance at the 10%, 5% and 1% level, respectively.
Panel A: The effect of CDS trading on the share of the loan retained by the lead arranger, conditional on the lead arranger's reputation
Dependent Variable: LEAD_OWN
(1) (2)
Variables High Reputation
Low Reputation TradedPost 0.012 0.047* (0.44) (1.79) Firm Characteristics
ROA -0.997*
-0.285
(-1.89)
(-0.85)
Profit 0.016
-0.008
(0.20)
(-0.21)
Tangible -0.057
0.025
(-0.49)
(0.22)
Leverage -0.125
-0.053
(-1.62)
(-0.88)
Log_asset -0.044**
-0.051***
(-2.24) (-3.06)
(continued)

49
Table 4 Panel A Continued Loan Characteristics
LoanAmt 0.002
-0.026
(0.12)
(-1.27)
Maturity -0.002***
-0.002***
(-2.82)
(-3.99)
NCOV -0.010
-0.012*
(-1.29)
(-1.96)
Log_spread 0.038*
0.020
(1.80)
(1.28)
Securedum 0.006
-0.010
(0.25)
(-0.54)
Revolver -0.135***
-0.089***
(-3.22)
(-2.85)
TermLoanB 0.050
0.079
(0.49)
(0.81)
Guarantor 0.027
0.008
(0.90)
(0.31)
Credit Rating FE YES YES Firm & YearMonth & Purpose FE YES YES Observations 2,166
4,035
Adjusted R-squared 0.620
0.520 Test for subsample differences:
TradedPost χ2 = 3.12* p-value = 0.074
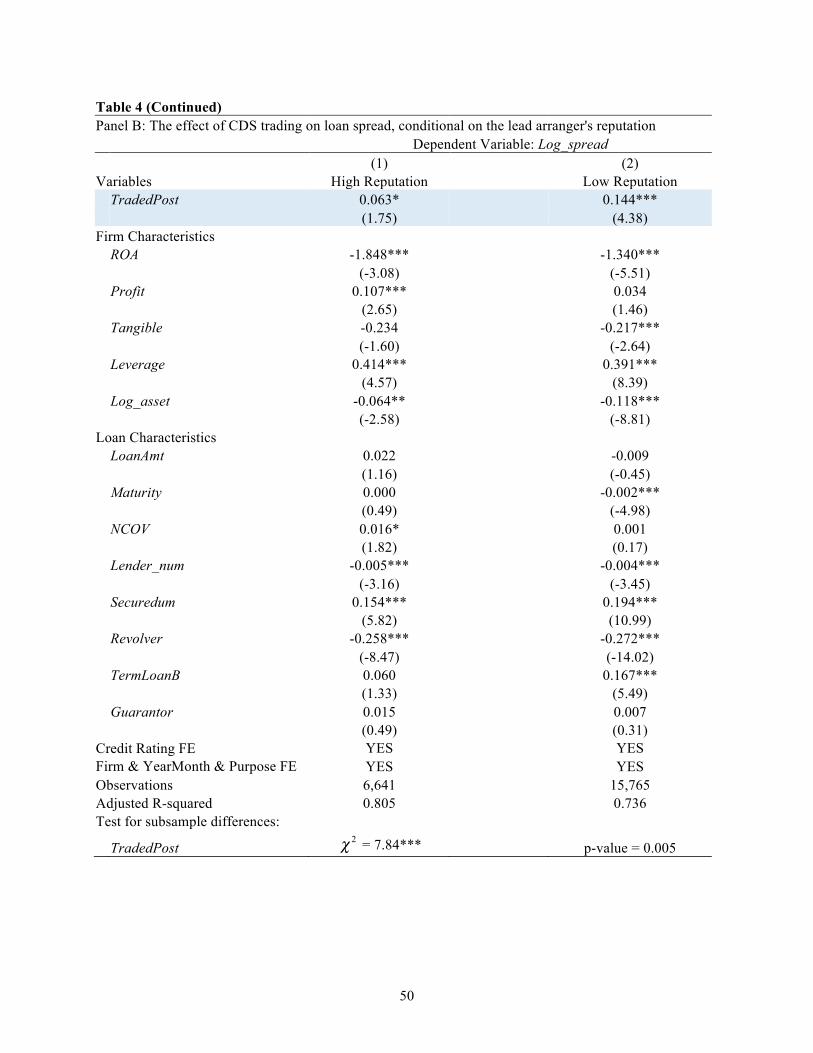
50
Table 4 (Continued) Panel B: The effect of CDS trading on loan spread, conditional on the lead arranger's reputation
Dependent Variable: Log_spread
(1) (2)
Variables High Reputation
Low Reputation TradedPost 0.063* 0.144*** (1.75) (4.38) Firm Characteristics
ROA -1.848***
-1.340***
(-3.08)
(-5.51)
Profit 0.107***
0.034
(2.65)
(1.46)
Tangible -0.234
-0.217***
(-1.60)
(-2.64)
Leverage 0.414***
0.391***
(4.57)
(8.39)
Log_asset -0.064**
-0.118***
(-2.58)
(-8.81)
Loan Characteristics
LoanAmt 0.022
-0.009
(1.16)
(-0.45)
Maturity 0.000
-0.002***
(0.49)
(-4.98)
NCOV 0.016*
0.001
(1.82)
(0.17)
Lender_num -0.005***
-0.004***
(-3.16)
(-3.45)
Securedum 0.154***
0.194***
(5.82)
(10.99)
Revolver -0.258***
-0.272***
(-8.47)
(-14.02)
TermLoanB 0.060
0.167***
(1.33)
(5.49)
Guarantor 0.015
0.007
(0.49)
(0.31)
Credit Rating FE YES YES Firm & YearMonth & Purpose FE YES YES Observations 6,641
15,765
Adjusted R-squared 0.805
0.736 Test for subsample differences:
TradedPost χ2 = 7.84*** p-value = 0.005

51
Table 5 Effect of CDS trading on syndicate structure and loan spread, conditional on CDS market liquidity In Panel A, we separately examine the effect of CDS trading on loan share retained by the lead arranger for subsamples of high and low CDS market liquidity (Columns 1 and 2). The dependent variable is LEAD_OWN, the loan share retained by the lead arranger. In Panel B, we separately examine the effect of CDS trading on loan spread for subsamples of high and low CDS market liquidity (Columns 1 and 2). The dependent variable is Log_spread, the natural logarithm of loan spread. We use the number of distinct dealers providing quotes as our proxy for the liquidity of CDS contracts. We classify a CDS traded firm as having high (low) CDS market liquidity if the mean number of daily dealers during the post-CDS initiation period is above (below) the sample median. The central explanatory variable is TradedPost, an indicator variable that equals one if a loan is issued after the month of CDS initiation, and zero otherwise. We include borrower, year-month, credit rating (i.e., AAA, AA+, etc.), and loan purpose fixed effects in all regressions. ROA is return on assets, defined as operating income after depreciation, divided by total assets. Profit is profit margin, defined as operating income after depreciation, divided by total sales. Leverage is total debt (short-term debt plus long-term debt), divided by total assets. Tangible is defined as property, plant and equipment (PPE), divided by total assets. Log_asset is the natural logarithm of a firm’s total asset. LoanAmt is the dollar amount of the largest facility within a loan package in billions. Maturity is the term of the largest facility within a loan package, measured in month. NCOV is the number of financial and net worth covenants for a loan deal. Securedum is an indicator variable that equals one if the loan is secured and zero otherwise. TermLoanB is an indicator variable that equals one if the loan is term loan B, C, or D, and zero otherwise. Revolver is an indicator variable that equals one if the loan is a revolver, and zero otherwise. Guarantor is an indicator variable that equals one when borrower has a guarantor, and zero otherwise. Lender_num is the number of lenders on a loan. t-statistics in parentheses are based on standard errors clustered by borrower. *, ** and *** indicate significance at the 10%, 5% and 1% level, respectively.
Panel A: The effect of CDS trading on the share of the loan retained by the lead arranger, conditional on CDS market liquidity
Dependent Variable: LEAD_OWN
(1) (2)
Variables High Liquidity
Low Liquidity TradedPost 0.068*** 0.030 (3.34) (1.30) Firm Characteristics
ROA -0.527*
-0.488*
(-1.94)
(-1.76)
Profit 0.020
0.009
(0.70)
(0.31)
Tangible 0.002
0.052
(0.03)
(0.60)
Leverage -0.018
-0.081*
(-0.38)
(-1.66)
Log_asset -0.069***
-0.055***
(-5.55) (-4.13)
(continued)

52
Table 5 Panel A Continued Loan Characteristics
LoanAmt -0.000
-0.020
(-0.03)
(-1.33)
Maturity -0.002***
-0.002***
(-4.54)
(-4.70)
NCOV -0.014***
-0.012**
(-2.77)
(-2.41)
Log_spread 0.018
0.033**
(1.43)
(2.47)
Securedum 0.005
-0.008
(0.32)
(-0.55)
Revolver -0.079***
-0.095***
(-3.32)
(-3.91)
TermLoanB 0.050
0.070
(0.55)
(0.85)
Guarantor 0.020
0.013
(1.01)
(0.63)
Credit Rating FE YES YES Firm & YearMonth & Purpose FE YES YES Observations 4,923
5,158
Adjusted R-squared 0.532
0.496 Test for subsample differences:
TradedPost χ2 = 3.98** p-value = 0.046

53
Table 5 (Continued) Panel B: The effect of CDS trading on loan spread, conditional on CDS market liquidity
Dependent Variable: Log_spread
(1) (2)
Variables High Liquidity
Low Liquidity TradedPost 0.206*** 0.119*** (6.18) (3.95) Firm Characteristics
ROA -1.462***
-1.297***
(-6.75)
(-6.17)
Profit 0.044**
0.030*
(2.27)
(1.67)
Tangible -0.207***
-0.148**
(-2.84)
(-2.07)
Leverage 0.390***
0.403***
(9.12)
(10.23)
Log_asset -0.129***
-0.130***
(-11.41)
(-11.59)
Loan Characteristics
LoanAmt 0.012
0.004
(0.82)
(0.24)
Maturity -0.001***
-0.002***
(-3.76)
(-5.51)
NCOV 0.000
-0.002
(0.06)
(-0.59)
Lender_num -0.005***
-0.003***
(-4.90)
(-2.79)
Securedum 0.194***
0.190***
(12.64)
(13.18)
Revolver -0.272***
-0.275***
(-15.87)
(-16.55)
TermLoanB 0.172***
0.120***
(5.92)
(4.90)
Guarantor 0.018
0.011
(0.93)
(0.62)
Credit Rating FE YES YES Firm & YearMonth & Purpose FE YES YES Observations 18,334
19,432
Adjusted R-squared 0.744
0.717 Test for subsample differences:
TradedPost χ2 = 5.15** p-value = 0.023