Embed Size (px)
Citation preview

1
The Effects of Bid-Pulsing on Keyword Performance in Search Engines
Savannah Wei Shi
Assistant Professor of Marketing
Marketing Department
Leavey School of Business
Santa Clara University
408-554-4798
Xiaojing Dong
Associate Professor of Marketing
Marketing Department
Leavey School of Business
Santa Clara University
408-554-5721
July, 2014
Forthcoming at the International Journal of Electronic Commerce
2
The Effects of Bid-Pulsing on Keyword Performance in Search Engines
Abstract:
The objective of this study is to empirically examine whether and how the bid-pulsing affects
keyword auction performance in search engine advertising. In keyword auctions, advertisers can
choose a set-to-forget fixed bidding amount (fixed-bidding), or they can change the bid value
based on certain type of rules (pulse-bidding). A keyword auction dataset from Yahoo! reveals
that around 60% of advertisers frequently changed their bid value for a particular keyword
category; moreover, such pulse-bidding behavior is observed throughout the entire time course
for some companies. Both cross-sectional and longitudinal analyses on this dataset demonstrate
that when a company pulses its bid values, the ranking, the number of exposures, and the number
of clicks of the target ad listing will all benefit; in addition, the average bid price will be lower.
The results are consistent across four keyword categories. Among the three keyword categories
that are in ascending order of level of competitiveness, the magnitude of the bid-pulsing effect
also increases. The study extends search engine advertising literature by providing empirical
evidence of pulse-bidding strategy under the generalized second price (GSP) auction and by
exploring the consequence of such strategy. Managerially, our results suggest that while keeping
all other costs and the bidding environment the same, increasing the frequency and scale of bid
pulsing will improve keyword performance; this is especially the case when bidding on a highly
competitive keyword category.
Keywords: Search Engine Advertising, Bid-Pulsing Strategy, Generalized Second Price (GSP),
Competition, Keyword Performance

3
Introduction
Search engine marketing has been deeply embedded in marketers’ advertising strategies
since its introduction in 1996. It is a form of internet marketing that promotes and increases the
visibility of businesses on search engine result pages, through search engine optimization (e.g.,
improving website structure, increasing inbound links), and through search engine advertising
(e.g., paid ad placement). SEMPO ([28]) estimates that the search engine marketing industry will
reach $26.8 billion by the end of 2013, having grown by 554% from $4.1 billion in 2004. The
major players in the industry are Google (market share 65.09% in Aug 2011), Yahoo! (15.89%),
Bing (13.10%), and others (Ask.com, AOL, etc., make up 5.92% of the market) [4].
In search engine advertising, the advertiser specifies a target query (one or more
keywords), a certain advertisement, and a bid value for the keyword(s) (i.e., maximum
willingness to pay for a click) while competing against other advertisers. When a consumer
enters that query in a search box, a keyword auction begins. The search engine will then display
the list of the paid advertisement links based on the relevant bid price, ad contents, and the
quality scores of the landing pages. Every time a consumer clicks on a sponsored link, the
corresponding advertiser’s account is billed. Advertisers determine the bid value based on a
number of factors, such as keyword performance (the number of exposures, the rankings, and the
number of clicks the ad link receives), conversion rate, the revenue generated by clicks, and the
resources and effort to manage the bidding process. They can adopt a fixed-bidding strategy,
under which a predefined bid value for keyword(s) is specified and kept consistent over time; or
a pulse-bidding strategy, under which the bid value is adjusted to optimize performance
whenever necessary. In search engines like Yahoo! and Google, the performance of the
keywords is available in almost real-time. Advertisers can choose the frequency and the amount
4
to change the bid value based on the feedback from the search engine. Other variables, such as
keyword choice, ad content, and landing page design can also be adjusted to optimize the
performance of following auctions. When a consumer enters the next search query, another
round of keyword auction begins. Since reading in English begins in the upper left-hand corner
and proceeds from left to right in a top-to-bottom fashion (e.g., [23]), ads displayed at the top
(higher ranked ads) are more likely to be exposed to consumers and believed to be more credible.
Typically, these ads tend to have higher click-through rates. Another performance measure
closely tied to the click probability is impression, or the number of times an ad is displayed on
search engine result page. Exposure to an ad link “reminds customers of the existence of their
company” ([5] p.7), and is likely to increase the click-through rate of an ad in the future ([6]).
Hence, a higher position on search result page, more exposure, and more clicks are always
desirable for advertisers.
Previous studies have examined the bidding strategies under the two most common
keyword auction formats: the Generalized First Price (GFP) and the Generalized Second Price
(GSP) auctions. In both formats, the advertiser with the highest bid is likely to receive the
highest rank and most exposures (which in general will lead to higher click-through rate). The
only difference is the cost of each click. In the GFP auction, the advertiser will pay the price he
bid; while in the GSP auction, the advertiser will pay the price of the next highest bid. The GFP
auction is naturally unstable ([10], [11]), featuring a “sawtooth” pattern of bid value (See
Appendix for an illustration).
Theoretically, under the simplified GSP condition – only one slot for one keyword, full
information, and static condition, a locally envy-free equilibrium exists ([11]). In equilibrium,
each bidder pays his Vickrey price and receives the slots he would have under the efficient
5
allocation, no bidder has a unilateral incentive to change his bid ([22], [32]). In other words,
fixed-bidding at Vickrey price might be ideal in this situation. In practice, however, the GSP
auction can be much more complex. There are multiple ad slots on a search engine results page,
and fixed-bidding at Vickrey price is no longer the best strategy. Indeed, our data collected under
the GSP format indicate that instead of keeping the bid value consistent, around 60% of
advertisers change their bid value over time. Moreover, such pulse-bidding behavior is observed
throughout the entire data period, rather than being concentrating in the earlier stage and
stabilizing afterwards as predicted by learning curve. Various drivers of such dynamic bidding
have been discussed in the literature: for instance, the previous ad’s rank and click-through rate,
the search engine’s evaluation of the site, and competitors’ bidding behavior will all contribute to
bid value variations. Researchers have also theoretically explored dynamic bid pricing strategy to
optimize the budget allocation across time and across keywords.
Given the quickly expanding analytical and empirical work on search engine advertising,
one question remained unanswered: what is the consequence of pulse-bidding strategy in the
GSP keyword auction? This study intends to fill the gap by empirically investigating whether
and how bid-pulsing affects keyword auction performance in search engine advertising. With
cross-sectional and longitudinal analyses on publicly available Yahoo! Search advertising data
([1]), we address the following questions of interest to search engine advertisers: does keyword
performance differ between the advertisers who adopt a pulse-bidding strategy and those who
adopt a fixed-bidding strategy? How does pulsing the bid price influence the rank, impressions,
and clicks of an ad? Is the effect of pulse-bidding different across keyword categories? Which
type of keyword is suitable for frequent pulsing and (or) large scale bid value change, and which
type is not? These questions are of great importance to both researchers and practitioners. Note
6
that our study empirically measures the differences between the fixed-bidding strategy and the
pulse-bidding strategy in terms of their influences on the performance measures. It does not
attempt to propose the optimal keyword bidding strategy or map out the actual underlying
bidding rules that the advertisers followed due to the data constraints. Rather, this study is more
of a descriptive nature than a normative nature.
The paper is organized as follows. First, we review the literature regarding the auction
format and corresponding bidding strategies, academic and industrial perspectives of fixed- and
pulse-bidding strategies, and models of bidding behavior in search engine advertising. We then
describe the dataset, and present the models and results. We finish with the discussions of
managerial implications and future research avenues.
Literature Review
Background: Keyword Auction Format
Search engines have used the generalized first price auction (GFP) and the generalized
second price auction (GSP) as keyword auction formats. In this section, we first introduce these
two auction formats, then discuss the corresponding bidding strategies, and finally point out the
gap in this stream of literature.
The GFP keyword auction format was originally adopted by GoTo (1998, later Overture,
now Yahoo! and Bing). In this format, if ad i with bid value bi is clicked, advertiser i is charged
the bid value bi. In a static setting, the GFP auction has a pure strategy Bayes-Nash symmetric
equilibrium ([22]). In a dynamic setting such as keyword auctions, however, the lack of pure
strategy full-information equilibrium encourages bidders to constantly change bid value from
one period to the next. For example, assume two advertisers (A and B) bid for the same keyword
7
under the GFP format. Advertiser A has the evaluation of the keyword at $1, and B has the
evaluation at $1.5. The best strategy for them is to start at their lowest bid (say $.50), and then
continue to outbid each other until the bid price reaches $1. At this point, A will stop increasing
the bid, and B could bid at $1.01 and win the auction. Therefore, we typically see a “sawtooth”
pattern (see Appendix for an illustration), or pulse-bidding behavior under this auction format.
The GFP auction structure is naturally unstable, and bidders change their bid value frequently
within a large range ([10], [11]). Edelman et al. ([11]) concluded that the GFP format encourages
“inefficient investment, causing volatile prices and allocative inefficiencies”.
Yahoo! switched from GFP to GSP format in June 2002, and now the GSP auction is
widely adopted by major search engines. In the GSP auction, if ad i with bid value bi is clicked,
rather than paying the bid value bi (as in the GFP) advertiser i pays an amount equal to the next
highest bid bj (sometime plus a minimum increment, typically $0.01). Essentially, the ad of the
highest bidder is listed in the first slot, but the price paid for a click is the second highest bid.
Similarly, the ad for the second-highest bidder will be listed in the second slot, and the price paid
for a click is the third-highest bid ([5], [10], [11]).
The GSP auction is a generalized form of standard second-price auction, which coincides
with the Vickrey-Clarke-Groves (VCG) auction ([11]). The VCG auction is incentive compatible,
i.e., the optimal strategy for a bidder is to bid their true valuation. It ensures that the bidder who
values the item most will win the auction. Bidders change their bid value less frequently, and the
range of the bid value is smaller than that in the GFP format. GSP generalizes the standard
second price auction by allowing for repeated bidding and multiple ad slots. In an infinitely
repeated game where bidders change bid price frequently and gradually learn the values of others,
an extremely large set of equilibria exist ([11]). Thus, to obtain a theoretical solution, Edelman et

8
al. ([11]) focused instead on a “one-shot, simultaneous move, complete information game” while
considering the dynamic nature of the auction. They derived a restricted ex-poste equilibrium
known as locally envy-free equilibrium ([11]), or symmetric Nash equilibrium ([31]). In that
equilibrium, each bidder pays the Vickrey price and receives the slots he would have under
efficient allocation, no bidder has a unilateral incentive to change his bid (fixed-bidding).
However, it is much more complex in practice: there are multiple advertising slots on search
result page, and search engines prevent advertisers from learning the bid value of competitors
and colluding with each other through complex algorithms. Fixed-bidding at Vickrey price is not
an optimal strategy. Indeed, empirical analyses indicate that bid price in the GSP keyword
auction is not stable: for instance, Yuan ([35]) found that advertisers actually change their bid 19%
more often under the GSP than under the GFP format. Edelman et.al [11] concluded that there is
no equilibrium in dominant strategy in GSP auctions adopted by most search engines.
Given the inconsistencies between the theory and practice, it is important to examine
empirically how advertisers bid under the GSP format, and whether fixed-bidding and pulse-
bidding affect keyword performance differently. We observe that six out of ten advertisers
frequently change their bid value in our data. Bid-pulsing behavior varies widely across firms,
with some companies limiting their bid pulsing within a specific period, while others change the
bid throughout the entire data period. The magnitude of pulsing also differs radically. Does pulse
bidding lead to better keyword performance than fixed bidding under the GSP format? What is
the impact of large scale bid pulsing on ad’s rank, impression, and click through rate? Will the
effect of pulsing differ across keyword categories? In this study, we attend to the consequence of
pulsing in the GSP keyword auction, which has been rarely studied in the literature, yet is of
critical importance for marketing managers.

9
Fixed-Bidding Strategy and Pulse-Bidding Strategy
In keyword auctions, advertisers can choose to adopt a fixed-bidding or a pulse-bidding
strategy. Under the fixed-bidding strategy, advertisers specify a predefined bid price (maximum
willingness to pay) for keyword(s) and keep it consistent over time. Search engine websites also
allow advertisers to set a maximum spending limit, after which the advertiser’s account will be
paused. Alternatively, advertisers can adopt a pulse-bidding strategy and change their bidding
amount frequently. For instance, advertisers can adapt their bid value according to rank changes
(position-based bidding); a conditional statement (rule-based bidding; e.g., if there are less than
five impressions, increase bid by $2.00); click-through probabilities (probability-based bidding),
or the ROI (portfolio-based bidding, where the bid value is set according to the click-to-cost of
each combination of keywords).
Pulse-bidding strategy is more performance oriented and enables effective budget
allocation; hence, it is widely adopted in practice. Researchers have emphasized the importance
of adopting a dynamic perspective of keyword auction, because one important feature of
keyword auction is the real time realization of keyword performance. Zhang and Feng ([37])
proved that in a two-player competition game, the dynamic aspect of keyword auctions results in
an equilibrium bidding strategy, which is characterized by the cyclical pattern of bid value, rather
than converges to a static equilibrium. Feng and Zhang ([13]) called such price dispersion
(randomized bid price) the “reactive price dispersion”, because the firm is reacting to the other’s
bid price in keyword auction. Maillé et al. ([24]) shared a similar opinion by proposing that a
natural approach for bidding is to “use past (performance) as a prediction for the future.” The
greedy bidding strategy, which adjusts bid price for next round to maximize utility while
assuming all other bidders remain the same, works well. Researchers also theoretically explored

10
the bidding strategy from the budget optimization perspective. Budget constraints in a keyword
auction include the daily budget set for campaigns and the budget allocation across keywords.
Dynamic adjustment of bid price is essential in achieving budget allocation efficiency. Kitts and
Leblanc ([20]) proposed a bid allocation plan in which the bid price is adjusted to maximize total
profit while not exceeding the budget during the planning horizon. Such future look-ahead bid
price allocation quadrupled the clicks for the same expenditure in a keyword auction experiment.
The reason for the improved performance is that pulse-bidding “enables it (the company) to hold
back cash for more desirable times of the day” (p.199, [20]). Feldman et al ([12]) explored in a
similar vein. They proved that two-bid uniform strategy (advertisers randomize the bid price
between bid value b1 and bid value b2 on all keywords until budget is exhausted) is able to
optimize the overall ad’s clicks. This dynamic bidding strategy is simple, robust, less reliant on
information, and thus desirable in practice. Zhang et al. ([36]) concluded that because the
sponsored search market usually changes rapidly, the bid price and daily budget should be
adjusted “in a timely manner according to market dynamics”. The dynamic dual adjustment of
bid price and daily budget could help advertisers “avoid wasting money on early ineffective
clicks and seize better advertising opportunities in the future” (p.105, [36]). Some industrial
reports also share the similar perspective, as Mou ([25]) stated, to avoid losing audience with low
bid and hurt ROI with high bid price, the best practice is to “adjust bid price from the mid-point
in the recommended bid range” based on performance.
Despite the potential benefit it brings, pulse-bidding strategy requires intensive data
support, and may incur a substantial amount of managing cost in practice ([30]). These
challenges apply to all types of pulse-bidding strategies, including rule-based, portfolio-based,
and position-based pulsing strategies. For instance, a rule-based strategy is logically straight

11
forward, but setting a well-functioned rule, especially for a large number of keywords, can be
hard and tedious ([20]). A portfolio-based strategy helps with effective spending of the bidding
money, yet it requires “large amount of historical data, and may take long time to learn the
market conditions” (p.11, [21]). A position-based bidding is effective in maintaining the optimal
ranking for the brand, yet the optimal ranking is unknown or it is subject to change. Manually
monitoring and controlling the proper bid value for each bidding activity is unrealistic for a
company with a large number of keywords to manage. To effectively apply pulse-bidding
strategy, advertisers need to develop a complex system for efficient data collection, analyzing,
and integration, which requires large investment from the company ([30]). Developing the
algorithm for the optimal pulse-bidding value based on such expansive, intricate and dynamic
keyword performance metrics, is a non-trivial task ([30], [33]).
The other bidding strategy, the fixed-bidding strategy, is observed in some keyword
auction practices, even though academic researchers clearly emphasize the importance of
dynamic adjustment of bid price. Such “set-and-forget” strategy requires much less time and
effort to manage the bidding process compared to the pulse-bidding strategy. It is particularly
attractive to novice advertisers who have little or no experience with search engine advertising,
those who have smaller number of keywords, or those “with little or no capacity (or desire) to
measure the effectiveness of the paid search efforts” ([30], p.5). Another advantage of fixed-
bidding strategy is the ability to better control the spending on search engine advertising. By
setting a fixed daily budget, advertisers could avoid unexpected excessive expenditures due to
the sudden surge in keyword search ([8]). On the other hand, the disadvantage of such bidding
strategy is obvious: fix-bidding strategy ignores the feedback of the keyword performance and
budget allocation, and rarely has a good return on investment ([30]).

12
Besides the performance emphasis, budget allocation, and management cost, several other
factors also affect advertisers’ decision on bidding strategies. For instance, if the target company
adopts a fixed-bidding strategy while the competitor adjusts the bid value very often, the ad’s
visibility of the target company will be easily surpassed on search engines. Under such a
situation, the target company might consider pulse-bidding strategy ([30]). The company’s
campaign goal also plays a role. For instance, a branded (specialized) search (such as keyword
“ABC Coffee Maker”) is less competitive compared to a generic search (such as keyword
“Coffee Maker”). If the company’s campaign goal is to maintain the ad’s rank for branded search,
it is not advisable to put in significant amount of time, money, and effort to constantly changing
the bid value ([2], [30]).
Therefore, to derive the optimal keyword bidding strategy, one needs information on bid
price, auction performance, budget, management cost, campaign goal, and its competitors’
bidding rules. As Jansen and Mullen ([15]) pointed out, “an optimal strategy for one keyword
market may not be the optimal strategy for another” (p.127). Yet except for bid value and
keyword performance, other information often remains as a trade secret and unknown. We
acknowledge the importance of such information for developing the best bidding strategies.
Hence, rather than suggesting the superior bidding strategies or probing into the underlying
pulse-bidding rules, the objective of this paper is to provide an empirical examination of the
consequence of the two bidding strategies, given the available bid price and keyword
performance information.
Bidding strategies in Search Engine Advertising and Modeling Approaches
In this section, we selectively review some analytic and empirical work in the bidding
strategy in search engine advertising.
13
Since the discussion on GSP by Edelman et al. ([10], [11]) and Varian ([31]), the collection
of analytical work on keyword auctions is rapidly expanding. Sen ([29]) studied the optimal
investment decision among search engine optimization and paid placement. Athey and Ellison
([3]) studied effect of inter-advertiser competition on advertisers’ bids. Kempe and Mahdian
([19]) used a cascade model to explore the externalities in sponsored ads. Chen et al. ([7])
focused on advertising space’s distribution among bidding advertisers. More recently, Katona
and Sarvary ([18]) developed a dynamic model to capture the impact of previous ad’s position on
current bidding strategy. They found that advertisers’ bidding behavior is strongly affected by
the interaction between search results in organic and sponsored sections, as well as the inherent
differences in the websites’ attractiveness. Zhu and Wilbur ([38]) examined equilibrium
strategies in hybrid advertising auctions, i.e., bidding on a pay-per-impression versus a pay-per-
click basis. They proposed that a hybrid payment scheme would improve publishers’ revenue
and achieve socially optimal allocation of advertisers to slots. Jerath et al. ([17]) analyzed the
bidding strategies of vertically differentiated firms and found the “position paradox”: under a
pay-per-impression mechanism, the superior firm will be better off by bidding for a lower
position compared to an inferior firm.
Our research adds to the growing body of empirical literature on bidding strategies in
search engine advertising. Various datasets and models have been used to examine the keyword
bidding strategy. For example, Jansen, Sobel, and Zhang ([16]) investigated the keyword
performance and the use of brand terms, and found that matching brand terms in key phrases and
ads will significantly improve the effectiveness and efficiency of keyword advertising. Ghose
and Yang ([14]) applied simultaneous equations to model the impact of keyword characteristics,
position of the advertisement, and the landing page’s quality score on advertisers’ bid price,
14
consumers’ search and purchase behavior, and the search engine’s ranking decision. Rutz and
Bucklin ([26]) proposed a dynamic linear model to capture the potential spillover from generic to
branded paid search. With complete information of consumer search and clicking, advertiser
bidding, and search engine information such as keyword pricing and website design, Yao and
Mela ([33]) applied a structure model to capture the relationships among three parties. In their
dynamic model, the search engine uses the previous ad’s performance to rank the current ad,
advertisers gauge consumers’ clicking behavior to determine the keyword bid value, and
consumers rely on the ad’s ranking in their click decisions. Other aspects of search engine
marketing, such as search queries ([34]) and click-fraud ([9]), have also been examined in the
literature. Most empirical studies on search engine advertising focus on the determinants of
dynamic bidding. For example, previous positions, click-through rate, the search engine’s
evaluation of the site, and competitors are all taken as factors that drive dynamic bidding (e.g.,
[18], [26], [27], [33]). However, the consequence of the pulse-bidding strategy awaits further
investigation. Our research intends to fill this gap by focusing on whether and how bid-pulsing
affects keyword auction performance in search engine advertising.
Data and Descriptive Analyses
We obtained publicly available keyword auction data from Yahoo! (Search Marketing
Advertiser Bid-Impression-Click data on Competing Keywords, [1]). The data record 16,268
advertisers’ 77,850,272 daily bidding activities, spanning four months in 2008, and across six
15
keyword categories1. The variables include anonymized advertiser IDs, anonymized keyword(s),
bid value for a particular keyword 2
, rank, number of impressions and clicks.
Advertisers may choose to bid on multiple keyword categories at one auction, and the bid
price will differ correspondingly. Such price change is due to the variation in keyword categories,
rather than pulsing-bidding that we are interested in. Therefore, to avoid complication, we only
keep the auctions that focus on a single keyword category. Among all the six keyword categories
we obtained, four of them have much larger number of advertisers (A: 4617, B: 4501, C: 5675,
and D: 3135) compared to the other two (E: 142 and F: 229). To have meaningful comparisons
across categories, we choose the first four categories A, B, C and D, to assess the impact of bid
pulsing on keyword performance. The descriptive statistics of these four categories are presented
in Table 1.
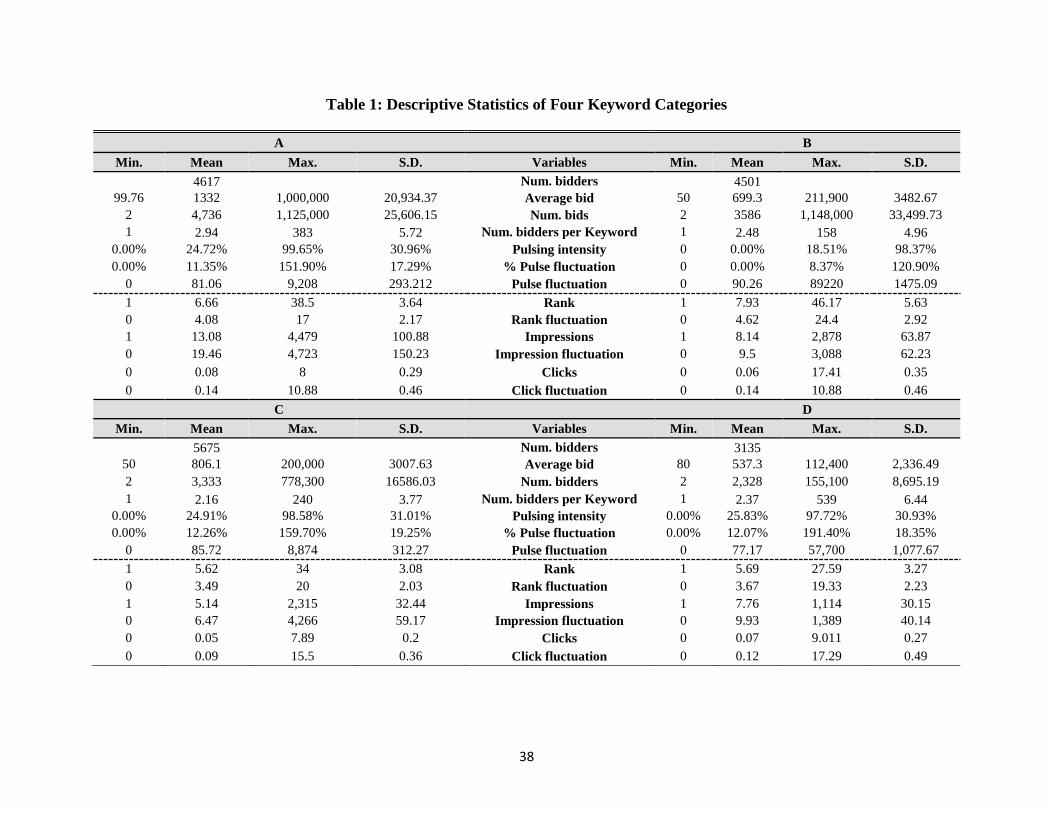
For each keyword category, we summarize the bidding decisions in the upper panel and
the keyword performances (rank, impression and click) in the lower panel. We find that: (1) the
numbers of advertisers in these keyword categories varies from 3125 (in category D) to 5675 (in
category B). (2) The daily bid value also differs greatly from $537.3 (in category D) to $1332 (in
category A). (3) Category A receives the most number of bids on average from each advertiser
(4736), while category D receives the least number of bids from each advertiser (2328). (4)
Finally, the number of advertisers bidding on each keyword also varies across categories (from
2.16 in category C to 2.94 in category A). As shown in the lower panel of each table, the average
impressions differ radically across the four keyword categories, with much higher exposure for
category A (13.08) than that for the other three keyword categories (B: 8.14; C: 5.14; D: 7.76).
1 These keyword categories are defined by the data provider, and no detailed information regarding these categories,
such as how each category is defined or the identity of the keyword, could be obtained. 2 The bid value is aggregated with a granularity of a day. The numbers refer to the total bid value for a keyword by
an advertiser (possibly across multiple auctions) within a day.
16
Similar pattern holds for clicks (A: 0.08; B: 0.06; C: 0.05; D: 0.07). The average ranks also vary
across categories (A: 6.66, B: 7.93, C: 5.62, D: 5.69). The rank, impression and click all fluctuate
substantially for all four categories. The descriptive statistics of bidding behavior and keyword
performance in Table 1 suggest that the four keyword categories are significantly different from
each other.
---INSERT TABLE 1 HERE---
To illustrate bid-pulsing behavior and the corresponding keyword performance, we
randomly select three companies and plot their bid value for the same keyword category over
time (Figure 1). These three advertisers bid for the same keyword category 117, 409, and 8,693
times, respectively. The number of auction activities, the number of changes in the bid values,
and the changes in the bid value vary significantly across advertisers. Some advertisers pulsed
more often and pulsed at larger scale in the earlier or later period, while others spread their
pulsing behavior across the entire data period. Figure 2 plots the rank, impressions, and clicks of
the search engine ads over time for three companies. It is clear that all these measurements
fluctuate substantially over time.
---INSERT FIGURES 1 and 2 HERE---
To obtain a detailed understanding at different levels, we generate two datasets for each
keyword category. The first dataset, the longitudinal dataset, keeps the entire bidding activities
for each advertiser during the observed period. In this dataset, each line of observation represents
a summary of the keyword auctions on a particular keyword by an advertiser in one day. The
longitudinal data for category A, B, C, and D record over 21 million, 16 million, 19 million, and
7 million auction activities respectively. The second dataset, cross-sectional dataset, averages
the bidding behavior and keyword auction performance over the observed period for each

17
advertiser and keyword. In this dataset, each line of observation represents an advertiser-
keyword combination.
We generate some variables to capture the pulsing behavior in each dataset. In the
longitudinal dataset, the first variable created is Pulsing Dummy, indicating whether there is a
change in the bid value for a specific keyword within the keyword category. Pulsing Dummy
takes the value one if bid value for a keyword at time t is different from that in time t – 1, zero
otherwise. The second variable created is the percentage of bid value change (or Pulsing
Strength), reflecting the magnitude of the change in the bid value from time t – 1 to time t,
normalized by the average bid value for the same keyword. Specifically, it is calculated as the
ratio of the change in the bid value for a keyword from t – 1 to t, relative to the average bid value
for the same keyword:
T
t
t
tt
BidValueT
BidValueBidValue StrengthPulsing
1
1
1.
Similarly, In the cross-sectional dataset, we calculate the Pulsing Intensity, which is the
percentage of times an advertiser changes its bid for the same keyword category; and Pulsing
Variation, which is the average of the absolute value of Pulsing Strength over time. Specifically,
Tt
tT
t
t
tt
BidValueT
BidValueBidValueabs
TVariation Pulsing
2
1
1
1
)(1
A metric evaluating the performance fluctuation (impressions, rank, and clicks) for each
advertiser-keyword is also added. We label it as Performance Fluctuation, which is the average
of absolute changes in keyword performance from time t – 1 to time t:
(
T
t
tt ePerformancePerformancabsT
oneFluctuatiPerformanc2
1)(1
.

18
Analyses
In this section, we examine the impact of bid-pulsing on keyword performance at two
levels. First, using the cross-sectional data, we study the differences in keyword performance
between the fixed-bidding strategy and the pulse-bidding strategy. Then we take a time-series
perspective by applying a mixed two-stage-least square approach to the longitudinal data to
study the impact of pulse-bidding on current keyword auction performance.
Search engine websites have developed complex algorithms to determine an ad’s rank
and impressions. The major components of this decision are keyword(s)’ bid value, ad design,
and the quality the landing page. However, the algorithm itself is a business secret and remains
unknown to advertisers and researchers. Additionally, search engines may adjust their algorithms
randomly when conducting experiments. The random features of these experiments are expected
not to change the basic algorithm dramatically. By leveraging statistical tools to analyze a large
set of auction data, our study provides an empirical examination of the impact of bidding strategy,
even with the unknown algorithm and random search engines experiments.
Cross-Sectional Data Analyses
Fixed-Bidding Group vs. Pulse-Bidding Group
We start the analyses by comparing fixed- and pulse-bidding strategies based on cross-
sectional data. Bidding activities for each keyword category are divided into two groups: the
fixed-bidding group contains the bidding activities of the advertisers who never changed their bid
value during the data period, and the pulse-bidding group includes the bidding activities of the
advertisers who changed their bid value at least once during the data period3. The comparison of
3 The pulse-bidding defined here includes the situation where the advertiser kept its bid value the same for some
bidding activities and changed it for some other bidding activities. We did not find any advertiser that changed its
bid value for all bidding activities (the “pure” pulse-bidding strategy).

19
various keyword performance metrics is presented in Table 2. When bidding for keyword
category A, 1890 advertisers adopted a fixed-bidding strategy (40.9%), and the remaining 2727
advertisers adopted the pulse-bidding strategy (59.1%). The split between fixed-bidding and
pulse-biding group are very similar in category B (45.3% vs. 54.7%), C (42.3% vs. 57.7%), and
D (40.5% vs. 59.5%). Furthermore, in category A, the average bid for the fixed-bidding group is
significantly higher than that in the other one (2153.20 vs. 763.64; p = .026). The same can be
said for all other three keyword categories (B: 754.8 vs. 632.3; C: 954.6 vs. 695.6; D: 577.2 vs.
510.08). A preliminary conclusion here is that pulse-bidding may help lower the average bid
value or the cost of adverting on search engines.
---INSERT TABLE 2 HERE ---
Interestingly, even with a lower average bid value, the pulse-bidding group usually has
better rank than the fixed-bidding group (the difference are 0.53, 1.13, 0.1, and 0.46 respectively
for category A, B, C, and D). By varying bid value, the ad also achieves more impressions and
clicks. Specifically, the number of exposures an ad receives in pulse-bidding group is on average
2.87 higher than that in fixed-bidding group; and the number of clicks in pulse-bidding group is
on average 3.25 higher than that in fixed-bidding group. Note that the fluctuations in rank,
impressions, and clicks are not eliminated in the fixed-bidding group. Even if the advertiser
keeps its bid value consistent, the keyword performance cannot be guaranteed to stay stable due
to competitors’ dynamic bidding strategies and undisclosed search engine manipulation (for
example, a controlled experiment).
Regression Analyses with Pulsing Intensity and Pulsing Variation
The above cross-sectional analyses draw our attention to the effect of pulsing on keyword
performance. Does higher pulsing frequency leads to better rank, impressions and clicks? Is
20
larger pulsing variation beneficial to keyword performance? How does the sensitivity of keyword
performance to pulsing vary by keyword categories? Figure 3a and 3b plot the histograms of the
Pulse Intensities and Pulsing Variations for pulse-bidding group across four keyword categories.
These plots demonstrate that the Pulse Intensities and Pulsing Variations vary significantly
across advertisers within keyword categories.
--- INSERT FIGURE 3a and 3b HERE ---
In this subsection, we examine the impact of Pulse Intensities and Pulsing Variations on
keyword performance through regression analyses. These two variables are highly correlated in
all keyword categories (correlation: A: .753; B: .742; C: .696; D: .733). Therefore, instead of
estimating one regression with both variables, we estimate two sets of regressions for each
keyword category. In the first set of regressions, we use Pulse Intensities as the independent
variable, and the values and the fluctuations of average rank, impressions, and clicks as the
dependent variables. The average bid value of each keyword is included as a control variable. In
the second set of regressions, we replace Pulse Intensities with Pulsing Variations. We apply
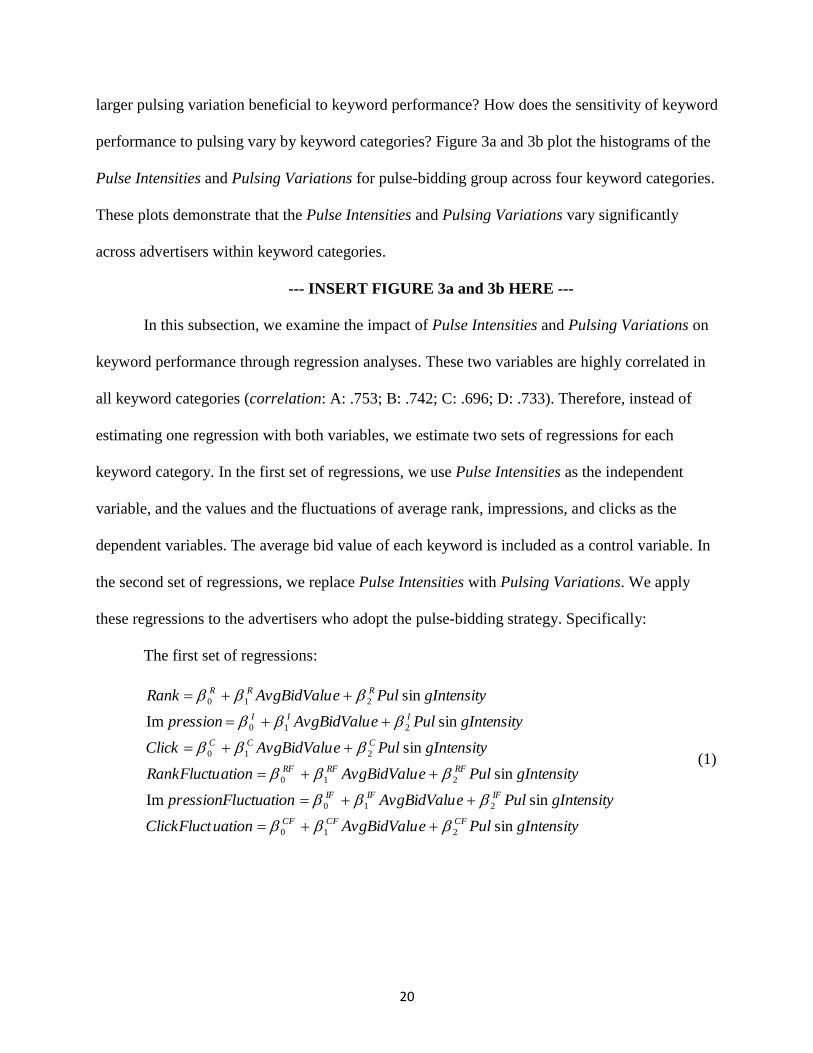
these regressions to the advertisers who adopt the pulse-bidding strategy. Specifically:
The first set of regressions:
gIntensityPuleAvgBidValuuationClickFluct
gIntensityPuleAvgBidValuuctuationpressionFl
gIntensityPuleAvgBidValuationRankFluctu
gIntensityPuleAvgBidValuClick
gIntensityPuleAvgBidValupression
gIntensityPuleAvgBidValuRank
CFCFCF
IFIFIF
RFRFRF
CCC
III
RRR
sin
sinIm
sin
sin
sinIm
sin
210
210
210
210
210
210
(1)
21
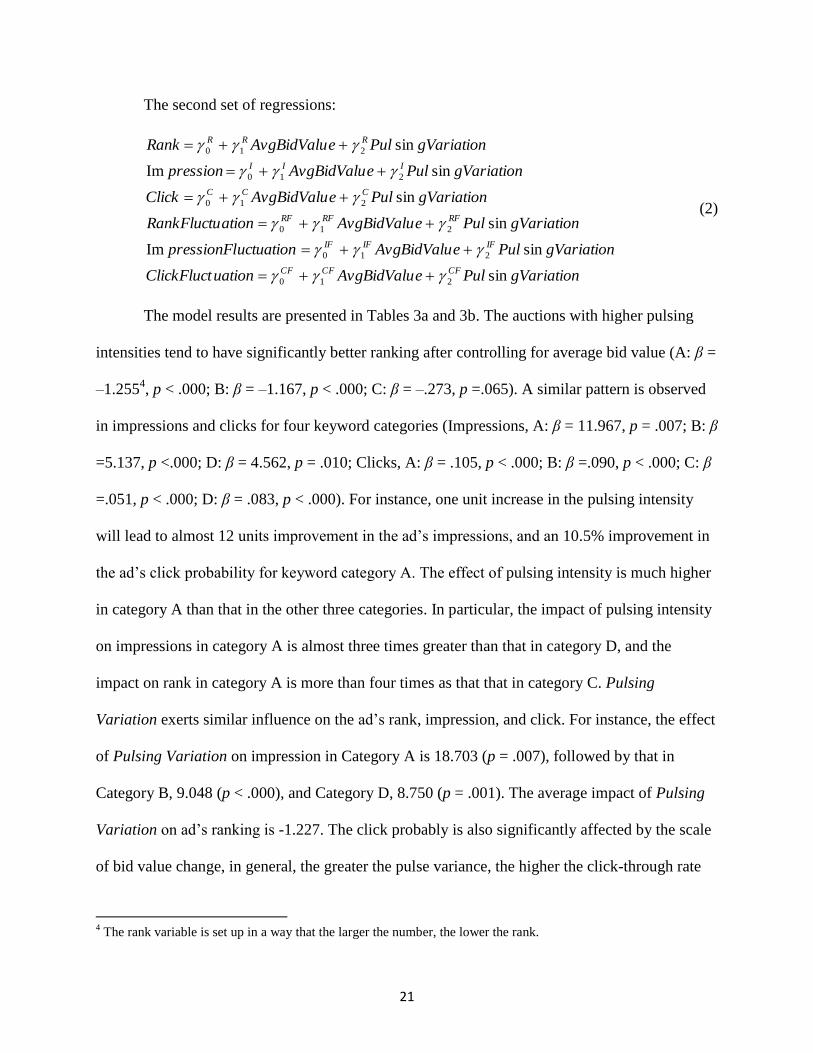
The second set of regressions:
gVariationPuleAvgBidValuuationClickFluct
gVariationPuleAvgBidValuuctuationpressionFl
gVariationPuleAvgBidValuationRankFluctu
gVariationPuleAvgBidValuClick
gVariationPuleAvgBidValupression
gVariationPuleAvgBidValuRank
CFCFCF
IFIFIF
RFRFRF
CCC
III
RRR
sin
sinIm
sin
sin
sinIm
sin
210
210
210
210
210
210
(2)
The model results are presented in Tables 3a and 3b. The auctions with higher pulsing
intensities tend to have significantly better ranking after controlling for average bid value (A: β =
–1.2554, p < .000; B: β = –1.167, p < .000; C: β = –.273, p =.065). A similar pattern is observed
in impressions and clicks for four keyword categories (Impressions, A: β = 11.967, p = .007; B: β
=5.137, p <.000; D: β = 4.562, p = .010; Clicks, A: β = .105, p < .000; B: β =.090, p < .000; C: β
=.051, p < .000; D: β = .083, p < .000). For instance, one unit increase in the pulsing intensity
will lead to almost 12 units improvement in the ad’s impressions, and an 10.5% improvement in
the ad’s click probability for keyword category A. The effect of pulsing intensity is much higher
in category A than that in the other three categories. In particular, the impact of pulsing intensity
on impressions in category A is almost three times greater than that in category D, and the
impact on rank in category A is more than four times as that that in category C. Pulsing
Variation exerts similar influence on the ad’s rank, impression, and click. For instance, the effect
of Pulsing Variation on impression in Category A is 18.703 (p = .007), followed by that in
Category B, 9.048 (p < .000), and Category D, 8.750 (p = .001). The average impact of Pulsing
Variation on ad’s ranking is -1.227. The click probably is also significantly affected by the scale
of bid value change, in general, the greater the pulse variance, the higher the click-through rate
4 The rank variable is set up in a way that the larger the number, the lower the rank.

22
(A: β = .195, p < .000; B: β =.183, p <.000; C: β =.083, p < .000; D: β = .127, p < .000). We
draw the tentative conclusion that frequent bid pulsing and higher level of pulsing variation are
beneficial to keyword performance; this is especially true for category A, which has the highest
average bid price and highest number of advertisers in the keyword category.
--- INSERT TABLES 3a and 3b HERE ---
The fluctuation in keyword performance can be attributed to pulse-bidding. Advertisers
who pulse frequently and pulse with greater variance in bid value generally have a larger
variation in their ads’ impressions and rank (Impression: Pulsing Intensity: A: β = 24.381, p
= .003; B: β =7.787, p < .000; D: β = 9.606 p =.001; Pulsing Variation: A: β = 37.653, p = .003;
B: β =17.230, p < .000; D: β = 11.540, p =.008. Rank: Pulsing Intensity: C: β =.506, p < .000; D:
β =.502, p = .002; Pulsing Variation: C: β =.527, p < .000). It is clear that pulse-bidding is not
necessarily suitable for those advertisers who wish to have a more stable ad’s ranking and
impressions. The click probabilities, in contrast, are much less susceptible to the pulse-bidding
(Pulsing Intensity: A: β = .207, p < .000; B: β =.171, p < .000; C: β =.101, p < .000; D: β =.159,
p < .000; Pulsing Variation: A: β = .178, p = .010; B: β =.143, p < .000; D: β =.111, p = .037).
The reason behind such differences might be that the effect of bid value on impression and rank
is almost immediate: once consumer inputs the search query, the search engine begins the
auction and ranks the ads based on the bid value, ad content, and landing page quality scores. An
ad’s click decisions, however, resides in consumers’ evaluation of the ad. It is affected by the
number of previous exposures (impressions) the consumer receives, the “goodwill” stock of the
ad’s reputation (the higher the rank, the more credible the ad), and many other exogenous
variables, such as quality score of the landing page, and brand awareness. Therefore, the
23
fluctuation in ad’s click probability is much less influenced by pulsing compared to the other two
performance metrics.
The cross-sectional analyses generate useful insights for search engine advertisers. To
achieve a high level of ad’s rank, exposure, and click propensity, a common approach is to
increase the keyword bid value. Our results show that alternatively, advertiser can pulse the bid
value to achieve a similar goal. For instance, to reach 100 ad impressions for category A, the
advertiser can save 9.86% in bid price by pulsing the bid price at 80% frequency. Even for
category D, which has the smallest impact from pulse frequency, the advertiser could save 3.89%
in average bid value by pulsing the bid value at 80%. From a cross-sectional perspective, pulse-
bidding not only saves money; it leads to improved keyword performance, especially in ad’s
impression and click.
Longitudinal Data Analyses
The above cross-sectional analyses demonstrate the significant impact of pulsing on the
keyword performance and its fluctuation. The identification of the model relies on the cross-
sectional (across advertisers) features in the data. Next, we examine whether the pattern still hold
in the longitudinal data when incorporating the time dimension. Specifically, we look at how
time-to-time changes in bid value affect the keyword performance.
In this set of analysis, the dependent variables are the values of three performance metrics,
i.e., rank, impression and click, as well as their changes between time t – 1 and time t
(Performance Change t=Performancet - Performancet-1). The predictors are Pulsing Dummy and
Pulsing Strength (defined on p.17). Bid Value at time t is incorporated as a control variable. As
mentioned previously, some companies may use previous keyword performance feedback in
their bidding strategies; therefore, Bid Value, Pulsing Dummy, and Pulsing Strength are treated
24
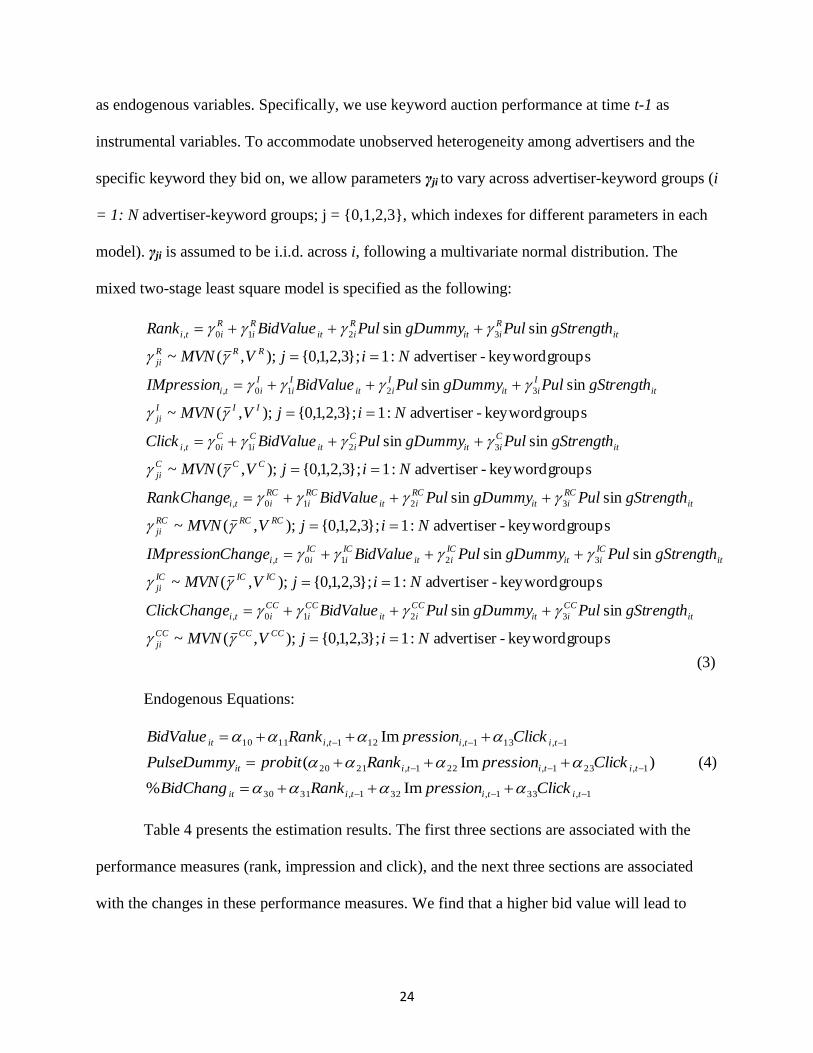
as endogenous variables. Specifically, we use keyword auction performance at time t-1 as
instrumental variables. To accommodate unobserved heterogeneity among advertisers and the
specific keyword they bid on, we allow parameters γji to vary across advertiser-keyword groups (i
= 1: N advertiser-keyword groups; j = {0,1,2,3}, which indexes for different parameters in each
model). γji is assumed to be i.i.d. across i, following a multivariate normal distribution. The
mixed two-stage least square model is specified as the following:
groups keyword-advertiser :1};3,2,1,0{);,(~
sinsin
groups keyword-advertiser :1};3,2,1,0{);,(~
sinsin
groups keyword-advertiser :1};3,2,1,0{);,(~
sinsin
groups keyword-advertiser :1};3,2,1,0{);,(~
sinsin
groups keyword-advertiser :1};3,2,1,0{);,(~
sinsin
groups keyword-advertiser :1};3,2,1,0{);,(~
sinsin
3210,
3210,
3210,
3210,
3210,
3210,
NijVMVN
gStrengthPulgDummyPulBidValueeClickChang
NijVMVN
gStrengthPulgDummyPulBidValueChangeIMpression
NijVMVN
gStrengthPulgDummyPulBidValueRankChange
NijVMVN
gStrengthPulgDummyPulBidValueClick
NijVMVN
gStrengthPulgDummyPulBidValueIMpression
NijVMVN
gStrengthPulgDummyPulBidValueRank
CCCCCC
ji
it
CC
iit
CC
iit
CC
i
CC
iti
ICICIC
ji
it
IC
iit
IC
iit
IC
i
IC
iti
RCRCRC
ji
it
RC
iit
RC
iit
RC
i
RC
iti
CCC
ji
it
C
iit
C
iit
C
i
C
iti
III
ji
it
I
iit
I
iit
I
i
I
iti
RRR
ji
it
R
iit
R
iit
R
i
R
iti
(3)
Endogenous Equations:
1,331,321,3130
1,231,221,2120
1,131,121,1110
Im%
)Im(
Im
tititiit
tititiit
tititiit
ClickpressionRankBidChang
ClickpressionRankprobitPulseDummy
ClickpressionRankBidValue
(4)
Table 4 presents the estimation results. The first three sections are associated with the
performance measures (rank, impression and click), and the next three sections are associated
with the changes in these performance measures. We find that a higher bid value will lead to
25
better ranking, more impressions and higher click probability. The effects are statistically
significant for all four categories.
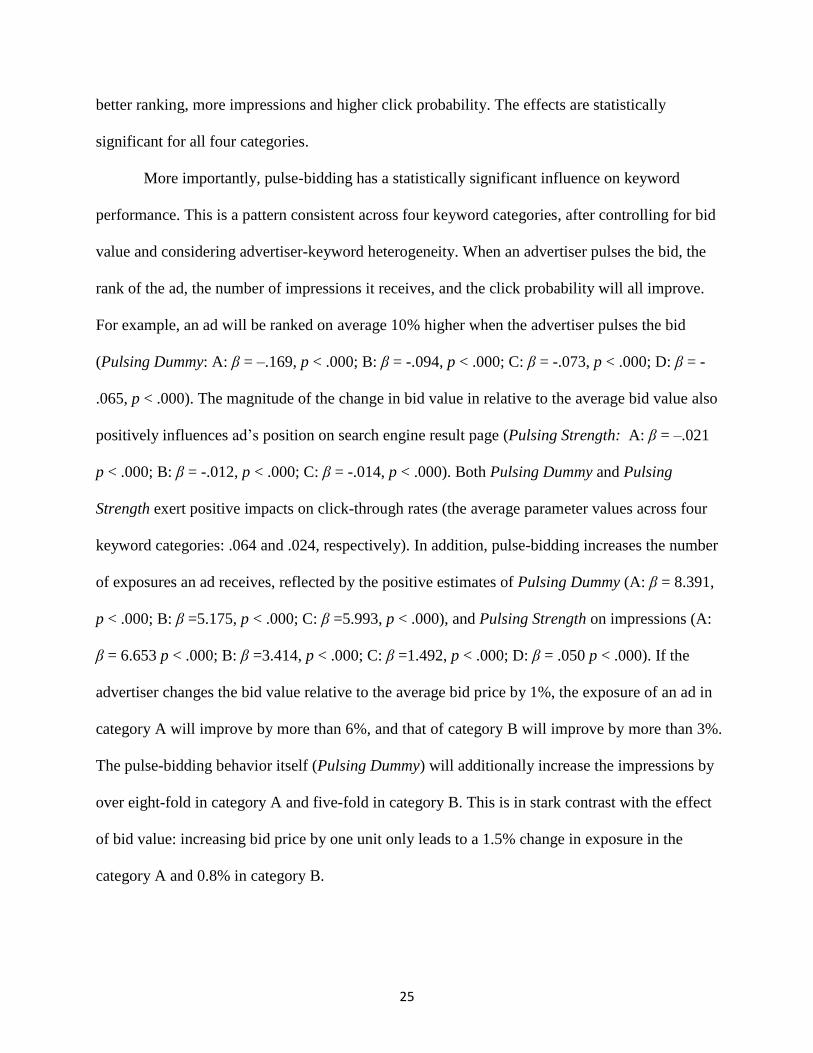
More importantly, pulse-bidding has a statistically significant influence on keyword
performance. This is a pattern consistent across four keyword categories, after controlling for bid
value and considering advertiser-keyword heterogeneity. When an advertiser pulses the bid, the
rank of the ad, the number of impressions it receives, and the click probability will all improve.
For example, an ad will be ranked on average 10% higher when the advertiser pulses the bid
(Pulsing Dummy: A: β = –.169, p < .000; B: β = -.094, p < .000; C: β = -.073, p < .000; D: β = -
.065, p < .000). The magnitude of the change in bid value in relative to the average bid value also
positively influences ad’s position on search engine result page (Pulsing Strength: A: β = –.021
p < .000; B: β = -.012, p < .000; C: β = -.014, p < .000). Both Pulsing Dummy and Pulsing
Strength exert positive impacts on click-through rates (the average parameter values across four
keyword categories: .064 and .024, respectively). In addition, pulse-bidding increases the number
of exposures an ad receives, reflected by the positive estimates of Pulsing Dummy (A: β = 8.391,
p < .000; B: β =5.175, p < .000; C: β =5.993, p < .000), and Pulsing Strength on impressions (A:
β = 6.653 p < .000; B: β =3.414, p < .000; C: β =1.492, p < .000; D: β = .050 p < .000). If the
advertiser changes the bid value relative to the average bid price by 1%, the exposure of an ad in
category A will improve by more than 6%, and that of category B will improve by more than 3%.
The pulse-bidding behavior itself (Pulsing Dummy) will additionally increase the impressions by
over eight-fold in category A and five-fold in category B. This is in stark contrast with the effect
of bid value: increasing bid price by one unit only leads to a 1.5% change in exposure in the
category A and 0.8% in category B.
26
Pulsing strategy not only affects the keyword performance, it also influences the scale
and the direction of the changes. For instance, if the advertiser changes the bid value for category
A at time t, the level of improvement in rank will be strengthened by 1.3%. The same can be said
for category B (.07%) and C (1.2%). Similarly, pulsing the bid value enhances the improvement
in impressions by 5.558 units and in clicks by 3.9% for the category A. The numbers for B are
3.384 units and 2.6%, and for C are 3.692 units and 1.7%. Note that such effects are in addition
to the effect of keyword bid value that has been controlled for. The changes in keyword
performance metrics are consistent with the direction of the changes in bid value at each time
point, and again the effect is much stronger in category A than the other keyword categories. The
greater the increase in the relative bid value (Pulsing Strength), the larger the level of
improvement in the rank, impression, and click will be (the average parameter values across four
keyword categories: rank: .011; impression: 5.838; click: .051; all parameters are significant).
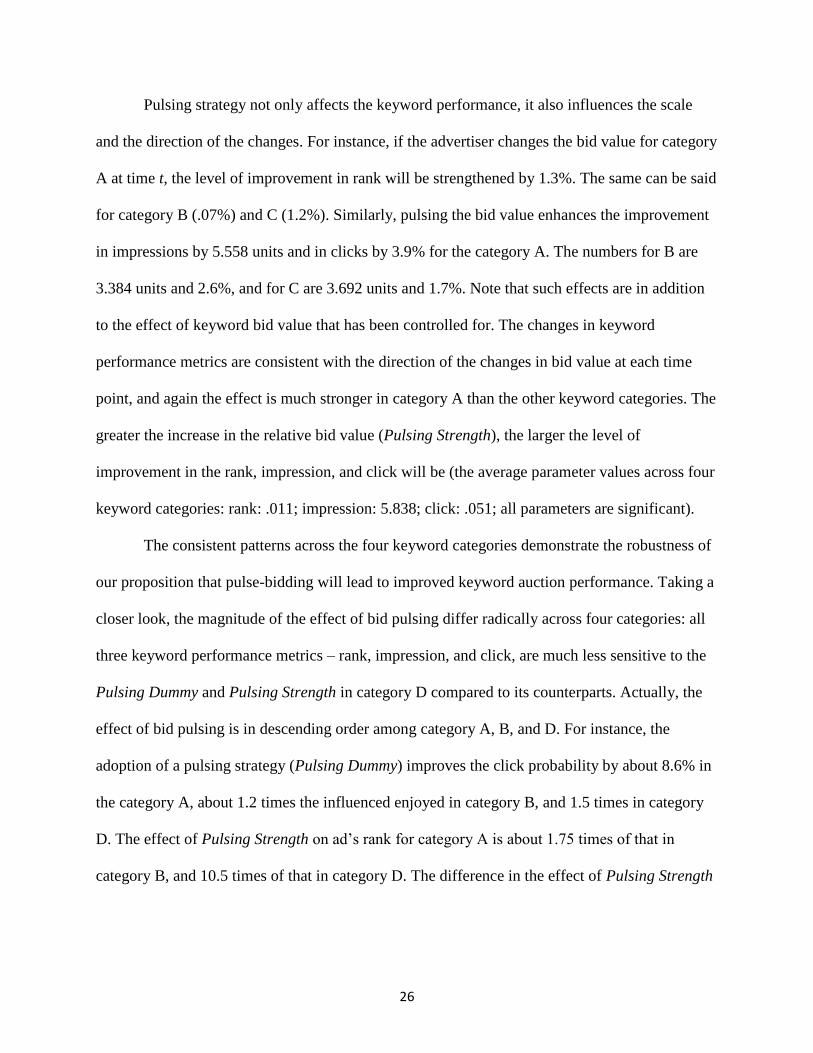
The consistent patterns across the four keyword categories demonstrate the robustness of
our proposition that pulse-bidding will lead to improved keyword auction performance. Taking a
closer look, the magnitude of the effect of bid pulsing differ radically across four categories: all
three keyword performance metrics – rank, impression, and click, are much less sensitive to the
Pulsing Dummy and Pulsing Strength in category D compared to its counterparts. Actually, the
effect of bid pulsing is in descending order among category A, B, and D. For instance, the
adoption of a pulsing strategy (Pulsing Dummy) improves the click probability by about 8.6% in
the category A, about 1.2 times the influenced enjoyed in category B, and 1.5 times in category
D. The effect of Pulsing Strength on ad’s rank for category A is about 1.75 times of that in
category B, and 10.5 times of that in category D. The difference in the effect of Pulsing Strength

27
on ad’s impressions is even more striking: the effect for category A is more than 133 times of
that in category D.
Interestingly, these three keyword categories, i.e., A, B, and D, are in descending order in
the average bid value for the keyword category ($1332 vs. $699.3 vs. $537.3 per day), the
number of competitors the keyword category(4617 vs. 4501 vs. 3135), and the average number
of bidders per keyword within the category ( 2.94 vs. 2.48 vs. 2.47). Other measures, such as the
number of auctions recorded, bidding frequency, and pulse-bidding scale, are comparable among
the three (see Table 1). Since the advertisers bidding for the same keyword and keyword
categories are considered to be competitors, and the average bid value indicates the popularity of
the keyword, we could use these three measures to gauge the level of competitiveness5. Hence,
category A should be a high-competition keyword category, B should be a medium-competition
keyword category, and D should be a low-competition keyword category. The benefit of bid
pulsing increase as the level of competitiveness rises: for an keyword auction in a highly
competitive keyword category, pulsing the bid will results in a much larger positive impact on
the ad’s rank, exposure, and click-through, and a much lower average bid value, compared to
that in less competitive ones. In summary, pulsing is useful in improving keyword auction
performance, especially for keywords with higher level of competition. This proposition holds in
both longitudinal analyses and cross-section analyses.
--- INSERT TABLE 4 HERE ---
All three keyword metrics – rank, impression and click – improve with pulse-bidding
even after controlling for bid value. Keeping the bid value constant at a high level does lead to
better keyword performance, yet such performance comes at a high cost. Alternatively,
5 Other information might also be useful to gauge the level of competitiveness, yet due to the anonymity of the data,
we do not have detailed information about the advertisers and the keyword categories.
28
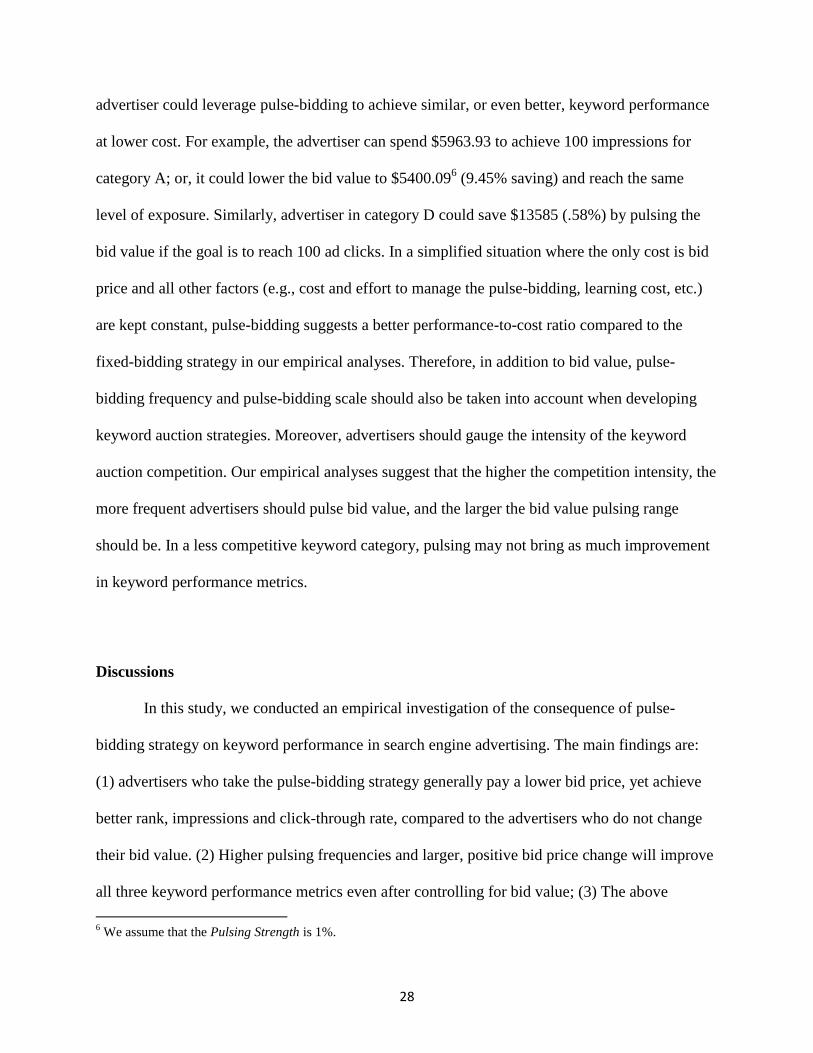
advertiser could leverage pulse-bidding to achieve similar, or even better, keyword performance
at lower cost. For example, the advertiser can spend $5963.93 to achieve 100 impressions for
category A; or, it could lower the bid value to $5400.096 (9.45% saving) and reach the same
level of exposure. Similarly, advertiser in category D could save $13585 (.58%) by pulsing the
bid value if the goal is to reach 100 ad clicks. In a simplified situation where the only cost is bid
price and all other factors (e.g., cost and effort to manage the pulse-bidding, learning cost, etc.)
are kept constant, pulse-bidding suggests a better performance-to-cost ratio compared to the
fixed-bidding strategy in our empirical analyses. Therefore, in addition to bid value, pulse-
bidding frequency and pulse-bidding scale should also be taken into account when developing
keyword auction strategies. Moreover, advertisers should gauge the intensity of the keyword
auction competition. Our empirical analyses suggest that the higher the competition intensity, the
more frequent advertisers should pulse bid value, and the larger the bid value pulsing range
should be. In a less competitive keyword category, pulsing may not bring as much improvement
in keyword performance metrics.
Discussions
In this study, we conducted an empirical investigation of the consequence of pulse-
bidding strategy on keyword performance in search engine advertising. The main findings are:
(1) advertisers who take the pulse-bidding strategy generally pay a lower bid price, yet achieve
better rank, impressions and click-through rate, compared to the advertisers who do not change
their bid value. (2) Higher pulsing frequencies and larger, positive bid price change will improve
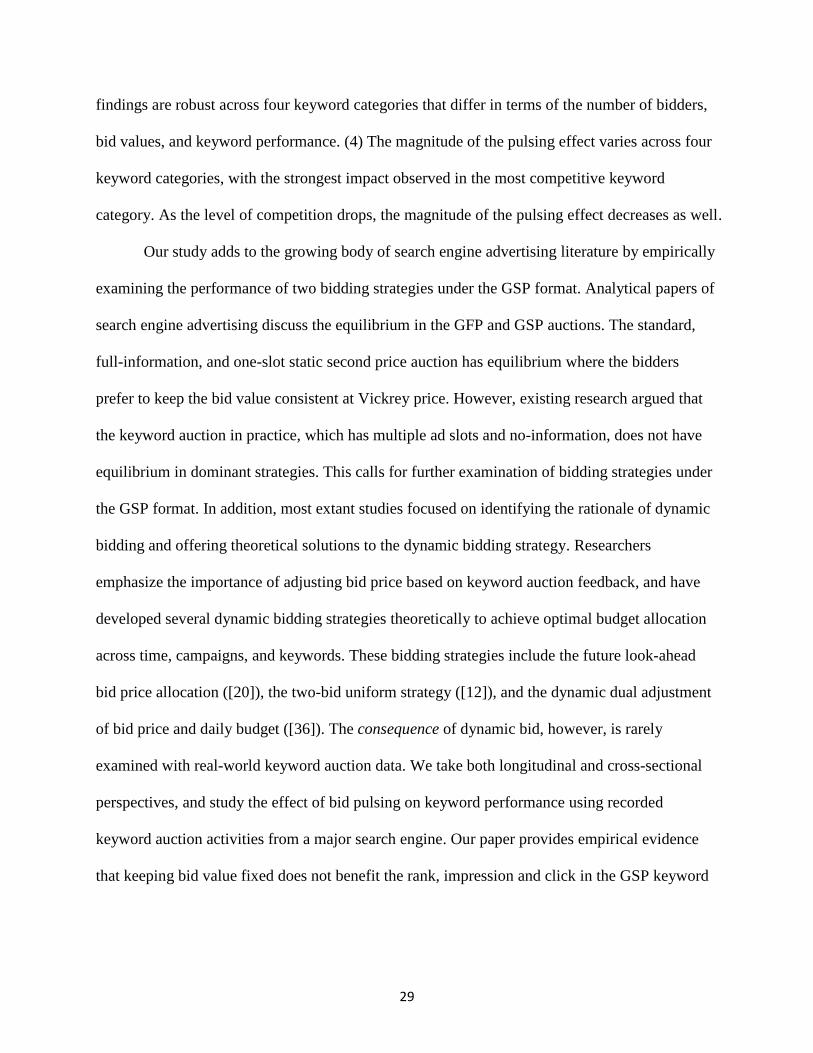
all three keyword performance metrics even after controlling for bid value; (3) The above
6 We assume that the Pulsing Strength is 1%.
29
findings are robust across four keyword categories that differ in terms of the number of bidders,
bid values, and keyword performance. (4) The magnitude of the pulsing effect varies across four
keyword categories, with the strongest impact observed in the most competitive keyword
category. As the level of competition drops, the magnitude of the pulsing effect decreases as well.
Our study adds to the growing body of search engine advertising literature by empirically
examining the performance of two bidding strategies under the GSP format. Analytical papers of
search engine advertising discuss the equilibrium in the GFP and GSP auctions. The standard,
full-information, and one-slot static second price auction has equilibrium where the bidders
prefer to keep the bid value consistent at Vickrey price. However, existing research argued that
the keyword auction in practice, which has multiple ad slots and no-information, does not have
equilibrium in dominant strategies. This calls for further examination of bidding strategies under
the GSP format. In addition, most extant studies focused on identifying the rationale of dynamic
bidding and offering theoretical solutions to the dynamic bidding strategy. Researchers
emphasize the importance of adjusting bid price based on keyword auction feedback, and have
developed several dynamic bidding strategies theoretically to achieve optimal budget allocation
across time, campaigns, and keywords. These bidding strategies include the future look-ahead
bid price allocation ([20]), the two-bid uniform strategy ([12]), and the dynamic dual adjustment
of bid price and daily budget ([36]). The consequence of dynamic bid, however, is rarely
examined with real-world keyword auction data. We take both longitudinal and cross-sectional
perspectives, and study the effect of bid pulsing on keyword performance using recorded
keyword auction activities from a major search engine. Our paper provides empirical evidence
that keeping bid value fixed does not benefit the rank, impression and click in the GSP keyword
30
auction. Pulse-bidding, on the other hand, is prevalent under the GSP format, and such bidding
strategy significantly improves the keyword performance while lowering the bid price.
Managerial Implications
Managerially, our research offers some key insights regarding the impact of bid pulsing
frequencies and strengths, and the difference in such impact across various keyword categories
given the current empirical setup. Advertisers in search engines can pursue either a fixed-bidding
strategy or a pulse-bidding strategy. Despite the fact that pulse-bidding requires intensive data
support and may incur higher management and learning cost, it is more performance oriented
and enables efficient budget allocation. Indeed, the results of both cross-sectional and the
longitudinal analyses lend strong support to the pulse-bidding strategy. We found that across four
keyword categories, the advertisers who pulse their bid always achieved an improved rank, better
exposure, and more clicks on the ad. While those who keep their bid value the same over time
incur higher cost of advertising and poorer keyword performance. To illustrate, the improvement
in rank, impression and click of the pulse-bidding strategy over fixed-bidding strategy are 8.23%,
26.94% and 50%, respectively, for auctions in category A; and 8.49%, 13.39% and 37.5%,
respectively, for auctions in category D. Longitudinal analyses demonstrate that in addition to
bid value, the bid pulsing behavior itself results in an improvement in the ad performance; and a
large, positive change in the bid value can further strengthen the effect on ad’s rank, exposure,
and clicks. For instance, simply pulsing the bid will increase the number of impressions by more
than five units in category C, and one unit positive change in bid value will add extra 1.492 units
to the exposure. Therefore, our results suggest that while keeping all other cost (such as the cost
of learning dynamic bidding, and the time and resources to manage the bidding process) and the

31
bidding environment (such as the distribution of fixed- and pulse-bidding advertisers) the same,
increasing the frequency and scale of bid pulsing will improve the keyword performance.
Our results suggest that pulse-bidding is able to lower the keyword bid price substantially
while achieving the similar level of ad effectiveness in our data. The common approach to
achieve a better rank, impression and click is to increase the keyword bid value. However, our
study indicates that rather than merely relying on increasing the keyword bid value, advertisers
could manipulate pulse-bidding frequency and scale to achieve a similar or even better
performance-to-cost ratio. For example, by pulsing-bid price at a high frequency (e.g., 80%), an
advertiser could save 9.86% in its average bid value while achieving the same level of ad
exposure (100 impressions) for category A. The number demonstrates the additional positive
impact of pulse-bidding on keyword performance after controlling for bid cost. Hence, when
developing a keyword auction strategy, marketers should consider the level of bid pulsing
intensity and bid pulsing range in addition to the bid price.
We also find that the effects of pulse-bidding are much stronger in keyword category A
than the other three categories. In fact, the effect of bid pulsing increases as the intensity of
keyword competitiveness increases. For example, the influence of pulsing intensity on the
impression of an ad’s in category A is about 2.3 times that of category B, and 12.7 times that of
category D. Note that category A is the most competitive keyword category, and D is the least
competitive one in our data. Similarly, the effect of the relative bid value change on an ad’s rank
for category A is 1.75 times that of category B, and more than 10 times that of category D. It is
possible that for a highly competitive keyword category, with limited ad space on the search
engine result page yet many competitors (advertisers), the price (bid value) difference between
two slots can be much smaller than that in the less competitive keyword category. Therefore, a

32
small improvement in the bid value leads to large variation in the rank, impressions and clicks,
and keyword performance becomes very sensitive to changes in bid value. However, in a less
competitive keyword category, the price difference between two slots can be much larger, and a
pulse bid that does not pass the threshold is not guaranteed to lead to the significant improvement
in the keyword performance. Hence, it is important for advertiser to gauge the level of keyword
competitiveness when developing bidding strategies. The average bid value and the number of
bidders bidding for the same keyword (category) provide information with respect to the
keyword competitiveness. If an advertiser is bidding for a highly competitive keyword, it is
advisable to change the bid value more frequently and enlarge the bid price range. Yet for a less
competitive keyword category, the return of bid pulsing could be much less.
Nevertheless, we find that about 40% of the advertisers still choose the fixed-bidding
strategy in our dataset. It is likely that these advertisers try to avoid the high management cost of
keyword auction, such as the cost of collecting and integrating keyword performance, and of
developing the complex algorithm to for proper bid value. The budget, the campaign goals, the
size of the account, and their competitors’ bidding approach might also contribute to the
selection of fixed-bidding strategy. There are two implications of this observation. First, the
percentage of fixed-bidding advertisers reveals the acceptance of such strategy in practice.
Without proper information on the budget, management cost, campaign goals and competitors’
bidding approach, one cannot conclude the optimal strategy for a specific firm. Rather, the firm
should use our empirical results as a benchmark and explore the optimal bidding strategies for its
specific situation. As Jansen and Mullen (2011) pointed out, “an optimal strategy for one
keyword market may not be the optimal strategy for another” (p.127). Second, we find that those
who change their bid value frequently and at large scale achieve better keyword performance.
33
These empirical results are specific to our bidding environment where around 40% of the
advertisers choose the fixed-bidding strategy, and the observed improvement may not apply if a
substantial number of bidders change their bidding behavior.
Future Research
There are several ways to extend the current study. First, our study is more of a
descriptive nature than a normative nature. We empirically examine the differences between the
fixed- and the pulse-bidding strategies in terms of their influences on keyword performance
using observed bidding activities. To provide guidance on the optimal keyword bidding
strategies, one needs to rely on more comprehensive information, such as company’s budget, bid
management cost, campaign goals, and its competitors’ bidding approach. Among them, the cost
of learning bid pulsing, collecting expansive and intricate data, and developing intensive
algorithm for proper bid value calculation, could be substantial and moderate the choice of the
bidding strategies. In addition, about 40% of the advertisers in our data choose the fix-bidding
strategy, and such bidding (competitive) environment may contribute to our empirical results.
Future research could examine the optimal bidding strategy theoretically and empirically if
proper data are collected, and explore the optimal bidding strategy in a competitive context.
Second, different keyword categories — for example, branded versus generic keywords, B2B
versus B2C keywords, high-involvement versus low-involvement purchase keywords, etc. —
may vary in keyword performance when bid value fluctuates. Future research can examine how
the effect of bid pulsing and cost saving differ across various types of keywords. Third,
advertisers pulse their bids based on different rules (such as position-based bidding, probability-
based bidding, portfolio-based bidding, or even random bidding), and the effect of bid pulsing on
keyword performance might differ correspondingly. A study incorporating such rules would

34
contribute to the understanding of keyword bidding strategies. All these questions are of great
importance for search engine marketing practitioners and worth further investigation.
Conclusions
This study empirically investigates whether and how pulse-bidding affects keyword
auction performance in search engine advertising. We extend previous search engine advertising
literature by providing empirical evidence of pulse-bidding strategy under the GSP auction
format and by exploring the consequence of such strategy. With cross-sectional and longitudinal
analyses on publicly available Yahoo! Search advertising data, we find that on average, the
advertisers who adopt the pulse-bidding strategy generally achieve better rank, impression, and
click-through rate at a lower bid price compared to those who adopt the fixed-bidding strategy.
Across four keyword categories that vary in the level of competitiveness, higher pulsing
frequencies and larger, positive bid price change are associated with better keyword performance
metrics, with the positive impact of bid-pulsing stronger in more competitive keyword categories.
We propose that when keeping all other costs (such as the cost of learning dynamic bidding, and
the time and resources to manage the bidding process) and the bidding environment (such as the
distribution of fixed- and pulse-bidding advertisers) constant, search engine advertisers should
consider increasing the bid pulsing frequency and pulsing scale. This is especially the case when
they bid on highly competitive keyword categories. With its rapid growth in recent years, and
increasing attention from marketers, we hope that our study will elicit more research interest in
search engine advertising.

35
Reference
1. Dataset Source: Yahoo! Webscope dataset: A3 - Yahoo! Search Marketing Advertiser Bid-
Impression-Click data on Competing Keywords, ydata-ysm-keyphrase-category-v1_0,
http://research.yahoo.com/Academic_Relations
2. Asdemir, K. A dynamic model of bidding patterns in sponsored search auctions.
Information Technology and Management, 12,1 (2011), 1-16.
3. Athey, S., and Ellison, G. Position auctions with consumer search. The Quarterly Journal of
Economics, 126, 3 (2011), 1213-1270.
4. Baker, L. Comparison of the top three search engines: Bing, Yahoo, Google. Search Engine
Journal (2011) , Retrieved June 29, 2012 from
http://www.searchenginejournal.com/comparison-of-the-top-three-search-engines-
bingyahoo-google-infographic/34109/
5. Borgers, T., Cox, I., Pesendorfer, M., and Petricek, V. Equilibrium bids in sponsored search
auctions: Theory and evidence. American Economic Journal: Microeconomics, 5, 4
(2013),163-187.
6. Brooks, N. The Atlas Rank Report: How Search Engine Rank Impacts Traffic. Seattle, WA:
The Atlas Institute, (2004).
7. Chen J., Liu, D., and Whinston A.B. Auctioning keywords in online search. Journal of
Marketing, 73, 4 (2009), 125–141.
8. Dayanik, S., and Parlar, M. Dynamic bidding strategies in search-based advertising. Annals
of Operations Research, 211,1 (2013), 103-136.
9. Dinev, T., Hu, Q., and Yayla, A. Is there an on-line advertisers' dilemma? A study of click
fraud in the pay-per-click model. International Journal of Electronic Commerce, 13,2
(2008), 29-60.
10. Edelman, B. and Ostrovsky, M. Strategic bidder behavior in sponsored search auctions.
Decision Support Systems, 43,1 (2007), 192–198.
11. Edelman, B., Ostrovsky, M., and Schwarz, M. Internet advertising and the generalized
second price auction: Selling billions of dollars worth of keywords. American Economic
Review, 97,1 (2007), 242–259.
12. Feldman, J., Muthukrishnan, S., Pal, M. and Stein, C. Budget optimization in search-based
advertising auctions. In Proceedings of the 8th ACM conference on Electronic commerce,
(2007), 40-49.
13. Feng, J., and Zhang, M.X. Dynamic price competition on the internet: advertising auctions.
In Proceedings of the 8th ACM conference on Electronic commerce, (2007), 57-58.
14. Ghose, A. and Yang, S. An empirical analysis of sponsored search performance in search
engine advertising. Management Science, 55, 10(2009), 1605–1622.
15. Jansen, B. J., and Mullen, T. Sponsored search: an overview of the concept, history, and
technology. International Journal of Electronic Business, 6, 2 (2008), 114-131.
16. Jansen, B. J., Sobel, K., and Zhang, M. The brand effect of key phrases and advertisements
in sponsored search. International Journal of Electronic Commerce, 16, 1 (2011), 77-106.

36
17. Jerath K., Ma, L., Park, Y. H., and Srinivasan, K. A ‘position paradox’ in sponsored search
auctions. Marketing Science, 30,4 (2011), 612–627.
18. Katona, Z. and Sarvary, M. The race for sponsored links: Bidding patterns for search
advertising. Marketing Science, 29,2 (2010), 199–215.
19. Kempe, D., and Mahdian, M. A cascade model for externalities in sponsored search.
Internet and Network Economics. Springer Berlin Heidelberg, (2008), 585-596.
20. Kitts, B., and Leblanc,B. Optimal bidding on keyword auctions. Electronic Markets, 14,3
(2004): 186-201.
21. A Kenshoo Perspective, Best practices for paid search bid management and optimization,
(March 2012), Retrieved on Mar 15,2014, from
http://www.kenshoo.com/biddingwhitepaper/.
22. Lahaie, S., Pennock, D.M., Saberi, A., and Vohra, R.V. Sponsored search auctions.
Algorithmic game theory, (2007), 699-716.
23. Lohse, G.L. Consumer eye movement patterns on yellow pages advertising. Journal of
Advertising, 26,1(1997), 61–73.
24. Maillé, P., Markakis, E., Naldi, M., Stamoulis, G.D., and Tuffin, B. Sponsored search
auctions: An overview of research with emphasis on game theoretic aspects. Electronic
Commerce Research, 12, 3 (2012), 265-300.
25. Mou , K., How to bid your way to a successful Facebook campaign, August 6th, 2013,
retrieved on Feb 27, 2014, from http://insights.marinsoftware.com/bid-optimization/
26. Rutz, O. J. and Bucklin, R. E. From generic to branded: A model of spillover dynamics in
paid search advertising. Journal of Marketing Research, 48,1(2011), 87–102.
27. Rutz, O. J., Trusov, M., and Bucklin, R. E. Modeling indirect effects of paid search
advertising: Which keywords lead to more future visits? Marketing Science, 30,4(2011),
646–665.
28. SEMPO. State of search marketing 2012 report. (2012), Retrieved from https://sempo.site-
ym.com/?members_report_land.
29. Sen, R. Optimal search engine marketing strategy. International Journal of Electronic
Commerce, 10, 1 (2005), 9-25.
30. The Search Agency. Bid optimization in paid search: Aligning advertising strategy with
business goals. (2010), Retrieved from:
http://info.thesearchagency.com/BidOptimizationinPaidSearchAligningAdvertisingStrategy
withBusinessGoals.html .
31. Varian, H.R. Position auctions. International Journal of Industrial Organization, 25,6
(2007), 1163-1178.
32. Vickrey, W. Counterspeculation, auctions, and competitive sealed tenders. The Journal of
Finance, 16,1 (1961), 8-37.
33. Yao, S. and Mela, C. F. A dynamic model of sponsored search advertising. Marketing
Science, 30, 3(2011), 447–468.
34. Yamin, F.M., and Ramayah, T. Interfacing Google search engine to capture user web search
behavior. International Journal of Electronic Commerce, 4,1 (2013), 47-62.
35. Yuan, J. Examining the Yahoo! sponsored search auctions: A regression discontinuity
design approach. International Journal of Economics and Finance, 4,3 (2012) ,139–151.
36. Zhang, J., Yang, Y., Li, X., Qin, R., and Zeng, D. Dynamic dual adjustment of daily budgets
and bids in sponsored search auctions. Decision Support Systems, 57 (2014), 105-114.

37
37. Zhang, X., and Feng, J. Cyclical bid adjustments in search-engine advertising. Management
Science, 57, 9 (2011), 1703-1719.
38. Zhu, Y. and Wilbur, K. C. Hybrid advertising auctions. Marketing Science, 30, 2 (2011),
249–273.
38
Table 1: Descriptive Statistics of Four Keyword Categories
A B
Min. Mean Max. S.D. Variables Min. Mean Max. S.D.
4617
Num. bidders
4501
99.76 1332 1,000,000 20,934.37 Average bid 50 699.3 211,900 3482.67
2 4,736 1,125,000 25,606.15 Num. bids 2 3586 1,148,000 33,499.73
1 2.94 383 5.72 Num. bidders per Keyword 1 2.48 158 4.96
0.00% 24.72% 99.65% 30.96% Pulsing intensity 0 0.00% 18.51% 98.37%
0.00% 11.35% 151.90% 17.29% % Pulse fluctuation 0 0.00% 8.37% 120.90%
0 81.06 9,208 293.212 Pulse fluctuation 0 90.26 89220 1475.09
1 6.66 38.5 3.64 Rank 1 7.93 46.17 5.63
0 4.08 17 2.17 Rank fluctuation 0 4.62 24.4 2.92
1 13.08 4,479 100.88 Impressions 1 8.14 2,878 63.87
0 19.46 4,723 150.23 Impression fluctuation 0 9.5 3,088 62.23
0 0.08 8 0.29 Clicks 0 0.06 17.41 0.35
0 0.14 10.88 0.46 Click fluctuation 0 0.14 10.88 0.46
C
D
Min. Mean Max. S.D. Variables Min. Mean Max. S.D.
5675
Num. bidders
3135
50 806.1 200,000 3007.63 Average bid 80 537.3 112,400 2,336.49
2 3,333 778,300 16586.03 Num. bidders 2 2,328 155,100 8,695.19
1 2.16 240 3.77 Num. bidders per Keyword 1 2.37 539 6.44
0.00% 24.91% 98.58% 31.01% Pulsing intensity 0.00% 25.83% 97.72% 30.93%
0.00% 12.26% 159.70% 19.25% % Pulse fluctuation 0.00% 12.07% 191.40% 18.35%
0 85.72 8,874 312.27 Pulse fluctuation 0 77.17 57,700 1,077.67
1 5.62 34 3.08 Rank 1 5.69 27.59 3.27
0 3.49 20 2.03 Rank fluctuation 0 3.67 19.33 2.23
1 5.14 2,315 32.44 Impressions 1 7.76 1,114 30.15
0 6.47 4,266 59.17 Impression fluctuation 0 9.93 1,389 40.14
0 0.05 7.89 0.2 Clicks 0 0.07 9.011 0.27
0 0.09 15.5 0.36 Click fluctuation 0 0.12 17.29 0.49

39
Table 2: Cross-Sectional Data:
Comparison between Fixed Bidding and Pulse Bidding
Fixed Bidding: A (N = 1,890) Pulse Bidding: A (N = 2,727)
Min Mean Max S.D. Min Mean Max S.D.
100 2,153.20 999,990 32,658.83 Average Bid 100 763.64 37,530 1,482.37
2 392.27 69,733 2,179.13 Number of Bids 2 7,746.29 1,125,397 32,936.79
1 6.97 38.50 4.55 Average Rank 1 6.44 22.80 2.83
0 3.72 17.00 2.42 Rank Fluctuation 0 4.32 14.41 1.95
1 10.74 4,479.13 124.01 Average Impressions 1 14.70 1,909.94 81.04
0 13.22 4,722.67 147.06 Impression Fluctuation 0 23.78 3,553.07 152.26
0 0.05 8.00 0.26 Average Clicks 0 0.10 5.71 0.31
0 0.09 6.00 0.32 Click Fluctuation 0 0.18 10.88 0.53
Fixed Bidding B (N=2,039) Pulse Bidding B (N=2,462)
Min Mean Max S.D. Min Mean Max S.D.
58 754.80 211,900 4,621.84 Average Bid 50 632.30 11,320 988.96
2 714.90 214,900 7,491.74 Number of Bids 2 5964.00 1,148,000 44,643.75
1 8.55 46.17 6.88 Average Rank 1 7.42 37.78 4.26
0 4.46 24.40 3.29 Rank Fluctuation 0 4.75 18.07 2.56
1 6.49 232.90 12.60 Average Impressions 1 10.12 2,878.00 93.85
0 8.40 459.20 20.70 Impression Fluctuation 0 10.81 3,088.00 89.61
0 0.06 17.41 0.48 Average Clicks 0 0.07 3.13 0.17
0 0.09 24.42 0.72 Click Fluctuation 0 0.12 5.81 0.30
Fixed Bidding C (N=2,400) Pulse Bidding C (N=3,275)
Min Mean Max S.D. Min Mean Max S.D.
50 954.60 200,000 4,465.35 Average Bid 63 695.60 18,750 1,237.83
3 372.20 59,530 1,947.12 Number of Bids 3 5716.00 778,300 21,879.75
1 5.69 34.00 3.64 Average Rank 1 5.59 26.45 2.52
0 3.16 20.00 2.18 Rank Fluctuation 0 3.87 14.58 1.81
1 3.67 233.90 8.72 Average Impressions 1 6.44 2315.00 42.78
0 3.75 396.90 13.58 Impression Fluctuation 0 8.82 4266.00 78.37
0 0.04 2.97 0.12 Average Clicks 0 0.06 7.89 0.24
0 0.06 5.75 0.20 Click Fluctuation 0 0.12 15.50 0.44
Fixed Bidding: D (N = 1,271) Pulse Bidding: D (N = 1,864)
Min Mean Max S.D. Min Mean Max S.D.
80 577.20 31,140 1,327.61 Average Bid 88 510.08 112,444 2,824.94
2 391.84 14,375 1,195.10 Number of Bids 2 3,648.16 155,123 11,041.41
1 5.88 27.59 3.81 Average Rank 1 5.42 21.40 2.83
0 3.11 19.33 2.34 Rank Fluctuation 0 4.06 15.80 2.07
1 7.11 1113.71 39.04 Average Impressions 1 8.21 520.93 22.13
0 7.81 1388.55 43.45 Impression Fluctuation 0 11.37 887.26 37.65
0 0.05 9.01 0.28 Average Clicks 0 0.08 6.00 0.27
0 0.09 17.29 0.51 Click Fluctuation 0 0.15 10.19 0.46

40
Table 3a: Cross-Sectional Analyses: Pulsing Intensity and Keyword Performance / Performance’ Fluctuations
DEPENDENT VAR A B C D
RANK Estimate S.D. P-value Estimate S.D. P-value Estimate S.D. P-value Estimate S.D. P-value
Intercept 7.457 0.163 0.000 7.865 0.138 0.000 6.116 0.084 0.000 6.035 0.118 0.000
Average Bid Value -6.19E-04 7.90E-05 0.000 -6.69E-05 1.85E-05 0.000 -4.41E-04 3.49E-05 0.000 -9.72E-05 2.31E-05 0.000
Pulsing Intensity -1.255 0.283 0.000 -1.167 0.318 0.000 -0.273 0.148 0.065 -0.251 0.225 0.264
IMPRESSIONS Estimate S.D. P-value Estimate S.D. P-value Estimate S.D. P-value Estimate S.D. P-value
Intercept 2.883 2.573 0.263 5.006 0.409 0.000 5.899 1.456 0.000 6.081 0.928 0.000
Average Bid Value 4.15E-03 1.25E-03 0.001 1.12E-04 5.47E-05 0.040 8.96E-04 6.06E-04 0.139 2.81E-04 1.81E-04 0.121
Pulsing Intensity 11.967 4.458 0.007 5.137 0.942 0.000 -0.193 2.569 0.940 4.562 1.762 0.010
CLICKS Estimate S.D. P-value Estimate S.D. P-value Estimate S.D. P-value Estimate S.D. P-value
Intercept 0.024 0.015 0.104 0.038 0.006 0.000 0.024 0.008 0.003 0.042 0.011 0.000
Average Bid Value 3.81E-05 7.14E-06 0.000 8.44E-07 7.43E-07 0.256 2.56E-05 3.34E-06 0.000 8.89E-06 2.22E-06 0.000
Pulsing Intensity 0.105 0.026 0.000 0.090 0.013 0.000 0.051 0.014 0.000 0.083 0.022 0.000
RANK
FLUCTUATION Estimate S.D. P-value Estimate S.D. P-value Estimate S.D. P-value Estimate S.D. P-value
Intercept 4.649 0.110 0.000 4.729 0.083 0.000 3.841 0.060 0.000 3.874 0.086 0.000
Average Bid Value -4.15E-04 5.33E-05 0.000 -4.33E-05 1.11E-05 0.000 -2.76E-04 2.50E-05 0.000 -7.04E-05 1.68E-05 0.000
Pulsing Intensity 0.001 0.191 0.996 0.169 0.114 0.140 0.506 0.106 0.000 0.502 0.164 0.002
IMPRESSION
FLUCTUATION Estimate S.D. P-value Estimate S.D. P-value Estimate S.D. P-value Estimate S.D. P-value
Intercept 1.187 4.726 0.802 5.643 0.671 0.000 7.884 2.667 0.003 6.986 1.578 0.000
Average Bid Value 7.17E-03 2.29E-03 0.002 1.67E-04 8.98E-05 0.063 1.36E-03 1.11E-03 0.222 4.09E-04 3.08E-04 0.185
Pulsing Intensity 24.381 8.187 0.003 7.787 1.546 0.000 -0.010 4.707 0.998 9.606 2.997 0.001
CLICK
FLUCTUATION Estimate S.D. P-value Estimate S.D. P-value Estimate S.D. P-value Estimate S.D. P-value
Intercept 0.036 0.026 0.165 0.064 0.010 0.000 0.041 0.015 0.006 0.072 0.019 0.000
Average Bid Value 6.64E-05 1.26E-05 0.000 1.57E-06 1.28E-06 0.219 4.62E-05 6.19E-06 0.000 1.15E-05 3.78E-06 0.002
Pulsing Intensity 0.207 0.045 0.000 0.171 0.022 0.000 0.101 0.026 0.000 0.159 0.037 0.000
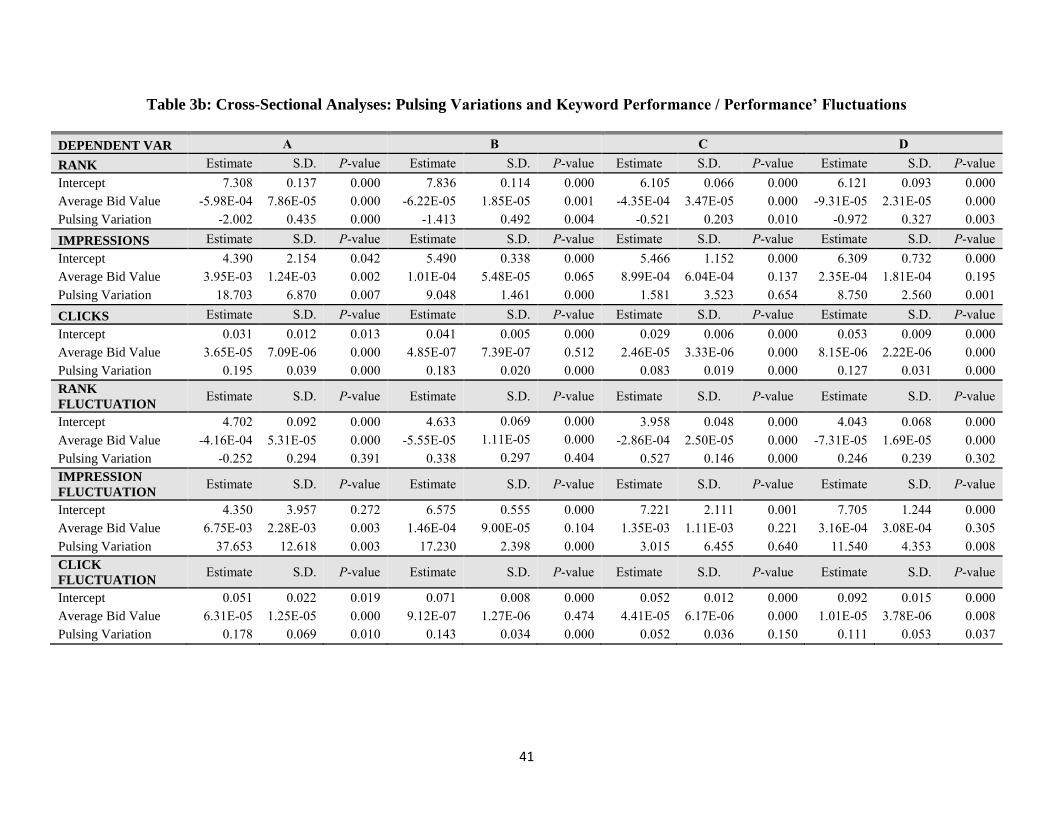
41
Table 3b: Cross-Sectional Analyses: Pulsing Variations and Keyword Performance / Performance’ Fluctuations
DEPENDENT VAR A B C D
RANK Estimate S.D. P-value Estimate S.D. P-value Estimate S.D. P-value Estimate S.D. P-value
Intercept 7.308 0.137 0.000 7.836 0.114 0.000 6.105 0.066 0.000 6.121 0.093 0.000
Average Bid Value -5.98E-04 7.86E-05 0.000 -6.22E-05 1.85E-05 0.001 -4.35E-04 3.47E-05 0.000 -9.31E-05 2.31E-05 0.000
Pulsing Variation -2.002 0.435 0.000 -1.413 0.492 0.004 -0.521 0.203 0.010 -0.972 0.327 0.003
IMPRESSIONS Estimate S.D. P-value Estimate S.D. P-value Estimate S.D. P-value Estimate S.D. P-value
Intercept 4.390 2.154 0.042 5.490 0.338 0.000 5.466 1.152 0.000 6.309 0.732 0.000
Average Bid Value 3.95E-03 1.24E-03 0.002 1.01E-04 5.48E-05 0.065 8.99E-04 6.04E-04 0.137 2.35E-04 1.81E-04 0.195
Pulsing Variation 18.703 6.870 0.007 9.048 1.461 0.000 1.581 3.523 0.654 8.750 2.560 0.001
CLICKS Estimate S.D. P-value Estimate S.D. P-value Estimate S.D. P-value Estimate S.D. P-value
Intercept 0.031 0.012 0.013 0.041 0.005 0.000 0.029 0.006 0.000 0.053 0.009 0.000
Average Bid Value 3.65E-05 7.09E-06 0.000 4.85E-07 7.39E-07 0.512 2.46E-05 3.33E-06 0.000 8.15E-06 2.22E-06 0.000
Pulsing Variation 0.195 0.039 0.000 0.183 0.020 0.000 0.083 0.019 0.000 0.127 0.031 0.000
RANK
FLUCTUATION Estimate S.D. P-value Estimate S.D. P-value Estimate S.D. P-value Estimate S.D. P-value
Intercept 4.702 0.092 0.000 4.633 0.069 0.000 3.958 0.048 0.000 4.043 0.068 0.000
Average Bid Value -4.16E-04 5.31E-05 0.000 -5.55E-05 1.11E-05 0.000 -2.86E-04 2.50E-05 0.000 -7.31E-05 1.69E-05 0.000
Pulsing Variation -0.252 0.294 0.391 0.338 0.297 0.404 0.527 0.146 0.000 0.246 0.239 0.302
IMPRESSION
FLUCTUATION Estimate S.D. P-value Estimate S.D. P-value Estimate S.D. P-value Estimate S.D. P-value
Intercept 4.350 3.957 0.272 6.575 0.555 0.000 7.221 2.111 0.001 7.705 1.244 0.000
Average Bid Value 6.75E-03 2.28E-03 0.003 1.46E-04 9.00E-05 0.104 1.35E-03 1.11E-03 0.221 3.16E-04 3.08E-04 0.305
Pulsing Variation 37.653 12.618 0.003 17.230 2.398 0.000 3.015 6.455 0.640 11.540 4.353 0.008
CLICK
FLUCTUATION Estimate S.D. P-value Estimate S.D. P-value Estimate S.D. P-value Estimate S.D. P-value
Intercept 0.051 0.022 0.019 0.071 0.008 0.000 0.052 0.012 0.000 0.092 0.015 0.000
Average Bid Value 6.31E-05 1.25E-05 0.000 9.12E-07 1.27E-06 0.474 4.41E-05 6.17E-06 0.000 1.01E-05 3.78E-06 0.008
Pulsing Variation 0.178 0.069 0.010 0.143 0.034 0.000 0.052 0.036 0.150 0.111 0.053 0.037

42
Table 4: Longitudinal Analyses
Mixed Two-Stage Least Square Model Results
Main Model Results DEPENDENT VAR A B C D
RANK Estimate S.D. P-value Estimate S.D. P-value Estimate S.D. P-value Estimate S.D. P-value
Intercept 8.423 0.102 0.000 7.707 0.295 0.000 4.923 0.300 0.000 4.260 0.103 0.000
Bid Value -3.22E-04 3.38E-06 0.000 -1.16E-04 4.60E-06 0.000 -6.89E-05 1.07E-05 0.000 -4.53E-05 9.52E-06 0.000
Pulsing Dummy -0.169 0.005 0.000 -0.094 0.009 0.000 -0.073 0.004 0.000 -0.065 0.007 0.000
Pulsing Strength -0.021 0.003 0.000 -0.012 0.001 0.000 -0.014 3.24E-04 0.000 -0.002 0.001 0.208
sd( R0 ) 9.819 7.614 7.144 4.922
sd( R1 ) 8.07E-09
5.18E-08
9.89E-09
7.62E-08
sd( R
2 ) 7.59E-06
6.23E-05
7.07E-06
8.10E-06
sd( R3 ) 7.26E-06
8.94E-07
5.53E-07
3.55E-06
–2 LogLike/AIC 1.31E+08 1.31E+08 1.02E+08 1.02E+08 1.14E+08 1.14E+08
4.45E+07 4.45E+07
IMPRESSIONS Estimate S.D. P-value Estimate S.D. P-value Estimate S.D. P-value Estimate S.D. P-value
Intercept 10.541 1.960 0.000 10.046 1.152 0.000 12.008 0.942 0.000 7.324 0.423 0.000
Bid Value 0.015 0.001 0.000 0.008 2.89E-04 0.000 0.011 4.65E-04 0.000 2.51E-04 3.53E-05 0.000
Pulsing Dummy 8.391 0.850 0.000 5.175 0.648 0.000 5.933 0.221 0.000 0.087 0.053 0.102
Pulsing Strength 6.653 0.266 0.000 3.414 0.172 0.000 1.492 0.076 0.000 0.050 0.008 0.000
sd( I
0 ) 10.262 11.467 13.339 13.540
sd( I
1 ) 3.40E-06
7.17E-07
1.09E-06
7.43E-08
sd( I
2 ) 7.06E-04
2.77E-03
8.48E-04
2.22E-04
sd( I
3 ) 1.36E-03
9.56E-04
6.04E-05
5.79E-05
–2 LogLike/AIC 3.54E+08 3.54E+08 2.09E+08 2.09E+08 2.62E+08 2.62E+08
9.24E+07 9.24E+07
(Cont’d in the next page)
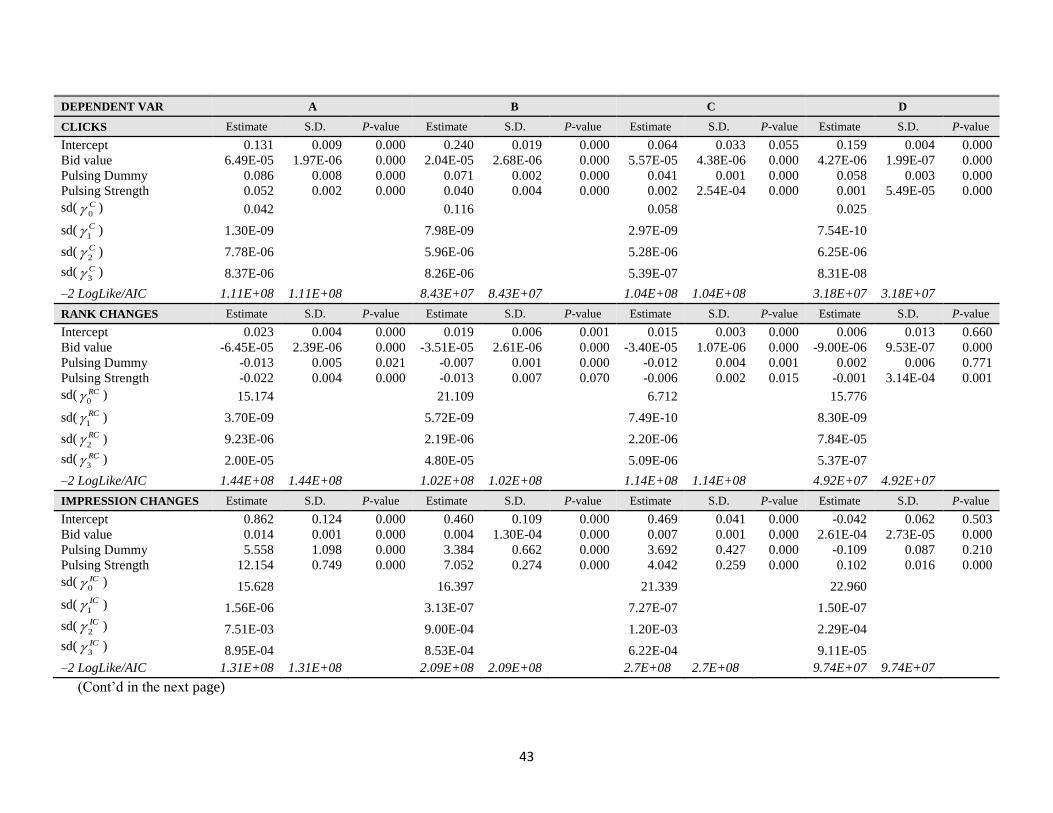
43
DEPENDENT VAR A B C D
CLICKS Estimate S.D. P-value Estimate S.D. P-value Estimate S.D. P-value Estimate S.D. P-value
Intercept 0.131 0.009 0.000 0.240 0.019 0.000 0.064 0.033 0.055 0.159 0.004 0.000
Bid value 6.49E-05 1.97E-06 0.000 2.04E-05 2.68E-06 0.000 5.57E-05 4.38E-06 0.000 4.27E-06 1.99E-07 0.000
Pulsing Dummy 0.086 0.008 0.000 0.071 0.002 0.000 0.041 0.001 0.000 0.058 0.003 0.000
Pulsing Strength 0.052 0.002 0.000 0.040 0.004 0.000 0.002 2.54E-04 0.000 0.001 5.49E-05 0.000
sd( C
0 ) 0.042 0.116 0.058 0.025
sd( C
1 ) 1.30E-09
7.98E-09
2.97E-09
7.54E-10
sd( C
2 ) 7.78E-06
5.96E-06
5.28E-06
6.25E-06
sd( C
3 ) 8.37E-06
8.26E-06
5.39E-07
8.31E-08
–2 LogLike/AIC 1.11E+08 1.11E+08 8.43E+07 8.43E+07 1.04E+08 1.04E+08
3.18E+07 3.18E+07
RANK CHANGES Estimate S.D. P-value Estimate S.D. P-value Estimate S.D. P-value Estimate S.D. P-value
Intercept 0.023 0.004 0.000 0.019 0.006 0.001 0.015 0.003 0.000 0.006 0.013 0.660
Bid value -6.45E-05 2.39E-06 0.000 -3.51E-05 2.61E-06 0.000 -3.40E-05 1.07E-06 0.000 -9.00E-06 9.53E-07 0.000
Pulsing Dummy -0.013 0.005 0.021 -0.007 0.001 0.000 -0.012 0.004 0.001 0.002 0.006 0.771
Pulsing Strength -0.022 0.004 0.000 -0.013 0.007 0.070 -0.006 0.002 0.015 -0.001 3.14E-04 0.001
sd( RC
0 ) 15.174 21.109 6.712 15.776
sd( RC
1 ) 3.70E-09
5.72E-09
7.49E-10
8.30E-09
sd( RC
2 ) 9.23E-06
2.19E-06
2.20E-06
7.84E-05
sd( RC
3 ) 2.00E-05
4.80E-05
5.09E-06
5.37E-07
–2 LogLike/AIC 1.44E+08 1.44E+08 1.02E+08 1.02E+08 1.14E+08 1.14E+08
4.92E+07 4.92E+07
IMPRESSION CHANGES Estimate S.D. P-value Estimate S.D. P-value Estimate S.D. P-value Estimate S.D. P-value
Intercept 0.862 0.124 0.000 0.460 0.109 0.000 0.469 0.041 0.000 -0.042 0.062 0.503
Bid value 0.014 0.001 0.000 0.004 1.30E-04 0.000 0.007 0.001 0.000 2.61E-04 2.73E-05 0.000
Pulsing Dummy 5.558 1.098 0.000 3.384 0.662 0.000 3.692 0.427 0.000 -0.109 0.087 0.210
Pulsing Strength 12.154 0.749 0.000 7.052 0.274 0.000 4.042 0.259 0.000 0.102 0.016 0.000
sd( IC
0 ) 15.628 16.397 21.339 22.960
sd( IC
1 ) 1.56E-06 3.13E-07 7.27E-07
1.50E-07
sd( IC
2 ) 7.51E-03 9.00E-04 1.20E-03
2.29E-04
sd( IC
3 ) 8.95E-04 8.53E-04 6.22E-04
9.11E-05
–2 LogLike/AIC 1.31E+08 1.31E+08 2.09E+08 2.09E+08 2.7E+08 2.7E+08
9.74E+07 9.74E+07
(Cont’d in the next page)

44
DEPENDENT VAR A B C D
CLICK CHANGES Estimate S.D. P-value Estimate S.D. P-value Estimate S.D. P-value Estimate S.D. P-value
Intercept 0.013 0.003 0.000 0.011 0.002 0.000 0.006 0.001 0.000 -0.002 0.102 0.981
Bid value 3.19E-05 1.03E-06 0.000 1.92E-05 8.48E-07 0.000 5.93E-06 4.35E-07 0.000 5.34E-06 3.95E-07 0.000
Pulsing Dummy 0.039 0.006 0.000 0.026 0.007 0.000 0.017 0.003 0.000 3.61E-04 0.001 0.714
Pulsing Strength 0.109 0.002 0.000 0.073 0.001 0.000 0.018 0.001 0.000 0.002 4.08E-04 0.000
sd( C
0 ) 3.59E-06 0.001 1.01E-04 9.36E-07
sd( C
1 ) 6.44E-09 6.26E-09 7.15E-10 3.31E-09
sd( C
2 ) 9.34E-06 7.07E-06 2.77E-06 8.95E-07
sd( C
3 ) 1.33E-06 1.36E-06 8.55E-07 6.60E-07
–2 LogLike/AIC 1.26E+08 1.26E+08 9.29E+07 9.29E+07 1.09E+08 1.09E+08 3.68E+07 3.68E+07

45
Figure 1: Illustration of Pulse Bidding
-150
-100
-50
0
50
100
150
1 4 7
10
13
16
19
22
25
28
31
34
37
40
43
46
49
52
55
58
61
64
67
70
73
76
79
82
85
88
91
94
97
10
0
10
3
10
6
10
9
11
2
11
5
Bid
Va
lue
Time
ID="a45e55ba-660c-41ef-8b90-95434b35cfe1"
Pulse Change (changes in bid value relative to average bid (zero line in the plot))
-1500
-1000
-500
0
500
1000
1500
110
19
28
37
46
55
64
73
82
91
10
010
911
812
713
614
515
416
317
218
119
019
920
821
722
623
524
425
326
227
128
028
929
830
731
632
533
434
335
236
137
037
938
839
740
6
Bid
Vla
ue
Time
ID="0023486c-c556-4536-9a4d-d724f22dd367"
Pulse Change (changes in bid value relative to average bid (zero line in the plot))
-300
-200
-100
0
100
200
300
119
037
956
875
794
611
35
13
24
15
13
17
02
18
91
20
80
22
69
24
58
26
47
28
36
30
25
32
14
34
03
35
92
37
81
39
70
41
59
43
48
45
37
47
26
49
15
51
04
52
93
54
82
56
71
58
60
60
49
62
38
64
27
66
16
68
05
69
94
71
83
73
72
75
61
77
50
79
39
81
28
83
17
85
06
Bid
Va
lue
Time
ID="aeed85d3-e8d8-40ea-9642-32160d69e5e2"
Pulse Change (changes in bid value relative to average bid (zero line in the plot))

46
Figure 2: Illustration of Keyword Performance
0
2
4
6
8
10
12
14
1 4 7
10
13
16
19
22
25
28
31
34
37
40
43
46
49
52
55
58
61
64
67
70
73
76
79
82
85
88
91
94
97
10
0
10
3
10
6
10
9
11
2
11
5
Ra
nk
Time
ID="a45e55ba-660c-41ef-8b90-95434b35cfe1"
Rank
0
2
4
6
8
10
12
14
1
10
19
28
37
46
55
64
73
82
91
10
0
10
9
11
8
12
713
6
14
5
15
4
16
3
17
2
18
1
19
0
19
9
20
821
7
22
6
23
5
24
4
25
3
26
2
27
1
28
0
28
929
8
30
7
31
6
32
5
33
4
34
3
35
2
36
1
37
037
9
38
8
39
7
40
6
Imp
ress
ion
s
Time
ID="0023486c-c556-4536-9a4d-d724f22dd367"
Impressions
0
0.5
1
1.5
2
2.5
3
3.5
118
637
155
674
192
611
11
12
96
14
81
16
66
18
51
20
36
22
21
24
06
25
91
27
76
29
61
31
46
33
31
35
16
37
01
38
86
40
71
42
56
44
41
46
26
48
11
49
96
51
81
53
66
55
51
57
36
59
21
61
06
62
91
64
76
66
61
68
46
70
31
72
16
74
01
75
86
77
71
79
56
81
41
83
26
85
11
Cli
cks
Time
ID="aeed85d3-e8d8-40ea-9642-32160d69e5e2"
Clicks

47
Figure 3a: Histogram of Pulsing Intensity of Pulse-bidding Group in Four Keyword
Categories
X-axis represents pulsing intensity; Y-axis represents the number of observations.
Histogram of Pulsing Intensity_A
Pulsing Intensity
Fre
qu
en
cy
0.0 0.2 0.4 0.6 0.8 1.0
05
01
00
15
0
Histogram of Pulsing Intensity_B
Pulsing Intensity
Fre
qu
en
cy
0.0 0.2 0.4 0.6 0.8 1.0
01
00
30
05
00
Histogram of Pulsing Intensity_C
Pulsing Intensity
Fre
qu
en
cy
0.0 0.2 0.4 0.6 0.8 1.0
01
00
20
03
00
40
0
Histogram of Pulsing Intensity_D
Pulsing Intensity
Fre
qu
en
cy
0.0 0.2 0.4 0.6 0.8 1.0
05
01
50
25
0

48
Figure 3b: Histogram of Pulsing Variation of Pulse-bidding Group in Four Keyword
Categories
X-axis represents pulsing variation; Y-axis represents the number of observations.
Histogram of Pulsing Variation_A
Pulsing Variation
Fre
qu
en
cy
0.0 0.2 0.4 0.6 0.8 1.0 1.2
05
01
50
25
0
Histogram of Pulsing Variation_B
Pulsing Variation
Fre
qu
en
cy
0.0 0.2 0.4 0.6 0.8 1.0 1.2
02
00
60
0
Histogram of Pulsing Variation_C
Pulsing Variation
Fre
qu
en
cy
0.0 0.2 0.4 0.6 0.8 1.0 1.2
02
00
40
06
00
80
0
Histogram of Pulsing Variation_D
Pulsing Variation
Fre
qu
en
cy
0.0 0.2 0.4 0.6 0.8 1.0 1.2
01
00
30
05
00
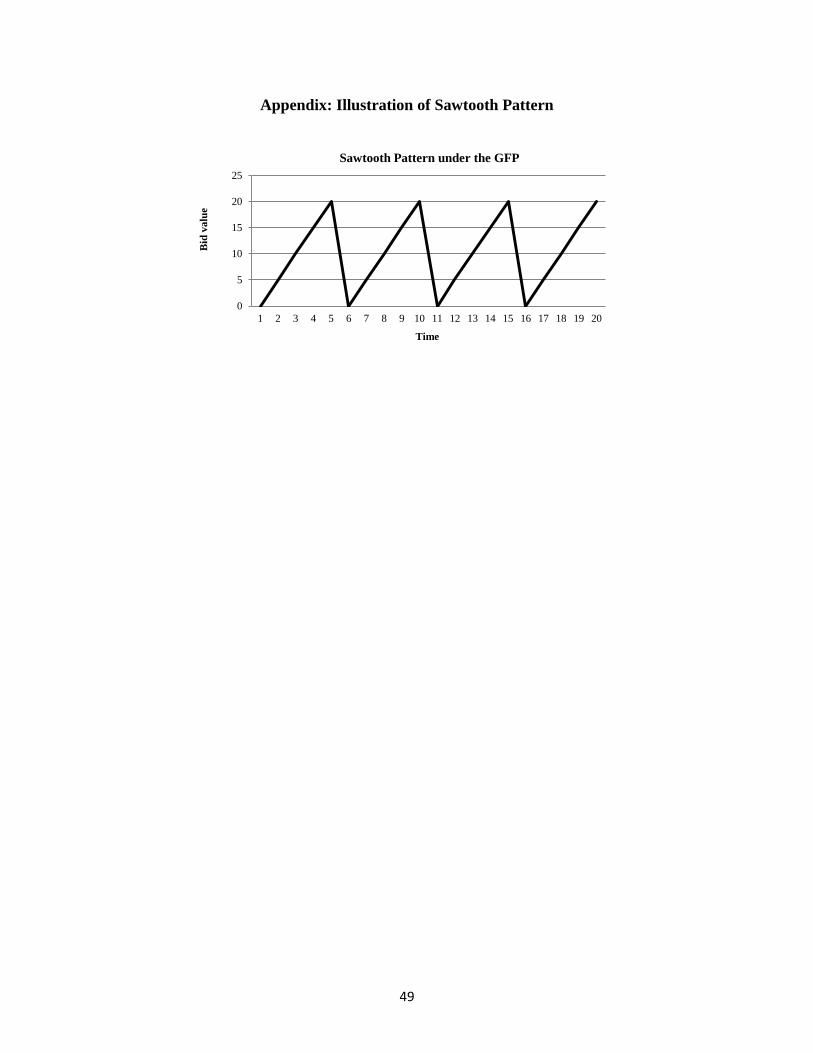
49
Appendix: Illustration of Sawtooth Pattern
0
5
10
15
20
25
1 2 3 4 5 6 7 8 9 10 11 12 13 14 15 16 17 18 19 20
Bid
va
lue
Time
Sawtooth Pattern under the GFP