Embed Size (px)
Citation preview
Journal of Strength and Conditioning Research Publish Ahead of PrintDOI: 10.1519/JSC.0000000000001936
The Effects of Beef, Chicken, or Whey Protein Post-Workout on Body Composition and Muscle
Performance
Running Head: Beef, Chicken, or Whey Protein Post-Workout
Matthew H. Sharp*3
, Ryan P. Lowery3, Kevin A. Shields
1, Jason R. Lane
1, Jocelyn L. Gray
1, Jeremy M.
Partl1, Daniel W. Hayes
1, Gabriel J. Wilson
2, Chase A. Hollmer
1, Julie R. Minivich
1 Jacob
M. Wilson3
and
1 Department of Health Sciences and Human Performance, The University of Tampa, Tampa, FL USA
33606
2
Maximum Human Performance, West Caldwell, NJ, USA 07006
3 Applied Science and Performance Institute, Tampa, FL, USA 33607
Corresponding Author: Matthew H. Sharp, M.S.
Applied Science and Performance Institute
Copyright ª 2017 National Strength and Conditioning Association
Different Protein Supplements and Resistance Training
1
ABSTRACT
The purpose of this study was to determine the effects of post-workout consumption of beef protein
isolate (Beef), hydrolyzed chicken protein (Chx) or whey protein concentrate (WPC), compared to a
control on lean mass and strength during 8 weeks of resistance training. Forty-one males and females
were randomized into four groups: WPC (m=5, f=5; Age (yrs)=19 ± 2, Height (cm)=171 ± 10, Mass (kg)=
74.60 ± 14.19), Beef (m=5, f=5; Age (yrs)=22 ± 4, Height (cm)=170 ± 7, Mass (kg)=70.13 ± 8.16),
ChxC(m=5, f=6; Age (yrs)=21 ± 2, Height (cm)=169 ± 9, Mass (kg)=74.52 ± 13.83) and Maltodextrin
(control) (m=4, f=6; Age (yrs)= 21 ± 2, Height (cm)=170 ± 9, Mass (kg)= 73.18 ± 10.96). Subjects partook
in an 8-week periodized resistance-training program. Forty-six grams of protein or a control were
consumed immediately following training or at similar times on off-days. Dual energy x-ray
absorptiometry (DXA) was used to determine changes in body composition. Maximum strength were
assessed by one repetition maximum (1RM) for bench press (upper body) and deadlift (lower body).
Power output was measured using cycle ergometer. WPC (52.48 ± 11.15 to 54.96 ± 11.85), Beef (51.68 ±
7.61kg to 54.65 ± 8.67kg) and Chx (52.97 ± 12.12kg to 54.89 ± 13.43kg) each led to a significant increase
in lean body mass compared with baseline (p<0.0001) while the control condition did not (53.14 ±
11.35kg to 54.19 ± 10.74kg). Fat loss was also significantly decreased at 8 weeks compared to baseline
for all protein sources (WPC: 18.70 ± 7.38kg to 17.16 ± 7.18kg; Beef: 16.43 ± 5.71kg to 14.65 ± 5.41kg;
Chx: 17.58 ± 5.57kg to 15.87 ± 6.07kg), but not the control condition (16.29 ± 7.14kg to 14.95 ± 7.72)
(p<0.0001). One repetition maximum for both deadlift and bench-press were significantly increased for
all treatment groups when compared to baseline. No differences in strength were noted between
conditions. Overall, the results of this study demonstrate that consuming quality sources of protein from
meat or WPC lead to significant benefits in body composition compared to control.
Key Words: Protein; Supplementation; Muscle Hypertrophy; Body Composition; Strength Training
ACCEPTED
Copyright ª 2017 National Strength and Conditioning Association
Different Protein Supplements and Resistance Training
2
INTRODUCTION
The benefits of additional protein consumption, beyond normal dietary protein intake, for
people of all ages participating in resistance training are well documented (2, 10, 11, 16). Following
consumption, proteins are digested into their constituent amino acids, which provide the building blocks
of skeletal muscle. It has been suggested that protein requirements for resistance trained athletes is
higher than normal individuals as extra protein/amino acids are necessary for maintenance of skeletal
muscle tissue and performance. In fact in the 1980s and early 90’s researchers demonstrated that total
protein needs were 50 to 175% greater in athletes than sedentary controls (9). However, there are a
number of variables beyond total protein intake that must be considered when selecting proteins
including the quality and source of the protein. In general, quality is determined by the essential amino
acid (EAA) content of the protein. Overall, research has shown that animal and dairy-based products
contain the highest percentage of EAAs and result in greater protein synthesis and muscle hypertrophy
following resistance training than a vegetarian protein-matched control, which typically lack one or
more EAAs (3, 6, 16).
While a majority of research in sport has compared dairy to maltodextrin and plant based
proteins, much less is known regarding the impact of meat based protein sources on skeletal muscle
adaptations (3, 6, 16). Previous work has shown 30 g of meat protein to be efficient in stimulating
mixed-muscle fractional synthesis in both young and elderly subjects (15). (5, 16, 17) To date, research
has yet to investigate the effects of dairy protein as compared to various meat based protein sources
during a resistance-training program. Therefore, the purpose of this study was to compare the effects
of whey protein concentrate (WPC), isolated beef proteinBeef, isolated chicken proteinChx, and a
maltodextrin control group on body composition, muscle performance, perceived recovery and
gastrointestinal symptoms in resistance trained individuals during periodized resistance training
ACCEPTED
Copyright ª 2017 National Strength and Conditioning Association
Different Protein Supplements and Resistance Training
3
combined with high intensity interval training. We hypothesize that different animal protein sources
(46g) consumed after training bouts improve resistance training and body composition adaptations
relative to a control group after an 8 week periodized resistance training protocol.
METHODS
Experimental Approach to the Problem
In order to investigate the effects of different protein sources on body composition and functional
performance, a double-blind, parallel, controlled trial was conducted in which subjects were randomly
divided into 4 groups: WPC, isolated beef protein (BeefISO™, Essentia Metabolic Proteins, Ankeny, IA),
hydrolyzed chicken protein (MyoCHX™, Essentia Metabolic Proteins, Ankeny, IA) and Maltodextrin
(control). Subjects were stratified based on dependent variables in the following order: lean body mass
(p=0.9904), fat mass (p=0.9903), strength (1RM deadlift: p=0.8283; 1RM bench press: p=0.9763) and
power output (p=0.8402) such that baseline values for these parameters were not statistically different
across groups. All subjects were required to undergo identical training protocols for 8 weeks. Subjects
consumed their supplement immediately post workout and at similar times on non-workout days. A
blinded researcher prior to and following the 8-week protocol collected measures of body composition,
strength and power at the same time of the day.
Subjects
A total of 41 subjects (male, n=19; female n=22) aged 18-30 years were recruited from The
University of Tampa’s campus and volunteered for the study. The WPC group consisted of 5 males and 5
ACCEPTED
Copyright ª 2017 National Strength and Conditioning Association
Different Protein Supplements and Resistance Training
4
females; the isolated beef protein (Beef) group consisted of 5 males and 5 females; the hydrolyzed
chicken protein (Chx) group consisted of 5 males and 6 females and the control group consisted of 4
males and 6 females. All subjects reported at least 2 years of prior experience in weight lifting
programs. All subjects agreed to refrain from additional resistance or cardiovascular training not
prescribed by the researchers for the duration of the study. We adopted the select inclusion criteria as
followed: non-smoker, no protein/amino acid supplementation, no anabolic or catabolic, or any other
ergogenic acids and finally any substance known to influence the variables investigated in this study.
Each subject was informed of the inherent risks and benefits and signed an informed consent prior to
participating in the study. The methods and test assessments utilized in this study were approved by the
University of Tampa Institutional Review Board.
INSERT TABLE 1 ABOUT HERE
Diet and Supplementation
Subjects worked individually with a dietitian on a weekly basis. Subjects were prescribed an
individually based diet. The dietitian used the Mifflin St. Jeor equation for each subject to determine
their caloric needs based on the lean body mass of the individual. The recommended diet consisted of
50% carbohydrates, 25% fat, and 25% protein. Total calories and macronutrients were matched
between treatment groups. Post study analysis revealed that individuals consumed diets that resulted
in 48% carbohydrates, 29% fat, and 23% protein. There were no statistical differences in total calories
or macronutrients between groups. Subjects tracked their daily intakes using MyFitnessPal™.
ACCEPTED
Copyright ª 2017 National Strength and Conditioning Association
Different Protein Supplements and Resistance Training
5
In addition to dietary recommendations, subjects consumed a 46g bolus of their respective
treatment condition (WPC, Chx, Beef, or Maltodextrin) post workout before leaving the laboratory and
at similar times on non-workout days. All shakes were consumed under the supervision of a blinded
researcher. In order to maintain control and blinded conditions, this researcher was the only person
handling and distributing the supplementation to the subjects. This individual had no part in data
collection, training, or post study analysis. Individuals were provided the supplement in the form of a
shakes, which were labeled “A”, “B”, “C”, and “D”.
Body Composition
A whole body Dual-Energy X-ray Absorptiometry (DXA) (Hologic, Bedford, MA, USA) scan was
utilized to measure body composition. Lean body mass (LBM) and fat mass (FM) were determined for
the total body with the subject laying in a supine position with the knee extended and instructed not to
move for the entire duration of the scan (~10 minutes). Results from the each scan were uploaded and
accessed on a computer directly connected to the DXA device. All DXA scans were conducted prior to
and after the completion of the study, and each subject was required to fast overnight (10 hours) prior
to the DXA scan. Each participant was given an appointment sheet including the date and time of their
scan with the date and time to stop consuming food and drink for compliance purposes. All scans were
analyzed by the same researcher who was blinded to treatment conditions. The coefficient of variation
(CV) for body composition was 1.5%.
Training Protocol
All subjects participated in an 8-week periodized resistance training protocol consisting of two
hypertrophy oriented sessions and one strength oriented session. During the training protocol, each
ACCEPTED
Copyright ª 2017 National Strength and Conditioning Association
Different Protein Supplements and Resistance Training
6
subject performed resistance exercise 3 d/wk (M, W, F). Monday and Wednesday was full-body
hypertrophy and Friday was full-body strength. The rest period between sets was set at 1-2 minutes for
hypertrophy and 3-5 minutes for strength. Tuesday and Thursday consisted of low volume and high
interval training on a Monark cycle ergometer. The resistance load for all Wingate sessions was set at
7.5% of body mass. All training sessions were supervised by a trained research assistant. The training
protocol was identical between groups and is further explained in the table below. Subjects were
restricted to only the exercise activity utilized in this protocol for the duration of their participation in
the study.
INSERT TABLE 2 ABOUT HERE
Strength & Power Measurements
Prior to the training protocol, all subjects completed two familiarization sessions to practice and
familiarize with the following assessments: 1RM bench press, 1RM deadlift, Wingate anaerobic peak
power (PP). Strength was assessed via one repetition maximum testing (1RM) in the bench press and
deadlift movements. Observation and load prescription was performed by a trained tester that was
certified by the National Strength and Conditioning Association (NSCA-CSCS). Loads were increased
incrementally until maximal load or failure at a given load was reached. Briefly, subjects performed a
general warm-up and a specific warm-up consisting of three sets. During the first set, subjects
performed 10 repetitions with 50% of their predicted 1RM. For the second set, they performed five
repetitions with 70% of the predicted 1RM. In the third set, subjects perform one repetition with 90% of
their predicted 1RM. After the completion of warm-up sets, subjects rested for 3 minutes. Then, each
ACCEPTED
Copyright ª 2017 National Strength and Conditioning Association
Different Protein Supplements and Resistance Training
7
subject had as many as five attempts to achieve their 1RM load with 3-5 minutes rest between each
attempt.
Anaerobic power was assessed via Monark Wingate cycle ergometry (Monark™, Vansbro,
Sweden). During the cycling test, the volunteer was instructed to cycle against a predetermined
resistance (7.5% of body mass) as fast as possible for 10 seconds. The saddle height was adjusted for
each individual in order to produce a 5–10° knee flexion while the foot was in the low position of the
central void. A standardized verbal stimulus was provided to the participant. Power output was
recorded in real time by a computer connected to the Monark standard cycle ergometer (Monark model
894e, Vansbro, Sweden) during a 10-second sprint test. Peak power was recorded using Monark
Anaerobic test software (Monark Anaerobic Wingate Software, Version 1.0, Monark, Vansbro, Sweden).
The CV for Wingate PP was 3.5%.
Perceptual Measures
The perceptual measures collected using a perceived recovery status scale (PRS). Ratings of
perceived recovery were collected at the beginning and end of every week. The PRS scale consisted of a
scalar representation numbering from 0-10. Visual descriptors of “very poorly recovered”, “adequately
recovered” and “very well recovered” for perceived recovery were presented at numbers 0, 5, and 10,
respectively. Subjects were asked to identify their level of perceived recovery after warming-up, before
performing the training protocol.
Gastrointestinal Symptoms
At the mid-point of every week, subjects completed the Gastrointestinal Symptom Rating Scale
(GSRS) survey prior to training (14). The survey contained 15 questions which were rated on a seven-
point Likert scale with visual anchors ranging from “very serve discomfort” to “no discomfort at all” to
ACCEPTED
Copyright ª 2017 National Strength and Conditioning Association
Different Protein Supplements and Resistance Training
8
track digestive side effects associated with supplementation. The factor analysis used in this study
stratified the questions into three scales: abdominal pain (abdominal discomfort, hunger pains, nausea);
indigestion symptoms (abdominal distension, acid reflux, heartburn, increased flatus); bowel
dysfunction (diarrhea, constipation, loose stools, hard stools, and incomplete evacuation).
Statistical analysis
After a visual inspection of boxplots in order to identify outliers, a normality test (i.e. Shapiro
Wilk) confirmed the normality of the data. A two-way ANOVA with repeated measures was performed
for all dependent variables assuming time (baseline, post-8wk) and group (WPC, Control, Chx, Beef) as
fixed factors. Whenever a significant F-value was obtained, a post-hoc with Tukey´s adjustment was
performed for multiple comparisons. For some selected variables, which were not normally distributed
(e.g. PRS and some blood markers), we used Friedman two-way analysis of variance. For all analyses the
significance level was set at p<0.05. In addition, mean values and confidence intervals of the absolute
difference (CIdiff) are presented as this approach allows variable change due to supplementation to be
investigated, rather than only the level of statistical significance. In this regard, the confidence interval
includes the value range in which the true population mean of the difference is likely to be
contained. Positive and negative confidence intervals that did not cross zero were considered significant.
Results are expressed as mean ± standard error, unless otherwise mentioned. There were no significant
gender effects for strength, power or body composition adaptations; therefore, the data was collapsed.
RESULTS
Volume Load and Macronutrient Intake
There were no between-groups significant differences for total volume (groups mean ± standard
deviation: WPC = 149766 ± 66330 kg; Chx = 155664 ± 58100 kg; Beef = 140194 ± 50357 kg; malto =
ACCEPTED
Copyright ª 2017 National Strength and Conditioning Association
Different Protein Supplements and Resistance Training
9
136472 ± 53379 kg) (p=0.865). In addition, the compliance for the training protocol was 97%. In regards
to nutrition, there were no between-group significant differences for total calorie intake per day or daily
macronutrient distribution (Table 3).
Body composition
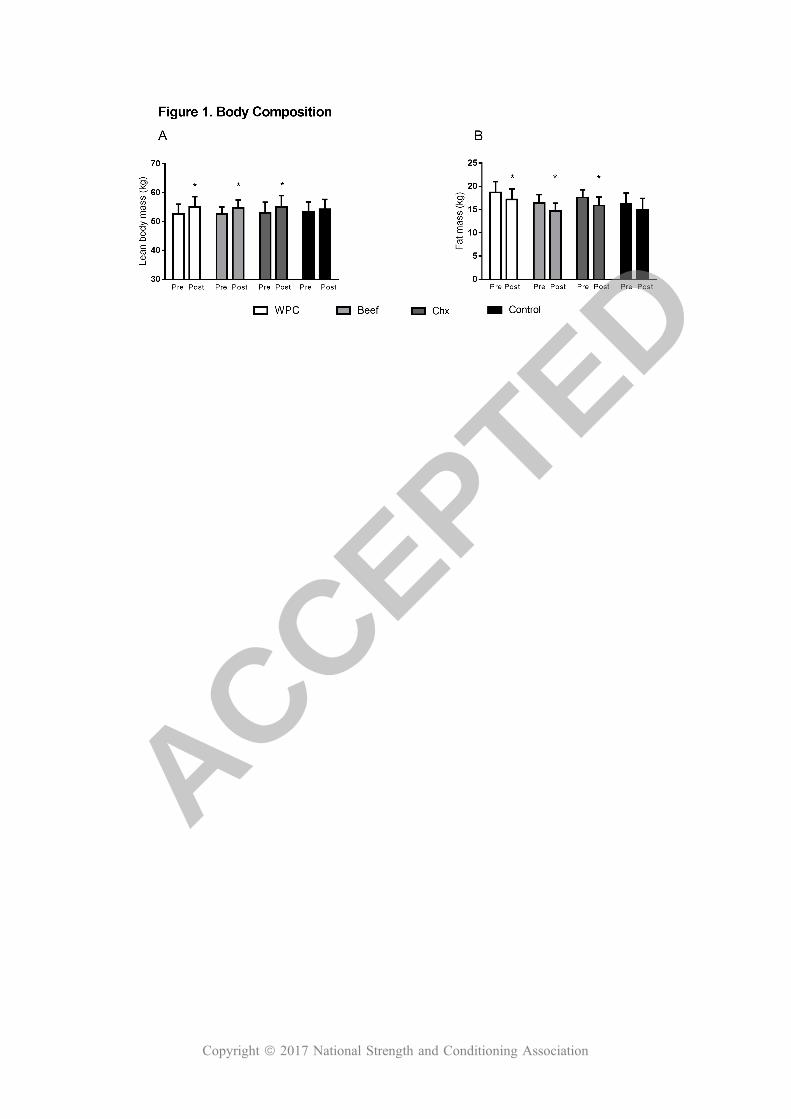
Results for body composition are presented in Figure 1A and 1B. No significant between-groups
differences in lean body mass and fat mass were detected at baseline (p>0.05). For lean body mass, a
significant main time effect was observed for all experimental groups (p<0.0001) that demonstrated a
relative increase ranging 1.9%-5.7%. In addition, CIdiff revealed that only the control group demonstrated
a non-significant increase in lean body mass, control: mean 1.0kg, 95% CIdiff: -0.7 to 2.8kg, whereas all
other experimental groups significantly increased lean body mass; WPC: mean 2.4kg, 95% CIdiff: 0.6 to
4.3kg; Chx: mean 1.9kg, 95% CIdiff: 0.1 to 3.6kg; Beef: mean 2.1kg, 95% CIdiff: 0.2 to 3.9kg with no
differences between conditions.
A significant main time effect was observed for fat mass in all experimental groups (p<0.0001),
with a relative decrease ranging -6.6%-10.8%. However, the control group did not significantly decrease
fat mass, control: mean -1.3kg, 95% CIdiff: 0.05 to -2.7kg, whereas each of the protein groups resulted in
significant decreases in fat mass over the course of the study; WPC: mean -1.5kg, 95% CIdiff: -0.15 to -
2.9kg; Chx: mean -1.7kg, 95% CIdiff: -0.3 to -3.0kg; Beef: mean -1.7kg, 95% CIdiff: -0.4 to -3.1kg.
ACCEPTED
Copyright ª 2017 National Strength and Conditioning Association
Different Protein Supplements and Resistance Training
10
INSERT FIGURE 1 ABOUT HERE
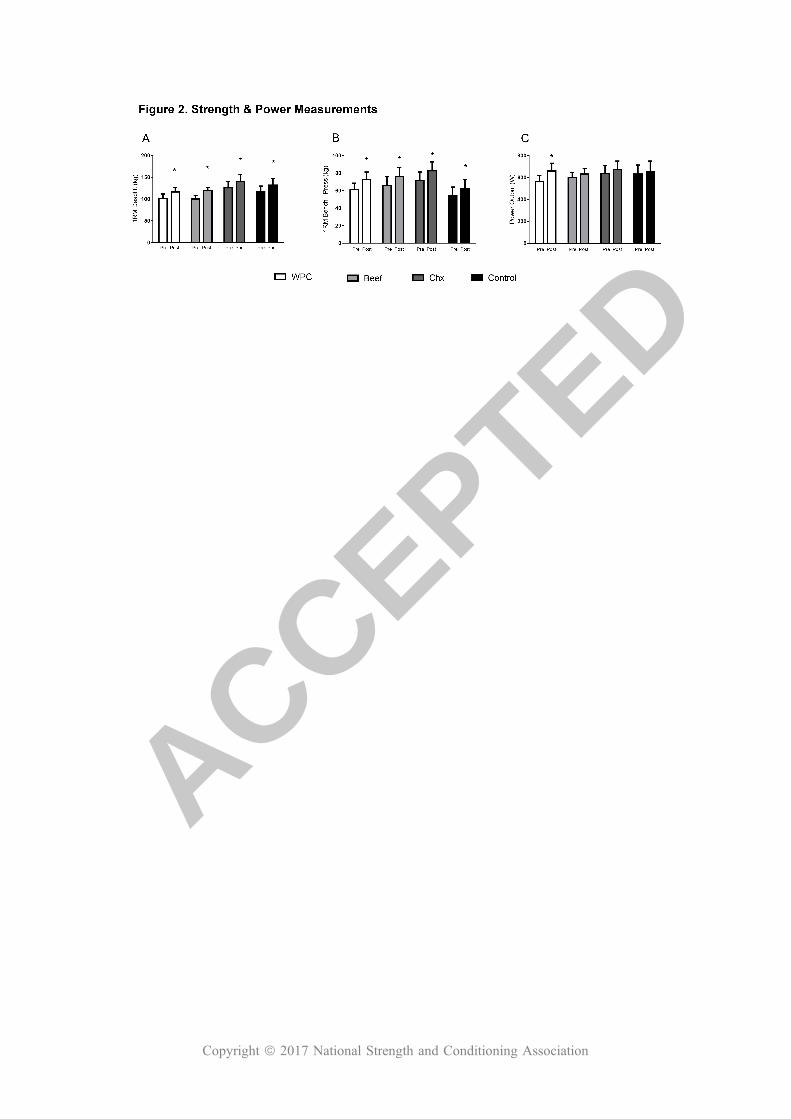
Maximum strength and muscle power
Results for maximum strength and muscle power are presented in Figure 2A, 2B and 2C. No
significant between-groups differences in 1RM deadlift, 1RM bench-press and PP were detected prior to
the experimental period (p>0.05). A significant main time effect was observed for 1RM deadlift in all
experimental groups (p<0.0001) with a relative increase ranging 11.6%-19.3%. In addition, CIdiff revealed
that all experimental groups had significant increases in 1RM deadlift; control: mean 15.7kg, 95% CIdiff:
6.9 to 24.5kg; WPC: mean 15.6kg, 95% CIdiff: 6.6 to 24.2kg; Chx: mean 12.1, 95% CIdiff: 6.3 to 23.0kg; Beef:
mean 19.3kg, 95% CIdiff: 10.5 to 28.1kg with no differences between conditions.
A similar response was observed for 1RM bench-press as a significant main time effect was
detected for all experimental groups (p<0.0001) with a relative increase ranging from 11.4%-17.6%.
Therefore, CIdiff revealed that all experimental groups had significant increases in 1RM bench-press;
control: mean 7.3kg, 95% CIdiff: 3.0 to 12.0kg; WPC: mean 10.9kg, 95% CIdiff: 6.2 to 15.6kg; Chx: mean
11.4Kg, 95% CIdiff: 6.6 to 15.6kg; Beef: mean 10.0kg, 95% CIdiff: 5.3 to 14.7kg, with no differences
between conditions.
For PP, a quite different response was observed, despite a significant main time effect detected
for all experimental groups (p<0.0001) demonstrating a relative increase ranging 3.7%-17.2%. The CIdiff
revealed that only the WPC group had significant increases in power output; WPC: mean 97.3Watts (W),
95% CIdiff: 45.2 to 149.5W. However, control, Chxand Beefgroups did not have significant increases in
power measurements; control: mean 23.0W, 95% CIdiff: -28.1 to 76.0W; Chx: mean 35.6W, 95% CIdiff: -
13.9 to 85.3W; Beef: mean 30.4W, 95% CIdiff: -21.6 to 82.6W.
ACCEPTED
Copyright ª 2017 National Strength and Conditioning Association
Different Protein Supplements and Resistance Training
11
INSERT FIGURE 2 ABOUT HERE
Perceptual measures
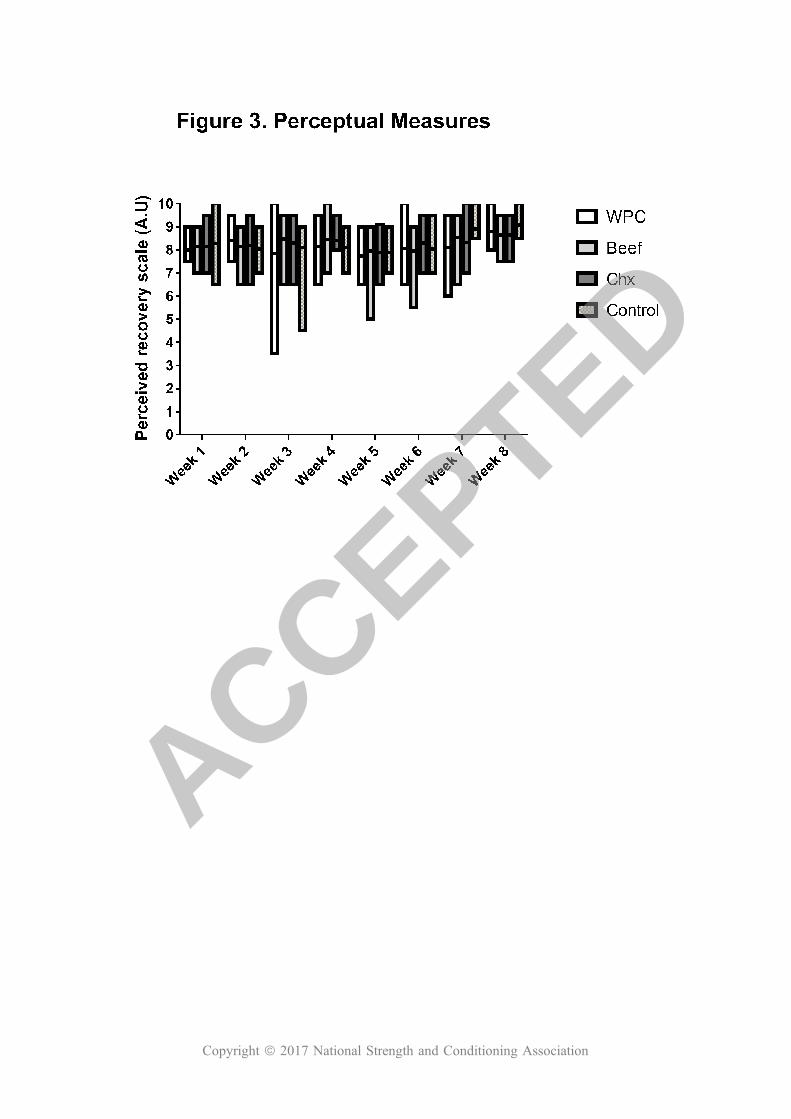
Results for perceived recovery status scale (PRS) are presented in Figure 3. No significant
between-groups differences were detected prior to experimental period (p>0.05). Despite some higher
interval individual values in data time points. All groups ranged between moderately recovered and well
recovered (e.g. range 7.0-9.2) throughout the experimental period. No significant within or between-
groups differences (p>0.05) were observed at any time throughout the study.
INSERT FIGURE 3 ABOUT HERE
Gastrointestinal Symptom rating Scale
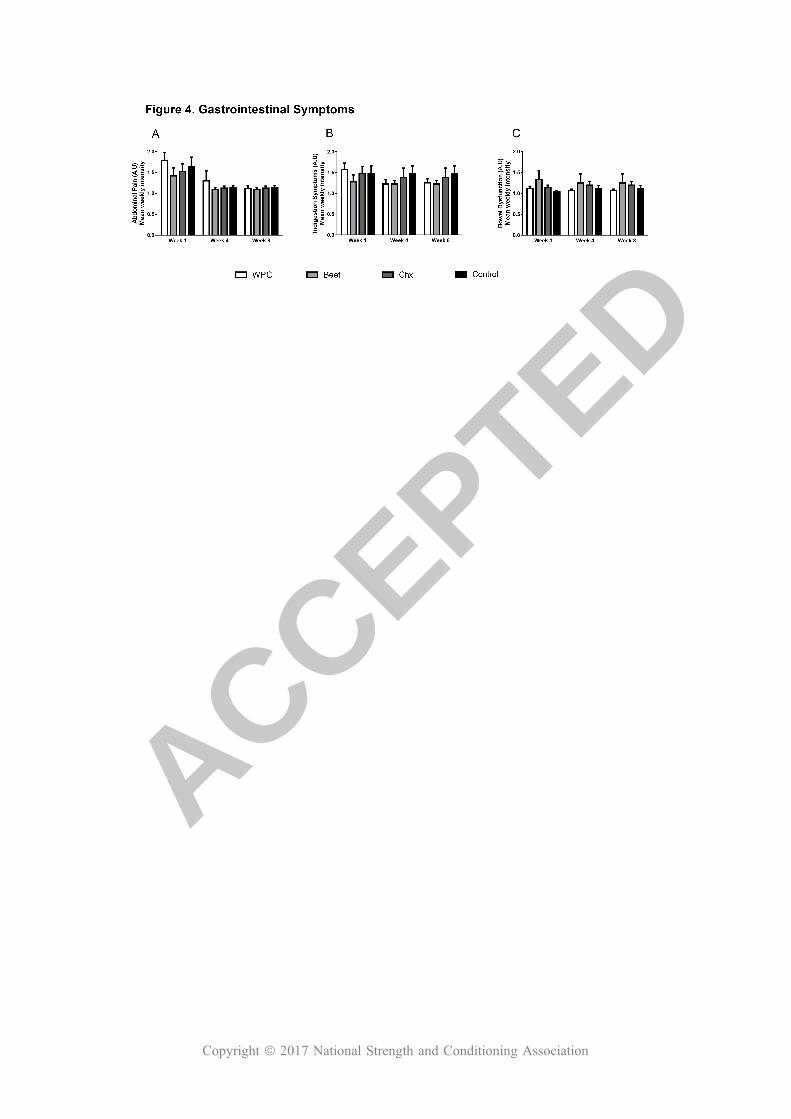
Results for the Gastrointestinal Symptom Rating Scale (GSRS) are presented in Figure 4A, 4B and
4C describing abdominal pain, indigestion, and bowel dysfunction, respectively. No significant between-
groups differences were detected prior to experimental period (p>0.05). All participants reported “no
discomfort at all” to “minor discomfort” for the three symptom clusters selected (i.e. abdominal pain,
indigestion symptoms and bowel dysfunction) throughout the experimental period. There were no
significant within or between-groups differences (p>0.05).
ACCEPTED
Copyright ª 2017 National Strength and Conditioning Association
Different Protein Supplements and Resistance Training
12
INSERT TABLE 4 ABOUT HERE
INSERT FIGURE 4 ABOUT HERE
INSERT TABLE 5 ABOUT HERE
DISSCUSSION
The purpose of this study was to investigate the effects of post exercise WPC, beef and chicken
protein consumption compared to a maltodextrin control on body composition, muscle strength and
power following eight weeks of periodized resistance training combined with high intensity interval
training. The primary finding in the present study was that protein supplementation irrespective of
source improved body composition relative to the control, further demonstrating that that two-servings
of protein (46g) post-workout improved body composition results. Our findings partially support our
purposed hypothesis that whey or meat protein (46g) following training can improve body composition
and resistance training-induced adaptations. These results suggest that choice of protein did not impact
muscular strength outcomes, as all quality protein sources (WPC, Beef, and Chx) demonstrated
significant improvements in maximum strength, however, not significantly greater than control. In
addition, only WPC significantly increased muscle power output. All experimental groups demonstrated
a significant increase in LBM and a significant decrease in FM, while neither of these effects were seen in
the control.
Body Composition
Our present findings underscore the importance of consuming protein post-workout, but also
indicate similar improvements in body composition profiles (i.e. increase LBM and decrease FM) should
be expected if an athlete consumes beef protein, chicken protein, or whey protein in spite of limited
research comparing different animal protein sources on body composition. Our findings are in
ACCEPTED
Copyright ª 2017 National Strength and Conditioning Association
Different Protein Supplements and Resistance Training
13
agreement with past research from Hartmen et al. (6) which demonstrated that enriching the diet with
additional high quality protein via consumption of fat-free fluid milk after resistance training was the
only condition to promote a significant increase in lean mass and fat loss than did consumption of soy or
carbohydrate in young, novice, male weightlifters.
To our knowledge, our study is the first to investigate the effects of different animal protein
sources on resistance trained college aged men and women. Protein supplements derived from meat
can provide high amounts of EAAs as a standard serving of 113.4 g (4 oz) lean beef, or chicken provides
10-15 g EAAs in total. In this regard, our experimental conditions received an adequate amount of EAAs
in which translated into positive adaptations on body composition profiles compared to the
carbohydrate control condition. Supporting this contention, other studies have demonstrated the
importance of consuming EAA to stimulate muscle protein synthesis (4, 7). These previous findings
suggest the total composition of a protein supplement should be considered (including amino acid
composition and peptide and other nutrient abundance) when choosing a post-workout protein source.
Therefore, the aforementioned outcomes suggest that performing resistance training followed by high
quality protein supplementation augments lean body mass and attenuates fat mass as it was observed
in our experimental groups.
Strength and Power
Regarding muscle functional performance, the results of the present study demonstrated that all
groups were able to increase muscle strength following an 8-week periodized training program. Previous
studies have demonstrated greater or similar strength gains for protein supplementation compared to
carbohydrate control groups regardless of training status (1, 18). For instance, Andersen et al (2005)
reported that countermovement jump and peak torque during slow isokinetic muscle contractions
increased similarly in both protein and carbohydrate groups. Thus, our findings are in agreement with
ACCEPTED
Copyright ª 2017 National Strength and Conditioning Association
Different Protein Supplements and Resistance Training
14
previous research that demonstrated no added benefit of protein supplementation on muscle functional
performance when compared to placebo (carbohydrate) condition in spite of significantly greater gains
in lean body mass. However, a reasonable explanation for those similar strength gains observed in the
current study might be associated with the volume load used herein. In order to investigate the effects
of different protein sources compared to carbohydrate group on morphological and functional
performance, we recruited trained individuals with a minimal training experience of ~2 years. Moreover,
it is important to mention that all conditions totaled a high and similar volume load (i.e. ~140000kg)
which has been suggested to be a robust predictor of strength gains for both males and females (13).
In regards to power output, quite a different response was observed, indicating that only the
WPC group had significant increases in power output (+ 97.3 W). It is difficult to determine why only the
WPC group improved more than other conditions. Furthermore, there is a paucity of studies
investigating the effects of diary and different animal protein sources on power output. Thus, future
studies addressing the effects of different supplemental proteins on power output in resistance trained
individuals is warranted.
Perceived Recovery & Gastrointestinal Symptoms
In addition, this study sought to investigate the effect of different protein sources on perceived
recovery compared to a carbohydrate control condition. However, there were no significant differences
between groups on perceived recovery response. It has been demonstrated protein functions as an
agent to remodel and recover damaged muscle tissue (12). Nonetheless, in the current study, regardless
of protein source (e.g. WPC, beef or chicken), the important role of protein to recover muscle damage
did not aid in one’s perception of recovery when compared to the control group.
Furthermore, this study investigated the impact of different protein sources on possible
gastrointestinal side effects relating to abdominal pain, indigestion and bowel dysfunction using the
ACCEPTED
Copyright ª 2017 National Strength and Conditioning Association
Different Protein Supplements and Resistance Training
15
GSRS. These side effects could have indicated improper digestion of the protein supplement, which
could negatively affect muscle performance and recovery. There were no between or within-group
differences throughout the duration of the study indicating that the experimental groups did not receive
any potential side effects compared to the control.
Mechanism of Action & Theoretical Interpretations
This study supports the notion that protein supplementation supports muscle protein accretion
in athletes. The mechanism behind this likely related to increases muscle protein synthesis as previously
documented (8). A unique outcome of this paper is that we found no effect of protein source on muscle
protein accretion, suggesting that as long as athletes consume large quantities of protein, the source is
not as relevant. This is consistent with previous research which suggests a “threshold” for anabolic
benefits of protein supplementation that may peak as low as 20 grams (11). It is possible that at sub
optimal protein doses (i.e. 10 grams) that protein quality would be of more relevance. This requires
further investigation.
PRACTICAL APPLICATIONS
The present results suggest that differences in protein sources are of less relevance when the
protein quantity is high (46g) and comes from either meat or dairy based sources. Furthermore, subjects
in this study did not report significant gastrointestinal distress from any treatment. These results
reinforce the importance of post-workout protein supplementation. Individuals looking to optimize
body composition should consume ample protein post-workout, but the source of protein can be self-
selected by the individual’s preference. For instance, those who have dairy and or lactose intolerances
can opt for animal protein sources that are free of these allergens and attain similar body composition
and muscular adapatations.
ACCEPTED
Copyright ª 2017 National Strength and Conditioning Association
Different Protein Supplements and Resistance Training
16
In contrast to body composition changes, there was no treatment effect for strength
adaptations. The WPC group was the only condition to significantly increase power output. These
performance outcomes require further investigation to elucidate the mechanism of action. Future
research should also examine adaptations in highly trained athletes.
ACKNOWLEDGEMENTS
All authors were all involved in the study design and data collection of the study. MHS, RPL,
JMW and EODS were involved in performing statistical analysis and drafting the manuscript. Essentia
Metabolic Proteins provided funding for this trial and all funding went to The University of TampaThe
results provided in this manuscript do not constitute endorsement of the product by the authors or the
NSCA.
References
1. Andersen LL, Tufekovic G, Zebis MK, Crameri RM, Verlaan G, Kjær M, Suetta C, Magnusson P,
and Aagaard P. The effect of resistance training combined with timed ingestion of protein on
muscle fiber size and muscle strength. Metabolism 54: 151-156, 2005.
2. Biolo G, Tipton KD, Klein S, and Wolfe RR. An abundant supply of amino acids enhances the
metabolic effect of exercise on muscle protein. Am J Physiol 273: E122-129, 1997.
3. Campbell WW, Barton ML, Jr., Cyr-Campbell D, Davey SL, Beard JL, Parise G, and Evans WJ.
Effects of an omnivorous diet compared with a lactoovovegetarian diet on resistance-training-
induced changes in body composition and skeletal muscle in older men. Am J Clin Nutr 70: 1032-
1039, 1999.
4. Churchward-Venne TA, Burd NA, Mitchell CJ, West DW, Philp A, Marcotte GR, Baker SK, Baar K,
and Phillips SM. Supplementation of a suboptimal protein dose with leucine or essential amino
acids: effects on myofibrillar protein synthesis at rest and following resistance exercise in men.
The Journal of physiology 590: 2751-2765, 2012.
5. Cotton PA, Subar AF, Friday JE, and Cook A. Dietary sources of nutrients among US adults, 1994
to 1996. Journal of the American Dietetic Association 104: 921-930, 2004.
6. Hartman JW, Tang JE, Wilkinson SB, Tarnopolsky MA, Lawrence RL, Fullerton AV, and Phillips
SM. Consumption of fat-free fluid milk after resistance exercise promotes greater lean mass
accretion than does consumption of soy or carbohydrate in young, novice, male weightlifters.
Am J Clin Nutr 86: 373-381, 2007.
ACCEPTED
Copyright ª 2017 National Strength and Conditioning Association
Different Protein Supplements and Resistance Training
17
7. Koopman R, Verdijk LB, Beelen M, Gorselink M, Kruseman AN, Wagenmakers AJ, Kuipers H, and
van Loon LJ. Co-ingestion of leucine with protein does not further augment post-exercise muscle
protein synthesis rates in elderly men. The British journal of nutrition 99: 571-580, 2008.
8. Layman DK. Protein quantity and quality at levels above the RDA improves adult weight loss.
Journal of the American College of Nutrition 23: 631S-636S, 2004.
9. Lemon PW. Beyond the zone: protein needs of active individuals. Journal of the American
College of Nutrition 19: 513S-521S, 2000.
10. Longland TM, Oikawa SY, Mitchell CJ, Devries MC, and Phillips SM. Higher compared with lower
dietary protein during an energy deficit combined with intense exercise promotes greater lean
mass gain and fat mass loss: a randomized trial. The American journal of clinical nutrition 103:
738-746, 2016.
11. Moore DR, Robinson MJ, Fry JL, Tang JE, Glover EI, Wilkinson SB, Prior T, Tarnopolsky MA, and
Phillips SM. Ingested protein dose response of muscle and albumin protein synthesis after
resistance exercise in young men. Am J Clin Nutr 89: 161-168, 2009.
12. Morton RW, McGlory C, and Phillips SM. Nutritional interventions to augment resistance
training-induced skeletal muscle hypertrophy. Front Physiol 6: 245, 2015.
13. Peterson MD, Pistilli E, Haff GG, Hoffman EP, and Gordon PM. Progression of volume load and
muscular adaptation during resistance exercise. European journal of applied physiology 111:
1063-1071, 2011.
14. Svedlund J, Sjodin I, and Dotevall G. GSRS--a clinical rating scale for gastrointestinal symptoms in
patients with irritable bowel syndrome and peptic ulcer disease. Digestive diseases and sciences
33: 129-134, 1988.
15. Symons TB, Schutzler SE, Cocke TL, Chinkes DL, Wolfe RR, and Paddon-Jones D. Aging does not
impair the anabolic response to a protein-rich meal. Am J Clin Nutr 86: 451-456, 2007.
16. Tang JE, Moore DR, Kujbida GW, Tarnopolsky MA, and Phillips SM. Ingestion of whey
hydrolysate, casein, or soy protein isolate: effects on mixed muscle protein synthesis at rest and
following resistance exercise in young men. J Appl Physiol 107: 987-992, 2009.
17. U.S. Department of Agriculture ARS. Composition of Foods Raw, Processed, Prepared USDA
Nutrient Database for Standard Reference, Release 15. . 2002.
18. Willoughby D, Stout J, and Wilborn C. Effects of resistance training and protein plus amino acid
supplementation on muscle anabolism, mass, and strength. Amino acids 32: 467-477, 2007.
Figure 1 legend. The combined 8-week effects of resistance training with WPC, Beef, Chx or control on
lean body mass (1A) and fat mass (1B). * indicates within-group differences (p< 0.05).
ACCEPTED
Copyright ª 2017 National Strength and Conditioning Association
Different Protein Supplements and Resistance Training
18
Figure 2 legend. The combined 8-week effects of resistance training with WPC, Beef, Chx or control on
deadlift 1RM (2A), bench press 1RM (2B) and power output (2C). * indicates within-group differences
(p<0.05).
Figure 3 legend. The combined 8-week effects of resistance training with WPC, Beef, Chx or control on
perceived recovery.
Figure 4 legend. The effects of supplementing with WPC, Beef, Chx or control on abdominal pain (4A),
indigestion symptoms (4B), and bowel dysfunction (4C).
ACCEPTED
Copyright ª 2017 National Strength and Conditioning Association
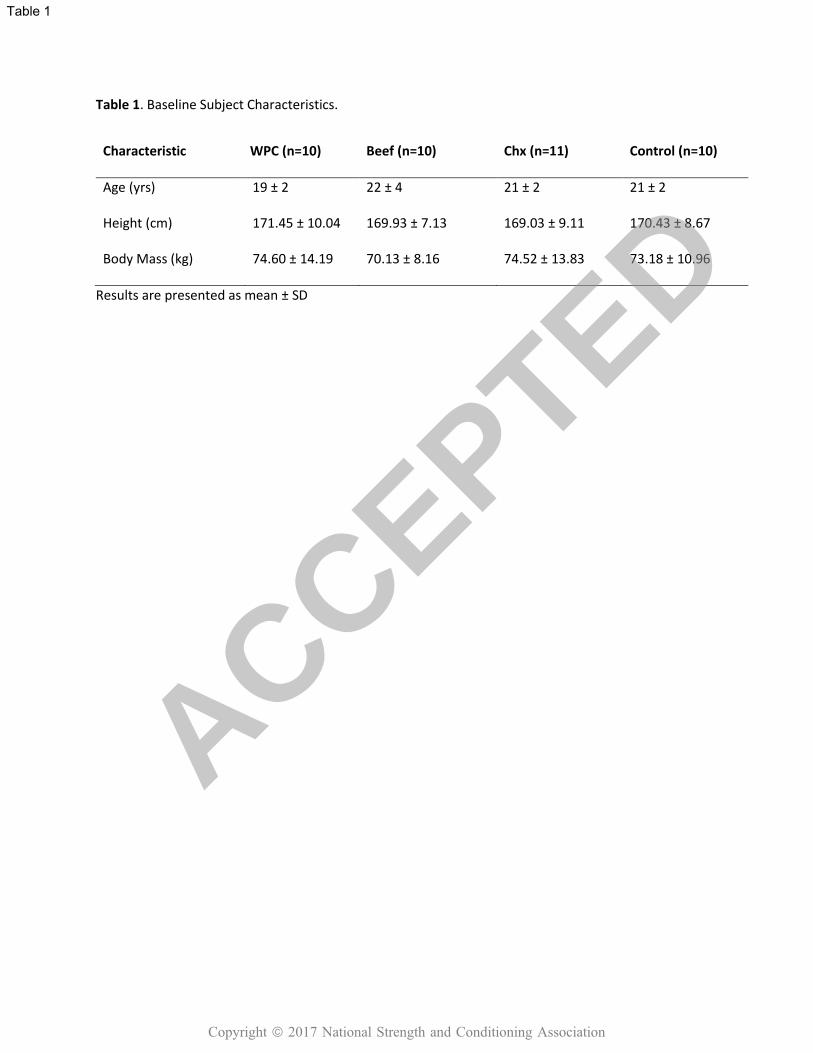
Table 1. Baseline Subject Characteristics.
Characteristic WPC (n=10) Beef (n=10) Chx (n=11) Control (n=10)
Age (yrs) 19 ± 2 22 ± 4 21 ± 2 21 ± 2
Height (cm) 171.45 ± 10.04 169.93 ± 7.13 169.03 ± 9.11 170.43 ± 8.67
Body Mass (kg) 74.60 ± 14.19 70.13 ± 8.16 74.52 ± 13.83 73.18 ± 10.96
Results are presented as mean ± SD
Table 1
ACCEPTED
Copyright ª 2017 National Strength and Conditioning Association
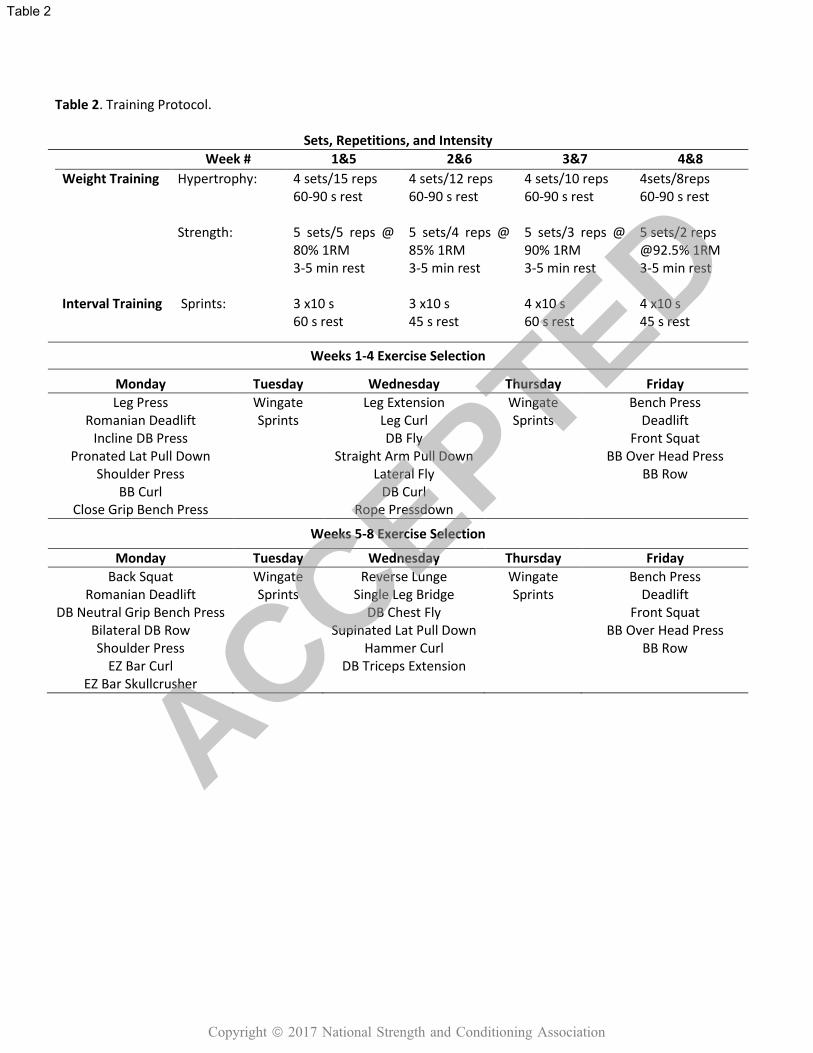
Table 2. Training Protocol.
Sets, Repetitions, and Intensity
Week # 1&5 2&6 3&7 4&8
Weight Training Hypertrophy: Strength:
4 sets/15 reps 60-90 s rest 5 sets/5 reps @ 80% 1RM 3-5 min rest
4 sets/12 reps 60-90 s rest 5 sets/4 reps @ 85% 1RM 3-5 min rest
4 sets/10 reps 60-90 s rest 5 sets/3 reps @ 90% 1RM 3-5 min rest
4sets/8reps 60-90 s rest 5 sets/2 reps @92.5% 1RM 3-5 min rest
Interval Training Sprints: 3 x10 s 60 s rest
3 x10 s 45 s rest
4 x10 s 60 s rest
4 x10 s 45 s rest
Weeks 1-4 Exercise Selection
Monday Tuesday Wednesday Thursday Friday
Leg Press Romanian Deadlift
Incline DB Press Pronated Lat Pull Down
Shoulder Press BB Curl
Close Grip Bench Press
Wingate Sprints
Leg Extension Leg Curl DB Fly
Straight Arm Pull Down Lateral Fly
DB Curl Rope Pressdown
Wingate Sprints
Bench Press Deadlift
Front Squat BB Over Head Press
BB Row
Weeks 5-8 Exercise Selection
Monday Tuesday Wednesday Thursday Friday
Back Squat Romanian Deadlift
DB Neutral Grip Bench Press Bilateral DB Row Shoulder Press
EZ Bar Curl EZ Bar Skullcrusher
Wingate Sprints
Reverse Lunge Single Leg Bridge
DB Chest Fly Supinated Lat Pull Down
Hammer Curl DB Triceps Extension
Wingate Sprints
Bench Press Deadlift
Front Squat BB Over Head Press
BB Row
Table 2
ACCEPTED
Copyright ª 2017 National Strength and Conditioning Association
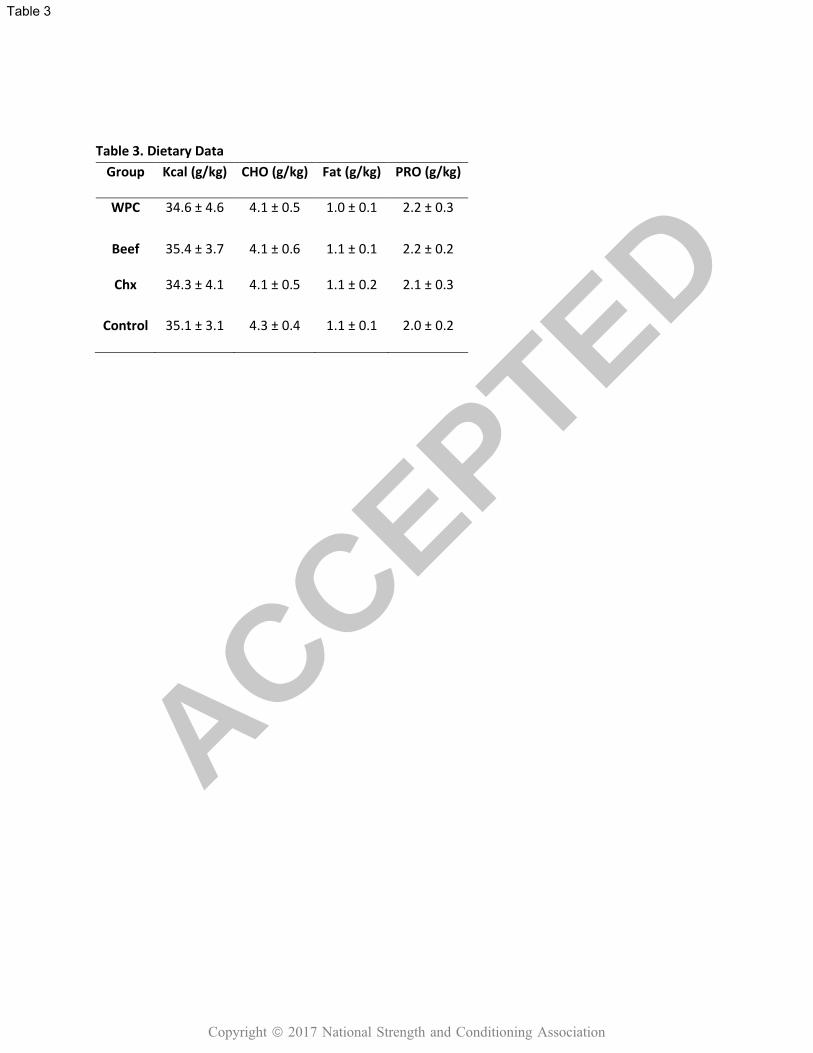
Table 3. Dietary Data
Group Kcal (g/kg) CHO (g/kg) Fat (g/kg) PRO (g/kg)
WPC 34.6 ± 4.6
4.1 ± 0.5
1.0 ± 0.1
2.2 ± 0.3
Beef 35.4 ± 3.7
4.1 ± 0.6
1.1 ± 0.1
2.2 ± 0.2
Chx 34.3 ± 4.1
4.1 ± 0.5
1.1 ± 0.2
2.1 ± 0.3
Control 35.1 ± 3.1
4.3 ± 0.4
1.1 ± 0.1
2.0 ± 0.2
Table 3
ACCEPTED
Copyright ª 2017 National Strength and Conditioning Association
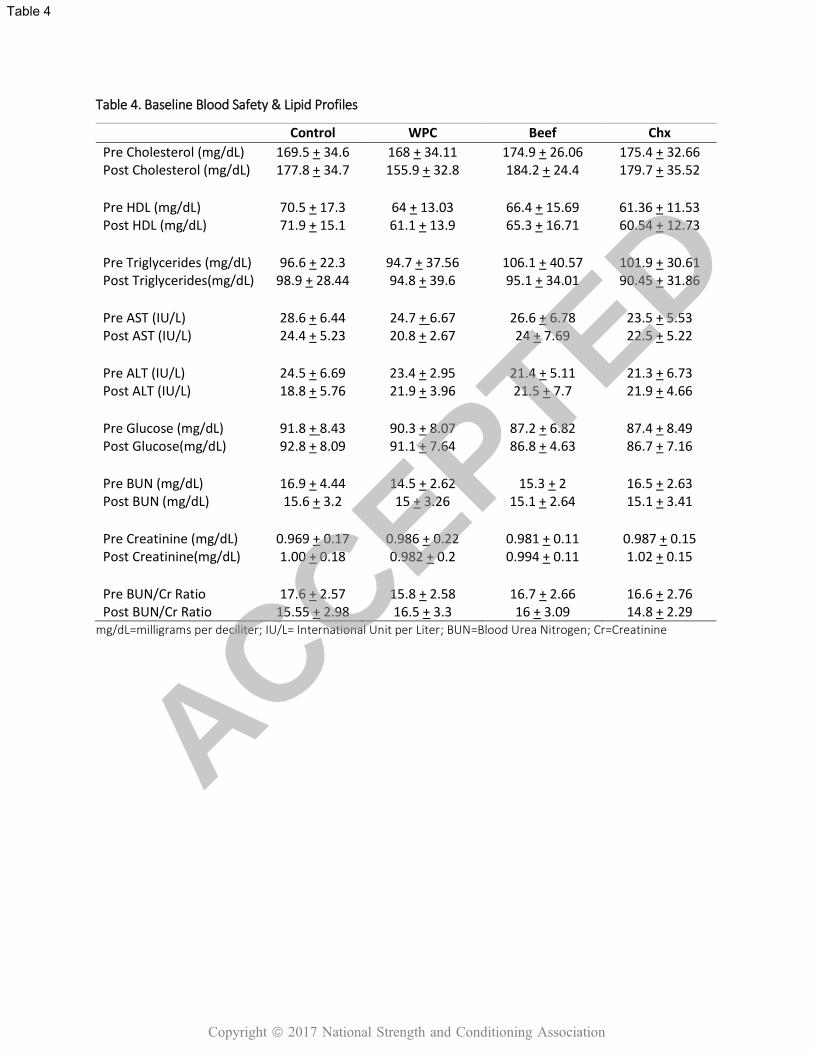
Table 4. Baseline Blood Safety & Lipid Profiles
mg/dL=milligrams per deciliter; IU/L= International Unit per Liter; BUN=Blood Urea Nitrogen; Cr=Creatinine
Control WPC Beef Chx
Pre Cholesterol (mg/dL) 169.5 + 34.6 168 + 34.11 174.9 + 26.06 175.4 + 32.66 Post Cholesterol (mg/dL) 177.8 + 34.7 155.9 + 32.8 184.2 + 24.4 179.7 + 35.52 Pre HDL (mg/dL) 70.5 + 17.3 64 + 13.03 66.4 + 15.69 61.36 + 11.53 Post HDL (mg/dL) 71.9 + 15.1 61.1 + 13.9 65.3 + 16.71 60.54 + 12.73 Pre Triglycerides (mg/dL) 96.6 + 22.3 94.7 + 37.56 106.1 + 40.57 101.9 + 30.61 Post Triglycerides(mg/dL) 98.9 + 28.44 94.8 + 39.6 95.1 + 34.01 90.45 + 31.86
Pre AST (IU/L) 28.6 + 6.44 24.7 + 6.67 26.6 + 6.78 23.5 + 5.53 Post AST (IU/L) 24.4 + 5.23 20.8 + 2.67 24 + 7.69 22.5 + 5.22
Pre ALT (IU/L) 24.5 + 6.69 23.4 + 2.95 21.4 + 5.11 21.3 + 6.73 Post ALT (IU/L) 18.8 + 5.76 21.9 + 3.96 21.5 + 7.7 21.9 + 4.66
Pre Glucose (mg/dL) 91.8 + 8.43 90.3 + 8.07 87.2 + 6.82 87.4 + 8.49 Post Glucose(mg/dL) 92.8 + 8.09 91.1 + 7.64 86.8 + 4.63 86.7 + 7.16
Pre BUN (mg/dL) 16.9 + 4.44 14.5 + 2.62 15.3 + 2 16.5 + 2.63 Post BUN (mg/dL) 15.6 + 3.2 15 + 3.26 15.1 + 2.64 15.1 + 3.41
Pre Creatinine (mg/dL) 0.969 + 0.17 0.986 + 0.22 0.981 + 0.11 0.987 + 0.15 Post Creatinine(mg/dL) 1.00 + 0.18 0.982 + 0.2 0.994 + 0.11 1.02 + 0.15
Pre BUN/Cr Ratio 17.6 + 2.57 15.8 + 2.58 16.7 + 2.66 16.6 + 2.76 Post BUN/Cr Ratio 15.55 + 2.98 16.5 + 3.3 16 + 3.09 14.8 + 2.29
Table 4
ACCEPTED
Copyright ª 2017 National Strength and Conditioning Association
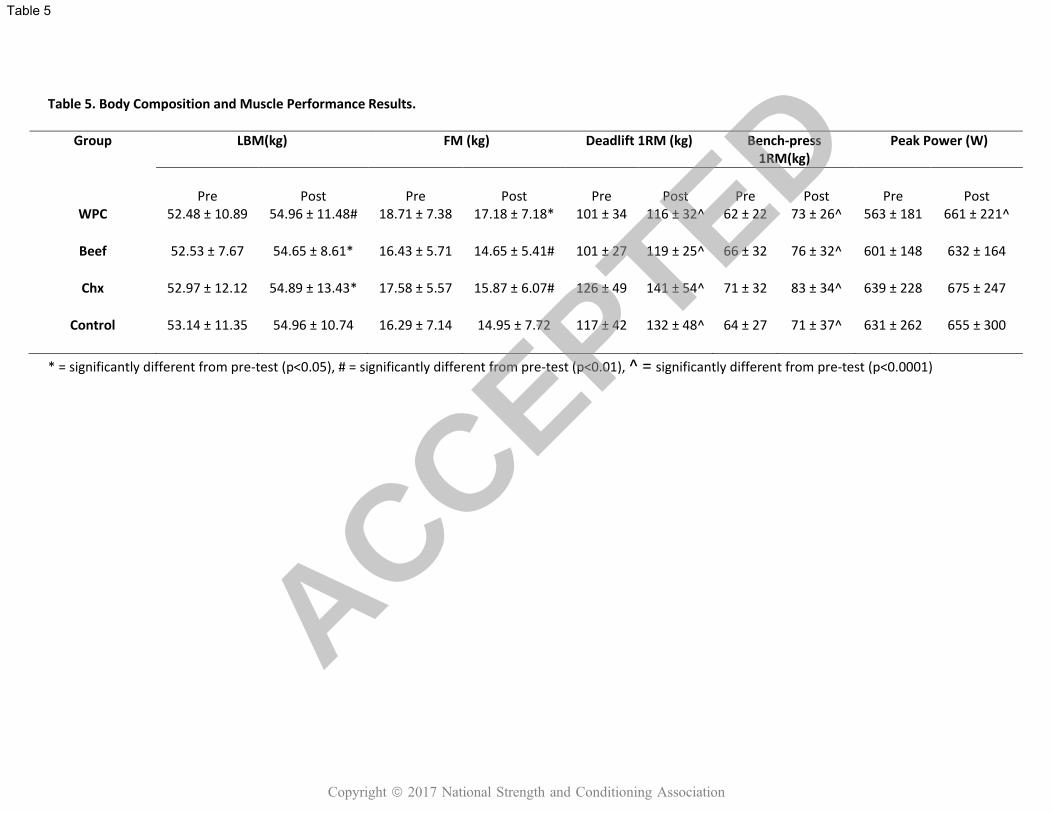
Table 5. Body Composition and Muscle Performance Results.
* = significantly different from pre-test (p<0.05), # = significantly different from pre-test (p<0.01), ^ = significantly different from pre-test (p<0.0001)
Group LBM(kg) FM (kg) Deadlift 1RM (kg) Bench-press 1RM(kg)
Peak Power (W)
Pre Post Pre Post Pre Post Pre Post Pre Post WPC
52.48 ± 10.89 54.96 ± 11.48# 18.71 ± 7.38 17.18 ± 7.18* 101 ± 34 116 ± 32^ 62 ± 22 73 ± 26^ 563 ± 181 661 ± 221^
Beef
52.53 ± 7.67 54.65 ± 8.61* 16.43 ± 5.71 14.65 ± 5.41# 101 ± 27 119 ± 25^ 66 ± 32 76 ± 32^ 601 ± 148 632 ± 164
Chx
52.97 ± 12.12 54.89 ± 13.43* 17.58 ± 5.57 15.87 ± 6.07# 126 ± 49 141 ± 54^ 71 ± 32 83 ± 34^ 639 ± 228 675 ± 247
Control
53.14 ± 11.35 54.96 ± 10.74 16.29 ± 7.14 14.95 ± 7.72 117 ± 42 132 ± 48^ 64 ± 27 71 ± 37^ 631 ± 262 655 ± 300
Table 5
ACCEPTED
Copyright ª 2017 National Strength and Conditioning Association
ACCEPTED
Copyright ª 2017 National Strength and Conditioning Association
ACCEPTED
Copyright ª 2017 National Strength and Conditioning Association
ACCEPTED
Copyright ª 2017 National Strength and Conditioning Association
ACCEPTED
Copyright ª 2017 National Strength and Conditioning Association