Embed Size (px)
Citation preview
The Effects of Ammonia on Anaerobic Digestion of the Organic Fraction of
Municipal Solid Wastes
By
Akinwumi Abiodun Akindele
A thesis submitted
under the supervision of Dr. Majid Sartaj
In Partial Fulfillment of the Requirements for the Award of
Master of Applied Science (M.ASc)
In
Civil Engineering
Department of Civil Engineering
University of Ottawa
Ottawa-Carleton Institute for Civil Engineering
Ottawa, Ontario, Canada
© Akinwumi Abiodun Akindele, Ottawa, Canada, 2016

ii
Abstract
The effect of ammonia on anaerobic digestion of the organic fraction of municipal solid
wastes (OFMSW) was investigated in this study. This study involved two sets of
experiments. First set involved the investigation of ammonia toxicity on AD of synthetic
OFMSW only (SW), at three different phases and pH 7.5, 8.0 and 8.5.
Phase 1 was the Batch Methane Potential (BMP) phase. BMP tests were conducted under
ammonia concentration of 2500 mg/L, 5000 mg/L, 7500 mg/L and 10,000 mg/L and at
pH 7.5, 8.0, and 8.5, using 500 mL Kimax® glass bottles. The total working volume of
the mixture was 300 mL comprising 120 mL of mesophilic anaerobically digested
inoculums, 30 g of OFMSW, various TAN concentrations ranging from 2,500, 5,000,
7,500 to 10,000 mg/L, and equal portions of buffer in form of NaHCO3 and KHCO3.
The second phase of the experiment examined whether the tolerance of the bacteria to
high ammonia concentration would improve by acclimating the microbes to high
ammonia concentrations, through gradual TAN loading. TAN concentration was
increased gradually at pH 7.5, 8.0 and 8.5 weekly.
The third phase of the experiment was Semi-continuous batch phase. This phase
examined the possibility of reducing the inhibitory effect of ammonia on AD, batch
reactors at pH values of 8.0 and 8.5 containing initial TAN concentrations of 7500 mg/L
and 10,000 mg/L. 3 g of the digestate containing high ammonia concentration(s) was
replaced with fresh substrate at every 4 days, 7 days and 15 days.
The second set of experiment involved study of the effects of ammonia on anaerobic
digestion of OFMSW with real landfill leachate (SW+L).
Phase 1 was BMP in which the effect of ammonia was examined at TAN concentrations
of 7,500 and 10,000 mg/L.
The phase 2 of the (SW+L) gradual TAN TAN loading. The possibility of adapting
mesophilic bacteria to high ammonia concentration was examined.
The results of the study confirmed that ammonia is toxic to AD, at high concentrations.
Biogas production reduced with increase in TAN concentration. Reduction in Cumulative
iii
Biogas Production (CBP) compared with control reactors was as much as 43 %, 64 % and
77 % in reactors containing 7500 mg/L TAN at pH 7.5, pH 8.0 and pH 8.5. CBP reduced
to 80-85 % in reactors containing 10,000 mg/L TAN across the pH examined. Also,
replacing 3g of digestate containing high TAN concentrations of 7500 mg/L and 10,000
mg/L with 3 g fresh substrate improved the activity of the mesophilic bacteria as seen in
the surges in biogas production when fresh substrate was injected into the reactors.
Similar results were obtained on effect of ammonia on AD of OFMSW mixed with real
landfill leachate to simulate an anaerobic bioreactor landfill. CBP reduced as the TAN
concentration increased. Compared with control reactors, reactors containing 7500 mg/L
TAN at pH 8.0 and pH 8.5 had 61 % and 80 % reduction in CBP. Likewise, reactors
containing 10,000 mg/L TAN at pH 8.0 and pH 8.5 had 68 % and 85 % reduction in
CBP, compared with control reactors.
Study confirmed that pH influenced the toxicity and composition of Total Ammonia
Nitrogen (TAN). At high pH (i.e. 8.5), FAN component of TAN was about 26 % and was
inhibitory to the methanogens. Results also showed that mesophilic bacteria could be
adapted to a TAN concentration of about 5000 mg/L at pH 7.5 through gradual TAN
loading.

iv
Dedicated to my Brother and Super Hero, Adeyinka Ayodeji Ojediran

v
Acknowledgements
Before anyone else, I wish to express my profound gratitude to the God of heaven
and earth for seeing me through this research and most importantly, the duration of my
masters program. From the rising of the sun to the place where it sets, let the name of the
name of LORD be praised (Psalm 113:3)!
To my dear research supervisor (Dr. Majid Sartaj), I say thank you for your
professionalism, patience, financial support, and encouragement when things were not
going according to plans. I consider myself lucky to have you as my research supervisor.
I will like to specially thank Rania Alqaralleh, for being so kind to help me out
when I was completely lost, especially at the beginning of this research. May God bless
you immensely, Rania!
I am extremely grateful to all of my five siblings, Adeyinka Ayodeji Ojediran,
Adenike Ojediran-Hamzat, Olumide Ojediran, Adebimpe Ojediran-Onaolapo, and
Iyabode Ojediran-Adelabi. I can never thank you all enough for your collective support.
I am grateful to Mr. and Mrs. Piper for their kindness, love and generosity. You
just can never understand the huge impact you made in my life.
Special thanks to Bro. Kenny Ojo, my spiritual leader-turned brother. You are
very amazing.
And to all my friends who stood by me by encouraging me throughout this thesis,
thank you and may God bless you all.
vi
List of figures
Figure 2.1: MSW Generation in 2013 in the U.S. before recycling (USEPA, 2012)…......6
Figure 2.2: Waste management hierarchy in the ISWM strategy (USEPA, 2012)………..7
Figure 2.3: Anaerobic Bioreactor Landfill ®Waste Management……………….………10
Figure 2.4: Anaerobic digestion process (Gujer and Zehnder, 1983) ……………..…….13
Figure 2.5: Phases of bioreactor landfill stabilization (Pohland and Kim, 2003)………..15
Figure 2.6: Cumulative biogas yield at C:N ratio of 15 at different pH controlled reactors
of LF admixed with MSW (Shanmugam and Horan, 2009)…..............................18
Figure 2.7: Steps in the bioconversion of proteins (Blomgren et al., 1990)..........................
……………………………………………………………………………………21
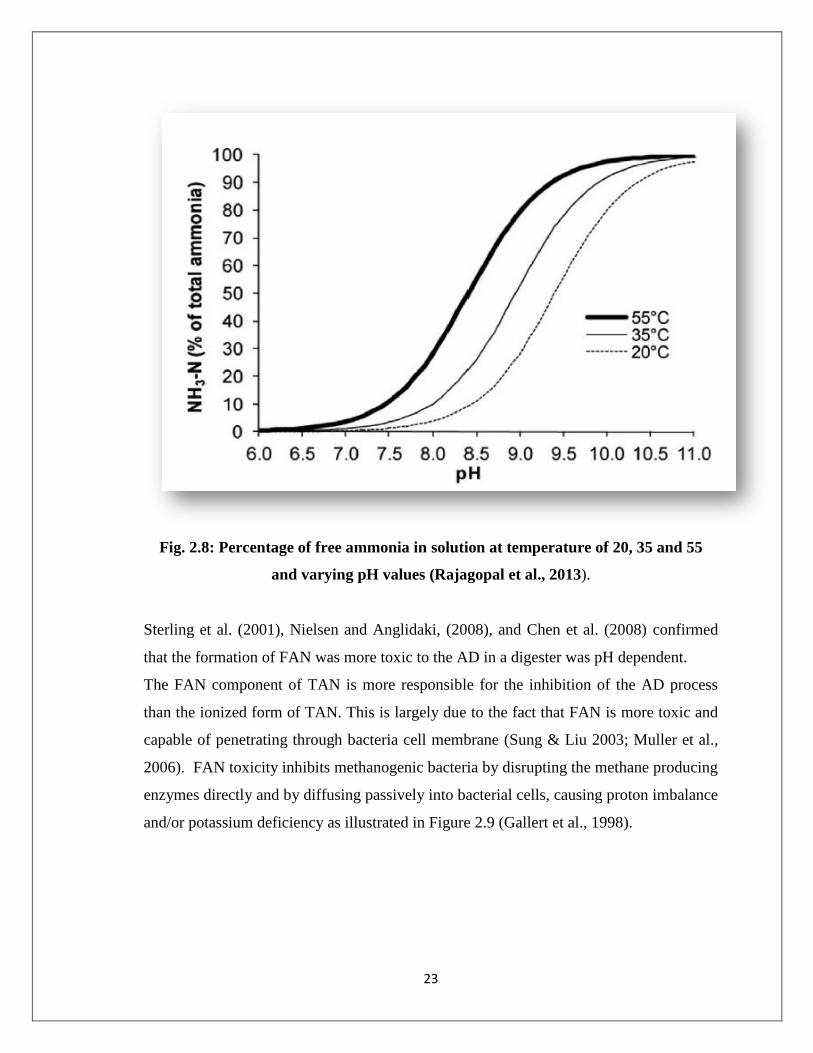
Figure 2.8: Percentage of free ammonia in solution at temperature of 20, 35 and 55 and
varying pH values Rajagopal et al., 2013)…………….…………………………23
Figure 2.9: Mechanism of ammonia inhibition on methanogenic bacteria (Sprott and
Patel, 1986)…………………………………………...…………..…….……..…24
Figure 2.10. Cumulative biogas yield at different C:N ratio of LFW admixed with MSW
(Shanmugam and Horan, 2009)………………………………………………….27
Figure 2.11. NH3–N levels at different C:N ratio of admixed LF and MSW (Shanmugam
and Horan, 2009)…………………………………….…………………………..28
Figure 2.12: Comparism of water dilution of ammonia chloride solution, anaerobically
digested biosolids, and digestate from the pilot scale reactor (Kayhanian,
1994)……………………………………………..……...……………………….29
Figure 3.1: Semi-continuous batch phase………………………………………………..44
Figure 3.2: Reactors in New Brunswick Scientific Controlled Environment Incubator
Shaker…………………………………………………………………………...46
Figure 3.3: Thermal conductivity gas chromatograph (series 400, Gow-Mac Instrument
Co., USA)…………………………………………………………..……………47
Figure 3.4: Fisher Accumet model XL25 dual channel pH/ion meter…………………...48
Figure 3.5: Brinkmann Polytron PT 3000 Homogenizer…………………………….…..49
Figure 3.6: RB200: Digital Reactor Block…………………...………………………….50
Figure 3.7: UV-VIS spectrophotometer………………………………………………….50

vii
Figure 3.8: U-tube manometer section showing the initial water levels at equilibrium with
atmospheric pressure………………………………………………………..……52
Figure 4.1: Cumulative biogas production from BMP reactors under different TAN
concentrations and similar operating pH of 75 (Phase 1) …………...……….….62
Figure 4.2: Biogas composition from batch reactors under different TAN concentrations
and similar operating pH of 7.5 (Phase 1) ………….……...…………………....63
Figure 4.3: TAN concentration at the beginning, mid-way and end of incubation period,
at operating pH of 7.5 (Phase 1) ……………………….……………….……….64
Figure 4.4: VFA concentration at the beginning, mid-way and end of incubation period,
at operating pH of 7.5 (Phase 1) …………………......………….………………65
Figure 4.5: COD concentration at the beginning, and end of incubation period, at
operating pH of 7.5………………………………………………………………66
Figure 4.6: Cumulative biogas production from BMP reactors under different TAN
concentrations and similar operating pH of 8.0 (Phase 1) ………....………...67
Figure 4.7: Biogas composition from BMP reactors under different TAN concentrations
and similar operating pH of 8.0 (Phase 1) …………………………...………….68
Figure 4.8: TAN concentration at the beginning, mid-way and end of incubation period,
at operating pH of 8.0 (Phase 1) ………………………………......…………….69
Figure 4.9: VFA concentration at the beginning, mid-way and end of incubation period,
at operating pH of 8.0 (Phase 1)… ……………………...……………...……….70
Figure 4.10: COD concentration at the beginning and end of incubation period, at
operating pH of 8.0 (Phase 1) ……………………………………...……………71
Figure 4.11: Cumulative biogas production from BMP reactors under different TAN
concentrations and similar operating pH of 8.5 (Phase 1)…..…….……………..72
Figure 4.12: Biogas composition from batch reactors under different TAN concentrations
and similar operating pH of 8.5 (Phase 1)……………………………………….73
Figure 4.13: TAN concentration at the beginning and end of incubation period, at
operating pH of 8.5 (Phase 1)………………………………...………………….74
Figure 4.14: VFA concentration at the beginning and end of incubation period, at
operating pH of 8.5 (Phase 1)……………………………………………………75
viii
Figure 4.15: COD concentration at the beginning and end of incubation period, at
operating pH of 8.5 (Phase 1)……………………………………………………76
Figure 4.16: Alkalinity at pH 7.5, 8.0 and 8.5 (Phase 1)………...………………………78
Figure 4.17: Cumulative biogas production from CB-reactors under different pH values
and similar initial TAN concentration of 350 mg/L (Phase 1)………….……….79
Figure 4.18: Percentage of FAN in TAN as a function of pH (7.5 – 8.5) and temperature
(35 oC)……………………………………………………...........................…….80
Figure 4.19: Cumulative biogas production under different pH values and similar initial
TAN concentration of 2500 mg/L (Phase 1)……………………………………..82
Figure 4.20: Cumulative biogas production from batch reactors under different pH values
and similar TAN concentrations of 5000 mg/L (Phase 1)………….……………83
Figure 4.21: Cumulative biogas production from reactors at different pH values and
similar TAN concentration of 7,500 mg/L (Phase 1)…………………………..84
Figure 4.22: Cumulative biogas production from reactors at different pH values and
similar TAN concentration of 10,000 mg/L (Phase 1)……………………...…84
Figure 4.23: Cumulative biogas production under gradual TAN Loading up to 10,000
mg/L (Phase 2)………………………………………………………………….. 86
Figure 4.24 (a): Cumulative biogas production under gradual TAN vs abrupt TAN
loading at pH 7.5 (Phase 2) ………………………………………......………….87
Figure 4.24 (b): Cumulative biogas production under gradual TAN up to 10,000 mg/L vs
abrupt TAN loading at pH 8.0 (Phase 2) …...…………………..……………….87
Figure 4.24 (c): Cumulative biogas production under gradual TAN up to 10,000 mg/L vs
abrupt TAN loading at pH 8.5 (Phase 2)… …………...……….……...………...88
Figure 4.25: VFA consumption under gradual TAN loading (Phase 2)………..………..89
Figure 4.26: COD consumption under gradual TAN Loading (Phase 2)………..………90
Figure 4.28: Alkalinity under gradual TAN Loading (Phase 2)…………………...…….91
Figure 4.29: Daily Biogas Production under semi-continuous mode (Phase 3)……...….92
Figure 4.30: Cumulative biogas production under various TAN concentrations……..…93
Figure 5.1: Cumulative biogas production from BMP reactors under different TAN
concentrations and similar operating pH of 7.5 (Phase 1)……………………...105
Figure 5.2: Biogas Composition at pH 7.5………………………..…………………....106

ix
Figure 5.3: TAN concentration under pH 7.5 (Phase 1)…………………………….….107
Figure 5.4: VFA concentration under pH 7.5 (Phase 1)……………………...…….…..108
Figure 5.5: COD concentration under pH 7.5 (Phase 1)………………………………..109
Figure 5.6: Alkalinity concentration under pH 7.5 (Phase 1)……………………….….110
Figure 5.7: Cumulative biogas production under pH 8.5 (Phase 1)…………..………...111
Figure 5.8: Biogas Composition under pH 8.5 (Phase 1) ………………………….......112
Figure 5.9: TAN Concentration under pH 8.5 (Phase 1)…………………..……….…..112
Figure 5.10: VFA Concentration under pH 8.5 (Phase 1)……………….……………..113
Figure 5.11: COD Concentration under pH 8.5 (Phase 1)………………...............……114
Figure 5.12: Alkalinity Concentration under pH 8.5 (Phase 1)……………….………..115
Figure 5.13: Cumulative biogas Production under pH 7.5 vs pH 8.5 (Phase 1)…...…...116
Figure 5.14: Biogas production at different pH values and similar TAN concentration of
7,500 mg/L (Phase 1)……………………………………...………………...….117
Figure 5.15: % of FAN in TAN as a function of pH and temperature……...………….118
Figure 5.16: Cumulative biogas production under gradual and abrupt TAN loadings at pH
7.5 (Phase 2) ……………………………………………………...…………….121
Figure 5.17: COD concentration under gradual TAN loadings at pH 7.5 vs 8.5 (Phase 2)
………………………………………………………………....122
Figure 5.18: VFA concentration under gradual TAN loadings at pH 7.5 vs 8.5…….....123
Figure 5.20: Total biogas production versus TAN concentration………………………124

x
List of tables
Table 3.1 (a): Reactor Configuration for SW – Phase 1…………………………………40
Table 3.1 (a): Reactor Configuration for (SW+L) – Phase 1……………………….……40
Table 3.2: Configuration of the simulated OFMSW used…………………………...…..41
Table 3.3: Properties of inoculums and OFMSW……………………………………......42
Table 3.3: Properties of Leachate…………………………………………………..........42
Table 4.1: Configuration of the simulated OFMSW used……………………..………...58
Table 4.2: Properties of inoculums and OFMSW………………………………………..58
Table 4.3: Initial and Final Alkalinity at pH 7.5, 8.0 and 8.5…………………………....77
Table 4.4: Percentage of FAN in TAN ………………………………………………….81
Table 4.5: Methane production per gram of COD degraded ………………………..…..85
Table 4.6: % Reduction in Biogas Production compared to CB-reactors at pH of 7.5,
8.0, and 8.5 …………………………………………………………………...….93
Table 5.1: Configuration of the simulated OFMSW.………………..…………………102
Table 5.2: Properties of inoculums, leachate and OFMSW………………………….....103
Table 5.3: Percentgeof FAN in TAN as a function of pH and temperature.…………...118
Table 5.4: Methane produced per gram of COD degraded……….…………………….119
Table 5.4: Percentage reduction in biogas compared with control reactors……………124

xi
List of abbreviations
AD: Anaerobic digestion
BANANA: Building Absolutely Nothing Anywhere Near Anybody.
BMP: Biochemical Methane Potential
CBP: Cumulative Biogas Production
CB-reactors: Control BMP reactors.
CH3COOH: acetic acid
CH4: Methane
CO2: Carbon-di-oxide
COD: Chemical Oxygen Demand
DBP: Daily Biogas Production
DW: Distilled Water
FAN: Free Ammonia Nitrogen
GHG: Greenhouse Gas
GTL: Gradual TAN Loading
HRT: Hydraulic Retention Time
ISWM: Integrated Solid Waste Management
MRT: Mass Retention Time
MSW: Municipal Solid Waste
NIMBY: Not In My Back Yard.
xii
NIMO: Not In My Office time
OFMSW: Organic Fraction of Municipal Solid Waste TAN
OLR: Organic Loading Rate
SLR: Solids Loading Rate
SRB: Sulfate Reducing Bacteria
SRT: Solids Retention Time
TAN: Total Ammonia Nitrogen
TV: Total Solids
USEPA: United States Environmental Protection Agency
VFAs: Volatile fatty acids
VOCs: Volatile Organic Compounds
VS: Volatile Solids
WMS: Waste Management Strategy
xiii
Table of Contents
Abstract ............................................................................................................................................ ii
Acknowledgements.......................................................................................................................... v
List of figures ................................................................................................................................... vi
List of tables ..................................................................................................................................... x
List of abbreviations ........................................................................................................................ xi
Chapter 1.......................................................................................................................................... 1
1 Introduction .................................................................................................................................. 1
1.1 Background ............................................................................................................................ 1
1.2 Research Objectives ............................................................................................................... 1
1.3 Research Questions ............................................................................................................... 2
1.4 Thesis Layout .......................................................................................................................... 2
References ....................................................................................................................................... 4
Chapter 2.......................................................................................................................................... 5
2 Literature Review .......................................................................................................................... 5
2.1 Municipal Solid Waste (MSW) Generation ............................................................................ 5
2.2 Waste Management Strategies ............................................................................................. 6
2.2.1 Waste Avoidance ............................................................................................................ 7
2.2.2 Waste Recycling/Composting ......................................................................................... 7
2.2.3 Energy Recovery ............................................................................................................. 8
2.2.4 Waste Disposal ................................................................................................................ 8
2.3 Bioreactor Landfill ................................................................................................................. 9
2.3.1 Classifications of Bioreactor Landfills ......................................................................... 10
2.4 Anaerobic Digestion ............................................................................................................ 12
2.4.1 Anaerobic Digestion Process ........................................................................................ 13
2.5 Phases of Biodegradation in a Bioreactor Landfill .............................................................. 15
2.5.1 Phase I: Lag or Initial Adjustment ................................................................................ 15
2.5.2 Phase II: Transition ....................................................................................................... 16
2.5.3 Phase III: Acid Formation ............................................................................................. 16
2.5.4 Phase IV: Methane Fermentation or Methanogenesis .................................................. 16
2.5.5 Phase V: Maturation and Stabilization .......................................................................... 16
2.6 Factors Inhibiting the Performance of the AD Process ........................................................ 17
xiv
2.6.1 Sulfide ........................................................................................................................... 17
2.6.2 pH .................................................................................................................................. 17
2.6.3 Temperature .................................................................................................................. 19
2.6.4 Ammonia-Nitrogen ....................................................................................................... 19
2.6.5 Presence of other ions ................................................................................................... 20
2.7 Mechanism of Ammonia Inhibition during Anaerobic Digestion ....................................... 20
2.8 Studies on Ammonia Inhibition of the AD Process ............................................................. 25
2.9 Measures to reduce the inhibitory effects of Ammonia on AD ........................................... 26
2.9.1 C: N Ratio adjustment ................................................................................................... 26
2.9.2 Dilution of reactor content ............................................................................................ 28
2.9.3 Acclimation of Methanogens to High Ammonia Concentration .................................. 30
2.10. Summary and Research Gap ............................................................................................. 30
Chapter 3........................................................................................................................................ 39
3 Materials and Methods ............................................................................................................... 39
3.1 Introduction ......................................................................................................................... 39
3.2. Organic Fraction of Municipal Solid Waste (OFMSW) ..................................................... 41
3.3 Inoculums and Leachate ...................................................................................................... 42
3.4 Experimental Setup .............................................................................................................. 43
3.5.1 Analytical Equipment and Methods .................................................................................. 46
3.5.2 pH .................................................................................................................................. 47
3.5.3 COD, TAN, VFA and Alkalinity .................................................................................. 48
3.5.4 Total and Volatile Solids............................................................................................... 51
Abstract .......................................................................................................................................... 54
4.1 Introduction .............................................................................................................................. 55
4.2.1 Analytical Methods and Equipment .................................................................................. 60
4.3 Results and Discussions ........................................................................................................... 60
4.3.1 Phase 1 (SW)..................................................................................................................... 61
4.3.1.1 The Effect of TAN at pH 7.5 ..................................................................................... 61
4.3.1.2 The Effect of TAN at pH 8.0 ..................................................................................... 67
4.3.1.3 The Effect of TAN at pH 8.5 ..................................................................................... 71
4.3.3 The Effects of pH and FAN .......................................................................................... 78
4.3.4 Phase 2 - Gradual TAN Loading Phase - SW ............................................................... 85
xv
Abstract .......................................................................................................................................... 98
5.1 Introduction .............................................................................................................................. 99
5.2 Materials and Methodology ................................................................................................... 101
5.2.1 Materials and Equipment ................................................................................................ 103
5.3 Results and Discussions ......................................................................................................... 104
5.3.1 Phase 1 – (SW+L) ........................................................................................................... 104
5.3.1.1 The Effect of TAN at pH 7.5 ................................................................................... 104
5.3.1.2 The Effect of TAN at pH 8.5 ................................................................................... 110
5.3.2 The effect of pH .......................................................................................................... 115
5.3.3 Phase 2 - Gradual TAN Loading - (SW+L) .................................................................... 119
5.4 Conclusion ............................................................................................................................. 123
6.1 Conclusions ............................................................................................................................ 128
6.2 Future Work ........................................................................................................................... 128
Appendix ...................................................................................................................................... 130
Appendix A ............................................................................................................................... 130
Appendix B ............................................................................................................................... 134
Appendix C ............................................................................................................................... 135

1
Chapter 1
1 Introduction
1.1 Background
Municipal Solid Waste (MSW) generation is a global concern. The MSW generation rate
increases with continuous increase in world population, yearly. Currently, an estimated
1.3 billion tons of MSW is generated globally every year and this value is projected to
increase by 70 % by 2025. In the same vein, the annual global cost of waste disposal is
expected to increase from $205 billion to $375 billion (World Bank, 2015). In 2008,
Statistics Canada published that over 25 million tonnes of MSW was deposited into
landfills across Canada. Out of the 25 million tonnes of waste landfilled, 13 million
tonnes were household wastes containing mainly organic waste. The Organic Fraction of
MSW (OFMSW) is about 40% of the total MSW generated in Canada (Statistics Canada,
2008; Alqaralleh et al., 2015). Anaerobic digestion (AD) is the most widely used process
for the treatment of wastes containing high organic content such as municipal wastewater
sludge and OFMSW. The AD of the OFMSW is a better alternative compared to aerobic
digestion because of the biogas produced in the process (mainly, carbon dioxide and
methane), which can be used for energy recovery. In addition, AD results in significant
reduction of waste volume. However, the AD process is greatly inhibited by high
ammonia concentration, which accumulates during the AD process. Ammonia is the by-
product resulting from the AD of proteins present in MSW (Nair et al., 2014). Several
studies have been carried out to examine the inhibitory effects of ammonia on AD of
organic matter. However; there is limited information about the inhibitory effects of
ammonia on AD of OFMSW (Yenigün and Demirel, 2013).
1.2 Research Objectives
The objectives of this research work are summarized below:
2
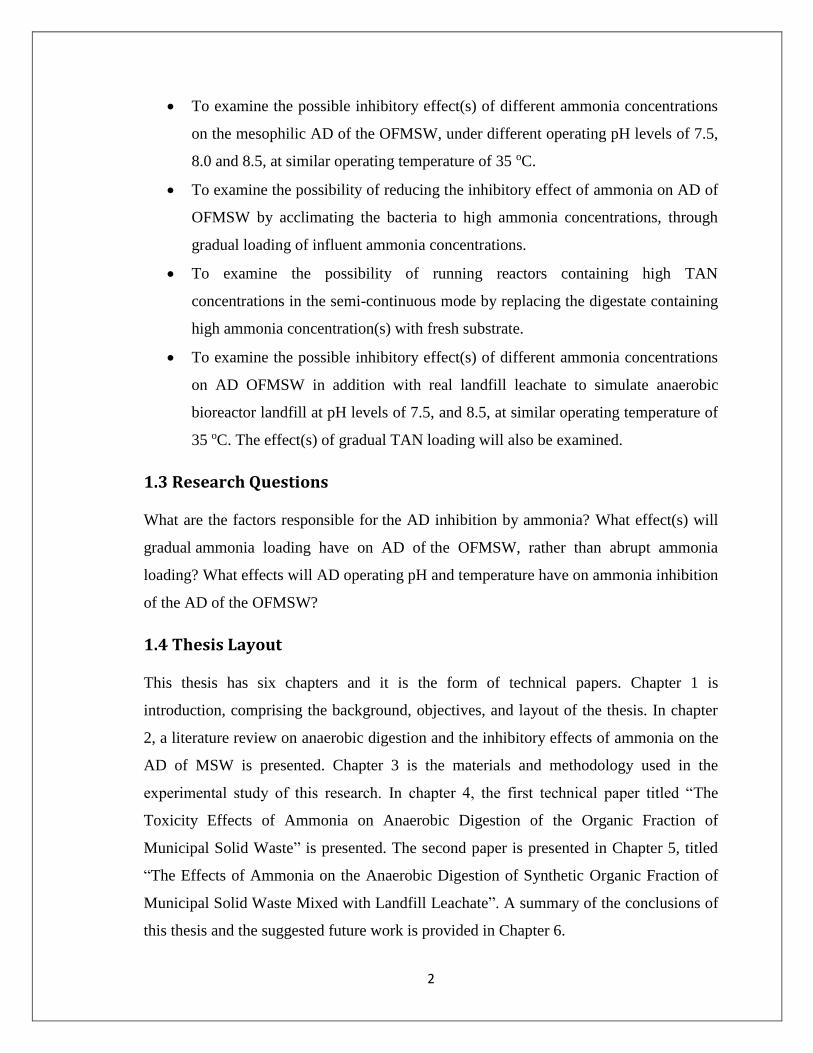
To examine the possible inhibitory effect(s) of different ammonia concentrations
on the mesophilic AD of the OFMSW, under different operating pH levels of 7.5,
8.0 and 8.5, at similar operating temperature of 35 oC.
To examine the possibility of reducing the inhibitory effect of ammonia on AD of
OFMSW by acclimating the bacteria to high ammonia concentrations, through
gradual loading of influent ammonia concentrations.
To examine the possibility of running reactors containing high TAN
concentrations in the semi-continuous mode by replacing the digestate containing
high ammonia concentration(s) with fresh substrate.
To examine the possible inhibitory effect(s) of different ammonia concentrations
on AD OFMSW in addition with real landfill leachate to simulate anaerobic
bioreactor landfill at pH levels of 7.5, and 8.5, at similar operating temperature of
35 oC. The effect(s) of gradual TAN loading will also be examined.
1.3 Research Questions
What are the factors responsible for the AD inhibition by ammonia? What effect(s) will
gradual ammonia loading have on AD of the OFMSW, rather than abrupt ammonia
loading? What effects will AD operating pH and temperature have on ammonia inhibition
of the AD of the OFMSW?
1.4 Thesis Layout
This thesis has six chapters and it is the form of technical papers. Chapter 1 is
introduction, comprising the background, objectives, and layout of the thesis. In chapter
2, a literature review on anaerobic digestion and the inhibitory effects of ammonia on the
AD of MSW is presented. Chapter 3 is the materials and methodology used in the
experimental study of this research. In chapter 4, the first technical paper titled “The
Toxicity Effects of Ammonia on Anaerobic Digestion of the Organic Fraction of
Municipal Solid Waste” is presented. The second paper is presented in Chapter 5, titled
“The Effects of Ammonia on the Anaerobic Digestion of Synthetic Organic Fraction of
Municipal Solid Waste Mixed with Landfill Leachate”. A summary of the conclusions of
this thesis and the suggested future work is provided in Chapter 6.

3
Due to the fact that this thesis is in paper based format, there may be repeated
information occurring in different chapters.

4
References Alqaralleh, R., Delatolla, R., & Kennedy, K. (2015). Anaerobic digestion of simulated-
organic fraction of municipal solid waste: effect of alkaline
pretreatment. International Journal of Environment and Waste Management, 16
(2), 166-185.
Nair, A., Sartaj, M., Kennedy, K., & Coelho, N. M. (2014). Enhancing biogas production
from anaerobic biodegradation of the organic fraction of municipal solid waste
through leachate blending and recirculation. Waste Management & Research, 32
(10), 939-946.
Statistics Canada (2008). Section 3: Solid Waste - http://www.statcan.gc.ca/pub/16-201-
x/2012000/part-partie3-eng.htm
World Bank (2015). What a Waste – A Global Review of Solid Waste Management.
http://www.worldbank.org/
Yenigün, O., & Demirel, B. (2013). Ammonia inhibition in anaerobic digestion: a
review. Process Biochemistry, 48(5), 901-911.

5
Chapter 2
2 Literature Review
2.1 Municipal Solid Waste (MSW) Generation MSW comprises the waste generated from residential households and apartment
buildings, commercial and institutional establishments, construction and demolition
waste, municipal services, and treatment plants (Staley and Barlaz, 2009).In North
America, 254 million tons of MSW was generated in the year 2013 in the United States
of America (USA) while in Canada over 30 million tons of MSW is generated annually
(USEPA, 2012). A recent report by the Canadian Broadcast Commission indicated that
the per capita waste generated in Canada is higher than in any other country in the world
(Canadian Broadcast Commission, 2013).The components of a typical MSW are food
wastes, paper, cardboard, plastics, textiles, rubber, leather, yard wastes, wood etc. while
construction and demolition waste is tended to be managed separately in industrial mono-
landfills (Tchobanoglous et al., 1993). The percentage composition of a typical MSW is
shown in Figure 2.1. The OFMSW which represents the biodegradable portion of the
MSW contains carbon compounds derived from animal and plant materials i.e. kitchen
waste and yard waste.
6
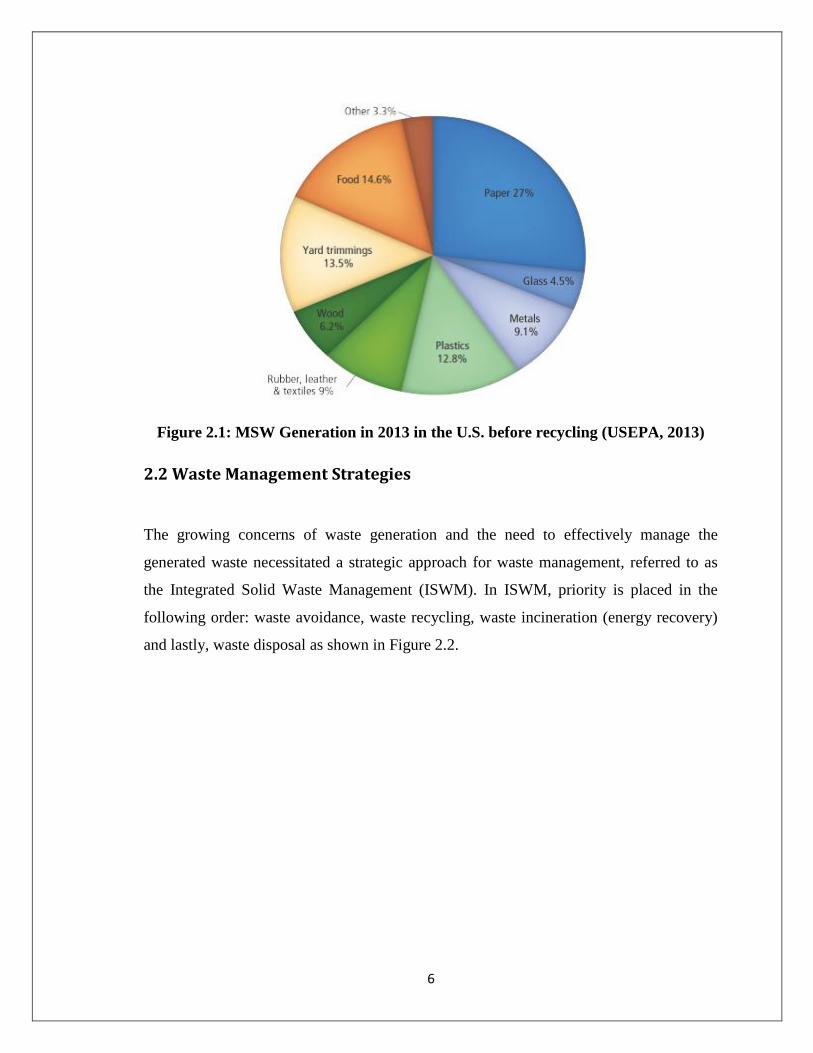
Figure 2.1: MSW Generation in 2013 in the U.S. before recycling (USEPA, 2013)
2.2 Waste Management Strategies
The growing concerns of waste generation and the need to effectively manage the
generated waste necessitated a strategic approach for waste management, referred to as
the Integrated Solid Waste Management (ISWM). In ISWM, priority is placed in the
following order: waste avoidance, waste recycling, waste incineration (energy recovery)
and lastly, waste disposal as shown in Figure 2.2.

7
Figure 2.2: Waste management hierarchy in the ISWM strategy (USEPA, 2012)
2.2.1 Waste Avoidance
Waste avoidance is a waste management strategy (WMS) that is aimed at discouraging
industries and individuals from acquiring unnecessary wastes. This WMS is often
referred to as waste reduction, aimed at reducing the rate of waste generation from the
source. In the developed countries, government policies in terms of MSW management
are geared towards waste prevention and reduction. This is achieved through public
education and sensitization, and increased waste disposal tariffs. The waste avoidance
strategy is also implemented through several programs that encourage individual
consumer to reuse used products and buy goods in bulk (USEPA, 2013).
2.2.2 Waste Recycling/Composting
Next on the ISWM is MSW recycling and composting. Through the recycling strategy,
items that would otherwise be dumped off as wastes and used items are collected, sorted
and processed into raw materials, and remanufactured into new products. MSW recycling
and separation is widely practiced in Canada. In the same vein, food scraps, yard
8
trimmings, and other organic materials are also composted to enhance waste stabilization.
Recycling has numerous advantages because it saves energy, enhances the supply of
valuable raw materials to the manufacturing industry, creates jobs, stimulates the
development of sustainable technology, reduces the need for new landfills and
combustors, and prevents the emission of many greenhouse gases and water pollutants
(Ara, 2012).
2.2.3 Energy Recovery
In the energy recovery strategy, waste materials are burned to create energy in the form
of heat and electricity. The energy recovery process involves thermal, chemical and
biological processes through which energy is recovered from waste. Energy recovery is a
renewable energy because the garbage which is the source of the fuel is sustainable and is
not depleted (Ara, 2012). Energy recovery from waste strategy is implemented in some
developed countries such as Japan where up to 70% of its MSW generated is incinerated
to reduce epidemics, reduce waste volume and to recover energy from such waste
materials (Mastutu, 2014). In addition, the energy recovered from the incineration of
MSW provides a better alternative for electricity generation than power plants powered
by fossil fuels through which greenhouse gases are emitted in large quantities. The
incineration of the OFMSW is neither energy efficient nor cost effective. This is because
the OFMSW consists of mostly kitchen food wastes and the incineration of food waste
requires lots of energy input while the energy recovered from the process is negligible.
2.2.4 Waste Disposal
Despite the implementation of the ISWM strategies in the order discussed above,
considerable amounts of wastes are still being disposed of in landfills (Kheradmand et al.,
2010). Landfilling operation is carried out without environmental protection measures in
underdeveloped and some developing countries. In developed countries however, the
1NIMBY, 2NIMO, and 3BANANA approaches of individuals towards waste management
9
and waste disposal into landfills have necessitated the need for the implementation of
environmental measures to minimize the environmental risks associated with landfilling,
through the use of bioreactor landfills. These measures involve the construction of
landfills liners, leachate collect system and biogas (especially, methane gas) collection
system for energy recovery (Poulsen, 2014).
2.3 Bioreactor Landfill
A bioreactor landfill is an engineered landfill where the waste microbial degradation
process is enhanced to achieve a faster and more extensive stabilization of waste
(Malfredi and Thompson, 2009). This is mainly achieved through the recirculation of the
collected leachate. Leachate is a liquid which is generated from the landfill when water
(i.e. rain or run off) seeps through the solid waste. The schematic diagram of a typical
bioreactor landfill is shown in Figure 2.3.The quality of leachate varies from one landfill
to another. The recirculation of leachate ensures a continuous supply of nutrients and
moisture close to field capacity, which are the two key conditions to promote the
degradation reactions. Leachate recirculation may also lead to an increase in waste
density, which results in a better utilization of the landfill capacity (Benson et al., 2007).
Leachate quality depends on the age of the landfill, the makeup of the waste and leachate,
the operational type of the landfill, leachate recirculation and treatment system, rainfall,
runoff design and ambient temperatures (Malfredi and Thompson, 2009).
1. Not In My Back Yard. Public attitude regarding the installation of waste management facilities close a
residential area.
2. Not In My Office time. Politicians and administrators try to avoid or postpone decisions in order not to
dent their career.
3. Building Absolutely Nothing Anywhere Near Anybody.

10
Figure 2.3: Anaerobic Bioreactor Landfill ®Waste Management (USEPA, 2011)
2.3.1 Classifications of Bioreactor Landfills
Based on the processes of operation, bioreactor landfills can be classified into aerobic,
anaerobic, hybrid (or facultative) bioreactor, and flushing bioreactor landfills.
Aerobic bioreactors are bioreactors wherein air is injected into the landfill waste mass
using blowers, in addition to controlled leachate recirculation, to enhance aerobic activity
and accelerate waste stabilization (USEPA, 2011). Due to the bacterial consortium, the
rate of waste stabilization in the initial stages of stabilization is relatively quick but the
rate of waste stabilization becomes longer towards the latter stages. Aerobic bioreactor
landfills also generate landfill gas (poor in methane and rich in carbon dioxide and
Nitrogen) and lower leachate production (Malfredi and Thompson, 2009). Aerobic
bioreactors are also called aerated bioreactors.
Anaerobic bioreactor landfills, unlike aerobic bioreactor landfills are operated in the
absence of air or oxygen. Anaerobic bioreactors require longer time to stabilize waste

11
when compared to aerobic bioreactors but they are more efficient than the conventional
engineered landfills. The entire landfill works as an anaerobic digester and accelerates the
waste decomposition by maintaining a healthy anaerobic bacteria consortium. Compared
to other classes of bioreactor landfills, anaerobic bioreactor landfills are easier to operate
and more cost effective since there is no energy requirement for aeration. One major
advantage of using an anaerobic bioreactor landfill for MSW degradation is its ability to
trap methane gas (i.e. methane constitutes around 50-60% of the biogas generated from
landfills) which can be used for energy recovery.
The hybrid landfill bioreactor combines the processes of anaerobic and aerobic
metabolism to stabilize the waste mass (Matsufuji et al., 2005). In the initial stage, the
degradation mechanism is anaerobically driven and enhanced by the recirculation of
leachate. This first stage (anaerobic stage) continues for 5–10 years, during which the
generated methane (CH4) will be too low for utilization for energy recovery. Then the
subsequent aerobic step is initiated by injecting air from the bottom of the landfill. A
convective air flow will then proceed within the landfill, due to the temperature gradient
between the warm waste (up to 50 – 70 oC) and the colder external environment by the
so-called ‘‘chimney effect” (Hanashima, 1999). When the natural airflow ceases,
anaerobic conditions may naturally re-establish but the waste is already stabilized and
therefore the potential for CH4 generation will be low. The cycling of aerobic and
anaerobic conditions also offers possibilities of treatment of some recalcitrant chemicals
and chemical by-products, in the same manner as modern wastewater treatment such as
nitrification and denitrification of ammonia (Reinhart et. al., 2006).The advantage that
hybrid bioreactors have is that they reach the methanogenesis phase faster due to the
combined aerobic-anaerobic processes. However, hybrid bioreactors are more difficult to
operate and the associated installation and maintenance cost is much more compared to
the other classes of bioreactors.
Flushing bioreactor landfills, are a special form of bioreactor landfills where considerable
amounts of water and leachate are recirculated in order to flush-out soluble waste,
components using a process called ‘‘waste irrigation” or ‘‘waste flushing”. The flushing
rate typically ranges from 1 to 5 m3 of total liquids (leachate and external water) per ton
of waste landfill (Hupe et al., 2003; Blakey et al., 1997). Due to the addition of large

12
volumes of water, flushing bioreactors achieve waste stabilization and contaminant
removal quickly (IWMLWG, 1999). However, the cost for the installation of flushing
bioreactor may be two to four times higher than the conventional landfill (Karnik and
Perry 1997).
2.4 Anaerobic Digestion
AD is a biological process whereby organic and inorganic wastes are decomposed in the
absence of oxygen. According to USEPA (2011), AD is defined as a process where
microorganisms break down organic materials, such as food scraps, manure and sewage
sludge, in the absence of oxygen. The huge energy content in OFMSW can be optimally
recovered when anaerobically biodegraded. The AD process may occur naturally in open
dump landfills where the bioreactor technology is not applied in portions that are
deficient of air, especially in the lower part of the landfills. When this occurs, the biogas
(especially methane) produced in this anaerobic part of such landfills is emitted into to
atmosphere, resulting in greenhouse gases (GHG) emission.
The ability to recover energy from organics makes AD more attractive than aerobic
digestion. It also reduces GHG by using methane as an energy source which would
otherwise be emitted from land filling waste (USEPA, 2011). In addition, anaerobic
systems produce methane gas, which is unavailable for biomass synthesis, resulting in
only 5-20% as much waste biomass, significantly reducing financial and disposal site
requirements (Speece, 2008).The application of the AD technology for MSW
management enhances the reduction of odours and volatile suspended solids and the
destruction of pathogenic organisms. When anaerobically biodegraded, OFMSW
generates biogas which is composed of methane (CH4) and carbon-dioxide (CO2), in
percentages of 55% and 45%, respectively. Methane production is a major consideration
in the selection of anaerobic digestion technology for wastewater treatment.
13
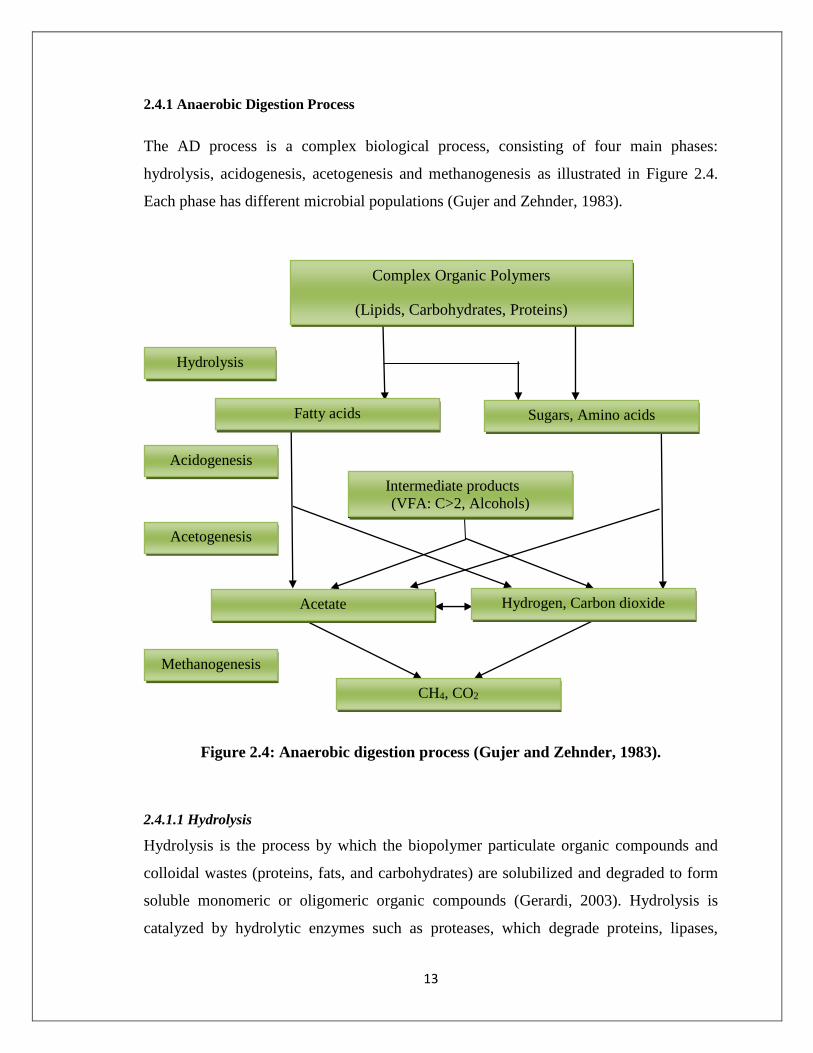
2.4.1 Anaerobic Digestion Process
The AD process is a complex biological process, consisting of four main phases:
hydrolysis, acidogenesis, acetogenesis and methanogenesis as illustrated in Figure 2.4.
Each phase has different microbial populations (Gujer and Zehnder, 1983).
Figure 2.4: Anaerobic digestion process (Gujer and Zehnder, 1983).
2.4.1.1 Hydrolysis
Hydrolysis is the process by which the biopolymer particulate organic compounds and
colloidal wastes (proteins, fats, and carbohydrates) are solubilized and degraded to form
soluble monomeric or oligomeric organic compounds (Gerardi, 2003). Hydrolysis is
catalyzed by hydrolytic enzymes such as proteases, which degrade proteins, lipases,
Complex Organic Polymers
(Lipids, Carbohydrates, Proteins)
Fatty acids Sugars, Amino acids
Intermediate products
(VFA: C>2, Alcohols)
Acetate Hydrogen, Carbon dioxide
CH4, CO2
Hydrolysis
Acidogenesis
Acetogenesis
Methanogenesis
Complex Organic Polymers
(Lipids, Carbohydrates, Proteins)
Hydrolysis
Fatty acids
Complex Organic Polymers
(Lipids, Carbohydrates, Proteins)
Hydrolysis
Sugars, Amino acids
Intermediate products
(VFA: C>2, Alcohols)
Acetate Hydrogen, Carbon dioxide
Acidogenesis
Fatty acids
Complex Organic Polymers
(Lipids, Carbohydrates, Proteins)
Hydrolysis
CH4, CO2
Acetogenesis
Methanogenesis
Sugars, Amino acids
Intermediate products
(VFA: C>2, Alcohols)
Acetate Hydrogen, Carbon dioxide
Acidogenesis
Fatty acids
Complex Organic Polymers
(Lipids, Carbohydrates, Proteins)
Hydrolysis
14
which degrade fats, and cellulases, which degrade cellulose. The simple organic
compounds (amino acids, fatty acids, and sugars) produced during this phase will be
utilized as a substrate in the next phase of the AD. Hydrolysis is a very significant
process in AD because it that can be a rate limiting step, particularly when anaerobically
digesting semi-solid waste (Ferrer et al., 2008).
2.4.1.2 Acidogenesis
During acidogenesis, the products of the hydrolysis phase (amino acids, fatty acids, and
sugars) are absorbed, degraded and converted into volatile fatty acids (VFAs), alcohols,
carbon dioxide, and hydrogen by different facultative and obligate anaerobic bacteria.
By-products, such as ammonia and hydrogen sulfide are also produced during this phase
(Strik et al., 2005; Chandra et al., 2012)
2.4.1.3 Acetogenesis
In the acetogenesis phase, the VFAs, alcohols, and carbon dioxide produced in the
acidogenesis phase are converted into acetate, hydrogen and carbon dioxide by acetate-
forming bacteria. This phase is also characterized by the constant reduction of hydrogen
and carbon dioxide to acetate by homoacetogenic microorganisms (Gerardi, 2003;
Chandra et al., 2012).
2.4.1.4 Methanogenesis
Methanogenesis occurs in strictly obligate anaerobic conditions. During this phase,
methane is produced from the products of acidogenesis/acetogenesis by methanogenic
Achaea. The two types of microorganisms responsible for methane formation are
acetoclastic methanogens and hydrogen-utilizing methanogens. Acetoclastic
methanogens utilize acetate to produce methane and carbon dioxide while the hydrogen-
utilizing methanogens use hydrogen and reduce carbon dioxide to form methane (Mara et
al., 2003). The methanogenesis phase is critical because methanogens are sensitive to the
different conditions such as ammonia, VFAs and pH, and this phase can therefore have a
huge impact on AD performance (De Vrieze et al., 2012). About 70% of methane in AD
is derived from this pathway (Parawira, 2012).
15
The AD phases in anaerobic bioreactor landfills are similar to the AD phases in a typical
digester, however with some slightly different terminologies.
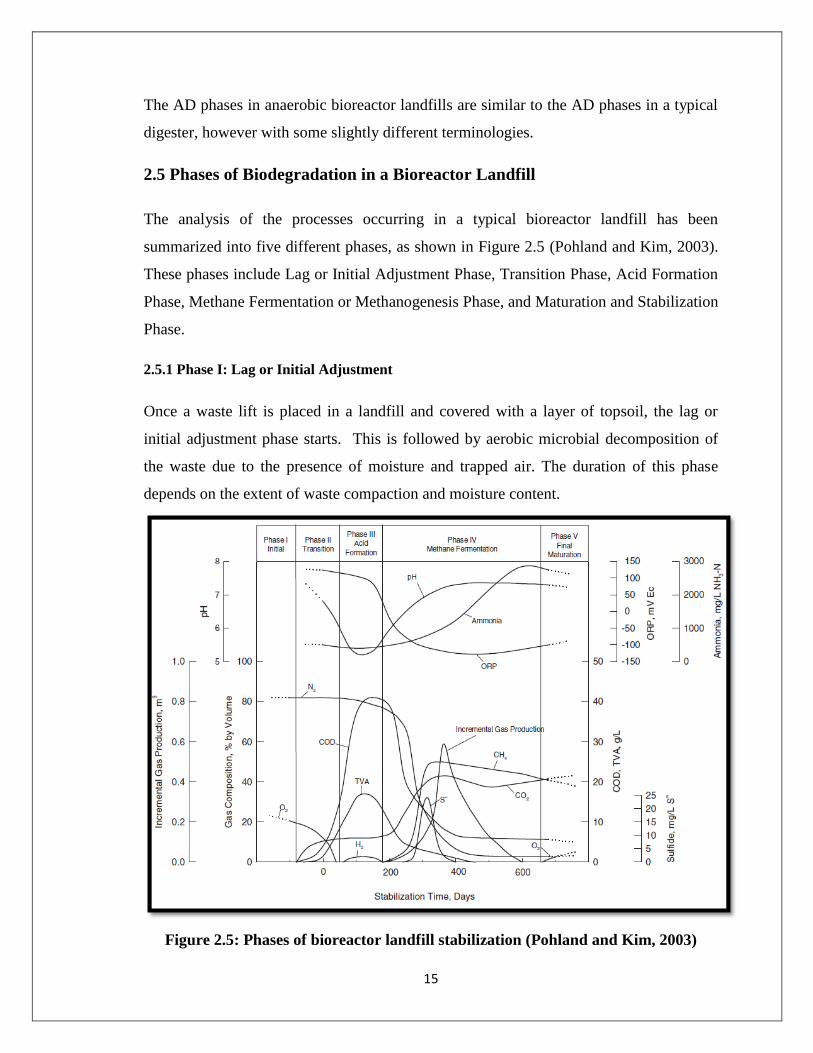
2.5 Phases of Biodegradation in a Bioreactor Landfill
The analysis of the processes occurring in a typical bioreactor landfill has been
summarized into five different phases, as shown in Figure 2.5 (Pohland and Kim, 2003).
These phases include Lag or Initial Adjustment Phase, Transition Phase, Acid Formation
Phase, Methane Fermentation or Methanogenesis Phase, and Maturation and Stabilization
Phase.
2.5.1 Phase I: Lag or Initial Adjustment
Once a waste lift is placed in a landfill and covered with a layer of topsoil, the lag or
initial adjustment phase starts. This is followed by aerobic microbial decomposition of
the waste due to the presence of moisture and trapped air. The duration of this phase
depends on the extent of waste compaction and moisture content.
Figure 2.5: Phases of bioreactor landfill stabilization (Pohland and Kim, 2003)
16
2.5.2 Phase II: Transition
The compaction and aerobic microbial activity in the previous phase result into the
depletion of oxygen in the waste as shown in Figure 2.5 and the entire process changes
from aerobic to anaerobic, during the transition stage. This switch from aerobic to
anaerobic process causes the hydrolysis and breaking down of the hydrocarbons present
in the waste. The end of this phase is marked by the significant change in the leachate
chemical oxygen demand (COD), and volatile organic acids (Shahriari and Abdallah,
2009).
2.5.3 Phase III: Acid Formation
The acid formation phase commences as the hydrocarbons broken down by hydrolysis
become converted into VFAs, composed mainly of acetic acid (CH3COOH), butyric acid
and hydrogen gas. There is a reduction in the pH value at this phase.
2.5.4 Phase IV: Methane Fermentation or Methanogenesis
This phase commences as the intermediate compounds, (i.e. VFAs and hydrogen gas)
formed in the acid forming phase, are broken down into methane (CH4), carbon-di-oxide
(CO2) and water (H2O) by microbes called methanogens. The consumption of the
intermediate compounds causes a rise in pH value to a neutral range (i.e. 7.0). This phase
is the most important stage for tapping the methane potential of the OFMSW.
2.5.5 Phase V: Maturation and Stabilization
The last phase of the biodegradation of the OFMSW in bioreactor landfills is called
maturation and stabilization. The level of microbial activity at this stage is lower when
compared to the previous two stages. This is because the whole process of biodegradation
is limited by available carbon substrates and essential nutrients like phosphorous, both of
which are essential for cell growth and synthesis. As a result, the methane produced in
this stage is low and is associated with the difficulty to biodegrade residual organics in
the OFMSW. Waste stabilization is then said to have occurred wherein there is little or
negligible methanogenic activity in the landfill (Nair et al., 2014).

17
2.6 Factors Inhibiting the Performance of the AD Process
There is a wide variation of information regarding the inhibitory effects of identified
substances and environmental factors on AD performance. This is largely because of the
variation in the properties of different substrates and inoculums used, variation in the
method of acclimation adopted, and owing to the fact that the AD process is complex.
However, the inhibition of the AD process has been linked to a decrease of the steady-
state rate of the biogas produced, the reduction of the methane content of the biogas
produced, and accumulation of organic acids (pH decrease) (Kroeker et al., 1979).
2.6.1 Sulfide
One of the constituents found in many industrial wastewaters is sulfate. During AD in
digesters, sulfate reducing bacteria (SRB) reduce sulfate to sulfide (Koster et al., 1986;
Hilton and Oleszkiewicz, 1988).The reduction of sulfate is accomplished through two
main groups of SRB including incomplete and complete oxidizers. Incomplete oxidizers
reduce compounds such as lactate to acetate and CO2, while complete oxidizers
completely convert acetate to CO2 and HCO-3. Due to sulfate reduction, there are two
noticeable stages of inhibition during AD. The first stage of inhibition is as a result of the
competition for available organic and inorganic substrates by SRB, causing a reduction in
methane production. The second stage of sulfide inhibition is due to the toxicity of
sulfide to different groups of bacteria (Andersonet al., 1982; Colleran et al., 1998).
2.6.2 pH
pH has a significant influence on the growth of microbial population necessary for AD
and the accumulation and composition of inhibitory substances such as total ammonia
nitrogen (TAN) and VFAs. TAN is made up of free ammonia nitrogen (FAN) and
ammonium nitrogen and the percentage composition of these two components largely
depends on the operating pH and temperature (Ding and Sartaj, 2015). FAN form of TAN

18
is more toxic to the AD process than the ammonium form and an increase in pH would
result in increased toxicity as will be discussed in more detail later on. It is therefore
expedient to keep pH within the growth optimum of microorganisms and to prevent
inhibition to the AD process. Braun et al. (1981) observed a VFAs accumulation up to
316 mg/L and an increase in FAN up to 316 mg/L while anaerobically digesting liquid
piggery manure, at an operating pH of 8.0. However, the FAN and VFAs concentrations
reduced instantly to 86 mg/L and 20 mg/L as the pH was adjusted to 7.4. The reduced pH
enhanced the bacteria utilization of the VFAs and the biogas production also increased.
Zeeman et al. (1985) observed an increase in methane production during the thermophilic
AD of cow manure, when the pH was reduced from 7.5 to 7.0.
Shanmugam and Horan (2009) examined the effect of operating pH on a waste mixture
containing a C:N ratio of 15 under various pH values of 4.5, 5.5, 6.5, 7.5 and 8.5. The
study showed that cumulative biogas production ranged from 1258 mL at pH 8.5 to 6518
at pH 6.5 as shown in Figure 2.6. Furthermore, a low specific biogas yield of 0.17 mL
CH4/gVS removed and high ammonia production of 3473 mg/L was observed at pH 8.5.
However, at pH 6.5, the cumulative biogas production and ammonia accumulation were
6515 mL and 817 mg/L respectively.
Figure 2.6: Cumulative biogas yield at C:N ratio of 15 at different pH controlled
reactors of LF admixed with MSW (Shanmugam and Horan, 2009)
19
2.6.3 Temperature
The operating temperature of an AD process has a significant effect on FAN
accumulation and microbial growth. When the temperature of an AD process is increased
the microbial growth rate increases however, this will enhance the accumulation of FAN
in high concentrations (Chen et al., 2008).
Research conducted by Braun et al. (1981) showed that operating at the mesophilic
temperature range during AD of cow manure containing high FAN concentration
enhanced a more stable process and reduced process inhibition, compared to operating at
the thermophilic temperature range. Angelidaki and Ahring (1994) and Hansen et al.,
(1999) observed an increase in biogas production when the operating temperature was
dropped from 60 oC to 37oC during the AD of substrates containing high ammonia
concentrations. The increased biogas production was interpreted as an indication of relief
from the inhibition caused by the FAN, as the temperature was reduced. However, it may
be argued that different bacteria such as mesophilic and thermophilic bacteria dominate
depending on the operating temperature thermophilic bacteria.
2.6.4 Ammonia-Nitrogen
The application of anaerobic bioreactor landfills and anaerobic digesters for anaerobically
digesting OFMSW and other organic matter, prevents the emission of GHG into the
atmosphere, prevents contamination of the groundwater and enhances the optimal
collection and utilization of the biogas produced for energy recovery (Ward et al., 2008).
However, the lack of degradation pathway for ammonia in anaerobic bioreactor landfills
and anaerobic digesters causes the accumulation of ammonia and volatile fatty acids,
resulting in reduced biogas production and digester failure. This will be discussed in
more details in the latter part of this thesis. High ammonia concentration inhibits
methanogenic activities and causes VFA accumulation, causing the failure of AD
digesters (Nielsen and Angelidaki., 2008). The inhibitory effect of ammonia on AD is
20
equally significant in anaerobic bioreactor landfills where leachate is constantly
recirculated. Continuous leachate recirculation enhances the persistent increase in the
concentration of ammonia in landfills and this a major factor in the treatment cost of
leachate and length of post-closure activities for bioreactor landfills ( Berge et al., 2005).
2.6.5 Presence of other ions
Research has shown that some ions such as Na+, Ca2+, and Mg2+ have antagonistic effects
on ammonia inhibition, a phenomenon whereby the toxicity of one ion is reduced by the
presence of other ions (McCarty and McKinney, 1961; Braun et al., 1981; Hendriksen
and Ahring, 1991). Research work by Kugelman and McCarty (1964) provided more
insights into the mutual antagonism existing between ammonia and sodium. Methane
production from acetic acid reduced by 20% as a result 0.15 M ammonia present in the
system, and a further 5 % increase in methane production was observed when 0.002–0.05
M Na+ was added to the system, compared to the control. In a related study on the AD of
poultry manure by Krylova et al. (1997), biogas generation was stimulated by adding
10% (w/v) phosphorite, regardless of the fact that NH4Cl was as high as 30 g/L in the
system. The stimulating effect of phosphorite was attributed to the immobilization of the
biomass on mineral particles, preventing biomass washout from the reactor. Also, biogas
stimulation due to phosphorite addition was an indication of the antagonistic effect of
phosphorite ore minerals (K+, Ca2+, Mg2+) on ammonia inhibition. The authors reported
however that the toxicity caused by more than 50 g/L of NH4Cl was irreversible, even
with addition of phosphorite.
2.7 Mechanism of Ammonia Inhibition during Anaerobic Digestion
Ammonia is the by-product resulting from the anaerobic digestion of nitrogenous
materials available in organic matter, mostly proteins and urea. Other nitrogenous
compounds present in wastewaters and OFMSW include phospholipids, nucleic acids and

21
other nitrogenous lipids. During the hydrolysis and solubilisation of protein, proteolytic
bacteria convert protein to alpha-amino acids as shown in Figure 2.7 (Kayhanian, 1999).
Figure 2.7: steps in the bioconversion of proteins (Blomgren et al., 1990).
As evident in Figure 2.7, ammonia is produced during hydrolysis of protein which is the
first stage of bioconversion of protein. Also, hydrolytic bacteria further hydrolyze amino
acids to form ammonia, H2, CO2 and VFAs. The amount of ammonia that can be
produced during the biodegradation of an organic substrate can be quantified using the
stoichiometric relationship in Equation (1) given below (Tchobanoglous et al., 1993).
CaHbOcNd +4a − b − 2c + 3d
4H2O
→4a + b − 2c − 3d
8CH4 +
4a − b + 2c + 3d
8CO2 + dNH3 … . Eq. (1)
While ammonia is an essential source of nutrient for bacterial growth during AD, its
inhibitory effects at high concentrations on methanogenic activities has been widely

22
reported (VanVelsen, 1979; Kayhanian, 1994; Poggi-Varaldo et al., 1997; Angelidaki and
Ahring., 1994; Calli et al., 2005; Duan et al., 2012).The release of ammonia through the
hydrolysis of amino acids causes a rise in the alkalinity and pH of the digester liquid
(Shanmugam and Horan, 2008). Among the three major anaerobic bacteria (i.e.
methanogens, acidogens and acetogens), methanogens have the least tolerance to
ammonia and fatty acids overloads. In order to maintain a constant pH and prevent
digester failure, there must be a balance between the consumption of fatty acids by
methanogens and the production of fatty acids by the acetogens (Kayhanian, 1994).
Oftentimes, ammonia-nitrogen is expressed as total ammonia nitrogen (TAN). TAN is
composed of free ammonia-nitrogen (FAN) and ammonium-nitrogen (NH4+-N). The FAN
content of the TAN is often referred to as the unionized form while the ammonium
content is commonly referred to as the ionized form of TAN. The percentages of FAN
and NH4+-N in TAN depend on pH and temperature as shown in Figure 2.8
The percentage of FAN in TAN can be estimated using Equation (2), as reported by
Hansen et al. (1998).
NH3 − N = TAN ∗ (1 + 10−pH
10−(0.09018+
2729.92
T(K)))
−1
… … … … … … … … Eq. (2)
where: NH3-N = Free Ammonia Nitrogen (FAN) mg/L; TAN = Total Ammonia Nitrogen
mg/L; T (K) = Temperature (Kelvin).
It is important to provide information on the operating pH and temperature when
referring to the TAN concentration of a digester and of any AD system. For instance, at
low pH (i.e. 6.0) and temperature (i.e. 35 oC), the percentage of FAN in TAN is almost
negligible. However, at high pH (i.e. 11) and temperature values, FAN constitutes as
much 100% of TAN, as seen in Figure 2.8.
23
Fig. 2.8: Percentage of free ammonia in solution at temperature of 20, 35 and 55
and varying pH values (Rajagopal et al., 2013).
Sterling et al. (2001), Nielsen and Anglidaki, (2008), and Chen et al. (2008) confirmed
that the formation of FAN was more toxic to the AD in a digester was pH dependent.
The FAN component of TAN is more responsible for the inhibition of the AD process
than the ionized form of TAN. This is largely due to the fact that FAN is more toxic and
capable of penetrating through bacteria cell membrane (Sung & Liu 2003; Muller et al.,
2006). FAN toxicity inhibits methanogenic bacteria by disrupting the methane producing
enzymes directly and by diffusing passively into bacterial cells, causing proton imbalance
and/or potassium deficiency as illustrated in Figure 2.9 (Gallert et al., 1998).

24
Figure 2.9: Mechanism of ammonia inhibition on methanogenic bacteria
(Sprott and Patel, 1986)
As illustrated in Figure 2.9 above, when ammonia diffuses passively into the cells of
methanogens, there is a difference in intracellular pH which results into the conversion of
some of the ammonia into ammonium (NH4+ − N), after absorbing protons ( H+). The
cells then must dissipate to balance the protons ( H+) deficit, using a potassium ( K+)
antiporter (Sprott et al., 1984). In a study conducted by Wiegant and Zeeman (1995), it
was observed that high TAN significantly affected the growth rates of hydrogen utilizing
methanogens and acetate was quickly produced when the concentration of TAN
increased. The authors proposed that intermediate compounds such as hydrogen and/or
propionic acids were formed as a result of the inhibition of hydrogen utilizing bacteria,
inhibiting the conversion of the acetate formed into methane. Ammonia is also toxic in
biological treatment of wastewater. The discharge of effluent of wastewater treatment
plant containing high ammonia concentration into water bodies can be toxic to aquatic
life (Dong and Sartaj, 2016).
25
AD process inhibition by ammonia often results in VFAs accumulation. In return, the
accumulation of VFAs leads to decrease in pH and a decline in the concentration of FAN.
As the FAN, VFAs and pH interact, there is an inhibition to the steady-state of the AD
process. Although the process will still be running stably, the biogas and the methane
content of the biogas produced will reduce significantly (Angelidaki and Ahring, 1993).
2.8 Studies on Ammonia Inhibition of the AD Process
The inhibitory effect of ammonia on the AD of both high-solids and low-solids under
various operating temperatures and pH values have been reported (Pfeiffer, 1974: Braun
et al., 1981; Webb, & Hawkes 1985; Hashimoto, 1986; Blomgren et al., 1990; Angelidaki
and Ahring, 1993). The impact of high ammonia concentrations on the biodegradation of
the OFMSW was studied by Kayhanian (1994), using various ammonia concentrations.
An instant inhibition occurred at 1000 mg/L ammonia concentration, followed by a 50%
inhibition and a complete bioreactor failure occurring at 1500 and 2500 mg/L ammonia
concentrations respectively. The inhibitory effect of ammonia on anaerobic film enriched
by methylaminotrophic methane producing Archaea was studied by Sossa et al. (2004),
using varying ammonia concentrations of 48.8, 73.8, 98.8, 148.8, 248.8, 448.8, and 848.8
mg/L, respectively. The authors reported that maximum methanogenic activity occurred
at 48.8 mg/L ammonia concentration. However, methanogenic activity was significantly
inhibited at 848.8 mg/L ammonia concentration. In a study by Koster (2007), 1900 –2000
mg/L ammonia concentration was reported as the cause of inhibition to methane
production at pH values above 7.6. When operating in thermophilic temperature range,
the inhibitory effect of high ammonia concentrations is more significant than when
operating in the mesophilic temperature range. Kayhanian (1994) observed a significant
reduction in methanogenic activity and methane gas production at TAN concentration of
500 mg/L, under operating pH of 7.5 and above and thermophilic temperature conditions.
Studies by Bhattacharya and Parkin (1998), Angelidaki et al. (1993), Martinelle and
Haggstrom (1993) and McCarty and McKinney (1991) showed that FAN was more
responsible for AD process inhibition than TAN. Bhattacharya and Parkin (1989)
26
reported a threshold FAN concentration of 55 ± 11 mg/L – NH3 while Braun et al.,
suggested a slightly higher FAN concentration of 80 mg/L – NH3. In another study by
McCarty and McKinney (1994), methanogenic activity was inhibited when FAN
concentration reached 150 mg/L – NH3.
2.9 Measures to reduce the inhibitory effects of Ammonia on AD
Several measures have been employed to reduce the inhibitory effect of ammonia on
anaerobic digestion. These include among others pH control, low operating temperature,
co-digestion, C:N ratio control, and dilution of digester content with fresh water (distilled
water).
2.9.1 C: N Ratio adjustment
Shanmugam and Horan (2009) conducted an experimental study on the AD of leather
fleshing waste (LFW) containing high alkaline pH value of 11.4 and a low C:N ratio of
3.2. A low methane yield due to the fact the LFW had excess nitrogen as evident in the
C:N ratio and the hydrolysis of the nitrogen, resulting in the formation of high ammonia
concentration inhibitory to methanogenesis. The C:N ratio of the LFW was adjusted by
blending it with MSW having a high C:N ratio. Various C:N ratios were examined
ranging from 3.2 to 30. The study showed that LFW and MSW waste mixtures containing
C:N ratios of 15 and 20 gave the highest cumulative biogas production compared with
other C:N ratios examined as shown in Figure 2.10. This result conformed with the study
conducted by Sievers and Brune (1978) who reported an optimum C:N ratio of 19.9.

27
Figure 2.10. Cumulative biogas yield at different C:N ratio of LFW mixed with
MSW (Shanmugam and Horan, 2009).
LFW and MSW waste mixtures containing low C:N ratios produced high concentrations
of ammonia up to 4289 mg/L as shown in Figure 2.11 and resulted in high alkalinity and
pH of 34,020 mg/L and 11.4 respectively. On the other hand, LFW and MSW waste
mixtures producing the highest biogas yielded low concentrations of both ammonia and
alkalinity 1736 and 8970 mg/L, respectively.
When optimised, the C:N ratio and co-digestion of wastes from different streams can be
the least expensive and easiest to implement strategy for reducing the inhibitory effect of
ammonia in AD (Shanmugam and Horan, 2009).

28
Figure 2.11. NH3–N levels at different C:N ratio of mixed LF and
MSW(Shanmugam and Horan, 2009).
2.9.2 Dilution of reactor content
Kayhanian (1994) examined the possibility of reducing the inhibitory effect of high TAN
concentrations in a high-solids anaerobic digester by diluting the reactor content. The
dilution of reactor content was carried out to examine whether the digestate would dilute
similarly as a simple solution by comparing laboratory and pilot scale tests, as illustrated
in Figure 2.12. As illustrated in Figure 2.12, the result showed that the digestate diluted
similarly as a simple solution in the laboratory and as a digestate in a pilot scale digester.
The dilution factor for the amount of dilution water required to dilute a digestate
containing inhibitory TAN concentration can be determined at a given TAN
concentration using Figure 2.12.
29
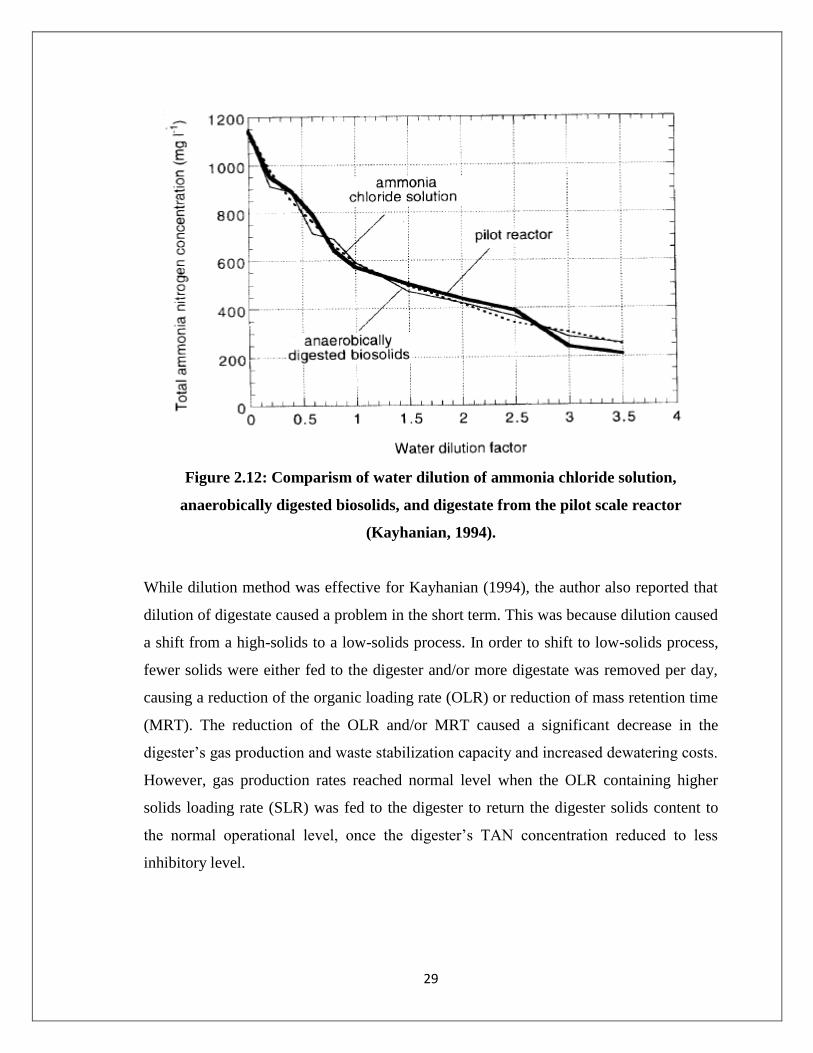
Figure 2.12: Comparism of water dilution of ammonia chloride solution,
anaerobically digested biosolids, and digestate from the pilot scale reactor
(Kayhanian, 1994).
While dilution method was effective for Kayhanian (1994), the author also reported that
dilution of digestate caused a problem in the short term. This was because dilution caused
a shift from a high-solids to a low-solids process. In order to shift to low-solids process,
fewer solids were either fed to the digester and/or more digestate was removed per day,
causing a reduction of the organic loading rate (OLR) or reduction of mass retention time
(MRT). The reduction of the OLR and/or MRT caused a significant decrease in the
digester’s gas production and waste stabilization capacity and increased dewatering costs.
However, gas production rates reached normal level when the OLR containing higher
solids loading rate (SLR) was fed to the digester to return the digester solids content to
the normal operational level, once the digester’s TAN concentration reduced to less
inhibitory level.
30
2.9.3 Acclimation of Methanogens to High Ammonia Concentration
The tolerance of microbes, most importantly the methanogens to high ammonia
concentrations can be improved by acclimating the microbes to high ammonia
concentrations. This can be achieved through a step-wise increase of ammonia
concentration. Melbinger and Donnellon (1967) investigated the reason for the drop in
biogas production capacity of one of two high-rate digesters operating under similar
organic loading. Prior to the failure of the other digester, the two digesters had average
biogas production of 10,640 m3/day. After the failure of digester I, digester II had an
excess biogas production of 6,400 m3/day than digester I. The result of the investigation
showed that at failure, the concentration of ammonia nitrogen in digester I had reached
1,900 mg/L compared with digester II containing ammonia nitrogen concentration of
1,700 mg/L. This conforms to the study of Alberton (1961) which placed the ammonia
concentration threshold for the failure point of digesters between 1,700-1,800 mg/L.
Further investigations by Melbinger and Donnellon (1967) revealed that the toxic effect
of ammonia on the performance of the high-rate digesters can be greatly reduced by
acclimating the methane-forming bacteria to ammonia, through gradual loading of TAN
in increasing concentrations. As a result of the acclimation, the high-rate digesters
operated without failure with TAN concentration up to 2,700 mg/L. Melbinger and
Donnellon (1967) concluded that “it is possible to operate at considerably higher levels;
apparently, it is not the concentration of ammonia nitrogen that is critical but the rate at
which it is produced.”
2.10. Summary and Research Gap
While several studies have been conducted to examine and control these inhibitors more
research is required to examine the effects of these inhibitors on the AD of OFMSW.
This is because OFMSW, industrial wastewater, livestock and poultry wastes have
different characteristics. For instance, poultry wastes have high ammonia concentration
and the anaerobic digestion of such waste will be easily inhibited. Several studies have

31
been carried out to examine the inhibitory effects of ammonia on AD of wastewater
however; there is limited information about the inhibitory effect of ammonia on AD of
OFMSW (Yenigün and Demirel, 2013). The wide range of the reported inhibitory
ammonia concentrations and the significance of ammonia toxicity on mesophilic bacteria
necessitate further studies on the inhibitory effects of ammonia on AD of OFMSW.

32
References
Albertson, Orris E. (1961). Ammonia nitrogen and the anaerobic environment. Journal
Water Pollution Control Federation: 978-995.
American Public Health Association, American Water Works Association, Water
Pollution Control Federation, & Water Environment Federation. (1915). Standard
methods for the examination of water and wastewater (Vol. 2). American Public
Health Association.
Angelidaki, I., and Ahring, B. K. (1993). Thermophilic anaerobic digestion of livestock
waste: the effect of ammonia. Applied Microbiology and Biotechnology, 38(4),
560-564.
Angelidaki, I., and Ahring, B. K. (1994). Anaerobic thermophilic digestion of manure at
different ammonia loads: effect of temperature. Water Research, 28(3), 727-731.
Ara, E. (2012). Anaerobic Co-digestion of Organic Fraction of Municipal Solid Waste
and Municipal Sludge With and Without Microwave Pre-treatment (Masters
Dissertation, University of Ottawa).
Benson, C.H., Barlaz, M.A., Lane, D.T., and Rawe, J.M., (2007). Practice review of five
bioreactor/recirculation landfills. Waste Management 27, 13–29.
Berge, N. D., Reinhart, D. R., and Townsend, T. G. (2005). The fate of nitrogen in
bioreactor landfills. Critical Reviews in Environmental Science and Technology,
35(4), 365-399.
Bhattacharya, S. K., and Parkin, G. F. (1989). The effect of ammonia on methane
fermentation processes. Journal (Water Pollution Control Federation), 55-59.
Blomgren, A., Hansen, A., and Svensson, B. H. (1990). Enrichment of a mesophilic,
syntrophic bacterial consortium converting acetate to methane at high ammonium
concentrations. In Microbiology and biochemistry of strict anaerobes involved in
interspecies hydrogen transfer (pp. 225-234). Springer US.
Braun, R., Huber, P., and Meyrath, J. (1981). Ammonia toxicity in liquid piggery manure
digestion. Biotechnology Letters, 3(4), 159-164.
33
Calli, B., Mertoglu, B., Inanc, B., and Yenigun, O. (2005). Effects of high free ammonia
concentrations on the performances of anaerobic bioreactors. Process
Biochemistry, 40(3), 1285-1292.
Canadian Broadcast Commission, (2008). Canadians Produce More Waste Than Anyone
Else. http://www.cbc.ca/news/business/canadians-produce-more-garbage-than-
anyone-else-1.1394020
Chandra, R., Takeuchi, H., and Hasegawa, T. (2012). Methane production from
lignocellulosic agricultural crop wastes: A review in context to second generation
of biofuel production. Renewable and Sustainable Energy Reviews, 16(3), 1462-
1476.
Chen, Y., Cheng, J. J., and Creamer, K. S. (2008). Inhibition of anaerobic digestion
process: a review. Bioresource Technology, 99(10), 4044-4064.
De Vrieze, J., Hennebel, T., Boon, N., and Verstraete, W. (2012). Methanosarcina: the
rediscovered methanogens for heavy duty Biomethanation. Bioresource
Technology, 112, 1-9.
Dong, S., and Sartaj, M. (2016). Statistical analysis and optimization of ammonia
removal from landfill leachate by sequential microwave/aeration process using
factorial design and response surface methodology. Journal of Environmental
Chemical Engineering, 4(1), 100-108
Duan, N., Dong, B., Wu, B., and Dai, X. (2012). High-solid anaerobic digestion of
sewage sludge under mesophilic conditions: feasibility study. Bioresource
Technology, 104, 150-156.
El Hadj, T. B., Astals, S., Gali, A., Mace, S., & Mata-Alvarez, J. (2009). Ammonia
influence in anaerobic digestion of OFMSW. Water Science and
Technology, 59(6), 1153
Ferrer, I., Ponsá, S., Vázquez, F., & Font, X. (2008). Increasing biogas production by
thermal (70 C) sludge pre-treatment prior to thermophilic anaerobic
digestion. Biochemical Engineering Journal, 42(2), 186-192.

34
Gallert, C., Bauer, S., and Winter, J. (1998). Effect of ammonia on the anaerobic
degradation of protein by a mesophilic and thermophilic biowaste population.
Applied Microbiology and Biotechnology, 50(4), 495-501.
Gerardi, M. H. (2003). The microbiology of anaerobic digesters. John Wiley & Sons.
Gujer, W., and Zehnder, A. J. B. (1983). Conversion processes in anaerobic
digestion. Water Science & Technology, 15(8-9), 127-167.
Hanashima, M. (1999). Pollution control and stabilization process by semi-aerobic
landfill type: the Fukuoka method. In Proceedings of Sardinia (Vol. 99, pp. 313-
326).
Hansen, K. H., Angelidaki, I., & Ahring, B. K. (1999). Improving thermophilic anaerobic
digestion of swine manure. Water Research, 33(8), 1805-1810
Hansen, K. H., Angelidaki, I., & Ahring, B. K. (1998). Anaerobic digestion of swine
manure: inhibition by ammonia. Water Research, 32(1), 5-12.
Hashimoto, A. G. (1986). Ammonia inhibition of methanogenesis from cattle
wastes. Agricultural Wastes, 17(4), 241-261.
Hendriksen, H. V., & Ahring, B. K. (1991). Effects of ammonia on growth and
morphology of thermophilic hydrogen-oxidizing methanogenic bacteria. FEMS
Microbiology Letters, 85(3), 241-245.
Hilton, B. L., & Oleszkiewicz, J. A. (1988). Sulfide-induced inhibition of anaerobic
digestion. Journal of Environmental Engineering, 114(6), 1377-139.
Hupe, K., Heyer, K., and Stegmann, R., (2003). Water infiltration for enhanced in situ
stabilization. In: Proceedings Sardinia 2003, Ninth Waste Management and
Landfill Symposium. S. Margherita di Pula, Cagliari, Italy.
Institute of Wastes Management Sustainable Landfill Working Group. (1999). The Role
and Operation of the Flushing Bioreactor. CIT0033.
Karnik, M. and C. Perry (1997). Cost Implications of Operating Landfills as Flushing
Bioreactors. Proceedings from Sardinia 97, Sixth International Landfill
Symposium, Volume I, S. Margherita di Pula, Cagliari, Italy, 13–17 October,
1997, Volume I, 419–426.

35
Kayhanian, M. (1994). Performance of a high‐solids anaerobic digestion process under
various ammonia concentrations. Journal of Chemical Technology and
Biotechnology, 59(4), 349-352.
Kayhanian, M. (1999). Ammonia inhibition in high-solids biogasification: an overview
and practical solutions. Environmental Technology, 20(4), 355-365.
Kim, J., & Pohland, F. (2003). Process enhancement in anaerobic bioreactor
landfills. Water Science & Technology, 48(4), 29-36.
Koster, I. W., and Lettinga, G. (1984). The influence of ammonium-nitrogen on the
specific activity of pelletized methanogenic sludge. Agricultural Wastes,9(3),
205-216.
Koster, I. W., and Lettinga, G. (1988). Anaerobic digestion at extreme ammonia
concentrations. Biological Wastes, 25(1), 51-59.
Kroeker, E. J., Schulte, D. D., Sparling, A. B., & Lapp, H. M. (1979).Anaerobic
treatment process stability. Journal (Water Pollution Control Federation), 718-
727
Kugelman, I. J., & McCarty, P. L. (1965). Cation toxicity and stimulation in anaerobic
waste treatment. Journal (Water Pollution Control Federation), 97-116.
Manfredi, S., and Christensen, T. H. (2009). Environmental assessment of solid waste
landfilling technologies by means of LCA-modeling. Waste management,29(1),
32-43.
Mara, D., and Horan, N. J. (Eds.). (2003). Handbook of water and wastewater
microbiology. Academic press.
Martinelle, K., and Häggström, L. (1993). Mechanisms of ammonia and ammonium ion
toxicity in animal cells: transport across cell membranes. Journal of
Biotechnology, 30(3), 339-350.
Matsufuji, Y., Tachifuji, and A., Matsugu, H., (2005). Biodegradation process of
municipal solid waste by semi aerobic landfill type. In: Proceedings Sardinia
2005, Tenth International Waste Management and Landfill Symposium. S.
Margherita di Pula, Cagliari, Italy.
Matsuto, T. (2014). A comparison of Waste Management throughout Asian
countries. Waste Management, 6(34), 969-970

36
McCarty, P. L., and McKinney, R. E. (1961). Salt toxicity in anaerobic digestion. Journal
(Water Pollution Control Federation), 399-415.
Melbinger, N. R., Donnellon, J., & Zablatzky, H. R. (1971). Toxic Effects of Ammonia
Nitrogen in High-Rate Digestion [with Discussion]. Journal (Water Pollution
Control Federation), 1658-1670.
Müller, T., Walter, B., Wirtz, A., and Burkovski, A. (2006). Ammonium toxicity in
. Current Microbiology, 52(5), 400-406.
Nielsen, H. B., and Angelidaki, I. (2008). Strategies for optimizing recovery of the biogas
process following ammonia inhibition. Bioresource Technology, 99(17), 7995-
8001.
Parawira, W. (2012).Enzyme research and applications in biotechnological
intensification of biogas production. Critical Reviews in Biotechnology, 32(2),
172-186.
Pfeffer, J. T. (1974). Temperature effects on anaerobic fermentation of domestic
refuse. Biotechnology and Bioengineering, 16(6), 771-787.
Poggi-Varaldo, H. M., Rodriguez-Vazquez, R., Fernandez-Villagomez, G., andEsparza-
Garcia, F. (1997). Inhibition of mesophilic solid-substrate anaerobic digestion by
ammonia nitrogen. Applied Microbiology and Biotechnology, 47(3), 284-291
Pohland, F. G., and Kim, J. C. (1999). In situ anaerobic treatment of leachate in landfill
bioreactor. Water Science Technology.
Poulsen, Tjalfe G. "Landfilling, past, present and future." Waste Management &
Research 32.3 (2014): 177-178
Rajagopal, R., Massé, D. I., and Singh, G. (2013). A critical review on inhibition of
anaerobic digestion process by excess ammonia. Bioresource Technology,143,
632-641.
Reinhart, D. R., McCreanor, P. T., and Townsend, T. (2002). The bioreactor landfill: Its
status and future. Waste Management & Research, 20(2), 172-186.
Saeed, M. O., Hassan, M. N., and Mujeebu, M. A. (2009). Assessment of municipal solid
waste generation and recyclable materials potential in Kuala Lumpur, Malaysia.
Waste Management, 29(7), 2209-2213.
Shahriahri and Abdallah, (2009) Anaerobic Biodegradation in Landfills.

37
Shanmugam, P., & Horan, N. J. (2009). Optimising the biogas production from leather
fleshing waste by co-digestion with MSW. Bioresource Technology, 100(18),
4117-4120.
Sievers, D. M., & Brune, D. E. (1978). Carbon/nitrogen ratio and anaerobic digestion of
swine waste. Transactions of the ASAE [American Society of Agricultural
Engineers] (USA).
Sossa, K., Alarcón, M., Aspé, E., & Urrutia, H. (2004). Effect of ammonia on the
methanogenic activity of methylaminotrophic methane producing Archaea
enriched biofilm. Anaerobe, 10(1), 13-18.
Speece, R. E. (1983). Anaerobic biotechnology for industrial wastewater
treatment. Environmental Science & Technology, 17(9), 416A-427A
Sprott, G. D., & Patel, G. B. (1986).Ammonia toxicity in pure cultures of methanogenic
bacteria. Systematic and Applied Microbiology, 7(2), 358-363.
Sprott, G. D., Shaw, K. M., and Jarrell, K. F. (1984).Ammonia/potassium exchange in
methanogenic bacteria. Journal of Biological Chemistry, 259(20), 12602-12608.
Staley, B. F., &Barlaz, M. A. (2009).Composition of municipal solid waste in the United
States and implications for carbon sequestration and methane yield. Journal of
Environmental Engineering.
Staley, B. F., and Barlaz, M. A. (2009).Composition of municipal solid waste in the
United States and implications for carbon sequestration and methane yield. Journal
of Environmental Engineering.
Sterling, M. C., Lacey, R. E., Engler, C. R., and Ricke, S. C. (2001). Effects of ammonia
nitrogen on H2 and CH4 production during anaerobic digestion of dairy cattle
manure. Bioresource Technology, 77(1), 9-18.
Strik, D. P., Domnanovich, A. M., Zani, L., Braun, R., and Holubar, P. (2005). Prediction
of trace compounds in biogas from anaerobic digestion using the MATLAB
Neural Network Toolbox. Environmental Modelling & Software, 20(6), 803-810.
Sung, S., & Liu, T. (2003). Ammonia inhibition on thermophilic anaerobic digestion.
Chemosphere, 53(1), 43-52.

38
Tchobanoglous, G., Theisen, H., and Vigil, S. (1993). Integrated Solid Waste
Management: Engineering Principles and Management Issues. McGraw-Hill,
Inc.
USEPA, (2011). Waste - http://www.epa.gov/osw/nonhaz/municipal/landfill.htm.
USEPA, (2013). Waste management hierarchy in the ISWM strategy and Homeland
Security Incidents - http://www.epa.gov/homeland-security-waste/waste-
management-hierarchy-and-homeland-security-incidents
Van Velsen, A. F. M. (1979). Adaptation of methanogenic sludge to high ammonia-
nitrogen concentrations. Water Research, 13(10), 995-999.
Ward, A. J., Møller, H. B., and Raju, C. S. (2010). Extreme thermophilic pre-treatment of
manures for improved biogas production. Proceeding 14th Ramiran International
Conference.
Webb, A. R., & Hawkes, F. R. (1985). The anaerobic digestion of poultry manure:
variation of gas yield with influent concentration and ammonium-nitrogen
levels. Agricultural Wastes, 14(2), 135-156.
Wiegant, W. M., and Zeeman, G. (1986). The mechanism of ammonia inhibition in the
thermophilic digestion of livestock wastes. Agricultural Wastes, 16(4), 243-253.
Yenigün, O., & Demirel, B. (2013). Ammonia inhibition in anaerobic digestion: a
review. Process Biochemistry, 48(5), 901-911.
Zeeman, G., Wiegant, W. M., Koster-Treffers, M. E., and Lettinga, G. (1985). The
influence of the total-ammonia concentration on the thermophilic digestion of
cow manure. Agricultural Wastes, 14(1), 19-35.

39
Chapter 3
3 Materials and Methods
3.1 Introduction The experimental study in this research was carried out using 500 mL Kimax® glass
bottles capped with butyl rubber stoppers, with sampling ports on the rubber stoppers to
enhance easy sampling and to prevent the interference of oxygen on the AD process
during sampling. Two sets of experiments were carried out with each set comprising
different phases as explained in the latter part of this chapter. The first set of experiments
involved the investigation of the inhibitory effects of ammonia on the AD of synthetic
OFMSW (SW) only while the second set of experiments involved the investigation of the
inhibitory effects of ammonia on the AD SW mixed with leachate (SW+L). Phase 1 of
the SW experiments was biochemical methane potential (BMP), phase 2 was gradual
TAN loading while phase 3 was semi-continuous reactor phase. For (SW+L), the two
phases examined were the BMP phase (phase 1) and the gradual TAN loading phase
(phase 2). The phases are explained in more details in the experimental set up section of
the chapter.
The total working volume of the reactor contents was 300 mL in both sets of
experiments, except for the semi-control reactor phase where the working volume was
200 mL. The working volumes (BMP phases) are shown in Tables 3.1 (a) and (b). For
SW, the inhibitory effect of various TAN concentrations ranging from 2,500, 5,000,
7,500 to 10,000 mg/L was investigated under different pH levels of 7.5, 8.0 and 8.5. For
the SW experiment, the initial TAN concentration in the control reactors was 350 mg/L
while for (SW+L) experiment, the initial TAN concentration was 650 mg/L in the control
reactors. The mass of NH4Cl required to achieve the desired TAN concentration was
determined by mass balance, considering initial the TAN concentrations in the reactors.
For (SW+L), effect of various TAN concentrations of 7,500 and 10,000 mg/L was
investigated under different pH levels of 7.5 and 8.5

40
Table 3.1 (a): Reactor Configuration for SW – Phase 1
NH4Cl
added
(g)
Control (30 g OFMSW + ≈ 120 mL DW + 120
mL Inoculums + 2 g buffer)
-
Control + 2500 mg/L TAN 2.46
Control + 5000 mg/L TAN 5.33
Control + 7500 mg/L TAN 8.20
Control + 10,000 mg/L TAN 11.06
Table 3.1 (b): Reactor Configuration for (SW+L) – Phase I
NH4Cl
added
(g)
Control (30 g OFMSW + 80 mL Leachate + ≈ 120 mL DW +
40 mL Inoculums + 2 g buffer)
-
Control + 7500 mg/L TAN 7.85
Control + 10,00 mg/L TAN 10.72
The operating temperature for all the AD experiments carried out in this study was 35 oC,
in the mesophilic temperature range. All tests were carried out in conformity to the
guidelines provided in the standard code of practice. All reactors were run in duplicates
throughout this study. The reactors were purged for about 2 minutes with nitrogen gas,
sealed with the rubber stoppers and a layer of silicone was added all around the
connecting areas between the glass and the stopper, stopper with tubes to ensure gas-
tightness of the reactors. All reactors were set up in duplicates. Equal portions of
NaHCO3 and KHCO3were added to achieve an alkalinity concentration of between 4000
and 6000 mg/L as CaCO3. As circumstances required, 1N Hydrochloric Acid (1N HCl)
solution and 5N Sodium Hydroxide (5N NaOH) solution were added to the bottles to
adjust the pH to the desired value

41
3.2. Organic Fraction of Municipal Solid Waste (OFMSW)
The OFMSW used in this study was simulated using food components that are
representative of a typical domestic kitchen and commercial kitchen food waste. The
percentages of the different components of the OFMSW had standard compositions of
protein, hydrocarbon, vegetable and fat in conformity with the Canadian Food Guide, as
shown in Table 3.2 (Ara, 2012). In order to obtain consistent results, each set of
simulated OFMSW was prepared weekly and the remaining simulated OFMSW was
frozen up at a temperature of -4 oC, to prevent the likelihood of any fermentation. The
carrots, cabbage, banana, and apple used were fresh. The ground beef was cooked for 30
minutes while the rice and pasta were cooked differently for 15 minutes each in a rice
cooker. Prior to being used, the OFMSW was thoroughly mixed and blended to form a
slurry having a particle size ranging from 1-2 mm, using a kitchen food processor.
Table 3.2: Configuration of the simulated OFMSW used
OFMSW Configuration
Composition Percentage
weight
(% w/w)
Carrot 11
Cooked rice 18
White cabbage 10
Cooked pasta 18
Banana 11
Dog food 11
Apple 11
Cooked ground beef 10
Total 100

42
3.3 Inoculums and Leachate
The inoculums used in this research was obtained from the effluent of the AD digester
used for the AD of sludge at the Robert O. Pickard Environmental Center (ROPEC),
Ottawa, Ontario, Canada. In order to keep the inoculums alive, the inoculums were kept
in suspension by agitation in a New Brunswick Scientific Controlled Environment
Incubator Shaker rotating at 86 revolutions per minute (rpm) at 35°C.
Prior to being used for batch experimental studies, the OFMSW and the inoculums were
characterized as shown in Table 3.3 for COD, Volatile Solids (VS), alkalinity, and Total
Solids (TS). All values are averages of duplicate runs.
Table 3.3: Properties of Inoculums and OFMSW
Properties COD
mg/L
pH TAN
mg/L
Alkalinity
as CaCo3
mg/L
VFAs,
mg/L
Total
Solids
(TS)
(%)
Volatile
solids
(VS)
(%)
Organic
Solid
(VS/TS)
(%)
OFMSW 177,000 4.5 350 2,750 9600 16.62 15.90 96
Inoculums 11,050 6.9 876.5 14,600 7500 1.73 0.96 56
Mature landfill leachate, aged between 15-25 years was obtained from a municipal
landfill in Ottawa was used in this study. The leachate was stored at a temperature of 4°
C until used and it was incubated at 35 °C in a Shaker for 24 hours before being used.
The leachate was characterized as shown in Table 3.4 below. All values are averages of
duplicate runs.
Table 3.4: Properties of Leachate
Properties COD
mg/L
pH TAN
mg/L
Alkalinity
(CaCO3)
mg/L
VFA
(acetic acid)
mg/L
Leachate 4425 9.0 1878 6725 549

43
3.4 Experimental Setup
3.4.1 SW – Phase 1
A total of thirty six (36) bottles were set up for the BMP phase, with the inoculums batch
bottles, control batch bottles, and batch bottles with each TAN concentration set up in
duplicates. The BMP bottles were set to the desired pH values of 7.5, 8.0 and 8.5.
3.4.2 SW – Phase 2
The second phase of the experiment was gradual TAN loading. In order to examine
whether the tolerance of the bacteria to high ammonia concentration would improve by
acclimating the microbes to high ammonia concentrations, TAN concentration was
increased gradually at pH 7.5, 8.0 and 8.5 using the same reactor contents as those of the
BMP phase. At the beginning, TAN concentration was raised to 1250 mg/L and further
increased by 1250 mg/L weekly.
3.4.3 SW – Phase 3
The third phase of the experiment was semi-continuous batch phase. In order to examine
the possibility of reducing the inhibitory effect of ammonia on AD, batch reactors at pH
values of 8.0 and 8.5 containing initial TAN concentrations of 7500 mg/L and 10,000
mg/L were converted to semi-continuous reactors at the end of the experiment. The
volume of digestate in these reactors was adjusted to working volume of 200 mL. A hole
was made in the stopper on each reactor; and was used for feeding the reactor by
attaching a 5-cm piece of tubing. The reactors were purged for about 2 minutes with
nitrogen gas, sealed with the rubber stoppers and a layer of silicone was added all around
the connecting areas between the glass and the stopper, stopper with tubes to ensure gas-
tightness of the reactors. To simulate a semi-continuous reactor process, 3 g of the
digestate containing high ammonia concentration(s) was replaced with fresh substrate
every 4 days, 7 days and 15 days, as shown in Figure 3.1. A total of 8 semi-continuous
batch bottles were set up for this phase.

44
Figure 3.1: Semi-continuous Batch Phase
3.4.4 (SW + L) – Phase 1
In phase 1, BMP tests were carried out using mesophilic anaerobically digested
inoculums volume of 40 mL, 80ml of anaerobic landfill leachate, 30 g of OFMSW, TAN
concentrations 7,500 and 10,000 mg/L. Equal portions of NaHCO3 and KHCO3 were
added as buffer. The total working volume of the mixture was brought to 300 mL by the
addition of DW. As circumstances required, 1N Hydrochloric Acid (1N HCl) solution
and 5N Sodium Hydroxide (5N NaOH) solution were used to adjust the pH to the desired
value. The inoculums BMP bottles, control BMP bottles, and BMP bottles containing
7,500 and 10,000 mg/L, TAN concentrations were set up in duplicates. A total of 20
BMP bottles were set up for this phase. The pH levels were 7.5 and 8.5.

45
3.4.5 (SW + L) – Phase 2
The phase 2 of the experiment was gradual TAN loading to examine the possibility of
adapting thermophilic bacteria to high ammonia concentration. At the beginning, TAN
concentration was raised to 1000 mg/L and further increased by 1000 mg/L weekly. A
total of 4 batch reactors were set up for this phase. The pH levels were 7.5 and 8.5.
As mentioned above at the beginning of the experiment and after taking samples for
analysis during the experiment, the BMP bottles were sparged with nitrogen gas for about
two minutes each, to expel any entrapped oxygen in the bottles. In order to ensure that the
pressure in each bottle was brought to equilibrium with atmospheric pressure at
beginning of the experiment, a BD 21G1½ needle connected to a U-tube manometer was
inserted into each bottle.
The daily biogas production of the inoculums batch bottles were subtracted from the
daily biogas production of the control BMP bottles and from each BMP bottle containing
added TAN concentrations. The AD process was initiated by incubating all the batch
bottles at 35 °C in a New Brunswick Scientific Controlled Environment Incubator Shaker
model G-25 (shown in Figure 3.2) at 80 rpm, and to the keep bacteria and substrate in
suspension. The daily biogas production of all the batch bottles were monitored and
recorded daily with a BD 21G½ needle connected to a u-tube manometer, until the biogas
production rates were insignificant. The VFAs, TAN, and COD of the controls were
measured at the beginning of the experiment to provide a basis for comparison and
analysis, midway to the end of the experiment and at the end of the experiment. Biogas
composition (nitrogen, methane and carbon dioxide) was analyzed during and after the
end of test while pH was monitored every three days to ensure the pH values were in the
desired ranges. The composition of the biogas production of the batch bottles were also
analyzed in duplicates.

46
Figure 3.2: Reactors in New Brunswick Scientific Controlled Environment
Incubator Shaker
3.5.1 Analytical Equipment and Methods
Biogas composition was analyzed using thermal conductivity gas chromatograph (series
400, Gow-Mac Instrument Co., USA). The operating temperatures of the column,
detector, and injection port temperatures were 120⁰C 130⁰C, and 130⁰C, respectively.
The equipment has two sampling columns namely, column A and column B as shown in
Figure 3.3. Column A measures the percentages of N2, O2 and CH4while column B
measures the percentages N2, CH4 and CO2 in the biogas sample analyzed. Column B was
used for the analysis of the biogas composition. The carrier gas used for the separation of
the different biogas compositions was helium, operated at inflow rate of 30 mL/min.
Biogas samples (0.5 mL) were taken in duplicates and injected into the column through
the injection port.

47
Figure 3.3: Thermal conductivity gas chromatograph
(series 400, Gow-Mac Instrument Co., USA).
3.5.2 pH
Fisher Accumet model XL25 dual channel pH/ion meter (shown in Figure 3.4) equipped
with a glass electrode was used to measure the pH of all inoculums, substrates (OFMSW)
and batch samples. Before being used for measuring pH, electrode of the pH meter which
was stored in a pH 7 buffer solution was removed, rinsed with distilled water, and dried
with Kim wipes. Samples were thoroughly mixed in Pyrex beaker with the aid of a
magnetic stirring rod and placed on a Thermix stirrer model 120MR. Sample pH values
were then measured by inserting the electrode of the pH/ion meter into the samples. The
electrode was returned to the buffer solution, rinsed again with distilled water and dried
between each pH measurement.

48
Figure 3.4: Fisher Accumet model XL25 dual channel pH/ion meter
3.5.3 COD, TAN, VFA and Alkalinity
Hach TNT plus™ 822 high range reagent vials (Method 8000) were used to measure the
chemical oxygen demand (COD). Samples were first homogenized and well mixed to
form a slurry paste using the Brinkmann Polytron PT 3000 homogenizer shown in Figure
3.5. Samples taken for COD analyses were diluted using serial dilution method until
COD measured fell within the range of the 20 to 1500 mg/L COD high range reagent
vials used. Sample CODs were measured according to the procedure shown in Appendix
A 1. The digital reactor block RB200 was used to heat and digest the Hach TNT 822 test
vials for 2 hours as shown in Figure 3.6.

49
Figure 3.5: BrinkmannPolytron PT 3000 Homogenizer
Prior to the analyses of TAN, VFA and total alkalinity, samples were centrifuged in a
Thermoscientific Sorvall Legend T+ model centrifuge at 10,000 rpm for 30 minutes.
Once centrifuged, the supernatant was poured onto and filtered through filters with
nominal pore size of 0.45 µm filters, using a Fisher Scientific pump (Wilkinson, 2011).
TAN was measured with the use of TNT plus™ 832 reagent vials (Method 10205, Hach,
USA). Total alkalinity determination was carried out with using TNTplus™870 reagent
vials with alkalinity measuring range of 25 to 400 mg/L CaCO3 (Method 10239, Hach
USA). VFA was measured as acetic acids using TNT plus™ 872 with measuring range of
50 to 2,500 mg/L Acetic Acid. The concentrations of the COD, TAN, VFA and total
alkalinity were measured using the UV-VIS spectrophotometer shown in Figure 3.7.

50
Figure 3.6: RB200: Digital Reactor Block
Figure 3.7: UV-VIS Spectrophotometer

51
3.5.4 Total and Volatile Solids
The analysis of the VS and TS was carried out using the Standard Method 2540G. Prior
to TS and VS analyses, the aluminium weighing pans used were placed in a Precision
mechanical convection oven model 23 maintained at 105 degrees Celsius. The pans were
placed in desiccators to cool completely for about 10 minutes (Wilkinson, 2011). The
mass of each aluminium weighing pan was measured on a balance and the mass was
recorded as (A). Each thoroughly mixed sample was poured into the aluminium weighing
pan and the combined mass of the aluminium weighing pan and the sample was recorded
as (B). The aluminium weighing pan containing the sample was heated in Precision
mechanical convection oven at 105 oC for 24 hours. After drying, the sample was placed
in a desiccator for 1 hour. After 1 hour, the samples were weighed and the new mass (C)
was recorded. After being weighed, the oven-dried samples were placed in a muffle
furnace operated at 550 oC and incinerated for 1 hour. After 1 hour, the samples were
placed in desiccators to cool for 1 hour. Finally, the mass of the incinerated sample was
weighed and recorded as (D). All samples were analyzed in duplicates. The TS and VS
were determined using following Equations (3) and (4) below:
% Total Solids (TS) =(𝐶 − 𝐴)
(𝐵 − 𝐴)∗ 100% … … … … … … … … Eq. (3)
% Volatile Solids (VS) =(𝐶 − 𝐷)
(𝐵 − 𝐴)∗ 100% … … … … … … … … Eq. (4)
where A = Mass of empty aluminium pan (g); B = mass of the aluminium weighing pan
plus sample (g); C = mass of the aluminium weighing pan plus sample after drying at 105
oC for 24 hours (g); D = mass of the aluminium weighing pan plus sample after
incineration at 550oC for 1 hour (g).
3.5.5 Biogas Measurement
In order to measure the daily biogas production, a BD 21G1½ needle connected to a U-
tube manometer (show in Appendix C) was inserted into each bottle to release the biogas.
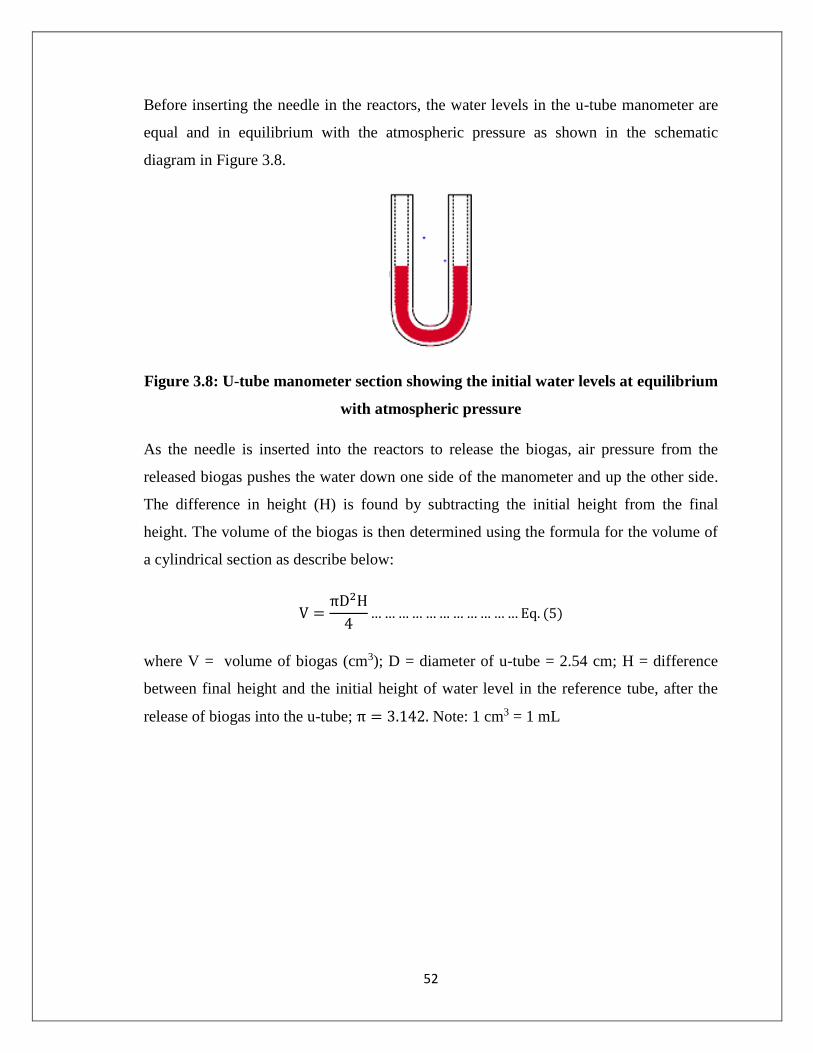
52
Before inserting the needle in the reactors, the water levels in the u-tube manometer are
equal and in equilibrium with the atmospheric pressure as shown in the schematic
diagram in Figure 3.8.
Figure 3.8: U-tube manometer section showing the initial water levels at equilibrium
with atmospheric pressure
As the needle is inserted into the reactors to release the biogas, air pressure from the
released biogas pushes the water down one side of the manometer and up the other side.
The difference in height (H) is found by subtracting the initial height from the final
height. The volume of the biogas is then determined using the formula for the volume of
a cylindrical section as describe below:
V =πD2H
4… … … … … … … … … … … Eq. (5)
where V = volume of biogas (cm3); D = diameter of u-tube = 2.54 cm; H = difference
between final height and the initial height of water level in the reference tube, after the
release of biogas into the u-tube; π = 3.142. Note: 1 cm3 = 1 mL
53
References
Ara, E. (2012). Anaerobic Co-digestion of Organic Fraction of Municipal Solid Waste
and Municipal Sludge With and Without Microwave Pre-treatment
(Masters Dissertation, University of Ottawa).
Hach (2015). COD Vials, Method 8000. http://www.hach.com/chemical-oxygen-
demand-cod-tntplus-vial-test-hr-20-1500-mg-l-
cod/product?id=7640193976&callback=qs
Hach (2015). Total Alkalinity Vials, Method 10239.http://www.hach.com/alkalinity-
total-tntplus-reagent-set/product?id=7640192443
Hach (2015). Volatile Acids Vials, Method 10240.http://www.hach.com/volatile-acids-
tntplus-reagent-set/product?id=7640196841&callback=qs
Hach, (2015). TAN Vials, Method 10205. http://www.hach.com/ammonia-tntplus-vial-
test-hr-2-47-mg-l-nh-sub-3-sub-n/product?id=7640209873
Nair, A., Sartaj, M., Kennedy, K., & Coelho, N. M. (2014). Enhancing biogas production
from anaerobic biodegradation of the organic fraction of municipal solid waste
through leachate blending and recirculation. Waste Management &
Research, 32(10), 939-946.
Wilkinson, A. (2011). Anaerobic Digestion of Corn Ethanol Thin Stillage for Biogas
Production in Batch and by Down-flow Fixed Film Reactor (M.A,Sc Thesis,
Dept. Civil Engineering. University of Ottawa).

54
Chapter 4
TECHNICAL PAPER I
The Toxicity Effects of Ammonia on Anaerobic Digestion of Synthetic Organic
Fraction of Municipal Solid Waste
Akinwumi Abiodun Akindele, Majid Sartaj
Abstract
The effect of ammonia on the anaerobic digestion of synthetic organic fraction of
municipal solid waste (OFMSW) was examined under different total ammonia nitrogen
(TAN) concentrations of 2500 mg/L, 5000 mg/L, 7500 mg/L, and 10,000 mg/L. The
study was conducted at pH 7.5, 8.0 and 8.5. Results obtained from this study confirmed
that ammonia is inhibitory to methanogenic activity. Reduction in Cumulative Biogas
Production (CBP) compared with control reactors was as much as 43 %, 64 % and 77 %
in reactors containing 7500 mg/L TAN at pH 7.5, pH 8.0 and pH 8.5. CBP reduced to 80-
85 % in reactors containing 10,000 mg/L TAN across all the pH ranges examined. The
operating pH influenced the level of toxicity and the composition of TAN. At high pH
(i.e. 8.5), FAN component of TAN was about 26 % and was inhibitory to the
methanogens. Also, replacing 3g of digestate containing high TAN concentrations of
7500 mg/L and 10,000 mg/L with 3 g fresh enhanced the activity of the mesophilic
bacteria. Lastly, results also showed that mesophilic bacteria could be adapted to a TAN
concentration of about 5000 mg/L at pH 7.5 through gradual TAN loading.
Keywords: total ammonia nitrogen, free ammonia nitrogen, organic fraction of municipal
solid waste

55
4.1 Introduction
Municipal Solid Waste (MSW) generation rate has been increasing with increasing world
population and is therefore a global concern (Staley and Barlaz, 2009). It was reported
that global production of MSW is projected to reach 3 billion metric tonnes per year by
2025 (Ara et al. 2014). In the same vein, the annual global cost of waste disposal is
expected to increase from $ 205 billion to $ 375 billion (World Bank, 2015).
Anaerobic digestion (AD) is the most widely used process for the treatment of
wastewater containing high organic content and can be an acceptable alternative to the
current disposal strategies for organic fraction of MSW (OFMSW) (Ara et al, 2015). AD
as a sustainable process converts the organic matter present in MSW into energy resource
and reduces the volume of landfilled wastes (El Hadj et al., 2009). However, the AD
process is susceptible to influence of pH, sulphate reducing bacteria, temperature and
high ammonia concentration which accumulates during the process (Angelidaki and
Ahring, 1994; Hansen et al., 1999; Shanmugam and Horan 2009; Nair et al., 2014).
Ammonia is the by-product resulting from the AD of proteins present in OFMSW and it
has been reported as a major inhibitor of microbial activities during AD process (Jung et
al., 2004).
Ammonia exists in two forms as ionized ammonia or ammonium (NH4+ ) and
unionized ammonia or free ammonia (NH3). The combination of these two forms of
ammonia is expressed as total ammonia nitrogen (TAN). The percentages of these two
forms of ammonia in TAN vary with temperature and pH (Ding and Sartaj, 2015). Also,
previous research has shown that toxicity in aqueous solutions is mainly due to NH3 form
(Dong and Sartaj, 2015).
The inhibitory effects of ammonia on the AD of high and low organic matters at
various operating temperatures and pH values have been reported (Pfeffer, 1974: Braun
et al., 1981; Webb, & Hawkes 1985; Hashimoto, 1986; Blomgren et al., 1990; Angelidaki
& Ahring, 1993). Kayhanian (1994) studied the impact of high ammonia concentrations
on the biodegradation of the OFMSW using varying ammonia concentrations. It was
reported that an instant inhibition occurred at 1000 mg/L ammonia concentration,
followed by a 50% inhibition and a complete bioreactor failure occurring at 1500, and

56
2500 mg/L ammonia concentrations respectively. Using various ammonia concentrations
of 48.8, 73.8, 98.8, 148.8, 248.8, 448.8, and 848.8 mg/L, Sossa et al. (2004) studied the
inhibitory effects of ammonia on anaerobic film enriched by methylaminotrophic
methane producing Archaea. The authors reported that maximum methanogenic activity
occurred at 48.8 mg/L ammonia concentration. However, methanogenic activity was
significantly inhibited at 848.8 mg/L ammonia concentration.
When present in high concentration, ammonium can directly inhibit biogas
production during AD however; free ammonia nitrogen (FAN) has been reported as the
major inhibitor of AD process at high pH and temperature. This is because FAN has the
capability of penetrating through the cell membrane of bacteria (Sung & Liu 2003).
McCarty & McKinney (1991) reported that FAN was more responsible for AD process
inhibition than TAN. Bhattacharya and Parkin (1989) reported a threshold FAN
concentration of 55 ± 11 mg/L–NH3 while Braun et al., 1981 reported a slightly higher
FAN concentration threshold of 80 mg/L–NH3. Methanogenic activity was inhibited
when FAN concentration reached 150 mg/L–NH3 (McCarty and McKinney, 1991)
The two main groups of methanogens involved in AD are acetoclastic
methanogens and hydrogenotrophic methanogens, each accounting for 70% and 30% of
methane production respectively (Speece, 1983). Acetoclastic methanogens consume
acetate or acetic acids to produce methane while hydrogenotrophic methanogens
consume hydrogen and carbon dioxide to produce methane. Varying effects of FAN on
acetoclastic methanogens and hydrogenotrophic methanogens have been reported (Koster
& Lettinga, 1984; Wiegant & Zeeman, 1986; Angelidaki et al., 1993). The reason for the
various thresholds of inhibitory ammonia concentration reported can be attributed to the
various initial ammonia concentrations examined, process temperature, operating pH,
organic loading rate and acclimation of inoculums. While several studies have been
carried out to examine the inhibitory effects of ammonia on AD of wastewater, there is
only limited information about the inhibitory effects of ammonia on AD of OFMSW
(Yenigün and Demirel, 2013). This research was focused on the toxicity effects of
ammonia on AD of the OFMSW and research objectives include:

57
To examine the possible inhibitory effect(s) of different ammonia concentrations
on the mesophilic AD of the OFMSW, under different operating pH levels of 7.5,
8.0 and 8.5, at similar operating temperature of 35 oC.
To examine the possibility of reducing the inhibitory effect(s) of ammonia on AD
by acclimating the bacteria to high ammonia concentrations, through gradual
loading of influent ammonia concentrations.
To examine the possibility of running the reactors under the most severe ammonia
toxicity in the semi-continuous AD reactor by replacing the digestate containing
high ammonia concentration(s) with fresh substrate.
4.2 Materials and Methodology
This experimental study was carried out in three phases, the Biochemical Methane
Potential (BMP) with instantaneous addition of TAN (phase 1), the BMP with gradual
TAN loading (phase 2) and the semi-continuous batch reactors (phase 3). All tests were
carried using 500 mL Kimax® glass bottles capped with butyl rubber stoppers in
duplicates.
For each set of BMP arrangements (at pH of 7.5, 8.0 and 8.5 each) in phase 1,
mesophilic anaerobically digested inoculums volume of 120 mL, 30 g of synthetic
OFMSW, and various TAN concentrations ranging from 2,500, 5,000, 7,500 to 10,000
mg/L were added to the reactors. The total working volume of the mixture was brought to
300 mL by the addition of distilled water (DW). A total of 36 BMP bottles were set up
for this experiment, with the inoculums BMP bottles, control BMP bottles, and BMP
bottles with each TAN concentration set up in duplicates.
The second phase of the experiment was gradual TAN loading. In order to
examine whether the tolerance of the bacteria to high ammonia concentration would
improve by acclimating the microbes to high ammonia concentrations, TAN
concentration was increased gradually (at pH 7.5, 8.0 and 8.5), using the same reactor
contents as those of the phase 1. At the beginning, TAN concentration was raised to 1250
mg/L and further increased by 1250 mg/L weekly, until it reached 10,500 mg/L on the 8th
week. A total of 6 batch bottles were set up for this phase.

58
The third phase of the experiment was Semi-continuous mode. In order to
examine the possibility of operating under continuous mode and assessthe inhibitory
effect of ammonia on AD, batch reactors at pH values of 8.0 and 8.5 containing initial
TAN concentrations of 7500 mg/L and 10,000 mg/L were converted to semi-continuous
reactors at the end of the phase 1. The volume of digestate in these reactors was adjusted
to working volume of 200 mL. A hole was made in the stopper on each reactor; and was
used for feeding the reactor by attaching a 5-cm piece of tubing. To simulate a semi-
continuous reactor process, 3 g of the digestate containing high ammonia concentration(s)
was replaced with fresh substrate, at the end of every 4 days, 7 days and 15 days.
For all 3 phases the reactors were purged for about 2 minutes with nitrogen gas,
sealed with the rubber stoppers and a layer of silicone was added all around the
connecting areas between the glass and the stopper, ensure gas-tightness of the reactors.
Equal portions of NaHCO3 and KHCO3 were added as buffer. As circumstances required,
1N Hydrochloric Acid (1N HCl) solution and 5N Sodium Hydroxide (5N NaOH)
solution were used to adjust the pH to the desired value. The daily biogas production of
the inoculums BMP bottles was subtracted from the daily biogas production of the
control BMP bottles and from BMP bottles containing TAN concentrations of 2,500,
5,000, 7,500 to 10,000 mg/L when necessary.
The OFMSW used in this study was synthesized using food components that are
representative of a typical domestic kitchen and commercial kitchen food waste. The
percentages of the different components of the OFMSW had standard compositions of
protein, hydrocarbon, vegetable and fat in conformity with the Canadian Food Guide, as
shown in Table 4.1 (Ara, 2012). In order to obtain consistent results, each set of
simulated OFMSW was prepared weekly and the remaining modeled OFMSW was
frozen up at a temperature of -4 oC, to prevent the likelihood of any fermentation. The
carrots, cabbage, banana, and apple used were fresh. The ground beef was cooked for 30
mins while the rice and pasta were cooked differently for 15 minutes each. Prior to being
used, the OFMSW was thoroughly mixed and blended to form a slurry having a particle
size ranging from 1-2 mm, using a kitchen food processor.

59
Table 4.1: Configuration of the simulated OFMSW used
The inoculums used in this research was obtained from the effluent of the AD digester
used for the AD of sludge at the Robert O. Pickard Environmental Center (ROPEC),
Ottawa, Ontario, Canada. In order to keep the inoculums alive, the inoculums was kept in
suspension by agitation in a New Brunswick Scientific Controlled Environment Incubator
Shaker rotating at 86 revolutions per minute (rpm), at 35°C. Prior to being used for
experimental studies, the OFMSW and the inoculums were characterized as shown in
Table 4.2 for COD, Volatile Solids (VS), Alkalinity, and Total Solids (TS). All values are
averages of duplicate runs.
Table 4.2: Properties of inoculums and OFMSW
Properties COD
mg/L
pH TAN
mg/L
Alkalinity
as CaCo3
mg/L
VFAs
(Acetic
acid)
mg/L
Total
Solids
(TS)
(%)
Volatile
solids
(VS)
(%)
Organic
Solid
(VS/TS)
(%)
OFMSW 177,000 4.5 350 2,750 9600 16.62 15.90 96
Inoculums 11,050 6.9 876.5 14,600 7500 1.73 0.96 56
OFMSW Configuration
Composition Percentage
weight (%
w/w)
Carrot 11
Cooked rice 18
White cabbage 10
Cooked pasta 18
Banana 11
Dog food 11
Apple 11
Cooked ground beef 10
Total 100
60
4.2.1 Analytical Methods and Equipment
Hach TNT plus™ 822 high range reagent vials (Method 8000) were used to measure the
chemical oxygen demand (COD). Samples were first homogenized and well mixed to
form a slurry paste using the Brinkmann Polytron PT 3000 homogenizer before COD
concentrations were measured. TAN was measured using the salicylate method, with the
use of TNT plus™ 832 reagent vials (Method 10205, Hach, USA). Total alkalinity
determination was carried out according colorimetric method using TNT plus™ 870
reagent vials with alkalinity measuring range of 25 to 400 mg/L CaCO3 (Method 10239,
Hach USA). VFA was measured as acetic acids using TNT plus™ 872 with measuring
range of 50 to 2,500 mg/L Acetic Acid. Prior to the analyses of TAN, VFA and total
alkalinity, samples were centrifuged in a Thermoscientific Sorvall Legend T+ model
centrifuge at 10,000 rpm for 30 minutes. Once centrifuged, the supernatant was poured
onto and filtered through filters with nominal pore size of 0.45 µm filters using a Fisher
Scientific pump (Wilkinson, 2011).
The daily biogas production was monitored and recorded daily with a BD 21G½
needle connected to a u-tube manometer, until the biogas production rates were
insignificant. Biogas composition of the biogas produced was analyzed using thermal
conductivity gas chromatograph (series 400, Gow-Mac Instrument Co., USA). Fisher
Accumet model XL25 dual channel pH/ion meter equipped with a glass electrode was
used to measure the pH of all inoculums, substrates (OFMSW) and BMP samples. The
carrier gas used for the separation of the different biogas compositions was helium,
operated at inflow rate of 30 mL/min. Biogas samples (0.5 mL) were taken in duplicates
and injected into the column through the injection port. Spectrophotometer was used to
measure the COD, VFA, TAN, and Total Alkalinity concentrations.
4.3 Results and Discussions
The results of the various batch tests conducted showed that the TAN could have
significant inhibitory effects on the AD of the OFMSW. This is particularly observable in

61
the difference between the amount of biogas produced by the control reactors and
reactors containing various TAN concentrations of 2,500 mg/L, 5,000 mg/L, 7,500 mg/L,
and 10,000 mg/L under identical pH values of 7.5, 8.0 and 8.5, in phase 1 of the
experiment. Similar trends were also observed in phases 2 and 3.
Also, the results of the experimental studies conducted confirmed that pH plays a
major role on the severity of the inhibitory effect of TAN on the AD of the OFMSW.
However, the effect of pH was not very significant on control batch reactors. As
discussed earlier, the percentage of FAN in TAN varies with pH and temperature. Under
identical temperature and TAN concentrations and different pH levels, the FAN content
of TAN varied significantly and this had a resultant effect on the variation in the biogas
produced by batch reactors containing similar TAN concentrations.
Experimental studies on the effect of gradual TAN loading indicated that the
gradual increase of TAN allowed methanogenic bacteria to become acclimated to high
TAN concentrations as much as 5000 mg/L at pH 7.5. Lastly, results from semi-
continuous reactors indicated that replacing equal amount of digestate containing high
TAN concentration with equal amount of OFMSW fresh substrate enhanced the
performance of the reactors.
4.3.1 Phase 1 (SW)
4.3.1.1 The Effect of TAN at pH 7.5
Figure 4.1 shows the average of the cumulative biogas productions (CBP) from control
BMP reactors (CB-reactors) and reactors containing TAN concentrations of 2,500 mg/L,
5,000 mg/L, 7,500 mg/L, and 10,000 mg/L, under similar operating pH of 7.5. The results
of the study show that TAN inhibits methanogenic activity and the extent of waste
biodegradation even at the lowest TAN concentration studied, with increasing effect with
increasing TAN concentrations. On the first day of the experiment, BMP reactors
containing 7,500 mg/L and 10,000 mg/L had no biogas production. As seen in Figure 4.1,
CB-reactors produced CBP of 2843 mL while BMP reactors containing TAN

62
concentrations of 2,500 mg/L, 5,000 mg/L, 7,500 mg/L, and 10,000 mg/L produced 2627
mL, 2363 mL, 1616 mL, and 560 mL CBP respectively, within 62 days of incubation.
Figure 4.1: Biogas production from BMP reactors under different TAN
concentrations and similar operating pH of 7.5 (phase 1)
BMP reactors containing TAN concentrations of 2,500 mg/L, 5,000 mg/L, 7,500 mg/L,
and 10,000 mg/L had 7%, 17%, 43% and 80% reduction in CBP respectively, compared
with CB-reactors. Biogas composition analyses (shown in Figure 4.2) carried out during
day 30 of the incubation period showed that the percentage of methane in the biogas
produced reduced significantly as the concentration of TAN increased. This is consistent
with the study of Sawayama et al., (2004) and Strik et al., (2006).
0
500
1000
1500
2000
2500
3000
0 10 20 30 40 50 60 70
Cu
mu
lati
ve
Bio
gas
Pro
du
ctio
n (
mL
)
Time (days)Control Control + 2,500 mg/L TAN
Control + 5,000 mg/L TAN Control + 7500 mg/L TAN
Control + 10,000 mg/L TAN

63
Figure 4.2: biogas composition from BMP reactors under different TAN
concentrations and similar operating pH of 7.5 (phase 1)
It can be observed from Figure 4.2 that ammonia has inhibitory effect on methanogenic
bacteria, especially at higher TAN concentrations. Reactors containing 10,000 mg/L
TAN had the least methane percentage (6.9%). At the end of the incubation period of 62
days the biogas composition was also analyzed. Methane percentage had reduced to as
low as 0% in reactors containing 10,000 mg/L while nitrogen accounted for as much as
90%, indicating a complete methanogenic inhibition.
The analysis of the TAN concentrations in the reactors at the beginning of the
experiment, after 30 days and after 62 days is presented in Figure 4.3. For the CB-
reactors, the initial TAN concentration was 350 mg/L. It can be observed from Figure 4.3
that after 30 days and 62 days of incubation, the TAN concentrations in all the reactors
had increased.
ControlControl +
2500 mg/LTAN
Control +5000 mg/L
TAN
Control +7500 mg/L
TAN
Control +10000
mg/L TAN
Nirogen 2.1 1.2 4.1 1.6 7.2
Methane 72.3 67 64.5 41.5 6.9
Carbon-di-oxide 25.6 31.8 31.4 56.9 85.9
0
10
20
30
40
50
60
70
80
90
100
Bio
gas
Com
posi
tion
(%
)

64
Figure 4.3: TAN concentration at the beginning, mid-way and end of incubation
period, at operating pH of 7.5 (phase 1)
At the end of the incubation period, TAN concentration increased from 350 mg/L to 550
mg/L for CB reactors while for other reactors, TAN concentrations increased from 2500
mg/L to 2840mg/L, 5000 mg/L to 5400 mg/L, 7500 mg/L to 7820 mg/L, 10,000 mg/L to
10,350 mg/L. This increase can be attributed to the biodegradation of the proteins in the
waste mixture (Nair et al., 2014).
Figure 4.4 shows the analysis of the VFA at the beginning, midway and end of the
digestion period. The VFA was measured as acetic acid. The analysis of the VFA on day
30 showed that CB-reactors had a VFA concentration of 2810 mg/L while reactors
containing 2,500 mg/L, 5,000 mg/L, 7,500 mg/L and 10,000 mg/L of TAN had VFA
concentrations of 4298 mg/L, 5919 mg/L, 12,590 mg/L, and 13,190 mg/L respectively.
TAN (mg/L) at
Start
TAN (mg/L) at day
30
TAN (mg/L) at day
60
Control 350 550 600
Control + 2500 mg/L TAN 2500 2750 2840
Control + 5000 mg/L TAN 5000 5320 5400
Control + 7500 mg/L TAN 7500 7760 7820
Control + 10000 mg/L TAN 10000 10250 10350
0
2000
4000
6000
8000
10000
12000
TA
N (
mg
/L)
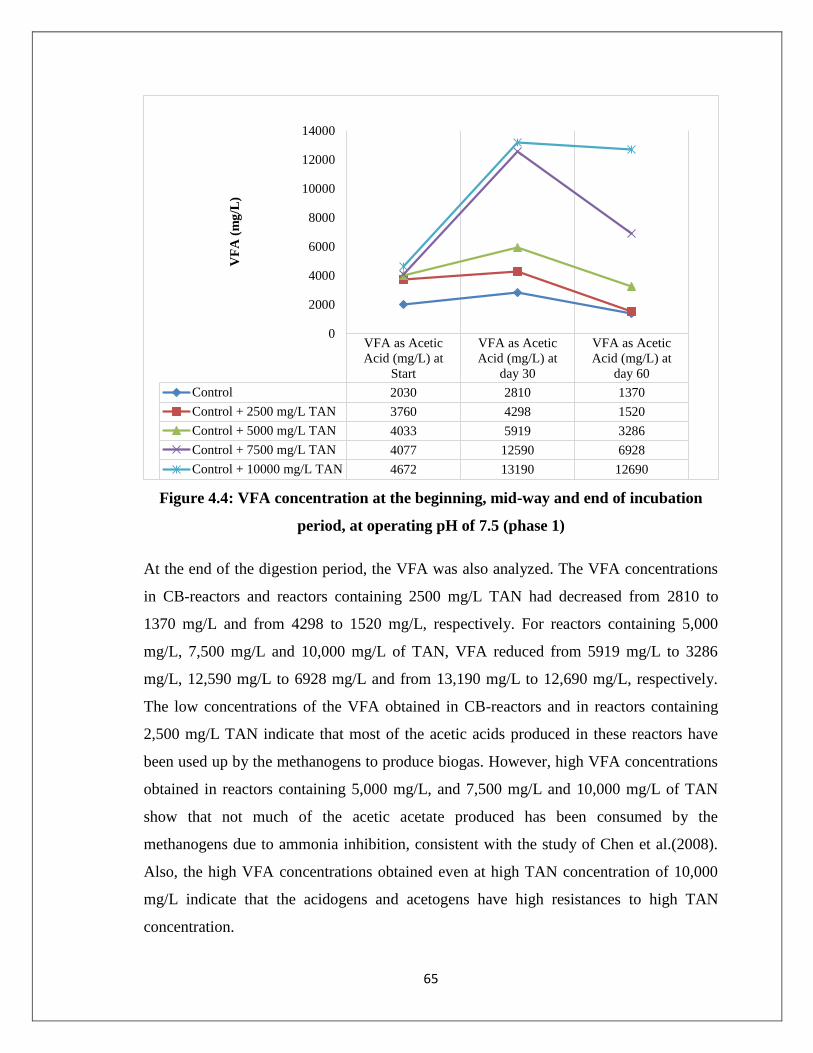
65
Figure 4.4: VFA concentration at the beginning, mid-way and end of incubation
period, at operating pH of 7.5 (phase 1)
At the end of the digestion period, the VFA was also analyzed. The VFA concentrations
in CB-reactors and reactors containing 2500 mg/L TAN had decreased from 2810 to
1370 mg/L and from 4298 to 1520 mg/L, respectively. For reactors containing 5,000
mg/L, 7,500 mg/L and 10,000 mg/L of TAN, VFA reduced from 5919 mg/L to 3286
mg/L, 12,590 mg/L to 6928 mg/L and from 13,190 mg/L to 12,690 mg/L, respectively.
The low concentrations of the VFA obtained in CB-reactors and in reactors containing
2,500 mg/L TAN indicate that most of the acetic acids produced in these reactors have
been used up by the methanogens to produce biogas. However, high VFA concentrations
obtained in reactors containing 5,000 mg/L, and 7,500 mg/L and 10,000 mg/L of TAN
show that not much of the acetic acetate produced has been consumed by the
methanogens due to ammonia inhibition, consistent with the study of Chen et al.(2008).
Also, the high VFA concentrations obtained even at high TAN concentration of 10,000
mg/L indicate that the acidogens and acetogens have high resistances to high TAN
concentration.
VFA as Acetic
Acid (mg/L) at
Start
VFA as Acetic
Acid (mg/L) at
day 30
VFA as Acetic
Acid (mg/L) at
day 60
Control 2030 2810 1370
Control + 2500 mg/L TAN 3760 4298 1520
Control + 5000 mg/L TAN 4033 5919 3286
Control + 7500 mg/L TAN 4077 12590 6928
Control + 10000 mg/L TAN 4672 13190 12690
0
2000
4000
6000
8000
10000
12000
14000
VF
A (
mg
/L)
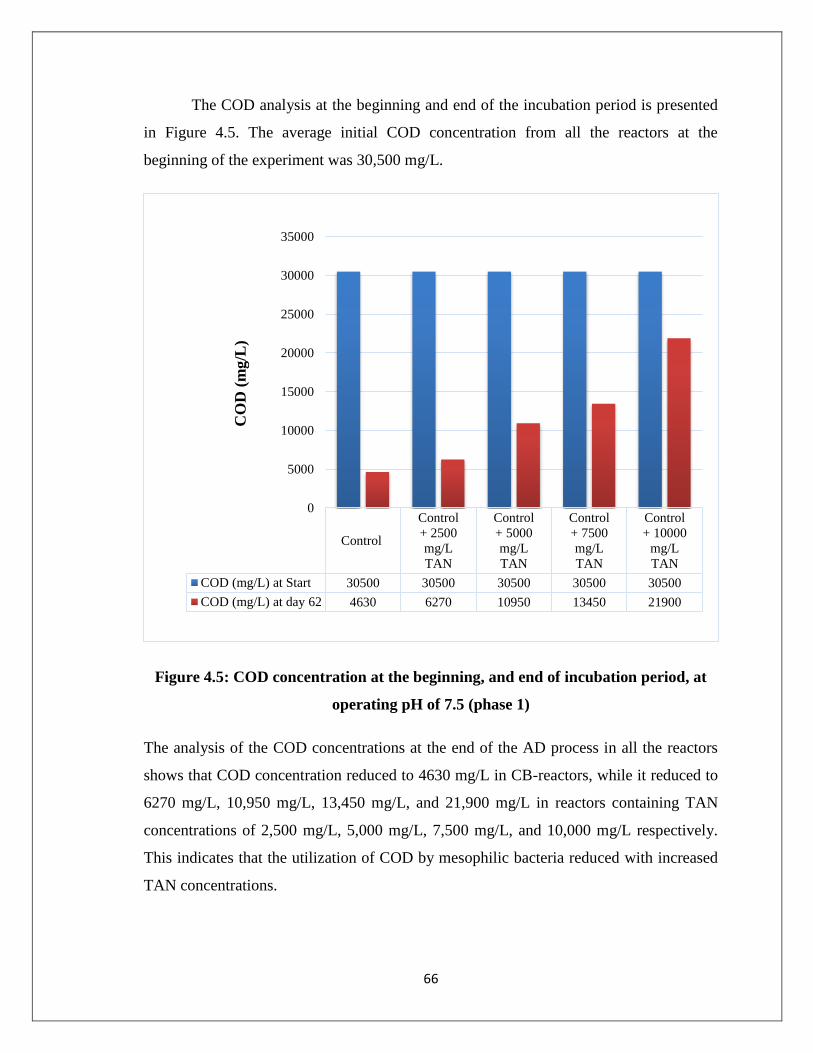
66
The COD analysis at the beginning and end of the incubation period is presented
in Figure 4.5. The average initial COD concentration from all the reactors at the
beginning of the experiment was 30,500 mg/L.
Figure 4.5: COD concentration at the beginning, and end of incubation period, at
operating pH of 7.5 (phase 1)
The analysis of the COD concentrations at the end of the AD process in all the reactors
shows that COD concentration reduced to 4630 mg/L in CB-reactors, while it reduced to
6270 mg/L, 10,950 mg/L, 13,450 mg/L, and 21,900 mg/L in reactors containing TAN
concentrations of 2,500 mg/L, 5,000 mg/L, 7,500 mg/L, and 10,000 mg/L respectively.
This indicates that the utilization of COD by mesophilic bacteria reduced with increased
TAN concentrations.
Control
Control
+ 2500
mg/L
TAN
Control
+ 5000
mg/L
TAN
Control
+ 7500
mg/L
TAN
Control
+ 10000
mg/L
TAN
COD (mg/L) at Start 30500 30500 30500 30500 30500
COD (mg/L) at day 62 4630 6270 10950 13450 21900
0
5000
10000
15000
20000
25000
30000
35000C
OD
(m
g/L
)

67
4.3.1.2 The Effect of TAN at pH 8.0
CBP at operating pH of 8.0 is presented in Figure 4.6. Similar to what was observed at
pH 7.5, biogas production reduced with increasing TAN concentration.
Figure 4.6: Biogas production from BMP reactors under different TAN
concentrations and similar operating pH of 8.0 (phase 1)
CB-reactors had CBP of 2651 mL of biogas compared with CBP of 2413 mL, 2184 mL,
960 mL, and 420 mL produced by reactors containing TAN concentration of 2,500 mg/L,
5,000 mg/L, 7,500 mg/L, and 10,000 mg/L, respectively. This implies that reactors
containing TAN concentrations of 2,500 mg/L, 5,000 mg/L, 7,500 mg/L, and 10,000
mg/L had 9%, 18%, 64% and 84% reduction in CBP respectively, compared with CB-
reactor.
The analysis of the biogas composition during the test is presented in Figure 4.7 below.
Similar to what was observed at pH 7.5, ammonia has inhibitory effect on methanogenic
bacteria.
0
500
1000
1500
2000
2500
3000
0 10 20 30 40 50 60 70Cu
mu
lati
ve
Bio
gas
Pro
du
ctio
n (
mL
)
Time (days)Control Control + 2,500 mg/L TAN
Control + 5,000 mg/L TAN Control + 7,500 mg/L TAN
Control + 10,000 mg/L TAN

68
Figure 4.7: Biogas composition from BMP reactors under different TAN
concentrations and similar operating pH of 8.0 (phase 1)
Also, the inhibitory effect was very significant especially at 7,500 mg/L and 10,000 mg/L
TAN as shown in Figure 4.7. At the end of the test, biogas analysis showed that the
methanogenic bacteria could not recover from the ammonia inhibition. Methane
percentage had reduced to as low as 0% in reactors containing 7,500 mg/L and 10,000
mg/L TAN, while nitrogen accounted for more than 90% of the biogas.
TAN analysis conducted during the test is presented in Figure 4.8. In similar trend with
pH 7.5, the TAN concentrations in all the reactors had increased after 30 days and at the
end of the 62 days of incubation.
ControlControl + 2500
mg/L TANControl + 5000
mg/L TANControl + 7500
mg/L TAN
Control +10000 mg/L
TAN
Nirogen 1.7 1.1 3.9 8 14.7
Methane 67 66.5 65.4 12.9 2.8
Carbon-di-oxide 31.3 32.5 30.7 79.1 82.5
0
10
20
30
40
50
60
70
80
90
Bio
gas
Com
posi
tion
(%
)
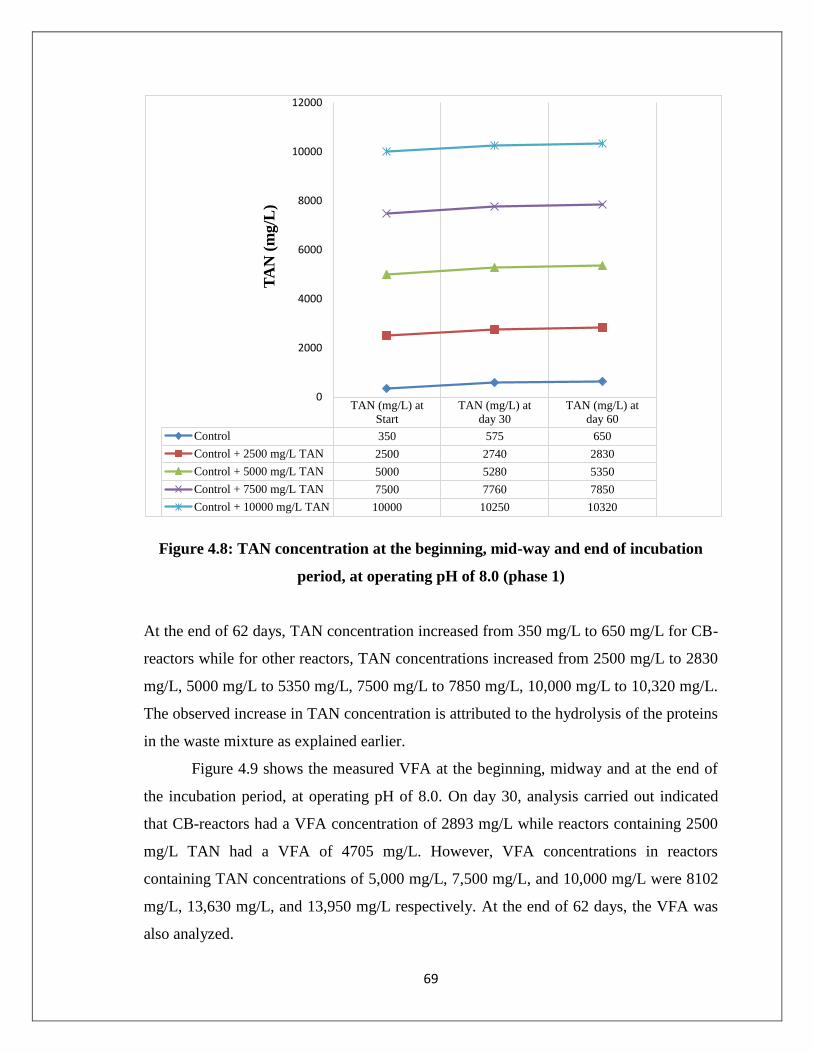
69
Figure 4.8: TAN concentration at the beginning, mid-way and end of incubation
period, at operating pH of 8.0 (phase 1)
At the end of 62 days, TAN concentration increased from 350 mg/L to 650 mg/L for CB-
reactors while for other reactors, TAN concentrations increased from 2500 mg/L to 2830
mg/L, 5000 mg/L to 5350 mg/L, 7500 mg/L to 7850 mg/L, 10,000 mg/L to 10,320 mg/L.
The observed increase in TAN concentration is attributed to the hydrolysis of the proteins
in the waste mixture as explained earlier.
Figure 4.9 shows the measured VFA at the beginning, midway and at the end of
the incubation period, at operating pH of 8.0. On day 30, analysis carried out indicated
that CB-reactors had a VFA concentration of 2893 mg/L while reactors containing 2500
mg/L TAN had a VFA of 4705 mg/L. However, VFA concentrations in reactors
containing TAN concentrations of 5,000 mg/L, 7,500 mg/L, and 10,000 mg/L were 8102
mg/L, 13,630 mg/L, and 13,950 mg/L respectively. At the end of 62 days, the VFA was
also analyzed.
TAN (mg/L) at
Start
TAN (mg/L) at
day 30
TAN (mg/L) at
day 60
Control 350 575 650
Control + 2500 mg/L TAN 2500 2740 2830
Control + 5000 mg/L TAN 5000 5280 5350
Control + 7500 mg/L TAN 7500 7760 7850
Control + 10000 mg/L TAN 10000 10250 10320
0
2000
4000
6000
8000
10000
12000
TA
N (
mg/L
)

70
Figure 4.9: VFA concentration at the beginning, mid-way and end of incubation
period, at operating pH of 8.0 (phase 1)
The VFA concentrations in CB-reactors and reactors containing 2500 mg/L TAN had
decreased from 2893 to 1380 mg/L and from 4705 to 1520 mg/L, respectively. For
reactors containing 5,000 mg/L, 7,500 mg/L and 10,000 mg/L of TAN, VFA reduced
from 8102 mg/L to 3975 mg/L, 13,630 mg/L to 10,600 mg/L and from 13,950 mg/L to
13,530 mg/L, respectively. As explained earlier, the low concentrations of the VFA
obtained in CB-reactors and in reactors containing 2,500 mg/L TAN indicate that most of
the acetic acids produced in these reactors have been used up by the methanogens to
produce biogas. However, due to ammonia inhibition, not much of the VFA produced
was consumed by the methanogens in reactors containing 5,000 mg/L, and 7,500 mg/L
and 10,000 mg/L of TAN.
The COD analysis at the beginning and at the end of 62 days is presented in
Figure 4.10. At the end of 62 days, the CB-reactors had COD concentration of 5040 mg/L
while reactors containing 2500 mg/L TAN had a COD of 6830 mg/L.
VFA as Acetic
Acid (mg/L) at
Start
VFA as Acetic
Acid (mg/L) at day
30
VFA as Acetic
Acid (mg/L) at day
60
Control 2120 2893 1380
Control + 2500 mg/L TAN 3900 4705 1600
Control + 5000 mg/L TAN 4450 8102 3975
Control + 7500 mg/L TAN 4676 13630 10600
Control + 10000 mg/L TAN 4965 13950 13530
0
2000
4000
6000
8000
10000
12000
14000
16000
VF
A (
mg
/L)
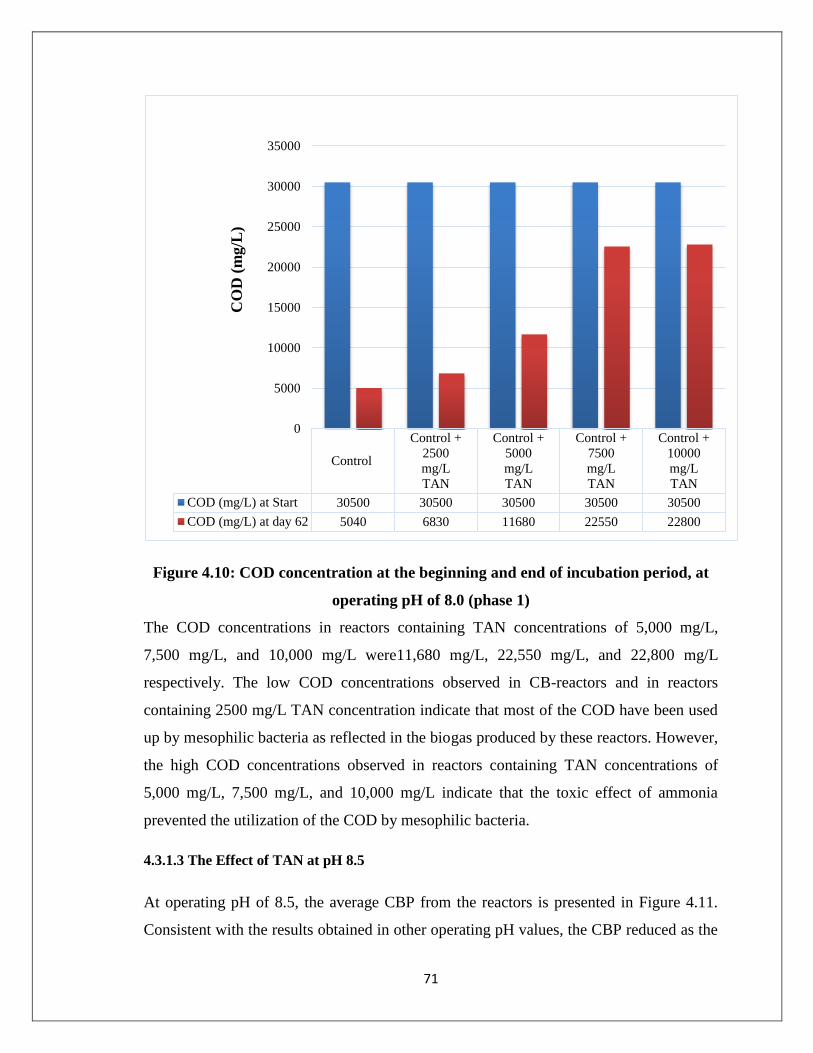
71
Figure 4.10: COD concentration at the beginning and end of incubation period, at
operating pH of 8.0 (phase 1)
The COD concentrations in reactors containing TAN concentrations of 5,000 mg/L,
7,500 mg/L, and 10,000 mg/L were11,680 mg/L, 22,550 mg/L, and 22,800 mg/L
respectively. The low COD concentrations observed in CB-reactors and in reactors
containing 2500 mg/L TAN concentration indicate that most of the COD have been used
up by mesophilic bacteria as reflected in the biogas produced by these reactors. However,
the high COD concentrations observed in reactors containing TAN concentrations of
5,000 mg/L, 7,500 mg/L, and 10,000 mg/L indicate that the toxic effect of ammonia
prevented the utilization of the COD by mesophilic bacteria.
4.3.1.3 The Effect of TAN at pH 8.5
At operating pH of 8.5, the average CBP from the reactors is presented in Figure 4.11.
Consistent with the results obtained in other operating pH values, the CBP reduced as the
Control
Control +
2500
mg/L
TAN
Control +
5000
mg/L
TAN
Control +
7500
mg/L
TAN
Control +
10000
mg/L
TAN
COD (mg/L) at Start 30500 30500 30500 30500 30500
COD (mg/L) at day 62 5040 6830 11680 22550 22800
0
5000
10000
15000
20000
25000
30000
35000
CO
D (
mg
/L)

72
concentration of TAN increased. On the first day of the experiment, while CB-reactors
produced 258 mL of biogas, there was no biogas production from reactors containing
2,500, 5,000 mg/L, 7,500 mg/L and 10,000 mg/L TAN.
Figure 4.11: Biogas production from BMP reactors under different TAN
concentrations and similar operating pH of 8.5 (phase 1)
While CB-reactors had CBP of 2459 mL of at the end of 62 days of incubation, the CBPs
from reactors containing TAN concentrations of 2,500 mg/L, 5,000 mg/L, 7,500 mg/L,
and 10,000 mg/L were 2142 mL, 1724 mL, 579 mL, and 365 mL, respectively.
Biogas composition analysis on day 30 at pH 8.5 is presented in Figure 4.12. Also as in
previous operating pH values, the percentage of methane in the biogas produced reduced
as the concentration of TAN increased.
0
500
1000
1500
2000
2500
3000
0 10 20 30 40 50 60 70
Cu
mu
lati
ve
Bio
gas
Pro
du
ctio
m (
mL
)
Time (days)Control Control + 2,500 mg/L TANControl + 5,000 mg/L TAN Control + 7500 mg/L TANControl + 10,000 mg/L TAN
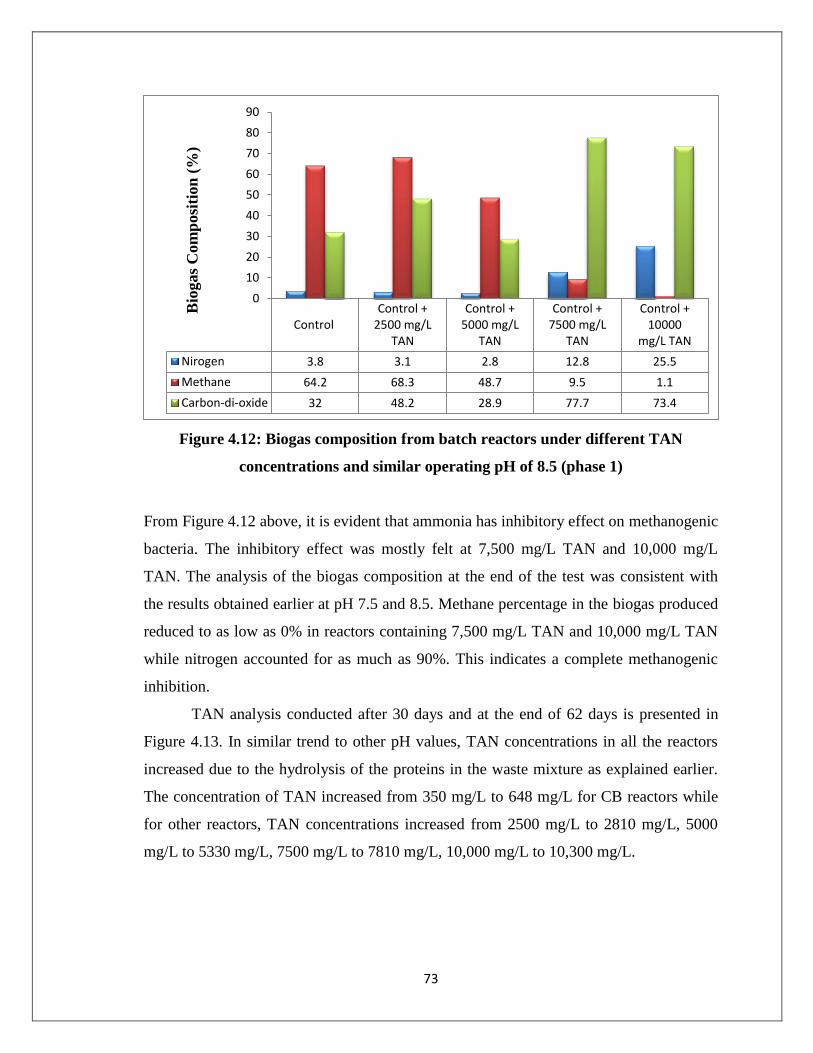
73
Figure 4.12: Biogas composition from batch reactors under different TAN
concentrations and similar operating pH of 8.5 (phase 1)
From Figure 4.12 above, it is evident that ammonia has inhibitory effect on methanogenic
bacteria. The inhibitory effect was mostly felt at 7,500 mg/L TAN and 10,000 mg/L
TAN. The analysis of the biogas composition at the end of the test was consistent with
the results obtained earlier at pH 7.5 and 8.5. Methane percentage in the biogas produced
reduced to as low as 0% in reactors containing 7,500 mg/L TAN and 10,000 mg/L TAN
while nitrogen accounted for as much as 90%. This indicates a complete methanogenic
inhibition.
TAN analysis conducted after 30 days and at the end of 62 days is presented in
Figure 4.13. In similar trend to other pH values, TAN concentrations in all the reactors
increased due to the hydrolysis of the proteins in the waste mixture as explained earlier.
The concentration of TAN increased from 350 mg/L to 648 mg/L for CB reactors while
for other reactors, TAN concentrations increased from 2500 mg/L to 2810 mg/L, 5000
mg/L to 5330 mg/L, 7500 mg/L to 7810 mg/L, 10,000 mg/L to 10,300 mg/L.
ControlControl +
2500 mg/LTAN
Control +5000 mg/L
TAN
Control +7500 mg/L
TAN
Control +10000
mg/L TAN
Nirogen 3.8 3.1 2.8 12.8 25.5
Methane 64.2 68.3 48.7 9.5 1.1
Carbon-di-oxide 32 48.2 28.9 77.7 73.4
0
10
20
30
40
50
60
70
80
90
Bio
gas
Com
posi
tion
(%
)

74
Figure 4.13: TAN concentration at the beginning, midway and end of incubation
period, at operating pH of 8.5 (phase 1)
The VFA analysis of the digestate in the reactors midway to and the end of the
AD period is presented in Figure 4.14. At the end of 62 days, CB-reactors had a VFA
concentration of 1420 mg/L while VFA concentration was 4175 mg/L in reactors
containing 2500 mg/L TAN. The concentration of VFA in reactors containing TAN
concentrations of 5,000 mg/L, 7,500 mg/L, and 10,000 mg/L was 6431 mg/L, 12,616
mg/L, and 13,787 mg/L respectively. The high TAN concentration in other reactors was
very toxic to methanogenic bacteria, preventing the uptake of VFA for biogas production.
TAN (mg/L) at
Start
TAN (mg/L) at day
30
TAN (mg/L) at day
60
Control 352 560 648
Control + 2500 mg/L TAN 2500 2760 2810
Control + 5000 mg/L TAN 5000 5280 5330
Control + 7500 mg/L TAN 7500 7800 7810
Control + 10000 mg/L TAN 10000 10280 10300
0
2000
4000
6000
8000
10000
12000
TA
N (
mg/L
)
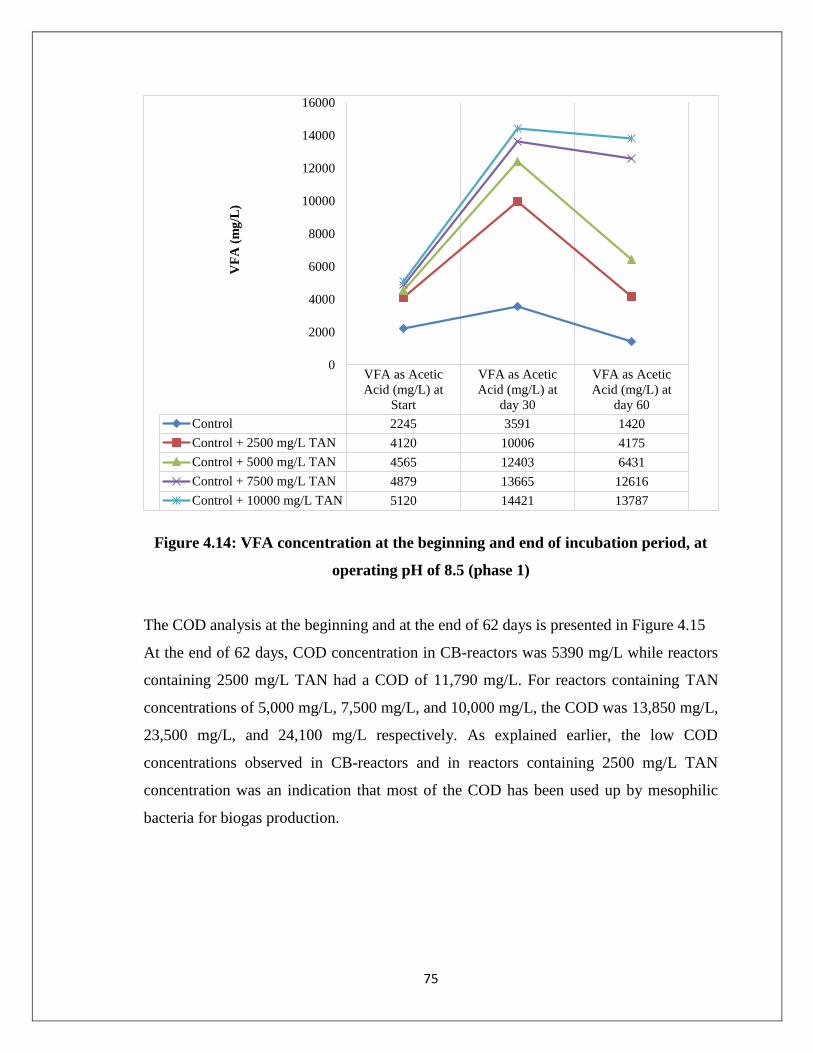
75
Figure 4.14: VFA concentration at the beginning and end of incubation period, at
operating pH of 8.5 (phase 1)
The COD analysis at the beginning and at the end of 62 days is presented in Figure 4.15
At the end of 62 days, COD concentration in CB-reactors was 5390 mg/L while reactors
containing 2500 mg/L TAN had a COD of 11,790 mg/L. For reactors containing TAN
concentrations of 5,000 mg/L, 7,500 mg/L, and 10,000 mg/L, the COD was 13,850 mg/L,
23,500 mg/L, and 24,100 mg/L respectively. As explained earlier, the low COD
concentrations observed in CB-reactors and in reactors containing 2500 mg/L TAN
concentration was an indication that most of the COD has been used up by mesophilic
bacteria for biogas production.
VFA as Acetic
Acid (mg/L) at
Start
VFA as Acetic
Acid (mg/L) at
day 30
VFA as Acetic
Acid (mg/L) at
day 60
Control 2245 3591 1420
Control + 2500 mg/L TAN 4120 10006 4175
Control + 5000 mg/L TAN 4565 12403 6431
Control + 7500 mg/L TAN 4879 13665 12616
Control + 10000 mg/L TAN 5120 14421 13787
0
2000
4000
6000
8000
10000
12000
14000
16000
VF
A (
mg
/L)

76
Figure 4.15: TAN concentration at the beginning and end of incubation period, at
operating pH of 8.5 (phase 1)
However, for other reactors containing high TAN concentrations of 5,000 mg/L, 7,500
mg/L, and 10,000 mg/L, COD concentration was very high, indicating that the toxic
effect of ammonia prevented the utilization of the COD by mesophilic bacteria.
The results of the alkalinity analyses conducted at all the pH values used is provided in
Table 4.3 and Figure4.16. The results show that alkalinity increases with increase in TAN
concentrations and pH. Alkalinity concentration reached as much as 37,790 mg/L in
reactors containing 10,000 mg/L TAN at pH 8.5.
Control
Control
+ 2500
mg/L
TAN
Control
+ 5000
mg/L
TAN
Control
+ 7500
mg/L
TAN
Control
+ 10000
mg/L
TAN
COD (mg/L) at Start 30500 30500 30500 30500 30500
COD (mg/L) at day 62 5390 11790 13850 23500 24100
0
5000
10000
15000
20000
25000
30000
35000
CO
D (
mg
/L)
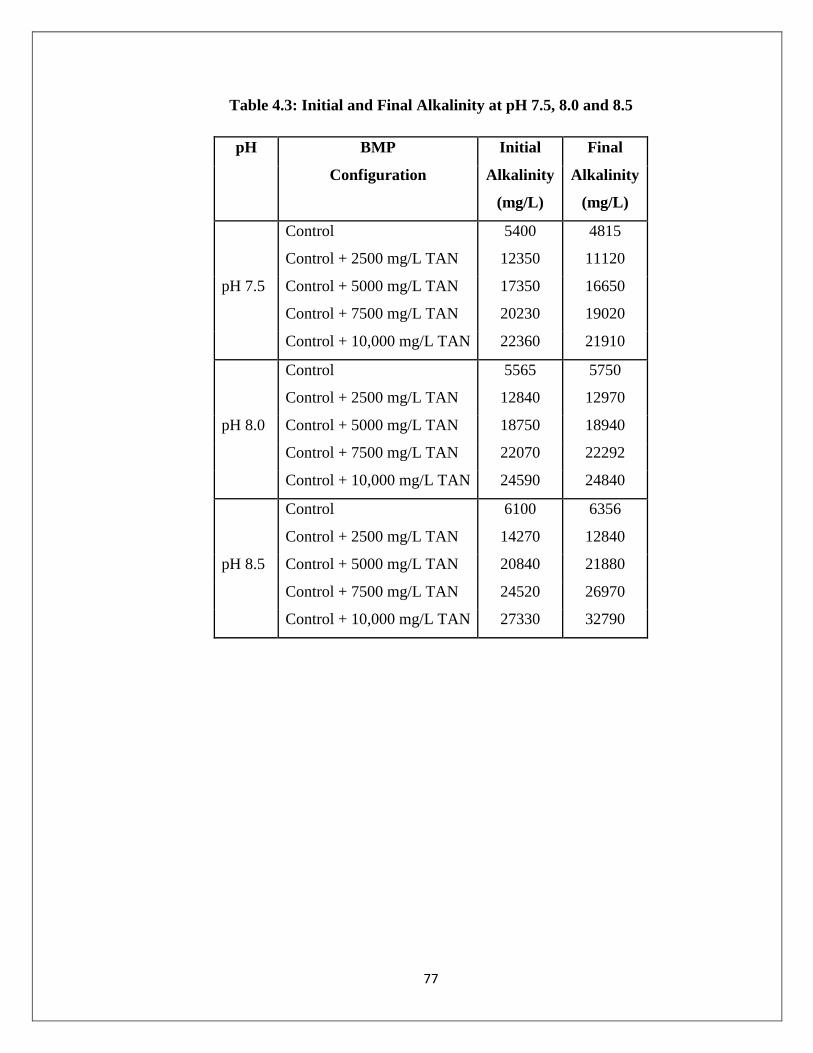
77
Table 4.3: Initial and Final Alkalinity at pH 7.5, 8.0 and 8.5
pH BMP
Configuration
Initial
Alkalinity
(mg/L)
Final
Alkalinity
(mg/L)
Control 5400 4815
Control + 2500 mg/L TAN 12350 11120
pH 7.5 Control + 5000 mg/L TAN 17350 16650
Control + 7500 mg/L TAN 20230 19020
Control + 10,000 mg/L TAN 22360 21910
Control 5565 5750
Control + 2500 mg/L TAN 12840 12970
pH 8.0 Control + 5000 mg/L TAN 18750 18940
Control + 7500 mg/L TAN 22070 22292
Control + 10,000 mg/L TAN 24590 24840
Control 6100 6356
Control + 2500 mg/L TAN 14270 12840
pH 8.5 Control + 5000 mg/L TAN 20840 21880
Control + 7500 mg/L TAN 24520 26970
Control + 10,000 mg/L TAN 27330 32790
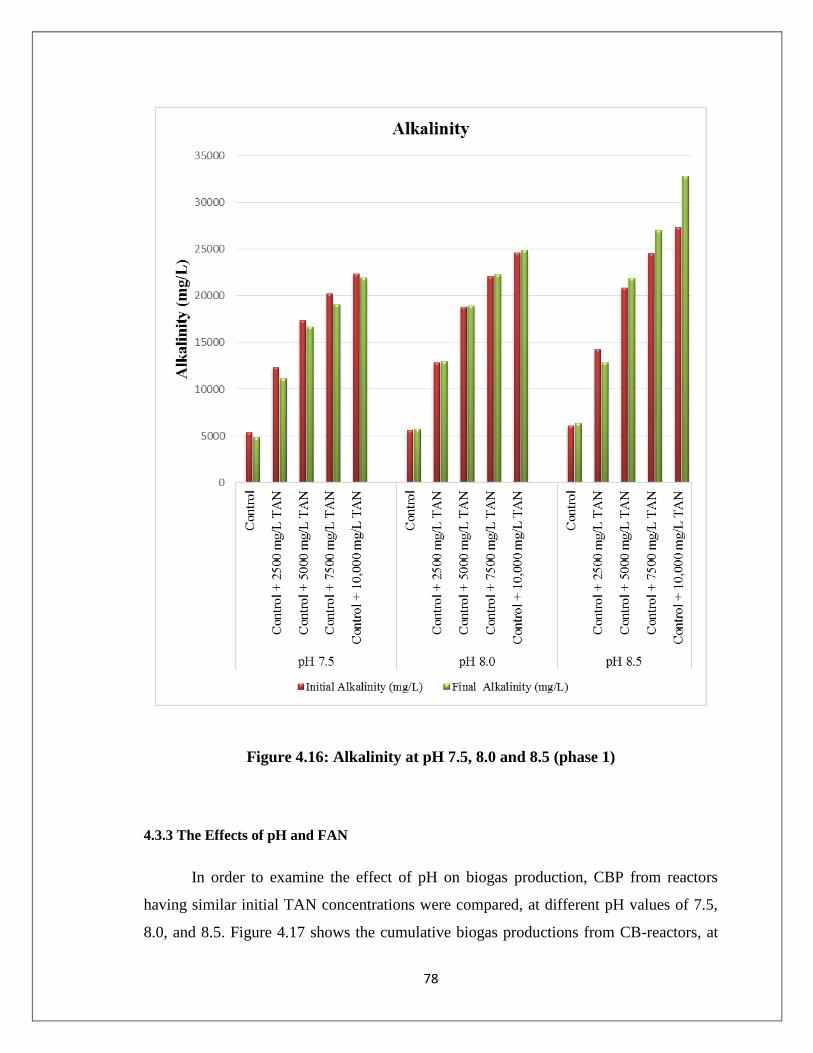
78
Figure 4.16: Alkalinity at pH 7.5, 8.0 and 8.5 (phase 1)
4.3.3 The Effects of pH and FAN
In order to examine the effect of pH on biogas production, CBP from reactors
having similar initial TAN concentrations were compared, at different pH values of 7.5,
8.0, and 8.5. Figure 4.17 shows the cumulative biogas productions from CB-reactors, at

79
pH values of 7.5, 8.0 and 8.5. The cumulative biogas production at pH values of 7.5, 8.0
and 8.5 was 2835 mL, 2651 mL, and 2459 mL respectively. CB-reactors at pH 8.0 and
8.5 had 7 %, and 13 % lesser than CB-reactors at pH 7.5. This shows that the operating
pH had a significant influence on methanogenic activity. This is understandable because
Mohan et al. (2008) reported that methanogenic bacteria require a favourable pH range of
6.5-7.5.
Figure 4.17: Cumulative biogas production from CB-reactors under different pH
values and similar initial TAN concentration of 350 mg/L (phase 1)
Another possible reason for the difference in CBP is the difference in composition of the
FAN in TAN concentrations at the different operating pH values used in this study. The
percentage composition of FAN in TAN at pH from 7.5-8.5 under mesophilic
temperature of 35 oC is shown in Figure 4.18 and in Table 4.4. The initial TAN
0
500
1000
1500
2000
2500
3000
0 10 20 30 40 50 60 70
Com
para
tiv
e C
um
ula
tive
Bio
ga
s P
rod
uct
ion
(m
L)
Time (Day)
pH 7.5 pH 8.0 pH 8.5

80
concentration of 350 mg/L TAN in CB-reactors increased to approximately 633 mg/L on
day 62, an average of the TAN concentrations at of all the pH values. At the end of the
test, the FAN concentrations were 20 mg/L, 69 mg/L and 163 mg/L at pH 7.5, 8.0 and 8.5
respectively. However, this cannot be ascertained because the TAN concentration and the
FAN component of the CB-reactors are not very significant.
Figure 4.18: Percentage of FAN in TAN as a function of pH (7.5 – 8.5) and
temperature (35 oC)
0
5
10
15
20
25
30
7.40 7.60 7.80 8.00 8.20 8.40 8.60
% o
f F
AN
in
TA
N
pH

81
Table 4.4: Percentage of FAN in TAN
Initial
TAN
(mg/L)
pH Initial
FAN
(mg/L)
Initial
% of FAN
in TAN
Final
TAN
(mg/L)
pH Final
FAN
(mg/L)
Final
% of FAN
in TAN
350 7.50 11 3 600 7.52 20 3
2500 7.50 85 3 2840 7.51 92 3
5000 7.50 170 3 5400 7.48 192 4
7500 7.50 255 3 7820 7.50 297 4
10000 7.50 340 3 10350 7.51 344 3
350 8.00 35 10 650 7.98 69 11
2500 8.00 250 10 2830 8.01 302 11
5000 8.00 501 10 5350 7.99 606 11
7500 8.00 751 10 7850 8.02 770 10
10000 8.00 1001 10 10320 8.00 1077 10
350 8.50 91 26 648 8.50 163 25
2500 8.50 651 26 2810 8.51 707 25
5000 8.50 1302 26 5330 8.48 1387 26
7500 8.50 1952 26 7810 8.50 2068 26
10000 8.50 2603 26 10300 8.47 2774 27
The comparative cumulative biogas production from reactors containing 2500
mg/L TAN at pH 7.5, 8.0 and 8.5 is presented in Figure 4.19. CBP at pH 7.5 was 2627
mL while at pH 8.0 and 8.5, 2413 mL, and 2142 mL were produced respectively. The
difference is biogas production is attributed to the difference in FAN concentrations. This
implies 8 %, and 19 % lesser than reactors operating at pH 7.5. The reason for the
difference in CBP can be linked with the difference in FAN composition at pH 7.5, 8.0
and 8.5.
As shown in Table 4.4 above, FAN composition of TAN was 3 % at 7.5 while at pH 8.0
and 8.5, it increased to 11 % and 22 % respectively. This shows that FAN concentration
was responsible for the difference in CBP. The FAN concentrations were calculated

82
using the Hansen et al., (1998) equation (Equation (2)), based on the assumption that
FAN escaping the system as nitrogen gas is negligible.
Figure 4.19: Cumulative biogas production under different pH values and similar
initial TAN concentration of 2500 mg/L (phase 1)
Figure 4.20 shows the CBP from reactors containing 5000 mg/L TAN at pH 7.5,
8.0 and 8.5. As explained earlier, the difference in FAN concentrations at the various pH
used was responsible for the observed difference in biogas production. A shown in Table
4.4above, FAN composition of TAN varied as much as 4% at 7.5, 11 % at pH 8.0 and 26
% at pH 8.5. This shows that FAN concentration was responsible for the difference in
CBP.
0
500
1000
1500
2000
2500
3000
0 10 20 30 40 50 60 70
Cu
mu
lati
ve
Bio
gas
Pro
du
ctio
n (
mL
)
Time (Day)
pH 7.5 pH 8.0 pH 8.5

83
Figure 4.20: Cumulative biogas production from batch reactors under different pH
values and similar TAN concentrations of 5000 mg/L
Similar trends were observed in reactors having initial TAN concentrations of
7500 mg/L and 10,000 mg/L as shown in Figures 4.21 and 4.22. For reactors containing
7500 mg/L and operated at pH 8.0 and 8.5, CBP was 40 %, and 64 % lesser than the CBP
from reactors operated at pH 7.5. Also, at 10,000 mg/L TAN, CBP was 25%, and 34 %
lesser than the CBP from reactors operated at pH 7.5.The percentage of FAN in TAN
varied as much as 4 % at 7.5, 11 % at pH 8.0 and 26 % at pH 8.5 as previously discussed.
The difference in CBP is attributable to the difference in the percentage of FAN in TAN
at each pH value.
0
500
1000
1500
2000
2500
3000
0 10 20 30 40 50 60 70
Cu
mu
lati
ve
Bio
gas
Pro
du
ctio
n (
mL
)
Time (Day)
pH 7.5 pH 8.0 pH 8.5

84
Figure 4.21: Cumulative biogas production from reactors at different pH values and
similar TAN concentration of 7,500 mg/L (Phase 1)
Figure 4.22: Cumulative biogas production from reactors at different pH values
and similar TAN concentration of 10,000 mg/L (Phase 1)
0
500
1000
1500
2000
2500
3000
0 10 20 30 40 50 60 70Cu
mu
lati
ve
Bio
gas
Pro
du
ctio
n (
mL
)
Time (Day)
pH 7.5 pH 8.0 pH 8.5
0
500
1000
1500
2000
2500
3000
0 10 20 30 40 50 60 70
Cu
mu
lati
ve
Bio
gas
Pro
du
ctio
n (
mL
)
Time (Day)
pH 7.5 pH 8.0 pH 8.5

85
Table 4.5 shows the volume of methane produced per gram of COD degraded. The
volume of methane produced per gram of COD degraded (CODd) decreased as the TAN
and FAN concentrations in the systems increased, across all the pH levels examined
throughout the research. For CB-reactors and reactors containing TAN concentrations up
to 5000 mg/L, although the volumes of methane produced per of COD obtained in this
research are lesser than the standard 350 mL CH4 /g COD, the volume of methane
produced per gram of COD still fall in the ranges reported in the literature (Alqaralleh et
al., 2015). Methane produced per gram of CODd was 264 mL CH4 /g CODd for CB-
reactors at pH 7.5 while reactors containing TAN concentrations of 2500 mg/L, 5000
mg/L and 7500 mg/L and 10,000 mg/L had 227 mL CH4 /g CODd, 196 mL CH4 /g CODd,
86 mL CH4 /g CODd, and 5 mL CH4 /g CODd. Similar trends were observed in other pH
levels as shown in Table 4.5. Across all pH levels, reactors containing TAN
concentrations of 7500 mg/L and 10,000 mg/L had the least methane gas produced per
gram of CODd.
Table 4.5: Methane production per gram of COD degraded
BMP pH 7.5 pH 8.0 pH 8.5
mL CH4 /
g CODd
mL CH4 /
g CODd
mL CH4 /
g CODd
Control 264 229 203
Control + 2500 mg/L TAN 227 207 188
Control + 5000 mg/L TAN 196 184 108
Control + 7500 mg/L TAN 86 16 7
Control + 10000 mg/L TAN 5 2 1
4.3.4 Phase 2 - Gradual TAN Loading Phase - SW
The CBP under gradual TAN loading is presented below in Figure 4.23. The inhibitory
effect of TAN on biogas production was insignificant in the early days. The average daily
biogas production (DBP) from the reactors when TAN loading was 1250 mg/L in the first
week were 118 mL/d, 96 mL/d and 77 mL/d at pH 7.5, 8.0 and 8.5 respectively. This

86
corresponded to a CBP of 825 mL, 675 mL and 540 mL at pH 7.5, 8.0 and 8.5
respectively at the end of week one.
Figure 4.23: Cumulative biogas production under gradual TAN loading
up to 10,000 mg/L (Phase 2)
This shows that TAN concentration of 1250 mg/L is not significantly inhibitory to
methanogenic activity. By the end of the fourth week, with gradual TAN concentration
reaching 5305 mg/L, average DBP was 41 mL/d, 9 mL/d and 5 mL/d at pH 7.5, 8.0 and
8.5 respectively. In the fifth week (TAN concentration was 6650 mg/L) and until TAN
concentration reached 10,500 mg/L after the 8th week, daily biogas production reduced
below 1% of the CBP. This suggests that methanogenic bacteria could not adapt to TAN
concentration beyond 5000-6000 mg/L, in the case of this study.
A comparison was made between CBP under sudden TAN loading of 10,000 mg/L and
gradual TAN loadings, at each operating pH value of 7.5, 8.0, and 8.5 as shown in
Figures 4.24 (a), (b) and (c). Under gradual TAN loading, a CBP of 1761 mL was
produced at pH 7.5, with 943 mL and 682 mL produced at pH 8.0 and 8.5 respectively,
0
500
1000
1500
2000
2500
3000
0 10 20 30 40 50 60 70
Cu
mu
ltiv
e B
iogas
Pro
du
ctio
m (
mL
)
Time (Days)
pH 7.5 pH 8.0 pH 8.5
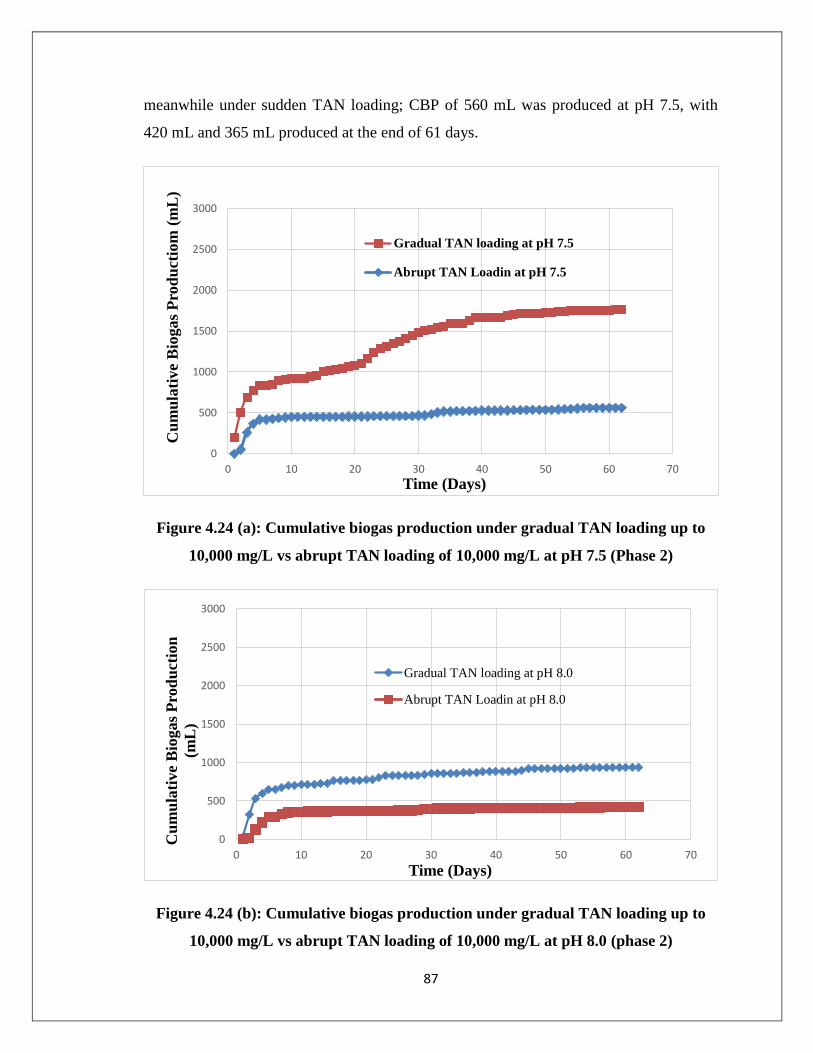
87
meanwhile under sudden TAN loading; CBP of 560 mL was produced at pH 7.5, with
420 mL and 365 mL produced at the end of 61 days.
Figure 4.24 (a): Cumulative biogas production under gradual TAN loading up to
10,000 mg/L vs abrupt TAN loading of 10,000 mg/L at pH 7.5 (Phase 2)
Figure 4.24 (b): Cumulative biogas production under gradual TAN loading up to
10,000 mg/L vs abrupt TAN loading of 10,000 mg/L at pH 8.0 (phase 2)
0
500
1000
1500
2000
2500
3000
0 10 20 30 40 50 60 70
Cu
mu
lati
ve
Bio
gas
Pro
du
ctio
m (
mL
)
Time (Days)
Gradual TAN loading at pH 7.5
Abrupt TAN Loadin at pH 7.5
0
500
1000
1500
2000
2500
3000
0 10 20 30 40 50 60 70
Cu
mu
lati
ve
Bio
gas
Pro
du
ctio
n
(mL
)
Time (Days)
Gradual TAN loading at pH 8.0
Abrupt TAN Loadin at pH 8.0

88
Figure 4.24 (c): Cumulative Biogas production under gradual TAN loading up to
10,000 mg/L vs abrupt TAN loading of 10,000 mg/L at pH 8.5 (phase 2)
The analysis of the VFA under gradual TAN loading is presented in Figure 4.25.
At the beginning of the experiment, VFA concentrations in the reactors were 3045 mg/L,
3610 mg/L and 3976 mg/L at pH of 7.5, 8.0 and 8.5 respectively. On day 7, the VFA
concentrations in the reactors had increased to 14600 mg/L, 15600 mg/L and 16000 mg/L
at pH of 7.5, 8.0 and 8.5 respectively. With gradual TAN loading up to 10,500 mg/L at
the end of the experiment, VFA concentration reduced to 7935 mg/L, 12,100 mg/L and
12,300 mg/L at pH 7.5, 8.0 and 8.5, respectively. This shows that at the lowest pH of 7.5,
the methanogens were more able to consume most the VFA for biogas production than at
pH 8.0 and 8.5. This can also be attributed to the fact the FAN concentration at pH of 8.0
and 8.5 caused the accumulation VFA and prevented the utilization of the VFA for
biogas production as previously discussed.
0
500
1000
1500
2000
2500
3000
0 10 20 30 40 50 60 70
Cu
mu
lati
ve
Bio
gas
Pro
du
ctio
n(m
L)
Time (Days)
Gradual TAN loading at pH 8.5
Abrupt TAN Loadin at pH 8.5

89
Figure 4.25: VFA consumption under gradual TAN loading (phase 2)
The COD analysis under gradual TAN loading is presented in Figure 4.26. The study
shows that the COD consumption rate decreased as the concentration of TAN added
increased, especially at pH of 8.0 and 8.5. At the end of the study, COD concentrations in
in the reactors reduced to 16,000 mg/L, 20,750 mg/L and 21,600 mg/L at pH 7.5, 8.0 and
8.5 respectively. The observed difference in the effluent COD concentrations can be
attributed to the fact FAN concentration inhibited the utilization of the COD for biogas
production by the methanogens, especially at pH 8.0 and 8.5.
VFA as Acetic
Acid (mg/L) on
day 1
VFA as Acetic
Acid (mg/L) on
day 7
VFA as Acetic
Acid (mg/L) on
day 14
VFA as Acetic
Acid (mg/L) on
day 62
pH 7.5 3045 14600 14200 7940
pH 8.0 3610 15600 15100 12100
pH 8.5 3980 16000 16200 12300
0
2000
4000
6000
8000
10000
12000
14000
16000
18000
VF
A (
ng
/L)
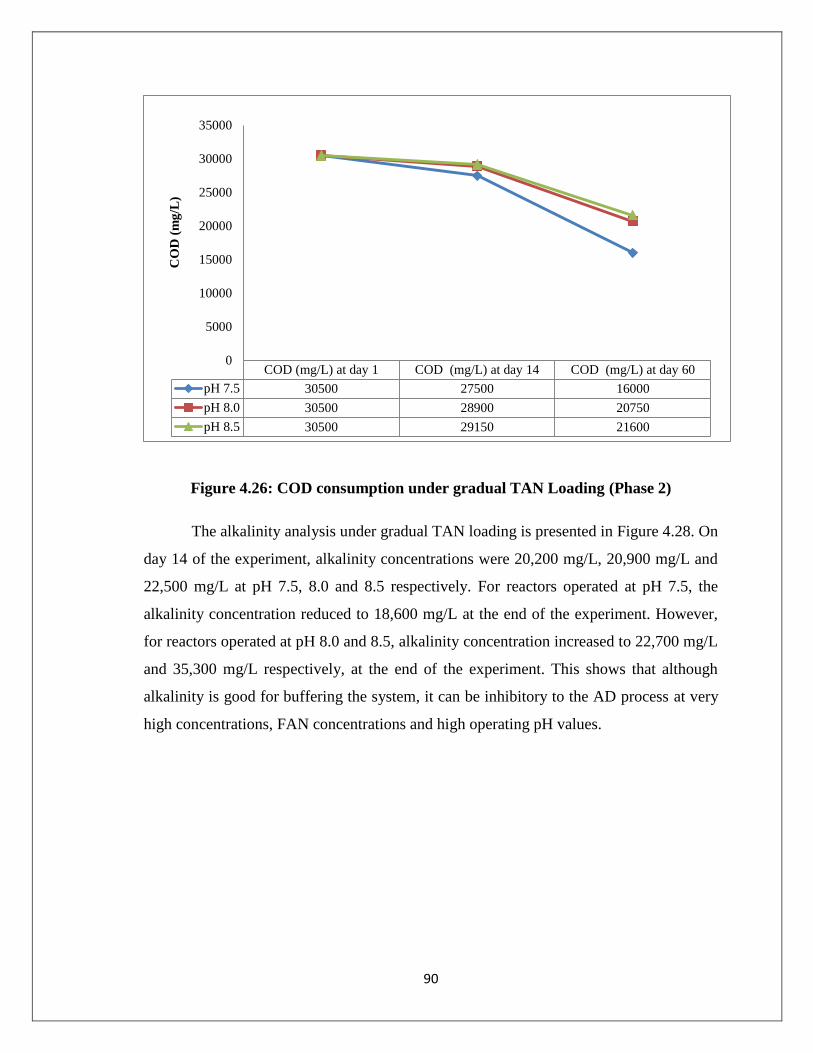
90
Figure 4.26: COD consumption under gradual TAN Loading (Phase 2)
The alkalinity analysis under gradual TAN loading is presented in Figure 4.28. On
day 14 of the experiment, alkalinity concentrations were 20,200 mg/L, 20,900 mg/L and
22,500 mg/L at pH 7.5, 8.0 and 8.5 respectively. For reactors operated at pH 7.5, the
alkalinity concentration reduced to 18,600 mg/L at the end of the experiment. However,
for reactors operated at pH 8.0 and 8.5, alkalinity concentration increased to 22,700 mg/L
and 35,300 mg/L respectively, at the end of the experiment. This shows that although
alkalinity is good for buffering the system, it can be inhibitory to the AD process at very
high concentrations, FAN concentrations and high operating pH values.
COD (mg/L) at day 1 COD (mg/L) at day 14 COD (mg/L) at day 60
pH 7.5 30500 27500 16000
pH 8.0 30500 28900 20750
pH 8.5 30500 29150 21600
0
5000
10000
15000
20000
25000
30000
35000
CO
D (
mg
/L)

91
Figure 4.28: Alkalinity under gradual TAN loading (Phase 2)
4.35 Phase 3 - Semi-continuous Mode - SW
Under semi-continuous reactor phase, 3 g of the digestate containing high ammonia
concentration was replaced with fresh substrate. Figure 4.29 shows the DBP from the
batch reactors converted to semi-continuous reactors. With the injection of fresh
substrates mesophilic bacteria were to resume into activity as seen in DBP shown in
Figure 4.29. Although biogas production started with replacement of the digestate with
fresh substrate, biogas production reduced drastically after the first 3 days. This may
possibly be attributed to the fact that the bacteria were only able to consume the readily
biodegrade portion of the fresh substrate coming into the system.
Alkalinity (mg/L) at
day 14
Alkalinity (mg/L) at
day 30
Alkalinity (mg/L) at
day 60
pH 7.5 20200 21600 18600
pH 8.0 20900 23700 22700
pH 8.5 22500 24800 35300
0
5000
10000
15000
20000
25000
30000
35000
40000
Alk
ali
nit
y (
mg
/L)

92
Figure 4.29: Daily biogas production under semi-continuous mode (Phase 3)
Reactors containing TAN concentration of 7,500 mg/L (786 mg/L-FAN) and 10,000 (380
mg/L-FAN) mg/L at pH 8.0 had the highest DBP under the semi-continuous mode at
each of the HRTs tested. This is because these reactors have the lowest FAN
concentrations. Under pH 8.5, reactors containing TAN concentrations of 7,500 mg/L
(2073 mg/L-FAN) and 10,000 mg/L (2800 mg/L-FAN) had the least DBP. It should be
noted that based on the loading rate of the fresh substrate injected into the system, the
HRTs will be 267 days, 467 days and 1000 days. However in reality, HRT should not be
less than 10-20 days. The purpose was to examine if the methanogens would return to
activity after the injection of fresh substrate.
4.4 Conclusion
The effect of ammonia on AD of OFMSW was studied under TAN concentrations of
2500 mg/L, 5000 mg/L, 7500 mg/L, and 10,000 mg/L at pH 7.5, 8.0 and 8.5. Results
confirmed that ammonia is inhibitory to methanogenic bacteria. CBP reduced with
increasing TAN concentration as shown in Figure 4.32 activity especially at 7,500 mg/L
and 10,000 mg/L. Percentage reduction in CBP compared with CB-reactors was as much
0
10
20
30
40
50
60
70
0 10 20 30 40 50 60
Da
ily
Bio
ga
s P
rod
uct
ion
(m
L)
Time (Days)
Control + 7500 mg/L TAN - pH
8.0
Control + 10000 mg/L TAN - pH
8.0
Control + 7500 mg/LTAN - pH 8.5
Control + 10000 mg/L TAN - pH
8.5
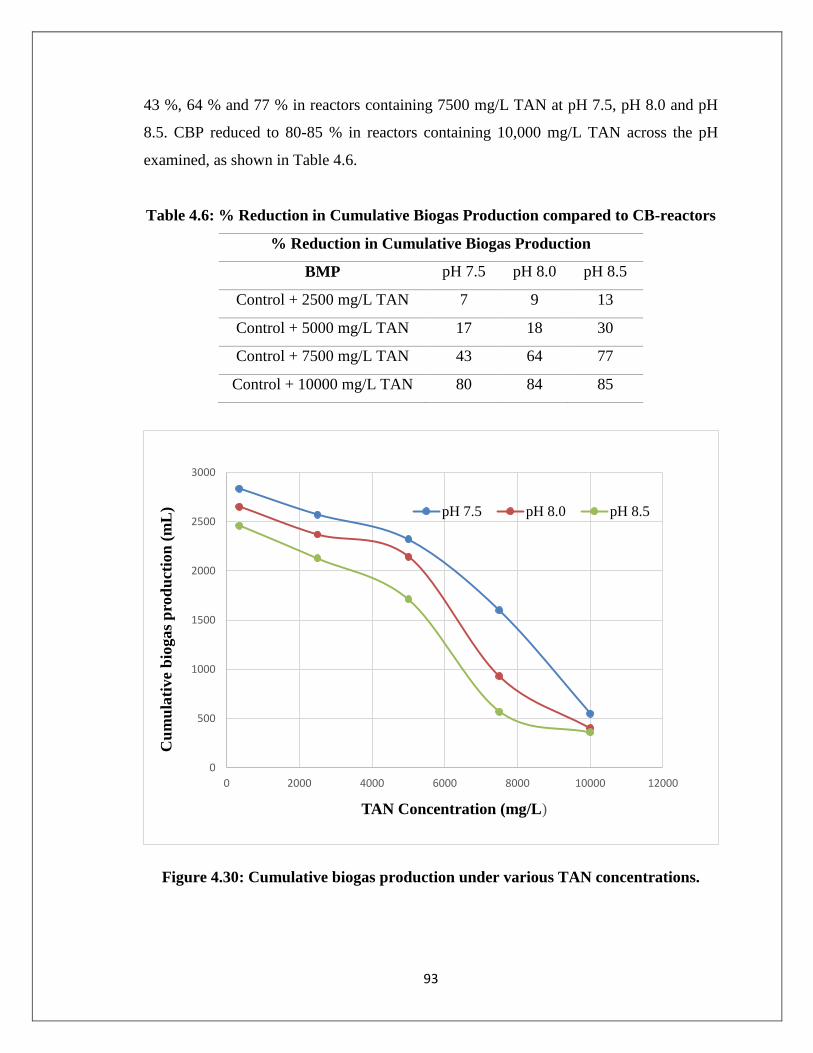
93
43 %, 64 % and 77 % in reactors containing 7500 mg/L TAN at pH 7.5, pH 8.0 and pH
8.5. CBP reduced to 80-85 % in reactors containing 10,000 mg/L TAN across the pH
examined, as shown in Table 4.6.
Table 4.6: % Reduction in Cumulative Biogas Production compared to CB-reactors
% Reduction in Cumulative Biogas Production
BMP pH 7.5 pH 8.0 pH 8.5
Control + 2500 mg/L TAN 7 9 13
Control + 5000 mg/L TAN 17 18 30
Control + 7500 mg/L TAN 43 64 77
Control + 10000 mg/L TAN 80 84 85
Figure 4.30: Cumulative biogas production under various TAN concentrations.
0
500
1000
1500
2000
2500
3000
0 2000 4000 6000 8000 10000 12000
Cu
mu
lati
ve
bio
ga
s p
rod
uct
ion
(m
L)
TAN Concentration (mg/L)
pH 7.5 pH 8.0 pH 8.5

94
The study also showed that pH influenced the inhibitory capacity and the FAN
component of TAN. At high pH (i.e. 8.5), FAN component of TAN was about 26 % and
was inhibitory to the methanogens. Results also showed that mesophilic bacteria could be
adapted to a TAN concentration of about 5000 mg/L at pH 7.5 through gradual TAN
loading. Also, the reactors under gradual TAN loading had 1200 mL of CBP than
reactors under sudden TAN loading of 10,000 mg/L at pH 7.5. Replacing 3g of digestate
containing high TAN concentrations of 7500 mg/L and 10,000 mg/L with 3 g fresh
substrate enhanced the return to activity of the methanogens as the observed in the semi-
continuous mode.

95
References
Alqaralleh, R., Delatolla, R., & Kennedy, K. (2015). Anaerobic digestion of simulated-
organic fraction of municipal solid waste: effect of alkaline
pretreatment. International Journal of Environment and Waste Management, 16
(2), 166-185.
Angelidaki, I., & Ahring, B. K. (1994). Anaerobic thermophilic digestion of manure at
different ammonia loads: effect of temperature. Water Research, 28(3), 727-731.
Angelidaki, I., Ellegaard, L., & Ahring, B. K. (1993). A mathematical model for dynamic
simulation of anaerobic digestion of complex substrates: focusing on ammonia
inhibition. Biotechnology and Bioengineering, 42(2), 159-166.
Ara, E. (2012). Anaerobic Co-digestion of Organic Fraction of Municipal Solid Waste
and Municipal Sludge With and Without Microwave Pre-treatment (Doctoral
dissertation, University of Ottawa).
Ara, E., Sartaj, M., & Kennedy, K. (2014). Effect of microwave pre-treatment of
thickened waste activated sludge on biogas production from co-digestion of
organic fraction of municipal solid waste, thickened waste activated sludge and
municipal sludge. Waste Management & Research, 32(12), 1200-1209.
Ara, E., Sartaj, M., & Kennedy, K. (2015). Enhanced biogas production by anaerobic co-
digestion from a trinary mix substrate over a binary mix substrate. Waste
Management & Research, 33(6), 578-587.
Bhattacharya, S. K., & Parkin, G. F. (1989). The effect of ammonia on methane
fermentation processes. Journal (Water Pollution Control Federation), 55-59.
Blomgren, A., Hansen, A., & Svensson, B. H. (1990). Enrichment of a mesophilic,
syntrophic bacterial consortium converting acetate to methane at high ammonium
concentrations. In Microbiology and biochemistry of strict anaerobes involved in
interspecies hydrogen transfer (pp. 225-234). Springer US.
Braun, R., Huber, P., & Meyrath, J. (1981). Ammonia toxicity in liquid piggery manure
digestion. Biotechnology Letters, 3(4), 159-164.

96
Dong, S., & Sartaj, M. (2015). Statistical analysis of thermal and non-thermal effects of
sequential microwave/aeration process for the removal of ammonia from aqueous
solution. Desalination and Water Treatment, 1-11.
El Hadj, T. B., Astals, S., Gali, A., Mace, S., & Mata-Alvarez, J. (2009). Ammonia
influence in anaerobic digestion of OFMSW. Water Science and
Technology, 59(6), 1153.
Hansen, K. H., Angelidaki, I., & Ahring, B. K. (1998). Anaerobic digestion of swine
manure: inhibition by ammonia. Water Research, 32(1), 5-12.
Jung, J. Y., Chung, Y. C., Shin, H. S., & Son, D. H. (2004).Enhanced ammonia nitrogen
removal using consistent biological regeneration and ammonium exchange of
zeolite in modified SBR process. Water Research,38(2), 347-354.
Koster, I. W., & Lettinga, G. (1988).Anaerobic digestion at extreme ammonia
concentrations. Biological Wastes, 25(1), 51-59.
Mata-Alvarez, J., Mace, S., & Llabres, P. (2000).Anaerobic Digestion of Organic Solid
Wastes.An Overview of Research Achievements and Perspective. Bioresource
Technology , 74, 3–16.
McCarty, P. L., & McKinney, R. E. (1961).Salt toxicity in anaerobic digestion. Journal
(Water Pollution Control Federation), 399-415.
Nair, A., Sartaj, M., Kennedy, K., & Coelho, N. M. (2014).Enhancing biogas production
from anaerobic biodegradation of the organic fraction of municipal solid waste
through leachate blending and recirculation. Waste Management &
Research, 32(10), 939-946.
Pfeffer, J. T. (1974). Temperature effects on anaerobic fermentation of domestic
refuse. Biotechnology and Bioengineering, 16(6), 771-787.
Shahriari, H., Warith, M., Hamoda, M., & Kennedy, K. J. (2012).Anaerobic digestion of
organic fraction of municipal solid waste combining two pre-treatment modalities,
high temperature microwave and hydrogen peroxide. Waste
management, 32(1), 41-52.
Shanmugam, P., & Horan, N. J. (2009). Optimising the biogas production from leather
fleshing waste by co-digestion with MSW. Bioresource Technology, 100(18),
4117-4120.

97
Sossa K, Alarcon M, Aspe E, & Urrutia H. (2004). Effect of ammonia on the
methanogenic activity of methylaminotrophic methane producing archaea
enriched biofilm anaerobe 2004; 10:13–8.
Speece, R. E. (1983). Anaerobic biotechnology for industrial wastewater
treatment. Environmental Science & Technology, 17(9), 416A-427A
Staley, B. F., & Barlaz, M. A. (2009).Composition of municipal solid waste in the
United States and implications for carbon sequestration and methane
yield. Journal of Environmental Engineering.
Webb, A. R., & Hawkes, F. R. (1985). The anaerobic digestion of poultry manure:
variation of gas yield with influent concentration and ammonium-nitrogen
levels. Agricultural Wastes, 14(2), 135-156.
Wiegant, W. M., & Zeeman, G. (1986). The mechanism of ammonia inhibition in the
thermophilic digestion of livestock wastes. Agricultural Wastes, 16(4), 243-253.
World Bank (2015). What a Waste – A Global Review of Solid Waste Management
Yenigün, O., & Demirel, B. (2013). Ammonia inhibition in anaerobic digestion: a
review. Process Biochemistry, 48(5), 901-911.
98
Chapter 5
TECHNICAL PAPER II
The Toxicity Effects of Ammonia on Anaerobic Digestion of Organic Fraction of
Municipal Solid Waste Mixed with Real Landfill Leachate
Akinwumi Abiodun Akindele, Majid Sartaj
Abstract
The effect of ammonia on the anaerobic digestion of the organic fraction of municipal
solid waste (OFMSW) mixed with real landfill leachate to simulate an anaerobic
bioreactor landfill was investigated in this study. The tests were conducted under
different total ammonia nitrogen (TAN) concentrations of 7500 mg/L, 10,000 mg/L and
pH 7.5 and 8.5. Results confirmed that ammonia is toxic to anaerobic digestion, as
Cumulative Biogas Production (CBP) reduced as the TAN concentration increased.
Compared with control reactors, reactors containing 7500 mg/L TAN at pH 8.0 and pH
8.5 had 61 % and 80 % reduction in CBP. Likewise, reactors containing 10,000 mg/L
TAN at pH 8.0 and pH 8.5 had 68 % and 85 % reduction in CBP, compared with control
reactors. The operating pH influenced the level of toxicity and composition of Total
Ammonia Nitrogen (TAN). At high pH (i.e. 8.5), FAN component of TAN was about 26
% and was inhibitory to the methanogens. Lastly, results also showed that mesophilic
bacteria could be adapted to a TAN concentration of about 5000 mg/L at pH 7.5 through
gradual TAN loading.
Keywords: total ammonia nitrogen, free ammonia nitrogen, organic fraction of municipal
solid waste

99
5.1 Introduction
Municipal Solid Waste (MSW) is a combination of wastes generated from residential
households and apartment buildings, commercial and institutional establishments,
construction and demolition waste, municipal services, and treatment plants
(Tchobanoglous, et al., 1993; Staley and Barlaz, 2009). MSW generation rate is a global
concern because the generation rate increases with increasing world population. The
World Bank recently published that about 1.3 billion tons of MSW is generated globally
per year and projected waste generation rate to increase by 70 % by the year 2025. Also,
the annual global cost of waste disposal is expected to increase from $ 205 billion to $
375 billion (World Bank, 2015). In year 2008, Statistics Canada published that over 25
million tonnes of MSW was deposited into landfills across Canada. Out of the 25 million
tonnes of waste landfilled, household wastes accounted for about 13 million tonnes
(Statistics Canada, 2008). The anaerobic digestion (AD) of MSW in anaerobic bioreactor
landfills enhances waste degradation and the biogas generated in the process can be used
for energy recovery. Leachate recirculation in anaerobic bioreactor landfills leads to an
increase in waste density, resulting in a better utilization of the landfill capacity (Benson
et al., 2007). However, leachate recirculation as practiced in anaerobic bioreactor landfills
increases the rate of ammonification, resulting in accumulation of higher levels of ammonia,
which intensifies the toxicity of the leachate. This is due to the fact that there is no degradation
pathway for ammonia in anaerobic systems (Nair et al., 2014). High concentrations of ammonia
in recirculated leachate could undermine the anaerobic digestion process performance by
inhibiting microorganisms and result in low methane production. Ammonia exists in two forms
as ionized ammonia or ammonium (NH4+ ) and unionized ammonia or free ammonia
(NH3). The combination of these two forms of ammonia is expressed as total ammonia
nitrogen (TAN). The percentages of these two forms of ammonia in TAN vary with
temperature and pH (Ding and Sartaj, 2015; Dong and Sartaj 2015).
The inhibitory effects of ammonia on the AD of high and low organic matters at
various operating temperatures and pH values have been reported (Pfeffer, 1974; Braun
et al., 1981; Webb and Hawkes 1985; Hashimoto, 1986; Blomgren et al., 1990;
Angelidaki and Ahring, 1993). Kayhanian (1994) studied the impact of high ammonia
concentrations on the biodegradation of the OFMSW using varying ammonia
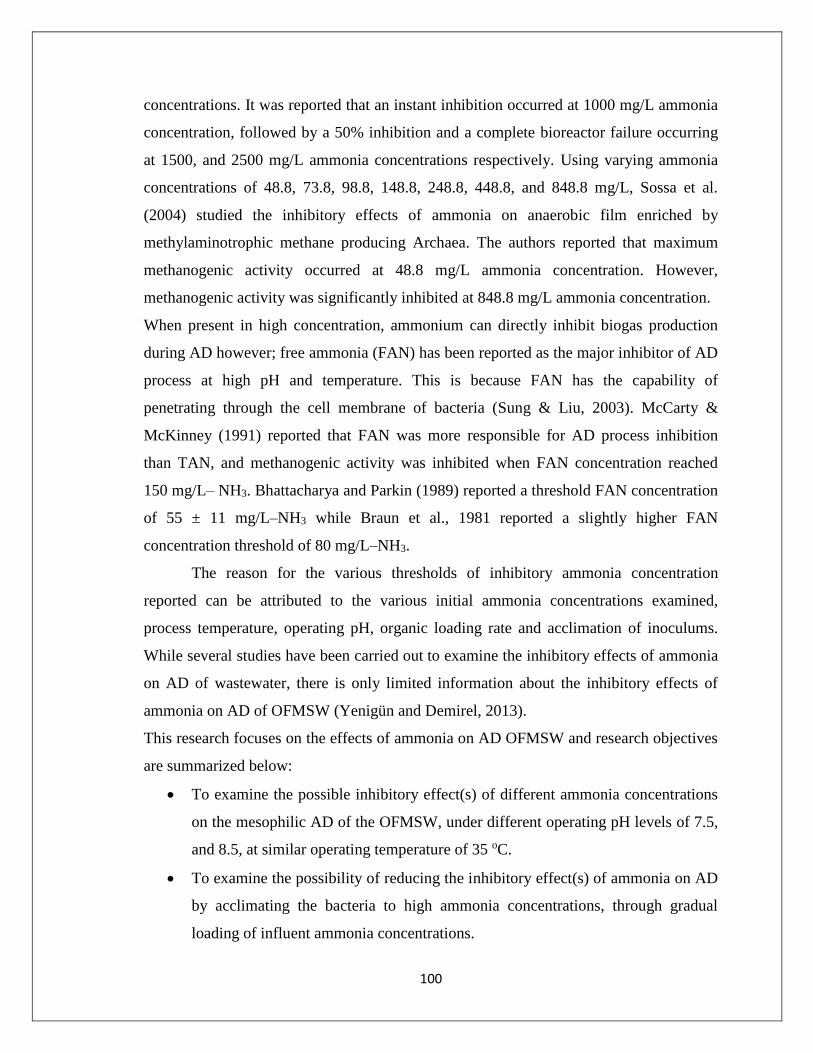
100
concentrations. It was reported that an instant inhibition occurred at 1000 mg/L ammonia
concentration, followed by a 50% inhibition and a complete bioreactor failure occurring
at 1500, and 2500 mg/L ammonia concentrations respectively. Using varying ammonia
concentrations of 48.8, 73.8, 98.8, 148.8, 248.8, 448.8, and 848.8 mg/L, Sossa et al.
(2004) studied the inhibitory effects of ammonia on anaerobic film enriched by
methylaminotrophic methane producing Archaea. The authors reported that maximum
methanogenic activity occurred at 48.8 mg/L ammonia concentration. However,
methanogenic activity was significantly inhibited at 848.8 mg/L ammonia concentration.
When present in high concentration, ammonium can directly inhibit biogas production
during AD however; free ammonia (FAN) has been reported as the major inhibitor of AD
process at high pH and temperature. This is because FAN has the capability of
penetrating through the cell membrane of bacteria (Sung & Liu, 2003). McCarty &
McKinney (1991) reported that FAN was more responsible for AD process inhibition
than TAN, and methanogenic activity was inhibited when FAN concentration reached
150 mg/L– NH3. Bhattacharya and Parkin (1989) reported a threshold FAN concentration
of 55 ± 11 mg/L–NH3 while Braun et al., 1981 reported a slightly higher FAN
concentration threshold of 80 mg/L–NH3.
The reason for the various thresholds of inhibitory ammonia concentration
reported can be attributed to the various initial ammonia concentrations examined,
process temperature, operating pH, organic loading rate and acclimation of inoculums.
While several studies have been carried out to examine the inhibitory effects of ammonia
on AD of wastewater, there is only limited information about the inhibitory effects of
ammonia on AD of OFMSW (Yenigün and Demirel, 2013).
This research focuses on the effects of ammonia on AD OFMSW and research objectives
are summarized below:
To examine the possible inhibitory effect(s) of different ammonia concentrations
on the mesophilic AD of the OFMSW, under different operating pH levels of 7.5,
and 8.5, at similar operating temperature of 35 oC.
To examine the possibility of reducing the inhibitory effect(s) of ammonia on AD
by acclimating the bacteria to high ammonia concentrations, through gradual
loading of influent ammonia concentrations.

101
5.2 Materials and Methodology
This experimental study was carried out in two phases, the Biochemical Methane
Potential (BMP) phase, and the gradual TAN loading phase.
The first phase was the Biochemical Methane Potential (BMP) test phase. In the
first phase, the effect of ammonia on anaerobic digestion of OFMSW with real landfill
leachate was studied, to simulate an anaerobic bioreactor landfill. The 500 mL Kimax®
glass bottles use were capped with butyl rubber stoppers. The BMP test was carried out
using mesophilic anaerobically digested inoculums volume of 40 mL, 80ml of anaerobic
landfill leachate, 30 gm of OFMSW, TAN concentrations 7,500 and 10,000 mg/L. Equal
portions of NaHCO3 and KHCO3 were added as buffer. The total working volume of the
mixture was brought to 300 mL by the addition of distilled water (DW).As circumstances
required, 1N Hydrochloric Acid (1N HCl) solution and 5N Sodium Hydroxide (5N
NaOH) solution were used to adjust the pH to the desired value. The inoculums BMP
bottles, control BMP bottles, and BMP bottles containing 7,500 and 10,000 mg/L, TAN
concentrations were set up in duplicates. A total 20 BMP bottles were set up for this
phase.
The second phase of the experiment was gradual TAN loading. This was carried
out to examine the possibility of adapting thermophilic bacteria to high ammonia
concentration. At the beginning, TAN concentration was raised to 1000 mg/L and further
increased by 1000 mg/L weekly. The OFMSW used in this study was synthesized using
food components that are representative of a typical domestic kitchen and commercial
kitchen food waste in Canada. The percentages of the different components of the
OFMSW had standard compositions of protein, hydrocarbon, vegetable and fat in
conformity with the Canadian Food Guide, as shown in Table 5.1 (Ara, 2012). In order to
obtain consistent results, each set of simulated OFMSW was prepared weekly and the
remaining modeled OFMSW was frozen up at a temperature of -4 oC, to prevent the
likelihood of any fermentation. The carrots, cabbage, banana, and apple used were fresh.
The ground beef was cooked for 30 mins while the rice and pasta were cooked differently
for 15 minutes each in a rice cooker. Prior to being used, the OFMSW was thoroughly
mixed and blended to form a slurry having a particle size ranging from 1-2 mm, using a
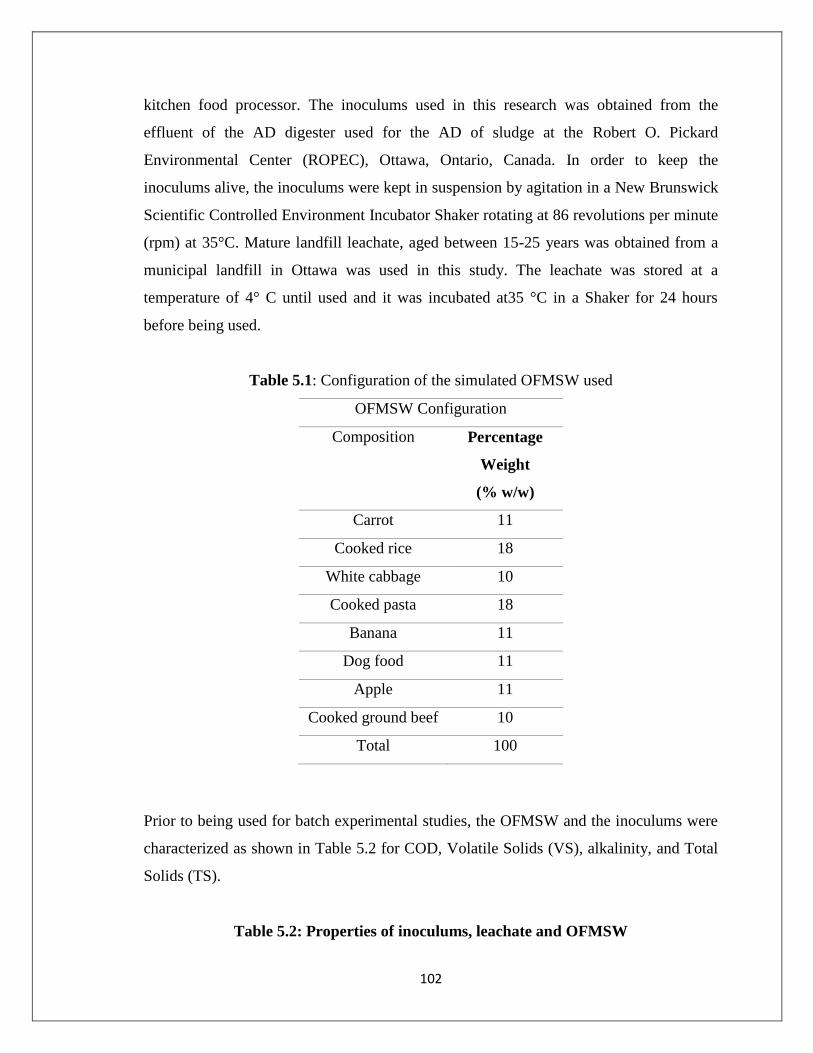
102
kitchen food processor. The inoculums used in this research was obtained from the
effluent of the AD digester used for the AD of sludge at the Robert O. Pickard
Environmental Center (ROPEC), Ottawa, Ontario, Canada. In order to keep the
inoculums alive, the inoculums were kept in suspension by agitation in a New Brunswick
Scientific Controlled Environment Incubator Shaker rotating at 86 revolutions per minute
(rpm) at 35°C. Mature landfill leachate, aged between 15-25 years was obtained from a
municipal landfill in Ottawa was used in this study. The leachate was stored at a
temperature of 4° C until used and it was incubated at35 °C in a Shaker for 24 hours
before being used.
Table 5.1: Configuration of the simulated OFMSW used
Prior to being used for batch experimental studies, the OFMSW and the inoculums were
characterized as shown in Table 5.2 for COD, Volatile Solids (VS), alkalinity, and Total
Solids (TS).
Table 5.2: Properties of inoculums, leachate and OFMSW
OFMSW Configuration
Composition Percentage
Weight
(% w/w)
Carrot 11
Cooked rice 18
White cabbage 10
Cooked pasta 18
Banana 11
Dog food 11
Apple 11
Cooked ground beef 10
Total 100

103
Properties COD
mg/L
pH TAN
mg/L
Alkalinity
as CaCo3
mg/L
VFA
(acetic acid)
mg/L
OFMSW 177,000 4.5 350 2,750 9600
Inoculums 11050 6.9 877 14,600 7500
Leachate 4425 9.0 1878 6725 549
5.2.1 Materials and Equipment
Hach TNT plus™ 822 high range reagent vials (Method 8000) were used to measure the
chemical oxygen demand (COD). Samples were first homogenized and well mixed to
form a slurry paste using the Brinkmann Polytron PT 3000 homogenizer before COD
concentrations were measured. TAN was measured using the salicylate method, with the
use of TNT plus™ 832 reagent vials (Method 10205, Hach, USA).Total alkalinity
determination was carried out according colorimetric method using TNTplus™870
reagent vials with alkalinity measuring range of 25 to 400 mg/L CaCO3 (Method 10239,
Hach USA).VFA was measured as acetic acids using TNT plus™ 872 with measuring
range of 50 to 2,500 mg/L Acetic Acid. The UV-VIS. Prior to the analyses of TAN, VFA
and total alkalinity, samples were centrifuged in a ThermoscientificSorvall Legend T+
model centrifuge at 10,000 rpm for 30 minutes. Once centrifuged, the supernatant was
poured onto and filtered through filters with nominal pore size of 0.45 µm filters using a
Fisher Scientific pump (Wilkinson, 2011).
The daily biogas production was recorded daily with a BD 21G½ needle
connected to a u-tube manometer, until the biogas production rates were less than 1 % of
the cumulative biogas produced. The daily biogas production from reactors containing
leachate and inoculums only was subtracted from the daily biogas production from CB-
reactors and reactors containing TAN concentrations of 7500 mg/L and 10,000 mg/L.
Biogas composition of the biogas produced was analyzed using thermal conductivity gas

104
chromatograph (series 400, Gow-Mac Instrument Co., USA). Fisher Accumet model
XL25 dual channel pH/ion meter equipped with a glass electrode was used to measure the
pH of all inoculums, substrates (OFMSW) and BMP samples. The carrier gas used for the
separation of the different biogas compositions was helium, operated at inflow rate of 30
mL/min. Biogas samples (0.5 mL) were taken in duplicates and injected into the column
through the injection port. Spectrophotometer was used to measure the COD, VFA, TAN,
Total and Alkalinity concentrations.
5.3 Results and Discussions
The results of the various batch tests conducted showed that the TAN and FAN have
significant effects on the AD of the OFMSW. This is particularly observable in the
difference between the amount of biogas produced by control batch reactors and batch
reactors containing various TAN concentrations of 7,500 mg/L, and 10,000 mg/L under
identical pH values of 7.5, and 8.5.
Also, the results of the experimental studies conducted confirmed that pH has a
significant effect on the severity of the inhibitory effect of TAN on the AD of the
OFMSW. However, the effect of pH was not very significant on control batch reactors.
As discussed earlier, the percentage of FAN in TAN varies with pH. Under identical
TAN concentrations and different pH levels, the FAN content of TAN varied
significantly and this had a resultant effect on the variation in the biogas produced by
batch reactors containing similar TAN concentrations.
Experimental studies on the effect of gradual TAN loading indicated that the gradual
increase of TAN allowed methanogenic bacteria to become acclimated to high TAN
concentration of about 5000 mg/L.
5.3.1 Phase 1 – (SW+L)
5.3.1.1 The Effect of TAN at pH 7.5
The cumulative biogas production (CBP) from control BMP reactors (CB-reactors),
reactors containing leachate and inoculums only and reactors containing TAN
concentrations of 7,500 mg/L, and 10,000 mg/L, under similar operating pH of 7.5 is

105
shown in Figure 5.1. The daily biogas production from reactors containing leachate and
inoculums only was subtracted from the daily biogas production from CB-reactors and
reactors containing TAN concentrations of 7500 mg/L and 10,000 mg/L. Methanogenic
activity inhibition by ammonia was evident from the first day of the experiment. On day
1 of the experiment, (CB-reactors) produced an average daily biogas of 152 ml while
reactors containing TAN concentrations of 7,500 mg/L, and 10,000 mg/L produced 23
mL and 13 mL respectively. At the end of the experiment, CB-reactors produced CBP of
2853 mL while BMP reactors containing TAN concentrations of 7,500 mg/L, and 10,000
mg/L produced 1108 mL, 904 mL respectively. This implies reactors containing TAN
concentrations of 7,500 mg/L, and 10,000 mg/L has 61 % and 68 % reductions in biogas
respectively, compared with CB-reactors.
Figure 5.1: Biogas production from BMP reactors under different TAN
concentrations and similar operating pH of 7.5 (Phase 1)
0
500
1000
1500
2000
2500
3000
0 10 20 30 40 50 60
Cu
mu
lati
ve
Bio
gas
Pro
du
ctio
n (
mL
)
Time (days)
Control
Control + 7,500 mg/L TAN
Control + 10,000 mg/L TAN

106
Consistent with the study of Sawayama et al., (2004) and Strik et al., (2006),
biogas composition analyses showed that the percentage of methane in the biogas
reduced with increasing TAN concentration. Methane percentage was negligible in
reactors containing TAN concentrations of 7,500 mg/L, and 10,000 mg/L, compared with
CB-reactors. As shown in Figure 5.2, the percentages of methane in the biogas analyzed
in reactors containing TAN concentrations of 7,500 mg/L, and 10,000 mg/L were 36.4 %
and 5.1 %, respectively. However, the average methane percentage of the biogas
produced by CB-reactors was 66.5 %. There was no noticeable increase in methane
percentage of the biogas produced by reactors containing TAN concentrations of 7,500
mg/L, and 10,000 mg/L throughout the experiment, due to ammonia inhibition.
Figure 5.2: Biogas Composition at pH 7.5 (Phase 1)
TAN concentrations increased in the reactors as evident in the TAN analyses
carried out in the course of the experiment as shown in Figure 5.3. For the CB-reactors,
the TAN concentration increased from 650 mg/L to 1010 mg/L. TAN concentrations
increased from 7500 mg/L to 7870 mg/L, 10,000 mg/L to 10,410 mg/L in reactors
containing initial TAN concentrations of 7500 mg/L and 10,000 mg/L respectively. This
Nirogen Methane Carbon-di-oxide
Control 1.2 66.5 43.2
Control + 7500 mg/L TAN 7.3 36.4 56.3
Control + 10000 mg/L TAN 13.2 5.1 81.7
0
10
20
30
40
50
60
70
80
90
Bio
gas
Com
posi
tion
(%
)
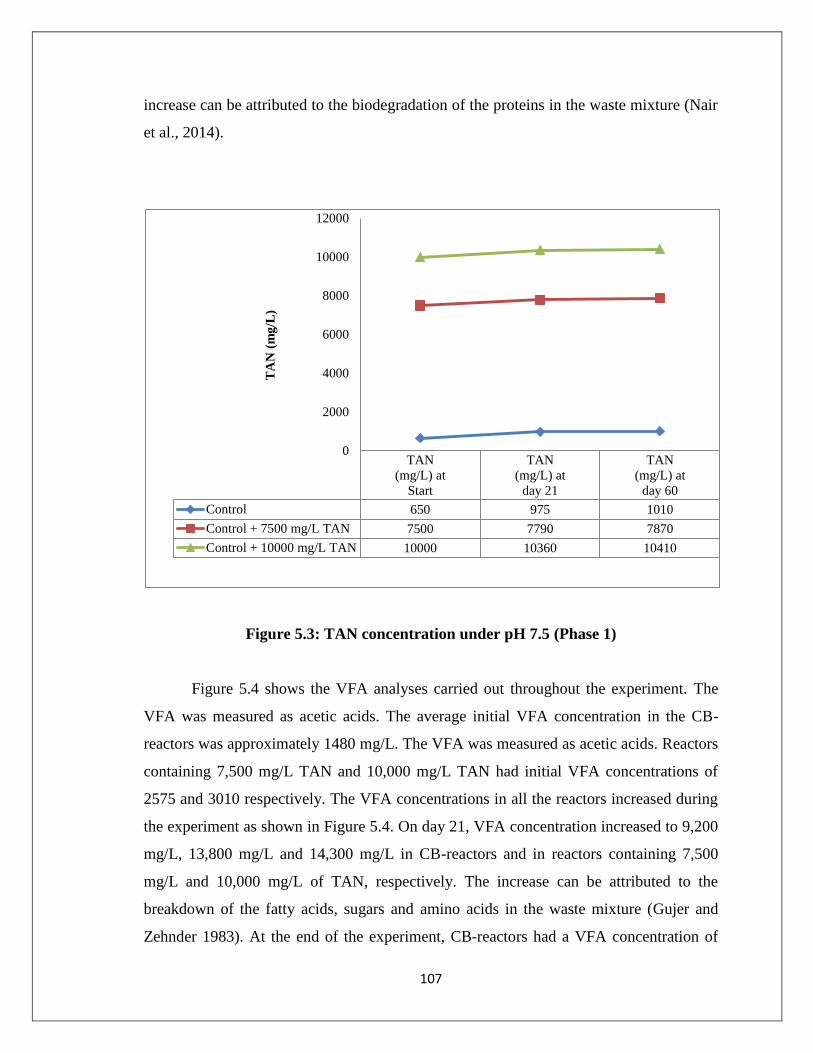
107
increase can be attributed to the biodegradation of the proteins in the waste mixture (Nair
et al., 2014).
Figure 5.3: TAN concentration under pH 7.5 (Phase 1)
Figure 5.4 shows the VFA analyses carried out throughout the experiment. The
VFA was measured as acetic acids. The average initial VFA concentration in the CB-
reactors was approximately 1480 mg/L. The VFA was measured as acetic acids. Reactors
containing 7,500 mg/L TAN and 10,000 mg/L TAN had initial VFA concentrations of
2575 and 3010 respectively. The VFA concentrations in all the reactors increased during
the experiment as shown in Figure 5.4. On day 21, VFA concentration increased to 9,200
mg/L, 13,800 mg/L and 14,300 mg/L in CB-reactors and in reactors containing 7,500
mg/L and 10,000 mg/L of TAN, respectively. The increase can be attributed to the
breakdown of the fatty acids, sugars and amino acids in the waste mixture (Gujer and
Zehnder 1983). At the end of the experiment, CB-reactors had a VFA concentration of
TAN
(mg/L) at
Start
TAN
(mg/L) at
day 21
TAN
(mg/L) at
day 60
Control 650 975 1010
Control + 7500 mg/L TAN 7500 7790 7870
Control + 10000 mg/L TAN 10000 10360 10410
0
2000
4000
6000
8000
10000
12000
TA
N (
mg
/L)

108
1090 mg/L while reactors containing 7,500 mg/L and 10,000 mg/L of TAN had VFA
concentrations of 15,600 mg/L, and 16,640 mg/L respectively. The low acetic acids
concentration observed in CB-reactors indicate that the bulk of the VFA produced had
been used up by the methanogens to produce biogas. Whereas VFA accumulated in
reactors containing 7,500 mg/L and 10,000 mg/L of TAN due to ammonia inhibition,
preventing the utilization of the acetic acids produced for biogas production by the
methanogens.
Figure 5.4: VFA concentration under pH 7.5 (Phase 1)
The analysis of the COD is presented in Figure 5.5. At the end of the experiment,
CB-reactors had COD concentration of 8270 mg/L while reactors containing 7500 mg/L
TAN and 10,000 mg/L TAN had a COD of 25,390 mg/L and 26,210 mg/L respectively.
Due to ammonia toxicity, not much of the COD was used in reactors containing TAN
concentrations of 7,500 mg/L, and 10,000 mg/L.
VFA as Acetic
Acid (mg/L) at
Start
VFA as Acetic
Acid (mg/L) at day
21
VFA as Acetic
Acid (mg/L) at day
60
Control 1480 9200 1090
Control + 7500 mg/L TAN 2575 13800 15600
Control + 10000 mg/L TAN 3010 14300 16640
0
2000
4000
6000
8000
10000
12000
14000
16000
18000
VF
A (
mg
/L)

109
Figure 5.5: COD concentration under pH 7.5 (Phase 1)
Alkalinity analyses carried out during the test showed that alkalinity increases as the
concentration of TAN increases, as shown in Figure 5.6. The alkalinity increased at the
end of the experiment, with alkalinity reaching 11,600 mg/L and 17,700 mg/L in reactors
containing 7,500 mg/L and 10,000 mg/L of TAN. The low biogas production in reactors
having high alkalinity can be attributed to alkalinity toxicity caused by high TAN
concentrations in these reactors.
COD (mg/L)
at day 1
COD (mg/L)
at day 21
COD (mg/L)
at day 50
Control 31000 20300 8270
Control + 7500 mg/L TAN 31000 26880 25390
Control + 10000 mg/L TAN 31000 26900 26210
0
5000
10000
15000
20000
25000
30000
35000
CO
D (
mg
/L)

110
Figure 5.6: Alkalinity concentration under pH 7.5 (Phase 1)
5.3.1.2 The Effect of TAN at pH 8.5
Figure 5.7 shows the CBP at pH 8.5. As observed at pH 7.5, CBP reduced as the
concentration of TAN increased. Similar to pH 7.5, the daily biogas production from
reactors containing leachate and inoculums only was subtracted from the daily biogas
production from CB-reactors and reactors containing TAN concentrations of 7500 mg/L
and 10,000 mg/L. However, the effect of TAN on biogas was significant at the operating
pH of 8.5. Methanogenic activity inhibition by ammonia was evident from the first day
of the experiment. Reactors containing TAN concentrations of 7,500 mg/L and 10,000
mg/L had no biogas production on day 1, from the second to the third week and
completely stopped producing biogas from day 38 to the end of the experiment. At the
end of the experiment, CBP of 1624 mL was produced by CB-reactors while reactors
containing TAN concentrations of 7,500 mg/L, and 10,000 mg/L produced 322 mL, 245
mL respectively. The CBP produced by reactors containing leachate and inoculums only
was 23 mL.
Alkalinit
y (mg/L)
at day 1
Alkalinit
y (mg/L)
at day 21
Alkalinit
y (mg/L)
at day 50
Control 5405 4850 4510
Control + 7500 mg/L TAN 9750 9180 11600
Control + 10000 mg/L TAN 10650 10600 17700
0
2000
4000
6000
8000
10000
12000
14000
16000
18000
20000
Alk
ali
nit
y (
mg
/L)
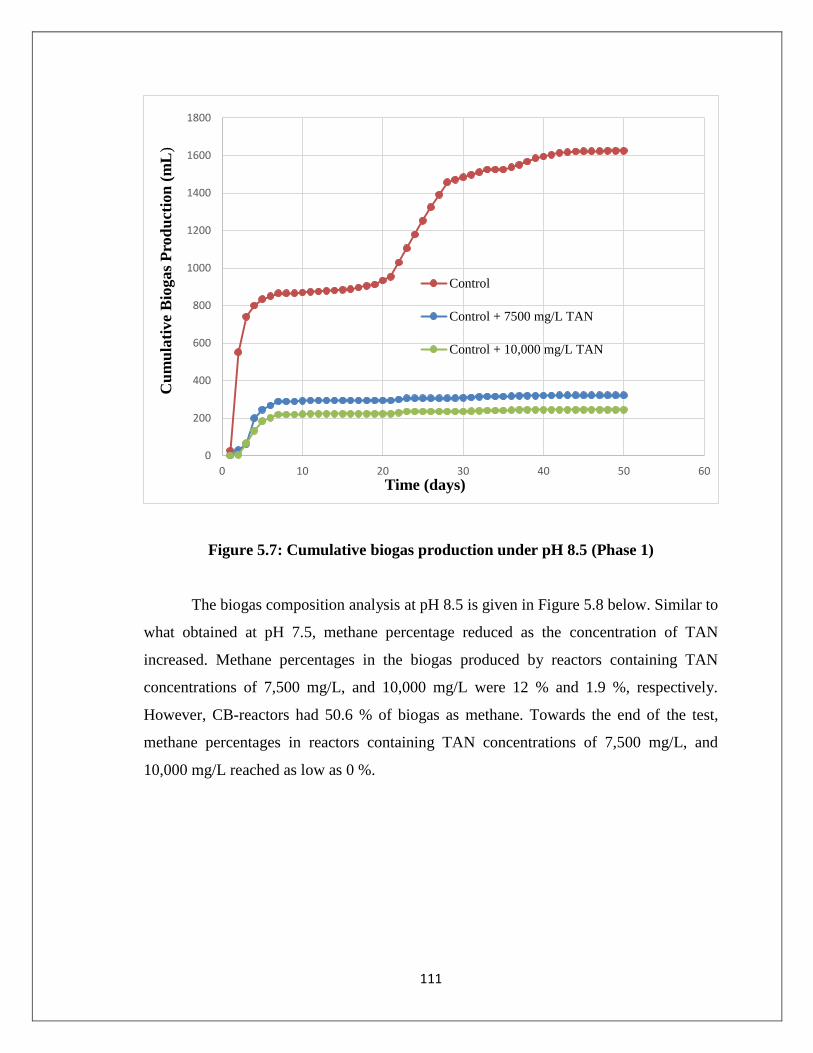
111
Figure 5.7: Cumulative biogas production under pH 8.5 (Phase 1)
The biogas composition analysis at pH 8.5 is given in Figure 5.8 below. Similar to
what obtained at pH 7.5, methane percentage reduced as the concentration of TAN
increased. Methane percentages in the biogas produced by reactors containing TAN
concentrations of 7,500 mg/L, and 10,000 mg/L were 12 % and 1.9 %, respectively.
However, CB-reactors had 50.6 % of biogas as methane. Towards the end of the test,
methane percentages in reactors containing TAN concentrations of 7,500 mg/L, and
10,000 mg/L reached as low as 0 %.
0
200
400
600
800
1000
1200
1400
1600
1800
0 10 20 30 40 50 60
Cu
mu
lati
ve
Bio
gas
Pro
du
ctio
n (
mL
)
Time (days)
Control
Control + 7500 mg/L TAN
Control + 10,000 mg/L TAN

112
Figure 5.8: Biogas Composition under pH 8.5 (phase 1)
The analysis of the TAN concentrations in the reactors at pH 8.5 is presented in Figure
5.9.
Figure 5.9: TAN Concentration under pH 8.5 (Phase 1)
Nirogen Methane Carbon-di-oxide
Control 2.2 50.6 47.2
Control + 7500 mg/L TAN 13.5 12 74.5
Control + 10000 mg/L TAN 22.8 1.9 75.3
0
10
20
30
40
50
60
70
80
Bio
gas
Com
posi
tion
(%
)
TAN (mg/L) at
Start
TAN (mg/L) at day
21
TAN (mg/L) at day
60
Control 650 986 1050
Control + 7500 mg/L TAN 7500 7780 7820
Control + 10000 mg/L TAN 10000 10260 10380
0
2000
4000
6000
8000
10000
12000
TA
N (
mg/L
)

113
The analysis showed that TAN concentrations increased in the reactors, as observed at
pH 7.5 due to the hydrolysis of the protein in the waste mixture. At the end of the test,
TAN concentration increased from 650 mg/L to 1050 mg/L in CB-reactors while TAN
increased from 7500 mg/L to 7820 mg/L and from 10,000 mg/L to 10,380 mg/L in
reactors containing initial TAN concentrations of 7,500 mg/L and 10,000 mg/L
respectively.
Figure 5.10 shows the analysis of the VFA carried out during the experiment. At
the beginning of the experiment, VFA concentration was 1560 mg/L in CB-reactors
while containing TAN concentrations of 7,500 mg/L, and 10,000 mg/L had initial VFA
concentrations of 2678 mg/L and 3500 mg/L respectively.
Figure 5.10: VFA Concentration under pH 8.5 (Phase 1)
On day 21, CB-reactors had VFA concentration of 10,500 mg/L while reactors containing
TAN concentrations of 7,500 mg/L and 10,000 mg/L had VFA concentrations of 14,200
mg/L, and 15,400 mg/L respectively. This can be attributed to the breakdown of the
VFA as Acetic
Acid (mg/L) at
Start
VFA as Acetic
Acid (mg/L) at day
21
VFA as Acetic
Acid (mg/L) at day
60
Control 1560 10500 6860
Control + 7500 mg/L TAN 2678 14200 17900
Control + 10000 mg/L TAN 3500 15400 18100
0
2000
4000
6000
8000
10000
12000
14000
16000
18000
20000
VF
A (
mg
/L)
PH 8.5
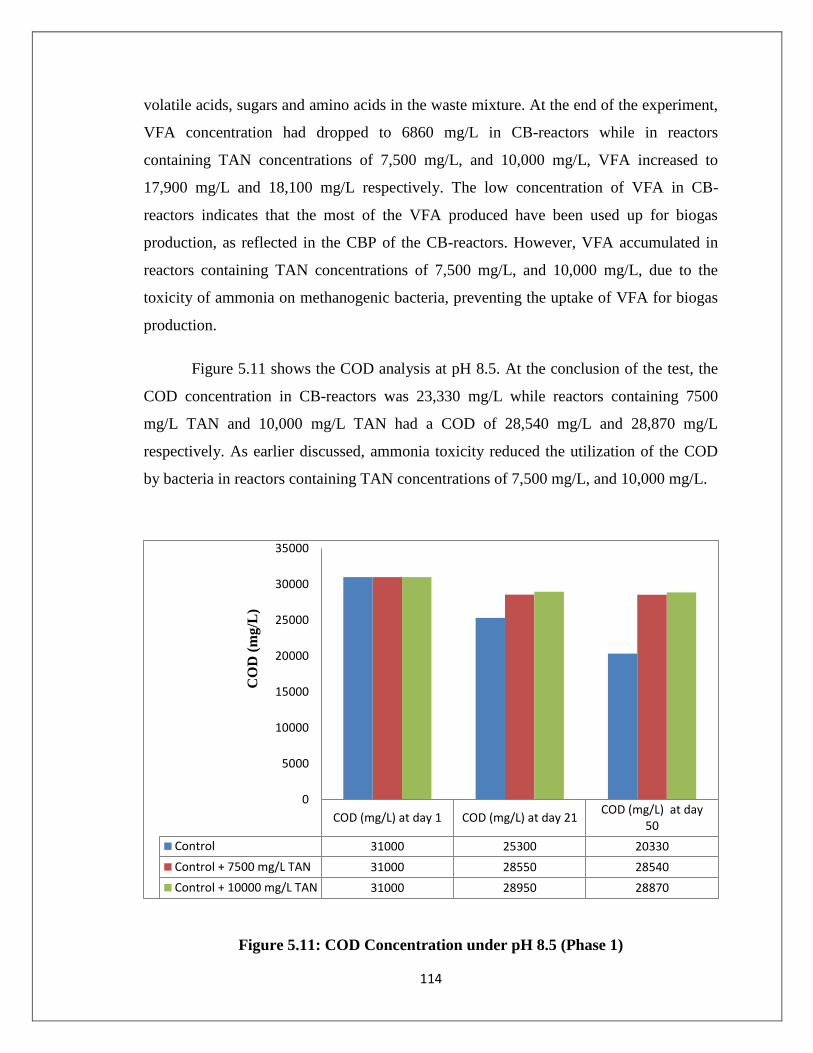
114
volatile acids, sugars and amino acids in the waste mixture. At the end of the experiment,
VFA concentration had dropped to 6860 mg/L in CB-reactors while in reactors
containing TAN concentrations of 7,500 mg/L, and 10,000 mg/L, VFA increased to
17,900 mg/L and 18,100 mg/L respectively. The low concentration of VFA in CB-
reactors indicates that the most of the VFA produced have been used up for biogas
production, as reflected in the CBP of the CB-reactors. However, VFA accumulated in
reactors containing TAN concentrations of 7,500 mg/L, and 10,000 mg/L, due to the
toxicity of ammonia on methanogenic bacteria, preventing the uptake of VFA for biogas
production.
Figure 5.11 shows the COD analysis at pH 8.5. At the conclusion of the test, the
COD concentration in CB-reactors was 23,330 mg/L while reactors containing 7500
mg/L TAN and 10,000 mg/L TAN had a COD of 28,540 mg/L and 28,870 mg/L
respectively. As earlier discussed, ammonia toxicity reduced the utilization of the COD
by bacteria in reactors containing TAN concentrations of 7,500 mg/L, and 10,000 mg/L.
Figure 5.11: COD Concentration under pH 8.5 (Phase 1)
COD (mg/L) at day 1 COD (mg/L) at day 21COD (mg/L) at day
50
Control 31000 25300 20330
Control + 7500 mg/L TAN 31000 28550 28540
Control + 10000 mg/L TAN 31000 28950 28870
0
5000
10000
15000
20000
25000
30000
35000
CO
D (
mg/L
)

115
The alkalinity analysis at operating pH of 8.5 is presented in Figure 5.12. Similar
to the results obtained at pH 7.5, alkalinity increased as the concentration of TAN in the
reactors increased. At the end of the experiment, alkalinity reached as high as 16,400
mg/L and 18,500 mg/L in reactors containing 7,500 mg/L and 10,000 mg/L of TAN
respectively. The high alkalinity caused by high TAN concentrations in the reactors
resulted in toxicity to the methanogenic bacteria as reflected in the low CBP in these
reactors.
Figure 5.12: Alkalinity concentration under pH 8.5 (Phase 1)
5.3.2 The effect of pH
The effect of the operating pH on methanogenic activity was very significant throughout
this study. A comparison of the CBP from reactors having similar initial TAN
Alkalinity (mg/L) at
day 1
Alkalinity (mg/L) at
day 21
Alkalinity (mg/L)
at day 50
Control 6510 9200 6538
Control + 7500 mg/L TAN 10750 16400 16400
Control + 10000 mg/L TAN 12250 18600 18500
0
2000
4000
6000
8000
10000
12000
14000
16000
18000
20000
Alk
ali
nit
y (
mg/L
)

116
concentrations at different pH values of 7.5, and 8.5 is shown in Figure 5.13 and Figure
5.14. For CB-reactors (Figure 5.13) CBP of 2854 mL was produced at pH 7.5, compared
with CBP of 1624 mL produced at pH 8.5. This implies that CB-reactors operating at pH
8.5 produced 43% lesser biogas compared with CB-reactors operating at pH 7.5. This
significant difference in biogas production may be attributed to the fact that the pH of 8.5
is not in the favourable pH range of 6.5-7.5 for methanogenic bacteria (Mohan et al.,
2008)
Figure 5.13: Cumulative Biogas Production under pH 7.5 vs pH 8.5 (Phase 1)
Also, the significant difference in CBP may be attributed to the difference in composition
of the FAN in TAN concentrations at the different operating pH values of 7.5 and 8.5 as
shown in Figure 5.15 and Table 5.3.
Throughout the study TAN concentrations in all the reactors were approximately
equal but the FAN concentrations varied and increased with increasing pH and TAN
concentration. FAN concentration reached as high as 278 mg/L at pH 8.5, while FAN
concentration was just 34 mg/L at pH 7.5 at the end of the test. This shows that FAN
0
500
1000
1500
2000
2500
3000
0 10 20 30 40 50 60
Cu
mu
lati
ve
Bio
gas
Pro
du
ctio
n (
mL
)
Time (Day)
Control - pH 7.5 Control - pH 8.5
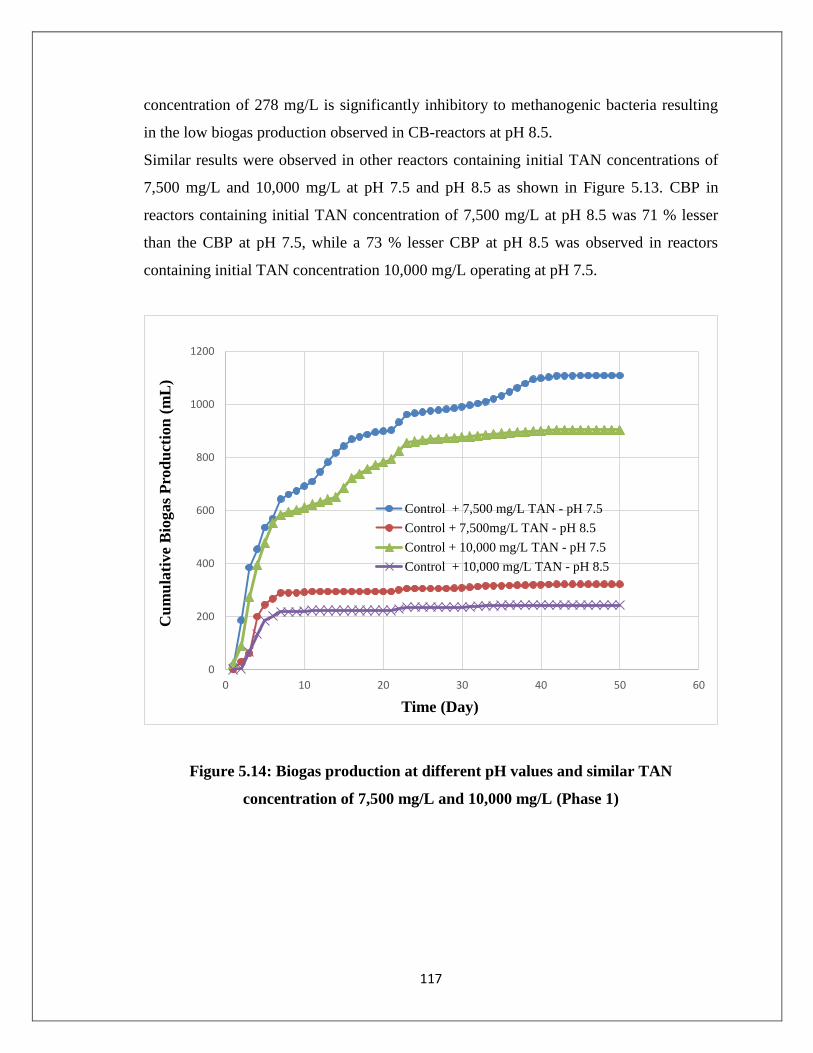
117
concentration of 278 mg/L is significantly inhibitory to methanogenic bacteria resulting
in the low biogas production observed in CB-reactors at pH 8.5.
Similar results were observed in other reactors containing initial TAN concentrations of
7,500 mg/L and 10,000 mg/L at pH 7.5 and pH 8.5 as shown in Figure 5.13. CBP in
reactors containing initial TAN concentration of 7,500 mg/L at pH 8.5 was 71 % lesser
than the CBP at pH 7.5, while a 73 % lesser CBP at pH 8.5 was observed in reactors
containing initial TAN concentration 10,000 mg/L operating at pH 7.5.
Figure 5.14: Biogas production at different pH values and similar TAN
concentration of 7,500 mg/L and 10,000 mg/L (Phase 1)
0
200
400
600
800
1000
1200
0 10 20 30 40 50 60
Cu
mu
lati
ve
Bio
gas
Pro
du
ctio
n (
mL
)
Time (Day)
Control + 7,500 mg/L TAN - pH 7.5
Control + 7,500mg/L TAN - pH 8.5
Control + 10,000 mg/L TAN - pH 7.5
Control + 10,000 mg/L TAN - pH 8.5

118
Figure 5.15: % of FAN in TAN as a function of pH and temperature.
Table 5.3: Percentage of FAN in TAN as a function of pH and temperature.
Initial
TAN
(mg/L)
pH FAN
(mg/L)
%
FAN
Final
TAN
(mg/L)
pH FAN
(mg/L)
%
FAN
650 7.50 22 3 1010 7.48 34 3
7500 7.50 255 3 7870 7.51 274 3
10000 7.50 340 3 10450 7.53 380 4
650 8.50 169 26 1050 8.51 278 26
7500 8.50 1952 26 8100 8.49 2073 26
10000 8.50 2603 26 10420 8.52 2806 27
0
5
10
15
20
25
30
7.40 7.60 7.80 8.00 8.20 8.40 8.60
% o
f F
AN
in
TA
N
pH

119
The volume of methane produced per gram of COD degraded is presented in Table 5.4.
Across all the operating pH levels examined, the volume of methane produced per gram
of COD degraded (CODd) reduced as the TAN concentrations in the systems increased.
CB-reactors produced 278 mL CH4 /g CODd and 256 mL CH4 /g CODd at pH 7.5 and pH
8.5 respectively. However, reactors containing TAN concentrations of 7500 mg/L and
10,000 mg/L had 240 mL CH4 /g CODd, and 32 mL CH4 /g CODd at pH 7.5. Similar
trends were observed in other pH levels as shown in Table 5.4. Across all pH levels,
reactors containing TAN concentrations of 7500 mg/L and 10,000 mg/L had the least
methane gas produced per gram of CODd. Although the volumes of methane produced
per of COD obtained are lesser than the standard 350 mL CH4 /g COD, The volume of
methane produced per gram of CODd by CB-reactors fall within the ranges reported in
the literature (Alqaralleh et al., 2015)
Table 5.4: Methane produced per gram of COD degraded
BMP pH 7.5 pH 8.5
mL CH4 / g
CODd
mL CH4 / g
CODd
Control 278 256
Control + 7500 mg/L TAN 240 52
Control + 10000 mg/L TAN 32 7
5.3.3 Phase 2 - Gradual TAN Loading - (SW+L)
In order to examine the possibility of adapting the mesophilic bacteria, TAN
concentration was increased gradually at 1000 mg/L-TAN weekly, at operating pH values
of 7.5 and 8.5. Unlike reactors operating at pH 8.5, the inhibitory effect of TAN on
biogas production was insignificant in at pH 7.5 in the first week.
The average DBP from the reactors when TAN loading was 1000 mg/L in the first
week was 138 mL/d, at pH 7.5, about 7 ml/d lesser than the average DBP from CB-
reactors at operating at pH 7.5. However, at pH 8.5, the reactors under gradual TAN
loading had average DBP of 84 mL/d, 32% lesser than the average DBP from CB-
reactors operating at pH 8.5. In the second week, with TAN concentration reaching 2,350
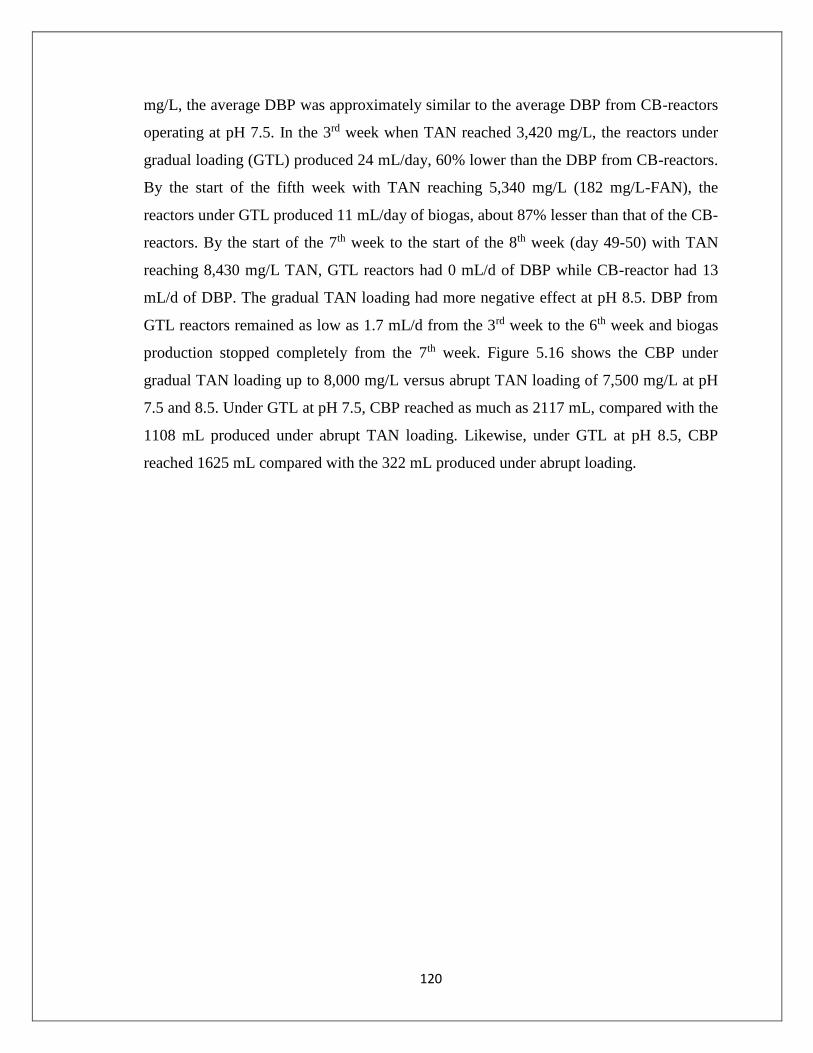
120
mg/L, the average DBP was approximately similar to the average DBP from CB-reactors
operating at pH 7.5. In the 3rd week when TAN reached 3,420 mg/L, the reactors under
gradual loading (GTL) produced 24 mL/day, 60% lower than the DBP from CB-reactors.
By the start of the fifth week with TAN reaching 5,340 mg/L (182 mg/L-FAN), the
reactors under GTL produced 11 mL/day of biogas, about 87% lesser than that of the CB-
reactors. By the start of the 7th week to the start of the 8th week (day 49-50) with TAN
reaching 8,430 mg/L TAN, GTL reactors had 0 mL/d of DBP while CB-reactor had 13
mL/d of DBP. The gradual TAN loading had more negative effect at pH 8.5. DBP from
GTL reactors remained as low as 1.7 mL/d from the 3rd week to the 6th week and biogas
production stopped completely from the 7th week. Figure 5.16 shows the CBP under
gradual TAN loading up to 8,000 mg/L versus abrupt TAN loading of 7,500 mg/L at pH
7.5 and 8.5. Under GTL at pH 7.5, CBP reached as much as 2117 mL, compared with the
1108 mL produced under abrupt TAN loading. Likewise, under GTL at pH 8.5, CBP
reached 1625 mL compared with the 322 mL produced under abrupt loading.

121
Figure 5.16: Biogas production under gradual and abrupt TAN loadings at pH 7.5
and pH 8.5 (Phase 2)
The COD analysis under gradual TAN loading is presented in Figure 5.17. The study
shows that the COD consumption rate decreased as the concentration of TAN added
increased. At the end of the study, COD concentrations in the reactors reduced to 17,100
mg/L, and 28,150 mg/L at pH 7.5 and 8.5 respectively. The observed difference in the
effluent COD concentrations can be attributed to the fact FAN concentration inhibited the
utilization of the COD for biogas production by the methanogens, especially at 8.5. As
discussed earlier, FAN accumulation and inhibition increase with increasing pH and
temperature.
0
500
1000
1500
2000
2500
3000
0 10 20 30 40 50 60
Cu
mu
lati
ve
Bio
gas
Pro
du
ctio
n (
mL
)
Time (days)
Gradual Loading - pH 7.5
Abrupt 7500 mg/L TAN Loading - pH 7.5
Abrupt 7500 mg/L TAN Loading - pH 8.5
Gradual Loading - pH 8.5

122
Figure 5.17: COD concentration under gradual TAN loadings at pH 7.5 vs 8.5
(Phase 2)
Figure 5.18 shows the analysis of the VFA under gradual TAN loading. At the beginning
of the experiment, VFA concentr Table 3.2ations in the reactors were 2072 mg/L, 2320
mg/L at pH of 7.5, and 8.5 respectively. At the end of 21 days, VFA concentrations in the
reactors had increased to 9530 mg/L, and 15400 mg/L at pH of 7.5, and 8.5 respectively.
With gradual TAN loading up to 8430 mg/L at the end of the test, VFA concentration
reduced to 9180 mg/L at pH 7.5, 8.0 and increased to 17,500 mg/L at 8.5. This implies
that at the pH of 7.5, the methanogens were able to utilize the bulk of the VFA for biogas
production than at pH 8.5.
COD (mg/L) at day 1 COD (mg/L) at day 21 COD (mg/L) at day 50
pH 7.5 31000 23200 17100
pH 8.5 31000 28250 28150
0
5000
10000
15000
20000
25000
30000
35000
CO
D (
mg
/L)
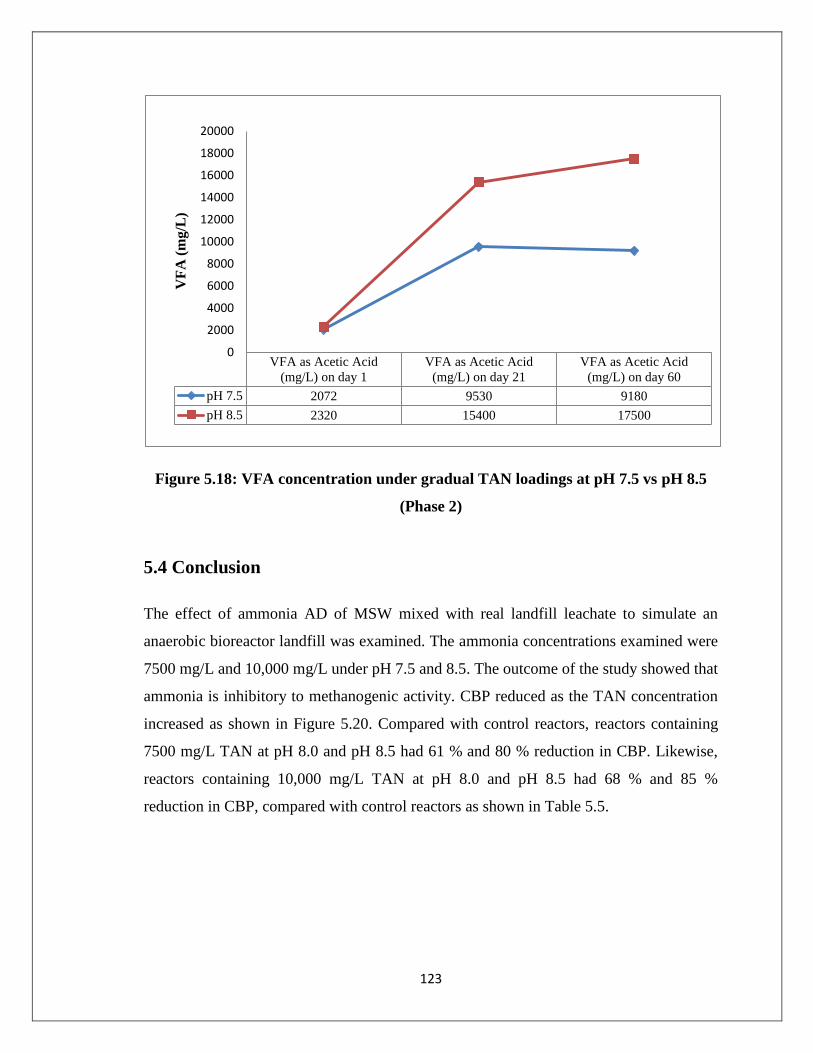
123
Figure 5.18: VFA concentration under gradual TAN loadings at pH 7.5 vs pH 8.5
(Phase 2)
5.4 Conclusion
The effect of ammonia AD of MSW mixed with real landfill leachate to simulate an
anaerobic bioreactor landfill was examined. The ammonia concentrations examined were
7500 mg/L and 10,000 mg/L under pH 7.5 and 8.5. The outcome of the study showed that
ammonia is inhibitory to methanogenic activity. CBP reduced as the TAN concentration
increased as shown in Figure 5.20. Compared with control reactors, reactors containing
7500 mg/L TAN at pH 8.0 and pH 8.5 had 61 % and 80 % reduction in CBP. Likewise,
reactors containing 10,000 mg/L TAN at pH 8.0 and pH 8.5 had 68 % and 85 %
reduction in CBP, compared with control reactors as shown in Table 5.5.
VFA as Acetic Acid
(mg/L) on day 1
VFA as Acetic Acid
(mg/L) on day 21
VFA as Acetic Acid
(mg/L) on day 60
pH 7.5 2072 9530 9180
pH 8.5 2320 15400 17500
0
2000
4000
6000
8000
10000
12000
14000
16000
18000
20000
VF
A (
mg
/L)

124
Figure 5.19: Cumulative biogas production versus TAN concentration
Table 5.5: Percentage reduction in biogas compared with control reactors
% Reduction in Biogas Production
BMP pH 7.5 pH 8.5
Control + 7500 mg/L TAN 61 80
Control + 10,000 mg/L TAN 68 85
The study also showed that pH influenced the inhibitory capacity and the FAN
component of TAN. At high pH (i.e. 8.5), FAN component of TAN was about 26 % and
was inhibitory to the methanogens. Results also showed that mesophilic bacteria could be
adapted to a TAN concentration of about 5000 mg/L at pH 7.5 through gradual TAN
loading.
0
500
1000
1500
2000
2500
3000
0 2000 4000 6000 8000 10000 12000Cu
mu
lati
ve
bio
ga
s p
rod
uct
ion
(m
L)
TAN Concentration (mg/L)
pH 7.5 pH 8.5
125
References
Alqaralleh, R., Delatolla, R., & Kennedy, K. (2015). Anaerobic digestion of simulated-
organic fraction of municipal solid waste: effect of alkaline
pretreatment. International Journal of Environment and Waste Management, 16
(2), 166-185.
Angelidaki, I., & Ahring, B. K. (1994). Anaerobic thermophilic digestion of manure at
different ammonia loads: effect of temperature. Water Research, 28(3), 727-731.
Angelidaki, I., Ellegaard, L., & Ahring, B. K. (1993). A mathematical model for dynamic
simulation of anaerobic digestion of complex substrates: focusing on ammonia
inhibition. Biotechnology and Bioengineering, 42(2), 159-166.
Ara, E. (2012). Anaerobic Co-digestion of Organic Fraction of Municipal Solid Waste
and Municipal Sludge With and Without Microwave Pre-treatment (Doctoral
dissertation, University of Ottawa).
Ara, E., Sartaj, M., & Kennedy, K. (2014). Effect of microwave pre-treatment of
thickened waste activated sludge on biogas production from co-digestion of
organic fraction of municipal solid waste, thickened waste activated sludge and
municipal sludge. Waste Management & Research, 32(12), 1200-1209.
Ara, E., Sartaj, M., & Kennedy, K. (2015). Enhanced biogas production by anaerobic co-
digestion from a trinary mix substrate over a binary mix substrate. Waste
Management & Research, 33(6), 578-587.
Bhattacharya, S. K., & Parkin, G. F. (1989). The effect of ammonia on methane
fermentation processes. Journal (Water Pollution Control Federation), 55-59.
Blomgren, A., Hansen, A., & Svensson, B. H. (1990).Enrichment of a mesophilic,
syntrophic bacterial consortium converting acetate to methane at high ammonium
concentrations. In Microbiology and Biochemistry of Strict Anaerobes involved in
Interspecies Hydrogen Transfer (pp. 225-234). Springer US.
Braun, R., Huber, P., & Meyrath, J. (1981). Ammonia toxicity in liquid piggery manure
digestion. Biotechnology Letters, 3(4), 159-164.

126
Dong, S., & Sartaj, M. (2015). Statistical analysis of thermal and non-thermal effects of
sequential microwave/aeration process for the removal of ammonia from aqueous
solution. Desalination and Water Treatment, 1-11.
El Hadj, T. B., Astals, S., Gali, A., Mace, S., & Mata-Alvarez, J. (2009). Ammonia
influence in anaerobic digestion of OFMSW. Water Science and
Technology, 59(6), 1153.
Hansen, K. H., Angelidaki, I., & Ahring, B. K. (1998). Anaerobic digestion of swine
manure: inhibition by ammonia. Water research, 32(1), 5-12.
Institute of Wastes Management Sustainable Landfill Working Group. (1999). The Role
and Operation of the Flushing Bioreactor. CIT0033.
Jung, J. Y., Chung, Y. C., Shin, H. S., & Son, D. H. (2004). Enhanced ammonia nitrogen
removal using consistent biological regeneration and ammonium exchange of
zeolite in modified SBR process. Water Research, 38(2), 347-354.
Koster, I. W., & Lettinga, G. (1988). Anaerobic digestion at extreme ammonia
concentrations. Biological Wastes, 25(1), 51-59.
Mata-Alvarez, J., Mace, S., & Llabres, P. (2000). Anaerobic Digestion of Organic Solid
Wastes. An Overview of Research Achievements and Perspective. Bioresource
Technology, 74, 3–16.
McCarty, P. L., & McKinney, R. E. (1961). Salt toxicity in anaerobic digestion. Journal
(Water Pollution Control Federation), 399-415.
Nair, A., Sartaj, M., Kennedy, K., & Coelho, N. M. (2014).Enhancing biogas production
from anaerobic biodegradation of the organic fraction of municipal solid waste
through leachate blending and recirculation. Waste Management &
Research, 32(10), 939-946.
Pacey, J. P., RaminYazdani, D. Reinhart, R. Morck, D. Augenstein (1999). The
Bioreactor Landfill: An Innovation in Solid Waste Management. SWANA, Silver
Springs, Maryland
Pfeffer, J. T. (1974). Temperature effects on anaerobic fermentation of domestic
refuse. Biotechnology and Bioengineering, 16(6), 771-787.
Reinhart, D. R., McCreanor, P. T., & Townsend, T. (2002). The bioreactor landfill: Its
status and future. Waste Management & Research, 20(2), 172-186.

127
Shahriari, H., Warith, M., Hamoda, M., & Kennedy, K. J. (2012). Anaerobic digestion of
organic fraction of municipal solid waste combining two pretreatment modalities,
high temperature microwave and hydrogen peroxide. Waste Management, 32(1),
41-52.
Shanmugam, P., & Horan, N. J. (2009). Optimising the biogas production from leather
fleshing waste by co-digestion with MSW. Bioresource Technology, 100(18),
4117-4120.
Sossa K, Alarcon M, Aspe E, & Urrutia H. (2004). Effect of ammonia on the
methanogenic activity of methylaminotrophic methane producing archaea
enriched biofilm Anaerobe 2004; 10:13–8.
Speece, R. E. (1983). Anaerobic biotechnology for industrial wastewater
treatment. Environmental science & technology, 17(9), 416A-427A
Staley, B. F., & Barlaz, M. A. (2009). Composition of municipal solid waste in the
United States and implications for carbon sequestration and methane
yield. Journal of Environmental Engineering.
Webb, A. R., & Hawkes, F. R. (1985). The anaerobic digestion of poultry manure:
variation of gas yield with influent concentration and ammonium-nitrogen
levels. Agricultural Wastes, 14(2), 135-156.
Wiegant, W. M., & Zeeman, G. (1986). The mechanism of ammonia inhibition in the
thermophilic digestion of livestock wastes. Agricultural wastes, 16(4), 243-253.
World Bank (2015). What a Waste – A Global Review of Solid Waste Management
Yenigün, O., & Demirel, B. (2013). Ammonia inhibition in anaerobic digestion: a
review. Process Biochemistry, 48(5), 901-911.
128
Chapter 6
Conclusions and Recommendations
6.1 Conclusions
Results of this research confirmed that ammonia is inhibitory to methanogenic activity,
especially at high TAN concentrations (i.e. 7500 mg/L and 10,000 mg/L) and pH 8.5.
Reactors containing 7500 mg/L and 10,000 mg/L had as much as 80-85 % reduction in
CBP, compared with control reactors.
The operating pH had a significant influence on the inhibitory capacity and the
FAN component of TAN. At operating pH of 8.5, FAN made up about 27 % of TAN,
causing extreme toxicity. Results also confirmed that through gradual ammonia loading,
bacteria may become adapted to high ammonia concentrations. Gradual ammonia loading
enhanced the ability of mesophilic bacteria to adapt to as much as 5000 mg/L TAN (at
pH 7.5). Results also show that operating the reactors in the semi-continuous mode by
replacing 3g of digestate containing high TAN concentrations of 7500 mg/L and 10,000
mg/L with 3 g fresh substrate improved the activity of the mesophilic bacteria.
The effect ammonia on AD of OFMSW with real landfill leachate with anaerobic
inoculums leachate to simulate an anaerobic landfill was also studied. Similar results
were obtained as in OFMSW digested using only mesophilic anaerobic inoculums. The
inhibitory effect of TAN also increased with pH and FAN. Compared with control
reactors, reactors containing 7500 mg/L TAN and 10,000 mg/L TAN had about 80-85 %
reduction in CBP.
6.2 Future Work
This study confirms the toxicity of ammonia on methanogenic activity during anaerobic
digestion. The possibility of adapting bacteria to high ammonia concentrations needs to
be studied on a larger scale and possibly on a field scale, instead of batch reactors. The

129
possibility of operating digesters treating waste containing high ammonia concentrations
like piggery and poultry wastes should be studied as a larger scale. Also, the toxicity of
ammonia may be reduced by adding low cost absorbent materials such as zeolite to the
feed.

130
Appendix
Appendix A
A. 1a. Procedure for measuring COD (Method 8000, Hach USA)
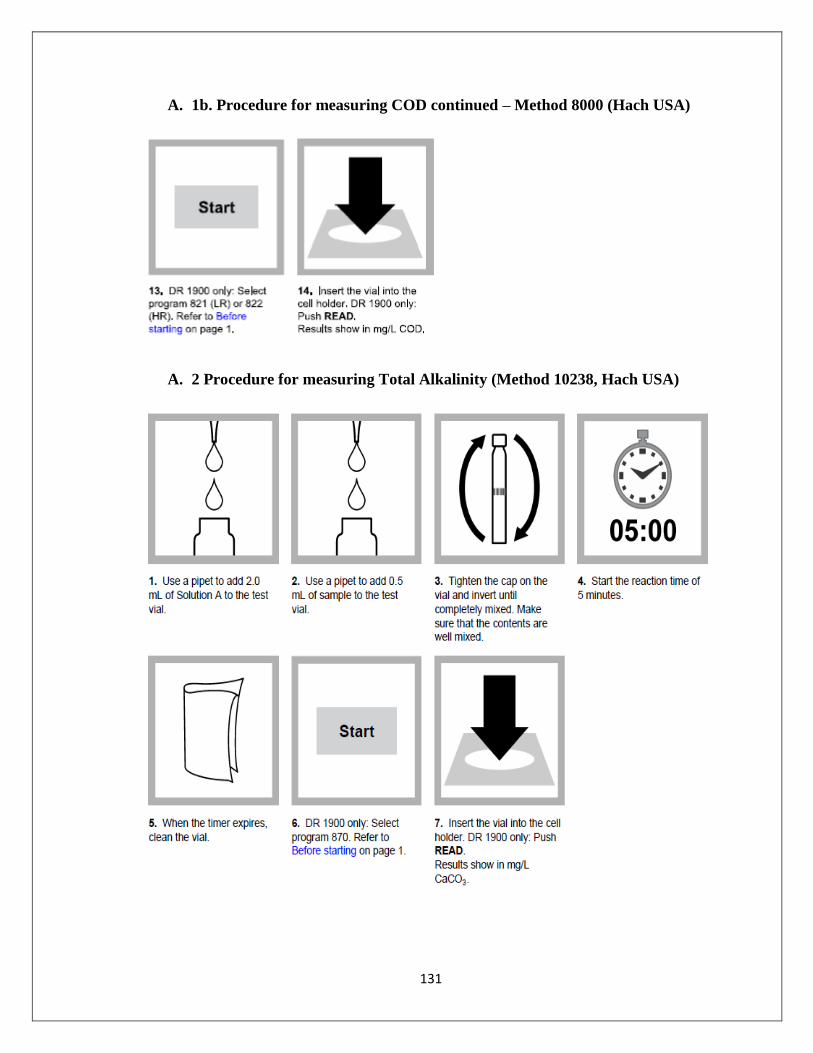
131
A. 1b. Procedure for measuring COD continued – Method 8000 (Hach USA)
A. 2 Procedure for measuring Total Alkalinity (Method 10238, Hach USA)

132
A. 3 Procedure for measuring Total Ammonia Nitrogen (TAN), (Method 10205
Hach USA)

133
A. 4 Procedure for measuring Volatile Acids as Acetate (Method 10240, Hach
USA).

134
Appendix B
HRT
(days)
Digestate
Removed
(g)
fresh
substrate
added
(g)
Schematic diagram
4
3
3
7
3
3
15
3
3
3 gm of fresh substrate
3 gm of digestate
3 gm of fresh substrate
3 gm of digestate
3 gm of digestate
3 gm of fresh substrate

135
Appendix C
U-tube Manometer