Embed Size (px)
Citation preview

The Effects of Acid Rain on Algal
GrowthAlex Zapinski
Pittsburgh Central Catholic
PJAS 2015
Grade 9

Acid Rain Contains high amounts of nitric and sulfuric
acids Created by emissions of sulfur dioxide and
nitrogen oxides. Emissions come from both natural and man
made factors Can be deposited onto the earth in two
forms: dry and wet deposition

AlgaeLarge and diverse group of
eukaryotic organisms, typically autotrophs
Base of all aquatic food chainsUsed as a bio-indicator for aquatic
ecosystems

Euglena gracilis Generally cylindrical in shape with many
flagella Common algal like protist Partial heterotroph- endocytosis and
photosynthesis Capable of surviving in both salt and
freshwater ecosystems A common lab subject

SpectrophotometryMeasures the amount of light that
passes through a medium at a set wavelength
Commonly used in physics, chemistry, biochemistry, material science, and molecular biology

Past studies Some limiting factors such as sulfuric acid can
cause algal blooms
Algal blooms can lead to the deoxygenization of the pond and death of other aquatic life
High concentrations of sulfuric acid have been shown to be a hindrance to the growth of algae

Interaction of Components Algae in nature is commonly affected by
acid rain, which can have devastating effects on the surrounding environment
The sulfuric acid affects the growth of the euglena
The spectrophotometer is used to measure the growth of the algae

PurposeTo determine if sulfuric acid has
significant effects on the growth of Euglena gracilis.

Hypothesis Null hypothesis- the sulfuric acid will not
have significant effects on the growth of Euglena gracilis
Alternative hypothesis- the sulfuric acid will have significant effects on the growth of Euglena gracilis

Materials Euglena gracilis 35 test tubes (13 x 100 mm culture tubes
borosilicate) Micro-pipettes Micro-pipette tips Spectrophotometer Test tube racks 0.1 M sulfuric acid Spring water Soil water
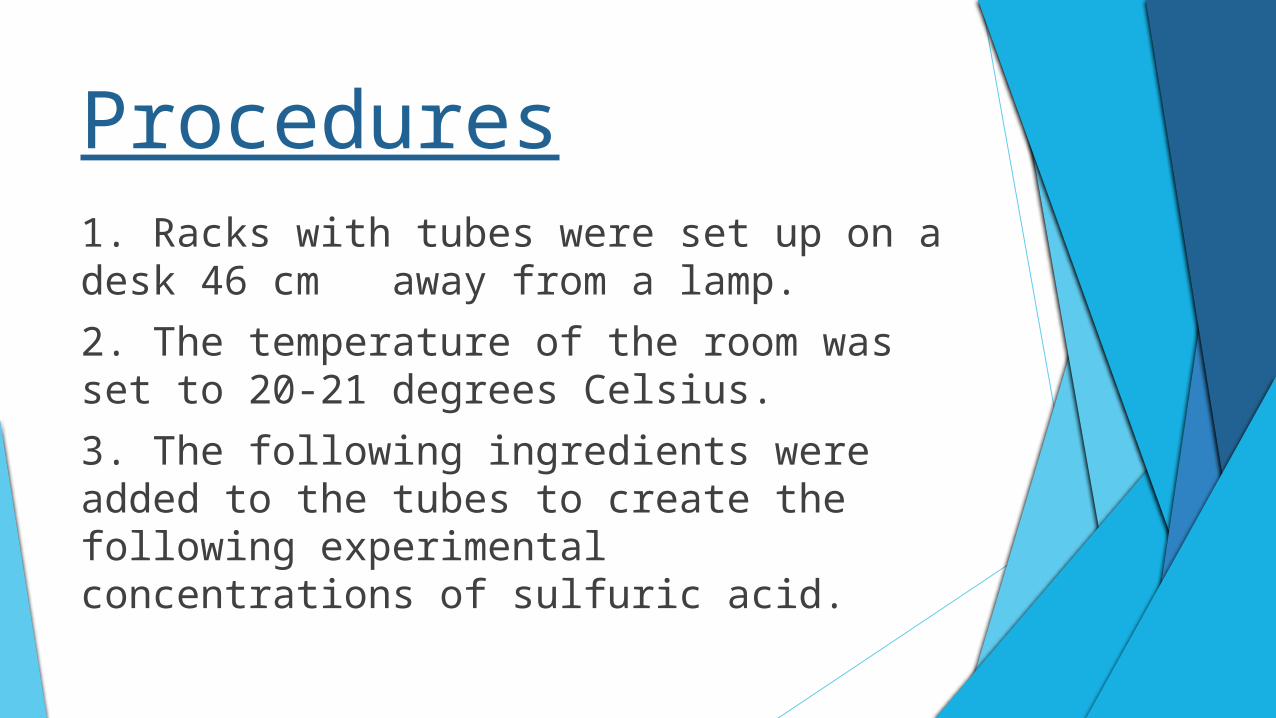
Procedures1. Racks with tubes were set up on a desk 46 cm away from a lamp.
2. The temperature of the room was set to 20-21 degrees Celsius.
3. The following ingredients were added to the tubes to create the following experimental concentrations of sulfuric acid.

Tube concentrations (mL)
Molarity
10-2 10-3 10-4
10-3 Substock
10-5
10-3 Substock
Control0
SulfuricAcid
0.5 0.05 0.5 0.05 0
Euglena 1 1 1 1 1
Soil Water
1 1 1 1 1
Spring Water
2.5 2.95 2.5 2.95 3
TotalVolume
5 5 5 5 5

4. The top of each tube was covered with wax paper and mixed by inversion.
5. The absorbance was taken at 430nm using a spectrophotometer.
6. Absorbance readings were taken every two days for 14 days.
Procedures (cont.)

Anova: Single Factor Analysis of data that compares variation
within groups to variation between the groups
Alpha: 0.05 If the p-value is below the alpha, then the
effects are significant

Day 1: 0.3795P-values:
430
nm Day 3: 10-13
Day 7: 10-11
Day 13: 10-22

Dunnett's Test Compares experimental groups back to the
control Determines which experimental groups
produced significant variation If T value > T-crit then the results were
significant

T-crit= 2.689
10-2
Sulfuric Acid
10-3 10-4 10-5
Day 3T-value
12 5.1 .632 1.288
Significance Significant Significant Not Sig. Not Sig.
Day 7T-value
13.748 4.208 0.705 2.114
Significance Significant Significant Not Sig. Not Sig.
Day 13T-value
29.2599 9.592 9.11 4.69
Significance Significant Significant Significant Significant

Conclusion Null hypothesis would be rejected for the
concentrations of 10-2 and 10-3
Null hypothesis would be accepted for the concentrations of 10-4 and 10-5 except for day 13

Limitations and ExtensionsLimitations- Health of Euglena? Controlled temperature
Extensions- Use more species of algae Use more replicates Use more concentrations of sulfuric acid Use concentrations of nitric acid The synergistic effects of sulfuric acid and
other chemicals

Works cited http://www.epa.gov/acidrain/index.html http://www.physics.ohio-state.edu/~kagan/
phy367/P367_articles/AcidRain/effects-on-lakes.html
http://www.fcps.edu/islandcreekes/ecology/euglena.htm
http://www.chemspider.com/Chemical-Structure.1086.html
Mark Krotec, PTEI
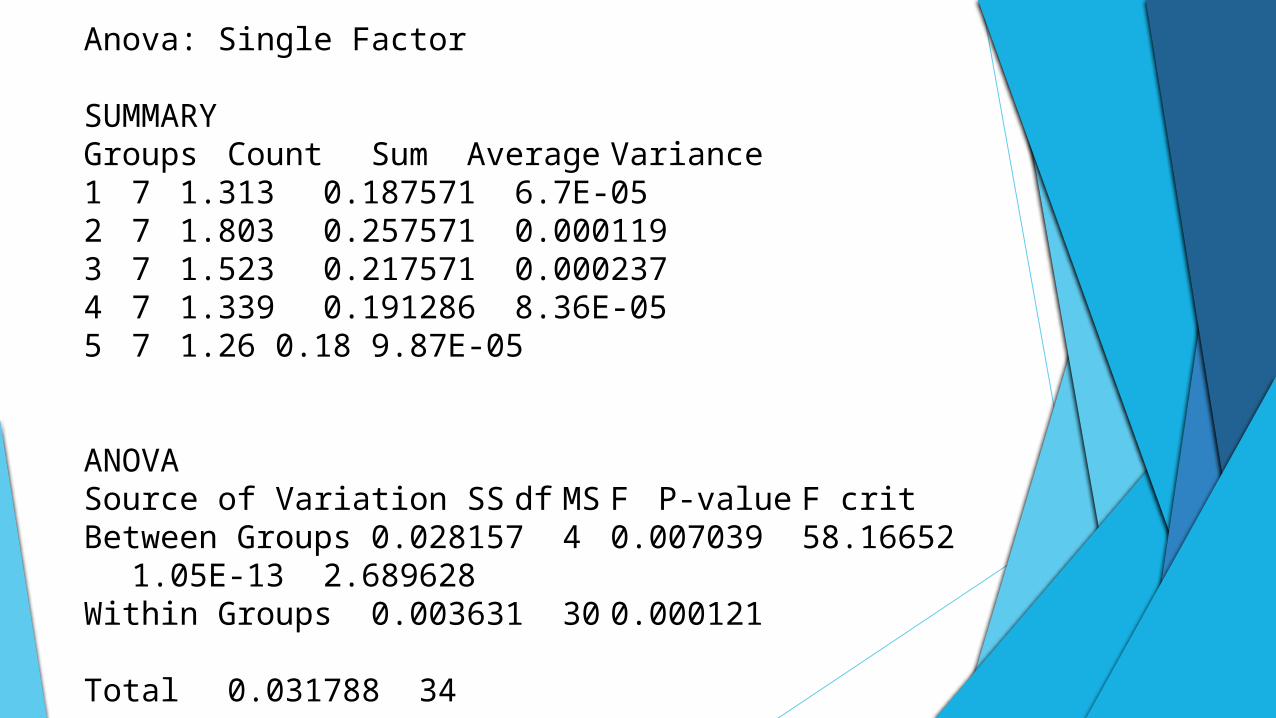
Anova: Single Factor
SUMMARYGroups CountSum Average Variance
1 7 1.3130.187571 6.7E-052 7 1.8030.257571 0.0001193 7 1.5230.217571 0.0002374 7 1.3390.191286 8.36E-055 7 1.26 0.18 9.87E-05
ANOVASource of Variation SS df MS F P-value F critBetween Groups 0.028157 4 0.00703958.16652 1.05E-13 2.689628Within Groups 0.003631 30 0.000121
Total 0.031788 34

Anova: Single Factor
SUMMARYGroups CountSum AverageVariance1 7 1.3130.187571 6.7E-05
2 7 1.8030.2575710.0001193 7 1.5230.2175710.0002374 7 1.3390.191286 8.36E-055 7 1.26 0.18 9.87E-05
ANOVA
Source of Variation SS dfMS F P-value F critBetween Groups 0.028157 40.007039 58.16652 1.05E-132.689628Within Groups 0.003631 300.000121Total 0.031788 34

Anova: Single Factor
SUMMARYGroups CountSum AverageVariance1 7 1.1760.1680.000108
2 7 1.7390.2484290.0003863 7 1.34 0.1914290.0003014 7 1.1070.158143 7.35E-055 7 1.0570.1510.000108
ANOVA
Source of Variation SS dfMS F P-value F critBetween Groups 0.043526 40.010882 55.70477 1.85E-132.689628Within Groups 0.00586 300.000195Total 0.049386 34

Anova: Single Factor
SUMMARYGroups CountSum AverageVariance2 7 2.0930.2996.97E-05
3 7 1.1620.1660.000938
4 7 1.0490.1498570.0001675 7 0.9130.130429 7.86E-05 0 0 #DIV/0! #DIV/0!
ANOVA
Source of Variation SS dfMS F P-value F critBetween Groups 0.122942 40.030735 93.99736 6.64E-142.795539Within Groups 0.007521 230.000327Total 0.130462 27