Embed Size (px)
Citation preview
University of MiamiScholarly Repository
Open Access Dissertations Electronic Theses and Dissertations
2010-07-29
The Effects of a Polynutrient Dietary Supplementon Physiological Measures and Mood State inResistance Trained MenThomas IncledonUniversity of Miami, [email protected]
Follow this and additional works at: https://scholarlyrepository.miami.edu/oa_dissertations
This Open access is brought to you for free and open access by the Electronic Theses and Dissertations at Scholarly Repository. It has been accepted forinclusion in Open Access Dissertations by an authorized administrator of Scholarly Repository. For more information, please [email protected].
Recommended CitationIncledon, Thomas, "The Effects of a Polynutrient Dietary Supplement on Physiological Measures and Mood State in ResistanceTrained Men" (2010). Open Access Dissertations. 661.https://scholarlyrepository.miami.edu/oa_dissertations/661
UNIVERSITY OF MIAMI
THE EFFECTS OF A POLYNUTRIENT DIETARY SUPPLEMENT ON PHYSIOLOGICAL MEASURES AND MOOD STATE IN RESISTANCE TRAINED
MEN
By
Thomas Incledon
A DISSERTATION
Submitted to the Faculty of the University of Miami
in partial fulfillment of the requirements for the degree of Doctor of Philosophy
Coral Gables, Florida
August 2010

©2010 Thomas Incledon
All Rights Reserved
UNIVERSITY OF MIAMI
A dissertation submitted in partial fulfillment of the requirements for the degree of
Doctor of Philosophy
THE EFFECTS OF A POLYNUTRIENT DIETARY SUPPLEMENT ON PHYSIOLOGICAL MEASURES AND MOOD STATE IN RESISTANCE TRAINED
MEN
Thomas Incledon Approved: ________________ _________________ Joseph F. Signorile, Ph.D. Terri A. Scandura, Ph.D. Professor of Exercise and Sport Sciences Dean of the Graduate School ________________ _________________ Arlette C. Perry, Ph.D. Sheah L. Rarback, M.A., R.D. Professor of Exercise and Sport Sciences Director, Nutrition Division ________________ Warren Whisenant, Ph.D. Professor of Exercise and Sport Sciences
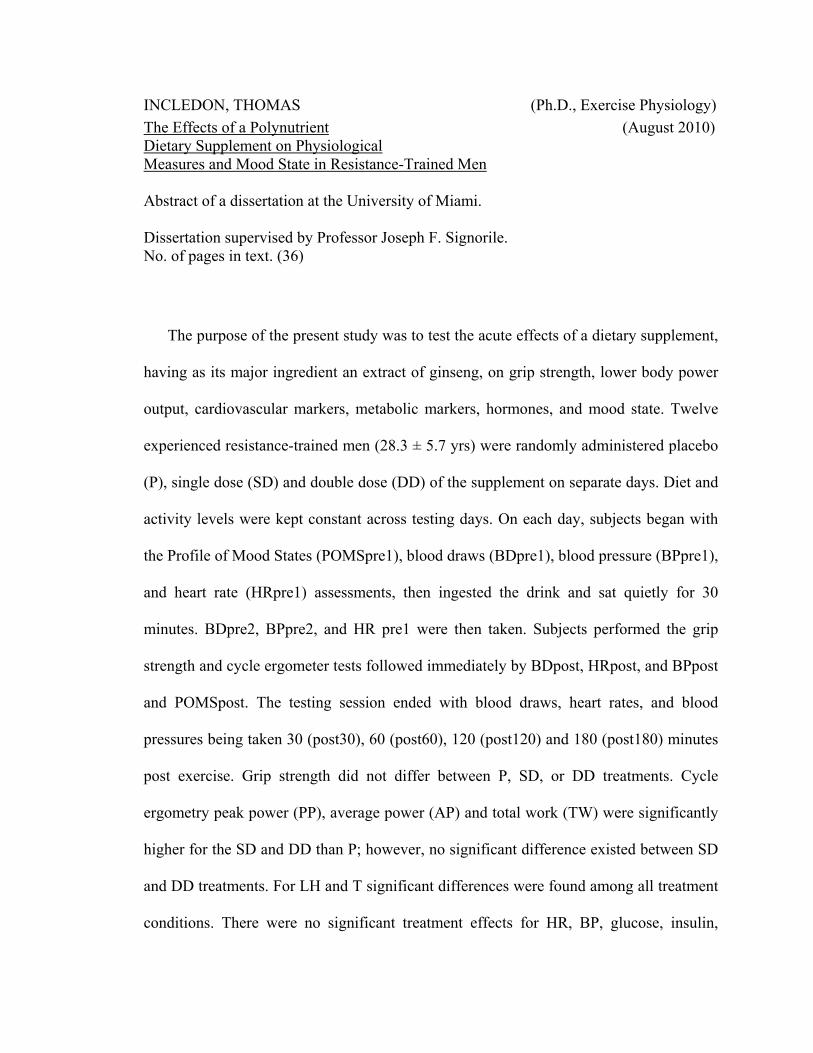
INCLEDON, THOMAS (Ph.D., Exercise Physiology)
The Effects of a Polynutrient (August 2010) Dietary Supplement on Physiological Measures and Mood State in Resistance-Trained Men Abstract of a dissertation at the University of Miami. Dissertation supervised by Professor Joseph F. Signorile. No. of pages in text. (36)
The purpose of the present study was to test the acute effects of a dietary supplement,
having as its major ingredient an extract of ginseng, on grip strength, lower body power
output, cardiovascular markers, metabolic markers, hormones, and mood state. Twelve
experienced resistance-trained men (28.3 ± 5.7 yrs) were randomly administered placebo
(P), single dose (SD) and double dose (DD) of the supplement on separate days. Diet and
activity levels were kept constant across testing days. On each day, subjects began with
the Profile of Mood States (POMSpre1), blood draws (BDpre1), blood pressure (BPpre1),
and heart rate (HRpre1) assessments, then ingested the drink and sat quietly for 30
minutes. BDpre2, BPpre2, and HR pre1 were then taken. Subjects performed the grip
strength and cycle ergometer tests followed immediately by BDpost, HRpost, and BPpost
and POMSpost. The testing session ended with blood draws, heart rates, and blood
pressures being taken 30 (post30), 60 (post60), 120 (post120) and 180 (post180) minutes
post exercise. Grip strength did not differ between P, SD, or DD treatments. Cycle
ergometry peak power (PP), average power (AP) and total work (TW) were significantly
higher for the SD and DD than P; however, no significant difference existed between SD
and DD treatments. For LH and T significant differences were found among all treatment
conditions. There were no significant treatment effects for HR, BP, glucose, insulin,

lactate, GH or PRL or for the POMS. There was a significant treatment*time interaction
for ACTH (p < .05). Post hoc analysis indicated that at Tpost ACTH was significantly
lower for D treatment vs P or S treatments (p < .05) and at Tpost60 ACTH was
significantly lower for S and D treatments vs P treatment (p < .05). There was significant
differences in C between the D treatment (260.45 ± 15.58 nmol•L-1) and the P (336.08 ±
27.59 nmol•L-1) and S (311.14 ± 21.01 nmol•L-1) treatments (p < .001). There was a
significant difference for T:C ratio values among P (0.0810 ± 0.0090), S (0.0960 ±
0.0130) and D (0.1410 ± 0.0190) treatments (p < .001). Acute ingestion of a polynutrient
supplement containing a standardized ginseng tract, was able to increase PP, AP, TW
LH, and testosterone and decrease ACTH and cortisol. No significant effects were found
for GH, PRL, insulin, glucose, lactate, HR, BP or POMS scores. Acute ingestion of a
polynutrient supplement was able to increase performance and the anabolic environment
in resistance trained men.
iii
TABLE OF CONTENTS
Page
LIST OF FIGURES ..................................................................................................... iv LIST OF TABLES ....................................................................................................... v Chapter 1: Introduction .............................................................................................. 1 Chapter 2: Methods .................................................................................................... 3 Chapter 3: Results ...................................................................................................... 12 Chapter 4: Discussion ................................................................................................ 16 Chapter 5: Summary and Conclusion ........................................................................ 19 References .................................................................................................. 20 Figures .................................................................................................. 23 Tables .................................................................................................. 30

iv
List of Figures
Figure 1. Study timeline. (23)
Figure 2. The effects of treatment on cycle ergometry peak and average power. (24)
Figure 3. The effect of treatment on total work during cycle ergometry. (25)
Figure 4. Differences in cycle ergometer peak power across trials. (26)
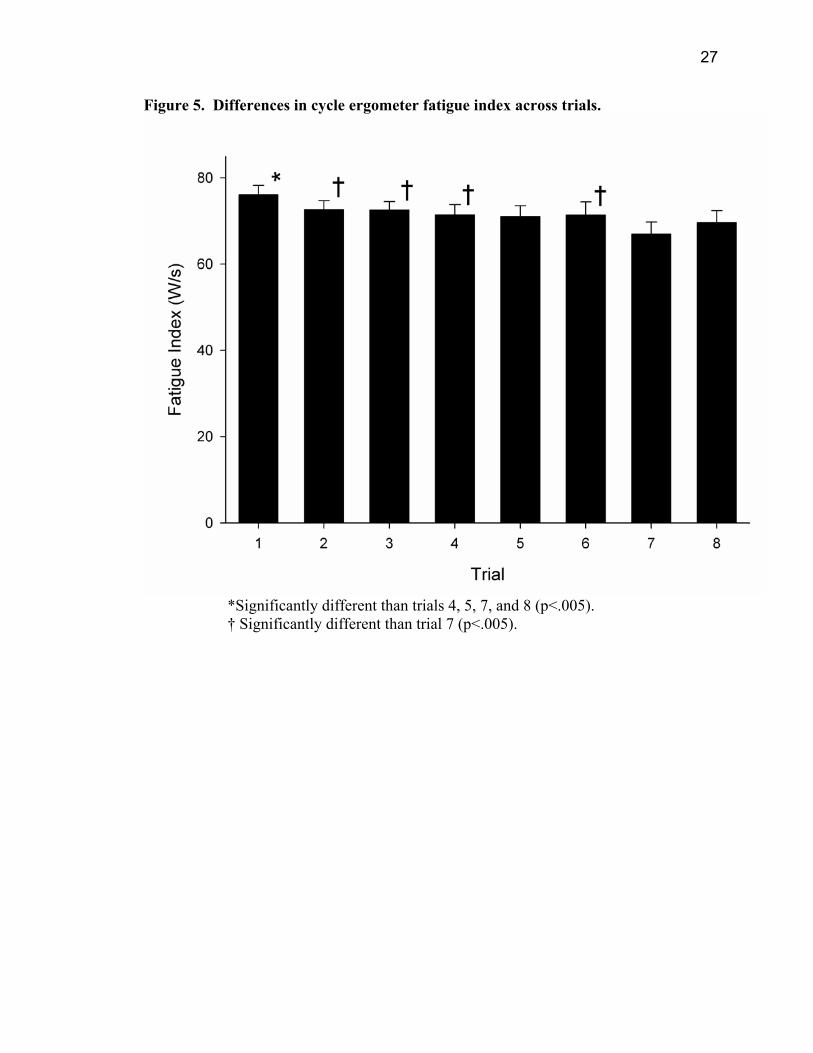
Figure 5. Differences in cycle ergometer fatigue index across trials. (27)
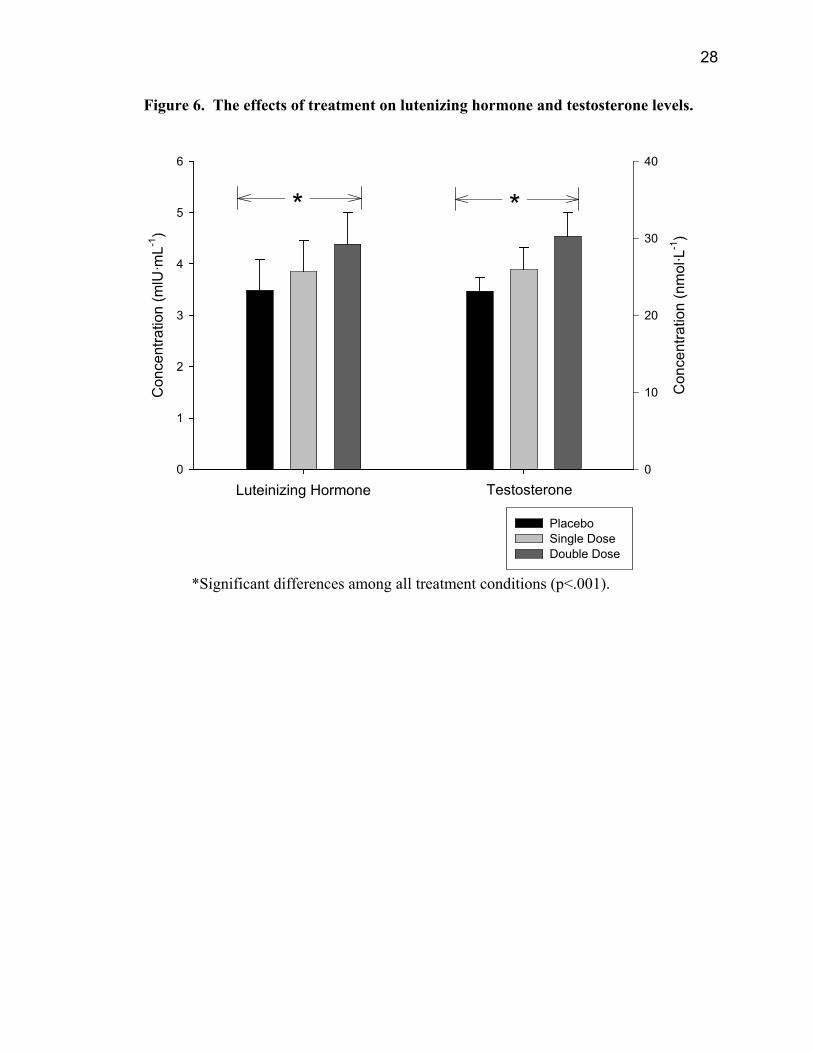
Figure 6. The effects of treatment on lutenizing hormone and testosterone levels. (28)
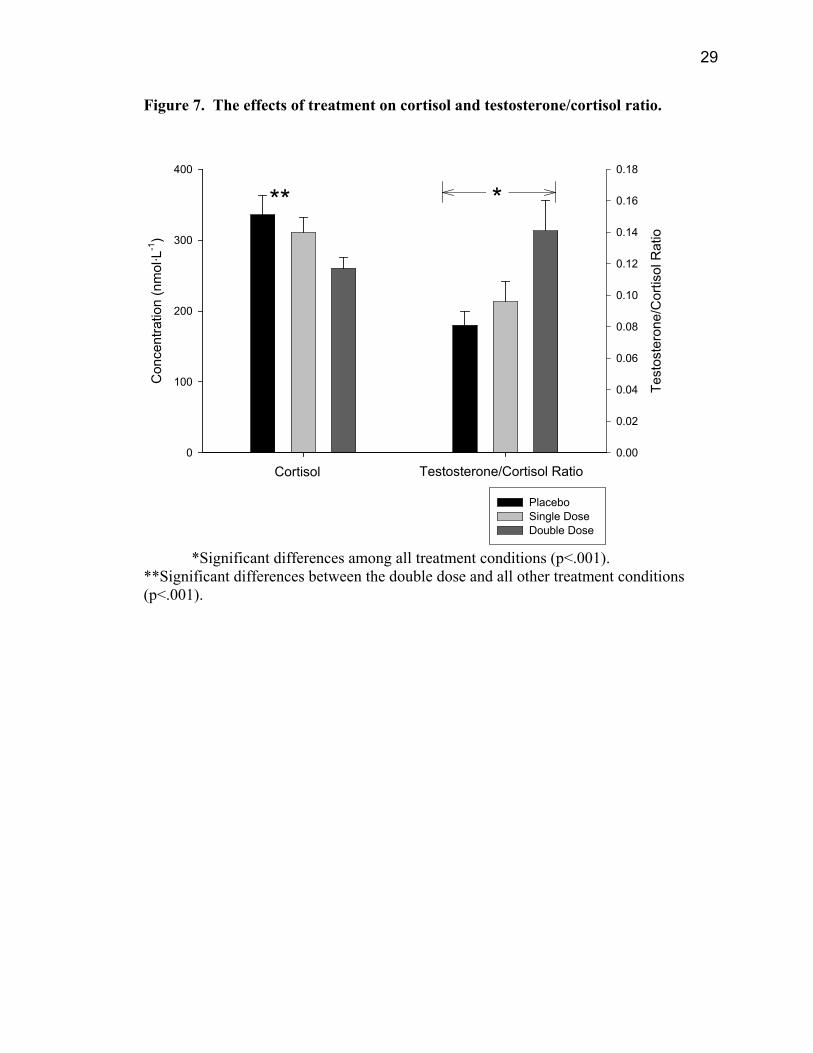
Figure 7. The effects of treatment on cortisol and testosterone/cortisol ratio. (29)
v
List of Tables
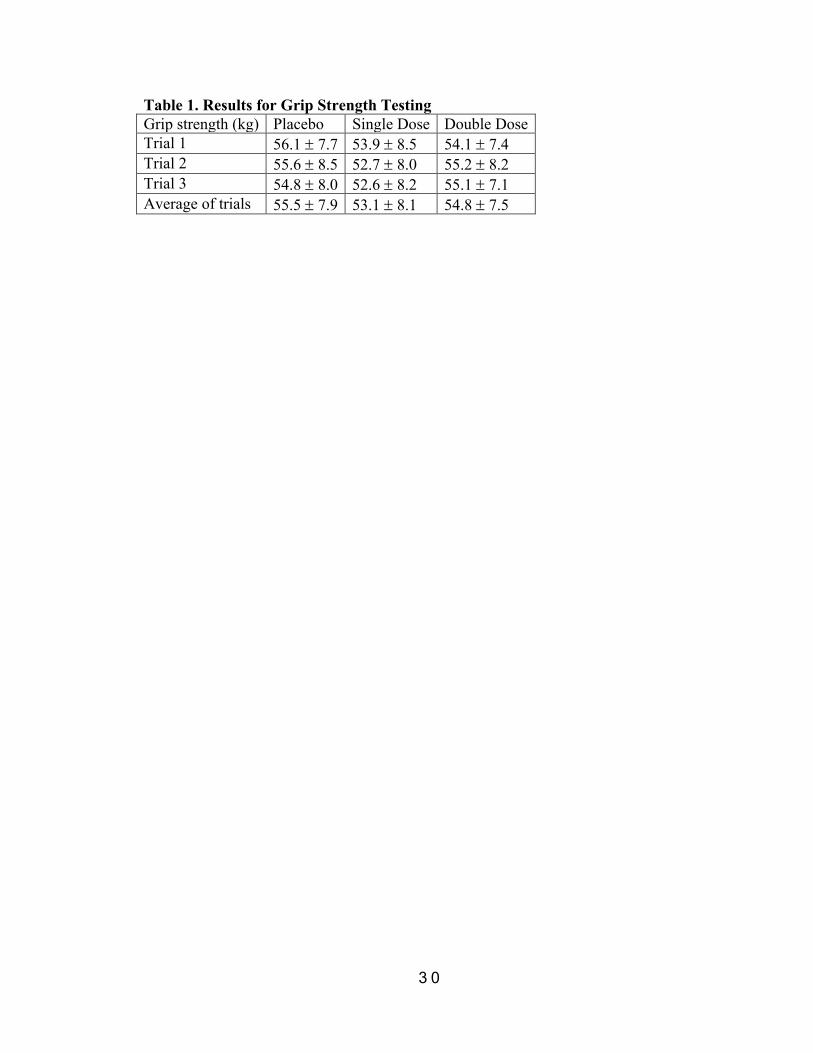
Table 1. Results for Grip Strength Testing. (30)
Table 2. Cardiovascular responses across time. (31)
Table 3. Metabolic response across time. (32)
Table 4. Changes in ACTH across time. (33)
Table 5. Changes in cortisol and testosterone/cortisol ratio across time points. (34)
Table 6. Changes in growth hormone and prolactin across time points. (35)
Table 7. T scores and TMDS for Profile of Mood States. (36)

1
Chapter 1: Introduction
The use of dietary supplements which contain a variety of nutrients is a common
practice among athletes and individuals concerned with maintaining a healthy lifestyle [1,
2]; however; the number of studies that have examined the effects of polynutrient dietary
supplements are limited. One rationale for consuming these products is the belief that
taking a number of dietary supplements simultaneously can increase the likelihood that a
given nutrient will be available in sufficient amounts to meet an individual’s needs during
physical or mental stress [3]. Another possible advantage is that ingesting multiple
supplements at the same time may provide greater benefits than if each were taken
independently.
One popular polynutrient dietary supplement, ProEndorphin (Nutraceutics Corp.,
Saint Louis, MO), contains a Panax ginseng (P. ginseng) extract and a number of other
ingredients including: thiamin hydrochloride, riboflavin 5-phosphate, niacin, pyridoxine
hydrochloride, cyanocobalamin, biotin, calcium-D-pantothenate, sodium, potassium, DL-
phenylalanine, 2-dimethylaminoethanol, kola nut extract, inositol, and taurine. These
ingredients have the potential to enhance performance through a number of mechanisms.
Caffeine has been shown to improve performance in both endurance and power-based
sports [4]. Additionally, DL-phenylalanine has been shown to improve mood [5]. And
finally, the combination of sodium citrate, taurine, glucuronolactone, caffeine, inositol,
niacinamide, calcium-D-pantothenate, pyridoxine hydrochloride, and cyanocobalamin
has been shown to improve physical performance and mood [6, 7].
Studies investigating P. ginseng extracts administered without other dietary
supplements have yielded mixed results. Acute treatment studies indicated no effect of P.
2
ginseng on endurance or strength performance in healthy young adults [8], and limited
effect on the immune response to an acute exercise in healthy sedentary men [9].
Additionally, ginseng extract does not appear to improve psychomotor performance
during exercise without negatively affecting exercise capacity [10]. Similarly, short-term
treatment of ginseng had no effect on endurance exercise performance in healthy young
adults [11].
Chronic treatment studies also indicate that ginseng has no effect on endurance
exercise performance [12, 13], lactate threshold [13] or rate of recovery from exhaustive
exercise [14] in healthy men. Additionally, supplementation with P. ginseng has been
shown to be ineffective at improving pulmonary function or endurance exercise capacity
in patients with COPD [15].
In contrast, short-term research involving a P. ginseng extract combined with
vitamins, minerals, and other ingredients was shown to increase the physical working
capacity of healthy male sports teachers during treadmill testing [16].
Taking into account the popularity of polynutrient supplement use by adults
engaged in strength training [1] and power sports [17], and the lack of pertinent studies
with these populations, the aim of the present study was to test the effects of a
polynutrient dietary supplement containing P. ginseng on neuromuscular performance
and mood state in a sample of men with substantial weight-training histories.
3
Chapter 2: Methods
Subjects
Twelve resistance-trained men (mean ± SD age 28.3 ± 5.7 years, height 178.22 ±
6.84 cm, mass 90.41 ± 15.54 kg) with 11.4 ± 6.0 years of resistance training experience
participated in the study. Subjects averaged 4.7 ± 0.7 and 3.0 ± 1.3 days per week for
resistance and endurance training, respectively. Subjects’ ethnic backgrounds were
Caucasian (5), Hispanic (5), African-American (1), and Bahamian (1). Sample size
calculations using PASS software (Number Cruncher Statistical Systems, Kaysville,
Utah) at α = .05 indicated that a repeated measures design employing three treatment
conditions requires sample sizes (n) 3 to 8 to yield power (P) values from 0.867 to
>0.999.
All subjects completed a Physical Activity Readiness Questionnaire (rPAR-Q)
[18, 19], and were prescreened for musculoskeletal, neurological, cardiovascular or other
conditions for which resistance or power testing would be contraindicated. Prior to
entrance into the study subjects completed a written informed consent approved by the
University of Miami Subcommittee for the Use and Protection of Human Subjects.
Research Design
The study examined differences in the response variables due to ingestion of a
single (SD) or double (DD) dose of ProEndorphin, or a placebo (P) consisting of a lime-
flavored effervescent solution that was identical in color and taste to the supplement
being tested, yet contained no active ingredients. The study used a double blind, placebo-
controlled repeated measures protocol with a one-week washout between treatments. In

4
order to maintain the double blind conditions, all treatments involved ingesting drinks of
the same taste, color, viscosity, and appearance. A research assistant randomly selected
one of three coded powdered drink mixes (coded A, B, or C), prepared the appropriate
drink (powder mixed with 180 mL of room temperature water in a colored container) and
left the room to prevent contact with the subject or tester. Another assistant then
administered the coded drink to the subject. For each treatment, the same protocol was
always followed. The researchers and assistants involved in the study did not discuss test
results or drink codes. The codes for the treatments were not broken until the data for all
subjects were collected and analyzed.
Timeline, Order of Testing and Blood Draws
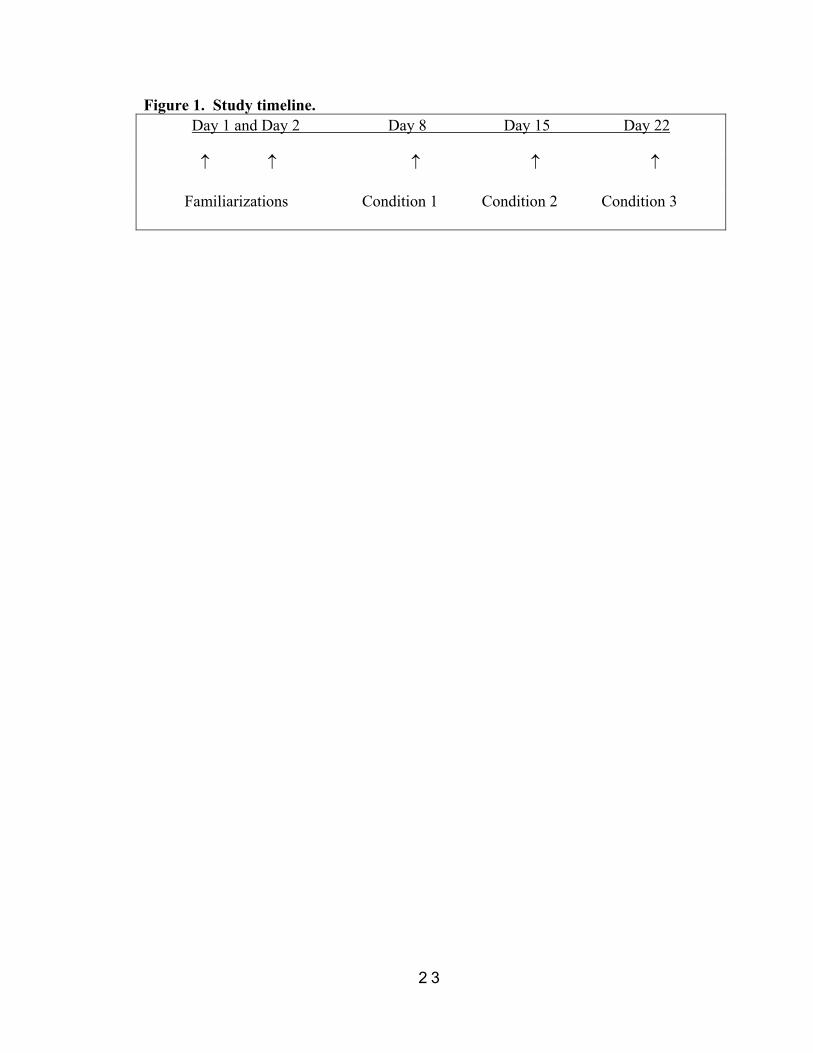
The timeline for the study is presented in Figure 1. The study protocol began with
a two-day familiarization period. During the familiarization period the subjects were
thoroughly informed concerning study goals and design. Additionally, subjects were
taught the proper use of the grip strength dynamometer and the stationary cycle
ergometer; and were allowed to practice the testing protocols that were to be used during
each test. Previous research indicates that two consecutive familiarization sessions
identical to the testing session provide sufficient practice to ensure test-retest reliability
[20]. Equipment settings, including seat height and grip span were recorded so that they
could be standardized for each subject across the testing conditions. At the conclusion of
the second familiarization day, the order in which the supplements were to be
administered was randomly assigned for each subject and samples were prepared and
coded.
5
Subjects were then asked to return on days 8, 15 and 22 of the study so they might
be tested under each treatment condition. They were contacted the day before each testing
session and instructed not to eat after 10:00 PM. The testing protocol across the three
testing days was standardized. Upon entering the laboratory, the subject was interviewed
to confirm that he had not changed his diet nor ingested any supplements, caffeine or
alcohol. We also confirmed that he was fasted, had been inactive at least 24 hours, and
followed his typical sleep schedule (i.e. at least 6 hours per day). Finally he confirmed
that he had not been exposed to any circumstances that would preclude him from testing
(i.e. illness, injury, medications, etc). The subject then completed the Profile of Mood
States (POMSpre) in private room to reduce possible distractions. Next, a catheter was
inserted in the subject’s antecubital vein, and the first blood draw (BDpre1), blood pressure
(BPpre1), and heart rate (HR pre1) were taken. The subject ingested the drink randomly
assigned for that day and sat quietly for 30 minutes. A second blood draw (BD pre2), blood
pressure (BPpre2), and heart rate (HR pre1) was then taken. Next the subject performed the
grip strength test followed by the cycle ergometer test. This was immediately followed by
BD post, HR post, and BPpost and a post-test POMS (POMSpost). The testing session ended
with blood draws, heart rates, and blood pressures being taken 30 (BDpost30, HRpost30,
BPpost30), 60 (BDpost60, HRpost60, BPpost60), 120 (BDpost120, HRpost120, BPpost120) and 180
(BDpost180, HRpost180, BPpost180) minutes post exercise. Following testing the subject was
provided food, and he was verified to be symptom free prior to being allowed to leave the
laboratory.
6
Dietary Control
Subjects completed a 7-day food log while following their typical dietary patterns.
In order to minimize the impact that dietary changes may have had on the treatment
conditions, each subject was instructed to maintain his dietary pattern across the 21-day
study period.
Activity Control
Subjects completed a previously validated 7-day activity log using their typical
activity patterns. They were then asked to maintain the same weekly activity level
throughout the duration of the study. Additionally, subjects were told to avoid exercise
the 2 days before each treatment condition.
Performance Testing
To reduce the impact of diurnal variation across treatments subjects started testing
between 8-10 AM. Additionally, for both performance tests consistent instructions were
provided for all subjects and the same tone and volume were used each time to motivate
subjects in order to minimize variability due to verbal cues.
Grip Strength Test Protocol (GST). Subjects performed the grip strength test
using a handheld JAMAR hydraulic grip dynamometer (Asimow Engineering, Santa Fe
Springs, CA, USA) using a standardized testing protocol. Prior to testing the grip span
was adjusted to the distance that been determined during the familiarization days. Briefly,
subjects were positioned in a straight-backed chair with both feet flat on the floor. The
shoulder was adducted and neutrally rotated, the elbow was flexed at 90o with the
7
forearm in a neutral position and the wrist between 0 and 30o extension and between 0
and 15o ulnar deviation. The arm was not supported and the dynamometer was presented
vertically and in line with the forearm to maintain standard forearm and wrist positions.
Prior to testing, subjects warmed up using three contractions performed at 50%, 75%, and
90% of their maximum grip strength values established during the familiarization period.
After the warm-up, 3 trials lasting three seconds each were performed separated by 60s
passive recovery periods. During each trial, maximal grip values were read by the tester
with the scale facing away from subject. The mean of the three trials was used for
statistical analysis, as this method is preferred due to its higher test-retest reliability [21].
Cycle Ergometry Test Protocol. A Monark 883E (Monark Exercise AB, Vansbro,
Sweden) cycle ergometer fitted with toe clips and an OptoSensor 2000 reading system
interfaced with the laboratory computer (Sports Medicine Industries, Inc., St. Cloud, MN)
was used to assess mechanical power. The OptoSensor 2000 measured flywheel velocity
using reflective markers attached to the pedal sprockets and an optical sensor tachometer
attached to the frame. Pedaling initiated data collection. The raw data were stored on the
computer and analyzed using the POWER software program (Sports Medicine Industries,
Inc., St. Cloud, MN). The software program calculated peak power, average power, total
work, and fatigue index for each trial. Subjects began the test seated so that the heels of
the feet touch the pedal with the knee joints extended. The seat height had been
established during the familiarization days. Their feet were secured by toe clips. In the
starting position the left foot was forward with both feet parallel to the ground. The angle
of the seat and angle of the handlebars were preset and did not vary between subjects,

8
trials, or conditions. All rides were preceded by a warm-up during which the subject
using a flywheel load equal to ~1% of his body mass for five minutes at a metronome
cadence of 30 rpm. No subject showed signs of fatigue (i.e. inability to maintain cadence
or standing up while pedaling), during the warm-up period. During the test subjects
performed eight 6s maximal effort sprints separated by 30s of active recovery at 60 rpm
with 1 kg resistance [22]. Peak power (PP), average power (AP), fatigue index (FI), and
total work (TW) were calculated for each individual trial. In addition, averages for these
variables were calculated for all trials combined.
Cardiovascular Measures
One-minute heart rate (HR) and noninvasive real-time blood pressure values were
measured using the NIBP100 (Biopac Systems, Inc., Santa Barbara, CA). The system
employs a tonometric technique, which records heart rate and intra-arterial pulse pressure
that has been previously validated [23]. The tonometric sensor is placed just distal of the
styloid process and held in place with a wrist brace. The NIBP100 also incorporates a
built-in oscillometric cuff measurement system to calibrate the relative intra-arterial
pressure readings to absolute values. The system outputs a continuous analog waveform
representative of the blood pressure. Oscillometric measurement is performed at user-
defined intervals to insure the accuracy of the blood pressure waveform generated by the
NIBP100. The waveform is collected by computer (MP100 System, Biopac Systems,
Inc., Santa Barbara, CA). Software (AcqKnowledge Biopac Systems, Inc., Santa Barbara,
CA) extracts the systolic, diastolic, and mean blood pressure values on a beat-to-beat
basis.
9
Glucose and Lactate Analysis
Glucose was analyzed using the Glucometer Elite Diabetes Care System (Bayer
Corporation, Pittsburgh, PA). The device has been previously validated [24]. Lactate
analysis was performed with the Lactate Pro (Fact Canada Consulting Ltd, British
Columbia, Canada). The accuracy of the Lactate Pro has also been demonstrated in the
literature [25, 26].
Blood Hormone Analysis
Blood samples (5 ml) were drawn from the right arm by a certified phlebotomist
using a JelcoTM (Critikon, Tampa, FL) catheter to reduce the potential risks to subjects
and minimize the discomfort of repetitive needle sticks. Blood was collected in tubes
containing either EDTA or a serum separator (SST). Each tube was centrifuged. The
centrifuged EDTA treated tubes provided plasma for adrenocorticotropin (ACTH)
analysis, while the SST tubes provided serum for analyses cortisol (C), growth hormone
(GH), insulin (I), luteinizing hormone (LH), prolactin (Prl), and testosterone (T) levels.
The samples were stored at –20oC to –84oC. The hormones were analyzed using the
Immulite Immunoassay System (Diagnostic Products Corporation, Los Angeles, CA), an
automated chemiluminescent analyzer. For analysis, subjects’ serum/plasma samples
were thawed, shaken, and 400 uL of the sample was pipetted into sample cups. The
sample cups were placed into bar code labeled cup holders resting on a carousel. The
treatment information for each label was entered manually via a keyboard interfaced with
the analyzer. Hormone test kits were placed behind each cup holder. The cup holder and
test kit were advanced forward on the carousel in a timed sequence. The analyzer

10
automatically pipetted the necessary sample size from the sample cup into the appropriate
hormone test kit. After a 70-minute (two carousel revolutions and centrifugal wash)
incubation period that involved a two-site chemiluminescent enzyme immunometric
assay (CIA), the hormone concentration was printed out. The Immulite Immunoassay
System [27] and hormone test kits are all approved by the FDA for in vitro diagnostic
testing as moderately complex tests and were previously validated [28].
All assays were performed according to the manufacturers' recommendations by
skilled technicians. Each hormone was measured in duplicate and the mean value was
used in statistical analyses. The intra and inter-assay coefficients of variation of the
assays were: ACTH 3.1% and 8.8%; C 6.8% and 9.9%; GH 5.3% and 5.7%; I 4.3% and
4.8%; LH 4.8% and 7.2%; Prl 6.8% and 9.6%; and T 5.8% and 7.9%.
Profile of Mood States (POMS)
Mood states were measured using the Profile of Mood States (POMS). This 65-
item questionnaire has been validated for assessing acute changes in mood before and
after exercise [29]. For analysis, scores (on a 5-point scale of 0–4) were grouped into six
subscales: tension–anxiety (T–A), depression–dejection (D), anger–hostility (A–H), vigor
(V), fatigue (F), and confusion (C). Subscale scores were converted to T-scores for
statistical analysis, and overall mood disturbance was also calculated.
Statistical Procedures
For grip strength a three-way ANOVA was used to detect differences among the
three supplement conditions. For cycle ergometry each dependent variable (PP, AP, TW
11
and FR) was evaluated using a 3 (conditions) x 8 (trials) repeated measures ANOVA.
Each bloodborne measure was analyzed using a 3 (condition) x 7 (time) repeated
measures ANOVA. When significant main effects or interactions were detected, LSD
post hoc tests were used to determine the sources. Statistical significance was set a priori
at p<.05. All statistical procedures were performed using IBM ® PASW Statistics 18.0
for Windows (SPSS Inc., Chicago, Illinois).
1 2
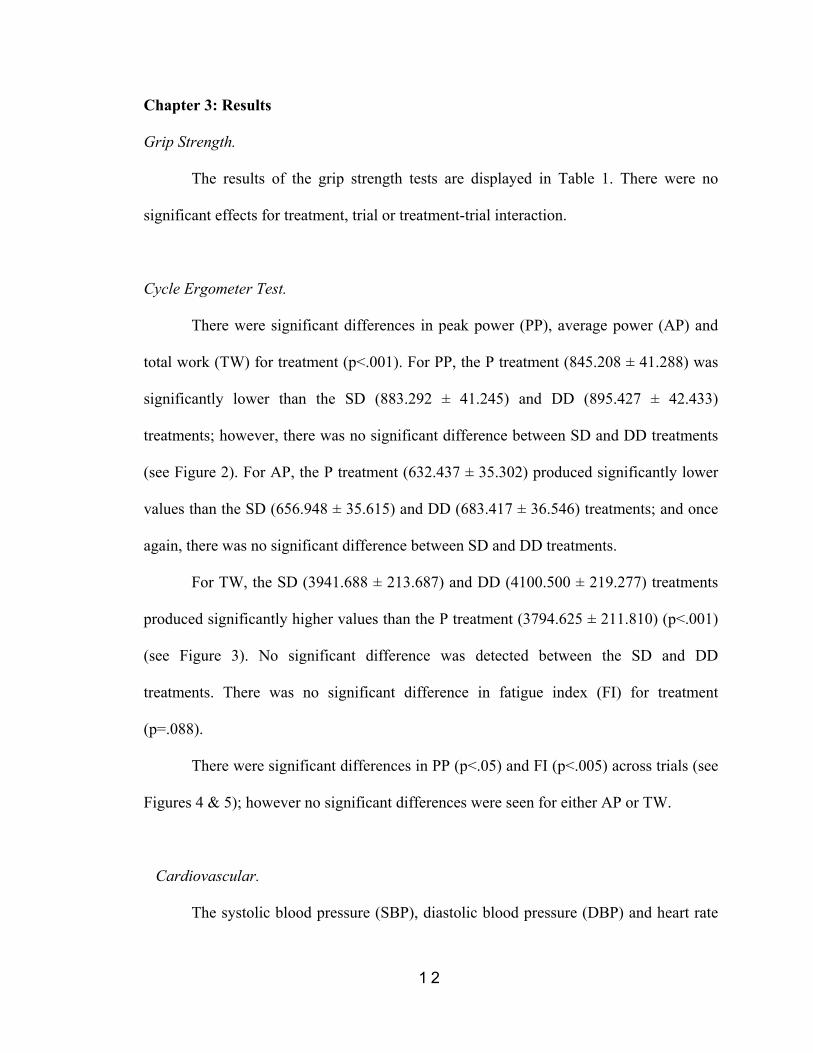
Chapter 3: Results
Grip Strength.
The results of the grip strength tests are displayed in Table 1. There were no
significant effects for treatment, trial or treatment-trial interaction.
Cycle Ergometer Test.
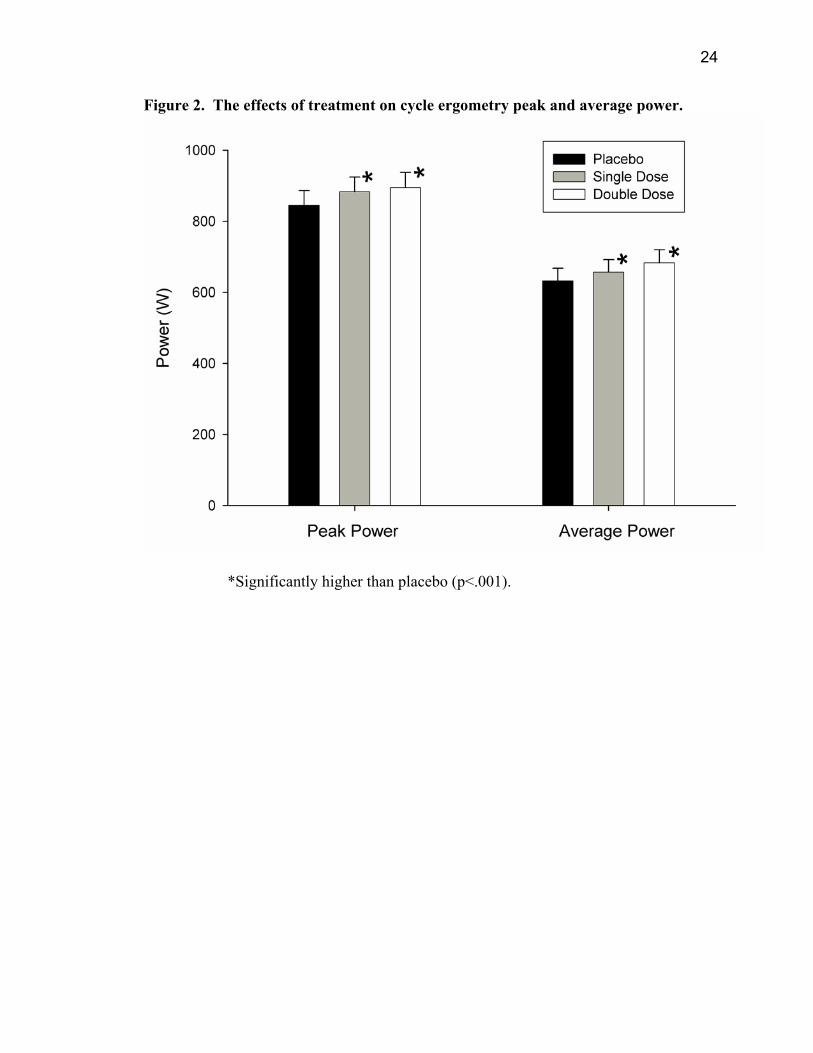
There were significant differences in peak power (PP), average power (AP) and
total work (TW) for treatment (p<.001). For PP, the P treatment (845.208 ± 41.288) was
significantly lower than the SD (883.292 ± 41.245) and DD (895.427 ± 42.433)
treatments; however, there was no significant difference between SD and DD treatments
(see Figure 2). For AP, the P treatment (632.437 ± 35.302) produced significantly lower
values than the SD (656.948 ± 35.615) and DD (683.417 ± 36.546) treatments; and once
again, there was no significant difference between SD and DD treatments.
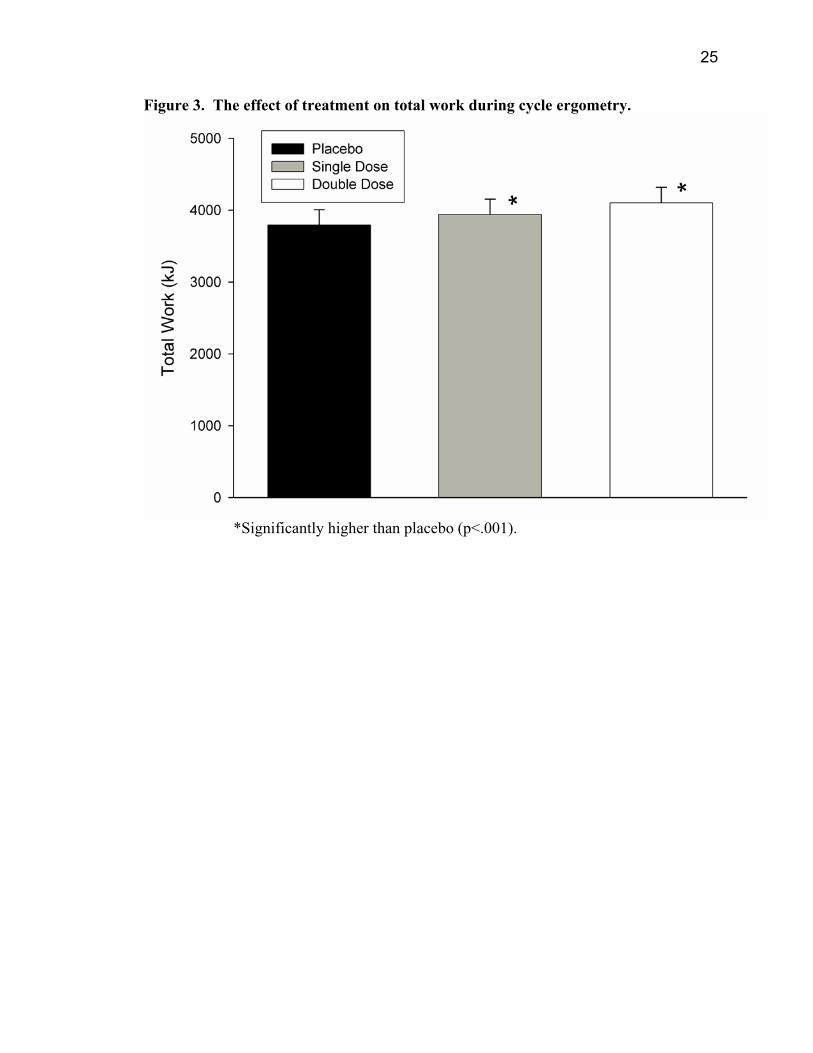
For TW, the SD (3941.688 ± 213.687) and DD (4100.500 ± 219.277) treatments
produced significantly higher values than the P treatment (3794.625 ± 211.810) (p<.001)
(see Figure 3). No significant difference was detected between the SD and DD
treatments. There was no significant difference in fatigue index (FI) for treatment
(p=.088).
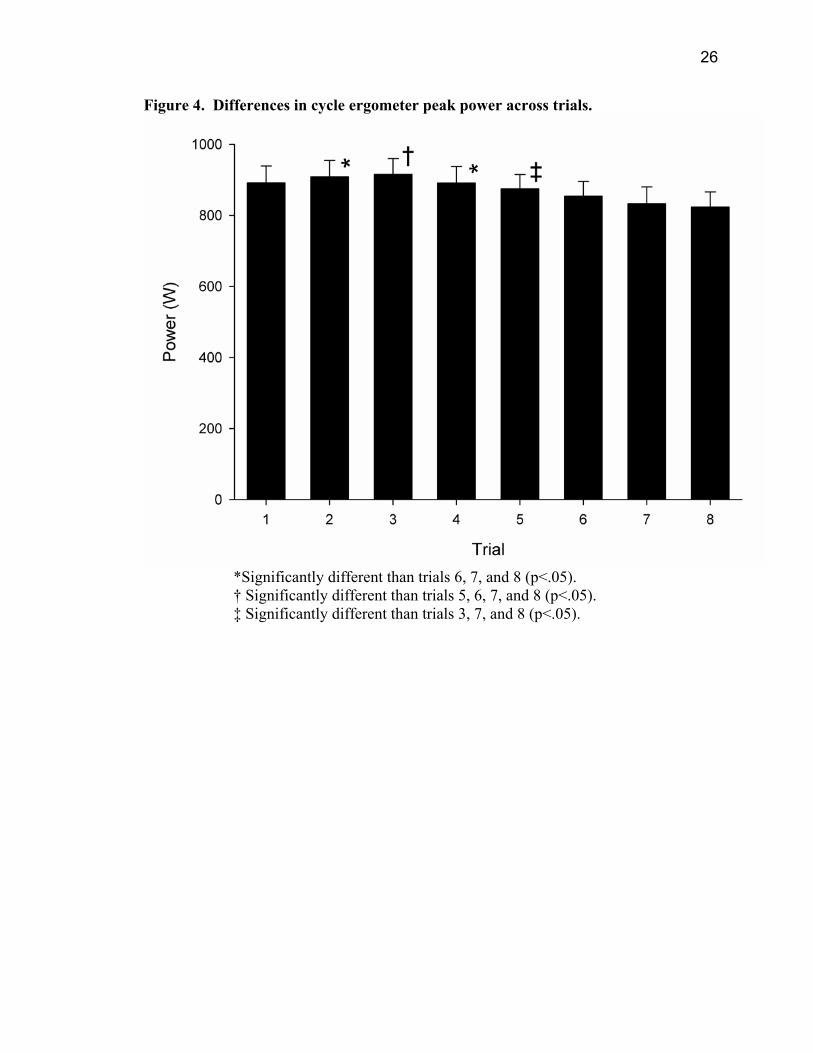
There were significant differences in PP (p<.05) and FI (p<.005) across trials (see
Figures 4 & 5); however no significant differences were seen for either AP or TW.
Cardiovascular.
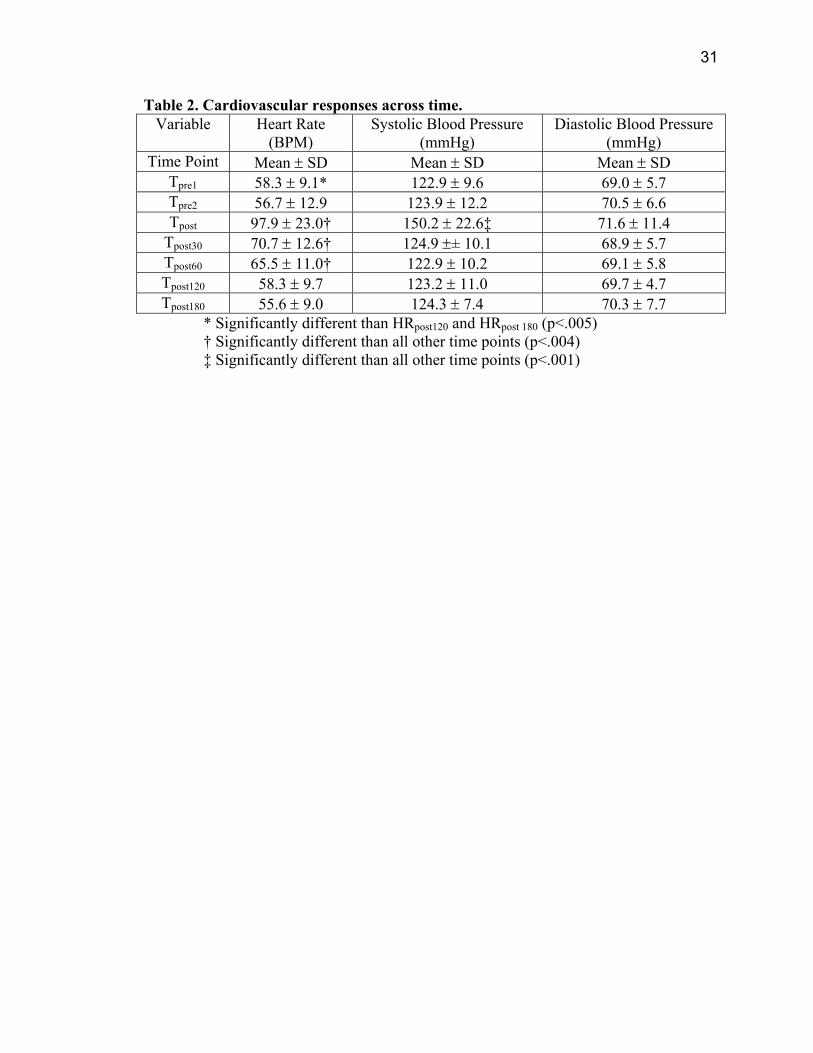
The systolic blood pressure (SBP), diastolic blood pressure (DBP) and heart rate

13
(HR) results are displayed in Table 2. There was no significant effects of treatment nor
treatment by time interaction on HR, SBP, or DBP (p<.05). There was a significant
difference between HRpre1 and HRpost120 and HRpost180 (p<.005). There was also a
significant difference between HRpost, HRpost30, HRpost60 and all other heart rate time
points (p<.004). There was also a significant difference between SBPpost and all other
time points (p<.001).
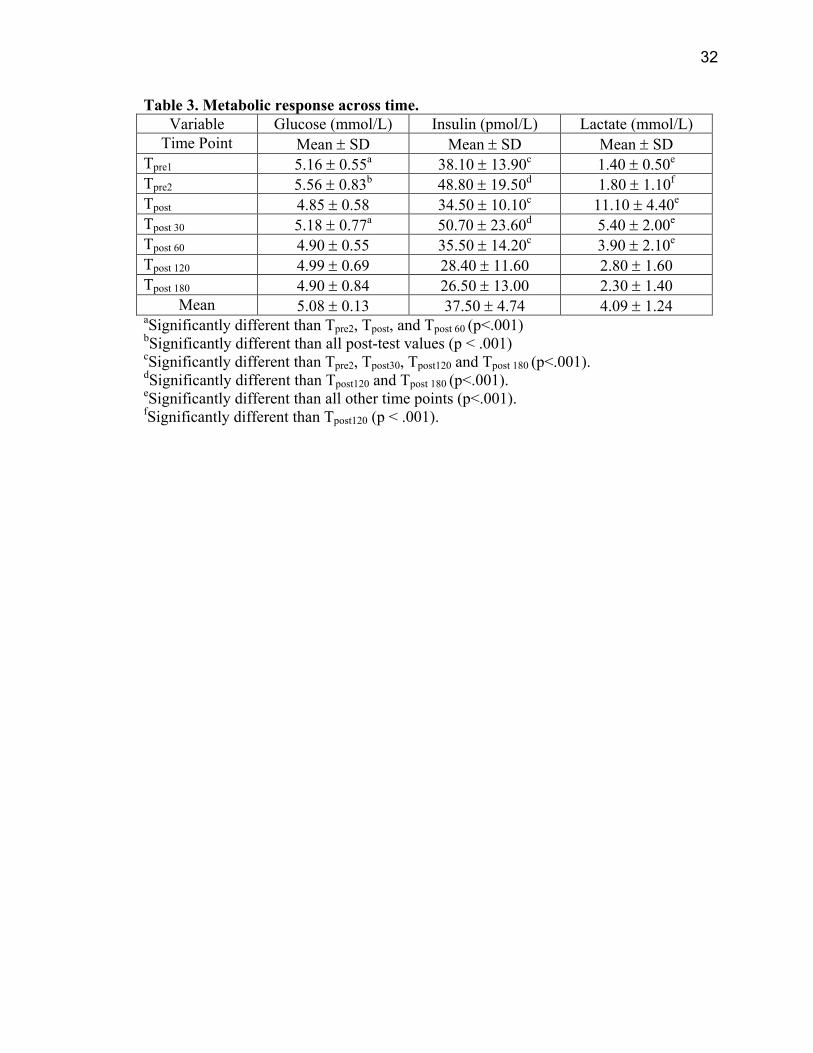
Metabolic Measures.
The Metabolic Measures results are reported in Table 3. There was no significant
treatment effect for glucose, insulin or lactate; however, there were significant changes in
each variable across time (p<.001). For glucose, time points Tpre1 and Tpost30 were found
to be significantly different than Tpre2, Tpost and Tpost60. There was also a significant
difference in glucose between time point Tpre2 and all post-test values.
For insulin, time points Tpre1, Tpost and Tpost60 were significantly different than
Tpre2, Tpost30, Tpost120 and Tpost180. Additionally, insulin levels at time points Tpre2 and
Tpost30 were significantly different than Tpost120 and Tpost180.
For lactate time points Tpre1, Tpost, Tpost30 and Tpost60 were significantly different
than all other time points. There was also a significant difference between time points
Tpre2 and Tpost120.
There were no significant differences in LH, SHBG or T across time points nor
were there significant treatment by time interactions. For LH (see Figure 6) significant
differences were found among all treatment conditions (P=3.49 ± 0.59 mlU·mL-1; S=3.85
± 0.60 mlU·mL-1; D=4.39 ± 0.61 mlU·mL-1; p < .001). There were also significant
14
differences for T values (see Figure 6) among all conditions P (23.15 ± 1.71 nmol·L-1), S
(25.95 ± 2.82 nmol·L-1) and D (30.28 ± 3.09 nmol·L-1) treatments (p < .001).
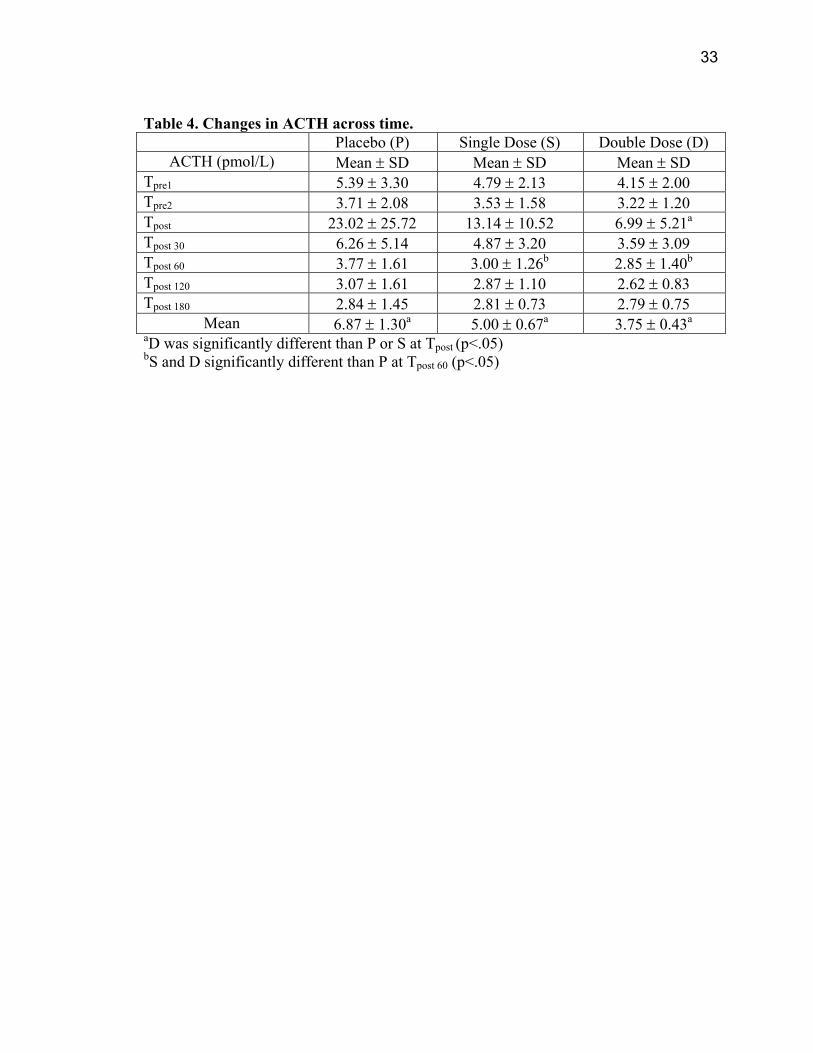
There was a significant treatment*time interaction on ACTH (p < .05) (see Table
4). Post hoc analysis indicated that at Tpost ACTH was significantly lower for D treatment
vs P or S treatments (p < .05) and at Tpost60 ACTH was significantly lower for S and D
treatments vs P treatment (p < .05).
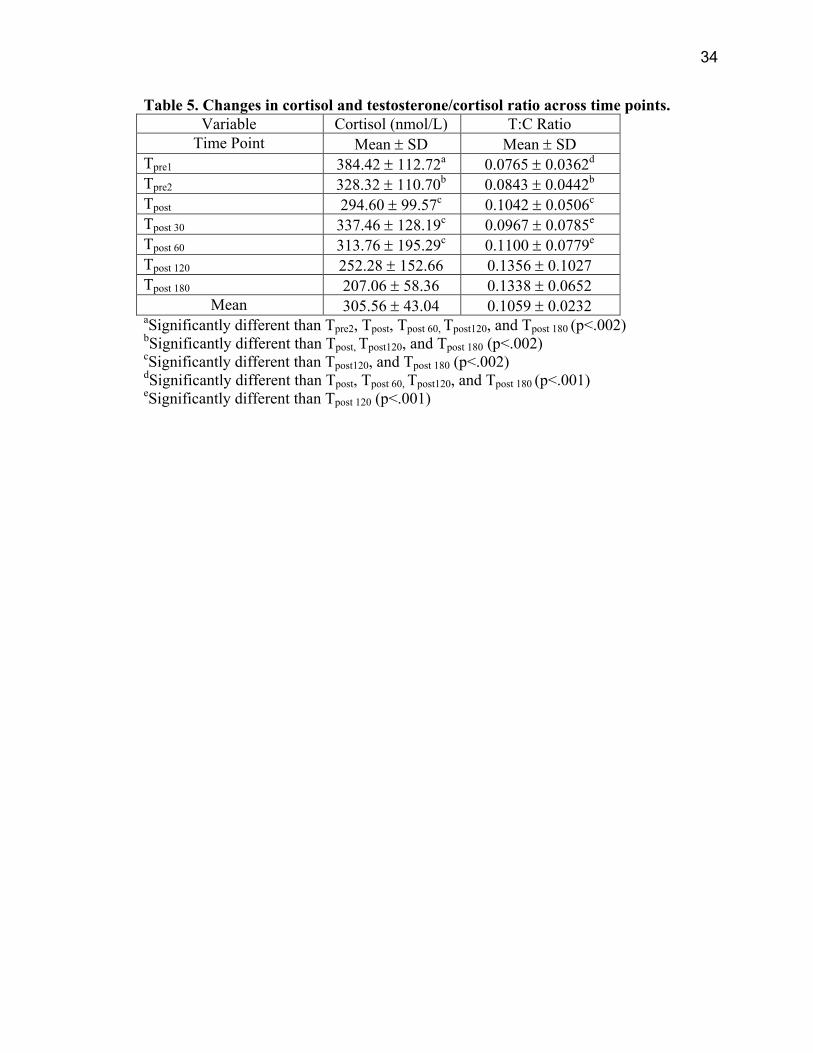
There was significant differences in C between the D treatment (260.45 ± 15.58
nmol·L-1) and the P (336.08 ± 27.59 nmol·L-1) and S (311.14 ± 21.01 nmol·L-1)
treatments (p < .001) (see Figure 7). There were significant differences for C values
between time point Tpre1 and Tpre2, Tpost, Tpost60, Tpost120 and Tpost180 (p < .002). There were
also significant differences between time point Tpre2 and time points Tpost, Tpost120 and
Tpost180 (p < .002). Significant differences in C values were also detected between the Tpost
value and Tpost120 and Tpost180 (p < .002). There were significant differences for C values
between time points Tpost30 and Tpost60 time points Tpost120 and Tpost180 (p < .002). Finally,
significant differences in C levels were detected between time points Tpost120 vs. Tpost180
(see Table 5).
There was a significant difference for T:C ratio values among P (0.0810 ±
0.0090), S (0.0960 ± 0.0130) and D (0.1410 ± 0.0190) treatments (p < .001) (see Figure
7). There was also a significant time effect for T:C Ratio (p < .001). There were
significant differences between time point Tpre1 and Tpost, Tpost60, Tpost120 and Tpost180.
There were also significant differences in T/C ratio between time point Tpre2 vs. Tpost,
Tpost120 and Tpost180. There were also significant differences between the Tpost value and
Tpost120 and Tpost180. Finally, there were significant differences for T/C ratio between time
15
points Tpost30 and Tpost60 and time point Tpost120 (see Table 5).
There was no significant effect of treatment on GH or PRL (p < .05). There was a
significant time effect for GH (p < .05). For GH values significant differences were seen
between time point Tpre2 and time points Tpost, Tpost30 and Tpost60. There were significant
differences for GH values between time point Tpost and time points Tpost30 and Tpost180.
Finally, there were significant differences for GH values between time point Tpost30 and
Tpost180 (see Table 6).
There was also a significant time effect for PRL (p < .001). There were significant
differences between time point Tpre1 and Tpre2, Tpost30, Tpost60, Tpost120 and Tpost180. There
were also significant differences for PRL values between time point Tpre2 and Tpost60,
Tpost120 and Tpost180. Significant differences were detected between time point Tpost and
Tpost60, Tpost120 and Tpost180. There were significant differences for PRL values between
time point Tpost30 and time points Tpost60, Tpost120 and Tpost180. Finally, there were
significant differences between time point Tpost60 and time points Tpost 120 and Tpost180 (see
Table 6).
Differences between pre- and post- treatment POMS scores are shown in Table 7.
There were no significant differences in the POMS subscales due to treatment. There
were, however, significant differences see across time points for the fatigue subscale (p <
.05), indicating subjects were more fatigued after the exercise trials. There were no
significant differences between Total Mood Disturbance Scores (TMDS) due to
treatments or time.
1 6
Chapter 4: Discussion
The present study examined the effects of a popular polynutrient dietary
supplement containing thiamin hydrochloride, riboflavin 5-phosphate, niacin, pyridoxine
hydrochloride, cyanocobalamin, biotin, calcium-D-pantothenate, sodium, potassium, DL-
phenylalanine, P. ginseng extract, 2-dimethylaminoethanol, kola nut extract, inositol, and
taurine on physical and biochemical performance markers in a physically active
population. We compared the acute effects of a single dose and a double dose of the
supplement against placebo. At the doses tested, the supplement had no effect on grip
strength. This is in contrast to previous research with athletes using a similar polynutrient
supplement, which demonstrated an increase in grip strength after five weeks of ingestion
[30]. The differences in results may be due to differences in the ginseng extract itself, the
type of subject or the duration of treatment prior to testing.
At the doses tested, however, the supplement did significantly increased PP, AP
and TW. There was no significant difference between SD and DD treatments on PP, AP
or TW performances. These findings are in agreement with previous research
demonstrating an increase in workload during treadmill exercise, using a similar
polynutrient supplement containing a ginseng extract [16]. The cycle ergometry exercise
protocol used in this study design was very challenging for subjects which would explain
the significant effect of trial on PP and FI.
The acute safety concerns regarding ingestion of the polynutrient supplement
were addressed in this study. SBP, DBP and HR results were similar for all treatment
groups. The ability to perform more work [16] and improve quality of life [31] while
maintaining healthy cardiovascular responses has been reported previously for
17
polynutrient supplements. The possible mechanisms to explain these findings include
increased nitric oxide levels [32], improved oxygen delivery to tissues [16] and increased
ability to handle physical and mental stress [30].
There were no significant effects of polynutrient supplementation on glucose,
insulin or lactate responses to repeated sprint cycle ergometry in this study. Given that
that the supplement increased TW and similar lactate responses were found, our findings
agree with earlier work indicating lower lactate levels at the same work load [16].
While previous studies have investigated the effects of polynutrient, ginseng
preparations on testosterone and/or cortisol levels, there are limited data regarding their
effects on other hormones in humans. Our study demonstrated an increase in LH and T,
and a decrease in ACTH and C levels after polynutrient, ginseng treatment. These
combined results produced a much higher T:C Ratio, indicating that polynutrient
supplement ingestion may increase the anabolic environment. There were no significant
effects on SHBG, GH or PRL levels. In contrast to our findings, previous research
showed no significant effects of ginseng ingestion on testosterone, cortisol, growth
hormone, and insulin-like growth factor-1 responses to acute resistance exercise [33].
Our study design used a specialized ginseng preparation in conjunction with multiple
vitamins, minerals and other agents, which could easily explain the differences in
research results. In addition, it was previously demonstrated that ginsenoside-Rb1 acts on
the anterior pituitary directly and stimulates LH levels in male rats [34]. By increasing
LH secretion from the anterior pituitary, levels of testosterone could also be stimulated.
Testosterone modulates the nitric oxide-cGMP signaling pathway and androgenesis in
leydig cells [35]. Given that ginseng-extract preparations and ginsenoside-Rb1 have also

18
been shown to increase nitric oxide levels [32, 36] there may be direct and indirect effects
(i.e. via testosterone) of ginseng to increase nitric oxide.
In the present study there was a significant increase in ACTH at Tpost for all
treatments, however it was significantly lower for the D treatments vs the P and S
treatments. There was also a significant reduction in C after the D treatment vs the P and
S treatments indicating that at higher dose this supplement can reduce the acute stress
response seen with intense exercises.
There were no significant effects of polynutrient treatment on POMS subscale
Tscores or Total Mood Disturbance Scores (TMDS). Previous studies have demonstrated
improvements in mood after ginseng preparation ingestion [37]. In the present study
subjects were highly motivated and very positive, so there could be little if any
improvement in mood. A reduction in fatigue was expected but the results were not
statistically significant. A larger samples size may be needed to detect a significant
reduction in fatigue.
1 9
Chapter 5: Conclusions
Acute ingestion of a polynutrient dietary supplement containing a ginseng extract
increased cycle ergometry performance and improved the anabolic environment (higher
testosterone, lower cortisol, increased T:C Ratio). Future work should examine if the
benefits of supplement ingestion improve with chronic administration, identify the
specific ginsenosides involved, and possible impact of gut bacteria on nutrient
metabolism and hence effects of polynutrient supplement.
2 0
REFERENCES
1. Morrison, L.J., F. Gizis, and B. Shorter, Prevalent use of dietary supplements among people who exercise at a commercial gym. Int J Sport Nutr Exerc Metab, 2004. 14(4): p. 481-92.
2. Tian, H.H., W.S. Ong, and C.L. Tan, Nutritional supplement use among university athletes in Singapore. Singapore Med J, 2009. 50(2): p. 165-72.
3. van der Beek, E.J., Vitamin supplementation and physical exercise performance. J Sports Sci, 1991. 9 Spec No: p. 77-90.
4. Astorino, T.A. and D.W. Roberson, Efficacy of acute caffeine ingestion for short-term high-intensity exercise performance: a systematic review. J Strength Cond Res, 2010. 24(1): p. 257-65.
5. Wood, D.R., F.W. Reimherr, and P.H. Wender, Treatment of attention deficit disorder with DL-phenylalanine. Psychiatry Res, 1985. 16(1): p. 21-6.
6. Alford, C., H. Cox, and R. Wescott, The effects of red bull energy drink on human performance and mood. Amino Acids, 2001. 21(2): p. 139-50.
7. Seidl, R., et al., A taurine and caffeine-containing drink stimulates cognitive performance and well-being. Amino Acids, 2000. 19(3-4): p. 635-42.
8. Morris, A.C., et al., No ergogenic effect of ginseng ingestion. Int J Sport Nutr, 1996. 6(3): p. 263-71.
9. Biondo, P.D., et al., A randomized controlled crossover trial of the effect of ginseng consumption on the immune response to moderate exercise in healthy sedentary men. Appl Physiol Nutr Metab, 2008. 33(5): p. 966-75.
10. Ziemba, A.W., et al., Ginseng treatment improves psychomotor performance at rest and during graded exercise in young athletes. Int J Sport Nutr, 1999. 9(4): p. 371-7.
11. Allen, J.D., et al., Ginseng supplementation does not enhance healthy young adults' peak aerobic exercise performance. J Am Coll Nutr, 1998. 17(5): p. 462-6.
12. Engels, H.J. and J.C. Wirth, No ergogenic effects of ginseng (Panax ginseng C.A. Meyer) during graded maximal aerobic exercise. J Am Diet Assoc, 1997. 97(10): p. 1110-5.
13. Kulaputana, O., S. Thanakomsirichot, and W. Anomasiri, Ginseng supplementation does not change lactate threshold and physical performances in physically active Thai men. J Med Assoc Thai, 2007. 90(6): p. 1172-9.
21
14. Kim, S.H., et al., Effects of Panax ginseng extract on exercise-induced oxidative stress. J Sports Med Phys Fitness, 2005. 45(2): p. 178-82.
15. Gross, D., et al., Ginseng improves pulmonary functions and exercise capacity in patients with COPD. Monaldi Arch Chest Dis, 2002. 57(5-6): p. 242-6.
16. Pieralisi, G., P. Ripari, and L. Vecchiet, Effects of a standardized ginseng extract combined with dimethylaminoethanol bitartrate, vitamins, minerals, and trace elements on physical performance during exercise. Clin Ther, 1991. 13(3): p. 373-82.
17. Huang, S.-H.S., K. Johnson, and A.L. Pipe, The use of dietary supplements and medications by Canadian athletes at the Atlanta and Sydney Olympic Games. Clin J Sport Med, 2006. 16(1): p. 27-33.
18. Thomas, S., J. Reading, and R.J. Shephard, Revision of the physical activity readiness questionnaire (PAR-Q). Canadian Journal of Sport Sciences, 1992. 17(4): p. 338-345.
19. Shephard, R.J., S. Thomas, and I. Weller, The canadian home fitness test. 1991 update. Sports Med, 1991. 11(6): p. 358-366.
20. Capriotti, P.V., W.M. Sherman, and D.R. Lamb, Reliability of power output during intermittent high-intensity cycling. Med Sci Sports Exerc, 1999. 31(6): p. 913-915.
21. Mathiowetz, V., et al., Reliability and validity of grip and pinch strength evaluations. J Hand Surg [Am], 1984. 9(2): p. 222-226.
22. Signorile, J.F., C. Ingalls, and L.M. Tremblay, The effects of active and passive recovery on short-term, high intensity power output. Can J Appl Physiol, 1993. 18(1): p. 31-42.
23. Mikhov, D., P. Markova, and R. Girchev, Spectral analysis of heart rate and arterial pressure variability after nitric oxide synthase inhibition. Acta Physiol Pharmacol Bulg, 1998. 23(3-4): p. 79-84.
24. Rheney, C.C. and J.K. Kirk, Performance of three blood glucose meters. Ann Pharmacother, 2000. 34(3): p. 317-321.
25. McNaughton, L.R., et al., A comparison of the Lactate Pro, Accusport, Analox GM7 and Kodak Ektachem lactate analysers in normal, hot and humid conditions. Int J Sports Med, 2002. 23(2): p. 130-135.
26. Pyne, D.B., et al., Evaluation of the Lactate Pro blood lactate analyser. Eur J Appl Physiol, 2000. 82(1-2): p. 112-116.
27. Babson, A.L., et al., The IMMULITE(TM) assay tube: A new approach to
22
heterogeneous ligand assay. Clin Chem, 1991. 37(9): p. 1521-1522.
28. Costongs, G.M., et al., Evaluation of the DPC IMMULITE random access immunoassay analyser. Eur J Clin Chem Clin Biochem, 1995. 33(11): p. 887-92.
29. Berger, B.G. and D.R. Owen, Relation of low and moderate intensity exercise with acute mood change in college joggers. Percept Mot Skills, 1998. 87(2): p. 611-621.
30. Chander, M., A. Ahuja, and M.S. Sohal. Effect of ginseng, vitamins & minerals on the physical performance of national level male players - abstract. in Fifth IOC World Congress on Sport Sciences. 1999. Australia: In Fifth IOC World Congress on Sport Sciences: book of abstracts Canberra Sports Medicine Australia 1999 p.209. http://www.ausport.gov.au/fulltext/1999/iocwc/abs209b.htm.
31. Caso Marasco, A., et al., Double-blind study of a multivitamin complex supplemented with ginseng extract. Drugs Exp Clin Res, 1996. 22(6): p. 323-329.
32. Gillis, C.N., Panax ginseng pharmacology: a nitric oxide link? Biochem Pharmacol, 1997. 54(1): p. 1-8.
33. Youl Kang, H., et al., Effects of ginseng ingestion on growth hormone, testosterone, cortisol, and insulin-like growth factor 1 responses to acute resistance exercise. J Strength Cond Res, 2002. 16(2): p. 179-83.
34. Tsai, S.-C., et al., Stimulation of the secretion of luteinizing hormone by ginsenoside-Rb1 in male rats. Chin J Physiol, 2003. 46(1): p. 1-7.
35. Andric, S.A., et al., Testosterone-induced modulation of nitric oxide-cGMP signaling pathway and androgenesis in the rat leydig cells. Biology of Reproduction, 2010.
36. Scott, G.I., et al., Ginsenosides Rb1 and Re decrease cardiac contraction in adult rat ventricular myocytes: role of nitric oxide. Br J Pharmacol, 2001. 134(6): p. 1159-65.
37. Kennedy, D.O. and A.B. Scholey, Ginseng: potential for the enhancement of cognitive performance and mood. Pharmacol Biochem Behav, 2003. 75(3): p. 687-700.
2 3
Figure 1. Study timeline. Day 1 and Day 2 Day 8 Day 15 Day 22
↑ ↑ ↑ ↑ ↑
Familiarizations Condition 1 Condition 2 Condition 3
24
Figure 2. The effects of treatment on cycle ergometry peak and average power.
*Significantly higher than placebo (p<.001).
25
Figure 3. The effect of treatment on total work during cycle ergometry.
*Significantly higher than placebo (p<.001).
26
Figure 4. Differences in cycle ergometer peak power across trials.
*Significantly different than trials 6, 7, and 8 (p<.05). † Significantly different than trials 5, 6, 7, and 8 (p<.05). ‡ Significantly different than trials 3, 7, and 8 (p<.05).
27
Figure 5. Differences in cycle ergometer fatigue index across trials.
*Significantly different than trials 4, 5, 7, and 8 (p<.005). † Significantly different than trial 7 (p<.005).
28
Figure 6. The effects of treatment on lutenizing hormone and testosterone levels.
Con
cent
ratio
n (m
lU·m
L-1)
0
1
2
3
4
5
6
Con
cent
ratio
n (n
mol
·L-1
)
0
10
20
30
40
Placebo Single Dose Double Dose
Luteinizing Hormone Testosterone
* *
*Significant differences among all treatment conditions (p<.001).
29
Figure 7. The effects of treatment on cortisol and testosterone/cortisol ratio.
Con
cent
ratio
n (n
mol
·L-1
)
0
100
200
300
400
Test
oste
rone
/Cor
tisol
Rat
io
0.00
0.02
0.04
0.06
0.08
0.10
0.12
0.14
0.16
0.18
Placebo Single Dose Double Dose
Cortisol Testosterone/Cortisol Ratio
** *
*Significant differences among all treatment conditions (p<.001).
**Significant differences between the double dose and all other treatment conditions (p<.001).
3 0
Table 1. Results for Grip Strength Testing Grip strength (kg) Placebo Single Dose Double Dose Trial 1 56.1 ± 7.7 53.9 ± 8.5 54.1 ± 7.4 Trial 2 55.6 ± 8.5 52.7 ± 8.0 55.2 ± 8.2 Trial 3 54.8 ± 8.0 52.6 ± 8.2 55.1 ± 7.1 Average of trials 55.5 ± 7.9 53.1 ± 8.1 54.8 ± 7.5
31
Table 2. Cardiovascular responses across time. Variable Heart Rate
(BPM) Systolic Blood Pressure
(mmHg) Diastolic Blood Pressure
(mmHg) Time Point Mean ± SD Mean ± SD Mean ± SD
Tpre1 58.3 ± 9.1* 122.9 ± 9.6 69.0 ± 5.7 Tpre2 56.7 ± 12.9 123.9 ± 12.2 70.5 ± 6.6 Tpost 97.9 ± 23.0† 150.2 ± 22.6‡ 71.6 ± 11.4
Tpost30 70.7 ± 12.6† 124.9 ±± 10.1 68.9 ± 5.7 Tpost60 65.5 ± 11.0† 122.9 ± 10.2 69.1 ± 5.8 Tpost120 58.3 ± 9.7 123.2 ± 11.0 69.7 ± 4.7 Tpost180 55.6 ± 9.0 124.3 ± 7.4 70.3 ± 7.7
* Significantly different than HRpost120 and HRpost 180 (p<.005) † Significantly different than all other time points (p<.004) ‡ Significantly different than all other time points (p<.001)
32
Table 3. Metabolic response across time. Variable Glucose (mmol/L) Insulin (pmol/L) Lactate (mmol/L)
Time Point Mean ± SD Mean ± SD Mean ± SD Tpre1
5.16 ± 0.55a 38.10 ± 13.90c 1.40 ± 0.50e Tpre2 5.56 ± 0.83b 48.80 ± 19.50d 1.80 ± 1.10f Tpost 4.85 ± 0.58 34.50 ± 10.10c 11.10 ± 4.40e Tpost 30 5.18 ± 0.77a 50.70 ± 23.60d 5.40 ± 2.00e Tpost 60 4.90 ± 0.55 35.50 ± 14.20c 3.90 ± 2.10e Tpost 120 4.99 ± 0.69 28.40 ± 11.60 2.80 ± 1.60 Tpost 180 4.90 ± 0.84 26.50 ± 13.00 2.30 ± 1.40
Mean 5.08 ± 0.13 37.50 ± 4.74 4.09 ± 1.24 aSignificantly different than Tpre2, Tpost, and Tpost 60 (p<.001) bSignificantly different than all post-test values (p < .001) cSignificantly different than Tpre2, Tpost30, Tpost120 and Tpost 180 (p<.001). dSignificantly different than Tpost120 and Tpost 180 (p<.001). eSignificantly different than all other time points (p<.001). fSignificantly different than Tpost120 (p < .001).
33
Table 4. Changes in ACTH across time.
Placebo (P) Single Dose (S) Double Dose (D) ACTH (pmol/L) Mean ± SD Mean ± SD Mean ± SD
Tpre1 5.39 ± 3.30 4.79 ± 2.13 4.15 ± 2.00
Tpre2 3.71 ± 2.08 3.53 ± 1.58 3.22 ± 1.20 Tpost 23.02 ± 25.72 13.14 ± 10.52 6.99 ± 5.21a Tpost 30
6.26 ± 5.14 4.87 ± 3.20 3.59 ± 3.09 Tpost 60 3.77 ± 1.61 3.00 ± 1.26b 2.85 ± 1.40b Tpost 120 3.07 ± 1.61 2.87 ± 1.10 2.62 ± 0.83 Tpost 180 2.84 ± 1.45 2.81 ± 0.73 2.79 ± 0.75
Mean 6.87 ± 1.30a 5.00 ± 0.67a 3.75 ± 0.43a aD was significantly different than P or S at Tpost (p<.05) bS and D significantly different than P at Tpost 60 (p<.05)
34
Table 5. Changes in cortisol and testosterone/cortisol ratio across time points. Variable Cortisol (nmol/L) T:C Ratio
Time Point Mean ± SD Mean ± SD Tpre1
384.42 ± 112.72a 0.0765 ± 0.0362d Tpre2 328.32 ± 110.70b 0.0843 ± 0.0442b Tpost 294.60 ± 99.57c 0.1042 ± 0.0506c Tpost 30 337.46 ± 128.19c 0.0967 ± 0.0785e Tpost 60 313.76 ± 195.29c 0.1100 ± 0.0779e Tpost 120 252.28 ± 152.66 0.1356 ± 0.1027 Tpost 180 207.06 ± 58.36 0.1338 ± 0.0652
Mean 305.56 ± 43.04 0.1059 ± 0.0232 aSignificantly different than Tpre2, Tpost, Tpost 60, Tpost120, and Tpost 180 (p<.002) bSignificantly different than Tpost, Tpost120, and Tpost 180 (p<.002) cSignificantly different than Tpost120, and Tpost 180 (p<.002) dSignificantly different than Tpost, Tpost 60, Tpost120, and Tpost 180 (p<.001) eSignificantly different than Tpost 120 (p<.001)

35
Table 6. Changes in growth hormone and prolactin across time points. Variable GH (ug/L) Prolactin (pmol/L)
Time Point Mean ± SD Mean ± SD Tpre1
0.18 ± 0.32 429.22 ± 168.91d Tpre2
0.39 ± 1.59a 340.34 ± 105.54e Tpost 0.49 ± 1.04b 355.55 ± 113.25e Tpost 30 1.31 ± 1.84c 326.71 ± 120.40e Tpost 60 1.04 ± 1.64 285.63 ± 98.16f Tpost 120 0.56 ± 1.85 254.35 ± 83.41 Tpost 180 0.23 ± 0.57 235.45 ± 92.13
Mean 0.60 ± 0.63 318.18 ± 28.15 aSignificantly different than Tpost, Tpost 30 and Tpost 60 (p<.05) bSignificantly different than Tpost 30, and Tpost 180 (p<.05) cSignificantly different than Tpost 180 (p<.05) dSignificantly different than Tpre2, Tpost, Tpost 60, Tpost120, and Tpost 180 (p<.001) eSignificantly different than Tpost60, Tpost 120, Tpost 180 (p<.001) fSignificantly different than Tpost 120 and Tpost 180 (p<.001)

36
Table 7. T scores and TMDS for Profile of Mood States. Subscale Pre Post Tension/anxiety 34.00 ± 4.92 35.00 ± 5.52 Depression 40.06 ± 5.88 40.31 ± 7.73 Anger/hostility 41.00 ± 5.86 41.00 ± 5.93 Vigor 45.00 ± 13.50 44.00 ± 13.06 Fatigue 42.00 ± 6.85 47.00 ± 9.37 Confusion 33.00 ± 4.53 33.00 ± 5.47 TMDS 144.00 ± 28.26 153.00 ± 33.37