Embed Size (px)
Citation preview
V8/r
THE EFFECTS OF A BRAIN-BASED LEARNING STRATEGY, MIND MAPPING,
ON ACHIEVEMENT OF ADULTS IN A TRAINING ENVIRONMENT
WITH CONSIDERATION TO LEARNING STYLES
AND BRAIN HEMISPHERICITY.
DISSERTATION
Presented to the Graduate Council of the
University of North Texas in Partial
Fulfillment of the Requirements
For the Degree of
DOCTOR OF PHILOSOPHY
By
Marian H. Williams, B. S., M. S.
Denton, Texas
May, 1999
Williams, Marian H., The effects of a brain-based learning strategy. Mind
Manning, on achievement of adults in a training environment with consideration to
learning styles and brain hemisphericitv. Doctor of Philosophy (Applied Technology,
Training & Development), May, 1999,141 pp., 15 tables, 11 illustrations, references, 242
titles.
This study examined the effectiveness of Mind Mapping (a diagram of the
structure of ideas in an associative manner, using graphics, color and key words) as a
note-taking device in a training course in a large, high-tech corporation, as compared to
traditional note-taking. The population for this study consisted of personnel employed by
a major high-tech firm, that had voluntarily registered for a Mind Mapping training class.
The effect of Mind Mapping was measured by the pre-test and post-test of the control and
experimental groups.
The design of the study was an experimental pre-test, post-test control group
design. The statistical procedure used in this study was a one-tailed t-test to determine if
there was a significant difference between mean achievement scores of the two groups.
Calculations for the t-test were done using the computer program (SPSS). A level of
significance of .05 was specified. The one-way analysis of variance (ANOVA) General
Linear Model SPSS version 8.0 was also performed on the data. The learning style and
hemisphericity of the sample was also studied using Bemice McCarthy's Learning Type
Measure (LTM) and Hemispheric Mode Indicator (HMI) with respect to success in Mind
Mapping to identify if there is any correlation between success in Mind Mapping and
learning style or brain hemisphericity. A 2 x 4 ANOVA General Linear Model (GLM)
was the statistical procedure used to analyze the scores from the LTM and the HMI.
This study determined that Mind Mapping, which is based on the brain research
which shows that learning is a biological/physiological function, is an effective learning
strategy that can be used in training learners how to learn. The effect of one's learning
style and brain hemisphericity also play a major role in the success one has in learning
and in the types of strategies used to optimize one's learning strengths and weaknesses.
This study has found that Mind Mapping as a learning strategy crosses all learning styles
and hemisphericity boundaries making everyone able to become a successful learner.

V8/r
THE EFFECTS OF A BRAIN-BASED LEARNING STRATEGY, MIND MAPPING,
ON ACHIEVEMENT OF ADULTS IN A TRAINING ENVIRONMENT
WITH CONSIDERATION TO LEARNING STYLES
AND BRAIN HEMISPHERICITY.
DISSERTATION
Presented to the Graduate Council of the
University of North Texas in Partial
Fulfillment of the Requirements
For the Degree of
DOCTOR OF PHILOSOPHY
By
Marian H. Williams, B. S., M. S.
Denton, Texas
May, 1999
ACKNOWLEDGMENTS
The dissertation journey toward a Ph.D. is an arduous one. It should not be taken
lightly, or without considerable planning, support, and financial consideration. My
journey, although long and tedious, has been enjoyable, frustrating and a true immersion
in the act of "learning." Like a wonderful journey into a foreign land, the dissertation
process has truly been an amazing and unforgettable experience, but it is also good to be
at my journey's end.
This journey would not have been possible without my faithful life-traveling
partners, my husband, Ron, and beautiful daughter, Elizabeth. They were my helpers,
cheerleaders, financial backers, and they definitely made the journey enjoyable.
My committee members, Dr. Mickey Wircenski, Dr. Jeff Allen, and Dr. Sam
Sauls served as wonderful tour guides in my travels on this long journey. They picked me
up and dusted me off when I fell off course, while pushing me upward to my goal, always
encouraging, always supportive. Special thanks to Dr. Earl McCallon and Surintorn
Suanthong for their statistical input and support.
Without Dave Gunby, a certified Mind Mapping instructor, this dissertation
journey would not have begun, nor ended. He was the leader of the journey and aided me
in gaining the information, experiences, and data necessary to complete the process.
EDS, EDS employees, and Jim Young, EDS, were also essential in the dissertation
process and my profound thanks goes out to them. Special thanks to Tony Buzan and
Vanda North in their support to this endeavor.
My other supporters and comrades on this long journey include Sue Etta Haile,
Terri Wilson, the teachers in their schools, and my "Ph.D. friends"-Suzanne Dunn, Reba
Berryman, & Peggy Rouh.
Most of all, I'd like to thank my dad for making my life possible and giving me
the great example - that life is a great journey to be enjoyed, experienced and relished.
m
TABLE OF CONTENTS
Page
LIST OF TABLES vi
LIST OF ILLUSTRATIONS vii
CHAPTER 1
1. INTRODUCTION 1
Background Purpose of the Study
Statement of the Problem Need of the Study
Hypotheses Assumptions Delimitations and Limitations
2. DEFINITION OF TERMS 11
CHAPTER 2
I. REVIEW OF LITERATURE 14
Learning & Memory Neuroscience Brain-based Learning Hemisphericity Learning styles Metacognition Learning Strategies Visual Strategies Mapping strategies Mind Mapping Research on Mind Mapping
IV
CHAPTER 3
1. PROCEDURES AND METHODS 67
Data Treatment Analysis Design of the Study Population/Sample Pilot Study I Pilot Study II Data Gathering Procedures for Conducting the Experiment
Method of Data Analysis
CHAPTER 4.
1. RESULTS 78
Introduction Hypotheses Data Analysis
Summary CHAPTER 5
1. SUMMARY 94
Conclusions Recommendations Problems for Further Study
Summary
APPENDIX
1. Achievement Assessment Tool 105
2. Examples of Mind Maps over Reading Material 110
3. Examples of Traditional Note-taking over Reading Material 114
REFERENCES 117
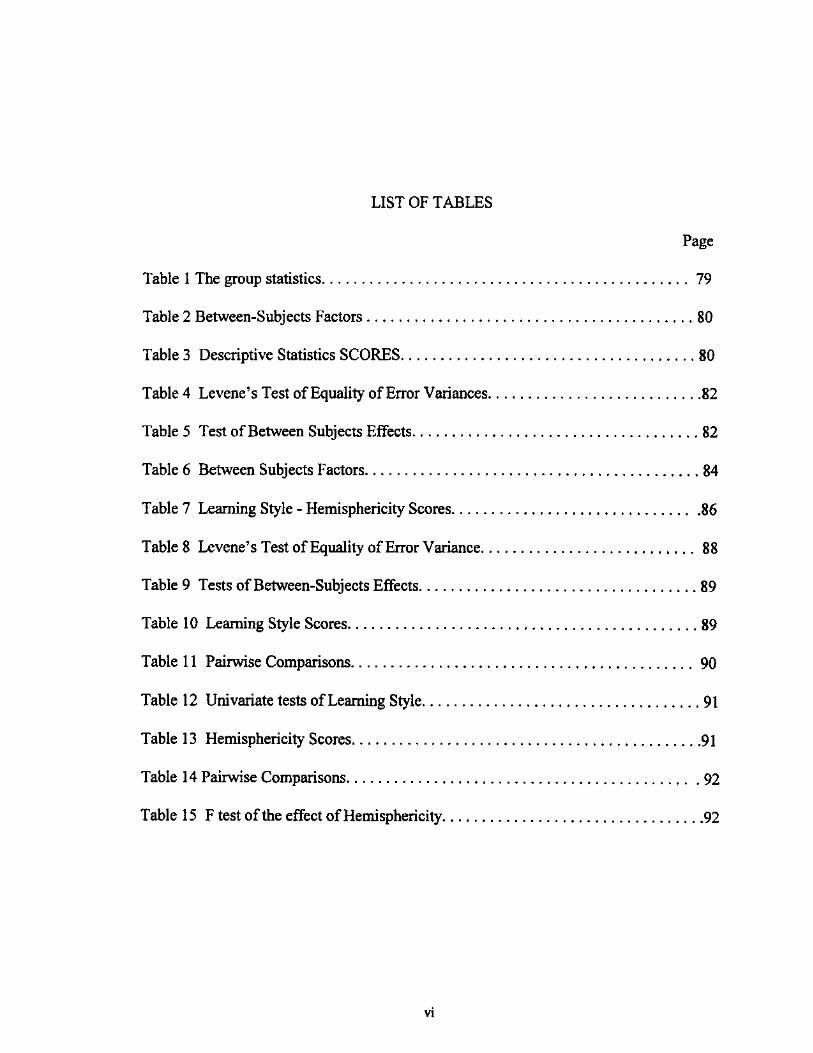
LIST OF TABLES
Page
Table 1 The group statistics 79
Table 2 Between-Subjects Factors 80
Table 3 Descriptive Statistics SCORES 80
Table 4 Levene's Test of Equality of Error Variances 82
Table 5 Test of Between Subjects Effects 82
Table 6 Between Subjects Factors 84
Table 7 Learning Style - Hemisphericity Scores 86
Table 8 Levene's Test of Equality of Error Variance 88
Table 9 Tests of Between-Subjects Effects 89
Table 10 Learning Style Scores 89
Table 11 Pairwise Comparisons 90
Table 12 Univariate tests of Learning Style 91
Table 13 Hemisphericity Scores 91
Table 14 Pairwise Comparisons 92
Table 15 F test of the effect of Hemisphericity 92
VI
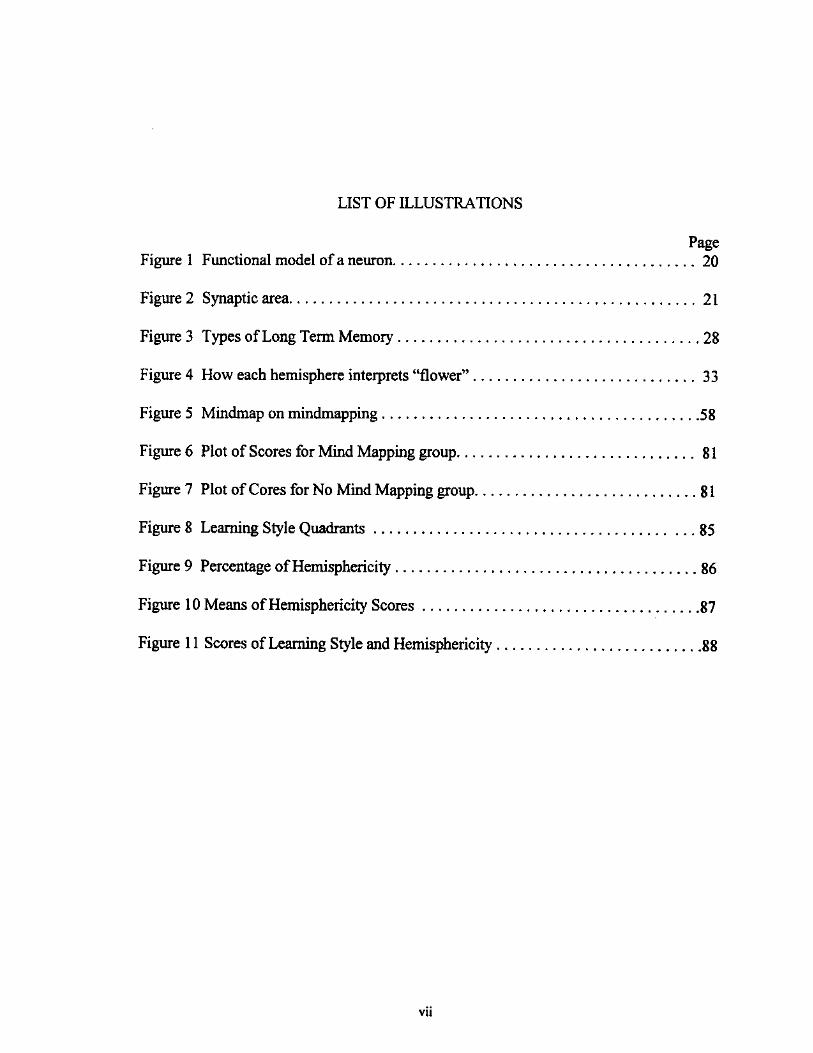
LIST OF ILLUSTRATIONS
Page
Figure 1 Functional model of a neuron 20
Figure 2 Synaptic area 21
Figure 3 Types of Long Term Memory 28
Figure 4 How each hemisphere interprets "flower" 33
Figure 5 Mindmap on mindmapping 58
Figure 6 Plot of Scores for Mind Mapping group 81
Figure 7 Plot of Cores for No Mind Mapping group 81
Figure 8 Learning Style Quadrants 85
Figure 9 Percentage of Hemisphericity 86
Figure 10 Means of Hemisphericity Scores 87
Figure 11 Scores of Learning Style and Hemisphericity 88
vu
CHAPTER 1
INTRODUCTION
Background
The new millennium will usher in a period of technological innovation,
unprecedented economic opportunity, surprising political reform, and great cultural
rebirth (Naisbitt & Aburdene, 1990).
We are now in an age of instant communication. We have the ability
to store all the world's information, and make it available almost
instantly, in virtually any form, to almost anyone anywhere on earth.
Using that ability to the fullest will change your world at least as much
as the alphabet, the printing press, the steam engine, the automobile or
television. Its impact will be greater than the silicon chip, the personal
computer, the voice-activated word processor, fiber optics, satellites,
and interactive compact video disks—even though it will make use of
all these. We are coming into an age dominated by a one-world
economy and a prime task of each society is to prepare all its members
to reshape their own future: to develop skill and abilities needed to
flourish in that one-world economy. (Dryden & Vos, 1994, p.25)
These changes have already resulted in a growing emphasis on learning (Argyris,
1991, 1993; Senge, 1990, 1992). In a rapidly changing environment, the ability of trainers,
educators, and workers to utilize and understand the expanding base of available
knowledge will be of paramount importance to their success. This study will show that by
using certain brain-based strategies, training can be redesigned to enable learners to
become more successful learners.
Three reports specifically targeted to help develop the public sector of the
workforce for the 21st century are built on the premise of learning (Hudson Institute,
1987,1988; National Commission on the Public Service, 1990). The general concept of
learning has a long and full history; however, only recently has 'learning" been applied to
organizations. Since 1990, the number of books and articles on the learning organization
has increased dramatically (Bassi, Benson, & Cheney, 19%). The term 'learning
organization" is seen throughout this literature and has its roots in the ideas of socio-
technical systems, action research, and the work of Chris Argyris and Donald Schon
(1992) on organizational learning (Senge, 1990).
A substantial amount of research has been undertaken in the areas of cognitive
styles, learning modalities, learning styles, cultural differences, language differences and
communication styles across cultures, and multiple intelligences. This research is the
product of philosophers, anthropologists, linguists, and biologists, as well as researchers
of brain functioning and neural "connectionism" (Sylwester, 1995). Additionally,
information gained by neuroimaging techniques has given us new insight into the
physiological changes that take place when we learn. Little action has actually been taken
to incorporate this research into methods of training, much less in the design and
development of learning organizations.
We must make changes in the way we learn and these changes are more urgent
than changes in technology (Dryden & Vos, 1994). It is imperative that we incorporate
the new research in all these areas into the way we train. We can teach learners how to
learn by designing and using brain-fitting, brain-compatible instructional tools, such as
Mind Mapping®, which is a Registered Trademark. We can transform workers into
learners who can then direct the future of the learning organization.
This study will attempt to show that a brain-compatible learning strategy, Mind
Mapping, can enable learners to be more successful learners.
Purpose of the Study
The purpose of this study is to determine the effectiveness of Mind Mapping, a
brain-based learning strategy, as a note-taking device with adults in a corporate training
environment. The effect of learning style and brain hemisphericity preference on success
in the use of Mind Mapping will also be assessed as a tool to better understand how to aid
people in becoming effective, efficient learners.
In the future, training will become devoted to teaching learners how to leant by
using specialized thinking strategies and learning techniques, such as Mind Mapping
(Gross, 1992). "Training needs to be reinvented. Training will not finish with school, nor
should it be confined to those who shine academically at eighteen. Learning. . . happens
all through life unless we block it" (Handy, 1989, p. 20).
In the past, people were prepared for a future with jobs in the industrial age-jobs
that are disappearing daily. People now need to be preparing for the jobs of the future,
jobs that will require thinking skills, not rote memorization and repetition. Mind Mapping,
is a brain-based learning strategy, that will provide opportunities for learners to attain
thinking skills.
This study should determine if Mind Mapping is an effective learning strategy that
can be used in training learners how to learn. The effect of one's learning style and brain
hemisphericity also play a major role in the success one has in learning and in the types of
strategies used to optimize one's learning strengths and weaknesses. Mind Mapping as a
learning strategy crosses all learning styles and hemisphericity boundaries making
everyone able to become a successful learner.
Statement of the Problem
The 21* century will usher in "the learning society" and the most successful
corporations will be those viewed as learning organizations. The term learning
organization refers to an organization where learning is a planned, intentional process that
directs the performance of individuals, teams, and the entire company (Bassi, et al., 1996).
Success for employees in this learning organization environment will be dependent on their
own thinking abilities. Learning will require workers to increase their thinking
competencies as well as their adeptness in learning new information. Learning will be a
continuous, life-long process (Gross, 1992). The matter is so important that Buzan states,
"If your company does not become a learning organization, it will become a dead
organization." (Buzan, 1991, p. 3).
In the past, training research and development efforts were focused on
improvement of training. Now the focus should be the transfer of classroom knowledge
and skills to the job situation (Dansereau, 1985). Transfer of training is the effective and
continuing application of the knowledge and skills gained in training (Broad & Newstrom,
1992). This transfer of training is important because U.S. organizations spend billions of
dollars each year on training and development for the employees, when approximately
90% is wasted within the first two weeks because that knowledge and training is not fully
applied by those employees on the job. (Buzan, 1991; Weinstein, Goetz, & Alexander,
1988).
For U.S. organizations to remain competitive in the global marketplace they must
develop highly skilled workforces. Our multi-billion-dollar training industry must be able
to demonstrate that these investments pay off in improved performance on the job (Broad
& Newstrom, 1992). The areas of cognition, metacognition, and the task and the learner
are of prime importance and should be the focus of future research (Weinstein, 1988).
According to Howard Gardner (1991), although we have learned a great deal
about learning, in most instances action to use this knowledge is not being taken. John
Goodlad's (1983) study found that most instructors still used strategies that consisted
mainly of lecturing and individual paper work. It is essential that instructors become
aware of the new cognitive science research, embrace it, and act upon it.
The educational issue that is under consideration in this study is the lack of use of
strategies that enable learners to be successful - learning how to learn, no matter what
their learning style or hemisphericity preference. The focus of this study will be the brain-
based learning strategy, Mind Mapping, and its effectiveness in note-taking across learning
styles and hemisphericity. A thorough and comprehensive assessment of the strategy of
Mind Mapping should show that it will enable people to absorb and retain much more
information, thereby making training departments utilizing Mind Mapping more effective
(Lewis, 1997).
Need for the Study
The need for this study is based on the fact that the future of the learning
organization is dependent on each person becoming lifelong, efficient learners. A problem
exists in most organizations in that most individuals do not know how to learn and that
those individuals assumed to be best at learning (i.e., professionals) are not good at
learning (Argyris, 1991). To resolve this dilemma, organizations must overcome their
resistance to new ideas and begin to use systems thinkers, and develop collaborative
learning capabilities "among different, equally knowledgeable people" (Senge, 1990, p.
14). It will become necessary to incorporate new ideas, such as Mind Mapping, into our
metacognitive skills as a new learning strategy. The challenge for training professionals
will be to put the concepts of a learning organization into operation through use of
strategies examined by this study (Bassi, et al, 1996).
The learning strategy that is the focus of this study is Mind Mapping. A mindmap
is a visual representation of knowledge. It is a diagram of the structure of ideas in an
associative manner, using graphics, color, and key words. The brain-based learning
strategy, Mind Mapping, is based on the translation of brain research which shows that the
mind does not process information in solely list-like, linear representations.
Research into Mind Mapping as a training strategy is inadequate. Many strategies that are
advocated in the curriculum literature have not been adequately evaluated (Pressley,
Woloshyn & Associates, 1995). The more scientifically conducted research in learning
theory has been undertaken largely by psychologists unconnected with the training
enterprise, who have investigated problems quite remote from the type of learning that
goes on in the classroom. The focus has been on animal learning or on short term and
fragmentaiy rote or nonverbal forms of human learning, rather than on the learning and
retention of organized bodies of meaningful material (Hart, 1983). In addition to strategy
research, Hyerle (1993) suggests that areas related to maps that need to be researched are
cognitive development, schema theory, cognitive styles, learning styles, cultural
differences, and secondary language acquisition. There is a need for research regarding
the relationship between Mind Mapping and brain hemisphere dominance and this needs to
be done using a more comprehensive and reliable instrument (Mehegan,1996). In addition
to the hemisphericity of the learner, Trautman (1979) suggests that further research should
be done to establish better, more succinct criteria by which to determine the cognitive
style and learning style characteristics of curriculum, resources, and instructional
strategies.
The lack of research in the areas of Mind Mapping and its effectiveness as a note-
taking device and the effect of learning style and hemisphericity on success in Mind
Mapping make this a critical area for study. This dissertation study should show that
brain-based strategies provide greater achievement by using both hemispheres. For
training departments, learning strategies, such as Mind Mapping, can be a more successful
method of instructing people how to comprehend, store and utilize information.
Hypotheses
The hypotheses for this study are:
1. Participants that receive Mind Mapping training will score significantly higher on the
achievement score measure than the participants that did not receive the Mind Mapping
training.
2. Within the group trained in Mind Mapping there will be no significant difference in
performance among participants across learning style as measured by the Learning Type
Measure instrument.
3. Within the group trained in Mind Mapping there will be no significant difference in
performance among participants across hemisphericity as measured by the Hemispheric
Mode Indicator instrument.
4. There will be no significant interaction between the learning style and hemisphericity
variables.
Assumptions
The following assumptions were made regarding the study.
1. The instruction received by each participant was of equal content and quality by the same
instructor, who is certified and trained in Mind Mapping.
2. Participants in neither the experimental nor the control group have had previous
instruction regarding Mind Mapping.
3. No one group received differential attention during the training, thus, the Hawthorne
Effect is not a factor that influences the research results.
Delimitations and Limitations
Delimitations
The delimitations that are imposed upon this study include the following:
1. This study will be limited to the study of Mind Mapping as a note-taking device.
2. Subjects for this study are from an industrial, corporate training environment.
3. This study will be limited to participants that have registered to take this course.
4. Educational level of subjects will not be considered as part of this study.
5. Gender of participants will not be considered as part of this study.
Limitations
The limitations that are imposed upon this study include the following:
6. The subjects in this study will be treated over a variety of times and settings.

10
7. The subjects in this study will be in the training classes as a result of voluntary
registration.
11
DEFINITION OF TERMS
Advance organizer - Instructional activity that focuses the learner on the essence of what is about to be taught (Pratt, 1994).
Behaviorism - General term for the psychology dominant in the United States through most of the 20th century, heavily using such terms as stimulus-response, reward, reinforcement, motivation, mediation, etc. (Hart, 1983).
Brain - The main, central mass of the nervous system housed in the skull, comprising 95 percent or more of the entire human nervous system (Hart, 1983).
Brain Based - Utilizing scientific knowledge of the brain, especially the human brain (Hart, 1983). An understanding of learning based on the structure and function of the brain. Learning occurs if the brain is not prohibited from fulfilling its normal processes.
Brain-cpmpatible - Fitting well with the nature or shape of the human brain as currently understood (Hart, 1983).
Cerebellum - The "little Brain" near the back of the neck, primarily concerned with coordinating muscular activity (Hart, 1983).
Cerebrum - The new mammalian brain, composed of two largely mirror-image hemispheres, in humans about 5/6 of the entire brain (Hart, 1983).
Concept - A general term for any consistent portion of an individual's progress in "making sense of the world"; a working hypothesis (Hart, 1983).
Constructivism theories of learning - These theories state that learners must individually discover and transform complex information, checking new information against old rules and revising them when they no longer work (Slavin, 1994).
Constructivism - A philosophy of learning that is founded on the premise that we all construct our own understanding of the world we live in, through reflection on our experiences. We use the 'rules' and "mental models" we generate in this process to maiff sense of experience. Learning is the process of adjusting our mental models to accommodate new experiences.
Cognitive - Related to knowledge or intellectual activity (Pratt, 1994).
12
Corpus callosum - Large bundle of nerve fibers forming a two-way bridge between the left and right cerebral hemispheres (Hart, 1983).
Cortex - The "bark" or outside layers of brain lobes; the gray matter of the brain in which thinking proceeds (Hart, 1983).
Hemispheres - The left and right portions of the cerebrum, roughly mirror images (Hart, 1983).
Information-processing theory - Cognitive theory of learning that describes the processing, storage, and retrieval of knowledge from the mind (Slavin. 1994).
Knowledge - Knowledge almost always takes the form of stored programs or pattern recognition (Hart, 1983).
Knowledge Structure - A hierarchy of levels, from common knowledge to higher and higher specific, detailed, technical, broad and theoretical, professional levels (Hart, 1983).
Learning - The acquisition of useful programs (Hart, 1983).
Learning Stvle - Tendency of an individual to learn more efficiently or effectively under a particular set of environmental conditions (Pratt, 1994).
Process of learning - The extraction from confusion of meaningful patterns, which can subsequently often be recognized by match (Hart, 1983).
Linear - Arranged in a line, or ample sequence; single path as opposed to multipath (Hart, 1983).
Metacognition - Awareness, monitoring, and regulating of one's own intellectual processes (Pratt, 1994). Knowledge about one's own learning, or knowing how to learn and monitoring one's own learning behaviors to determine the degree of progress and strategies needed for accomplishing instructional goals (Slavin, 1994).
Neuron - The specialized cell of the nervous system, which has 30 billion or more. There are a number of categories of neurons, with different shapes and functions (Hart, 1983).
Neuroscience - The study of the human nervous system, the brain, and the biological basis of consciousness, perception, memory and learning.
Pattern - An entity, such as an object, action, procedure, situation, relationship or system, which may be recognized by substantial consistency in the clues it presents to a brain, which is a pattern-detecting apparatus (Hart, 1983).
13
Schema. Schemata - A term used for programs which are not learned after birth but are genetically transmitted. Example: a bird "knows" how to build a nest. In humans schemata may be vague, to be refined by the culture (Hart, 1983).
Schema theory - The theory that information is stored in long-term memory in networks of connected facts and concepts that provide a structure for making sense of new information (Slavin, 1994).
Svnapse - The connection between one neuron and another; actually a tiny gap across which neurotransmitters act. Since a singe neuron may connect with 10,000 or more others, synapses in a human brain run into vast numbers (Hart. 1983).
Strategy - The method, process, procedure, or technique used in instruction (Pratt, 1994).
CHAPTER 2
REVIEW OF LITERATURE
This chapter reviews and summarizes relevant literature on Mind Mapping,
learning and memory, brain-based learning, the new neuroscience discoveries about the
brain and how it learns, metacognition, strategies, learning styles and hemisphericity
preferences. The first part of this chapter is comprised of a review of current literature
and research on the various entities that affect the brain-based learning strategy of Mind
Mapping. The second part of the literature review works and studies showing the
effectiveness of Mind Mapping as a note-taking strategy.
Learning and Memory
The learning organization and the ability to learn will be of prime importance in the
decade to come (Gross, 1992; Naisbitt, 1990; Senge, 1990,1992; Argyris, 1991; Dryden
& Vos, 1994; Buzan, 1991). By studying how we learn and how we can learn more
efficiently, we can meet these growing needs. This review of the literature begins by
examining what we currently know about learning and memory.
Learning and memory are inextricably entwined because without memory one cannot
learn. Learning is the active process of gaining a skill or knowledge. Learning occurs
when learners relate information to prior knowledge and when learners construct their
14
15
own reality from sensory perceptions (Hart, 1983; Jonassen, 1987). Memory involves the
processes of mental storage and the processes of locating, retaining and recalling what has
been learned.
Historically, the study of the nature of knowledge and knowledge production
(epistemology) and learning research looked at association, contiguity, 'The Law of
Effect" (Thomdike, 1913), and practice, which included multiple associations. This
behavioral approach, the old traditional factory-model-of-production-view o f learning and
instructing, of Skinner, Pavlov, Thorndike and others, has been shown to be out-of-date
and erroneous (O'Neil, 1978).
The cognitive revolution and the work of Jean Piaget slowly shifted the traditional
view of training to constructivism. The broad-based thinking skills movement of the past
20 years has been led by the works of Arthur Costa (1991), David Perkins (1990), Edward
deBono (1994) and many others (Fosnot, 1996). The constructivist theory of learning
emphasizes that cognitive change only takes place when learners individually discover and
transform complex information and make it their own (Brooks, 1990; Leinhardt, 1992;
Brown & Duguid, 1989; Magoon, 1977; Slavin, 1994).
Constructivism is now guided by research in cognitive science (Gardner, 1985).
Cognitive science became the doctrine that human behavior was more than conditioned
responses, and the human mind is able to create, choose, reflect and explore the universe
between stimulus and response (Resnick & Klopfer, 1989; Purves, Fitzpatrick, Katz, &
McNamara, (Eds.), 1997). Presently, with all the new research on the brain and how we
learn, we have the opportunity to transform training. John Bruer(1993) claims that the
16
instructional methods based on the research in cognitive science will be as important to
training as the polio vaccine and penicillin were to the world of medicine. Unfortunately,
the only ones that seem aware of these breakthroughs in instruction are the researchers,
not the instructors.
A contemporary view of instructing and learning based on research in cognitive
science holds that, among other things: all learning, except for simple rote memorization,
requires the learner to actively construct meaning; learners' prior understandings and
thoughts about a topic or concept before instruction exert a tremendous influence on what
they learn during instruction; the instructor's primary goal is to generate a change in the
learner's cognitive structure or way of viewing and organizing the world; and learning in
cooperation with others is an important source of motivation, support, modeling and
coaching (Nolan & Francis, 1992).
The next step in the evolution of learning theories is the brain-based learning
theory. It is based on the latest discoveries in neuroscience. The biological process of
how we learn is the basis for how we instruct.
Neuroscience
Progress in neuroscience in understanding the brain as a system and
communication between neurons has been amazing. A merger between the two areas,
neuroscience and cognitive science, has developed to study how the human nervous
system develops knowledge, learning, and memory (Hart, 1983). The physiological
impact of how we learn is astounding. When you learn something new, neurons actually
17
grow more dendrites to reach other neurons. The more you practice, the stronger these
connections become.
This new field, cognitive neuroscience, draws upon new methods of inquiry and
imaging that allow the human brain to be studied during life in ways never before possible.
These include techniques of brain imaging and various methods to measure the brain's
electrical and magnetic activity. X-ray CT (computer-assisted tomography), PET (positron
emission tomography), MRI (magnetic resonance imaging), SQUID (superconductivity
quantum interference device), EEG (electroencephalography) and MEG
(magnetoencephalography) allow us to learn about where activity is occurring in the brain
while it is performing various tasks (Barrett, 1992; Posner & Raichle, 1994).).
According to Leslie Hart (1983), the brain and how it learns has been and
continues to be an ignored topic because of the traditional instructional systems started by
Horace Mann in 1837 and the emphasis on the psychologists' behaviorist theories, led by
Skinner. So in order to better appreciate the new research on the physiology of the brain
and it's connection to learning, it is important to at least understand a few brain basics.
The human brain has a virtually inexhaustible capacity to learn. This amazing 3 pound
organ can store more information than all the libraries in the world (Wycoff, 1995). Each
healthy human brain, irrespective of a person's age, sex, nationality, or cultural
background, comes equipped with a set of exceptional features: We are all born with
brains that are made up of 100 billion neurons, or brain cells, and each one can grow up to
20,OCX) connections, like branches on a tree. Neurons, unlike other cells, don't produce
more neurons. The number of brain cells we are born with is approximately the number
18
we have to use throughout our lives. There are about 10 billion neurons in the brain, with
about 1,000,000,000,000,000 connections. The possible combinations of connections is
on the order of ten to the one millionth power. As we use the brain, we strengthen certain
patterns of connection. This results in a physical change in the connection itself that
makes that connection easier to make next time. This is the development of memory. As
a given message, or thought, or re-lived memory is passed from brain cell to brain cell, a
biochemical electromagnetic pathway is established. Each of these neuronal pathways is
known as a memory trace (Buzan, 1994) Repeated use keeps the track clear, thus
encouraging further traffic. The more tracks and pathways you can create and use, the
clearer, faster and more closely connected in time or place.
The triune brain theory (MacClean, 1978) helps explain the need to engage the
whole brain in learning. Paul MacClean's (1978) triune brain theory states that there are
three phases of brain development which are:
*Lizard or reptilian brain-the lizard brain is simple, geared to the maintenance of
survival functions: respiration, digestion, circulation, and reproduction.
•Leopard Brain-(Limbic System) The reptilian brain extended and the leopard brain
(or limbic brain) evolved, adding the animals' behavioral repertoire including the capacity
for emotion and coordination of movement. This portion of the evolution of the brain
yielded the general adaptation syndrome (GAS), or the fight-or-flight response.
*Neomammalian or Learning brain-(Cerebral Cortex) This is the most recent phase of
brain development. This phase provided the ability to solve problems, use language and
numbers, develop memory, and be creative (Caine & Caine, 1994; Hermann, 1996).
19
All three layers of the brain interact. To instruct someone in any subject
adequately, the subject must be embedded in all the elements that give it meaning. People
must have a way to relate to the subject in terms of what is personally important.
The other fact that we must recognize in training is that when we learn
physiological changes take place in the brain. Changes actually occur. Neurons grow
dendrites. Synaptic connections are added. Our brain changes (Kandel & Hawkins,
1992).
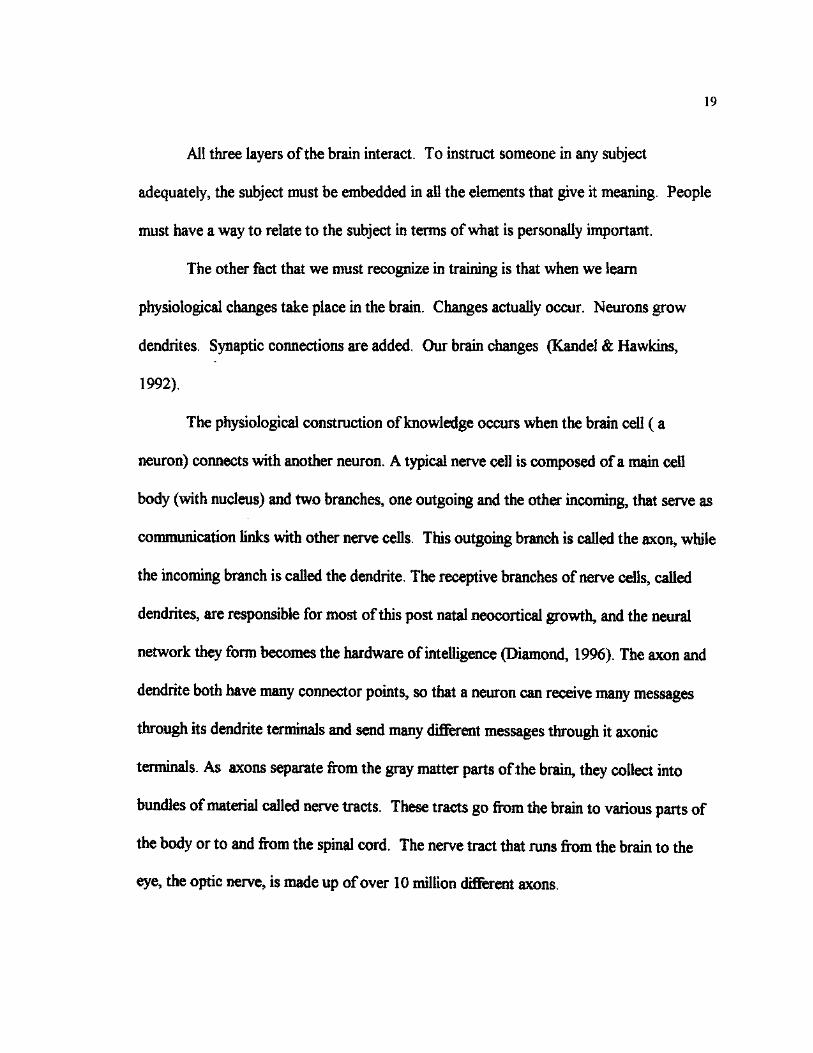
The physiological construction of knowledge occurs when the brain cell (a
neuron) connects with another neuron. A typical nerve cell is composed of a main cell
body (with nucleus) and two branches, one outgoing and the other incoming, that serve as
communication links with other nerve cells. This outgoing branch is called the axon, while
the incoming branch is called the dendrite. The receptive branches of nerve cells, called
dendrites, are responsible for most of this post natal neocortical growth, and the neural
network they form becomes the hardware of intelligence (Diamond, 1996). The axon and
dendrite both have many connector points, so that a neuron can receive many messages
through its dendrite terminals and send many different messages through it axonic
terminals. As axons separate from the gray matter parts of the brain, they collect into
bundles of material called nerve tracts. These tracts go from the brain to various parts of
the body or to and from the spinal cord. The nerve tract that runs from the brain to the
eye, the optic nerve, is made up of over 10 million different axons.
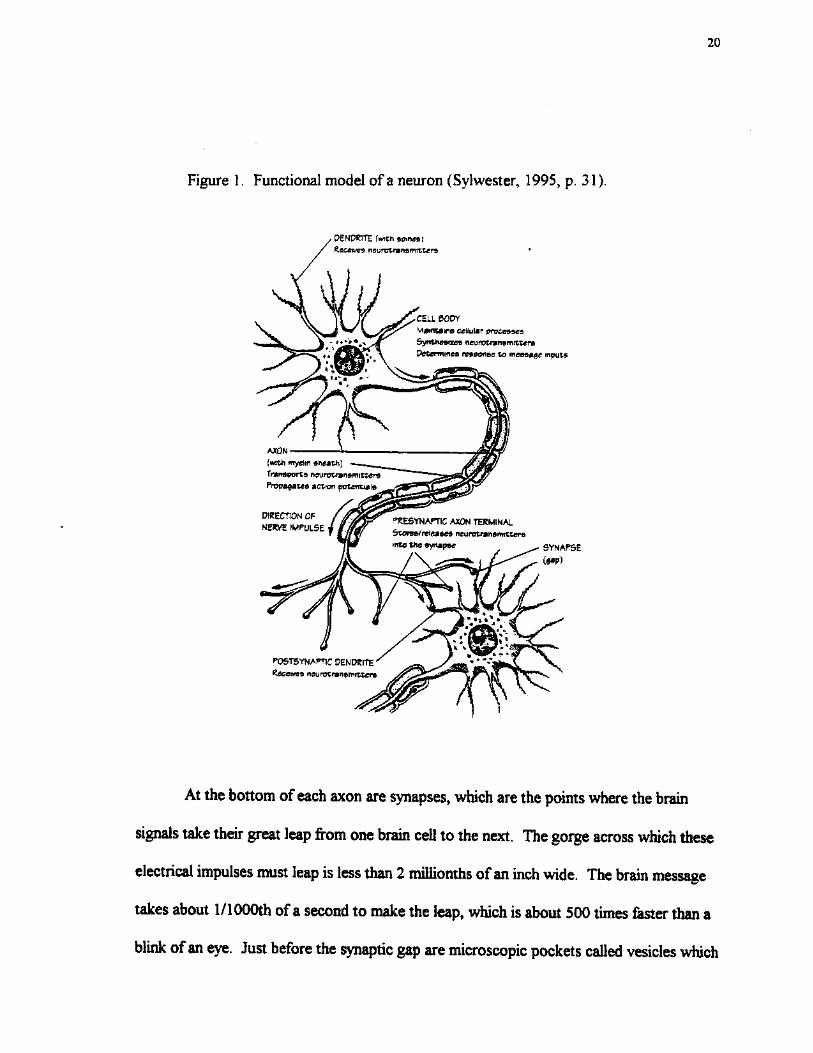
Figure 1. Functional model of a neuron (Sylwester, 1995, p. 31).
20
t DENDRITE (with spines i Receives neurotransmitters
BODY Maintains cellular processes Synthesizes neurotransmitters Determines response to message inputs
(with myelin sheath) Transports neurotransmitters Propagates action potentials
DIRECTION OF NERVE IMPULSE
PRESYNAPTIC AXON TERMINAL Stores/releases neurotransmitters
SYNAPSE
( W )
POSTSYNAPTIC DENDRITE
Receives neurotransmitters
At the bottom of each axon are synapses, which are the points where the brain
signals take their great leap from one brain cell to the next. The gorge across which these
electrical impulses must leap is less than 2 millionths of an inch wide. The brain message
takes about l/1000th of a second to make the leap, which is about 500 tinn»s faster than a
blink of an eye. Just before the synaptic gap are microscopic pockets called vesicles which
21
contain chemical transmitters . When a message arrives, the vesicle releases its chemical
transmitters (neurotransmitters) into the synapse. This release creates a chemical
imbalance and the transmitters combine and create an electrical charge. This electrical
charge allows the message being transmitted to leap from synapse to synapse. It is
generally believed that the messages transmitted during the synaptic leap help the brain
figure out what it knows (Restak, 1994).
Figure 2. Synaptic Area (Sylwester, 1995, p. 34)
IMPOSE
WITOC-tON^IA
(cettuur energy proaucuor
TERMINA
iriessea SYNAPSE
Signal* cc est: voay — y I, — y J
^ I 2EKDK~z
While much is still unknown about the brain and how we learn, these new
advances in neuroscience give us enough information to start using brain-based learning as
a framework for redesigning training.
22
Brain-based Learning
Breakthroughs in brain research by Speriy, Ornstein, and Diamond helped us
understand the split-brain, the enormous potential of the human brain, and the fact that
there is rapid growth of brain-dendrites in an environment of enriched experiences.
Therefore, cognitive learning theorists have developed the information-processing
theory, the dominant theory of learning and memory for the past twenty years (Slavin,
1994).
Brain-based learning involves acknowledging the brain's rules for meaningful
learning and organizing instruction with those rules in mind. Brain research establishes
and confirms that multiple complex and concrete experiences are essential for meaningful
learning and instructing. Optimizing the use of the human brain means using the brain's
infinite capacity to make connections and understanding what conditions maximize this
process. In essence, learners learn from their entire ongoing experience. Content is
inseparable from context. So, we as educators and trainers much search for ways to
expand the quantity and quality of ways in which a learner is exposed to content and
context. This process is often termed as immersion. The learner needs to be engaged in
talking, listening, reading, viewing, acting, and valuing (Bransford & Vye,1989).
Research indicates that the brain functions far more optimally when engaged in
challenging (but not threatening) problem solving thinking. Brain-friendly approaches to
training engage the brain in higher-order thought processes, utilizing complex real-life
issues and problems (Gardner 1993, 1991; Healy 1990).
23
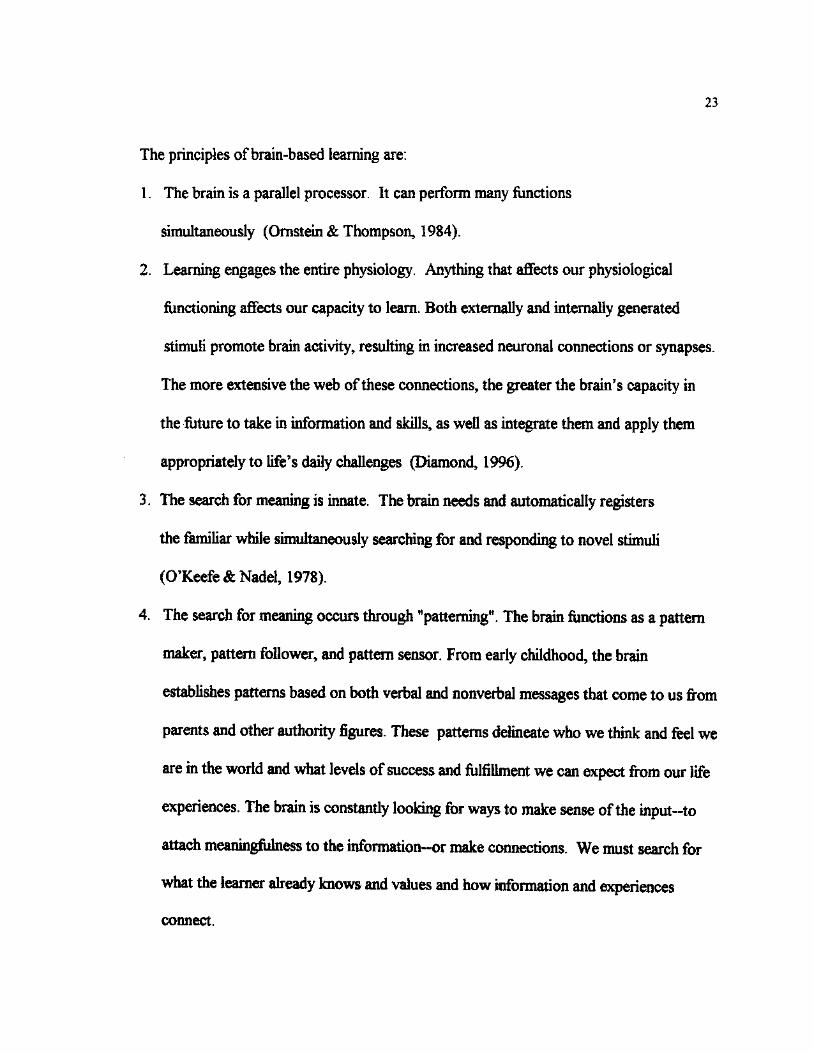
The principles of brain-based learning are:
1. The brain is a parallel processor. It can perform many functions
simultaneously (Ornstein & Thompson, 1984).
2. Learning engages the entire physiology. Anything that affects our physiological
functioning affects our capacity to learn. Both externally and internally generated
stimuli promote brain activity, resulting in increased neuronal connections or synapses.
The more extensive the web of these connections, the greater the brain's capacity in
the future to take in information and skills, as well as integrate them and apply them
appropriately to life's daily challenges (Diamond, 1996).
3. The search for meaning is innate. The brain needs and automatically registers
the familiar while simultaneously searching for and responding to novel stimuli
(O'Keefe & Nadel, 1978).
4. The search for meaning occurs through "patterning". The brain functions as a pattern
maker, pattern follower, and pattern sensor. From early childhood, the brain
establishes patterns based on both verbal and nonverbal messages that come to us from
parents and other authority figures. These patterns delineate who we think and feel we
are in the world and what levels of success and fulfillment we can expect from our life
experiences. The brain is constantly looking for ways to make sense of the input-to
attach meaningfulness to the information—or make connections. We must search for
what the learner already knows and values and how information and experiences
connect.
24
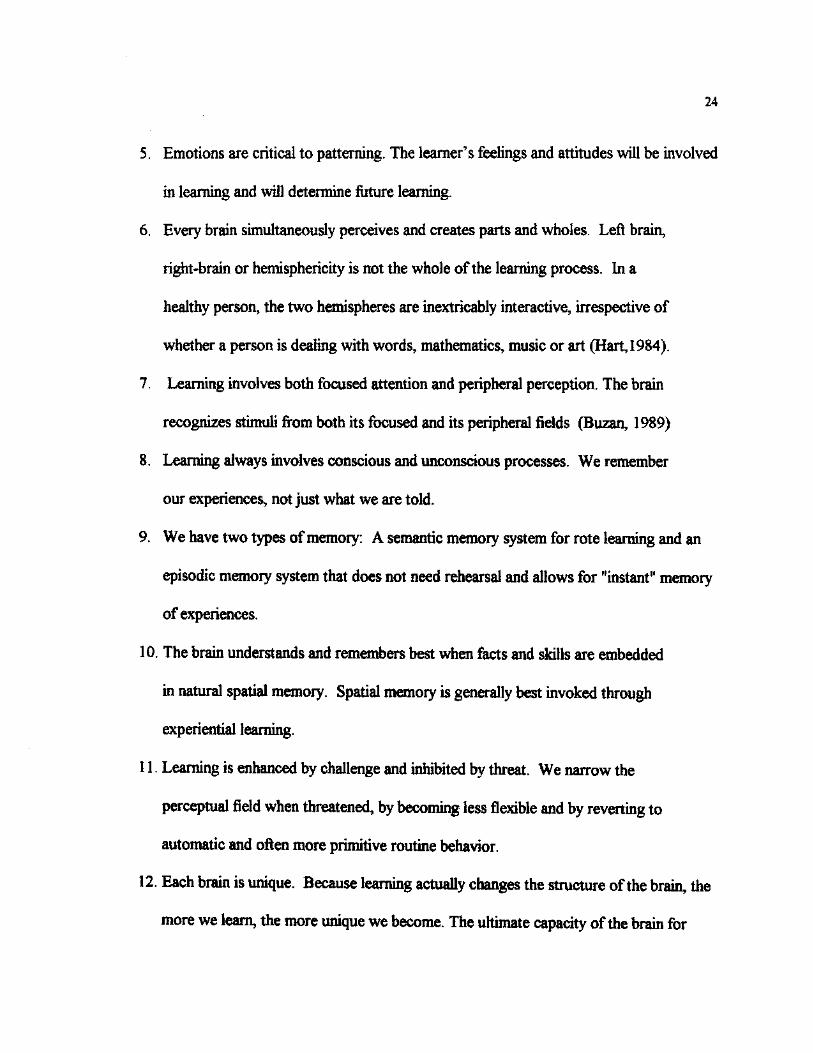
5. Emotions are critical to patterning. The learner's feelings and attitudes will be involved
in learning and will determine future learning.
6. Every brain simultaneously perceives and creates parts and wholes. Left brain,
right-brain or hemisphericity is not the whole of the learning process. In a
healthy person, the two hemispheres are inextricably interactive, irrespective of
whether a person is dealing with words, mathematics, music or art (Hart, 1984).
7. Learning involves both focused attention and peripheral perception. The brain
recognizes stimuli from both its focused and its peripheral fields (Buzan, 1989)
8. Learning always involves conscious and unconscious processes. We remember
our experiences, not just what we are told.
9. We have two types of memory: A semantic memory system for rote learning and an
episodic memory system that does not need rehearsal and allows for "instant" memory
of experiences.
10. The brain understands and remembers best when facts and skills are embedded
in natural spatial memory. Spatial memory is generally best invoked through
experiential learning.
11. Learning is enhanced by challenge and inhibited by threat. We narrow the
perceptual field when threatened, by becoming less flexible and by reverting to
automatic and often more primitive routine behavior.
12. Each brain is unique. Because learning actually changes the structure of the brain, the
more we learn, the more unique we become. The ultimate capacity of the brain for
25
learning cannot be measured and will never be known, as that capacity increases with
use (Caine & Caine, 1990).
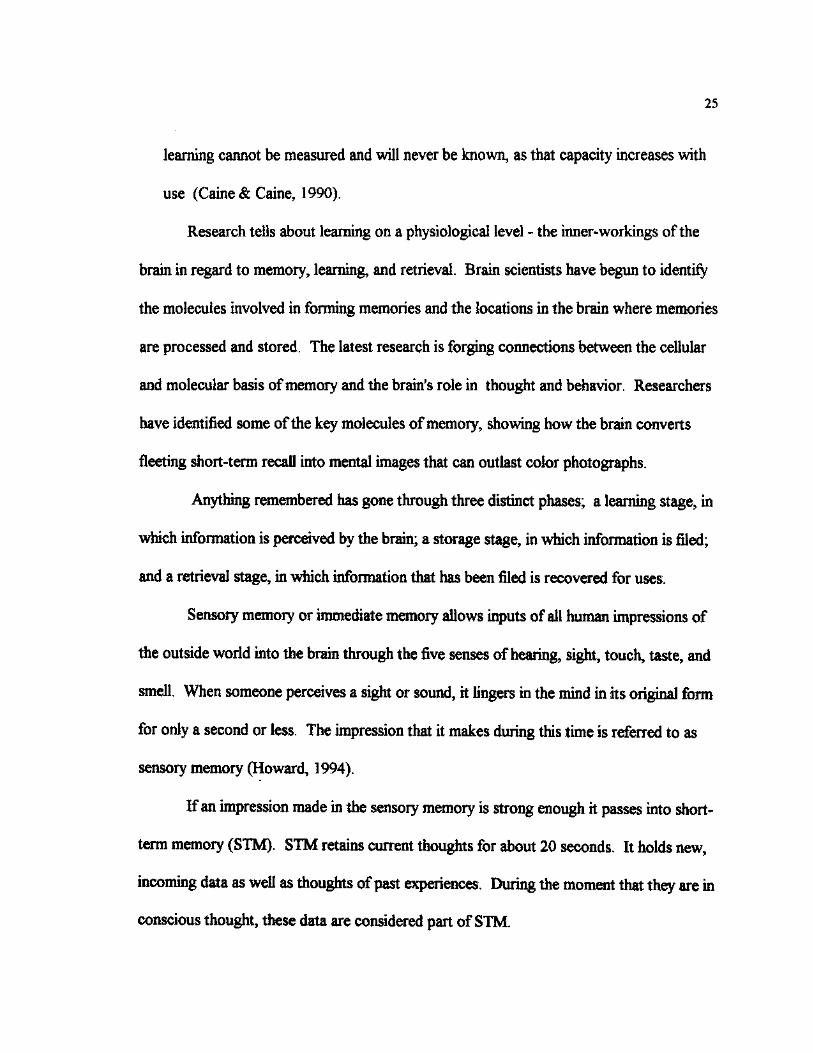
Research tells about learning on a physiological level - the inner-workings of the
brain in regard to memory, learning, and retrieval. Brain scientists have begun to identify
the molecules involved in forming memories and the locations in the brain where memories
are processed and stored. The latest research is forging connections between the cellular
and molecular basis of memory and the brain's role in thought and behavior. Researchers
have identified some of the key molecules of memory, showing how the brain converts
fleeting short-term recall into mental images that can outlast color photographs.
Anything remembered has gone through three distinct phases; a learning stage, in
which information is perceived by the brain; a storage stage, in which information is filed;
and a retrieval stage, in which information that has been filed is recovered for uses.
Sensory memory or immediate memory allows inputs of all human impressions of
the outside world into the brain through the five senses of hearing, sight, touch, taste, and
smell. When someone perceives a sight or sound, it lingers in the mind in its original form
for only a second or less. The impression that it makes during this time is referred to as
sensory memory (Howard, 1994).
If an impression made in the sensory memory is strong enough it passes into short-
term memory (STM). STM retains current thoughts for about 20 seconds. It holds new,
incoming data as well as thoughts of past experiences. During the moment that they are in
conscious thought, these data are considered part of STM.
26
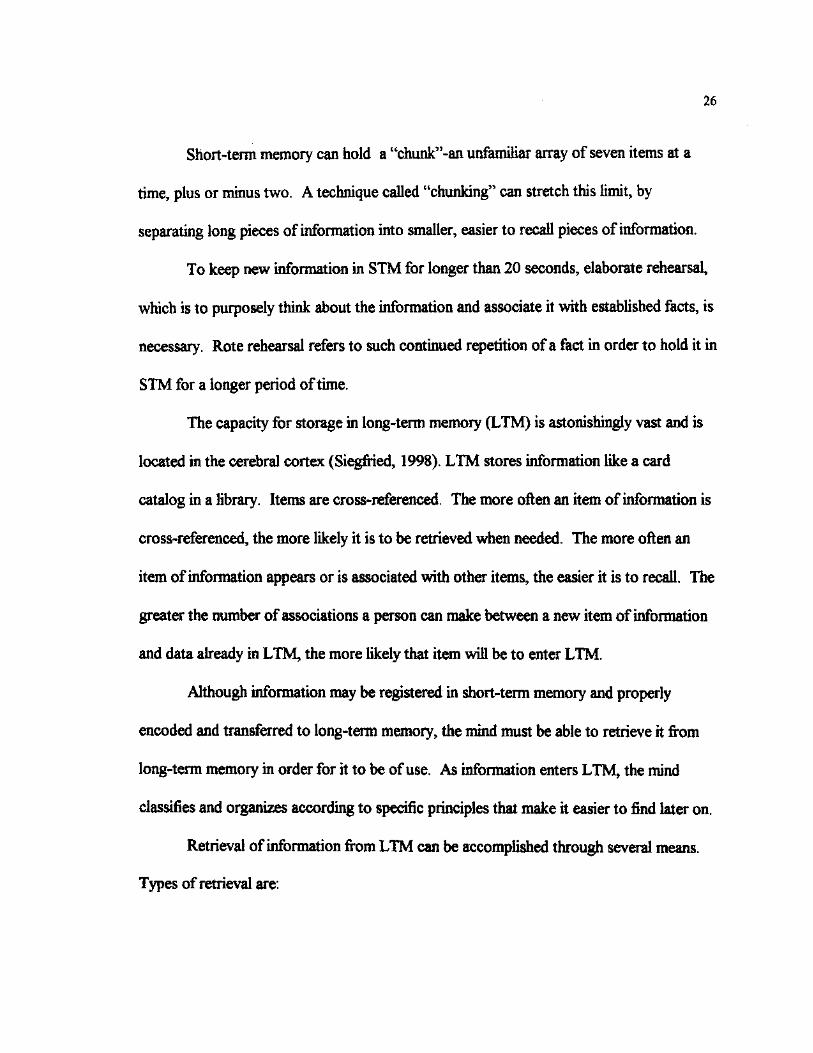
Short-term memory can hold a "chunk"-an unfamiliar array of seven items at a
time, plus or minus two. A technique called "chunking" can stretch this limit, by
separating long pieces of information into smaller, easier to recall pieces of information.
To keep new information in STM for longer than 20 seconds, elaborate rehearsal,
which is to purposely think about the information and associate it with established facts, is
necessary. Rote rehearsal refers to such continued repetition of a feet in order to hold it in
STM for a longer period of time.
The capacity for storage in long-term memory (LTM) is astonishingly vast and is
located in the cerebral cortex (Siegfried, 1998). LTM stores information like a card
catalog in a library. Items are cross-referenced. The more often an item of information is
cross-referenced, the more likely it is to be retrieved when needed. The more often an
item of information appears or is associated with other items, the easier it is to recall. The
greater the number of associations a person can make between a new item of information
and data already in LTM, the more likely that item will be to enter LTM.
Although information may be registered in short-term memory and properly
encoded and transferred to long-term memory, the mind must be able to retrieve it from
long-term memory in order for it to be of use. As information enters LTM, the mind
classifies and organizes according to specific principles that make it easier to find later on.
Retrieval of information from LTM can be accomplished through several means.
Types of retrieval are:
27
Reconstructive memory. According to Bartlett (1932), people do not remember
accurately the way in which a story was told or an event occurred. Instead, they record
information in such a way that it complies with previous personal experiences.
Schemas. Schemas form a basis for storing information, by establishing a
framework where familiar information helps a person be better able to recognize new data
and locate it in this framework in relation to similar material already stored there. This
process helps to streamline the retrieval process.
Conceptual hierarchy. This helps a person to memorize information by putting it
into larger categories or sets. This system or organizing items into general categories, and
then further subdividing them, is an efficient memory device that the human mind uses
constantly without realizing it.
Contextual cues also aid in information retrieval. A recent theory suggests that the
memory of an event or piece of information is improved when the individual is surrounded
by the same environmental cues that existed when it was learned. It appears that
environmental cues that exist during a learning experience may activate the memory for
the learned information and aid in its recall.
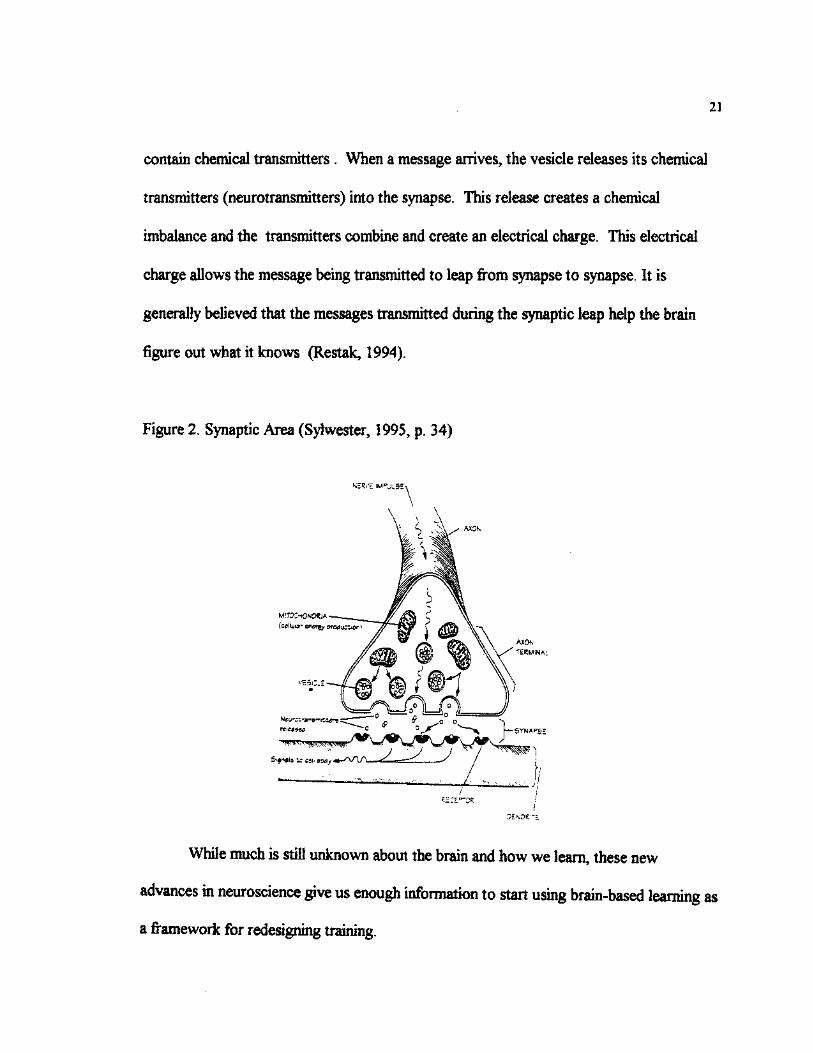
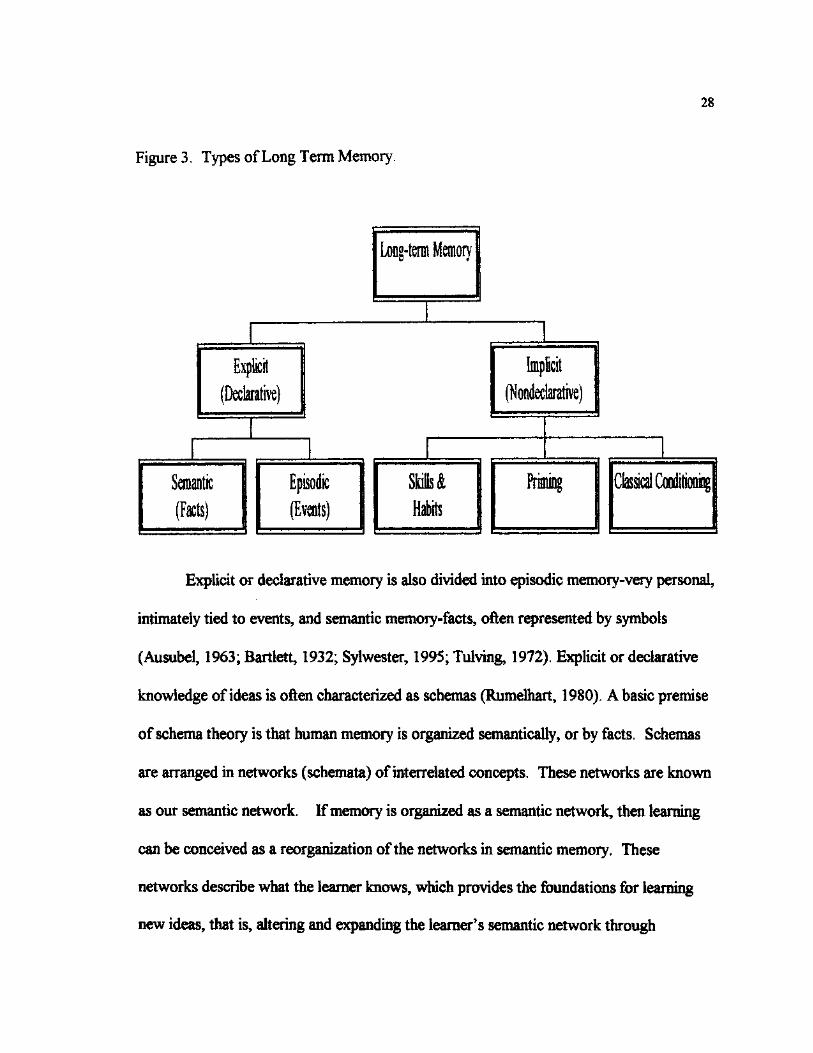
Learning and memory are also classified as to the types of learning or memory that
occur. Long-term memory is generally divided into two broad categories: explicit (or
declarative) and implicit (or non declarative) (Siegfried, 1998; Sylwester, 1995; Howard,
1994) Explicit memory involves recall of facts and events, or recognition of people,
places, and things. Implicit memory is generally unconscious-involving skills and habits.
28
Figure 3. Types of Long Term Memory.
Explicit
i Semantic (Facts)
Episodic (Events)
kpicit (Nondeclarative)
Skills & Habits
Priming Classical Cooditioniig
Explicit or declarative memory is also divided into episodic memory-very personal,
intimately tied to events, and semantic memoiy-facts, often represented by symbols
(Ausubel, 1963; Bartlett, 1932; Sylwester, 1995; Tulving, 1972). Explicit or declarative
knowledge of ideas is often characterized as schemas (Rumelhart, 1980). A basic premise
of schema theory is that human memory is organized semantically, or by facts. Schemas
are arranged in networks (schemata) of interrelated concepts. These networks are known
as our semantic network. If memory is organized as a semantic network, then learning
can be conceived as a reorganization of the networks in semantic memory. These
networks describe what the learner knows, which provides the foundations for learning
new ideas, that is, altering and expanding the learner's semantic network through
29
accretion, tuning, and restructuring. This process helps to streamline the retrieval process
(Jonassen, Beissner & Yacci, 1993; Siavin, 1994).
The most important principle of schema theoiy is that information that fits into an
existing schema is more easily understood, learned, and retained than information that
does not fit into an existing schema. (Ausubel, 1968; Rumelhart, 1980). Schemas allow
meaningful learning to occur by connecting new learning to prior learning, but this cannot
occur if the learner lacks relevant prior knowledge. This connection between meaning and
learning was first studied by David Ausubel (1968). Ausubel stated that the most
important single factor influencing learning is what the learner already knows (Ausubel,
1968).
Learners who employ meaningful learning are expected to retain knowledge over
time and they, consequently, find ways to connect new information with more general
prior learned material. Learners should continuously connect what they are learning to
their background and knowledge (All & Havens, 1997). When information is presented in
a potentially meaningful way and the learner is encouraged to anchor new ideas with the
establishment of links between old and new material, meaningful learning is more likely to
occur (Irvine, 1995).
A study by Kuhara-Kojima and Hatano (1991) illustrated this clearly. College
learners were taught information about baseball and music. Those who knew a great deal
about baseball but not music learned much more about baseball; the opposite was true of
those who knew much about music and little about baseball. In fact, background
knowledge was much more important than general learning ability in predicting how much
30
the learners would learn. Learners who know a great deal about a subject have more well-
developed schemata for incorporating new knowledge. However, learners will often fail
to use their prior knowledge to help them learn new material. Instructors must link new
learning to the learner's existing background knowledge (Pressley, Harris, Marks, 1992).
Rote learning occurs if the learner simply internalizes knowledge in an arbitrary,
verbatim fashion without making the connection between known and new knowledge.
Rote learning refers to the memorization of facts or associations, such as the multiplication
tables, etc. Much of rote learning involves associations that are essentially arbitrary. For
example, the chemical symbol for gold is (Au) and would be more easily remembered if it
were (Go or Gd). Rote learning is not "bad", but it is often "inert knowledge" or
"knowledge that could and should be applicable to a wide range of situations but is only
applied to a restricted set of circumstances" (Slavin, 1994, p. 214).
Procedural knowledge, on the other hand, describes how learners uses or apply
their declarative knowledge. Ryle describes this type of knowledge as knowing how.
Procedural knowledge entails the interrelating of schemas into patterns that represent
mental performance which are in turn represented mentally as performance schemata
(Sylwester, 1995).
Structural knowledge is an intermediate type of knowledge that mediates the
translation of declarative into procedural knowledge and facilitates the application of
procedural knowledge. Structural knowledge is the knowledge of how concepts within a
domain are interrelated.
31
Semantic networks describe structural knowledge. They provide a psychological
foundation for the epistemological assumptions made about structural knowledge and the
inference that researchers have drawn regarding structure. These inferences that have
been examined empirically provide a strong rationale for studying structural knowledge
(Jonassen, Beissner & Yacci, 1993).
Hemisphericity
More than 2,000 years ago, Hippocrates, observed that our brain had two sides, a
left and a right. Roger Spenys(1968) research and findings helped mold the left- or right-
brained approach. Although each hemisphere is dominant in certain activities, they are
both basically skilled in all areas, and the mental skills identified by Roger Sperry are
actually distributed throughout the cortex. Levy's (1983) research has confirmed that
both sides of the brain are involved in nearly every human activity (Jensen, 1996).
Michael rforainiga (1992) says that events occurring in one hemisphere can influence
developmental events occurring at the same time at veiy remote parts of the other
hemisphere (Eberle, 1982). Jerome Bruner spoke of left-handed ways of knowing, which
is now referred to as right hemisphere knowing. The crossover from hand to hemisphere
is understandable since the right hemisphere of the brain controls the left aide of the body
and vice versa (Bruner, 1965; Torrance, 1977).
Current brain research has found that (1) The two halves of the brain process
information differently; (2) Both hemispheres are equally important in terms of whole-
32
brain functioning; and (3) Individuals rely more on one information processing mode than
the other, especially when they approach new learning. (Bogen, 1975).
Individuals' unique methods of operation in the mental sphere have been referred
to as their cognitive style (Willing, 1989; Trautman, 1979). Cognitive style has been
differentiated by the following terms: "Global vs. Analytic"; "Holist versus Serialistz"
(Pask,1988); "Right versus Left-brained"; "Field-dependent versus Field-independent"
(Witkin, Moore, Goodenough, & Cox, 1977.)
The different functions of the two hemispheres have been confirmed by comparing
the electrical activity from the left and right sides of the brain. When the brain is in a fairly
relaxed state, it tends to show alpha rhythms—that is, waves of about eight to ten cycles
per second. Robert Omstein (1984) compared the relative levels of alpha from the left
and right sides of the brain for different mental activities. He found that when he gave his
subject a mathematical problem to solve, the alpha increased in the right hemisphere,
suggesting that the right side was relaxing, and decreased in the left, showing that
awareness was focused more in this side. Conversely, when the subject was asked to
match colored patterns, the alpha intensity increased in the left and decreased in the right,
suggesting that the subject was making greater use of the right hemisphere (Russell,
1979).
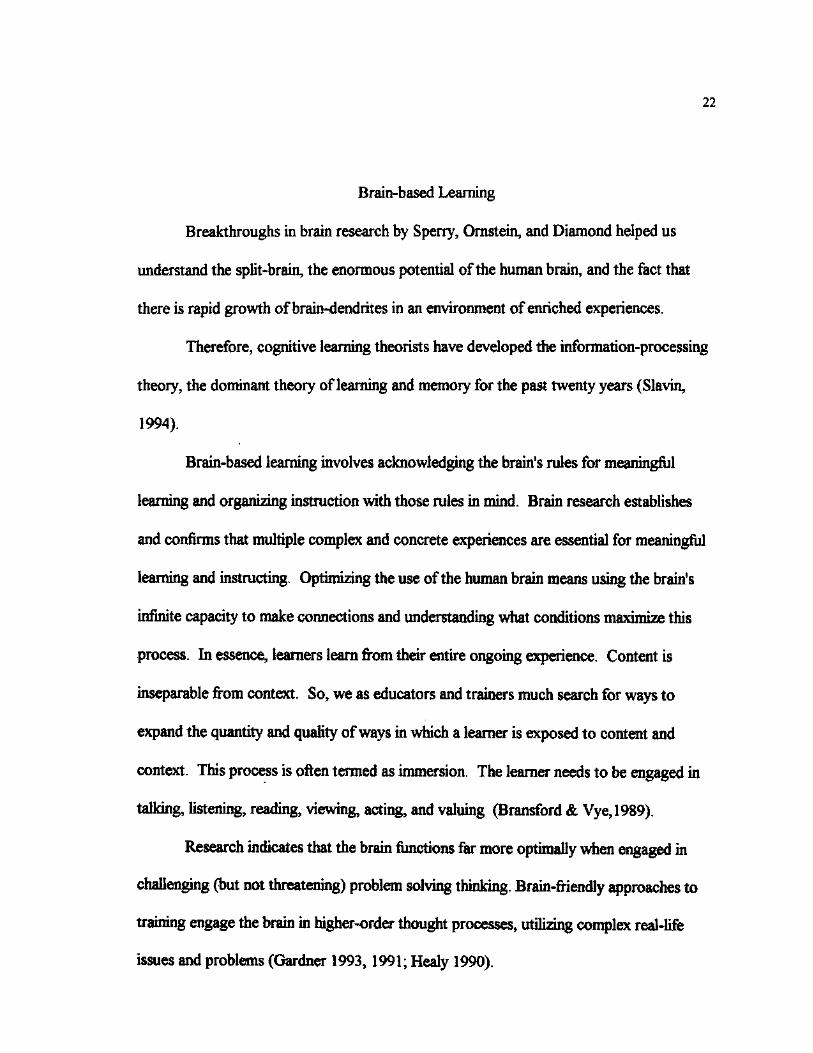
In many people the left hemisphere is concerned with language - speech output,
verbal activities, analytical apprehension, serial processing, and linear functions (Springer
& Deutsch, 1989). Experiments have shown the right hemisphere to be better in the
perception of depth, in the specialization of music and also in the recognition of faces and
33
other familiar patterns (Kimura, 1992; Bever & Chiarello; Ellis & Shepherd; Springer &
Deutsch, 1989).
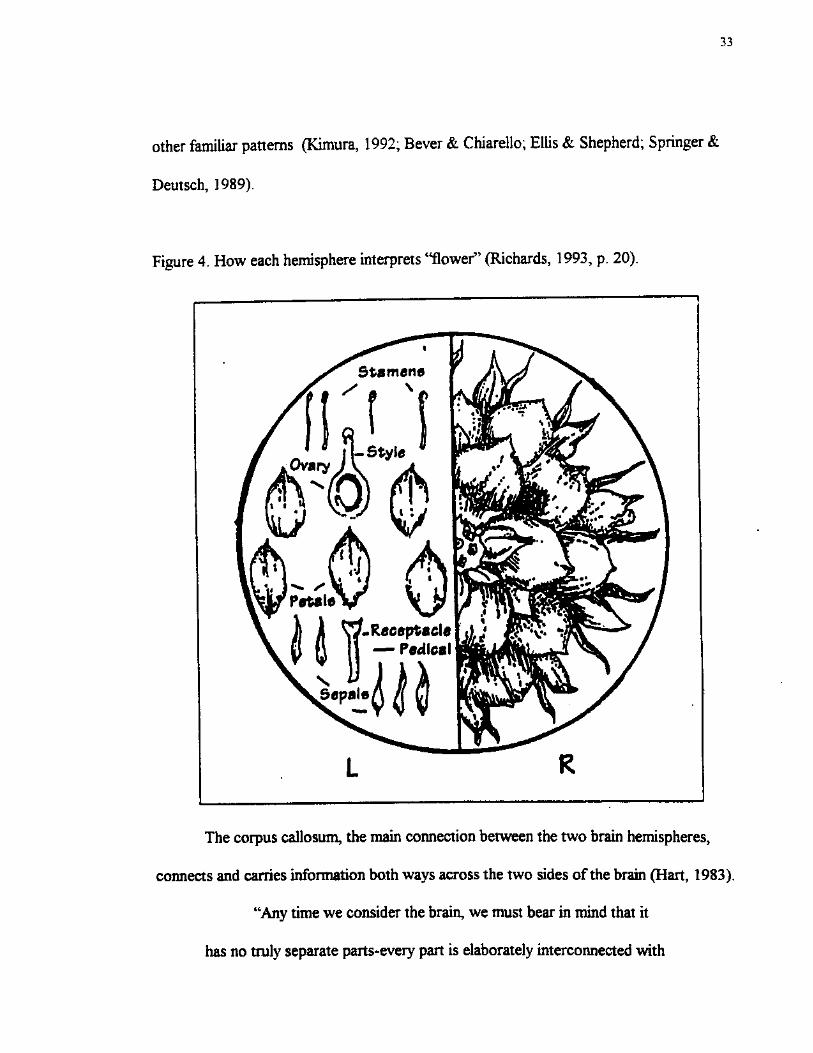
Figure 4. How each hemisphere interprets "flower" (Richards, 1993, p. 20).
Stamene
li o
Patale
Ml Raeaptada
Pad lea I m The corpus callosum, the main connection between the two bran hemispheres,
connects and carries information both ways across the two sides of the brain (Hart, 1983).
"Any time we consider the brain, we must bear in mind that it
has no truly separate parts-every part is elaborately interconnected with
34
all other parts, and the brain always operates as an intricate system, a
whole. Our training may miss training or developing half of the brain,
but it probably does so by missing out on the talents of both
hemispheres." (Springer & Deutsch, 1989, p. 192).
A review of recent studies of mental rotation, response competition, hemispheric
activation, regional cerebral blood flow, dreaming, and electrical brain stimulation
suggests a trend away from models of global hemispheric specialization, toward
componential or computational models that include both sides of the brain as an integrated
structure. The precise identification of the area or areas of the brain involved in any
postulated component of imagery processing is difficult at this stage, but it is definite that
there is involvement of the left hemisphere in imagery processes (Loverock, 1995).
Another difference between left and right hemispheric processing is that the left
hemisphere processes in a serial mode while the right processes in parallel. But this only
occurs for verbal material. When the items are shapes, both hemispheres appear to work
in a parallel mode, since its verbal abilities are no longer of any use in distinguishing
abstract shapes (Russell, 1979). It is only a preference, and when obliged to, either
hemisphere can function in either mode.
The value of specialization of function is that it effectively increases our mental
capacity. Each hemisphere tends to analyze its own input first, only swapping information
with the other side once a considerable degree of processing has already taken place.
Thus we can process two streams of information at once and then compare and integrate
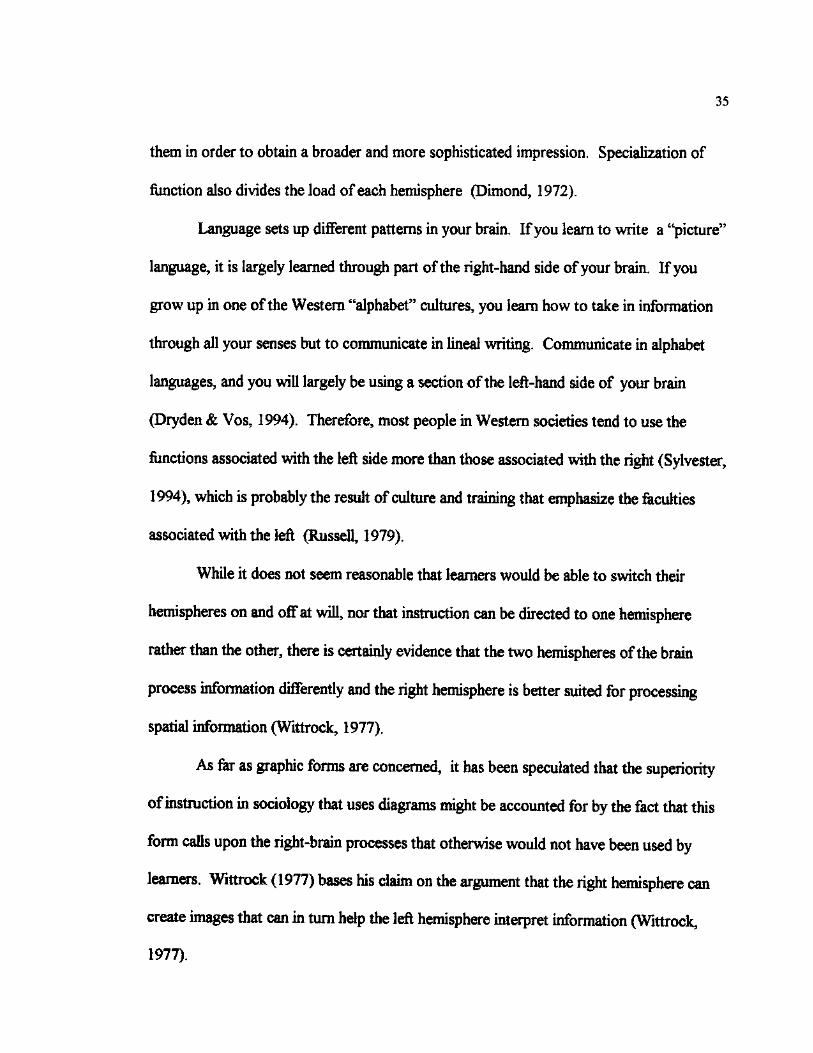
35
them in order to obtain a broader and more sophisticated impression. Specialization of
function also divides the load of each hemisphere (Dimond, 1972).
Language sets up different patterns in your bran. If you learn to write a "picture"
language, it is largely learned through part of the right-hand side of your brain. If you
grow up in one of the Western "alphabet" cultures, you learn how to take in information
through all your senses but to communicate in lineal writing. Communicate in alphabet
languages, and you will largely be using a section of the left-hand side of your brain
(Dryden & Vos, 1994). Therefore, most people in Western societies tend to use the
functions associated with the left side more than those associated with the right (Sylvester,
1994), which is probably the result of culture and training that emphasize the faculties
associated with the left (Russell, 1979).
While it does not seem reasonable that learners would be able to switch their
hemispheres on and off at will, nor that instruction can be directed to one hemisphere
rather than the other, there is certainly evidence that the two hemispheres of the brain
process information differently and the right hemisphere is better suited for processing
spatial information (Wittrock, 1977).
As far as graphic forms are concerned, it has been speculated that the superiority
of instruction in sociology that uses diagrams might be accounted for by the fact that this
form calls upon the right-brain processes that otherwise would not have been used by
learners. Wittrock (1977) bases his claim on the argument that the right hemisphere can
create images that can in turn help the left hemisphere interpret information (Wittrock,
1977).
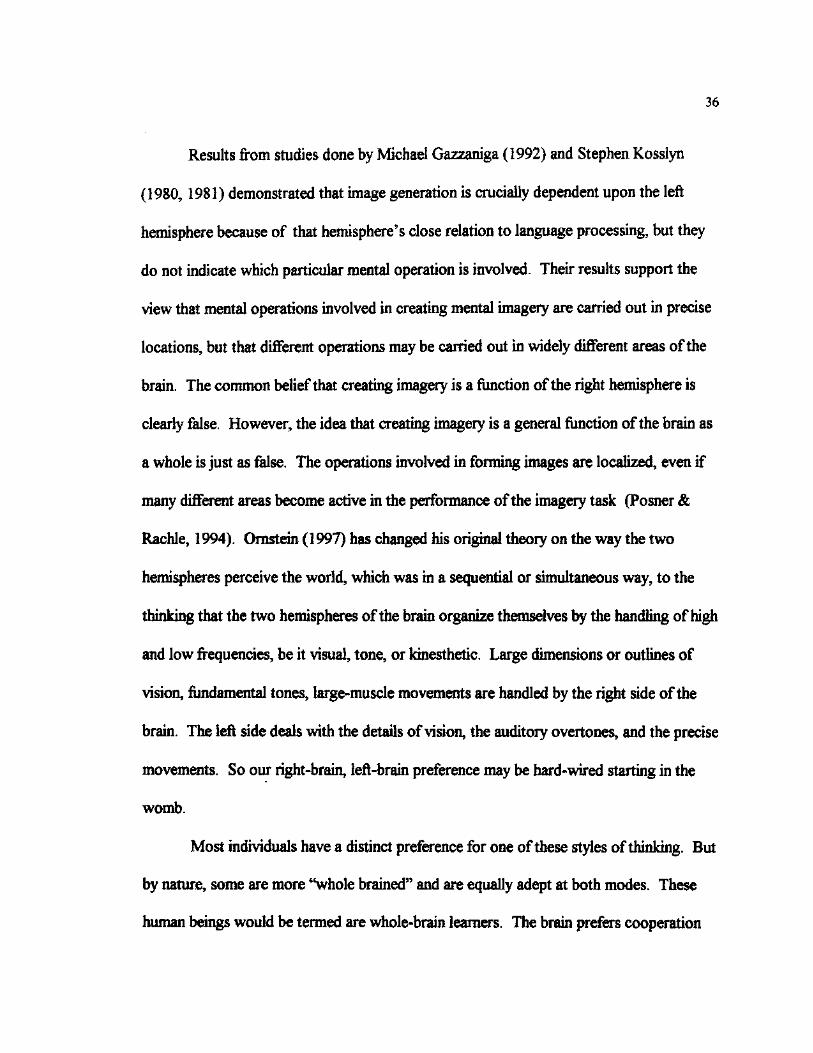
36
Results from studies done by Michael Gazzaniga (1992) and Stephen Kosslyn
(1980, 1981) demonstrated that image generation is crucially dependent upon the left
hemisphere because of that hemisphere's close relation to language processing, but they
do not indicate which particular mental operation is involved. Their results support the
view that mental operations involved in creating mental imagery are carried out in precise
locations, but that different operations may be carried out in widely different areas of the
brain. The common belief that creating imagery is a function of the right hemisphere is
clearly false. However, the idea that creating imagery is a general function of the brain as
a whole is just as false. The operations involved in forming images are localized, even if
many different areas become active in the performance of the imagery task (Posner &
Rachle, 1994). Orastein (1997) has changed his original theory on the way the two
hemispheres perceive the world, which was in a sequential or simultaneous way, to the
thinking that the two hemispheres of the brain organize themselves by the handling of high
and low frequencies, be it visual, tone, or kinesthetic. Large dimensions or outlines of
vision, fundamental tones, large-muscle movements are handled by the right side of the
brain. The left side deals with the details of vision, the auditory overtones, and the precise
movements. So our right-brain, left-brain preference may be hard-wired starting in the
womb.
Most individuals have a distinct preference for one of these styles of thinking. But
by nature, some are more "whole brained" and are equally adept at both modes. These
human beings would be termed are whole-brain learners. The brain prefers cooperation
37
rather than conflict, and it will work to develop an efficient system that incorporates the
two different processing styles (Richards, 1993).
Lay Ling Yeap's (1989) research measured the psychological domain of the
learner in terms of hemisphericity. He compared three levels of learner achievement: low,
moderate and high. His research showed significant differences between the low to middle
achievers, but between the moderate and high achievers there was a "distinctly different"
hemispheric dominance profile (Jensen, 1994; Ornstein, 1997).
Yet numerous studies have shown that when we use both sides of our brain
together, the whole brain responds significantly better (Lewis, 1997). In general, training
tends to favor left-brain modes of thinking, while down-playing right-brain modes. One
way to give everyone the opportunity to learn in a whole brain way is to balance the verbal
techniques with visual strategies (Williams, 1983).
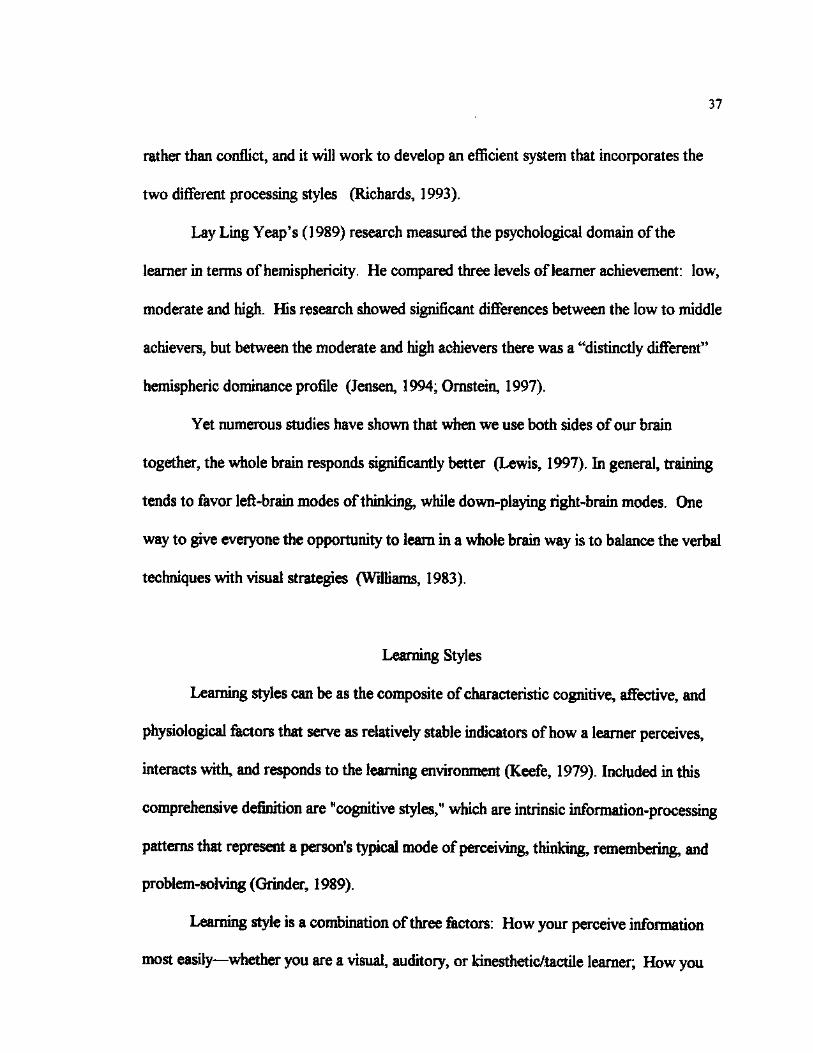
Learning Styles
Learning styles can be as the composite of characteristic cognitive, affective, and
physiological factors that serve as relatively stable indicators of how a learner perceives,
interacts with, and responds to the learning environment (Keefe, 1979). Included in this
comprehensive definition are "cognitive styles," which are intrinsic information-processing
patterns that represent a person's typical mode of perceiving, thinkings remembering, and
problem-solving (Grinder, 1989).
Learning style is a combination of three factors: How your perceive information
most easily—whether you are a visual, auditory, or kinesthetic/tactile learner; How you
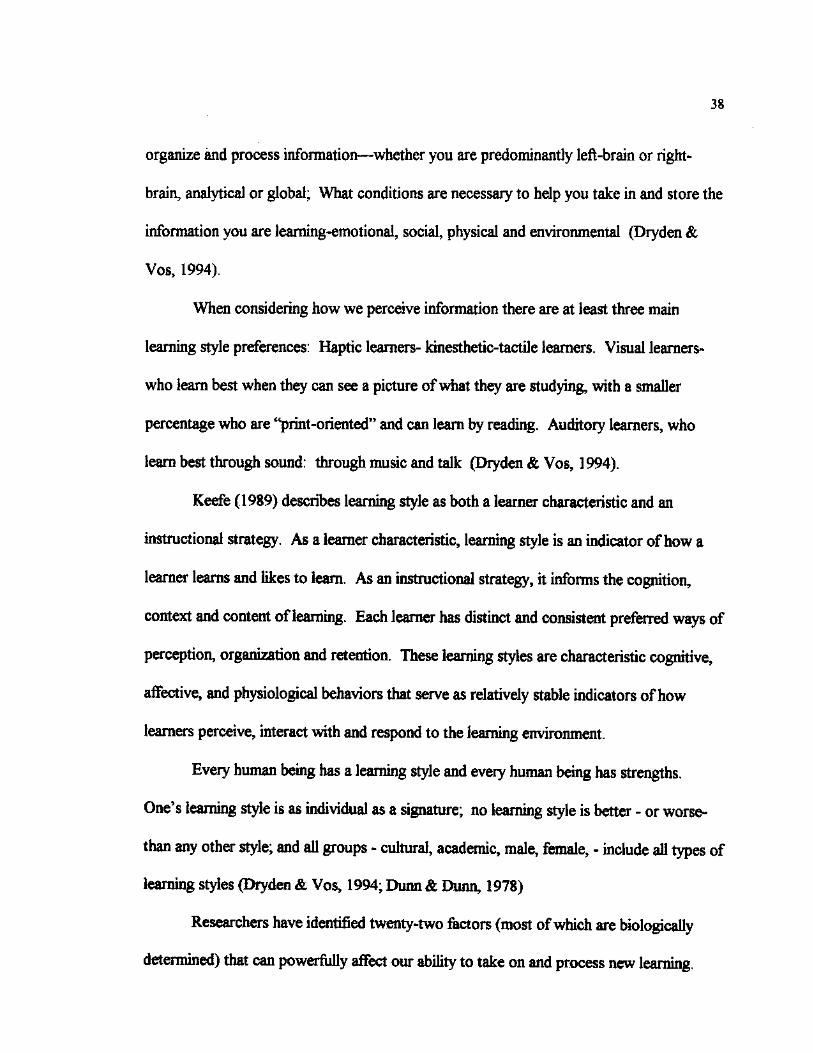
38
organize and process information—whether you are predominantly left-brain or right-
brain, analytical or global; What conditions are necessary to help you take in and store the
information you are learning-emotional, social, physical and environmental (Dryden &
Vos, 1994).
When considering how we perceive information there are at least three main
learning style preferences: Haptic learners- kinesthetic-tactile learners. Visual learners-
who learn best when they can see a picture of what they are studying, with a smaller
percentage who are "print-oriented" and can learn by reading. Auditory learners, who
learn best through sound: through music and talk (Dryden & Vos, 1994).
Keefe (1989) describes learning style as both a learner characteristic and an
instructional strategy. As a learner characteristic, learning style is an indicator of how a
learner learns and likes to learn. As an instructional strategy, it informs the cognition,
context and content of learning. Each learner has distinct and consistent preferred ways of
perception, organization and retention. These learning styles are characteristic cognitive^
affective, and physiological behaviors that serve as relatively stable indicators of how
learners perceive, interact with and respond to the learning environment.
Every human being has a learning style and every human being has strengths.
One's learning style is as individual as a signature; no learning style is better - or worse-
than any other style; and all groups - cultural, academic, male, female, - include all types of
learning styles (Dryden & Vos, 1994; Dunn & Dunn, 1978)
Researchers have identified twenty-two factors (most of which are biologically
determined) that can powerfully affect our ability to take on and process new learning
39
Research validates that when learners go about their learning in concert with their personal
learning style requirements, all can be successful learners, regardless of subject matter
(Reichmann & Grasha, 1974; Keefe, 1989). Knowles states that a central principle of
andragogy (the instructing of adults) should be the consideration of the learners' life
experience as well as their learning styles (Knowles, 1984).
Diagnosing and interpreting learning styles provide data as to how individuals
perceive, interact with, and respond to the learning environment. A knowledge of our own
learning style makes us aware of needs of learners, which implies knowledge of our own
preferences and a conscious effort to expand our repertoire of instructional strategies and
techniques to respond to learner diversity.
Marty instruments assess learning style (Dunn, Dunn, & Price, 1982,1985; Perrin,
1981; Hermann, 1996; Kolb,1985; Gregorc, 1979). Many of these instruments base their
development on a similar conception of thinking and experience.
The learning style instruments selected for this study are part of the assessment
tools for Bernice McCarthy's 4MAT system. The 4MAT system is an eight-step cycle of
instruction that capitalizes on individual learning styles and brain dominance processing
preferences. 'The theories ofDavid Kolb (1981, 1984,1985), Carl Jung (1923), Jean
Piaget (1969), Joseph Bogen (1975), Gabriele Rico (1983), Betty Edwards (1979), and
John Bradshaw and Norman Nettleton (1983) have contributed to 4MAT's conception."
(McCarthy, 1990, p. 31).
According to Bernice McCarthy's 4MAT system, we all learn in a whole brain
style with dominance for left or right brain in each quadrant. This cycle of learning is based
40
on a number of premises. First, is David Kolb's (1976, 1984,1985) premise that describes
the two major differences in how people learn: How they perceive and how they process.
Different individuals perceive and process experience in different preferred ways and these
preferences comprise our unique learning styles. Essential to quality learning is an
awareness in the learner of his/her own preferred mode, becoming comfortable with
his/her own best ways of learning and being helped to develop a learning repertoire,
through experience with alternative modes. McCarthy's system incorporates left
brain/right brain research into an instructional system that identifies four different learning
styles:
• Type 1: Innovative Learners are primarily interested in personal meaning. They need to
have reasons for learning—ideally, reasons that connect new information with personal
experience and establish that information's usefulness in daily life.
• Type 2: Analytic Learners are primarily interested in acquiring facts in order to deepen
their understanding of concepts and processes.
• Type 3: Common Sense Learners are primarily interested in how things work; they want
to "get in and try it."
• Type 4: Dynamic Learners are primarily interested in self-directed discovery. They rely
heavily on their own intuition, and seek to instruct both themselves and others
(McCarthy, 1980).
Inherent in the 4MAT System are two major premises: (1) people have major
learning styles and hemispheric (right mode/left-mode) processing preferences; and (2)
41
designing and using multiple instructional strategies in a systematic framework to instruct
to these preferences can improve instructing and learning.
Experiments show that learners learn best when their learning style is matched by
the instructor's instructing style (Caflferty, 1980), but the typical class contains a wide
array of different learner learning styles.
In experiments by Torrance and Ball (1978), learner learning styles were assessed,
and then the learners were put through a course to expose them to alternative learning
strategies. Through exposure to right-hemisphere, non-linear learning strategies (imagery,
intuition, brainstorming, metaphors, etc.), the learners were able to make more use of their
existing capabilities and extend into new areas. The results also showed that the learners
were able "to change their preferred styles of learning and thinking through brief but
intensive training" (Torrance & Ball, 1978).
Studies suggest that the effectiveness of learners' strategies depends on the context
of learning and on the learner's own characteristics (e.g. academic environments, learning
style) (Pask, 1988).
Metacognition
For learning to occur, it is necessary to instruct learners on how to learn. Because
learning is a knowledge domain just as physics and medicine, instruction should be given
to enable learners to incorporate this type of knowledge and/or skill into their schemas
(Gagne', 1985). Studies show that people have had developmental increases in the
42
amount they know about their own cognitive processes (Brown and DeLoache, 1978;
Flavell, 1979). Therefore, metacognitive instruction would be beneficial.
The term metacognition is used to describe the mind's management system
(Gagne, 1985; Flavell, 1985). Basically, metacognition means that, when confronted with
a dilemma or some obstacle, humans draw on their mental resources to plan a course of
action, monitor that strategy while executing it, then reflect on the strategy to evaluate its
productiveness in terms of the outcomes it was intended to achieve (Hyerle, 1996).
Brown (1978), Flavell (Flavell & Wellman, 1977), and Markman (1979) were
pioneers in this area and described metacognition as the explicit consciousness of
ourselves as problem solvers. This ability is a higher level process and involves the
possession of lower cognitive levels such as basic processes of working memory,
crystallized knowledge in the form of mental schemas and strategies, and weak and strong
methods of problem solving.
Metacognition includes two linked capabilities: the ability to focus awareness and
the ability to control or direct mental processing to achieve goals. Metacognitive
awareness monitors activity in all the layered systems of the mind, but allows attention to
be focused on one thing at a time. Timing, sequencing, recognizing checkpoints in a
process, aiming for effects, evaluating errors, choosing and adapting strategies, and
checking output against goals-such is the work of metacognition. Metacognitive control
directs the work of the mind toward purposes, rather just letting things happen (Clarke,
1990).
43
Studies have indicated that poor learners are unable to monitor the use of
metacognitive skills as good learners do. Monitoring involves the continuous process of
determining strategy effectiveness via knowledge products. This in turn leads to strategy
alteration towards maximized usage and output. At the same time, monitoring within a
domain-specific domain is dependent on general metacognitive skills and domain-specific
knowledge (Schraw, Dunkle, Bendixen, Roedel & DeBacker, 1995). Also, knowledge
about cognition does not necessarily lead to its regulation and usage (Schraw, 1994).
Despite the fact that individuals are aware of metacognitive knowledge many do not use
this to monitor performance (e.g. reading comprehension). Brown, Bransford, Ferrara
and Campione (1983) found that less skilled learners were less likely to use self-
assessment techniques such as self-tests and self-questioning as a means of gauging the
appropriateness and correction of knowledge concepts and strategy usage. Thus,
monitoring of higher level processes within the learning paradigm (e.g. comprehension,
memory) is in itself a metacognitive skill (Markman, 1985).
In essence, "the ability to apply this skill differentiated strong and weak learners of
all ages" and that it is not a tendency made explicit through development (Bruer, 1993, p.
72). Pressley (1990) has suggested that poor monitoring is evident in even skilled adult
(e.g. readers) and results in knowledge acquisition and achievement failures. Thus there
appears a need for such metacognitive strategies such as self-monitoring to be taught.
Instructing metacognitive strategies have been considered challenging and often requires
externalizing thoughts as a means to cognition awareness (Perkins, Simmons &
Tishman,1990).
44
Research has shown that when learners are taught learn-to-leam skills, their ability
to process new information can rise substantially (Weinstein & Underwood, 1985; Segal,
Chipman & Glaser, 1985). Other studies on metacognition have shown the importance of
metacognition skills (Belmont, Butterfield, & Borkowski, 1978; Pressly & Levin, 1983;
Paris, Newman & McVey, 1982),
Learning Strategies
Memory devices have been around since 500 or 600 BC. The Greeks and Romans
used well-developed imagery, mnemonics and the memory house, derived from Aristotle's
model of memory, very effectively. The pedagogical uses of most of these types of
strategies has declined.
Many learners lack and are unaware of the techniques available to them through
the use of learning strategies and basic study skills. In most situations, instruction of study
skills in any systematic way is nonexistent, and most instructors appear to expect learners
to develop study skills by osmosis or maturation.
Studying the thought processes involved in stimulating learning, memoiy, and
comprehension based on the new cognitive research, has caused a recent resurgence in the
interest of instructing, learning and using strategies. According to Pressley (1995) the
concept of cognitive strategies, and the research being conducted that shows that learning
can be facilitated by the use of many strategies, represent the most important instructional
advance of the past 15 years. Learning strategies have been defined as "mental operations
45
or procedures that a learner may use to acquire, retain, and retrieve different kinds of
knowledge and performance" (Rigney Lutz, 1976, p. 165; Danserau, 1985, p. 13).
The term learning strategies is used in a very broad sense to identify a number of
different competencies that researchers and practitioners have postulated as necessary, or
helpful, for effective learning and retention of information for later use. These
competencies include cognitive information-processing strategies, such as techniques for
organizing and elaborating on incoming information to make it more meaningful; active
study strategies, such as systems for note-taking and test preparation; and support
strategies, such as techniques for organizing study time, coping with performance anxiety,
and directing attention to the learning task at hand. In addition, there is a range of
metacognitive strategies that learners can use to detect discrepancies between what they
know and what they do not know and to monitor and direct their acquisition of the new
information (Weinstein, 1985, 1988).
There are different classes of learning strategies designed to facilitate different
types of learning (Jonassen, 1984) and meta-learning. Learning or memory strategies
include paired-associate learning, serial learning, and free-recall learning. Specific
strategies under these areas are imagery, stimulus selection and coding, keyword
mnemonics, the loci method (Anderson, 1989), the pegword method (Paivio, 1971), and
initial letter strategies. These techniques engage learners in higher-order thinking such as
exemplifying, categorizing, integrating, elaborating, and analyzing. Mapping techniques
such as pattern notes and concept maps require learners to graphically analyze subject
matter in order to illustrate its structures (Jonassen, et al., 1993).
46
The benefit of formal training in strategy instruction has been shown to have
significant positive impacts on the learner (Segal, et al., 1985; Weinstein & Underwood,
1985; Pressley, et al., 1995; Kulik, Kulik & Schwalb, 1983). This emphasis was also
evident in a study by Chi and her colleagues (1988), who explored the learning strategies
used by academically successful and less-successful college learners as they encountered
examples in their physics texts. Chi and her colleagues found that successful learners
engaged in a process of self-explanation; they tried to figure out why each particular
aspect of the solution was applicable and asked themselves about other cases in which the
general solution might also be applicable. As a result, they acquired an understanding that
was more general than a memorization of the specific steps necessary for the particular
problem in the text. Academically less-successful learners showed much less of a tendency
to attempt to explain to themselves why and when particular solutions worked.
Visual Strategies
Vision is of vital importance to learning. When we think, we see or visualize.
Vision and thinking are one process; they cannot be separated, either logically or
physiologically.
The earliest records of human drawings was during the Ice Age. Between 60,000
to 10,000 BC, cave dwellers in France, Spain, Africa, and Scandinavia painted drawings of
animals and scenes from their own experience. Such pictorial imagery eventually led to the
development of writing and mathematics. Language evolved from images to pictographs
to symbolic codes becoming increasingly abstract.
47
The most powerful influences on your learners' behaviors are concrete, vivid
images. Current research shows that things that we can see or picture in our minds are
generally easier to learn and remember than things we cannot see or picture. Information
processing research suggests that this is because our working memories can hold only
seven or so chunks of information before some information is forgotten. Images, which
form a continuous representation of information, therefore take up less space than things
we cannot imagine. Consequently, many items can be "chunked" together as one image,
leaving much more space in working memory for additional information or thought
(Gagne, Yekovich & Yekovich, 1993). In a study on memoiy, Ralph Haber showed that
humans have an almost photographic visual memoiy. Subjects were shown 2560 photos,
then subjects were show 2560 pairs of photos and asked in each case which photo was in
the original group of2560. The success rate averaged between 85% and 95%. (Haber,
1989).
Fossil records indicate that long before the human mechanisms for speech had
evolved, the organs of vision were highly developed, serving as important tools of
knowledge for early human beings.
Neural tissue developed in order to make use of incoming visual information, but
the eye is not the recorder of information (Sless, 1981). The eye is not biologically
separate from the bran. It is actually part of the same organ; or more accurately, the brain
is part of the eye. In the development of the embryo, the eyes are first to appear, the brain
being a subsequent outgrowth. In structural terms, the eyes have not grown out of the
brain, the brain has receded from the eyes (Sless, 1981). Seventy percent of our body's
48
sensory receptors are located in our eyes. To absorb light rays the retina has 120 million
rods and 7 million cones, with each rod or cone focusing on a small, specific segment of
the visual field.
Neuroscientists say that vision is important and effective because 1) the brain has
an attentional bias for high contrast and novelty; 2) 90% of the brain's sensory input is
from visual sources; and 3) the brain has an immediate and primitive response to symbols,
icons and strong, simple images (Jensen, 1995).
The eye, unlike a camera, is not a mechanism for capturing images so much as it is
a complex processing unit to detect change, form, and features, and which selectively
prepares data that the brain must then interpret (Barry, 1997).
The crossover in the visual system is slightly more complex than in the rest of the
body. The eyes themselves are not directly crossed, but the left side of the retina of each
eye connects to the left side of the brain, and the right side of the retina of each eye
connects to the right side of the brain. Thus, since the retinal image is inverted, the left
side of the visual field connects to the right side of the brain and the right side of the visual
field connects to the left side (Russell, 1979).
In recent decades scientists have made extraordinary progress in understanding the
processes that transform words into images. The study of imagery forms a part of a more
general inquiry into the relationship of mind and brain that is now producing real insight
into workings of this least understood of human organs. A number of researchers have
used imagery theory as the basis for constructing and testing hypotheses concerning
learning from graphic forms. Rigney and Lutz (1976) used computer graphics in a lesson
49
on the battery and found that these helped learners learn the material. They accounted for
their findings in terms of the images that they suspected the graphics encouraged the
learners to form. In a subsequent study, Alesandrini (1981) reported that learners who
had to draw a diagram of the battery and who related specific details to more inclusive
concepts performed better than learners who did not. In this study, imagery appeared to
be related to visual, holistic thinking. These studies exemplify a body of research that
leads to the following conclusion: Graphic forms encourage learners to create mental
images that, in turn, make it easier for them to learn certain types of material.
One of the main theorists in visualization, Paivio (1971, 1986) proposes the dual-
code model, a verbal system specialized for processing and storing linguistic information
and a separate nonverbal system for spatial information and mental imagery. The two
systems can function independently, but they are also interconnected so that, for example,
a person looking at a picture might engage in covert verbalization. When a concept is
registered in both memory systems, it is said to be dual-coded. Paivio argues that dual-
coding is more likely to occur with pictures than with words, and since two memory traces
are better than one, dual-coding explains the pictorial superiority effect. Once concrete
images are established within the learner's memory, they will act as hooks on which other
ideas are connected. This is what Gambrell and Bales (1986) refer to as associative
learning and it forms the basis for a learning theory known as concept mapping
In addition to Paivio, a number of researchers have proposed that certain types of
information are stored in memory as image-like structures (Anderson 1978; Kosslyn,
1980, 1981; Shepard, 1978; Shepard & Cooper, 1982) which retain some, though not all,
50
of the properties of the pictures, the graphic forms, or the direct visual experiences that
give rise to them. It should be added that there has been considerable debate as to
whether this is in fact the case, or whether all information in memory is stored as
propositions in language-like structures as Pylyshyn (1973,1981) has suggested.
Research has shown that many learners are visually oriented and that such
individuals benefit more from visually oriented learning strategies (Dwyer, 1972; Lesgold,
Mccormick, and Goinkoff, 1975; Carnine and Kinder, 1985). Mapping seems to be an
advantage to learners who are visually oriented -they become better learners; and visual
images of maps are likely to stick in the memory longer and more accurately than words
alone (Smith, 1991).
Visual/spatial intelligence is one of Howard Gardner's (1993) theory of multiple
intelligences made up of eight intelligences: musical, spatial (visual), interpersonal
intrapersonal, naturalist, logical, linguistic, and bodily kinesthetic intelligence.
Visual/spatial intelligence requires the incorporation of visual/spatial learning strategies
and tools for the best learning to occur. Visual-spatial intelligence includes an aggragpt?
of related skills including visual discrimination, recognition, projection, mental imagery,
spatial reasoning, image manipulation, and the duplication of inner or external imagery,
any or all of which may be expressed by a single person.
Although visualization is central to spatial intelligence, it is not directly related to
sight, and in feet, can be highly developed in those who are blind (Lewis, 1997). This
intelligence is referred to as both visual and spatial since people perceive and process
information through both modalities.
51
Spatial learning strategies are aimed at coding and transforming text information
into spatial representations that preserve and make explicit the structural information that
can be abstracted from a text. Today, most training stresses the importance of abstract
symbols in reading, writing, and arithmetic, often overlooking other aspects of visual-
spatial intelligence.
Mapping Strategies
The theory behind the use of mapping strategies involves all of the latest
neuroscience, learning theory, learning style assessments, hemisphericity assessments and
visual implications.
Research conducted over a number of years in cognitive science and human factor
engineering shows that we need to provide learners with skills or techniques for acquiring
knowledge. An extensive study of instruction found that presenters still used strategies
that consisted mainly of their own talk and monitored seatwork (Goodlad, 1983; Gardner,
1991). Zemke (1998) states that self-directed learning strategies may be the only way to
meet the knowledge requirements of this vastly changing and competitive marketplace and
because of this, the development of mapping strategies, like Mind Mapping will be
essential to workers long-term ability to keep learning.
There are many terms for mapping strategies-visual representations of ideas.
Terms such as webbing (Bromley, 1996), Mind Mapping (Buzan, 1994), pattern noting
(Buzan, 1974), clustering (Rico, 1983), semantic maps, cognitive maps, graphic
organizers, mindscaping (Marguiles, 1991), knowledge maps or K-mapping (McCagg &
52
Dansereau, 1991), organizational matrix (Ausubel, 1960), concept maps (Novak &
Gowin, 1984), comprehension strategies (Hill, 1994), learning maps (Rose & Nicholl,
1997), and thinking maps (Hyerle, 1996) are seen throughout the literature and are often
used interchangeably.
In this portion of the review of literature, I will use the term mapping strategies or
maps as a generic term for any of these learning strategies..
The most succinct definition of the array of these mapping strategies is " . . . words
on paper, arranged to represent an individual's understanding of the relationship between
words. Whereas conventions of sentence structure make most writing linear in form,
graphic organizers take their form from the presumed structure of relationships among
ideas" (Clarke, 1990, p. 30). Bromley s ta tes , . . no matter what the special name, a
graphic organizer is a visual representation of knowledge" (Bromley, 1996, p. 6). Hyerle
describes his "thinking" visual tools as forms of metacognition-graphically displayed
thinking processes (Hyerle, 1996).
Each mapping strategy —visual outlines, spatial organizers, concept maps,
mindmaps, clusters, or mindscapes—is clearly useful for different purposes and
preferences. Not only are they useful for organizing information, but also for generating
ideas. They are used to create patterns, build connections, and establish associations
between the learner's own experience and new information, between known facts and new
concepts, between parts of a concept or problem and its whole. Some of the processes
are more linear in nature and lend themselves to analytical tasks; whereas others are more
global, and are useful for creative purposes. None of these mapping strategies are difficult
53
to instruct or to learn, and they all offer both instructors and learners an array of tools for
the variety of tasks involved in the learning process (Campbell, Campbell, & Dickinson,
1996).
The process involved in creating maps is for the learner to begin with a center or
nucleus. The general idea of the lecture, book, movie, the topic for creative writing, or the
central issue in a problem-solving exercise, is placed in the center of the page. Main ideas
are connected to the central topic by drawing lines from the center. Supporting ideas
become branches off main ideas. Working outward from the center in all directions, the
learner produces a growing, organized structure composed of key words, phrases, and
images.
Mapping strategies are based on these premises:
1. Meaningful learning involves the assimilation of new concepts and propositions
into existing cognitive structures. In order for learning to occur it must be meaningful.
Brain based learning has as one of its objectives to develop a sense of deeper meaning- as
opposed to surface meaning. Deeper meaning can only occur when an emotional
investment is made by the learner. Deep meaning also requires multiple associations on
multiple levels throughout the material (Jensen, 1996). The theory of knowledge
(epistemology) underlying mapping strategies holds that the new meaning humans
construct about events or objects is based upon their prior knowledge (All & Havens,
1997). Maps have been reported to be a potent instructional tool for promoting what
Ausubel has described as meaningful learning. Meaningful learning refers to anchoring
new ideas or concepts with previously acquired knowledge in a nonarbitrary way (Novak,
54
1993). It is now recognized that the maps are more meaningful if the links between the
concepts are labeled with a reason for that link (Novak, 1990; Stewart, 1979). In a study
of the effect of meaningfiilness on learning, groups were tested on recall of facts after
reading a selection. Subjects that used mindful strategies making the material relevant to
themselves versus subjects that learned the material in the traditional manner, performed
significantly better, recalling more of the information. (Lieberman & Langer, 1995; p. 78,
Langer, 1997).
2. Knowledge is organized hierarchically in cognitive structure, and most new
learning involves subsumption of concepts and propositions into existing hierarchies.
Because learning occurs in an organized way (Ausubel, 1968; Novak & Go win, 1984),
structural knowledge is essential to recall and comprehension. We naturally and
necessarily organize our mental representations of phenomena in order to be able to access
them. The more semantically meaningful the relationships between the ideas are, the
better they are recalled. When important information is isolated, we can see how concepts
are connected, and this makes it more easily understood (Novak & Gowin, 1984).
3. Knowledge acquired by rote learning will not be assimilated. Memorization of
facts and specific skills are the lowest level of learning (Caine & Caine, 1996).
Most of the research on maps is in the area of advance organizer and concept
maps. Advance organizers, developed by David Ausubel (I960,1963), helps to orient
learners to material they are about to learn and to help than recall related information that
could be used to assist in incorporating new information. There is some evidence that use
of advance organizers increases learner learning, although the magnitude of the effect is
55
controversial (Corkill, 1992; Glover et al., 1990). Some researchers present the learners
with the concepts to be used in the map while others require the learners to generate their
own concepts (e.g., Edwards & Fraseer, 1983; Okebukola, 1990). Advance organizers
seem to be most useful for instructing content that has a well-organized structure that may
not be immediately apparent to learners. Advance organizers help learners activate prior
knowledge, and provide an anchor for later learning (Austin & Shore, 1994).
Concept maps, developed by Joseph Novak in 1972, are flexible diagrams showing
relationships between concepts (Novak, 1990). The use of this instructional strategy
encourages the identification of key concepts and their relationships, thus facilitating the
encoding of information into long-term memory and successful recall of concepts at a later
date (Van Patten, Chao, & Reigeluth, 1986; Ault, 1985).
Research on the effects of concept mapping as a study technique is mixed. Studies
using concept mapping as a tool for learning have been primarily related to science
training. In these studies, researchers investigated the effectiveness of concept mapping
on the learners' organization of content, achievement, and attitudes toward concept
mapping as a learning strategy. Many authors have reported successful training
applications of concept mapping (Ault, 1985; Arnaudin et al, 1984; Novak, Gowin, &
Johansen, 1983; Novak, 1991; Mikulecky, Clark & Adams, 1988; Heinze-Fry and Novak,
1990; Jegede, Alaiyemola, and Okebukola, 1990; Okebukola, 1990; Willerman &
MacHarg 1991; Smith & Dwyer, 1995; Pinto & Zeitz, 1997; Armbruster, Anderson and
Meyer, 1991; Clarice, 1991; Horton, McConney, Gallo, Woods, Senn, 1993).
56
Research into the effectiveness of the use of mapping strategies has shown that
creating maps to illustrate the organization of ideas and information aids comprehension,
learning, and recall (Armbruster, Anderson, & Meyer, 1991; Anderson & Arbruster,
1980,1984; Flood & Lapp, 1988; Heimlich & Pittelman, 1986;Dunston, 1992; Moore &
Readance, 1984; Chi, Feltovich, & GHaser, 1988; Gaines, 1996; Okebuklo, 1990).
Studies show that the effects of mapping strategies are greatest when learners have
in-depth instruction in their use and are actively engaged in the construction of the
graphics themselves. However, the technique is not equally effective among all learners.
Low-achieving and midrange learners appear to benefit most from mapping content,
whereas high-achieving learners may see it as a diversion from techniques that already
work for them (Holly & Dansereau, 1984).
A disadvantage of the use of concept mapping is that it can be time consuming,
first in learning the technique and then in putting it to use. With limited prior knowledge,
learners may find concept mapping of little value (McKeachie, 1984). When mapping is
taught as a study technique, refinement of the process to ensure accuracy and
inclusiveness can take several weeks (Dansereau & Holley, 1984; Arnaudin et al., 1984).
A study by Jay (1994) indicated that the use of concept mapping in a college-level
cell biology course was positive attitudinally, but no significant difference in achievement
was ascertained. Learners indicated that an instructor-generated "concept list" was
necessary for success with concept mapping. Using "free form" mapping may fail to
clarify the nature of relationships included, leaving vagueness in both concepts and their
relationships (Van Patten, Chao, & Reigeluth, 1986).
57
Mind Mapping
Tony Buzan (1984) originated the Mind Mapping technique as a spatial, non-linear
approach to note-taking since it taps the mind's natural ability to work in an integrated,
interlinked, complex manner. The theories and concepts behind learning strategies and
other types of mapping hold true for Mind Mapping except that mindmaps feature treelike
branches of information that display key concepts as well as relationships. Differing from
more linear concept maps and other mapping strategies, however, mindmaps are more
global in their approach.
Mind Mapping is a brain-based learning strategy in that it meets all the
requirements of the brain for long-term learning. Maps are a dynamic way to capture
significant points of information. They use a global format, allowing information to be
displayed in the same way that our brain functions-in many directions simultaneously.
Ornstein (1984) has shown that the process of thinking is a complex combination of
words, pictures, scenarios, colors, and even sound and music. Thus the process of
presenting and capturing lesson content in maps closely approximates the natural
operation of thinking. ( Rose, 1997).
The human brain is not designed for linear, one-path thought (Hart, 1983). The
human brain does not store information in neat lines or columns. The brain stores
information on its tree-like dendrites. Mind Mapping has its origins in the results of
research into the human brain. Like brain cells which have a central body with a lot of
branches which radiate from the center or nucleus of the cell, the mindmap starts with a
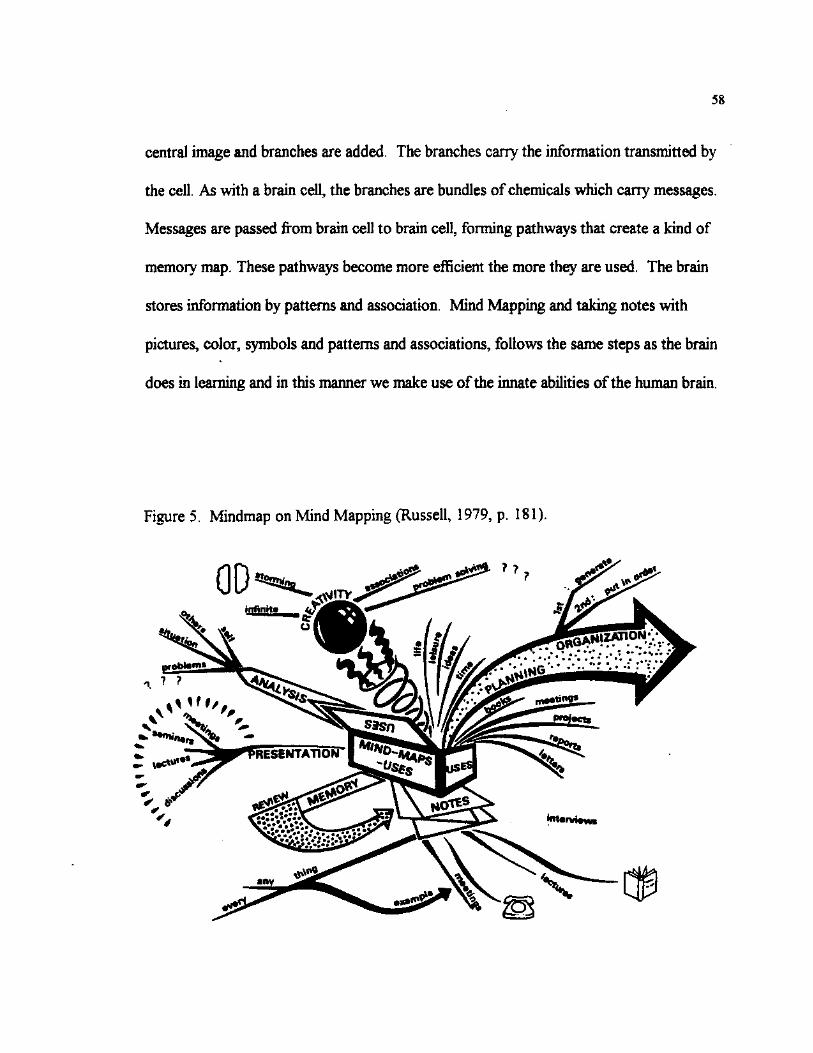
58
central image and branches are added. The branches carry the information transmitted by
the cell. As with a brain cell, the branches are bundles of chemicals which carry messages.
Messages are passed from brain cell to brain cell, forming pathways that create a kind of
memory map. These pathways become more efficient the more they are used. The brain
stores information by patterns and association. Mind Mapping and taking notes with
pictures, color, symbols and patterns and associations, follows the same steps as the brain
does in learning and in this manner we make use of the innate abilities of the human brain.
Figure 5. Mindmap on Mind Mapping (Russell, 1979, p. 181).
gniiZMlON
O V ' ' ' ^ -
RESENTATiON
X
59
To create a mindmap for note-taking, start with a central concept, add sub-topics
on the connecting lines. Colors, images, and key words should be placed in the middle of a
page. Codes can be used as mnemonic devices. Color-coding can be used in the
appropriate topic areas. The words in a mindmap should be printed. Mindmaps have
pictorial elements added. These words and visual patterns provide you with highly
charged cues to "jog" your memory.
Mindmaps are useful for several purposes, however, for the purpose of this study I
will limit the research to the effectiveness of Mind Mapping as a note-taking device.
Although the human race has made visual notes throughout history, i.e.—the cave
paintings of primitive man, the hieroglyphics of ancient Egypt, and early Chinese
ideograms (Gregory, 1970), in recent history learners have taken linear notes, by writing
down words line by line. Most people find that note-taking insures better recall of
information. Positive effects of note taking as a study strategy are most likely when used
with complex, conceptual material in which the critical task is to identify the main ideas
(Anderson and Armbruster, 1984). Simply writing down information as notes is not as
effective as note-taking that requires some mental processing before writing (Kiewra et al.,
1991; Kiewra, 1991). In a study on note-taking systems, Michael Howe (1977) found that
"Key word notes personally made" (vs. Fill-in blanks and another's notes) scored highest
in understanding and recall compared to other non-patterned note-taking systems (Jensen,
1994,1996). Howe found that when the ratio of key words to non-key words is higher,
the better the recall. Because key words have greater meaningful content they tend to
lock up" more information in memory and are "keys" to recalling ideas (Russell, 1979).
60
In another study, Buzan studied the three common techniques for taking notes
during a lecture: writing a complete transcript, writing a summary, and writing key words.
The results of his study showed that the learner who writes his own key words showed the
greatest amount of learning and retention. (Buzan, 1993).
Mind Mapping offers many advantages over conventional formats of notetaking.
Mind Mapping capitalizes on several factors that enhance recall. Essential key words are
noted, associations, relationships, and patterns are highlighted, hemispheric interplay
exists, conscious involvement is required, subjective visual organization is imposed, and
input is through dual-coding.. These techniques employ free-association of ideas, creating
a "structure" quite unlike the traditional outline method, but equally effective.
Key Words. Key words are one of the most helpful and critical parts of a
mindmap. Some estimates claim that only five to ten per cent of language consists of key
words. Learners who rely on conventional, long-hand, or outline-formatted notes may be
at a disadvantage. Time and energy are wasted in such note-taking, information is lost,
reviews are too lengthy and the key words are disconnected visually from important
relationships.
Patterning. The complexity and elegance of the way the brain learns is quite
amazing. The brain is a self-organizer (Caine & Caine, 1996) and has an enormous
capability of categorizing in connected ways (Carnine, 1990). One of the most unique and
useful traits of our brain is its innate ability to make patterns. To bring meaning to life
experiences, the brain, acting as a pattern sensor, looks for patterns in daily experience
that agree with its own internal patterns. New learning is facilitated when the brain can
61
relate newly introduced material to something it already knows (Caine & Caine 1991;
Edelman, 1992). Having made patterns, the brain uses them as guidelines to drive
behavior. These patterns then tend to be acted out in daily experience, generally without
our recognizing the connection between them and our actual behavior and experience
(Caine & Caine, 1991). As a patterning device, the brain almost certainly has no equal. It
is capable of sorting and storing virtually every major piece of data it takes in.
Associations. The brain is very efficient. It stores information by making great
use of associations (Dryden & Vos, 1994). Every person's brain has an association
cortex. It can link up like with like, from different memory banks (Jensen, 1995, p. 141).
By working directly and consciously with the brain's pattern making function, we can
access expanded brain function and take advantage of two important aspects of memory
which are association and emphasis. When we learn something new, the new information
is stored by associating it with something we have already stored, making it easier to
remember something new. We also easily remember new things that are emphasized as
being unique or very important.
Hemisphericity interplay. Mind Mapping makes provision for hemispheric
interplay. A mindmap uses both right and left brain functions. The process begins as a left
brain activity involving task orientation. Then, the process shifts to the right brain where
image-making, ideation, and insight can take place. Returning to the left brain, images and
ideas are verbalized and the creative results evaluated (Eberle, 1982). Buzan (1994) feels
that by labeling people as either left- or right-side dominant we are missing the importance
of hemisphericity discussions, therefore it is counter-productive. Utilizing skills inherent
62
to both sides of the brain, become very valuable techniques. Mindmaps are compatible
with "schema" theories of cognitive processing in which information about a concept is
filed into an existing framework of categories (Rumelhart, 1980) So, when prior
knowledge is retrieved, this schema provides a framework on which to attach new
knowledge.
Visual. When something can be visualized, it is easier to remember, and mindmaps
are highly visual. Visualizing the mindmap will help to release the flow of information
being learned (Richards, 1993). By organizing the details of a subject into categories, a
visual pattern develops that unifies the separate parts into a whole.
Dual input. Mapping strategies provide input in two modes (visual and verbal),
rather than just one (Paivio, 1971). The use of both visual and verbal language to create
maps results in active learning. The learner is engaged through listening, speaking,
reading, writing, and thinking, and this aids meaningful learning. A map containing key
ideas and information is easier to remember than extended text, whether the text is visual
or verbal (Vygotsky, 1962).
Research on Mind Mapping
Research supports Mind Mapping as a learning aid. It has been discovered that
creating a suitable mindmap can greatly enhance learning and memory. Learners compile
chunks of information that are retrieved through schema memory structure. Much of the
research examining the use of mapping strategies is in the area of reading. These studies
show that they aid in comprehension (Dunston, 1992; Moore & Readance, 1984)
63
Research on outlining, networking and mapping is limited and inconsistent, but
generally finds that these methods are helpful as study aids and help learners understand
and recall information better (Anderson and Armbruster, 1984; Van Patten et al., 1986)
Much of the research has been done with younger children (Chi, Feltovich, & Glaser,
1988), but positive results were also found with adolescents and adults.
The literature review resulted in only one dissertation specifically on Mind
Mapping. This study was conducted for adults in a corporate setting on the effectiveness
of Mind Mapping vs. traditional note-taking. In addition, brain hemisphericity was also
assessed. The Human Information Processing Survey (HIPS) was administered to the
experimental group in the study. The HIPS survey sampled the specialized functions of
the right and left brain hemispheres. A right, left, or integrated brain hemisphere style
profile was measured. Data from the HIPS was correlated with an attitudinal survey to
examine a possible relationship between brain dominance and attitude towards Mind
Mapping. The study showed that those with a right brain preference had higher test
performance and also reported a positive preference for Mind Mapping on the attitudinal
survey (Mehegan, 1996).
Rooda conducted a study to determine if the introduction of the instructing
strategy, Mind Mapping, into an introductory nursing research course would increase
overall learner performance. The results supported the use of Mind Mapping activities as
a way to improve academic success (Rooda, 1994).
McCagg and Dansereau's (1991) studied mapping as a supplemental learning
strategy in a college classroom. In this study, a multiple choice test was used to assess
64
achievement. Results of their study indicated that learner implementation of mapping
activities led to improved performance on multiple choice tests.
Malloy (1987) conducted a study on the effects of introducing college learners to
techniques that would assist them in integrating diverse ideas at a deep cognitive
processing level. The study evaluated writing in the college classroom with an
experimental group that was taught integration techniques of Mind Mapping, visual
imagery, and analogy against a control group that was given practice in organizing papers
and paragraphs. The criterion task to test their integrative abilities required subjects to
integrate three unrelated, abstract ideas. The results indicated that the group given
integration techniques of Mind Mapping, visual imagery and analogy scored higher than
the control group. The experimental group also showed that the techniques affected their
organization as well as their surface structure of the written product (Malloy, 1987).
In a study by Keng (1996) comparing the effectiveness of outlining, concept
mapping, and note-taking as learning strategies on non-science students' understanding of
heat and temperature, results showed that students who used either an outlining or
mapping learning strategy scored significantly better than students who used only a
personalized note-taking strategy. In addition, students scored almost equally on the
multiple-choice tests, but when pressed for explanations on the constructed response,
essay-type examinations, students that used only note-taking strategies "were unable to
provide the in-deptfy responses necessary to earn high marks" (Keng, 1996, p. 90)
About half the people who learn this process (Mind Mapping) find it extremely
useful; the other half find it uncomfortable to use. The latter seem to object to the lack of
65
structure and find it difficult to be as spontaneous as the process requires. But for those
who are comfortable with it, it can be a very useful and versatile tool (Higgins, 1995).
Traditionally, training and the training culture have emphasized instruction of
specific skills that people need to do their jobs more effectively, but not on the ability to
learn. When taught and used properly, Mind Mapping can reach the "hard-to-reach"
learner, improve visualization skills, boost memory, recall and retention, improve
collaborative skills/team work, and allow for both right and left brain learners to "win"
(Jensen, 1995).
'The key is to use both hemispheres, three modalities (visual, auditory, and
kinesthetic) and all four learning styles (concrete, abstract, cerebral, and limbic)." (Jensen,
1995. p2).
CHAPTER 3
PROCEDURES AND METHODS
This chapter describes the methodology used in this study to examine the
effectiveness of Mind Mapping as a note-taking device in a training course as measured
by pre-test, post-test results. The learning style and hemisphericity of the sample was
also studied in respect to success in Mind Mapping to identify if there is any correlation
between success in Mind Mapping and learning style or brain hemisphericity. The
population, design, controls and treatments, sample, instrumentation, materials, data
collection procedures, analytical and statistical treatment, and study time frames are
discussed.
Data Treatment Analysis
The hypotheses for this study are:
1. Participants that receive Mind Mapping training will score significantly higher on the
achievement score measure than the participants that did not receive the Mind Mapping
training.
2. Within the group trained in Mind Mapping there will be no significant difference in
performance among participants across learning style as measured by the Learning Type
Measure instrument.
66
67
3. Within the group trained in Mind Mapping there will be no significant difference in
performance among participants across hemisphericity as measured by the Hemispheric
Mode Indicator instrument.
4. There will be no significant interaction between the learning style and hemisphericity
variables.
Design of the Study
In this study the effectiveness of Mind Mapping as a notetaking technique was
compared with the effectiveness of traditional notetaking. The treatment was the brain-
based learning strategy, Mind Mapping. The effect of Mind Mapping was measured by
the pre-test and post-test of the control and experimental groups. The design of the study
was an experimental pre-test, post-test control group design (Campbell & Stanley, 1963,
p. 55).
R O (X)
R X O
Population/Sample
The population for this study consisted of personnel employed by a major high-
tech firm, which employs 105,000 people worldwide. This study involved the participants
in a Mind Mapping training class sponsored by a large high tech corporation. Participants
in the training class came from all areas of the company, therefore, a wide range of
68
educational level, expertise, interest, and job areas were included in this study. Due to the
corporate environment and possible subject sensitivity due to participation in an
experiment in the workplace, participation in this study was voluntary. Assignment to
either the experimental or control groups was random, as specified by criteria for a pre-
test, post-test control group experimental design. To ensure confidentiality and minimize
experimenter bias, all subjects were given numerical codes on tests and instruments used in
this study. The informed consent form, as set out by the University of North Texas
Institutional Review Board for the Protection of Human Subjects in Research, was signed
by each participating subject insuring confidentially. All subjects elected to participate in
this study.
The sample of participants for this study were selected at random as they
voluntarily sign up for this class through the corporate training services registration
process, which is a corporate on-line system available to all corporation employees. This
course is offered 2-4 times per month. Once registered, the subjects were randomly
assigned, via training administration software, to a specific course session.
The power of a test has a direct correlation to the size of the sample (Kirk, 1995).
Therefore, the sample size for this experiment was determined to be N=120 subjects using
the formula on page 63 of Kirk (1995). The four determinants of the power of the test:
level of significance, size of the sample, size of the population standard deviation, and the
magnitude of difference between their means aided in the determination of sample size.
This large sample was necessary in order to achieve the best results of the statistical
analysis required for the study which required use of a 2 x 4 ANOVA. The large sample
69
size helped to ensure that there were no empty cells which would have been detrimental to
the statistical analysis of the study.
Pilot Study I
A pilot study was conducted with a sample of 13 participants in a Mind Mapping
course in a corporate environment. As a result of the pilot study, the procedures for
administering the instruments were altered. In addition, the reading passage used in the
pilot study could have biased the results of the study in that some study participants could
have prior knowledge of the content that they were being tested over. A new reading
passage and true/false test were selected, designed, and tested for validity and reliability.
Pilot Study II
A second pilot study was done to determine the reliability of the revised
achievement assessment tool. This new achievement assessment tool, consisting of a
reading passage and a 30 items true/false quiz, was selected with the intent to avoid
participants having prior knowledge of the subject matter. The content of the reading
passage was of a technical information nature. The reading passage had several limitations
in its design in that it needed to be technical in nature, cutting edge material that would
not be common knowledge to the subjects but short enough to be read, mapped or noted,
and comprehended within a ten-minute period of time.
A 30 item true/false test was constructed to test comprehension of the reading
material consisting of thirty items. The 30 item true/false test was administered to 115
70
subjects that were not part of the Mind Mapping study. The scores from the 115 subjects
were statistically evaluated to test for reliability of the true/false instrument. The true/false
test was tested for internal consistency and reliability, as measured by the Cronbach alpha
statistic. The results of the reliability testing of the achievement test instrument showed a
Cronback alpha of0.844, using the MicroCAT (tm) Testing System, Copyright (c) 1982,
1984, 1986, 1988,1992 by Assessment Systems Corporation, Rasch Model Item
Calibration Program - RASCAL (tm) Version 3.50 The mean score of the test was
m = 8.1, with a standard deviation, SD = 109.5.
An item analysis of test questions was conducted with this pilot test data. The
difficulty index, measuring the number of people who answered a given item correctly,
was .0950. Although there were several test items that were in the "too difficult" and "too
easy" range, elimination of those items did not significantly affect the reliability alpha,
therefore, all thirty items were left in the test. The rationale behind this is that the longer
the test, the more reliable it is.
To establish the content and construct validity, the achievement instrument was
evaluated by a team of four subject matter experts as to their opinions on the items. These
experts reviewed the test and found it to have content and construct validity.
Data Gathering
Instruments used in this study to gather data were the achievement assessment (a
reading passage and true/false); the Learning Type Measure(LTM), and the Hemispheric
Mode Indicator (HMI).
71
The pre-test, post-test achievement assessment tool (a reading passage and
true/false test) was developed and checked for validity and reliability as mentioned in the
previous section.
The Learning Type Measure (LTM) instrument, developed by Bernice McCarthy
(1980) to facilitate application of the 4MAT System for learning, teaching, and leadership,
is based on the Kolb Learning Style Inventory (1985). The LTM measure describes the
four learning types as depicted by McCarthy. The LTM consists of 15 items and the
content and construct validity have been tested and confirmed (McCarthy & St. Germain,
1997). Content validity has been established in that the stems in the 15 items of Part A
represent the descriptions of the four types of learners found in several books and articles
by McCarthy and her colleagues. Construct validity is established in the fact that only 10
subjects out of390 had tie scores on the quadrants. This delineates the fact that the test
does distinguish learning style quadrant. Further construct validity of the LTM shows that
70% of the respondents had differences between their maximum sum and their next
highest sum of 5 or more. A percentage of 50% of the respondents had differences of 7 or
more. The differences ranged from 0 (for the ten who had two identical sums) to 25 ( a
very peaked profile).
Construct validity was established by analyzing the "correct" respondents rating a
particular stem strongly, i.e., 3 or 4.
The reliability of the LTM instrument was tested for internal consistency, as
measured by the Cronbach alpha statistic. The alpha values for the four sets of items
forming the four learning type sums in Part A and the do vs. watch items in Part B are:
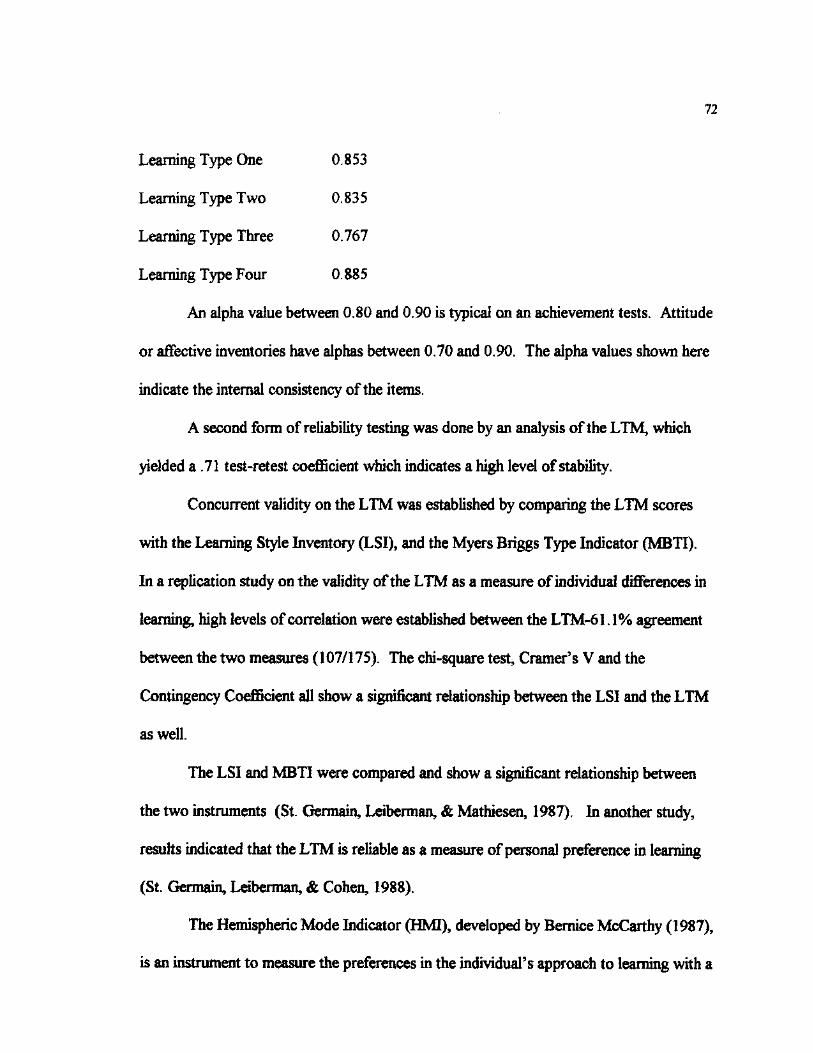
72
Learning Type One 0.853
Learning Type Two 0.835
Learning Type Three 0.767
Learning Type Four 0.885
An alpha value between 0.80 and 0.90 is typical on an achievement tests. Attitude
or affective inventories have alphas between 0.70 and 0.90. The alpha values shown here
indicate the internal consistency of the items.
A second form of reliability testing was done by an analysis of the LTM, which
yielded a .71 test-retest coefficient which indicates a high level of stability.
ConcuiTent validity on the LTM was established by comparing the LTM scores
with the Learning Style Inventory (LSI), and the Myers Briggs Type Indicator (MBTI).
In a replication study on the validity of the LTM as a measure of individual differences in
learning, high levels of correlation were established between the LTM-61.1% agreement
between the two measures (107/175). The chi-square test, Cramer's V and the
Contingency Coefficient all show a significant relationship between the LSI and the LTM
as well.
The LSI and MBTI were compared and show a significant relationship between
the two instruments (St. Germain, Leiberman, & Mathiesen, 1987). In another study,
results indicated that the LTM is reliable as a measure of personal preference in learning
(St. Germain, Leiberman, & Cohen, 1988).
The Hemispheric Mode Indicator (HMI), developed by Bernice McCarthy (1987),
is an instrument to measure the preferences in the individual's approach to learning with a
73
bias for right, left, or whole brain-mode processing techniques. The HMI is used in
conjunction with the LTM to establish a learners' preference for approaching and
representing learning (McCarthy, 1987). The HMI consists of 32 items that are rated on a
Likert-type scale. Each item consists of a continuum between two adjectives. On the
continuum, there are four choices, the subject either chooses "a lot (2)" or "somewhat
(1)" from the other side of the continuum. The HMI rates the participant as to their
inclination toward right, left or whole brain preference. The high negative scores in the
HMI are associated with a left hemispheric mode, and high positive scores are associated
with a right hemispheric mode. The Cronback alpha for the HMI is 0.90. The test-retest
reliability (Pearson moment correlation coefficient is 0.904 (Lieberman, 1986). The
HMI's items were correlated with the items of Torrance's measure of hemispheric
dominance (Your Style of Learning and Thinking, SOLAT-C). The Spearman rank
correlation coefficient is 0.819. The Pearson Product-moment correlation is 0.659
(Lieberman, 1986).
The relationship between learning style and hemispheric dominance is shown to
have a statistically significant relationship between HMI and learning style (Chi-
square=373.1, p, .001).
In a study of the nexus of brain hemisphericity, personality types, temperaments,
learning styles, learning strategies, gender, majors, and cultures, the HMI was used to
determine brain hemisphericity preference (Saleh, 1998).
74
Procedures for Conducting the Experiment
In this study the effectiveness of Mind Mapping as a note-taking device was
compared with the effectiveness of traditional note-taking. The hemisphericity of each
participant and the learning style of each participant was also studied as to their effect on
the success of Mind Mapping. The effect of Mind Mapping was measured by a pre-test
given to a control group prior to the Mind Mapping training and a post-test given to the
experimental group immediately following training.
Participants within each Mind Mapping training class were randomly assigned to a
Group A or a Group B.
Prior to any instruction on Mind Mapping, Group A was given the achievement
assessment portion of this experiment (a reading passage on a technical training topic
unfamiliar to the subjects and a 30 item true/false test over the content and comprehension
of the reading material). A time period of ten minutes was given to the participants to
read the passage, make notes, make highlights or use whatever strategy that they would
normally use to study a reading passage. At the end of the ten minutes, a true/false quiz
over the information in the reading passage was administered to the participants in Group
A. The participants were given five minutes to complete the true/false quiz.
Group B was administered the Learning Type Measure instrument and the
Hemispheric Mode Indicator instrument. Both Group A and Group B then received two
days of training on Mind Mapping from a single certified Mind Mapping instructor. At the
end of the training, Group B was administered the post-test (the same achievement
75
assessment given the control group consisting of a reading passage and 30 item true/false
quiz). Group B was under the same time constraints as Group A, but Group B was asked
to mindmap the material in the reading passage as their study strategy before taking the
quiz. These instruments measured the difference in achievement between Group A and
Group B on the same achievement assessment instrument to determine whether traditional
note-taking or the brain-based learning strategy of Mind Mapping was most effective. In
all instances, the achievement assessment tool was timed - ten minutes to read and study
the passage and five minutes to complete the true/false quiz. The LTM and HMI assessed
the effect of hemisphericity and learning style on achievement scores.
Method of Data Analysis
The statistical procedure used in this study was a one-tailed t-test to determine if
there was a significant difference between mean achievement scores of the two groups.
Calculations for the t-test were done using the computer program (SPSS). A level of
significance of .05 was specified. In addition, the one-way analysis of variance (ANOVA)
General Linear Model SPSS version 8.0 was performed on the data to test for group
differences between the Mind Mapping and no Mind Mapping group.
A 2 x 4 ANOVA was the statistical procedure used to analyze the scores from the
LTM and the HMI. These scores were tested to determine the main effects of
hemisphericity and learning style and to check for interaction between hemisphericity and
learning style.

76
In this study, it was highly probable that there would be unequal cell frequencies.
Therefore, statistical analysis to deal with this problem were used.
77
CHAPTER 4
RESULTS
Introduction
The purpose of this study was to examine the effect of the brain-based learning
strategy, Mind Mapping, as a notetaking device in adults in a training situation with
consideration to learning styles and brain hemisphericity, as determined by the
achievement assessment tool, the Learning Type Measure and the Hemispheric Mode
Indicator.
Hypotheses
The hypotheses for this study were:
1. Participants that receive Mind Mapping training will score significantly higher on the
achievement score measure than the participants that did not receive the Mind Mapping
training.
2. Within the group trained in Mind Mapping there will be no significant difference in
performance among participants across learning style as measured by the Learning Type
Measure instrument.
3. Within the group trained in Mind Mapping there will be no significant difference in
performance among participants across hemisphericity as measured by the Hemispheric
Mode Indicator instrument.
77
78
4. There will be no significant interaction between the learning style and hemisphericity
variables.
Data for this study were collected at a large high tech corporation with voluntary
enrollment of subjects in a Mind Mapping class offered at the corporate training center.
This study was conducted with 112 subjects receiving two days of training on Mind
Mapping from the same instructor who is a certified Mind Mapping instructor. The
subjects were divided randomly into a control group and an experimental group. A timed
achievement assessment test was given to the control group before being trained in Mind
Mapping to test comprehension on a reading passage with subjects taking notes in the
traditional manner. The same timed achievement assessment test was given to the
experimental group after two days of training in Mind Mapping. Subjects in the second
group were told to mindmap the information in the reading passage rather than take
traditional linear notes before taking the achievement assessment test. This experiment
tried to determine if there was any significant difference in the Mind Mapping group
versus the traditional notetaking group judged by the scores on the achievement
assessment tool. In addition, the Mind Mapping group was assessed as to learning style
by the Learning Type Measure and brain hemisphericity by the Hemispheric Mode
Indicator to determine if learning style or hemisphericity had an influence on success with
Mind Mapping.
In this chapter results of data analysis are presented according to the purposes
described in Chapter 1 and the procedures outlined in Chapter ID. Results of all analysis
procedures related to the hypotheses are presented.

79
Data Analysis
Hypotheses 1. Participants that receive Mind Mapping training will score significantly
higher on the achievement score measure than the participants that did not receive the
Mind Mapping training.
Hypothesis 1. Is rejected as the Mind Mapping group did not score significantly higher on
the achievement score measure that the participants that did not receive the Mind Mapping
training at the p> .05 level.
At an alpha level of .05, a t-test was performed to determine if there was a
significant difference between the achievement assessment tool scores of the Mind
Mapping group versus the non-Mind Mapping group. Table 1 presents the results of the
t-test for independent samples (alpha = .05) comparing the post-test results for both
groups, which show that there was no significant difference. The group statistics are seen
in Table 1.
Table 1. Group Statistics
Group N Mean Std. Deviation Std. Error Mean
SCORES Mind Mapping 56 20.9643 3.6430 .4868 No Mind Mapping 56 21.1964 2.9813 .3984
Independent Samples Test t-test for Equality of Means- -.369 p> .05
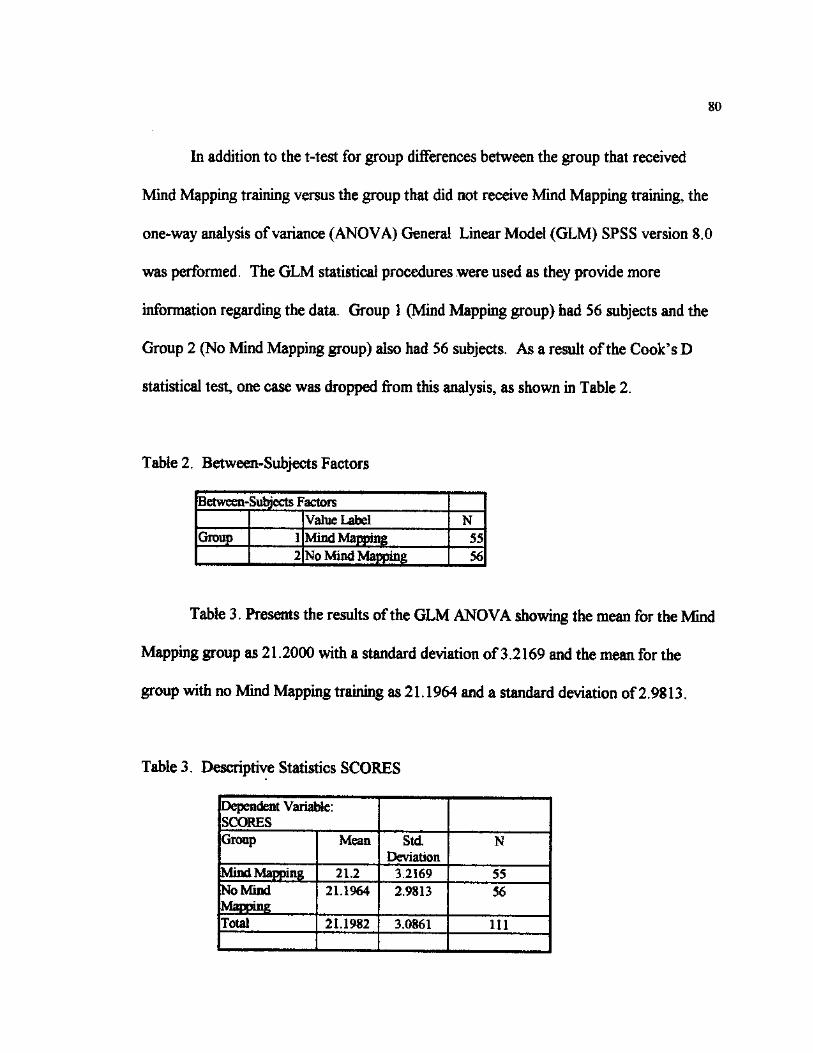
80
In addition to the t-test for group differences between the group that received
Mind Mapping training versus the group that did not receive Mind Mapping training, the
one-way analysis of variance (ANOVA) General Linear Model (GLM) SPSS version 8.0
was performed. The GLM statistical procedures were used as they provide more
information regarding the data. Group 1 (Mind Mapping group) had 56 subjects and the
Group 2 (No Mind Mapping group) also had 56 subjects. As a result of the Cook's D
statistical test, one case was dropped from this analysis, as shown in Table 2.
Table 2. Between-Subjects Factors
Between-Subjects Factors Value Label N
Group 1 Mind Mapping 55 2 No Mind Mapping 56
Table 3. Presents the results of the GLM ANOVA showing the mean for the Mind
Mapping group as 21.2000 with a standard deviation of 3.2169 and the mean for the
group with no Mind Mapping training as 21.1964 and a standard deviation of 2.9813.
Table 3. Descriptive Statistics SCORES
Dependent Variable: SCORES Group Mean Std.
Deviation N
Mind Mapping 21.2 3.2169 55 No Mind Mapping
21.1964 2.9813 56
Total 21.1982 3.0861 111
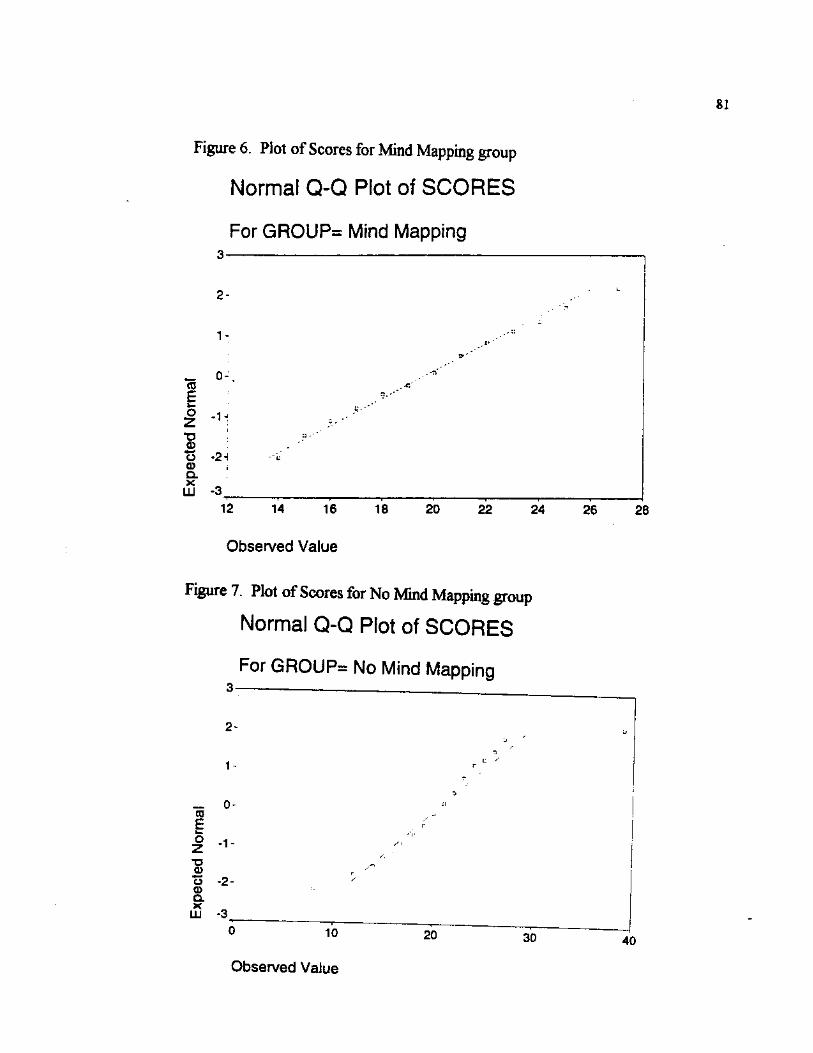
Figure 6. Plot of Scores for Mind Mapping group
Normal Q-Q Plot of SCORES
For GROUP= Mind Mapping 3 -
2 -
1 -
_ 0 - , CO E
I -M t j ! © o -2H 0) > Q. X UJ -3
12 14 16 18 20 22 24
Observed Value
Figure 7. Plot of Scores for No Mind Mapping group
Normal Q-Q Plot of SCORES
For GROUP= No Mind Mapping
81
26 28
— 0-03 E o z - 1 -
"O CD o -2-<D OL x
ill -3 10 20 30
Observed Value
40
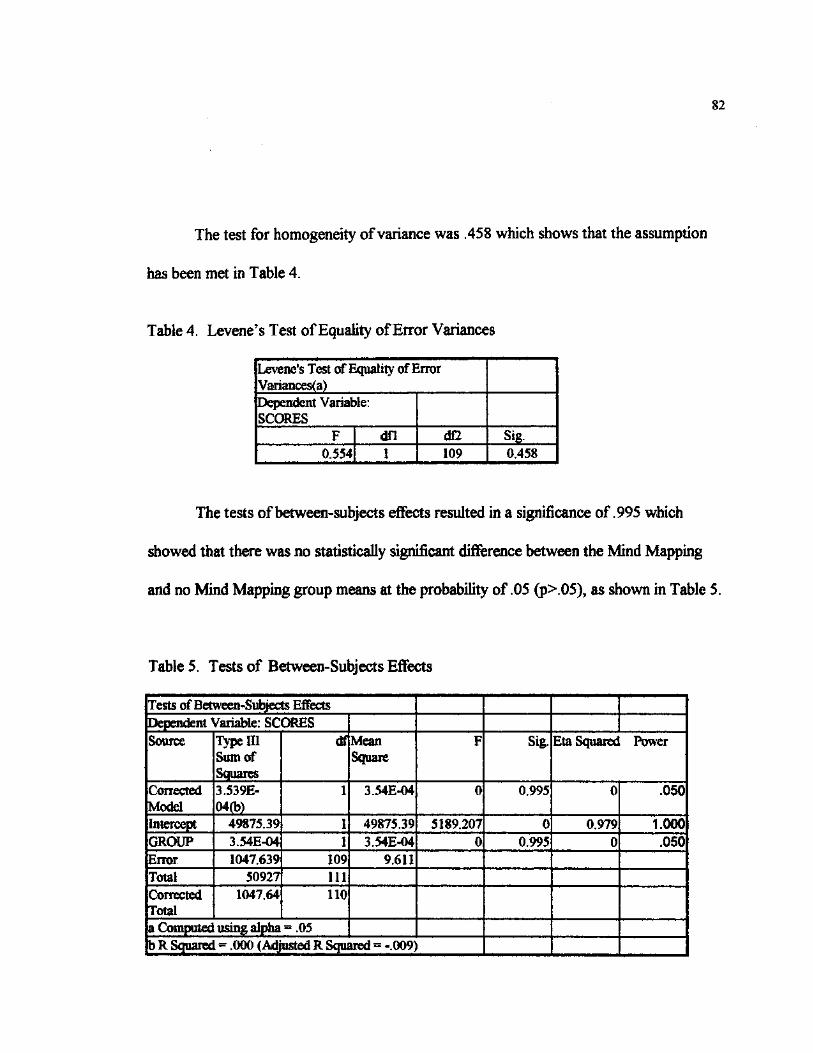
82
The test for homogeneity of variance was .458 which shows that the assumption
has been met in Table 4.
Table 4. Levene's Test of Equality of Error Variances
Levene's Test of Equality of Error Variances(a) Dependent Variable: SCORES
F dfl df2 Sig. 0.554 1 109 0.458
The tests of between-subjects effects resulted in a significance of .995 which
showed that there was no statistically significant difference between the Mind Mapping
and no Mind Mapping group means at the probability of .05 (p>.05), as shown in Table 5.
Table 5. Tests of Between-Subjects Effects
Tests of Between-Subjects Effects Dependent Variable: SCORES Source "type in
Sum of Squares
df Mean Square
F Sig. Eta Squared Power
Corrected Model
3.539E-04(b)
1 3.54E-04 0 0.995 0 .050
Intercept 49875.39 1 49875.39 5189.207 0 0.979 1.000 GROUP 3.54E-04 1 3.54E-04 0 0.995 0 .050 Error 1047.639 109 9.611 Total 50927 111 Corrected Total
1047.64 110
a Computed using alpha - .05 b R Squared = .000 (Adjusted R Squared = -.009) l
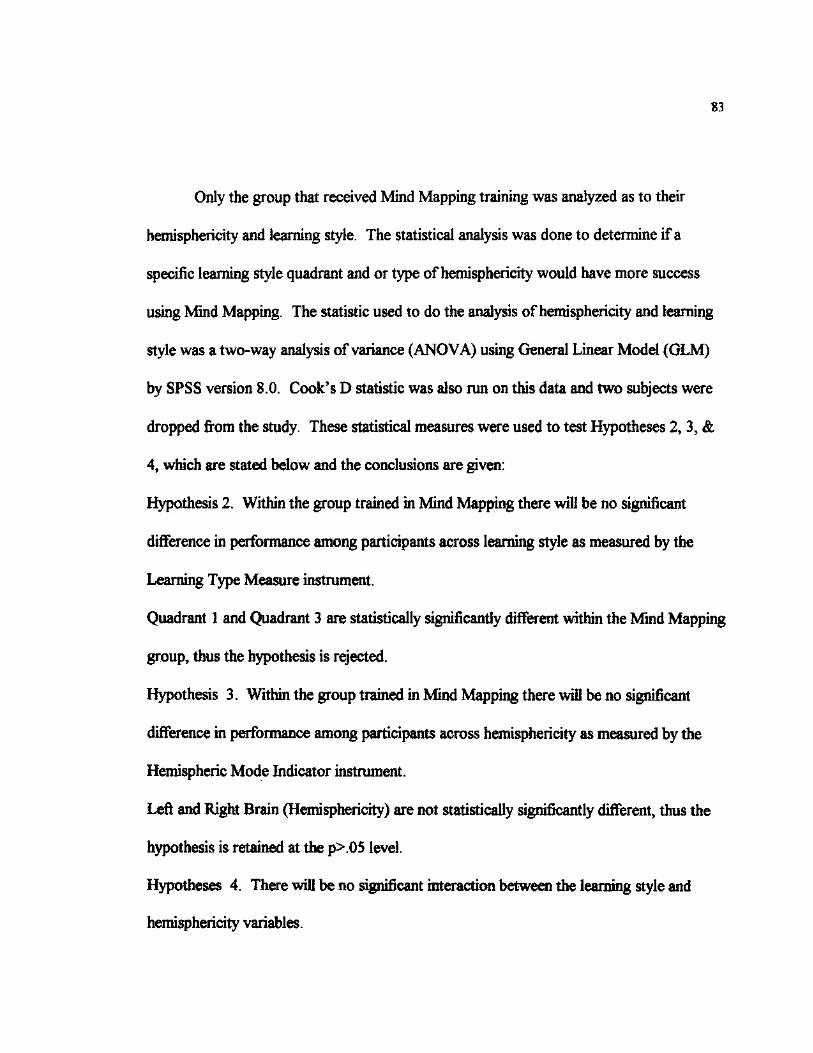
83
Only the group that received Mind Mapping training was analyzed as to their
hemisphericity and learning style. The statistical analysis was done to determine if a
specific learning style quadrant and or type of hemisphericity would have more success
using Mind Mapping. The statistic used to do the analysis of hemisphericity and learning
style was a two-way analysis of variance (ANOVA) using General Linear Model (GLM)
by SPSS version 8.0. Cook's D statistic was also run on this data and two subjects were
dropped from the study. These statistical measures were used to test Hypotheses 2,3, &
4, which are stated below and the conclusions are given:
Hypothesis 2. Within the group trained in Mind Mapping there will be no significant
difference in performance among participants across learning style as measured by the
Learning Type Measure instrument.
Quadrant 1 and Quadrant 3 are statistically significantly different within the Mind Mapping
group, thus the hypothesis is rejected.
Hypothesis 3. Within the group trained in Mind Mapping there will be no significant
difference in performance among participants across hemisphericity as measured by the
Hemispheric Mode Indicator instrument.
Left and Bight Brain (Hemisphericity) are not statistically significantly different, thus the
hypothesis is retained at the p>.05 level.
Hypotheses 4. There will be no significant interaction between the learning style and
hemisphericity variables.
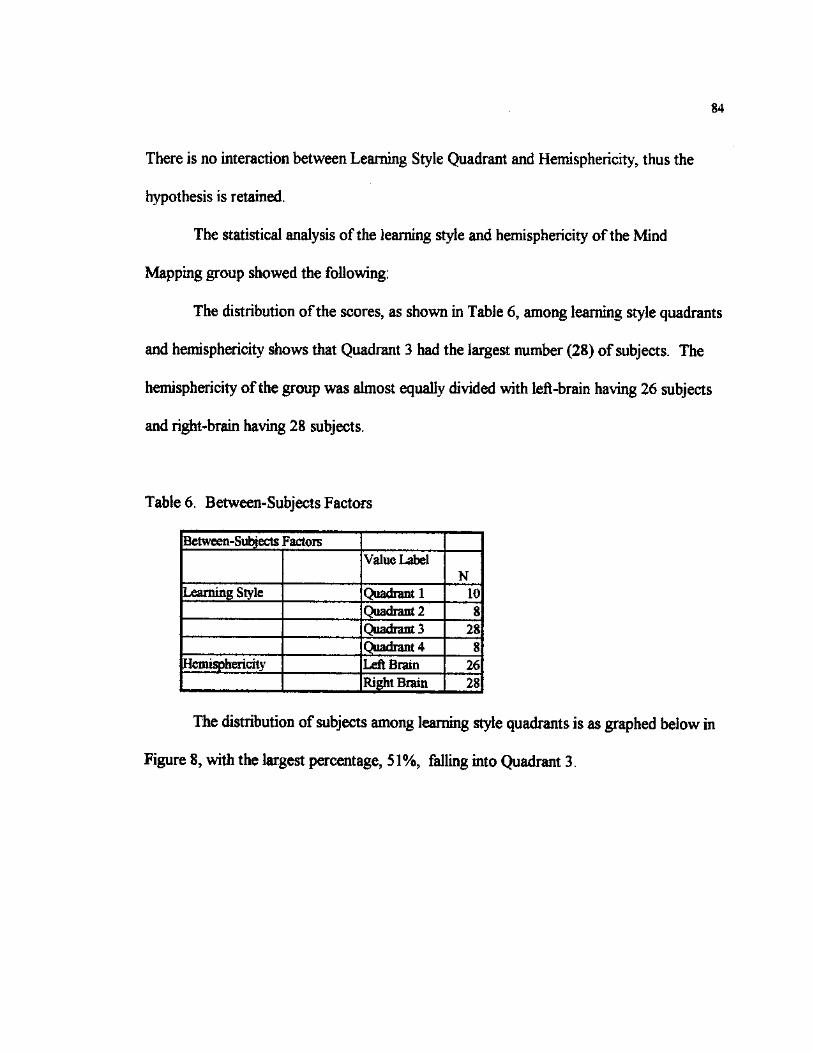
84
There is no interaction between Learning Style Quadrant and Hemisphericity, thus the
hypothesis is retained.
The statistical analysis of the learning style and hemisphericity of the Mind
Mapping group showed the following:
The distribution of the scores, as shown in Table 6, among learning style quadrants
and hemisphericity shows that Quadrant 3 had the largest number (28) of subjects. The
hemisphericity of the group was almost equally divided with left-brain having 26 subjects
and right-brain having 28 subjects.
Table 6. Between-Subjects Factors
Between-Subjects Factors Value Label
N Learning Style Quadrant 1 10
Quadrant 2 8 Quadrant 3 28 Quadrant 4 8
Hemisphericity Left Brain 26 Right Brain 28
The distribution of subjects among learning style quadrants is as graphed below in
Figure 8, with the largest percentage, 51%, falling into Quadrant 3.
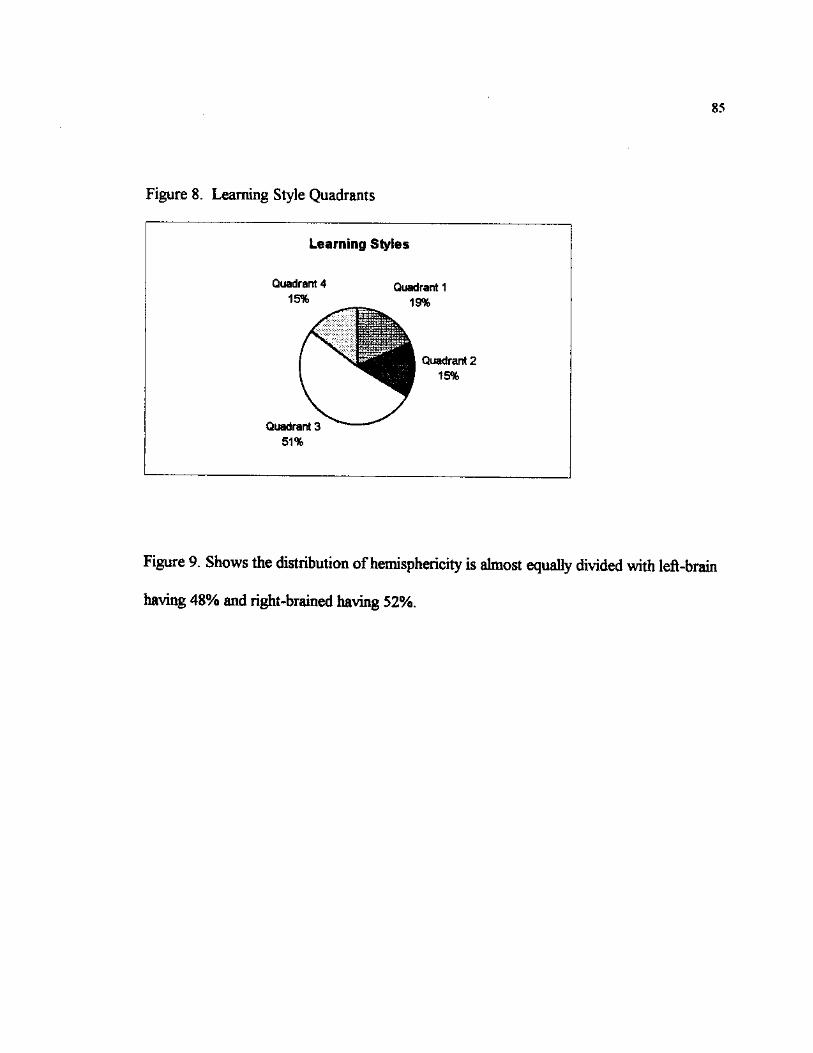
85
Figure 8. Learning Style Quadrants
Learning Styles
Quadrant 4 Quadrant 1 15% ^ 19%
/ % l i i
^ M | | | Quadrant 2 ^ ^ 9 15%
Quadrant 3 51%
Figure 9. Shows the distribution of hemisphericity is almost equally divided with left-brain
having 48% and right-brained having 52%.
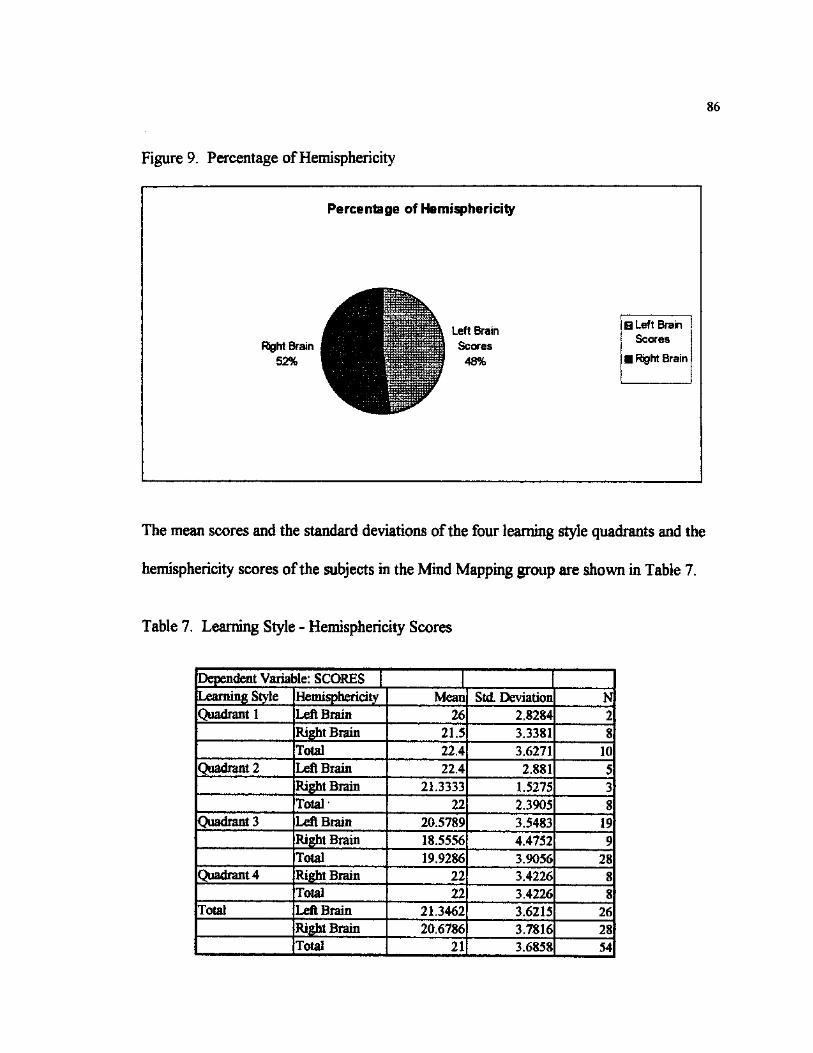
86
Figure 9. Percentage of Hemisphericity
Percentage of Hemisphericity
Right Brain 52%
Left Brain Scores 48%
& Left Brain Scores
• Right Brain
The mean scores and the standard deviations of the four learning style quadrants and the
hemisphericity scores of the subjects in the Mind Mapping group are shown in Table 7.
Table 7. Learning Style - Hemisphericity Scores
Dependent Variai jle: SCORES Learning Style Hemisphericity Mean Std. Deviation N Quadrant 1 Left Brain 26 2.8284 2
Right Brain 21.5 3.3381 8 Total 22.4 3.6271 10
Quadrant 2 Left Brain 22.4 2.881 5 Right Brain 21.3333 1.5275 3 Total 22 2.3905 8
Quadrant 3 Left Brain 20.5789 3.5483 19 Right Brain 18.5556 4.4752 9 Total 19.9286 3.9056 28
Quadrant 4 Right Brain 22 3.4226 8 Total 22 3.4226 8
Total Left Brain 21.3462 3.6215 26 Right Brain 20.6786 3.7816 28 Total 21 3.6858 54
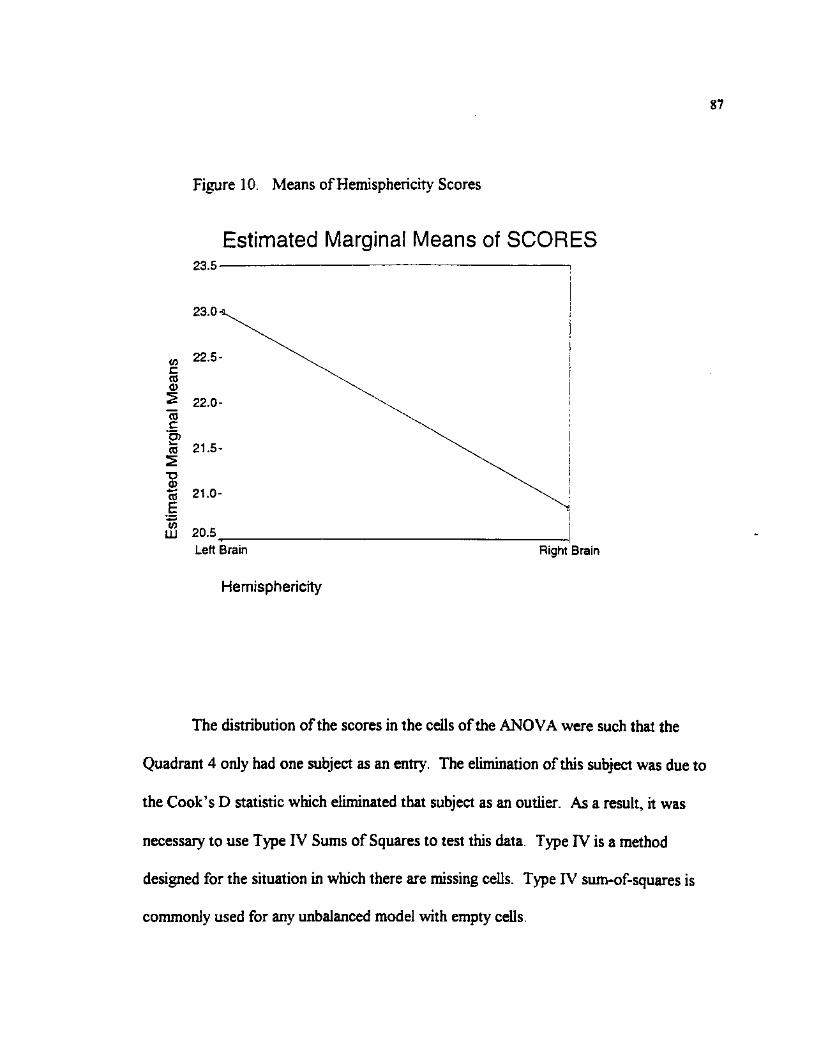
87
Figure 10. Means of Hemisphericity Scores
Estimated Marginal Means of SCORES 23.5
22.0-
co 21.5-
5 21.0-
LU 20.5 Left Brain Right Brain
Hemisphericity
The distribution of the scores in the cells of the ANOVA were such that the
Quadrant 4 only had one subject as an entry. The elimination of this subject was due to
the Cook's D statistic which eliminated that subject as an outlier. As a result, it was
necessaiy to use Type IV Sums of Squares to test this data. Type IV is a method
designed for the situation in which there are missing cells. Type IV sum-of-squares is
commonly used for any unbalanced model with empty cells.
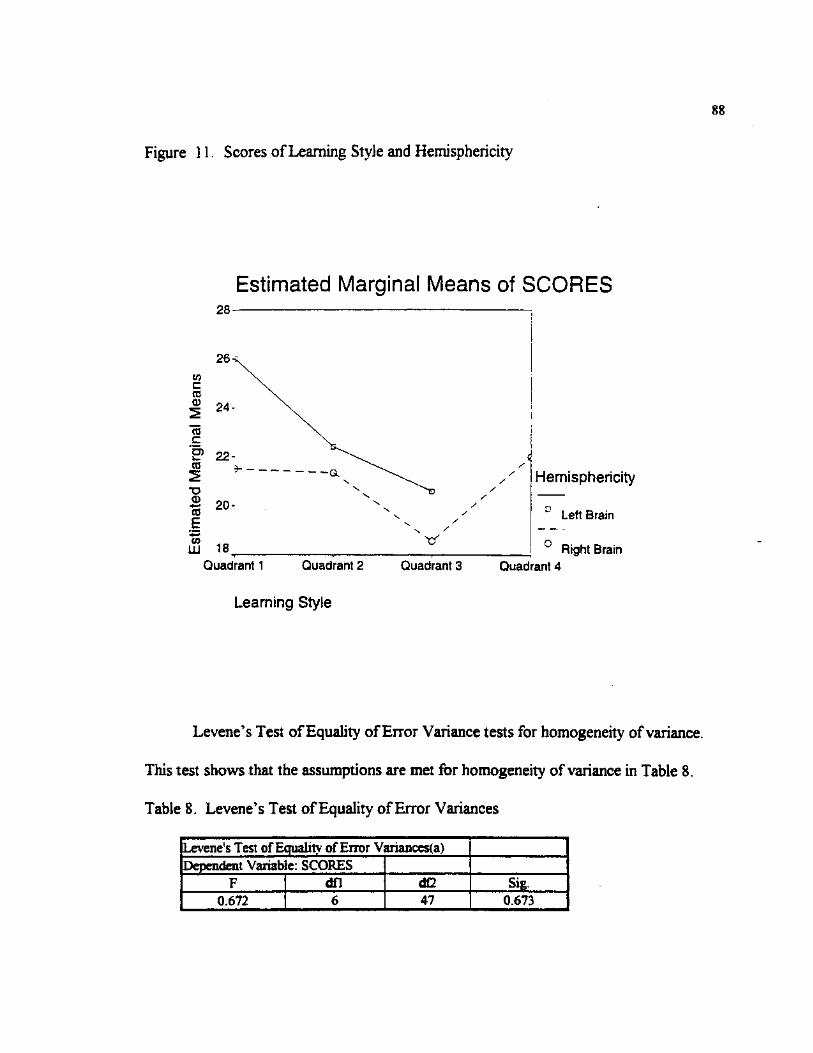
88
Figure 11. Scores of Learning Style and Hemisphericity
Estimated Marginal Means of SCORES
UJ 18 Quadrant 1 Quadrant 2 Quadrant 3
Learning Style
Hemisphericity
Left Brain
Right Brain Quadrant 4
Levene's Test of Equality of Error Variance tests for homogeneity of variance.
This test shows that the assumptions are met for homogeneity of variance in Table 8.
Table E. Levene's Test of Equality of Error Variances
Levene's Test of Equality of Error Variances(a) Dependent Variable: SCORES
F I dfl d£2 Sig. 0.672 I 6 47 0.673
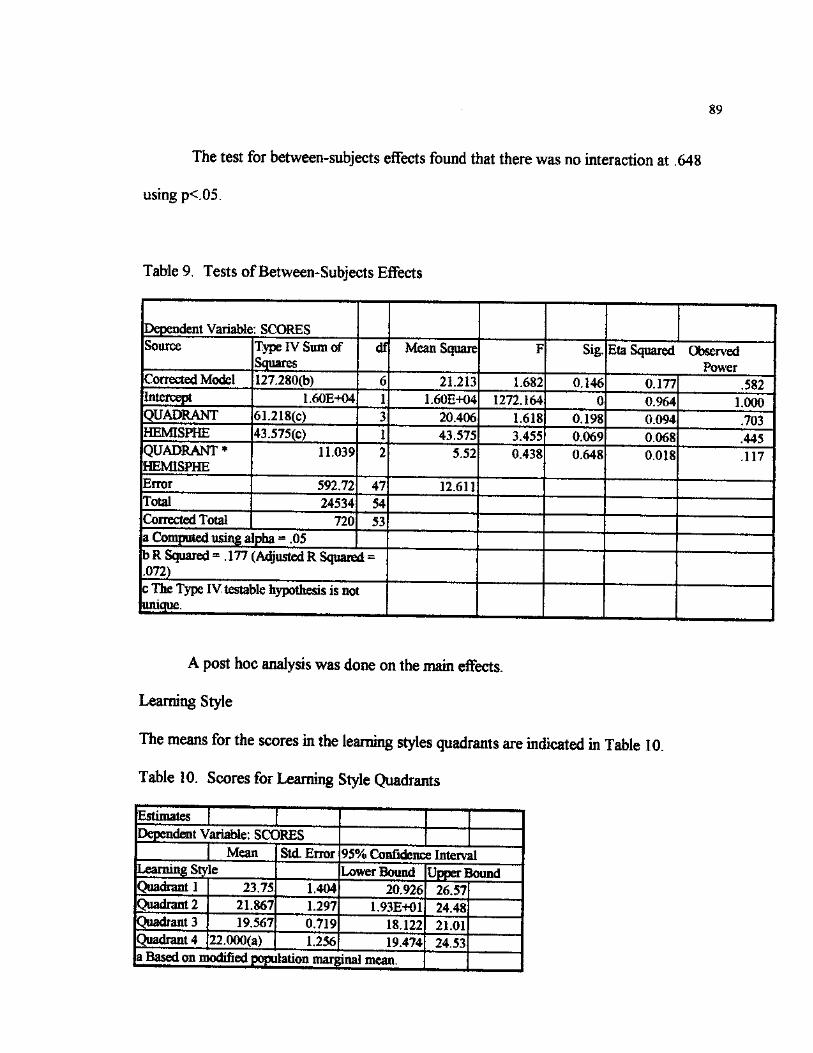
89
The test for between-subjects effects found that there was no interaction at .648
using p< 05.
Table 9. Tests of Between-Subjects Effects
Dependent Variable :SCORES Source Type IV Sum of
Squares df Mean Square F Sig. Eta Squared Observed
Power Corrected Model 127.280(b) 6 21.213 1.682 0.146 0.177 .582 Intercept 1.60E+04 1 1.60E+04 1272.164 0 0.964 1.000 QUADRANT 61.218(c) 3 20.406 1.618 0.198 0.094 .703 HEMISPHE 43.575(c) 1 43.575 3.455 0.069 0.068 .445 QUADRANT* HEMISPHE
11.039 2 5.52 0.438 0.648 0.018 .117
Error 592.72 47 12.611 Total 24534 54 Corrected Total 720 53 a Computed using al [pha = .05 bR Squared = .177 (Adjusted R Squared = .072) c The Type IV testable hypothesis is not unique.
A post hoc analysis was done on the main effects.
Learning Style
The means for the scores in the learning styles quadrants are indicated in Table 10.
Table 10. Scores for Learning Style Quadrants
Estimates | | Dependent Variable: SCORES
1 Mean Std. Error 95% Confidence Interval Learning Style Lower Bound Upper Bound Quadrant 1 23.75 1.404 20.926 26.57 Quadrant 2 21.867 1.297 1.93E+01 24.48 Quadrant 3 19.567 0.719 18.122 21.01 Quadrant 4 22.000(a) 1.256 19.474 24.53 a Based on modified population marginal m«m

90
An omnibus F test usually lowers power, so in this case the statistical
analysis used was post hoc pairwise comparisons (see Table 11).
Table 11. Pairwise Comparisons
Dependent Variable: SCORES I Mean Difference (I-D
Std. Error Sig.(a) 95% Confidence Interval for Difference^)
(D Learning Style
(J) Learning Style Lower Bound Upper Bound
Quadrant 1 Quadrant 2 1.883 1.911 0.329 -1.961 5.728 Quadrant 3 4.183(*) 1.577 0.011 1.01 7.355 Quadrant 4 1.750(b) 1.883 0.358 -2.039 5.539
Quadrant 2 Quadrant 1 -1.883 1.911 0.329 -5.728 1.961 Quadrant 3 2.299 1.482 0.128 -0.683 5.282 Quadrant 4 -.133(b) 1.805 0.941 -3.764 3.498
Quadrant 3 Quadrant 1 -4,183(*) 1.577 0.011 -7.355 -1.01 Quadrant 2 -2.299 1.482 0.128 -5.282 0.683 Quadrant 4 -2.433(b) 1.447 0.099 -5.343 0.477
Quadrant 4 Quadrant 1 -1.750(c) 1.883 0.358 -5.539 2.039 Quadrant 2 .133(c) 1.805 0.941 -3.498 3.764 Quadrant 3 2.433(c) 1.447 0.099 -0.477 5.343
Based on estimated marginal means * The mean difference is significant at the .05 level. a Adjustment for multiple comparisons: Least Significant Difference (equivalent to no adjustments). b An estimate of the modified population marginal mean (J). c An estimate of the modified population marginal mean (I).
From this analysis we can see that Quadrant 1 and Quadrant 3 are statistically
significant at the .05 level. It is also important to look at Eta (effect size). Although small,
Eta is close to. 1 as seen in Table 12.
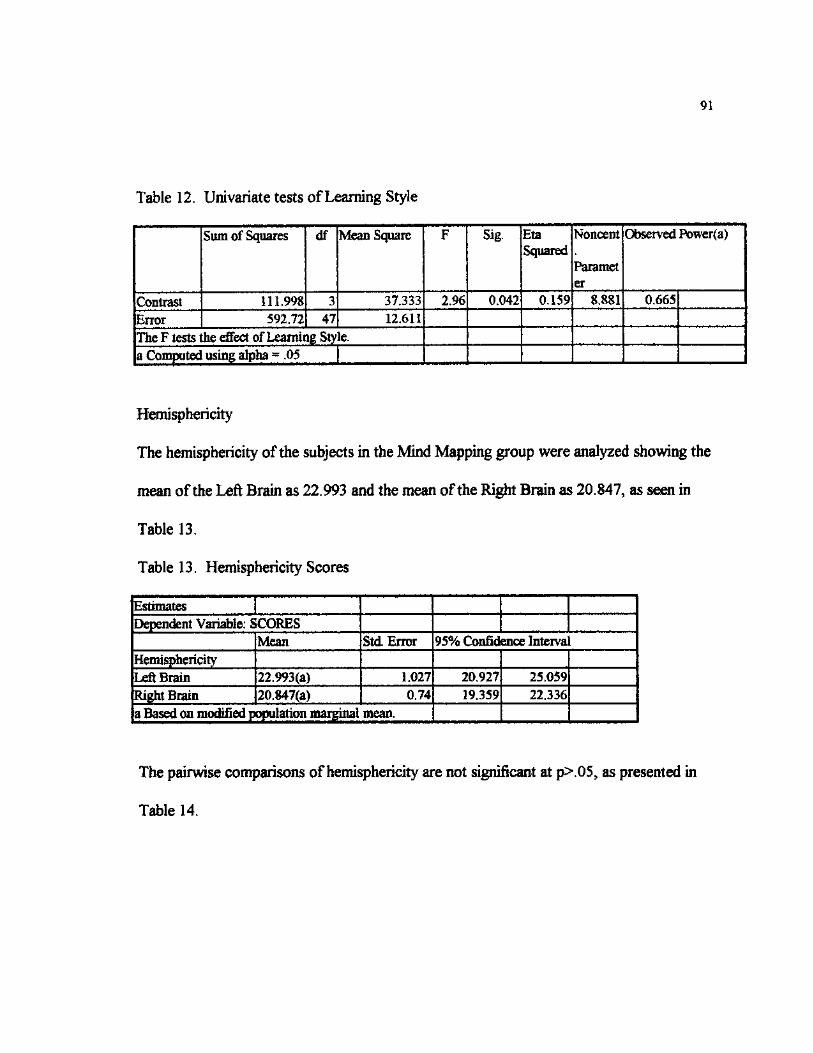
91
Table 12. Univariate tests of Learning Style
Sum of Squares df Mean Square F Sig. Eta Squared
Noncent
Paramet er
Observed Power(a)
Contrast 111.998 3 37.333 2.96 0.042 0.159 8.881 0.665 Error 592.72 47 12.611 The F tests the effect of Learning Sty le. a Computed using alpha = .05
Hemisphericity
The hemisphericity of the subjects in the Mind Mapping group were analyzed showing the
mean of the Left Brain as 22.993 and the mean of the Right Brain as 20.847, as seen in
Table 13.
Table 13. Hemisphericity Scores
Estimates | I Dependent Variable: SCORES |
Mean Std. Error 95% Confidence Interva Hemisphericity Left Brain 22.993(a) 1.027 20.927 25.059 Right Brain 20.847(a) 0.74 19.359 22.336 a Based on modified population marginal mean.
The pairwise comparisons of hemisphericity are not significant at p>.05, as presented in
Table 14.
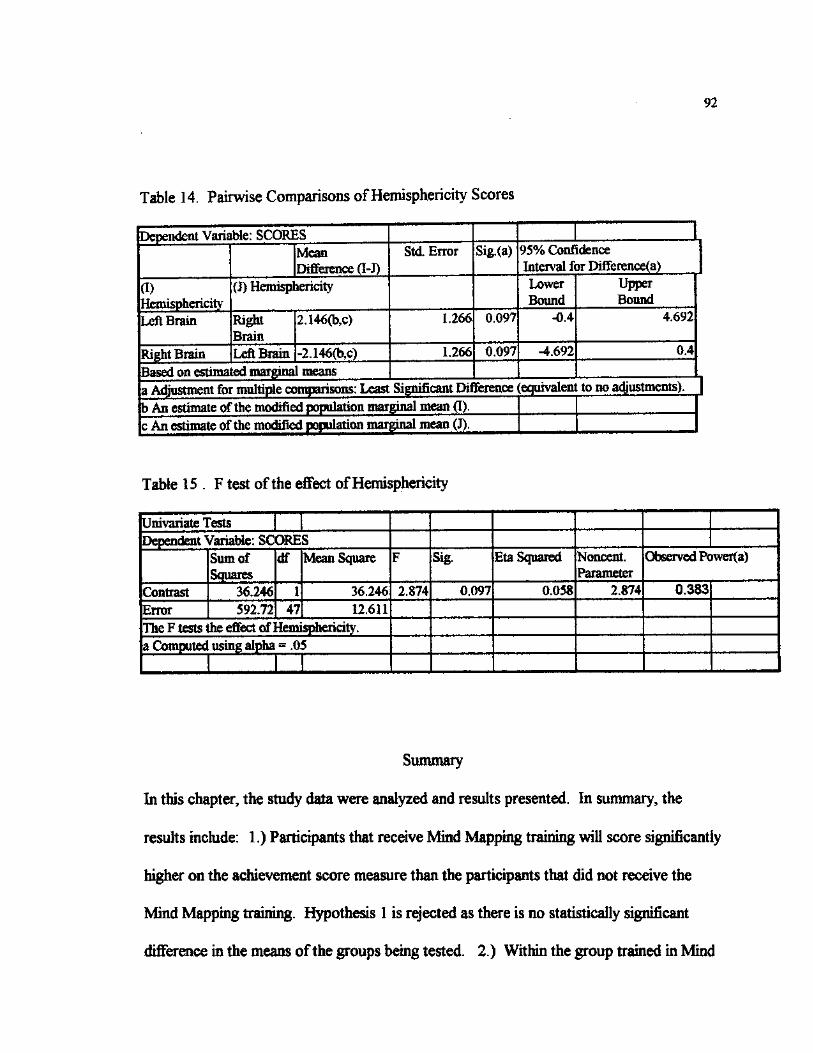
92
Table 14. Pairwise Comparisons of Hemisphericity Scores
Dependent Variable: SCORES 1 >. iMean (Difference (I-J)
Std. Error Sig.(a) 95% Confidence 1 Interval for Difference^) I J el (J) Hemisphericity Lower Bound
Upper Bound
Left Brain Right Brain
2.146(b,c) 1.266 0.097 -0.4 4.692
Right Brain Left Brain -2.146(b,c) 1.266 0.097 -4.692 0.4
Based on estimated margina means a Adjustment for multiple comparisons: Least Significant Difference i (equivalent to no adjustments). | b An estimate of the modified population marginal mean (I). c An estimate of the modified population marginal mean (J).
Table 15 . F test of the effect of Hemisphericity
Univariate Tests Dependent Variable: SCORES
Sum of Squares
df Mean Square F Sig. Eta Squared Noncent. Parameter
Observed Power(a)
Contrast 36.246 1 36.246 2.874 0.097 0.058 2.874 0.383
Error 592.72 47 12.611 The F tests the effect of] Hemisphericity. a Computed using alpha = .05
Summary
In this chapter, the study data were analyzed and results presented. In summary, the
results include: 1.) Participants that receive Mind Mapping training will score significantly
higher on the achievement score measure than the participants that did not receive the
Mind Mapping training. Hypothesis 1 is rejected as there is no statistically significant
difference in the means of the groups being tested. 2.) Within the group trained in Mind
93
Mapping there will be no significant difference in performance among participants across
learning style as measured by the Learning Type Measure instrument. Hypothesis 2 is
rejected as Learning Style Quadrant 1 and Quadrant 3 showed significant difference in
performance among participants. 3.) Within the group trained in Mind Mapping there
will be no significant difference in performance among participants across hemisphericity
as measured by the Hemispheric Mode Indicator instrument. Hypothesis 3 is retained as
no significant difference in performance among participants across hemisphericity was
detected. 4.) There will be no significant interaction between the learning style and
hemisphericity variables. Hypothesis 4 was retained as there was no interaction between
the learning style and hemisphericity variables.
These results are discussed further in Chapter 5, along with their relationship to
current literature. In Chapter 5, conclusions are drawn regarding the implications of the
results for each hypothesis and recommendations for further research are made.
CHAPTER 5
SUMMARY, CONCLUSIONS AND RECOMMENDATIONS
In this chapter, the research study is summarized. Conclusions regarding the
results of the data analyses for the various hypotheses are presented and discussed.
Recommendations for further research in the area of Mind Mapping, as a notetaking
strategy, are made.
Summary
The purpose of this study was to determine the effectiveness of Mind Mapping, a
brain-based learning strategy, as a note-taking device with adults in a corporate training
environment. The effect of learning style and brain hemisphericity preference on success
in the use of Mind Mapping was also assessed as a tool to better understand how to aid
people in becoming effective, efficient learners. This study has increased the body of
knowledge concerning the effectiveness of Mind Mapping as a notetaking strategy with
consideration to learning styles and brain hemisphericity of adults in a corporate training
situation.
This study has shown that brain-based strategies provide greater achievement by
using both hemispheres of the brain and that using certain brain-based strategies, such as
94
95
Mind Mapping, training can be redesigned to enable learners to become more successful
learners. There is a lack of current research in the areas of Mind Mapping and its
effectiveness as a note-taking device and the effect of learning style and hemisphericity on
success in Mind Mapping made this dissertation study a critical area for study.
Subjects using Mind Mapping versus traditional notetaking strategies were
compared to determine the effectiveness of Mind Mapping in consideration with learning
style and brain hemisphericity on adults in a training situation. The brain-based learning
strategy, Mind Mapping, is based on the translation of brain research which shows that the
mind does not process information in solely list-like, linear representation. The use of
associations, graphics, color, and key words make the Mind Mapping strategy "brain-
friendly", thus extremely effective in aiding the learning process.
This study was conducted in a corporate training environment with 112 subjects
receiving two days of training on Mind Mapping from the same instructor who is a
certified Mind Mapping instructor. The subjects were divided randomly into a control
group and an experimental group. An achievement assessment test was given to the
control group before bang trained in Mind Mapping to test comprehension on a reading
passage with subjects taking notes in the traditional manner. The same achievement
assessment test was given to the experimental group after two days of training in Mind
Mapping. Subjects were told to mindmap the information in the reading passage rather
than take notes. This experiment examined the data to determine if there was any
significant difference in the Mind Mapping vs. traditional notetaking group judged by the
scores on the achievement assessment tool. In addition, the Mind Mapping group was
96
assessed as to learning style by the Learning Type Measure and brain hemisphericity by the
Hemispheric Mode Indicator to determine if learning style or hemisphericity had an
influence on success with Mind Mapping.
Conclusions
The study hypothesis was rejected:
1. Participants that receive Mind Mapping training will score significantly higher on the
achievement score measure than the participants that did not receive the Mind
Mapping training.
Participants that had been trained in Mind Mapping did not score higher than the
group that used traditional note-taking techniques. Previous findings show that the brain-
based learning strategy, mapping, is helpful as a study aid and helps learners understand
and recall information better (Anderson and Armbmster, 1984; Armbruster, 1991; Chi,
Feltovich, & Glaser, 1988; Dansereau, 1985; Dunston, 1992; Moore & Readance, 1984;
Pressley, Woloshyn & Associates, 1995; Van Patten et al., 1986).
This study shows that Mind Mapping, as a learning strategy, was equally effective
as a note-talcing device for participants in the study-the mean scores of the Mind Mapping
group were 21.2 and the non Mind Mapping group were 21.1964. This is especially
significant in that the strategy of Mind Mapping was a new skill and no practice or study
time was allowed. The achievement assessment tool was administered immediately after
the training. The amount of time required to assimilate a new skill was not part of this
study. However, the results of this study, which showed that after a two-day training class
on Mind Mapping the study subjects were able to score equally well as those that used
97
traditional note-taking, is extremely significant. Traditional note-taking, a skill that most of
the participants have practiced a lifetime, usually consists of grammatically correct phrases
and sentences and is often cumbersome and inefficient when compared with key word
noting (mapping). The introduction of Mind Mapping and the requirement to use it after
only two days of limited practice would definitely affect the success of the Mind Mapping
group. The benefit of formal training in strategy instruction has been shown to have
significant positive impacts on the learner (Segal, et al., 1985; Weinstein & Underwood,
1985; Pressley, et al., 1995; Kulik, Kulik & Schwalb, 1983). Kiewra and Fletcher (1984)
found that the modification of notetaking behavior may require some degree of intensive
learning. When mapping is taught as a study technique, refinement of the process to
ensure accuracy and inclusiveness can take several weeks (Dansereau & Holley, 1984;
Arnaudin et al., 1984). Still, the basics of mapping can be mastered in less than an hour by
individuals who complete a few mapping exercises and get feedback on them from
teachers or peers (Clarke, 1990). The fact that the group scored equally as well as the
traditional note-taking group is a true indication of the impact and effectiveness of the skill
of Mind Mapping. With more time, practice, and skill with Mind Mapping a greater
disparity among the scores would probably be evidenced.
In addition to learning a new learning strategy as part of this study, the amount of
time given the subjects to practice before taking an immediate post-test was nil. In a study
done by McCagg and Dansereau (1991), findings showed that implementation of mapping
strategies requires that the students be adequately familiar with the mapping technique to
reduce possible anxiety; provided with appropriate examples of mapping usage; and
98
should be allowed to practice mapping prior to implementing the technique as a
supplemental learning strategy.
This study looked at the learning style of the learner as well as the hemisphericity
of the learner in an effort to evaluate one's learning style's impact on the use of the brain-
based strategy of Mind Mapping. This type of study was suggested by Trautman (1979)
in which he suggested that further research should be done to establish better, more
succinct criteria by which to determine the cognitive style and learning style characteristics
of curriculum, resources, and instructional strategies.
The study statistics showed that Quadrant 1 and Quadrant 3 were significant as to
the scores of the achievement assessment tool. This result may be the result of the
quantity of the number of subjects in each cell rather than the scores relating to those cells.
Brain hemisphericity was not significant as a predictor of success with Mind Mapping.
According to McCarthy (1987), we all learn in a whole brain style with dominance for left
or right brain in each quadrant. Studies suggest that the effectiveness of learners'
strategies depends on the context of learning and on the learner's own characteristics (e.g.
academic environment, learning style) (Pask, 1988). Learning style research has shown
that when student learning styles were assessed, and then the students were put through a
course to expose them to other methods other than their preferred mode of learning, the
students were able to change their preferred styles of learning and thinking through briefj
but intensive, training. Through exposure to right-hemisphere, non-linear learning
strategies the learners were able to make more use of their existing capabilities and extend
into new areas (Torrance & Ball, 1978).
99
Mehegan's study (1996) showed that those with a right brain preference had
higher test performance and also reported a positive preference for Mind Mapping on the
attitudinal survey. Although an attitudinal survey was not part of this study, results of the
study show that brain hemisphericity was equally distributed among the subjects and it was
not a significant influence on the success of achievement on mapping.
Research on the effects of mapping as a learning strategy is mixed. Used as a
learning strategy, mapping has been shown to increase knowledge acquisition (Ault, 1985;
Arnaudin et al., 1984). According to McKeachie (1984) mapping can also be time
consuming, first in learning the technique and then in putting it to use. With limited prior
knowledge, students may find mapping of little value. Rooda's results (1994) supported
the use of Mind Mapping activities as a way to improve academic success. McCagg and
Dansereau's (1991) study showed that learner implementation of mapping activities led to
improved performance on multiple choice tests. In a study by Malloy (1987), results
showed that the group given integration techniques of Mind Mapping, visual imagery and
analogy scored higher than the control group. The experimental group also showed that
the techniques affected their organization as well as their surface structure of the written
product. Keng's study (1996) compared the effectiveness of outlining, concept mapping,
and note-taking as learning strategies on non-science students' understanding of heat and
temperature. Keng's results showed that students who used either an outlining or
mapping learning strategy scored significantly better than students who used only a
personalized note-taking strategy. About half the people who learn this process (Mind
Mapping) find it extremely useful; the other half find it uncomfortable to use. The latter
100
seem to object to the lack of structure and find it difficult to be as spontaneous as the
process requires. But for those who are comfortable with it, it can be a very useful and
versatile tool (Higgins, 1995).
The reading passage selected for this study was of a technical nature and purposely
chosen so as to avoid participants' prior knowledge of the reading material. As a result,
the information was difficult to read, assimilate, and most participants had no prior
knowledge from which to attach this new information. The complexity or difficulty of the
reading passage has a potential impact on notetaking. Cook and Meyer (1983) and Locke
(1977) found that complex, information-dense lectures can result in ineffective notetaking
and lower recall scores under this response condition.
Recommendations
Other areas, in addition to strategy research, related to maps that need to be
researched are cognitive development, schema theory, cognitive styles, learning styles,
cultural differences, and secondary language acquisition.
Mehegan (1996), recommended that research regarding the relationship between
Mind Mapping and bran hemisphere dominance be done using a more comprehensive and
reliable instrument. As a result, this study used the Hemispheric Mode Indicator which has
been proved to be valid and reliable. Further studies in this area would be beneficial in
substantiating the research of this study.
Evaluation of mapping strategies is problematic in that they are difficult to
evaluate. Learning strategies research needs improvement in the experimental methods
101
used to study spatial learning strategies. It is difficult to assess a student's entry-level
ability to use mapping strategies.
Problems for Further Study
Further research in the area of Mind Mapping, brain-based learning and
brain-based learning strategies, learning styles and brain hemisphericity will aid in the
development of more effective means of teaching people how to learn.
As a suggestion for future studies, research into the effect of a time delay after
reading the passage and being tested would be very interesting. In a telephone
conversation in regard to this study's design, Dr. D. Dansereau suggested that as a future
study a two hour delay of testing after reading and noting or Mind Mapping the passage
would allow a better evaluation of the effect of Mind Mapping versus traditional
notetaking, as Mind Mapping should afford better long term memory incorporation.
Dillon and Schmeck (1983) have identified a number of individual differences and
individual difference variables that affect cognitive processes, particularly learning
strategies. Few studies have investigated these factors, but investigation of the factors and
how they relate to other experimental variables can improve our understanding of the
mechanisms underlying the use of mapping strategies and the instructional techniques
needed to teach them exclusively on group data.
According to Smith (1991), mapping seems to be an advantage to learners who are
visually oriented. This study did not look at the different modalities of learning-visual,
102
auditory, or kinesthetic; but this would be an excellent and interesting study in terms of
success with Mind Mapping.
Additional areas that were not considered as part of this study, but would be
excellent areas for further research are:
1. The effect of Mind Mapping within other training or educational environments.
2. Success with Mind Mapping among subjects with high, medium, and low intelligence
scores.
3. Success with Mind Mapping when considering educational level of participants in the
Mind Mapping class.
4. The effect of the training over time.
5. The correlation of gender and hemisphericity and success with Mind Mapping. Gender
was not evaluated as part of this study. Novak (1991) and Jegede, et al (1990) have
reported that males using mapping have greater achievement gains than similar females
and males maps are more integrated and complex.
6. Consideration of age and success in the use of Mind Mapping.
7. The influence of the use of color versus black and white in the process of Mind
Mapping.
8. The effect of music on the success with Mind Mapping and/or notetaking.
9. The effect of a longer period of time for instruction and practice of the Mind Mapping
skill.
10. The effect of time delay in testing and comprehension of information comparing Mind
Mapping and traditional notetaking.
103
Summary
In summary, this final chapter has synthesized the results of this research, provided
conclusions based on the findings, and indicated recommendations for further research.
This study provides the basis for future investigations in the area of Mind Mapping's
potential as a brain-based learning strategy for trainers and educators. Mapping can afford
great benefits to trainers and educators in development of classroom environments that
can be more supportive and inviting. The use of mapping can make learning more
effective, more efficient and more satisfying; as well as simplifying and organizing complex
content and connecting new ideas to old ones.
Trainers and educators use of mapping as a strategy will allow them to:
• Focus attention on key elements
• Help integrate prior knowledge with new knowledge
• Enhance conceptual development
• Enrich reading, writing, and thinking
• Aid writing by supporting planning and revising
• Promote focused discussion
• Assist instructional planning
• Serve as an assessment and evaluation tool
The growing emphasis on learning (Argyris, 1991,1993;Senge, 1990, 1992), in
corporations and the educational arena, will necessitate the incorporation of this research
104
into methods of training and into the design and development of learning organizations. In
the future, training will become devoted to teaching learners how to learn by using
specialized thinking strategies and learning techniques, such as Mind Mapping (Gross,
1992). The findings of this study show that brain-based strategies provide greater
achievement by using both hemispheres. For training departments, learning strategies, such
as Mind Mapping, can be a more successful method of instructing people how to
comprehend, store and utilize information.

APPENDIX A
ACHIEVEMENT ASSESSMENT TOOL
105
106
Digital Light Processing
Flat-panel video projectors are among the hottest audio-visual products on the market. The majority of these projectors use liquid-crystal display (LCD) imaging technology. The LCD panels absorb a lot of the projection lamp's light energy in their polarizing filters and individual pixels. This characteristic of liquid-crystal displays led to research in the early 1980s by scientists at Texas Instruments, the goal of which being to develop an alternative flat-panel display technology with improved light efficiency.
In 1987, TI's efforts paid off with the invention of Digital Light Processing, a system that used reflective light-not transmissive- to form images. DLP achieved higher levels of efficiency than those found in the LCD panels and had the bonus of being a digitally modulated imaging system. Eventually, this would make it possible to send video and computer images to a projector as digital data, not analog signals as are currently used. Such a digital projection system could be largely immune to noise and signal attenuation, as well as other artifacts often found in analog systems.
In an LCD projector, the individual pixels contain tiny crystals, which block more or less light, in response to changing voltage applied to their control transistors. The variation in light from one pixel to another creates a grayscale image, which is more apparent as the number of pixels increases. If the pixels can change state fast enough, it is possible to project video through these panels.
Unlike liquid crystal display panel projectors, whose transmissive operation resembles that of a slide projector, DLP forms images by reflecting light from a mirrored surface back through a projector's lens and on to the screen. The amount of light reflected from one mirror to the next also creates a grayscale image, which becomes more apparent as the number of mirrors increases. Again, if the mirrors can move quickly enough, video can be projected.
The gadget that makes this process possible is known as a Digital Micromirror Device (DMD). DMD's are actually small arrays of tiny mirrors, measuring only 16 micrometer square (16mm2) and resting on a static RAM chip. Each mirror can tilt a maximum of 10 degrees, responding to a "1" or "0' command from the RAM chip. A mirror fully tilted in the "1" position reflects the maximum amount of light, while the "0" position results in no reflection. Grayscale images are created only when each mirror cycles rapidly between the "1" and "0" states, using a process similar to digital pulse-width modulation.
This transition from "1" to "0" is extremely fast, taking less than 15 milliseconds. If an individual mirror spends more time in a "1" state than "0" within a given time interval, the reflected light from the mirror will appear darker. DMDs can easily move fast enough to reproduce video images, as well as high-resolution computer graphics and data. They are also pretty efficient, reflecting 60% of the light that strikes their surfaces.
Video Systems, May, 1998,
107
Digital Light Processing
Name_ Group. Date
Please read each question carefully, then write T (true) or F (false) on the line next to the question.
1. Liquid Crystal Display panels do not absorb a great deal of the projection
lamp's light energy in their polarizing filters and individual pixels.
2. Liquid Crystal Display (LCD) panels use reflective light to form images.
3. Analog systems are subject to noise, signal attenuation and other artifacts.
4. In an LCD projector, tiny transistors block more or less light.
5. Only the Digital Light Processing system can creat a grayscale image.
6. LCD panels transmissive operation forms images by reflecting light from
individual pixels that contain tiny crystals.
7- Analog signals make it possible to send video and computer images to a
projector.
8. Flat panel video projectors will soon come to the audio-visual market.
9. The mirrors in the Digital Micromirror Device are commanded by a RAM
chip.
10 . If a Digital Micromirror Device mirror is fully tilted in the "1" position it
results in no reflection.
11. The transition on a Digital Micromirror Device from "1" to "0" takes less than
10 milliseconds.
108
12 . Digital Micromirror Devices can reflect 30% of the light that strikes their
surfaces.
13 . Improved light efficiency was the impetus to develop Digital Light Processing.
14 . Digital Light Processing systems use transmissive light to form images.
15 . Each mirror in et Digital Micromirror Device can tilt a minimum of 10
degrees.
16 . The grayscale image is more apparent as the number of mirrors increases.
17 . Only Digital Light Processing systems can project video.
18 . In 1978, TI invented Digital Light Processing technology.
19 . The Digital Micromirror Device (DMD) is made up of small mirrors that
measure only 16 millimeters square.
20 . Most projectors now use the Digital Light Processing technology.
21 . If an individual mirror spends more time in a "1" state than "0"a given time
interval, the reflected light from the mirror will appear darker.
22 . Liquid Crystal Display panel projectors have operation that resembles that of a
slide projector.
23 . Digital Light Projectors have the bonus of being a digitally modulated imaging
system.
24 . Video and computer images can only be sent to a computer as digital data.
25 . Most flat-panel video projectors use liquid crystal displays.
26 . In an LCD projector, the changing voltage applied to their control transistors
determines how much light is blocked by the individual pixels.
109
27 . The Digital Micromirror Device makes the LCD panel a viable flat-panel
video projector.
28 . Digital Light Process forms images by reflecting light from a mirrored surface
back through a projector's lens and on to the screen.
29 . Currently, with the LCD projector, analog signals are used to send video and
computer images.
30 . In an LCD projector, the individual pixels contain tiny crystals.
APPENDIX A
EXAMPLES OF MIND MAPS OVER READING MATERIAL
110
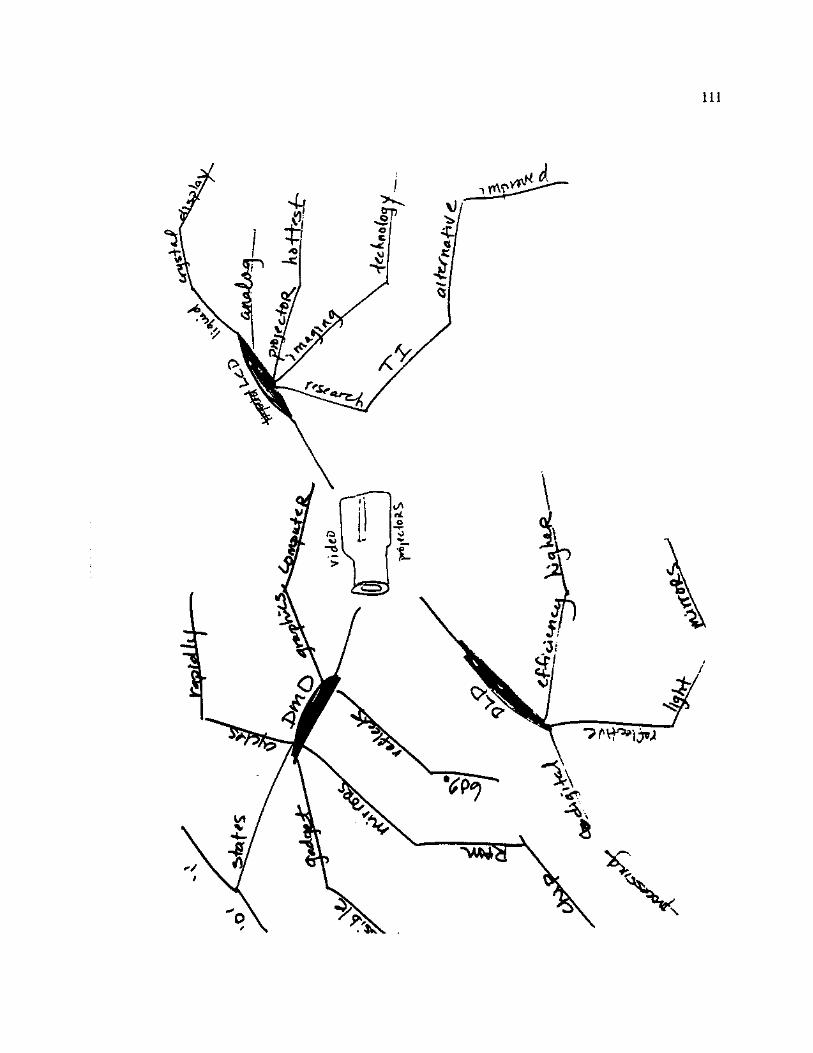
I l l
t
1
i
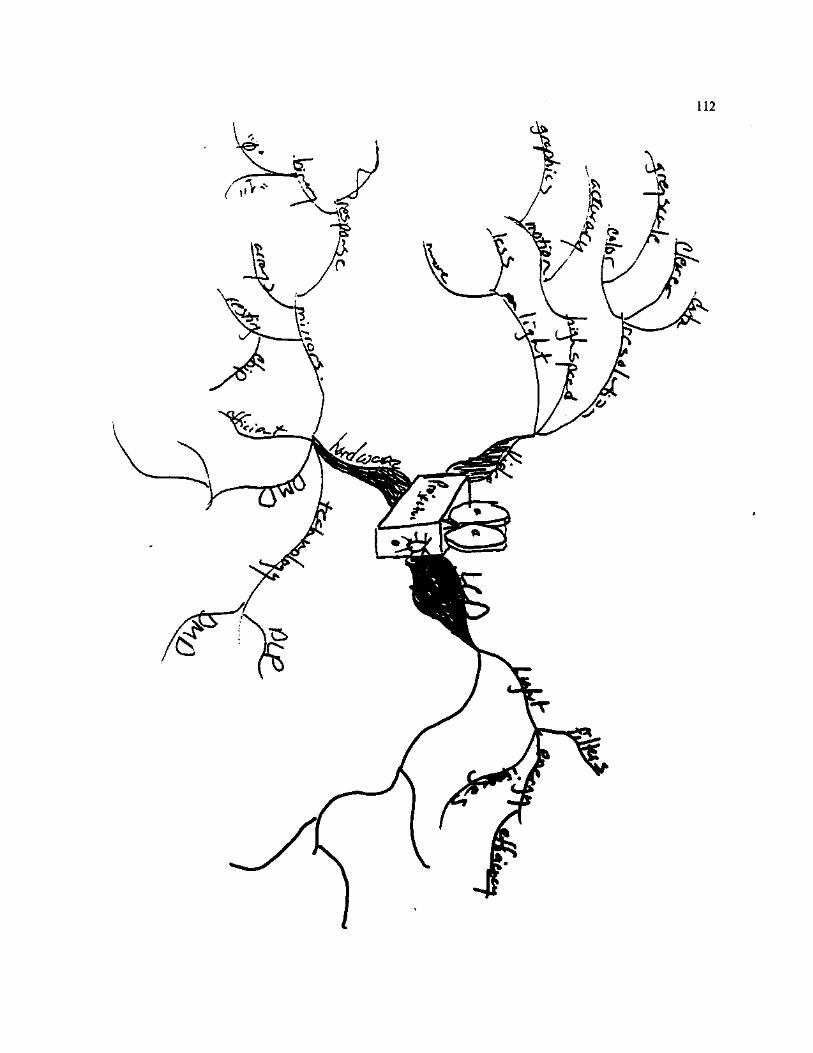
112
^ 3
A
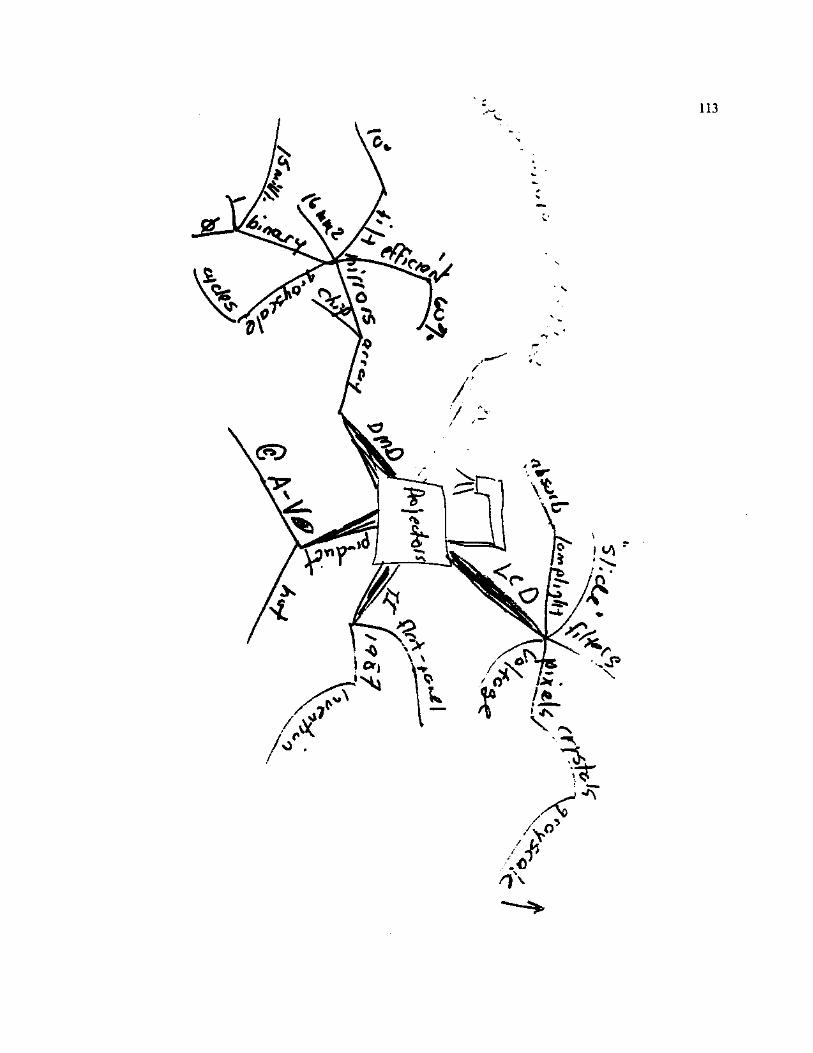
113
d\
/ 7 ? \ / o * i*.
APPENDIX A
EXAMPLES OF TRADITIONAL NOTE-TAKING OVER READING MATERIAL
114
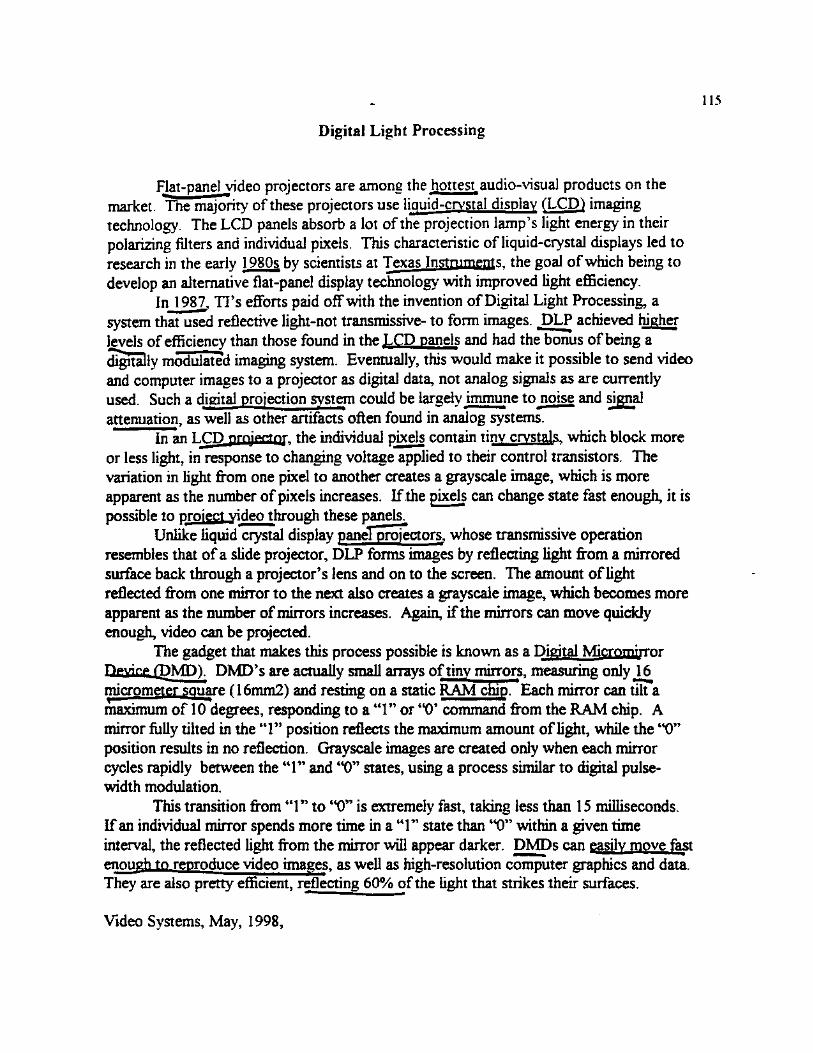
115
Digital Light Processing
Flat-panel video projectors are among the hottest audio-visual products on the market. The majority of these projectors use liquid-crystal display (LCD) imaging technology. The LCD panels absorb a lot of the projection lamp's light energy in their polarizing filters and individual pixels. This characteristic of liquid-crystal displays led to research in the early 1980s by scientists at Texas Instruments, the goal of which being to develop an alternative flat-panel display technology with improved light efficiency.
In 1987, TPs efforts paid off with the invention of Digital Light Processing, a system that used reflective light-not transmissive- to form images. DLP achieved higher levels of efficiency than those found in the LCD panels and had the bonus of being a digitally modulated imaging system. Eventually, this would make it possible to send video and computer images to a projector as digital data, not analog signals as are currently used. Such a digital projection system could be largely immune to noise and signal attenuation, as well as other artifacts often found in analog systems.
In an LCDjjifljfiCtQT, the individual pixels contain tinv crystals, which block more or less light, in response to changing voltage applied to their control transistors. The variation in light from one pixel to another creates a grayscale image, which is more apparent as the number of pixels increases. If the pixels can change state fast enough, it is possible to project video through these panels.
Unlike liquid crystal display panel projectors, whose transmissive operation resembles that of a slide projector, DLP forms images by reflecting light from a mirrored surface back through a projector's lens and on to the screen. The amount of light reflected from one mirror to the next also creates a grayscale image, which becomes more apparent as the number of mirrors increases. Again, if the mirrors can move quickly enough, video can be projected.
The gadget that makes this process possible is known as a Digital Micromirrnr TVvirp fnMTtt DMD's are actually small arrays of tiny mirrors, measuring only 16 micrometer square (16mm2) and resting on a static RAM chip Each mirror can tilt a maximum of 10 degrees, responding to a "1" or "0' command from the RAM chip. A mirror fully tilted in the "1" position reflects the maximum amount of light, while the "0" position results in no reflection. Grayscale images are created only when each mirror cycles rapidly between the "1" and "0" states, using a process similar to digital pulse-width modulation.
This transition from "1" to "0" is extremely fast, taking less than 15 milliseconds. If an individual mirror spends more time in a "1" state than "0" within a given time interval, the reflected light from the mirror will appear darker. DMDs can easily move fast enough to reproduce video images, as well as high-resolution computer graphics and data. They are also pretty efficient, reflecting 60% of the light that strikes their surfaces.
Video Systems, May, 1998,
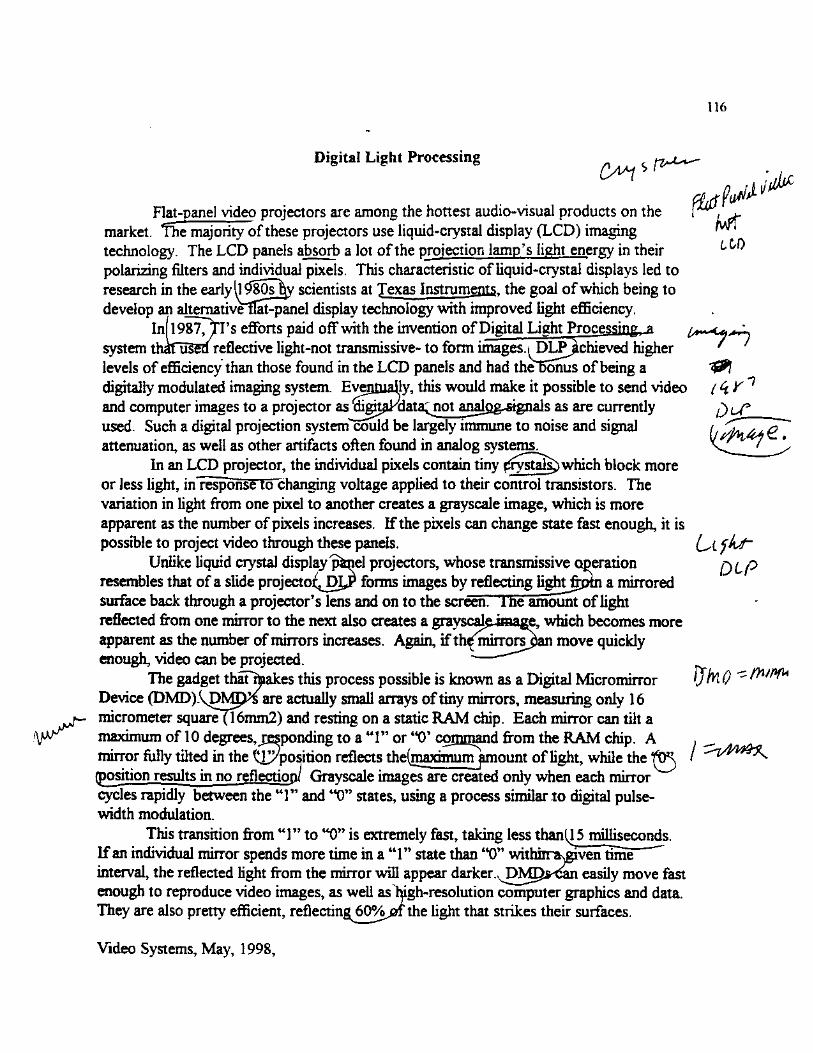
116
Digital Light Processing Ca^I
s '
Flat-panel video projectors are among the hottest audio-visual products on the Tho moinrinr r\f tliACA nrrtia/»tnrc tiCA lini Hicnl5»v fl imaoino fWl market. Hie majority of these projectors use liquid-crystal display (LCD) imaging
technology. The LCD panels absorb a lot of the projection lamp's light energy in their ^ ̂ polarizing filters and individual pixels. This characteristic of liquid-crystal displays led to research in the early il$80sfy scientists at Texas Instruments, the goal of which being to develop an alternativeflat-panel display technology with improved light efficiency.
In 1987/jTs efforts paid off with the invention of Digital Light Processing a system thafuSSa reflective light-not transmissive- to form images, i DLPjtchieved higher ' levels of efficiency than those found in the LCD panels and had theBonus of being a digitally modulated imaging system. Eventually, this would make it possible to send video (CiY1
and computer images to a projector as digit^Kdata^not analog-signals as are currently used. Such a digital projection system could be largely immune to noise and signal attenuation, as well as other artifacts often found in analog systems. ^
In an LCD projector, the individual pixels contain tiny ^rystal%) which block more or less light, in response to changing voltage applied to their control transistors. The variation in light from one pixel to another creates a grayscale image, which is more apparent as the number of pixels increases. If the pixels can change state fast enough, it is possible to project video through these panels. i
Unlike liquid crystal display pfcnel projectors, whose transmissive operation O L P resembles that of a slide projecto^DI^P forms images by reflecting Ughtfrpin a mirrored surface back through a projector's lens and on to the screen. The amount of light reflected from one mirror to the next also creates a grayscale-image, which becomes more apparent as the number of mirrors increases. Again, if th^miirorspan move quickly enough, video can be projected.
The gadget thaThjakes this process possible is known as a Digital Micromirror (/Mi? ' WW* Device (DMD).^DMp>s are actually small arrays of tiny mirrors, measuring only 16 micrometer square (16mm2) and resting on a static RAM chip. Each mirror can tilt a maximum of 10 degrees, jssponding to a "I" or "0' command from the RAM chip. A , ^ mirror fully tilted in the ^/position reflects the(maximum^mount of light, while the 0̂*̂ < (position results in no reflection/ Grayscale images are created only when each mirror cycles rapidly between the "1" and "0" states, using a process similar to digital pulse-width modulation.
This transition from "1" to "0" is extremely fast, taking less than(j 5 milliseconds. If an individual mirror spends more time in a "1" state than "0" withnraxgiven time interval, the reflected light from the mirror will appear darker.vDNfl^*<San easily move fast enough to reproduce video images, as well as high-resolution computer graphics and data. They are also pretty efficient, reflecting^ 60%^3i the light that strikes their surfaces.
Video Systems, May, 1998,
REFERENCES
Alesandrini, K. L. (1981). Pictorial-verbal and analytic - holistic learning
strategies in science learning. Journal of Educational psychology. 73. 358-368.
All, C., & Havens, R. L. (1997). Cognitive/concept mapping: a teaching
strategy for nursing. Journal of Advanced Nursing. 25 (6). 1210-1219.
Anderson, J. R. (1978). Arguments concerning representations for mental
imagery. Psychological Review. 85. 249-277.
Anderson, L. M. (1989). Learners and learning. In M. Reynolds (Ed.),
Knowledge base for beginning teachers. New York: Pergamon Press.
Anderson, T. H. & Armbruster, B. B. (1984). Studying. In P. D. Pearson (Ed.),
Handbook of reading research. New York: Longman.
Anderson, T. & Armbruster, B. (1980). The effect of mapping. Center for the
Study of Reading 5th ed. Urbana,IL: University of Illinois.
Argyris, C. (1991). Teaching smart people how to learn. Harvard Business
Review. 59. (3). 99-109.
Argyris, C. (1993). Knowledge for action: A guide to overcoming barriers to
organizational change. San Francisco: Jossey-Bass.
Armbruster, B. B., Anderson, T. H., and Meyer, J. L. (1991). Improving content
area reading using instructional graphics. Reading Research Quarterly. 26.394-414.
117
118
Arnaudin, M. W.; Mintzes, J. J.; Dunn, C. S.; & Shafer, T. S. (1984, November).
Concept mapping college science teaching. Journal of College Science Teaching..
Ault, C. R.. (1985, September/October). Concept mapping as a study strategy in
earth science. Journal of College Science Teaching. 38-44.
Austin, L. B. & Shore, B. M. (1994). The use of concept mapping as an
instructional strategy in college level physics. Scientia Paedagoeica Exoerimentalis
XXXI. 2, 249-264.
Ausubel, D. P. (1960). The use of advanced organizers in the learning and
retention of meaningful verbal material. Journal of Educational Psychology. 51.267-272.
Ausubel, D. P. (1963). The psychology of meaningful verbal learning. New
York: Grune and Stratton.
Ausubel, D. P. (1968). Educational Psychology: A cognitive view. Holt,
Rinehart and.: New York: Winston, Inc.
Barrett, S. L. (1992). It's all in vour head. Minneapolis, MN: Free Spirit
Publishing, Inc.
Barry, Ann Marie Seward. (1997). Visual intelligence. Perception imape and
manipulation in visual communication. : Albany, New York: State University of New
York Press.
Bartlett, F. C. (1932). Remembering. Cambridge, England: The Cambridge
University Press.
119
Bassi, L. J., Benson, G., & Cheney, S. (1996). Position yourself for the fiiture:
The top ten trends. American Society for Training and Development.
http://www.astd.org/virtual_community/find/
Belmont, J. M., Butterfield, E. C., & Borkowski, J. G. (1978). Training retarded
people to generalize memorization methods across memory tasks. In M. M. Gruneberg,
P. E. Morris, and R. N. Sykes, (Eds.), Practical Aspects of Memory. London: Academic
Press.
Bever, T. G. & Chiarello, R. J. Cerebral dominance in musicians and non-
musicians. Science. 185. 537-39.
Bogen, J. (1975). The other side of the brain: An appositional mind. Bulletin of
the Los Angeles Neurological Societies 34(2), 49-61.
Bradshaw, J., and Nettleton, N. (1983). Human cerebral asymmetry. Englewood
Cliffs, NJ; Prentice-Hall, Inc.
Bransford, J. D. & Vye, N. J. (1989). A perspective on cognitive research and its
implications for instruction. Toward the thinking curriculum: Current cognitive research.
Association of Supervision & Curriculum Development.
Broad, M. L. & Newstrom, J. W. (1992). Transfer of training. Reading, Mass:
Addison-Wesley Publishing Company, Inc.
Bromley, K. D. (1996). Webbing with literature: creatine storv maps with
children's books. Boston: Allyn and Bacon.
Brooks, J. G. (1990). Teachers and students: Constructivists forging new
connections. Educational Leadership. 47 (5). 68-71.
120
Brown, J. S. Collins, A., and Duguid, P. (1989). Situated cognition and the
culture of learning. Educational Research. 18.32-42.
Brown, A. L. (1978). Knowing when, where, and how to remember: A problem
of metacognition. In Glaser, R. (Ed.), Advances in instructional psychology (vol. I V
Hillsdale, NJ: Lawrence Erlbaum.
Brown, A. L., and Deloche, J. S. (1978). Skills, plans, and self-regulation. In
Siegler, R. S. (Ed.), Children's thinking: What develops? Hillsdale, NJ: Lawrence
Erlbaum & Assoc.
Brown, A. L, Bransford, J. D., Ferrara, R. A., and Campione, K. C. (1983).
Learning, remembering, and understanding. In Mussen, P. H. (Ed ), Handbook of child
psychology, volume 3: Cognitive development. Wiley.
Bruer, J. T. (1993, Summer). The mind's journey from novice to expert.
American Educator 17. 7-8.
Bruner, J. (1965). On knowing, essavs for the left hand. New York, Atheneum.
Buzan, T. (1984). Speed reading. E. P. Dutton,Inc.: New York.
Buzan, T. (1986). Use vour memory. BBC Publications: London.
Buzan, T. (1974, 1982,1989). Use both sides of vour brain. (3rd ed /> New York:
Penguin Books, USA, Inc.
Buzan, T. (1991, August). Mind mapping. Executive Excellence, p. 3.
Buzan, T. (1994) . The mind map book. New York: Penguin Group.
Caine, R. N. & Caine, G. (1990, October). Understanding a brain-based approach
to learning and teaching. Educational Leadership 66-70.
121
Caine, R. N. & Caine, G. (1991,1994). Making connections: Teaching and the
human brain. New York: Innovative Learning Publications, Addison-Wesley Publishing
Company.
Caine, R. N. & Caine, G. (1996, Fall). What "whole brain" means: Why
wholeness matters. MindShift connection. Vol 1. Number 1. Zephyr Press: Tucson, AZ.
Campbell, D. T. & Stanley, J. C. (1963). Experimental and quasi-experimental
designs for research. Chicago: Rand McNally & Company, pp. 53-55.
Campbell, L., Campbell, B., & Dickinson, D. (1996). Teaching and learning
through multiple intelligences. New York, NY: Simon & Schuster Co.
Carnine, D. (1990, January). New research on the brain: Implications for
instruction. Phi Delta Kappan.
Carnine, D. & Kinder, D. (1985). Teaching low-performing students to apply
generative and schema strategies to narrative and expository material. Remedial and
Special Education. 6 H I 20-30.
Chi, M. T. H., Feltovich, P. J., and Glaser, R. (1988). Self explanations: How
students study and use examples in learning to solve problems. Pittsburgh, Pa: Learning
Research and Development Center.
Cha, D. & Dwyer, F. M. (1991). Effect of visual and embedded rehearsal
strategies in facilitating student achievement of different educational objectives.
International Journal of Instructional Media Vol 18(4^
Clarke, J. H. (1990). Patterns of thinking Needham Heights Massarhn^g-
Allyn and Bacon.
122
Clarke, J. H. (1991). Using visual organizers to focus on thinking. Journal of
Reading. 34. 526-534.
Cohen, G. Hemispheric differences in serial versus parallel processing. Journal of
Experimental Psychology. 97. 349-56.
Cook, L. K., & Meyer, R. E. (1983). Reading strategy training for meaningful
learning from prose. In M. Pressley & J.R. Levin (Eds). Cognitive strategy research:
educational application. New York: Springer-Vertag.
Corkill, A. J. (1992). Advance organizers: Facilitators of recall. Educational
Psychology Review. 4. 33-67.
Costa, A. L., (Ed.) (1991). Developing Minds. (2nd ed.) Alexandria, VA:
Association for Supervision and Curriculum Development.
Dansereau, D. F. (1985). Learning strategy research. In S. F. Chipman. J. W.
Segal, & R. Glaser, (Eds.), Thinking and learning skills. Vol. 1. Hillsdale, NJ: Lawrence
Erlbaum & Assoc.
Dansereau, D. F. & Holley, C. D. (1984). Spatial learning strategies:
Techniques, applications, and related issues. Orlando, Fla.: Academic Press, Inc.
DeBono, E. (1994) de Bono's Thinking course. New York: Facts on File, Inc.
Diamond, M. C. (1996). The Brain: Use it or lose it. Mindshift connection. Vol
1, Number 1. Tucson, AZ: Zephyr Press.
Dimond, S. (1972). The double brain. London: Churchill Livingstone.
Dryden, G. & Vos, J. (1994). The learning revolution. Rolling Hills Estates,
CA.: Jalmar Press.
123
Dunn, R. & Dunn, K. (1978). Teaching students through their individual learning
styles: A practical approach. Reston, VA: Reston Publishing.
Dunn, R., Dunn, K., Price, G. (1982). Manual: Productivity environmental
preference survey. Lawrence, KS: Price Systems.
Dunn, R., Dunn, K., Price, G. (1985). Manual: Learning style inventory.
Lawrence, KS: Price Systems.
Dunston, P. J., (1992). A Critique of Graphic Organizer Research. Reading
Research and Instruction. 31(2V 57-65.
Dwyer, F. M. (1972). A guide for improving visualized instruction. State College,
PA: Learning Services.
Eberle, B.. (1982). Visual thinking. Buffalo. NY: D.O.K. Publishers, Inc.
Edelman, G. (1992). Bright air, brilliant fire. New York, NY: Basic Books.
Edwards, B. (1979) Drawing on the right side of the brain. Los Angeles: J. P.
Tarcher, Inc.
Edwards, J. & Fraser, K. (1983). Concept maps as reflectors of conceptual
understanding. Research in Science Education. 13, 19-26.
Ellis, H. D. & Shepherd, J. W. Recognition of upright and inverted faces
presented in the left and right visual fields. Cortex 11.3-7.
Flavell, J. H. (1979). Metacognition and cognitive monitoring: A new area of
cognitive-developmental inquiiy. American psychologist. 34 (10), 906-911.
Flavell, J. H. (1985). Cognitive development. Englewood Cliffs, NJ: Prentice-
Hall.
124
Flavell, J. H. & Wellman, H.M., (1977), Metamemory. In R. V. Kail, Jr., and J.W.
Hagen, (Eds ), Perspectives on the development of memory and cognition. Hillsdale, NJ:
Lawrence Erlbaum Associates.
Flood, J. & Lapp, D. (1988). Conceptual mapping strategies for understanding
information texts. The Reading Teacher. 41 (8), 780-783.
Fosnot, C. T. (1996). Constuctivism: theory, perspectives, and practice.
Teachers College Press: New York, NY.
Gagne, E. D. (1985). The cognitive psychology of school learning. Boston:
Little, Brown and Company.
Gagne, R. M. & Glaser, R. Foundations in Learning Research. Instructional
Technology: Foundations.
Gagne,E., Yekovich, C. W., and Yekovich, F. (1993). The cognitive psychology
of school learning. (2nd ed.Y New York: Harper-Collins.
Gambrell, L. B. & Bales, R. J. (1986). Mental imagery and comprehension-
monitoring performance of four-and fifth-grade poor readers. Reading Research
Quarterly. 21.454-464.
Gardner, H. (1985). The mind's new science: A history of the cognitive
revolution. New York: Basic Books, Inc., Publishers.
Gardner, H. (1991). The unschooled mind: How children think and how
schools should teach. New York: Basic Books.
Gardner, H. (1993). Multiple intelligences. New York: Basic Books.
125
Gardner, J. N. & Jewler, J. A. (1995). Your college experience: strategies for
success. Belmont, CA.: Wadsworth Publishing Co.
Gazziniga, M. (1992). Nature's mind. New York: Basic Books.
Glover, J. A., Bullock, R. G., and Dietzer, M. L. (1990). Advance organizers:
Delay hypothesis. Journal of Educational Psychology. 82.291-297.
Goodlad, John. (1983). A study of schooling: Some findings and hypotheses. Phi
Delta Kappan 64. March, 467.
Gregorc, A. F. (1979). Learning/teaching styles: Their nature and effects.
Student learning styles: diagnosing and prescribing programs. 19-26.
Gregory, R. L. (1970). The intelligent eve. New York: McGraw-Hill, Inc.
Grinder, M. (1989). Righting the educational conveyor belt. Portland, OR:
Metamorphous Press.
Gross, R. (1992). Lifelong learning in learning society of the twenty-first century.
In C. Collins & J. N. Mangieri, (Eds.) Teaching thinking: An agenda for the twentv-first
century. Hillsdale, New Jersey: Lawrence Erlbaum Associates, Publishers.
Haber, R. N. (1989,_May). How we remember what we see. Scientific America.
105.
Handy, C. (1989). The age of unreason. London: Hutchinson.
Hart, L. A. (1983). Human brain and human learning. New York: Longman Inc.
Healy, J. M. (1990). Endangered minds. New York: Touchstone.
Heimlich, J. E., & Pittelman, S. D. (1986). Semantic mapping: classroom
applications. Newark, DE: International Reading Association.
126
Heinze-Fry, J. A. & Novak, J. (1990). Concept mapping brings long-term
movement toward meaningful learning. Science Education. 74(4). 461-472.
Herrmann, N. (1996). The whole brain business book. New York: McGraw-
Hill.
Higgins, J. M. (1995, Nov. 10-16)A way to generate new ideas is through Mind
Mapping. Orlando Business Journal..
Hill, R. C. (1994, Fall). Concept mapping, graphic organizing and structuring:
Visual techniques for functional content-centered reading. Education. 115. Number 1.
Horton, P. B., McConney, A. A., Gallo, M., Woods, A. L., Senn, G. J. (1993,
January). An investigation of the effectiveness of concept mapping as an instructional
tool. Science education. Vol. 77.no. 1.
Howard, P. J. (1994). The owner's manual for the brain. Austin, TX: Leornian
Press.
Howe, M. J. A. & Godfrey, J. (1977). Student note-taking as an aid to learning.
Exeter, England: Exeter University Teaching Services.
Hudson Institute. (1987). Workforce 2000: Work and workers for the 21*
century. (Publication No. HI-3796 -RR). Washington, DC: Government Printing Office.
Hudson Institute. (1988). Civil service 2000 (Report prepared for the US Office
of Personnel Management, Career Entiy Group; Publication No. 88-712-P). Washington,
DC: Government Printing Office.
Hyerle,D. N. (1993). Thinking Maps as Tools for Multiple Modes of
Understanding. Unpublished doctoral dissertation, University of California at Berkeley.
127
Hyerle, D. N. (December 1995/January 1996). Thinking maps: seeing is
understanding. Educational Leadership. 85-89.
Hyerle, D. N. (1996). Visual tools for constructing knowledge. Alexandria, VA:
Association for Supervision and Curriculum Development.
Irvine, L. (1995). Can concept mapping be used to promote meaningful learning
in nursing education? Journal of Advanced Nursing. 21. 1175-1179.
Jay, J. A (1994). A study of concept mapping in a college-level cell biology
course. (Doctoral dissertation, University of Missouri, 1994). Dissertation Abstracts
International, 55/12, 3760.
Jegede, O. J., Alaiyemola, F. F., & Okebukola, P. A. O. (1990). The effect of
concept mapping on students' anxiety and achievement in biology. Journal of Research in
Science teaching. 27(101 951-960.
Jensen, E (1994). The learning brain. San Diego. CA: Turning Point Publishing.
Jensen, E. (1995). How to teach mind-mapping more effectively. Del Mar, CA:
Turning Point Publishing.
Jensen, E. (1996). Brain-based learning. Del Mar, CA: Turning Point
Publishing.
Jonassen, D. H. (1984). Developing a learning strategy using pattern notes: A
new technology. Programmed Learning and Educational Technology 21 (3Y 163-175.
Jonassen, D. H. (1987). Assessing cognitive structure: Verifying a method using
pattern notes. Journal of Research and Development in Education. 20(3 V 1-14.
128
Jonassen, D.H., Beissner, K., & Yacci, M. (1993). Structural Knowledge.
Hillsdale, NJ: Lawrence Erlbaum Associates, Publishers.
Jung, C. (1923). Psychological types. New York: Harcourt Brace.
Kandel, E. R., Hawkins, R. D. (1992, September). The biological basis of
learning and individuality. Scientific American. 79-86.
Keefe, J. W. (1979). Learning style: An overview. In NASSP's Student learning
styles: Diagnosing and prescribing programs. 1-17). Reston, VA: National Association of
Secondary School Principals.
Keefe, J. W. (1989). Learning stvle profile handbook. Accommodating perceptual,
study and instructional preferences. Vol. II. Reston, VA: National Association of
Secondary School Principals.
Keng, Hsiao-Tseng. (1996). A comparative study of note-taking, outlining and
concept mapping learning strategies of national Taipei teachers college students'
understanding of heat and temperature. (Doctoral dissertation, University of Iowa, 1996),
Dissertation Abstracts International, 57/05, AAC 9639675.
Kiewra, K. A. (1991). Aids to lecture learning. Educational Psychologist. 26.37-
53.
Kiewra, K. A., DuBois, N. F., Christian, D., Roskelley, D. (1991). Note-taking
functions and techniques. Journal of Education Psychology. 83.240-245.
Kiewra, K. A., Fletcher, H. J. (1984). The relationship between levels of
notetaking and achievement. Human Learning, 3.273-280.
129
Kimura, D. (1992, September). Sex differences in the brain. Scientific American.
119-25.
Kirk,R. K. (1995). Experimental design: procedures for the behavioral sciences.
Pacific Grove, CA: Brooks/Cole Publishing Co.
Knowles, M. (1984). Andragogv in action. San Francisco: Jossey-Bass.
Kolb, D. A. (1976, 1981, 1985). Learning styles inventory. In A. Chickering,
(Ed.). The Modern American College. San Francisco: Jossey-Bass.
Kolb, D. A. (1984). Experiential learning. Experience as the source of learning and
development. Englewood Cliffs, NJ: Prentice-Hall.
Kosslyn, S. M. (1980). Image and mind. Cambridge, MA: Harvard University
Press.
Kosslyn, S. M. (1981). The medium is the message of mental imagery.
Psychological Review. 88.46-66.
Kuhara-Kojima, K., and Hatano, G. (1991). Contribution of content knowledge
and learning ability to the learning of facts. Journal of Educational Psychology. 83(2),
253-263.
Kulik, C. L., Kulik, J., & Schwalb, B. J. (1983). College programs for high-risk
and disadvantaged students: A meta-analysis of findings. Review of Educational
Research. 53.397-414.
Langer, E. J. (1997). The power of mindful learning. Reading, Massachusetts:
Addison-Wesiey Publishing Company, Inc.
130
Leinhardt, G. (1992). What research on learning tells us about teaching.
Educational Leadership. 49 (7), 20-25.
Lesgold, A. M., McCormick, C., & GoinkofF, R. M. (1975). Imagery training and
children's prose learning. Journal of Educational Psychology. 67. 663-667.
Levy, J. (1985, May). Right brain, left brain: fact and fiction. Psychology
Today. 38.
Lewis, C. (1997, November). Mind mapping-Its benefit for trainers. Training
Officer. 33, (9), 278-279.
Lieberman, M., and Langer, E. (1995). Mindfulness and the process of learning,
In P. Antonacci, (Ed.), Learning and Context. Cresskill, NJ: Hampton Press.
Locke, E. A. (1977). An empirical study of lecture notetaking among college
students. Journal of Educational Research. 77.93-99.
Loverock, D. S. & Modigliani, V. (1995). Visual imagery and the brain: A
review. Journal of Mental Imagery. 91-131.
MacClean, P. D. (1978). A mind of three minds: educating the triune brain. In J.
Chall, & A. Mirsky, (Eds.), Education and the brain. Chicago: University of Chicago
Press.
Malloy, T. E. (1987, March). Teaching integrative thought. Techniques and data.
Margulies, N. (1991). Learning and Teaching Mind Mapping. Tucson. AZ:
Zephyr Press.
131
Markman, E. M. (1979). Realizing you don't have to understand: elementary
school children's awareness of inconsistencies. Child Development. 50. 643-655.
Markman, E. M, (1985). Comprehension monitoring: developmental and
education issues, In S. F. Chipman, J.W. Segal, and R. Glaser, (Eds ), Thinking and
Learning Skills, volume 2: Research and Open Questions. Hillsdale. NJ: Lawrence
Erlbaum & Associates.
McCagg, E. & Dansereau, D. (1991). A convergent paradigm for examining
knowledge mapping as a learning strategy. Journal of Educational Research. 84.317-
324.
McCarthy, B. (1980.1987). The 4MAT System: Teaching to Learning Styles
with Right/Left Mode Techniques (Rev. ed.Y Illinois: EXCEL.
McCarthy, B. (1990). Using the 4MAT System to bring learning styles to schools.
Educational Leadership: Journal of the Department of Supervision and Curriculum
Development. N.E.A. 48(21 p. 31
McCarthy, B. & St. Germain, C. (1997). The 4MAT research guide. Banington,
111: Excel, Inc.
McKeachie, W. (1984). Spacial strategies: Critique and educational implications.
In Holley, C. F. & Dansereau, D. F. (Eds.), Spacial learning strategies: techniques
applications and related issues. Orlando, FL: Academic Press.
Mehegan, R S. (1996). Mind Mapping as an adult learning notetaking strategy to
increase the encoding of information in a corporate training course (Doctoral
132
dissertation, Florida International University, 1996). Dissertation Abstracts International,
57/12-A, 5019.
Metcalfe, J. & Shimamura, A. (1996). On knowing what we know: review of
metacognition. Journal of Psvchophvsiologv. 10( 4V Seattle: Hogrefe & Huber
Publishers.
MicroCAT (tm) Testing System, Copyright (c) 1982, 1984, 1986, 1988, 1992 by
Assessment Systems Corporation, Rasch Model Item Calibration Program - RASCAL
(tm) Version 3.50
Mikulecky, L., Clark, E. S., & Adams, S. M. (1988). Teaching concept mapping
and university level study strategies using computers. Journal of Reading. 32(81 694-701.
Moore, D. W., & Readance, J. E. (1984). A quantitative and qualitative review of
graphic organizer research. Journal of Educational Research. 78.11-17.
Naisbitt, J. & Aburdene, P. (1990). Megatrends 2000. William Morrow and
Company, Inc. New York.
National Commission on Public Service. (1990). Leadership for America:
Rebuilding the public service. Lexington, MA: Lexington Books.
Nolan, J. & Francis, P. (1992). Changing perspectives in curriculum and
instruction. In C. CHickman. (Ed A Supervision in transition.. Alexandria, Va.:
Association of Supervision and Curriculum Development, 47-46.
Novak, J. (1990).Concept maps and vee diagrams: two metacognitive tools to
facilitate meaningful learning. Instructional Science. 19.25-52.
133
Novak, J. (1991). Clarify with concept maps. The Science Teacher. 58 (7). 45-
49.
Novak, J. (1993). How do we learn our lesson? The Science Teacher. 60 (3)..
50-55.
Novak, J. D. & Gowin, B. D. (1984). Learning how to learn. New York:
Cambridge University Press.
Novak, J. D., Gown, D. B. & Johansen, G. T. (1983). The use of concept
mapping and vee mapping with junior high school science students. Science Education.
67, 625-645.
Okebukola, P. A. (1990). Attaining meaningful learning of concepts in genetics
and ecology: An examination of the potency of the concept mapping technique. Journal
of Research in Science Teaching. 27. 5,493-504.
O'Keefe, J. & Nadel, L. (1978). The hippocampus as a cognitive map. Oxford:
Claredon Press.
OTSfeil, H. F., Jr. (1978). Learning Strategies. New York: Academic Press.
Ornstein, R. (1997). The right mind. New York: Harcourt Brace & Company.
Ornstein, R. & Thompson, R. (1984). The Amazing Brain. Boston: Houghton
Mifflin Company.
Piaget, J. (1976). The psychology of intelligence. Lanham,MD: Rowman&
Littlefield.
Paivio, A. (1971). Imagery and verbal processes. New York: Holt.
134
Paivio, A. (1979). Imagery and verbal processes. Hillsdale, NJ: Lawrence
Erlbaum Associates.
Paivio, A. (1986). Mental Representations: A Dual Coding Approach. New
York: Oxford University Press.
Paris, S. G., Newman, R. S. & McVey, K. A. (1982). Learning the functional
significance of mneumonic actions: A microgenic study of strategy acquisition. Journal nf
Experimental Child Psychology. 34. 490-509.
Pask, G. (1988). Learning strategies, teaching strategies, and conceptual or
learning style. R. R. Schmeck, (Ed.), Learning strategies and learning styles. New York,
Plenum Press.
Perkins, D. N., Simmons, R, and Tishman, S. (1990). Teaching cognitive and
metacognitive strategies. Special Issue: Cognitive perspectives on higher order
knowledge. Journal of Structural Learning. 10f4V 285- 343.
Penin, J. (1981). Primary version: Learning style inventory. Jamaica, NY:
Learning Style Network, St. John's University.
Pinto, A. J. & Zeitz, H. J. (1997). Concept mapping: a strategy for promoting
meaningful learning in medical education. Medical Teacher. Vol 19 No. 2.
Posner, M. I. & Rachle, M. E. (1994). Images of mind. New York: Scientific
American Library.
Pratt, D. (1994). Curriculum planning: A handbook for professionals Orlando
Fla. Harcourt Brace College Publishers..
135
Pressley, M. (1990). Self-regulated learning: monitoring learning from text. Special
Issue: Self regulated learning and academic achievement. Educational Psychologist.
25(1), 19-33.
Pressley, M., and Harris, K. R., and Marks, M. B. (1992). But good strategy
instructors are constructivists! Educational Psychology Review. 4. 3-31.
Pressley, M.& Levin, J. R. (1983). Cognitive strategy research : educational
applications. New York: Springer-Verlag.
Pressley, M., Woloshyn, V. & Associates. (1995). Cognitive strategy instruction
that really improves children's academic performance. Cambridge, MASS: Brookline
Books.
Purves, D., Augustine, G. J., Fitzpatick, D., Katz, L.C., LaMantia, A., McNamara,
J. O., eds. (1997). Neuroscience. Sunderland. MA: Sinauer Associates, Inc.
Pylyshyn, Z. (1973). What the mind's eye tells the mind's brain. Psychological
Bulletin. 80. 1-24.
Pylyshyn, Z. (1981). The imagery debate: Analogue media versus tacit
knowledge. Psychological Review. 88. 16-45.
Raichle, M. E. (1994, April) . Visualizing the mind. Scientific American. 58-64.
Reichmann, S. W., & Grasha, A. F. (1974). A rational approach to developing and
assessing the construct validity of a student learning style scale instrument. Journal of
Psychology. 87.213-223.
136
Resnick, L. B. & Klopfer, L. E. (1989). Toward the thinking curriculum: current
cognitive research. Alexandria, VA: Association for Supervision and Curriculum
Development.
Restak,R. M. (1984). The brain. New York: Bantam Books.
Richards, R. G. (1993). Leam: Playful techniques to accelerate learning. Tucson,
AZ: Zephyr Press.
Rico, G. L. (1983). Writing the natural wav. New York: G. P. Putnam's Sons.
Rigney, J.W. & Lutz, K. (1976). Effect of graphic analogies of concepts in
chemistiy on learning and attitude. Journal of Educational Psychology. 68.305-311.
Rooda, L. A. (1994, November/December). Effects of mind mapping on student
achievement in a nursing research course. Nurse Educator. Vol. 19 (6).
Rose, C. & Nicholl, M. (1997). Accelerated learning for the 21st century. New
York: Delacorte Press.
Rumelhart, D. E. (1980). Schemata: The building blocks of cognition. In R. J.
Spiro, B. C. Bruce, & W. F. Brewer, (Eds.), Theoretical issues in reading
comprehension. 33-58. Hillsdale, NJ: Erlbaum.
Russell, Peter. (1979). The brain book. New York: Penguin Books, USA.
Saleh, A. I. (1998). The nexus of brain hemisphericitv. personality types,
temperaments, learning styles, learning strategies, gender, majors, and cultures. (Doctoral
dissertation, University of Alabama, 1998). Dissertation Abstracts International, 58/08,
3004.
137
Schmeck, Ronald R. (Ed.), (1988). Learning Strategies and Learning Styles. New
York: Plenum Press.
Schmeck, Ronald R. (1988). Individual differences and learning strategies. 171—
191. In Weinstein, et al. (Eds.), Learning and Study Strategies. San Diego, CA:
Academic Press.
Schon, D. A. & Argyris, C. (1992). Theory in practice: increasing professional
effectiveness. San Francisco: Jossey-Bass Publishers.
Schraw, G. (1994). Does a general monitoring skill exist? Journal of Educational
Psychology. 87(31 433- 444.
Schraw, G. (1995). The effect of metacognitive knowledge on local and global
monitoring. Contemporary Educational Psychology. 19(21 143-154.
Segal, J. W, Chipman, S. F. & Glaser, R. (Eds.), (1985). Thinking and learning
skills. Vol. 1., Lawrence Erlbaum Associates, Publishers, Hillsdale, NJ.
Senge, P.M. (1990). The leader's new work: Building learning organizations.
Sloan Management Review. 32(1). 7-24.
Senge, P.M. (1992). Mental models. Planning Review. 20(2V 4-10.44.
Senge, P. (1994). The fifth discipline. The art and practice of the learning
organization. New York: Doubleday.
Senge, P. (1994). The fifth discipline fieldbook. New York: Doubleday.
Shepard, R. (1978). The mental image. American Psvchologist.33. 125-137.
Shepard, R., & Cooper, L. A. (1982). Mental images and their transformations.
Cambridge, MA: MIT Press.
138
Siegfried, T, (1998, January 16). What memories are made of. The Dallas
Morning News. 6D-8D.
Slavin, R. (1994). Educational psychology theory and practice. Boston: Allyn
and Bacon.
Sless, David. (1981). Learning and visual communication. London: Croom
Helm Ltd.
Smith, B. D. (1991). Mapping. In M. Paluch, (Ed.), Bridging the gap. 183-184.
New York: Harper Collins College Publishers.
Smith, K. M. & Dwyer, F. M. (1995). The effect of concept mapping strategies in
facilitating student achievement. International Journal of Instructional Media, 22 (1).
Springer, S. P. & Deutsch, G. (1989). Left brain, right brain. (3rd Ed.), New
York: W. H. Freeman.
Sperry, R. (1968). Hemisphere disconnection and unity in conscious awareness.
American Psychologist, 23,723-33.
Sousa, D. A. (1995). How the brain learns. Reston, VA: National Association
of Secondary School Principals.
St. Germain, C., Leiberman, M., & Cohen, M. (1988). Reliability and validity
study of the Learning Type Measure (LTMV Barrington, IL: Excel, Inc.
St. Germain, C., Leiberman, M., & Mathiesen, B. (1987). Replicated validity
study of the Learning Type Measure fLTMY Barrington, IL: Excel, Inc.
139
Stewart, J. (1979). Content and cognitive structure: Critique of assessment and
representation technique used by science education researchers. Science Education. 63.
395-405.
Sylwester, R. (1990, October) . Expanding the range, dividing the task:
educating the human brain in an electronic society. Educational Leadership. 71-78.
Sylwester, R. (1994, January). What the biology of the brain tells us about
learning. Educational Leadership. 46-50.
Sylwester, R. (1995). A celebration of neurons: an educator's guide to the
human brain. Alexandria, VA: Association for Supervision and Curriculum Development.
Thorndike, E. L. (1913). Educational psychology. New York: Teachers College
Press.
Torrance, P. E., et al., (1977, Winter). Your style of learning and thinking, The
Gifted Child Quarterly. Vol. XXL No.4.
Torrance, P. and Ball, O. (1978). Intensive approach alters learning styles in
gifted. Journal of Creative Behavior 1(81 52.
Trautman, P. (1979). An investigation of the relationship between selected
instructional techniques and identified cognitive style. (Doctoral dissertation, St. John's
University, 1979). Dissertation Abstracts International,.
Tulving, E. (1972). Episodic and semantic memory. In E. Tulving & W.
Donaldson (Eds.). Organization of memory. New York: Academic Press.
140
Van Patten, J., Chao, C. & Reigeluth, C.M. (1986). A review of strategies for
sequencing and synthesizing instruction. Review of Educational Research. 56(41 437-
471.
Vygotsky, L. S. (1962). Thought and language. Cambridge, MA: MIT press.
Weinstein, C. E., Goetz, E. T., Alexander, P. A. (Eds.) (1988). Learning and
Study Strategies. Academic Press, Inc. San Diego, Ca.
Weinstein, C. E. & Underwood, V. L. (1985). Learning strategies: The how of
learning. 241-258. In J. W. Segal, S. F. Chipman, R. Glaser, (Eds.), Thinking and
Learning Skills. 1. Hillsdale, NJ: Lawrence Erlbaum Associates, Publishers.
Willerman, M. & MacHarg, R. A. (1991)The concept map as an advance
organizer. Journal of Research in Science Teaching 28(8Y 705-711
Williams, L. V. (1983). Teaching for the two-sided mind. New York: Simon &
Schuster, Inc.
Willing, K. (1989). Teaching how to learn. Macquarie University Sydney:
National Centre for English Language Teaching and Research.
Witkin, H. A., Moore, C. A., Goodenough, D. R , & Cox, P. W. (1977). Field-
dependent and field-independent cognitive styles and their educational implications.
Review of Educational Research. 1. 64.
Wittrock, M. C., (Ed.) (1977). The human brain. Englewood Cliffs, NJ:
Prentice-Hall.
Wolf, D. (1979). Early svmbolization. San Francisco: Jossey-Bass Inc.,
Publishers.
141
Wycoff, J. (1995). Transformation Thinking New York: The Berkley
Publishing Group.
Yeap, L. L. (1989). Hemisphericity and student achievement. International
Journal of Neuroscience. 48. 225-32.
Zemke, R. (1998, May). In search of self-directed learners. Traininp 60-68.