Embed Size (px)
Citation preview
September 26, 2007 (revision in progress)
The Effects and Unintended Consequences of the Sarbanes-Oxley Act on the Supply and Demand for Directors∗
James S. Lincka, Jeffry M. Nettera, Tina Yangb
aTerry College of Business, University of Georgia,
Athens, GA 30602-6253 [email protected], ph: 706-542-3646 [email protected], ph: 706-542-3654
bCollege of Business and Behavior Science, Clemson University
Clemson, SC 29634 [email protected], ph: 864-656-2249
∗ This paper was previously circulated under the title “Effects and Unintended Consequences of the Sarbanes-Oxley Act on Corporate Boards.” We would like to thank Denny Beresford, Kathleen Hanley, Jarrad Harford, Jeffrey Lipshaw, Harold Mulherin, Andy Prevost, John Robinson, Roberta Romano, and seminar participants at Florida State University, the University of Georgia, Ohio University, the 2006 AFA meetings, the 2006 Corporate Finance Conference at Washington University-St. Louis, and the 2005 FMA meetings for helpful comments.
September 26, 2007 (revision in progress)
The Effects and Unintended Consequences of the Sarbanes-Oxley Act on the Supply and Demand for Directors
Abstract:
We provide the first comprehensive study on the impact of the Sarbanes-Oxley Act (SOX) on the
supply and demand of directors using broad sample evidence from more than 8,000 public companies as well as detailed analysis of smaller subsamples. Post-SOX boards are larger and more independent. Director workload and risk increased: audit committees meet more than twice as often post SOX as they did pre SOX, and Director and Officer (D&O) insurance premiums more than doubled. The corporate director pool also changed post SOX: more post-SOX directors are lawyers/consultants, financial experts and retired executives and fewer are current executives. These changes drove a large increase in the cost of the board, particularly for small firms. For example, small firms paid $3.19 in director fees per $1,000 of net sales in 2004, which is $0.84 more than they paid in 2001 and $1.21 more than in 1998. In contrast, large firms paid $0.32 in director fees per $1,000 of net sales in 2004, seven cents more than they paid in 2001 and ten cents more than in 1998. Overall, our evidence suggests that SOX, as well as activities leading and pursuant to SOX, had a dramatic impact on corporate boards and the cost thereof.
Keywords: board independence, board size, board leadership, board structure, board reform, corporate governance, director compensation, director liability, the Sarbanes-Oxley Act, regulation JEL Classifications: D23, G32, G34, G38, K22, M14
1
“In response to a loss of confidence among American investors reminiscent of the Great Depression,
President George W. Bush signed the Sarbanes-Oxley Act into law on July 30, 2002.” Welytok Sarbanes-
Oxley for Dummies (2006, p. 9)
The Sarbanes-Oxley Act (SOX) became law on July 30, 2002. Pursuant to the Act, the Securities
and Exchange Commission (the SEC) adopted rules that directed self-regulatory organizations (SRO)
including the NYSE and the NASDAQ to prohibit the listing of any firm that is not in compliance with
these rules.1 Enacted as emergency legislation amid high-profile corporate scandals, SOX represents “the
most important securities legislation since the original federal securities laws of the 1930s” (then SEC
Chairman William H. Donaldson, September 17, 2003).
We propose that the governance changes mandated by SOX and other activities of this era
affected the supply and demand for directors.2 Specifically, demand increased due to various mandates on
board composition and workload, while the supply of directors decreased due to the increased workload
and risks of being a director. While we can not directly trace out the shifts of the curves, we examine the
magnitude of the changes caused by these demand and supply shifts on the number and pay of directors
(price and quantity). Both demand and supply shifts would increase the price of directors (pay). While the
shifts have opposite effects on quantity, some of SOX’s requirements often necessitate that the quantity of
directors increase; thus, we expect that the demand effect will dominate. Further, we examine factors
related to the changes in supply and demand for directors including changes in the workload of directors,
the structure of corporate boards, the liability risk faced by directors, and the composition of the director
pool. While it is beyond the scope of this paper to examine the overall costs/benefits of the legislation, we
do briefly review that literature.
1 See Securities Act Rel. 8220 (April 9, 2003). 2 SOX mandates specific requirements on board structure, and also required the SEC to direct the exchanges to prohibit listing of any company that is not in compliance with its provisions – the resulting exchange rules are generally more stringent than those specifically spelled out in SOX. For expositional convenience, and because they were directed to do so by SOX, we generally refer to these rules as mandates of SOX rather than SOX and the exchanges.
2
We construct several different samples for our empirical analysis to provide sufficient breadth
and depth to identify important time series and cross-sectional impacts. For example, we study the boards
of more than 8,000 firms from 1989 to 2005, providing broad-sample evidence on the impact of SOX. We
complement our broad-sample evidence with more detailed analysis of smaller subsamples. The breadth
and depth of our sample allows for a comprehensive analysis of board-related costs, and the extent to
which the burden of these regulatory mandates is uniform across firms.
Our results suggest that SOX dramatically affected corporate boards, their activities, and their
costs. Median pay per director rose by more than $36,000 from 2001 to 2004, an increase of almost 68%.
By comparison, CEO pay increased by just 17% over the same time period. The per director pay increase,
coupled with the fact that firms also have more outside directors drove a substantial increase in total
director fess paid by firms. Our results also suggest that changes in director pay fall disproportionately on
smaller firms, a fact that was exacerbated by SOX given the dramatic post-SOX rise in director
compensation. For example, small firms paid $3.19 in director fees per $1,000 of net sales in 2004, which
is $0.84 more than they paid in 2001 and $1.21 more than in 1998. In contrast, large firms paid $0.32 in
director fees per $1,000 of net sales in 2004, seven cents more than they paid in 2001 and ten cents more
than in 1998. Further, the proportion of equity to cash pay rose significantly post SOX.
Our evidence is also consistent with the notion that director workload and risk have significantly
increased post SOX. On average, audit committees meet more than twice as often post SOX as they did
pre SOX, and some firms started to pay audit chair and committee members extra for their services post
SOX. Further, we find that Director and Officer (D&O) insurance premiums increased substantially post
SOX. For example, for a small sample of firms that provide the necessary disclosures – in the U.S., D&O
insurance disclosures are only required for firms incorporated in New York – median D&O insurance
premiums increased by more than 150% from 2001 to 2004.
Board structure changed dramatically after SOX, and the extent of these changes varies with firm
characteristics. Post-SOX boards are larger and more independent. The larger boards suggests that firms
were more likely to add outside directors than remove inside directors to meet independence
3
requirements, consistent with the notion that the board’s overall workload increased or that insiders serve
specific needs. In addition, more firms separate the two posts of CEO and Chairman of the Board (COB)
post SOX, particularly for smaller firms. Not surprisingly, firms with less independent boards pre SOX
increase board independence more than firms that had more independent boards pre SOX.
The makeup of the director pool changed substantially post SOX. Sitting executives make up a
significantly smaller fraction of the director pool, while retired executives, professional directors, those
with financial expertise, and lawyers make up a larger portion. Director turnover increased substantially,
particularly for audit committee members. Not surprisingly, firms were less likely to add employee and
grey directors post SOX.
While our study examines the specific impacts of SOX on directors and boards, we recognize that
these changes are more broadly the result of a changed landscape for corporate governance. During the
time when SOX was deliberated and passed, other significant events were occurring, such as the large
drop in stock prices, the start of an economic recession, and a series of corporate scandals. These events
influenced the corporate governance landscape, and led to SOX and pursuant rule changes on the NYSE
and NASDAQ. However, we also believe SOX signifies a turning point, and our results are consistent
with the conjecture that firms are making substantial adjustments directly in response to SOX.
Given that we focus on the structure, activities and costs of boards, and do not measure the
benefits, we cannot draw general conclusions about whether these changes, on net, led to better or worse
boards overall. However, other studies have attempted to measure whether SOX’s overall impact was a
net positive or negative. While the results have been mixed, Wintoki (2007) suggests that small firms
were adversely affected by SOX. In general, some firms may be better served by a board that looks
different than the one essentially mandated by SOX. In those situations, firms are forced away from their
optimal board structure, and may suffer, on net, from that aspect of SOX.
The rest of the paper is organized as follows. We provide an overview of SOX, review the
literature, and develop the hypotheses in Section 1. Section 2 describes our data. In Section 3, we examine
director compensation and factors affecting the supply and demand for directors. We examine the impact
4
of SOX on board structure in Section 4 and on the director pool in Section 5. We summarize and conclude
in Section 6.
1. Overview of SOX, related literature, and research questions
Some legal scholars argue that, reacting to a financial crisis, Congress adopted the Sarbanes-
Oxley Act very quickly, and without much consideration (Bebchuk and Hamdani, 2006; Romano, 2005)
Romano (2005) also notes that SOX represents a fundamental change in the law and the mode of
regulation. It moves federal regulation into mandates for corporate governance, rather than the traditional
disclosure requirements. The SEC moves into areas that had been exclusively regulated by the states.
Romano goes on to describe the congressional activity in great detail, but suggests the Act is made up of
“proposals of policy entrepreneurs with neither careful consideration nor assimilation of the literature at
odds with the policy prescriptions” (Romano (2005, p. 1602)). Our focus is to analyze the effects of SOX
on corporate boards and directors, thereby contributing to the on-going debate of the effect and potential
refinement of this legislation3. Next, we review SOX provisions, highlighting those that are most relevant
for this paper, layout our research questions, and summarize related literature.
1.1 The Sarbanes-Oxley Act and board-related rule requirements
SOX was intended to be a comprehensive solution to the type of corporate malfeasance that led to
the spectacular downfalls of firms such as Enron and WorldCom. SOX has five main objectives: 1) to
strengthen the independence of auditing firms, 2) to improve the quality and transparency of financial
statements and corporate disclosure, 3) to enhance corporate governance, 4) to improve the objectivity of
research, and 5) to strengthen the enforcement of the federal securities laws.4 The emerging research on
SOX has provided some evidence on whether SOX has successfully achieved its first two objectives. Our
paper primarily addresses the third objective, to enhance corporate governance, by examining the impact
on corporate boards. 3 For example, "The Committee on Capital Markets Regulation" was created on September 12, 2006. It calls for cost-benefit analysis of SOX and has made recommendations to relax some of the SOX requirements. 4 The Practitioner’s Guide to the Sarbanes-Oxley Act, Volume 1, The American Bar Association, 2004.
5
One of SOX’s objectives is to enhance corporate governance by promoting board independence
and imposing new obligations and responsibilities on the audit committee. Pursuant to the Act, the NYSE
and the NASDAQ adopted new listing requirements. The major governance provisions include:5
• The board of directors of each NYSE and NASDAQ listed firm must have a majority of independent directors.6
• The independent director must meet a refined definition of independence. • The compensation and the nominating/governance committees must consist entirely of
independent directors. • The audit committee must have a minimum of three members and consist entirely of independent
directors. In addition, each member of the audit committee must be financially literate. One member must be an “audit committee financial expert,” or the company must disclose that it doesn’t have such an expert and why not.
1.2 Research questions
Leading and pursuant to SOX, significant changes were occurring in the economy including a
declining stock market, a series of corporate scandals, elevated shareholder activism, and increased public
awareness of corporate governance. Thus, we recognize that our analysis with respect to SOX is part of a
broader change in the corporate governance landscape. Further, Romano (2005) argues that many of the
provisions of SOX “may more accurately be characterized as recycled ideas advocated for quite some
time by corporate governance entrepreneurs.” (Romano (2005), p. 1523). These arguments suggest that
some of the post-SOX trends may have begun before SOX was enacted. Even so, we believe that SOX
signifies a turning point in the corporate governance landscape and expect to see firms making substantial
adjustments directly in response to it. Thus, we form our empirical predictions based on the specific 5 For more details on the Sarbanes-Oxley Act of 2002 and the governance proposals of the NYSE and NASDAQ, refer to Public Law 107-204 – July 30, 2002, The Practitioner’s Guide to the Sarbanes-Oxley Act, the SEC Release No. 34-48745, File Nos. SR-NYSE-2002-33, SR-NASD-2002-77, SR-NASD-2002-80, SR-NASD-2002-138, SR-NASD-2002-139, and SR-NASD-2002-141. For summaries, refer to Engel et al. (2005) and Chhaochharia et al. (2007). 6 SOX primarily focuses on the audit committee of public companies. Section 301 (Public Company Audit Committees) requires each member of the audit committee be independent. The rule changes adopted by the NYSE and NASDAQ pursuant to SOX require firms to have majority independent boards and entirely independent compensation and nominating/governance committees. In general, the NYSE and NASDAQ rules share many commonalities, but there are some differences. Overall, the NASDAQ rules offer greater flexibility. For example, NASDAQ allows firms to either 1) have an independent compensation or an independent nominating/governance committee or 2) have a majority of independent directors to perform the corresponding committee duties. The new governance rules have no mandates regarding board size or separation of the CEO and Chair positions. In addition, certain entities are exempted from the new rules, including controlled companies, limited partnerships, companies in bankruptcy, mutual funds, and certain other passive business organizations.
6
requirements of SOX and the pursuant NYSE and NASDAQ rule changes. We summarize our predictions
in Table 1 and briefly discuss them below.
SOX specifies a director’s responsibilities in greater detail and holds directors to a higher
standard of due diligence than what existed before SOX. Hence, we expect board workload to increase
and board tasks to become more complex post SOX (Institutional Investor, April 12, 2005, “The Great
American Corporate Director Hunt”). We also expect director risk to increase post SOX, raising Director
and Officer (D&O) insurance premiums.7 Given increased workload and risk, board candidates may be
more reluctant to sit on corporate boards. Additionally, some directors may drop out of the supply pool as
they fail to qualify as independent directors under the new definition of “independent directors.” Taken as
a whole, we expect the supply of qualified directors to decrease and demand to increase post SOX.
Therefore, we expect companies to pay more to lure qualified directors post SOX. Further, SOX Section
402 prohibits all loans to directors, which may require substitute compensation. We expect SOX to have
the most dramatic impact on pay and workload of audit committee members given Section 404, as well as
specific requirements on audits and audit committees. SOX Section 404 requires a company's
management and auditors to report on the effectiveness of internal controls over financial reporting. It is
widely viewed as the single most expensive piece of SOX (USA Today, March 1, 2005; CNNfn July 30,
2004). To proxy for workload, we examine meeting frequency for the board and its committees as well as
the number of directorships a director holds.
Some of SOX’s compliance costs are likely fixed. For example, board size does not increase
linearly in firm size so increases in director compensation may be relatively more burdensome for smaller
firms. In light of this, Holmstrom and Kaplan (2003) argue that SOX will have a more negative effect on
7 In January 2005, ten outside directors from WorldCom agreed to contribute $18 million of their own money to a $54 million settlement of shareholder lawsuit. A few days later, ten former Enron directors agreed to pay $13 million out of their own pocket towards a $168 million settlement. “Tracking the Numbers/Outside Audit: WorldCom's Steep Price – Outside Directors' Failures Send Expensive Lessons On the Cost of Inattention”, by Jonathan Weil and Shawn Young, the Wall Street Journal, January 7, 2005, Page C1. Richard Breeden, former SEC chair, called these settlements a “watershed development” (Bebchuk et al. (2006)).
7
smaller companies than on larger ones. Thus, we expect the board-related costs of SOX to be
disproportionately higher for smaller firms.
In terms of board structure, we expect board independence to increase post SOX. Linck et al.
(2007), for example, show that the trend towards more independent boards pre-dated SOX. However,
given that SOX includes specific independence-related requirements, we expect the trend toward
independence to accelerate after SOX. Firms can choose to meet the independence requirements by either
adding outside directors or removing inside directors. Which method they choose is an empirical
question. However, if the overall workload of the board increased or if insiders serve specific needs, then
we expect to see firms add outside directors more than they remove inside directors to meet the
independence requirements, increasing overall board size. Further, to the extent that smaller firms are less
likely to be compliant with SOX (Linck et al., 2007; Lehn, Patro, and Zhao, 2004; Boone, Field, Karpoff,
and Raheja, 2007), we expect their board independence to increase disproportionately more than for
larger firms.
Since SOX has specific mandates on director qualifications, board structure and some of its
committees, many public companies will have to restructure their boards to comply with the new
regulations, removing unqualified directors and adding qualified ones. The reforms and increased public
scrutiny on governance practice may also drive companies to re-evaluate the skill sets that they need from
directors, leading to changes in board members. 8 Further, faced with increased workload and risk,
directors may re-evaluate their decisions to serve. These arguments suggest director turnover will increase
post SOX. In addition, SOX creates demand for certain types of directors – for example, directors with
financial expertise. These factors are likely to drive a change in the composition of the director pool.
8 For example, during a hearing on SOX held by the House Committee on Financial Services, the CEO of E*Trade, Mitchell Caplan, testified that the compliance process with SOX has led the firm to re-assess the skill set that it needs for board members. In the end, E*Trade separated the titles of Chairman and CEO, revamped the audit and compensation committees, and brought on four new members to the board of directors (Political Transcripts by Federal Document Clearing House, July 22, 2004).
8
1.3 Related literature
Several papers study the market reaction to SOX using event-study methodology. The findings
are mixed. Li, Pincus, and Rego (2008), Chhaochharia and Grinstein (2007), and Jain and Rezaee (2006)
suggest that SOX is value increasing, while Zhang (2007) suggests that SOX is value decreasing. The
mixed results are not surprising given the challenges researchers face in assessing the value implications
of SOX. Further, the impact may not be uniform across firms. For example, Wintoki (2007) finds that
firms facing high monitoring costs derive less benefit from the new regulations.
Engel, Hayes, and Wang (2005) and Leuz, Triantis, and Wang (2006) study the impact of SOX
on U.S. listing costs. Engel et al. (2005) find that the frequency of going private transactions increases
after SOX. Leuz et al. (2006) provide corroborating results in their study of going-dark transactions,
finding that the frequency of going-dark transactions increases dramatically post SOX. (In going-dark
transactions, firms stop filing with the SEC by deregistering their securities, but continue to trade in the
OTC market.) Berger, Li, and Wong (2005) examine the impact of SOX on firms cross listed in the U.S.
They find that firms from countries with weaker shareholder protection react more positively to SOX-
related events. Smith (2006) finds that while SOX announcement returns are negative and significant for
non-US firms as a whole, the returns of firms based in countries with low-level shareholder rights were
greater (less negative) than those of firms based in countries with high-level shareholder rights. He
attributes this to shareholders’ expectation that the costs of SOX compliance will outweigh the anticipated
benefits for those firms from countries with already high-level shareholder protection in place. Further, as
recently as 2000, nine out of every ten dollars raised by foreign companies through equity offerings were
done in New York instead of in London or Luxembourg. However, the reverse is true by 2005. Some
argue that SOX compliance costs are the main driver for the decline (WSJ, January 26, 2006, “New York
Loses Edge in Snagging Foreign Listings”).
Several papers study the impact of SOX on firms’ internal control procedures. Ashbaugh-Skaife,
Collins, and Kinney (2006) and Ge and McVay (2005) find that the likelihood of firms’ disclosing
9
internal control deficiencies is positively related to operating complexity and negatively related to
performance. The findings are mixed with regard to the market reaction of such announcements. De
Franco, Guan, and Lu (2005) suggest that SOX may offer better protection to small investors by
channeling more information to the market.
Hoitash, Markelevich, and Barragato (2005), Lai (2003), Asthana, Balsam, and Kim (2004) and
Griffin and Lont (2005) study the impact of SOX on audit quality and on auditors. These studies suggest
that: 1) SOX increased audit fees, 2) SOX’s provision to restrict non-audit services improved audit
quality, and 3) SOX brought significant changes to the auditor market. For example, Asthana et al. (2004)
argue that competition in the auditor market decreased post SOX.
2. Data description
We use three primary samples to explore the impact of SOX on corporate boards – a “Disclosure”
sample, an “IRRC” sample, and a random sample of small, medium, and large firms for which we hand-
collect detailed data (the “random” sample). Disclosure contains director, financial, and ownership
information for all publicly-traded companies that file with the SEC.9 Our Disclosure sample begins in
1989. One criticism of SOX is its blanket imposition of governance requirements on all public firms,
possibly resulting in a disproportionate burden for small firms (Morgenstern and Nealis, 2004). We are
able to assess the validity of this claim using the Disclosure sample, since it contains most public firms,
large and small.
Albeit comprehensive in the firms covered, Disclosure lacks some important board attributes such
as committee structure and detailed descriptions of each board member. In contrast, the Investor
Responsibility Research Center (IRRC) data includes committee information and more detailed
classifications of directors, among other things. However, it covers only S&P1500 firms for a shorter time
period. Further, IRRC begins coverage of some board characteristics only after 1998. By construct, the
9 For more information about the Disclosure database and the sample collection process, please see Linck et al. (2007).
10
IRRC firms are, on average, significantly larger than the Disclosure firms. Indeed, as of 2004 only two
out of the 1,141 IRRC firms have a market capitalization of less than $75 million.
We also assemble a third sample of 90 firms for more detailed analysis. We form this sample by
first placing each firm into one of three market value groups using cutoffs of $75 and $700 million as of
2002 (SOX uses these break points in providing firms breaks on certain compliance deadlines). We then
randomly choose 30 firms from each size group, and hand collect detailed information from their proxy
statements for 1998, 2001, and 2004.
Table 2 reports the annul number of observations as well as mean and median market value of
equity (in 2004 millions of dollars) across our three samples. There are a total of 62,694 firm-year
observations representing 8,327 unique firms in the Disclosure sample for the sample period of 1989-
2005. The IRRC sample includes 12,022 firm-years from 1996 to 2005 representing 2,209 unique firms,
and our random sample covers 90 unique firms for 1998, 2001, and 2004.10 The IRRC sample firms are,
on average, substantially larger than those in both the Disclosure and random samples. In 2004, the
median market value of equity for the Disclosure, IRRC, and random samples are $283 million, $1.55
billion, and $374 million, respectively.
3. Evidence on director compensation and factors affecting the supply and demand for directors
In this section, we first examine how director compensation changed from before to after SOX.
Director compensation essentially measures the overall impact of changes in the supply and demand for
directors. We then analyze other factors that drove these changes including director workload, D&O
insurance premiums, and changes to the director pool. Given the detailed information required, we use the
IRRC and random samples for most of this analysis (director pay data is not available for the Disclosure
sample).
10 To provide a complete picture, we use the maximum available time series when possible. However, we focus many of our tests on the 1998 to 2004 period to allow approximately equal time pre and post SOX.
11
3.1 Changes in director compensation
In this section, we examine the change in director pay around SOX for the IRRC and random
samples. Due to data availability, cash compensation for the IRRC sample includes only the annual cash
retainer and fees paid to directors for attending general board meetings. For the random sample, we are
able to include attendance fees for committee meetings plus any additional cash compensation paid to
lead directors, the Chairman of the Board, committee chairs, and certain committee members. For both
samples, equity pay includes option and stock grants. Pay numbers are expressed in 2004 constant
dollars.11
Table 3 reports univariate pay results for the IRRC and random samples.12 For the IRRC sample,
median total compensation per director rose substantially from $57,514 in 1998 to $74,488 in 2001 (a
30% increase) and to $112,745 in 2004 (a 51% increase), both statistically significant changes. The
increase in cash pay was significantly higher post SOX while equity-based pay rose significantly in both
the pre- and post-SOX period. For comparison, we also report median CEO pay in Panel B. The change in
total CEO pay was relatively more modest than that for director pay. Median CEO total pay rose from
$2.4 million in 1998 to $2.9 million in 2001 (a 21% increase) and to $3.6 million in 2004 (a 24%
increase).
To put the pay change in perspective, we also report the impact of pay increases on EPS (diluted
EPS excluding extraordinary items, Compustat item #57). From 1998 to 2001, the median firm spent less
than a penny of EPS on director compensation (for the full board). This increased to a penny in 2001 and
11 Following Bryan and Klein (2004), we do not include option awards upon initial election since these one-time grants would distort our compensation comparison across years (which may be exacerbated by the “lucky grant” concern reported by Bebchuk, Grinstein, and Peyer (2006)). If directors join the board mid-year, we assume they receive the compensation for the entire year. We also do not consider outlays such as insurance plans (term life insurance, accidence, etc.), retirement plans, and charity matching contribution. Further, we do not include D&O insurance in our compensation numbers, but do analyze it separately below. For the IRRC sample, we gather pay data from the IRRC and EXECUCOMP databases. For the random sample, we collect pay data from proxy statements. We use stock price data from CRSP. To compute the value of option grants, we use the Black-Scholes (1973) method and assume that option grants are at the money with a seven-year maturity and that the grant price is the closing stock price from the previous fiscal year (Core and Guay (2002), Ryan and Wiggins (2004), and Aggrawal and Samwick (1999)), To compute the value of stock grants for directors, we multiply the number of shares granted by the closing stock price from the previous fiscal year (Ryan and Wiggins (2004)). 12 We report medians because option pay includes several large outliers that distort mean pay measures.
12
1.5 cents in 2004, a 44% increase from 2001 to 2004. The increase is a more modest 7.6% for CEO pay.
In untabulated results, we also scaled director pay by other measures, such as net sales, total assets, and
MVE, and obtain similar results. Overall, Panel A shows that director pay increased significantly since
1998, particularly post SOX, and the post SOX increases are relatively larger than the increases observed
for CEO pay.
Figure 1 compares the proportion of equity-based pay for CEOs and directors from 1998-2005.
The proportion of director pay provided by equity increased from just above 40% in 1998 to over 60%
post SOX. The trend is similar for CEO pay, although somewhat less pronounced, particularly post SOX.
However, the proportion of director pay provided by options increased substantially leading up to and
succeeding SOX. In contrast, the use of options for CEO pay appears to be decreasing post SOX after
increasing in the pre-SOX period. The CEO pay results are similar to those of Cohen, Dey, and Lys
(2005), who argue that SOX increased the risk to CEOs. Firms responded by reducing CEO incentive pay
to provide additional insurance to the CEOs.
Panel C summarizes director pay for the random sample. Given the small sample size in each size
group, this is meant to be descriptive. Consistent with the IRRC sample results, director compensation –
both cash and equity components – increased significantly from 1998 to 2004. Over this period, cash
compensation for non-employee directors increased by 132%, 106%, and 79% for small, medium, and
large firms, respectively. The increase in director cash pay is primarily due to the increase in the annual
retainer and the increase in the number of committee meetings. In untabulated results, we also find that
seven large firms, five medium firms, and six small firms began paying extra compensation to the chair or
members of the audit committees post SOX, while we detected no such practice pre SOX. Large
(medium, small) firms paid, on average, $10,000 ($5,000, $3,750) more to audit chairs than to other
directors (not reported in the table).
The per director pay numbers do not incorporate the differential impacts that the rule changes
may have on board size and composition. Thus, to better assess the relative burden of director pay, we
13
estimate total director pay per $1,000 in net sales and the impact on EPS.13 For small firms, total pay per
$1,000 in net sales rose from $1.98 in 1998 to $2.35 in 2001 to $3.19 in 2004. The increase from 2001 to
2004 appears economically large at $0.84 (36%), but is not statistically significant, possibly due to our
small sample size. For medium (large) firms, the corresponding numbers rose from $1.02 ($0.22) in 1998
to $1.23 ($0.25) in 2001 and to $2.05 ($0.32) in 2004. Again, the changes are not statistically significant.
The trends are similar when we examine the impact on EPS.
In sum, board compensation increased substantially post SOX. Further, the results suggest that
director pay is disproportionately burdensome for smaller firms, a fact that appears to have been
exacerbated by SOX given the dramatic post-SOX rise in demand for directors. In 2004, small firms paid
directors $1.14 more per $1,000 in sales than medium firms (56% higher) and $2.87 more than large firms
(almost ten times more). The results are consistent with the notion that it is relatively more expensive for
small firms to hire qualified directors than for large firms.
3.2 Director compensation – Multivariate analysis
In this section, we analyze the impact of SOX on director compensation in a multivariate
framework, controlling for the economic factors that the existing literature has suggested drive director
pay. As an initial examination of whether the level of total pay and the proportion that comes from
options changes post SOX, we employ the following model specifications:
εββββββββα
+++++++++=
ownership CEO)tenure CEO(Logownership Director sizeFirm D&Rreturn StockROAPOSTSOX)pay_Total(Log
8765
4321 (1)
εββββββ
ββββα
++++++
+++++=
dummy forward-carry loss Taxdummy dividend zeroassets total / debt Totalownership CEO)tenure CEO(Logwnershpo Director
sizeFirmrisk FirmD&RPOSTSOXpay_total/Equity
109
8765
4321 (2)
Total_pay is the sum of cash and equity pay per director; equity pay includes option and stock awards.
We select the control variables based on the contracting and managerial-power theories (Jensen and
13 When we use the term “burden”, we are referring to whether the overall economic cost is relatively high. For example, increased pay may not be a cash flow burden if it can be paid with non-cash instruments, such as stock and options. However, the overall economic cost is still borne by the firm’s shareholders.
14
Murphy, 1990; Hermalin and Weisbach, 1998; Bebchuk, Fried, and Walker, 2002). The contracting
theory predicts relations between pay and firm performance, job complexity, leverage, and ownership.
The managerial-power theory predicts relations between pay and CEO negotiation power.14 We use
industry-adjusted ROA (ROA) and market-adjusted stock returns (Stock return) to measure firm
performance, research and development (R&D) and the log of market value of equity (Firm size) to proxy
for job complexity, CEO tenure to proxy for the CEO’s bargaining power, and director and CEO
ownership to proxy for potential substitution between the incentive-alignment effect provided by
compensation contract and the incentive-alignment effect provided by ownership stake. In Models 2 and
3, we include a zero dividend dummy, which equals one if a firm pays no dividend, to proxy for firms’
cash constraints, and a tax loss carry-forward dummy, which equals one if a firm has a net operating loss
carry-forward (NOLs), to capture the tax advantages of option and stock pay (Yermack, 2004)15.
Table 4 presents the results. We use the panel data technique and the method of restricted
maximum likelihood to estimate each model. Since about 10% of sample firms do not grant equity
awards, we estimate panel Tobit models to account for the fact that the dependent variable is censored at
zero for Model (2). Consistent with our hypotheses and earlier univariate results, we find that the SOX
14 Since shareholders do not observe managers’ actions, Holmstrom (1979) argues that compensation needs to tie managers’ pay to firm performance. Holmstrom also predicts that incentive pay should positively correlate with information asymmetry of the firm. In this light, Smith and Watts (1992) argue that growth firms require more incentive pay since they are harder to value. The contracting theory also predicts that managers of large firms will be paid more because they oversee more resources. Additionally, compensation, as just one element of the nexus of contracts, interacts with other contracting mechanisms like capital structure and ownership structure. For example, Mehran (1995) documents a negative relation between incentive pay and stock ownership, and John and John (1993) show that levered firms have low pay-performance sensitivity. In contrast to the contracting theory, the managerial-power theory views compensation as the manifestation of agency problems – i.e., self-serving managers have negotiation power over the board of directors in setting their own pay (Hermalin and Weisbach, 1998; Bebchuk, Fried, and Walker, 2002; Bebchuk and Fried, 2003). Consistent with this argument, Bebchuk, Cremers, and Preyer (2007) find that powerful CEOs (proxied by CEO tenure, whether CEO is the Chairman of the Board, and antitakeover provisions) receive higher pay. Ryan and Wiggins (2004) also find that firms with less independent boards pay their directors less incentive pay. For more details regarding the compensation literature, please see Murphy (1999) for a general survey on executive pay and Core, Guay, and Larcker (2002) for a survey focusing on equity-based pay. 15 Yermack (2004) argues that option pay provides tax advantages because the option holder’s tax liability net of the corporation’s tax deduction has lower present value compared to cash pay. He argues that the same tax advantage for option awards may also apply to stock awards albeit to a lesser degree.
15
dummy (POSTSOX) is positively related to both the level and change in director pay and the option
component thereof..
As expected, firm size is significantly and positively related to total pay and incentive pay, while
growth opportunities (R&D) are significantly and positively related to incentive pay. Results for our other
control variables are generally consistent with expectations and the prior literature. Performance is
positively correlated with director total pay. We find some evidence that compensation and stock
ownership are substitutes. The debt ratio is negatively related to incentive pay, consistent with John and
John (1993) that levered firms award less equity compensation to mitigate the agency costs of debt. The
coefficient on the zero-dividend is positive and significant, consistent with the notion that firms use more
equity pay when they are cash constrained (Yermack, 2004; Bryan and Klein, 2004). The tax loss carry-
forward dummy is indistinguishable from zero, which is inconsistent with Yermack’s (2004) taxation
argument that option pay provides tax advantages. Yermack (2004) also found this relation to be
emperically insignificant.
Since we are most interested in how pay changed around SOX, models (3) and (4) estimate
models where we regress the change in pay and the change in option pay, respectively, on various
attributes interacted with our post SOX dummy and the control variables described above. The interaction
between post size and firm size is negatively related to both the change in total pay and the change in the
proportion of pay provided by options, suggesting that directors at small firms experienced a greater
increase in both total pay and the option proportion of total pay post SOX relative to larger firms. We find
no significant relation for post sox interacted with R&D expenditures. We also include an interaction term
for the change in director workload (defined as the meeting frequency of the board) and find that the
interaction is positively related to change in total pay, but negatively related to change in option pay. This
finding is consistent with our conjecture that higher workload contributes to higher director pay post
SOX. The negative sign on this interacted term in the change in option pay regression is consistent with
the obsevation that meeting fees are usually paid in cash.
16
We also interact the SOX dummy with stock returns and firm risk. As expected, we find
the interaction for stock returns positively and significantly correlated with total pay and
incentive pay. This suggests that post SOX director pay is more sensitive to firm performance,
which is not surprising given that directors receive more incentive pay post SOX. The interaction
for firm risk is indistinguishable from zero in both models.
Overall, our results are consistent with the hypothesis that SOX significantly increased director
pay and the impact was larger for small firms. Fama and Jensen (1983) argue that outside directors use
their directorships to signal to the market that they are expert decision makers and monitors. They further
state that “the signals are credible when the direct payments to outside directors are small” (page 315).
However, we find that, due to the dramatic increase in director workload and risk, director pay has
significantly increased post SOX.
3.3 Board and committee meetings
The preceding section provides some evidence that director workload contributes to higher
director pay post SOX. In this section, we provide direct evidence on the extent of such workload
increases. We collect data on the board’s committees and the number of times each of those committees
meets each year for the random sample. 16 We consider only audit, compensation, and nominating/
corporate governance committees (henceforth nominating committee for brevity) because they are the
most common standing board committees and are the committees specifically referenced by SOX and
pursuant NYSE and NASDAQ listing requirements. Table 5 reports the results. While there is no material
change in the meeting frequency for the full board of directors and the compensation committee, meeting
frequency of audit and nominating committees increased significantly. Further, nearly 80% of small and
medium firms do not have a nominating committee before SOX. (In the absence of a nominating
16 IRRC does not provide information on the meeting frequency of the board or its committees. EXECUCOMP provides meeting frequency for the board but not for its committees. In unreported analysis, we compiled meeting frequencies for all firms in EXECUCOMP (S&P1500 firms). Consistent with the results based on the random sample, we did not discern any trend in board meeting frequency for EXECUCOMP firms – the median is six from 1996 to 1998, seven from 1999 to 2000, six from 2001 to 2002, and seven in 2003.
17
committee, the full board or the executive committee, which is generally led by the CEO, performs the
corresponding function.) However, post SOX, more than 70% of small and median firms had a
nominating committee. Given the average board size of those firms is six, these results suggest that it may
be more difficult for smaller firms compared to larger firms (which average about ten directors on the
board) to have three separate board committees, each of which needs to be entirely independent under the
new listing standards. 17 Indeed, Michael S. Emen, Senior Vice President, NASDAQ Listing
Qualifications, makes this point in explaining the greater flexibility in NASDAQ’s rules: “Our new rules
take into account the differences in size among issuers by allowing companies to satisfy this
(independence) requirement either by having an independent compensation or nomination committee or
by allowing the independent directors (of the full board) approve these matters.” (Corporate Governance:
The View from NASDAQ”, March 22, 2004.)
3.4 Directorships and memberships
In this section, we provide additional evidence on director workload by studying outside
directorships and the proportion of independent directors who sit on all three key committees (audit,
compensation, and governance). The former measures the general market demand for a director, while the
latter gauges the workload of independent directors within a firm. If the director market tightened post
SOX, independent directors should sit on more committees within a firm post SOX. We expect directors,
in general, to hold fewer outside directorships, particularly for audit committee members given the greater
responsibilities imposed on them.
Table 6 Panel A reports the percentage of independent directors who sit on all three committees,
the number of outside directorships and the proportion of busy directors for audit and non-audit
17 For operating efficiency, committee meetings often convene about the same time as the full board meetings (usually a day earlier). Firms generally strive to have different directors sit on different committees partially due to governance motivations and partially due to logistic concerns. If an outsider sits on too many committees, it becomes difficult to schedule meetings. As we show later, less than 10% independent directors sit on all committees. As more firms set up separate committees post SOX, which are required to be entirely independent under the new listing requirements, firms may find it a logistical necessity to add independent directors to staff those committees, leading to larger boards post SOX. We thank Professor Denny Beresford, former FASB chairman (1987-1997), who now has extensive board experience, typically as chair of the audit committee, for sharing this insight with us.
18
committee members for the IRRC sample. We define a busy director as one who holds two or more
outside directorships if not retired or who holds five or more outside directorships if retired (Ferris,
Jagannathan, and Pritchard, 2003; Fich and Shivdasani, 2006). We define a director as retired if he/she is
classified as retired by IRRC or if he/she is more than 70 years old. Consistent with our conjecture,
significantly more independent directors sit on all three board committees post SOX. The results are not
consistent with our hypothesis that directors will hold fewer directorships post-SOX. Indeed, the results
suggest that audit-committee members increase their directorships post SOX, although the proportion of
busy directors held relatively flat after SOX. The results are consistent with the notion that certain types
of directors, those with financial expertise, are in greater demand post-SOX. Further, given that the
number of busy directors did not increase, the results are consistent with the conjecture that non-busy
directors with financial expertise added directorships post SOX.
We also examine these measures for the random sample since the labor market for directors may
differ for small and large firms. The results are reported in Table 6 Panel B.18 Substantially more
independent directors sit on all three committees in smaller firms than in larger firms. Directors at smaller
firms also held fewer board seats than those at larger firms, supporting the general perception that the
latter are more skilled directors and, hence, in greater demand. Directors at medium and large firms
increased their directorships from 1998 to 2001, but decreased them from 2001 to 2004. In contrast,
directors at small firms exhibit the opposite trend, providing additional evidence that small firms
potentially face a different director labor market than large firms. Although firms of all size groups have
fewer busy directors post SOX, large firms exhibit the biggest drop in the proportion of busy directors,
43% decrease post SOX, compared to 13% for medium firms and 10% for small firms. This is consistent
18 The number of outside directorships we compile is larger than those reported by IRRC. We cross checked several firms and find that the difference arises because IRRC appears to be missing some directorships (we only include directorships of for-profit firms). For example, for Jeffrey H. Brotman, director of Starbucks Corporation, the 1998 proxy statement reports his job description as "(JEFFREY H. BROTMAN, 55, has been a director of the Company since March 1989… Mr. Brotman, presently the chairman of Costco Companies, Inc…. He is a member of the Board of Directors of Seafirst Bank; The Sweet Factory, a candy retailer; and Garden Botanika, Inc., a cosmetics and skin care retailer.)" We count the number of outside directorships for him as three while IRRC only one.
19
with the notion that directors at larger firms, due to greater visibility, draw greater scrutiny for being too
busy.
In view of SOX’s specific requirements on directors with a financial background, we also study
outside directorships per financial expert.19 We define a director as a financial expert if he or she is an
incumbent CFO or professional accountant. Hence, if a director was a CFO the previous year, but became
a CEO the current year, he/she will not be classified as a financial expert. (This is a rather stringent
requirement, but ensures more consistent classification.) We first examine the proportion of a firm’s
directors who are financial experts. Consistent with our expectation, firms from all size groups increase
the proportion of financial experts on their board post SOX. The trend actually started pre SOX, but
accelerated considerably post SOX. Further, the increase is the largest for small firms (from 5.13% of the
total directors in 2001 to 10.00% in 2004), followed closely by large firms (1.76% to 6.36%). In terms of
the number of directorships held, the trends are not particularly strong, although it appears that directors
with a financial background at small firms increased their outside directorships post SOX. Taken as
whole, our findings suggest that small firms may face a tighter director labor market post SOX than large
firms.
3.5 Director and officer (D&O) insurance
SOX not only intends to increase the responsibility on corporate officers and directors, but also
aims to strengthen the enforcement of federal securities laws. As such, we expect a corresponding
increase in the risk that directors face, possibly leading to higher D&O insurance premiums.
Unfortunately, we do not have detailed information on D&O insurance data for all firms (it is not a
required disclosure). However, we were able to gather some D&O insurance data from several sources.
We report aggregate D&O insurance premium results from Towers Perrin Tillinghast’s “Tillinghast 2004
Directors and Officers Liability Survey (D&O Liability Survey.)” We also collect D&O insurance
19 Congress left the definition of "financial expert" to the SEC, which defines a financial expert as someone who has, through education and experience, an understanding of financial statements, generally accepted accounting principles, internal controls and procedures for financial reporting, and audit-committee functions.
20
premium data for firms incorporated in New York since it is a required disclosure in that state. Lastly, we
searched the 1998, 2001, and 2004 proxy and financial statements for all S&P 500 firms, and found 12
firms that disclosed some information on D&O insurance premiums.
The D&O Liability Survey includes a historical D&O insurance premium index, which
summarizes average D&O insurance premiums back to 1974. In 1998, this index average stood at 539. It
increased to 720 in 2001 and to 1,113 in 2004. The increase from 1998 to 2001 represents a 34%
increase, while the increase from 2001 to 2004 represents a 55% increase. The index showed particularly
large increases from 2001 to 2002 (29%) and from 2002 to 2003 (33%).
We report the results for our hand-collected data from NY firms and S&P 500 firms in Table 7.
These samples include 27 NY firms that reported D&O insurance premiums in 1998, 2001 and 2004, and
12 S&P 500 firms that reported D&O insurance premiums in those same years. For the 27 NY firms,
median D&O insurance premiums rose from $113,000 in 1998 to $143,000 in 2001 to $360,000 in 2004,
an increase of 27% from 1998 to 2001 and 152% from 2001 to 2004. For the S&P 500 firms, the median
D&O insurance premium increased from $675,000 in 1998 to $826,000 in 2001 to $3.0 million in 2004.
This represents an increase of about 22% from 1998 to 2001 and more than 264% from 2001 to 2004.
Indeed, all 12 firms reported higher D&O insurance premiums in 2004 compared to 2001. Overall, we
find that D&O insurance premiums increased quite dramatically in the post-SOX period, supporting the
notion that director risk increased post SOX. An important caveat with respect to our D&O insurance
results is that we know very little about the details of the associated D&O policies. If the type of coverage
(limits, deductibles, types of exclusions, etc.) systematically changed post SOX, then we do not have
direct apples-to-apples comparisons. We conjecture that the limitations and restrictions likely increased, if
anything, post SOX. If that is the case, then the total cost of D&O insurance risk may have increased even
further than what the increased premiums imply. However, it could also be that firms increased their
D&O coverage in the wake of SOX, which would bias our estimates upwards.
21
4. The Impact of the Sarbanes-Oxley Act on board structure
In this section, we examine how SOX affected board structure. For most of this analysis we use
the Disclosure sample as well as the IRRC sample. Some of this analysis is similar to Linck et al. (2007),
who examine the factors that determine board structure. However, here we focus on the regulatory impact
of SOX on board structure, which is one element in understanding how SOX affected the supply and
demand of directors.
4.1 Board development from 1989 to 2005
Figure 2 shows the development of the board from 1989 to 2005 for the Disclosure sample, the
IRRC sample, and Disclosure firms with market capitalization under $75 million. We add the third
category because we are interested in understanding the impact of SOX on small firms. We describe
board composition as the fraction of non-employee directors on the board. We use the two-way
classification scheme of employee (insiders) and non-employee directors (outsiders) because the
Disclosure database lacks sufficient information for us to identify inside, gray, and independent
directors.20 In addition to the actual values of each attribute, we report the “predicted” values based on a
simple time series extrapolation to better highlight whether post-SOX changes were different from trends
already occurring. Panel A shows that the mean proportion of outsiders on the board increased steadily
throughout the sample period. This finding is consistent with the general perception that corporate boards
are becoming more independent due to increased shareholder activism and public pressure. Additionally,
it appears that SOX intensified this trend. For example, the mean ratio of outsiders on the board for the
Disclosure sample increased by 5.6% from 60.7% in 1989 to 66.3% in 2001. Further, small firms
exhibited the largest percentage increase post SOX. Their board independence increased by 6.5% from
2001 to 2005, compared to 4.3% for the Disclosure sample and 2.2% for the IRRC sample.
20 This officer/director classification is also used in other studies including Lehn et al. (2004), Borokhovich, Parrino, and Trapani (1996), Agrawal and Knoeber (2001), and Kroszner and Strahan (2001). Million Dollar Directory also uses this classification.
22
Panel B shows the time trend in board composition measured as percent of firms with insider-
dominated boards. We consider a board as insider-dominated if insiders comprise more than 50% of the
board. Consistent with the results in Panel A, the percentage of firms with insider-dominated boards
decreased monotonically from 21.6% in 1989 to only 3.5% in 2005 for the Disclosure sample – the
decline was steepest during the post-SOX period. We observe a similar trend for the IRRC sample. There
were almost no IRRC firms with a majority of insiders on the board during the post-SOX period. Small
firms exhibited the biggest decrease in insider-dominated boards. The ratio declined from 29.2% in 1989
to 13.2% in 2001 and then to 5.3% in 2005. Similar to what we observe for board composition, the largest
fall, 5.6 percentage points, occurred in 2003.
Panel C shows the time trend of board size from 1989 to 2005. The management literature (e.g.,
Kephart, 1950; Feldman and Arnold, 1983) finds that communication and coordination problems reduce
the effectiveness of large groups. Using similar arguments, Lipton and Lorsch (1992) and Jensen (1993)
suggest that smaller boards are more efficient than larger boards. Consequently, there has been public
pressure on firms to reduce their board size. For the Disclosure sample, the mean board size decreased by
5.6% from 1989 to 2001 (Wilcoxon p-value = 0.01). The IRRC sample, which covers larger, more visible
firms, showed an even larger decrease of 9% from 1996 to 2001 (Wilcoxon p-value = 0.01). Interestingly,
post SOX average board size increased for both samples. From 2002 to 2005, average board size of the
Disclosure firms increased by 6%, reversing the entire reduction in board size over the previous twelve
years (Wilcoxon p-value = 0.01). While the average board size for the IRRC firms also increased, it is not
economically or statistically significant. The board size of small firms decreased slightly from 1989 to
1997 and then started to increase thereafter. It reached its peak in 2003, and then slightly decreased
afterwards, consistent with the notion that smaller firms have more difficulty recruiting directors post
SOX.
Panel D shows the trend in the proportion of firms that have the Chief Executive Officer (CEO)
chair the board from 1989 to 2005. Despite the public call for separating the two posts of CEO and COB
(see e.g., Lipton and Lorsch, 1992; The McKinsey Quarterly, 2002, “Changes Across the Board”, among
23
others), the percentage of Disclosure firms with combined titles of CEO and COB stayed relatively
constant from 1989 to 2001. Interestingly, despite the fact that SOX has no provisions regarding board
leadership, the proportion of firms that combined the two titles dropped in the post-SOX period. Small
firms showed the steepest decrease, from 53.3% in 2002 to 45.5% in 2005 (Wilcoxon p-value < 0.01).
In summary, these descriptive results are consistent with the view that SOX had a significant
effect on board structure, and that its effect varies by firm size.
4.2 The impact of SOX on board structure – Multivariate analysis and robustness checks
Although the previous descriptive results suggest that SOX had a significant effect on board
structure, one concern is that the results are driven by firms entering or exiting the sample. To alleviate
this concern and to further investigate the impact of SOX, we perform multivariate tests on the firms that
survived from 1998 to 2004. We choose the 1998-2004 period so that we can have roughly equal time
intervals for board changes pre and post SOX. However, this does create a survivor-bias problem.
Although the literature has so far produced mixed evidence on the causality between board structure and
firm performance (see e.g., Bhagat and Black, 1999), the current reforms are presumably premised on the
belief that SOX will improve governance, which will result in better performance and long-term survival.
Requiring sample firms to survive from 1998 to 2004, a period that spans an economic recession, may
bias the sample to better performing firms. If it is true that better governed firms perform better, then
SOX will have less effect on these firms, resulting in a downward bias in our estimation of the impact of
SOX for this sample.
We estimate the following models to analyze the impact of SOX on board structure, controlling
for firm-specific factors that the literature has shown to influence board structure (e.g., Linck et al., 2007;
Boone et al., 2007; Lehn et al., 2004).
εββ
ββββα++
+++++=OwnDirectorOwnCEO
LogMVEMONCOSTSCOMPLEXPOSTSOXBoardSize__ 65
4321 (3)
24
ChairCEOLagAgeCEOLog ePerformancFCFOwnDirectorOwnCEO
LogMVEMONCOSTSCOMPLEXPOSTSOXBoardIndep
εββββββ
ββββα
++++++
+++++=
)_()_(__
109
8765
4321
(4)
POSTSOX is a dummy variable that takes the value of one if the sample period falls after 2001.
Based on our earlier analysis, we expect it to correlate positively with board size and board independence.
Linck et al. (2007) argue that large firms or firms with complex operating and financial structures
benefit more from outside advising and monitoring. Consistent with their hypothesis, they find
those type of firms have larger and more independent boards. Following Linck et al. (2007), we use
principal component analysis and extract one factor from log of firm age, total debt over total assets, and
log of business segment to proxy for firms’ operation and financial complexity (COMPLEX). Linck et al.
(2007) also argue that outsiders lack firm-specific information and, hence, face information acquisition
and processing costs. Larger boards also face additional costs of free-rider, coordination, and/or
communication problems. Therefore, they predict board size and board independence decrease in
monitoring costs. They use standard proxies for information asymmetry (stock return volatility)
and growth opportunities (market-to-book ratio and R&D expenditure) to measure firms’ monitoring
costs. Following Linck et al. (2007), we extract one factor from the market-to-book ratio, R&D
expenditure, and stock return volatility to capture firms’ monitoring costs (MONCOSTS). Linck et al.
(2007) and Boone et al. (2007) find that proxies for CEO power (firm performance and CEO age) and
CEO incentive alignment (CEO ownership) correlate negatively with board independence. Linck et al.
(2007) show that outside director ownership is associated with larger and more independent boards. They
also find that firms with high level of free cash flow and firms where the CEO is also the Chair have more
independent boards. Therefore, we also control for outside director ownership (Director_Own), log of
CEO age (Log(CEO_Age)), firm performance (Performance; return on assets after adjusting for industry
median), free cash flow (FCF; the measure in Lehn and Poulsen, 1989), a lagged dummy indicating
25
whether the CEO is the Chair (Lag(CEO_Chair)) in the regressions for board size and board
independence accordingly.
One of the main objectives of SOX is to strengthen board monitoring by mandating more
independent boards. Therefore, by design, SOX is more likely to increase board independence of those
firms that are not in compliance with the new rules before the enactment of SOX. However, it is unclear
whether they do so by adding independent directors or removing non-independent directors. We believe
that this research question is interesting because it helps us assess director supply post SOX and whether
firms desire certain number of insiders on the board. Due to data limitations, we define non-compliant
firms in the Disclosure sample as those with a majority of employee directors on the board. We also
expect SOX to have greater impact on small firms and firms with larger CEO ownership stake, since
those firms tend to have more insiders on the board (Linck et al., 2007) and hence are more likely to be
affected by the Act.
To test the above hypotheses, we interact POSTSOX with our measure of a firm’s compliance
(Non-compliant), firms size (LogMVE), and CEO ownership (CEO_own). We hypothesize Non-
compliant*POSTSOX and CEO_Own*POSTSOX to be positively related to board independence, and
LogMVE*POSTSOX to be negatively related to board independence. For reasons stated earlier, we treat
the relation between these three interaction terms and board size as an empirical question. Table 8
presents the results. Models (1) and (4) report the results from estimating Equations 3 and 4 above.
Consistent with our expectation, POSTSOX is positively and significantly related to board size and board
independence. Our results on the control variables are largely consistent with the existing literature. For
example, we find that complex firms have larger and more independent boards.
Models (2) and (5) in Table 8 add a dummy for non-compliant firms as well as interacted terms to
estimate the extent to which these relations changed post SOX. As expected, non-compliant firms had
smaller and less independent boards. In this specification, Non-compliant*POSTSOX is positively related
to both board size and independence and the POSTSOX dummy (not interacted) is insignificant. This
suggests that the observed increase in board size and independence is driven by firms who were
26
previously not in compliance with SOX, which also supports the contention that there is distinct SOX
effect as opposed to just an extrapolation of already existing trends. The results also suggest that non-
compliant firms may have become more independent by adding outsiders rather than reducing insiders.
LogMVE*POSTSOX is positive and marginally significant in the board independence regression,
suggesting that large firms add more outsiders to the board than small firms. Although this finding is
contrary to our prediction, it supports the argument that large firms face more complex board tasks and
hence potentially need to hire more directors. It is also consistent with the view that large firms are better
able to recruit outside directors. CEO_Own*POSTSOX is insignificant in the board size regression, but is
significantly positively related to board independence.
Other significant events were also taking place in the economy around SOX including several
major corporate scandals, a recession, elevated shareholder activism, etc. Together these forces changed
the corporate governance landscape, including the board structure. This makes it difficult to disentangle
how much of the changes we observe are due to SOX, and how much are due to other forces occurring
contemporaneously. To further address this issue, we utilize a specific SOX exemption. SOX applies to
all firms listed in the U.S. except for controlled firms, firms in bankruptcy, passive business
organizations, and foreign issuers. 21 While the Disclosure sample does not include most of these
exempted companies, it does include controlled firms. Controlled companies are those “with more than
50% of the voting power held by an individual, a group or another company”
(http://www.sec.gov/rules/sro/34-48745.htm). The full Disclosure sample includes 927 controlled firms,
291 of which survived from 1998 to 2004. We use the following model.
SOXeffectPOSTSOXPOSTSOXXstructureBoard * γδβ ++= (7)
where X is a vector of the variables that determine board structure. POSTSOX is the dummy variable that
equals one if the sample period falls after 2001, and SOXeffect is a dummy variable that equals one if the
firm is not a controlled firm. In this model specification, δ captures the impact of all the events that
21 For details about the exemptions, please refer to http://www.sec.gov/rules/sro/34-48745.htm
27
happened after 2001, which include SOX, corporate scandals, stock market decline, etc. In other words,
δ captures the collective forces that changed board structure post SOX. On the other hand, SOXeffect
shifts the intercept only for those firms specifically targeted by SOX. Therefore, γ measures the impact
of SOX on boards above and beyond what would have happened without SOX. Models (3) and (6) in
Table 8 report the results. POSTSOX*SOXeffect is positive and significant in the board independence
regression, suggesting that SOX has a significant impact even after we control for other forces influencing
boards at that time. Interestingly, POSTSOX*SOXEffect is insignificant in the board size regression. Note
that SOX does not have any direct mandate regarding board size.22
For robustness, we estimate seemingly unrelated regressions (SURE) to control for the
potential joint-determination of board size and board independence, and obtain similar results. We also
estimate the same regressions for the IRRC sample (not reported in a table to conserve space). Given the
richer information available for the IRRC sample, we construct a more detailed non-compliance score that
captures the extent to which a firm is not in compliance with SOX. Specifically, the non-compliance score
is the sum of five dummy variables, each taking the value of one if the board consists of a majority of
inside directors, or if the audit, compensation, nominating, or governance committee is not 100%
independent. Thus, a non-compliance score of five indicates that the firm needs to make the biggest
change in board structure to meet the requirements of SOX and related exchange rule changes. The results
are similar to those for the Disclosure sample, with some minor differences. The differences may be
driven by the fact that, on average, the IRRC firms are much larger than Disclosure firms. We do not
report the results from these robustness checks to conserve space.
Overall, our multivariate results confirm our earlier descriptive and univariate findings. Post SOX
boards are larger and more independent, and are more likely to separate the CEO and COB posts. These
effects vary with firm characteristics. SOX had a bigger impact on firms with less independent boards, 22 Following Linck et al. (2007) specification, we also estimate the impact of SOX on the probability of CEO being the COB by including the SOX dummy, the corresponding interacted terms, and finally POSTSOX*SOXeffect. Consistent with our descriptive analysis, we find that the SOX dummy (POSTSOX) is negatively and significantly related to the likelihood that the CEO is also the COB. We do not find significant relations for interacted terms and POSTSOX*SOXeffect. We do not tabulate these results to conserve space.
28
smaller firms, and firms with high CEO ownership. Further, SOX had a bigger impact on firms
specifically targeted by the act, suggesting a distinct SOX impact beyond trends that were already
occurring.
5. The impact of SOX on the director pool
In this section, we examine how SOX impacted the composition of the director pool. We first
examine the overall frequency of director turnover pre and post SOX, and then analyze the types of
directors that make up the director pool in the pre- and post-SOX periods. Since we are interested in the
identity of directors, we use IRRC sample for this analysis.
5.1 Director turnover from 1996 to 2004
Figure 3 illustrates director turnover for the IRRC sample from 1996 to 2004. To maintain data
consistency, we exclude new firms and delisted firms. More than 60% of firms experienced director
turnover in any given year. Denis and Sarin (1999) find that 40% of the firm-years in their sample period
(1983-1992) exhibit director turnover, suggesting higher turnover in more recent periods. This is
consistent with the results for CEO turnover – Kaplan and Minton (2006) report that CEO turnover is
higher from 1998-2005 than from 1992-1997. Further, director turnover is particularly high in 2003 and
2004, the two years following SOX. In addition to SOX, higher director turnover is consistent with
anecdotal evidence that board reforms such as term limits and performance evaluation led to more
scrutiny of the board (PR Newswire, Augest 13, 1999, “Directors Who Don't Perform Will be Asked to
Resign”; New York Times, October 17, 1999, “When Deadwood Doesn’t Refer to the Table”; Dow Jones
News Service, August 13, 2002, “Corporate Boardrooms May See as much as 50% Turnover”).
5.2 The Impact of SOX on the composition of director pool
In this section, we investigate whether the composition of the director pool has changed post
SOX. We classify directors into seven broad categories based on the information provided by IRRC: 1)
Executive – executives of a non-financial service company; 2) Retired – directors who are retired
29
executives or more than 70 years old, 3) Professional – directors who are retired and sit on at least five
boards; 4) Financial – private investors or those who work in financial services industries; 5) Lawyer –
lawyers or consultants; 6) Academic – directors who work for academic institutions; and 7) Other – all
other classifications. We report the results in Table 9, Panel A. Executive directors made up more than
half of the director pool prior to 2002. That proportion declined monotonically to 41.6% in 2004, with the
steepest decline occurring post SOX. This trend is consistent with hypothesis that SOX increased the risk
and workload of directors, resulting in fewer sitting executives serving as directors (Bebchuk et al.
(2006)). Further supporting this conjecture is the increase in directors who are retired. It appears that
firms demand the expertise/skill of executives, but that the workload demands are increasingly too great
for sitting executives. The proportion of directors with financial expertise and the proportion of
lawyers/consultants also increased, likely filling demands for specific expertise driven by the new
regulations such as financial expertise and increased risk of litigation. Financial experts and
lawyers/consultants represented 21% of the director pool in 2004 compared to 10% in 1998. Interestingly,
boards added proportionately more lawyers post SOX than any other category. The share of directorships
held by lawyers rose from 5.55% in 2001 to 8.55% in 2004, consistent with rising legal liabilities.
Given that SOX has a particular focus on the audit committee, we separately examine director
turnover for audit and non-audit committee members. The results are presented in Table 9, Panel B. We
find significantly higher turnover on the audit committee (departures and additions) post SOX compared
to pre SOX. Departures from the audit committee rose from 27.9% in 2001 to 31.4% in 2004, and
additions rose from 23.8% to 36.2%. These results are consistent with firms restructuring their audit
committees to meet the demands of the new requirements for independence and financial expertise. It
may also be the result of turnover at firms that experience financial scandals. For example, Srinivasan
(2005) finds that the likelihood of director departure increases in the severity of a restatement, particularly
for audit committee members. With respect to non-audit committee members, we find that a significant
increase in both additions and departures for retired executives and a statistically significant and
30
economically large increase in additions of professional directors. Interestingly, turnover of lawyer
directors increased faster pre SOX than it did post SOX.
We also analyze the impact of SOX on director turnover in a multivariate setting. Since the
insights are neither surprising nor new given our previous analysis, we do not tabulate these results to
conserve space. Our models include various control variables following Hermalin and Weisbach (1988)
and Yermack (2004). Consistent with expectations, firms were more likely to appoint independent
directors to the board throughout the sample period, and this likelihood increased post SOX. Post SOX
firms were also more likely to appoint new audit committee members. Interestingly, the probability that a
firm adds a busy director increased post SOX, supporting the notion of a tightened supply of qualified
directors post SOX. Consistent with our earlier results, executives are less likely to be appointed to the
board post SOX.
6. Conclusion
The Sarbanes-Oxley Act of 2002 represents the most dramatic change to the securities laws
regulating corporate governance since the Great Depression. The passage of SOX was motivated by the
scandals that hit corporate America in the early years of the 21st century. While the scandals were caused
by the actions of corporate executives, many argue that better monitoring by boards and accountants,
among others, could have prevented the scandals from occurring. While SOX has many parts, we
concentrate on how it affected the supply and demand for directors. With SOX, the Federal government,
for the first time, moved into direct merit regulation (as opposed to disclosure regulation) of the behavior
of managers as well as the structure of corporate boards. SOX and the pursuant changes in the exchange
rules impose more personal accountability on directors, require greater documentation of internal
controls, increase reporting requirements, and impose specific requirements on corporate boards. We
argue that these requirements increase the demand and reduce the supply of directors, and use that as a
guide to examine the effects on director pay, director workload, liability insurance, board structure,
director turnover, and the composition of the director pool.
31
We examine these issues using broad sample evidence from more than 8,000 public companies as
well as detailed analysis of other subsamples. The breadth and depth of our sample allow for a
comprehensive analysis of board-related costs, and the extent to which the burden of these regulatory
mandates is uniform across firms. Broadly speaking, our evidence suggests that SOX, and contemporary
reforms, dramatically increased the cost of corporate boards, particularly for small firms. We find that
director compensation increased substantially post SOX. Further, we find some evidence that SOX
imposes a disproportionate burden on small firms. For example, small firms paid $3.19 in director fees
per $1,000 of net sales in 2004, which is $0.84 more than they paid in 2001 and $1.21 more than in 1998.
In contrast, large firms paid $0.32 in director fees per $1,000 of net sales in 2004, seven cents more than
they paid in 2001 and ten cents more than in 1998. In 2004, director pay per $1,000 of net sales is almost
ten times higher for small firms than for large firms. These results have important implications for at least
a couple reasons. First, they illustrate the potential adverse impact on smaller public firms. Second, most
of the literature critiquing the burdensome costs of SOX has focused on the cost of complying with
section 404. This paper shows that SOX negatively affected other expenses of public companies as well,
particularly for small firms which have not yet had to comply with 404.
We find evidence consistent with the theory that director workload and risk increased post SOX.
Board committees meet more often post-SOX, particularly the audit committee, and many firms now pay
additional fees to the chair and members of the audit committee post SOX, a practice that was relatively
rare pre SOX. In addition, we find substantial increases in Director and Officer (D&O) insurance
premiums from 2001 to 2004.
SOX also had a substantial impact on board structure, director turnover and the director pool.
Post SOX boards are larger and more independent, and more firms separated the two posts of CEO and
the Chairman of the Board (COB). The degree of these board changes varied with firms’ characteristics.
Firms that did not have majority independent boards prior to SOX exhibited greater increases in board
independence and board size. Larger firms were more likely to increase outsider representation on the
board than smaller firms post SOX, and firms with higher managerial ownership were more likely to add
32
directors and separate the CEO and COB titles. Not surprisingly, firms were less likely to add inside
directors, and more likely to add independent directors to the board post SOX compared to pre SOX. We
also find that the makeup of the director pool changed post SOX. The proportion of directors that are
sitting executives dropped significantly, while the proportion held by retired executives, financial experts,
and lawyers/consultants increased. While this trend pre-dated SOX, many of these trends accelerated post
SOX.
We focus on the effects on directors and the board of directors – it is beyond the scope of this
paper to draw conclusions as to the overall net cost or benefit of SOX. However, our analysis does
provide some guidelines for future research. For example, as we noted, the mandates of SOX are aimed at
setting up boards and directors to reduce the possibility of undetected fraud and engaging in fraudulent
behavior. One clear outcome of these mandates is, on average, larger boards. However, the literature has
suggested that larger boards may be less effective than smaller boards (Yermack, 1996; Eisenberg,
Sundgren, and Wells, 1998). What are the value implications of this change and the effects on
performance? Have the mandates of SOX increased director workload and changed board structure so
materially that boards are less effective in serving an advisory role? We also document that director
compensation increased substantially post SOX. What are the implications for that on firm performance?
Pay for monitoring has never been a mantra of good governance. How has SOX impacted a firm’s ability
to deal with changes in the corporate environment? What types of firms are most affected?
33
References:
Agrawal, Anup, and Charles R. Knowber, 2001, Do some outside directors play a political role? Journal of Law and Economics 44, 179-198.
Ashbaugh-Skaife, Hollis, Daniel W. Collins, and William R. Kinney, 2006, The discovery and reporting
of internal control deficiencies prior to SOX-mandated audits, Working paper. Asthana, Sharad, Steven Balsam, and Sungsoo Kim, 2004, The effect of Enron, Andersen, and Sarbanes-
Oxley on the market for audit services, Working paper. Bebchuk, Lucian A., Joseph Bachelder, Roel Campos, Byron Georgiou, Alan Hevesi, William Lerach,
Robert Mendelsohn, Robert Monks, Toby Myerson, John Olson, Leo Strine, and John Wilcox, 2006, Director liability, Delaware Journal of Corporate Law n31, 1011-1045.
Bebchuk, Lucian A., and Assaf Hamdani, 2006, Federal corporate law: Lessons from history, Columbia
Law Review 106, 1793-1838. Bebchuk, Lucian A., Yaniv Grinstein and Urs Preyer, 2006, Lucky directors, Working Paper, December
2006. Berger, Philip G., Feng Li, and M. H. Franco Wong, 2005, The impact of Sarbanes-Oxley on cross-listed
companies, Working paper. Bhagat, Sanjai, and Bernard Black, 1999, The uncertain relationship between board composition and firm
performance, The Business Lawyer 54, 921 – 963. Boone, Audra L., Laura C. Field, Jonathan M. Karpoff, and Charu G. Raheja, 2007, The determinants of
corporate board size and composition: An empirical analysis, Journal of Financial Economics, forthcoming.
Borokhovich, Kenneth A., Robert Parrino, and Teresa Trapani, 1996, Outside directors and CEO
selection, Journal of Financial and Quantitative Analysis 31, 337–355. Brickley, James A., Jeffry L. Coles, and Gregg Jarrell, 1997, Leadership structure: Separating the CEO
and Chairman of the Board, Journal of Corporate Finance 3, 189-220. Bryan, Stephen, and April Klein, 2004, Non-management director options, board characteristics, and
future firm investments and performance, Working paper. Chhaochharia, Vidhi, and Yaniv Grinstein, 2007, Corporate governance and firm value: Ihe impact of the
2002 governance rules, Journal of Finance, forthcoming. Core, John, and Wayne Guay, 2002, Estimating the value of employee stock option portfolios and their
sensitivity to price and volatility, Journal of Accounting Research 40, 613-630. De Franco, Gus, Yuyan Guan, and Hai Lu, 2005, The wealth change and redistribution effects of
Sarbanes-Oxley internal control disclosures, Working paper. Denis, David J., and Atulya Sarin, 1999, Ownership and board structure in publicly traded corporations,
Journal of Financial Economics 52, 187-223.
34
Eisenberg, Theodore, Stefan Sundgren, and Martin T. Wells, 1998, Larger board size and decreasing firm
value in small firms, Journal of Financial Economics 48, 35-54. Engel, Ellen, Rachel M. Hayes, and Xue Wang, 2005, The Sarbanes-Oxley Act and firms’ going private
decisions, Working paper. Feldman, Daniel C., and Hugh J. Arnold, 1983, Managing Individual and Group Behavior in
Organizations, New York: McGraw-Hill. Ferris, Stephen P., Murali Jagannathan, and Adam C. Pritchard, 2003, Too busy to mind the business?
Monitoring by director with multiple board appointments, Journal of Finance 58, 1087-1111. Fich, Eliezer M., and Anil Shivdasani, 2006, Are busy boards effective monitors? Journal of Finance 61,
689-724. Gaver, Jennifer J., and Kenneth M. Gaver, 1993, Additional evidence on the association between the
investment opportunity set and corporate financing, dividend, and compensation policies, Journal of Accounting and Economics 16, 125-160.
Ge, Weili, and Sarah McVay, 2005, The disclosure of material weaknesses in internal control after the
Sarbanes-Oxley Act, Accounting Horizons 19, 137-158. Griffin, Paul A., and David H. Lont, 2005, The effects of auditor dismissals and resignations on audit
fees: Evidence based on SEC disclosures under Sarbanes-Oxley, Working paper. Hermalin, Benjamin E., and Michael S. Weisbach, 1988, The determinants of board composition, RAND
Journal of Economics 19, 589-606. Hermalin, Benjamin E., and Michael S. Weisbach, 1998, Endogenously chosen boards of directors and
their monitoring of the CEO, American Economic Review 88, 96-118. Hoitash, Rani, Ariel Markelevich, and Charles A. Barragato, 2005, The nature and disclosure of fees paid
to auditors – An analysis before and after the Sarbanes-Oxley Act, The CPA Journal 75, 6-10. Holmstrom, Bengt, and Steven Kaplan, 2003, The state of U.S. Corporate governance: What’s right and
what’s wrong, Journal of Applied Corporate Finance 15, 8-20. Jain, Pankaj K., and Zabihollah Rezaee, 2006, The Sarbaines-Oxley Act of 2002 and capital market
behavior: Early evidence, Contemporary Accounting Research 23, 629-654. Jensen, Michael C., 1993, The modern industrial revolution, exit, and the failure of internal control
systems, Journal of Finance 48, 831-880. John, Teresa A., and Kose John, 1993, Top-management compensation and capital structure, Journal of
Finance 48, 949–974. Kaplan, Steven N., and Bernadette A. Minton, 2006, How has CEO turnover changed? Increasingly
performance sensitive boards and increasingly uneasy CEOs, Working paper.
35
Kephart, William M., 1950, A quantitative analysis of intragroup relations, American Journal of Sociology 55, 544-549.
Kroszner, Randall S., and Philip E. Strahan, 2001, Bankers on boards: Monitoring, conflicts of interest,
and lender liability, Journal of Financial Economics 62, 415-452. Lai, Kam Wah, 2003, The Sarbanes-Oxley Act and auditor independence: Preliminary evidence from
audit opinion and discretionary accruals, Working paper. Lehn, Kenneth, and Annette Poulsen, 1989, Free cash flow and stockholder gains in going private
transactions, Journal of Finance 44, 771-787. Lehn, Kenneth, Sukesh Patro, and Mengxin Zhao, 2004, Determinants of the size and structure of
corporate boards: 1935-2000, Working Paper, University of Pittsburg. Leuz, Christian, Alexander Triantis, and Tracy Wang, 2006, Why do firms go Dark? Causes and
economic consequences of voluntary SEC deregistrations, Working paper. Li Haidan, Morton Pincus, and Sonja Olhoft Rego, 2008, Market reaction to events surrounding the
Sarbanes-Oxley Act of 2002 and earnings management, Journal of Law and Economics, forthcoming. Linck, James S., Jeffrey M. Netter, and Tina Yang, 2007, The determinants of board structure, Journal of
Financial Economics, forthcoming. Lipton, Martin, and Jay W. Lorsch, 1992, A modest proposal for improved corporate governance, The
Business Lawyer 48, 59-77. Morgenstern, Marc, and Peter Nealis, 2004, The impact of Sarbanes-Oxley on mid-cap issuers, Standard
& Poor's Review of Securities & Commodities Regulation 37. Romano, Roberta, 2005, The Sarbanes-Oxley Act and the making of quack corporate governance, Yale
Law Journal 114, 1521-1611. Ryan, Harley E. Jr., and Roy A. Wiggins III, 2004, Who is in whose pocket? Director compensation,
board independence, and barriers to effective monitoring, Journal of Financial Economics 73, 497-524.
Smith, Clifford W. Jr., and Ross L. Watts, 1992, The investment opportunity set and corporate financing,
dividend and compensation policies, Journal of Financial Economics 32, 263–292. Smith, Geoffrey P., 2005, Sarbanes-Oxley and the foreign issuer: A test of the bonding hypothesis,
Working paper, University of Georgia. Srinivasan, Suraj, Consequences of Financial Reporting Failure for Outside Directors: Evidence from
Accounting Restatements and Audit Committee Members, Journal of Accounting Research, Vol. 43, pp. 291-334.
Wintoki, Jide, 2007, Corporate boards, regulation and firm Value: The impact of the Sarbanes-Oxley Act
and the exchange listing requirements, Working paper, University of Georgia.
36
Yermack, David, 1996, Higher market valuation of companies with a small board directors, Journal of Financial Economics 40, 185-221.
Yermack, David, 2004, Remuneration, retention, and reputation incentives for outside Directors, Journal
of Finance 59, 2281-2308. Zhang Ivy Xiying, 2007, Economic consequences of the Sarbanes-Oxley Act of 2002, Working paper.
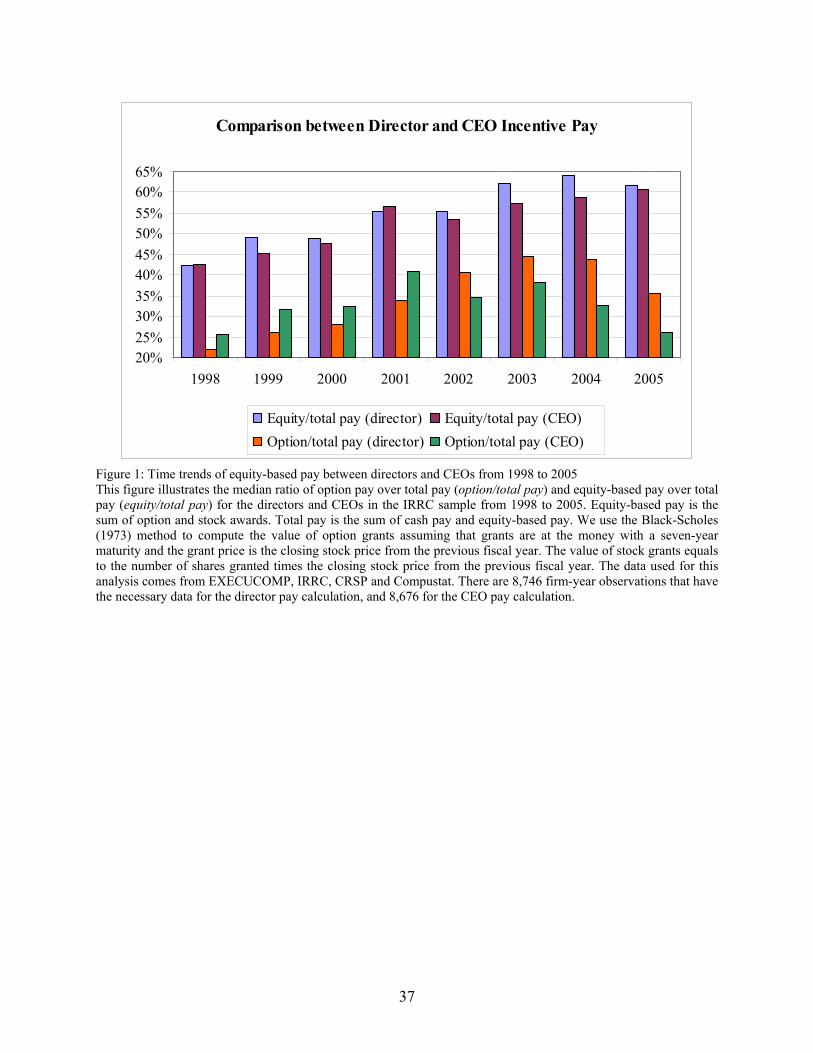
37
Comparison between Director and CEO Incentive Pay
20%25%30%35%40%45%50%55%60%65%
1998 1999 2000 2001 2002 2003 2004 2005
Equity/total pay (director) Equity/total pay (CEO)Option/total pay (director) Option/total pay (CEO)
Figure 1: Time trends of equity-based pay between directors and CEOs from 1998 to 2005 This figure illustrates the median ratio of option pay over total pay (option/total pay) and equity-based pay over total pay (equity/total pay) for the directors and CEOs in the IRRC sample from 1998 to 2005. Equity-based pay is the sum of option and stock awards. Total pay is the sum of cash pay and equity-based pay. We use the Black-Scholes (1973) method to compute the value of option grants assuming that grants are at the money with a seven-year maturity and the grant price is the closing stock price from the previous fiscal year. The value of stock grants equals to the number of shares granted times the closing stock price from the previous fiscal year. The data used for this analysis comes from EXECUCOMP, IRRC, CRSP and Compustat. There are 8,746 firm-year observations that have the necessary data for the director pay calculation, and 8,676 for the CEO pay calculation.
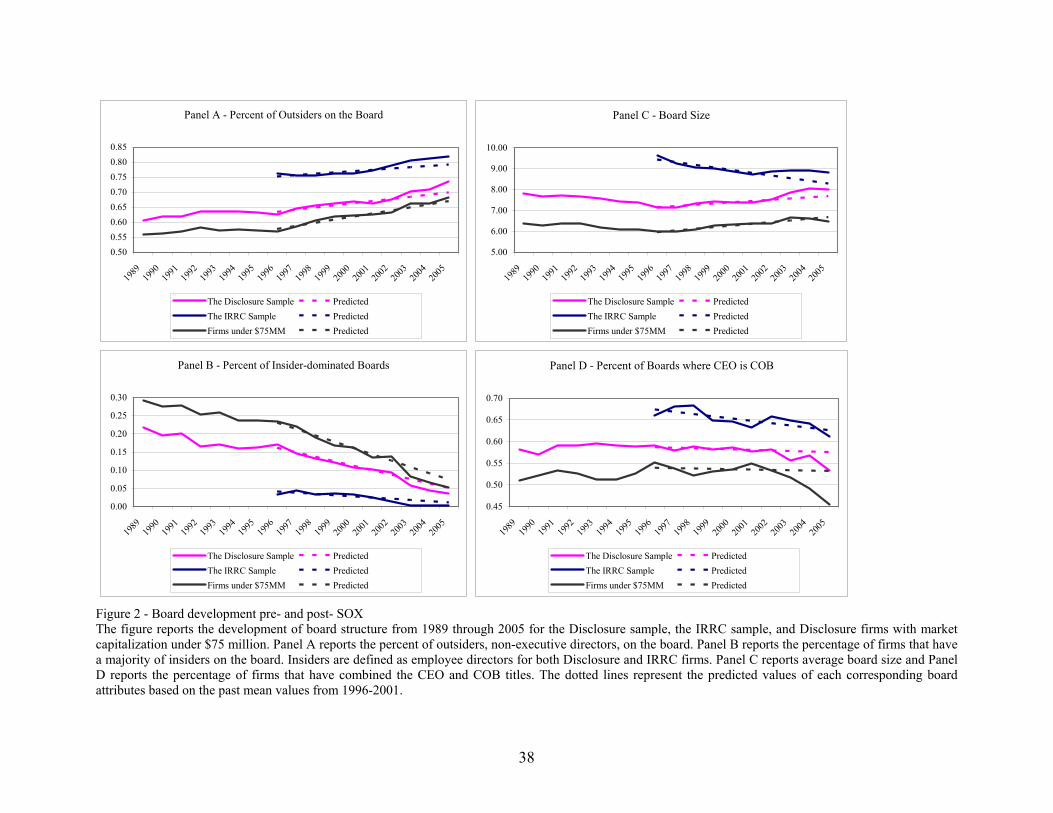
38
Panel A - Percent of Outsiders on the Board
0.500.550.600.650.700.750.800.85
1989
1990
1991
1992
1993
1994
1995
1996
1997
1998
1999
2000
2001
2002
2003
2004
2005
The Disclosure Sample PredictedThe IRRC Sample PredictedFirms under $75MM Predicted
Panel C - Board Size
5.00
6.00
7.00
8.00
9.00
10.00
1989
1990
1991
1992
1993
1994
1995
1996
1997
1998
1999
2000
2001
2002
2003
2004
2005
The Disclosure Sample PredictedThe IRRC Sample PredictedFirms under $75MM Predicted
Panel B - Percent of Insider-dominated Boards
0.00
0.05
0.10
0.15
0.20
0.25
0.30
1989
1990
1991
1992
1993
1994
1995
1996
1997
1998
1999
2000
2001
2002
2003
2004
2005
The Disclosure Sample PredictedThe IRRC Sample PredictedFirms under $75MM Predicted
Panel D - Percent of Boards where CEO is COB
0.45
0.50
0.55
0.60
0.65
0.70
1989
1990
1991
1992
1993
1994
1995
1996
1997
1998
1999
2000
2001
2002
2003
2004
2005
The Disclosure Sample PredictedThe IRRC Sample PredictedFirms under $75MM Predicted
Figure 2 - Board development pre- and post- SOX The figure reports the development of board structure from 1989 through 2005 for the Disclosure sample, the IRRC sample, and Disclosure firms with market capitalization under $75 million. Panel A reports the percent of outsiders, non-executive directors, on the board. Panel B reports the percentage of firms that have a majority of insiders on the board. Insiders are defined as employee directors for both Disclosure and IRRC firms. Panel C reports average board size and Panel D reports the percentage of firms that have combined the CEO and COB titles. The dotted lines represent the predicted values of each corresponding board attributes based on the past mean values from 1996-2001.
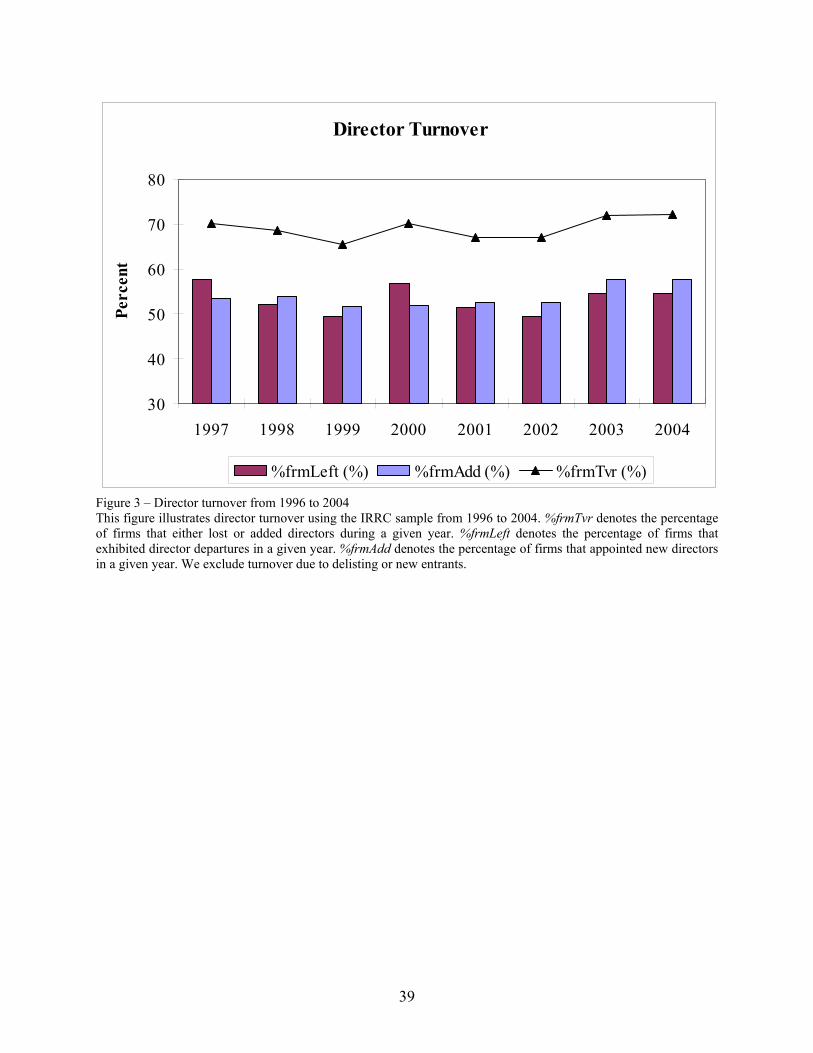
39
Director Turnover
30
40
50
60
70
80
1997 1998 1999 2000 2001 2002 2003 2004
Perc
ent
%frmLeft (%) %frmAdd (%) %frmTvr (%)
Figure 3 – Director turnover from 1996 to 2004 This figure illustrates director turnover using the IRRC sample from 1996 to 2004. %frmTvr denotes the percentage of firms that either lost or added directors during a given year. %frmLeft denotes the percentage of firms that exhibited director departures in a given year. %frmAdd denotes the percentage of firms that appointed new directors in a given year. We exclude turnover due to delisting or new entrants.
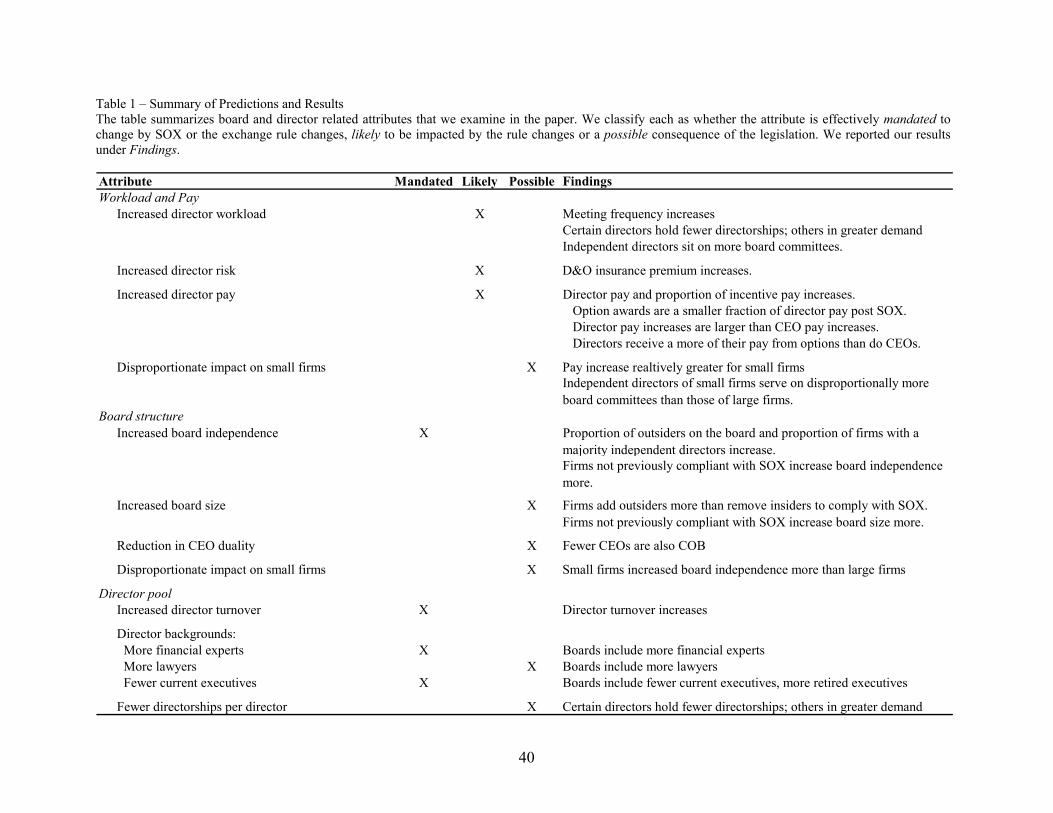
40
Table 1 – Summary of Predictions and Results The table summarizes board and director related attributes that we examine in the paper. We classify each as whether the attribute is effectively mandated to change by SOX or the exchange rule changes, likely to be impacted by the rule changes or a possible consequence of the legislation. We reported our results under Findings. Attribute Mandated Likely Possible FindingsWorkload and Pay
Increased director workload X Meeting frequency increasesCertain directors hold fewer directorships; others in greater demandIndependent directors sit on more board committees.
Increased director risk X D&O insurance premium increases.
Increased director pay X Director pay and proportion of incentive pay increases. Option awards are a smaller fraction of director pay post SOX. Director pay increases are larger than CEO pay increases. Directors receive a more of their pay from options than do CEOs.
Disproportionate impact on small firms X Pay increase realtively greater for small firmsIndependent directors of small firms serve on disproportionally more board committees than those of large firms.
Board structureIncreased board independence X Proportion of outsiders on the board and proportion of firms with a
majority independent directors increase.Firms not previously compliant with SOX increase board independence more.
Increased board size X Firms add outsiders more than remove insiders to comply with SOX.Firms not previously compliant with SOX increase board size more.
Reduction in CEO duality X Fewer CEOs are also COB
Disproportionate impact on small firms X Small firms increased board independence more than large firms
Director poolIncreased director turnover X Director turnover increases
Director backgrounds: More financial experts X Boards include more financial experts More lawyers X Boards include more lawyers Fewer current executives X Boards include fewer current executives, more retired executives
Fewer directorships per director X Certain directors hold fewer directorships; others in greater demand
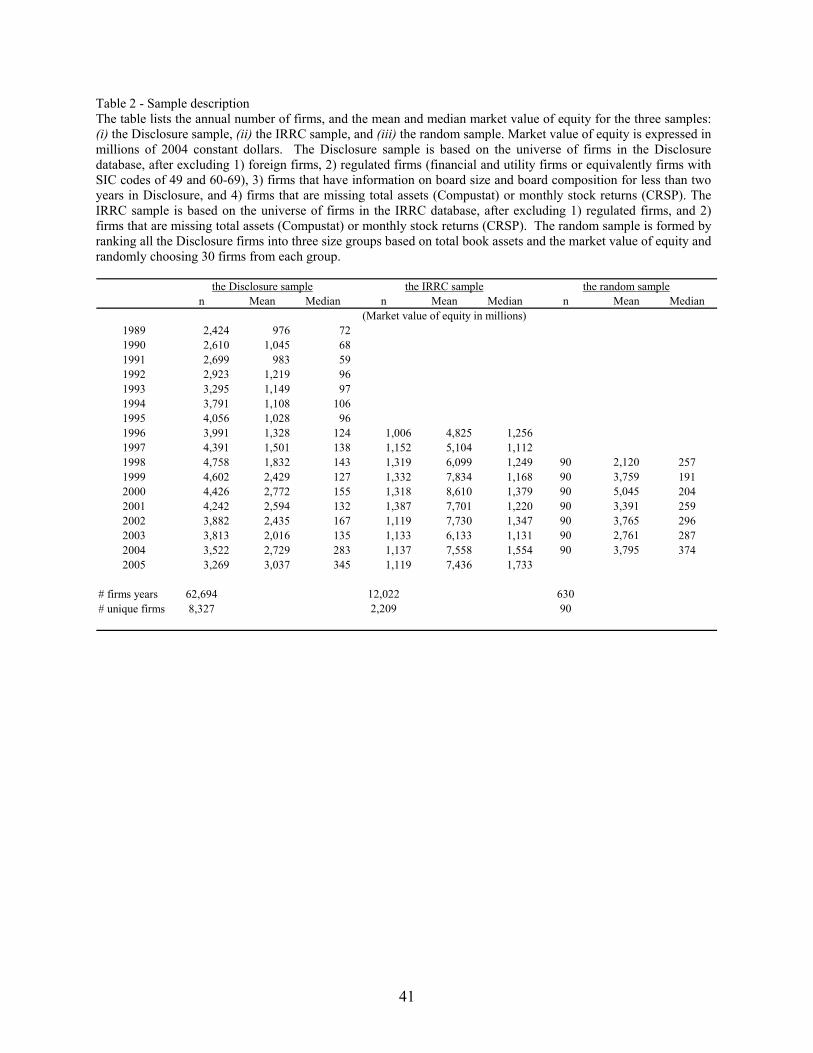
41
Table 2 - Sample description The table lists the annual number of firms, and the mean and median market value of equity for the three samples: (i) the Disclosure sample, (ii) the IRRC sample, and (iii) the random sample. Market value of equity is expressed in millions of 2004 constant dollars. The Disclosure sample is based on the universe of firms in the Disclosure database, after excluding 1) foreign firms, 2) regulated firms (financial and utility firms or equivalently firms with SIC codes of 49 and 60-69), 3) firms that have information on board size and board composition for less than two years in Disclosure, and 4) firms that are missing total assets (Compustat) or monthly stock returns (CRSP). The IRRC sample is based on the universe of firms in the IRRC database, after excluding 1) regulated firms, and 2) firms that are missing total assets (Compustat) or monthly stock returns (CRSP). The random sample is formed by ranking all the Disclosure firms into three size groups based on total book assets and the market value of equity and randomly choosing 30 firms from each group.
n Mean Median n Mean Median n Mean Median
1989 2,424 976 721990 2,610 1,045 681991 2,699 983 591992 2,923 1,219 961993 3,295 1,149 971994 3,791 1,108 1061995 4,056 1,028 961996 3,991 1,328 124 1,006 4,825 1,2561997 4,391 1,501 138 1,152 5,104 1,1121998 4,758 1,832 143 1,319 6,099 1,249 90 2,120 2571999 4,602 2,429 127 1,332 7,834 1,168 90 3,759 1912000 4,426 2,772 155 1,318 8,610 1,379 90 5,045 2042001 4,242 2,594 132 1,387 7,701 1,220 90 3,391 2592002 3,882 2,435 167 1,119 7,730 1,347 90 3,765 2962003 3,813 2,016 135 1,133 6,133 1,131 90 2,761 2872004 3,522 2,729 283 1,137 7,558 1,554 90 3,795 3742005 3,269 3,037 345 1,119 7,436 1,733
# firms years 62,694 12,022 630# unique firms 8,327 2,209 90
(Market value of equity in millions)
the Disclosure sample the IRRC sample the random sample
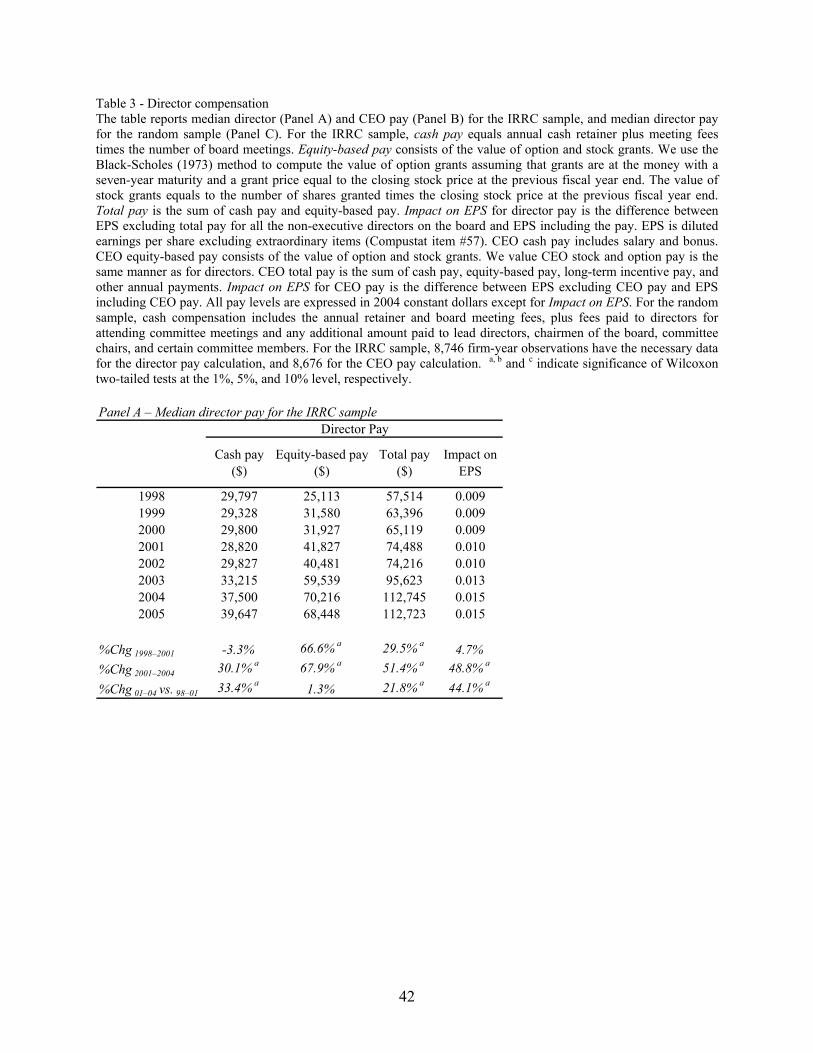
42
Table 3 - Director compensation The table reports median director (Panel A) and CEO pay (Panel B) for the IRRC sample, and median director pay for the random sample (Panel C). For the IRRC sample, cash pay equals annual cash retainer plus meeting fees times the number of board meetings. Equity-based pay consists of the value of option and stock grants. We use the Black-Scholes (1973) method to compute the value of option grants assuming that grants are at the money with a seven-year maturity and a grant price equal to the closing stock price at the previous fiscal year end. The value of stock grants equals to the number of shares granted times the closing stock price at the previous fiscal year end. Total pay is the sum of cash pay and equity-based pay. Impact on EPS for director pay is the difference between EPS excluding total pay for all the non-executive directors on the board and EPS including the pay. EPS is diluted earnings per share excluding extraordinary items (Compustat item #57). CEO cash pay includes salary and bonus. CEO equity-based pay consists of the value of option and stock grants. We value CEO stock and option pay is the same manner as for directors. CEO total pay is the sum of cash pay, equity-based pay, long-term incentive pay, and other annual payments. Impact on EPS for CEO pay is the difference between EPS excluding CEO pay and EPS including CEO pay. All pay levels are expressed in 2004 constant dollars except for Impact on EPS. For the random sample, cash compensation includes the annual retainer and board meeting fees, plus fees paid to directors for attending committee meetings and any additional amount paid to lead directors, chairmen of the board, committee chairs, and certain committee members. For the IRRC sample, 8,746 firm-year observations have the necessary data for the director pay calculation, and 8,676 for the CEO pay calculation. a, b and c indicate significance of Wilcoxon two-tailed tests at the 1%, 5%, and 10% level, respectively. Panel A – Median director pay for the IRRC sample
Cash pay ($)
Equity-based pay ($)
Total pay ($)
Impact on EPS
1998 29,797 25,113 57,514 0.0091999 29,328 31,580 63,396 0.0092000 29,800 31,927 65,119 0.0092001 28,820 41,827 74,488 0.0102002 29,827 40,481 74,216 0.0102003 33,215 59,539 95,623 0.0132004 37,500 70,216 112,745 0.0152005 39,647 68,448 112,723 0.015
%Chg 1998–2001 -3.3% 66.6% a 29.5% a 4.7%%Chg 2001–2004 30.1% a 67.9% a 51.4% a 48.8% a
%Chg 01–04 vs. 98–01 33.4% a 1.3% 21.8% a 44.1% a
Director Pay
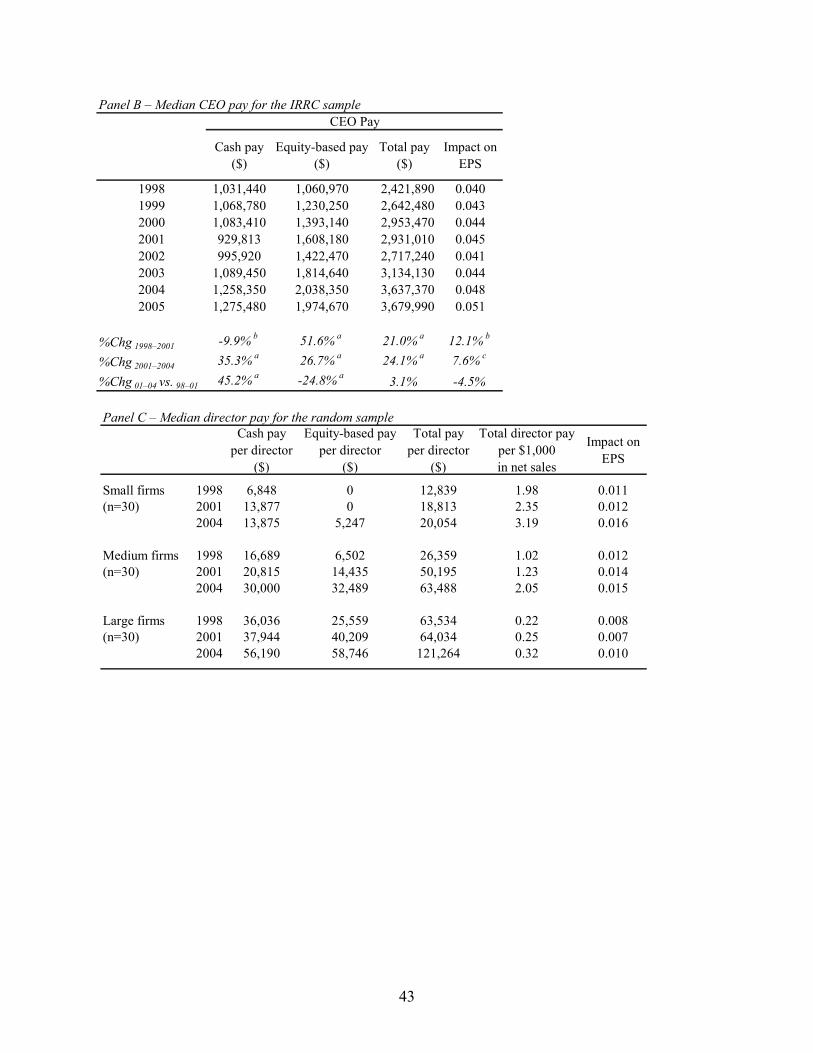
43
Panel B – Median CEO pay for the IRRC sample
Cash pay ($)
Equity-based pay ($)
Total pay ($)
Impact on EPS
1998 1,031,440 1,060,970 2,421,890 0.0401999 1,068,780 1,230,250 2,642,480 0.0432000 1,083,410 1,393,140 2,953,470 0.0442001 929,813 1,608,180 2,931,010 0.0452002 995,920 1,422,470 2,717,240 0.0412003 1,089,450 1,814,640 3,134,130 0.0442004 1,258,350 2,038,350 3,637,370 0.0482005 1,275,480 1,974,670 3,679,990 0.051
%Chg 1998–2001 -9.9% b 51.6% a 21.0% a 12.1% b
%Chg 2001–2004 35.3% a 26.7% a 24.1% a 7.6% c
%Chg 01–04 vs. 98–01 45.2% a -24.8% a 3.1% -4.5%
CEO Pay
Panel C – Median director pay for the random sample Cash pay
per director($)
Equity-based payper director
($)
Total pay per director
($)
Total director pay per $1,000 in net sales
Impact on EPS
Small firms 1998 6,848 0 12,839 1.98 0.011(n=30) 2001 13,877 0 18,813 2.35 0.012
2004 13,875 5,247 20,054 3.19 0.016
Medium firms 1998 16,689 6,502 26,359 1.02 0.012(n=30) 2001 20,815 14,435 50,195 1.23 0.014
2004 30,000 32,489 63,488 2.05 0.015
Large firms 1998 36,036 25,559 63,534 0.22 0.008(n=30) 2001 37,944 40,209 64,034 0.25 0.007
2004 56,190 58,746 121,264 0.32 0.010
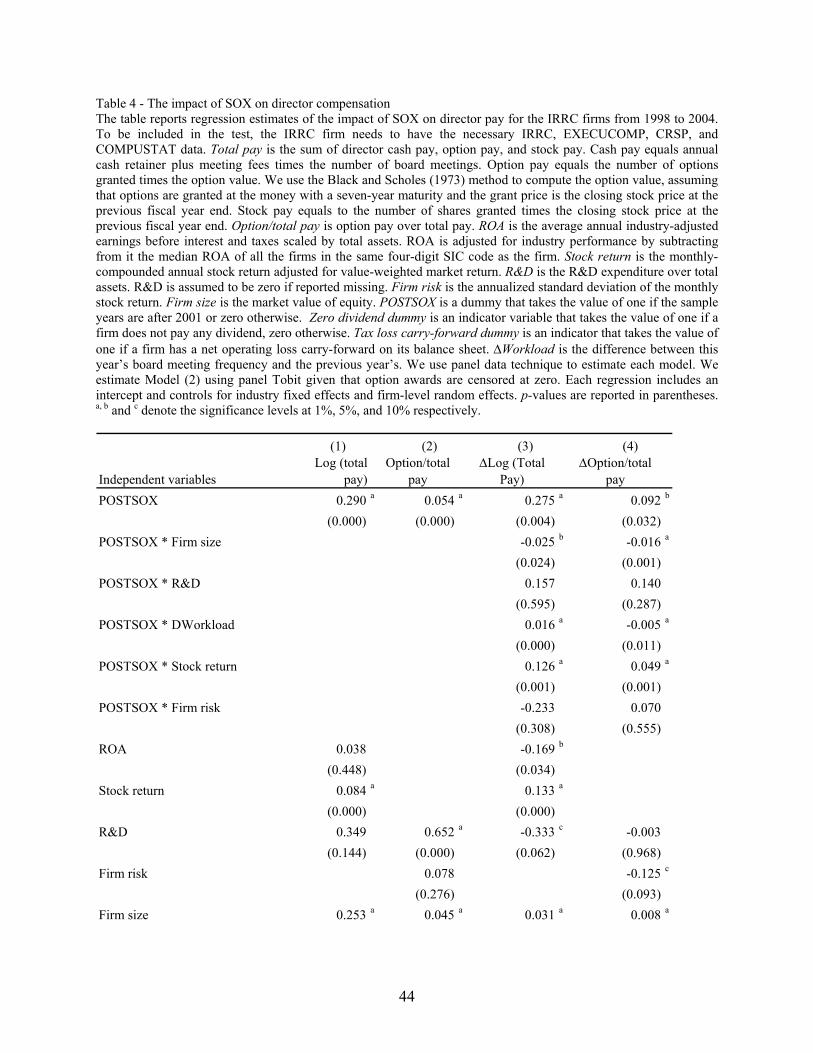
44
Table 4 - The impact of SOX on director compensation The table reports regression estimates of the impact of SOX on director pay for the IRRC firms from 1998 to 2004. To be included in the test, the IRRC firm needs to have the necessary IRRC, EXECUCOMP, CRSP, and COMPUSTAT data. Total pay is the sum of director cash pay, option pay, and stock pay. Cash pay equals annual cash retainer plus meeting fees times the number of board meetings. Option pay equals the number of options granted times the option value. We use the Black and Scholes (1973) method to compute the option value, assuming that options are granted at the money with a seven-year maturity and the grant price is the closing stock price at the previous fiscal year end. Stock pay equals to the number of shares granted times the closing stock price at the previous fiscal year end. Option/total pay is option pay over total pay. ROA is the average annual industry-adjusted earnings before interest and taxes scaled by total assets. ROA is adjusted for industry performance by subtracting from it the median ROA of all the firms in the same four-digit SIC code as the firm. Stock return is the monthly-compounded annual stock return adjusted for value-weighted market return. R&D is the R&D expenditure over total assets. R&D is assumed to be zero if reported missing. Firm risk is the annualized standard deviation of the monthly stock return. Firm size is the market value of equity. POSTSOX is a dummy that takes the value of one if the sample years are after 2001 or zero otherwise. Zero dividend dummy is an indicator variable that takes the value of one if a firm does not pay any dividend, zero otherwise. Tax loss carry-forward dummy is an indicator that takes the value of one if a firm has a net operating loss carry-forward on its balance sheet. ΔWorkload is the difference between this year’s board meeting frequency and the previous year’s. We use panel data technique to estimate each model. We estimate Model (2) using panel Tobit given that option awards are censored at zero. Each regression includes an intercept and controls for industry fixed effects and firm-level random effects. p-values are reported in parentheses. a, b and c denote the significance levels at 1%, 5%, and 10% respectively.
(1) (2) (3) (4)
Independent variablesLog (total
pay)Option/total
payΔLog (Total
Pay)ΔOption/total
payPOSTSOX 0.290 a 0.054 a 0.275 a 0.092 b
(0.000) (0.000) (0.004) (0.032)POSTSOX * Firm size -0.025 b -0.016 a
(0.024) (0.001)POSTSOX * R&D 0.157 0.140
(0.595) (0.287)POSTSOX * DWorkload 0.016 a -0.005 a
(0.000) (0.011)POSTSOX * Stock return 0.126 a 0.049 a
(0.001) (0.001)POSTSOX * Firm risk -0.233 0.070
(0.308) (0.555)ROA 0.038 -0.169 b
(0.448) (0.034)Stock return 0.084 a 0.133 a
(0.000) (0.000)R&D 0.349 0.652 a -0.333 c -0.003
(0.144) (0.000) (0.062) (0.968)Firm risk 0.078 -0.125 c
(0.276) (0.093)Firm size 0.253 a 0.045 a 0.031 a 0.008 a
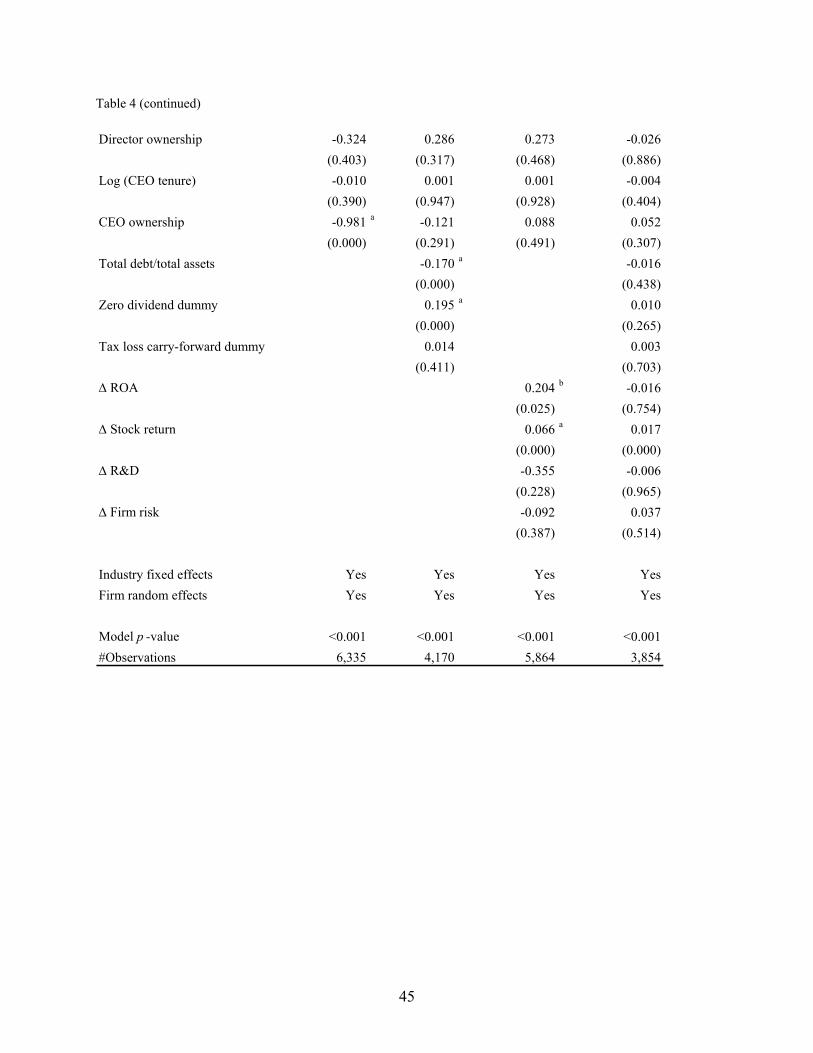
45
Table 4 (continued) Director ownership -0.324 0.286 0.273 -0.026
(0.403) (0.317) (0.468) (0.886)Log (CEO tenure) -0.010 0.001 0.001 -0.004
(0.390) (0.947) (0.928) (0.404)CEO ownership -0.981 a -0.121 0.088 0.052
(0.000) (0.291) (0.491) (0.307)Total debt/total assets -0.170 a -0.016
(0.000) (0.438)Zero dividend dummy 0.195 a 0.010
(0.000) (0.265)Tax loss carry-forward dummy 0.014 0.003
(0.411) (0.703)Δ ROA 0.204 b -0.016
(0.025) (0.754)Δ Stock return 0.066 a 0.017
(0.000) (0.000)Δ R&D -0.355 -0.006
(0.228) (0.965)Δ Firm risk -0.092 0.037
(0.387) (0.514)
Industry fixed effects Yes Yes Yes YesFirm random effects Yes Yes Yes Yes
Model p -value <0.001 <0.001 <0.001 <0.001#Observations 6,335 4,170 5,864 3,854
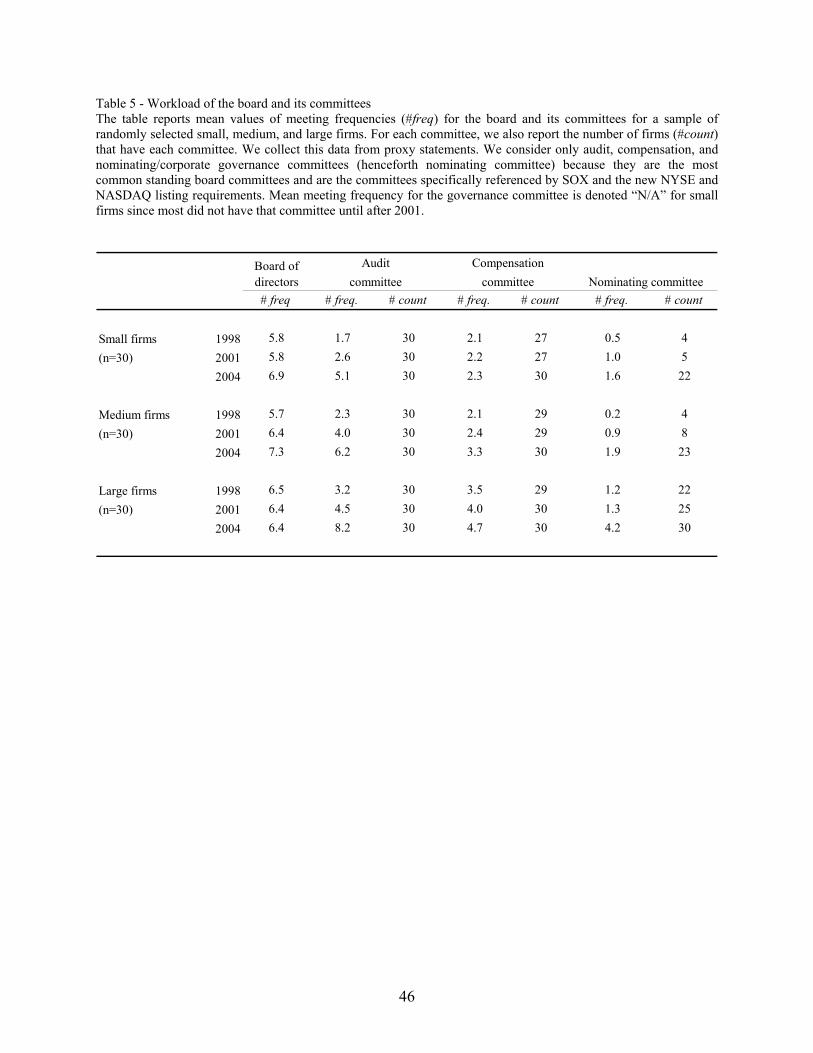
46
Table 5 - Workload of the board and its committees The table reports mean values of meeting frequencies (#freq) for the board and its committees for a sample of randomly selected small, medium, and large firms. For each committee, we also report the number of firms (#count) that have each committee. We collect this data from proxy statements. We consider only audit, compensation, and nominating/corporate governance committees (henceforth nominating committee) because they are the most common standing board committees and are the committees specifically referenced by SOX and the new NYSE and NASDAQ listing requirements. Mean meeting frequency for the governance committee is denoted “N/A” for small firms since most did not have that committee until after 2001.
# freq # freq. # count # freq. # count # freq. # count
Small firms 1998 5.8 1.7 30 2.1 27 0.5 4(n=30) 2001 5.8 2.6 30 2.2 27 1.0 5
2004 6.9 5.1 30 2.3 30 1.6 22
Medium firms 1998 5.7 2.3 30 2.1 29 0.2 4(n=30) 2001 6.4 4.0 30 2.4 29 0.9 8
2004 7.3 6.2 30 3.3 30 1.9 23
Large firms 1998 6.5 3.2 30 3.5 29 1.2 22(n=30) 2001 6.4 4.5 30 4.0 30 1.3 25
2004 6.4 8.2 30 4.7 30 4.2 30
Compensationcommittee Nominating committee
Board of directors
Auditcommittee
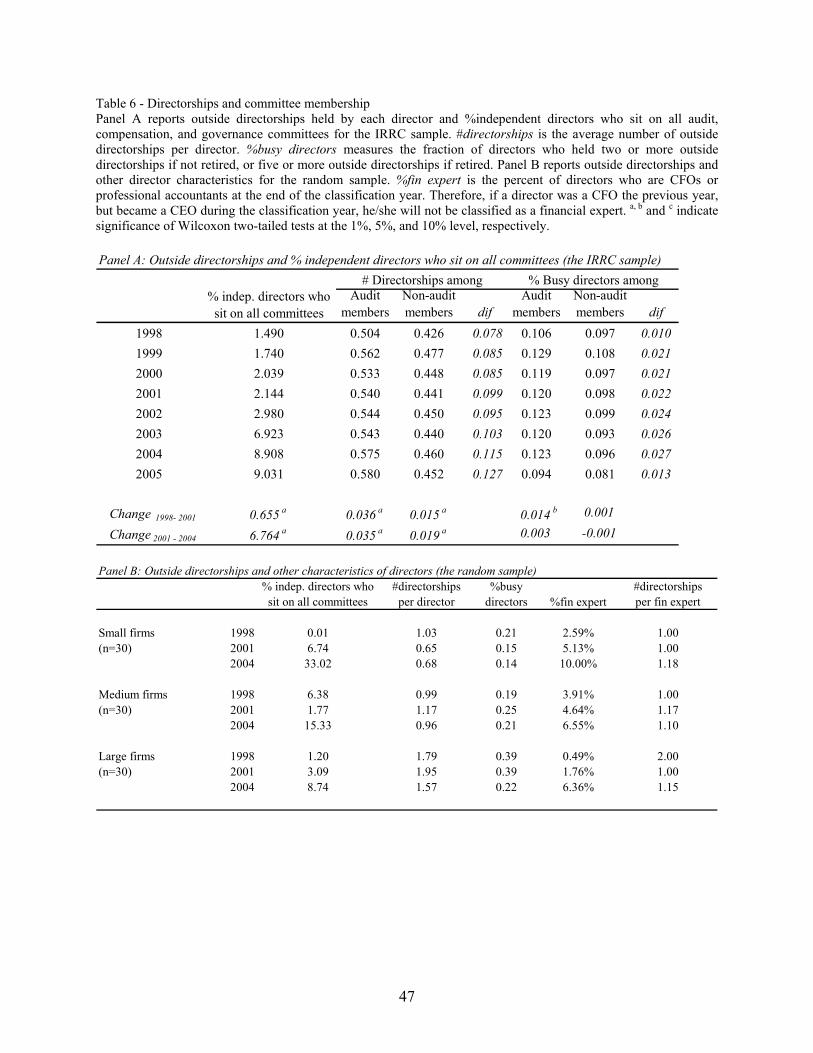
47
Table 6 - Directorships and committee membership Panel A reports outside directorships held by each director and %independent directors who sit on all audit, compensation, and governance committees for the IRRC sample. #directorships is the average number of outside directorships per director. %busy directors measures the fraction of directors who held two or more outside directorships if not retired, or five or more outside directorships if retired. Panel B reports outside directorships and other director characteristics for the random sample. %fin expert is the percent of directors who are CFOs or professional accountants at the end of the classification year. Therefore, if a director was a CFO the previous year, but became a CEO during the classification year, he/she will not be classified as a financial expert. a, b and c indicate significance of Wilcoxon two-tailed tests at the 1%, 5%, and 10% level, respectively. Panel A: Outside directorships and % independent directors who sit on all committees (the IRRC sample)
Audit members
Non-audit members dif
Audit members
Non-audit members dif
1998 1.490 0.504 0.426 0.078 0.106 0.097 0.0101999 1.740 0.562 0.477 0.085 0.129 0.108 0.0212000 2.039 0.533 0.448 0.085 0.119 0.097 0.0212001 2.144 0.540 0.441 0.099 0.120 0.098 0.0222002 2.980 0.544 0.450 0.095 0.123 0.099 0.0242003 6.923 0.543 0.440 0.103 0.120 0.093 0.0262004 8.908 0.575 0.460 0.115 0.123 0.096 0.0272005 9.031 0.580 0.452 0.127 0.094 0.081 0.013
Change 1998- 2001 0.655 a 0.036 a 0.015 a 0.014 b 0.001
Change 2001 - 2004 6.764 a 0.035 a 0.019 a 0.003 -0.001
% indep. directors who sit on all committees
% Busy directors among# Directorships among
Panel B: Outside directorships and other characteristics of directors (the random sample)
% indep. directors who sit on all committees
#directorships per director
%busy directors %fin expert
#directorships per fin expert
Small firms 1998 0.01 1.03 0.21 2.59% 1.00(n=30) 2001 6.74 0.65 0.15 5.13% 1.00
2004 33.02 0.68 0.14 10.00% 1.18
Medium firms 1998 6.38 0.99 0.19 3.91% 1.00(n=30) 2001 1.77 1.17 0.25 4.64% 1.17
2004 15.33 0.96 0.21 6.55% 1.10
Large firms 1998 1.20 1.79 0.39 0.49% 2.00(n=30) 2001 3.09 1.95 0.39 1.76% 1.00
2004 8.74 1.57 0.22 6.36% 1.15
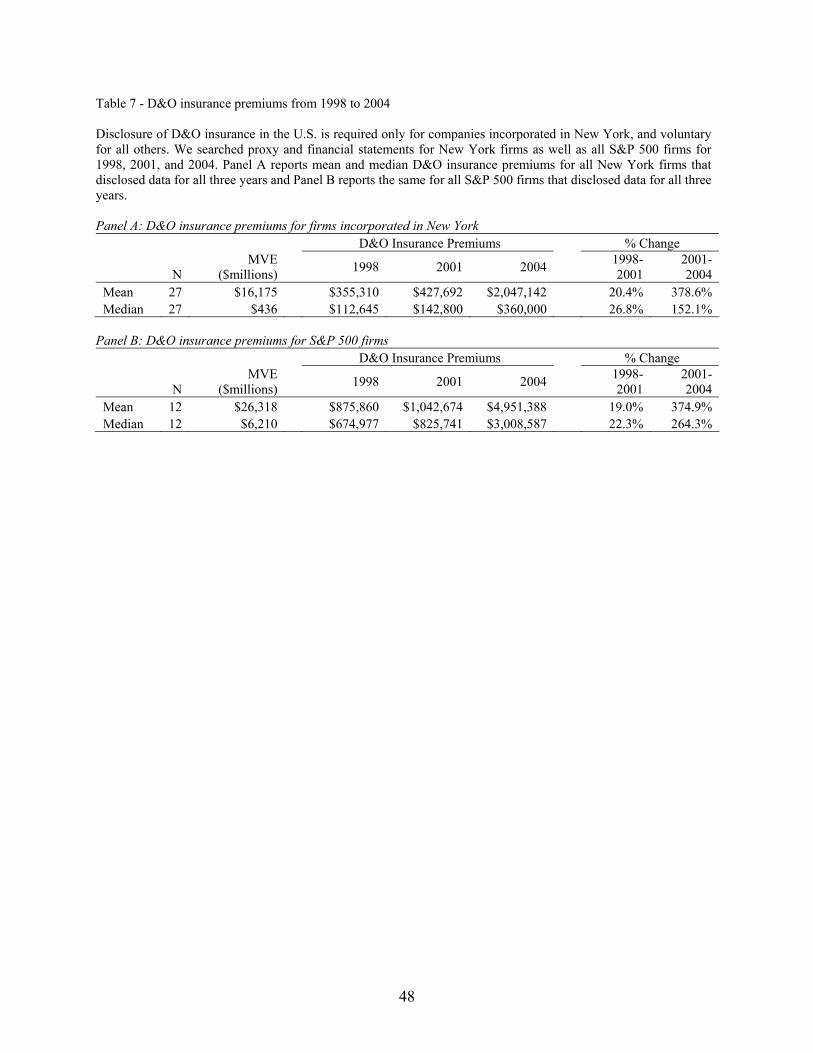
48
Table 7 - D&O insurance premiums from 1998 to 2004 Disclosure of D&O insurance in the U.S. is required only for companies incorporated in New York, and voluntary for all others. We searched proxy and financial statements for New York firms as well as all S&P 500 firms for 1998, 2001, and 2004. Panel A reports mean and median D&O insurance premiums for all New York firms that disclosed data for all three years and Panel B reports the same for all S&P 500 firms that disclosed data for all three years. Panel A: D&O insurance premiums for firms incorporated in New York
D&O Insurance Premiums % Change
N MVE
($millions) 1998 2001 2004 1998-2001
2001-2004
Mean 27 $16,175 $355,310 $427,692 $2,047,142 20.4% 378.6% Median 27 $436 $112,645 $142,800 $360,000 26.8% 152.1%
Panel B: D&O insurance premiums for S&P 500 firms
D&O Insurance Premiums % Change
N MVE
($millions) 1998 2001 2004 1998-2001
2001-2004
Mean 12 $26,318 $875,860 $1,042,674 $4,951,388 19.0% 374.9% Median 12 $6,210 $674,977 $825,741 $3,008,587 22.3% 264.3%
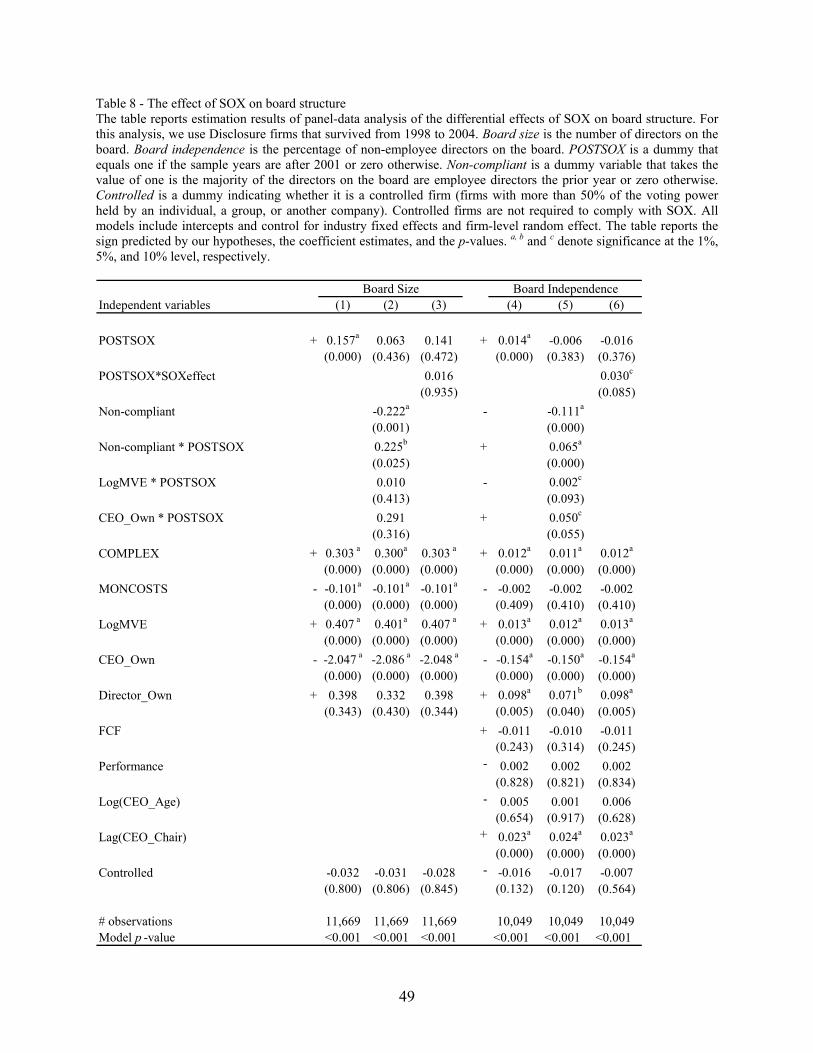
49
Table 8 - The effect of SOX on board structure The table reports estimation results of panel-data analysis of the differential effects of SOX on board structure. For this analysis, we use Disclosure firms that survived from 1998 to 2004. Board size is the number of directors on the board. Board independence is the percentage of non-employee directors on the board. POSTSOX is a dummy that equals one if the sample years are after 2001 or zero otherwise. Non-compliant is a dummy variable that takes the value of one is the majority of the directors on the board are employee directors the prior year or zero otherwise. Controlled is a dummy indicating whether it is a controlled firm (firms with more than 50% of the voting power held by an individual, a group, or another company). Controlled firms are not required to comply with SOX. All models include intercepts and control for industry fixed effects and firm-level random effect. The table reports the sign predicted by our hypotheses, the coefficient estimates, and the p-values. a, b and c denote significance at the 1%, 5%, and 10% level, respectively.
Independent variables (1) (2) (3) (4) (5) (6)
POSTSOX + 0.157a 0.063 0.141 + 0.014a -0.006 -0.016(0.000) (0.436) (0.472) (0.000) (0.383) (0.376)
POSTSOX*SOXeffect 0.016 0.030c
(0.935) (0.085)Non-compliant -0.222a - -0.111a
(0.001) (0.000)Non-compliant * POSTSOX 0.225b + 0.065a
(0.025) (0.000)LogMVE * POSTSOX 0.010 - 0.002c
(0.413) (0.093)CEO_Own * POSTSOX 0.291 + 0.050c
(0.316) (0.055)COMPLEX + 0.303 a 0.300a 0.303 a + 0.012a 0.011a 0.012a
(0.000) (0.000) (0.000) (0.000) (0.000) (0.000)MONCOSTS - -0.101a -0.101a -0.101a - -0.002 -0.002 -0.002
(0.000) (0.000) (0.000) (0.409) (0.410) (0.410)LogMVE + 0.407 a 0.401a 0.407 a + 0.013a 0.012a 0.013a
(0.000) (0.000) (0.000) (0.000) (0.000) (0.000)CEO_Own - -2.047 a -2.086 a -2.048 a - -0.154a -0.150a -0.154a
(0.000) (0.000) (0.000) (0.000) (0.000) (0.000)Director_Own + 0.398 0.332 0.398 + 0.098a 0.071b 0.098a
(0.343) (0.430) (0.344) (0.005) (0.040) (0.005)FCF + -0.011 -0.010 -0.011
(0.243) (0.314) (0.245)Performance - 0.002 0.002 0.002
(0.828) (0.821) (0.834)Log(CEO_Age) - 0.005 0.001 0.006
(0.654) (0.917) (0.628)Lag(CEO_Chair) + 0.023a 0.024a 0.023a
(0.000) (0.000) (0.000)Controlled -0.032 -0.031 -0.028 - -0.016 -0.017 -0.007
(0.800) (0.806) (0.845) (0.132) (0.120) (0.564)
# observations 11,669 11,669 11,669 10,049 10,049 10,049Model p -value <0.001 <0.001 <0.001 <0.001 <0.001 <0.001
Board Size Board Independence
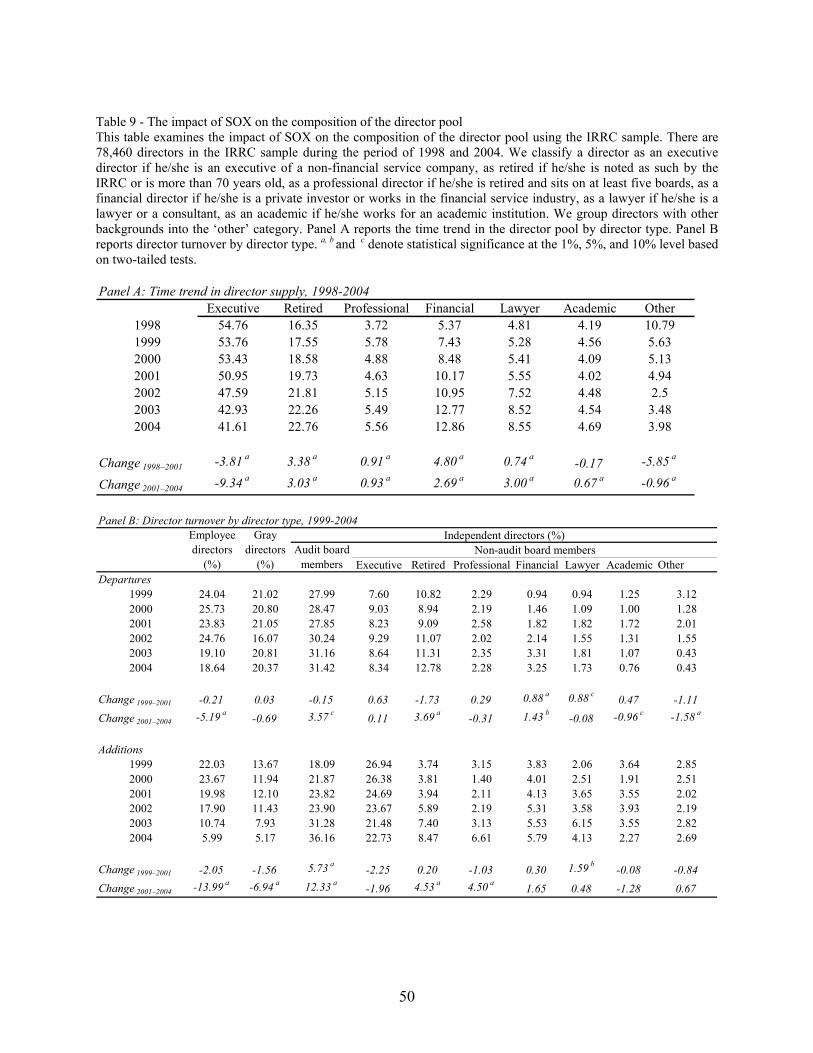
50
Table 9 - The impact of SOX on the composition of the director pool This table examines the impact of SOX on the composition of the director pool using the IRRC sample. There are 78,460 directors in the IRRC sample during the period of 1998 and 2004. We classify a director as an executive director if he/she is an executive of a non-financial service company, as retired if he/she is noted as such by the IRRC or is more than 70 years old, as a professional director if he/she is retired and sits on at least five boards, as a financial director if he/she is a private investor or works in the financial service industry, as a lawyer if he/she is a lawyer or a consultant, as an academic if he/she works for an academic institution. We group directors with other backgrounds into the ‘other’ category. Panel A reports the time trend in the director pool by director type. Panel B reports director turnover by director type. a, b and c denote statistical significance at the 1%, 5%, and 10% level based on two-tailed tests. Panel A: Time trend in director supply, 1998-2004
Executive Retired Professional Financial Lawyer Academic Other1998 54.76 16.35 3.72 5.37 4.81 4.19 10.791999 53.76 17.55 5.78 7.43 5.28 4.56 5.632000 53.43 18.58 4.88 8.48 5.41 4.09 5.132001 50.95 19.73 4.63 10.17 5.55 4.02 4.942002 47.59 21.81 5.15 10.95 7.52 4.48 2.52003 42.93 22.26 5.49 12.77 8.52 4.54 3.482004 41.61 22.76 5.56 12.86 8.55 4.69 3.98
Change 1998–2001 -3.81 a 3.38 a 0.91 a 4.80 a 0.74 a -0.17 -5.85 a
Change 2001–2004 -9.34 a 3.03 a 0.93 a 2.69 a 3.00 a 0.67 a -0.96 a
Panel B: Director turnover by director type, 1999-2004
Executive Retired Professional Financial Lawyer Academic OtherDepartures
1999 24.04 21.02 27.99 7.60 10.82 2.29 0.94 0.94 1.25 3.122000 25.73 20.80 28.47 9.03 8.94 2.19 1.46 1.09 1.00 1.282001 23.83 21.05 27.85 8.23 9.09 2.58 1.82 1.82 1.72 2.012002 24.76 16.07 30.24 9.29 11.07 2.02 2.14 1.55 1.31 1.552003 19.10 20.81 31.16 8.64 11.31 2.35 3.31 1.81 1.07 0.432004 18.64 20.37 31.42 8.34 12.78 2.28 3.25 1.73 0.76 0.43
Change 1999–2001 -0.21 0.03 -0.15 0.63 -1.73 0.29 0.88 a 0.88 c 0.47 -1.11Change 2001–2004 -5.19 a -0.69 3.57 c 0.11 3.69 a -0.31 1.43 b -0.08 -0.96 c -1.58 a
Additions1999 22.03 13.67 18.09 26.94 3.74 3.15 3.83 2.06 3.64 2.852000 23.67 11.94 21.87 26.38 3.81 1.40 4.01 2.51 1.91 2.512001 19.98 12.10 23.82 24.69 3.94 2.11 4.13 3.65 3.55 2.022002 17.90 11.43 23.90 23.67 5.89 2.19 5.31 3.58 3.93 2.192003 10.74 7.93 31.28 21.48 7.40 3.13 5.53 6.15 3.55 2.822004 5.99 5.17 36.16 22.73 8.47 6.61 5.79 4.13 2.27 2.69
Change 1999–2001 -2.05 -1.56 5.73 a -2.25 0.20 -1.03 0.30 1.59 b -0.08 -0.84Change 2001–2004 -13.99 a -6.94 a 12.33 a -1.96 4.53 a 4.50 a 1.65 0.48 -1.28 0.67
Independent directors (%)Non-audit board members
Employeedirectors
(%)
Gray directors
(%)Audit board
members


![20110712 Unintended Consequences 12[1].07](https://img.pdfslide.us/doc/110x75/577d278b1a28ab4e1ea429b5/20110712-unintended-consequences-12107.jpg)