Embed Size (px)
Citation preview
School of Psychology and Speech Pathology
The effectiveness of PROMPT therapy for children
with Cerebral Palsy
Roslyn Ward
This thesis is presented for the Degree of
Doctor of Philosophy
of
Curtin University
April 2012


THE EFFECTIVENESS OF PROMPT
i
Declaration
To the best of my knowledge and belief this thesis contains no material previously
published by any other person except where due acknowledgment has been made.
This thesis contains no material which has been accepted for the award of any other
degree or diploma in any university.
Roslyn Ward Signature…………………………………. Date………………………………………
THE EFFECTIVENESS OF PROMPT
ii
Acknowledgements
“intellectual development and personal growth do not occur if there is no
disequilibrim in a person’s current thinking or feeling”(Panicucci, 2007).
The undertaking of this thesis was made possible by the support and contributions of
many, to whom I owe much gratitude. Each person has played a unique and vital
role.
To My Academic Team
Supervisor: Suze Leitão - I feel privileged to have completed this thesis under your
supervision. Thank you for your time, support, guidance and insights. I have
sincerely appreciated your adeptness at keeping me on track, dedication to evidence-
based practice, and editorial expertise.
Co-supervisor: Geoff Strauss - The kinematic analysis would not have been possible
without your expertise. Thank you for your assistance, guidance and attention to
detail. I have valued your patience, particularly in explaining some of the key
principles.
Research Assistant: Paul Davey - Thank you for your instruction in the Peak Motus
system, writing the programs that enabled the kinematic analysis; and the creation of
the visual animations. I also want to acknowledge your persistence in problem
solving glitches along the way.
Statistician: Peter McKinnon - Thank you for your assistance and willingness to
repeatedly answer my questions with such patience and humour.
Thanks also go to Associate Professor Anne Ozanne and Dr. Beverly Joffe at
LaTrobe University, where this journey commenced.
To My Colleagues
Elizabeth Barty - You have been a great source of support and mentoring. Thank
you for being instrumental in facilitating the availability of resources that made the
intervention study possible.
Georgina Jones - Thank you for undertaking and completing the practical aspects of
this study: from logistics to data preparation and de-identification. I am most
grateful for your commitment to rigor and exactness.

THE EFFECTIVENESS OF PROMPT
iii
Michael Chan - Thank you for inspiring me to pursue a deeper understanding of
movement disorders.
The Therapists at the Centre for Cerebral Palsy - Thanks go to the therapists who
administered the PROMPT intervention protocols. Their commitment to undertake
the PROMPT training and dedication to administering the therapy protocols is
gratefully acknowledged.
Deborah Hayden (PROMPT Institute) – Thank you for your support throughout the
process, in particular for conferring on the participant intervention protocols and
priorities, providing therapist training during the mentoring day and fidelity protocol.
Linda Orton and Meg Houghton - Thank you for your professionalism, commitment
and attention to detail. I would like to express my gratitude for the vital roles you
fulfilled as independent scorers, thus allowing me to remain blinded during the
analyses.
Marie Blackmore - Thank you for support and assistance during the early phases of
this thesis when the study design and methodology were in development. Your
knowledge and expertise in single subject research design was invaluable.
To The Families Who Participated in This Study
Sincere and deep thanks go to the participants and their families who gave so
generously of their time with such dedication and commitment.
To My Friends and Family
Finally, I wish to thank family members and friends who shared the journey. Special
mention goes to my husband Russell and my daughter April - Your encouragement,
practical support and understanding were instrumental to seeing this thesis across the
finish line.
THE EFFECTIVENESS OF PROMPT
iv
Peer Reviewed Presentations and Publications arising from the Thesis
Ward, R. (2009, Sept). The effectiveness of PROMPT therapy for children
with cerebral palsy. Poster presented at the 63rd American Academy of Cerebral
Palsy and Developmental Medicine (AACPDM) Annual Meeting, Arizona, USA.
Ward, R., Leitão, S., & Strauss, G. (2009). The effectiveness of PROMPT
therapy for children with cerebral palsy [Abstract]. Developmental Medicine and
Child Neurology, 51(S5): 76.
Ward, R. (2011, June). Kinematic changes in jaw and lip control of children
with cerebral palsy following participation in a motor-speech (PROMPT)
intervention. Poster presented at the 6th International Conference on Speech Motor
Control, Groningen, The Netherlands.
Ward, R., Strauss, G., & Leitão, S. (2011). Kinematic changes in jaw and lip
control of children with cerebral palsy following participation in a motor-speech
(PROMPT) intervention [Abstract]. Stem, Spraak en Taalpathologie, 17: 59
Ward, R., Strauss, G., & Leitão, S. (2011). Kinematic changes in jaw and lip
control of children with cerebral palsy following participation in a motor-speech
(PROMPT) intervention. Manuscript in review.
THE EFFECTIVENESS OF PROMPT
v
Abstract
The purpose of this study is to evaluate the effectiveness of a motor speech treatment
approach (PROMPT) in the management of motor-speech impairment in children
with cerebral palsy. Two main objectives were addressed: (1) to evaluate changes in
speech intelligibility and, (2) evaluate changes in kinematic movements of the jaw
and lips using three dimensional (3D) motion analysis.
A single subject multiple-baseline-across-participants research design, with four
phases: Baseline (A1), two intervention phases (B and C) and maintenance (A2), was
implemented.
Six participants, aged 3-to-11-years (3 boys, 3 girls) with moderate to severe speech
impairment were recruited through The Centre for Cerebral Palsy, Western Australia
(TCCP). Inclusion criteria were: diagnosis of cerebral palsy, age 3 – 14 years, stable
head control (supported or independent), spontaneous use of at least 15 words,
speech impairment ≥1.5 standard deviations, hearing loss no greater than 25dB,
developmental quotient ≥70 (Leiter-Brief International Performance Scale R) and no
previous exposure to PROMPT.
Thirteen typically-developing peers were recruited to compare the trend of kinematic
changes in jaw and lip movements to those of the children with cerebral palsy.
Upon achievement of a stable baseline, participants completed two intervention
phases both of 10 weeks duration. Therapist fidelity to the PROMPT approach was
determined by a blinded, independent PROMPT Instructor.
Perceptual outcome measures included the administration of weekly speech probes,
containing trained and untrained vocabulary at the two targeted levels of intervention
plus an additional level. These were analysed for both perceptual accuracy (PA) and
the motor speech movement parameter.
End of phase measures included:
1. Changes in phonetic accuracy as measured using a measure of percentage
phonemes correct;
THE EFFECTIVENESS OF PROMPT
vi
2. Speech intelligibility measures, using a standardised assessment tool; and
3. Changes to activity/participation using the Canadian Occupational Performance
Measure (COPM).
Kinematic data were collected at the end of each study phase using 3D motion
analysis (Vicon Motus 9.1). This involved the collection of jaw and lip
measurements of distance, duration and velocity, during the production of 11
untrained stimulus words. The words contained vowels that spanned the articulatory
space and represented motor-speech movement patterns at the level of mandibular
and labial-facial control, as classified according to the PROMPT motor speech
hierarchy.
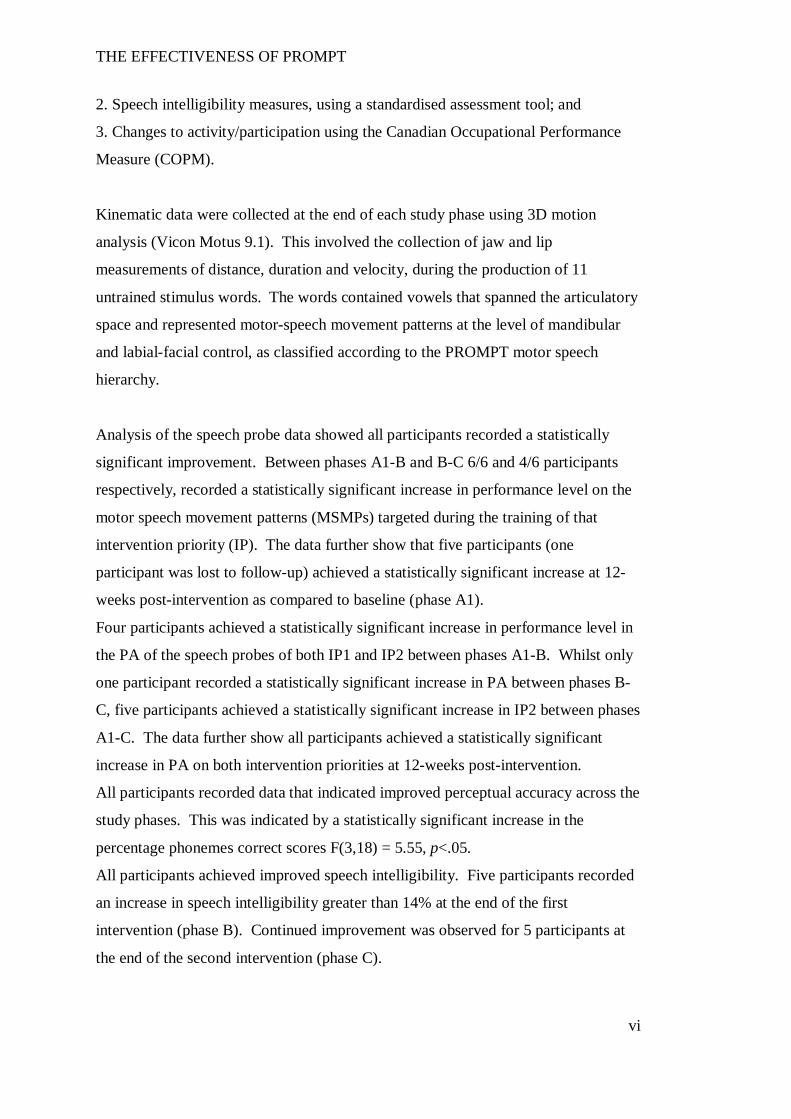
Analysis of the speech probe data showed all participants recorded a statistically
significant improvement. Between phases A1-B and B-C 6/6 and 4/6 participants
respectively, recorded a statistically significant increase in performance level on the
motor speech movement patterns (MSMPs) targeted during the training of that
intervention priority (IP). The data further show that five participants (one
participant was lost to follow-up) achieved a statistically significant increase at 12-
weeks post-intervention as compared to baseline (phase A1).
Four participants achieved a statistically significant increase in performance level in
the PA of the speech probes of both IP1 and IP2 between phases A1-B. Whilst only
one participant recorded a statistically significant increase in PA between phases B-
C, five participants achieved a statistically significant increase in IP2 between phases
A1-C. The data further show all participants achieved a statistically significant
increase in PA on both intervention priorities at 12-weeks post-intervention.
All participants recorded data that indicated improved perceptual accuracy across the
study phases. This was indicated by a statistically significant increase in the
percentage phonemes correct scores F(3,18) = 5.55, p<.05.
All participants achieved improved speech intelligibility. Five participants recorded
an increase in speech intelligibility greater than 14% at the end of the first
intervention (phase B). Continued improvement was observed for 5 participants at
the end of the second intervention (phase C).
THE EFFECTIVENESS OF PROMPT
vii
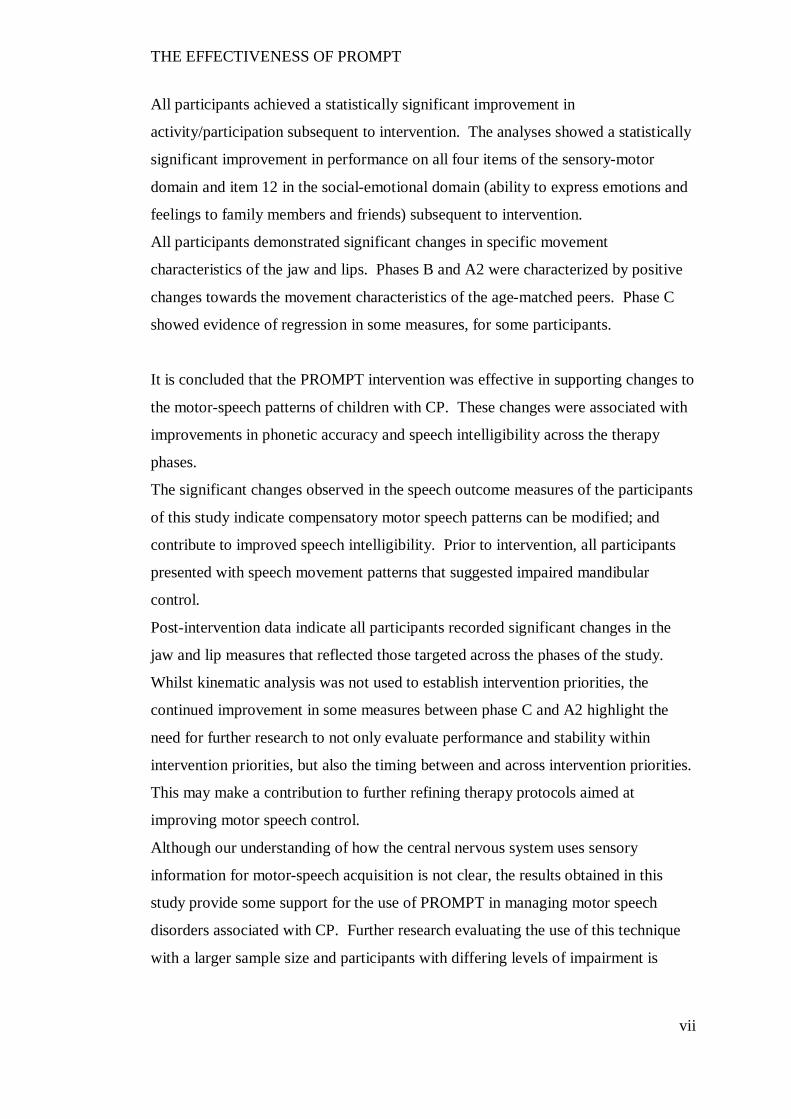
All participants achieved a statistically significant improvement in
activity/participation subsequent to intervention. The analyses showed a statistically
significant improvement in performance on all four items of the sensory-motor
domain and item 12 in the social-emotional domain (ability to express emotions and
feelings to family members and friends) subsequent to intervention.
All participants demonstrated significant changes in specific movement
characteristics of the jaw and lips. Phases B and A2 were characterized by positive
changes towards the movement characteristics of the age-matched peers. Phase C
showed evidence of regression in some measures, for some participants.
It is concluded that the PROMPT intervention was effective in supporting changes to
the motor-speech patterns of children with CP. These changes were associated with
improvements in phonetic accuracy and speech intelligibility across the therapy
phases.
The significant changes observed in the speech outcome measures of the participants
of this study indicate compensatory motor speech patterns can be modified; and
contribute to improved speech intelligibility. Prior to intervention, all participants
presented with speech movement patterns that suggested impaired mandibular
control.
Post-intervention data indicate all participants recorded significant changes in the
jaw and lip measures that reflected those targeted across the phases of the study.
Whilst kinematic analysis was not used to establish intervention priorities, the
continued improvement in some measures between phase C and A2 highlight the
need for further research to not only evaluate performance and stability within
intervention priorities, but also the timing between and across intervention priorities.
This may make a contribution to further refining therapy protocols aimed at
improving motor speech control.
Although our understanding of how the central nervous system uses sensory
information for motor-speech acquisition is not clear, the results obtained in this
study provide some support for the use of PROMPT in managing motor speech
disorders associated with CP. Further research evaluating the use of this technique
with a larger sample size and participants with differing levels of impairment is

THE EFFECTIVENESS OF PROMPT
viii
recommended to further develop our understanding of using this approach with
children with CP.
THE EFFECTIVENESS OF PROMPT
ix
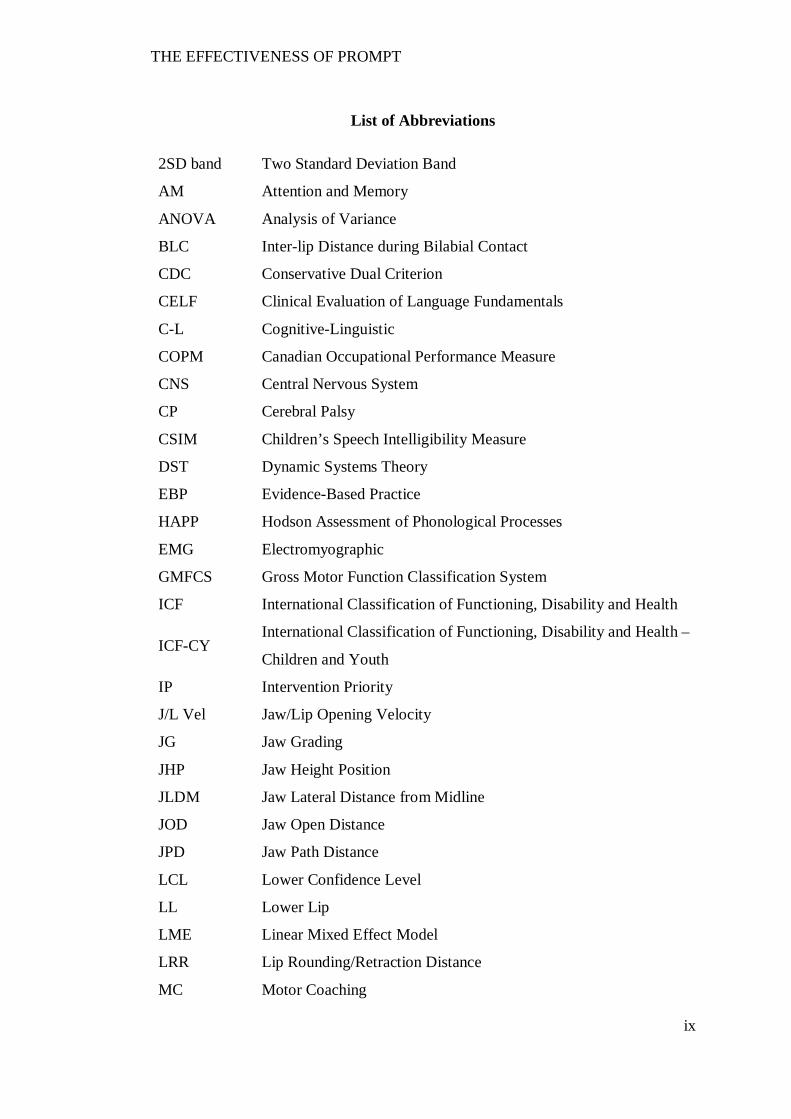
List of Abbreviations
2SD band Two Standard Deviation Band
AM Attention and Memory
ANOVA Analysis of Variance
BLC Inter-lip Distance during Bilabial Contact
CDC Conservative Dual Criterion
CELF Clinical Evaluation of Language Fundamentals
C-L Cognitive-Linguistic
COPM Canadian Occupational Performance Measure
CNS Central Nervous System
CP Cerebral Palsy
CSIM Children’s Speech Intelligibility Measure
DST Dynamic Systems Theory
EBP Evidence-Based Practice
HAPP Hodson Assessment of Phonological Processes
EMG Electromyographic
GMFCS Gross Motor Function Classification System
ICF International Classification of Functioning, Disability and Health
ICF-CY International Classification of Functioning, Disability and Health –
Children and Youth
IP Intervention Priority
J/L Vel Jaw/Lip Opening Velocity
JG Jaw Grading
JHP Jaw Height Position
JLDM Jaw Lateral Distance from Midline
JOD Jaw Open Distance
JPD Jaw Path Distance
LCL Lower Confidence Level
LL Lower Lip
LME Linear Mixed Effect Model
LRR Lip Rounding/Retraction Distance
MC Motor Coaching
THE EFFECTIVENESS OF PROMPT
x
MSH Motor Speech Hierarchy
MSMPs Motor Speech Movement Patterns
NDT Neurodevelopmental Treatment
PA Perceptual Accuracy
PPC Percentage Phonemes Correct
PROMPT Prompts for Restructuring Oral Muscular Phonetic Targets
PPT Phonetic Placement Therapy
P-S Physical-Sensory
SAO Systems Analysis Observation
S-E Social-Emotional
SPC Statistical Process Control
SSRD Single Subject Research Design
TCCP The Centre for Cerebral Palsy
TD Typically Developing
TMS Transcranial Magnetic Stimulation
UCL Upper Confidence Level
UL Upper Lip
VMPAC Verbal Motor Production Assessment of Children
WD Word Duration
WHO World Health Organisation
THE EFFECTIVENESS OF PROMPT
xi
Table of Contents
Declaration ...................................................................................................... i
Acknowledgements ......................................................................................... ii
Peer Reviewed Presentations and Publications arising from the Thesis ........... iv
Abstract .......................................................................................................... v
List of Abbreviations ..................................................................................... ix
Table of Contents ........................................................................................... xi
List of Tables .............................................................................................. xvii
List of Figures ............................................................................................ xxiv
Chapter 1 INTRODUCTION ................................................................................ 1
Chapter 2 LITERATURE REVIEW .................................................................... 9
The ICF Model of Disablement ....................................................................... 9
Cerebral Palsy ............................................................................................... 11
Classification Based on Motor Abnormality ....................................... 12
Activity and Participation ................................................................... 13
Motor Speech Control ................................................................................... 14
Speech Subsystems Coordination........................................................ 14
The Development of Early Motor Speech Control............................... 15
Speech Subsystem Control In Children with Cerebral Palsy ................ 17
PROMPT ...................................................................................................... 19
The Theoretical Basis of PROMPT Approach: Dynamic Systems
Theory (DST). .................................................................................... 24
Neural Plasticity ................................................................................. 29
Motor Learning................................................................................... 32
Evidence to Support PROMPT ........................................................... 43
Chapter 3 RATIONALE AND RESEARCH AIMS FOR THE PRESENT
THESIS ..................................................................................................... 49
Outcome Measures........................................................................................ 50
Structure and Function ........................................................................ 52
Activity and Participation ................................................................... 54
Research Study Overview ............................................................................. 55
Single Subject Research Design .................................................................... 57
Hypotheses ................................................................................................... 60
THE EFFECTIVENESS OF PROMPT
xii
Chapter 4 QUESTION ONE. .............................................................................. 63
IS PROMPT EFFECTIVE IN MAKING CHANGES TO SPEECH
PRODUCTION ACCURACY IN CHILDREN WITH CP WITH
MODERATE- TO-SEVERE SPEECH IMPAIRMENT? ................... 63
Introduction................................................................................................... 63
Method.......................................................................................................... 67
Participants ......................................................................................... 67
Measures ............................................................................................ 71
Intervention programme ...................................................................... 80
Procedure ............................................................................................ 86
Reliability and Fidelity........................................................................ 87
Data Preparation and Generation ......................................................... 87
Phonetic accuracy: Narrow phonetic transcription. ............................. 89
Data Analysis...................................................................................... 90
Results .......................................................................................................... 92
Speech Production Accuracy (Speech Probes)..................................... 92
Participant 1 ........................................................................................ 93
Participant 2 ...................................................................................... 101
Participant 3 ...................................................................................... 110
Participant 4 ...................................................................................... 119
Participant 5 ...................................................................................... 129
Participant 6 ...................................................................................... 137
Summary Overview All Participants ................................................. 147
Phonetic Accuracy ............................................................................ 150
Motor-Speech Control....................................................................... 152
Summary Overview of the Perceptual Measures ............................... 153
Discussion ................................................................................................... 155
Speech Production Accuracy ............................................................. 155
Phonetic Accuracy ............................................................................ 165
Conclusion .................................................................................................. 170
THE EFFECTIVENESS OF PROMPT
xiii
Chapter 5 QUESTION TWO ............................................................................ 171
WILL CHILDREN WITH MODERATE-TO-SEVERE SPEECH
IMPAIRMENTS ASSOCIATED WITH CP SHOW CHANGES IN
DISTANCE, VELOCITY AND DURATION MEASURES OF THE
JAW AND LIPS SUBSEQUENT TO PROMPT INTERVENTION?
........................................................................................................ 171
Introduction ................................................................................................ 171
Method ....................................................................................................... 174
Participants ....................................................................................... 174
Procedure ......................................................................................... 175
Measures .......................................................................................... 177
Stimulus Words ................................................................................ 179
Data Processing ................................................................................ 184
Reliability ......................................................................................... 187
Data Analysis ................................................................................... 188
Results ........................................................................................................ 190
Participant 1 ..................................................................................... 191
Participant 2 ..................................................................................... 205
Participant 3 ..................................................................................... 218
Participant 4 ..................................................................................... 231
Participant 5 ..................................................................................... 245
Participant 6 ..................................................................................... 261
Summary Overview All Participants ................................................. 275
Discussion .................................................................................................. 276
Pre-Existing Motor-Speech Movement Patterns ................................ 277
Motor-Speech Movement Patterns Subsequent to PROMPT ............. 279
Conclusion .................................................................................................. 281
Chapter 6 QUESTION THREE ........................................................................ 283
WILL CHILDREN WITH CP SHOW CHANGES IN THE ACTIVITY AND
PARTICIPATION DOMAINS OF THE ICF SUBSEQUENT TO
PROMPT INTERVENTION? ......................................................... 283
Introduction ................................................................................................ 283
Method ....................................................................................................... 285
THE EFFECTIVENESS OF PROMPT
xiv
Participants ....................................................................................... 285
Measures .......................................................................................... 285
Procedure .......................................................................................... 288
Reliability and Fidelity...................................................................... 288
Data Analysis.................................................................................... 288
Results ........................................................................................................ 289
Speech Intelligibility ......................................................................... 289
Activity and Participation in Daily Routines ..................................... 290
Discussion ................................................................................................... 294
Speech Intelligibility ......................................................................... 294
Activity and Participation.................................................................. 297
Conclusion .................................................................................................. 300
Chapter 7 GENERAL DISCUSSION ............................................................... 302
Overview .................................................................................................... 302
A Systems Approach to Intervention ................................................. 304
Tactile Kinaesthetic Input ................................................................. 306
Kinematic Analysis to Support Perceptual Analysis as an Outcome
Measure ............................................................................................ 308
Study Limitations ........................................................................................ 309
Experimental Control ........................................................................ 309
Kinematics ........................................................................................ 312
Strengths of the Study ................................................................................. 312
Experimental Control ........................................................................ 312
Clinical Implications ................................................................................... 315
A Contribution to the Evidence-Base ................................................ 315
Implications for The Design of Intervention Protocols ...................... 316
Therapist Training............................................................................. 317
Translation of Research into the Clinic.............................................. 318
Future Research .......................................................................................... 319
Treatment Efficacy ........................................................................... 319
The Visual Aspect of Speech Intelligibility ...................................... 321
Principles of Motor Learning ............................................................ 321
The Role of Tactile-Kinaesthetic Input .............................................. 322
THE EFFECTIVENESS OF PROMPT
xv
Conclusion .................................................................................................. 322
References .................................................................................................. 325
APPENDICES ........................................................................................... 360
Appendix A Therapy History Questionnaire ................................................ 361
Appendix B Systems Analysis Observation ................................................. 366
Appendix C Canadian Occupational Performance Measure ......................... 368
Appendix D Speech Probe Wordlists .......................................................... 371
Appendix E Calculations used to Derive the Kinematic Measures ............... 378
Appendix F Position and Anatomical Location of the Facial Markers ......... 379
Appendix G Performance on the Motor Speech Movement Patterns and
Perceptual Accuracy across the Intervention Priorities and Study Phases
for the Participants........................................................................... 380
Appendix H Results obtained on the Canadian Occupational Performance
Measure........................................................................................... 387
Appendix I Descriptive Statistics for the Kinematic Measures of Distance,
Jaw/Lip Opening Velocity and Word Duration for P1 ...................... 392
Appendix J Descriptive Statistics for the Kinematic Measures of Distance,
Jaw/Lip Opening Velocity and Word Duration for P2 ...................... 399
Appendix K Descriptive Statistics for the Kinematic Measures of Distance,
Jaw/Lip Opening Velocity and Word Duration for P3 ...................... 406
Appendix L Descriptive Statistics for the Kinematic Measures of Distance,
Jaw/Lip Opening Velocity and Word Duration for P4 ...................... 413
Appendix M Descriptive Statistics for the Kinematic Measures of Distance,
Jaw/Lip Opening Velocity and Word Duration for P5 ...................... 420
Appendix N Descriptive Statistics for the Kinematic Measures of Distance,
Jaw/Lip Opening Velocity and Word Duration for P6 ...................... 427
Appendix O Copyright Release PROMPT Institute ..................................... 434
THE EFFECTIVENESS OF PROMPT
xvi
List of Tables
Table 2.1 Levels of Evidence and Study Design for Published Paediatric Studies
Evaluating PROMPT ........................................................................... 44
Table 2.2. Methodological Quality of the PROMPT Studies as Assessed using the
SCED Scale ......................................................................................... 45
Table 3.1 Dependent Measures and Methods of Analysis for the Measures used in
this Thesis ............................................................................................ 52
Table 4.1 Participant Characteristics....................................................................... 70
Table 4.2 Assessment Tools used to Evaluate the Dependent Variables .................. 73
Table 4.3 Word Pool for Speech Probes ................................................................ 74
Table 4.4 Summary of the Assessment Measures and Occasions of Testing .......... 76
Table 4.5 Participant Intervention Priorities............................................................ 82
Table 4.6 Number of Sessions Attended by each Participant across the Study Phases
............................................................................................................ 83
Table 4.7 Therapist Assigned to each Participant, and Level of Training ................ 86
Table 4.8 P1’s Intervention Priorities and Number of Sessions Attended ................ 93
Table 4.9 Mean Percent Correct Performance on the Speech Probes across the Study
Phases for P1 ....................................................................................... 93
Table 4.10 Summary of the Two-Standard Deviation Band Analysis on the Speech
Probes across the Study Phases for P1 .................................................. 99
Table 4.11 Effect Size Data on the Speech Probes across the Phases of the Study for
P1 ........................................................................................................ 99
Table 4.12 Summary of the Split-middle and Binomial Test on the Speech Probes
across the Study Phases for P1 ........................................................... 100
Table 4.13 P2’s Intervention Priorities and Number of Sessions Attended ............ 101
Table 4.14 Mean Percent Correct Performance on the Speech Probes across the
Study Phases for P2 ........................................................................... 102
Table 4.15 Summary of the Two-Standard Deviation Band Analysis on the Speech
Probes across the Study Phases for P2 ................................................ 108
Table 4.16 Effect Size Data on the Speech Probes across the Phases of the Study for
P2 ...................................................................................................... 109
THE EFFECTIVENESS OF PROMPT
xvii
Table 4.17 Summary of the Split-middle and Binomial Test on the Speech Probes
across the Study Phases for P2 ........................................................... 109
Table 4.18 P3’s Intervention Priorities and Number of Sessions Attended ............ 110
Table 4.19 Mean Percent Correct Performance on the Speech Probes across the
Study Phases for P3 ........................................................................... 110
Table 4.20 Summary of the Two-Standard Deviation Band Analysis on the Speech
Probes across the Study Phases for P3................................................ 117
Table 4.21 Effect Size Data on the Speech Probes across the Phases of the Study for
P3 ...................................................................................................... 118
Table 4.22 Summary of the Split-middle and Binomial Test on the Speech Probes
across the Study Phases for P3 ........................................................... 118
Table 4.23 P4’s Intervention Priorities and Number of Sessions Attended ............ 119
Table 4.24 Mean Percent Correct Performance on the Speech Probes across the
Study Phases for P4 ........................................................................... 120
Table 4.25 Summary of the Two-Standard Deviation Band Analysis on the Speech
Probes across the Study Phases for P4................................................ 127
Table 4.26 Effect Size Data on the Speech Probes across the Phases of the Study for
P4 ...................................................................................................... 127
Table 4.27 Summary of the Split-middle and Binomial Test on the Speech Probes
across the Study Phases for P4 ........................................................... 128
Table 4.28 P5’s Intervention Priorities and Number of Sessions Attended ............ 129
Table 4.29 Mean Percent Correct Performance on the Speech Probes across the
Study Phases for P5 ........................................................................... 129
Table 4.30 Summary of the Two-Standard Deviation Band Analysis on the Speech
Probes across the Study Phases for P5................................................ 135
Table 4.31 Effect Size Data on the Speech Probes across the Phases of the Study for
P5 ...................................................................................................... 136
Table 4.32 Summary of the Split-middle and Binomial Test on the Speech Probes
across the Study Phases for P5 ........................................................... 137
Table 4.33 P6’s Intervention Priorities and Number of Sessions Attended ............ 138
Table 4.34 Mean Percent Correct Performance on the Speech Probes across the
Study Phases for P6 ........................................................................... 138
THE EFFECTIVENESS OF PROMPT
xviii
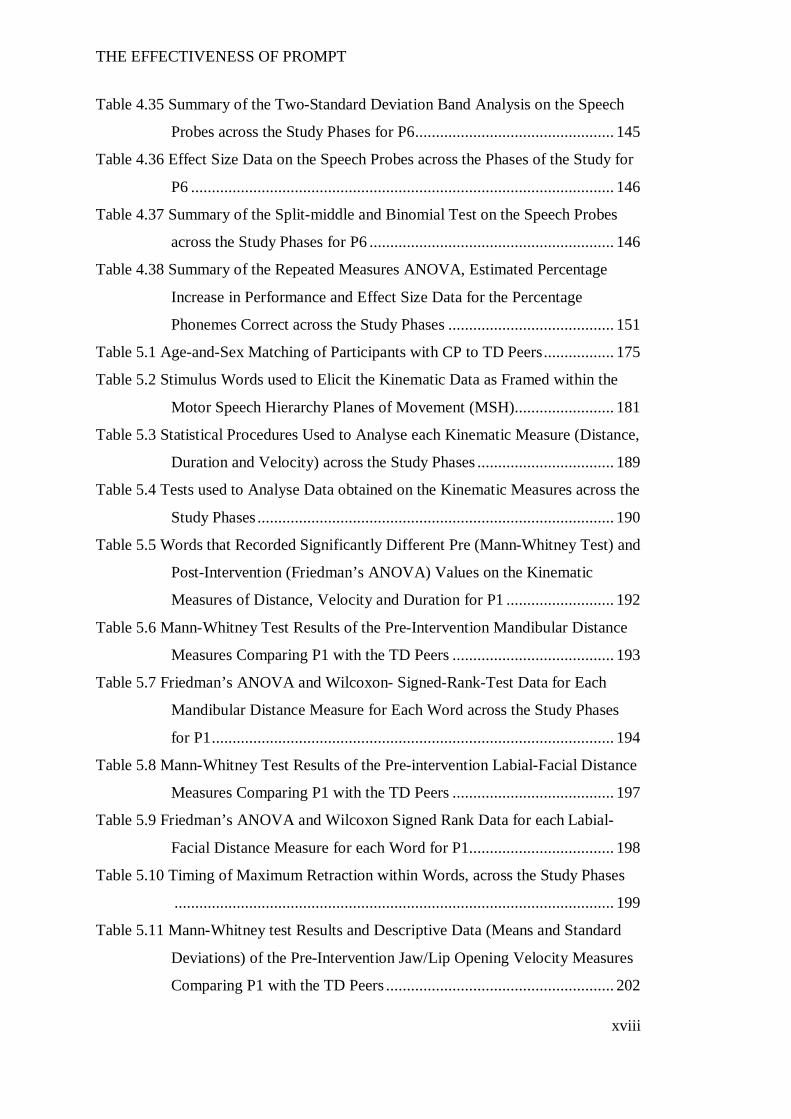
Table 4.35 Summary of the Two-Standard Deviation Band Analysis on the Speech
Probes across the Study Phases for P6 ................................................ 145
Table 4.36 Effect Size Data on the Speech Probes across the Phases of the Study for
P6 ...................................................................................................... 146
Table 4.37 Summary of the Split-middle and Binomial Test on the Speech Probes
across the Study Phases for P6 ........................................................... 146
Table 4.38 Summary of the Repeated Measures ANOVA, Estimated Percentage
Increase in Performance and Effect Size Data for the Percentage
Phonemes Correct across the Study Phases ........................................ 151
Table 5.1 Age-and-Sex Matching of Participants with CP to TD Peers ................. 175
Table 5.2 Stimulus Words used to Elicit the Kinematic Data as Framed within the
Motor Speech Hierarchy Planes of Movement (MSH) ........................ 181
Table 5.3 Statistical Procedures Used to Analyse each Kinematic Measure (Distance,
Duration and Velocity) across the Study Phases ................................. 189
Table 5.4 Tests used to Analyse Data obtained on the Kinematic Measures across the
Study Phases ...................................................................................... 190
Table 5.5 Words that Recorded Significantly Different Pre (Mann-Whitney Test) and
Post-Intervention (Friedman’s ANOVA) Values on the Kinematic
Measures of Distance, Velocity and Duration for P1 .......................... 192
Table 5.6 Mann-Whitney Test Results of the Pre-Intervention Mandibular Distance
Measures Comparing P1 with the TD Peers ....................................... 193
Table 5.7 Friedman’s ANOVA and Wilcoxon- Signed-Rank-Test Data for Each
Mandibular Distance Measure for Each Word across the Study Phases
for P1 ................................................................................................. 194
Table 5.8 Mann-Whitney Test Results of the Pre-intervention Labial-Facial Distance
Measures Comparing P1 with the TD Peers ....................................... 197
Table 5.9 Friedman’s ANOVA and Wilcoxon Signed Rank Data for each Labial-
Facial Distance Measure for each Word for P1 ................................... 198
Table 5.10 Timing of Maximum Retraction within Words, across the Study Phases
.......................................................................................................... 199
Table 5.11 Mann-Whitney test Results and Descriptive Data (Means and Standard
Deviations) of the Pre-Intervention Jaw/Lip Opening Velocity Measures
Comparing P1 with the TD Peers ....................................................... 202
THE EFFECTIVENESS OF PROMPT
xix
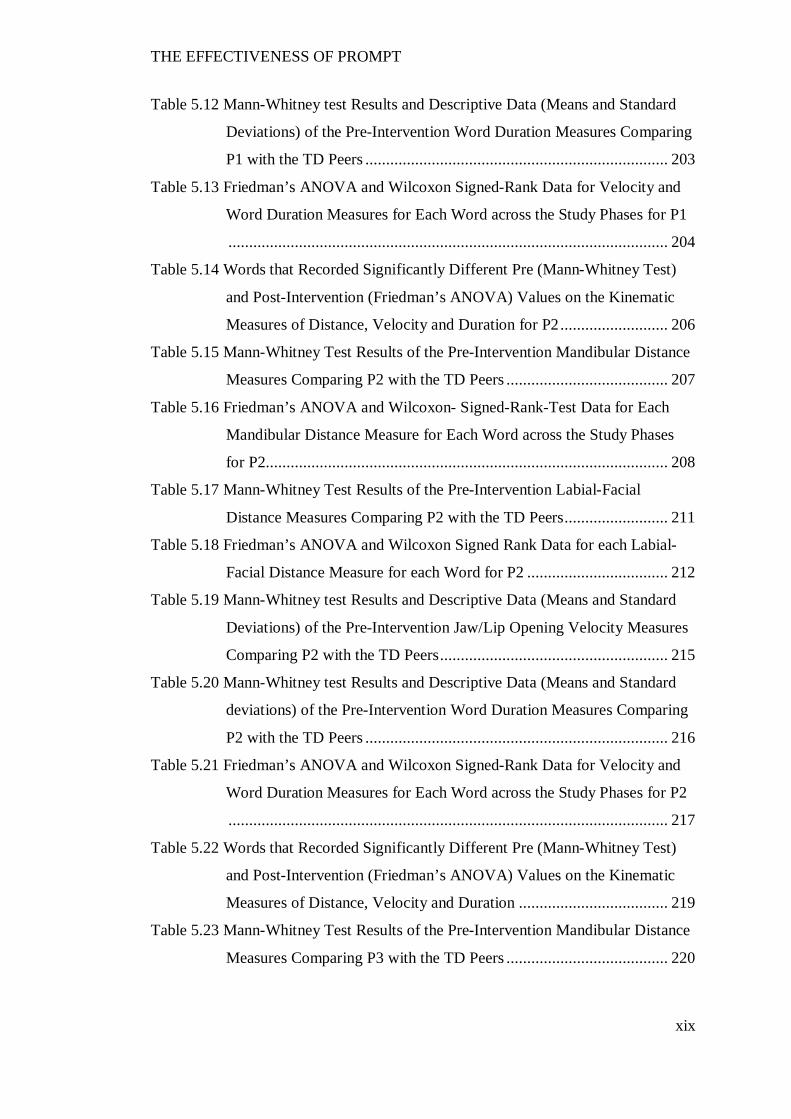
Table 5.12 Mann-Whitney test Results and Descriptive Data (Means and Standard
Deviations) of the Pre-Intervention Word Duration Measures Comparing
P1 with the TD Peers ......................................................................... 203
Table 5.13 Friedman’s ANOVA and Wilcoxon Signed-Rank Data for Velocity and
Word Duration Measures for Each Word across the Study Phases for P1
.......................................................................................................... 204
Table 5.14 Words that Recorded Significantly Different Pre (Mann-Whitney Test)
and Post-Intervention (Friedman’s ANOVA) Values on the Kinematic
Measures of Distance, Velocity and Duration for P2 .......................... 206
Table 5.15 Mann-Whitney Test Results of the Pre-Intervention Mandibular Distance
Measures Comparing P2 with the TD Peers ....................................... 207
Table 5.16 Friedman’s ANOVA and Wilcoxon- Signed-Rank-Test Data for Each
Mandibular Distance Measure for Each Word across the Study Phases
for P2................................................................................................. 208
Table 5.17 Mann-Whitney Test Results of the Pre-Intervention Labial-Facial
Distance Measures Comparing P2 with the TD Peers ......................... 211
Table 5.18 Friedman’s ANOVA and Wilcoxon Signed Rank Data for each Labial-
Facial Distance Measure for each Word for P2 .................................. 212
Table 5.19 Mann-Whitney test Results and Descriptive Data (Means and Standard
Deviations) of the Pre-Intervention Jaw/Lip Opening Velocity Measures
Comparing P2 with the TD Peers ....................................................... 215
Table 5.20 Mann-Whitney test Results and Descriptive Data (Means and Standard
deviations) of the Pre-Intervention Word Duration Measures Comparing
P2 with the TD Peers ......................................................................... 216
Table 5.21 Friedman’s ANOVA and Wilcoxon Signed-Rank Data for Velocity and
Word Duration Measures for Each Word across the Study Phases for P2
.......................................................................................................... 217
Table 5.22 Words that Recorded Significantly Different Pre (Mann-Whitney Test)
and Post-Intervention (Friedman’s ANOVA) Values on the Kinematic
Measures of Distance, Velocity and Duration .................................... 219
Table 5.23 Mann-Whitney Test Results of the Pre-Intervention Mandibular Distance
Measures Comparing P3 with the TD Peers ....................................... 220
THE EFFECTIVENESS OF PROMPT
xx
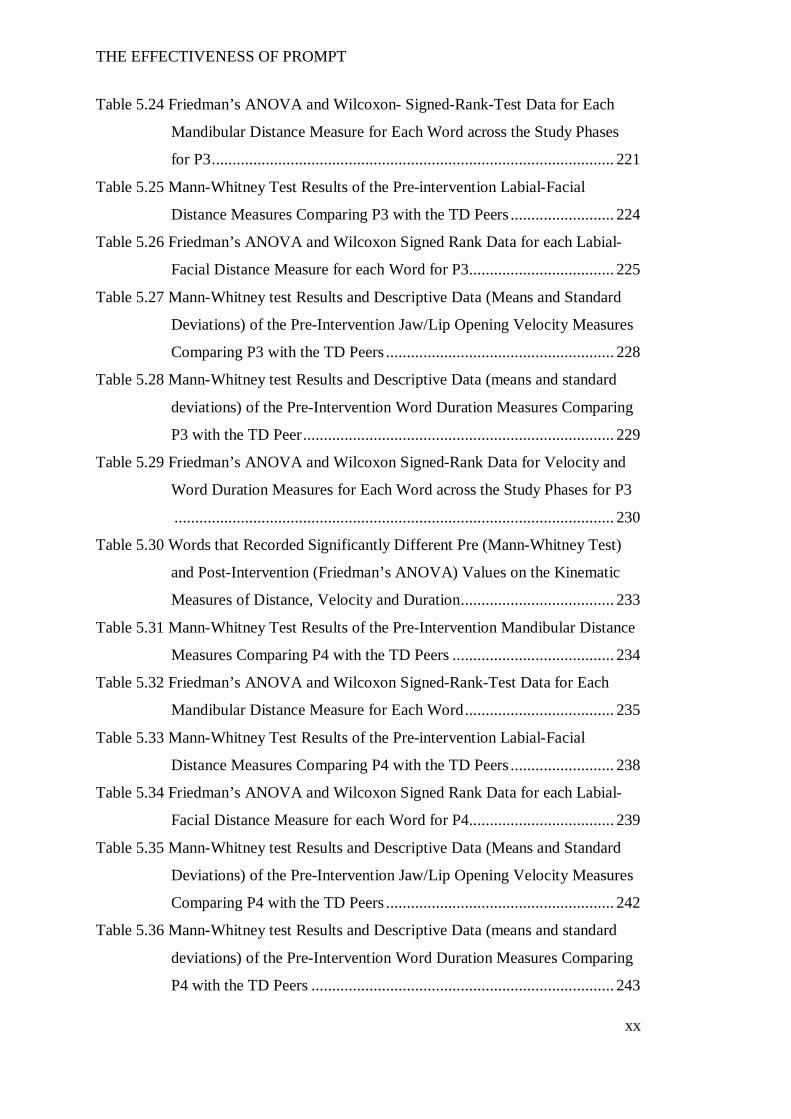
Table 5.24 Friedman’s ANOVA and Wilcoxon- Signed-Rank-Test Data for Each
Mandibular Distance Measure for Each Word across the Study Phases
for P3 ................................................................................................. 221
Table 5.25 Mann-Whitney Test Results of the Pre-intervention Labial-Facial
Distance Measures Comparing P3 with the TD Peers ......................... 224
Table 5.26 Friedman’s ANOVA and Wilcoxon Signed Rank Data for each Labial-
Facial Distance Measure for each Word for P3 ................................... 225
Table 5.27 Mann-Whitney test Results and Descriptive Data (Means and Standard
Deviations) of the Pre-Intervention Jaw/Lip Opening Velocity Measures
Comparing P3 with the TD Peers ....................................................... 228
Table 5.28 Mann-Whitney test Results and Descriptive Data (means and standard
deviations) of the Pre-Intervention Word Duration Measures Comparing
P3 with the TD Peer ........................................................................... 229
Table 5.29 Friedman’s ANOVA and Wilcoxon Signed-Rank Data for Velocity and
Word Duration Measures for Each Word across the Study Phases for P3
.......................................................................................................... 230
Table 5.30 Words that Recorded Significantly Different Pre (Mann-Whitney Test)
and Post-Intervention (Friedman’s ANOVA) Values on the Kinematic
Measures of Distance, Velocity and Duration ..................................... 233
Table 5.31 Mann-Whitney Test Results of the Pre-Intervention Mandibular Distance
Measures Comparing P4 with the TD Peers ....................................... 234
Table 5.32 Friedman’s ANOVA and Wilcoxon Signed-Rank-Test Data for Each
Mandibular Distance Measure for Each Word .................................... 235
Table 5.33 Mann-Whitney Test Results of the Pre-intervention Labial-Facial
Distance Measures Comparing P4 with the TD Peers ......................... 238
Table 5.34 Friedman’s ANOVA and Wilcoxon Signed Rank Data for each Labial-
Facial Distance Measure for each Word for P4 ................................... 239
Table 5.35 Mann-Whitney test Results and Descriptive Data (Means and Standard
Deviations) of the Pre-Intervention Jaw/Lip Opening Velocity Measures
Comparing P4 with the TD Peers ....................................................... 242
Table 5.36 Mann-Whitney test Results and Descriptive Data (means and standard
deviations) of the Pre-Intervention Word Duration Measures Comparing
P4 with the TD Peers ......................................................................... 243
THE EFFECTIVENESS OF PROMPT
xxi
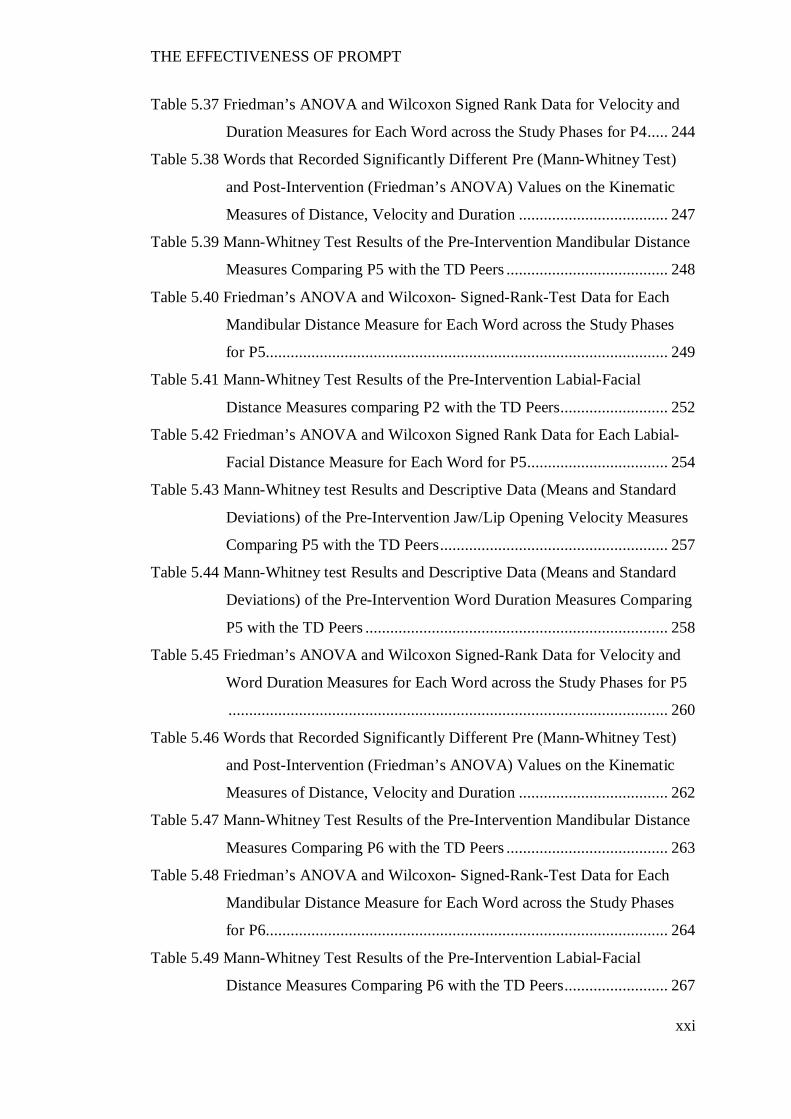
Table 5.37 Friedman’s ANOVA and Wilcoxon Signed Rank Data for Velocity and
Duration Measures for Each Word across the Study Phases for P4 ..... 244
Table 5.38 Words that Recorded Significantly Different Pre (Mann-Whitney Test)
and Post-Intervention (Friedman’s ANOVA) Values on the Kinematic
Measures of Distance, Velocity and Duration .................................... 247
Table 5.39 Mann-Whitney Test Results of the Pre-Intervention Mandibular Distance
Measures Comparing P5 with the TD Peers ....................................... 248
Table 5.40 Friedman’s ANOVA and Wilcoxon- Signed-Rank-Test Data for Each
Mandibular Distance Measure for Each Word across the Study Phases
for P5................................................................................................. 249
Table 5.41 Mann-Whitney Test Results of the Pre-Intervention Labial-Facial
Distance Measures comparing P2 with the TD Peers .......................... 252
Table 5.42 Friedman’s ANOVA and Wilcoxon Signed Rank Data for Each Labial-
Facial Distance Measure for Each Word for P5 .................................. 254
Table 5.43 Mann-Whitney test Results and Descriptive Data (Means and Standard
Deviations) of the Pre-Intervention Jaw/Lip Opening Velocity Measures
Comparing P5 with the TD Peers ....................................................... 257
Table 5.44 Mann-Whitney test Results and Descriptive Data (Means and Standard
Deviations) of the Pre-Intervention Word Duration Measures Comparing
P5 with the TD Peers ......................................................................... 258
Table 5.45 Friedman’s ANOVA and Wilcoxon Signed-Rank Data for Velocity and
Word Duration Measures for Each Word across the Study Phases for P5
.......................................................................................................... 260
Table 5.46 Words that Recorded Significantly Different Pre (Mann-Whitney Test)
and Post-Intervention (Friedman’s ANOVA) Values on the Kinematic
Measures of Distance, Velocity and Duration .................................... 262
Table 5.47 Mann-Whitney Test Results of the Pre-Intervention Mandibular Distance
Measures Comparing P6 with the TD Peers ....................................... 263
Table 5.48 Friedman’s ANOVA and Wilcoxon- Signed-Rank-Test Data for Each
Mandibular Distance Measure for Each Word across the Study Phases
for P6................................................................................................. 264
Table 5.49 Mann-Whitney Test Results of the Pre-Intervention Labial-Facial
Distance Measures Comparing P6 with the TD Peers ......................... 267
THE EFFECTIVENESS OF PROMPT
xxii
Table 5.50 Friedman’s ANOVA and Wilcoxon Signed Rank Data for each Labial-
Facial Distance Measure for each Word for P6 ................................... 269
Table 5.51 Mann-Whitney test Results and Descriptive Data (means and standard
deviations) of the Pre-Intervention Jaw/Lip Opening Velocity Measures
Comparing P6 with the TD Peers ....................................................... 272
Table 5.52 Mann-Whitney test Results and Descriptive Data (Means and Standard
Deviations) of the Pre-Intervention Word Duration Measures Comparing
P6 with the TD Peers ......................................................................... 273
Table 5.53 Friedman’s ANOVA and Wilcoxon Signed-Rank Data for Velocity and
Word Duration Measures for Each Word for P6 ................................. 274
Table 6.1 Percentage Scores [and 90% Confidence Intervals] Obtained by each of
the Participants on the Children’s Speech Intelligibility Measure (CSIM)
.......................................................................................................... 290
Table 6.2 Friedman’s ANOVA and Wilcoxon Signed-Rank Test Data for the
Domain Analysis of the COPM across the Study Phases .................... 292
THE EFFECTIVENESS OF PROMPT
xxiii
List of Figures
Figure 2.1. Representation of Cerebral Palsy within the ICF Framework (WHO,
2001). .................................................................................................. 10
Figure 2.2. The conceptual model for the PROMPT approach. From The PROMPT
Introduction to Technique Manual by Hayden (2003). Reprinted with
permission. .......................................................................................... 20
Figure 2.3. Motor Speech Hierarchy. From The PROMPT Introduction to Technique
Manual by Hayden (2003). Reprinted with permission. ....................... 21
Figure 2.4. Finger placement for facial surface prompts. ........................................ 23
Figure 3.1. Outcomes measure assessments as classified within the components of
the ICF (WHO, 2001). ......................................................................... 51
Figure 3.2. Phases of the Study .............................................................................. 56
Figure 3.3. Occasions of assessment administration. .............................................. 59
Figure 4.1. Timeline for baseline periods of each participant .................................. 78
Figure 4.2. Illustration of word-pool selection process ........................................... 79
Figure 4.3. P1’s performance on the motor-speech movement patterns (MSMP) and
perceptual accuracy (PA) on the trained word-sets for intervention
priority one. ......................................................................................... 94
Figure 4.4. P1's performance on the motor-speech movement parameters (MSMP)
and perceptual accuracy (PA) on the untrained speech probes for
intervention priority one....................................................................... 95
Figure 4.5. P1's performance on the motor-speech movement parameters (MSMP)
and perceptual accuracy (PA) on the trained speech probes for
intervention priority two. ..................................................................... 96
Figure 4.6. P1's performance on the motor-speech movement parameters (MSMP)
and perceptual accuracy (PA) on the untrained speech probes for
intervention priority two. ..................................................................... 97
Figure 4.7. P1's performance on the motor-speech movement parameters (MSMP)
and perceptual accuracy (PA) on the control speech probes for the
untrained intervention priority three. .................................................... 98
Figure 4.8. P2's performance on the motor-speech movement parameters (MSMP)
and perceptual accuracy (PA) on the trained speech probes for
intervention priority one..................................................................... 102
THE EFFECTIVENESS OF PROMPT
xxiv
Figure 4.9. P2's performance on the motor-speech movement parameters (MSMP)
and perceptual accuracy (PA) on the untrained speech probes for
intervention priority one. .................................................................... 103
Figure 4.10. P2's performance on the motor-speech movement parameters (MSMP)
and perceptual accuracy (PA) on the trained speech probes for
intervention priority two..................................................................... 104
Figure 4.11. P2's performance on the motor-speech movement parameters (MSMP)
and perceptual accuracy (PA) on the untrained speech probes for
intervention priority two..................................................................... 106
Figure 4.12. P2's performance on the motor-speech-movement parameters (MSMP)
and perceptual accuracy (PA) on the control speech probes for the
untrained intervention priority three. .................................................. 107
Figure 4.13. P3’s performance on the motor-speech movement patterns (MSMP) and
perceptual accuracy (PA) on the trained word-sets for intervention
priority one. ....................................................................................... 111
Figure 4.14. P3’s performance on the motor-speech movement parameters (MSMP)
and perceptual accuracy (PA) on the untrained speech probes for
intervention priority one. .................................................................... 112
Figure 4.15. P3's performance on the motor-speech movement parameters (MSMP)
and perceptual accuracy (PA) on the trained speech probes for
intervention priority two..................................................................... 113
Figure 4.16. P3's performance on the motor-speech movement parameters (MSMP)
and perceptual accuracy (PA) on the untrained speech probes for
intervention priority two..................................................................... 115
Figure 4.17. P3's performance on the motor-speech movement parameters (MSMP)
and perceptual accuracy (PA) on the control speech probes for the
untrained intervention priority three. .................................................. 116
Figure 4.18. P4's performance on the motor-speech movement patterns (MSMP) and
perceptual accuracy (PA) on the trained word-sets for intervention
priority one. ....................................................................................... 121
Figure 4.19. P4's performance on the motor-speech movement parameters (MSMP)
and perceptual accuracy (PA) on the untrained speech probes for
intervention priority one. .................................................................... 122
THE EFFECTIVENESS OF PROMPT
xxv
Figure 4.20. P4's performance on the motor-speech movement parameters (MSMP)
and perceptual accuracy (PA) on the trained speech probes for
intervention priority two. ................................................................... 123
Figure 4.21. P4's performance on the motor-speech movement parameters (MSMP)
and perceptual accuracy (PA) on the untrained speech probes for
intervention priority two. ................................................................... 124
Figure 4.22. P4's performance on the motor-speech movement parameters (MSMP)
and perceptual accuracy (PA) on the control speech probes for the
untrained intervention priority three. .................................................. 125
Figure 4.23. P5's performance on the motor-speech movement patterns (MSMP) and
perceptual accuracy (PA) on the trained word-sets for intervention
priority one. ....................................................................................... 130
Figure 4.24. P5's performance on the motor-speech movement parameters (MSMP)
and perceptual accuracy (PA) on the untrained speech probes for
intervention priority one..................................................................... 131
Figure 4.25. P5's performance on the motor-speech-movement parameters (MSMP)
and perceptual accuracy (PA) on the trained speech probes for
intervention priority two. ................................................................... 132
Figure 4.26. P5's performance on the motor-speech movement parameters (MSMP)
and perceptual accuracy (PA) on the untrained speech probes for
intervention priority two. ................................................................... 133
Figure 4.27. P5's performance on the motor-speech-movement parameters (MSMP)
and perceptual accuracy (PA) on the control speech probes for the
untrained intervention priority three. .................................................. 134
Figure 4.28. P6's performance on the motor-speech movement patterns (MSMP) and
perceptual accuracy (PA) on the trained word-sets for intervention
priority one. ....................................................................................... 139
Figure 4.29. P6’s performance on the motor-speech movement parameters (MSMPs)
and perceptual accuracy (PA) on the untrained speech probes for
intervention priority one..................................................................... 140
Figure 4.30. P6's performance on the motor-speech movement parameters (MSMPs)
and perceptual accuracy (PA) on the trained speech probes for
intervention priority two. ................................................................... 141
THE EFFECTIVENESS OF PROMPT
xxvi
Figure 4.31. P6's performance on the motor-speech movement parameters (MSMPs)
and perceptual accuracy (PA) on the untrained speech probes for
intervention priority two..................................................................... 143
Figure 4.32. P6's performance on the motor-speech movement parameters (MSMPs)
and perceptual accuracy (PA) on the control speech probes for the
untrained intervention priority three. .................................................. 144
Figure 4.33. Percentage phonemes corret (PPC) for each participant across the
phases of the study. ............................................................................ 150
Figure 4.34. Performance scores for each participant in each motor-speech-control
area of the verbal motor assessment for children. ............................... 153
Figure 5.1. The jaw height positions of the stimulus word-set. .............................. 178
Figure 5.2. Word stimulus sets for the motion analysis as categorised across three
levels of the motor-speech hierarchy. ................................................. 180
Figure 5.3. Facial marker placement. .................................................................... 183
Figure 5.4. Post processing of PEAK Motus data. ................................................ 184
Figure 5.5. Average position of the upper lip (X axis) and lower lip (Y axis), across
the study phases, as measured at minimum inter-lip distance at the point
of bilabial contact (mms) for P1 and the (TD) peers. .......................... 201
Figure 5.6. Average position of the upper lip (X axis) and lower lip (Y axis), across
the study phases, as measured at minimum bilabial inter-lip distance
(mms) for P2 and the TD peers........................................................... 214
Figure 5.7. Average position of the upper lip (X axis) and lower lip (Y axis), across
the study phases, as measured at minimum bilabial inter-lip distance
(mms) for P3 and the TD peers........................................................... 227
Figure 5.8. Average position of the upper lip (X axis) and lower lip (Y axis), across
the study phases, as measured at minimum inter-lip distance (mms) at the
point of bilabial contact for P4 and the TD peer. ................................ 241
Figure 5.9. Average position of the upper lip (X axis) and lower lip (Y axis), across
the study phases, as measured at minimum inter-lip distance (mms) at the
point of bilabial contact for P5 and the TD peers. ............................... 256
Figure 5.10. Average position of the upper lip (X axis) and lower lip (Y axis), across
the study phases, as measured at minimum inter-lip distance (mms) at the
point of bilabial contact for P6 and the TD peers ................................ 271
THE EFFECTIVENESS OF PROMPT
xxvii
Figure 6.1. Mean percentage increase in performance and satisfaction measures
across the study phases for the Canadian Occupational Performance
Measure. ............................................................................................ 293
Figure G.1. Accuracy of performance on the speech probes as scored for motor
speech movement patterns and perceptual accuracy across the
intervention priorities and study phases for P1 ................................... 381
Figure G.2. Accuracy of performance on the speech probes as scored for motor
speech movement patterns and perceptual accuracy across the
intervention priorities and study phases for P2 ................................... 382
Figure G.3. Accuracy of performance on the speech probes as scored for motor
speech movement patterns and perceptual accuracy across the
intervention priorities and study phases for P2 ................................... 383
Figure G.4. Accuracy of performance on the speech probes as scored for motor
speech movement patterns and perceptual accuracy across the
intervention priorities and study phases for P4 ................................... 384
Figure G.5. Accuracy of performance on the speech probes as scored for motor
speech movement patterns and perceptual accuracy across the
intervention priorities and study phases for P5 ................................... 385
Figure G.6. Accuracy of performance on the speech probes as scored for motor
speech movement patterns and perceptual accuracy across the
intervention priorities and study phases for P6 ................................... 386

THE EFFECTIVENESS OF PROMPT
1
CHAPTER 1 INTRODUCTION
Cerebral Palsy (CP) is a neurodevelopmental condition that includes a group
of non-progressive movement and posture disorders that are a result of lesions or
dysfunction to the central nervous system. The worldwide incidence is reported to
be approximately 2 to 2.5 per 1000 live births (Ashwal et al., 2004; J. Lin, 2003;
Siebes, Wijnroks, & Vermeer, 2002; Workinger, 2005) making it one of the most
prevalent childhood disorders.
The literature identifies at least 40% of children with CP present with
communication impairment (Kennes et al., 2002). Due to the complex interaction
between multiple systems (e.g., physical, cognitive, sensory and communicative) in
CP, children with motor speech disorders are at increased risk of social and
educational limitations, and participation restrictions (Bult, Verschuren, Jongmans,
Lindeman, & Ketelaar, 2011; Palisano et al., 2011; Voorman, Dallmeijer, Van Eck,
& Schuengel, 2010).
Given this, one of the primary objectives of speech intervention is to improve
communicative function and increase speech intelligibility by “maximizing the
ability to speak within neurological limits”, thereby improving an individual’s
quality of life (Workinger, 2005).
Decision making regarding the evaluation and selection of an appropriate
intervention requires the use of a conceptual framework. This provides a structure
for gathering and assessing relevant information for the selection of appropriate
intervention protocols (Shumway-Cook & Woollacott, 2012; van der Merwe, 2009).
Two broad components are essential in the development of a conceptual
framework: 1. evidence-based practice, and 2. the identification of a model of
disablement.
Evidence based practice is an approach for clinical practice that requires the
“…conscientious, explicit, and judicious use of current best evidence in making
decisions about the care of individual patients. The practice of evidence-based-
medicine means integrating individual clinical expertise with the best available
external evidence from systematic research” (Sackett, Rosenberg, Gray, Haynes, &
Richardson, 1996, p. 71).
The integration of evidence-based practice into clinical practice requires the
application of a step-by-step process that includes the formulation of a specific
THE EFFECTIVENESS OF PROMPT
2
question, a search for the best available evidence, and critical evaluation of the
validity and usefulness of that evidence (Speech Pathology Australia, 2010; Clark,
2003; Williams, McLeod & McCauley, 2010; Reilly, others).
Clark (2003) states two broad strategies are available to clinicians in the
search for the best available evidence. The first strategy requires a clinician to
consult, identify and critically evaluate the peer reviewed literature for documented
quality experimental evidence that supports the effectiveness/efficacy of an
intervention approach.
Critical evaluation of the literature requires some knowledge as to the type of
study design (e.g., randomised controlled trial, case-cohort study) that will most
suitably answer the specific question under investigation (Glasziou &
Vandernbroucke, 2004).
Typically, randomised control trial studies have been heralded as the gold
standard for best available evidence with other types of study designs excluded from
systematic reviews because of failure to meet the level of evidence assigned to
randomised control trials (Grossman & Mackenzie, 2005; J. P. T. Higgins & Green,
2011; Moher, Schulz, Altman, & Group, 2001; Palmer & Enderby, 2007; P.
Rosenbaum, 2010). However, a judgement on the basis of level alone does not
inform a clinician regarding the quality of the evidence (Guyatt et al., 2008). As
stated by Booth (2010), a “bad randomised controlled trial is not superior to a good
cohort study” (p. 84). Further, “the five phase model of clinical-outcome research”
(Robey, 2004; Robey & Schultz, 1998) for communication disorders indicates
control trial studies, in the absence of early phase (e.g., I and II) research is
inappropriate. Therefore, disregarding early phase treatment studies on the basis of
“low level” evidence is premature.
A review of the literature pertaining to motor speech disorders associated
with CP indicates that whilst many treatment strategies (instrumental, medical,
compensatory and behavioural) for the management of motor speech disorders
associated with CP have been reported, the experimental evidence base to support
these treatment approaches is lacking (Pennington, Goldbart & Marshall, 2003;
Palmer & Enderby, 2007; Pennington, Robson & Miller, 2009, Hodge & Wellman,
1999).
THE EFFECTIVENESS OF PROMPT
3
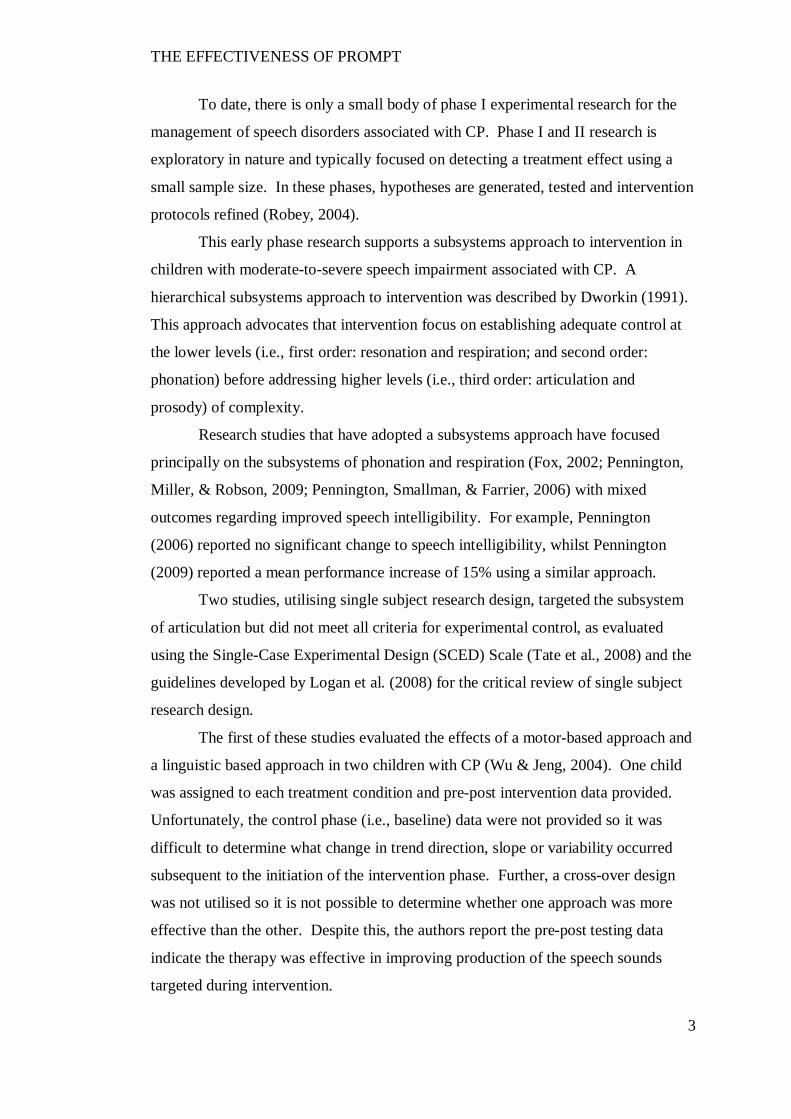
To date, there is only a small body of phase I experimental research for the
management of speech disorders associated with CP. Phase I and II research is
exploratory in nature and typically focused on detecting a treatment effect using a
small sample size. In these phases, hypotheses are generated, tested and intervention
protocols refined (Robey, 2004).
This early phase research supports a subsystems approach to intervention in
children with moderate-to-severe speech impairment associated with CP. A
hierarchical subsystems approach to intervention was described by Dworkin (1991).
This approach advocates that intervention focus on establishing adequate control at
the lower levels (i.e., first order: resonation and respiration; and second order:
phonation) before addressing higher levels (i.e., third order: articulation and
prosody) of complexity.
Research studies that have adopted a subsystems approach have focused
principally on the subsystems of phonation and respiration (Fox, 2002; Pennington,
Miller, & Robson, 2009; Pennington, Smallman, & Farrier, 2006) with mixed
outcomes regarding improved speech intelligibility. For example, Pennington
(2006) reported no significant change to speech intelligibility, whilst Pennington
(2009) reported a mean performance increase of 15% using a similar approach.
Two studies, utilising single subject research design, targeted the subsystem
of articulation but did not meet all criteria for experimental control, as evaluated
using the Single-Case Experimental Design (SCED) Scale (Tate et al., 2008) and the
guidelines developed by Logan et al. (2008) for the critical review of single subject
research design.
The first of these studies evaluated the effects of a motor-based approach and
a linguistic based approach in two children with CP (Wu & Jeng, 2004). One child
was assigned to each treatment condition and pre-post intervention data provided.
Unfortunately, the control phase (i.e., baseline) data were not provided so it was
difficult to determine what change in trend direction, slope or variability occurred
subsequent to the initiation of the intervention phase. Further, a cross-over design
was not utilised so it is not possible to determine whether one approach was more
effective than the other. Despite this, the authors report the pre-post testing data
indicate the therapy was effective in improving production of the speech sounds
targeted during intervention.
THE EFFECTIVENESS OF PROMPT
4
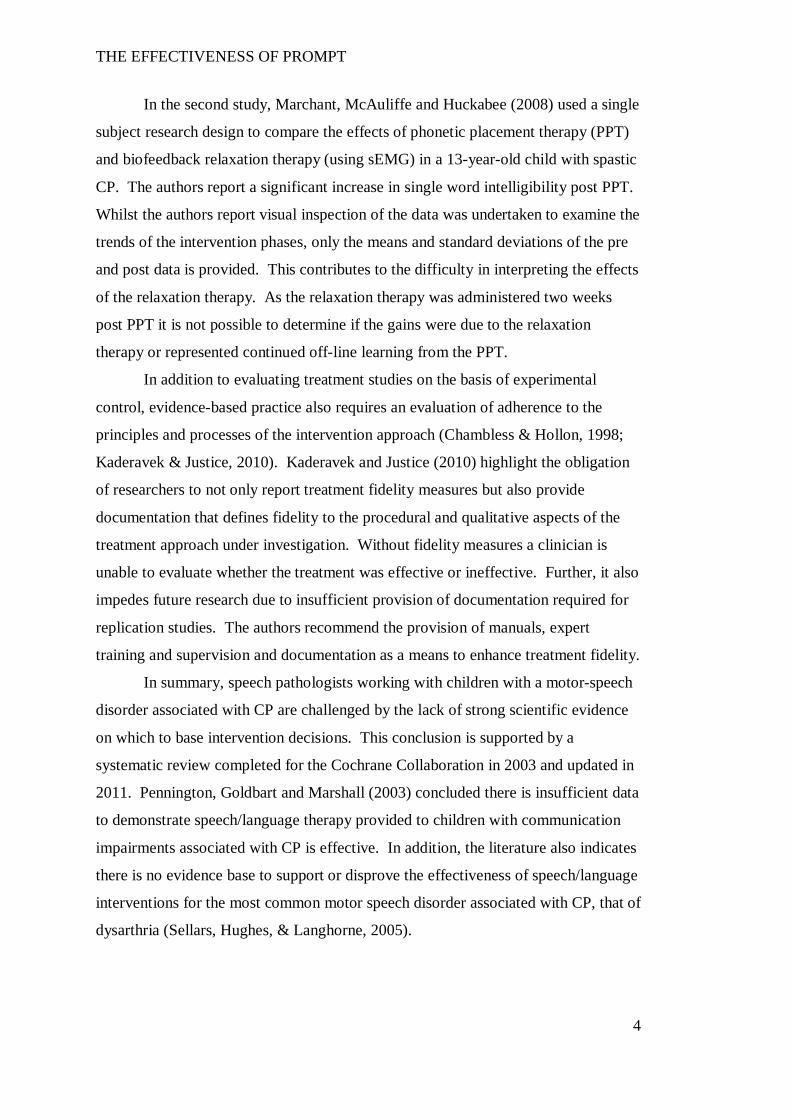
In the second study, Marchant, McAuliffe and Huckabee (2008) used a single
subject research design to compare the effects of phonetic placement therapy (PPT)
and biofeedback relaxation therapy (using sEMG) in a 13-year-old child with spastic
CP. The authors report a significant increase in single word intelligibility post PPT.
Whilst the authors report visual inspection of the data was undertaken to examine the
trends of the intervention phases, only the means and standard deviations of the pre
and post data is provided. This contributes to the difficulty in interpreting the effects
of the relaxation therapy. As the relaxation therapy was administered two weeks
post PPT it is not possible to determine if the gains were due to the relaxation
therapy or represented continued off-line learning from the PPT.
In addition to evaluating treatment studies on the basis of experimental
control, evidence-based practice also requires an evaluation of adherence to the
principles and processes of the intervention approach (Chambless & Hollon, 1998;
Kaderavek & Justice, 2010). Kaderavek and Justice (2010) highlight the obligation
of researchers to not only report treatment fidelity measures but also provide
documentation that defines fidelity to the procedural and qualitative aspects of the
treatment approach under investigation. Without fidelity measures a clinician is
unable to evaluate whether the treatment was effective or ineffective. Further, it also
impedes future research due to insufficient provision of documentation required for
replication studies. The authors recommend the provision of manuals, expert
training and supervision and documentation as a means to enhance treatment fidelity.
In summary, speech pathologists working with children with a motor-speech
disorder associated with CP are challenged by the lack of strong scientific evidence
on which to base intervention decisions. This conclusion is supported by a
systematic review completed for the Cochrane Collaboration in 2003 and updated in
2011. Pennington, Goldbart and Marshall (2003) concluded there is insufficient data
to demonstrate speech/language therapy provided to children with communication
impairments associated with CP is effective. In addition, the literature also indicates
there is no evidence base to support or disprove the effectiveness of speech/language
interventions for the most common motor speech disorder associated with CP, that of
dysarthria (Sellars, Hughes, & Langhorne, 2005).
THE EFFECTIVENESS OF PROMPT
5
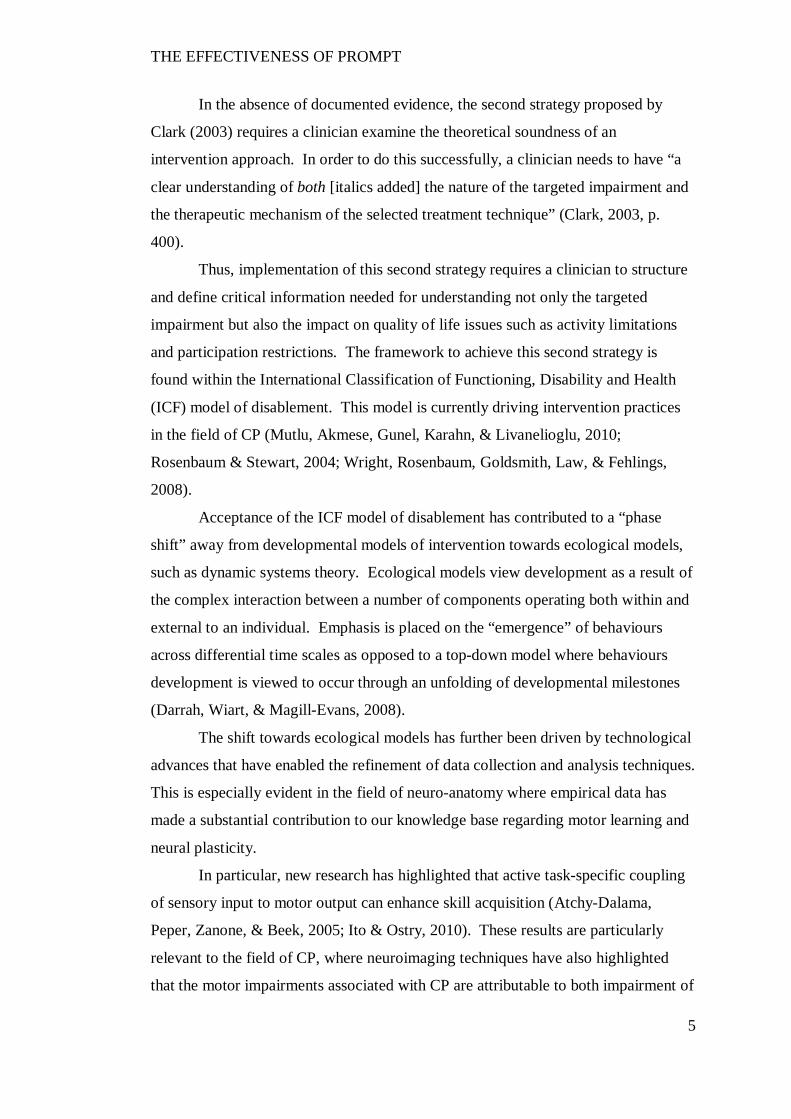
In the absence of documented evidence, the second strategy proposed by
Clark (2003) requires a clinician examine the theoretical soundness of an
intervention approach. In order to do this successfully, a clinician needs to have “a
clear understanding of both [italics added] the nature of the targeted impairment and
the therapeutic mechanism of the selected treatment technique” (Clark, 2003, p.
400).
Thus, implementation of this second strategy requires a clinician to structure
and define critical information needed for understanding not only the targeted
impairment but also the impact on quality of life issues such as activity limitations
and participation restrictions. The framework to achieve this second strategy is
found within the International Classification of Functioning, Disability and Health
(ICF) model of disablement. This model is currently driving intervention practices
in the field of CP (Mutlu, Akmese, Gunel, Karahn, & Livanelioglu, 2010;
Rosenbaum & Stewart, 2004; Wright, Rosenbaum, Goldsmith, Law, & Fehlings,
2008).
Acceptance of the ICF model of disablement has contributed to a “phase
shift” away from developmental models of intervention towards ecological models,
such as dynamic systems theory. Ecological models view development as a result of
the complex interaction between a number of components operating both within and
external to an individual. Emphasis is placed on the “emergence” of behaviours
across differential time scales as opposed to a top-down model where behaviours
development is viewed to occur through an unfolding of developmental milestones
(Darrah, Wiart, & Magill-Evans, 2008).
The shift towards ecological models has further been driven by technological
advances that have enabled the refinement of data collection and analysis techniques.
This is especially evident in the field of neuro-anatomy where empirical data has
made a substantial contribution to our knowledge base regarding motor learning and
neural plasticity.
In particular, new research has highlighted that active task-specific coupling
of sensory input to motor output can enhance skill acquisition (Atchy-Dalama,
Peper, Zanone, & Beek, 2005; Ito & Ostry, 2010). These results are particularly
relevant to the field of CP, where neuroimaging techniques have also highlighted
that the motor impairments associated with CP are attributable to both impairment of
THE EFFECTIVENESS OF PROMPT
6
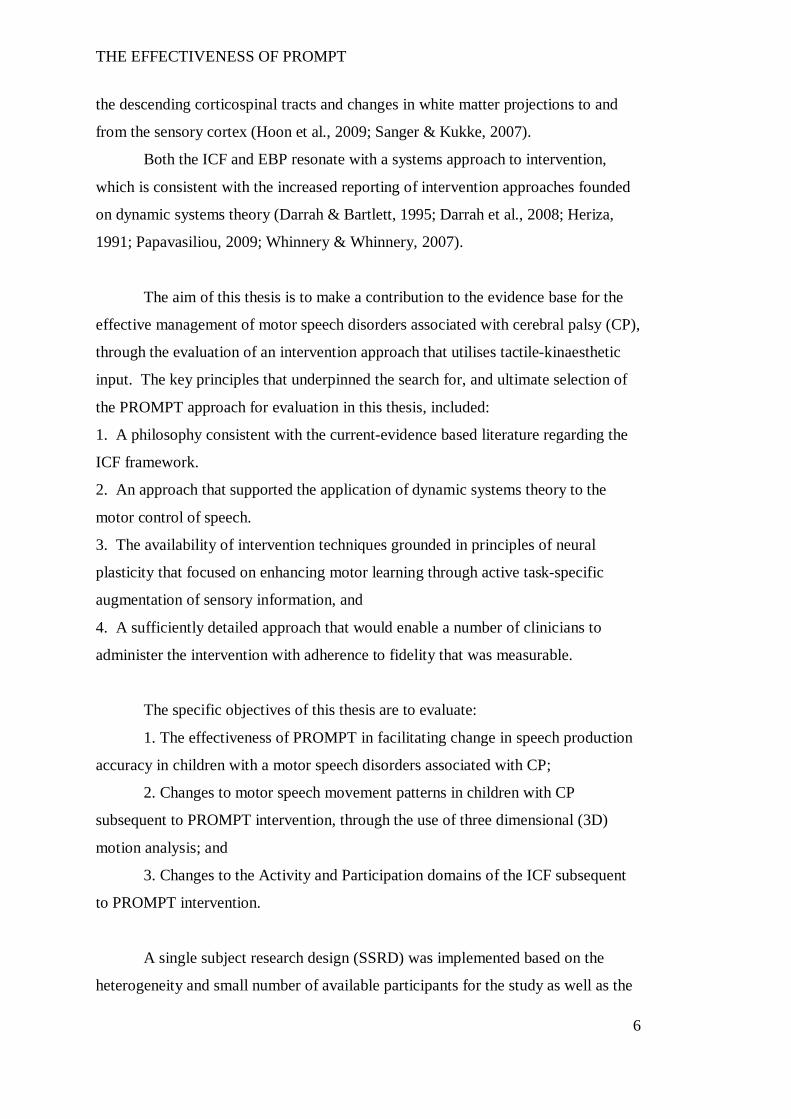
the descending corticospinal tracts and changes in white matter projections to and
from the sensory cortex (Hoon et al., 2009; Sanger & Kukke, 2007).
Both the ICF and EBP resonate with a systems approach to intervention,
which is consistent with the increased reporting of intervention approaches founded
on dynamic systems theory (Darrah & Bartlett, 1995; Darrah et al., 2008; Heriza,
1991; Papavasiliou, 2009; Whinnery & Whinnery, 2007).
The aim of this thesis is to make a contribution to the evidence base for the
effective management of motor speech disorders associated with cerebral palsy (CP),
through the evaluation of an intervention approach that utilises tactile-kinaesthetic
input. The key principles that underpinned the search for, and ultimate selection of
the PROMPT approach for evaluation in this thesis, included:
1. A philosophy consistent with the current-evidence based literature regarding the
ICF framework.
2. An approach that supported the application of dynamic systems theory to the
motor control of speech.
3. The availability of intervention techniques grounded in principles of neural
plasticity that focused on enhancing motor learning through active task-specific
augmentation of sensory information, and
4. A sufficiently detailed approach that would enable a number of clinicians to
administer the intervention with adherence to fidelity that was measurable.
The specific objectives of this thesis are to evaluate:
1. The effectiveness of PROMPT in facilitating change in speech production
accuracy in children with a motor speech disorders associated with CP;
2. Changes to motor speech movement patterns in children with CP
subsequent to PROMPT intervention, through the use of three dimensional (3D)
motion analysis; and
3. Changes to the Activity and Participation domains of the ICF subsequent
to PROMPT intervention.
A single subject research design (SSRD) was implemented based on the
heterogeneity and small number of available participants for the study as well as the
THE EFFECTIVENESS OF PROMPT
7
lack of existing efficacy studies. This thesis is consistent with a phase I intervention
study (Beeson & Robey, 2006).
The thesis contains the following chapters:
1. Chapter 2: A review of the literature.
In this chapter the key principles that resulted in the selection of the
PROMPT approach are explored, as detailed below:
1.1 The ICF framework.
1.2 The definition of CP. This is described within the context of the ICF
model, with a focus not only on the impairments of structure and function, but also
activity and participation limitations.
1.3 Motor speech control. This section details the subsystems of motor
speech control, early development of these subsystems and impairment in children
with cerebral palsy.
1.4 The PROMPT approach. This entails a description of the theoretical
basis, principles that define the intervention procedures, and evidence to support the
evaluation of this approach in children with motor speech disorders associated with
CP.
2. Chapter 3: Rationale and research aims of the thesis.
Chapters 4, 5 and 6 document the three main research questions addressed in
this thesis, as follows:
3. Chapter 4 examines the effectiveness of PROMPT in facilitating change in
speech production accuracy in children with a motor speech disorders associated
with CP. This chapter includes a detailed description of the six participants who
completed the PROMPT intervention, the procedures and instruments, the
intervention protocol, outcome measures and results obtained. The chapter
concludes with a discussion of the findings.
4. Chapter 5 examines changes in the motor speech movement patterns of
these same children through the use of three dimensional (3D) motion analysis. A
cohort of typically developing children was recruited to compare the trend of
changes in jaw and lip movements to those of the children with cerebral palsy. This
chapter details the procedures and instruments; results obtained and concludes with a
discussion of the findings.
THE EFFECTIVENESS OF PROMPT
8
5. Chapter 6 examines changes to the Activity and Participation domains of
the ICF subsequent to PROMPT intervention. This entailed an evaluation of
changes to speech intelligibility using a formalised measure; and parent evaluation of
changes in performance and satisfaction with changes to the daily routine.
The thesis concludes with a general discussion of the findings, limitations
and strengths, consideration for further research and conclusion.
THE EFFECTIVENESS OF PROMPT
9
CHAPTER 2 LITERATURE REVIEW
The ICF Model of Disablement
…disability is a ‘universal’ phenomenon and is regarded as a general feature
of the human experience (McDougall, Wright, & Rosenbaum, 2010, p. 208).
The ICF is a conceptual framework, proposed by the World Health
Organisation (WHO) that expresses disability from a health perspective as opposed
to impairment (WHO, 2002). More recently, the ICF Children and Youth (ICF-CY)
version was derived from the ICF to more accurately reflect the dynamic inter-
relationship of the child within the context of a family system (WHO, 2007).
The ICF-CY has two parts, as illustrated in Error! Not a valid bookmark
self-reference.:
Part 1. Function and Disability.
a. Structure and Function. These two components are further divided into 8
subdomains that include voice and speech functions, neuromuscular and movement-
related functions, and sensory functions.
b. Activity. Within the ICF, activity is defined as “the execution of a task or
action by an individual”.
c. Participation. This is defined as a child’s “involvement in a life situation”
(WHO, 2007, p. 9).
The Activity and Participation domains are further divided into 9 subdomains
that include learning and applying knowledge, general tasks and demands,
communication, mobility, self-care, domestic life, interpersonal interactions and
relationships, major life areas, and community, social and civic life.
Part 2. Contextual Factors. These describe the subdomains of the
environmental and personal factors (WHO, 2002). The ICF-CY concept of
environment reflects transitions (e.g., entering and leaving school) and increasing
independence across the ages (infancy, childhood and adolescence).
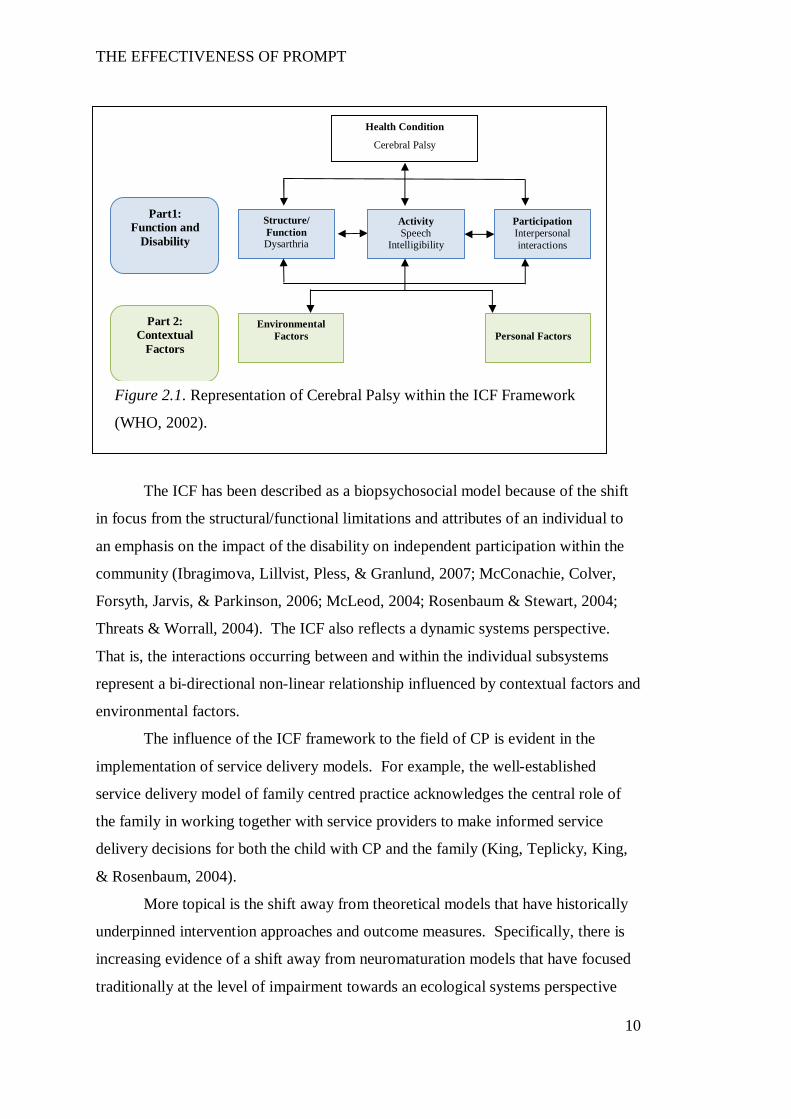
THE EFFECTIVENESS OF PROMPT
10
Health Condition
Cerebral Palsy
Structure/ Function Dysarthria
Activity Speech
Intelligibility
Participation Interpersonal interactions
Part1: Function and
Disability
Environmental Factors Personal Factors
Part 2: Contextual
Factors
Figure 2.1. Representation of Cerebral Palsy within the ICF Framework
(WHO, 2002).
. Interactions between the components of the ICF (WHO, 2001).
The ICF has been described as a biopsychosocial model because of the shift
in focus from the structural/functional limitations and attributes of an individual to
an emphasis on the impact of the disability on independent participation within the
community (Ibragimova, Lillvist, Pless, & Granlund, 2007; McConachie, Colver,
Forsyth, Jarvis, & Parkinson, 2006; McLeod, 2004; Rosenbaum & Stewart, 2004;
Threats & Worrall, 2004). The ICF also reflects a dynamic systems perspective.
That is, the interactions occurring between and within the individual subsystems
represent a bi-directional non-linear relationship influenced by contextual factors and
environmental factors.
The influence of the ICF framework to the field of CP is evident in the
implementation of service delivery models. For example, the well-established
service delivery model of family centred practice acknowledges the central role of
the family in working together with service providers to make informed service
delivery decisions for both the child with CP and the family (King, Teplicky, King,
& Rosenbaum, 2004).
More topical is the shift away from theoretical models that have historically
underpinned intervention approaches and outcome measures. Specifically, there is
increasing evidence of a shift away from neuromaturation models that have focused
traditionally at the level of impairment towards an ecological systems perspective
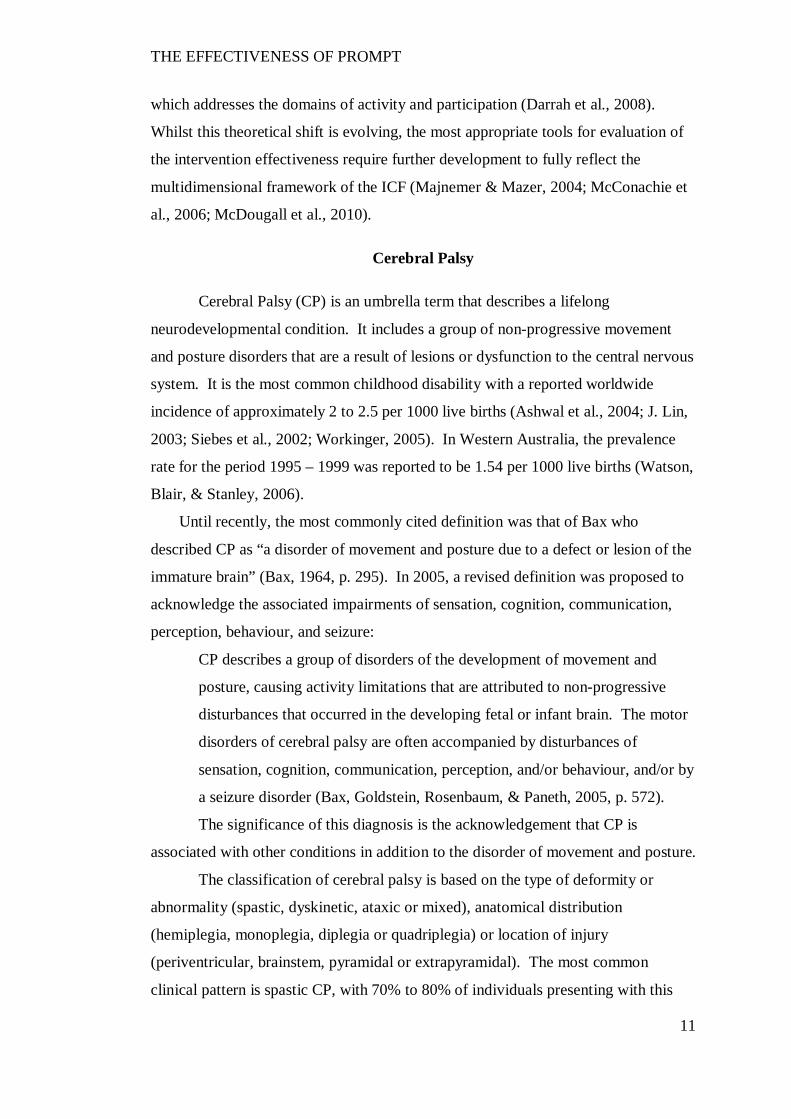
THE EFFECTIVENESS OF PROMPT
11
which addresses the domains of activity and participation (Darrah et al., 2008).
Whilst this theoretical shift is evolving, the most appropriate tools for evaluation of
the intervention effectiveness require further development to fully reflect the
multidimensional framework of the ICF (Majnemer & Mazer, 2004; McConachie et
al., 2006; McDougall et al., 2010).
Cerebral Palsy
Cerebral Palsy (CP) is an umbrella term that describes a lifelong
neurodevelopmental condition. It includes a group of non-progressive movement
and posture disorders that are a result of lesions or dysfunction to the central nervous
system. It is the most common childhood disability with a reported worldwide
incidence of approximately 2 to 2.5 per 1000 live births (Ashwal et al., 2004; J. Lin,
2003; Siebes et al., 2002; Workinger, 2005). In Western Australia, the prevalence
rate for the period 1995 – 1999 was reported to be 1.54 per 1000 live births (Watson,
Blair, & Stanley, 2006).
Until recently, the most commonly cited definition was that of Bax who
described CP as “a disorder of movement and posture due to a defect or lesion of the
immature brain” (Bax, 1964, p. 295). In 2005, a revised definition was proposed to
acknowledge the associated impairments of sensation, cognition, communication,
perception, behaviour, and seizure:
CP describes a group of disorders of the development of movement and
posture, causing activity limitations that are attributed to non-progressive
disturbances that occurred in the developing fetal or infant brain. The motor
disorders of cerebral palsy are often accompanied by disturbances of
sensation, cognition, communication, perception, and/or behaviour, and/or by
a seizure disorder (Bax, Goldstein, Rosenbaum, & Paneth, 2005, p. 572).
The significance of this diagnosis is the acknowledgement that CP is
associated with other conditions in addition to the disorder of movement and posture.
The classification of cerebral palsy is based on the type of deformity or
abnormality (spastic, dyskinetic, ataxic or mixed), anatomical distribution
(hemiplegia, monoplegia, diplegia or quadriplegia) or location of injury
(periventricular, brainstem, pyramidal or extrapyramidal). The most common
clinical pattern is spastic CP, with 70% to 80% of individuals presenting with this
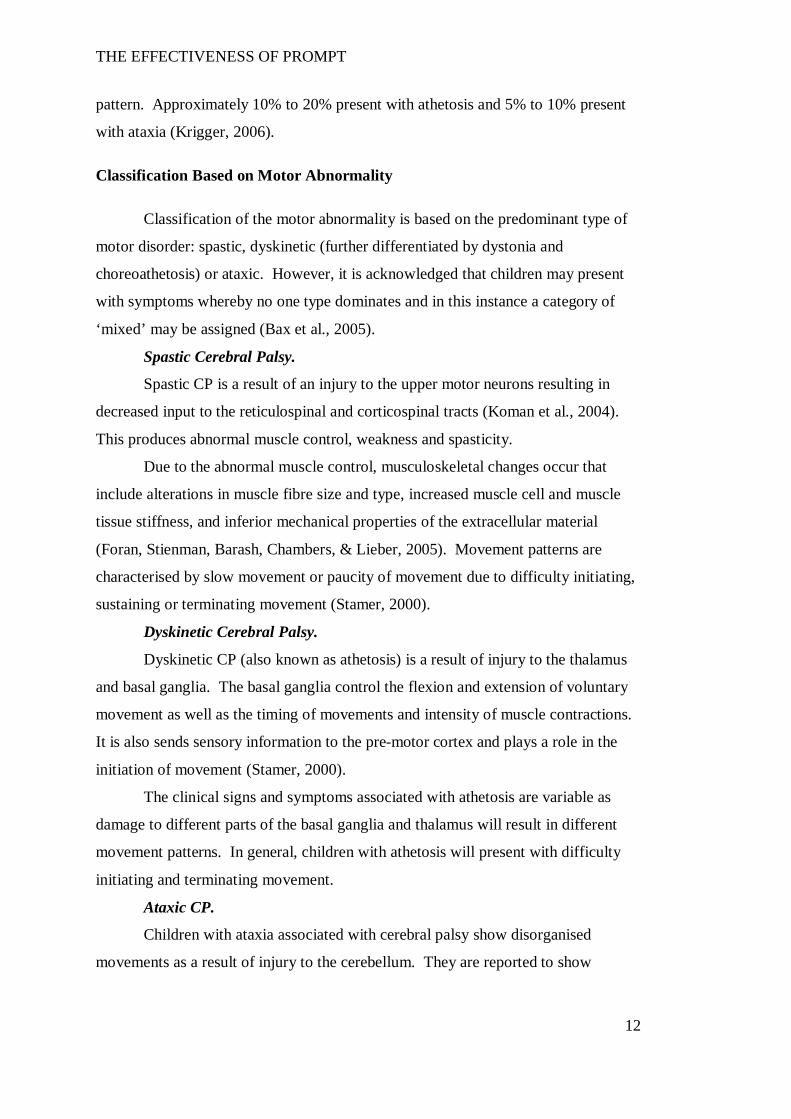
THE EFFECTIVENESS OF PROMPT
12
pattern. Approximately 10% to 20% present with athetosis and 5% to 10% present
with ataxia (Krigger, 2006).
Classification Based on Motor Abnormality
Classification of the motor abnormality is based on the predominant type of
motor disorder: spastic, dyskinetic (further differentiated by dystonia and
choreoathetosis) or ataxic. However, it is acknowledged that children may present
with symptoms whereby no one type dominates and in this instance a category of
‘mixed’ may be assigned (Bax et al., 2005).
Spastic Cerebral Palsy.
Spastic CP is a result of an injury to the upper motor neurons resulting in
decreased input to the reticulospinal and corticospinal tracts (Koman et al., 2004).
This produces abnormal muscle control, weakness and spasticity.
Due to the abnormal muscle control, musculoskeletal changes occur that
include alterations in muscle fibre size and type, increased muscle cell and muscle
tissue stiffness, and inferior mechanical properties of the extracellular material
(Foran, Stienman, Barash, Chambers, & Lieber, 2005). Movement patterns are
characterised by slow movement or paucity of movement due to difficulty initiating,
sustaining or terminating movement (Stamer, 2000).
Dyskinetic Cerebral Palsy.
Dyskinetic CP (also known as athetosis) is a result of injury to the thalamus
and basal ganglia. The basal ganglia control the flexion and extension of voluntary
movement as well as the timing of movements and intensity of muscle contractions.
It is also sends sensory information to the pre-motor cortex and plays a role in the
initiation of movement (Stamer, 2000).
The clinical signs and symptoms associated with athetosis are variable as
damage to different parts of the basal ganglia and thalamus will result in different
movement patterns. In general, children with athetosis will present with difficulty
initiating and terminating movement.
Ataxic CP.
Children with ataxia associated with cerebral palsy show disorganised
movements as a result of injury to the cerebellum. They are reported to show
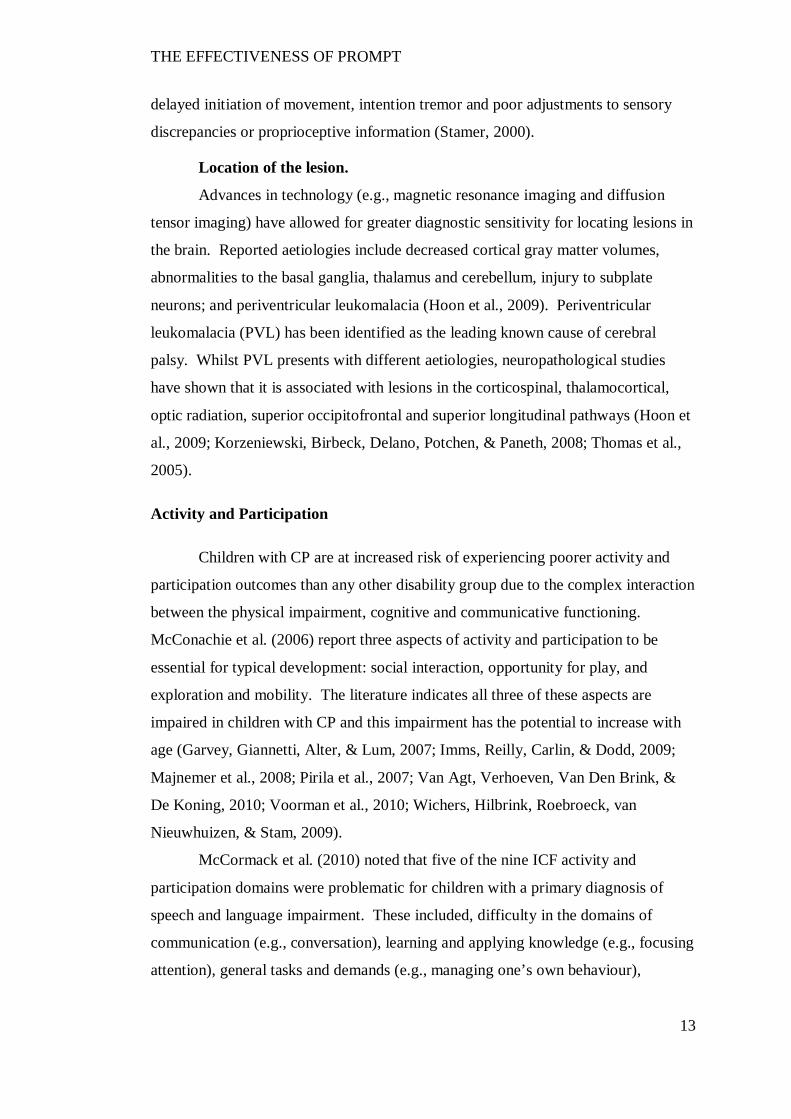
THE EFFECTIVENESS OF PROMPT
13
delayed initiation of movement, intention tremor and poor adjustments to sensory
discrepancies or proprioceptive information (Stamer, 2000).
Location of the lesion.
Advances in technology (e.g., magnetic resonance imaging and diffusion
tensor imaging) have allowed for greater diagnostic sensitivity for locating lesions in
the brain. Reported aetiologies include decreased cortical gray matter volumes,
abnormalities to the basal ganglia, thalamus and cerebellum, injury to subplate
neurons; and periventricular leukomalacia (Hoon et al., 2009). Periventricular
leukomalacia (PVL) has been identified as the leading known cause of cerebral
palsy. Whilst PVL presents with different aetiologies, neuropathological studies
have shown that it is associated with lesions in the corticospinal, thalamocortical,
optic radiation, superior occipitofrontal and superior longitudinal pathways (Hoon et
al., 2009; Korzeniewski, Birbeck, Delano, Potchen, & Paneth, 2008; Thomas et al.,
2005).
Activity and Participation
Children with CP are at increased risk of experiencing poorer activity and
participation outcomes than any other disability group due to the complex interaction
between the physical impairment, cognitive and communicative functioning.
McConachie et al. (2006) report three aspects of activity and participation to be
essential for typical development: social interaction, opportunity for play, and
exploration and mobility. The literature indicates all three of these aspects are
impaired in children with CP and this impairment has the potential to increase with
age (Garvey, Giannetti, Alter, & Lum, 2007; Imms, Reilly, Carlin, & Dodd, 2009;
Majnemer et al., 2008; Pirila et al., 2007; Van Agt, Verhoeven, Van Den Brink, &
De Koning, 2010; Voorman et al., 2010; Wichers, Hilbrink, Roebroeck, van
Nieuwhuizen, & Stam, 2009).
McCormack et al. (2010) noted that five of the nine ICF activity and
participation domains were problematic for children with a primary diagnosis of
speech and language impairment. These included, difficulty in the domains of
communication (e.g., conversation), learning and applying knowledge (e.g., focusing
attention), general tasks and demands (e.g., managing one’s own behaviour),
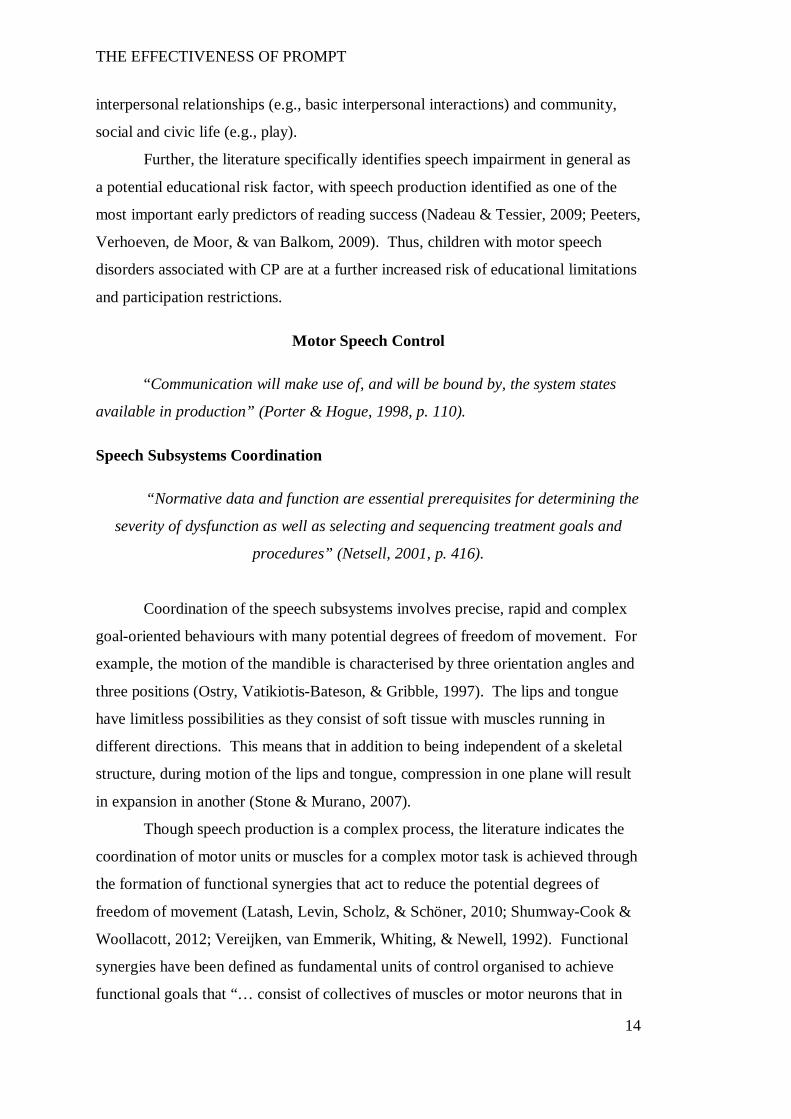
THE EFFECTIVENESS OF PROMPT
14
interpersonal relationships (e.g., basic interpersonal interactions) and community,
social and civic life (e.g., play).
Further, the literature specifically identifies speech impairment in general as
a potential educational risk factor, with speech production identified as one of the
most important early predictors of reading success (Nadeau & Tessier, 2009; Peeters,
Verhoeven, de Moor, & van Balkom, 2009). Thus, children with motor speech
disorders associated with CP are at a further increased risk of educational limitations
and participation restrictions.
Motor Speech Control
“Communication will make use of, and will be bound by, the system states
available in production” (Porter & Hogue, 1998, p. 110).
Speech Subsystems Coordination
“Normative data and function are essential prerequisites for determining the
severity of dysfunction as well as selecting and sequencing treatment goals and
procedures” (Netsell, 2001, p. 416).
Coordination of the speech subsystems involves precise, rapid and complex
goal-oriented behaviours with many potential degrees of freedom of movement. For
example, the motion of the mandible is characterised by three orientation angles and
three positions (Ostry, Vatikiotis-Bateson, & Gribble, 1997). The lips and tongue
have limitless possibilities as they consist of soft tissue with muscles running in
different directions. This means that in addition to being independent of a skeletal
structure, during motion of the lips and tongue, compression in one plane will result
in expansion in another (Stone & Murano, 2007).
Though speech production is a complex process, the literature indicates the
coordination of motor units or muscles for a complex motor task is achieved through
the formation of functional synergies that act to reduce the potential degrees of
freedom of movement (Latash, Levin, Scholz, & Schöner, 2010; Shumway-Cook &
Woollacott, 2012; Vereijken, van Emmerik, Whiting, & Newell, 1992). Functional
synergies have been defined as fundamental units of control organised to achieve
functional goals that “… consist of collectives of muscles or motor neurons that in
THE EFFECTIVENESS OF PROMPT
15
turn control muscle contractions” (A. Smith, 2010 p.275). Thus synergies are
regarded as a way of organising the speech system to reduce the potential degrees of
freedom of movement, and give rise to preferred movement patterns. They are also
considered dynamic in the sense that they are open to modification through changes
in the central nervous system, specific task requirements and changes associated with
motor learning and development. As such, synergies are expected to emerge,
disappear and change.
The speech science literature provides data that support the existence of
hierarchical sequences in speech motor control (specifically mandibular and labial
coordination) that unfold over an extended developmental period. Individual
articulators exhibit non-uniform developmental time paths that are differentiated by
changes in the composition of inter-articulator relationships (Cheng, Mudoch,
Goozée, & Scott, 2007; Grigos, Saxman, & Gordan, 2005; Riely & Smith, 2003; A.
Smith, 1992; A. Smith & Zelaznik, 2004; Terband, Maassen, Van Lieshout, &
Nijland, 2010).
The Development of Early Motor Speech Control
Within the hierarchy of motor-speech development, the mandible has been
identified as foundational to the development and integration of more complex
movements of the lips and tongue. For example, Green, Moore and Reilly (2002)
found the mandible is the predominant contributor in early development, with
engagement of the lips independent from the mandible increasing with age. That is,
early lip movements occur as a result of excessive mandibular displacement in the
open phase creating excessive lip compression upon completion of mandibular
closure. With development, differentiation between the mandible and lips is
observed through decreased jaw displacement and increased upper lip and lower lip
movements (Green, Moore, Higashikawa, & Steeve, 2000; Green et al., 2002;
Walsh, Smith, & Weber-Fox, 2006).
In addition to the developmental trends observed in labial-mandibular
coupling, there is also evidence to suggest the presence of developmental differences
in muscle activation patterns of the mandible (Ruark & Moore, 1997; Steeve &
Moore, 2009; Steeve, Moore, Green, Reilly, & McMurtrey, 2008). In a recent
longitudinal electromyography (EMG) study, Steeve and Moore (2009) examined
THE EFFECTIVENESS OF PROMPT
16
the developmental differences in the coordinative muscles of the mandible in speech
and non-speech tasks, in a typically developing single male infant from 8 to 22
months. They found organisational differences in muscle group activation for babble
and true words across the developmental ages of their study. For example, during
vowel babble there was increased EMG activity in synergistic muscle groups whilst
greater coupling of the antagonistic muscle groups was observed in multi-syllabic
vocalisations. These findings are in support of earlier work by Ruark and Moore
(1997).
Smith and Zelaznik (2004) further examined the development of inter-
articulator relationships by investigating two speech synergies – the mandible/lower
lip and the lip (upper lip - lower lip) aperture synergies. Their data indicate the
lower lip/mandible synergy develops before the lip aperture (upper lip - lower lip)
synergy.
Finally, whilst the tongue/jaw synergy has been less researched there is
emerging literature that suggests tongue movements become increasingly dissociated
from the mandible with increasing developmental age (Cheng et al., 2007; Terband
et al., 2010).
In summary, early developmental changes in individual articulators and
composition of functional synergies occur due to extensive changes in neuromotor
pathways associated with maturation, anatomical/biomechanical composition,
experience and practice.
THE EFFECTIVENESS OF PROMPT
17
Speech Subsystem Control In Children with Cerebral Palsy
“Motor control abnormalities due to the initial neurological insult give rise
to atypical movement patterns, which in turn give rise to atypical
development”(Deffeyes, Harbourne, Kyvelidou, Stuberg, & Stergiou, 2009, p. 564).
The prevalence of speech disorders in individuals with CP is not well
described, and estimates vary between 31% and 88% (Ashwal et al., 2004; Havstam,
Buchholz, & Hartelius, 2003; Watson et al., 2006; Whitehall, 2009). Whilst the
most commonly reported speech disorder associated with cerebral palsy (CP) is
dysarthria (Hodge & Wellman, 1999; Pennington, Miller, & Robson, 2009), recent
work has suggested that even children who do not present with explicit symptoms of
dysarthric speech may experience underlying motor control deficits (Hustad, Gorton,
& Lee, 2010).
The motor speech impairments associated with CP may impact an
individual’s ability to produce speech efficiently and accurately, due to impairments
in timing and coordination across the speech subsystems. The literature describes
impairment to different subsystems of speech control including respiration,
phonation, resonance and articulation. Reduced speech intelligibility has been
associated with poor breath quality, inappropriate voicing, slower speech rate,
reduced vowel space, excessive or reduced movements and articulatory imprecision
(Hustad, Gorton, & Lee, 2010; E. L. Lin, Chen, & Lee, 2007; Soloman & Charron,
1998; Workinger, 2005). Whilst the Mayo classification system has been used to
describe the perceptual characteristics observed in children with dysarthria, more
recent research indicates classification on the basis of severity and disease type may
be more appropriate (Y. Kim, Kent, & Weismer, 2011).
Two possible explanations for impaired motor control in individuals with CP
have been postulated: aberrant activation of muscle synergies (Neilson & O’Dwyer,
1981); and/or a poor relationship between the motor command and the resulting
perceptual consequences of the movement (Kent & Netsell, 1978).
Examination of the work of early researchers investigating the articulatory
precision of speakers with cerebral palsy suggests a pattern of articulatory
imprecision related to the physiological complexity (integration of jaw, lip and
tongue control) of articulation (Byrne, 1959; Clarke & Hoops, 1980; Clement &
THE EFFECTIVENESS OF PROMPT
18
Twitchell, 1959; Hixon & Hardy, 1964; Ingram & Barn, 1961; Love, 1992; Milloy &
Morgan-Barry, 1990; Platt, Andrews, Young, & Quinn, 1980; Workinger, 2005;
Workinger & Kent, 1991). For example, in a study conducted by Irwin (1972), as
cited by Love (1992), production of labial phonemes and nasals were reportedly the
easiest, whilst dentals, glottals, fricatives and glides were the most difficult. These
findings support those reported by Byrne (1959) who also stated the acquisition of
the bilabial stops (p, b) and nasals (m, n) in speakers with CP are the easiest to
produce.
Recent data reported by Kim, Martin, Hasegawa-Johnson, and Perlman
(2010) support the pattern of articulatory errors recorded in the data by early
researchers. These authors suggest speakers with low speech intelligibility substitute
complex sounds with sounds that required lower complexity. This supports the
notion that error patterns can be attributed to the motor complexity of the phoneme
(Bartle-Meyer, Goozée, Murdoch, & Green, 2009; R. D Kent, 1992; A. Smith &
Goffman, 2004). For example early bilabial (p, b) can be produced through the
mechanical motion of the jaw, whilst tongue tip sounds require integration and
coordination of the jaw, lips and tongue.
Whilst empirical data on the speech-movement patterns of children with CP
are limited, there is evidence to suggest children with CP present with underlying
mandibular instability. For example, Kent and Netsell (1978) report excessive
mandibular displacement with lip and tongue blade movements highly dependent on
the mandible in four children with athetoid CP. Yokuchi (2004) reported impaired
motor speech movement patterns that included limited jaw opening, lip asymmetry,
and inappropriate labial contraction for rounding and retraction. More recently
Ortega et al. (2008) reported significantly decreased mouth opening and increased
lateral deviation in children with spastic CP when compared with typically
developing peers.
Most recently, a kinematic study by Hong et al. (2011) evaluated
labiomandibular coupling in mono-syllabic and poly-syllabic speech tasks in twelve
Mandarin-speaking children with spastic CP. They reported a significant difference
in the temporal coupling between the lower lip and jaw movements using a cross-
correlation analysis, for children with CP, as compared to the age matched peers. In
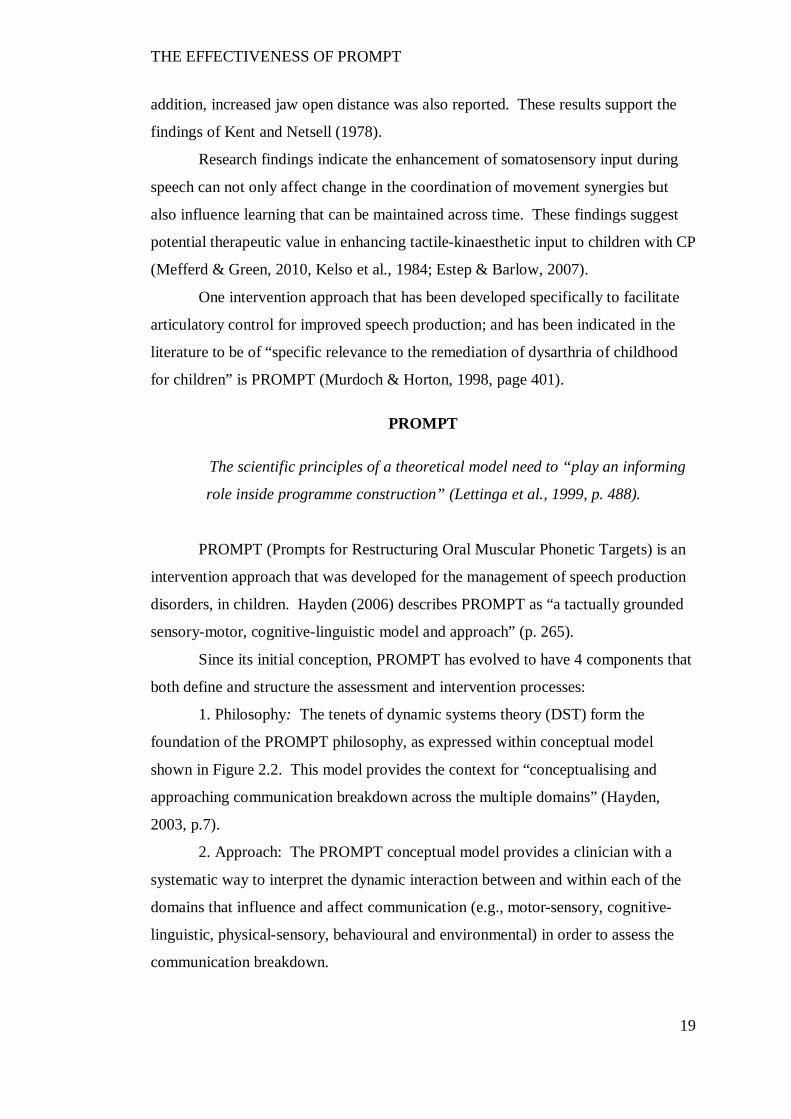
THE EFFECTIVENESS OF PROMPT
19
addition, increased jaw open distance was also reported. These results support the
findings of Kent and Netsell (1978).
Research findings indicate the enhancement of somatosensory input during
speech can not only affect change in the coordination of movement synergies but
also influence learning that can be maintained across time. These findings suggest
potential therapeutic value in enhancing tactile-kinaesthetic input to children with CP
(Mefferd & Green, 2010, Kelso et al., 1984; Estep & Barlow, 2007).
One intervention approach that has been developed specifically to facilitate
articulatory control for improved speech production; and has been indicated in the
literature to be of “specific relevance to the remediation of dysarthria of childhood
for children” is PROMPT (Murdoch & Horton, 1998, page 401).
PROMPT
The scientific principles of a theoretical model need to “play an informing
role inside programme construction” (Lettinga et al., 1999, p. 488).
PROMPT (Prompts for Restructuring Oral Muscular Phonetic Targets) is an
intervention approach that was developed for the management of speech production
disorders, in children. Hayden (2006) describes PROMPT as “a tactually grounded
sensory-motor, cognitive-linguistic model and approach” (p. 265).
Since its initial conception, PROMPT has evolved to have 4 components that
both define and structure the assessment and intervention processes:
1. Philosophy: The tenets of dynamic systems theory (DST) form the
foundation of the PROMPT philosophy, as expressed within conceptual model
shown in Figure 2.2. This model provides the context for “conceptualising and
approaching communication breakdown across the multiple domains” (Hayden,
2003, p.7).
2. Approach: The PROMPT conceptual model provides a clinician with a
systematic way to interpret the dynamic interaction between and within each of the
domains that influence and affect communication (e.g., motor-sensory, cognitive-
linguistic, physical-sensory, behavioural and environmental) in order to assess the
communication breakdown.
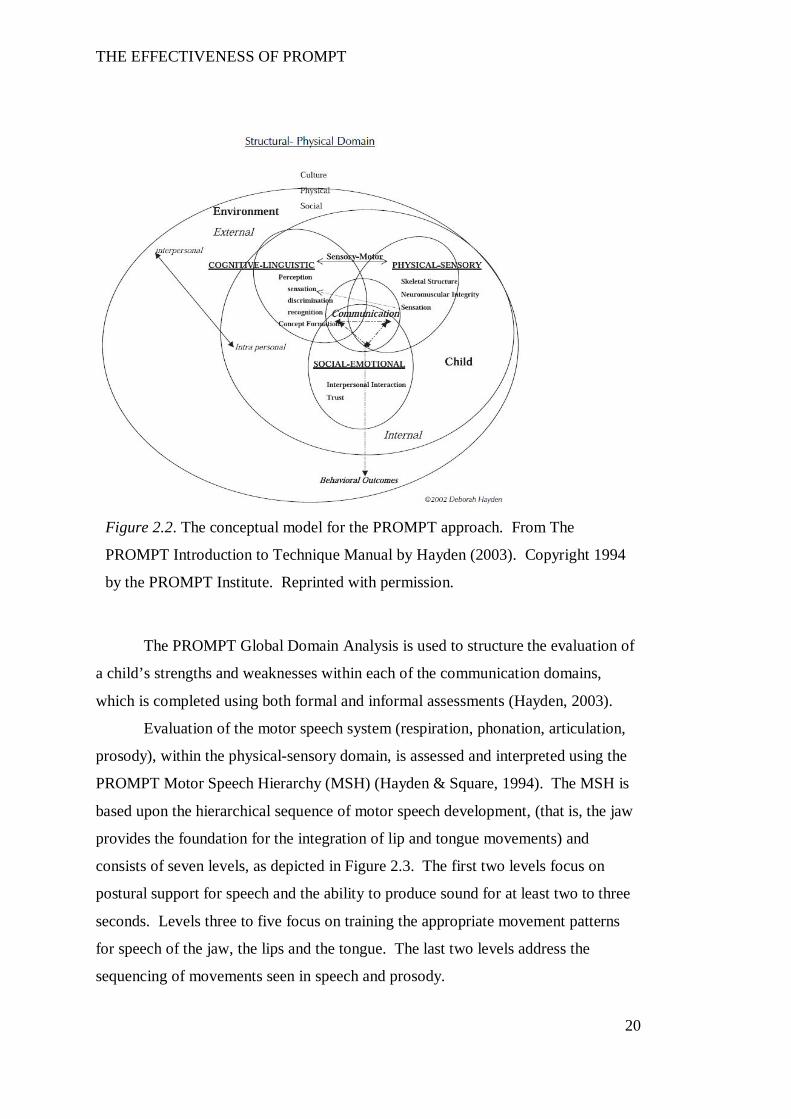
THE EFFECTIVENESS OF PROMPT
20
The PROMPT Global Domain Analysis is used to structure the evaluation of
a child’s strengths and weaknesses within each of the communication domains,
which is completed using both formal and informal assessments (Hayden, 2003).
Evaluation of the motor speech system (respiration, phonation, articulation,
prosody), within the physical-sensory domain, is assessed and interpreted using the
PROMPT Motor Speech Hierarchy (MSH) (Hayden & Square, 1994). The MSH is
based upon the hierarchical sequence of motor speech development, (that is, the jaw
provides the foundation for the integration of lip and tongue movements) and
consists of seven levels, as depicted in Figure 2.3. The first two levels focus on
postural support for speech and the ability to produce sound for at least two to three
seconds. Levels three to five focus on training the appropriate movement patterns
for speech of the jaw, the lips and the tongue. The last two levels address the
sequencing of movements seen in speech and prosody.
Figure 2.2. The conceptual model for the PROMPT approach. From The
PROMPT Introduction to Technique Manual by Hayden (2003). Copyright 1994
by the PROMPT Institute. Reprinted with permission.
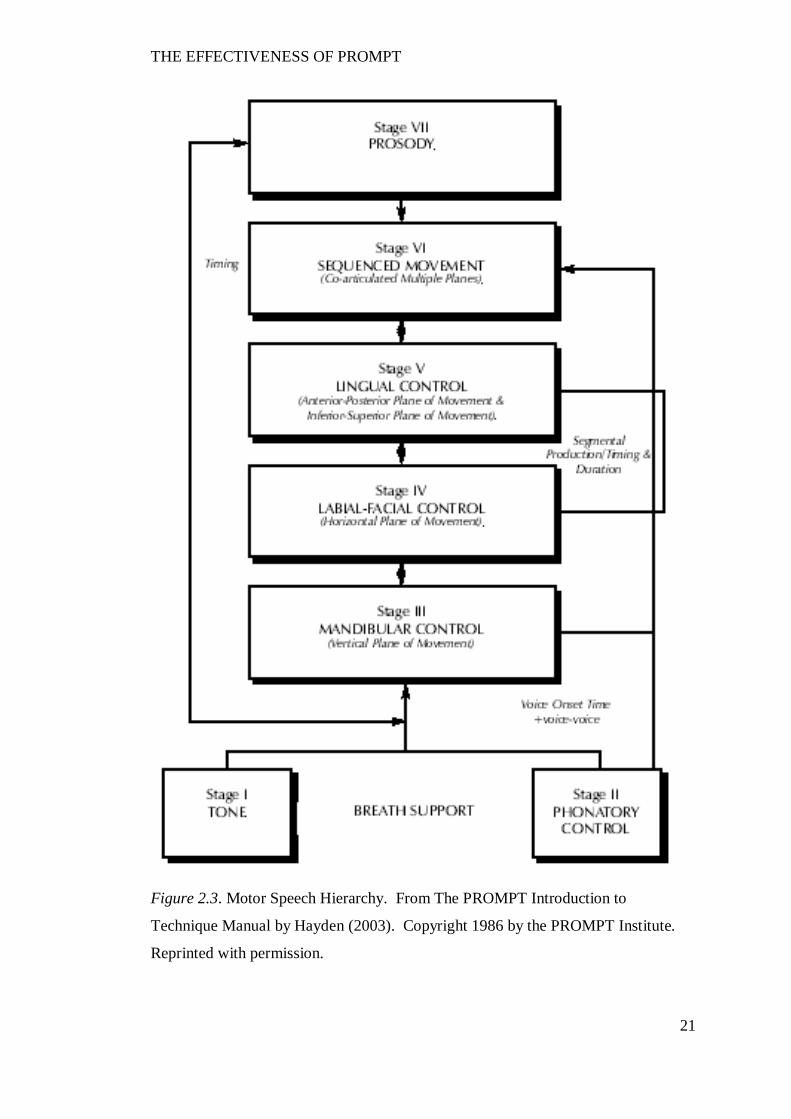
THE EFFECTIVENESS OF PROMPT
21
Figure 2.3. Motor Speech Hierarchy. From The PROMPT Introduction to
Technique Manual by Hayden (2003). Copyright 1986 by the PROMPT Institute.
Reprinted with permission.
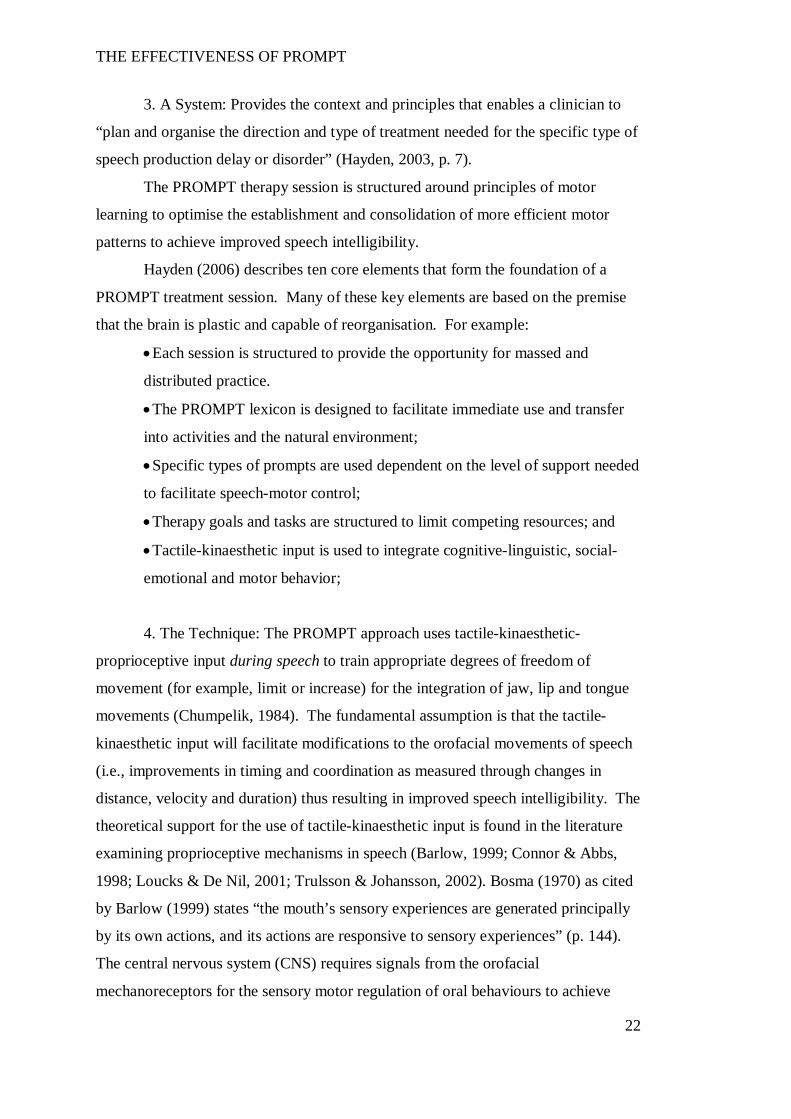
THE EFFECTIVENESS OF PROMPT
22
3. A System: Provides the context and principles that enables a clinician to
“plan and organise the direction and type of treatment needed for the specific type of
speech production delay or disorder” (Hayden, 2003, p. 7).
The PROMPT therapy session is structured around principles of motor
learning to optimise the establishment and consolidation of more efficient motor
patterns to achieve improved speech intelligibility.
Hayden (2006) describes ten core elements that form the foundation of a
PROMPT treatment session. Many of these key elements are based on the premise
that the brain is plastic and capable of reorganisation. For example:
Each session is structured to provide the opportunity for massed and
distributed practice.
The PROMPT lexicon is designed to facilitate immediate use and transfer
into activities and the natural environment;
Specific types of prompts are used dependent on the level of support needed
to facilitate speech-motor control;
Therapy goals and tasks are structured to limit competing resources; and
Tactile-kinaesthetic input is used to integrate cognitive-linguistic, social-
emotional and motor behavior;
4. The Technique: The PROMPT approach uses tactile-kinaesthetic-
proprioceptive input during speech to train appropriate degrees of freedom of
movement (for example, limit or increase) for the integration of jaw, lip and tongue
movements (Chumpelik, 1984). The fundamental assumption is that the tactile-
kinaesthetic input will facilitate modifications to the orofacial movements of speech
(i.e., improvements in timing and coordination as measured through changes in
distance, velocity and duration) thus resulting in improved speech intelligibility. The
theoretical support for the use of tactile-kinaesthetic input is found in the literature
examining proprioceptive mechanisms in speech (Barlow, 1999; Connor & Abbs,
1998; Loucks & De Nil, 2001; Trulsson & Johansson, 2002). Bosma (1970) as cited
by Barlow (1999) states “the mouth’s sensory experiences are generated principally
by its own actions, and its actions are responsive to sensory experiences” (p. 144).
The central nervous system (CNS) requires signals from the orofacial
mechanoreceptors for the sensory motor regulation of oral behaviours to achieve
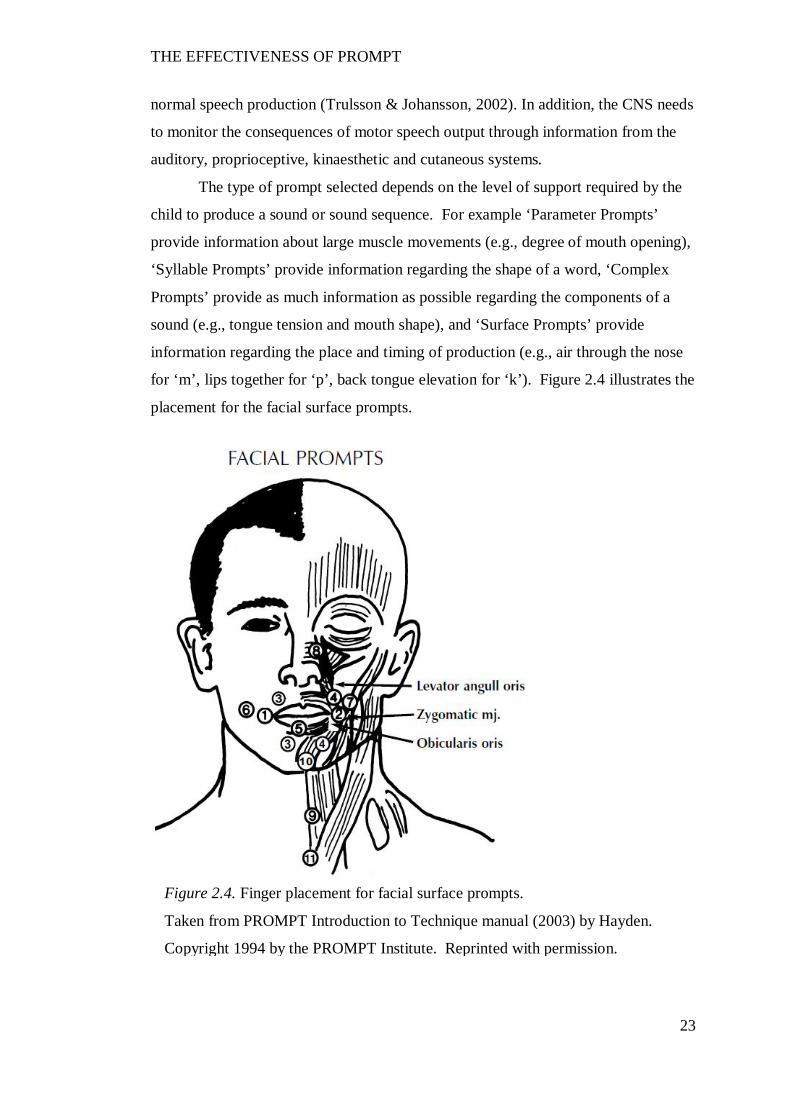
THE EFFECTIVENESS OF PROMPT
23
normal speech production (Trulsson & Johansson, 2002). In addition, the CNS needs
to monitor the consequences of motor speech output through information from the
auditory, proprioceptive, kinaesthetic and cutaneous systems.
The type of prompt selected depends on the level of support required by the
child to produce a sound or sound sequence. For example ‘Parameter Prompts’
provide information about large muscle movements (e.g., degree of mouth opening),
‘Syllable Prompts’ provide information regarding the shape of a word, ‘Complex
Prompts’ provide as much information as possible regarding the components of a
sound (e.g., tongue tension and mouth shape), and ‘Surface Prompts’ provide
information regarding the place and timing of production (e.g., air through the nose
for ‘m’, lips together for ‘p’, back tongue elevation for ‘k’). Figure 2.4 illustrates the
placement for the facial surface prompts.
Figure 2.4. Finger placement for facial surface prompts.
Taken from PROMPT Introduction to Technique manual (2003) by Hayden.
Copyright 1994 by the PROMPT Institute. Reprinted with permission.
THE EFFECTIVENESS OF PROMPT
24
Clark (2003) suggests the theoretical foundations of an intervention approach
and its components need to be examined individually, as part of the evidence-based
process of critical evaluation. In this section the components of PROMPT will be
investigated as follows:
1. An overview of the theoretical basis that informs the philosophy and
approach of PROMPT, and
2. Examination of the principles of neural plasticity and motor learning that
inform the intervention protocol.
This section will conclude with an examination of the current research
undertaken to investigate the effectiveness of PROMPT in the management of motor
speech disorders.
The Theoretical Basis of PROMPT Approach: Dynamic Systems Theory (DST).
“Behaviour and development are emergent properties of system-wide
interactions that can create something new from the many interacting components in
the system” (Spencer, Perone and Buss, 2011, p. 2).
The alignment of the PROMPT approach with dynamic systems theory
(DST) is evident when compared against the core tenets. In this section, four tenets
of DST are presented, followed by an interpretation of how these principles are
applied within the PROMPT approach.
An open system.
Within the construct of DST, a system is defined as a set of components or
domains (collective variables) that are inter-related to function as a unit (Thelen &
Smith, 2006). The inter-relationships among the components of the system operate
within a state of constant change open to external and internal influences. This
means there is a non-linear correspondence between the parts and the whole; and
development may differentially vary within each of the systems. The goal of DST is
to understand the interconnected relationships within and between the system
(Juarrero, 1999).
Self-organisation.
Self-organisation refers to the process by which new behaviours emerge from
THE EFFECTIVENESS OF PROMPT
25
the complex interactions of the subcomponents within an open system (Warren,
2006). This occurs in the absence of pre-determined hard-wiring, through the
repeated interaction between the subcomponents in a system. Whilst it is
theoretically possible for a system to generate a number of self-organising
behavioural patterns, individuals generally use a subset of preferred movement
patterns.
Development is considered to occur in the direction of increasing hierarchical
structure, with order maintained through the presence of specific boundary
conditions (Newell, Liu, & Mayer-Kress, 2001; Newman & Newman, 2007; Thelen
& Smith, 2006). For example, the literature reports that the development of early
speech is characterised by progression through an increasingly complex continuum.
One end of the continuum is comprised of early pre-speech vocalisations and
babbling with progression to single word usage that consists of a complex inventory
of vowels, consonants and consonant clusters at the other end. Specific boundary
conditions include physiological constraints and potential catalysts. Early
physiological constraints include the coupling of the jaw and lip whilst catalysts
include the intrinsic desire to communicate (Bleile, 2004; McLeod, van Doorn, &
Reed, 2001; Nip, Green, & Marx, 2011; A. Smith & Zelaznik, 2004).
Emergence/Transitions.
New behavioural patterns are considered to emerge when previously
unconnected processes or domains become coordinated and interconnected.
Preferred behaviours emerge through feedback among many lower order system
elements and result in a differentially more complex hierarchy (Newman &
Newman, 2007, p. 278). For example, Iverson and Thelen (1999) report a dynamic
progression of speech development that is influenced through co-activation of
connections with the motor system, such that the onset of babbling is temporally
related to changes in patterns of rhythmic hand activity. Specifically, Iverson and
Thelen (1999) cite evidence that indicate gains in language development between 9
and 13 months of age are positively associated with the use of gesture.
A preferred or stable movement pattern is referred to as an attractor state.
Moving from a preferred stable movement pattern requires perturbation to the
system. The more stable an attractor state, the greater a perturbation needs to be to
move the state of the system to another attractor state. The emergence of a new
THE EFFECTIVENESS OF PROMPT
26
behaviour is termed a “phase-shift”. When the current preferred behaviour pattern is
destabilised, a new behaviour pattern emerges (Kelso, 2003; Lewis, 2011; Muchisky,
Gershkoff-Stowe, Cole, & Thelen, 1996; Spencer & Perone, 2008; Thelen & Smith,
2006).
These patterns of change are realised within the function of time as measured
on two scales: real-time and developmental time. Real-time behaviour is the
spontaneous assembly of behaviour on a short time scale towards an attractor.
Developmental time represents attractor states that self-organise over a longer
developmental time frame of months and years.
Parameters and constraints.
A system is organised and structured bi-directionally through order and
control parameters, respectively (Kelso, 2003). An order parameter is a single
intrinsic entity/variable that describes the organisation of the subsystems within a
system (Porter & Hogue, 1998; Van Lieshout, 2004). Control parameters are
external (boundary conditions) that act to constrain the order parameter and are
responsible for bringing about change/re-organisation to the state of the system. For
example, inter-limb and phonation studies indicate that the relative phase of
movement is an order parameter and an example of a control parameter is the
velocity of movement.
Influences that guide emerging behaviours are considered constraints. Three
types are identified by Newell (Newell, 1991b, 2003; Newell, Broderick, & Slifkin,
2003; Newell et al., 2001; Newell & Valvano, 1998) and include:
1. Individual constraints: these refer to the unique structural and functional
characteristics of an individual (e.g., physical, cognitive and social);
2. Task constraints: these refer to the goal of a specific task and can be grouped on
a number of levels including functional (e.g., activities of daily living), movement
attributes (e.g., continuous or discrete movements) and movement stability (e.g.,
nature of nature of the task being performed); and
3. Environmental constraints: these refer to physical factors (such as lighting
conditions and terrain) as well as socio-cultural influences.
It is important to note, as stated by Davids, Savelsbergh and Miyahara
(2010), that constraints should not be viewed negatively but as a means to “alleviate
THE EFFECTIVENESS OF PROMPT
27
the co-ordination problem in dynamical movement systems by structuring the
available state space and reducing the number of configurations available ” (p. 174).
Variability.
Variability is considered an adaptive feature of motor output and not as noise
or error that needs to be eradicated during development (Fetters, 2010; Newell,
Deutsch, Sosnoff, & Mayer-Kress, 2006; Piek, 2002; Stergiou, Harbourne, &
Cavanaugh, 2006; Vereijken, 2010). Specifically, a system that is stable at a
particular point in time will show limited variability, whilst a system that is
undergoing modification will show increased variability. The literature suggests
there is an optimal level of variability that is reflective of a healthy adaptive system.
The concept of maladaptive variability is in contrast to adaptive variability
and has the potential to limit skill acquisition. For example, childhood apraxia of
speech, despite lack of consensus on specific diagnostic features, is identified in part
by excessive variability in speech sound production that contributes to impaired
speech/language development (Morgan & Vogel, 2008).
The literature indicates increased variability is reflective of instability and a
reduced ability to maintain and transfer newly learned skill; whilst reduced
variability is reflective of rigidity and low responsiveness to perturbations (Fetters,
2010; Sanger & Kukke, 2007). Both levels of variability have the potential to limit
skill acquisition and have been reported in the literature in children with CP
(Hadders-Algra, 2001, 2008, 2010; Hong et al., 2011). Thus, a goal of intervention
is to facilitate an optimal level of movement variability (Stergiou et al., 2006).
Application of Dynamic Systems Theory to PROMPT.
The alignment of the PROMPT approach with DST is evident when
compared against the core tenets of DST:
Open System.
The philosophy and conceptual framework of PROMPT (as illustrated in
Figure 2.2) acknowledges the influence of the interdependent relationships between
the cognitive-linguistic, social-emotional and physical-sensory domains and the
environment, on communication.
THE EFFECTIVENESS OF PROMPT
28
A PROMPT trained clinician completes a domain analysis, using a variety of
standardised and non-standardised assessment tools to determine the interaction
between each of the domains within the system of communication, and subsequently
selects the entry point of intervention. The focus of intervention is on strengthening
the weakest domain and re-structuring the subsystems, with the ultimate goal of
achieving integration between and within all of the subsystems for functional
communication.
Emergence.
Speech motor development is viewed as consisting of co-dependent
subsystems, with skill acquisition subject to the bidirectional interaction between
existing and developing systems. Thus, motor learning is characterised by an
alteration to the movement synergies unique to each individual (Doyon & Benali,
2005; Kostrubiec, Tallet, & Zanone, 2006). The PROMPT clinician is trained to
assess the co-ordination between the subsystems and work to promote coordination
through the establishment of efficient functional higher order synergies.
Parameters and Constraints:
Clinicians need to adopt a problem solving approach to identify constraints
(individual, environmental, task) that can be used to optimise learning (Fetters,
2010). Intervention techniques are used to facilitate or act as a control parameter in
bringing about change toward a higher level of functioning.
Tactile-kinaesthetic prompts are used to restructure the degrees of freedom
available in a speech system to facilitate controlled flexible movements (as bound by
conditions of time and space) for accurate speech production.
Variability:
The PROMPT approach acknowledges that maladaptive variability is a
hallmark of impairment. As stated by Hayden (2002): “some attractor states may
continue to persist and thereby result in a motor system that is out of balance” (p.
26). The tactile-kinaesthetic input is therefore used to facilitate appropriate
boundary conditions for the development of efficient and flexible motor speech
patterns.
THE EFFECTIVENESS OF PROMPT
29
Neural Plasticity
“By understanding the basic principles of neural plasticity that govern
learning in both the intact and damaged brain, identification of the critical
behavioural and neurobiological signals that drive recovery can begin” (Kleim &
Jones, 2008, p. S225).
PROMPT intervention aims to establish new motor patterns to improve
speech intelligibility. The premise for this is based on evidence that indicates the
brain is plastic and capable of learning new motor skills through the establishment of
new motor patterns.
The literature reports that synaptic plasticity is one of the most important
mechanisms in the developing brain (Abel & Lattal, 2001; Garvey et al., 2007;
Johnston et al., 2009; Landi, Baguear, & Della-Maggiore, 2011). Plasticity is
defined as the ability of the brain to organise or re-organise itself in response to
different tasks, environments and stimuli. It involves changes in synaptic
connections between individual neurons, increases in neuronal assemblies, increased
myelination of axons and/or changes in the size/shape of a neuron (Kolb &
Whishaw, 1996; Monfils, Plautz, & Kleim, 2005; Pascual-Leone, Amedi, Fregni, &
Merabet, 2005). As stated by Pascual-Leone et al. (2005), neural plasticity should be
considered an intrinsic property of the nervous system that is an “obligatory
consequence of each sensory input, motor act, association, reward signal, action
plan, or awareness” (p. 379).
Neuro-imaging studies provide evidence that support the contribution of
adaptive plasticity during sensorimotor learning. Specifically, functional brain
imaging technology has been used to identify the differential contribution of neural
networks during the different phases of sensorimotor learning (acquisition and
consolidation) that have been identified in behavioural studies (Abel & Lattal, 2001;
Boudreau, Farina, & Falla, 2010; Costa, Cohen, & Nicholelis, 2004; Doyon, 2008;
Doyon & Benali, 2005; Sanes, 2003; Seidler & Noll, 2008; Ungerleider, Doyon, &
Karni, 2002). For example, Seidler and colleagues (Seidler & Noll, 2008; Seidler,
Noll, & Chintalapati, 2006) provide detailed neural imaging data that indicate the
brain structures active during early learning involve both the corticostriatal and
corticocerebellar systems. Changes in activation are observed in the transfer phase
THE EFFECTIVENESS OF PROMPT
30
that includes decreased activation and a reduction in brain regions recruited. Doyon
and Benali (2005) report the corticostriatal system maintains a role in the long-term
maintenance of motor sequence tasks, whilst the corticocerebellar system maintains
a role in long-term motor adaptation.
The influence of training on adaptive plasticity has been demonstrated in
animals and humans that have undergone treadmill training subsequent to spinal cord
injury (De Leon, Hodgson, Roy, & Edgerton, 1999; Frood, 2011; Timoszyk et al.,
2002). Two phases are associated with spinal cord injury: the initial phase
associated with the mechanical impact and a second phase associated with
neurotoxicity. It has been proposed, with some evidence to support the notion, that
the treadmill training promotes new connections with the spinal cord by creating an
environment that prevents cell death associated with the secondary phase of spinal
cord injury (De Leon et al., 1999; Frood, 2011).
Whilst the focus of this section of the thesis is on adaptive plasticity, it is
equally important to note that there is also evidence of maladaptive plasticity, as seen
in cerebral palsy.
Evidence of re-organisational plasticity in children with CP.
Neurobiological mechanisms that contribute to maladaptive re-organisational
plasticity include overproduction of neurons in early development, programmed cell
death of excessive neurons, overproduction and elimination of immature synapses in
early development and strengthening of synaptic connections later in life (Johnston
et al., 2009; Wittenberg, 2009).
The literature indicates that children with CP are most likely to show
maintenance of axonal projections that would normally be pruned (Eyre, 2007; J. H.
Martin, 2005; J. H. Martin, Friel, Salimi, & Chakrabarty, 2007). An example of this
is evident in the corticospinal pathways of children with CP. Transcranial magnetic
stimulation (TMS) studies show individuals who have suffered unilateral damage to
the motor cortex (such as spastic hemiplegia) can show different patterns of motor
projections. These include an increase in the number of fast conduction ipsilateral
and contralateral corticospinal axons from the intact motor cortex. This is in contrast
to typical development where projections are contralateral (Holmstrom et al., 2010).
There is evidence to suggest that the increased ipsilateral projections occur as a
result of reduced activity in the infarcted hemisphere leading to increased withdrawal
THE EFFECTIVENESS OF PROMPT
31
of the surviving contralateral corticospinal projections and displacement from the
more active ipsilateral projections (Cowry, 2007; Eyre, 2007; Eyre et al., 2007).
New imaging techniques show that children with CP also display injury to
the sensory tracts. Specifically, it has been identified that in comparison to typically
developing children there is a reduction in the sensory fibres connecting to the
sensory cortex (Hoon et al., 2009; Sanger & Kukke, 2007; Yoshida et al., 2010).
Despite the substantial neural re-organisation evident in children with CP,
there is emerging evidence to suggest that intervention can promote functional neural
adaptive plasticity in children with CP (Trivedi et al. 2008; Yoshida et al., 2010).
Trivedi et al. (2008) report evidence of changes in the corticospinal tracts of children
with CP, using diffusion tensor imaging. Eight children with spastic CP participated
in an intervention protocol that included botulinum injections and administration of a
6-month intensive standardized physiotherapy regime. At the 6 month follow-up
data indicated all participants had made a functional change to mobility, as measured
using the Gross Motor Function Classification System (GMFCS). These changes
were accompanied by increased functional connectivity in the corticospinal tract as
indicated by increased fractional anisotropy in the posterior limb of the internal
capsule. The significance of these data is strengthened by the use of 6 control
participants who recorded no significant change to the corticospinal tracts between
the baseline and follow-up phases.
The study by Trivedi et al. (2008) suggests adaptive plastic changes are
possible in children with CP and indicates the potential to enhance therapeutic
outcomes.
In summary, whilst no therapeutic approach can repair brain damage,
knowledge of the mechanisms that facilitate adaptive changes in the developing
brain; and how the brain can be re-organised following disruption/lesions presents
clinicians with neuroscientific principles upon which to base intervention protocols
for the purposes of maximizing learning.
THE EFFECTIVENESS OF PROMPT
32
Motor Learning
Learning requires the establishment of new stable patterns of dynamics that
can be brought together over a sufficient time scale to realise the demands of either
a new task to be learned, or the continued improvement in the performance of a
given task” (Newell, 2003, p. 2).
Presented in this section of the thesis is a behavioural interpretation of the
phases of motor learning and training structure framed within the theory of DST.
Phases of Learning.
Skill acquisition.
Skill acquisition is defined as the emergence of a behaviour that is adaptable
to a range of varying performance contexts (Araújo & Davids, 2011; Temprado,
Zanone, Monno, & Laurent, 2001).
Training a new skill entails the evaluation of both the existing preferred
movement pattern behaviours as well as the degree of cooperation/competition that
exists with the new “to-be- learned” skill. Initial early acquisition of a motor skill
entails modification of pre-existing capacities (Hollenstein, 2007; Kelso, 2003;
Kelso & Zanone, 2002; Y.-T. Liu, Mayer-Kress, & Newell, 2010; Newell, 2003;
Temprado et al., 2001). It is expected that when a task requirement cooperates with
pre-existing coordination tendencies, the behaviour will be stabilised. In contrast,
when the “to-be-learned” behaviour competes with pre-existing behaviours it is
expected the whole behavioural repertoire will undergo recalibration, including
previously stable behaviours.
Evidence of recalibration subsequent to learning a new skill has been
reported in typical development. For example, Chen, Metcalfe, Jeka and Clark
(2007) report disruption in the sitting posture of infants subsequent to
accommodating the newly emerging behaviour of independent walking; and
Corbetta and Bojczyk (2002) report a return to two-handed reaching during the
transition to walking.
A popular experimental methodology to assess the influence of pre-existing
behaviours on newly acquired behaviours during skills training is that of in-phase
and anti-phase coordination patterns. This is illustrated in the work of Serrien (2009)
THE EFFECTIVENESS OF PROMPT
33
who explored the competition between new (2:1 finger-tapping task) and existing
(1:1 in/anti-phase finger task) dynamics in a bimanual finger-tapping task, using two
experimental conditions with an ABA design.
The use of finger motion tasks is an established experimental methodology
for assessing functional coordination (Kelso, 1984; Repp, 2005). The 2:1 finger-
tapping task requires participants tap one finger at twice the rate of another finger at
a rate paced to a metronome. The dominant finger taps at the faster tempo, whilst
the non-dominant finger taps at a slower tempo. The participant is required to hold
the slow finger stationary at a peak upward position whilst the faster finger
completes the second tap. The 1:1 ratio in-phase task requires a participant to make
bimanual finger flexion movements in synchrony with a metronome. The 1:1 finger
anti-phase task requires participants synchronise one finger in extension and the
other in flexion to the beat of the metronome.
The results of the finger tapping task demonstrated interference from the
preferred (in-phase) movement pattern when the two training tasks were interwoven.
Specifically, the pre-existing dynamic appeared to dominate the newly acquired
movement pattern. The results therefore support claims in the literature that the
effectiveness of generalisation will depend on the previous learning history of an
individual (Krakauer, 2006).
The ability to enhance motor learning through the provision of sensory
information has also been observed through the use of modified phase coordination
tasks. For example, Atchy-Dalam, Peper, Zanone and Beek (2005) had two groups
of participants learn a relative phasing task of 30º performed using the left and right
elbows. One group of participants had an inertial load imposed on the left forearm to
induce the phase shift. Group two performed the phasing task in the absence of the
inertial load. Both groups of participants performed the required in-phase task
initially to the beat of the metronome for 40 seconds and then continued the task in
the absence of the metronome for 30 seconds. The data indicate whilst there was no
difference in the level of performance obtained there was a significant difference in
the practice conditions. That is, the group with the inertial load applied learnt the
task faster and with less error than the group without the additional sensory
feedback. The results therefore offer support to the premise that the mapping of
motor output with sensory consequences facilitates learning.
THE EFFECTIVENESS OF PROMPT
34
Consolidation.
From a DST perspective, the “empirical signature” of skill consolidation is
both improvement in accuracy and stability; and the phase where susceptibility to
interference/competition decreases (Abel & Lattal, 2001; Doyon, 2008; Kelso &
Zanone, 2002). Improvement in accuracy represents a shift towards goal attainment,
whilst consolidation is proposed to be represented within the stability of the
behaviour. As stated by Kostrubiec, Tallet and Zanone (2006) “The interplay
between the creation/stabilisation of a new pattern and the transient shift of an
existing one enables the memory to cope with incoming perturbations” ( p. 243).
Emerging literature suggests with increasing age susceptibility to interference
strengthens. Specifically, pre-pubescent children show a stronger ability to co-
consolidate successive experience-dependent tasks than post-pubescent children or
adults (Bronnikov & Kravtsov, 2006; Dorfberger, Adi-Japha, & Karni, 2007).
An example of age-related changes in susceptibility is found in the study of
Dorfberger, Adi-Japha and Karni (2007). They explored the influence of
interference in children using a finger-to-thumb opposition task that required
participants to tap a sequence on the non-dominant hand. Comparisons of
performance across three age-groups (9, 12 and 17 year-old-children) were reported
across two experimental conditions. In the first experimental conditions, participants
performed a finger sequence task that was repeated across three training sessions. In
the second experimental condition, the same task from experiment one was repeated.
A second training session followed two hours later where a second finger sequence
was introduced and trained. The results show the two youngest age groups (9 years
and 12 years) did not experience interference and continued to record improved
performance scores, whilst the 17-year-olds recorded significant interference with
the introduction of the second sequence.
This “divergence” in motor learning between adults and children suggests the
need for caution in the application of motor learning principles predominantly based
on adult data to children who are still acquiring motor skills.
An additional concept for consideration is that of continued skill acquisition
during non-training periods. This is referred to as “off-line” learning and has been
reported in the non-intervention period, subsequent to intervention in children with
CP (Bar-Haim et al., 2010; Dorfberger et al., 2007; Trahan & Malouin, 2002). Bar-
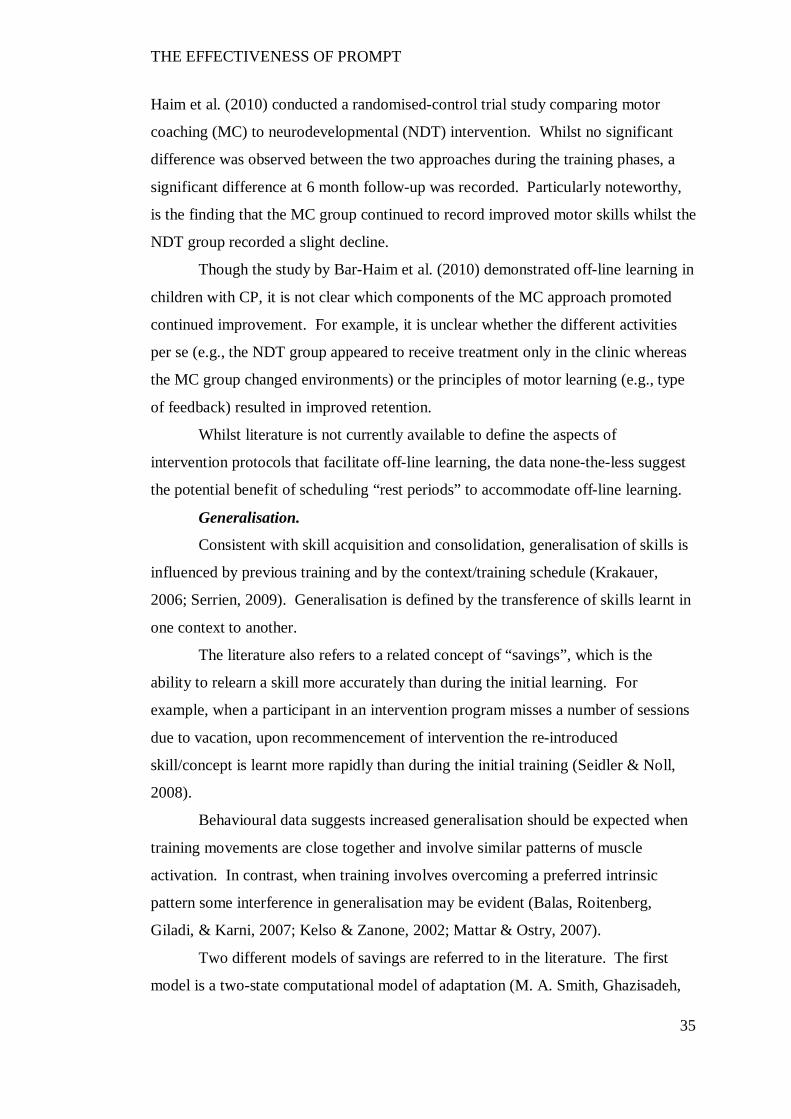
THE EFFECTIVENESS OF PROMPT
35
Haim et al. (2010) conducted a randomised-control trial study comparing motor
coaching (MC) to neurodevelopmental (NDT) intervention. Whilst no significant
difference was observed between the two approaches during the training phases, a
significant difference at 6 month follow-up was recorded. Particularly noteworthy,
is the finding that the MC group continued to record improved motor skills whilst the
NDT group recorded a slight decline.
Though the study by Bar-Haim et al. (2010) demonstrated off-line learning in
children with CP, it is not clear which components of the MC approach promoted
continued improvement. For example, it is unclear whether the different activities
per se (e.g., the NDT group appeared to receive treatment only in the clinic whereas
the MC group changed environments) or the principles of motor learning (e.g., type
of feedback) resulted in improved retention.
Whilst literature is not currently available to define the aspects of
intervention protocols that facilitate off-line learning, the data none-the-less suggest
the potential benefit of scheduling “rest periods” to accommodate off-line learning.
Generalisation.
Consistent with skill acquisition and consolidation, generalisation of skills is
influenced by previous training and by the context/training schedule (Krakauer,
2006; Serrien, 2009). Generalisation is defined by the transference of skills learnt in
one context to another.
The literature also refers to a related concept of “savings”, which is the
ability to relearn a skill more accurately than during the initial learning. For
example, when a participant in an intervention program misses a number of sessions
due to vacation, upon recommencement of intervention the re-introduced
skill/concept is learnt more rapidly than during the initial training (Seidler & Noll,
2008).
Behavioural data suggests increased generalisation should be expected when
training movements are close together and involve similar patterns of muscle
activation. In contrast, when training involves overcoming a preferred intrinsic
pattern some interference in generalisation may be evident (Balas, Roitenberg,
Giladi, & Karni, 2007; Kelso & Zanone, 2002; Mattar & Ostry, 2007).
Two different models of savings are referred to in the literature. The first
model is a two-state computational model of adaptation (M. A. Smith, Ghazisadeh,
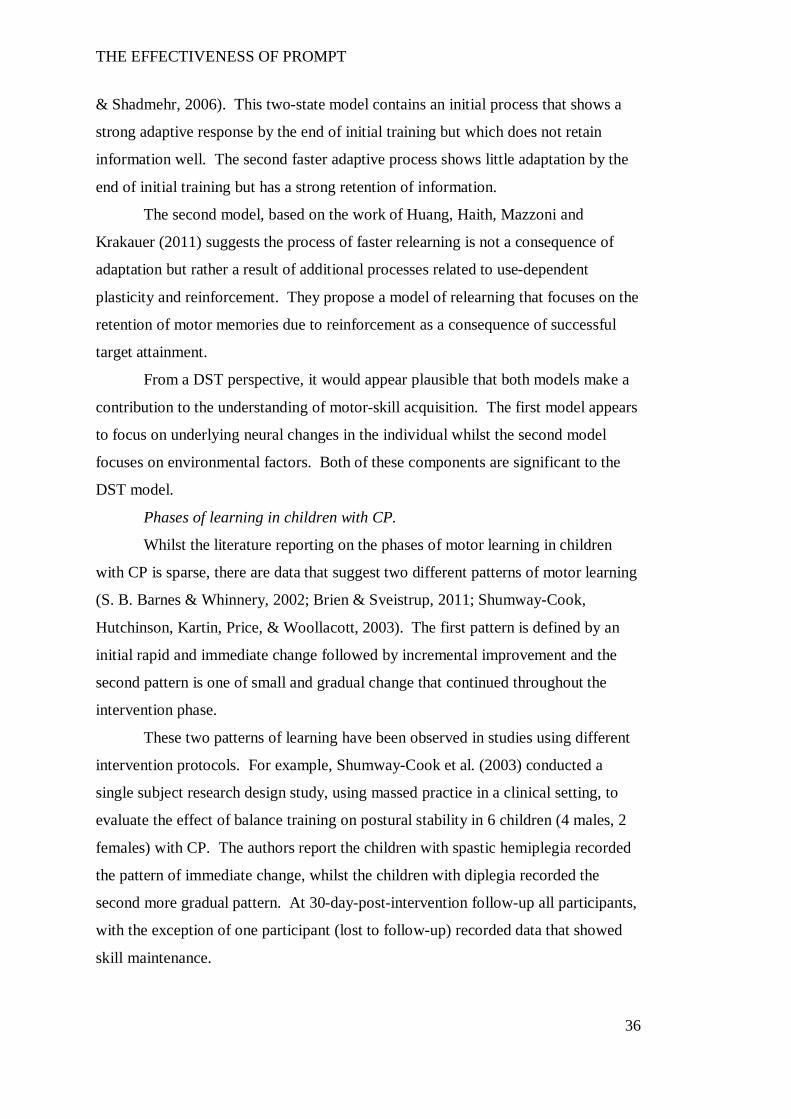
THE EFFECTIVENESS OF PROMPT
36
& Shadmehr, 2006). This two-state model contains an initial process that shows a
strong adaptive response by the end of initial training but which does not retain
information well. The second faster adaptive process shows little adaptation by the
end of initial training but has a strong retention of information.
The second model, based on the work of Huang, Haith, Mazzoni and
Krakauer (2011) suggests the process of faster relearning is not a consequence of
adaptation but rather a result of additional processes related to use-dependent
plasticity and reinforcement. They propose a model of relearning that focuses on the
retention of motor memories due to reinforcement as a consequence of successful
target attainment.
From a DST perspective, it would appear plausible that both models make a
contribution to the understanding of motor-skill acquisition. The first model appears
to focus on underlying neural changes in the individual whilst the second model
focuses on environmental factors. Both of these components are significant to the
DST model.
Phases of learning in children with CP.
Whilst the literature reporting on the phases of motor learning in children
with CP is sparse, there are data that suggest two different patterns of motor learning
(S. B. Barnes & Whinnery, 2002; Brien & Sveistrup, 2011; Shumway-Cook,
Hutchinson, Kartin, Price, & Woollacott, 2003). The first pattern is defined by an
initial rapid and immediate change followed by incremental improvement and the
second pattern is one of small and gradual change that continued throughout the
intervention phase.
These two patterns of learning have been observed in studies using different
intervention protocols. For example, Shumway-Cook et al. (2003) conducted a
single subject research design study, using massed practice in a clinical setting, to
evaluate the effect of balance training on postural stability in 6 children (4 males, 2
females) with CP. The authors report the children with spastic hemiplegia recorded
the pattern of immediate change, whilst the children with diplegia recorded the
second more gradual pattern. At 30-day-post-intervention follow-up all participants,
with the exception of one participant (lost to follow-up) recorded data that showed
skill maintenance.
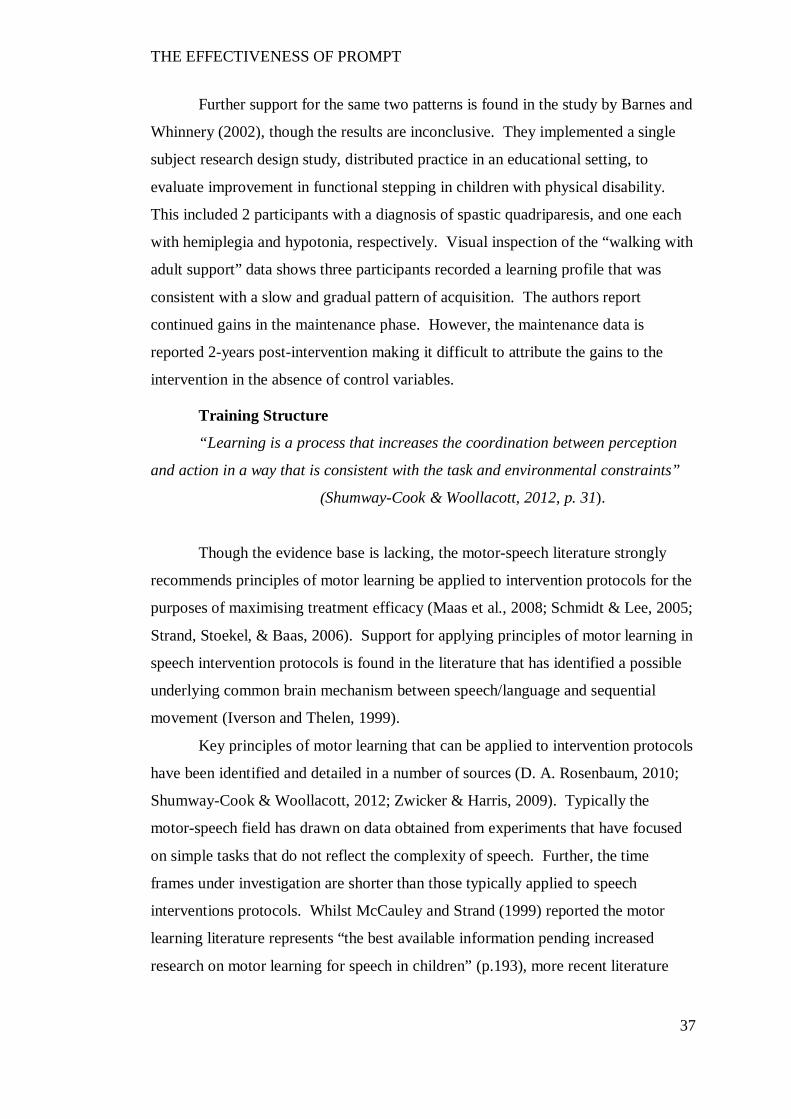
THE EFFECTIVENESS OF PROMPT
37
Further support for the same two patterns is found in the study by Barnes and
Whinnery (2002), though the results are inconclusive. They implemented a single
subject research design study, distributed practice in an educational setting, to
evaluate improvement in functional stepping in children with physical disability.
This included 2 participants with a diagnosis of spastic quadriparesis, and one each
with hemiplegia and hypotonia, respectively. Visual inspection of the “walking with
adult support” data shows three participants recorded a learning profile that was
consistent with a slow and gradual pattern of acquisition. The authors report
continued gains in the maintenance phase. However, the maintenance data is
reported 2-years post-intervention making it difficult to attribute the gains to the
intervention in the absence of control variables.
Training Structure
“Learning is a process that increases the coordination between perception
and action in a way that is consistent with the task and environmental constraints”
(Shumway-Cook & Woollacott, 2012, p. 31).
Though the evidence base is lacking, the motor-speech literature strongly
recommends principles of motor learning be applied to intervention protocols for the
purposes of maximising treatment efficacy (Maas et al., 2008; Schmidt & Lee, 2005;
Strand, Stoekel, & Baas, 2006). Support for applying principles of motor learning in
speech intervention protocols is found in the literature that has identified a possible
underlying common brain mechanism between speech/language and sequential
movement (Iverson and Thelen, 1999).
Key principles of motor learning that can be applied to intervention protocols
have been identified and detailed in a number of sources (D. A. Rosenbaum, 2010;
Shumway-Cook & Woollacott, 2012; Zwicker & Harris, 2009). Typically the
motor-speech field has drawn on data obtained from experiments that have focused
on simple tasks that do not reflect the complexity of speech. Further, the time
frames under investigation are shorter than those typically applied to speech
interventions protocols. Whilst McCauley and Strand (1999) reported the motor
learning literature represents “the best available information pending increased
research on motor learning for speech in children” (p.193), more recent literature
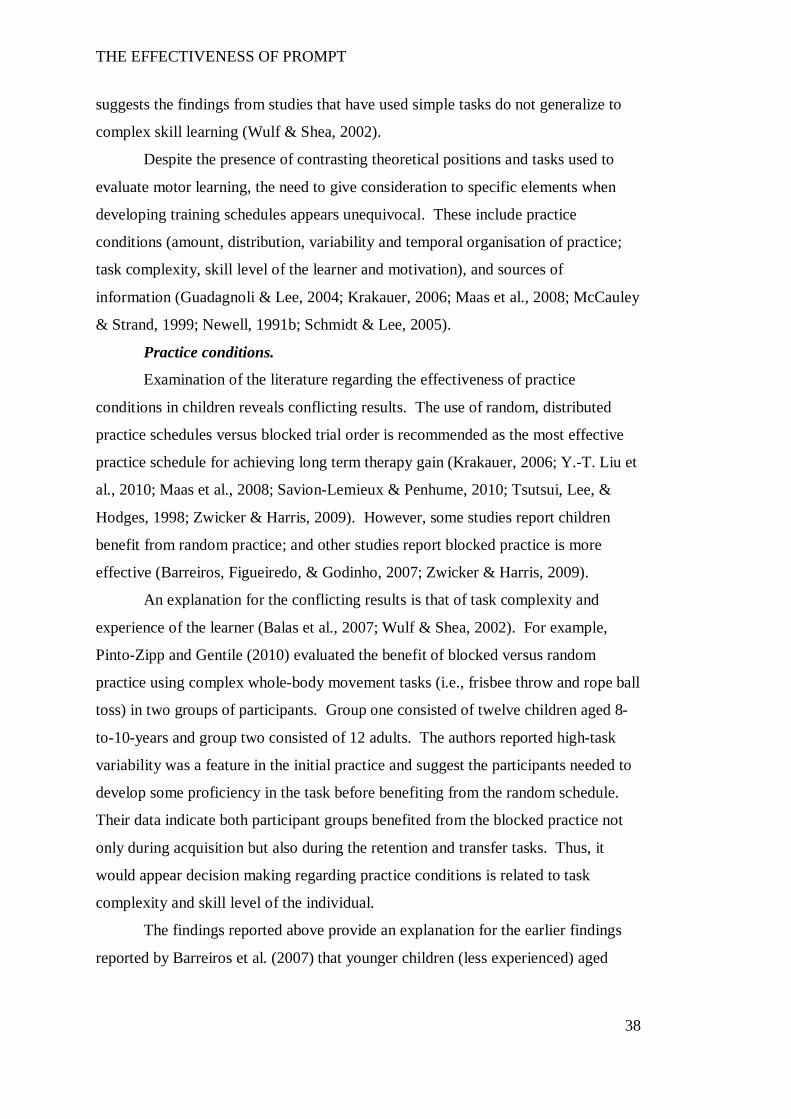
THE EFFECTIVENESS OF PROMPT
38
suggests the findings from studies that have used simple tasks do not generalize to
complex skill learning (Wulf & Shea, 2002).
Despite the presence of contrasting theoretical positions and tasks used to
evaluate motor learning, the need to give consideration to specific elements when
developing training schedules appears unequivocal. These include practice
conditions (amount, distribution, variability and temporal organisation of practice;
task complexity, skill level of the learner and motivation), and sources of
information (Guadagnoli & Lee, 2004; Krakauer, 2006; Maas et al., 2008; McCauley
& Strand, 1999; Newell, 1991b; Schmidt & Lee, 2005).
Practice conditions.
Examination of the literature regarding the effectiveness of practice
conditions in children reveals conflicting results. The use of random, distributed
practice schedules versus blocked trial order is recommended as the most effective
practice schedule for achieving long term therapy gain (Krakauer, 2006; Y.-T. Liu et
al., 2010; Maas et al., 2008; Savion-Lemieux & Penhume, 2010; Tsutsui, Lee, &
Hodges, 1998; Zwicker & Harris, 2009). However, some studies report children
benefit from random practice; and other studies report blocked practice is more
effective (Barreiros, Figueiredo, & Godinho, 2007; Zwicker & Harris, 2009).
An explanation for the conflicting results is that of task complexity and
experience of the learner (Balas et al., 2007; Wulf & Shea, 2002). For example,
Pinto-Zipp and Gentile (2010) evaluated the benefit of blocked versus random
practice using complex whole-body movement tasks (i.e., frisbee throw and rope ball
toss) in two groups of participants. Group one consisted of twelve children aged 8-
to-10-years and group two consisted of 12 adults. The authors reported high-task
variability was a feature in the initial practice and suggest the participants needed to
develop some proficiency in the task before benefiting from the random schedule.
Their data indicate both participant groups benefited from the blocked practice not
only during acquisition but also during the retention and transfer tasks. Thus, it
would appear decision making regarding practice conditions is related to task
complexity and skill level of the individual.
The findings reported above provide an explanation for the earlier findings
reported by Barreiros et al. (2007) that younger children (less experienced) aged
THE EFFECTIVENESS OF PROMPT
39
between 8 and 9-years, may benefit from blocked practice; and older children (more
experienced) aged between 10-12 years may benefit from random practice.
It has been stated that an accepted paediatric clinical practice for
speech/language pathologists is to use blocked practice followed with random
practice (McCauley & Strand, 1999). Blocked practice is used during the early
stages of training practice and then subsequently replaced with random practice to
achieve skill generalisation when novelty and task difficulty is reduced. Support to
this clinical approach is offered in the study by Pinto-Zipp and Gentile (2010).
Lee and Wishart (2005) suggest the protocols of random and blocked practice
represent the poles of the “contextual interferences” continuum and propose that a
schedule comprised of small blocks followed by random presentation may facilitate
learning in complex tasks. This perspective is particularly relevant to children with
CP, where the literature reports a greater number of trials and longer learning time is
needed to facilitate functional outcomes (Garvey et al., 2007).
In summary, the literature indicates a prescribed formula of blocked versus
random practice needs to be replaced with decision making on the basis of the needs
of the individual, the task demands and environmental constraints.
Information.
“The challenge for the therapist, then, is in selecting the physical or
informational constraint that induces an efficient and effective search strategy for
task-relevant qualitative and quantitative change and functional output in the
movement dynamics” (Newell & Valvano, 1998, p. 51).
Newell and Valvano (1998) suggest a clinician can facilitate a learner to
optimise their search for the ideal movement strategy by:
1. Assisting the learner to understand the goal of the task and movements to
be learned.
2. Providing feedback in the form of knowledge of performance and
knowledge of results,
3. Augmenting the search by the learner for the optimum strategy.
The following subsection focuses specifically on the use of tactile-
kinaesthetic input as a means of facilitating a learner to optimise their search for the
ideal functional movement strategy. The literature highlights the importance of
THE EFFECTIVENESS OF PROMPT
40
sensory augmentation in particular for children with CP to achieve functional motor
output (Hadders-Algra, 2000).
The role of active tactile-kinaesthetic information.
The function of augmentative feedback is to facilitate the search for a task
relevant strategy and minimize the practice of inefficient or ineffective strategies.
Newell and Valvano (1998) state augmentative information is the provision of
information that is not normally available to an individual.
The role of somatosensory input in speech production.
Speech production entails fine movements that are dependent on peripheral
input to control, correct, adjust and stabilise oral facial movements. The literature
identifies orofacial afferents are not only essential for motor control, they play a
critical role in motor learning (Sessle et al., 2005).
There is evidence to suggest that sensory input can modulate motor cortex
excitability and therefore has a role to play in facilitating “learning-dependent”
plasticity (Monfils, Plautz and Kleim, 2005; Stefan 2000). Specifically, perturbation
studies have been used to explore the potential role of the somatosensory system to
affect change in the coordination of movement synergies (Ito & Ostry, 2010; Kelso,
Tuller, Vatikiotis-Bateson, & Fowler, 1984; Ménard, Perrier, Aubin, Savariaux, &
Thibeault, 2008).
These studies have shown articulator coupling patterns will reorganise or
compensate as a response to modification/disruptions in articulator movements (such
as insertion of a plastic tube in the mouth or a bite block between the teeth), to
maintain perceptual integrity and acoustic output. For example, Kelso et al. (1984)
report three experiments designed to examine the effects on articulatory cooperation
between the jaw, lips and tongue, when a constant force load was applied to the jaw
in both opening and closing gestures. They reported that whilst no perceived
distortion to the speech signal was observed (acoustic analysis was not provided),
kinematic and EMG analysis demonstrated compensatory changes. For example,
when an unexpected force was applied to the jaw during production of the word bab
/bæb/, compensation was observed through increased activity in the upper and lower
lip. Similarly, during production of the word /bæz/ increased tongue activity (but not
lip) was observed. They reasoned the lower-lip perturbations, particularly evident
when the load was applied in jaw closing, occurred as a result of passive mechanical
THE EFFECTIVENESS OF PROMPT
41
compensations; whilst a more active neuromuscular response in “locally linked
articulators”, was indicated by increased EMG activity in the jaw opening
experiments.
Perturbation studies also suggest the potential to improve speech intelligibility
through modifying speech movement patterns. Mefferd and Green (2010) explored
the strength of the relationship between tongue kinematics and acoustic changes in
the vowel /ia/ by manipulating speaking rate and loudness in 10 typical adult
speakers during the production of a sentence. They found changes in tongue
displacement were closely correlated with changes in acoustic vowel distance, and
suggested the potential for speech intelligibility to be improved through
maximisation of articulatory specification.
The role of mechanoreceptors.
The literature supports the functional role mechanoreceptors play in
providing detailed information pertaining to movement position and control during
speech (Estep, 2009; Estep & Barlow, 2007; Francis, Ciocca, & Yu, 2003; Howell,
Anderson, Bartrip, & Bailey, 2009; McClean & Tasko, 2003).
The perioral region, in particular the upper lip, corners of the mouth and
tongue, is richly innervated and endowed with mechanoreceptors. Research shows
the presence of fast (type I) and slowly adapting (type I and II) afferents in the skin
of the face and vermillion borders of the lips (Trulsson & Johansson, 2002). Fast
adapting type I afferents are activated by discrete stimuli in a small well defined
area, maintain burst responses at the beginning and end of sustained skin
indentations; and are found mostly in the tip of the tongue. The slowly adapting
afferents also have small well defined receptive fields. Slowly adapting type I
afferents are reported to be superficially located and “respond to self-generated
movements and external loads” (Estep & Barlow, 2007). Type II slowly adapting
afferents are located more deeply in the skin and sensitive to lateral skin stretch
(Macefield, 2005).
The research also indicates four types of mechano-sensory information are
available to the jaw (Türker, 2002). These include 1. golgi tendon organs that
provide information about muscle contraction; 2. muscle spindles that provide
detailed information about muscle length and rate of change (Finan & Smith, 2005;
Murray & Klineberg, 1984); 3. cutaneous receptors (slowly adapting type I and II) in
THE EFFECTIVENESS OF PROMPT
42
the hairy skin overlying the temporomandibular joint that provides information about
condylar movement (Bukowska, Essick, & Trulsson, 2010; Trulsson & Johansson,
2002; Türker, Johnsen, Sowman, & Trulsson, 2006); and 4. slowly adapting
periodontal mechanoreceptors (Gilman, 2002).
The literature suggests the type, placement and context in which the
stimulation is provided is essential in facilitating sensory-motor reorganisation
(Estep, 2009; Gick, Ikegami, & Derrick, 2010; Wilston, Reed, & Braida, 2010). For
example, Estep and Barlow (2007) report data that demonstrates changes to the inter-
lip angle subsequent to the delivery of tactile stimulation to the upper lip during
production of the word “ah-wah”. Further they report observing differential changes
dependent on the timing of the mechanical inputs during the speech task. Their data
reinforces the responsiveness of the orofacial system to external mechano-sensory
stimulation during active speech.
Ito and Ostry (2010) completed a series of experiments that demonstrated lip
movements could be changed in response to mechanical perturbation. One
experiment evaluated the adaption of the upper lip to a facial skin stretch
perturbation task during the production of the short phrase “see wood”. A
mechanical stretch was applied laterally to the oral angle, with change in horizontal
displacement of the upper lip used as the measure of change and compared to a
control group. The data show that the displacement of the upper lip systematically
increased with training; and this was maintained when the load was removed. In
contrast, the control group showed no change thus indicating the skin perturbation
task modified the motor speech output. Further the authors report that an analysis of
the first and second formant frequencies did not reveal any consistent patterns of
change. The authors suggest this may be due to other articulatory organs
compensating to maintain the acoustic output, or the small change in vocal tract
length over the course of the training period.
Though not specifically highlighted in the PROMPT model, it is important to
note that the location and placement of the surface prompts for facial placements 1-5
(as illustrated in Figure 2.4) are consistent with the location of fast and slowly
adapting mechanoreceptive fields of the infraorbital and inferior alveolar nerves
(Trulsson & Essick, 2010; Trulsson & Johansson, 2002).
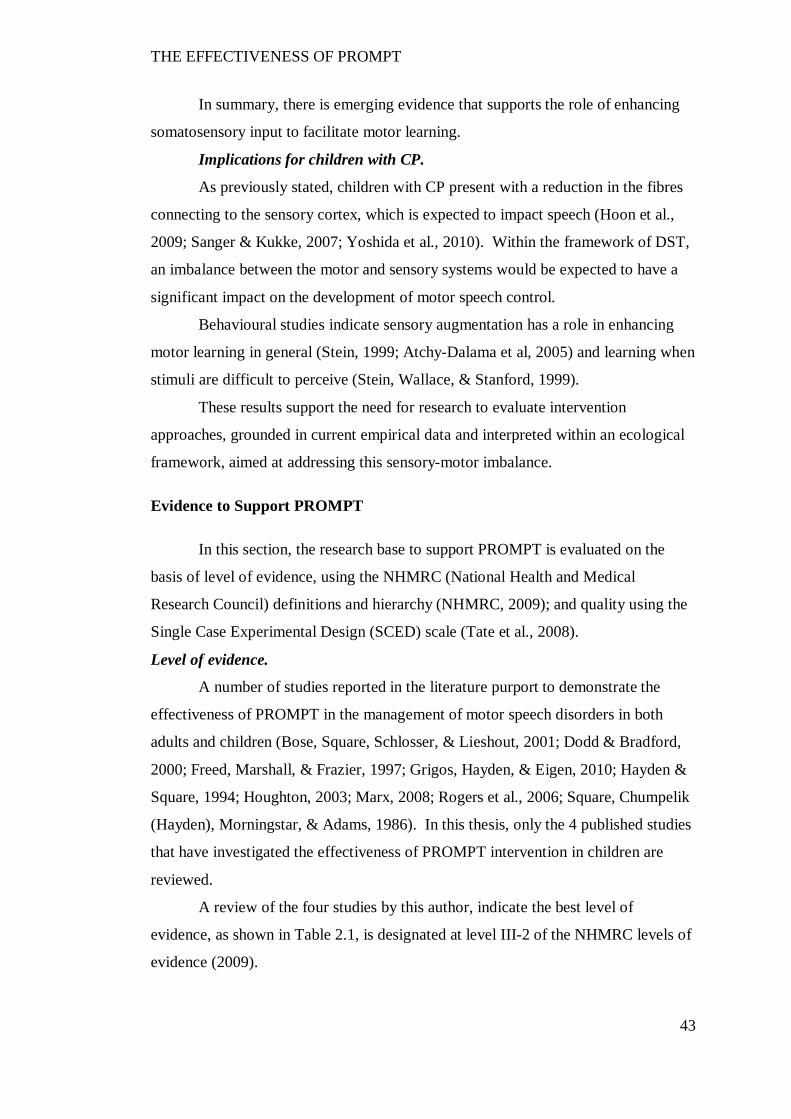
THE EFFECTIVENESS OF PROMPT
43
In summary, there is emerging evidence that supports the role of enhancing
somatosensory input to facilitate motor learning.
Implications for children with CP.
As previously stated, children with CP present with a reduction in the fibres
connecting to the sensory cortex, which is expected to impact speech (Hoon et al.,
2009; Sanger & Kukke, 2007; Yoshida et al., 2010). Within the framework of DST,
an imbalance between the motor and sensory systems would be expected to have a
significant impact on the development of motor speech control.
Behavioural studies indicate sensory augmentation has a role in enhancing
motor learning in general (Stein, 1999; Atchy-Dalama et al, 2005) and learning when
stimuli are difficult to perceive (Stein, Wallace, & Stanford, 1999).
These results support the need for research to evaluate intervention
approaches, grounded in current empirical data and interpreted within an ecological
framework, aimed at addressing this sensory-motor imbalance.
Evidence to Support PROMPT
In this section, the research base to support PROMPT is evaluated on the
basis of level of evidence, using the NHMRC (National Health and Medical
Research Council) definitions and hierarchy (NHMRC, 2009); and quality using the
Single Case Experimental Design (SCED) scale (Tate et al., 2008).
Level of evidence.
A number of studies reported in the literature purport to demonstrate the
effectiveness of PROMPT in the management of motor speech disorders in both
adults and children (Bose, Square, Schlosser, & Lieshout, 2001; Dodd & Bradford,
2000; Freed, Marshall, & Frazier, 1997; Grigos, Hayden, & Eigen, 2010; Hayden &
Square, 1994; Houghton, 2003; Marx, 2008; Rogers et al., 2006; Square, Chumpelik
(Hayden), Morningstar, & Adams, 1986). In this thesis, only the 4 published studies
that have investigated the effectiveness of PROMPT intervention in children are
reviewed.
A review of the four studies by this author, indicate the best level of
evidence, as shown in Table 2.1, is designated at level III-2 of the NHMRC levels of
evidence (2009).
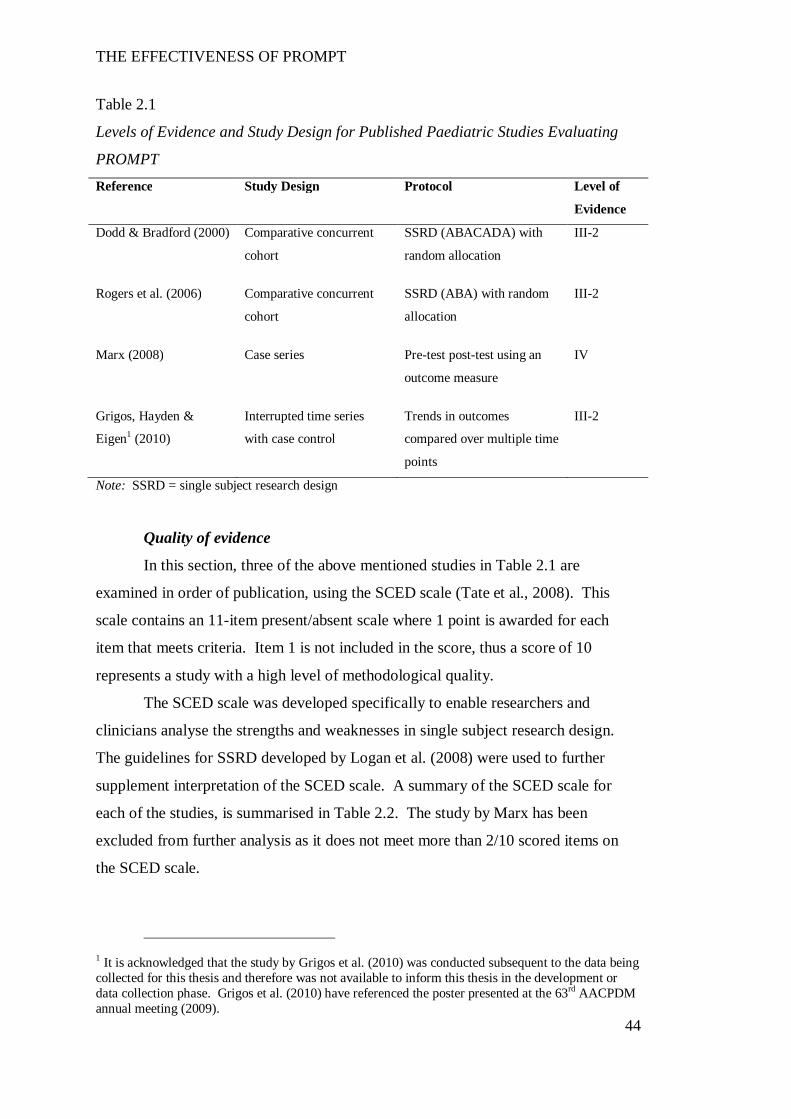
THE EFFECTIVENESS OF PROMPT
44
Table 2.1
Levels of Evidence and Study Design for Published Paediatric Studies Evaluating
PROMPT Reference Study Design Protocol Level of
Evidence
Dodd & Bradford (2000) Comparative concurrent
cohort
SSRD (ABACADA) with
random allocation
III-2
Rogers et al. (2006) Comparative concurrent
cohort
SSRD (ABA) with random
allocation
III-2
Marx (2008) Case series Pre-test post-test using an
outcome measure
IV
Grigos, Hayden &
Eigen1 (2010)
Interrupted time series
with case control
Trends in outcomes
compared over multiple time
points
III-2
Note: SSRD = single subject research design
Quality of evidence
In this section, three of the above mentioned studies in Table 2.1 are
examined in order of publication, using the SCED scale (Tate et al., 2008). This
scale contains an 11-item present/absent scale where 1 point is awarded for each
item that meets criteria. Item 1 is not included in the score, thus a score of 10
represents a study with a high level of methodological quality.
The SCED scale was developed specifically to enable researchers and
clinicians analyse the strengths and weaknesses in single subject research design.
The guidelines for SSRD developed by Logan et al. (2008) were used to further
supplement interpretation of the SCED scale. A summary of the SCED scale for
each of the studies, is summarised in Table 2.2. The study by Marx has been
excluded from further analysis as it does not meet more than 2/10 scored items on
the SCED scale.
1 It is acknowledged that the study by Grigos et al. (2010) was conducted subsequent to the data being collected for this thesis and therefore was not available to inform this thesis in the development or data collection phase. Grigos et al. (2010) have referenced the poster presented at the 63rd AACPDM annual meeting (2009).
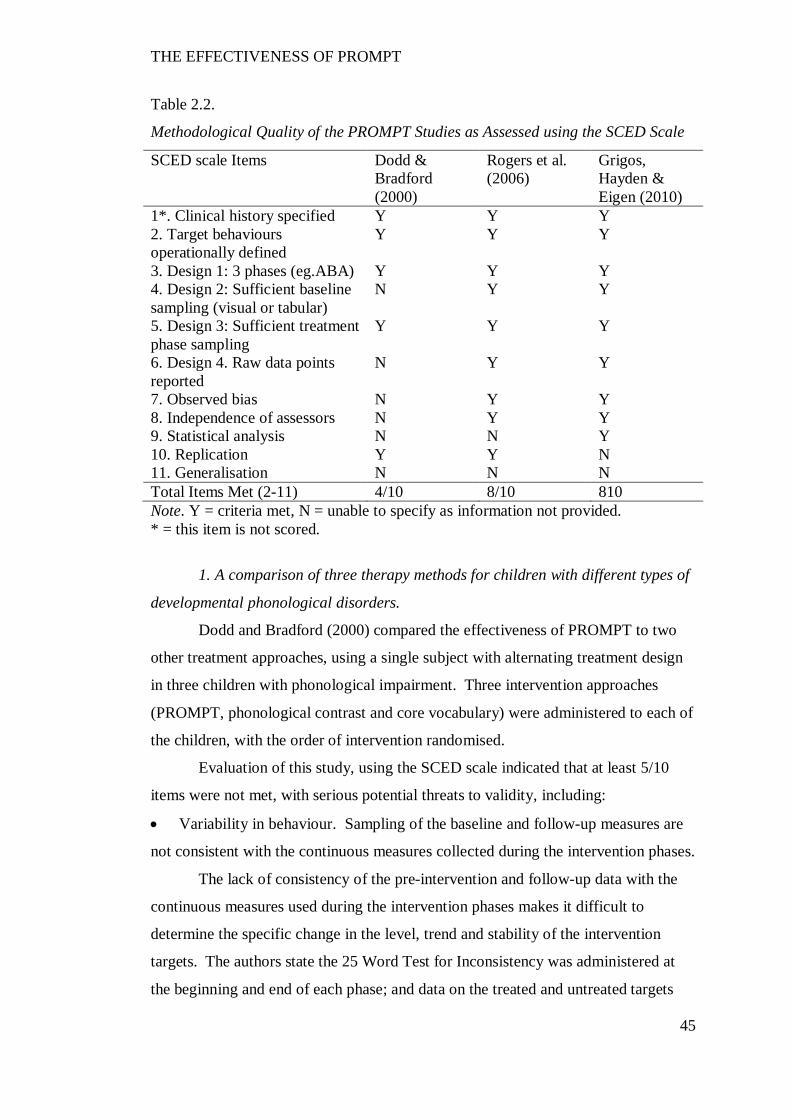
THE EFFECTIVENESS OF PROMPT
45
Table 2.2.
Methodological Quality of the PROMPT Studies as Assessed using the SCED Scale
SCED scale Items Dodd & Bradford (2000)
Rogers et al. (2006)
Grigos, Hayden & Eigen (2010)
1*. Clinical history specified Y Y Y 2. Target behaviours operationally defined
Y Y Y
3. Design 1: 3 phases (eg.ABA) Y Y Y 4. Design 2: Sufficient baseline sampling (visual or tabular)
N Y Y
5. Design 3: Sufficient treatment phase sampling
Y Y Y
6. Design 4. Raw data points reported
N Y Y
7. Observed bias N Y Y 8. Independence of assessors N Y Y 9. Statistical analysis N N Y 10. Replication Y Y N 11. Generalisation N N N Total Items Met (2-11) 4/10 8/10 810 Note. Y = criteria met, N = unable to specify as information not provided. * = this item is not scored.
1. A comparison of three therapy methods for children with different types of
developmental phonological disorders.
Dodd and Bradford (2000) compared the effectiveness of PROMPT to two
other treatment approaches, using a single subject with alternating treatment design
in three children with phonological impairment. Three intervention approaches
(PROMPT, phonological contrast and core vocabulary) were administered to each of
the children, with the order of intervention randomised.
Evaluation of this study, using the SCED scale indicated that at least 5/10
items were not met, with serious potential threats to validity, including:
Variability in behaviour. Sampling of the baseline and follow-up measures are
not consistent with the continuous measures collected during the intervention phases.
The lack of consistency of the pre-intervention and follow-up data with the
continuous measures used during the intervention phases makes it difficult to
determine the specific change in the level, trend and stability of the intervention
targets. The authors state the 25 Word Test for Inconsistency was administered at
the beginning and end of each phase; and data on the treated and untreated targets
THE EFFECTIVENESS OF PROMPT
46
were collected every second session during the treatment phases. Further only the
raw data of the intervention phase is provided.
Observer bias. Two potential sources of observer bias include failure to report
fidelity to all three intervention approaches and the independence of the assessor
from the intervention. Further, whilst the authors report point-to-point reliability for
the pre-assessment tools, no reliability measures are reported for the intervention
targets. In addition, administration of the PROMPT approach requires a clinician
complete a systems analysis observation in order to determine the intervention
priorities. This assessment information is not included in the battery of assessment
tools, thus making it difficult to determine the appropriateness of the intervention
goals for this approach. It should also be noted that the authors state in their
hypotheses that they predict the PROMPT intervention will be ineffective. When
these factors are considered collectively, a bias against the approach is suggested.
Verification of treatment efficacy. No statistical analysis or effect size data is
provided.
These internal threats to validity indicate the authors’ interpretations of the
results need to be considered cautiously. The authors conclude that the PROMPT
approach was “of minimal use to any of the children” (p.208). However, it could be
argued the authors failed to control for intervention bias. The authors state they did
not expect PROMPT to be effective because the underlying deficit was not
commensurate with the mechanics of the treatment approach. If the authors believed
this intervention approach inappropriate to the impairment under investigation, it
raises the question as to why the PROMPT treatment approach was selected for
investigation.
Although the authors conclude the PROMPT approach did not effect
substantial gain to the intervention targets, they do report all children made positive
changes to speech production accuracy and intelligibility. This suggests the
effectiveness of the PROMPT approach with a population for which the approach
was developed, warrants attention.
2. Teaching young nonverbal children with autism useful speech: A pilot
study of the Denver Model and PROMPT Interventions.
Rogers, Hayden, Hepburn, Charlife-Smith, Hall and Hayes (2006) report on
the effectiveness of two intervention approaches (PROMPT and the Denver Model)
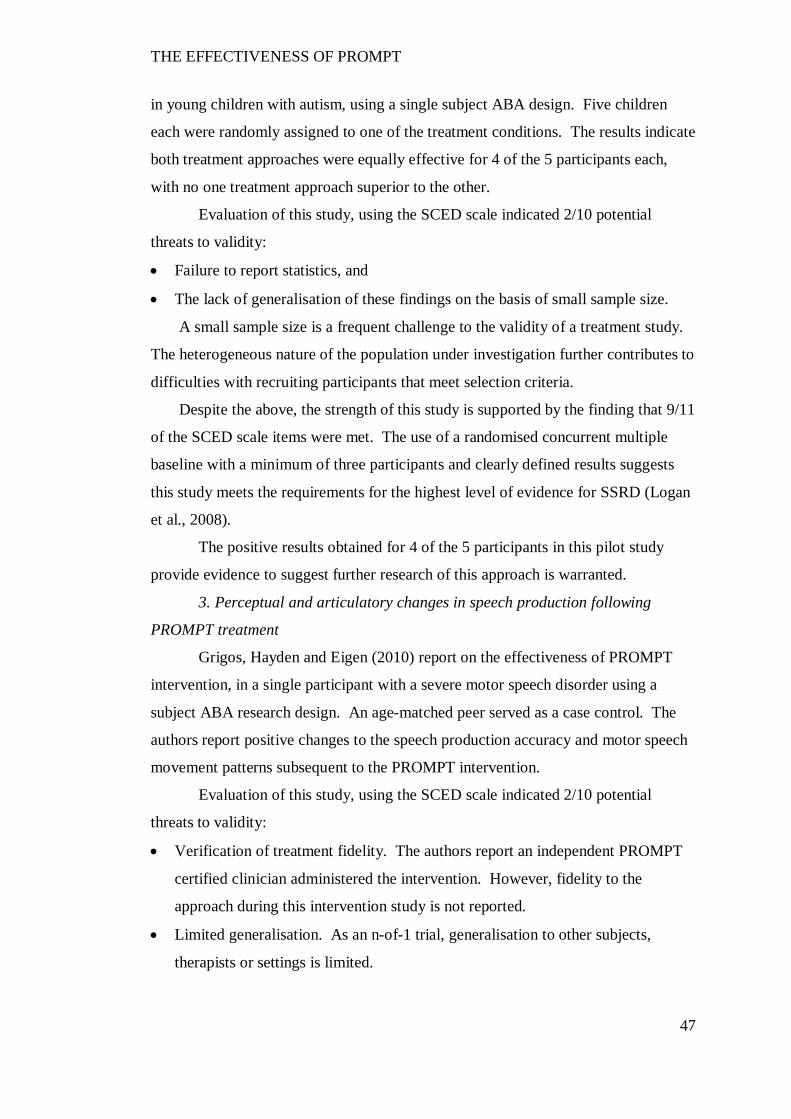
THE EFFECTIVENESS OF PROMPT
47
in young children with autism, using a single subject ABA design. Five children
each were randomly assigned to one of the treatment conditions. The results indicate
both treatment approaches were equally effective for 4 of the 5 participants each,
with no one treatment approach superior to the other.
Evaluation of this study, using the SCED scale indicated 2/10 potential
threats to validity:
Failure to report statistics, and
The lack of generalisation of these findings on the basis of small sample size.
A small sample size is a frequent challenge to the validity of a treatment study.
The heterogeneous nature of the population under investigation further contributes to
difficulties with recruiting participants that meet selection criteria.
Despite the above, the strength of this study is supported by the finding that 9/11
of the SCED scale items were met. The use of a randomised concurrent multiple
baseline with a minimum of three participants and clearly defined results suggests
this study meets the requirements for the highest level of evidence for SSRD (Logan
et al., 2008).
The positive results obtained for 4 of the 5 participants in this pilot study
provide evidence to suggest further research of this approach is warranted.
3. Perceptual and articulatory changes in speech production following
PROMPT treatment
Grigos, Hayden and Eigen (2010) report on the effectiveness of PROMPT
intervention, in a single participant with a severe motor speech disorder using a
subject ABA research design. An age-matched peer served as a case control. The
authors report positive changes to the speech production accuracy and motor speech
movement patterns subsequent to the PROMPT intervention.
Evaluation of this study, using the SCED scale indicated 2/10 potential
threats to validity:
Verification of treatment fidelity. The authors report an independent PROMPT
certified clinician administered the intervention. However, fidelity to the
approach during this intervention study is not reported.
Limited generalisation. As an n-of-1 trial, generalisation to other subjects,
therapists or settings is limited.
THE EFFECTIVENESS OF PROMPT
48
Despite the preceeding, the strength of this study is supported by the use of
precise objective measures involving a stimulus set that was not part of the
intervention protocol. The recommendation for further research is consistent with
both the level of evidence and findings of the study.
Recommendation
It has been reported in the literature that the evidence-base to support
PROMPT is equivocal, with a level of evidence consistent with at best “limited
testimonial support” (Bowen, 2009, p. xviii). However, this appraisal of the peer
reviewed literature shows a level of evidence that is commensurate with many
intervention approaches reported to be of value in managing speech sound disorders
in children (Williams, McLeod & McCauley, 2010).
The evaluation of the three studies reported in this thesis, combined with the
theoretical basis that underpins the approach, suggests there is sufficient support to
warrant the further investigation of this approach in the management of motor speech
disorders in children with CP.
THE EFFECTIVENESS OF PROMPT
49
CHAPTER 3 RATIONALE AND RESEARCH AIMS FOR THE PRESENT
THESIS
The literature identifies that although CP remains one of the most prevalent
childhood disabilities, the evidence base to support or refute speech intervention
approaches, framed within present day theoretical models and relevant empirical
evidence, is limited.
The primary goal of this thesis is to make a contribution to the current limited
evidence base available to clinicians in the management of motor-speech disorders
associated with CP. The lack of sufficient data available to clinicians is a barrier not
only in the decision making process regarding the evaluation and selection of an
appropriate intervention protocol for clients but also in the allocation of therapy and
training budgets.
The treatment approach (PROMPT) selected for investigation in this thesis is
aligned with DST and is supported by recent knowledge gleaned from empirical
studies pertaining to neural plasticity and principles of motor learning.
Outcome measures used to evaluate the PROMPT approach have been
selected to address the domains of part one (function and disability) of the ICF
framework. Specifically, changes to the domain of structure and function were
evaluated using outcome measures that include both perceptual and kinematic
measurements.
The use of both perceptual and kinematic measures, within a clinical setting
for the purposes of evaluating an intervention approach, is considered unique. The
combination of both types of measures enables an evaluation of the functional status
of the motor-speech movement patterns and their associated perceptual output in
children with a moderate-to-severe motor speech disorder; and the impact of changes
to these parameters on speech intelligibility. Whilst the use of perceptual measures
is well established and indeed has been identified as the benchmark for assessment
(Murdoch, 2011), kinematic measurements have typically been confined to the
research laboratory. However, the advances in the portability of motion analysis
technology have made kinematic measures more readily accessible to the clinical
setting.
In addition to the domain of structure and function of the ICF, two further
measures were selected to evaluate changes to the domains of activity and
THE EFFECTIVENESS OF PROMPT
50
participation. One measure includes a standardised assessment of speech
intelligibility. The second measure of activity/participation was based on the COPM
(Law et al., 2005). The use of this tool, as framed within the domains of both the
ICF and communication provides the opportunity to reflect changes in activity and
participation as interpreted within the construct of DST. Both the standardised
speech intelligibility measure and the COPM have been identified as robust and
sensitive to change in children with CP.
Children with moderate-to-severe speech impairment were identified for
inclusion in this study as the literature identifies this group of children as being most
at-risk for educational limitations and participation restrictions (Balkom &
Verhoeven, 2010). Speech production has been identified as one of the most
important early predictors of reading success (Nadeau & Tessier, 2009; Peeters et al.,
2009). It has been further identified that the lack of speech interferes with the ability
to use silent reading rehearsal therefore limiting a child’s ability to play with the
sound structure of language for reading success (Ehrich, 2006).
Improvement in a child’s ability to use speech that is understood by familiar
and unfamiliar listeners therefore presents the opportunity to improve a child’s
success in interacting with peers and enhance educational opportunities.
Outcome Measures
“There has been a consensual acceptance amongst many childhood disability
researchers that maximizing children’s effective ‘participation’ is the overarching
goal in providing services....” (Morris, 2009, p. 92).
The major goal of speech therapy for children with severe speech
impairments is to improve intelligibility (Hodson, Scherz, & Strattman, 2002; R.D
Kent, Miolo, & Bloedel, 1994; Klein & Flint, 2006; Pennington, Goldbart, &
Marshall, 2005).
The acceptance of the ICF framework has seen acknowledgement of the need
for outcome measures to reflect not only changes in impairment but also to reflect
the impact of the intervention on the client’s level of activity and participation. The
literature reports that parents and children want to see changes across all domains –
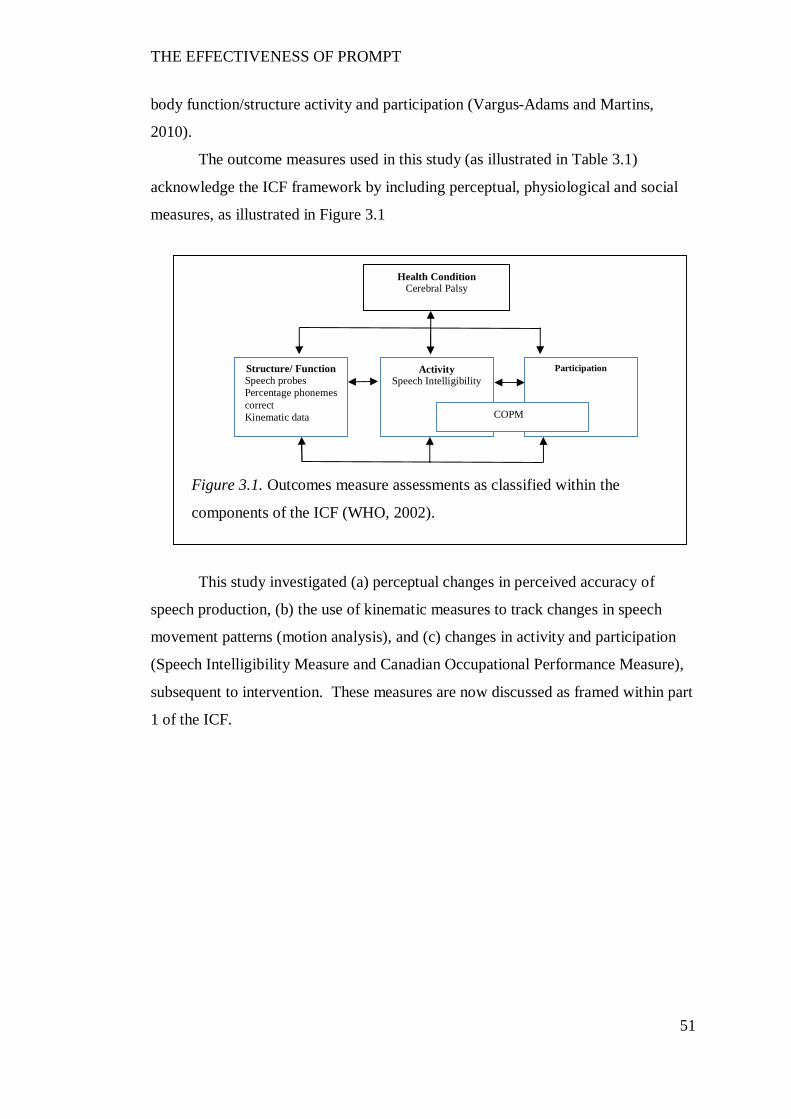
THE EFFECTIVENESS OF PROMPT
51
Participation
Figure 3.1. Outcomes measure assessments as classified within the
components of the ICF (WHO, 2002).
Health Condition Cerebral Palsy
Structure/ Function Speech probes Percentage phonemes correct Kinematic data
Activity Speech Intelligibility
COPM
body function/structure activity and participation (Vargus-Adams and Martins,
2010).
The outcome measures used in this study (as illustrated in Table 3.1)
acknowledge the ICF framework by including perceptual, physiological and social
measures, as illustrated in Figure 3.1
This study investigated (a) perceptual changes in perceived accuracy of
speech production, (b) the use of kinematic measures to track changes in speech
movement patterns (motion analysis), and (c) changes in activity and participation
(Speech Intelligibility Measure and Canadian Occupational Performance Measure),
subsequent to intervention. These measures are now discussed as framed within part
1 of the ICF.
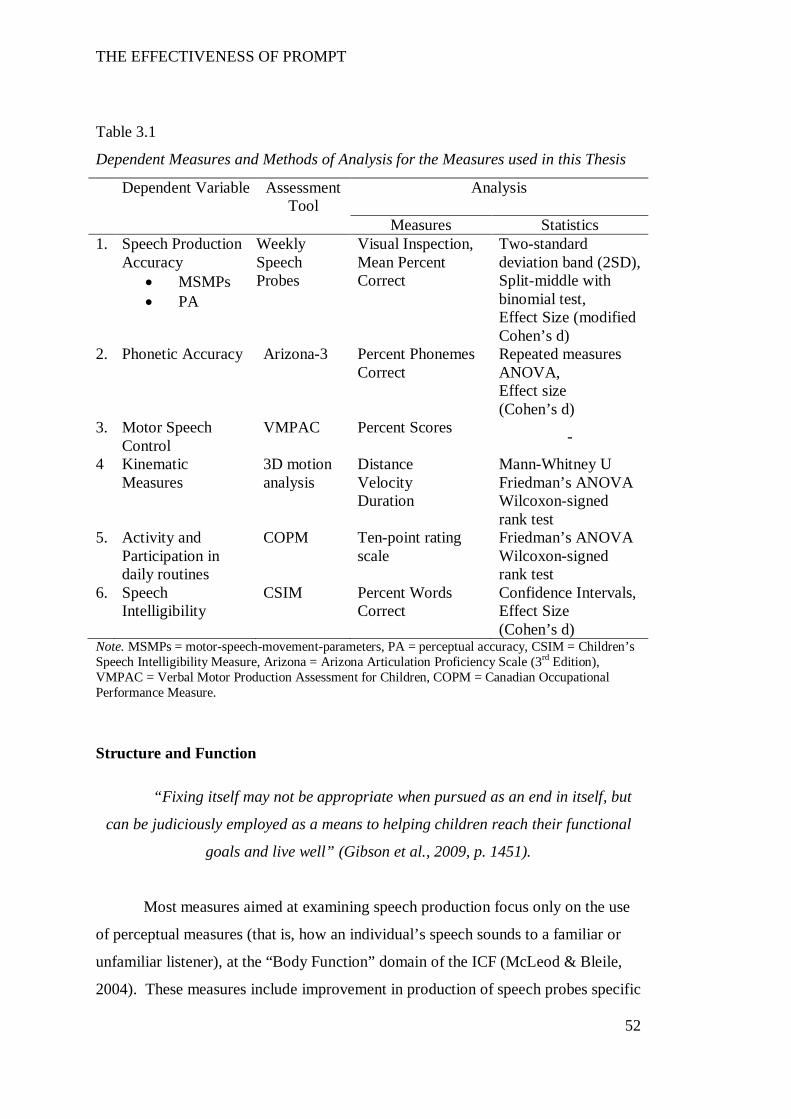
THE EFFECTIVENESS OF PROMPT
52
Table 3.1
Dependent Measures and Methods of Analysis for the Measures used in this Thesis
Dependent Variable Assessment Tool
Analysis
Measures Statistics 1. Speech Production
Accuracy MSMPs PA
Weekly Speech Probes
Visual Inspection, Mean Percent Correct
Two-standard deviation band (2SD), Split-middle with binomial test, Effect Size (modified Cohen’s d)
2. Phonetic Accuracy Arizona-3 Percent Phonemes Correct
Repeated measures ANOVA, Effect size (Cohen’s d)
3. Motor Speech Control
VMPAC Percent Scores -
4 Kinematic Measures
3D motion analysis
Distance Velocity Duration
Mann-Whitney U Friedman’s ANOVA Wilcoxon-signed rank test
5. Activity and Participation in daily routines
COPM Ten-point rating scale
Friedman’s ANOVA Wilcoxon-signed rank test
6. Speech Intelligibility
CSIM Percent Words Correct
Confidence Intervals, Effect Size (Cohen’s d)
Note. MSMPs = motor-speech-movement-parameters, PA = perceptual accuracy, CSIM = Children’s Speech Intelligibility Measure, Arizona = Arizona Articulation Proficiency Scale (3rd Edition), VMPAC = Verbal Motor Production Assessment for Children, COPM = Canadian Occupational Performance Measure.
Structure and Function
“Fixing itself may not be appropriate when pursued as an end in itself, but
can be judiciously employed as a means to helping children reach their functional
goals and live well” (Gibson et al., 2009, p. 1451).
Most measures aimed at examining speech production focus only on the use
of perceptual measures (that is, how an individual’s speech sounds to a familiar or
unfamiliar listener), at the “Body Function” domain of the ICF (McLeod & Bleile,
2004). These measures include improvement in production of speech probes specific
THE EFFECTIVENESS OF PROMPT
53
to the intervention focus, performance on formal test scores and improved accuracy
of articulation through such measures as percentage consonants correct and phonetic
transcription (Wambaugh, Duffy, McNeil, Robin, & Rogers, 2006).
However, given dysarthria affects multiple speech subsystems, the use of
perceptual measurements alone is not sufficient. This has been highlighted in studies
that have evaluated the reliability and accuracy amongst health professionals in
classifying the type of dysarthria (Cheng et al., 2007; R.D Kent, Weismer, Kent,
Vorperian, & Duffy, 1999; Murdoch, 2011).
Advances in technology now provide clinicians access to tools that were
previously inaccessible (e.g., three dimensional motion analysis). Murdoch (2011)
states “instrumental assessment can enhance the abilities of the clinician in all stages
of clinical management, including the documentation of treatment efficacy”. The
use of motion analysis to examine subclinical motor speech signs has been reported
in adult dysarthria, dysarthria associated with traumatic brain injury, childhood
apraxia of speech and stuttering (Cahill, Murdoch, & Theodorus, 2005; Peters,
Hulstijn, & Van Leishout, 2000; Roy, Leeper, Blomgren, & Cameron, 2001;
Theodorus, Murdoch, & Horton, 1999). No study of this nature has been undertaken
to evaluate changes in motor-speech-patterns in children with CP, subsequent to
intervention.
Kinematic analysis.
Motion analysis is a concept used to describe the compilation and analysis of
movement data of any kind in two dimensions (2D) or three dimensions (3D). The
data may be obtained from various sources including video cameras, VCR, magnetic
or mechanical devices, and is captured either ‘on-line’ or ‘off-line’. The use of video
systems based on video sequences utilise off line systems where the movement is
recorded and later evaluated with the aid of image processing (Castro, Medina-
Carnicer, & Galisteo, 2006).
The use of motion analysis in the health sciences is becoming increasingly
popular due to the availability of more readily accessible commercial software
packages (Green & Wang, 2003; Katz, Bharadwaj, & Stettler, 2006; Maner, Smith,
& Grayson, 2000; Ostry, Gribble, & Gracco, 1996; Shiller, Ostry, & Laboissiere,
2001).
THE EFFECTIVENESS OF PROMPT
54
Vicon Motus (previously Peak Motus Measurement System) is an example of
a 3D motion analysis system. Two or more cameras are used to capture movement
in a calibrated space, from which specific 3D points may be identified. The software
package allows measurement of distance, angle and rate of change of selected
reference points and segments. Motion analysis has been applied to the fields of
physiotherapy in gait analysis, orthopaedics, podiatry and sports rehabilitation.
More recently it has been applied to the study of speech movement (Green &
Wilson, 2006; Grigos & Patel, 2007; Kleinow & Smith, 2006; Lindstrom, 2002).
An independent assessment of Vicon Motus has indicated the system to be
accurate and reliable for the precise and objective spatial temporal assessment of
facial expression, with a test-retest reliability coefficient of .73 to .99 (Lindstrom,
2002).
Activity and Participation
“There has been a consensual acceptance amongst many childhood disability
researchers that maximizing children’s effective ‘participation’ is the overarching
goal in providing services....” (Morris, 2009, p. 92).
Two outcome measures were selected to evaluate changes in activity and
participation. The first measure focused specifically on changes to speech
intelligibility and the second measure focused on global changes to activity and
participation within each participant’s daily routine.
Speech Intelligibility.
A number of assessment options are available to determine changes in speech
intelligibility (Gordon-Brannan & Hodson, 2000; Hodge, 2010; Hustad, 2006; R.D
Kent et al., 1994; Yorkston & Beukelman, 1978). For the purposes of this thesis, a
formalised assessment, that utilises a closed set task format scored by an unfamiliar
listener, was selected.
The Children’s Speech Intelligibility Measure (Wilcox and Morris, 1999)
was selected as it has been shown to have an established validity and sensitivity in
detecting changes to speech intelligibility in children with CP (Pennington et al.,
2006). Further, recent evidence suggests the use of forced-choice format reduces
THE EFFECTIVENESS OF PROMPT
55
variability in listener judgments of speech intelligibility when assessing the speech
of speakers with moderate to severe speech impairment (McHenry, 2011).
Changes to Activity and Participation within the daily routine.
The Canadian Occupational Performance Measure (COPM) is an
individualised measure of changes in self-perception of occupational performance
and satisfaction over the course of a therapeutic intervention. It contains three
sections: 1. self-care (activities of daily living), 2. productivity (education and work)
and; 3. leisure (play, leisure and social participation) (McColl, Law, Baptiste &
Pollock, 2005). The three sections of the COPM reflect the nine domains of the ICF
Activity and Participation Domains (WHO, 2001). The COPM is designed for use
with clients of all ages and utilises a semi-structured interview format that takes
approximately 15-30 minutes to administer. Thus, both the parents and the clients
are involved in the process of setting the intervention goals and priorities.
Additionally, the COPM is not only a measure of performance but also satisfaction.
The COPM has been widely used in paediatric rehabilitation (De Rezze,
Wright, Curran, Campbell, & Macarthur, 2008). Further, Cusick, Lannin and Lowe
(2007) report modifying the COPM for use with children with speech impairment
associated with CP, without compromise to the robustness of the measure.
Research Study Overview
A single subject multiple-baseline-across-participants research design, as
illustrated in Figure 3.2, was used to evaluate the effectiveness of the PROMPT
intervention. The study consisted of four phases, consistent with an ABCA research
design, as described below:
Phase A1: The baseline data collection phase consists of a 5- to 8-week period
during which time participants receive their standard therapy services. All
participants will remain in baseline until stable baseline measurements are
determined through the application of statistical process control (Portney & Watkins,
2009).
Phase B: PROMPT intervention aimed at one level of the PROMPT motor
speech hierarchy (MSH).
Phase C. PROMPT intervention aimed at one level higher on the MSH.
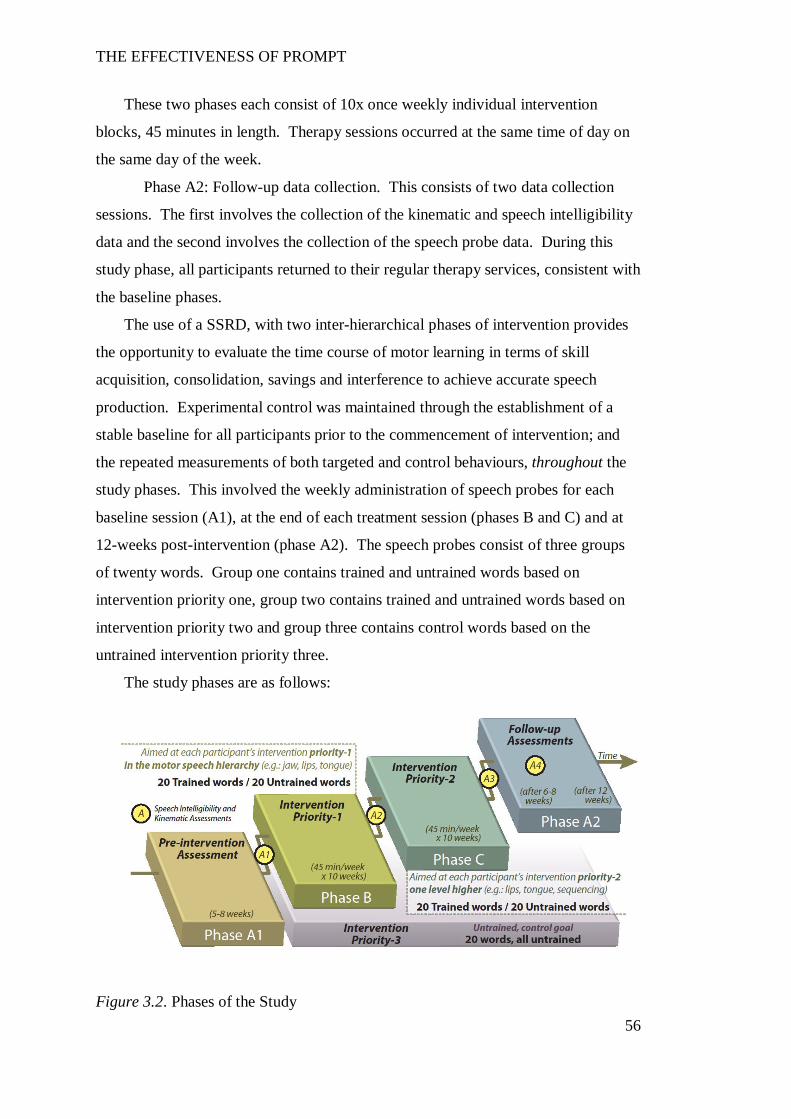
THE EFFECTIVENESS OF PROMPT
56
These two phases each consist of 10x once weekly individual intervention
blocks, 45 minutes in length. Therapy sessions occurred at the same time of day on
the same day of the week.
Phase A2: Follow-up data collection. This consists of two data collection
sessions. The first involves the collection of the kinematic and speech intelligibility
data and the second involves the collection of the speech probe data. During this
study phase, all participants returned to their regular therapy services, consistent with
the baseline phases.
The use of a SSRD, with two inter-hierarchical phases of intervention provides
the opportunity to evaluate the time course of motor learning in terms of skill
acquisition, consolidation, savings and interference to achieve accurate speech
production. Experimental control was maintained through the establishment of a
stable baseline for all participants prior to the commencement of intervention; and
the repeated measurements of both targeted and control behaviours, throughout the
study phases. This involved the weekly administration of speech probes for each
baseline session (A1), at the end of each treatment session (phases B and C) and at
12-weeks post-intervention (phase A2). The speech probes consist of three groups
of twenty words. Group one contains trained and untrained words based on
intervention priority one, group two contains trained and untrained words based on
intervention priority two and group three contains control words based on the
untrained intervention priority three.
The study phases are as follows:
Figure 3.2. Phases of the Study
THE EFFECTIVENESS OF PROMPT
57
Three main research questions were posed:
1. Is PROMPT effective in making changes to speech production accuracy in
children with CP with moderate-to-severe speech impairment? The following two
specific questions were posed:
1.1 Will speech production accuracy improve subsequent to intervention?
1.2 Will phonetic accuracy increase?
2. Will children with moderate-to-severe speech impairments associated with CP
show changes in distance, velocity and duration measures of the jaw and lips
subsequent to PROMPT intervention?
3. Will children with CP show changes in the Activity and Participation domains of
the ICF subsequent to intervention? The following two specific questions were
posed:
3.1 Will unfamiliar listeners identify improvements in speech intelligibility
subsequent to intervention?
3.2 Will children with CP be perceived as showing improved participation in
tasks and actions of daily life with family members and friends subsequent to the
PROMPT intervention?
Single Subject Research Design
“…I hope people will resist the siren call of the RCT simply because it is
there – and use the best designs for the ‘big’ questions we need to answer”(P.
Rosenbaum, 2010, p. 111).
The design chosen for this thesis was a single subject research design (SSRD)
with concurrent multiple-baseline-across-participants. The role and validity of the
SSRD in healthcare disciplines is indicated through the recent development of
criteria and 14-point scoring system upon which to evaluate the quality of SSRD
studies by the Treatment Outcomes Committee of the AACPDM (Logan, Hickman,
Harris, & Heriza, 2008).
Single subject experimental designs have long been recognized as useful for
examining effects of language and literacy interventions, (Neuman & McCormick,
1995) and, more broadly, have yielded useful insights in the disability, psychological
THE EFFECTIVENESS OF PROMPT
58
and special education fields, as illustrated by the Journal of Applied Behaviour
Analysis (JABA), which is devoted to single subject designs.
The use of SSRD in children with CP has several advantages over other study
designs. It avoids grouping together diverse children with diverse diagnoses and
speech impairments, allowing each participant’s responses to be considered
individually. It permits the investigation of outcome measures, in particular the
exploration and refinement of movement analysis to describe differences in
articulation. And the use of repeated assessments allows some investigation of the
effects of treatment parameters, particularly the length of intervention required to
produce effects.
Single subject research designs involve the systematic application of
interventions at pre-planned stages and the consistent, repeated measurement of
relevant outcomes that are expected to change with the intervention phases (Portney
& Watkins, 2009). Each individual constitutes a separate study, even though similar
interventions on several children may be running at the same time. These studies
differ from case studies, relying on quantitative (not qualitative) data and in being
experimental, not merely observational (Portney & Watkins, 2009).
The foundations of a SSRD include:
1. Repeated measurement of a dependent variable. This involves collecting
data prior to commencing intervention (baseline) at regular time intervals, and
continuing to collect the same data during the intervention phase. Figure 4.1
illustrates the occasions of assessment for each of the dependent variables evaluated
in this thesis.
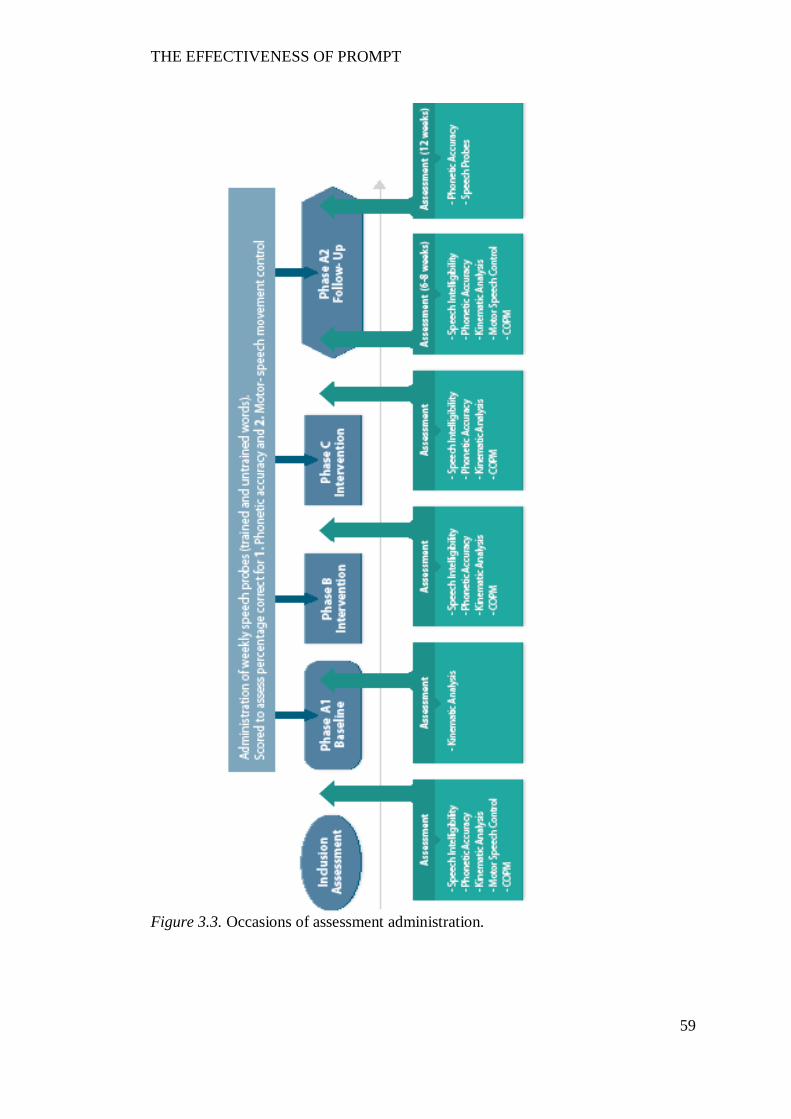
THE EFFECTIVENESS OF PROMPT
59
Figure 3.3. Occasions of assessment administration.
THE EFFECTIVENESS OF PROMPT
60
2. Establishment of a stable baseline; and
3. Graphing the data.
Visual inspection is the typical method used to interpret the significance of the data.
Visual inspection involves judgement of changes in level, slope and variability.
Advocates for visual inspection argue it is a reliable and conservative analysis tool.
Recently however, much debate has centred on the need to use statistical
procedures to support visual inspection. The criticism has been directed at the lack
of formal decision rules upon which to interpret the data and a lack of inter-rater
reliability (Fisher, 2003).
The use of statistical analyses has the positive advantage of: (a) reducing
uncertainty when evaluating treatment effects in the presence of unstable baselines,
(b) producing consistent results, and (c) being suitable to use with serially dependent
data (Fisher, Kelley, & Lomas, 2003; Hojem & Ottenbacher, 1988; Nourbakhsh &
Ottenbacher, 1994). Statistical procedures commonly cited in the literature include
the two-band standard deviation (2SD band) analysis and trend-lines such as the
split-middle (SM) method of trend estimation with binomial test (Portney &
Watkins, 2009).
Hypotheses
Speech production will improve across the phases of the study, as
demonstrated by:
1.1. Speech production accuracy.
Phase B:
i. Improvement in the motor-speech movement patterns will be observed on the
speech probes targeted in the first intervention priority. This may cause
destabilisation between the pre-existing coordination synergies and result in initially
reduced perceptual accuracy.
ii. Due to the biomechanical linkages between the jaw and lips, some
destabilisation of the speech probes at intervention priority two may be observed.
However, the change in performance will not be significant.
iii. No change to the motor-speech-movement patterns or perceptual accuracy will
be observed in the control goal.
Phase C
THE EFFECTIVENESS OF PROMPT
61
i. Improvement in performance level and stability, of both the motor-speech
movement patterns and perceptual accuracy will be observed on the speech probes
targeted during the first intervention priority.
ii. Improvement in the motor-speech movement patterns will be observed on the
speech probes targeted in the second intervention priority.
iii. No change to the motor-speech-movement patterns or perceptual accuracy will
be observed in the control goal.
Phase A2
i. Off-line learning will continue to occur during the non-intervention phase if a
stable shift in the targeted coordination dynamics has occurred.
ii. Improved speech intelligibility will be recorded across the study phases.
1.2. Phonetic accuracy.
Improvement in phonetic accuracy will be cumulative across the study
phases, as evidenced by progressively increasing percentage phonemes correct
scores.
2. Distance, duration and velocity measures.
Changes in the measures of distance, velocity and duration as targeted across
the study phases will be observed as follows:
i. Participants will record the greatest magnitude of change to the kinematic
measures that reflect the intervention priority being trained in the first intervention
phase. For example, most participants will commence intervention at the mandibular
level of control as measured on the PROMPT MSH. Thus, it is expected the
measures of jaw control (e.g., Jaw Lateral Distance from Midline, jaw path distance
travelled and jaw opening distance) will show the greatest magnitude of change, with
a trend direction towards typically developing peers.
ii. Due to the biomechanical linkages between the jaw and lips, changes to the
second intervention priority will also observed during the training of the first
intervention priority (phase B) but that during the training of the second intervention
priority (phase C), a greater treatment effect will be observed. That is, participants
that received intervention focused on labial-facial control will show changes to the
labial-facial measures (e.g., lip rounding) during the second intervention phase.
iii. The training of new motor-speech movement patterns will result in
destabilisation of an existing pattern of motor-speech movement patterns. As a
THE EFFECTIVENESS OF PROMPT
62
result, with the initiation of a new motor-speech movement pattern, an initial
“worsening” of the targeted behaviour may be apparent until speech subsystem re-
organisation is achieved. Continued skill acquisition during the follow-up non-
intervention period is expected with stabilisation of the newly acquired motor-
speech-movement patterns.
iv. A limited treatment effect is expected to occur on the movement patterns that
are not targeted during intervention (for example, the production of words that
require lingual control and which are not targeted in intervention, may show limited
improvement due to improved mandibular and labial-facial control).
3. Activity and participation.
3.1. Speech intelligibility.
Improvement in speech intelligibility will be cumulative across the study
phases, as evidenced by progressively increasing intelligibility scores recorded on
the standardised measure of speech intelligibility.
3.2 Changes to activity and participation within the daily routine.
Changes to activity and participation within the daily routine will occur if the
communication domains have sufficiently re-organised to achieve integration
between the physical-sensory, social-emotional and cognitive-linguistic domains.
Thus, it is not anticipated a change in activity and participation will be recorded
before phase C.
THE EFFECTIVENESS OF PROMPT
63
CHAPTER 4 QUESTION ONE.
IS PROMPT EFFECTIVE IN MAKING CHANGES TO SPEECH
PRODUCTION ACCURACY IN CHILDREN WITH CP WITH MODERATE-
TO-SEVERE SPEECH IMPAIRMENT?
Introduction
Speech production is a goal oriented process that results from movement of
the jaw, lips, tongue, velum, vocal folds, and respiratory system. The transition from
early vocalisations to intelligible speech requires mastery and coordination, achieved
through precise timing and accurate positioning of multiple sub speech systems
(Ballard, Granier, & Robin, 2000; Barlow, 1999; Caruso & Strand, 1999; Green et
al., 2000; Tasko & McClean, 2004). In addition, the motor speech processes are
influenced by not only the differential development of cognitive and linguistic skills
but also sensory motor, tactile, auditory/visual stimulation and perceptual saliency
(Barlow, 1999; Connor & Abbs, 1998; Green et al., 2000; A. Smith, 1992; Trulsson
& Johansson, 2002).
The literature is increasingly reporting data that highlight the significant role
somatosensory input plays in motor speech control and learning (Estep, 2009; Estep
& Barlow, 2007; Ito & Ostry, 2010; Sessle et al., 2005). In particular, researchers
have shown that the speech production system is responsive to the provision of
enhanced kinaesthetic information to cutaneous afferents (Estep, 2009; Gick et al.,
2010; Wilston et al., 2010). For example, researchers have demonstrated that the
modifications to the speech system through the application of external perturbation,
such as through the stretching of the facial skin at the lateral angle of the mouth,
changes speech production (Estep & Barlow, 2009). Further, studies have also
shown that articulator coupling patterns will reorganise or compensate as a response
to modifications/disruptions in articulator movements. These findings are further
enriched by behavioural studies that indicate sensory augmentation can play a role in
enhancing motor learning in general, particularly when stimuli are difficult to
perceive (Atchy-Dalama et al., 2005; Stein, Wallace, & Stanford, 1999).
Motor speech impairments associated with CP may impact an individual’s
ability to produce speech efficiently and accurately, due to impairments in timing
and coordination across the speech subsystems (Hustad et al., 2010; E. L. Lin et al.,
THE EFFECTIVENESS OF PROMPT
64
2007; Soloman & Charron, 1998; Workinger, 2005). Impairments to the motor
speech movement patterns of children with CP reported in the literature include
excessive mandibular displacement, with lip and tongue blade movements highly
dependent on the mandible in children with athetoid CP (Kent & Netsell, 1978).
Ortega et al. (2008) reported significantly decreased mouth opening and increased
lateral deviation in children with spastic CP. Further, the kinematic study by Hong
et al. (2007) reported a significant difference in the temporal coupling between the
lower lip and jaw movements in children with CP, as compared to the age matched
peers. It has been hypothesised that a poor relationship between the motor command
and perceptual consequences of the speech movement may be one of the possible
explanations for this impaired motor control (Kent & Netsell, 1978; Neilson &
O’Dwyer, 1981).
Recent brain imaging studies show that children with CP indeed present with
injury to the sensory system that includes a reduction in fibres connecting to the
sensory cortex (Hoon et al., 2009). These findings support the hypothesis that
impaired motor speech control in children with CP could be associated with the
selection of inefficient or ineffective movement strategies due insufficient
information regarding control, adjustment and stabilisation through peripheral
(sensory) input.
Research findings indicate the enhancement of somatosensory input during
speech can not only affect change in the coordination of movement synergies but
also influence learning that can be maintained across time. These findings suggest
potential therapeutic value in enhancing tactile-kinaesthetic input to children with CP
(Mefferd & Green, 2010).
Although the use of tactile-kinaesthetic input to facilitate speech production
in children with motor speech impairment has an established history in the literature
(Crickmay, 1966; Dworkin, 1991; Pannbacker, 1988; Square, 1999; Stinchfield &
Young, 1938) the scientific evidence base supporting the role of somatosensory
enhancement in clinical practice for the management of motor speech impairment in
children is limited.
Evidence based practice is an approach for clinical practice that requires the
“…conscientious, explicit, and judicious use of current best evidence in making
decisions about the care of individual patients. The practice of evidence-based-
THE EFFECTIVENESS OF PROMPT
65
medicine means integrating individual clinical expertise with the best available
external evidence from systematic research” (Sackett et al., 1996, p. 71).
The current research climate advocates that research focused on the
evaluation of treatment outcomes be conducted in phases. Specifically, it is
recommended that novel treatment approaches first be evaluated using a single
subject research design with a small number of participants in order to evaluate the
treatment effect (Beeson & Robey, 2006; Robey & Schultz, 1998).
Three intervention approaches, reported recently in the peer-reviewed
literature to employ tactile kinaesthetic input, have utilised early phase single subject
research designs to evaluate treatment effectiveness: the Touch-Cue-Method (Bashir,
Grahamjones, & Bostwick, 1984; Gordon-Brannan & Weiss, 2007), Dynamic
Temporal and Tactile Cueing (Strand et al, 2006), and PROMPT (Chumpelik, 1984).
The Touch-Cue-Method method utilises a hierarchical sequence of 8 touch
cues (b, d, g, s, f, n, ʃ, l) that are provided to the face and neck, simultaneously with
auditory and visual cues. The approach is comprised of three stages that include
producing sounds in isolation and progress to multiword sequences. Martikainen
and Korpilahti (2011) evaluated the effectiveness of the Touch-Cue-Method and a
non-tactile method (Melodic Intonation Therapy) in a 4 year-old girl with childhood
apraxia of speech. The study design consisted of an A1BA2CA3 design with the
Touch-Cue-Method administered subsequent to the non-tactile method. Outcome
measures included percentage vowels and consonants correct using narrow phonetic
transcription; and phonological mean length of utterance.
Visual inspection of one of the dependent variables (percentage of vowels
correct) showed an accelerating trend in the baseline phase that continued throughout
the study phases. Further, the percentage-consonants-correct data showed an
increasing trend direction at the commencement of phase A2 (rest phase after
administration of the non-tactile approach) that continued until the end of the study
phases. The continued improvement in the non-intervention phase, before
commencement of the Touch-Cue-Method limits the interpretation of the
effectiveness of the touch-cue-method as it is not possible to reliably assign the
improvement to the intervention approach specifically.
Dynamic Temporal and Tactile Cueing is a treatment approach, developed by
Strand (Strand et al., 2006), that is based on integral stimulation (Gordon-Brannan &
THE EFFECTIVENESS OF PROMPT
66
Weiss, 2007; Strand & Skinder, 1999). The method utilises a hierarchically
organised sequence of stimuli, with an emphasis on “the shaping of movement
gestures for speech production” (2006, p. 298). Strand et al. (2006) report a clinician
utilises the tactile input to facilitate accurate jaw and lip positions for the speech
target. In the early treatment stages, where maximal support is required the child is
assisted to maintain the movement position in order to “maximise the proprioceptive
processing” (p. 298). Gestural cues are faded as the child’s accuracy and
independence increase.
Dynamic Temporal and Tactile Cueing has been evaluated most recently in
two studies (Baas, Strand, Elmer, & Barbaresi, 2008; Strand et al., 2006) that utilised
multiple-baseline-across-behaviours designs. In both of these studies, the authors
report positive treatment outcomes that they attribute to multiple aspects of the
intervention approach, including treatment frequency, stimulus targets and principles
of motor learning embedded in the therapy routine.
Rogers et al. (2006) evaluated the use of PROMPT in facilitating the
development of functional speech in five children with autism, using a single subject
ABA research design. The authors of this study show that of the 5 children who
participated in the PROMPT intervention, 4 children recorded positive increases in
functional speech as recorded by an increase in the number of functional words and
phrases spoken across the study phases.
Whilst the authors of all of the above studies report tactile input is used to
shape the correct articulation posture, the frequency and administration of the tactile-
kinaesthetic input is not specified. Further, the outcome measures are not designed
to record how these cues facilitated changes to correct the articulation postures under
investigation. The absence of outcome measures focused on evaluating the tactile-
kinaesthetic input in the above studies, therefore limits the ability to assess the
specific benefits of enhanced sensory-motor input.
Despite this, the positive speech outcomes for the speech and communication
skills of the participants in these studies suggest further investigation of intervention
approaches focused on providing enhanced tactile-kinaesthetic input for the purposes
of improving speech intelligibility during speech merits attention. In addition, the
use of outcome measures that documents changes to the speech movement patterns
across the study phases is also required.
THE EFFECTIVENESS OF PROMPT
67
The literature suggests the type, placement and context in which the
stimulation is provided is essential in facilitating sensory-motor reorganisation
(Estep, 2009; Gick et al., 2010; Wilston et al., 2010). The PROMPT intervention
approach has been developed specifically to facilitate articulatory control for
improved speech production; and has been identified as treatment approach that has
direct relevance for children with motor speech disorders (Murdoch & Horton, 1998,
page 401). The approach utilises specific types of prompts to target 1. joint receptors
and muscle spindles for postural stabilisation and 2. cutaneous afferents to stimulate
specific motor speech postures. A PROMPT trained clinician uses specific tactile-
kinaesthetic input during active speech directed to specific orofacial regions that are
richly innervated with slowly adapting, cutaneous mechanoreceptors that are
responsive to external low level inputs during motor activity (Andreatta & Barlow,
2009; Feng, Gracco, & Max, 2011; Trulsson & Johansson, 2002).
The purpose of this chapter is to make a contribution to the evidence base by
investigating perceptual changes to speech production in six children with CP
subsequent to PROMPT intervention.
The research question addressed in this chapter is as follows:
Is PROMPT effective in making changes to speech production accuracy in children
with CP with moderate-to-severe speech impairment? The following two specific
questions were posed:
1.1 Will speech production accuracy improve subsequent to intervention?
1.2 Will phonetic accuracy increase?
Method
Participants
Inclusion criteria.
The inclusion criteria for this study were:
1. Diagnosis of cerebral palsy.
2. Age range 3 – 14 years.
3. Stable head control – independent or supported.
THE EFFECTIVENESS OF PROMPT
68
4. Developmental quotient greater than 70 as measured on the Leiter-Brief
International Performance Scale R Brief (Leiter-R) (Roid & Miller, 1997) a
nonverbal cognitive assessment.
5. Spontaneous use of at least 15 words verbally.
6. Standard score at or below 1.5 standard deviations on the Arizona
Proficiency Scale – 3rd Revision (Arizona-3) (Fudala 2001).
Exclusion criteria for this study were:
1. Past treatment using the PROMPT approach,
2. Receptive language impairment greater than two standard deviations
below the mean on the CELF-P (Wiig, Secord, & Semel, 1992) or CELF 4 (Semel,
Wiig, & Secord, 1995), and
3. A hearing loss greater than 25dB as measured through pure tone
audiometric screening.
Recruitment.
Participants were recruited through The Centre for Cerebral Palsy (TCCP).
TCCP is a not-for-profit organisation that provides supports and services to people
with cerebral palsy and their families, living in Western Australia. Services include
access to physiotherapy, speech pathology, occupational therapy, respite, health
promotion, employment, as well as access to specialized technology/equipment.
All speech pathologists at TCCP (eight in total), working with children
between 3 and 14 years, attended an information session outlining the purpose of the
study and the inclusion criteria for participants. After this session, the speech
pathologists were given parent information sheets to pass on to the families of any
children whom they considered would be likely to meet the inclusion criteria.
Ten families were identified as potential candidates and invited to participate.
Eight of these families expressed an interest. One participant was excluded because
the child had previously received treatment using the PROMPT approach. The
remaining 7 children were tested to determine eligibility to participate in the study
on the basis of the selection criteria. Six children met the criteria. The family of the
7th child were informed that their child did not meet selection criteria. They were
offered therapy consistent with the study protocol but were excluded from the
analysis phase of the data collected in this study.
THE EFFECTIVENESS OF PROMPT
69
Ethics approval was initially obtained from LaTrobe University Human
Research Ethics Committee (application 06-137) and The Ethics Committee of
Princess Margaret Hospital (1298/EP). Subsequent to the transfer of candidacy to
Curtin University, ethics approval was further obtained from the Curtin University
Human Research Ethics Committee (HR102/2007).
All procedures and protocols were observed with no complaints or
withdrawals. All participants completed all phases of the study. Participant five
(P5) missed one therapy session in block two and one appointment in the follow-up
phase due to the family temporarily leaving the country.
Participant description.
Table 4.1 summarizes the characteristics of the six participants (3 girls and 3
boys) that met selection criteria. Ages ranged from 3 years to 11 years, 9 months at
study commencement. All participants had cerebral palsy and were native speakers
of English. All participants were assigned a participant number and pseudonym.
Throughout the thesis, the participants will be referred to by their assigned
participant number.
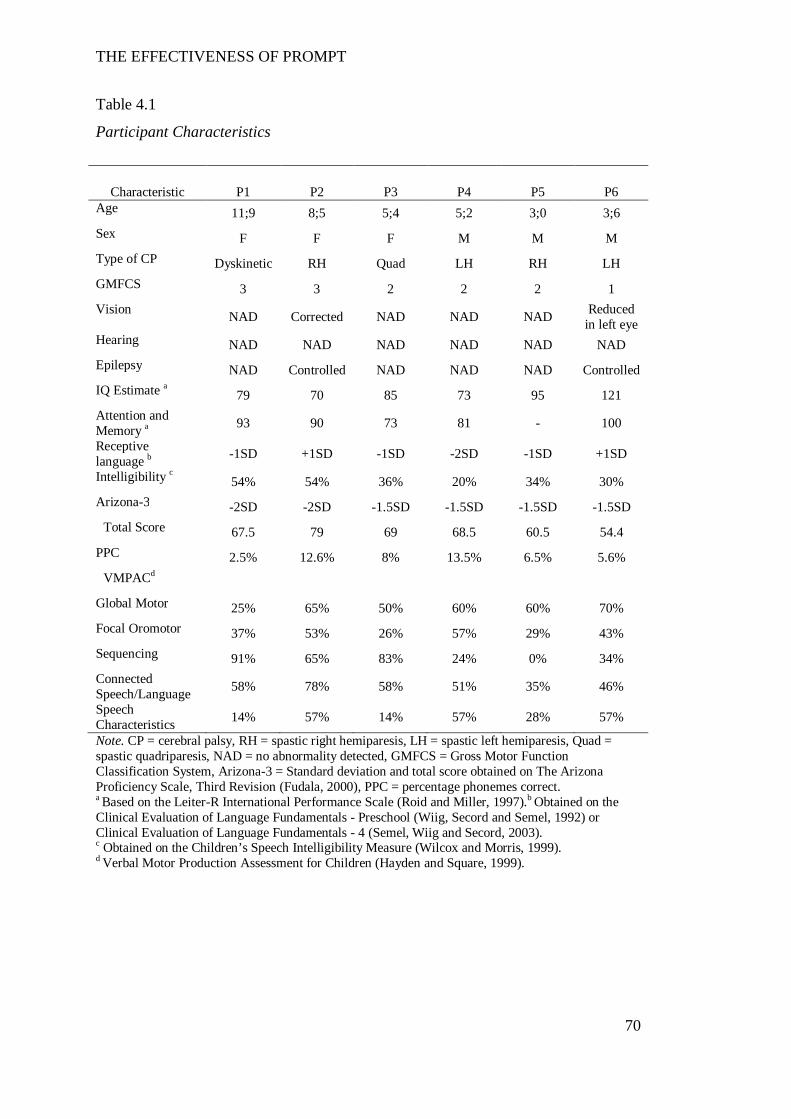
THE EFFECTIVENESS OF PROMPT
70
Table 4.1
Participant Characteristics
Characteristic P1 P2 P3 P4 P5 P6 Age 11;9 8;5 5;4 5;2 3;0 3;6 Sex F F F M M M Type of CP Dyskinetic RH Quad LH RH LH GMFCS 3 3 2 2 2 1 Vision NAD Corrected NAD NAD NAD Reduced
in left eye Hearing NAD NAD NAD NAD NAD NAD Epilepsy NAD Controlled NAD NAD NAD Controlled IQ Estimate a 79 70 85 73 95 121 Attention and Memory a 93 90 73 81 - 100
Receptive language b -1SD +1SD -1SD -2SD -1SD +1SD
Intelligibility c 54% 54% 36% 20% 34% 30% Arizona-3 -2SD -2SD -1.5SD -1.5SD -1.5SD -1.5SD
Total Score 67.5 79 69 68.5 60.5 54.4 PPC 2.5% 12.6% 8% 13.5% 6.5% 5.6%
VMPACd Global Motor 25% 65% 50% 60% 60% 70% Focal Oromotor 37% 53% 26% 57% 29% 43% Sequencing 91% 65% 83% 24% 0% 34% Connected Speech/Language 58% 78% 58% 51% 35% 46%
Speech Characteristics 14% 57% 14% 57% 28% 57%
Note. CP = cerebral palsy, RH = spastic right hemiparesis, LH = spastic left hemiparesis, Quad = spastic quadriparesis, NAD = no abnormality detected, GMFCS = Gross Motor Function Classification System, Arizona-3 = Standard deviation and total score obtained on The Arizona Proficiency Scale, Third Revision (Fudala, 2000), PPC = percentage phonemes correct. a Based on the Leiter-R International Performance Scale (Roid and Miller, 1997).b Obtained on the Clinical Evaluation of Language Fundamentals - Preschool (Wiig, Secord and Semel, 1992) or Clinical Evaluation of Language Fundamentals - 4 (Semel, Wiig and Secord, 2003). c Obtained on the Children’s Speech Intelligibility Measure (Wilcox and Morris, 1999). d Verbal Motor Production Assessment for Children (Hayden and Square, 1999).
THE EFFECTIVENESS OF PROMPT
71
Measures
Selection criteria.
The following standardised measures were used for the assessment of
cognition, speech and language:
1. The Leiter International Performance Scale-Revised (Leiter-R) (Roid &
Miller, 1997).
The Leiter-R is a standardised test designed to assess nonverbal cognitive
functioning in children and adolescents, aged between 2 and 20 years. The test
contains two groupings of subtests: ten subtests of nonverbal ability associated with
visualisation, reasoning and spatial ability (VR), and two subtests of attention and
memory (AM). An estimate of global intellectual ability can be obtained through
administration of the full Leiter-R or the Brief IQ Screener.
The Brief IQ Screener consists of 4 subtests that assess figure ground, form
completion, repeating patterns and sequential order. Three types of responses are
elicited from the child by the examiner and include placing response cards into slots
on an easel frame, arranging shapes and pointing. The examiner gives all
instructions non-verbally. Administration time is approximately 25 minutes.
Raw scores are converted to normalised scaled scores. The Brief IQ score is
calculated from the sum of the subtests normalised scaled scores and converted to a
normalised standard score.
The authors report reliability coefficients of .88, .90 and .89 across three
main age ranges (2-5, 6-10, 11-20 years). In addition, Tsatsanis et al. (2003)
reported a correlation of 97% between the Leiter R Brief and the Leiter-R Full Scale.
The Leiter-R was developed for administration with children with severe
speech impairment and has been established in the literature as one of the most
widely used cognitive tests in children with CP (Brossard-Racine et al., 2012;
Majnemer et al., 2008).
2. The Receptive Language Subtests of the Clinical Evaluation of Language
Fundamentals Preschool (CELF-P), (Wiig et al., 1992) or the Clinical Evaluation of
Language Fundamentals 4 (CELF-4), (Semel et al., 1995).
Both these tests are norm-referenced and measure language ability.
THE EFFECTIVENESS OF PROMPT
72
The CELF-P is designed to assess the expressive and receptive language
skills of children aged between 3 and 6 years. It contains six subtests: three subtests
(linguistic concepts, basic concepts and sentence completion) provide a receptive
language score and three subtests (recalling sentences in context, formulating labels
and word structure) provide an expressive language score.
The CELF- 4 contains 19 subtests designed to measure four aspects of
language (phonology/syntax, semantics, pragmatics and phonological awareness) in
children aged between 5 and 21 years of age. A receptive language index is derived
from three subtests for 8 year-olds and two sub-tests for 9-12 year-olds.
Only the receptive language subtests were administered. Participants are
required to respond to questions by pointing to pictures. One subtest of the CELF-4
(score form 5-8 year olds) requires single word responses. Testing can be stopped
between the subtests to give the participant a break if required.
Both tests convert raw scores to yield standardised scores with percentile
ranks, confidence intervals, standard deviations and age equivalents.
The authors report test-retest reliability coefficients for the composite scores
to be between .81- .96, and .87 - .95 on the CELF-P and CELF-4, respectively.
3. The Arizona Proficiency Scale, Third Revision (Arizona-3) (Fudala,
2001).
The Arizona-3 is a standardised test of articulation for children aged 18
months to 18 years. The test gathers data on an individual’s articulation proficiency,
articulation competence and global speech intelligibility based on a total of 67
consonants, vowels and diphthongs, in single words.
Children are asked to look at and label simple picture cards. Test
administration time is approximately 15 minutes. A total score is calculated and
converted to yield a standardised score, severity rating and intelligibility rating.
Fudala (2000) reports a strong test-retest reliability of .97. High correlations
with other articulation tests were also reported including the Goldman-Fristoe Test
of Articulation (.89) and the Photo Articulation Test (.84).
4. A questionnaire was designed and administered to parents to determine
the child’s history of speech therapy (Appendix A).
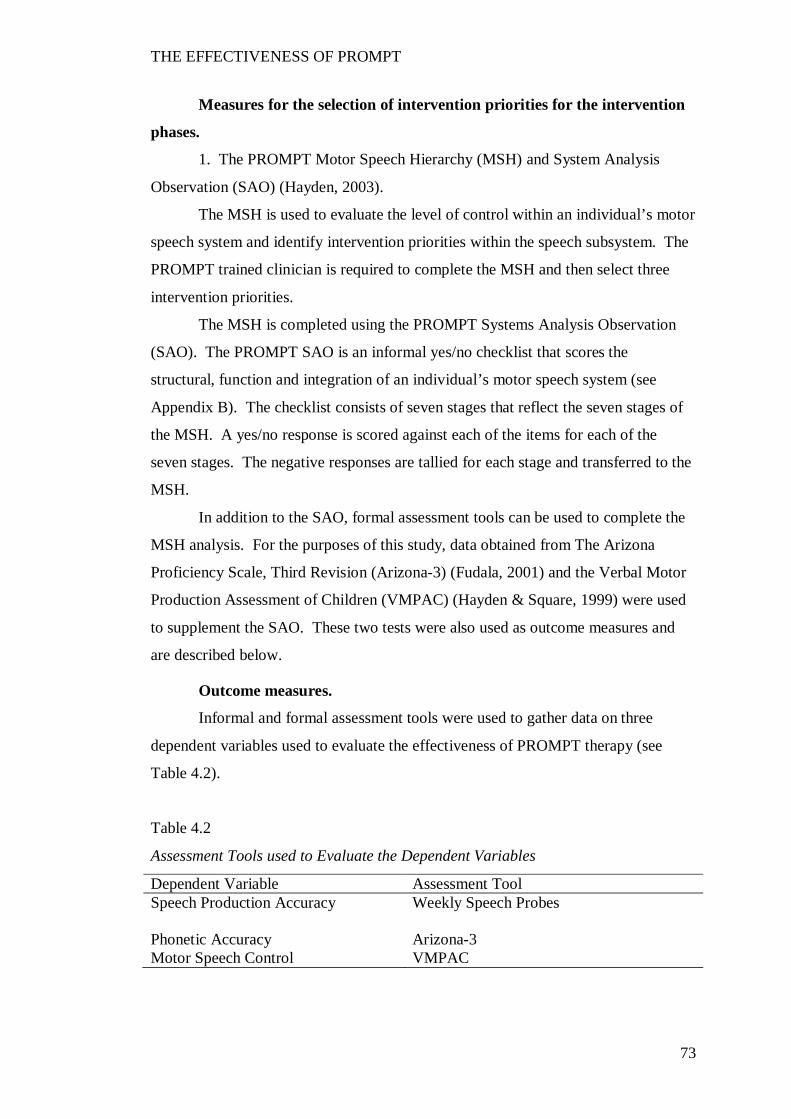
THE EFFECTIVENESS OF PROMPT
73
Measures for the selection of intervention priorities for the intervention
phases.
1. The PROMPT Motor Speech Hierarchy (MSH) and System Analysis
Observation (SAO) (Hayden, 2003).
The MSH is used to evaluate the level of control within an individual’s motor
speech system and identify intervention priorities within the speech subsystem. The
PROMPT trained clinician is required to complete the MSH and then select three
intervention priorities.
The MSH is completed using the PROMPT Systems Analysis Observation
(SAO). The PROMPT SAO is an informal yes/no checklist that scores the
structural, function and integration of an individual’s motor speech system (see
Appendix B). The checklist consists of seven stages that reflect the seven stages of
the MSH. A yes/no response is scored against each of the items for each of the
seven stages. The negative responses are tallied for each stage and transferred to the
MSH.
In addition to the SAO, formal assessment tools can be used to complete the
MSH analysis. For the purposes of this study, data obtained from The Arizona
Proficiency Scale, Third Revision (Arizona-3) (Fudala, 2001) and the Verbal Motor
Production Assessment of Children (VMPAC) (Hayden & Square, 1999) were used
to supplement the SAO. These two tests were also used as outcome measures and
are described below.
Outcome measures.
Informal and formal assessment tools were used to gather data on three
dependent variables used to evaluate the effectiveness of PROMPT therapy (see
Table 4.2).
Table 4.2
Assessment Tools used to Evaluate the Dependent Variables
Dependent Variable Assessment Tool Speech Production Accuracy Weekly Speech Probes
Phonetic Accuracy Arizona-3 Motor Speech Control VMPAC
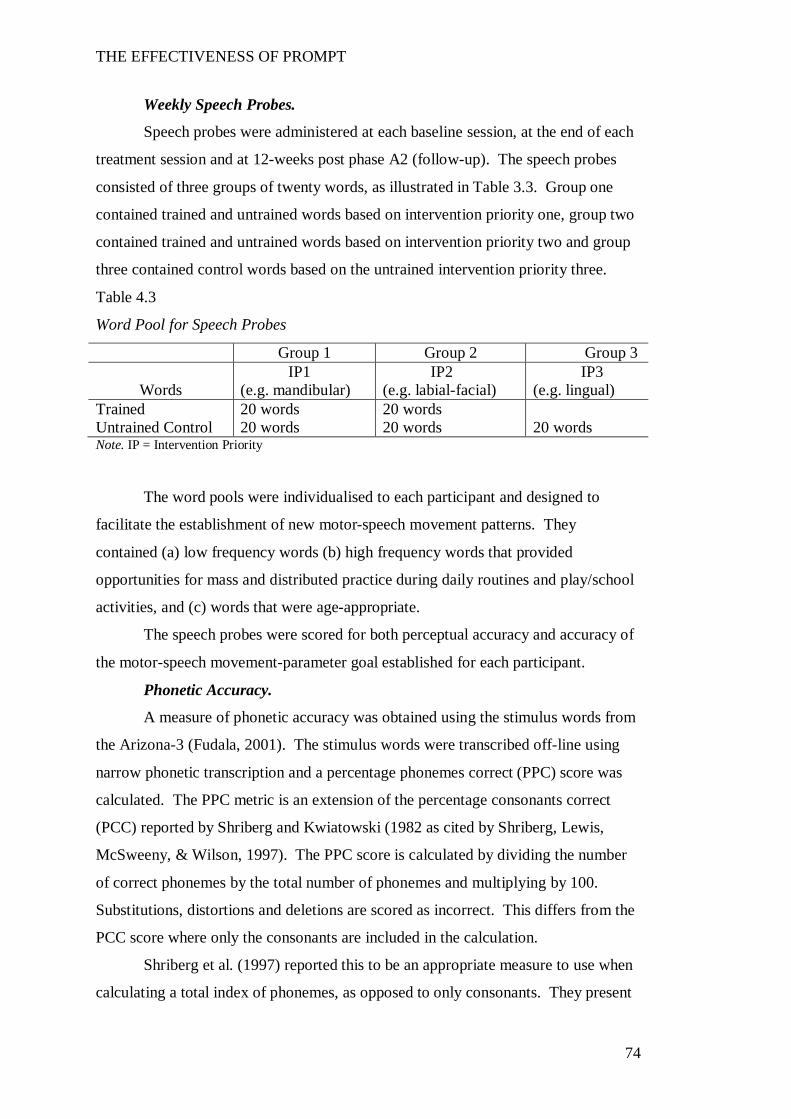
THE EFFECTIVENESS OF PROMPT
74
Weekly Speech Probes.
Speech probes were administered at each baseline session, at the end of each
treatment session and at 12-weeks post phase A2 (follow-up). The speech probes
consisted of three groups of twenty words, as illustrated in Table 3.3. Group one
contained trained and untrained words based on intervention priority one, group two
contained trained and untrained words based on intervention priority two and group
three contained control words based on the untrained intervention priority three.
Table 4.3
Word Pool for Speech Probes
Group 1 Group 2 Group 3
Words IP1
(e.g. mandibular) IP2
(e.g. labial-facial) IP3
(e.g. lingual) Trained 20 words 20 words Untrained Control 20 words 20 words 20 words Note. IP = Intervention Priority
The word pools were individualised to each participant and designed to
facilitate the establishment of new motor-speech movement patterns. They
contained (a) low frequency words (b) high frequency words that provided
opportunities for mass and distributed practice during daily routines and play/school
activities, and (c) words that were age-appropriate.
The speech probes were scored for both perceptual accuracy and accuracy of
the motor-speech movement-parameter goal established for each participant.
Phonetic Accuracy.
A measure of phonetic accuracy was obtained using the stimulus words from
the Arizona-3 (Fudala, 2001). The stimulus words were transcribed off-line using
narrow phonetic transcription and a percentage phonemes correct (PPC) score was
calculated. The PPC metric is an extension of the percentage consonants correct
(PCC) reported by Shriberg and Kwiatowski (1982 as cited by Shriberg, Lewis,
McSweeny, & Wilson, 1997). The PPC score is calculated by dividing the number
of correct phonemes by the total number of phonemes and multiplying by 100.
Substitutions, distortions and deletions are scored as incorrect. This differs from the
PCC score where only the consonants are included in the calculation.
Shriberg et al. (1997) reported this to be an appropriate measure to use when
calculating a total index of phonemes, as opposed to only consonants. They present
THE EFFECTIVENESS OF PROMPT
75
reliability information based on a speech sample of 33 children and adults. The
pooled data indicated a relatively small error of measurement (0.9) and a correlation
coefficient of .96.
Motor Speech Control.
The Verbal Motor Production Assessment for Children (VMPAC) (Hayden
and Square, 1999).is a standardised test designed to assess global motor control
(muscle symmetry, range and tone of movement in the face), focal oromotor control,
sequencing control, connected speech and language control and speech
characteristics in children aged three to 12 years. Test administration time is
approximately 30 minutes.
Raw scores are converted to mean percent correct scores for each area. The
data are then transferred to a standardised age-based profile graph for comparison to
the corresponding age group (3, 4, 5, 6 and 7-12 years).
Hayden and Square (1999) reported test-retest reliability coefficients ranging
between .56 and .90 across the five subtest areas. The areas of focal oromotor
control and sequencing scored the highest correlations of .90 and .88, respectively.
The lowest correlations were recorded on the two subtests with the smallest number
of test items – global motor control and speech characteristics.
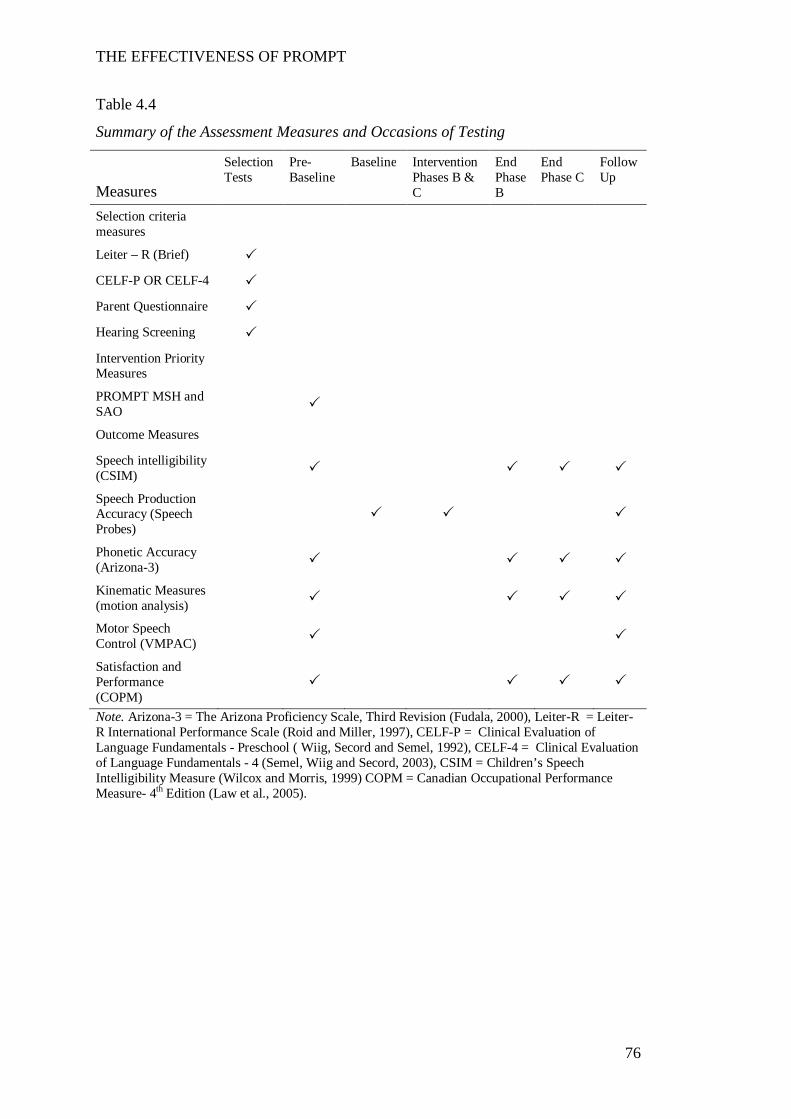
THE EFFECTIVENESS OF PROMPT
76
Table 4.4
Summary of the Assessment Measures and Occasions of Testing
Measures
Selection Tests
Pre-Baseline
Baseline
Intervention Phases B & C
End Phase B
End Phase C
Follow Up
Selection criteria measures
Leiter – R (Brief) CELF-P OR CELF-4 Parent Questionnaire Hearing Screening Intervention Priority Measures
PROMPT MSH and SAO
Outcome Measures Speech intelligibility (CSIM)
Speech Production Accuracy (Speech Probes)
Phonetic Accuracy (Arizona-3)
Kinematic Measures (motion analysis)
Motor Speech Control (VMPAC)
Satisfaction and Performance (COPM)
Note. Arizona-3 = The Arizona Proficiency Scale, Third Revision (Fudala, 2000), Leiter-R = Leiter-R International Performance Scale (Roid and Miller, 1997), CELF-P = Clinical Evaluation of Language Fundamentals - Preschool ( Wiig, Secord and Semel, 1992), CELF-4 = Clinical Evaluation of Language Fundamentals - 4 (Semel, Wiig and Secord, 2003), CSIM = Children’s Speech Intelligibility Measure (Wilcox and Morris, 1999) COPM = Canadian Occupational Performance Measure- 4th Edition (Law et al., 2005).
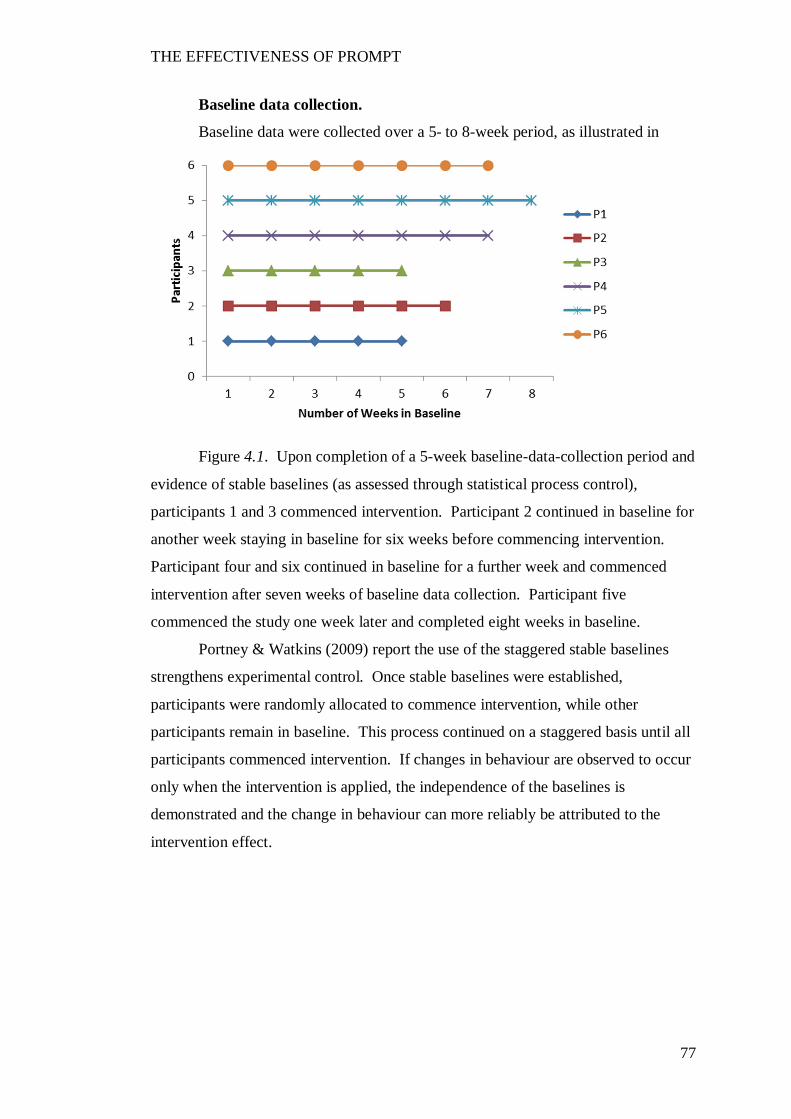
THE EFFECTIVENESS OF PROMPT
77
Baseline data collection.
Baseline data were collected over a 5- to 8-week period, as illustrated in
Figure 4.1. Upon completion of a 5-week baseline-data-collection period and
evidence of stable baselines (as assessed through statistical process control),
participants 1 and 3 commenced intervention. Participant 2 continued in baseline for
another week staying in baseline for six weeks before commencing intervention.
Participant four and six continued in baseline for a further week and commenced
intervention after seven weeks of baseline data collection. Participant five
commenced the study one week later and completed eight weeks in baseline.
Portney & Watkins (2009) report the use of the staggered stable baselines
strengthens experimental control. Once stable baselines were established,
participants were randomly allocated to commence intervention, while other
participants remain in baseline. This process continued on a staggered basis until all
participants commenced intervention. If changes in behaviour are observed to occur
only when the intervention is applied, the independence of the baselines is
demonstrated and the change in behaviour can more reliably be attributed to the
intervention effect.
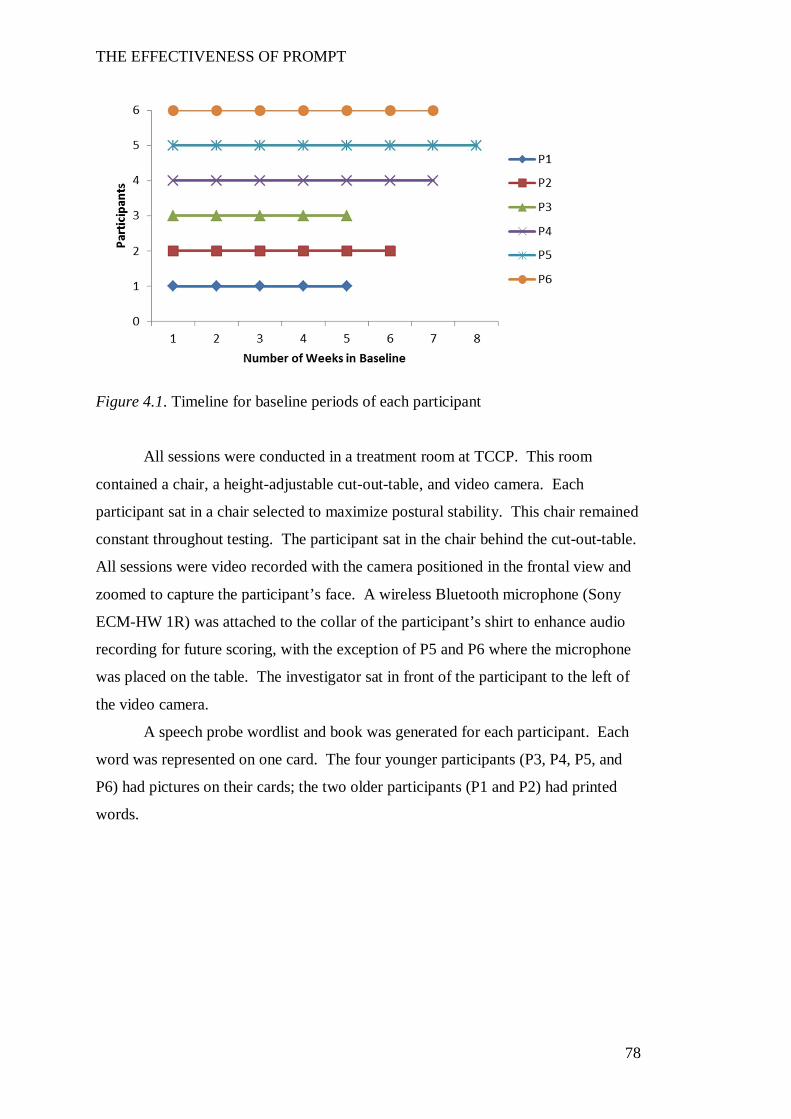
THE EFFECTIVENESS OF PROMPT
78
Figure 4.1. Timeline for baseline periods of each participant
All sessions were conducted in a treatment room at TCCP. This room
contained a chair, a height-adjustable cut-out-table, and video camera. Each
participant sat in a chair selected to maximize postural stability. This chair remained
constant throughout testing. The participant sat in the chair behind the cut-out-table.
All sessions were video recorded with the camera positioned in the frontal view and
zoomed to capture the participant’s face. A wireless Bluetooth microphone (Sony
ECM-HW 1R) was attached to the collar of the participant’s shirt to enhance audio
recording for future scoring, with the exception of P5 and P6 where the microphone
was placed on the table. The investigator sat in front of the participant to the left of
the video camera.
A speech probe wordlist and book was generated for each participant. Each
word was represented on one card. The four younger participants (P3, P4, P5, and
P6) had pictures on their cards; the two older participants (P1 and P2) had printed
words.
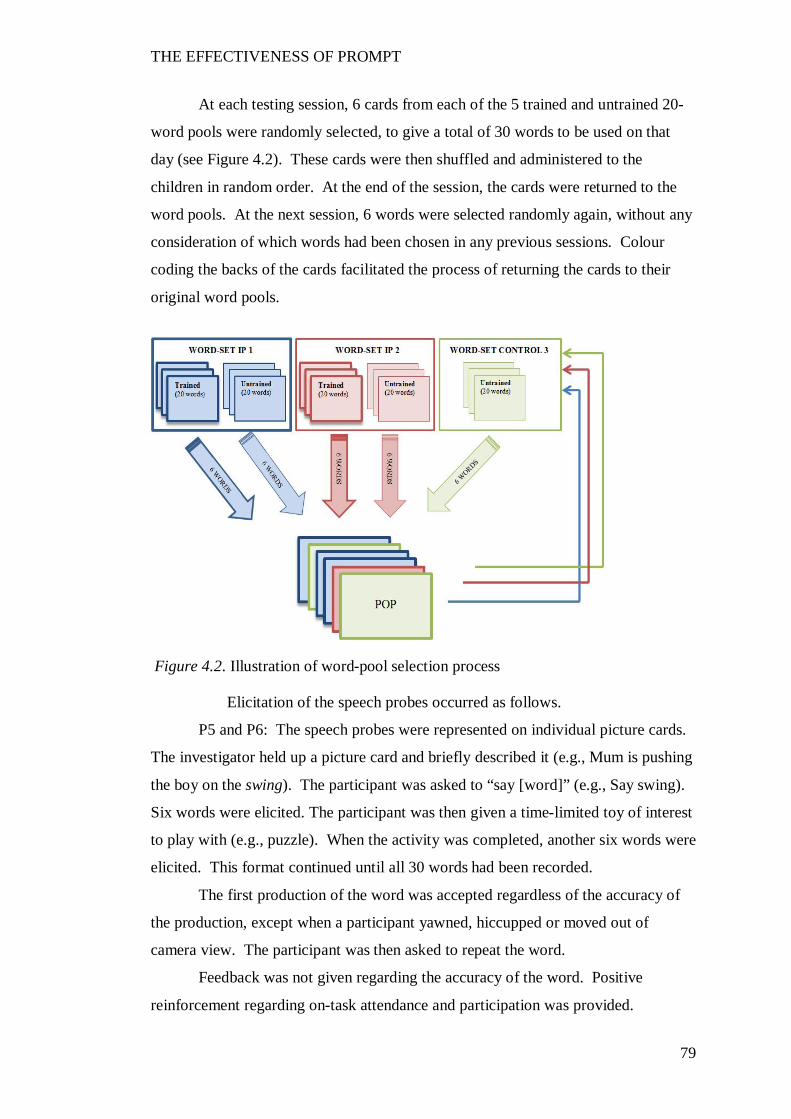
THE EFFECTIVENESS OF PROMPT
79
At each testing session, 6 cards from each of the 5 trained and untrained 20-
word pools were randomly selected, to give a total of 30 words to be used on that
day (see Figure 4.2). These cards were then shuffled and administered to the
children in random order. At the end of the session, the cards were returned to the
word pools. At the next session, 6 words were selected randomly again, without any
consideration of which words had been chosen in any previous sessions. Colour
coding the backs of the cards facilitated the process of returning the cards to their
original word pools.
Elicitation of the speech probes occurred as follows.
P5 and P6: The speech probes were represented on individual picture cards.
The investigator held up a picture card and briefly described it (e.g., Mum is pushing
the boy on the swing). The participant was asked to “say [word]” (e.g., Say swing).
Six words were elicited. The participant was then given a time-limited toy of interest
to play with (e.g., puzzle). When the activity was completed, another six words were
elicited. This format continued until all 30 words had been recorded.
The first production of the word was accepted regardless of the accuracy of
the production, except when a participant yawned, hiccupped or moved out of
camera view. The participant was then asked to repeat the word.
Feedback was not given regarding the accuracy of the word. Positive
reinforcement regarding on-task attendance and participation was provided.
Figure 4.2. Illustration of word-pool selection process
THE EFFECTIVENESS OF PROMPT
80
P3 and P4: The speech probes were represented on individual picture cards.
The chief investigator held up the card and gave a brief description. The participant
was then asked to “say [word]”, e.g., “The boy is drinking from a cup. Say cup”.
Upon elicitation of all 30 words, the participant chose a game/toy to play
with the chief investigator, as reward.
P1 and P2: The speech probes were printed on individual cards. The
participant read the word from the card held up by the investigator. The cards were
held to one side and behind the camera so the participant’s face remained visible to
the camera. A word card was held in view and the participant was asked to read the
word aloud. If a word was misread, the investigator used sentence completion to
elicit the correct response. For example, “When the lawn grows too long, you need
to (mow) the lawn.” The word card was then shuffled through the pack and re-
presented a second time.
Intervention programme
As described in the literature review, PROMPT is a motor-speech
intervention approach founded upon the theoretical construct of dynamic systems
theory. That is, the PROMPT approach acknowledges the dynamic inter-relationship
between the physical-sensory, cognitive-linguistic and social-emotional domains of
the individual, as well as the external influences of the environment, in motor speech
production. Therefore, for long-term change to occur, intervention needs to involve
all domains, with a focus on strengthening the weakest domain (Hayden, 2008).
The PROMPT approach incorporates a technique that utilises dynamic
tactile-kinaesthetic-proprioceptive input to facilitate speech production.
There are currently four levels of PROMPT training:
1. Introduction to Technique
2. Bridging PROMPT technique to Intervention
3. PROMPT Certification, and
4. PROMPT Instructor.
The minimum requirement for administration of the PROMPT intervention
approach is completion of the three-day workshop ‘Introduction to Technique’. All
participants of this workshop are instructed in and provided with a manual that
details the theoretical model and framework underpinning PROMPT; administration
THE EFFECTIVENESS OF PROMPT
81
of the assessment protocol (SAO, and MSH) and setting of intervention priorities
within the PROMPT framework; different types and levels of PROMPTs and,
intervention principles.
The intervention protocol was designed to adhere to the theoretical
framework and principles of PROMPT as detailed in the Introduction to Technique
manual (2003).
Intervention protocol.
Three intervention priorities were selected and treatment objectives written
for the first two. The third intervention priority served as a control goal, thus no
treatment objectives were developed for this priority. Participants 2, 3, 5 and 6
targeted mandibular control in phase B and labial-facial control in phase C.
Participant 1 targeted labial-facial control in phase B and lingual control in phase C.
Participant 4 targeted mandibular and labial-facial control simultaneously in phase B
and lingual control in phase C. Each participant’s intervention priorities across the
intervention phases are illustrated in Table 4.5
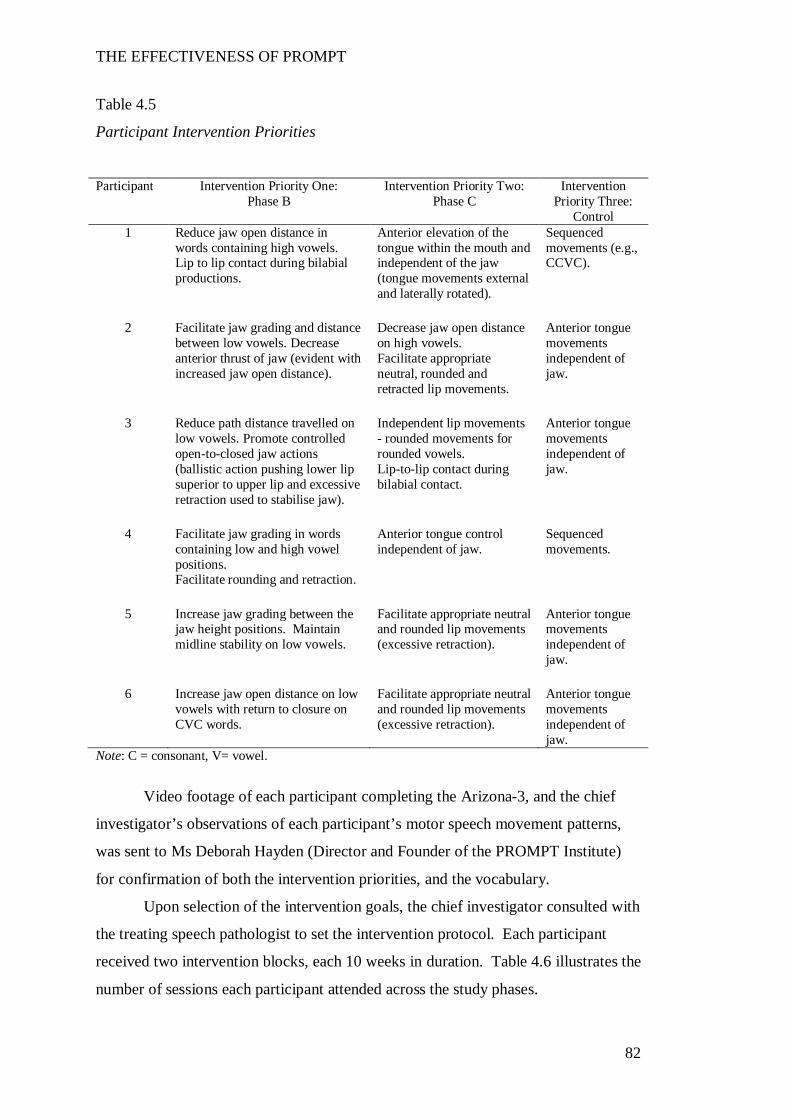
THE EFFECTIVENESS OF PROMPT
82
Table 4.5
Participant Intervention Priorities
Participant Intervention Priority One:
Phase B Intervention Priority Two:
Phase C Intervention
Priority Three: Control
1 Reduce jaw open distance in words containing high vowels. Lip to lip contact during bilabial productions.
Anterior elevation of the tongue within the mouth and independent of the jaw (tongue movements external and laterally rotated).
Sequenced movements (e.g., CCVC).
2 Facilitate jaw grading and distance
between low vowels. Decrease anterior thrust of jaw (evident with increased jaw open distance).
Decrease jaw open distance on high vowels. Facilitate appropriate neutral, rounded and retracted lip movements.
Anterior tongue movements independent of jaw.
3 Reduce path distance travelled on
low vowels. Promote controlled open-to-closed jaw actions (ballistic action pushing lower lip superior to upper lip and excessive retraction used to stabilise jaw).
Independent lip movements - rounded movements for rounded vowels. Lip-to-lip contact during bilabial contact.
Anterior tongue movements independent of jaw.
4 Facilitate jaw grading in words
containing low and high vowel positions. Facilitate rounding and retraction.
Anterior tongue control independent of jaw.
Sequenced movements.
5 Increase jaw grading between the
jaw height positions. Maintain midline stability on low vowels.
Facilitate appropriate neutral and rounded lip movements (excessive retraction).
Anterior tongue movements independent of jaw.
6 Increase jaw open distance on low
vowels with return to closure on CVC words.
Facilitate appropriate neutral and rounded lip movements (excessive retraction).
Anterior tongue movements independent of jaw.
Note: C = consonant, V= vowel.
Video footage of each participant completing the Arizona-3, and the chief
investigator’s observations of each participant’s motor speech movement patterns,
was sent to Ms Deborah Hayden (Director and Founder of the PROMPT Institute)
for confirmation of both the intervention priorities, and the vocabulary.
Upon selection of the intervention goals, the chief investigator consulted with
the treating speech pathologist to set the intervention protocol. Each participant
received two intervention blocks, each 10 weeks in duration. Table 4.6 illustrates the
number of sessions each participant attended across the study phases.
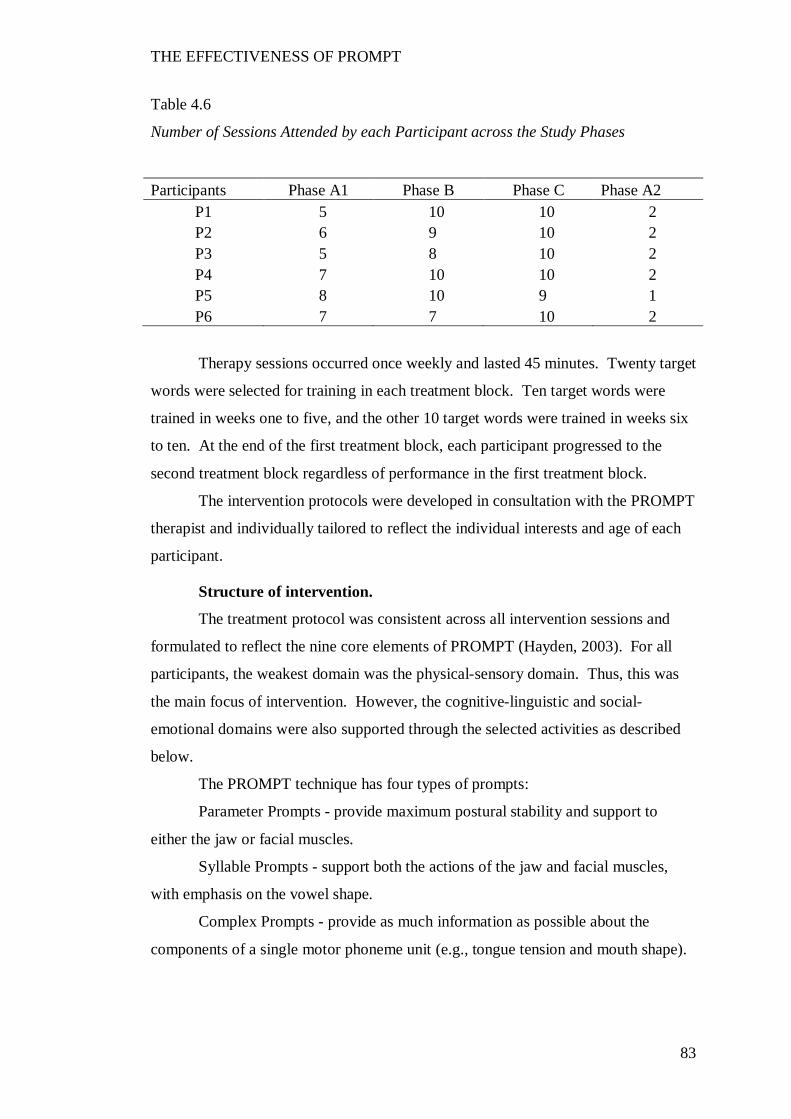
THE EFFECTIVENESS OF PROMPT
83
Table 4.6
Number of Sessions Attended by each Participant across the Study Phases
Participants Phase A1 Phase B Phase C Phase A2 P1 5 10 10 2 P2 6 9 10 2 P3 5 8 10 2 P4 7 10 10 2 P5 8 10 9 1 P6 7 7 10 2
Therapy sessions occurred once weekly and lasted 45 minutes. Twenty target
words were selected for training in each treatment block. Ten target words were
trained in weeks one to five, and the other 10 target words were trained in weeks six
to ten. At the end of the first treatment block, each participant progressed to the
second treatment block regardless of performance in the first treatment block.
The intervention protocols were developed in consultation with the PROMPT
therapist and individually tailored to reflect the individual interests and age of each
participant.
Structure of intervention.
The treatment protocol was consistent across all intervention sessions and
formulated to reflect the nine core elements of PROMPT (Hayden, 2003). For all
participants, the weakest domain was the physical-sensory domain. Thus, this was
the main focus of intervention. However, the cognitive-linguistic and social-
emotional domains were also supported through the selected activities as described
below.
The PROMPT technique has four types of prompts:
Parameter Prompts - provide maximum postural stability and support to
either the jaw or facial muscles.
Syllable Prompts - support both the actions of the jaw and facial muscles,
with emphasis on the vowel shape.
Complex Prompts - provide as much information as possible about the
components of a single motor phoneme unit (e.g., tongue tension and mouth shape).
THE EFFECTIVENESS OF PROMPT
84
Surface Prompts - provide the most critical but least information necessary to
produce a motor phoneme sequence through a co-articulated movement sequence
(Hayden, 2003).
The types of prompts administered were dependent on the needs of the
individual participant.
The structure of the intervention sessions was as follows:
Motor-phoneme “warm up” 1 (5 minutes).
The participant was asked to say individual sounds/words. The sounds/words
were selected on the basis of the target vocabulary. The therapist demonstrated to
the participant the sound/word using a surface prompt. The therapist then asked the
participant to say the sound/word and provided support using a surface, parameter,
complex or syllable prompt for each production. The type of prompt used by the
therapist was dependent on the level of support required by the participant. For
example if the participant was asked to produce /ah/ and opened the jaw too wide,
the participant would be asked to use a smaller mouth and be supported with a
parameter prompt. The participant was asked to say the word/sound to a maximum
of five correct productions, continuing to give the appropriate level of tactile support.
Specific verbal feedback was given throughout the warm-up drills.
The “warm up” period consisted of a schedule of massed practice to help the
participant learn the speech movement pattern. All participants were encouraged to
start in a neutral posture (i.e., lips softly closed together without excessive
retraction). Knowledge of performance feedback was provided after each trial. Upon
completion of the warm-up, the therapist moved to the first activity where the
sounds/words were embedded into a game.
Activity 1 (15 minutes).
The five target words were embedded into a game that centred on a daily
routine relevant to the participant (such as getting dressed, making breakfast etc).
The participant was given the opportunity to use each target word no less than 15
times. The level and amount of tactile-kinaesthetic input (prompting) was
individually tailored to the needs of the participant based on the following sequence:
The target word was first modelled to the participant using a surface prompt, to elicit
the targeted response. The level and type of prompting subsequently given to
support the participant to produce the word varied dependent on the intervention
priority. For example, when targeting the intervention of mandibular control a
THE EFFECTIVENESS OF PROMPT
85
participant may be given a parameter prompt during their production of the target
word. When the target word was produced accurately (both perceptually and
motorically), the tactile-input was reduced. During the 15 minute activity words
from the trained word-set pool were practiced in a distributed manner. Knowledge
of performance and results were randomly given.
Motor-phoneme “warm up drill” 2 (5 minutes).
The procedure followed was identical to the first motor phoneme warm-up
using sounds/words specific to Activity 2.
Activity 2 (15 minutes).
The five target words were embedded into a social routine relevant to the
participant (such as playing an age appropriate game). The procedure followed was
identical to the first activity. The participant used each target word no less than 15
times. Verbal praise and reinforcement was given throughout the therapy session.
Token reinforcements such as stickers were also used. The session concluded with a
discussion regarding home practice for the week (5 minutes).
Therapists.
Four independent PROMPT-trained therapists administered the treatment
protocols in this study (Table 4.7). The therapists administered the intervention
protocol and were not involved in the data collection or analysis.
Inclusion criteria for therapist participation in the study included (a)
completion of the Introduction to Technique workshop, (b) completion of the case
study detailed in the Introduction to Technique manual within 3 months of the
workshop, (c) regular use of the technique for at least 9 months, (d) attendance at a
PROMPT mentoring day held by Deborah Hayden in October 2006, (e) a fidelity
rating to the PROMPT approach of no less than 80% as assessed by an independent
senior PROMPT Instructor, and (f) an expression of interest to participate in the
study.
Three therapists were trained to level 2 (Bridging PROMPT technique to
intervention) and one therapist was trained to level 1 (Introduction to technique).
Three therapists administered treatment to one participant each. The fourth therapist
administered treatment to three participants. The author of this thesis did not
administer any therapy sessions.
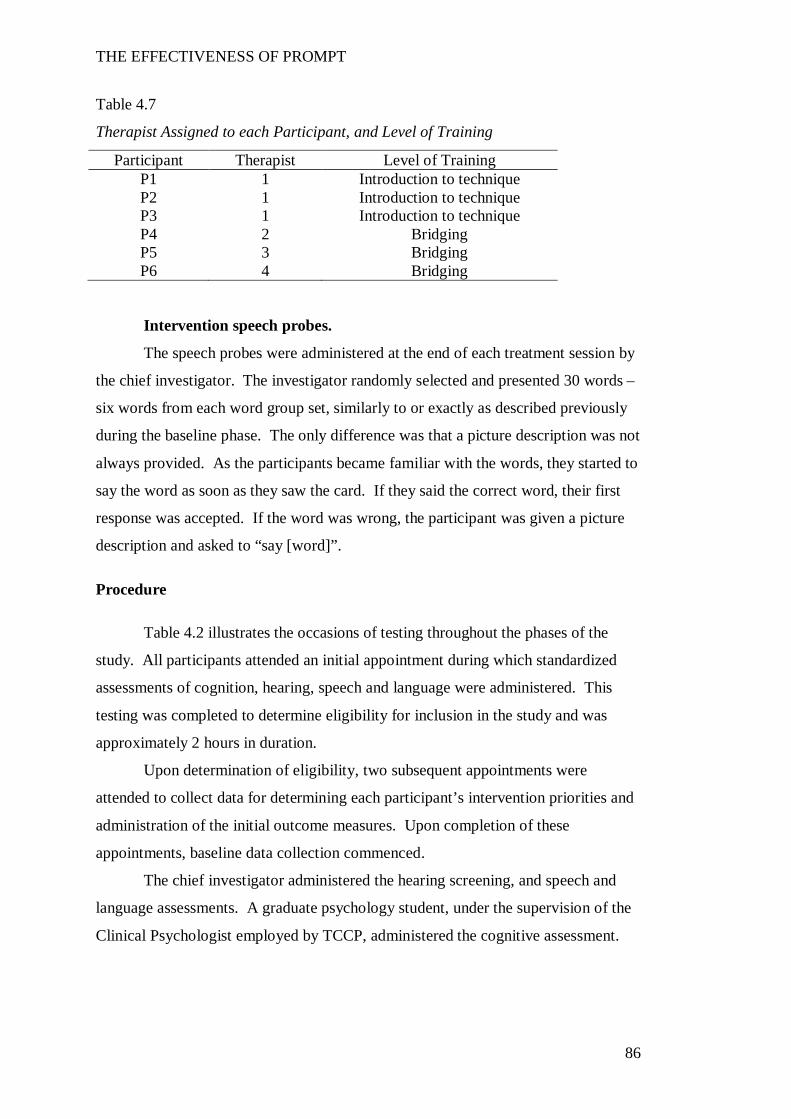
THE EFFECTIVENESS OF PROMPT
86
Table 4.7
Therapist Assigned to each Participant, and Level of Training
Participant Therapist Level of Training P1 1 Introduction to technique P2 1 Introduction to technique P3 1 Introduction to technique P4 2 Bridging P5 3 Bridging P6 4 Bridging
Intervention speech probes.
The speech probes were administered at the end of each treatment session by
the chief investigator. The investigator randomly selected and presented 30 words –
six words from each word group set, similarly to or exactly as described previously
during the baseline phase. The only difference was that a picture description was not
always provided. As the participants became familiar with the words, they started to
say the word as soon as they saw the card. If they said the correct word, their first
response was accepted. If the word was wrong, the participant was given a picture
description and asked to “say [word]”.
Procedure
Table 4.2 illustrates the occasions of testing throughout the phases of the
study. All participants attended an initial appointment during which standardized
assessments of cognition, hearing, speech and language were administered. This
testing was completed to determine eligibility for inclusion in the study and was
approximately 2 hours in duration.
Upon determination of eligibility, two subsequent appointments were
attended to collect data for determining each participant’s intervention priorities and
administration of the initial outcome measures. Upon completion of these
appointments, baseline data collection commenced.
The chief investigator administered the hearing screening, and speech and
language assessments. A graduate psychology student, under the supervision of the
Clinical Psychologist employed by TCCP, administered the cognitive assessment.
THE EFFECTIVENESS OF PROMPT
87
All testing was completed in the same treatment room at TCCP. Periodic
breaks were given, as necessary, to prevent fatigue. All assessment sessions were
video-recorded.
Upon completion of the testing, participants moved to the baseline phase and
subsequently into the intervention protocol.
Reliability and Fidelity
All scoring of outcome measures and intervention fidelity was completed by
independent and blinded researchers, as detailed below.
PROMPT intervention.
The PROMPT Institute provided an independent senior PROMPT Instructor
to evaluate each therapist’s fidelity to the treatment approach, using the PROMPT
fidelity protocol (Rogers et al., 2006). Prior to commencing the study, each
therapist’s fidelity to the PROMPT approach was evaluated, with all therapists
obtaining a minimum of 80% fidelity.
All intervention sessions were video recorded throughout the study. Two
further fidelity measures, per participant, per intervention phase were taken to
generate a total of four fidelity ratings per participant. Therefore therapists 2 through
4 underwent four fidelity ratings each; therapist 1 underwent 15 fidelity ratings. The
intervention sessions were randomly selected by an independent research assistant
using a random number selection. The sessions were transferred by the research
assistant to DVD, after removing all information identifying the therapist. The
DVDs were sent to the PROMPT Instructor who was blinded to the phases of the
study and the intervention session.
Fidelity measures throughout intervention block one (phase B) ranged
between 77.7% and 93.7%. All therapists achieved the desired 80% fidelity during
intervention block two (phase C) with scores ranging between 80.2% and 97%.
Data Preparation and Generation
Preparation of the data for analysis for each of the outcome measures is
described below.
THE EFFECTIVENESS OF PROMPT
88
An independent PROMPT trained speech-language pathologist (referred to as
the transcriber), blinded to the phases of the study and the participants, completed
the scoring of the data for speech production accuracy and phonetic accuracy.
Speech production accuracy: Scoring of speech probes.
All treatment sessions were de-identified and randomised, with the
transcriber blinded to the intervention sessions.
A scoring protocol was provided to the transcriber that identified the motor-
speech and perceptual goals for each participant. Each word was scored for accuracy
of the targeted motor speech movement pattern (MSMP) and perceptual accuracy
(PA). A binary coding system was used to code each parameter, where 0 =
inaccurate and 1 = accurate. A score of 1 was assigned as follows:
MSMP: the targeted motor speech movement pattern of that intervention
priority for the individual participant was appropriately executed. Words that
contained more than one movement goal (e.g. push = lip-to-lip contact for /p/ and
rounding /sh) were assigned a fraction (e.g., /p/ = ½, /sh/ = ½ point) to enable a
maximum score of one point for each parameter.
PA: production of the target word was perceptually correct, as identified
using narrow phonetic transcription.
Twenty percent of the data were randomly selected by the research assistant
and given to the transcriber for rescoring. The absolute difference between the first
and second occasion of scoring was calculated and converted to a percentage
agreement. An intra-rater agreement of 94% and 93% for accuracy of speech
production and motor-speech-movement-parameters respectively, was achieved.
Fifty percent of the data was selected for determination of inter-rater
reliability. The same research assistant de-identified the treatment sessions for both
the chief investigator and transcriber to score. Points of difference were identified
and reviewed for consensus. When consensus could not be obtained (5%) the
transcriber consulted with the independent PROMPT Instructor for transcription
confirmation.
The absolute difference between the scoring of the transcriber and chief
investigator was calculated and converted to a percentage agreement. An inter-rater
agreement of 87% and 91% for accuracy of speech production and motor-speech-
movement-parameters respectively, was achieved. These agreement values are
THE EFFECTIVENESS OF PROMPT
89
within the range deemed “acceptable” for research needs (Shriberg et al., 2010) and
consistent with inter-rater agreement values reported in the literature (E. Barnes et
al., 2009; Bose et al., 2001; Davis, Jacks, & Marquardt, 2005; Paatsch, Blamey,
Sarant, & Bow, 2006).
Phonetic accuracy: Narrow phonetic transcription.
Training process.
The speech of individuals with dysarthria is reported to include prosodic,
resonance, and disordered articulation errors. The standard International Phonetic
Association (IPA) symbols, as used in broad phonetic transcription, do not provide
the necessary symbols to code these features. Therefore, the extIPA (Ball, 2005)
diacritics that code sliding articulation, tongue position (e.g., retracted, bladed),
dental production of bilabials, labial spreading and nasalisation were used to
transcribe the speech characteristics of the participants in this study.
The literature documents the potential for reduced transcriber reliability with
the use of narrow phonetic transcription due to increased transcription complexity
(Ball, Müller, Klopfenstein, & Rutter, 2009). To strengthen reliability and prevent
transcriber drift, Shriberg et al. (1997) suggest the use of consensus transcription and
re-calibration.
In this study, the following procedures were undertaken to promote
consistency in narrow phonetic transcription:
Pre-training.
The transcriber and chief investigator jointly transcribed a speech sample of a
child (non-participant) with moderate-to-severe speech disorder, with speech
characteristics similar to the speech of the children anticipated to participate in the
study. The key error patterns sampled were discussed and key diacritics of the
extIPA used to represent these errors were identified.
Consensus.
The transcriber and chief investigator independently transcribed a speech
sample of a child (non-participant) with a moderate- to-severe speech disorder using
narrow phonetic transcription. All points of difference or disagreement were
discussed and transcription consensus reached. Upon obtaining 90% inter-rater
THE EFFECTIVENESS OF PROMPT
90
agreement, the transcriber commenced independent transcription of the speech
samples of the participants.
Calibration.
The transcriber and chief investigator independently, blinded to the testing
occasion, re-transcribed the data of one participant. The research assistant randomly
selected and de-identified the data. The absolute difference between the first and
second occasion of transcription was calculated and converted to a percentage
difference. Inter-rater reliability was 92% agreement.
Data Analysis
Speech production accuracy.
Both visual inspection and statistical tests were used to analyse the speech
probe data. Visual inspection requires the examination of graphed data, with the
target behaviour plotted on the Y-axis and time plotted on the X-axis. The MSMP
and PA scores for each intervention priority were graphed with the trained word-sets
plotted separately to the untrained.
The determination of intervention effects in single subject research design
requires a judgement about changes in the performance pattern both within and
between the design phases using visual inspection and statistical analysis (Portney &
Watkins, 2009).
Within-phase characteristics.
Within phase characteristics were judged according to stability (consistency
of response over time) and trend (performance direction described as accelerating,
decelerating, variable or stable based on a line of best fit).
Portney and Watkins (2009) report on the application of statistical process
control (SPC) to evaluate whether baseline data is within the limits of expected
“common cause” stability/variability. This involves the calculation of a moving-
mean-range (X-mR) and the plotting of a 3 standard deviation band to depict the
upper confidence limit (UCL) and lower confidence limit (LCL). The data are
determined to be stable if the data points fall within the confidence limits.
The establishment of a stable baseline is essential for determining
intervention effectiveness. In this study, the baseline was determined to be stable
THE EFFECTIVENESS OF PROMPT
91
when 1. all data points fell inside the UCL and LCL as determined by SPC and 2.
there was an absence of trend direction or a decelerating slope was observed.
Between-phase characteristics.
Assessment of the between-phase characteristics requires a judgement for
each dependent variable about change in (a) level (magnitude of performance), (b)
slope (steepness of the trend direction), (c) trend (performance direction typically
described as accelerating, decelerating, variable or stable based on a line of best fit),
and (d) variability between each phase and the following one.
In addition to visual inspection, statistical methods were used to evaluate
changes in the data trend and level. The three statistical measures used in this study
included the two standard deviation band (2SD band) analysis (change in level), the
conservative dual criterion split-middle method of trend estimation with binomial
test (change in trend and slope) and effect size (Fisher et al., 2003; Nourbakhsh &
Ottenbacher, 1994; Portney & Watkins, 2009; Satake, Jagaroo, & Maxwell, 2008):
1. 2SD band: Typically a significant change in level in the 2SD band
method is considered to have occurred when two consecutive points occur outside
the UCL and LCL (Orme & Cox, 2001; Portney & Watkins, 2009). The literature
reports two consecutive data points above the 2SD band are considered to be
consistent with a p-value <0.05. However, this method is based on the assumption
of normal distribution and that observations are independent. Campbell and
Herzinger (2010) report the presence of serial dependency that frequently occurs in
SSRD, can render the p-value to 0.1. Given there were insufficient data points to
calculate the degree of serial dependency in the datasets of this study, a more
stringent criterion of 3 consecutive data points between two and three standard
deviations was used (Orme & Cox, 2001).
2. Split-middle method of trend estimation with binomial test: The
conservative dual-criterion (CDC) method as detailed by Fisher et al. (2003) was
implemented. This method involves raising the positions of the mean and split-
middle lines by a further 0.25 standard deviations. This method has been shown to
be superior to other methods (i.e., split-middle method, general linear model and
dual criterion method) in controlling type I errors when the data are autocorrelated
(Fisher et al., 2003). In addition, the use of this method has been reported in single
subject research designs in the speech pathology field (Wambaugh & Ferguson,
2007).
THE EFFECTIVENESS OF PROMPT
92
3. Effect size: Solanas, Manolov and Onghena (2010) investigated the
optimum effect size measurement for single subject data containing short data series
(i.e., less than 10 data points per study phase). Their analyses indicated formulas
based on the standardised mean difference (e.g., d-index) were the least susceptible
to autocorrelation and still sensitive to intervention effects. Therefore, this study
applied a modified Cohen’s d using the pooled standard deviation as recommended
by Dunst, Hamby and Trivette (2004) for single subject research design.
Phonetic accuracy.
Percentage Phonemes Correct (PPC) scores were calculated using the
wordlist from the Arizona 3 (third revision) (Fudala, 2000). The PPC score was
calculated by scoring correct responses on the consonants and vowel/diphthong
phonemes. Distortions, deletions and substitutions were scored as incorrect.
The percentage of phonemes correct was then entered into SPSS and repeated
measures ANOVA was performed. In addition the Cohen’s d was also calculated to
determine the effect sizes across the study phases.
Motor-speech control.
The Verbal Motor Production Assessment for Children (VMPAC) (Hayden
and Square, 1999) assesses five areas of motor speech control: global motor control,
focal oromotor control, sequencing, connected speech and language control, and
speech characteristics. Each area is scored to yield a percentage correct score.
Initial (pre phase A1) and post intervention (phaseA2) data are reported for each
subtest along with a percentage improvement score for each participant.
Results
Speech Production Accuracy (Speech Probes)
In this section the data for dependent variable one (speech production
accuracy), are presented for each participant as individual case studies, followed by a
group summary.
Speech production accuracy was assessed through the administration of
weekly speech probes. The speech probes were administered and scored for
accuracy on two parameters: 1. motor-speech-movement-parameters (MSMPs) and
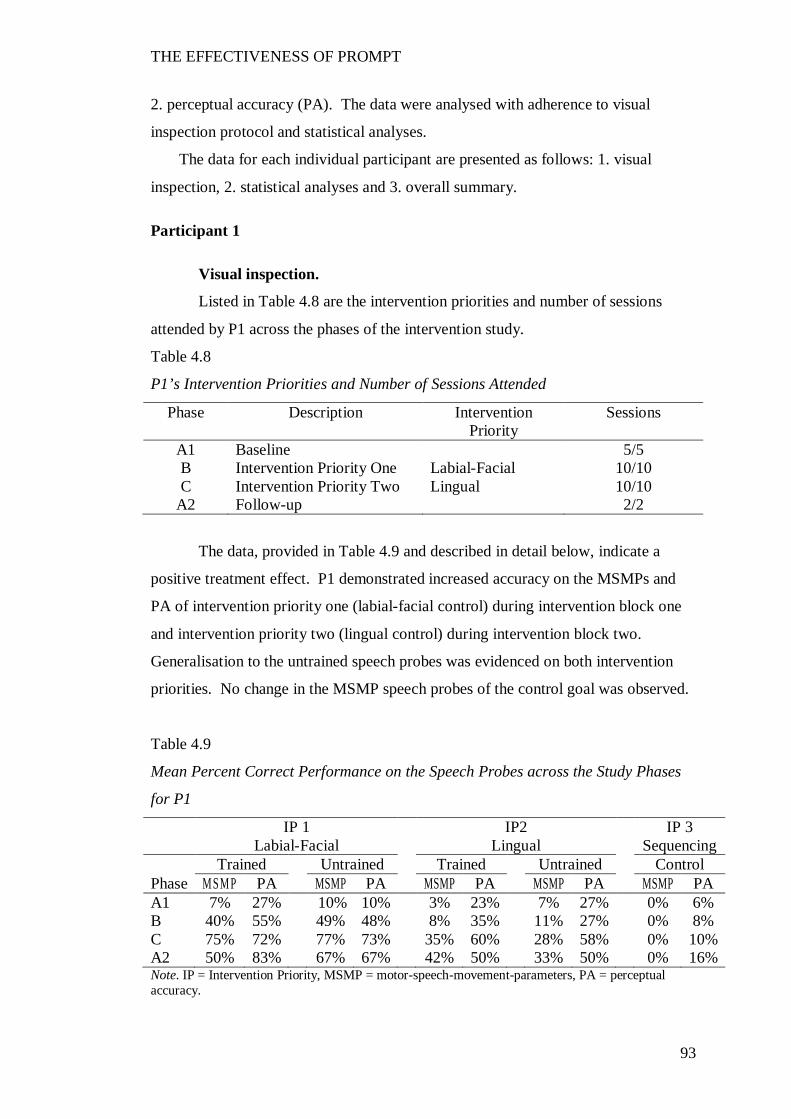
THE EFFECTIVENESS OF PROMPT
93
2. perceptual accuracy (PA). The data were analysed with adherence to visual
inspection protocol and statistical analyses.
The data for each individual participant are presented as follows: 1. visual
inspection, 2. statistical analyses and 3. overall summary.
Participant 1
Visual inspection.
Listed in Table 4.8 are the intervention priorities and number of sessions
attended by P1 across the phases of the intervention study.
Table 4.8
P1’s Intervention Priorities and Number of Sessions Attended
Phase Description Intervention Priority
Sessions
A1 Baseline 5/5 B Intervention Priority One Labial-Facial 10/10 C Intervention Priority Two Lingual 10/10
A2 Follow-up 2/2
The data, provided in Table 4.9 and described in detail below, indicate a
positive treatment effect. P1 demonstrated increased accuracy on the MSMPs and
PA of intervention priority one (labial-facial control) during intervention block one
and intervention priority two (lingual control) during intervention block two.
Generalisation to the untrained speech probes was evidenced on both intervention
priorities. No change in the MSMP speech probes of the control goal was observed.
Table 4.9
Mean Percent Correct Performance on the Speech Probes across the Study Phases
for P1
IP 1 IP2 IP 3 Labial-Facial Lingual Sequencing Trained Untrained Trained Untrained Control Phase M SM P PA MSMP PA MSMP PA MSMP PA MSMP PA A1 7% 27% 10% 10% 3% 23% 7% 27% 0% 6% B 40% 55% 49% 48% 8% 35% 11% 27% 0% 8% C 75% 72% 77% 73% 35% 60% 28% 58% 0% 10% A2 50% 83% 67% 67% 42% 50% 33% 50% 0% 16% Note. IP = Intervention Priority, MSMP = motor-speech-movement-parameters, PA = perceptual accuracy.
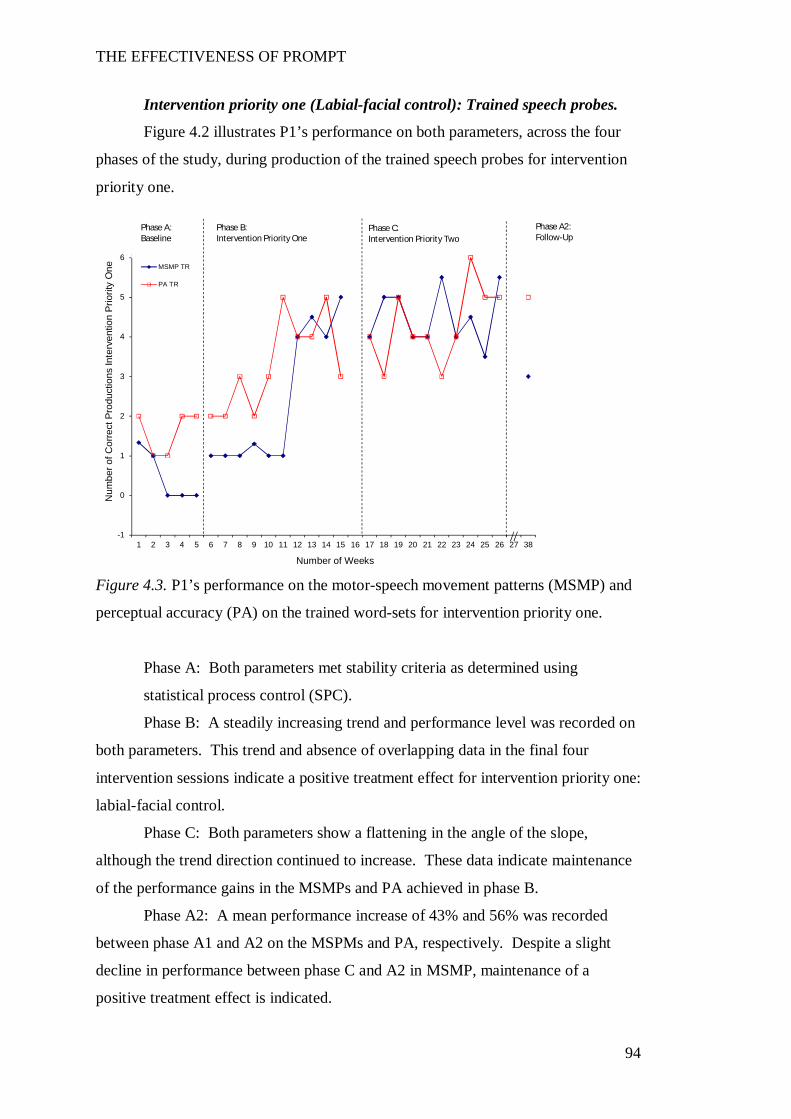
THE EFFECTIVENESS OF PROMPT
94
Intervention priority one (Labial-facial control): Trained speech probes.
Figure 4.2 illustrates P1’s performance on both parameters, across the four
phases of the study, during production of the trained speech probes for intervention
priority one.
Figure 4.3. P1’s performance on the motor-speech movement patterns (MSMP) and
perceptual accuracy (PA) on the trained word-sets for intervention priority one.
Phase A: Both parameters met stability criteria as determined using
statistical process control (SPC).
Phase B: A steadily increasing trend and performance level was recorded on
both parameters. This trend and absence of overlapping data in the final four
intervention sessions indicate a positive treatment effect for intervention priority one:
labial-facial control.
Phase C: Both parameters show a flattening in the angle of the slope,
although the trend direction continued to increase. These data indicate maintenance
of the performance gains in the MSMPs and PA achieved in phase B.
Phase A2: A mean performance increase of 43% and 56% was recorded
between phase A1 and A2 on the MSPMs and PA, respectively. Despite a slight
decline in performance between phase C and A2 in MSMP, maintenance of a
positive treatment effect is indicated.
-1
0
1
2
3
4
5
6
7
1 2 3 4 5 6 7 8 9 10 11 12 13 14 15 16 17 18 19 20 21 22 23 24 25 26 27 38
Num
ber o
f Cor
rect
Pro
duct
ions
Inte
rven
tion
Prio
rity
One
Number of Weeks
MSMP TR
PA TR
Phase B:Intervention Priority One
Phase C:Intervention Priority Two
Phase A2:Follow-Up
Phase A:Baseline
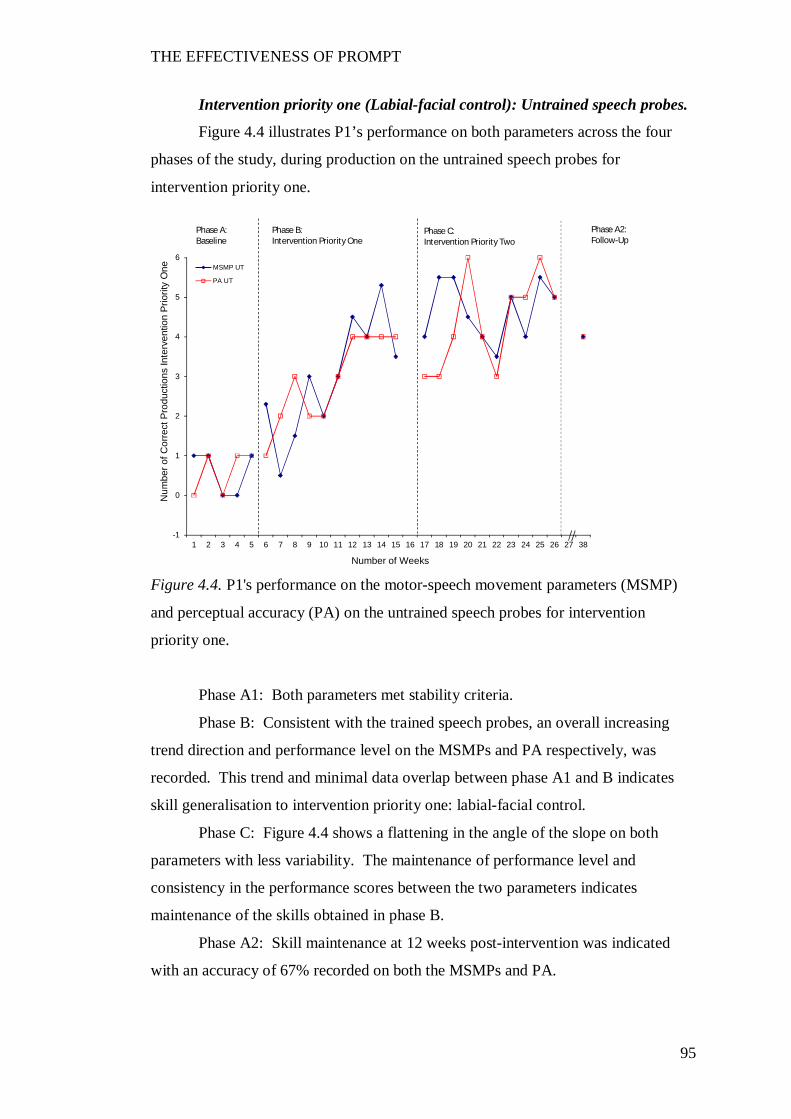
THE EFFECTIVENESS OF PROMPT
95
Intervention priority one (Labial-facial control): Untrained speech probes.
Figure 4.4 illustrates P1’s performance on both parameters across the four
phases of the study, during production on the untrained speech probes for
intervention priority one.
Figure 4.4. P1's performance on the motor-speech movement parameters (MSMP)
and perceptual accuracy (PA) on the untrained speech probes for intervention
priority one.
Phase A1: Both parameters met stability criteria.
Phase B: Consistent with the trained speech probes, an overall increasing
trend direction and performance level on the MSMPs and PA respectively, was
recorded. This trend and minimal data overlap between phase A1 and B indicates
skill generalisation to intervention priority one: labial-facial control.
Phase C: Figure 4.4 shows a flattening in the angle of the slope on both
parameters with less variability. The maintenance of performance level and
consistency in the performance scores between the two parameters indicates
maintenance of the skills obtained in phase B.
Phase A2: Skill maintenance at 12 weeks post-intervention was indicated
with an accuracy of 67% recorded on both the MSMPs and PA.
-1
0
1
2
3
4
5
6
7
1 2 3 4 5 6 7 8 9 10 11 12 13 14 15 16 17 18 19 20 21 22 23 24 25 26 27 38
Num
ber o
f Cor
rect
Pro
duct
ions
Inte
rven
tion
Prio
rity
One
Number of Weeks
MSMP UT
PA UT
Phase B:Intervention Priority One
Phase C:Intervention Priority Two
Phase A2:Follow-Up
Phase A:Baseline
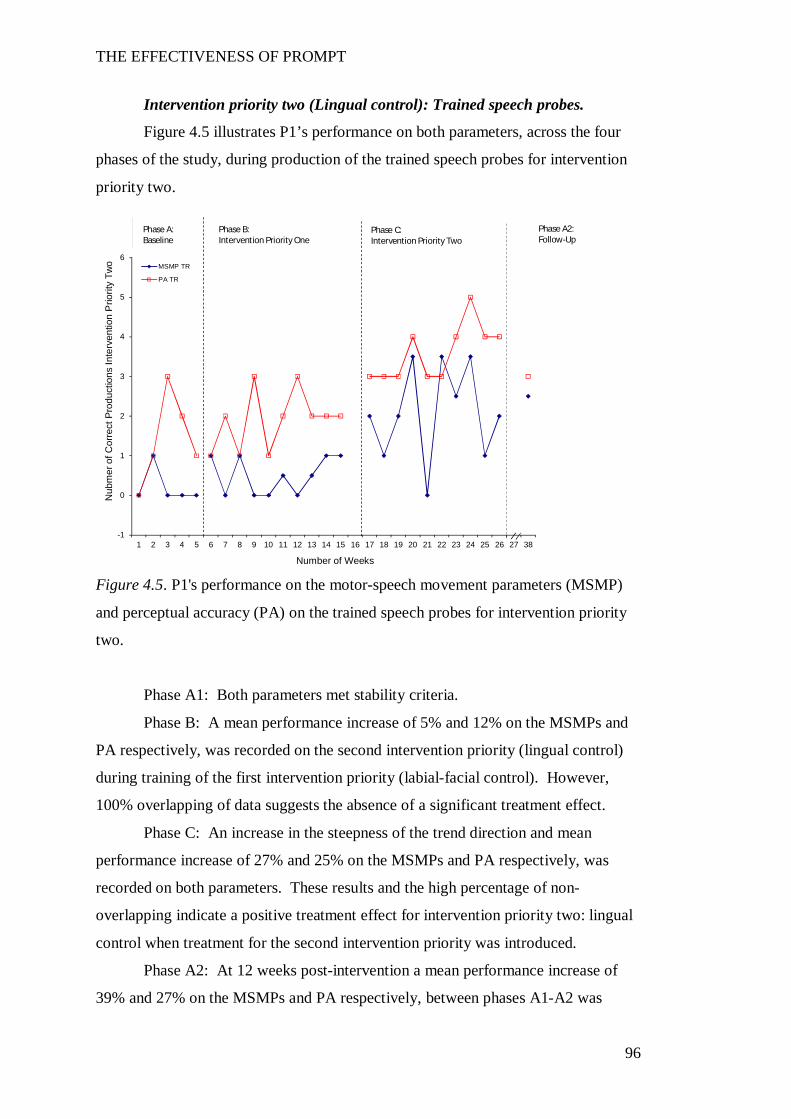
THE EFFECTIVENESS OF PROMPT
96
Intervention priority two (Lingual control): Trained speech probes.
Figure 4.5 illustrates P1’s performance on both parameters, across the four
phases of the study, during production of the trained speech probes for intervention
priority two.
Figure 4.5. P1's performance on the motor-speech movement parameters (MSMP)
and perceptual accuracy (PA) on the trained speech probes for intervention priority
two.
Phase A1: Both parameters met stability criteria.
Phase B: A mean performance increase of 5% and 12% on the MSMPs and
PA respectively, was recorded on the second intervention priority (lingual control)
during training of the first intervention priority (labial-facial control). However,
100% overlapping of data suggests the absence of a significant treatment effect.
Phase C: An increase in the steepness of the trend direction and mean
performance increase of 27% and 25% on the MSMPs and PA respectively, was
recorded on both parameters. These results and the high percentage of non-
overlapping indicate a positive treatment effect for intervention priority two: lingual
control when treatment for the second intervention priority was introduced.
Phase A2: At 12 weeks post-intervention a mean performance increase of
39% and 27% on the MSMPs and PA respectively, between phases A1-A2 was
-1
0
1
2
3
4
5
6
7
1 2 3 4 5 6 7 8 9 10 11 12 13 14 15 16 17 18 19 20 21 22 23 24 25 26 27 38
Nub
mer
of C
orre
ct P
rodu
ctio
ns In
terv
entio
n P
riorit
y Tw
o
Number of Weeks
MSMP TR
PA TR
Phase B:Intervention Priority One
Phase C:Intervention Priority Two
Phase A2:Follow-Up
Phase A:Baseline
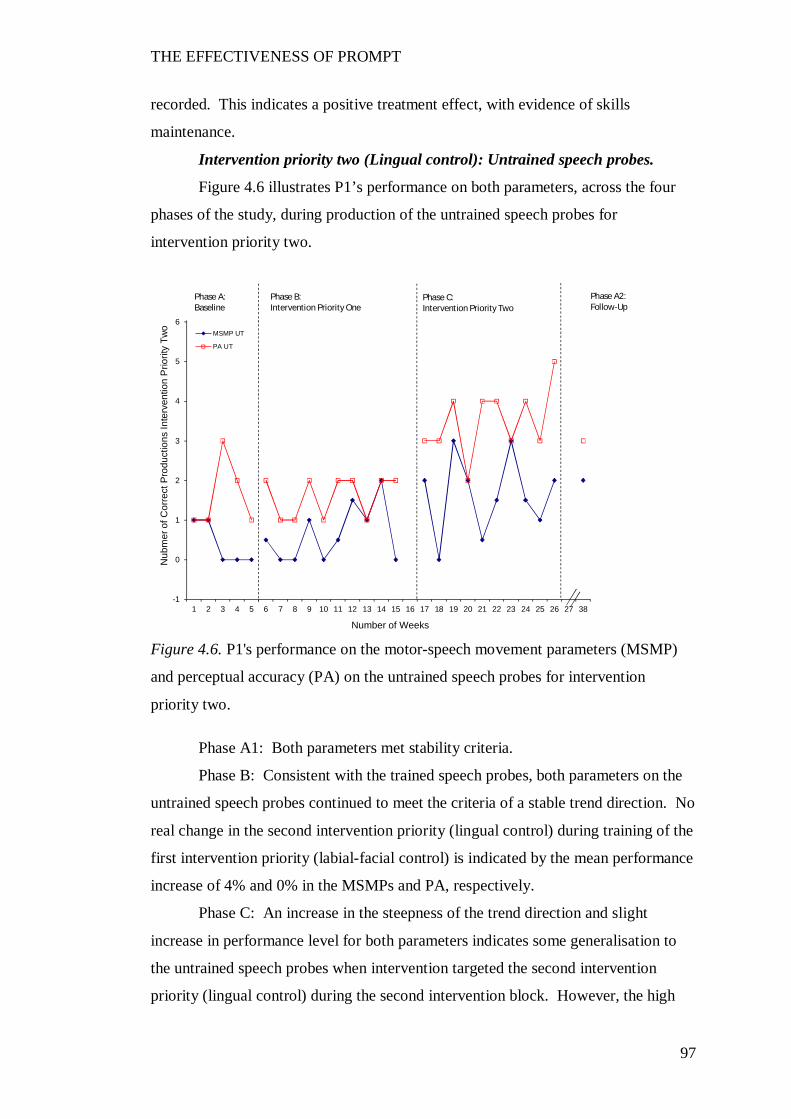
THE EFFECTIVENESS OF PROMPT
97
recorded. This indicates a positive treatment effect, with evidence of skills
maintenance.
Intervention priority two (Lingual control): Untrained speech probes.
Figure 4.6 illustrates P1’s performance on both parameters, across the four
phases of the study, during production of the untrained speech probes for
intervention priority two.
Figure 4.6. P1's performance on the motor-speech movement parameters (MSMP)
and perceptual accuracy (PA) on the untrained speech probes for intervention
priority two.
Phase A1: Both parameters met stability criteria.
Phase B: Consistent with the trained speech probes, both parameters on the
untrained speech probes continued to meet the criteria of a stable trend direction. No
real change in the second intervention priority (lingual control) during training of the
first intervention priority (labial-facial control) is indicated by the mean performance
increase of 4% and 0% in the MSMPs and PA, respectively.
Phase C: An increase in the steepness of the trend direction and slight
increase in performance level for both parameters indicates some generalisation to
the untrained speech probes when intervention targeted the second intervention
priority (lingual control) during the second intervention block. However, the high
-1
0
1
2
3
4
5
6
7
1 2 3 4 5 6 7 8 9 10 11 12 13 14 15 16 17 18 19 20 21 22 23 24 25 26 27 38
Nub
mer
of C
orre
ct P
rodu
ctio
ns In
terv
entio
n P
riorit
y Tw
o
Number of Weeks
MSMP UT
PA UT
Phase B:Intervention Priority One
Phase C:Intervention Priority Two
Phase A2:Follow-Up
Phase A:Baseline
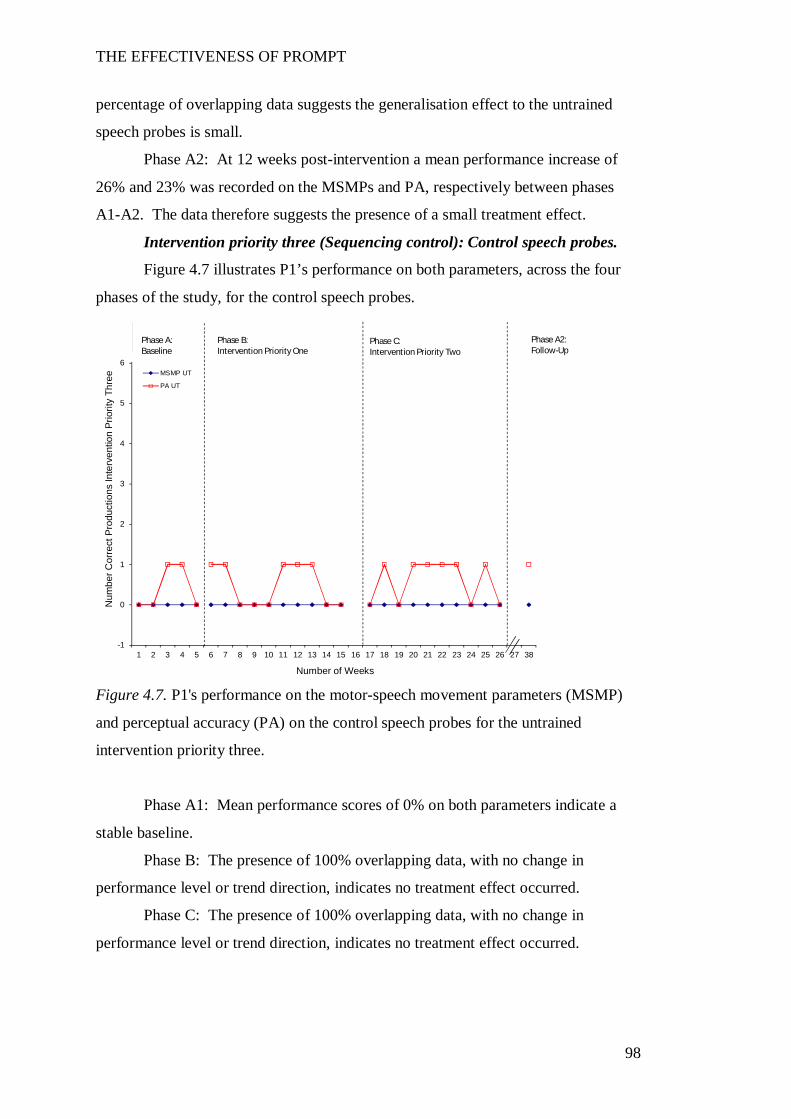
THE EFFECTIVENESS OF PROMPT
98
percentage of overlapping data suggests the generalisation effect to the untrained
speech probes is small.
Phase A2: At 12 weeks post-intervention a mean performance increase of
26% and 23% was recorded on the MSMPs and PA, respectively between phases
A1-A2. The data therefore suggests the presence of a small treatment effect.
Intervention priority three (Sequencing control): Control speech probes.
Figure 4.7 illustrates P1’s performance on both parameters, across the four
phases of the study, for the control speech probes.
Figure 4.7. P1's performance on the motor-speech movement parameters (MSMP)
and perceptual accuracy (PA) on the control speech probes for the untrained
intervention priority three.
Phase A1: Mean performance scores of 0% on both parameters indicate a
stable baseline.
Phase B: The presence of 100% overlapping data, with no change in
performance level or trend direction, indicates no treatment effect occurred.
Phase C: The presence of 100% overlapping data, with no change in
performance level or trend direction, indicates no treatment effect occurred.
-1
0
1
2
3
4
5
6
7
1 2 3 4 5 6 7 8 9 10 11 12 13 14 15 16 17 18 19 20 21 22 23 24 25 26 27 38
Num
ber C
orre
ct P
rodu
ctio
ns In
terv
entio
n Pr
iorit
y Th
ree
Number of Weeks
MSMP UT
PA UT
Phase B:Intervention Priority One
Phase C:Intervention Priority Two
Phase A2:Follow-Up
Phase A:Baseline
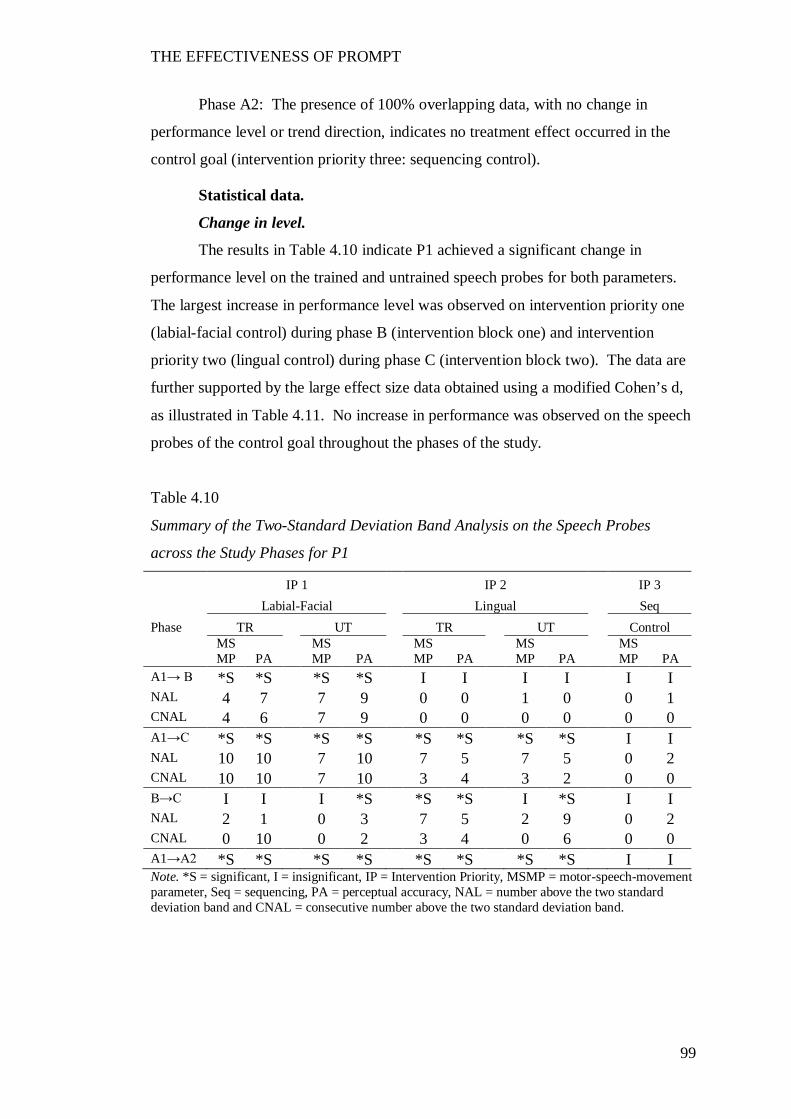
THE EFFECTIVENESS OF PROMPT
99
Phase A2: The presence of 100% overlapping data, with no change in
performance level or trend direction, indicates no treatment effect occurred in the
control goal (intervention priority three: sequencing control).
Statistical data.
Change in level.
The results in Table 4.10 indicate P1 achieved a significant change in
performance level on the trained and untrained speech probes for both parameters.
The largest increase in performance level was observed on intervention priority one
(labial-facial control) during phase B (intervention block one) and intervention
priority two (lingual control) during phase C (intervention block two). The data are
further supported by the large effect size data obtained using a modified Cohen’s d,
as illustrated in Table 4.11. No increase in performance was observed on the speech
probes of the control goal throughout the phases of the study.
Table 4.10
Summary of the Two-Standard Deviation Band Analysis on the Speech Probes
across the Study Phases for P1
IP 1 IP 2 IP 3 Labial-Facial Lingual Seq Phase TR UT TR UT Control
MSMP PA
MSMP PA
MSMP PA
MSMP PA
MSMP PA
A1→ B *S *S *S *S I I I I I I NAL 4 7 7 9 0 0 1 0 0 1 CNAL 4 6 7 9 0 0 0 0 0 0 A1→C *S *S *S *S *S *S *S *S I I NAL 10 10 7 10 7 5 7 5 0 2 CNAL 10 10 7 10 3 4 3 2 0 0 B→C I I I *S *S *S I *S I I NAL 2 1 0 3 7 5 2 9 0 2 CNAL 0 10 0 2 3 4 0 6 0 0 A1→A2 *S *S *S *S *S *S *S *S I I Note. *S = significant, I = insignificant, IP = Intervention Priority, MSMP = motor-speech-movement parameter, Seq = sequencing, PA = perceptual accuracy, NAL = number above the two standard deviation band and CNAL = consecutive number above the two standard deviation band.
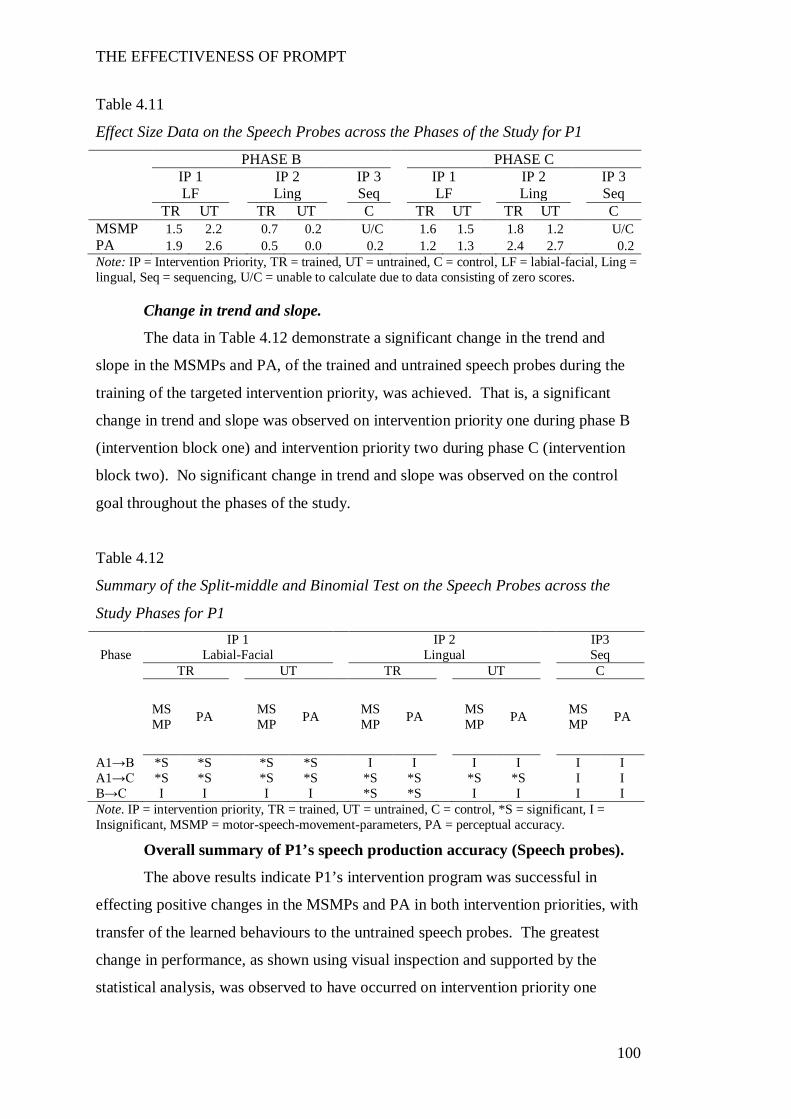
THE EFFECTIVENESS OF PROMPT
100
Table 4.11
Effect Size Data on the Speech Probes across the Phases of the Study for P1
PHASE B PHASE C IP 1 IP 2 IP 3 IP 1 IP 2 IP 3 LF Ling Seq LF Ling Seq TR UT TR UT C TR UT TR UT C MSMP 1.5 2.2 0.7 0.2 U/C 1.6 1.5 1.8 1.2 U/C PA 1.9 2.6 0.5 0.0 0.2 1.2 1.3 2.4 2.7 0.2 Note: IP = Intervention Priority, TR = trained, UT = untrained, C = control, LF = labial-facial, Ling = lingual, Seq = sequencing, U/C = unable to calculate due to data consisting of zero scores.
Change in trend and slope.
The data in Table 4.12 demonstrate a significant change in the trend and
slope in the MSMPs and PA, of the trained and untrained speech probes during the
training of the targeted intervention priority, was achieved. That is, a significant
change in trend and slope was observed on intervention priority one during phase B
(intervention block one) and intervention priority two during phase C (intervention
block two). No significant change in trend and slope was observed on the control
goal throughout the phases of the study.
Table 4.12
Summary of the Split-middle and Binomial Test on the Speech Probes across the
Study Phases for P1 IP 1 IP 2 IP3
Phase Labial-Facial Lingual Seq TR UT TR UT C
MSMP PA MS
MP PA MSMP PA MS
MP PA MSMP PA
A1→B *S *S *S *S I I I I I I A1→C *S *S *S *S *S *S *S *S I I B→C I I I I *S *S I I I I Note. IP = intervention priority, TR = trained, UT = untrained, C = control, *S = significant, I = Insignificant, MSMP = motor-speech-movement-parameters, PA = perceptual accuracy.
Overall summary of P1’s speech production accuracy (Speech probes).
The above results indicate P1’s intervention program was successful in
effecting positive changes in the MSMPs and PA in both intervention priorities, with
transfer of the learned behaviours to the untrained speech probes. The greatest
change in performance, as shown using visual inspection and supported by the
statistical analysis, was observed to have occurred on intervention priority one
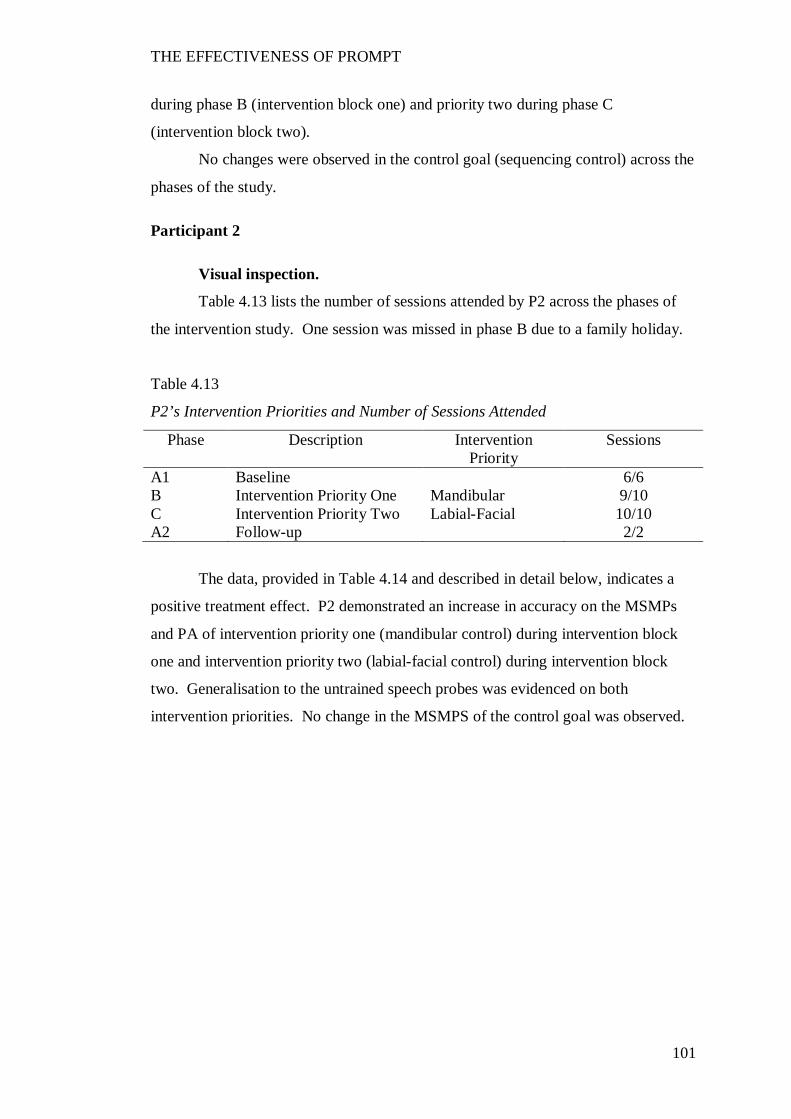
THE EFFECTIVENESS OF PROMPT
101
during phase B (intervention block one) and priority two during phase C
(intervention block two).
No changes were observed in the control goal (sequencing control) across the
phases of the study.
Participant 2
Visual inspection.
Table 4.13 lists the number of sessions attended by P2 across the phases of
the intervention study. One session was missed in phase B due to a family holiday.
Table 4.13
P2’s Intervention Priorities and Number of Sessions Attended
Phase Description Intervention Priority
Sessions
A1 Baseline 6/6 B Intervention Priority One Mandibular 9/10 C Intervention Priority Two Labial-Facial 10/10 A2 Follow-up 2/2
The data, provided in Table 4.14 and described in detail below, indicates a
positive treatment effect. P2 demonstrated an increase in accuracy on the MSMPs
and PA of intervention priority one (mandibular control) during intervention block
one and intervention priority two (labial-facial control) during intervention block
two. Generalisation to the untrained speech probes was evidenced on both
intervention priorities. No change in the MSMPS of the control goal was observed.
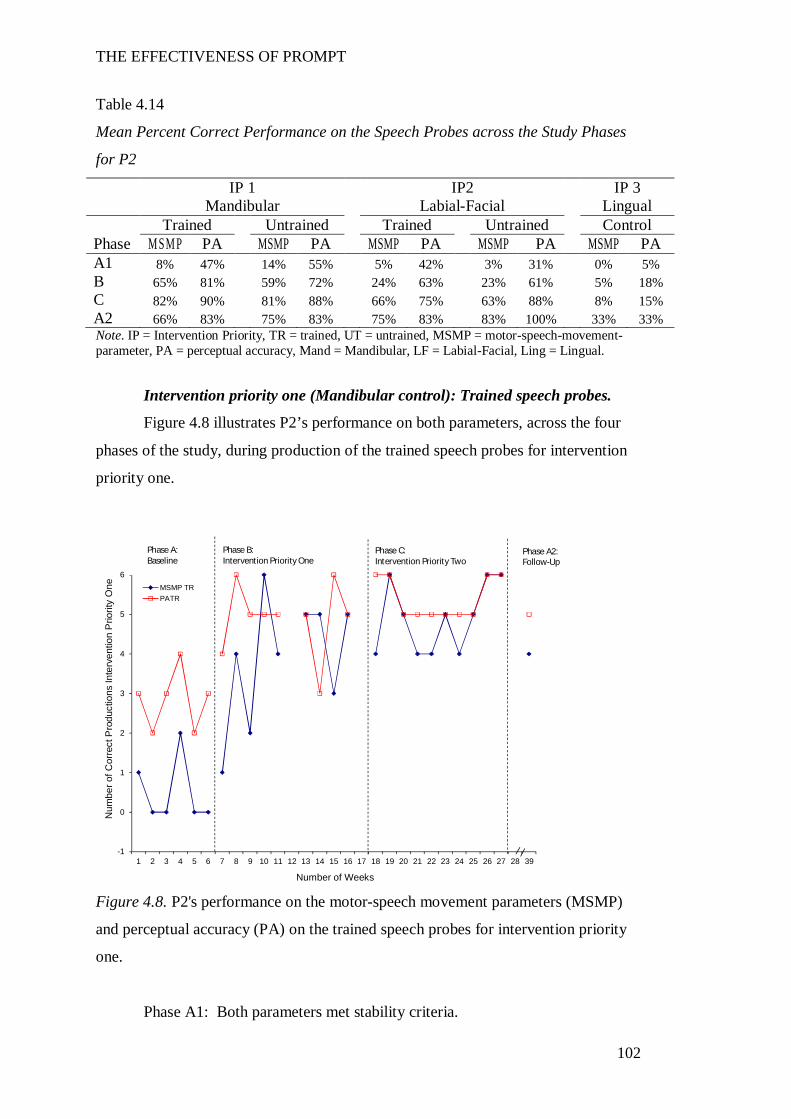
THE EFFECTIVENESS OF PROMPT
102
Table 4.14
Mean Percent Correct Performance on the Speech Probes across the Study Phases
for P2
IP 1 IP2 IP 3 Mandibular Labial-Facial Lingual Trained Untrained Trained Untrained Control Phase M SM P PA MSMP PA MSMP PA MSMP PA MSMP PA A1 8% 47% 14% 55% 5% 42% 3% 31% 0% 5% B 65% 81% 59% 72% 24% 63% 23% 61% 5% 18% C 82% 90% 81% 88% 66% 75% 63% 88% 8% 15% A2 66% 83% 75% 83% 75% 83% 83% 100% 33% 33% Note. IP = Intervention Priority, TR = trained, UT = untrained, MSMP = motor-speech-movement-parameter, PA = perceptual accuracy, Mand = Mandibular, LF = Labial-Facial, Ling = Lingual.
Intervention priority one (Mandibular control): Trained speech probes.
Figure 4.8 illustrates P2’s performance on both parameters, across the four
phases of the study, during production of the trained speech probes for intervention
priority one.
Figure 4.8. P2's performance on the motor-speech movement parameters (MSMP)
and perceptual accuracy (PA) on the trained speech probes for intervention priority
one.
Phase A1: Both parameters met stability criteria.
-1
0
1
2
3
4
5
6
7
1 2 3 4 5 6 7 8 9 10 11 12 13 14 15 16 17 18 19 20 21 22 23 24 25 26 27 28 39
Num
ber o
f Cor
rect
Pro
duct
ions
Inte
rven
tion
Prio
rity
One
Number of Weeks
MSMP TRPATR
Phase B:Intervention Priority One
Phase C:Intervention Priority Two
Phase A2:Follow-Up
Phase A:Baseline
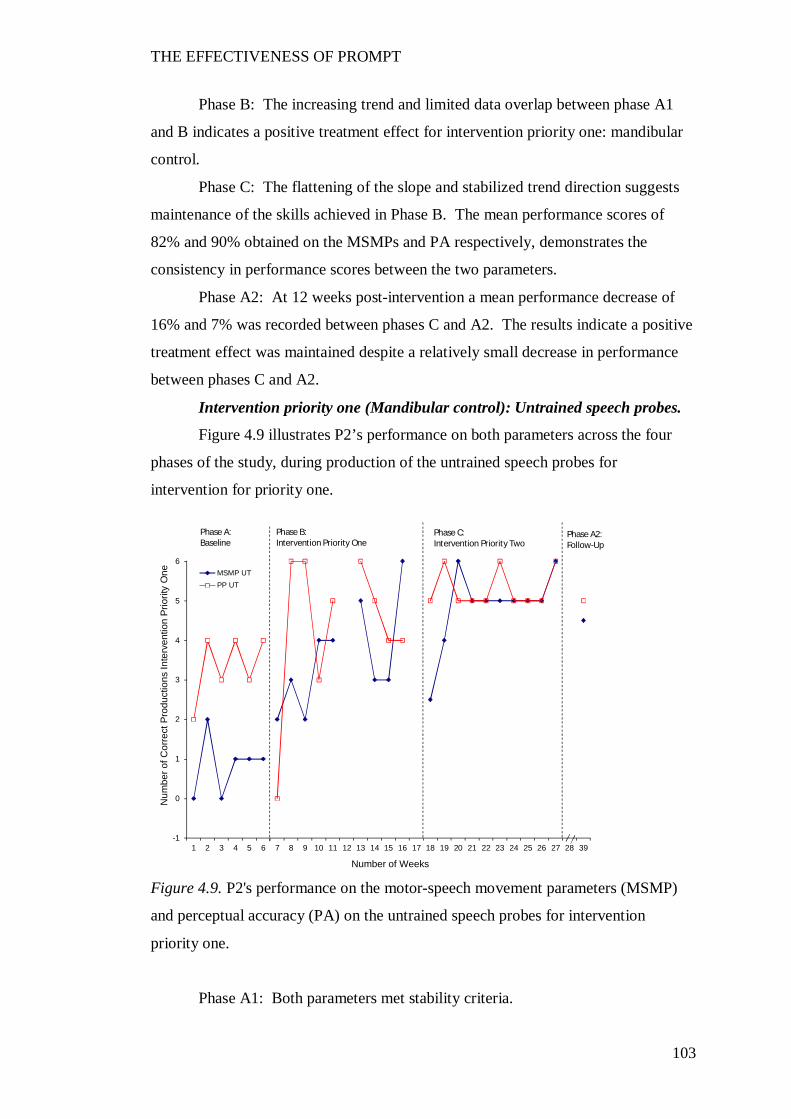
THE EFFECTIVENESS OF PROMPT
103
Phase B: The increasing trend and limited data overlap between phase A1
and B indicates a positive treatment effect for intervention priority one: mandibular
control.
Phase C: The flattening of the slope and stabilized trend direction suggests
maintenance of the skills achieved in Phase B. The mean performance scores of
82% and 90% obtained on the MSMPs and PA respectively, demonstrates the
consistency in performance scores between the two parameters.
Phase A2: At 12 weeks post-intervention a mean performance decrease of
16% and 7% was recorded between phases C and A2. The results indicate a positive
treatment effect was maintained despite a relatively small decrease in performance
between phases C and A2.
Intervention priority one (Mandibular control): Untrained speech probes.
Figure 4.9 illustrates P2’s performance on both parameters across the four
phases of the study, during production of the untrained speech probes for
intervention for priority one.
Figure 4.9. P2's performance on the motor-speech movement parameters (MSMP)
and perceptual accuracy (PA) on the untrained speech probes for intervention
priority one.
Phase A1: Both parameters met stability criteria.
-1
0
1
2
3
4
5
6
7
1 2 3 4 5 6 7 8 9 10 11 12 13 14 15 16 17 18 19 20 21 22 23 24 25 26 27 28 39
Num
ber o
f Cor
rect
Pro
duct
ions
Inte
rven
tion
Prio
rity
One
Number of Weeks
MSMP UTPP UT
Phase B:Intervention Priority One
Phase C:Intervention Priority Two
Phase A2:Follow-Up
Phase A:Baseline
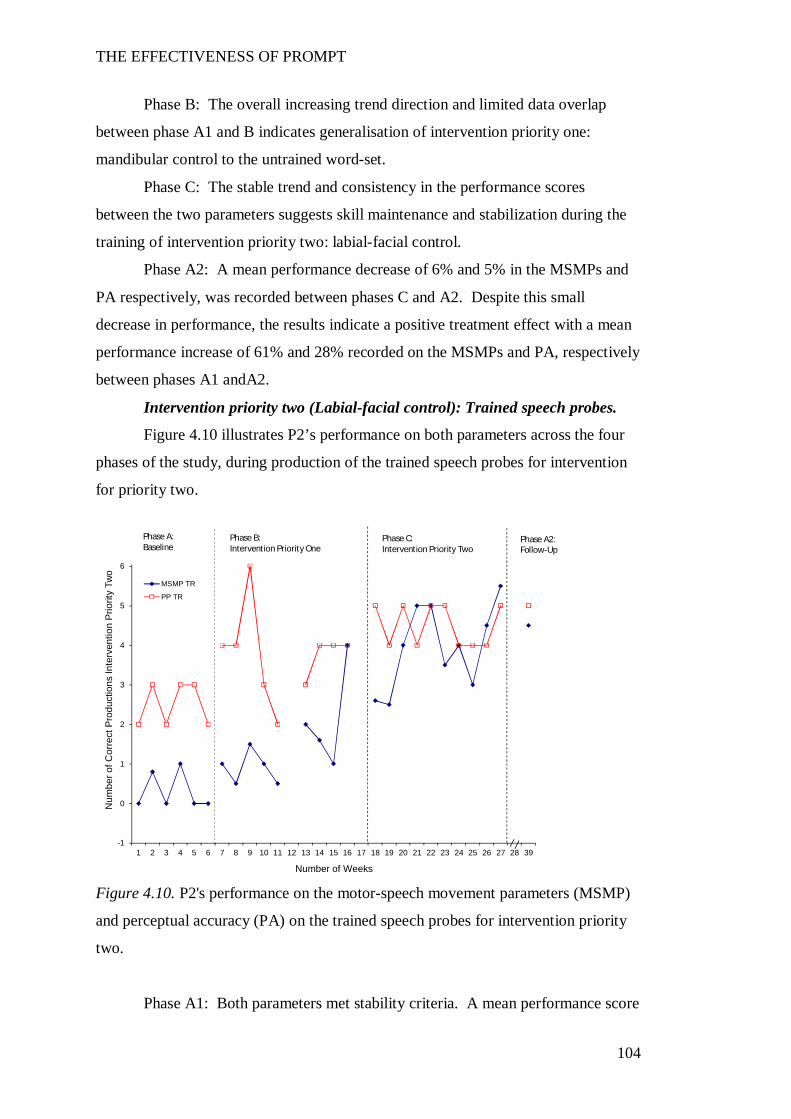
THE EFFECTIVENESS OF PROMPT
104
Phase B: The overall increasing trend direction and limited data overlap
between phase A1 and B indicates generalisation of intervention priority one:
mandibular control to the untrained word-set.
Phase C: The stable trend and consistency in the performance scores
between the two parameters suggests skill maintenance and stabilization during the
training of intervention priority two: labial-facial control.
Phase A2: A mean performance decrease of 6% and 5% in the MSMPs and
PA respectively, was recorded between phases C and A2. Despite this small
decrease in performance, the results indicate a positive treatment effect with a mean
performance increase of 61% and 28% recorded on the MSMPs and PA, respectively
between phases A1 andA2.
Intervention priority two (Labial-facial control): Trained speech probes.
Figure 4.10 illustrates P2’s performance on both parameters across the four
phases of the study, during production of the trained speech probes for intervention
for priority two.
Figure 4.10. P2's performance on the motor-speech movement parameters (MSMP)
and perceptual accuracy (PA) on the trained speech probes for intervention priority
two.
Phase A1: Both parameters met stability criteria. A mean performance score
-1
0
1
2
3
4
5
6
7
1 2 3 4 5 6 7 8 9 10 11 12 13 14 15 16 17 18 19 20 21 22 23 24 25 26 27 28 39
Num
ber o
f Cor
rect
Pro
duct
ions
Inte
rven
tion
Prio
rity
Two
Number of Weeks
MSMP TR
PP TR
Phase B:Intervention Priority One
Phase C:Intervention Priority Two
Phase A2:Follow-Up
Phase A:Baseline
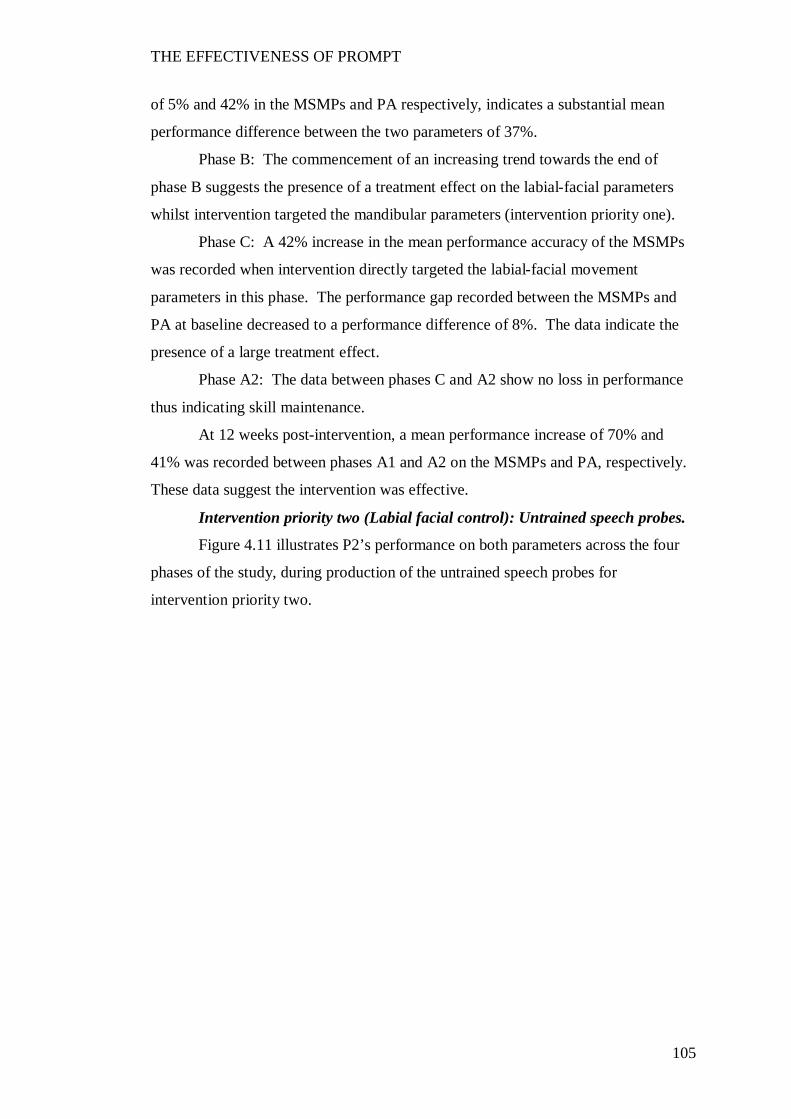
THE EFFECTIVENESS OF PROMPT
105
of 5% and 42% in the MSMPs and PA respectively, indicates a substantial mean
performance difference between the two parameters of 37%.
Phase B: The commencement of an increasing trend towards the end of
phase B suggests the presence of a treatment effect on the labial-facial parameters
whilst intervention targeted the mandibular parameters (intervention priority one).
Phase C: A 42% increase in the mean performance accuracy of the MSMPs
was recorded when intervention directly targeted the labial-facial movement
parameters in this phase. The performance gap recorded between the MSMPs and
PA at baseline decreased to a performance difference of 8%. The data indicate the
presence of a large treatment effect.
Phase A2: The data between phases C and A2 show no loss in performance
thus indicating skill maintenance.
At 12 weeks post-intervention, a mean performance increase of 70% and
41% was recorded between phases A1 and A2 on the MSMPs and PA, respectively.
These data suggest the intervention was effective.
Intervention priority two (Labial facial control): Untrained speech probes.
Figure 4.11 illustrates P2’s performance on both parameters across the four
phases of the study, during production of the untrained speech probes for
intervention priority two.
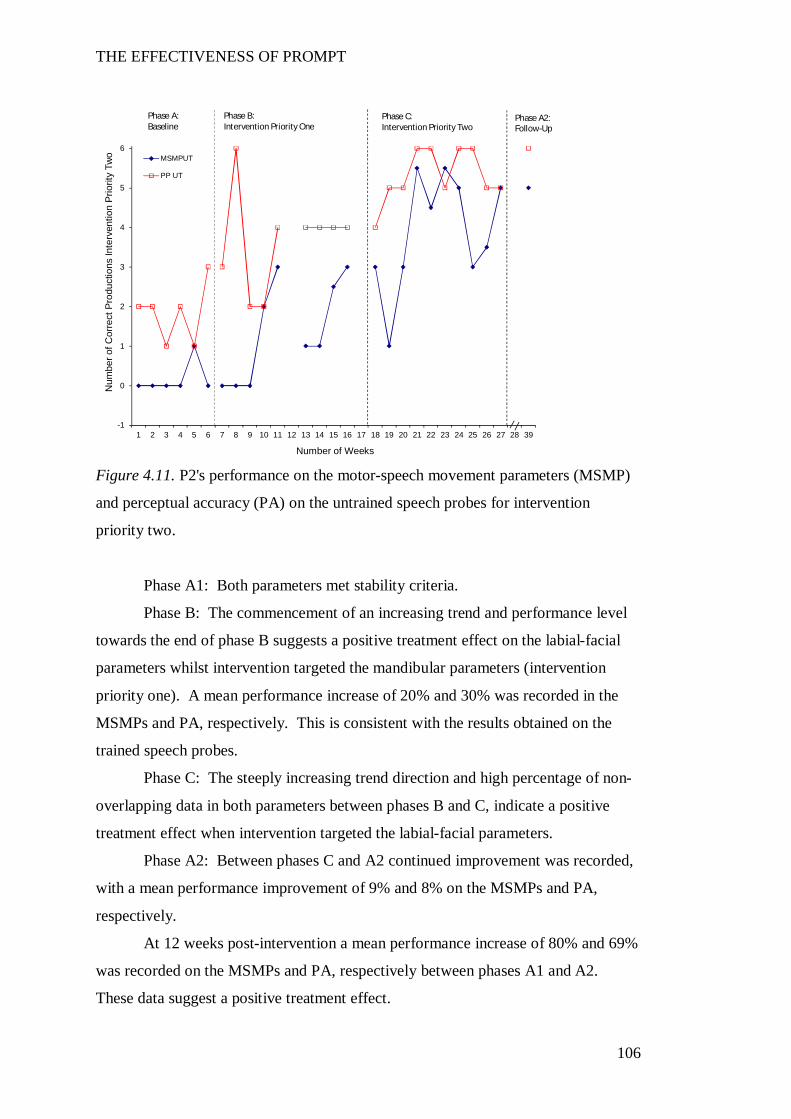
THE EFFECTIVENESS OF PROMPT
106
Figure 4.11. P2's performance on the motor-speech movement parameters (MSMP)
and perceptual accuracy (PA) on the untrained speech probes for intervention
priority two.
Phase A1: Both parameters met stability criteria.
Phase B: The commencement of an increasing trend and performance level
towards the end of phase B suggests a positive treatment effect on the labial-facial
parameters whilst intervention targeted the mandibular parameters (intervention
priority one). A mean performance increase of 20% and 30% was recorded in the
MSMPs and PA, respectively. This is consistent with the results obtained on the
trained speech probes.
Phase C: The steeply increasing trend direction and high percentage of non-
overlapping data in both parameters between phases B and C, indicate a positive
treatment effect when intervention targeted the labial-facial parameters.
Phase A2: Between phases C and A2 continued improvement was recorded,
with a mean performance improvement of 9% and 8% on the MSMPs and PA,
respectively.
At 12 weeks post-intervention a mean performance increase of 80% and 69%
was recorded on the MSMPs and PA, respectively between phases A1 and A2.
These data suggest a positive treatment effect.
-1
0
1
2
3
4
5
6
7
1 2 3 4 5 6 7 8 9 10 11 12 13 14 15 16 17 18 19 20 21 22 23 24 25 26 27 28 39
Num
ber o
f Cor
rect
Pro
duct
ions
Inte
rven
tion
Prio
rity
Two
Number of Weeks
MSMPUT
PP UT
Phase B:Intervention Priority One
Phase C:Intervention Priority Two
Phase A2:Follow-Up
Phase A:Baseline
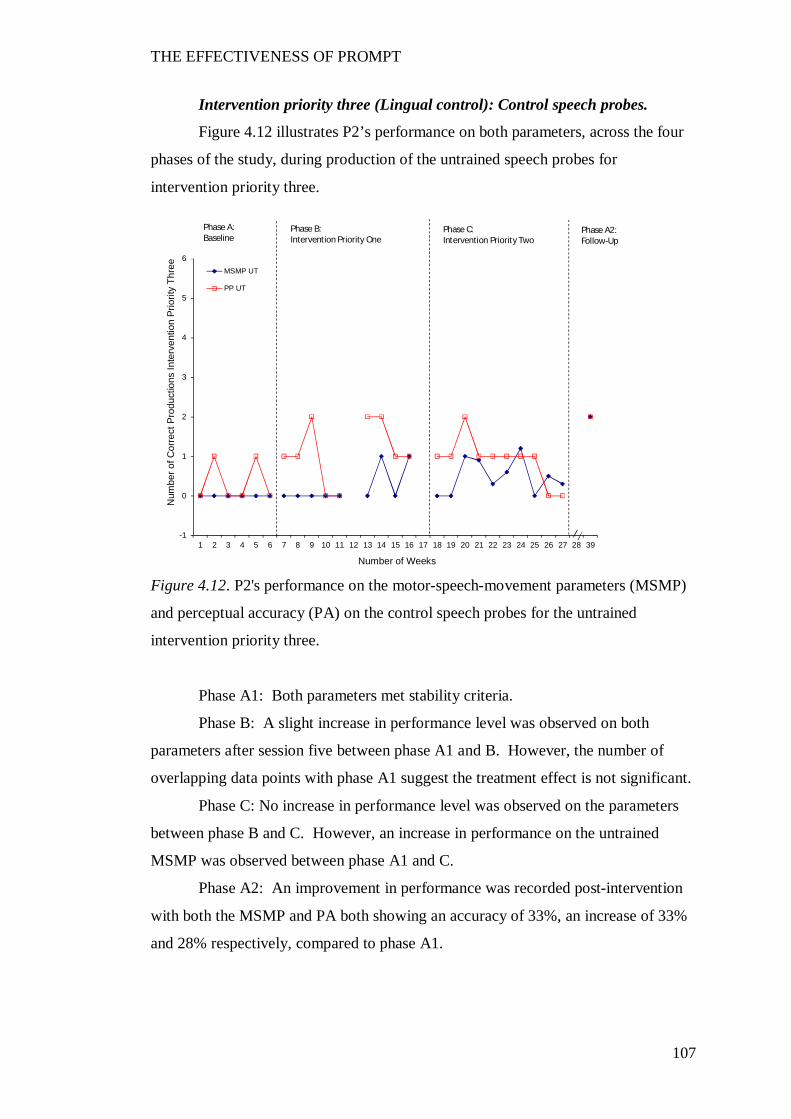
THE EFFECTIVENESS OF PROMPT
107
Intervention priority three (Lingual control): Control speech probes.
Figure 4.12 illustrates P2’s performance on both parameters, across the four
phases of the study, during production of the untrained speech probes for
intervention priority three.
Figure 4.12. P2's performance on the motor-speech-movement parameters (MSMP)
and perceptual accuracy (PA) on the control speech probes for the untrained
intervention priority three.
Phase A1: Both parameters met stability criteria.
Phase B: A slight increase in performance level was observed on both
parameters after session five between phase A1 and B. However, the number of
overlapping data points with phase A1 suggest the treatment effect is not significant.
Phase C: No increase in performance level was observed on the parameters
between phase B and C. However, an increase in performance on the untrained
MSMP was observed between phase A1 and C.
Phase A2: An improvement in performance was recorded post-intervention
with both the MSMP and PA both showing an accuracy of 33%, an increase of 33%
and 28% respectively, compared to phase A1.
-1
0
1
2
3
4
5
6
7
1 2 3 4 5 6 7 8 9 10 11 12 13 14 15 16 17 18 19 20 21 22 23 24 25 26 27 28 39
Num
ber o
f Cor
rect
Pro
duct
ions
Inte
rven
tion
Prio
rity
Thre
e
Number of Weeks
MSMP UT
PP UT
Phase B:Intervention Priority One
Phase C:Intervention Priority Two
Phase A2:Follow-Up
Phase A:Baseline
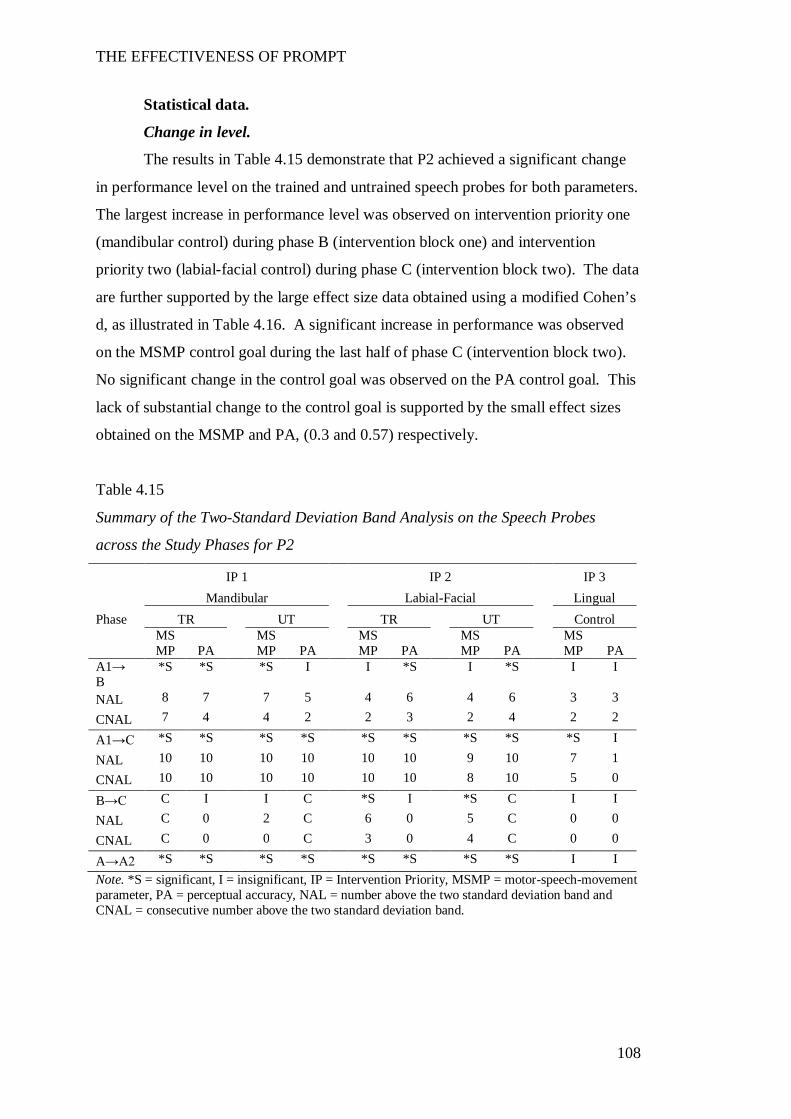
THE EFFECTIVENESS OF PROMPT
108
Statistical data.
Change in level.
The results in Table 4.15 demonstrate that P2 achieved a significant change
in performance level on the trained and untrained speech probes for both parameters.
The largest increase in performance level was observed on intervention priority one
(mandibular control) during phase B (intervention block one) and intervention
priority two (labial-facial control) during phase C (intervention block two). The data
are further supported by the large effect size data obtained using a modified Cohen’s
d, as illustrated in Table 4.16. A significant increase in performance was observed
on the MSMP control goal during the last half of phase C (intervention block two).
No significant change in the control goal was observed on the PA control goal. This
lack of substantial change to the control goal is supported by the small effect sizes
obtained on the MSMP and PA, (0.3 and 0.57) respectively.
Table 4.15
Summary of the Two-Standard Deviation Band Analysis on the Speech Probes
across the Study Phases for P2
IP 1 IP 2 IP 3 Mandibular Labial-Facial Lingual Phase TR UT TR UT Control
MSMP PA
MSMP PA
MSMP PA
MSMP PA
MSMP PA
A1→ B
*S *S *S I I *S I *S I I
NAL 8 7 7 5 4 6 4 6 3 3
CNAL 7 4 4 2 2 3 2 4 2 2
A1→C *S *S *S *S *S *S *S *S *S I
NAL 10 10 10 10 10 10 9 10 7 1
CNAL 10 10 10 10 10 10 8 10 5 0
B→C C I I C *S I *S C I I
NAL C 0 2 C 6 0 5 C 0 0
CNAL C 0 0 C 3 0 4 C 0 0
A→A2 *S *S *S *S *S *S *S *S I I Note. *S = significant, I = insignificant, IP = Intervention Priority, MSMP = motor-speech-movement parameter, PA = perceptual accuracy, NAL = number above the two standard deviation band and CNAL = consecutive number above the two standard deviation band.
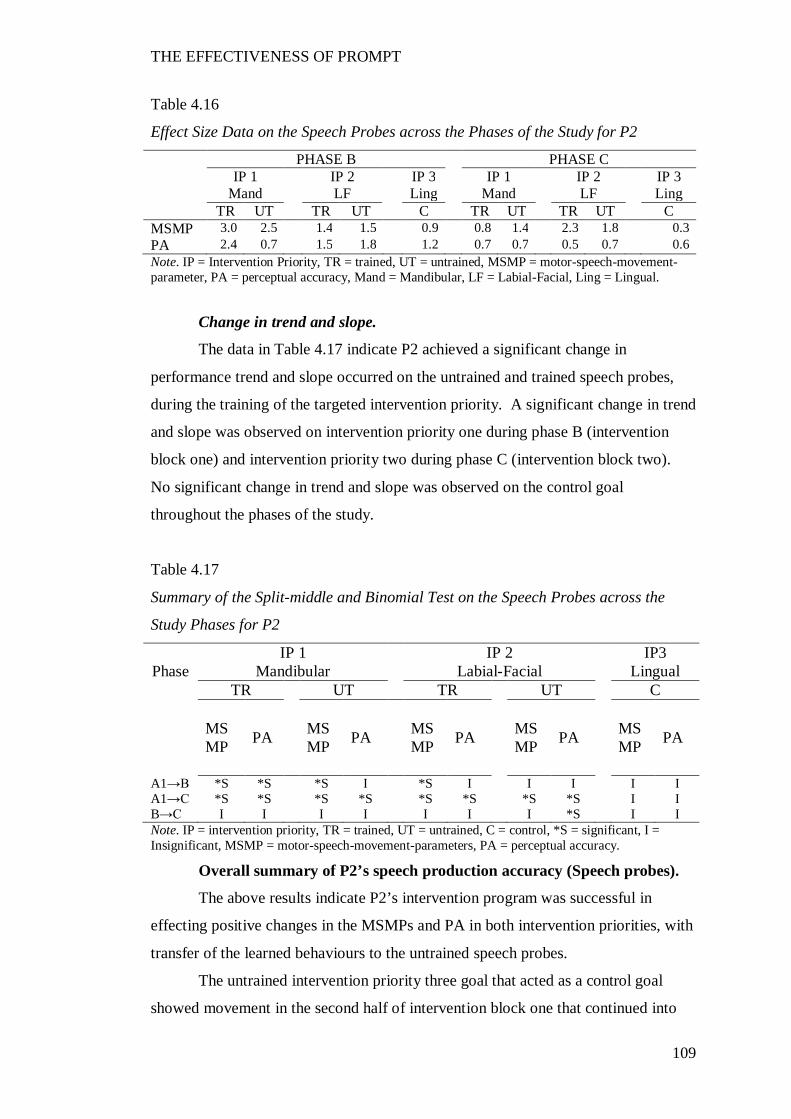
THE EFFECTIVENESS OF PROMPT
109
Table 4.16
Effect Size Data on the Speech Probes across the Phases of the Study for P2
PHASE B PHASE C IP 1 IP 2 IP 3 IP 1 IP 2 IP 3 Mand LF Ling Mand LF Ling TR UT TR UT C TR UT TR UT C MSMP 3.0 2.5 1.4 1.5 0.9 0.8 1.4 2.3 1.8 0.3 PA 2.4 0.7 1.5 1.8 1.2 0.7 0.7 0.5 0.7 0.6 Note. IP = Intervention Priority, TR = trained, UT = untrained, MSMP = motor-speech-movement-parameter, PA = perceptual accuracy, Mand = Mandibular, LF = Labial-Facial, Ling = Lingual.
Change in trend and slope.
The data in Table 4.17 indicate P2 achieved a significant change in
performance trend and slope occurred on the untrained and trained speech probes,
during the training of the targeted intervention priority. A significant change in trend
and slope was observed on intervention priority one during phase B (intervention
block one) and intervention priority two during phase C (intervention block two).
No significant change in trend and slope was observed on the control goal
throughout the phases of the study.
Table 4.17
Summary of the Split-middle and Binomial Test on the Speech Probes across the
Study Phases for P2
IP 1 IP 2 IP3 Phase Mandibular Labial-Facial Lingual
TR UT TR UT C
MSMP PA MS
MP PA MSMP PA MS
MP PA MSMP PA
A1→B *S *S *S I *S I I I I I A1→C *S *S *S *S *S *S *S *S I I B→C I I I I I I I *S I I Note. IP = intervention priority, TR = trained, UT = untrained, C = control, *S = significant, I = Insignificant, MSMP = motor-speech-movement-parameters, PA = perceptual accuracy.
Overall summary of P2’s speech production accuracy (Speech probes).
The above results indicate P2’s intervention program was successful in
effecting positive changes in the MSMPs and PA in both intervention priorities, with
transfer of the learned behaviours to the untrained speech probes.
The untrained intervention priority three goal that acted as a control goal
showed movement in the second half of intervention block one that continued into
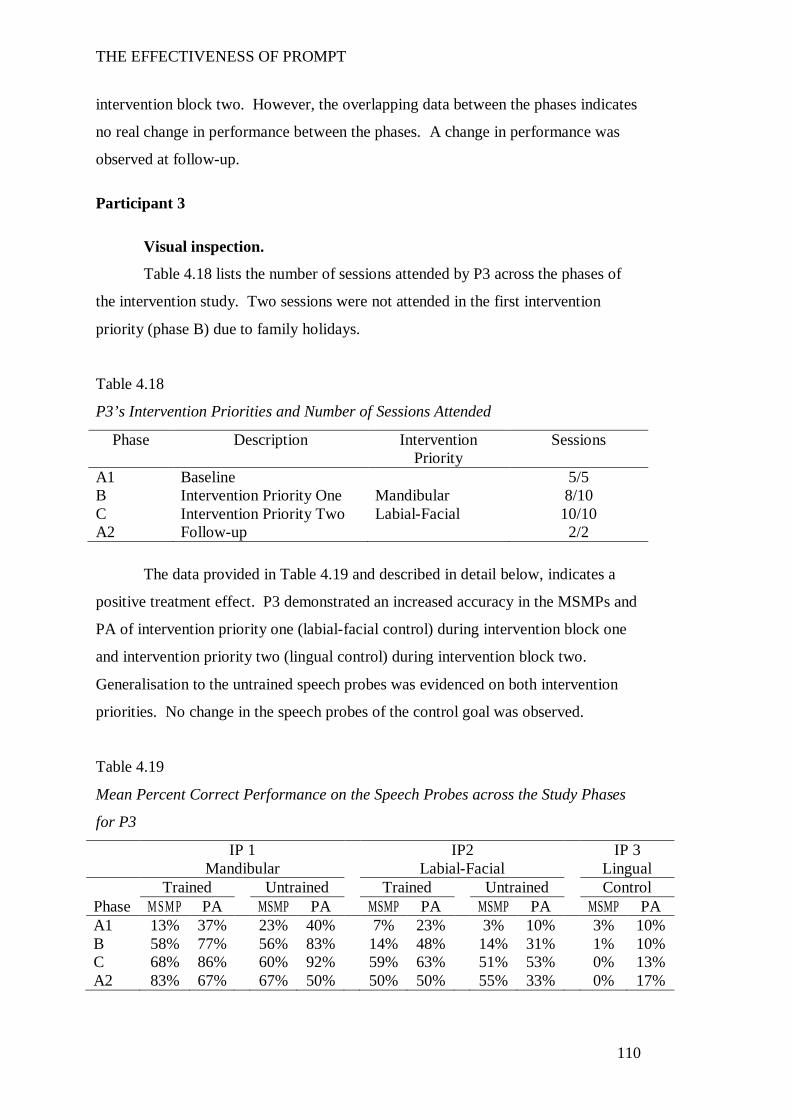
THE EFFECTIVENESS OF PROMPT
110
intervention block two. However, the overlapping data between the phases indicates
no real change in performance between the phases. A change in performance was
observed at follow-up.
Participant 3
Visual inspection.
Table 4.18 lists the number of sessions attended by P3 across the phases of
the intervention study. Two sessions were not attended in the first intervention
priority (phase B) due to family holidays.
Table 4.18
P3’s Intervention Priorities and Number of Sessions Attended
Phase Description Intervention Priority
Sessions
A1 Baseline 5/5 B Intervention Priority One Mandibular 8/10 C Intervention Priority Two Labial-Facial 10/10 A2 Follow-up 2/2
The data provided in Table 4.19 and described in detail below, indicates a
positive treatment effect. P3 demonstrated an increased accuracy in the MSMPs and
PA of intervention priority one (labial-facial control) during intervention block one
and intervention priority two (lingual control) during intervention block two.
Generalisation to the untrained speech probes was evidenced on both intervention
priorities. No change in the speech probes of the control goal was observed.
Table 4.19
Mean Percent Correct Performance on the Speech Probes across the Study Phases
for P3
IP 1 IP2 IP 3 Mandibular Labial-Facial Lingual Trained Untrained Trained Untrained Control Phase M SM P PA MSMP PA MSMP PA MSMP PA MSMP PA A1 13% 37% 23% 40% 7% 23% 3% 10% 3% 10% B 58% 77% 56% 83% 14% 48% 14% 31% 1% 10% C 68% 86% 60% 92% 59% 63% 51% 53% 0% 13% A2 83% 67% 67% 50% 50% 50% 55% 33% 0% 17%
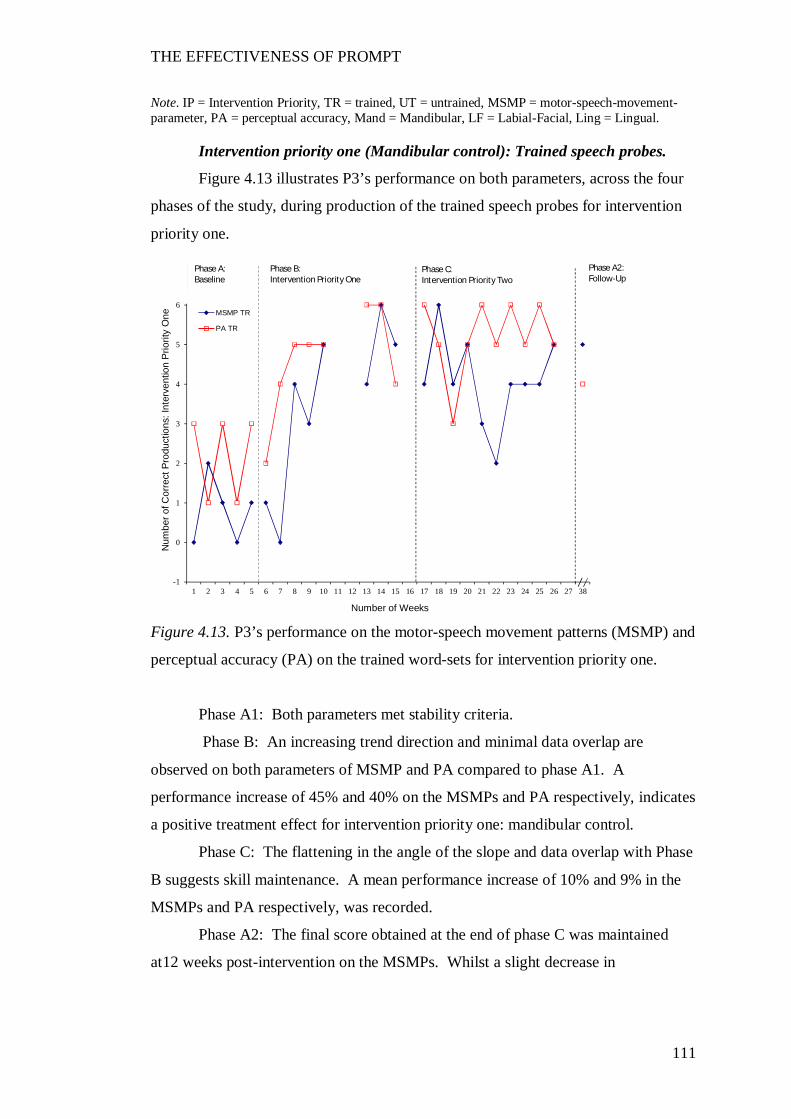
THE EFFECTIVENESS OF PROMPT
111
Note. IP = Intervention Priority, TR = trained, UT = untrained, MSMP = motor-speech-movement-parameter, PA = perceptual accuracy, Mand = Mandibular, LF = Labial-Facial, Ling = Lingual.
Intervention priority one (Mandibular control): Trained speech probes.
Figure 4.13 illustrates P3’s performance on both parameters, across the four
phases of the study, during production of the trained speech probes for intervention
priority one.
Figure 4.13. P3’s performance on the motor-speech movement patterns (MSMP) and
perceptual accuracy (PA) on the trained word-sets for intervention priority one.
Phase A1: Both parameters met stability criteria.
Phase B: An increasing trend direction and minimal data overlap are
observed on both parameters of MSMP and PA compared to phase A1. A
performance increase of 45% and 40% on the MSMPs and PA respectively, indicates
a positive treatment effect for intervention priority one: mandibular control.
Phase C: The flattening in the angle of the slope and data overlap with Phase
B suggests skill maintenance. A mean performance increase of 10% and 9% in the
MSMPs and PA respectively, was recorded.
Phase A2: The final score obtained at the end of phase C was maintained
at12 weeks post-intervention on the MSMPs. Whilst a slight decrease in
-1
0
1
2
3
4
5
6
7
1 2 3 4 5 6 7 8 9 10 11 12 13 14 15 16 17 18 19 20 21 22 23 24 25 26 27 38
Num
ber o
f Cor
rect
Pro
duct
ions
: Int
erve
ntio
n Pr
iorit
y O
ne
Number of Weeks
MSMP TR
PA TR
Phase B:Intervention Priority One
Phase C:Intervention Priority Two
Phase A2:Follow-Up
Phase A:Baseline
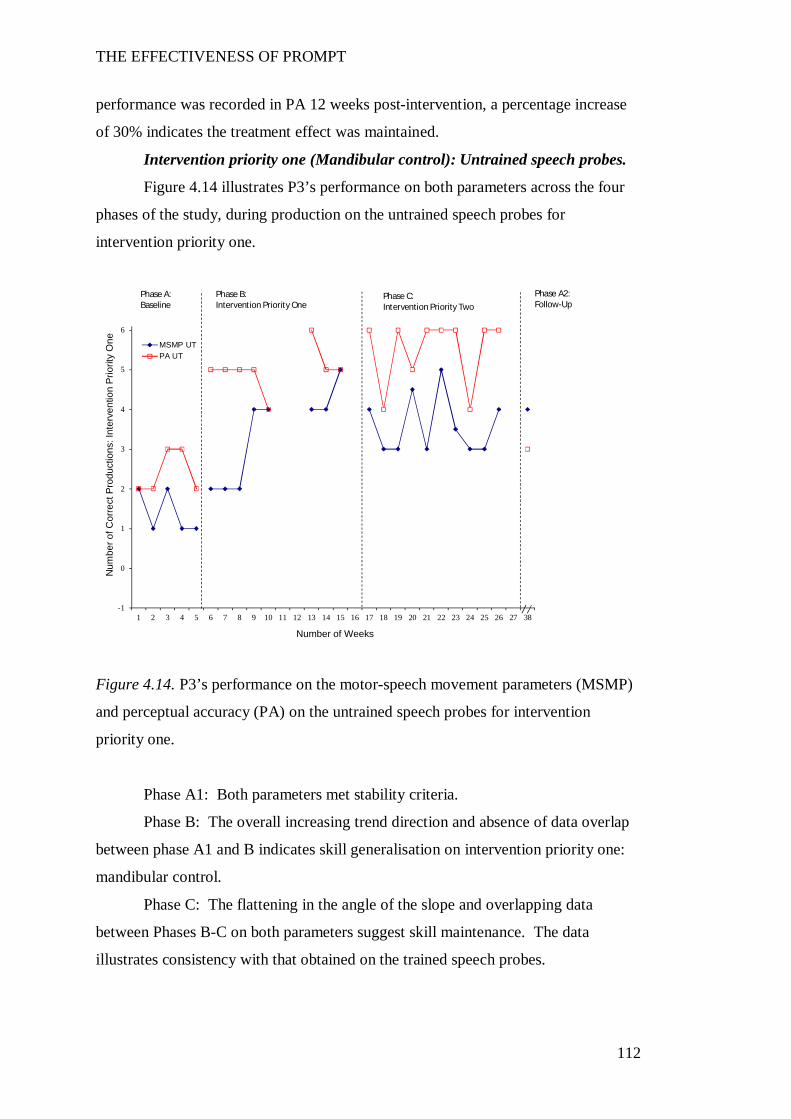
THE EFFECTIVENESS OF PROMPT
112
performance was recorded in PA 12 weeks post-intervention, a percentage increase
of 30% indicates the treatment effect was maintained.
Intervention priority one (Mandibular control): Untrained speech probes.
Figure 4.14 illustrates P3’s performance on both parameters across the four
phases of the study, during production on the untrained speech probes for
intervention priority one.
Figure 4.14. P3’s performance on the motor-speech movement parameters (MSMP)
and perceptual accuracy (PA) on the untrained speech probes for intervention
priority one.
Phase A1: Both parameters met stability criteria.
Phase B: The overall increasing trend direction and absence of data overlap
between phase A1 and B indicates skill generalisation on intervention priority one:
mandibular control.
Phase C: The flattening in the angle of the slope and overlapping data
between Phases B-C on both parameters suggest skill maintenance. The data
illustrates consistency with that obtained on the trained speech probes.
-1
0
1
2
3
4
5
6
7
1 2 3 4 5 6 7 8 9 10 11 12 13 14 15 16 17 18 19 20 21 22 23 24 25 26 27 38
Num
ber o
f Cor
rect
Pro
duct
ions
: Int
erve
ntio
n Pr
iorit
y O
ne
Number of Weeks
MSMP UTPA UT
Phase B:Intervention Priority One
Phase C:Intervention Priority Two
Phase A2:Follow-Up
Phase A:Baseline
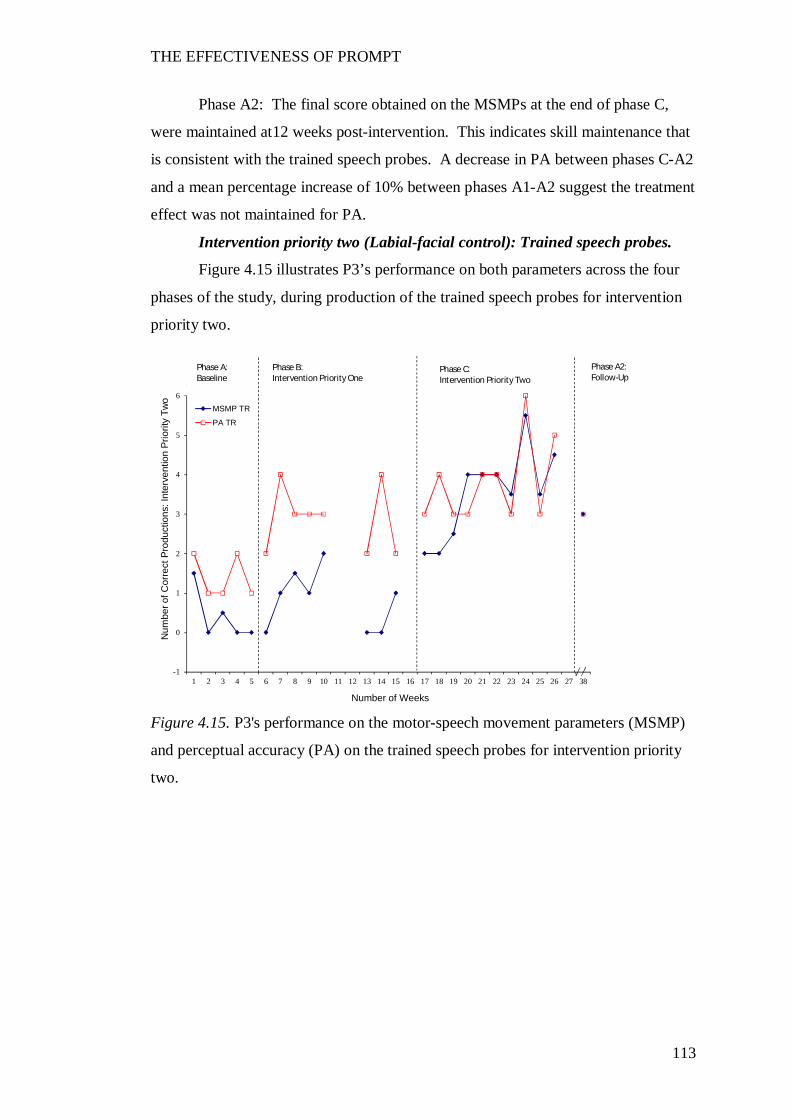
THE EFFECTIVENESS OF PROMPT
113
Phase A2: The final score obtained on the MSMPs at the end of phase C,
were maintained at12 weeks post-intervention. This indicates skill maintenance that
is consistent with the trained speech probes. A decrease in PA between phases C-A2
and a mean percentage increase of 10% between phases A1-A2 suggest the treatment
effect was not maintained for PA.
Intervention priority two (Labial-facial control): Trained speech probes.
Figure 4.15 illustrates P3’s performance on both parameters across the four
phases of the study, during production of the trained speech probes for intervention
priority two.
Figure 4.15. P3's performance on the motor-speech movement parameters (MSMP)
and perceptual accuracy (PA) on the trained speech probes for intervention priority
two.
-1
0
1
2
3
4
5
6
7
1 2 3 4 5 6 7 8 9 10 11 12 13 14 15 16 17 18 19 20 21 22 23 24 25 26 27 38
Num
ber o
f Cor
rect
Pro
duct
ions
: Int
erve
ntio
n Pr
iorit
y Tw
o
Number of Weeks
MSMP TR
PA TR
Phase B:Intervention Priority One
Phase C:Intervention Priority Two
Phase A2:Follow-Up
Phase A:Baseline
THE EFFECTIVENESS OF PROMPT
114
Phase A1: Both parameters met stability criteria.
Phase B: An increasing trend direction and absence of overlapping data
points in the PA data, suggests the training of the first intervention priority
(mandibular control) had a significant effect on the PA of the second intervention
priority (labial-facial control) during phase B. No real change was recorded in the
MSMPs.
Phase C: The change to a steadily increasing trend and absence of
overlapping data points indicate a positive treatment effect on the MSMPS during
the training of intervention priority two: labial-facial control. A mean performance
increase of 15% between phases B-C was recorded in PA. Synchrony in the
accuracy of the MSMPs and PA is observed in the final six sessions of this phase.
Phase A2: At 12 weeks post-intervention a mean percentage score of 50%
was recorded on both parameters. These results indicate a mean performance
increase between phases A1-A2 of 43% and 27% in the MSMPs and PA,
respectively. These results suggest a positive treatment effect.
Intervention priority two (Labial facial): Untrained speech probes.
Figure 4.16 illustrates P3’s performance on the parameters across the four
phases of the study, during production of the untrained speech probes for
intervention priority two.
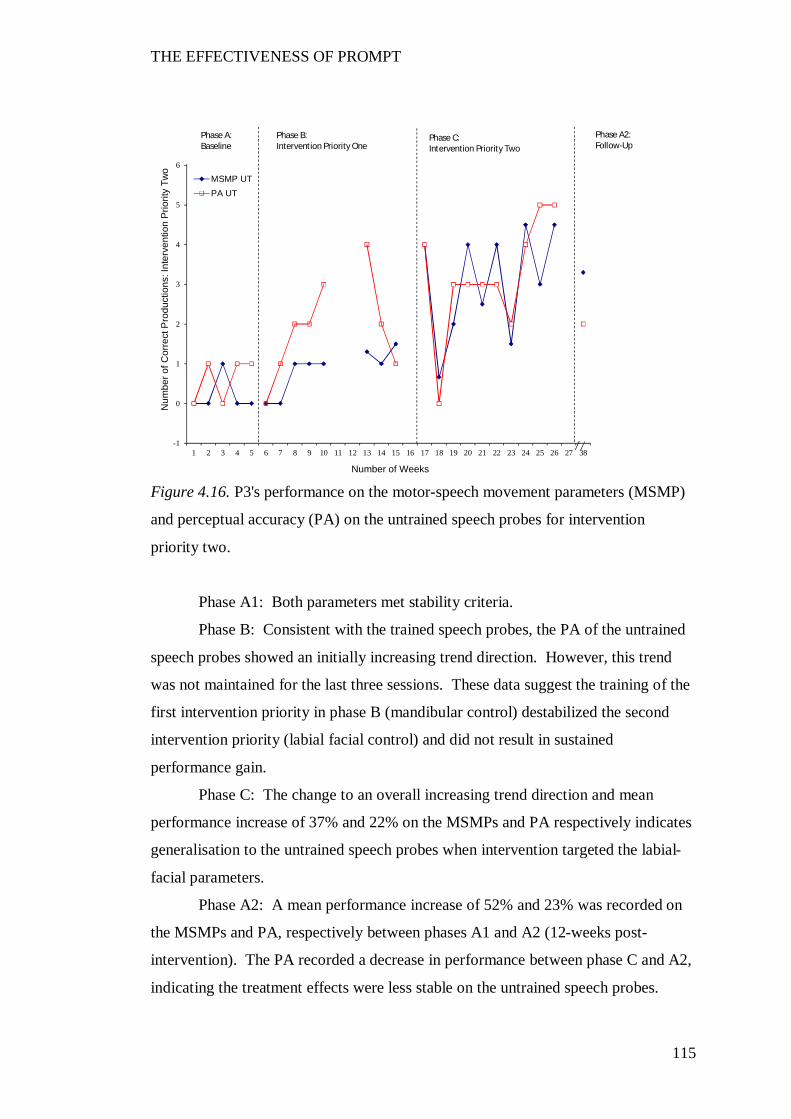
THE EFFECTIVENESS OF PROMPT
115
Figure 4.16. P3's performance on the motor-speech movement parameters (MSMP)
and perceptual accuracy (PA) on the untrained speech probes for intervention
priority two.
Phase A1: Both parameters met stability criteria.
Phase B: Consistent with the trained speech probes, the PA of the untrained
speech probes showed an initially increasing trend direction. However, this trend
was not maintained for the last three sessions. These data suggest the training of the
first intervention priority in phase B (mandibular control) destabilized the second
intervention priority (labial facial control) and did not result in sustained
performance gain.
Phase C: The change to an overall increasing trend direction and mean
performance increase of 37% and 22% on the MSMPs and PA respectively indicates
generalisation to the untrained speech probes when intervention targeted the labial-
facial parameters.
Phase A2: A mean performance increase of 52% and 23% was recorded on
the MSMPs and PA, respectively between phases A1 and A2 (12-weeks post-
intervention). The PA recorded a decrease in performance between phase C and A2,
indicating the treatment effects were less stable on the untrained speech probes.
-1
0
1
2
3
4
5
6
7
1 2 3 4 5 6 7 8 9 10 11 12 13 14 15 16 17 18 19 20 21 22 23 24 25 26 27 38
Num
ber o
f Cor
rect
Pro
duct
ions
: Int
erve
ntio
n Pr
iorit
y Tw
o
Number of Weeks
MSMP UTPA UT
Phase B:Intervention Priority One
Phase C:Intervention Priority Two
Phase A2:Follow-Up
Phase A:Baseline
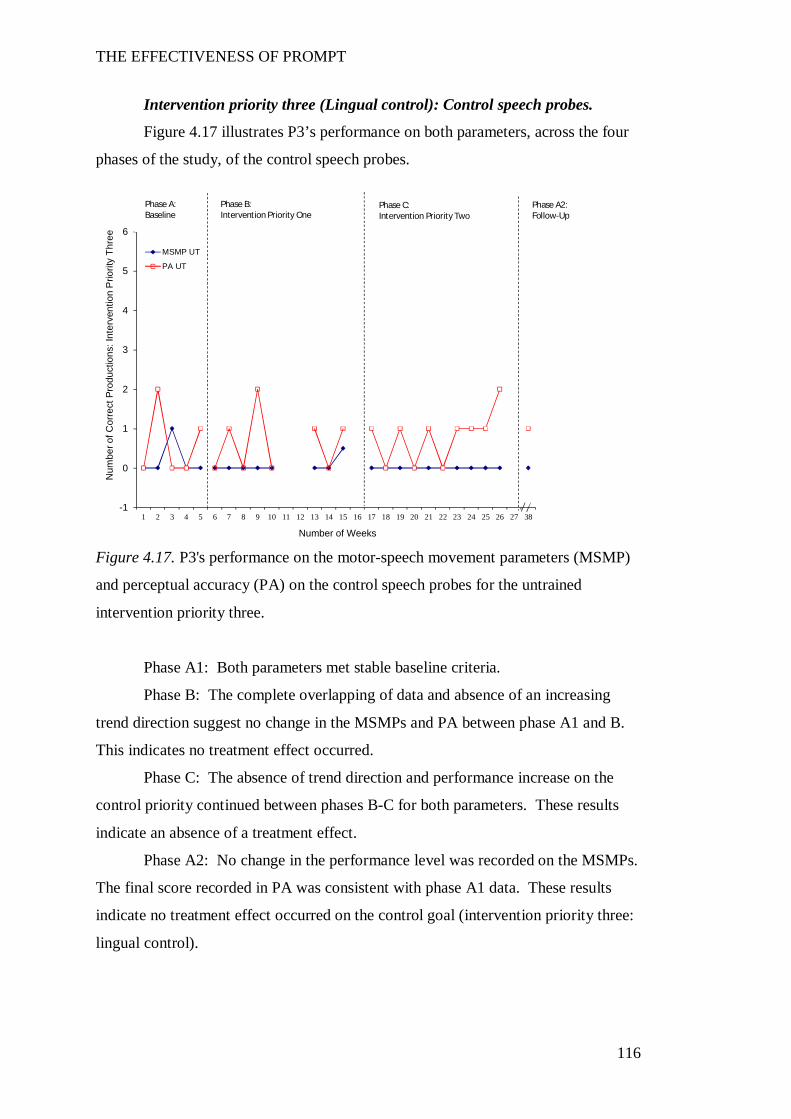
THE EFFECTIVENESS OF PROMPT
116
Intervention priority three (Lingual control): Control speech probes.
Figure 4.17 illustrates P3’s performance on both parameters, across the four
phases of the study, of the control speech probes.
Figure 4.17. P3's performance on the motor-speech movement parameters (MSMP)
and perceptual accuracy (PA) on the control speech probes for the untrained
intervention priority three.
Phase A1: Both parameters met stable baseline criteria.
Phase B: The complete overlapping of data and absence of an increasing
trend direction suggest no change in the MSMPs and PA between phase A1 and B.
This indicates no treatment effect occurred.
Phase C: The absence of trend direction and performance increase on the
control priority continued between phases B-C for both parameters. These results
indicate an absence of a treatment effect.
Phase A2: No change in the performance level was recorded on the MSMPs.
The final score recorded in PA was consistent with phase A1 data. These results
indicate no treatment effect occurred on the control goal (intervention priority three:
lingual control).
-1
0
1
2
3
4
5
6
7
1 2 3 4 5 6 7 8 9 10 11 12 13 14 15 16 17 18 19 20 21 22 23 24 25 26 27 38
Num
ber o
f Cor
rect
Pro
duct
ions
: Int
erve
ntio
n P
riorit
y Th
ree
Number of Weeks
MSMP UT
PA UT
Phase B:Intervention Priority One
Phase C:Intervention Priority Two
Phase A2:Follow-Up
Phase A:Baseline
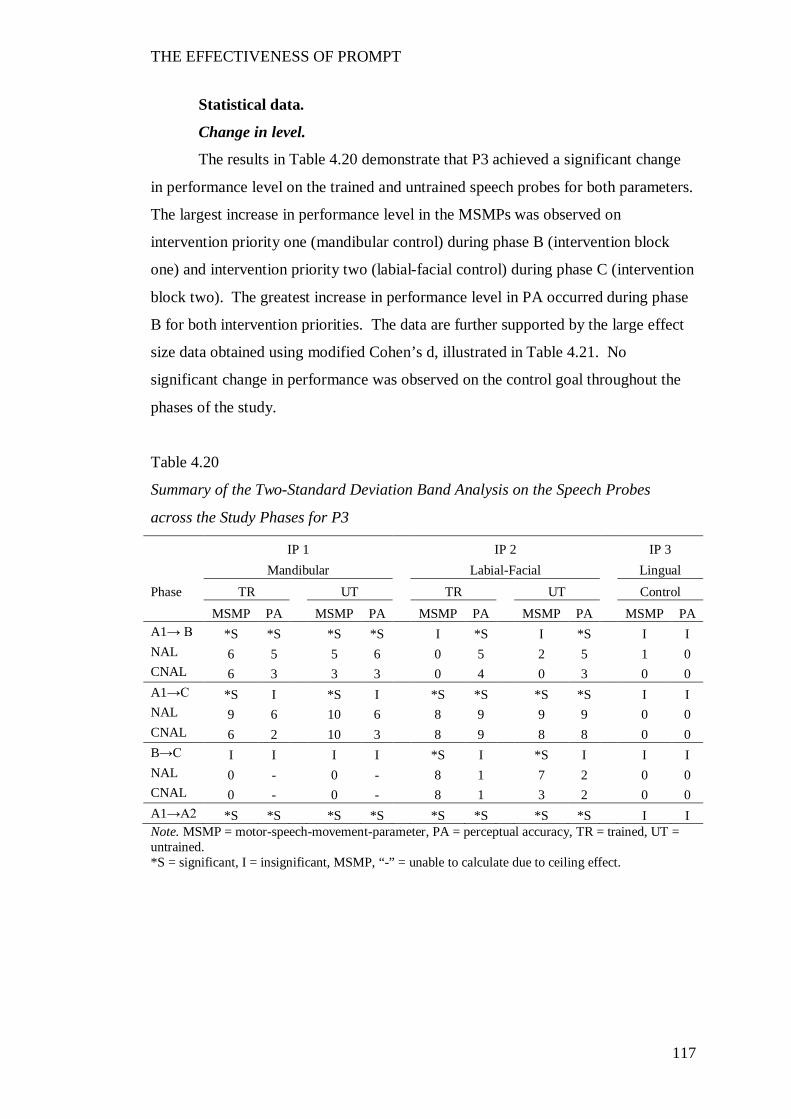
THE EFFECTIVENESS OF PROMPT
117
Statistical data.
Change in level.
The results in Table 4.20 demonstrate that P3 achieved a significant change
in performance level on the trained and untrained speech probes for both parameters.
The largest increase in performance level in the MSMPs was observed on
intervention priority one (mandibular control) during phase B (intervention block
one) and intervention priority two (labial-facial control) during phase C (intervention
block two). The greatest increase in performance level in PA occurred during phase
B for both intervention priorities. The data are further supported by the large effect
size data obtained using modified Cohen’s d, illustrated in Table 4.21. No
significant change in performance was observed on the control goal throughout the
phases of the study.
Table 4.20
Summary of the Two-Standard Deviation Band Analysis on the Speech Probes
across the Study Phases for P3
IP 1 IP 2 IP 3 Mandibular Labial-Facial Lingual Phase TR UT TR UT Control MSMP PA MSMP PA MSMP PA MSMP PA MSMP PA A1→ B *S *S *S *S I *S I *S I I NAL 6 5 5 6 0 5 2 5 1 0 CNAL 6 3 3 3 0 4 0 3 0 0 A1→C *S I *S I *S *S *S *S I I NAL 9 6 10 6 8 9 9 9 0 0 CNAL 6 2 10 3 8 9 8 8 0 0 B→C I I I I *S I *S I I I NAL 0 - 0 - 8 1 7 2 0 0 CNAL 0 - 0 - 8 1 3 2 0 0 A1→A2 *S *S *S *S *S *S *S *S I I Note. MSMP = motor-speech-movement-parameter, PA = perceptual accuracy, TR = trained, UT = untrained. *S = significant, I = insignificant, MSMP, “-” = unable to calculate due to ceiling effect.
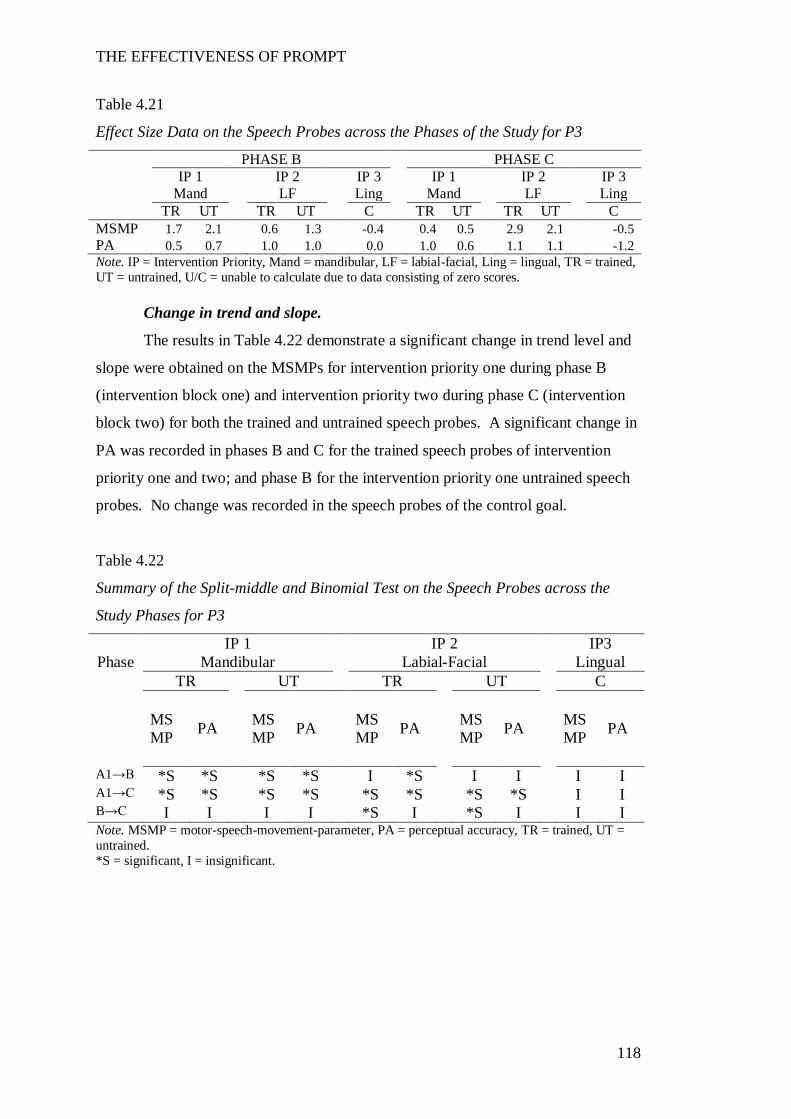
THE EFFECTIVENESS OF PROMPT
118
Table 4.21
Effect Size Data on the Speech Probes across the Phases of the Study for P3
PHASE B PHASE C IP 1 IP 2 IP 3 IP 1 IP 2 IP 3 Mand LF Ling Mand LF Ling TR UT TR UT C TR UT TR UT C MSMP 1.7 2.1 0.6 1.3 -0.4 0.4 0.5 2.9 2.1 -0.5 PA 0.5 0.7 1.0 1.0 0.0 1.0 0.6 1.1 1.1 -1.2 Note. IP = Intervention Priority, Mand = mandibular, LF = labial-facial, Ling = lingual, TR = trained, UT = untrained, U/C = unable to calculate due to data consisting of zero scores.
Change in trend and slope.
The results in Table 4.22 demonstrate a significant change in trend level and
slope were obtained on the MSMPs for intervention priority one during phase B
(intervention block one) and intervention priority two during phase C (intervention
block two) for both the trained and untrained speech probes. A significant change in
PA was recorded in phases B and C for the trained speech probes of intervention
priority one and two; and phase B for the intervention priority one untrained speech
probes. No change was recorded in the speech probes of the control goal.
Table 4.22
Summary of the Split-middle and Binomial Test on the Speech Probes across the
Study Phases for P3
IP 1 IP 2 IP3 Phase Mandibular Labial-Facial Lingual
TR UT TR UT C
MSMP PA MS
MP PA MSMP PA MS
MP PA MSMP PA
A1→B *S *S *S *S I *S I I I I A1→C *S *S *S *S *S *S *S *S I I B→C I I I I *S I *S I I I Note. MSMP = motor-speech-movement-parameter, PA = perceptual accuracy, TR = trained, UT = untrained. *S = significant, I = insignificant.
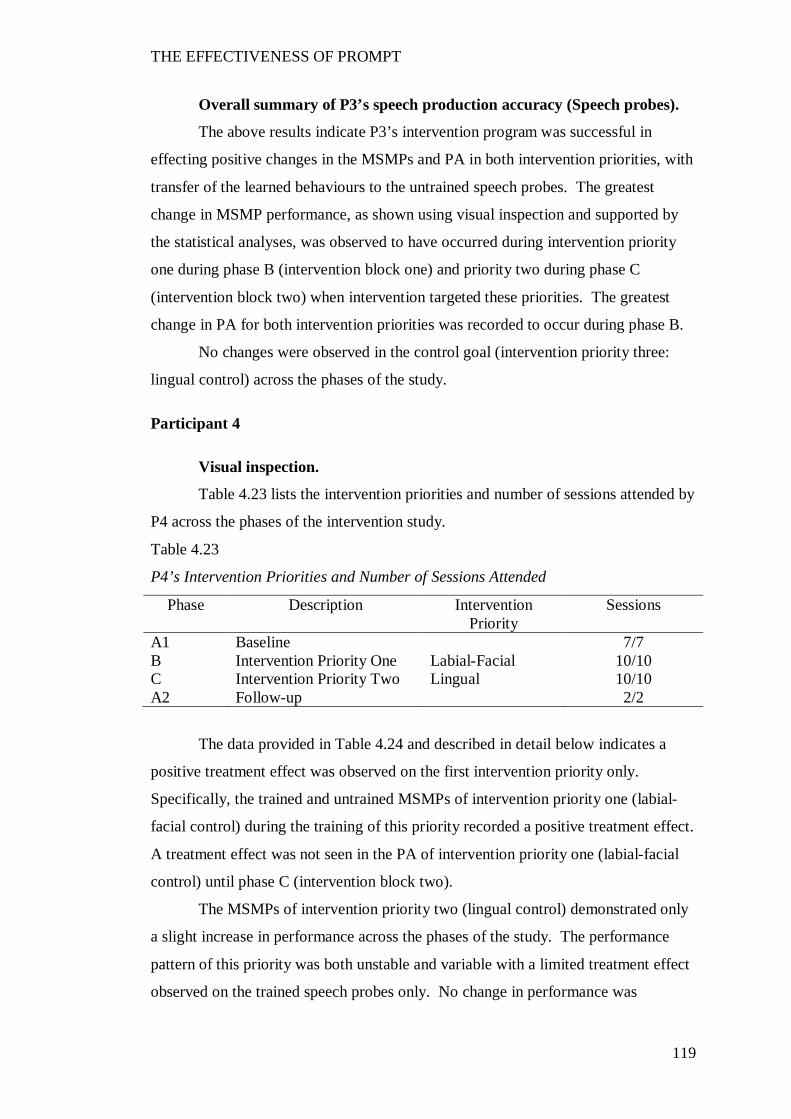
THE EFFECTIVENESS OF PROMPT
119
Overall summary of P3’s speech production accuracy (Speech probes).
The above results indicate P3’s intervention program was successful in
effecting positive changes in the MSMPs and PA in both intervention priorities, with
transfer of the learned behaviours to the untrained speech probes. The greatest
change in MSMP performance, as shown using visual inspection and supported by
the statistical analyses, was observed to have occurred during intervention priority
one during phase B (intervention block one) and priority two during phase C
(intervention block two) when intervention targeted these priorities. The greatest
change in PA for both intervention priorities was recorded to occur during phase B.
No changes were observed in the control goal (intervention priority three:
lingual control) across the phases of the study.
Participant 4
Visual inspection.
Table 4.23 lists the intervention priorities and number of sessions attended by
P4 across the phases of the intervention study.
Table 4.23
P4’s Intervention Priorities and Number of Sessions Attended
Phase Description Intervention Priority
Sessions
A1 Baseline 7/7 B Intervention Priority One Labial-Facial 10/10 C Intervention Priority Two Lingual 10/10 A2 Follow-up 2/2
The data provided in Table 4.24 and described in detail below indicates a
positive treatment effect was observed on the first intervention priority only.
Specifically, the trained and untrained MSMPs of intervention priority one (labial-
facial control) during the training of this priority recorded a positive treatment effect.
A treatment effect was not seen in the PA of intervention priority one (labial-facial
control) until phase C (intervention block two).
The MSMPs of intervention priority two (lingual control) demonstrated only
a slight increase in performance across the phases of the study. The performance
pattern of this priority was both unstable and variable with a limited treatment effect
observed on the trained speech probes only. No change in performance was
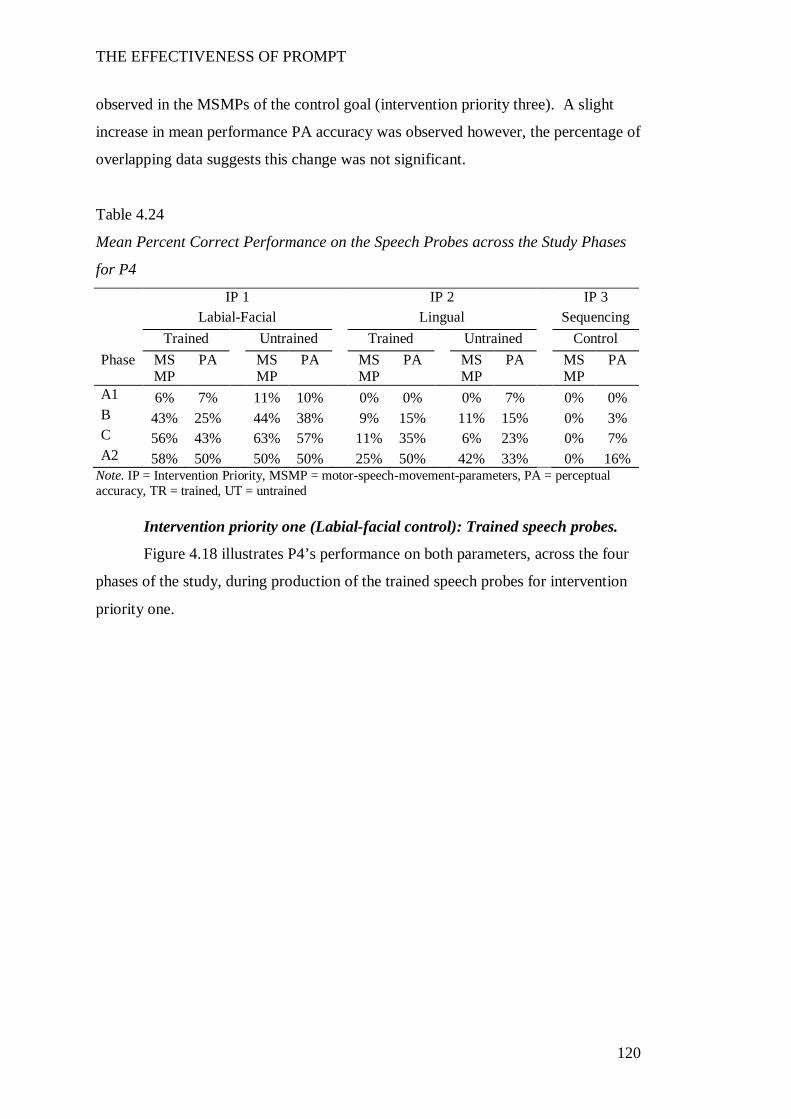
THE EFFECTIVENESS OF PROMPT
120
observed in the MSMPs of the control goal (intervention priority three). A slight
increase in mean performance PA accuracy was observed however, the percentage of
overlapping data suggests this change was not significant.
Table 4.24
Mean Percent Correct Performance on the Speech Probes across the Study Phases
for P4
IP 1 IP 2 IP 3 Labial-Facial Lingual Sequencing Trained Untrained Trained Untrained Control Phase MS
MP PA MS
MP PA MS
MP PA MS
MP PA MS
MP PA
A1 6% 7% 11% 10% 0% 0% 0% 7% 0% 0% B 43% 25% 44% 38% 9% 15% 11% 15% 0% 3% C 56% 43% 63% 57% 11% 35% 6% 23% 0% 7% A2 58% 50% 50% 50% 25% 50% 42% 33% 0% 16%
Note. IP = Intervention Priority, MSMP = motor-speech-movement-parameters, PA = perceptual accuracy, TR = trained, UT = untrained
Intervention priority one (Labial-facial control): Trained speech probes.
Figure 4.18 illustrates P4’s performance on both parameters, across the four
phases of the study, during production of the trained speech probes for intervention
priority one.
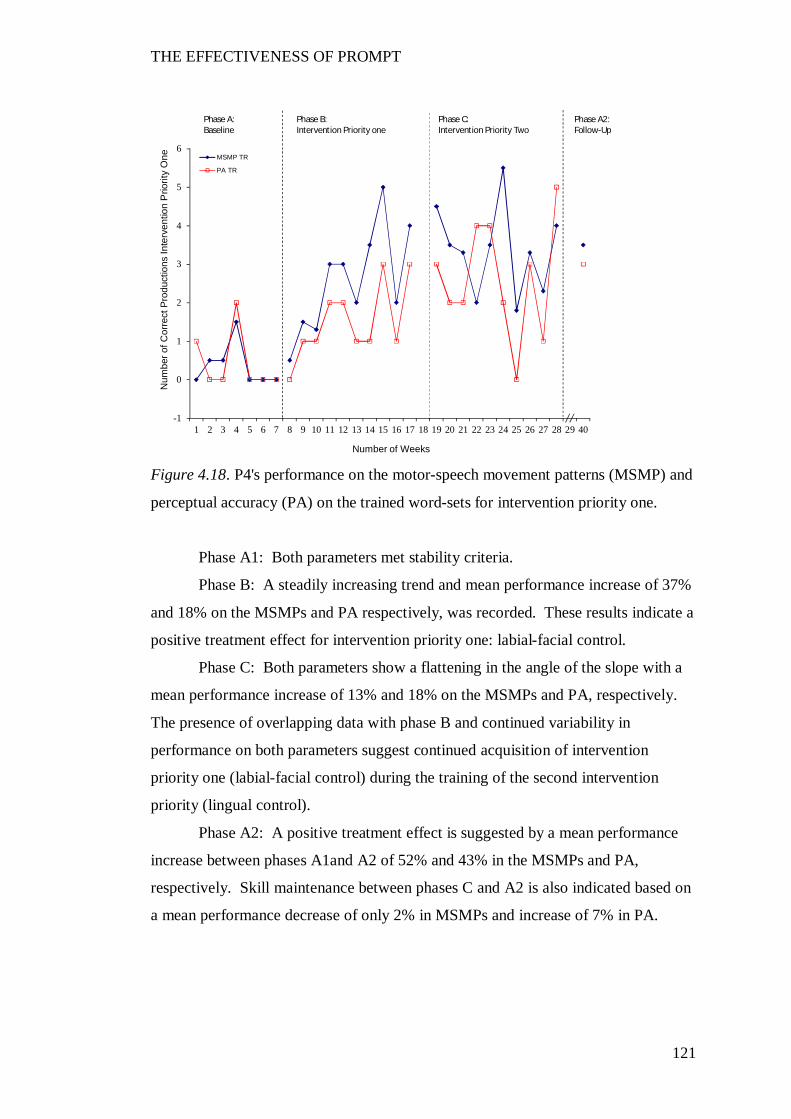
THE EFFECTIVENESS OF PROMPT
121
Figure 4.18. P4's performance on the motor-speech movement patterns (MSMP) and
perceptual accuracy (PA) on the trained word-sets for intervention priority one.
Phase A1: Both parameters met stability criteria.
Phase B: A steadily increasing trend and mean performance increase of 37%
and 18% on the MSMPs and PA respectively, was recorded. These results indicate a
positive treatment effect for intervention priority one: labial-facial control.
Phase C: Both parameters show a flattening in the angle of the slope with a
mean performance increase of 13% and 18% on the MSMPs and PA, respectively.
The presence of overlapping data with phase B and continued variability in
performance on both parameters suggest continued acquisition of intervention
priority one (labial-facial control) during the training of the second intervention
priority (lingual control).
Phase A2: A positive treatment effect is suggested by a mean performance
increase between phases A1and A2 of 52% and 43% in the MSMPs and PA,
respectively. Skill maintenance between phases C and A2 is also indicated based on
a mean performance decrease of only 2% in MSMPs and increase of 7% in PA.
-1
0
1
2
3
4
5
6
7
1 2 3 4 5 6 7 8 9 10 11 12 13 14 15 16 17 18 19 20 21 22 23 24 25 26 27 28 29 40
Num
ber o
f Cor
rect
Pro
duct
ions
Inte
rven
tion
Prio
rity
One
Number of Weeks
MSMP TR
PA TR
Phase B:Intervention Priority one
Phase C:Intervention Priority Two
Phase A2:Follow-Up
Phase A:Baseline
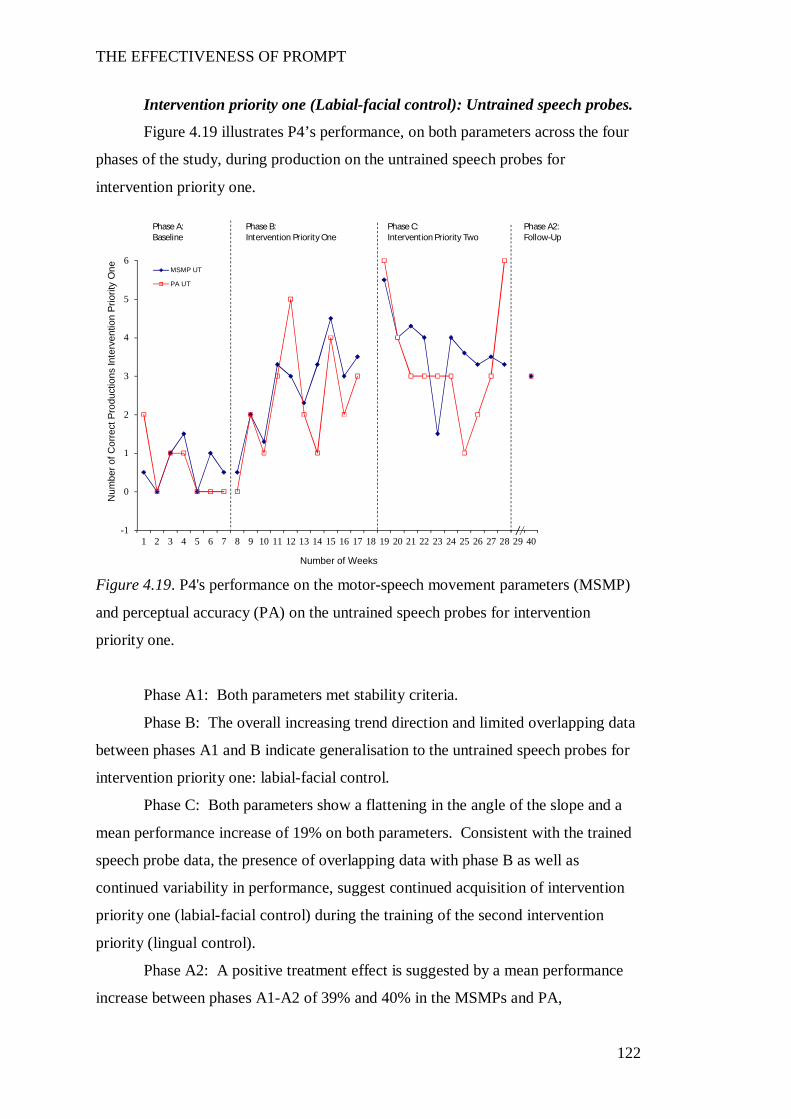
THE EFFECTIVENESS OF PROMPT
122
Intervention priority one (Labial-facial control): Untrained speech probes.
Figure 4.19 illustrates P4’s performance, on both parameters across the four
phases of the study, during production on the untrained speech probes for
intervention priority one.
Figure 4.19. P4's performance on the motor-speech movement parameters (MSMP)
and perceptual accuracy (PA) on the untrained speech probes for intervention
priority one.
Phase A1: Both parameters met stability criteria.
Phase B: The overall increasing trend direction and limited overlapping data
between phases A1 and B indicate generalisation to the untrained speech probes for
intervention priority one: labial-facial control.
Phase C: Both parameters show a flattening in the angle of the slope and a
mean performance increase of 19% on both parameters. Consistent with the trained
speech probe data, the presence of overlapping data with phase B as well as
continued variability in performance, suggest continued acquisition of intervention
priority one (labial-facial control) during the training of the second intervention
priority (lingual control).
Phase A2: A positive treatment effect is suggested by a mean performance
increase between phases A1-A2 of 39% and 40% in the MSMPs and PA,
-1
0
1
2
3
4
5
6
7
1 2 3 4 5 6 7 8 9 10 11 12 13 14 15 16 17 18 19 20 21 22 23 24 25 26 27 28 29 40
Num
ber o
f Cor
rect
Pro
duct
ions
Inte
rven
tion
Prio
rity
One
Number of Weeks
MSMP UT
PA UT
Phase B:Intervention Priority One
Phase C:Intervention Priority Two
Phase A2:Follow-Up
Phase A:Baseline
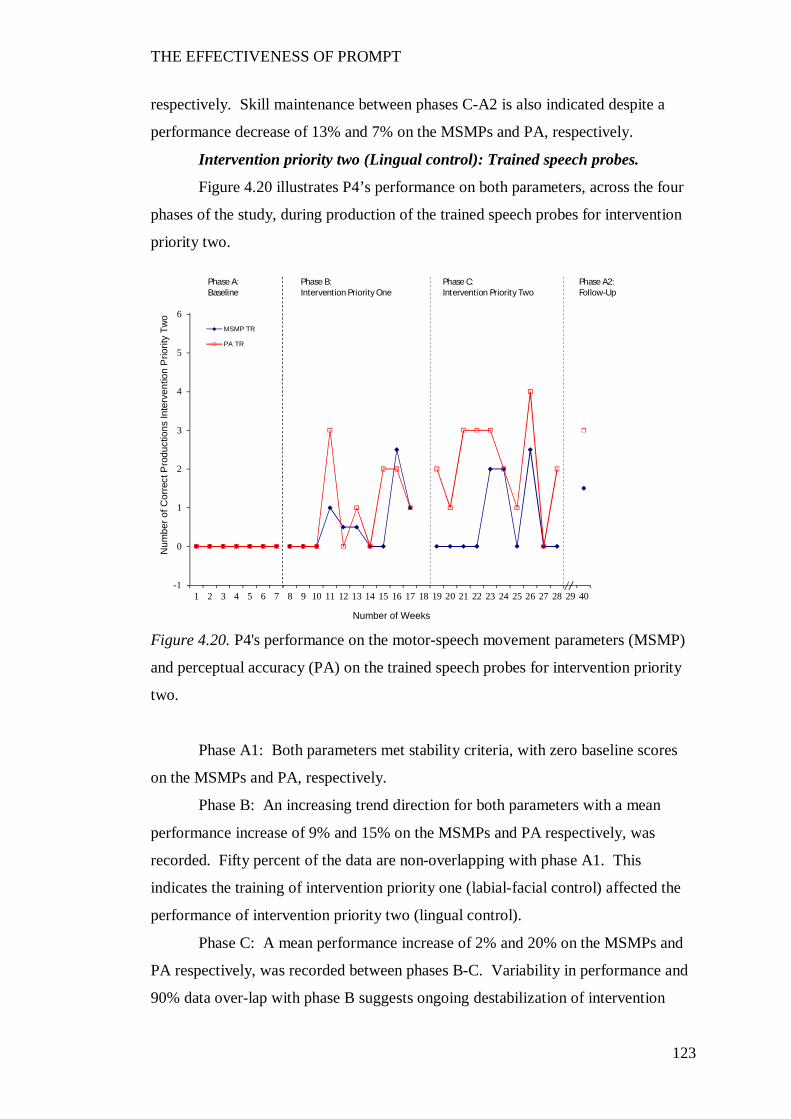
THE EFFECTIVENESS OF PROMPT
123
respectively. Skill maintenance between phases C-A2 is also indicated despite a
performance decrease of 13% and 7% on the MSMPs and PA, respectively.
Intervention priority two (Lingual control): Trained speech probes.
Figure 4.20 illustrates P4’s performance on both parameters, across the four
phases of the study, during production of the trained speech probes for intervention
priority two.
Figure 4.20. P4's performance on the motor-speech movement parameters (MSMP)
and perceptual accuracy (PA) on the trained speech probes for intervention priority
two.
Phase A1: Both parameters met stability criteria, with zero baseline scores
on the MSMPs and PA, respectively.
Phase B: An increasing trend direction for both parameters with a mean
performance increase of 9% and 15% on the MSMPs and PA respectively, was
recorded. Fifty percent of the data are non-overlapping with phase A1. This
indicates the training of intervention priority one (labial-facial control) affected the
performance of intervention priority two (lingual control).
Phase C: A mean performance increase of 2% and 20% on the MSMPs and
PA respectively, was recorded between phases B-C. Variability in performance and
90% data over-lap with phase B suggests ongoing destabilization of intervention
-1
0
1
2
3
4
5
6
7
1 2 3 4 5 6 7 8 9 10 11 12 13 14 15 16 17 18 19 20 21 22 23 24 25 26 27 28 29 40
Num
ber o
f Cor
rect
Pro
duct
ions
Inte
rven
tion
Prio
rity
Two
Number of Weeks
MSMP TR
PA TR
Phase B:Intervention Priority One
Phase C:Intervention Priority Two
Phase A2:Follow-Up
Phase A:Baseline
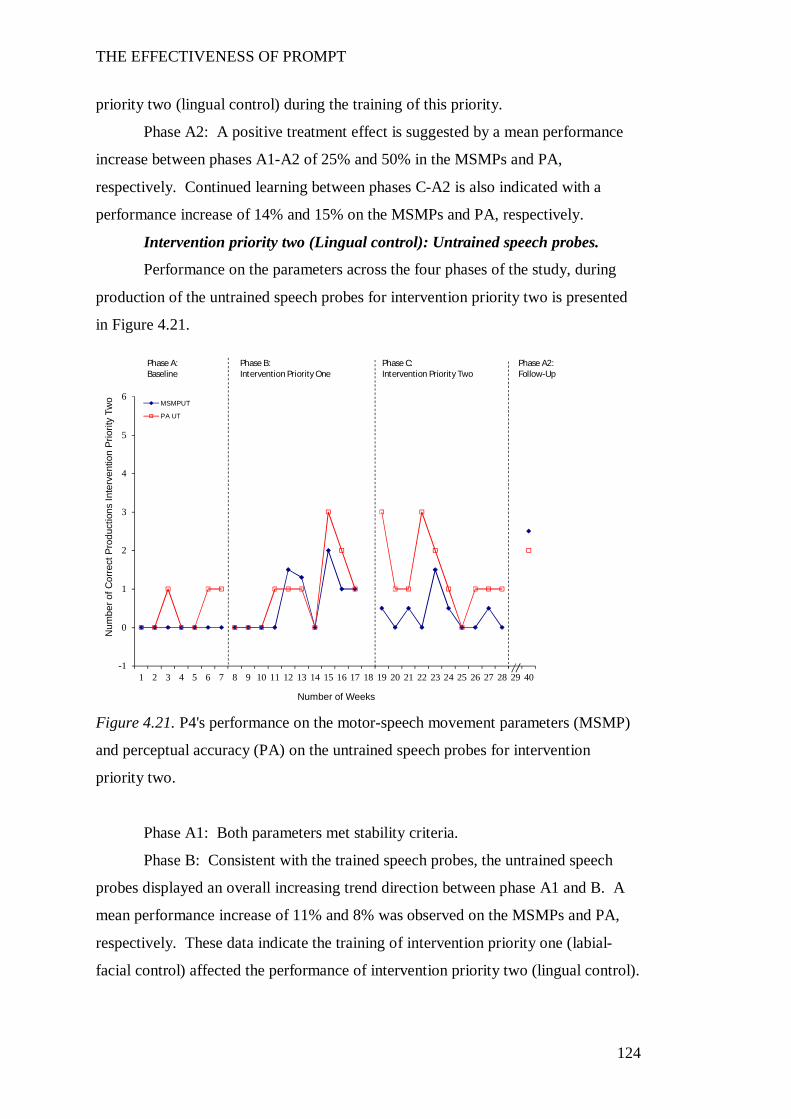
THE EFFECTIVENESS OF PROMPT
124
priority two (lingual control) during the training of this priority.
Phase A2: A positive treatment effect is suggested by a mean performance
increase between phases A1-A2 of 25% and 50% in the MSMPs and PA,
respectively. Continued learning between phases C-A2 is also indicated with a
performance increase of 14% and 15% on the MSMPs and PA, respectively.
Intervention priority two (Lingual control): Untrained speech probes.
Performance on the parameters across the four phases of the study, during
production of the untrained speech probes for intervention priority two is presented
in Figure 4.21.
Figure 4.21. P4's performance on the motor-speech movement parameters (MSMP)
and perceptual accuracy (PA) on the untrained speech probes for intervention
priority two.
Phase A1: Both parameters met stability criteria.
Phase B: Consistent with the trained speech probes, the untrained speech
probes displayed an overall increasing trend direction between phase A1 and B. A
mean performance increase of 11% and 8% was observed on the MSMPs and PA,
respectively. These data indicate the training of intervention priority one (labial-
facial control) affected the performance of intervention priority two (lingual control).
-1
0
1
2
3
4
5
6
7
1 2 3 4 5 6 7 8 9 10 11 12 13 14 15 16 17 18 19 20 21 22 23 24 25 26 27 28 29 40
Num
ber o
f Cor
rect
Pro
duct
ions
Inte
rven
tion
Prio
rity
Two
Number of Weeks
MSMPUT
PA UT
Phase B:Intervention Priority One
Phase C:Intervention Priority Two
Phase A2:Follow-Up
Phase A:Baseline
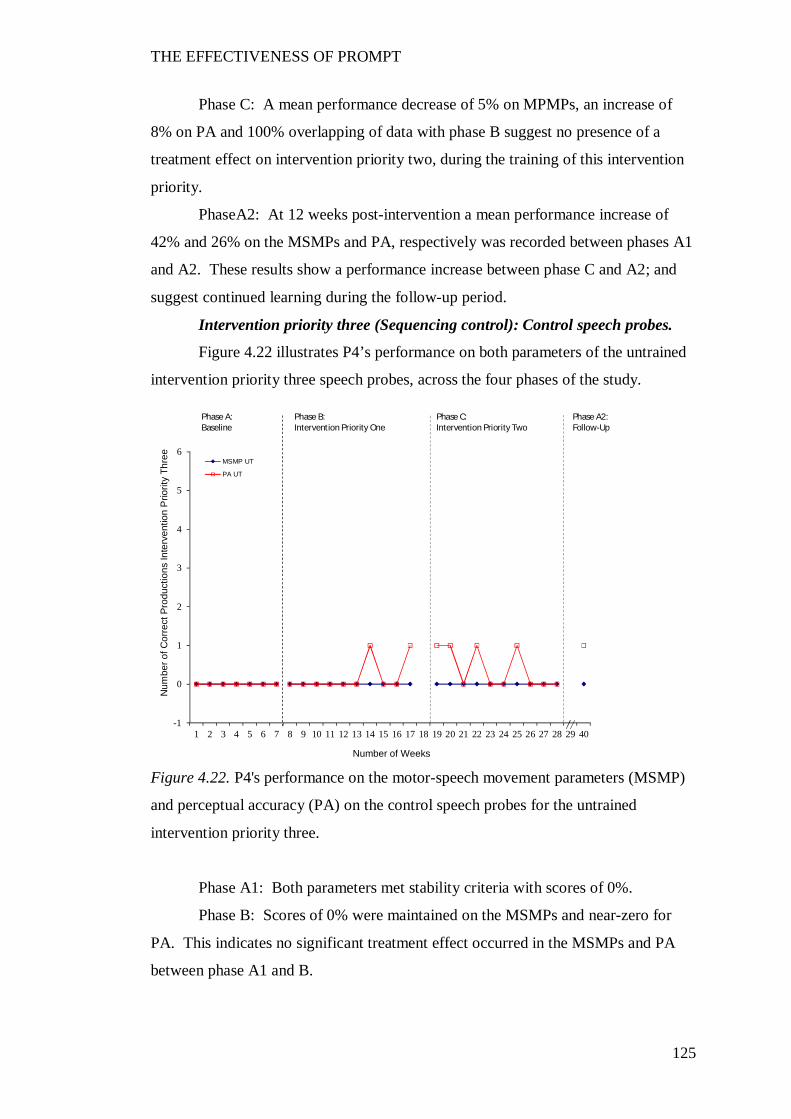
THE EFFECTIVENESS OF PROMPT
125
Phase C: A mean performance decrease of 5% on MPMPs, an increase of
8% on PA and 100% overlapping of data with phase B suggest no presence of a
treatment effect on intervention priority two, during the training of this intervention
priority.
PhaseA2: At 12 weeks post-intervention a mean performance increase of
42% and 26% on the MSMPs and PA, respectively was recorded between phases A1
and A2. These results show a performance increase between phase C and A2; and
suggest continued learning during the follow-up period.
Intervention priority three (Sequencing control): Control speech probes.
Figure 4.22 illustrates P4’s performance on both parameters of the untrained
intervention priority three speech probes, across the four phases of the study.
Figure 4.22. P4's performance on the motor-speech movement parameters (MSMP)
and perceptual accuracy (PA) on the control speech probes for the untrained
intervention priority three.
Phase A1: Both parameters met stability criteria with scores of 0%.
Phase B: Scores of 0% were maintained on the MSMPs and near-zero for
PA. This indicates no significant treatment effect occurred in the MSMPs and PA
between phase A1 and B.
-1
0
1
2
3
4
5
6
7
1 2 3 4 5 6 7 8 9 10 11 12 13 14 15 16 17 18 19 20 21 22 23 24 25 26 27 28 29 40
Num
ber o
f Cor
rect
Pro
duct
ions
Inte
rven
tion
Prio
rity
Thre
e
Number of Weeks
MSMP UT
PA UT
Phase B:Intervention Priority One
Phase C:Intervention Priority Two
Phase A2:Follow-Up
Phase A:Baseline
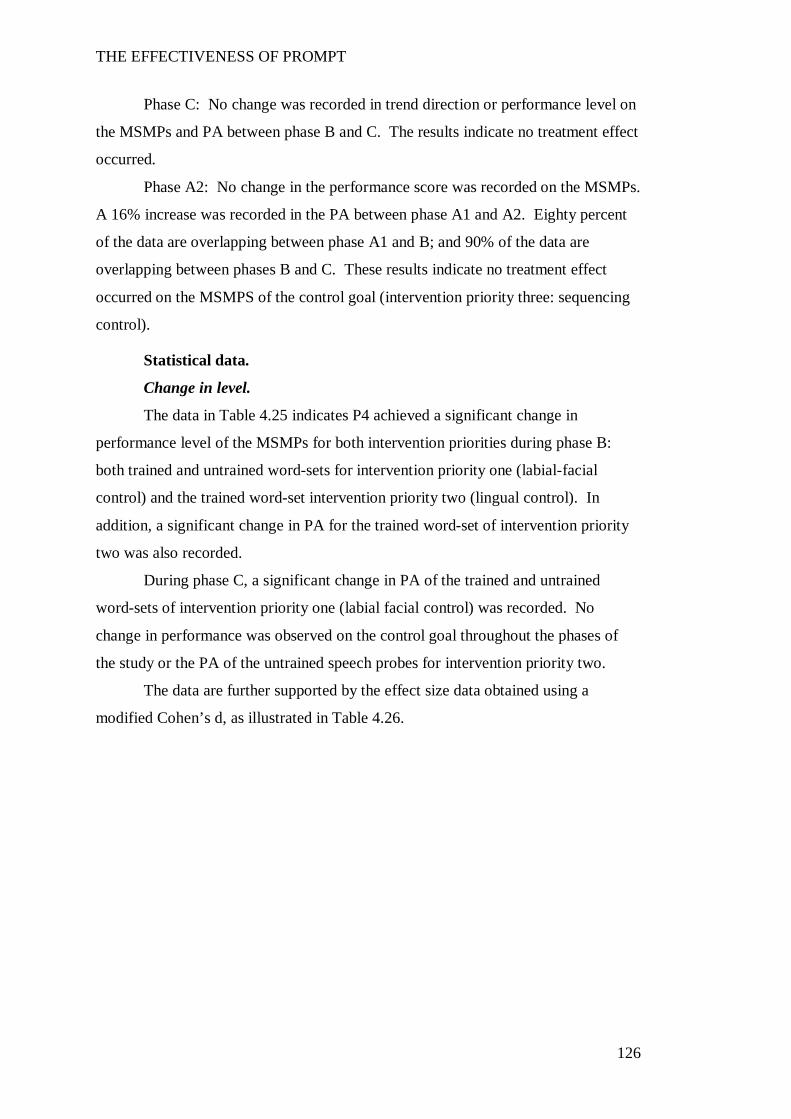
THE EFFECTIVENESS OF PROMPT
126
Phase C: No change was recorded in trend direction or performance level on
the MSMPs and PA between phase B and C. The results indicate no treatment effect
occurred.
Phase A2: No change in the performance score was recorded on the MSMPs.
A 16% increase was recorded in the PA between phase A1 and A2. Eighty percent
of the data are overlapping between phase A1 and B; and 90% of the data are
overlapping between phases B and C. These results indicate no treatment effect
occurred on the MSMPS of the control goal (intervention priority three: sequencing
control).
Statistical data.
Change in level.
The data in Table 4.25 indicates P4 achieved a significant change in
performance level of the MSMPs for both intervention priorities during phase B:
both trained and untrained word-sets for intervention priority one (labial-facial
control) and the trained word-set intervention priority two (lingual control). In
addition, a significant change in PA for the trained word-set of intervention priority
two was also recorded.
During phase C, a significant change in PA of the trained and untrained
word-sets of intervention priority one (labial facial control) was recorded. No
change in performance was observed on the control goal throughout the phases of
the study or the PA of the untrained speech probes for intervention priority two.
The data are further supported by the effect size data obtained using a
modified Cohen’s d, as illustrated in Table 4.26.
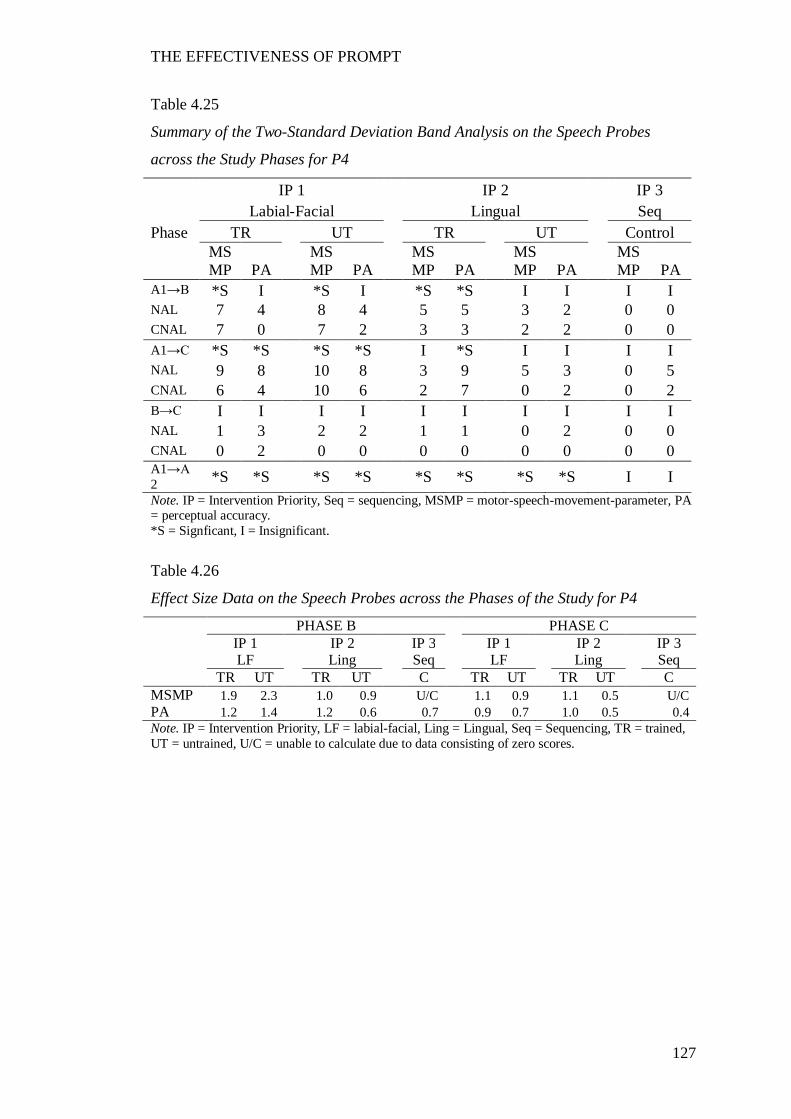
THE EFFECTIVENESS OF PROMPT
127
Table 4.25
Summary of the Two-Standard Deviation Band Analysis on the Speech Probes
across the Study Phases for P4
IP 1 IP 2 IP 3 Labial-Facial Lingual Seq Phase TR UT TR UT Control
MSMP PA
MSMP PA
MSMP PA
MSMP PA
MSMP PA
A1→B *S I *S I *S *S I I I I NAL 7 4 8 4 5 5 3 2 0 0 CNAL 7 0 7 2 3 3 2 2 0 0 A1→C *S *S *S *S I *S I I I I NAL 9 8 10 8 3 9 5 3 0 5 CNAL 6 4 10 6 2 7 0 2 0 2 B→C I I I I I I I I I I NAL 1 3 2 2 1 1 0 2 0 0 CNAL 0 2 0 0 0 0 0 0 0 0 A1→A2 *S *S *S *S *S *S *S *S I I Note. IP = Intervention Priority, Seq = sequencing, MSMP = motor-speech-movement-parameter, PA = perceptual accuracy. *S = Signficant, I = Insignificant.
Table 4.26
Effect Size Data on the Speech Probes across the Phases of the Study for P4
PHASE B PHASE C IP 1 IP 2 IP 3 IP 1 IP 2 IP 3 LF Ling Seq LF Ling Seq TR UT TR UT C TR UT TR UT C MSMP 1.9 2.3 1.0 0.9 U/C 1.1 0.9 1.1 0.5 U/C PA 1.2 1.4 1.2 0.6 0.7 0.9 0.7 1.0 0.5 0.4 Note. IP = Intervention Priority, LF = labial-facial, Ling = Lingual, Seq = Sequencing, TR = trained, UT = untrained, U/C = unable to calculate due to data consisting of zero scores.
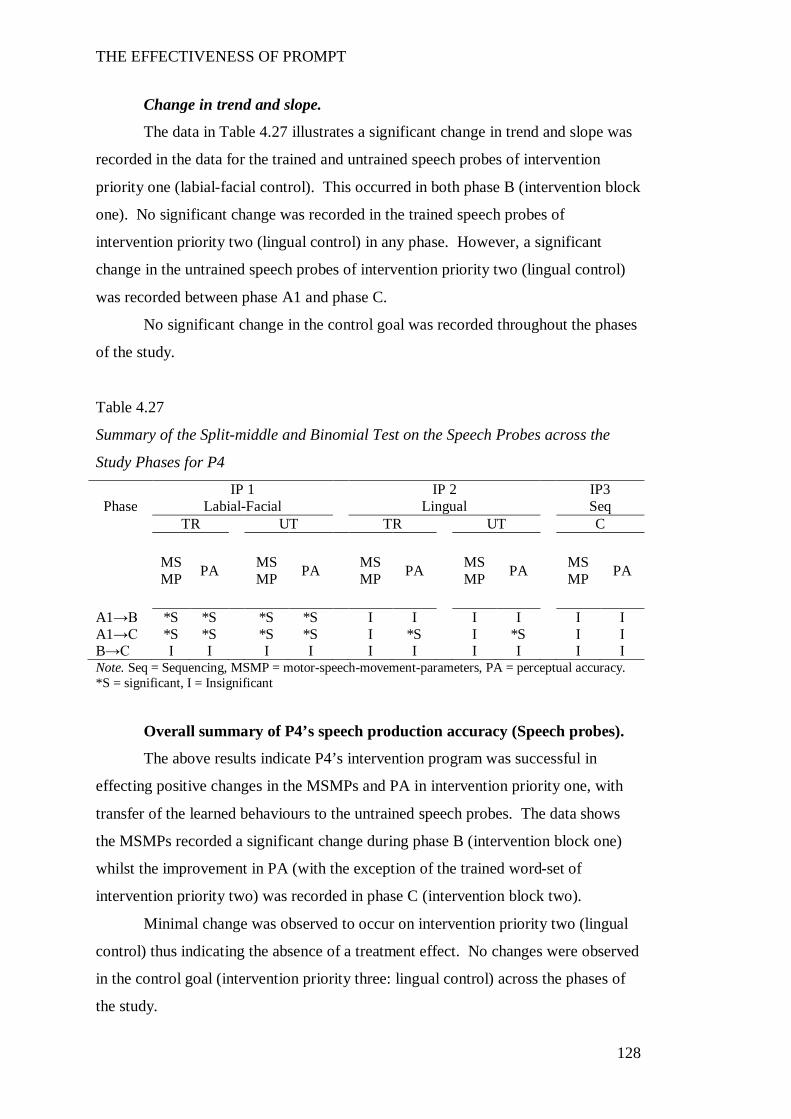
THE EFFECTIVENESS OF PROMPT
128
Change in trend and slope.
The data in Table 4.27 illustrates a significant change in trend and slope was
recorded in the data for the trained and untrained speech probes of intervention
priority one (labial-facial control). This occurred in both phase B (intervention block
one). No significant change was recorded in the trained speech probes of
intervention priority two (lingual control) in any phase. However, a significant
change in the untrained speech probes of intervention priority two (lingual control)
was recorded between phase A1 and phase C.
No significant change in the control goal was recorded throughout the phases
of the study.
Table 4.27
Summary of the Split-middle and Binomial Test on the Speech Probes across the
Study Phases for P4
IP 1 IP 2 IP3 Phase Labial-Facial Lingual Seq
TR UT TR UT C
MSMP PA MS
MP PA MSMP PA MS
MP PA MSMP PA
A1→B *S *S *S *S I I I I I I A1→C *S *S *S *S I *S I *S I I B→C I I I I I I I I I I Note. Seq = Sequencing, MSMP = motor-speech-movement-parameters, PA = perceptual accuracy. *S = significant, I = Insignificant
Overall summary of P4’s speech production accuracy (Speech probes).
The above results indicate P4’s intervention program was successful in
effecting positive changes in the MSMPs and PA in intervention priority one, with
transfer of the learned behaviours to the untrained speech probes. The data shows
the MSMPs recorded a significant change during phase B (intervention block one)
whilst the improvement in PA (with the exception of the trained word-set of
intervention priority two) was recorded in phase C (intervention block two).
Minimal change was observed to occur on intervention priority two (lingual
control) thus indicating the absence of a treatment effect. No changes were observed
in the control goal (intervention priority three: lingual control) across the phases of
the study.
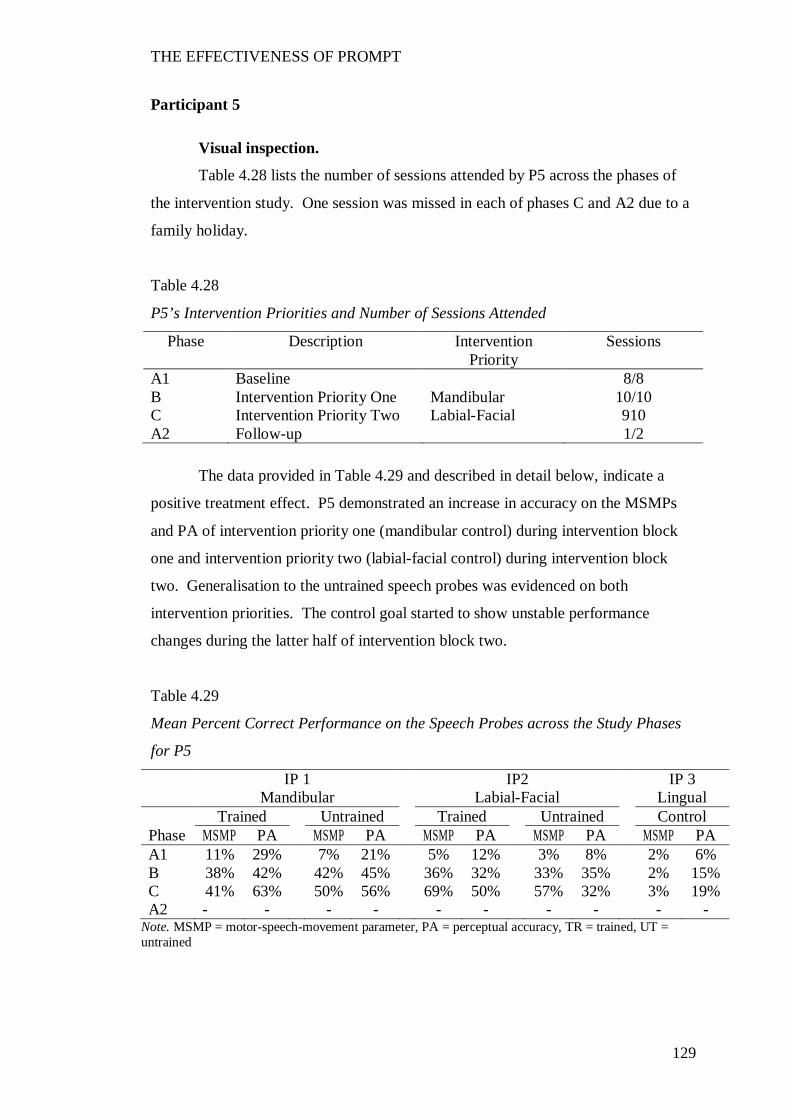
THE EFFECTIVENESS OF PROMPT
129
Participant 5
Visual inspection.
Table 4.28 lists the number of sessions attended by P5 across the phases of
the intervention study. One session was missed in each of phases C and A2 due to a
family holiday.
Table 4.28
P5’s Intervention Priorities and Number of Sessions Attended
Phase Description Intervention Priority
Sessions
A1 Baseline 8/8 B Intervention Priority One Mandibular 10/10 C Intervention Priority Two Labial-Facial 910 A2 Follow-up 1/2
The data provided in Table 4.29 and described in detail below, indicate a
positive treatment effect. P5 demonstrated an increase in accuracy on the MSMPs
and PA of intervention priority one (mandibular control) during intervention block
one and intervention priority two (labial-facial control) during intervention block
two. Generalisation to the untrained speech probes was evidenced on both
intervention priorities. The control goal started to show unstable performance
changes during the latter half of intervention block two.
Table 4.29
Mean Percent Correct Performance on the Speech Probes across the Study Phases
for P5
IP 1 IP2 IP 3 Mandibular Labial-Facial Lingual Trained Untrained Trained Untrained Control Phase MSMP PA MSMP PA MSMP PA MSMP PA MSMP PA A1 11% 29% 7% 21% 5% 12% 3% 8% 2% 6% B 38% 42% 42% 45% 36% 32% 33% 35% 2% 15% C 41% 63% 50% 56% 69% 50% 57% 32% 3% 19% A2 - - - - - - - - - -
Note. MSMP = motor-speech-movement parameter, PA = perceptual accuracy, TR = trained, UT = untrained
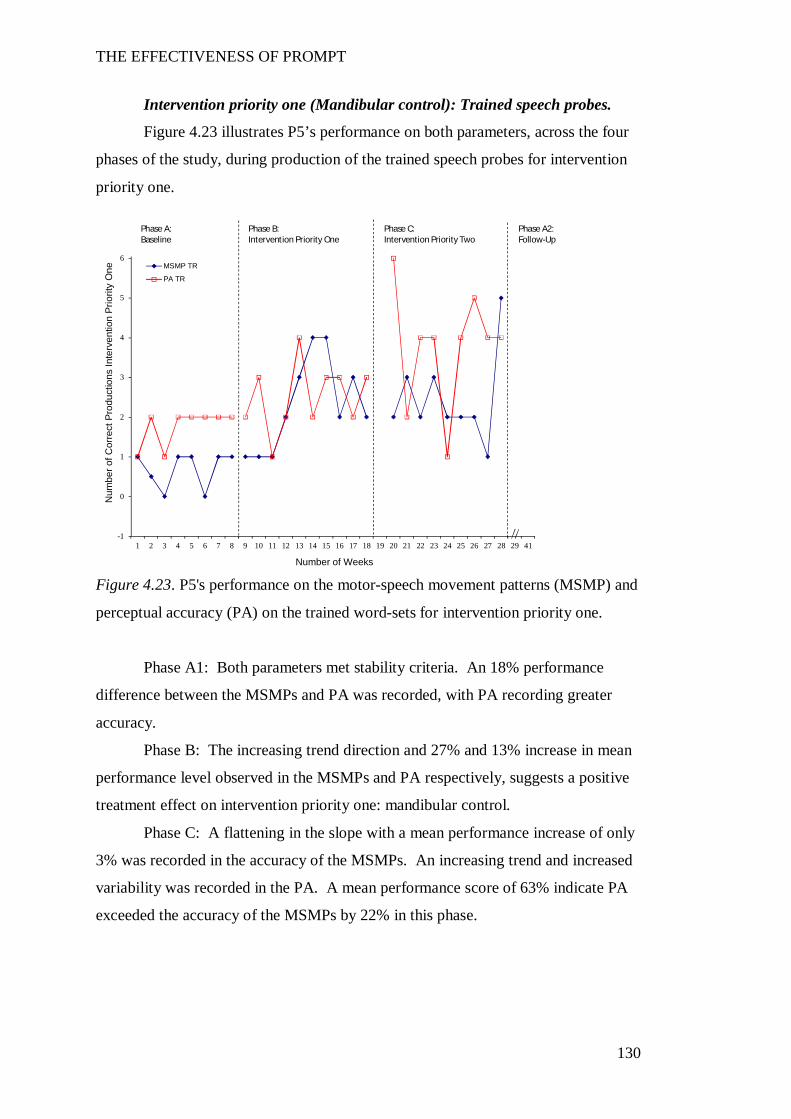
THE EFFECTIVENESS OF PROMPT
130
Intervention priority one (Mandibular control): Trained speech probes.
Figure 4.23 illustrates P5’s performance on both parameters, across the four
phases of the study, during production of the trained speech probes for intervention
priority one.
Figure 4.23. P5's performance on the motor-speech movement patterns (MSMP) and
perceptual accuracy (PA) on the trained word-sets for intervention priority one.
Phase A1: Both parameters met stability criteria. An 18% performance
difference between the MSMPs and PA was recorded, with PA recording greater
accuracy.
Phase B: The increasing trend direction and 27% and 13% increase in mean
performance level observed in the MSMPs and PA respectively, suggests a positive
treatment effect on intervention priority one: mandibular control.
Phase C: A flattening in the slope with a mean performance increase of only
3% was recorded in the accuracy of the MSMPs. An increasing trend and increased
variability was recorded in the PA. A mean performance score of 63% indicate PA
exceeded the accuracy of the MSMPs by 22% in this phase.
-1
0
1
2
3
4
5
6
7
1 2 3 4 5 6 7 8 9 10 11 12 13 14 15 16 17 18 19 20 21 22 23 24 25 26 27 28 29 41
Num
ber o
f Cor
rect
Pro
duct
ions
Inte
rven
tion
Prio
rity
One
Number of Weeks
MSMP TR
PA TR
Phase B:Intervention Priority One
Phase C:Intervention Priority Two
Phase A2:Follow-Up
Phase A:Baseline
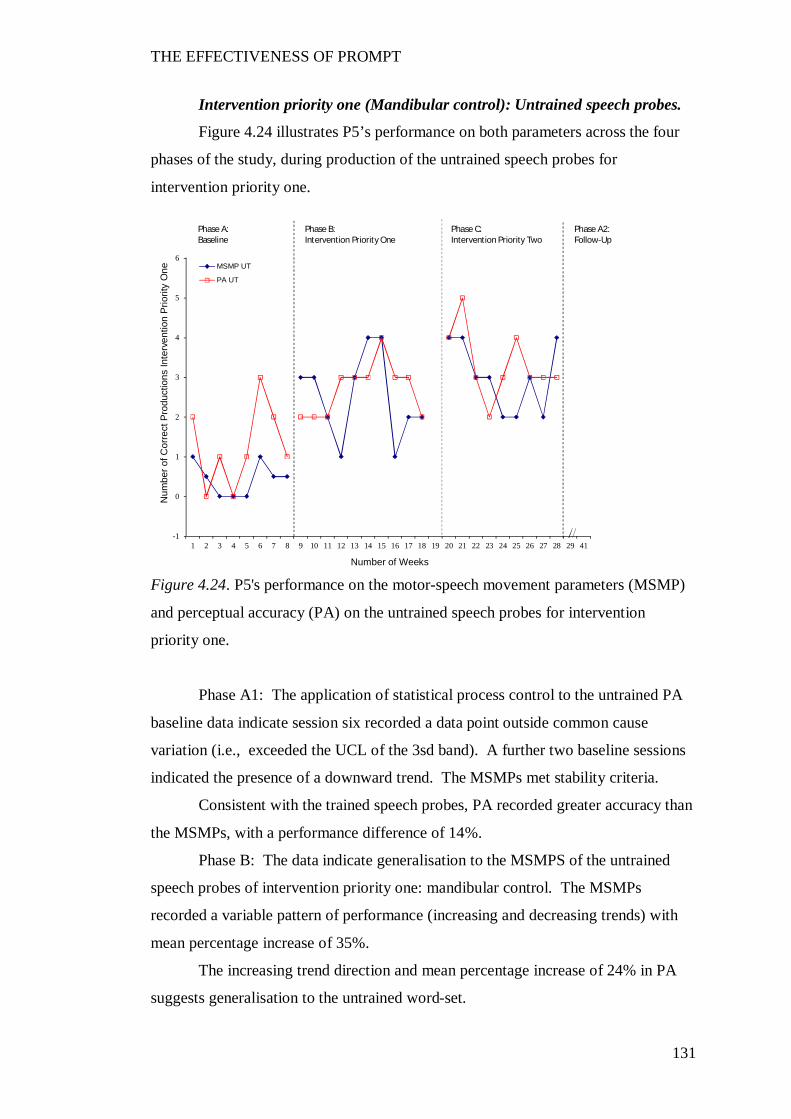
THE EFFECTIVENESS OF PROMPT
131
Intervention priority one (Mandibular control): Untrained speech probes.
Figure 4.24 illustrates P5’s performance on both parameters across the four
phases of the study, during production of the untrained speech probes for
intervention priority one.
Figure 4.24. P5's performance on the motor-speech movement parameters (MSMP)
and perceptual accuracy (PA) on the untrained speech probes for intervention
priority one.
Phase A1: The application of statistical process control to the untrained PA
baseline data indicate session six recorded a data point outside common cause
variation (i.e., exceeded the UCL of the 3sd band). A further two baseline sessions
indicated the presence of a downward trend. The MSMPs met stability criteria.
Consistent with the trained speech probes, PA recorded greater accuracy than
the MSMPs, with a performance difference of 14%.
Phase B: The data indicate generalisation to the MSMPS of the untrained
speech probes of intervention priority one: mandibular control. The MSMPs
recorded a variable pattern of performance (increasing and decreasing trends) with
mean percentage increase of 35%.
The increasing trend direction and mean percentage increase of 24% in PA
suggests generalisation to the untrained word-set.
-1
0
1
2
3
4
5
6
7
1 2 3 4 5 6 7 8 9 10 11 12 13 14 15 16 17 18 19 20 21 22 23 24 25 26 27 28 29 41
Num
ber o
f Cor
rect
Pro
duct
ions
Inte
rven
tion
Prio
rity
One
Number of Weeks
MSMP UT
PA UT
Phase B:Intervention Priority One
Phase C:Intervention Priority Two
Phase A2:Follow-Up
Phase A:Baseline
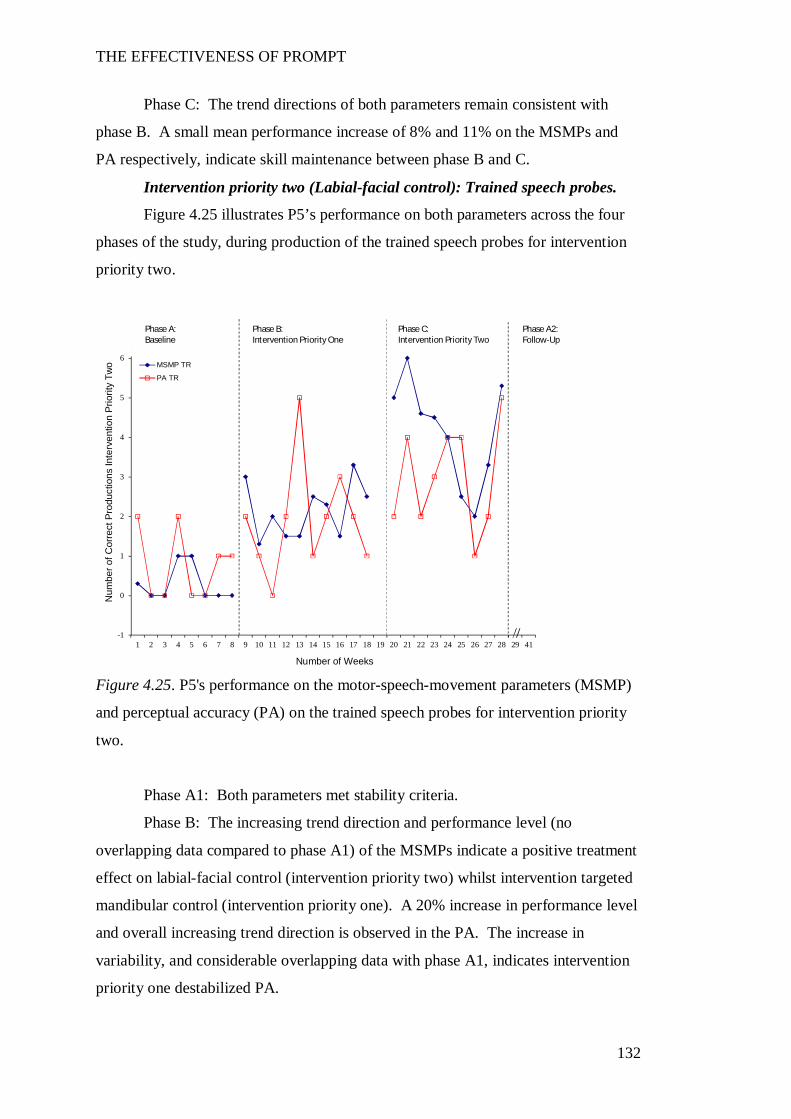
THE EFFECTIVENESS OF PROMPT
132
Phase C: The trend directions of both parameters remain consistent with
phase B. A small mean performance increase of 8% and 11% on the MSMPs and
PA respectively, indicate skill maintenance between phase B and C.
Intervention priority two (Labial-facial control): Trained speech probes.
Figure 4.25 illustrates P5’s performance on both parameters across the four
phases of the study, during production of the trained speech probes for intervention
priority two.
Figure 4.25. P5's performance on the motor-speech-movement parameters (MSMP)
and perceptual accuracy (PA) on the trained speech probes for intervention priority
two.
Phase A1: Both parameters met stability criteria.
Phase B: The increasing trend direction and performance level (no
overlapping data compared to phase A1) of the MSMPs indicate a positive treatment
effect on labial-facial control (intervention priority two) whilst intervention targeted
mandibular control (intervention priority one). A 20% increase in performance level
and overall increasing trend direction is observed in the PA. The increase in
variability, and considerable overlapping data with phase A1, indicates intervention
priority one destabilized PA.
-1
0
1
2
3
4
5
6
7
1 2 3 4 5 6 7 8 9 10 11 12 13 14 15 16 17 18 19 20 21 22 23 24 25 26 27 28 29 41
Num
ber o
f Cor
rect
Pro
duct
ions
Inte
rven
tion
Prio
rity
Two
Number of Weeks
MSMP TR
PA TR
Phase B:Intervention Priority One
Phase C:Intervention Priority Two
Phase A2:Follow-Up
Phase A:Baseline
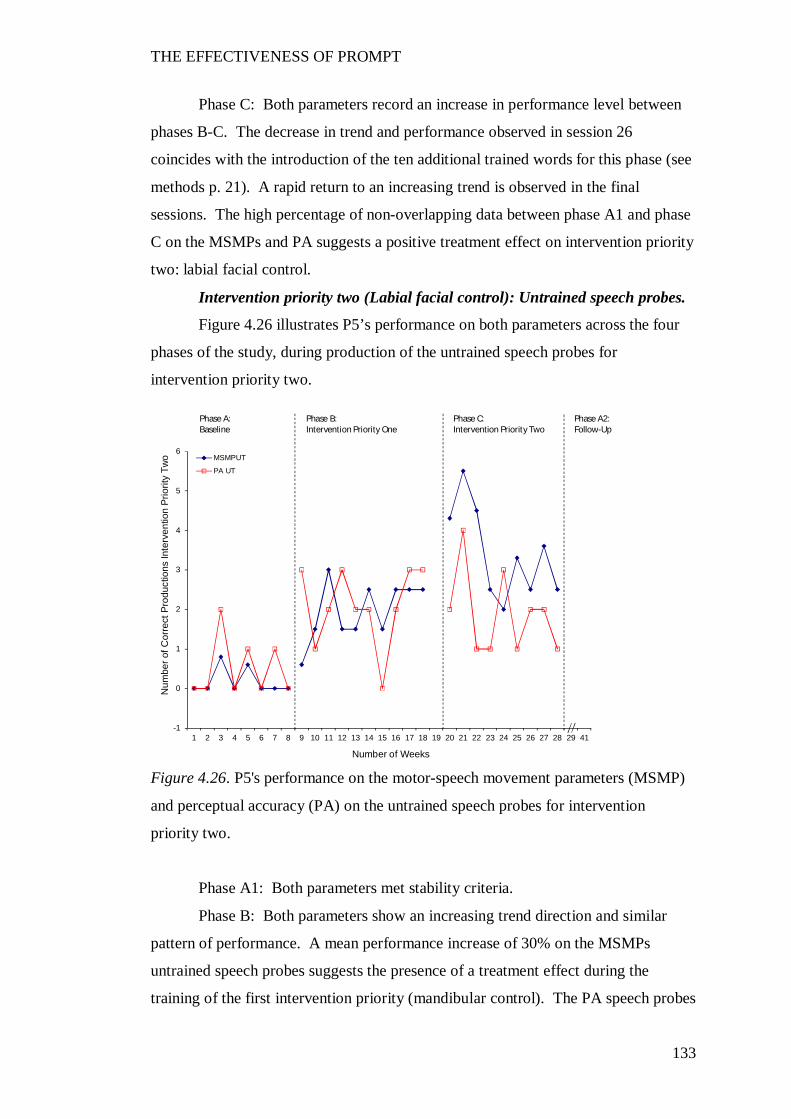
THE EFFECTIVENESS OF PROMPT
133
Phase C: Both parameters record an increase in performance level between
phases B-C. The decrease in trend and performance observed in session 26
coincides with the introduction of the ten additional trained words for this phase (see
methods p. 21). A rapid return to an increasing trend is observed in the final
sessions. The high percentage of non-overlapping data between phase A1 and phase
C on the MSMPs and PA suggests a positive treatment effect on intervention priority
two: labial facial control.
Intervention priority two (Labial facial control): Untrained speech probes.
Figure 4.26 illustrates P5’s performance on both parameters across the four
phases of the study, during production of the untrained speech probes for
intervention priority two.
Figure 4.26. P5's performance on the motor-speech movement parameters (MSMP)
and perceptual accuracy (PA) on the untrained speech probes for intervention
priority two.
Phase A1: Both parameters met stability criteria.
Phase B: Both parameters show an increasing trend direction and similar
pattern of performance. A mean performance increase of 30% on the MSMPs
untrained speech probes suggests the presence of a treatment effect during the
training of the first intervention priority (mandibular control). The PA speech probes
-1
0
1
2
3
4
5
6
7
1 2 3 4 5 6 7 8 9 10 11 12 13 14 15 16 17 18 19 20 21 22 23 24 25 26 27 28 29 41
Num
ber o
f Cor
rect
Pro
duct
ions
Inte
rven
tion
Prio
rity
Two
Number of Weeks
MSMPUT
PA UT
Phase B:Intervention Priority One
Phase C:Intervention Priority Two
Phase A2:Follow-Up
Phase A:Baseline
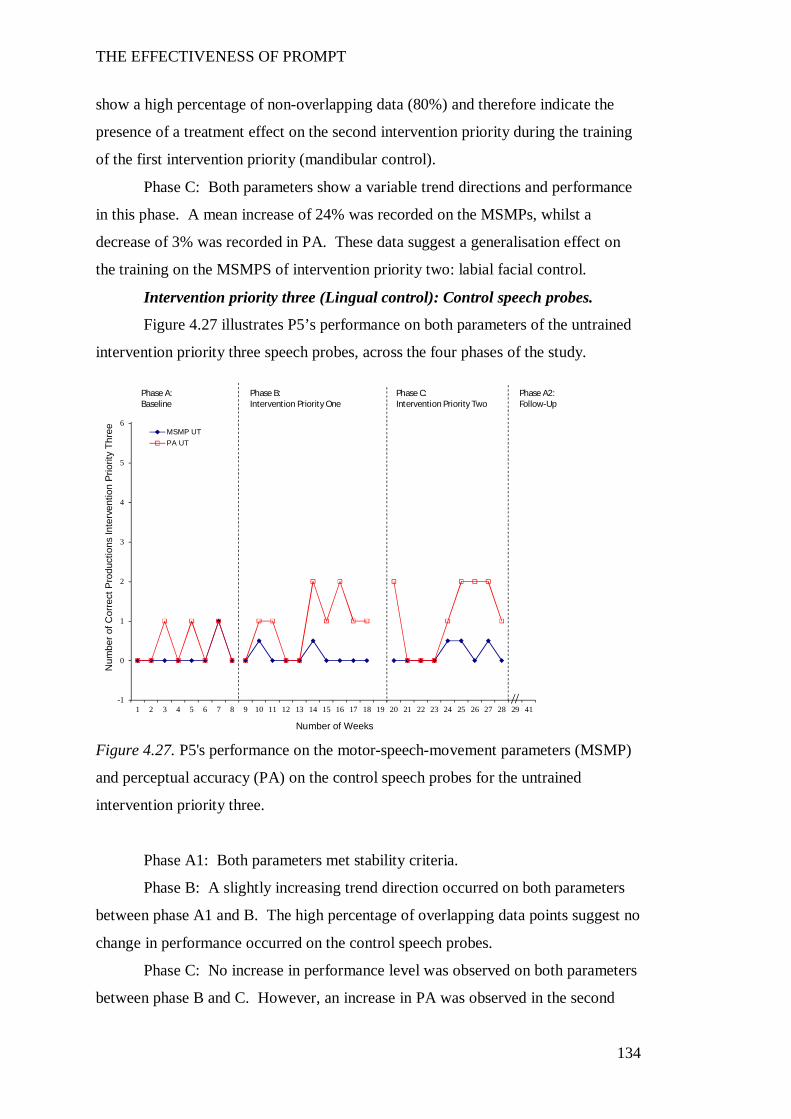
THE EFFECTIVENESS OF PROMPT
134
show a high percentage of non-overlapping data (80%) and therefore indicate the
presence of a treatment effect on the second intervention priority during the training
of the first intervention priority (mandibular control).
Phase C: Both parameters show a variable trend directions and performance
in this phase. A mean increase of 24% was recorded on the MSMPs, whilst a
decrease of 3% was recorded in PA. These data suggest a generalisation effect on
the training on the MSMPS of intervention priority two: labial facial control.
Intervention priority three (Lingual control): Control speech probes.
Figure 4.27 illustrates P5’s performance on both parameters of the untrained
intervention priority three speech probes, across the four phases of the study.
Figure 4.27. P5's performance on the motor-speech-movement parameters (MSMP)
and perceptual accuracy (PA) on the control speech probes for the untrained
intervention priority three.
Phase A1: Both parameters met stability criteria.
Phase B: A slightly increasing trend direction occurred on both parameters
between phase A1 and B. The high percentage of overlapping data points suggest no
change in performance occurred on the control speech probes.
Phase C: No increase in performance level was observed on both parameters
between phase B and C. However, an increase in PA was observed in the second
-1
0
1
2
3
4
5
6
7
1 2 3 4 5 6 7 8 9 10 11 12 13 14 15 16 17 18 19 20 21 22 23 24 25 26 27 28 29 41
Num
ber o
f Cor
rect
Pro
duct
ions
Inte
rven
tion
Prio
rity
Thre
e
Number of Weeks
MSMP UTPA UT
Phase B:Intervention Priority One
Phase C:Intervention Priority Two
Phase A2:Follow-Up
Phase A:Baseline
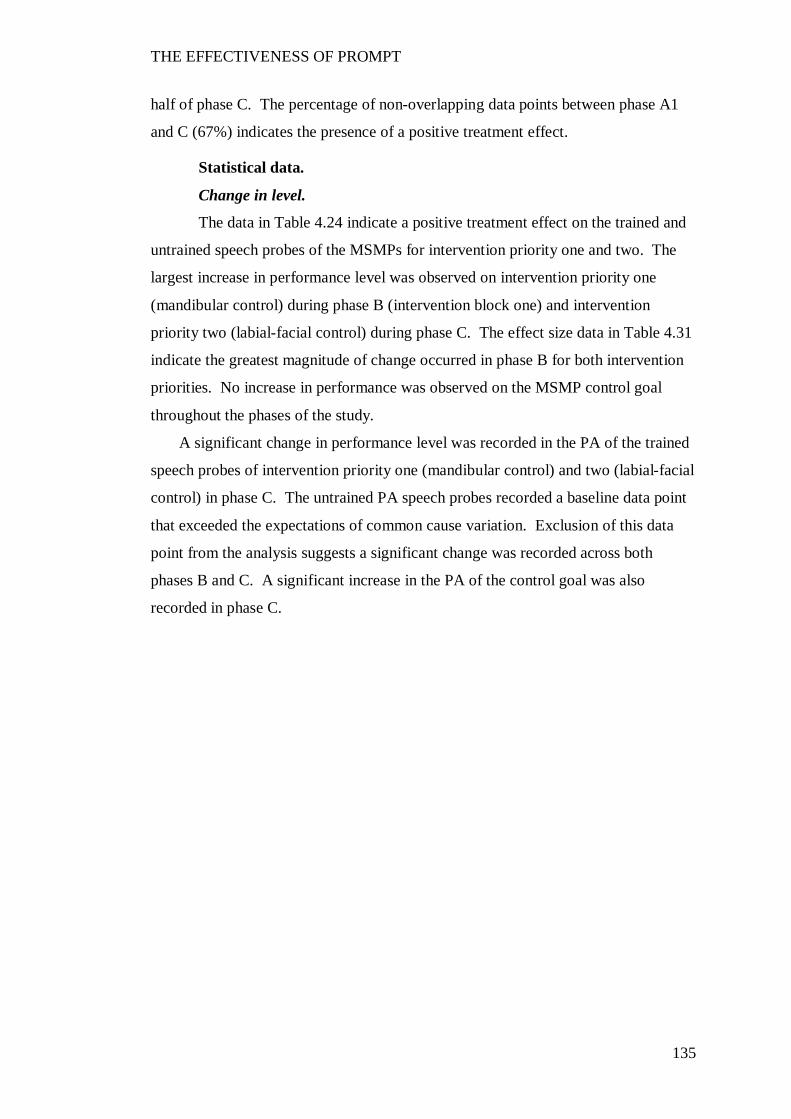
THE EFFECTIVENESS OF PROMPT
135
half of phase C. The percentage of non-overlapping data points between phase A1
and C (67%) indicates the presence of a positive treatment effect.
Statistical data.
Change in level.
The data in Table 4.24 indicate a positive treatment effect on the trained and
untrained speech probes of the MSMPs for intervention priority one and two. The
largest increase in performance level was observed on intervention priority one
(mandibular control) during phase B (intervention block one) and intervention
priority two (labial-facial control) during phase C. The effect size data in Table 4.31
indicate the greatest magnitude of change occurred in phase B for both intervention
priorities. No increase in performance was observed on the MSMP control goal
throughout the phases of the study.
A significant change in performance level was recorded in the PA of the trained
speech probes of intervention priority one (mandibular control) and two (labial-facial
control) in phase C. The untrained PA speech probes recorded a baseline data point
that exceeded the expectations of common cause variation. Exclusion of this data
point from the analysis suggests a significant change was recorded across both
phases B and C. A significant increase in the PA of the control goal was also
recorded in phase C.
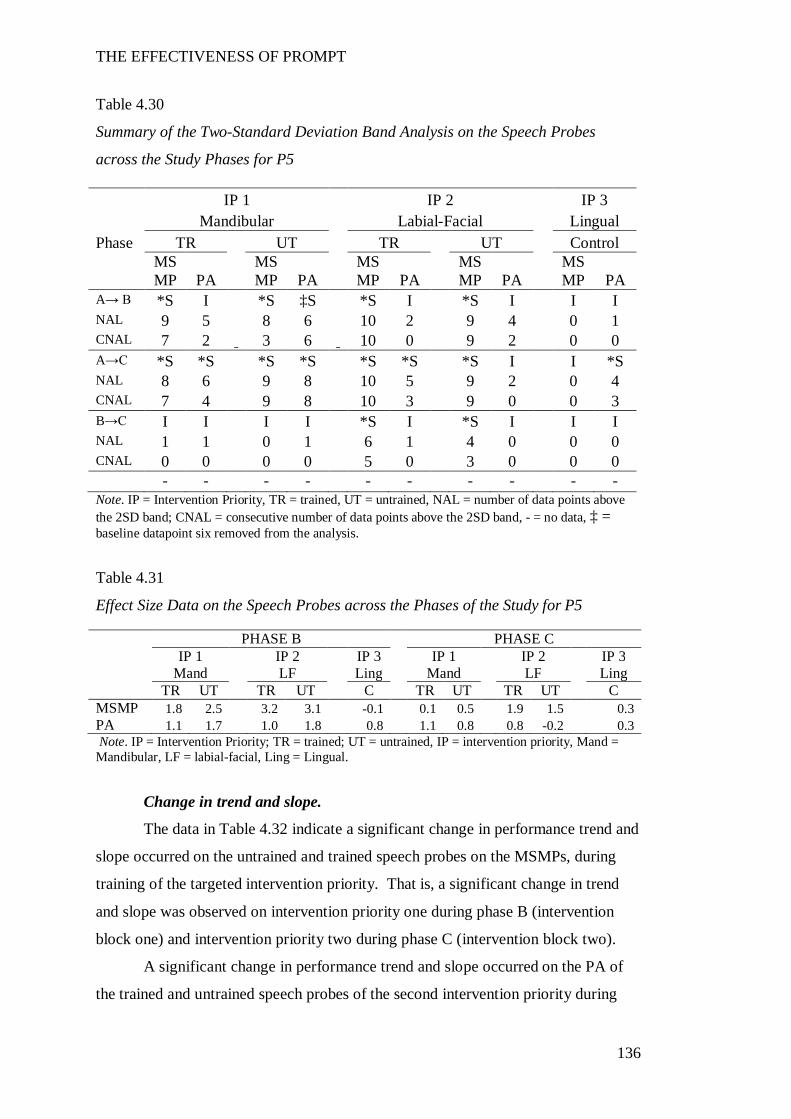
THE EFFECTIVENESS OF PROMPT
136
Table 4.30
Summary of the Two-Standard Deviation Band Analysis on the Speech Probes
across the Study Phases for P5
Note. IP = Intervention Priority, TR = trained, UT = untrained, NAL = number of data points above the 2SD band; CNAL = consecutive number of data points above the 2SD band, - = no data, ‡ = baseline datapoint six removed from the analysis.
Table 4.31
Effect Size Data on the Speech Probes across the Phases of the Study for P5
Note. IP = Intervention Priority; TR = trained; UT = untrained, IP = intervention priority, Mand = Mandibular, LF = labial-facial, Ling = Lingual.
Change in trend and slope.
The data in Table 4.32 indicate a significant change in performance trend and
slope occurred on the untrained and trained speech probes on the MSMPs, during
training of the targeted intervention priority. That is, a significant change in trend
and slope was observed on intervention priority one during phase B (intervention
block one) and intervention priority two during phase C (intervention block two).
A significant change in performance trend and slope occurred on the PA of
the trained and untrained speech probes of the second intervention priority during
IP 1 IP 2 IP 3 Mandibular Labial-Facial Lingual Phase TR UT TR UT Control
MSMP PA
MSMP PA
MSMP PA
MSMP PA
MSMP PA
A→ B *S I *S ‡S *S I *S I I I NAL 9 5 8 6 10 2 9 4 0 1 CNAL 7 2 3 6 10 0 9 2 0 0 A→C *S *S *S *S *S *S *S I I *S NAL 8 6 9 8 10 5 9 2 0 4 CNAL 7 4 9 8 10 3 9 0 0 3 B→C I I I I *S I *S I I I NAL 1 1 0 1 6 1 4 0 0 0 CNAL 0 0 0 0 5 0 3 0 0 0 - - - - - - - - - -
PHASE B PHASE C IP 1 IP 2 IP 3 IP 1 IP 2 IP 3 Mand LF Ling Mand LF Ling TR UT TR UT C TR UT TR UT C MSMP 1.8 2.5 3.2 3.1 -0.1 0.1 0.5 1.9 1.5 0.3 PA 1.1 1.7 1.0 1.8 0.8 1.1 0.8 0.8 -0.2 0.3
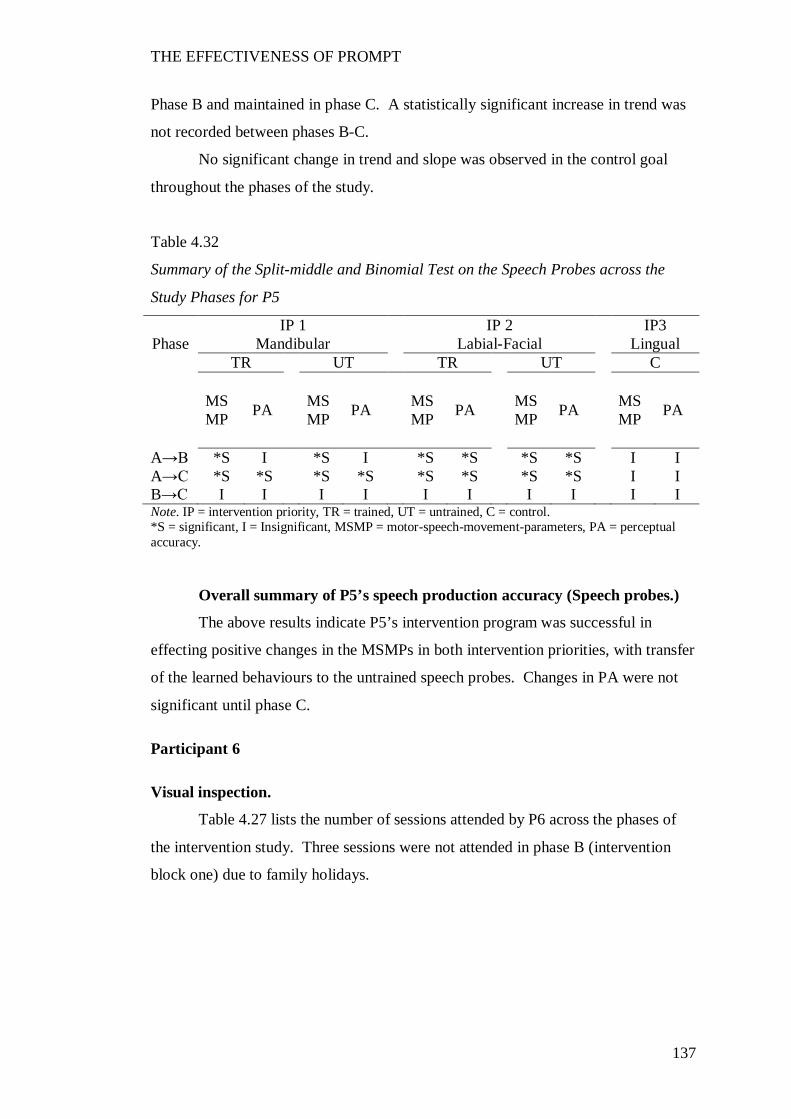
THE EFFECTIVENESS OF PROMPT
137
Phase B and maintained in phase C. A statistically significant increase in trend was
not recorded between phases B-C.
No significant change in trend and slope was observed in the control goal
throughout the phases of the study.
Table 4.32
Summary of the Split-middle and Binomial Test on the Speech Probes across the
Study Phases for P5
IP 1 IP 2 IP3 Phase Mandibular Labial-Facial Lingual
TR UT TR UT C
MSMP PA MS
MP PA MSMP PA MS
MP PA MSMP PA
A→B *S I *S I *S *S *S *S I I A→C *S *S *S *S *S *S *S *S I I B→C I I I I I I I I I I Note. IP = intervention priority, TR = trained, UT = untrained, C = control. *S = significant, I = Insignificant, MSMP = motor-speech-movement-parameters, PA = perceptual accuracy.
Overall summary of P5’s speech production accuracy (Speech probes.)
The above results indicate P5’s intervention program was successful in
effecting positive changes in the MSMPs in both intervention priorities, with transfer
of the learned behaviours to the untrained speech probes. Changes in PA were not
significant until phase C.
Participant 6
Visual inspection.
Table 4.27 lists the number of sessions attended by P6 across the phases of
the intervention study. Three sessions were not attended in phase B (intervention
block one) due to family holidays.
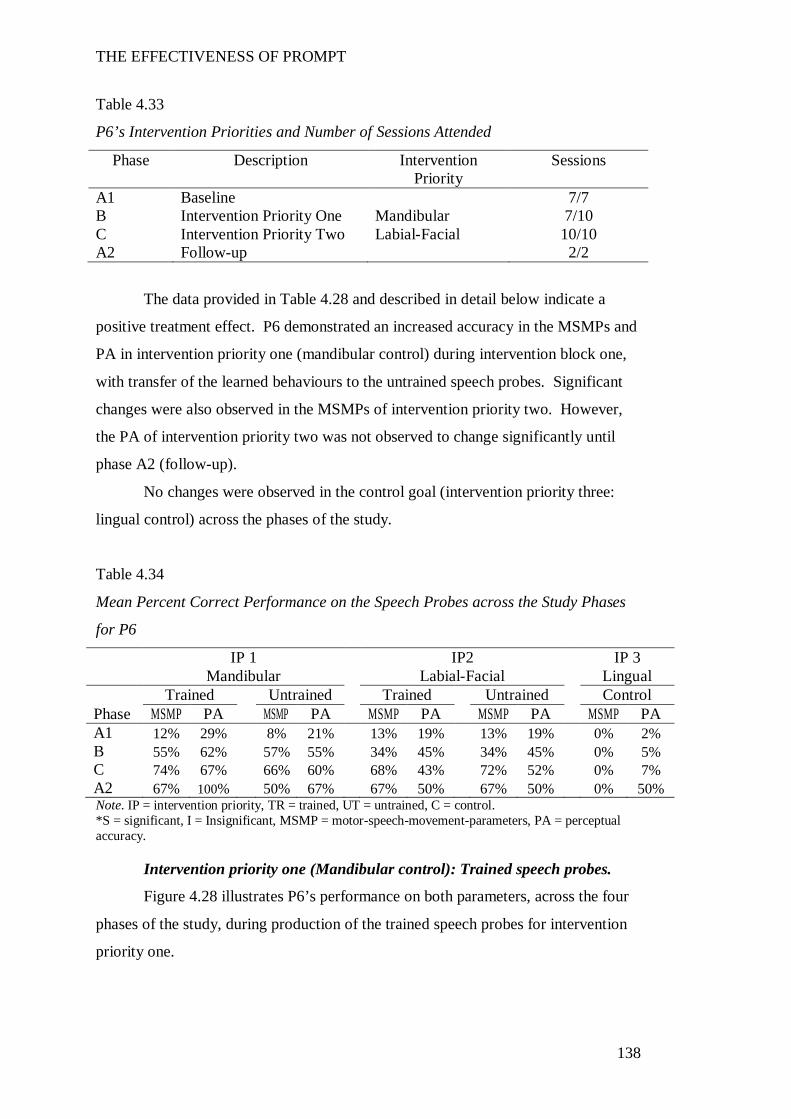
THE EFFECTIVENESS OF PROMPT
138
Table 4.33
P6’s Intervention Priorities and Number of Sessions Attended
Phase Description Intervention Priority
Sessions
A1 Baseline 7/7 B Intervention Priority One Mandibular 7/10 C Intervention Priority Two Labial-Facial 10/10 A2 Follow-up 2/2
The data provided in Table 4.28 and described in detail below indicate a
positive treatment effect. P6 demonstrated an increased accuracy in the MSMPs and
PA in intervention priority one (mandibular control) during intervention block one,
with transfer of the learned behaviours to the untrained speech probes. Significant
changes were also observed in the MSMPs of intervention priority two. However,
the PA of intervention priority two was not observed to change significantly until
phase A2 (follow-up).
No changes were observed in the control goal (intervention priority three:
lingual control) across the phases of the study.
Table 4.34
Mean Percent Correct Performance on the Speech Probes across the Study Phases
for P6
IP 1 IP2 IP 3 Mandibular Labial-Facial Lingual Trained Untrained Trained Untrained Control Phase MSMP PA MSMP PA MSMP PA MSMP PA MSMP PA A1 12% 29% 8% 21% 13% 19% 13% 19% 0% 2% B 55% 62% 57% 55% 34% 45% 34% 45% 0% 5% C 74% 67% 66% 60% 68% 43% 72% 52% 0% 7% A2 67% 100% 50% 67% 67% 50% 67% 50% 0% 50% Note. IP = intervention priority, TR = trained, UT = untrained, C = control. *S = significant, I = Insignificant, MSMP = motor-speech-movement-parameters, PA = perceptual accuracy.
Intervention priority one (Mandibular control): Trained speech probes.
Figure 4.28 illustrates P6’s performance on both parameters, across the four
phases of the study, during production of the trained speech probes for intervention
priority one.
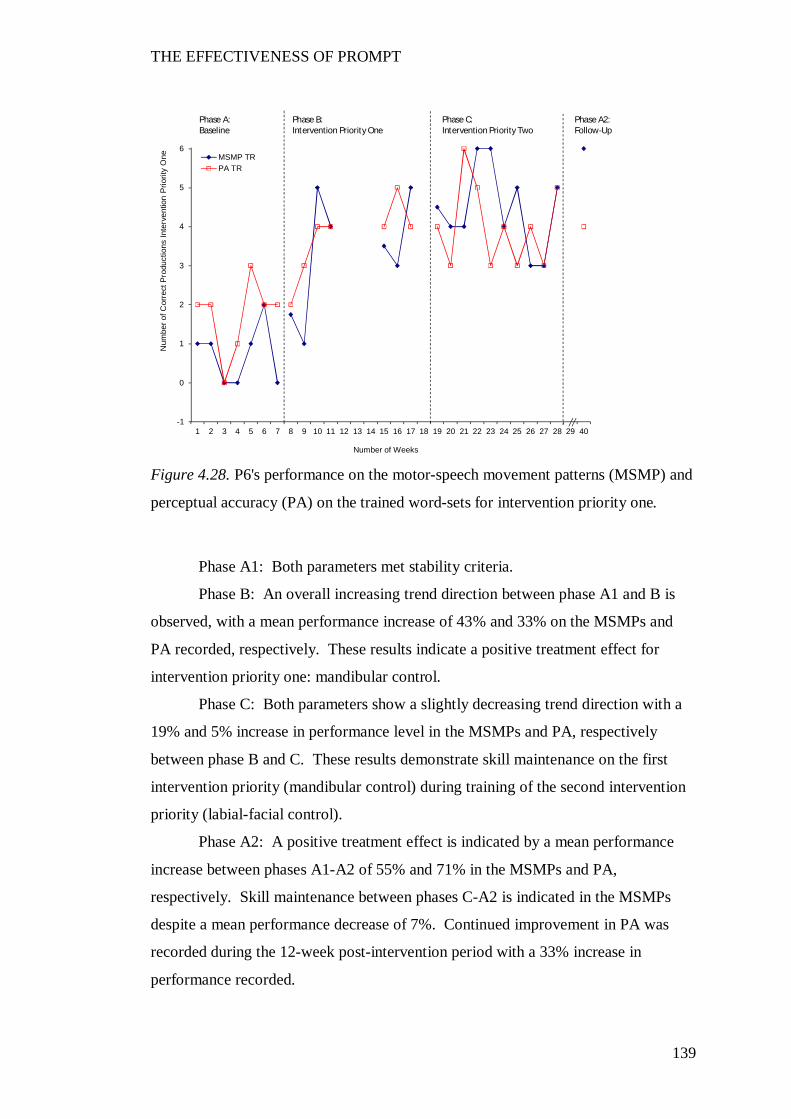
THE EFFECTIVENESS OF PROMPT
139
Figure 4.28. P6's performance on the motor-speech movement patterns (MSMP) and
perceptual accuracy (PA) on the trained word-sets for intervention priority one.
Phase A1: Both parameters met stability criteria.
Phase B: An overall increasing trend direction between phase A1 and B is
observed, with a mean performance increase of 43% and 33% on the MSMPs and
PA recorded, respectively. These results indicate a positive treatment effect for
intervention priority one: mandibular control.
Phase C: Both parameters show a slightly decreasing trend direction with a
19% and 5% increase in performance level in the MSMPs and PA, respectively
between phase B and C. These results demonstrate skill maintenance on the first
intervention priority (mandibular control) during training of the second intervention
priority (labial-facial control).
Phase A2: A positive treatment effect is indicated by a mean performance
increase between phases A1-A2 of 55% and 71% in the MSMPs and PA,
respectively. Skill maintenance between phases C-A2 is indicated in the MSMPs
despite a mean performance decrease of 7%. Continued improvement in PA was
recorded during the 12-week post-intervention period with a 33% increase in
performance recorded.
-1
0
1
2
3
4
5
6
7
1 2 3 4 5 6 7 8 9 10 11 12 13 14 15 16 17 18 19 20 21 22 23 24 25 26 27 28 29 40
Num
ber o
f Cor
rect
Pro
duct
ions
Inte
rven
tion
Prio
rity
One
Number of Weeks
MSMP TRPA TR
Phase B:Intervention Priority One
Phase C:Intervention Priority Two
Phase A2:Follow-Up
Phase A:Baseline
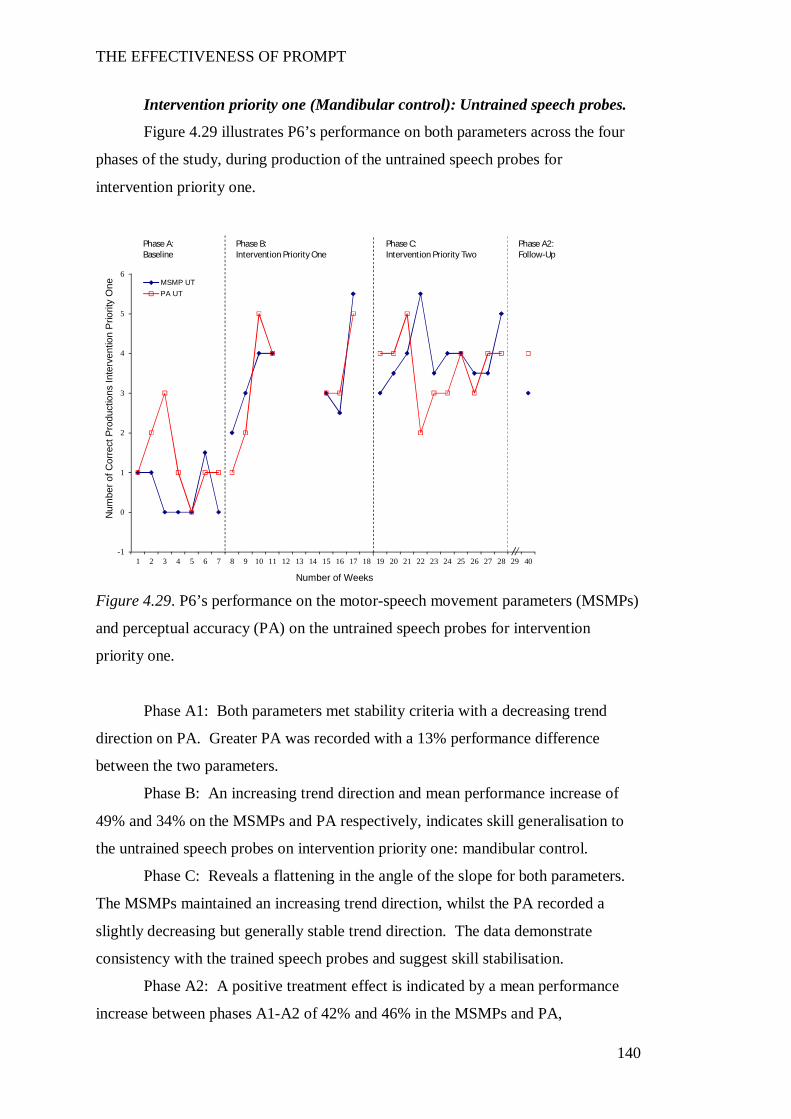
THE EFFECTIVENESS OF PROMPT
140
Intervention priority one (Mandibular control): Untrained speech probes.
Figure 4.29 illustrates P6’s performance on both parameters across the four
phases of the study, during production of the untrained speech probes for
intervention priority one.
Figure 4.29. P6’s performance on the motor-speech movement parameters (MSMPs)
and perceptual accuracy (PA) on the untrained speech probes for intervention
priority one.
Phase A1: Both parameters met stability criteria with a decreasing trend
direction on PA. Greater PA was recorded with a 13% performance difference
between the two parameters.
Phase B: An increasing trend direction and mean performance increase of
49% and 34% on the MSMPs and PA respectively, indicates skill generalisation to
the untrained speech probes on intervention priority one: mandibular control.
Phase C: Reveals a flattening in the angle of the slope for both parameters.
The MSMPs maintained an increasing trend direction, whilst the PA recorded a
slightly decreasing but generally stable trend direction. The data demonstrate
consistency with the trained speech probes and suggest skill stabilisation.
Phase A2: A positive treatment effect is indicated by a mean performance
increase between phases A1-A2 of 42% and 46% in the MSMPs and PA,
-1
0
1
2
3
4
5
6
7
1 2 3 4 5 6 7 8 9 10 11 12 13 14 15 16 17 18 19 20 21 22 23 24 25 26 27 28 29 40
Num
ber o
f Cor
rect
Pro
duct
ions
Inte
rven
tion
Prio
rity
One
Number of Weeks
MSMP UTPA UT
Phase B:Intervention Priority One
Phase C:Intervention Priority Two
Phase A2:Follow-Up
Phase A:Baseline
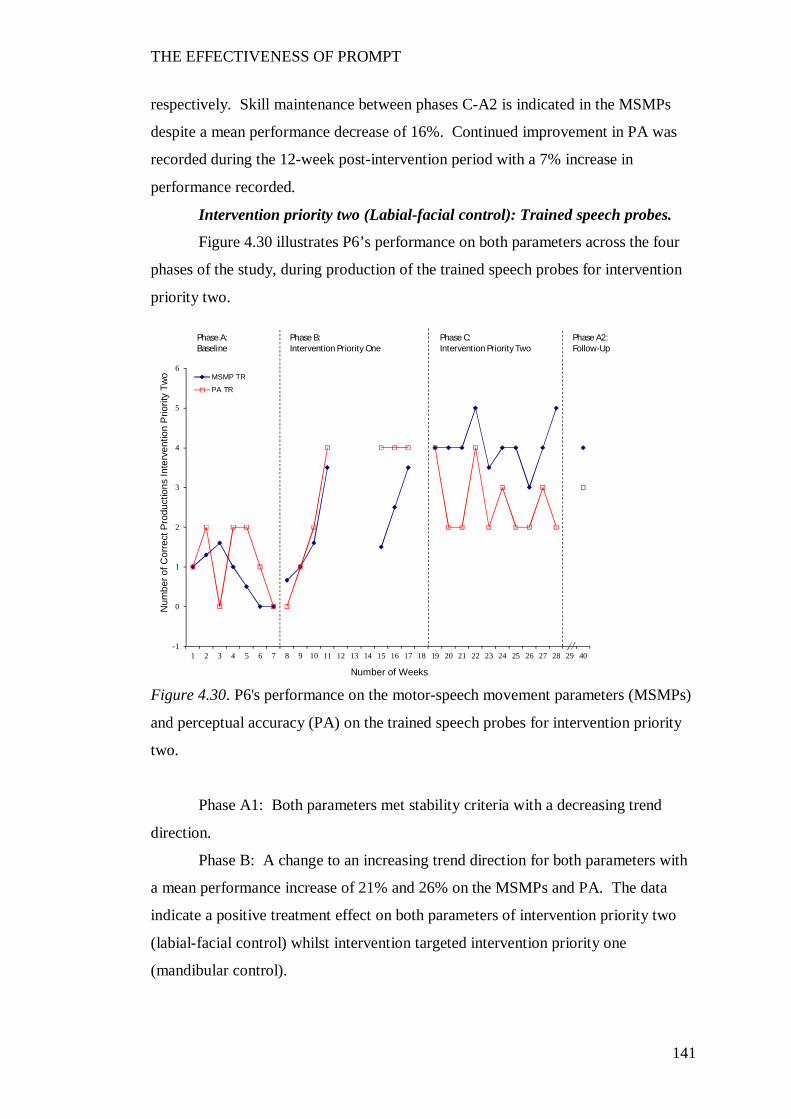
THE EFFECTIVENESS OF PROMPT
141
respectively. Skill maintenance between phases C-A2 is indicated in the MSMPs
despite a mean performance decrease of 16%. Continued improvement in PA was
recorded during the 12-week post-intervention period with a 7% increase in
performance recorded.
Intervention priority two (Labial-facial control): Trained speech probes.
Figure 4.30 illustrates P6’s performance on both parameters across the four
phases of the study, during production of the trained speech probes for intervention
priority two.
Figure 4.30. P6's performance on the motor-speech movement parameters (MSMPs)
and perceptual accuracy (PA) on the trained speech probes for intervention priority
two.
Phase A1: Both parameters met stability criteria with a decreasing trend
direction.
Phase B: A change to an increasing trend direction for both parameters with
a mean performance increase of 21% and 26% on the MSMPs and PA. The data
indicate a positive treatment effect on both parameters of intervention priority two
(labial-facial control) whilst intervention targeted intervention priority one
(mandibular control).
-1
0
1
2
3
4
5
6
7
1 2 3 4 5 6 7 8 9 10 11 12 13 14 15 16 17 18 19 20 21 22 23 24 25 26 27 28 29 40
Num
ber o
f Cor
rect
Pro
duct
ions
Inte
rven
tion
Prio
rity
Two
Number of Weeks
MSMP TR
PA TR
Phase B:Intervention Priority One
Phase C:Intervention Priority Two
Phase A2:Follow-Up
Phase A:Baseline
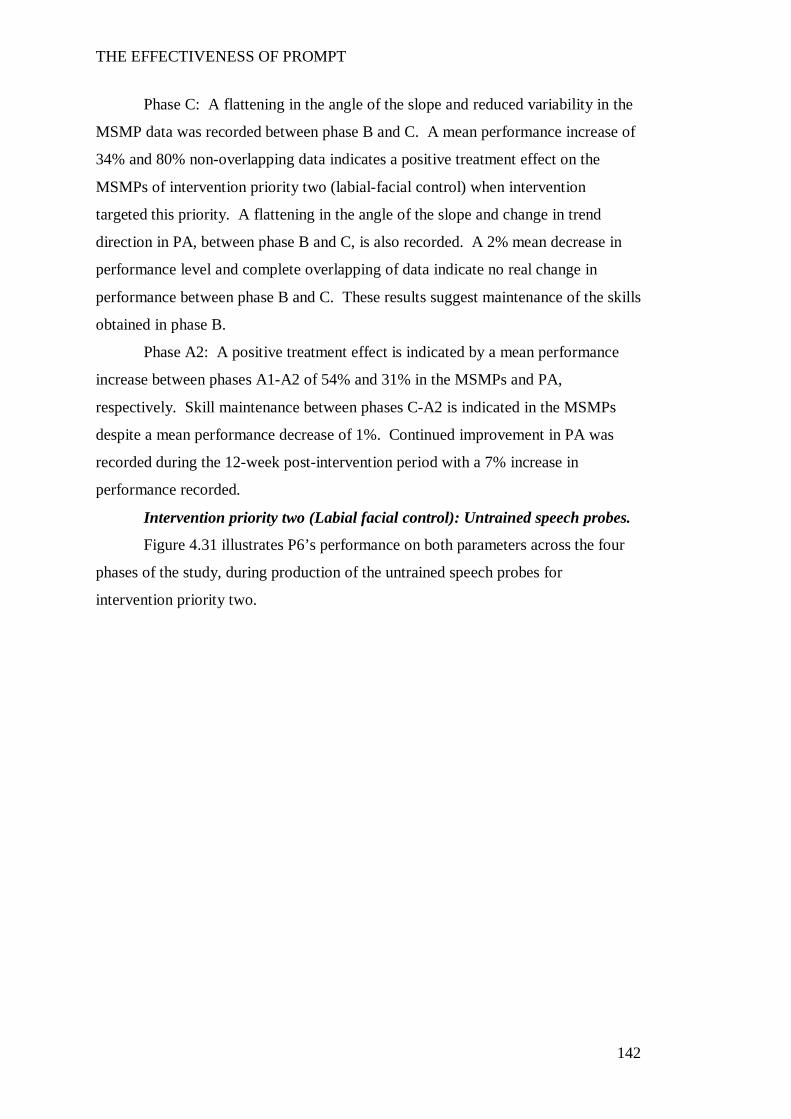
THE EFFECTIVENESS OF PROMPT
142
Phase C: A flattening in the angle of the slope and reduced variability in the
MSMP data was recorded between phase B and C. A mean performance increase of
34% and 80% non-overlapping data indicates a positive treatment effect on the
MSMPs of intervention priority two (labial-facial control) when intervention
targeted this priority. A flattening in the angle of the slope and change in trend
direction in PA, between phase B and C, is also recorded. A 2% mean decrease in
performance level and complete overlapping of data indicate no real change in
performance between phase B and C. These results suggest maintenance of the skills
obtained in phase B.
Phase A2: A positive treatment effect is indicated by a mean performance
increase between phases A1-A2 of 54% and 31% in the MSMPs and PA,
respectively. Skill maintenance between phases C-A2 is indicated in the MSMPs
despite a mean performance decrease of 1%. Continued improvement in PA was
recorded during the 12-week post-intervention period with a 7% increase in
performance recorded.
Intervention priority two (Labial facial control): Untrained speech probes.
Figure 4.31 illustrates P6’s performance on both parameters across the four
phases of the study, during production of the untrained speech probes for
intervention priority two.
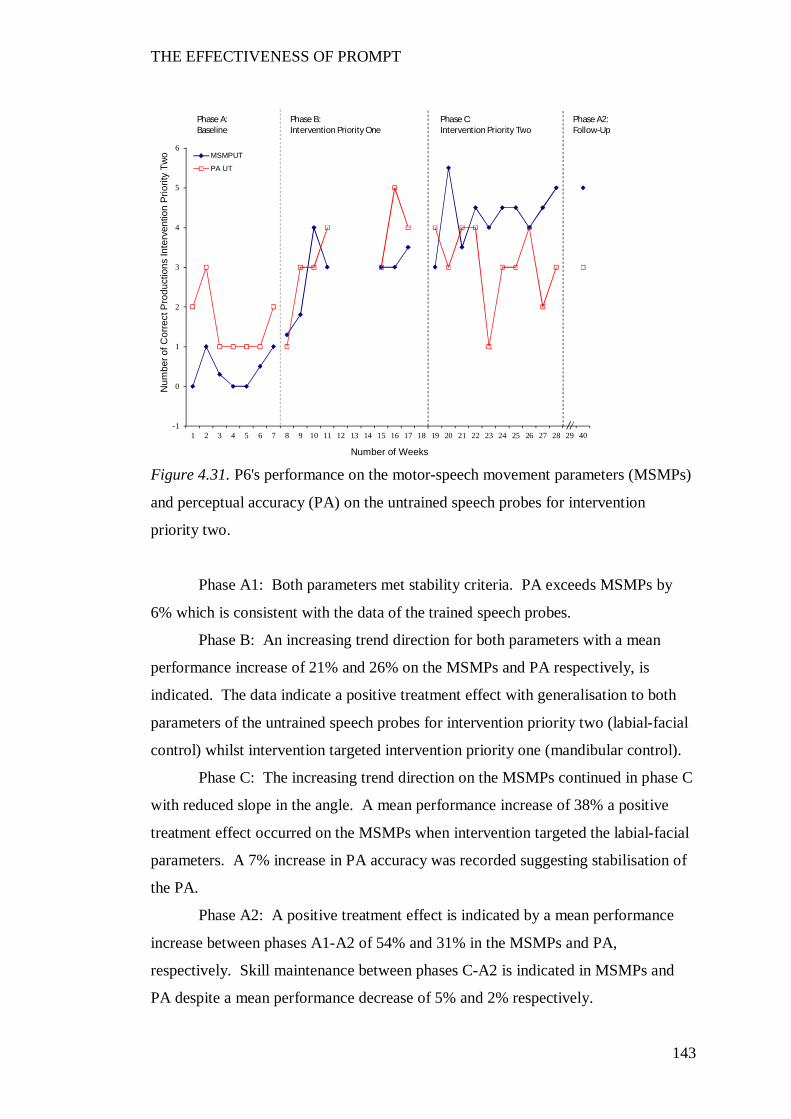
THE EFFECTIVENESS OF PROMPT
143
Figure 4.31. P6's performance on the motor-speech movement parameters (MSMPs)
and perceptual accuracy (PA) on the untrained speech probes for intervention
priority two.
Phase A1: Both parameters met stability criteria. PA exceeds MSMPs by
6% which is consistent with the data of the trained speech probes.
Phase B: An increasing trend direction for both parameters with a mean
performance increase of 21% and 26% on the MSMPs and PA respectively, is
indicated. The data indicate a positive treatment effect with generalisation to both
parameters of the untrained speech probes for intervention priority two (labial-facial
control) whilst intervention targeted intervention priority one (mandibular control).
Phase C: The increasing trend direction on the MSMPs continued in phase C
with reduced slope in the angle. A mean performance increase of 38% a positive
treatment effect occurred on the MSMPs when intervention targeted the labial-facial
parameters. A 7% increase in PA accuracy was recorded suggesting stabilisation of
the PA.
Phase A2: A positive treatment effect is indicated by a mean performance
increase between phases A1-A2 of 54% and 31% in the MSMPs and PA,
respectively. Skill maintenance between phases C-A2 is indicated in MSMPs and
PA despite a mean performance decrease of 5% and 2% respectively.
-1
0
1
2
3
4
5
6
7
1 2 3 4 5 6 7 8 9 10 11 12 13 14 15 16 17 18 19 20 21 22 23 24 25 26 27 28 29 40
Num
ber o
f Cor
rect
Pro
duct
ions
Inte
rven
tion
Prio
rity
Two
Number of Weeks
MSMPUT
PA UT
Phase B:Intervention Priority One
Phase C:Intervention Priority Two
Phase A2:Follow-Up
Phase A:Baseline
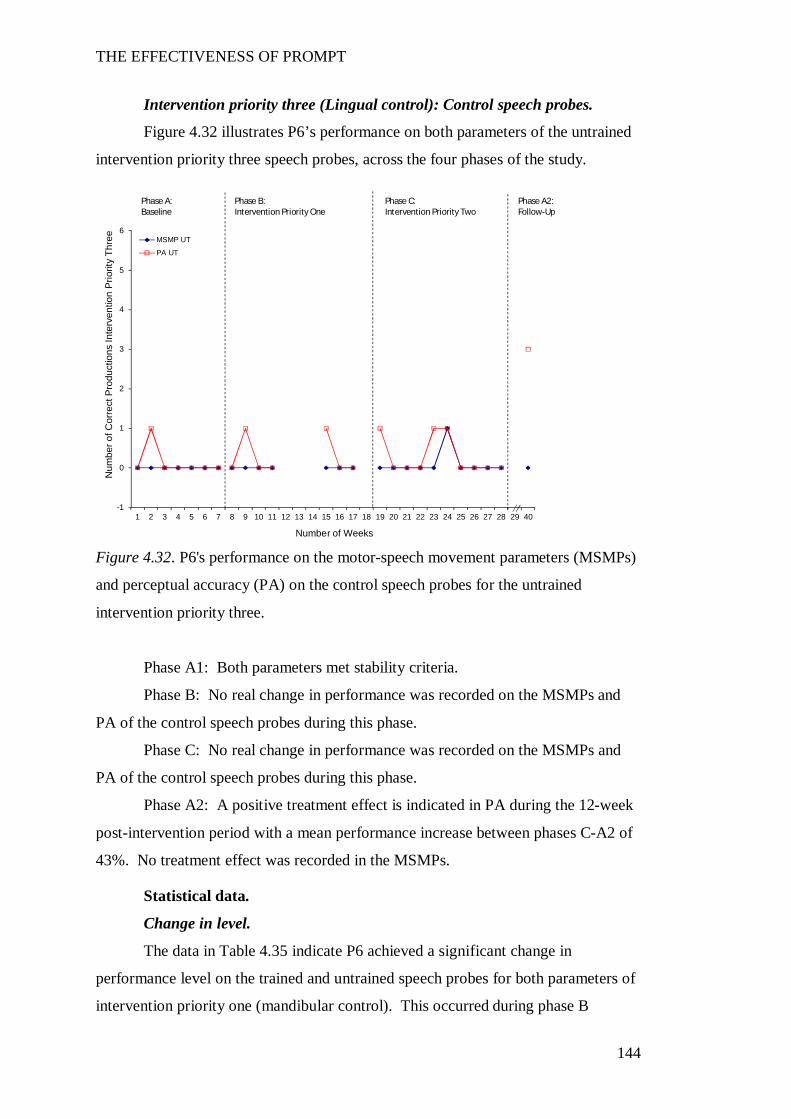
THE EFFECTIVENESS OF PROMPT
144
Intervention priority three (Lingual control): Control speech probes.
Figure 4.32 illustrates P6’s performance on both parameters of the untrained
intervention priority three speech probes, across the four phases of the study.
Figure 4.32. P6's performance on the motor-speech movement parameters (MSMPs)
and perceptual accuracy (PA) on the control speech probes for the untrained
intervention priority three.
Phase A1: Both parameters met stability criteria.
Phase B: No real change in performance was recorded on the MSMPs and
PA of the control speech probes during this phase.
Phase C: No real change in performance was recorded on the MSMPs and
PA of the control speech probes during this phase.
Phase A2: A positive treatment effect is indicated in PA during the 12-week
post-intervention period with a mean performance increase between phases C-A2 of
43%. No treatment effect was recorded in the MSMPs.
Statistical data.
Change in level.
The data in Table 4.35 indicate P6 achieved a significant change in
performance level on the trained and untrained speech probes for both parameters of
intervention priority one (mandibular control). This occurred during phase B
-1
0
1
2
3
4
5
6
7
1 2 3 4 5 6 7 8 9 10 11 12 13 14 15 16 17 18 19 20 21 22 23 24 25 26 27 28 29 40
Num
ber o
f Cor
rect
Pro
duct
ions
Inte
rven
tion
Prio
rity
Thre
e
Number of Weeks
MSMP UT
PA UT
Phase B:Intervention Priority One
Phase C:Intervention Priority Two
Phase A2:Follow-Up
Phase A:Baseline
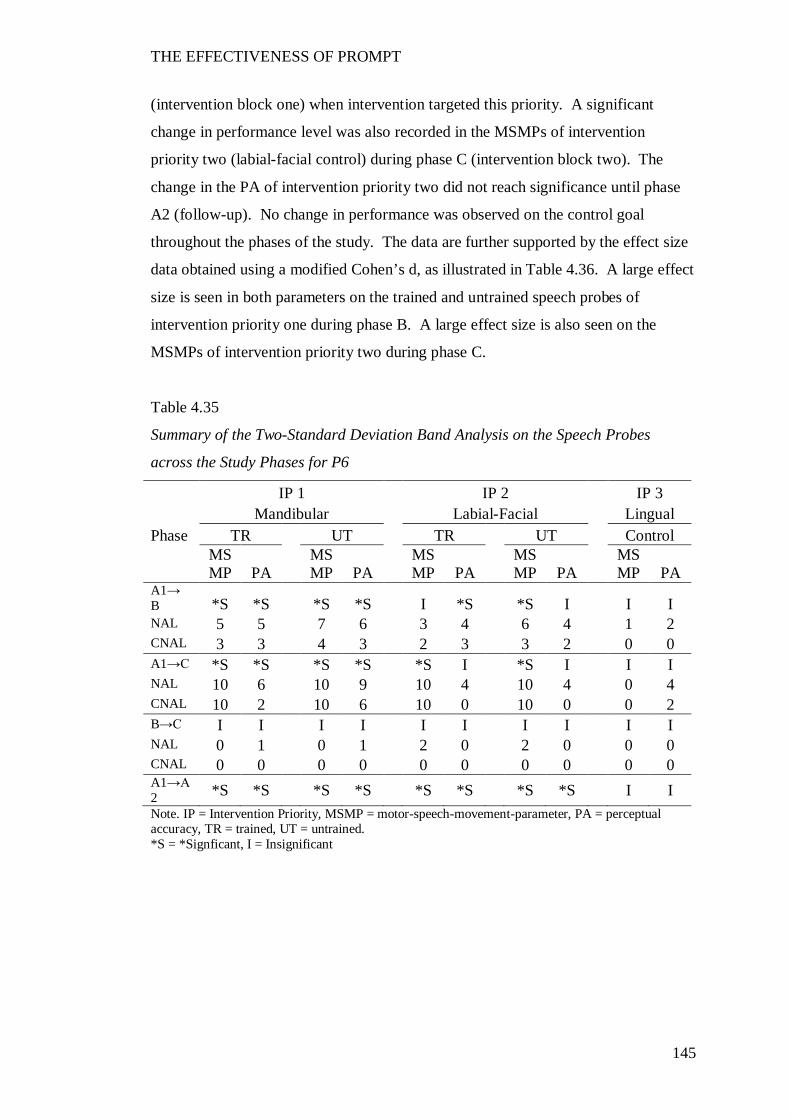
THE EFFECTIVENESS OF PROMPT
145
(intervention block one) when intervention targeted this priority. A significant
change in performance level was also recorded in the MSMPs of intervention
priority two (labial-facial control) during phase C (intervention block two). The
change in the PA of intervention priority two did not reach significance until phase
A2 (follow-up). No change in performance was observed on the control goal
throughout the phases of the study. The data are further supported by the effect size
data obtained using a modified Cohen’s d, as illustrated in Table 4.36. A large effect
size is seen in both parameters on the trained and untrained speech probes of
intervention priority one during phase B. A large effect size is also seen on the
MSMPs of intervention priority two during phase C.
Table 4.35
Summary of the Two-Standard Deviation Band Analysis on the Speech Probes
across the Study Phases for P6
IP 1 IP 2 IP 3 Mandibular Labial-Facial Lingual Phase TR UT TR UT Control
MSMP PA
MSMP PA
MSMP PA
MSMP PA
MSMP PA
A1→ B *S *S *S *S I *S *S I I I NAL 5 5 7 6 3 4 6 4 1 2 CNAL 3 3 4 3 2 3 3 2 0 0 A1→C *S *S *S *S *S I *S I I I NAL 10 6 10 9 10 4 10 4 0 4 CNAL 10 2 10 6 10 0 10 0 0 2 B→C I I I I I I I I I I NAL 0 1 0 1 2 0 2 0 0 0 CNAL 0 0 0 0 0 0 0 0 0 0 A1→A2 *S *S *S *S *S *S *S *S I I Note. IP = Intervention Priority, MSMP = motor-speech-movement-parameter, PA = perceptual accuracy, TR = trained, UT = untrained. *S = *Signficant, I = Insignificant
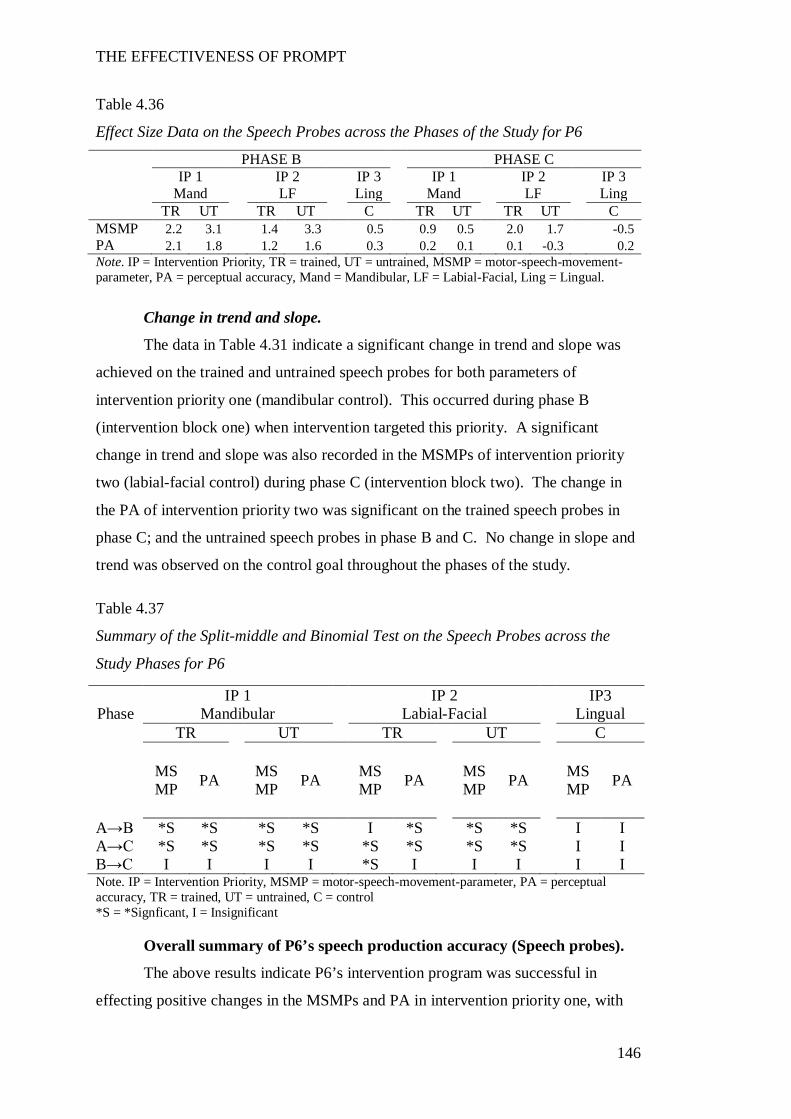
THE EFFECTIVENESS OF PROMPT
146
Table 4.36
Effect Size Data on the Speech Probes across the Phases of the Study for P6
PHASE B PHASE C IP 1 IP 2 IP 3 IP 1 IP 2 IP 3 Mand LF Ling Mand LF Ling TR UT TR UT C TR UT TR UT C MSMP 2.2 3.1 1.4 3.3 0.5 0.9 0.5 2.0 1.7 -0.5 PA 2.1 1.8 1.2 1.6 0.3 0.2 0.1 0.1 -0.3 0.2 Note. IP = Intervention Priority, TR = trained, UT = untrained, MSMP = motor-speech-movement-parameter, PA = perceptual accuracy, Mand = Mandibular, LF = Labial-Facial, Ling = Lingual.
Change in trend and slope.
The data in Table 4.31 indicate a significant change in trend and slope was
achieved on the trained and untrained speech probes for both parameters of
intervention priority one (mandibular control). This occurred during phase B
(intervention block one) when intervention targeted this priority. A significant
change in trend and slope was also recorded in the MSMPs of intervention priority
two (labial-facial control) during phase C (intervention block two). The change in
the PA of intervention priority two was significant on the trained speech probes in
phase C; and the untrained speech probes in phase B and C. No change in slope and
trend was observed on the control goal throughout the phases of the study.
Table 4.37
Summary of the Split-middle and Binomial Test on the Speech Probes across the
Study Phases for P6
Note. IP = Intervention Priority, MSMP = motor-speech-movement-parameter, PA = perceptual accuracy, TR = trained, UT = untrained, C = control *S = *Signficant, I = Insignificant
Overall summary of P6’s speech production accuracy (Speech probes).
The above results indicate P6’s intervention program was successful in
effecting positive changes in the MSMPs and PA in intervention priority one, with
IP 1 IP 2 IP3 Phase Mandibular Labial-Facial Lingual
TR UT TR UT C
MSMP PA MS
MP PA MSMP PA MS
MP PA MSMP PA
A→B *S *S *S *S I *S *S *S I I A→C *S *S *S *S *S *S *S *S I I B→C I I I I *S I I I I I
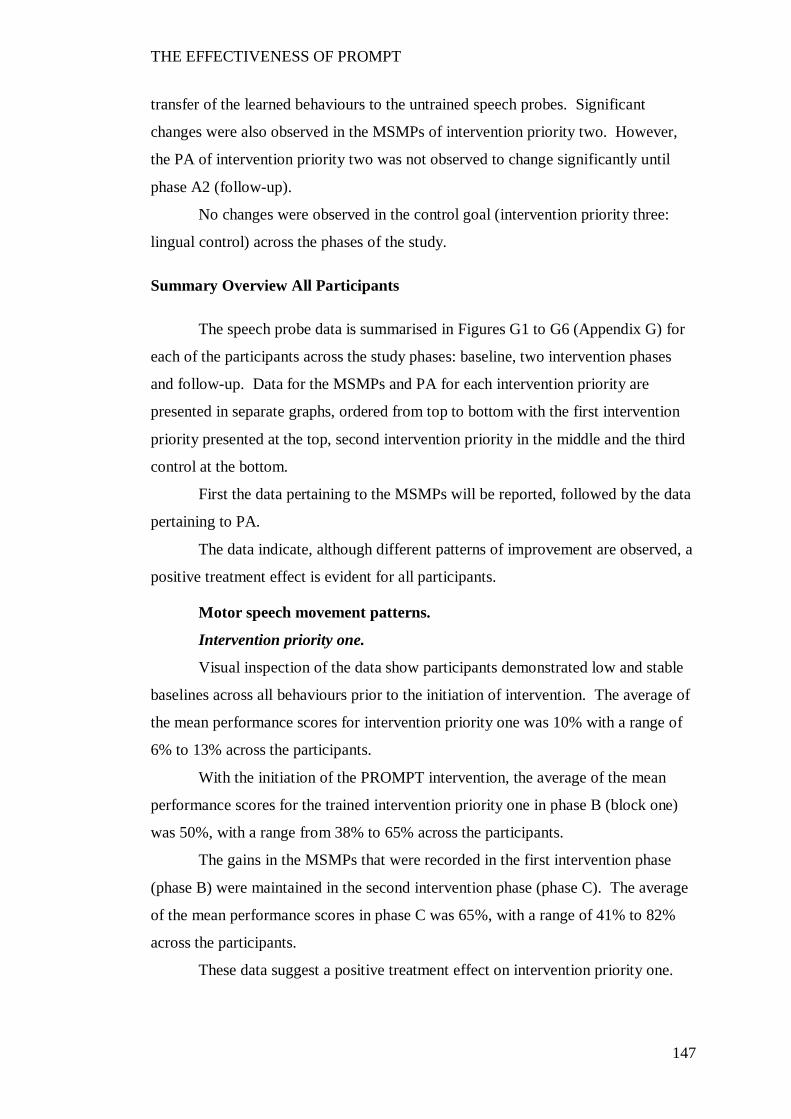
THE EFFECTIVENESS OF PROMPT
147
transfer of the learned behaviours to the untrained speech probes. Significant
changes were also observed in the MSMPs of intervention priority two. However,
the PA of intervention priority two was not observed to change significantly until
phase A2 (follow-up).
No changes were observed in the control goal (intervention priority three:
lingual control) across the phases of the study.
Summary Overview All Participants
The speech probe data is summarised in Figures G1 to G6 (Appendix G) for
each of the participants across the study phases: baseline, two intervention phases
and follow-up. Data for the MSMPs and PA for each intervention priority are
presented in separate graphs, ordered from top to bottom with the first intervention
priority presented at the top, second intervention priority in the middle and the third
control at the bottom.
First the data pertaining to the MSMPs will be reported, followed by the data
pertaining to PA.
The data indicate, although different patterns of improvement are observed, a
positive treatment effect is evident for all participants.
Motor speech movement patterns.
Intervention priority one.
Visual inspection of the data show participants demonstrated low and stable
baselines across all behaviours prior to the initiation of intervention. The average of
the mean performance scores for intervention priority one was 10% with a range of
6% to 13% across the participants.
With the initiation of the PROMPT intervention, the average of the mean
performance scores for the trained intervention priority one in phase B (block one)
was 50%, with a range from 38% to 65% across the participants.
The gains in the MSMPs that were recorded in the first intervention phase
(phase B) were maintained in the second intervention phase (phase C). The average
of the mean performance scores in phase C was 65%, with a range of 41% to 82%
across the participants.
These data suggest a positive treatment effect on intervention priority one.
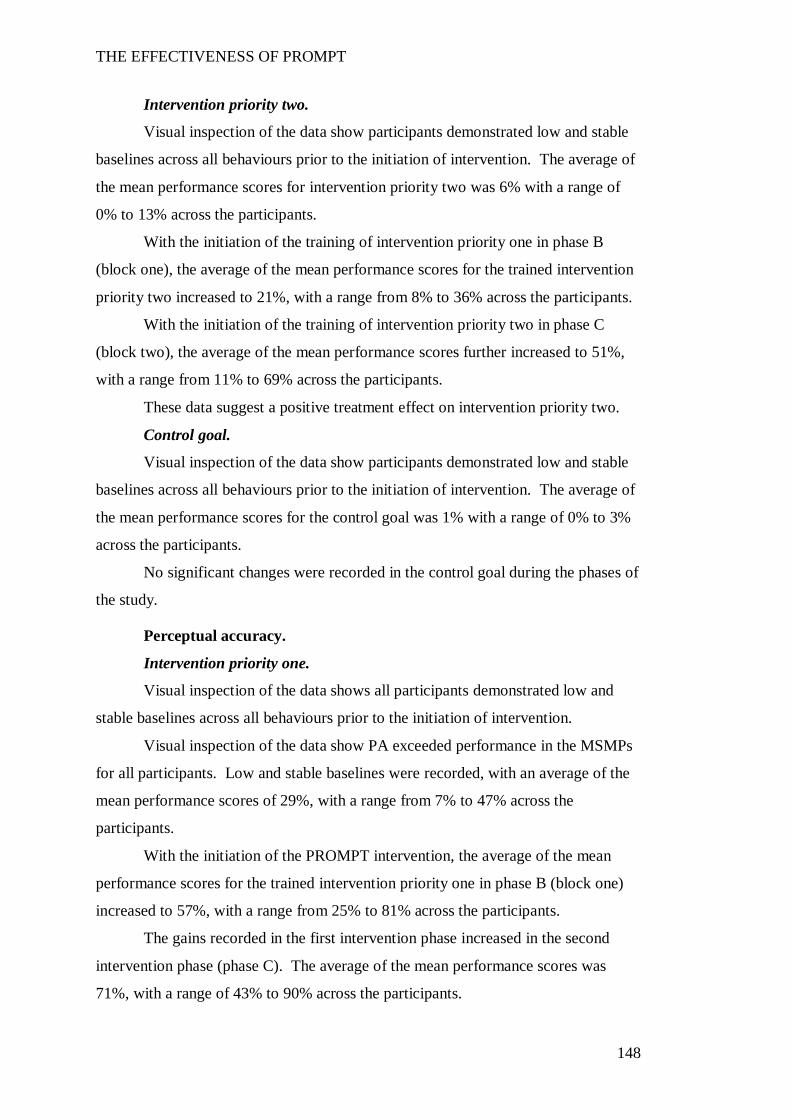
THE EFFECTIVENESS OF PROMPT
148
Intervention priority two.
Visual inspection of the data show participants demonstrated low and stable
baselines across all behaviours prior to the initiation of intervention. The average of
the mean performance scores for intervention priority two was 6% with a range of
0% to 13% across the participants.
With the initiation of the training of intervention priority one in phase B
(block one), the average of the mean performance scores for the trained intervention
priority two increased to 21%, with a range from 8% to 36% across the participants.
With the initiation of the training of intervention priority two in phase C
(block two), the average of the mean performance scores further increased to 51%,
with a range from 11% to 69% across the participants.
These data suggest a positive treatment effect on intervention priority two.
Control goal.
Visual inspection of the data show participants demonstrated low and stable
baselines across all behaviours prior to the initiation of intervention. The average of
the mean performance scores for the control goal was 1% with a range of 0% to 3%
across the participants.
No significant changes were recorded in the control goal during the phases of
the study.
Perceptual accuracy.
Intervention priority one.
Visual inspection of the data shows all participants demonstrated low and
stable baselines across all behaviours prior to the initiation of intervention.
Visual inspection of the data show PA exceeded performance in the MSMPs
for all participants. Low and stable baselines were recorded, with an average of the
mean performance scores of 29%, with a range from 7% to 47% across the
participants.
With the initiation of the PROMPT intervention, the average of the mean
performance scores for the trained intervention priority one in phase B (block one)
increased to 57%, with a range from 25% to 81% across the participants.
The gains recorded in the first intervention phase increased in the second
intervention phase (phase C). The average of the mean performance scores was
71%, with a range of 43% to 90% across the participants.
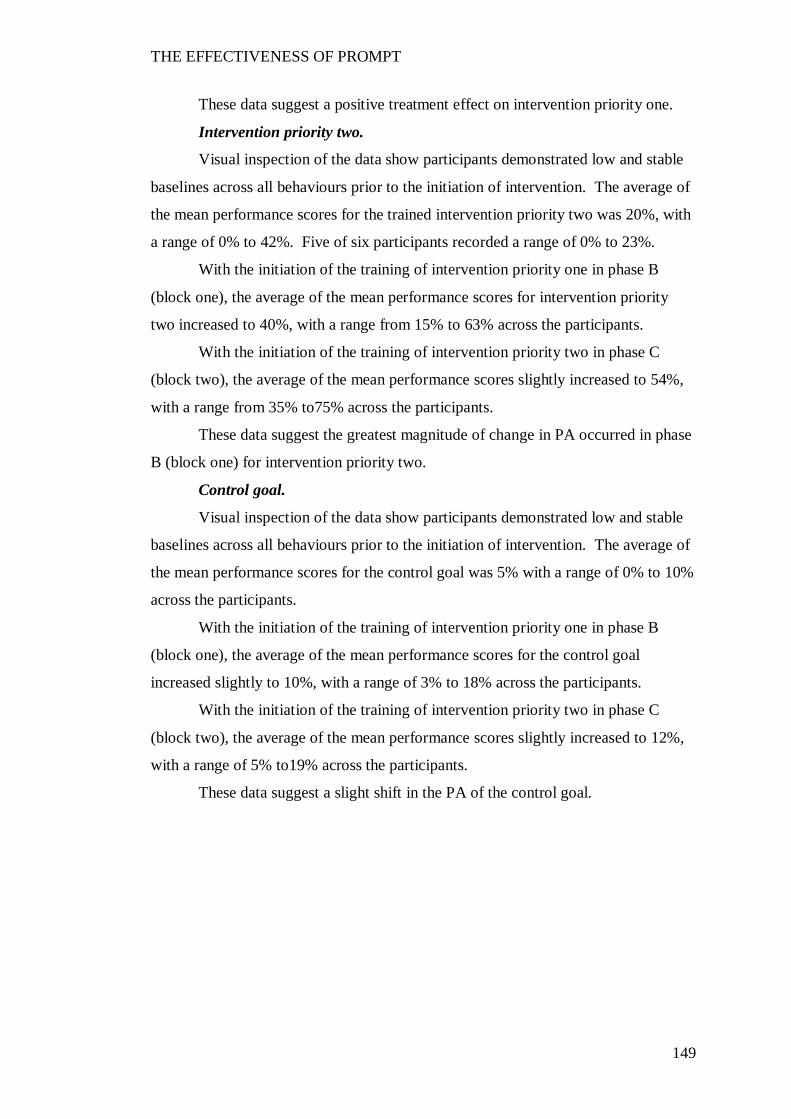
THE EFFECTIVENESS OF PROMPT
149
These data suggest a positive treatment effect on intervention priority one.
Intervention priority two.
Visual inspection of the data show participants demonstrated low and stable
baselines across all behaviours prior to the initiation of intervention. The average of
the mean performance scores for the trained intervention priority two was 20%, with
a range of 0% to 42%. Five of six participants recorded a range of 0% to 23%.
With the initiation of the training of intervention priority one in phase B
(block one), the average of the mean performance scores for intervention priority
two increased to 40%, with a range from 15% to 63% across the participants.
With the initiation of the training of intervention priority two in phase C
(block two), the average of the mean performance scores slightly increased to 54%,
with a range from 35% to75% across the participants.
These data suggest the greatest magnitude of change in PA occurred in phase
B (block one) for intervention priority two.
Control goal.
Visual inspection of the data show participants demonstrated low and stable
baselines across all behaviours prior to the initiation of intervention. The average of
the mean performance scores for the control goal was 5% with a range of 0% to 10%
across the participants.
With the initiation of the training of intervention priority one in phase B
(block one), the average of the mean performance scores for the control goal
increased slightly to 10%, with a range of 3% to 18% across the participants.
With the initiation of the training of intervention priority two in phase C
(block two), the average of the mean performance scores slightly increased to 12%,
with a range of 5% to19% across the participants.
These data suggest a slight shift in the PA of the control goal.
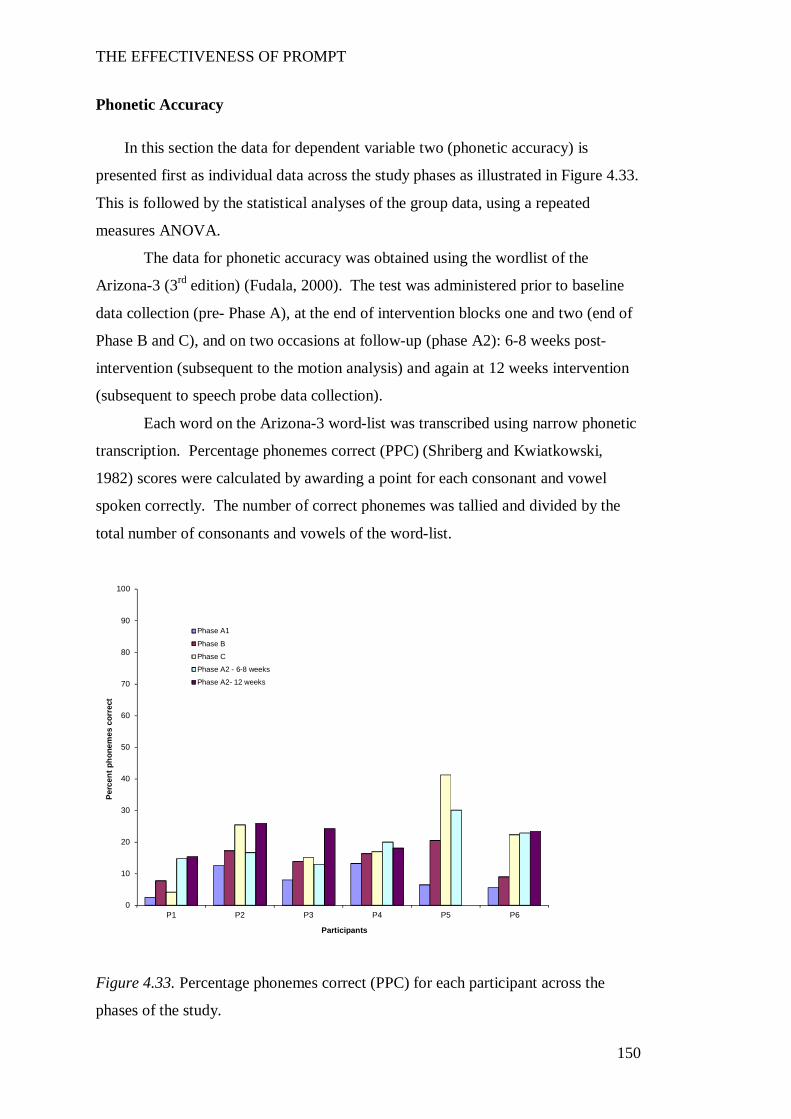
THE EFFECTIVENESS OF PROMPT
150
Phonetic Accuracy
In this section the data for dependent variable two (phonetic accuracy) is
presented first as individual data across the study phases as illustrated in Figure 4.33.
This is followed by the statistical analyses of the group data, using a repeated
measures ANOVA.
The data for phonetic accuracy was obtained using the wordlist of the
Arizona-3 (3rd edition) (Fudala, 2000). The test was administered prior to baseline
data collection (pre- Phase A), at the end of intervention blocks one and two (end of
Phase B and C), and on two occasions at follow-up (phase A2): 6-8 weeks post-
intervention (subsequent to the motion analysis) and again at 12 weeks intervention
(subsequent to speech probe data collection).
Each word on the Arizona-3 word-list was transcribed using narrow phonetic
transcription. Percentage phonemes correct (PPC) (Shriberg and Kwiatkowski,
1982) scores were calculated by awarding a point for each consonant and vowel
spoken correctly. The number of correct phonemes was tallied and divided by the
total number of consonants and vowels of the word-list.
Figure 4.33. Percentage phonemes correct (PPC) for each participant across the
phases of the study.
0
10
20
30
40
50
60
70
80
90
100
P1 P2 P3 P4 P5 P6
Perc
ent p
hone
mes
cor
rect
Participants
Phase A1
Phase B
Phase C
Phase A2 - 6-8 weeks
Phase A2- 12 weeks
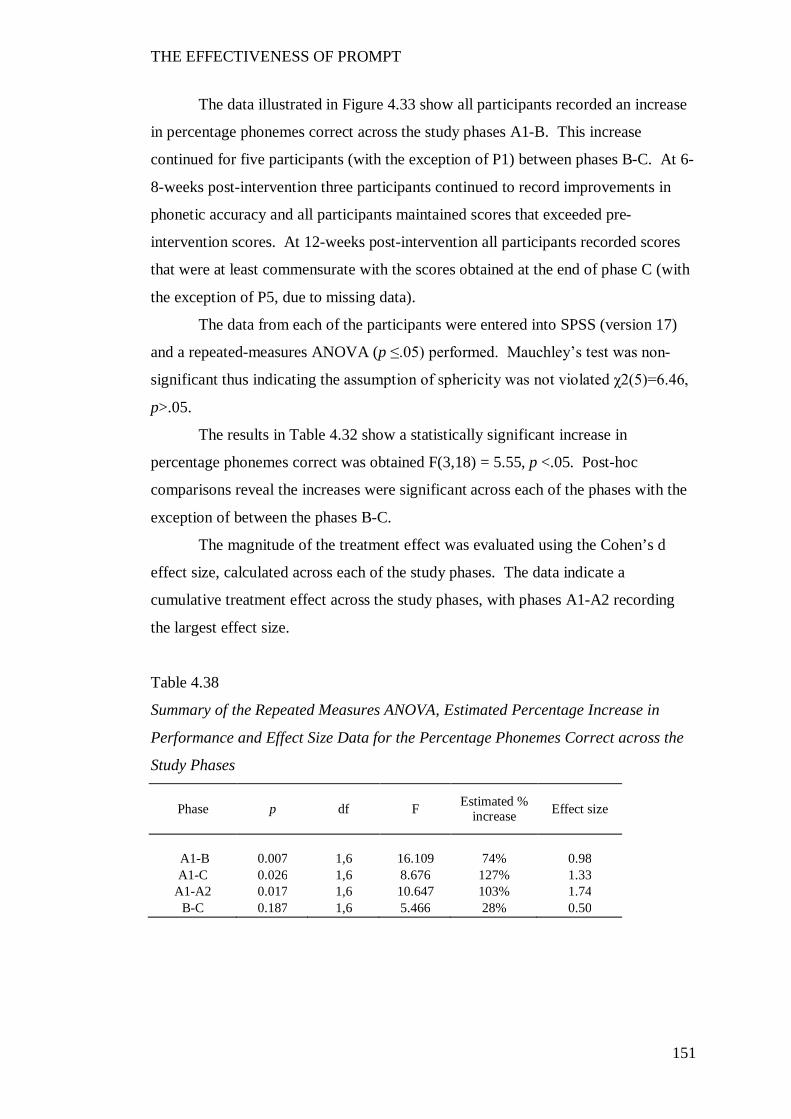
THE EFFECTIVENESS OF PROMPT
151
The data illustrated in Figure 4.33 show all participants recorded an increase
in percentage phonemes correct across the study phases A1-B. This increase
continued for five participants (with the exception of P1) between phases B-C. At 6-
8-weeks post-intervention three participants continued to record improvements in
phonetic accuracy and all participants maintained scores that exceeded pre-
intervention scores. At 12-weeks post-intervention all participants recorded scores
that were at least commensurate with the scores obtained at the end of phase C (with
the exception of P5, due to missing data).
The data from each of the participants were entered into SPSS (version 17)
and a repeated-measures ANOVA (p ≤.05) performed. Mauchley’s test was non-
significant thus indicating the assumption of sphericity was not violated χ2(5)=6.46,
p>.05.
The results in Table 4.32 show a statistically significant increase in
percentage phonemes correct was obtained F(3,18) = 5.55, p <.05. Post-hoc
comparisons reveal the increases were significant across each of the phases with the
exception of between the phases B-C.
The magnitude of the treatment effect was evaluated using the Cohen’s d
effect size, calculated across each of the study phases. The data indicate a
cumulative treatment effect across the study phases, with phases A1-A2 recording
the largest effect size.
Table 4.38
Summary of the Repeated Measures ANOVA, Estimated Percentage Increase in
Performance and Effect Size Data for the Percentage Phonemes Correct across the
Study Phases
Phase p df F Estimated % increase Effect size
A1-B 0.007 1,6 16.109 74% 0.98 A1-C 0.026 1,6 8.676 127% 1.33
A1-A2 0.017 1,6 10.647 103% 1.74 B-C 0.187 1,6 5.466 28% 0.50
THE EFFECTIVENESS OF PROMPT
152
Motor-Speech Control
In this section the data for dependent variable four (motor-speech control) is
presented as individual data.
The Verbal Motor Production Assessment for Children (VMPAC) (Hayden
& Square, 1999) assesses five areas of motor speech control: 1. Global Motor
Control, 2. Focal Control, 3.Sequencing, 4. Connected Speech and Language
Control, and 5. Speech Characteristics. Each area is scored to yield a percentage
correct score.
The test was administered on two occasions: prior to the commencement of
the baseline data collection (pre phase A1) and again at 6-8-weeks follow-up (phase
A2).
Figure 4.34 summarises the pre (prior to phase A1) and post-intervention
(Phase A2) performance scores obtained by each of the participants on each subtest
of motor-speech-control. Each motor-speech-control score is represented on the Y
axis to a maximum possible score of 500% (i.e., 5 x 100%).
Whilst the profiles of improvement are different for each participant, three
areas recorded the most change overall: speech characteristics, sequencing and focal
oromotor control. Minimal change was observed in the area of connected speech
and language control, with one participant each recording a positive (participant five)
and negative (participant four) change.
No change was expected in the area of global motor as this area assesses
tone, reflexes and vegetative functions. P5 and P6 demonstrated a 5% improvement
in this area. Review of the raw data indicated this improvement occurred as a result
of improved control in sequential swallowing during drinking. The two youngest
participants demonstrated the most improvement – P5 improved in all five areas,
whilst P6 improved in four. P4 demonstrated the least change, recording
improvement in the area of sequencing control only.
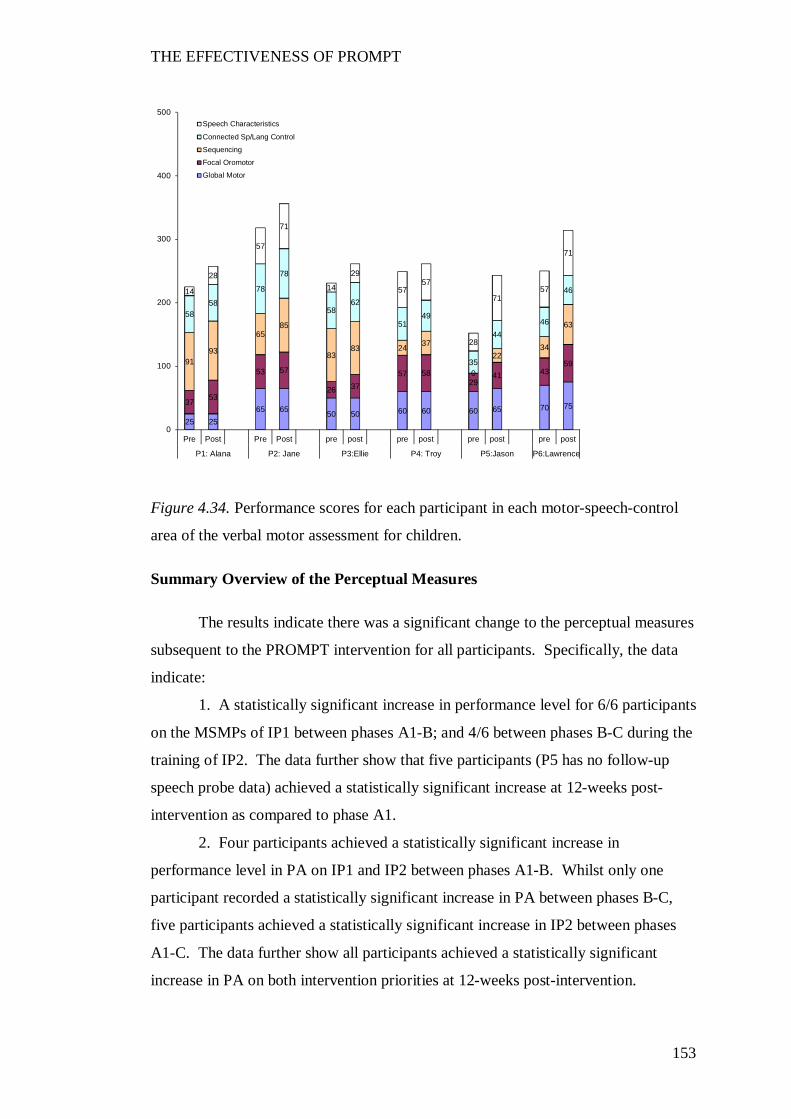
THE EFFECTIVENESS OF PROMPT
153
Figure 4.34. Performance scores for each participant in each motor-speech-control
area of the verbal motor assessment for children.
Summary Overview of the Perceptual Measures
The results indicate there was a significant change to the perceptual measures
subsequent to the PROMPT intervention for all participants. Specifically, the data
indicate:
1. A statistically significant increase in performance level for 6/6 participants
on the MSMPs of IP1 between phases A1-B; and 4/6 between phases B-C during the
training of IP2. The data further show that five participants (P5 has no follow-up
speech probe data) achieved a statistically significant increase at 12-weeks post-
intervention as compared to phase A1.
2. Four participants achieved a statistically significant increase in
performance level in PA on IP1 and IP2 between phases A1-B. Whilst only one
participant recorded a statistically significant increase in PA between phases B-C,
five participants achieved a statistically significant increase in IP2 between phases
A1-C. The data further show all participants achieved a statistically significant
increase in PA on both intervention priorities at 12-weeks post-intervention.
25 2565 65 50 50 60 60 60 65 70 7537 53
53 57
26 3757 58
2941 43
599193
6585
8383 24 37
0
2234
6358
58
78
78
5862
5149
35
4446
4614
28
57
71
14
29
5757
28
7157
71
0
100
200
300
400
500
Pre Post Pre Post pre post pre post pre post pre post
P1: Alana P2: Jane P3:Ellie P4: Troy P5:Jason P6:Lawrence
Speech Characteristics
Connected Sp/Lang Control
Sequencing
Focal Oromotor
Global Motor
THE EFFECTIVENESS OF PROMPT
154
3. All participants recorded data that indicated improved phonetic accuracy
across the study phases, as indicated by a statistically significant increase in the
percentage phonemes correct scores F(3,18) = 5.55, p<.05.
The magnitude of the treatment effect was evaluated using the Cohen’s d
effect size, calculated across each of the study phases. The data indicate a
cumulative treatment effect for all perceptual outcome measures across the study
phases, with phases A1-B and A1-A2 recording the largest effect size.
THE EFFECTIVENESS OF PROMPT
155
Discussion
In this section the effectiveness of PROMPT in facilitating changes to the
perceptual measurements of speech production and phonetic accuracy of children
with CP, are discussed. It was hypothesised that therapy aimed at maximising motor
speech control would improve the speech production accuracy in children with
moderate-to-severe speech impairment.
Speech Production Accuracy
The findings of this study show all participants recorded substantial change
in speech production accuracy. Speech production was assessed for both perceptual
accuracy (PA) and attainment of the targeted motor-speech movement pattern
(MSMP) using weekly speech probes. All participants recorded changes on the
trained and untrained speech probes for the intervention priorities targeted during
both intervention phases of the study. There was no significant change to the control
word-sets thus providing evidence that the changes in perceptual accuracy and motor
speech movement patterns were due to the therapy and not as a result of maturation
or chance.
The use of a SSRD, with two inter-hierarchical phases of intervention, has
provided the opportunity to evaluate the time course of motor learning in terms of
skill acquisition, consolidation, savings and interference to achieve accurate speech
production (Doyon, 2008; Kostrubiec et al., 2006; Landi et al., 2011; Luft &
Buitrago, 2005; Savion-Lemieux & Penhume, 2010; Schmidt & Lee, 2005;
Shumway-Cook & Woollacott, 2012; Zanone & Kelso, 1997). Specifically, the
initial relatively short-term skill acquisition of the first intervention priority in
intervention block one was compared to the ongoing skill acquisition/consolidation
of that same skill, during a second intervention phase that targeted a second
intervention priority. The subsequent introduction of a second intervention priority
during the second intervention phase presented the opportunity to make observations
regarding anterograde interference. Anterograde interference is the effect of therapy
on the first intervention priority during the training of the second intervention
priority. The weekly speech probes collected at the end of each treatment session in
THE EFFECTIVENESS OF PROMPT
156
this study allow for evaluation of variability/stability in performance between
treatment sessions across the study phases.
Intervention priority one.
Phase B: Change in rate and performance level.
The results, obtained on the first intervention priority in the first intervention
phase (phase B) show all participants with the exception of P1, recorded relatively
rapid short-term gains. This was indicated by the steeply accelerating trend in the
celeration line (SM binomial) of the data for five participants (P2-P6). The results
for one participant (P1) suggest delayed skill acquisition with limited change from
baseline data until week eight, where a rapid gain followed by gradual skill
acquisition was observed. All participants recorded a significant change in
performance level of the MSMPs as demonstrated using the 2SD band method,
whilst 4 of the 6 participants (not P4 and P5) also recorded a significant change in
performance in PA.
The results of this study are similar to the two patterns of motor learning
reported in intervention studies aimed at developing complex motor control skills in
children with cerebral palsy (Logan et al., 2008; Love, 1992; Newell, 2003). The
first pattern, defined by an initial rapid and immediate change followed by
incremental improvement, was observed in P2 through P6. The second pattern,
defined by small and gradual change that continues throughout the intervention
phase, was observed in P1 who differed from the other participants in terms of
diagnosis, age and intervention priorities targeted.
The data for one of the participants (P6) supported the notion of prior
experience laying down a memory that allowed for faster subsequent re-learning or
what the literature refers to as “savings”(Landi et al., 2011; Seidler & Noll, 2008; M.
A. Smith et al., 2006). The observation of the phenomenon of savings in this study
arose as a consequence of this participant missing three successive intervention
sessions due to a family vacation. Upon resumption of therapy, this participant
recorded results that exceeded the performance level of the initial four sessions
recorded prior to going on vacation. Barnes and Whinnery (2002) also report similar
data on one participant who showed progress beyond results obtained during initial
training, upon resumption of training after a break in intervention.
THE EFFECTIVENESS OF PROMPT
157
Two different theoretical perspectives are offered in this thesis for the
interpretation of savings. Smith et al. (2006) suggest the rapid short-term acquisition
phase and ability for retention can be attributed to a rapid two-state model of
adaptation. This two-state model of adaptation consists of an initial process that
shows a strong adaptive response by the end of initial training but does not retain
information well. The second, faster adaptive process shows little adaptation by the
end of initial training but has a strong retention of information. With initial learning
of a task it is hypothesised that both of these processes are operating at zero. When
re-learning a task, the internal model is not at zero because the second adaptive
response has retained some memory and is therefore already biased to learning.
The second model, based on the work of Huang, Haith, Mazzoni and
Krakauer (2011) suggests the process of faster relearning is not a consequence of
adaptation but rather a result of additional processes related to use-dependent
plasticity and reinforcement. They propose a model of relearning that focuses on the
retention of motor memories due to reinforcement as a consequence of successful
target attainment.
Despite the lack of a consistent interpretation regarding the underlying
processes, the observation of savings in the data set was unexpected given the
literature reports children with CP are less successful in learning sequences and take
longer to learn tasks (Gagliardi, Tavano, Turconi, Pozzoli, & Borgatti, 2011).
Indeed, Garvey (2007) suggests off-line learning is probably absent in children with
CP. However, the data recorded by P6 suggests it is possible for children with CP to
not only achieve relatively rapid adaptation to the new motor task after four weeks of
intervention but also show evidence of faster re-learning upon resumption of therapy.
There is a paucity of, as well as diversity in the design of, experimental
speech treatment studies investigating the efficacy of intervention for children with
CP. This makes it difficult to benchmark the rate of change observed in the
dependent variables of this study against other experimental studies aimed
specifically at speech production. For example, whilst Marchant, McCauliffe and
Huckabee (2008) conducted an ABACA design aimed at improving the speech
intelligibility of a single participant with spastic quadriparesis CP, the study differed
in intensity and therapy type. In addition, the absence of longitudinal graphs (only
means and standard deviations were reported) makes it difficult to visually inspect
the data to compare the rate of change. Wu and Jeng (2004) also report on the
THE EFFECTIVENESS OF PROMPT
158
effects of a motor based intervention in a single subject with CP, aged 11 years.
However, whilst they provide graphs of the intervention phase no data are shown or
reported for the baseline phase, thus making it difficult to interpret the effects of
intervention and rate of change.
One motor-speech SSRD intervention study, conducted by Strand, Stoekel
and Baas (2006), despite targeting a different clinical population (childhood apraxia
of speech), is relevant to this thesis for two reasons. Firstly, the motor speech
treatment approach under investigation applied tactile-kinaesthetic input (dynamic
temporal and tactile cueing). Although this technique differs from PROMPT it does
emphasise the “shaping of movement gestures for speech production” (p. 298), that
is, the use of tactile input to guide articulatory movements. Secondly, one of the four
participants of the study presented with a concomitant diagnosis of dysarthria (in the
absence of a diagnosis of CP). Though the data reported on the participant of
interest to this study are limited to eight words, visual inspection of the illustrated
graphs by this author, seems to also suggest two patterns of learning that appear
related to word complexity. That is, the words “no”, “pooh”, “dad”, “hi” and “what”
are single syllable words that could arguably be produced predominately through one
plane of movement (mandibular or labial-facial). Performance on these words
suggest an initial decrease subsequent to the initiation of intervention, followed by a
rapid phase of acquisition that slowed to incremental gain on the words “dad” and
“hi”. In contrast the word “honey” and the phrase “I do” indicate a slower more
gradual process of acquisition. Strand et al. (2006) report targeting improved
mandibular and labial facial control for the production of CV configurations in this
participant. Given this, it is conceivable that these two stimuli required a higher
level of articulatory co-ordination and represented a higher level of complexity,
requiring integration of planes of movement (mandibular, labial-facial or lingual).
This interpretation of the data reported in the study by Strand et al. (2006) is
consistent with the findings reported in this thesis.
Possible explanations for the different patterns of learning in children with
CP could be linked to severity, diagnosis, age of the individual or any non-linear
combination of these. Shumway-Cook et al. (2003) suggested the two patterns of
motor learning observed in their study were associated with the level of disability.
In their study the two participants rated level I on the GMFCS (the least severe) with
spastic hemiplegia showed rapid change, whilst three participants rated at level II
THE EFFECTIVENESS OF PROMPT
159
with diplegia showed gradual improvement. Similarly in this thesis, the participant
to record the most gradual change was rated level III on the GMFCS, had the
severest global motor score on the VMPAC, a diagnosis of athetosis and in addition
was the oldest participant. It is also possible that the pattern of learning is influenced
by age. For example, one of the younger participants in this thesis recorded a rapid
profile of change. In contrast to the data reported by Shumway-Cook (2003), P3 had
a diagnosis of spastic quadriparesis and was rated level II on the GMFCS. P3 also
had the second lowest global motor score on the VMPAC. These data indicate a
complicated and non-linear relationship to the process of skill acquisition in
individuals with neurologic impairment. Future research in this area could further
elucidate these results.
Phase C: Consolidation.
The hypothesis that training the second intervention priority in phase C
would not interfere with consolidation of the earlier trained behavior (intervention
priority one) in phase B was supported. During phase C, when intervention priority
two was targeted, the overall pattern observed in the data for intervention priority
one was consistent with a phase of consolidation. This was indicated by a decrease
in the steepness of the slope, small incremental gains in performance level and
increased stability in the data.
The results obtained in phase C are discussed within the context of resource
allocation as well as the role of tactile-kinaesthetic input. In this study, resource
allocation is considered in terms of both cognitive attention required for the task and
strength of coupling between the existing and “to-be-learned” behavior (Temprado et
al., 2001).
Learning a sequenced task (as is required in speech) involves consolidation of
both explicit and implicit components of the task, with these two components
operating on different time scales (Ghilardi, Moisello, Silvestri, Ghez, & Krakauer,
2009). The literature suggests children with CP are less successful than TD peers in
learning sequences due to increased cognitive demands that contributed to impaired
implicit and explicit memory skills (Ghilardi et al., 2009).
Empirical evidence to support the hypothesis that training one intervention
priority at a time has the benefit of decreasing the cognitive load can be found in
coordination studies. For example, the work of Serrien (2009) provides evidence
that attending to two tasks during the rapid acquisition phase can create competition
THE EFFECTIVENESS OF PROMPT
160
between the existing skill and the new to be-developed skill. She explored the
competition between new (2:1 finger-tapping task) and existing (1:1 in/anti-phase
finger task) dynamics in a bimanual finger-tapping task, using two experimental
conditions with an ABA design.
The results of the study by Serrien (2009) show that whilst both groups recorded
significantly improved performance in the training task, the participants that had
their training schedules interrupted with another task (that consisted of an already
acquired behaviour) were less accurate. The interpretation of this finding was that
competition occurred as a result of attending to two tasks.
It is noted that the tasks used in the study described above do not require the
same degree of complexity as is required for speech. Speech is a highly complex
task that involves precise, rapid and complex goal-oriented behaviours with many
potential degrees of freedom of movement, with interleaving between different
articulators (Saltman and Munhall, 1989). Further, the work of speech scientists
have demonstrated that motor performance is affected not only by cognitive
processes but also by the complexity of the language demands (Maner, Smith, &
Grayson, 2000; Nip, Green, & Marx, 2009; Nip et al., 2011).
Despite the lesser complexity of these experimental tasks compared to speech,
the findings do provide support for the interpretation that training the second
intervention priority separately, as opposed to interweaving the two intervention
priorities in the same phase, promoted stabilization due to minimization of
competing resource allocation.
Further, empirical data indicates the greater the coupling (intrinsic
biomechanical properties, cognitive demands and task constraints) between the
existing (intervention priority one) and new behaviour (intervention priority two),
the greater the resistance to interference (Temprado et al., 2001). The speech science
literature supports the notion of a lower order jaw/lip and higher order lip aperture
synergy (Smith & Zelaznik, 2004). It is possible that the interarticulator coupling
and use of tactile-kinaesthetic input to control the degrees of freedom of movement,
promoted consolidation.
It is proposed that the tactile-kinaesthetic input provided in this study served
to stabilise the first intervention priority (as shown by the small incremental gain and
decrease in variability) whilst destabilising the second intervention priority, to
facilitate a phase shift toward a transition of change. Kelso, Fink, DeLaplain, &
THE EFFECTIVENESS OF PROMPT
161
Carson (2001) state “coupling specific aspects of an individual movement to specific
sensory information from the environment serves to stabilise coordination globally”
(p. 1210). They report haptic information serves to stabilise movement patterns in
one training condition, whilst destabilising in another condition. The data from this
study are consistent with this statement.
Further research aimed at evaluating single versus concurrent acquisition
would further our knowledge pertaining to competing attention in skill acquisition in
children with CP. It is well recognised that the type of training schedule affects
motor learning (Lee, Wulf, & Schmidt, 1992; Maas et al., 2008; Schmidt & Lee,
2005; W. F. W. Wu et al., 2011). Whilst the literature also provides evidence to
support concurrent skills training, there are limited data available that examines
schedules of motor skill learning in children with CP. Recently, Wambaugh and
Mauszycki (2010) reported evidence of over-generalisation in a participant with
acquired apraxia of speech, subsequent to dual skills training. They postulated
impaired sensory motor integration may have attributed to over-generalisation
observed in the participant in their study. Given children with CP present with
impaired sensory motor integration, this needs to be further examined when
considering intervention protocols.
Intervention priority two.
Phase B: Change in rate and performance level.
Visual inspection of the speech probe data during phase B indicates that the
training of intervention priority one affected the performance of intervention priority
two during this phase. Two participants (P4 and P5) recorded a significant change in
performance level to the MSMPs of IP2, whilst four participants recorded a
significant change in PA (P2, P3, P4 and P6). Further, the data shows increased
variability in comparison with the baseline phase.
Evidence also exists that suggests increased generalisation should be
expected when training movements that are close together and involve similar
patterns of muscle activation (Mattar & Ostry, 2007). The results observed in this
study support these findings for the four participants who were directly targeted for
mandibular control (intervention priority one). Empirical data indicates the jaw is
the primary articulator, with early lip movements tied to mandibular control in early
motor development (Green et al., 2000; Green et al., 2002; Walsh et al., 2006).
THE EFFECTIVENESS OF PROMPT
162
Perturbation studies have also demonstrated that perturbation of the jaw will cause
compensatory changes to the lips. It was therefore hypothesised that improving and
refining control of the mandible would result in changes at the labial-facial level of
control.
Additional support for the interpretation that movements that involve similar
patterns show better generalisation is also found in the data recorded for P1. This
participant commenced training at the labial-facial level of control (IP1). The
second intervention priority targeted lingual control. Her data show that whilst there
was an increase in the variability of IP2 during the training of IP1, there was no
change in performance level or trend direction. As explained by Mattar & Ostry
(2007), it may be that the patterns of muscle activation were too dissimilar and thus
generalisation was less.
Phase C: Interference.
The changes observed in intervention priority two in phase C are interpreted
with reference to behavioural studies that have explored the effect of anterograde
interference on motor learning (Abel & Lattal, 2001; Doyon, 2008; Kelso & Zanone,
2002; Krakauer, Mazzoni, Ghazisadeh, Ravindran, & Shadmehr, 2006; Sing &
Smith, 2010). Anterograde interference refers to the process by which learning a
novel task (task B) is influenced by the previously learned behaviours (task A). Of
particular interest to this thesis are the data reported by Sing and Smith (2010) that
suggest the learning of a subsequent task may proceed more slowly than the
previously trained task. Visual inspection of the data during the training of the
second intervention priority (phase C), show the maximum performance level
achieved was 67% for MSMPS and 75% for PA on the trained word set. Whilst the
change in performance level was statistically significant for 5 participants, the level
of performance and rate of learning on IP2 was less than IP1 for all participants in
this study. These results are therefore consistent with findings reported in the
literature.
Two possible explanations for interference include the level of skill mastery
and the effect of task similarity. Sing and Smith (2010) found that duration of
training, and not necessarily the level of mastery, had a significant impact on the
degree of interference. They state “the amount of anterograde interference depends
systematically on the strength of a particular component of the initial adaptation
rather than on the total amount of adaptation that is achieved” (p. 2). Specifically,
THE EFFECTIVENESS OF PROMPT
163
the group of participants in their study that had more training trials (230-trial group)
had more interference than the group that received less training (13-trial group), even
though this group had recorded a lower level of mastery.
The data from this thesis challenge the application of high level skill mastery
as a criterion for continuing or terminating intervention. Typically the success of an
intervention program is based on performance mastery, with a mastery criterion
typically of approximately 80% - 90% applied before proceeding to the next
intervention phase (Katz & McNeil, 2010; Marchant et al., 2008; Powell, Elbert,
Miccio, Strike-Roussos, & Brasseur, 1998; Williams, 2000). This thesis differed in
that an a priori decision was made to continue intervention regardless of performance
gain (Gierut, 1998). None of the participants recorded performance mastery of the
MSMPs above 66% in IP1. However, all participants with the exception of P4 made
progress on IP2. In addition, there was minimal interference on IP1. It is therefore
interpreted that a mastery of 80% accuracy is not a requirement for moving to a
second intervention priority. In fact, it could be argued that setting a criterion of
mastery too high could interfere with the mastery of a second higher-order skill.
These results support the statement of Rvachew, Rafaat and Martin (1999) that “it is
unnecessary and inefficient to treat an individual target sound continuously until
mastery is achieved [emphasis added]” (p. 33).
A second explanation for the observation of minimal interference is based on
evidence that suggests learning both requires and results in the modification of pre-
existing behaviours (Kelso & Zanone, 2002). Thus, the learning of a new task may
be expected to either cooperate or compete with existing behaviours. A “to-be-
learned behaviour” that cooperates with a previously learned behaviour is expected
to increase the rate of learning as a result of a reduction of competition between task
requirements.
The data from this thesis indicate that the training of intervention priority one
was a cooperative priority to intervention priority two, for the participants who
commenced training at the mandibular level of control. Continued improvement to
intervention priority two was recorded in five participants, between baseline and the
second intervention priority.
An example of how training of a second intervention priority competes with
previously learned behaviour is evident in the data from P4. The clinician was
required to support mandibular stability for P4 whilst targeting labial-facial control.
THE EFFECTIVENESS OF PROMPT
164
This participant recorded data that showed rapid but variable skill acquisition in the
first intervention priority, with a mean performance increase of 44% and 18% on the
MSMPs and PA, respectively. During the training of the second intervention
priority, the first intervention priority maintained a variable pattern of performance,
with a slight decrease in the trend direction. No real change was observed in the
performance accuracy of the second intervention priority in this phase. Thus the data
from this participant supports the notion that training of the first intervention priority
was successful because the muscles of activation were similar, however the second
intervention priority (lingual control) introduced patterns of activation that were too
dissimilar and contributed to resource competition.
Further, the results suggest that changes to the higher order synergy of lip
aperture required greater refinement and therefore lagged the MSMP changes.
Whilst significant changes in the MSMPs were recorded between phases B-C,
changes in PA reached statistical significance between phases A-C for five
participants but only one participant recorded a statistically significant change
between phases B-C.
Interpretation of the results of this study, as considered within the theoretical
perspective framework of dynamic systems theory (and coordination dynamics)
suggest the learning of intervention priority two, (for five participants) was
sympathetic to the skills acquired in intervention priority one, and therefore
promoted learning of the second intervention priority. For one participant, the second
intervention priority introduced competition. This perspective supports the results
that were obtained not only on the speech production measures discussed here, but
also the kinematic measures discussed in further detail in the subsequent section.
The results obtained in this study indicate the need for additional research to
further develop our understanding of our ability to predict the influence of
interference on motor learning. The role for further research aimed at not only
examining the rate and level of performance change, but also potential to influence
performance mastery by manipulating time frames within treatment designs requires
further investigation.
THE EFFECTIVENESS OF PROMPT
165
Phonetic Accuracy
“Articulatory imprecision has been reported as the greatest contributor to
‘intelligibility’” (Morgan et al., 2007, p. 1183).
Changes in phonetic accuracy across the phases of this study were evaluated
based on a calculation of percentage phonemes correct (PPC). This measure was
selected based on the literature that indicates word speech intelligibility can be
maximized through improving the phonetic repertoire of speakers (Shriberg &
Kwiatkowski, 1982). The PPC measure provides a global assessment of change in
the phonetic repertoire of the participants of this study, as opposed to specific
changes recorded on the speech probe measures.
All participants in this study recorded improved accuracy in the percentage of
phonemes correctly produced subsequent to the PROMPT Intervention. Pre-
assessment data for all participants showed significant articulatory impairment with a
mean percentage improvement of 10% between phases A1 (baseline) and A2
(follow-up).
The results of this study support the recommendations of early researchers
(Dworkin, 1991; Hixon & Hardy, 1964; Murdoch & Horton, 1998) that intervention
for children with motor speech disorders associated with CP would benefit from the
establishment of appropriate motor speech movement patterns.
The results will be discussed first by considering the role of articulatory
complexity in the speech error patterns of individuals with CP; followed by
consideration for the implementation of a hierarchical subsystems approach to
intervention.
Articulatory complexity.
It is asserted in this thesis that the improved phonetic accuracy recorded in
the participants of this study was due to a focus on targeting articulatory complexity
at an appropriate level within the motor-speech hierarchy. Support for this
hypothesis is grounded in the literature pertaining to the developmental hierarchy of
motor speech control and patterns of articulatory imprecision reported in speakers
with cerebral palsy.
Kinematic data, obtained by speech scientists (Green et al., 2000; Green et
al., 2002) provide empirical evidence that suggests phoneme acquisition follows the
THE EFFECTIVENESS OF PROMPT
166
hierarchical progression of motor-speech control. For instance, as discussed in the
literature review, the mandible has been identified as the earliest developing
articulator, pivotal to the development and integration of more complex movements
of the lips and tongue (Cheng et al., 2007; Grigos et al., 2005; Riely & Smith, 2003;
A. Smith, 1992; A. Smith & Zelaznik, 2004; Terband et al., 2010). Early
developmental data indicate bilabial compression is initially achieved through the
mechanical action of the jaw. With development, differentiation between the lips
and jaw increases with bilabial activity achieved through more refined individual
upper and lower lip action.
Examination of the work of early researchers investigating the articulatory
precision of speakers with cerebral palsy suggests a pattern of articulatory
imprecision related to the physiological complexity (integration of jaw, lip and
tongue control) of articulation (Byrne, 1959; Clarke & Hoops, 1980; Clement &
Twitchell, 1959; Hixon & Hardy, 1964; Ingram & Barn, 1961; Love, 1992; Milloy &
Morgan-Barry, 1990; Platt et al., 1980; Workinger, 2005; Workinger & Kent, 1991).
For example, in a study conducted by Irwin (1972), as cited by Love (1992),
production of labial phonemes and nasals were reportedly the easiest, whilst dentals,
glottals, fricatives and glides were the most difficult. These findings support those
reported by Byrne (1959) who also stated the acquisition of the bilabial stops (p, b)
and nasals (m, n) in speakers with CP are the easiest to produce. Interestingly,
Clements and Twitchell (1959) report speakers with CP demonstrate difficulty with
lip compression for bilabials. Although these two statements appear to be in
conflict, if considered from a physiological perspective they are compatible. That is,
it is possible the bilabials were being produced through the mechanical motion of the
jaw. With increased control and refinement, bilabials are produced with active
engagement of the lips. The inability to actively engage the lips suggests the use of a
lower level movement strategy to produce these sounds. The dominant use of the
mandible to achieve lip closure, would limit further integration of movement patterns
requiring increased articulatory complexity.
Recent literature has provided data that show speakers with low speech
intelligibility will substitute complex sounds with sounds that required lower
complexity (H. Kim et al., 2010). Kim et al. (2010) directly researched the role of
articulatory complexity and speech intelligibility, and revealed a positive relationship
between speech intelligibility and percentage consonants correct, as well as a
THE EFFECTIVENESS OF PROMPT
167
positive correlation between articulatory complexity and error types. That is, sounds
that required a higher level of motoric complexity recorded the most error.
Specifically, fricatives, affricates and liquids recording the lowest level of accuracy,
whilst nasals and glides were most correct.
Interpretation of the above data suggests that an intervention approach that
systematically assesses articulatory complexity within a framework of hierarchical
motor-speech control; and utilises that same framework to systematically effect
change to the coordinative constraints operating within an individual motor-speech
system will be effective in improving speech intelligibility in children with
disordered motor-speech control. Thus the data reported above and presented in this
research study lend support to a hierarchical subsystems approach to intervention
that addresses the motor complexity of the phonetic repertoire; and explain the
improved articulatory precision observed in the participants of this study.
The PROMPT approach recognises the relationship between articulatory
complexity and the biological/functional constraints impacting on the motor speech
control of each individual. Within the PROMPT system the acquisition of bilabial
and nasal phonemes would initially be targeted at level III (mandibular control) of
the motor speech hierarchy. At this level, bilabial closure would be expected to be
achieved through the mechanical motion of the jaw. Phonemes targeted at this level
are considered to have less articulatory complexity than sounds requiring
independent lip motion (such as f) that are coded at level IV. The more difficult
anterior tongue tip sounds are considered to require integration of the jaw, lips and
tongue and therefore coded at level V of the MSH. Thus, a child presenting with a
motor-speech pattern characterised by ballistic movements driven by the motion of
the jaw will be expected to produce particular phonemes with accuracy and
misarticulate others that require more complex control and differentiation.
Perceptual accuracy.
Changes to the perceptual signal may be due to changes in any combination
of the biomechanical linkages between the mandibular, labial, lingual, laryngeal and
pharyngeal muscles. For example, fricatives are regarded as the most complex group
of sounds requiring a high level precision within the vocal tract (Honda & Takemoto,
2010; Iskarous, Shadle, & Proctor, 2011).
THE EFFECTIVENESS OF PROMPT
168
The complexity of articulation is illustrated in a study by Honda, Takano and
Takemoto (2010). They report data that highlight the complex interaction between
the jaw, lips and tongue during the production of vowels. For example, production
of /i/ requires a high jaw position, labial-facial retraction, and lingual tension that are
typically created through co-contraction of the anterior and posterior bundles of the
genioglossus muscle. Honda et al. (2010) report when the elevation of the tongue
dorsum is achieved through excessive force applied by the posterior bundles of the
genioglossus, the anterior bundles of the genioglossus will act to counteract the
force. This action will also result in a compensatory decrease in jaw open distance.
Honda et al. (2010) report these muscle activation patterns are not represented in the
format frequency data on the same timescale. Thus, a complex relationship between
vocal tract dynamics, articulatory movements and how this is reflected in the
perceptual signal is indicated.
The perceptual data from the speech probes indicates change to the motor-
speech movement patterns preceded the perceptual changes. The results support a
non-linear articulation-perceptual relationship consistent with dynamic systems
theory which predicts a dynamic progression in the coupling of motor control and
speech output; such that large changes to the movements of articulators may only
create small change in the perceptual signal.
Several possible reasons for delay in the perceptual changes are considered.
Firstly, the perceptual shift may not have been perceivable. Support for this
hypothesis is found in the work of Zhou et al. (2008). They examined the acoustic
difference between tongue shape of the bunched and retroflex /r/. They reported
whilst their adult listeners did not perceive the differences between the two sounds,
differences in the lingual pattern were observed in the distance between formant 4
and formant 5. Thus, it is possible that had acoustic analysis also been undertaken, a
shift that was not yet perceivable perceptually may have been identified.
Secondly, there may have been insufficient change to the vocal tract. Ito and
Ostry (2010) recorded data that indicated no change in F1 and F2 in adult
participants subsequent to changes in lip position stimulated by perturbation. They
suggested the absence of acoustic change may have been due to small overall
changes in the vocal tract length or the possibility that other articulators compensated
to maintain the acoustic output. Singh and Singh (2008) provide data that suggests
only 50% of children aged between 7-8 years of age display the adult features of
THE EFFECTIVENESS OF PROMPT
169
formant transitions and place of articulation. Green and Nip (2010) also report
acoustic and/or perceptual measures may not be sensitive to changes in articulatory
control in young children. Thus, it may be that in order for change to be perceivable
for the participants in this study, more than one subsystem (e.g., two phases of
intervention) would be required to produce change. Examination of the results of P1
and P5 lend some support to this interpretation. They both record data that show
congruency between the MSMPs and PA is achieved in the second phase of
intervention for the trained word-sets on intervention priority one and two.
Finally, it is also possible that the intervention acted to destabilise the
relationship between the existing maladaptive movement pattern and incumbent
perceptual output. In this case the incongruency between the movement pattern and
speech output is reflective of the motor learning process. Iverson and Thelen (1999),
propose four dynamic transition periods (initial linkages, emerging control, flexible
coupling and synchronous coupling) in early speech development. During the
establishment of the initial linkages, the motor and speech systems are only loosely
coupled. With increasing control (flexible coupling), Iverson and Thelen (1999)
report the timing relationship between motor system and speech mutually influence
one another and “ultimately settle on a ‘compromise’ frequency at which they
entrain to produce a coordinated behaviour” (p. 33). Thus, the asymmetry between
the two systems (speech output and movement) observed in the data of this thesis,
could be reflective of reorganisation of the motor-speech movement system. As a
result during the initial acquisition phase of an intervention protocol clinicians
should expect to observe a period of asynchrony in speech/motor control. With
increasing control and the establishment of a new preferred state, synchronous motor
speech movement patterns and perceptual output is expected.
Some support for the interpretation of this is found in the data of the
participants in this thesis who displayed incongruent MSMPs and PA scores pre-
intervention. For example P5 recorded baseline data that showed PA exceeded
MSMP accuracy. Subsequent to the first intervention phase the converse was
recorded. That is, the MSMP data exceeded the PA. In the second intervention
phase congruency between the two measures was recorded.
Further research, noteworthy of consideration, but outside the scope of this
study, is that of a child’s own perception of their production and the role this may
have in fine-tuning perceptual output. Shiller, Gracco and Rvachew (2010) report
THE EFFECTIVENESS OF PROMPT
170
“children may be less able to detect perceptual variability related to their own
productions, and hence show less perceptual fine-tuning to accommodate such
changes” (p.7). Thus it may be possible that changes in articulation control and
coordination may not be apparent in early speech output. More recent research by
Ito and Ostry (2012) provide some evidence that suggests “sound and proprioception
are integrated in the neural processing of speech” (p. 445). That is, facial
somatosensory input plays a role in altering speech sound perception. Thus, it is also
possible that children with CP may take longer to achieve perceptual changes due to
poor integration between the sensory, motor and auditory inputs.
Conclusion
The hypothesis that the participants of this study would demonstrate
improved speech production and phonetic accuracy, subsequent to participation in
the PROMPT intervention, is supported. Specifically, the results provide evidence to
suggest the implementation of a hierarchical subsystems approach aimed at
developing efficient functional movement synergies (e.g., jaw/lower lip synergies)
through the establishment of appropriate movement boundaries, resulted in improved
motor-speech control.
The use of a SSRD, with two inter-hierarchical phases of intervention, also
demonstrated a cumulative treatment effect. This finding is consistent with the
literature that reports improved generalisation when training movement patterns with
similar patterns of muscle activation (Mattar & Ostry, 2007).
The finding of differential changes to the motor-speech movement patterns of
each of the participants, over the phases of the study support the need for additional
objective measures (e.g., kinematic data) to further enhance the interpretation of
perceptual data. This is supported by the literature that identifies many different
movements patterns can be used to produce a similar perceptual outcome (Green &
Nip, 2010; Honda & Takemoto, 2010; Ito & Ostry, 2010). Whilst the data from the
perceptual measures of this study identifies changes to the motor-speech movement
patterns occurred, further evaluation using objective kinematic measures is
warranted in order to gain a more complete understanding of the relationship
between the perceptual and kinematic changes.
THE EFFECTIVENESS OF PROMPT
171
CHAPTER 5 QUESTION TWO
WILL CHILDREN WITH MODERATE-TO-SEVERE SPEECH
IMPAIRMENTS ASSOCIATED WITH CP SHOW CHANGES IN
DISTANCE, VELOCITY AND DURATION MEASURES OF THE JAW AND
LIPS SUBSEQUENT TO PROMPT INTERVENTION?
Introduction
Changes in articulatory movements associated with dysarthria lead to
aberrant speech acoustics and a perceptually recognizable disorder (Yunusova,
Weismer, Westbury & Lindstrom, 2008, p. 596).
The most common speech disorder associated with CP is that of dysarthria
(Hodge & Wellman, 1999; Ingram & Barn, 1961; Love, 1992; Workinger, 2005;
Workinger & Kent, 1991). Pennington, Miller and Robson (2009) describe
dysarthria as:
an articulatory disturbance which arises when neuromuscular impairment
affects the tone, power and coordination of any or all of the muscles used for
speech …. leading to loss or inaccuracy of articulatory movements. When
this happens listeners perceive the distortion or omission of sounds and
syllables and the alterations to voice quality characteristic of dysarthria (p.
10).
Although the above definition identifies articulatory disturbance as a
contributing source of impaired speech intelligibility; and intervention is frequently
aimed at establishing different movement patterns (Pennington et al., 2009), the use
of perceptual outcome measures appear to be the established benchmark for
evaluating the effectiveness of a motor speech intervention approach (R.D Kent &
Kent, 2000; Murdoch, 2011; Murdoch & Horton, 1998).
The validity of using these measures in the absence of instrumental analysis,
for both the diagnosis and treatment planning of motor speech disorders, has been a
topic of debate in the literature (Chenery, 1998; Cheng et al., 2007; Kearns &
Simmons, 1988; Ozsancak et al., 2006) Typically, motor speech disorders affect
multiple speech subsystems that include respiration, phonation, articulation and
THE EFFECTIVENESS OF PROMPT
172
resonance (R.D Kent & Kent, 2000; Love, 1992; Netsell, 2001, Love, 1992 #315).
Therefore the assessment of speech impairment, including identification of phonetic
and phonological processes, needs to be considered within the context of the
movement proficiencies of the individual articulators (Netsell, 2001). Determination
of the possible contribution of any or all of these subsystems to speech impairment
has contributed to a lack of reliability and validity in identifying speech impairments
on the basis of perceptual analysis alone.
Given this limitation, the need to supplement perceptual analysis with
instrumental analysis (e.g., acoustics) in the assessment and diagnosis of the types of
motor speech disorders is recognised (Kearns & Simmons, 1988; R.D Kent & Kim,
2003; R.D Kent et al., 1999; Y. Kim et al., 2011; Murdoch, 2011). The literature
indicates the use of acoustic analysis as an outcome measure is typically associated
with intervention studies focused on the manipulation of rate, prosody and loudness
(Yorkston et al., 2008; Pennington et al., 2009, Patel, 2002 ). Examples of acoustic
measures include spectrographic analysis to identify changes to intensity, duration
and fundamental frequency (Patel & Campellone, 2009; Thompson-Ward &
Theodoros, 1998; Wenke, Cornwell, & Theodoros, 2010).
A limitation of using perceptual and acoustic analysis as an outcome measure
in the evaluation of interventions aimed at making changes to speech movement
patterns includes the inability of these measures to inform a clinician as to the
contribution of each of the individual motor-speech subsystems to overall speech
intelligibility (Gracco, 1992; Yunusova, Weismer, Westbury, & Lindstrom, 2008).
In the absence of such measures, researchers have hypothesised as to the
potential benefit of changes to specific movement patterns for speech intelligibility.
For example, Wenke, Cornwell and Theodoros (2010), based on the analysis of
acoustic data, proposed that increasing law and lip displacement may be a strategy to
increase the vowel space area and thus improve speech intelligibility.
The challenge of proposing modifications to speech movement patterns based
on acoustic analysis is that many different movement patterns may produce the same
perceptual or acoustic end-product (Yorkston, Beukelman and Traynor (1988). For
example, the literature identifies changes to the perceptual signal may be due to
changes in any combination of the biomechanical linkages between the mandibular,
labial, lingual, laryngeal and pharyngeal muscles (Honda & Takemoto, 2010;
Iskarous et al., 2011). Therefore, “…inferences regarding movements that are based
THE EFFECTIVENESS OF PROMPT
173
solely on acoustic or perceptual measures must be viewed with caution” (Yorkston,
Beukelman & Traynor, 1988 (p.352).
The inability of a clinician to objectively assess and evaluate therapeutic
changes to motor-speech movement patterns highlight the need for clinical access to
physiological measures that would support this process (Murdoch, 2011; Theodorus
et al., 1999; Weismer, 2006).
Advances in technology now provide clinicians access to tools that were
previously inaccessible (e.g., three dimensional motion analysis). Murdoch (2011)
states “instrumental assessment can enhance the abilities of the clinician in all stages
of clinical management, including the documentation of treatment efficacy”. The
use of motion analysis to examine subclinical motor speech signs has been reported
in adult dysarthria, dysarthria associated with traumatic brain injury, childhood
apraxia of speech and stuttering (Cahill et al., 2005; Peters et al., 2000; Roy et al.,
2001; Theodorus et al., 1999).
The positive results obtained on the perceptual measures for all participants
in the PROMPT intervention study support the use of tactile-kinaesthetic input,
applied systematically and actively during speech, contributed to modifying the
speech-movement patterns of the participants and led to improved speech production
and phonetic accuracy.
The differential changes in speech production accuracy and the motor-speech
movement patterns recorded across the phases of the PROMPT study, as reported in
chapter 4, support the use of a more objective physiological level of analysis to
facilitate the objective evaluation and interpretation of the changes in motor speech
movement patterns and associated improvements in speech production accuracy for
each of the participants observed in this study.
In this chapter, the use of 3D motion analysis to analyse changes to the
kinematic measures of distance, velocity and duration of jaw and lip movements is
investigated.
The following question was addressed:
Will children with moderate-to-severe speech impairments associated with
CP show changes in distance, velocity and duration measures of the jaw and lips
subsequent to PROMPT intervention?
THE EFFECTIVENESS OF PROMPT
174
Method
Participants
All 6 participants described in chapter 3 participated in the collection of data
for the kinematic measures. In addition, to facilitate interpretation of the kinematic
data obtained on the 6 participants across the phases of the PROMPT intervention,
12 typically-developing (TD) peers were recruited to serve as a reference group.
Cohort of typically developing (TD) peers.
Recruitment.
A convenience sample of 12 TD peers served as a reference group. The TD
peers were known either to the speech pathologists administering the PROMPT
intervention, research assistant or principal investigator. Ethics approval was
successfully obtained from Curtin University Human Research Ethics Committee.
Families were approached by the principal investigator and provided with
information on the purpose of the study, and the procedure for collecting the motion
analysis data. The parents were asked to discuss the study with their children and
obtain consent to participate. Informed consent was obtained from both the parents
and the TD children. All procedures and protocols were followed and no complaints
received.
Description.
All TD peers scored within age-appropriate limits on oral motor and speech
tests [The Arizona Proficiency Scale (3) (Fudala, 2001) and The Verbal Motor
Production Assessment for Children (VMPAC, Hayden and Square, 1999)]. Parent
report indicated there was no history of language impairment. All TD peers passed a
pure-tone hearing screening, using the staircase method at 20dB at frequencies of
1000, 2000, 4000 and 8000Hz. In addition, English was the first and primary
language of all participants.
With the exception of P2 and P4, three TD peers were also age and sex
matched to each participant with CP (see Table 5.1).
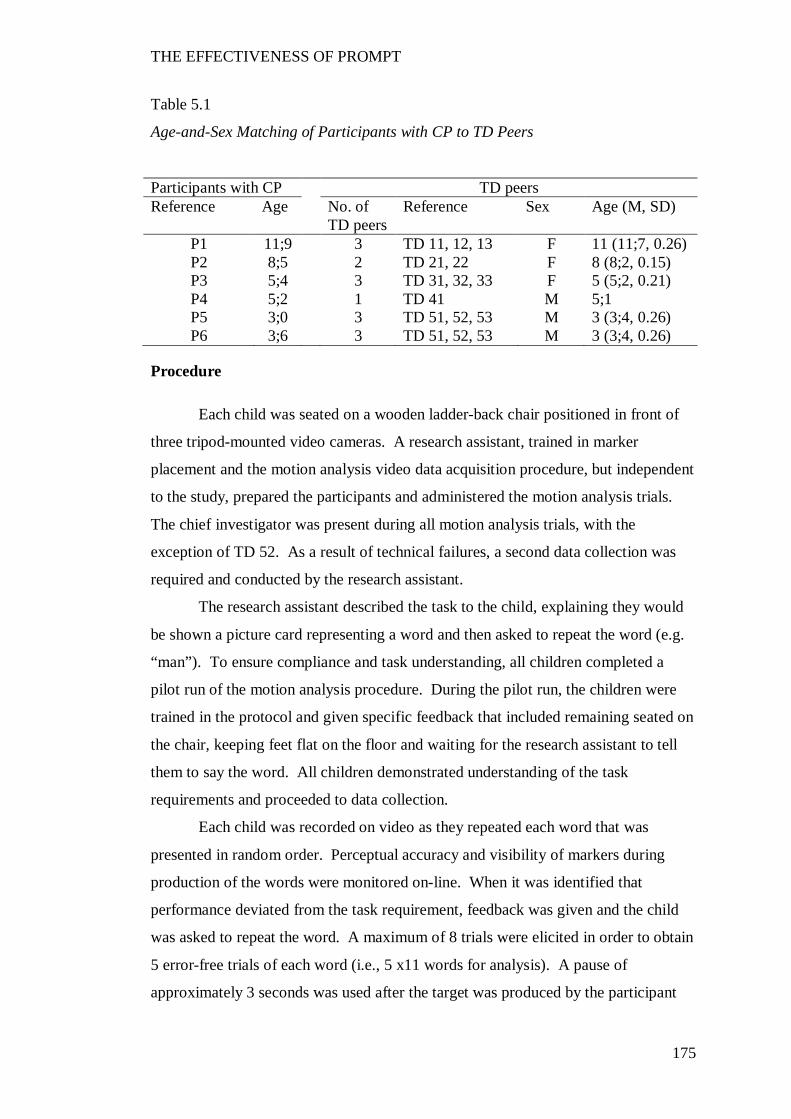
THE EFFECTIVENESS OF PROMPT
175
Table 5.1
Age-and-Sex Matching of Participants with CP to TD Peers
Participants with CP TD peers Reference Age No. of
TD peers Reference Sex Age (M, SD)
P1 11;9 3 TD 11, 12, 13 F 11 (11;7, 0.26) P2 8;5 2 TD 21, 22 F 8 (8;2, 0.15) P3 5;4 3 TD 31, 32, 33 F 5 (5;2, 0.21) P4 5;2 1 TD 41 M 5;1 P5 3;0 3 TD 51, 52, 53 M 3 (3;4, 0.26) P6 3;6 3 TD 51, 52, 53 M 3 (3;4, 0.26)
Procedure
Each child was seated on a wooden ladder-back chair positioned in front of
three tripod-mounted video cameras. A research assistant, trained in marker
placement and the motion analysis video data acquisition procedure, but independent
to the study, prepared the participants and administered the motion analysis trials.
The chief investigator was present during all motion analysis trials, with the
exception of TD 52. As a result of technical failures, a second data collection was
required and conducted by the research assistant.
The research assistant described the task to the child, explaining they would
be shown a picture card representing a word and then asked to repeat the word (e.g.
“man”). To ensure compliance and task understanding, all children completed a
pilot run of the motion analysis procedure. During the pilot run, the children were
trained in the protocol and given specific feedback that included remaining seated on
the chair, keeping feet flat on the floor and waiting for the research assistant to tell
them to say the word. All children demonstrated understanding of the task
requirements and proceeded to data collection.
Each child was recorded on video as they repeated each word that was
presented in random order. Perceptual accuracy and visibility of markers during
production of the words were monitored on-line. When it was identified that
performance deviated from the task requirement, feedback was given and the child
was asked to repeat the word. A maximum of 8 trials were elicited in order to obtain
5 error-free trials of each word (i.e., 5 x11 words for analysis). A pause of
approximately 3 seconds was used after the target was produced by the participant
THE EFFECTIVENESS OF PROMPT
176
and before presenting the next word. Data collection time varied across each child,
dependent on the child’s need to take breaks between trials. No data collection
occasion exceeded one hour.
Set-up.
Each child sat in a ladder-back chair with feet firmly on the ground. A cut-
out-table was positioned in front of the participant to allow propping through the
elbow to provide postural stability through the trunk.
Three video cameras (Sony HDRHC3E PAL HDV 1080i) were used to
capture the speech movement patterns. Camera one was positioned directly in front
of the participant. Cameras two and three were positioned 30 degrees to either side
of camera one, which was placed 1.3 meters from the centre of the chair. Each
camera was mounted on a Sony remote control tripod (VCT-D68ORM). The bubble
level of the tripod was used to ensure the camera was level. Masking tape was
placed on the floor for the duration of the study to maintain camera and chair
placement. Accuracy of camera placement was confirmed with a plumb line.
The video cameras were linked to an OTIC television (OTM 515). The
cameras were white balanced, manually focused and zoomed until the calibration
cube image filled the television monitor.
Two Rove halogen floor lamps (35/50W) were placed horizontally on the
floor to the left and right of the participant’s face. The lamps were covered with
photographic paper to diffuse the light. A white block-out fabric backdrop was
positioned behind the participant. All overhead fluorescent lights were turned on
during recording. The window treatments were drawn throughout all trials to keep
lighting as consistent as possible.
Two fluorescent markers were placed on the left and right side of the chair, in
line with the participant’s ears to identify postural changes during the recording. No
head posture restraints were used during testing.
Microphone placement was dependent on participant tolerance and
compliance. Placement options included fixed to the participant’s shirt/lapel, placed
on the table in front of the participant at elbow height or attached posteriorly to a
rung of the ladder-back chair at mouth height.
THE EFFECTIVENESS OF PROMPT
177
Measures
Five repetitions of 11 untrained stimulus words were used to elicit the
kinematic measures of distance, velocity and duration.
Distance.
Three distance measures of the jaw were calculated:
1. Jaw path distance travelled (JPD) - Sum of the 3D Euclidian distance of
the middle jaw marker across each time sample (Yunusova et al., 2010).
2. Jaw open distance (JOD) - The 3D Euclidian distance between the middle
forehead marker and middle jaw marker subtracted from the corresponding distance
at rest (Green et al., 2000).
3. Jaw Lateral Distance from Midline (JLDM) - Average lateral
displacement from midline distance of the middle lower lip + jaw marker (LL) from
rest (Moore, 2004).
Mean maximum movement measures were obtained for JOD, whilst the JPD
and JLDM measures were based on the average value obtained across the repetitions.
In addition, a measure of jaw grading (JG) was derived from the JOD
measures at each jaw height position (JHP) for participants 5 and 6. Figure 5.1
illustrates the JHP’s for the stimulus words used in this study, as based on the
Standard Australian English vowel map presented by Cox (2006, 2008). Jaw
grading was defined as a participant’s ability to yield significantly different JODs for
each JHP. This measure is therefore derived from the JOD measures during
statistical analysis.
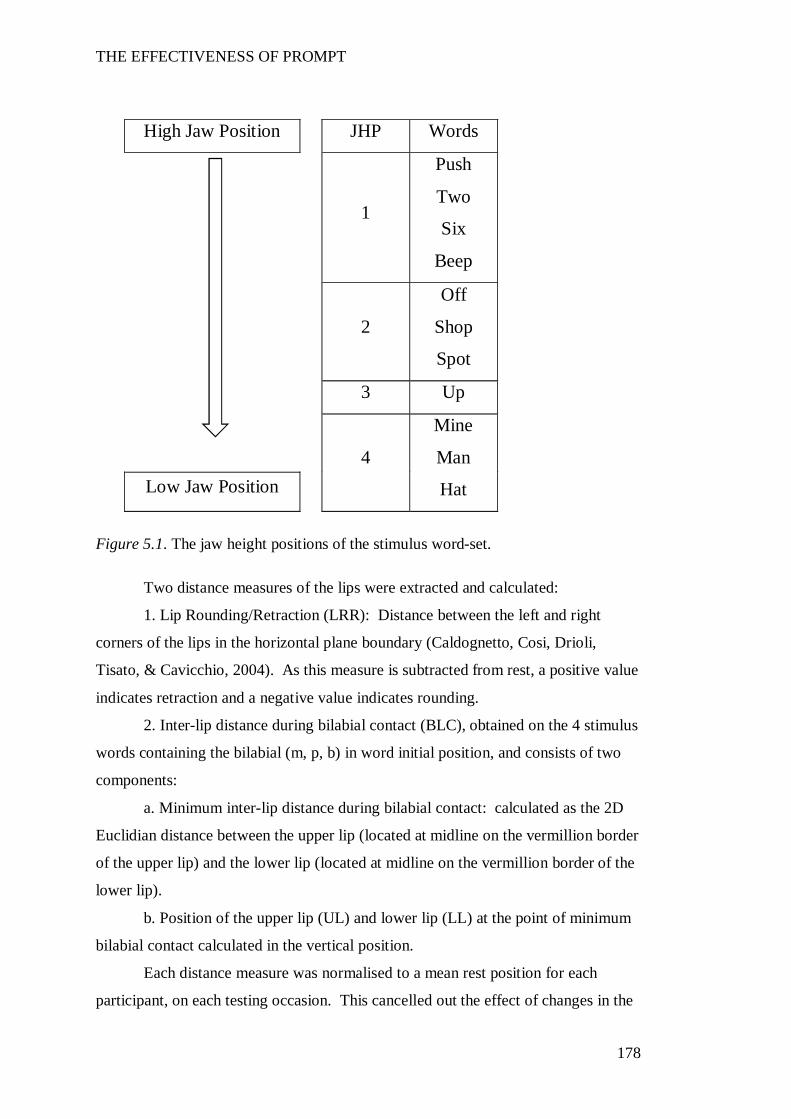
THE EFFECTIVENESS OF PROMPT
178
Figure 5.1. The jaw height positions of the stimulus word-set.
Two distance measures of the lips were extracted and calculated:
1. Lip Rounding/Retraction (LRR): Distance between the left and right
corners of the lips in the horizontal plane boundary (Caldognetto, Cosi, Drioli,
Tisato, & Cavicchio, 2004). As this measure is subtracted from rest, a positive value
indicates retraction and a negative value indicates rounding.
2. Inter-lip distance during bilabial contact (BLC), obtained on the 4 stimulus
words containing the bilabial (m, p, b) in word initial position, and consists of two
components:
a. Minimum inter-lip distance during bilabial contact: calculated as the 2D
Euclidian distance between the upper lip (located at midline on the vermillion border
of the upper lip) and the lower lip (located at midline on the vermillion border of the
lower lip).
b. Position of the upper lip (UL) and lower lip (LL) at the point of minimum
bilabial contact calculated in the vertical position.
Each distance measure was normalised to a mean rest position for each
participant, on each testing occasion. This cancelled out the effect of changes in the
High Jaw Position
JHP Words
1
Push
Two
Six
Beep
2
Off
Shop
Spot
3 Up
4
Mine
Man
Hat Low Jaw Position
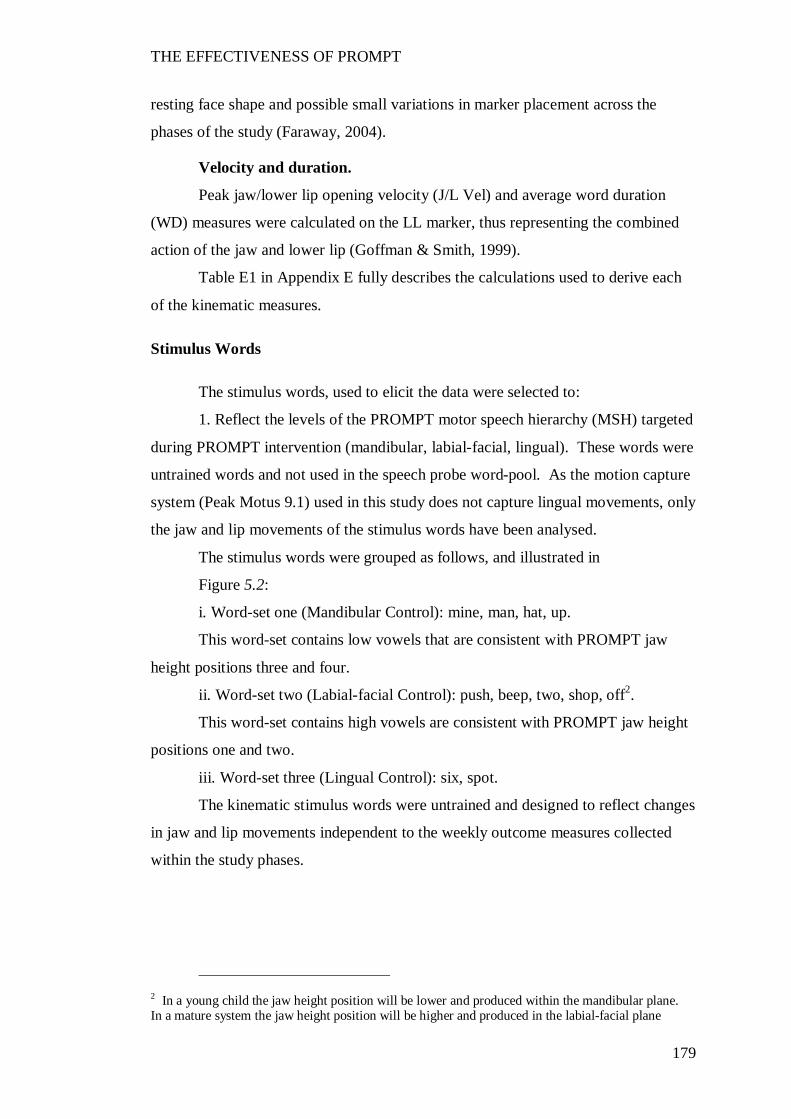
THE EFFECTIVENESS OF PROMPT
179
resting face shape and possible small variations in marker placement across the
phases of the study (Faraway, 2004).
Velocity and duration.
Peak jaw/lower lip opening velocity (J/L Vel) and average word duration
(WD) measures were calculated on the LL marker, thus representing the combined
action of the jaw and lower lip (Goffman & Smith, 1999).
Table E1 in Appendix E fully describes the calculations used to derive each
of the kinematic measures.
Stimulus Words
The stimulus words, used to elicit the data were selected to:
1. Reflect the levels of the PROMPT motor speech hierarchy (MSH) targeted
during PROMPT intervention (mandibular, labial-facial, lingual). These words were
untrained words and not used in the speech probe word-pool. As the motion capture
system (Peak Motus 9.1) used in this study does not capture lingual movements, only
the jaw and lip movements of the stimulus words have been analysed.
The stimulus words were grouped as follows, and illustrated in
Figure 5.2:
i. Word-set one (Mandibular Control): mine, man, hat, up.
This word-set contains low vowels that are consistent with PROMPT jaw
height positions three and four.
ii. Word-set two (Labial-facial Control): push, beep, two, shop, off2.
This word-set contains high vowels are consistent with PROMPT jaw height
positions one and two.
iii. Word-set three (Lingual Control): six, spot.
The kinematic stimulus words were untrained and designed to reflect changes
in jaw and lip movements independent to the weekly outcome measures collected
within the study phases.
2 In a young child the jaw height position will be lower and produced within the mandibular plane. In a mature system the jaw height position will be higher and produced in the labial-facial plane
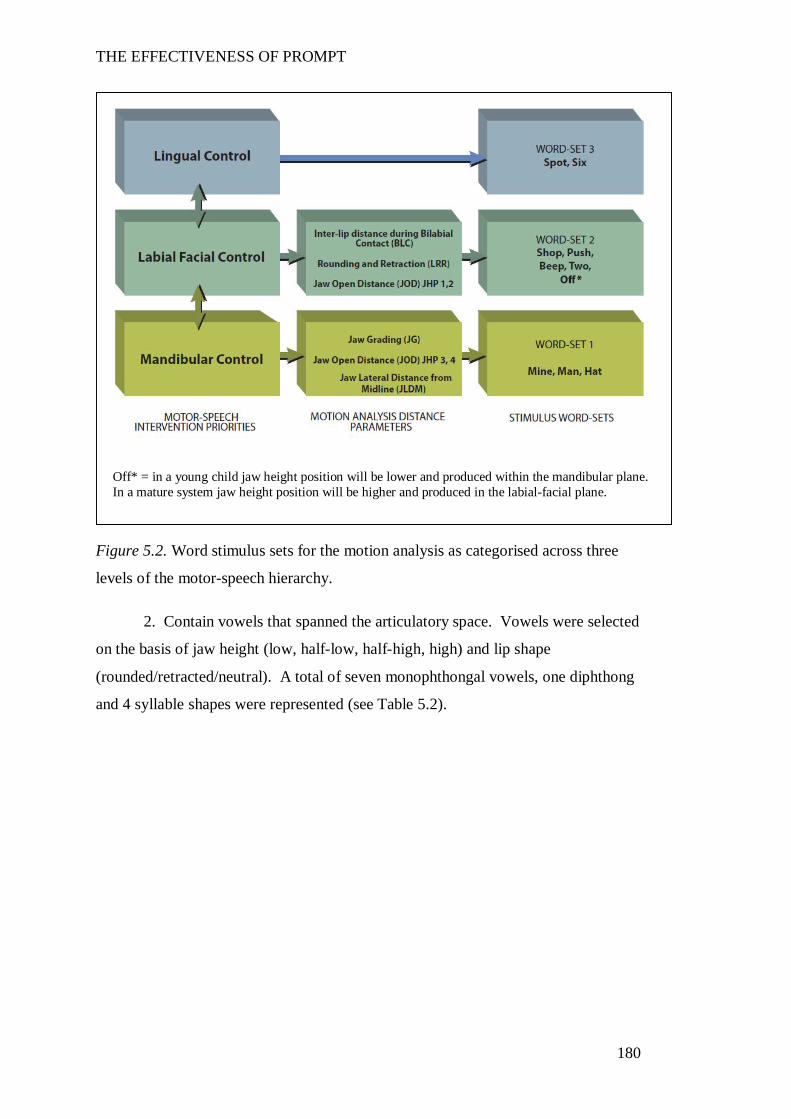
THE EFFECTIVENESS OF PROMPT
180
Figure 5.2. Word stimulus sets for the motion analysis as categorised across three
levels of the motor-speech hierarchy.
2. Contain vowels that spanned the articulatory space. Vowels were selected
on the basis of jaw height (low, half-low, half-high, high) and lip shape
(rounded/retracted/neutral). A total of seven monophthongal vowels, one diphthong
and 4 syllable shapes were represented (see Table 5.2).
Off* = in a young child jaw height position will be lower and produced within the mandibular plane. In a mature system jaw height position will be higher and produced in the labial-facial plane.
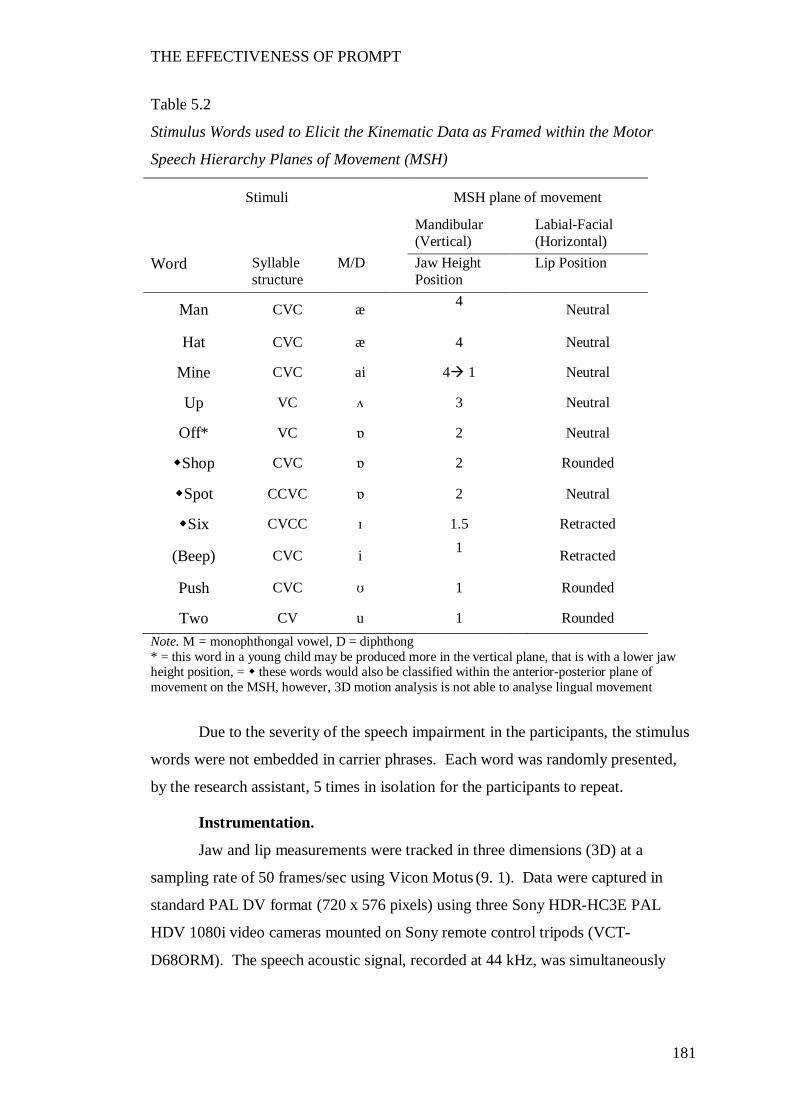
THE EFFECTIVENESS OF PROMPT
181
Table 5.2
Stimulus Words used to Elicit the Kinematic Data as Framed within the Motor
Speech Hierarchy Planes of Movement (MSH)
Stimuli
MSH plane of movement
Mandibular (Vertical)
Labial-Facial (Horizontal)
Word Syllable structure
M/D Jaw Height Position
Lip Position
Man CVC æ
4
Neutral
Hat CVC æ 4 Neutral
Mine CVC ai 4 1 Neutral
Up VC ʌ 3 Neutral
Off* VC ɒ
2 Neutral
Shop CVC ɒ 2 Rounded
Spot CCVC ɒ 2 Neutral
Six CVCC ɪ 1.5 Retracted
(Beep) CVC i 1
Retracted
Push CVC ʊ 1 Rounded
Two CV u 1 Rounded Note. M = monophthongal vowel, D = diphthong * = this word in a young child may be produced more in the vertical plane, that is with a lower jaw height position, = these words would also be classified within the anterior-posterior plane of movement on the MSH, however, 3D motion analysis is not able to analyse lingual movement
Due to the severity of the speech impairment in the participants, the stimulus
words were not embedded in carrier phrases. Each word was randomly presented,
by the research assistant, 5 times in isolation for the participants to repeat.
Instrumentation.
Jaw and lip measurements were tracked in three dimensions (3D) at a
sampling rate of 50 frames/sec using Vicon Motus (9. 1). Data were captured in
standard PAL DV format (720 x 576 pixels) using three Sony HDR-HC3E PAL
HDV 1080i video cameras mounted on Sony remote control tripods (VCT-
D68ORM). The speech acoustic signal, recorded at 44 kHz, was simultaneously
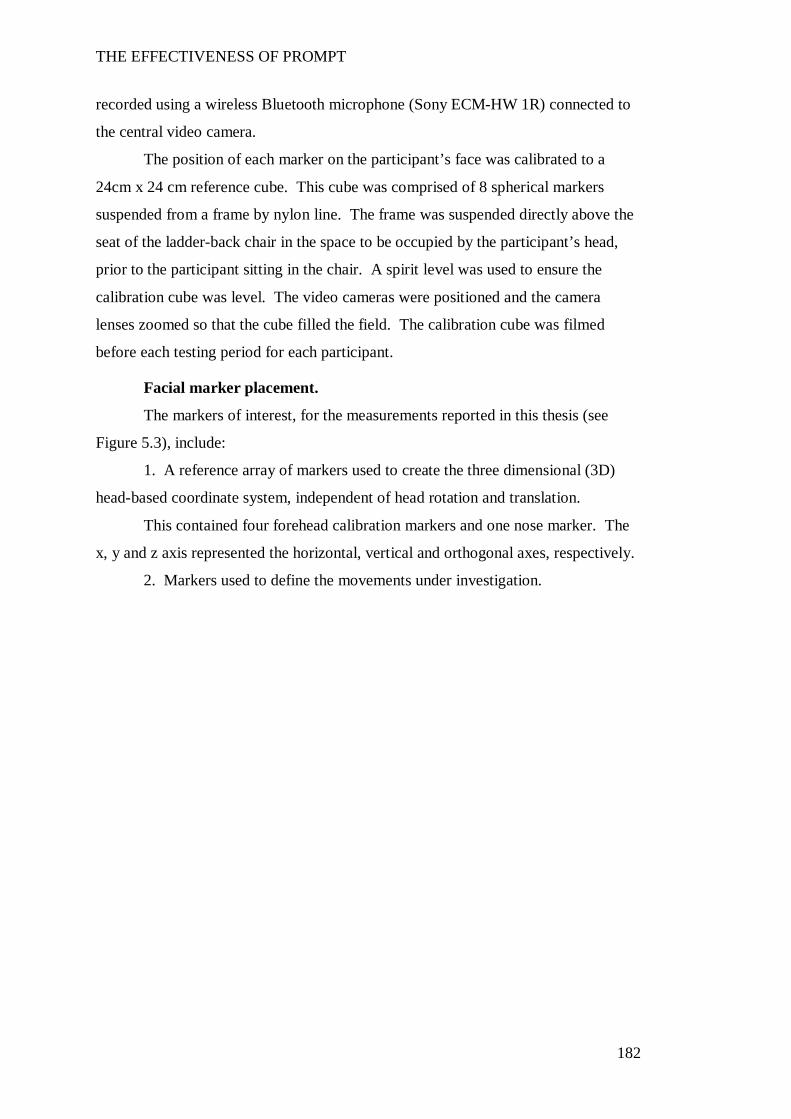
THE EFFECTIVENESS OF PROMPT
182
recorded using a wireless Bluetooth microphone (Sony ECM-HW 1R) connected to
the central video camera.
The position of each marker on the participant’s face was calibrated to a
24cm x 24 cm reference cube. This cube was comprised of 8 spherical markers
suspended from a frame by nylon line. The frame was suspended directly above the
seat of the ladder-back chair in the space to be occupied by the participant’s head,
prior to the participant sitting in the chair. A spirit level was used to ensure the
calibration cube was level. The video cameras were positioned and the camera
lenses zoomed so that the cube filled the field. The calibration cube was filmed
before each testing period for each participant.
Facial marker placement.
The markers of interest, for the measurements reported in this thesis (see
Figure 5.3), include:
1. A reference array of markers used to create the three dimensional (3D)
head-based coordinate system, independent of head rotation and translation.
This contained four forehead calibration markers and one nose marker. The
x, y and z axis represented the horizontal, vertical and orthogonal axes, respectively.
2. Markers used to define the movements under investigation.
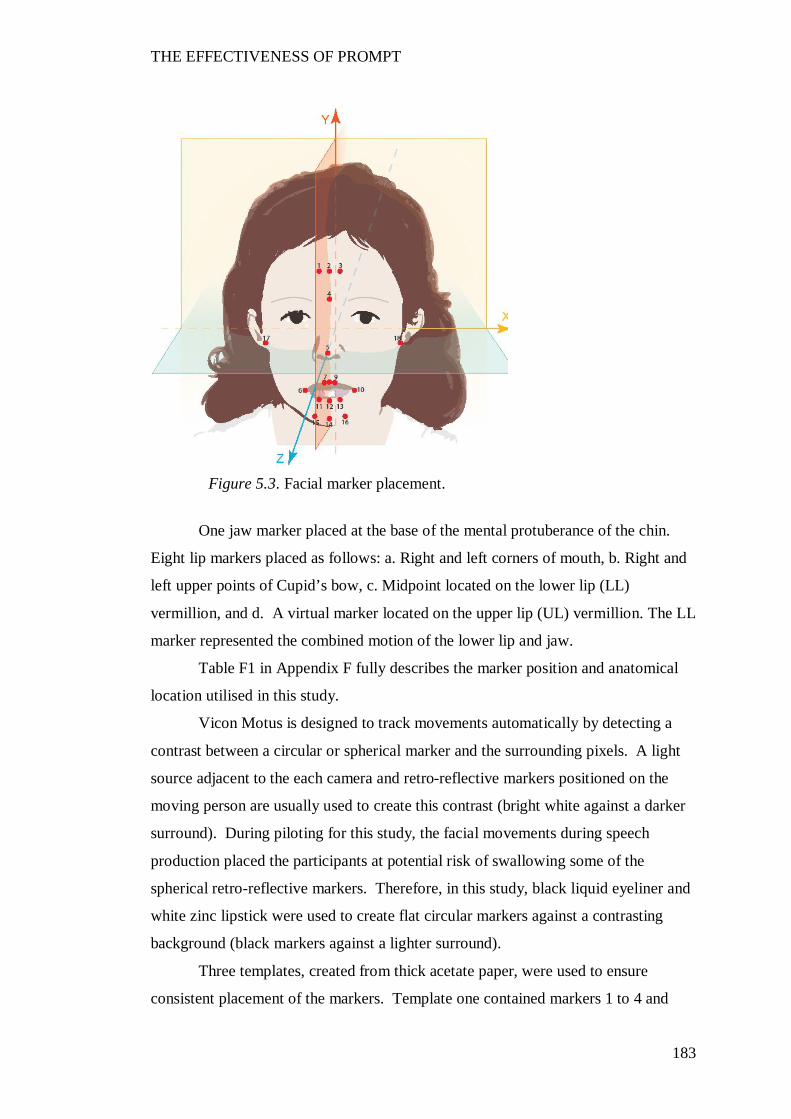
THE EFFECTIVENESS OF PROMPT
183
One jaw marker placed at the base of the mental protuberance of the chin.
Eight lip markers placed as follows: a. Right and left corners of mouth, b. Right and
left upper points of Cupid’s bow, c. Midpoint located on the lower lip (LL)
vermillion, and d. A virtual marker located on the upper lip (UL) vermillion. The LL
marker represented the combined motion of the lower lip and jaw.
Table F1 in Appendix F fully describes the marker position and anatomical
location utilised in this study.
Vicon Motus is designed to track movements automatically by detecting a
contrast between a circular or spherical marker and the surrounding pixels. A light
source adjacent to the each camera and retro-reflective markers positioned on the
moving person are usually used to create this contrast (bright white against a darker
surround). During piloting for this study, the facial movements during speech
production placed the participants at potential risk of swallowing some of the
spherical retro-reflective markers. Therefore, in this study, black liquid eyeliner and
white zinc lipstick were used to create flat circular markers against a contrasting
background (black markers against a lighter surround).
Three templates, created from thick acetate paper, were used to ensure
consistent placement of the markers. Template one contained markers 1 to 4 and
Figure 5.3. Facial marker placement.
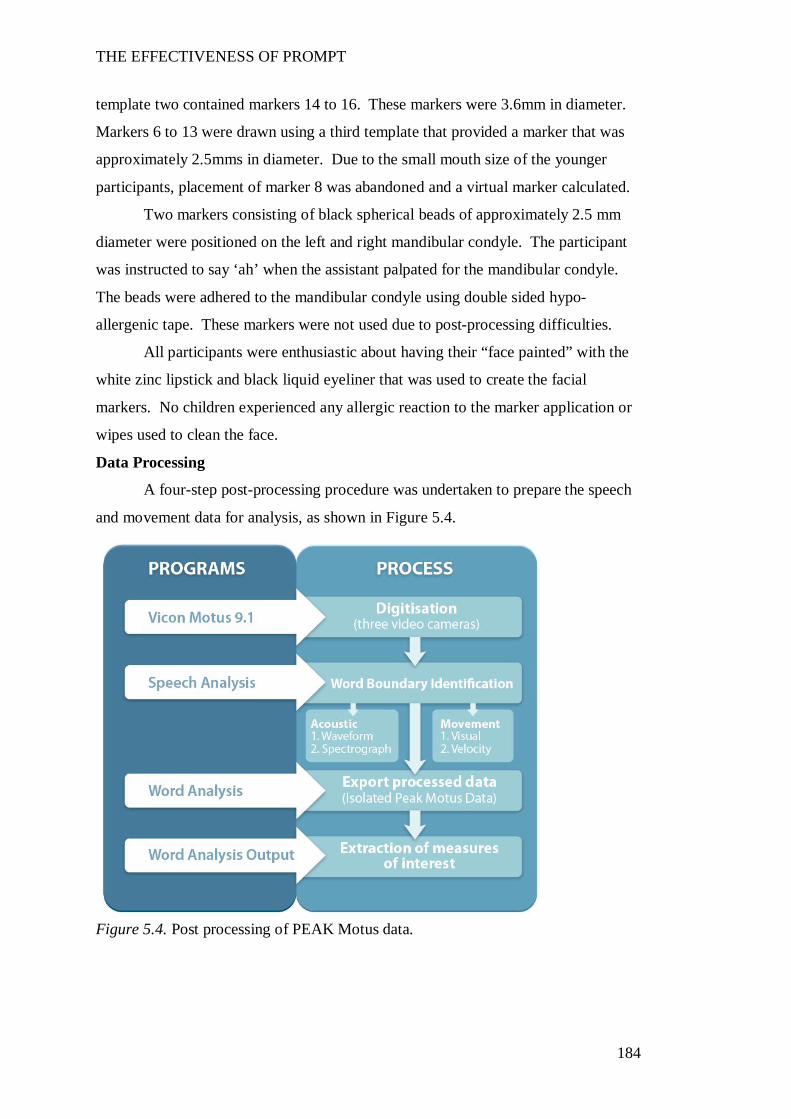
THE EFFECTIVENESS OF PROMPT
184
template two contained markers 14 to 16. These markers were 3.6mm in diameter.
Markers 6 to 13 were drawn using a third template that provided a marker that was
approximately 2.5mms in diameter. Due to the small mouth size of the younger
participants, placement of marker 8 was abandoned and a virtual marker calculated.
Two markers consisting of black spherical beads of approximately 2.5 mm
diameter were positioned on the left and right mandibular condyle. The participant
was instructed to say ‘ah’ when the assistant palpated for the mandibular condyle.
The beads were adhered to the mandibular condyle using double sided hypo-
allergenic tape. These markers were not used due to post-processing difficulties.
All participants were enthusiastic about having their “face painted” with the
white zinc lipstick and black liquid eyeliner that was used to create the facial
markers. No children experienced any allergic reaction to the marker application or
wipes used to clean the face.
Data Processing
A four-step post-processing procedure was undertaken to prepare the speech
and movement data for analysis, as shown in Figure 5.4.
Figure 5.4. Post processing of PEAK Motus data.
THE EFFECTIVENESS OF PROMPT
185
Digitisation.
The 50Hz video was captured from the video cameras onto a computer via an
IEEE1394 lead, imported into the PEAK Motus software and automatically digitised.
Poorly performing markers were identified during the automatic digitisation process
and subsequently, manually digitised. The digitised data from the 3 camera views
was then processed to produce three-dimensional (3D) scaled coordinates and
exported as an ASCII comma delimited dataset.
Three custom programs, written using LabVIEW 8.6.1 (National Instruments
Corporation, Austin, TX, USA), were used to extract the data.
Word boundary analysis.
The PEAK Motus video footage, containing the speech acoustic and
kinematic data, was exported into a custom written program (Speech Analysis),
created using LabVIEW 8.2.1 (National Instruments Corporation), for word
boundary identification.
Perceptual analysis.
Stimulus words were analysed for perceptual and movement errors by the
chief investigator. A correct/incorrect scoring criterion was utilised for the TD
peers. Productions were excluded if they contained articulatory errors, with the
exception of the word “push” by the 3-year-old TD peers. This word was produced
as “pus” with facial rounding. This production was accepted because the error was
attributed to inadequate tongue tension that did not affect the movement patterns
investigated in this study.
Word productions of the stimulus words from the participants with CP were
transcribed using broad phonetic transcription. Articulatory errors were excluded
only if they deviated substantially from their ‘typical’ productions.
All transcription was completed by the principal investigator.
Acoustic word boundary analysis.
The video footage was exported into the custom written speech analysis
program. The acoustic word-onset and -offset was initially identified visually and
aurally using the plotted waveform displayed in the speech analysis program. The
audio track (.wav files) containing these word boundaries (frame numbers) were then
exported for use in a spectrographic analysis program (SFS/WASP (Huckvale,
2007). The wide-band spectrographic display was used to confirm the word
THE EFFECTIVENESS OF PROMPT
186
boundary through identification of the onset and cessation of acoustic energy
associated with each word (Francis et al., 2003; Howell et al., 2009; McClean &
Tasko, 2003). All jaw measures, lip rounding/retraction distance, jaw/lip opening
velocity and word duration were analysed within the acoustic onset and offset
boundaries. Mean maximum movement measures were obtained for JOD, whilst the
JPD and JLDM measures were based on the average value obtained across the
repetitions.
Movement word boundary analysis.
The general location of a movement-preparation boundary, prior to the
acoustic-onset was identified for each word. This was initially identified based on
visual inspection of the video footage in the speech analysis program. The precise
point of the velocity zero-crossing, closest to the acoustic onset, was subsequently
determined automatically within a window that occurred between the movement
preparation phase and the acoustic onset. This was done using an algorithm written
into a specifically developed word analysis program, created using Labview 8.2.1.
The velocity trace was based on the recording of the lower lip + jaw marker. All
automatically identified zero-crossings were manually confirmed.
Reliable identification of movement offsets with this single-word-data-set
proved problematic. The speech science literature frequently reports the use of
carrier phrases such as “buy bobby a puppy” where the words of interest are
preceded and followed by a jaw raising or lowering movement, thus creating a
change in direction that promotes the identification of a peak or zero-crossing in the
velocity trace (Goffman & Smith, 1999; Green et al., 2002; Löfqvist & Gracco,
1997; Walsh et al., 2006). The inability of the participants in this study to produce a
carrier phrase required the use of single stimulus word-set only. Visual inspection of
the data in this thesis indicated the offset-zero-crossing could not be consistently
identified. Given this, the offset was based on the acoustic data.
The acoustic and movement boundary frames were subsequently recorded in
an excel spreadsheet and named using a convention that would allow a specifically
written program (word analysis) to read the frame numbers that identified the word
boundaries.
THE EFFECTIVENESS OF PROMPT
187
Word analysis.
The isolated data (that is the data independent of head rotation and
translation), containing the word as measured within the onset and offset boundaries,
were smoothed and time normalised to 200 points using a cubic spline algorithm (De
Boor, 2001), and exported to an Excel spreadsheet. These words were further
processed in the specifically developed “word analysis” program, created using
Labview 8.2.1 to identify the measures of interest – distance, position, velocity and
duration.
Visual inspection of the data was undertaken for all markers of interest to
identify any possible post-processing errors.
Word-analysis output.
The measures of interest were automatically extracted using a specifically
written program (Speech Word Analysis Output), created using LabVIEW 8.2.1
(National Instruments Corporation).
Data exclusion.
All productions were excluded from analysis if they contained excessive
volume, coughing, laughing or excessive movements that resulted in missing
markers.
Reliability
Acoustic word boundaries.
Intra-rater reliability of the acoustic word boundaries was evaluated by re-
measuring 10% of the participant data.
Intra-rater reliability of the acoustic word boundaries was evaluated by
comparing the time frames of the total word duration obtained using the
spectrographic analysis. The averaged absolute difference between the original and
the repeated measures was 31msecs.
Reliability measures for the kinematic measures of distance, velocity and
duration were not undertaken as the data are extracted automatically using custom
written programs.
THE EFFECTIVENESS OF PROMPT
188
Data Analysis
Non-parametric statistics were selected for the analysis of the motion analysis
data. Nonparametric statistics are recommended when sample size is small; data
distribution is unequal; the number of trials elicited per participant across testing
occasions is unequal and; data violates the assumptions of normality and
homogeneity (deVries, 1994; Field, 2009). The statistical analyses undertaken for
each of the kinematic measures are summarised in Table 5.4.
Exploratory analysis of the data was also undertaken using parametric tests.
However, the results indicated the data for some of the participants violated the
assumptions of homogeneity on some of the word stimuli. Log transformations were
applied but did not correct the violations in all cases. In addition, the number of
repetitions per word per testing occasion varied across the participants. In particular,
Participant 1 was able to produce only 3 repetitions per word during phase B.
The data were analysed as summarised in Table 5.1 for each participant
across the phases of the study:
1. Pre-Intervention: Assessment of the kinematic measures (distance, duration
and velocity) obtained prior to participation in the PROMPT Intervention. These
data were collected following administration of the final baseline speech probe
measure (Phase A). The Mann-Whitney test was used to determine the significance
of the differences between the kinematic measures of each participant and the
reference group of TD peers who were age-and-sex-matched to each participant.
2. Post-Intervention: Assessment of changes in the kinematic measures obtained
subsequent to participation in each of the two phases (B and C) of PROMPT
intervention, and again at follow-up (phase A2). Two non-parametric statistical tests
were used. Friedman’s ANOVA (p ≤.05) was used to test for the presence of a main
effect. Bonferroni-corrected pair-wise comparisons using the Wilcoxon signed-rank
test (p ≤.01) were used to evaluate differences in the values for each of the measures
across the study phases.
Two-tailed tests were used on all mandibular measures of velocity and
duration. One tailed tests were used on lip rounding/retraction (LRR) and inter-lip
distance during bilabial contact (BLC) based on a priori knowledge that these
distances were greater than the TD peers; and intervention was aimed at reducing
this distance. In addition, for P5 and P6 a linear mixed effect model (LME) was
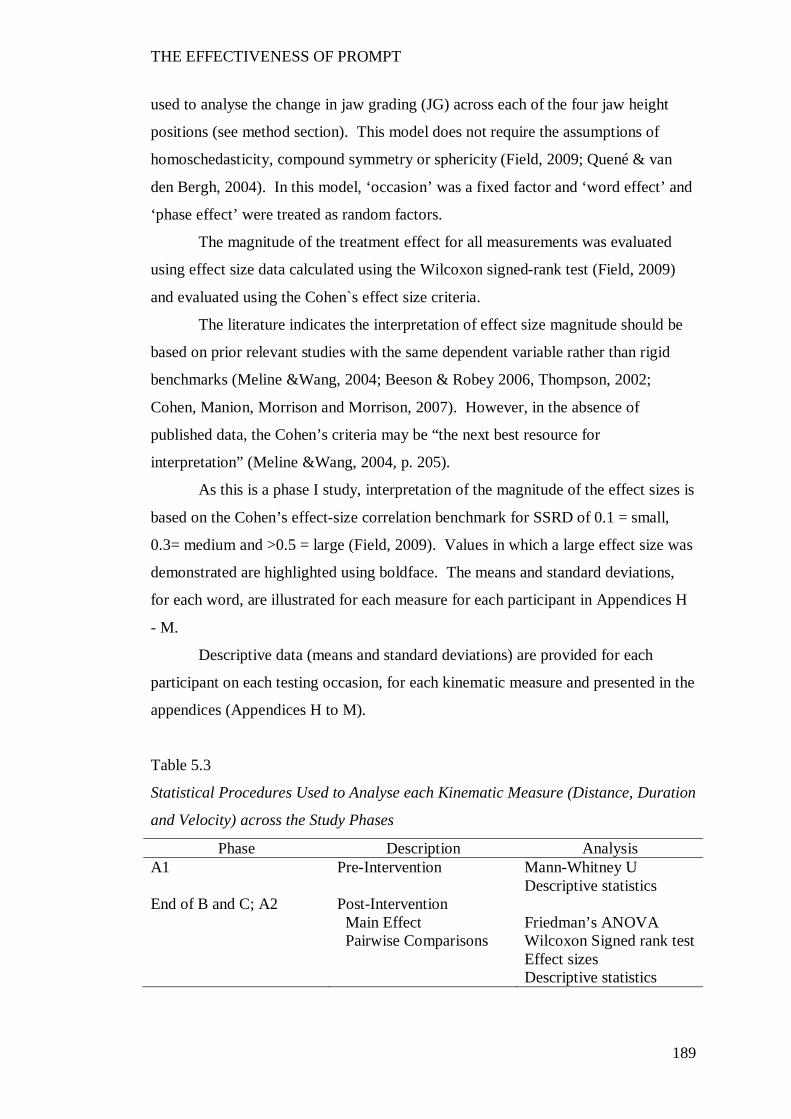
THE EFFECTIVENESS OF PROMPT
189
used to analyse the change in jaw grading (JG) across each of the four jaw height
positions (see method section). This model does not require the assumptions of
homoschedasticity, compound symmetry or sphericity (Field, 2009; Quené & van
den Bergh, 2004). In this model, ‘occasion’ was a fixed factor and ‘word effect’ and
‘phase effect’ were treated as random factors.
The magnitude of the treatment effect for all measurements was evaluated
using effect size data calculated using the Wilcoxon signed-rank test (Field, 2009)
and evaluated using the Cohen`s effect size criteria.
The literature indicates the interpretation of effect size magnitude should be
based on prior relevant studies with the same dependent variable rather than rigid
benchmarks (Meline &Wang, 2004; Beeson & Robey 2006, Thompson, 2002;
Cohen, Manion, Morrison and Morrison, 2007). However, in the absence of
published data, the Cohen’s criteria may be “the next best resource for
interpretation” (Meline &Wang, 2004, p. 205).
As this is a phase I study, interpretation of the magnitude of the effect sizes is
based on the Cohen’s effect-size correlation benchmark for SSRD of 0.1 = small,
0.3= medium and >0.5 = large (Field, 2009). Values in which a large effect size was
demonstrated are highlighted using boldface. The means and standard deviations,
for each word, are illustrated for each measure for each participant in Appendices H
- M.
Descriptive data (means and standard deviations) are provided for each
participant on each testing occasion, for each kinematic measure and presented in the
appendices (Appendices H to M).
Table 5.3
Statistical Procedures Used to Analyse each Kinematic Measure (Distance, Duration
and Velocity) across the Study Phases
Phase Description Analysis A1 Pre-Intervention Mann-Whitney U
Descriptive statistics End of B and C; A2 Post-Intervention Main Effect Friedman’s ANOVA Pairwise Comparisons Wilcoxon Signed rank test Effect sizes Descriptive statistics
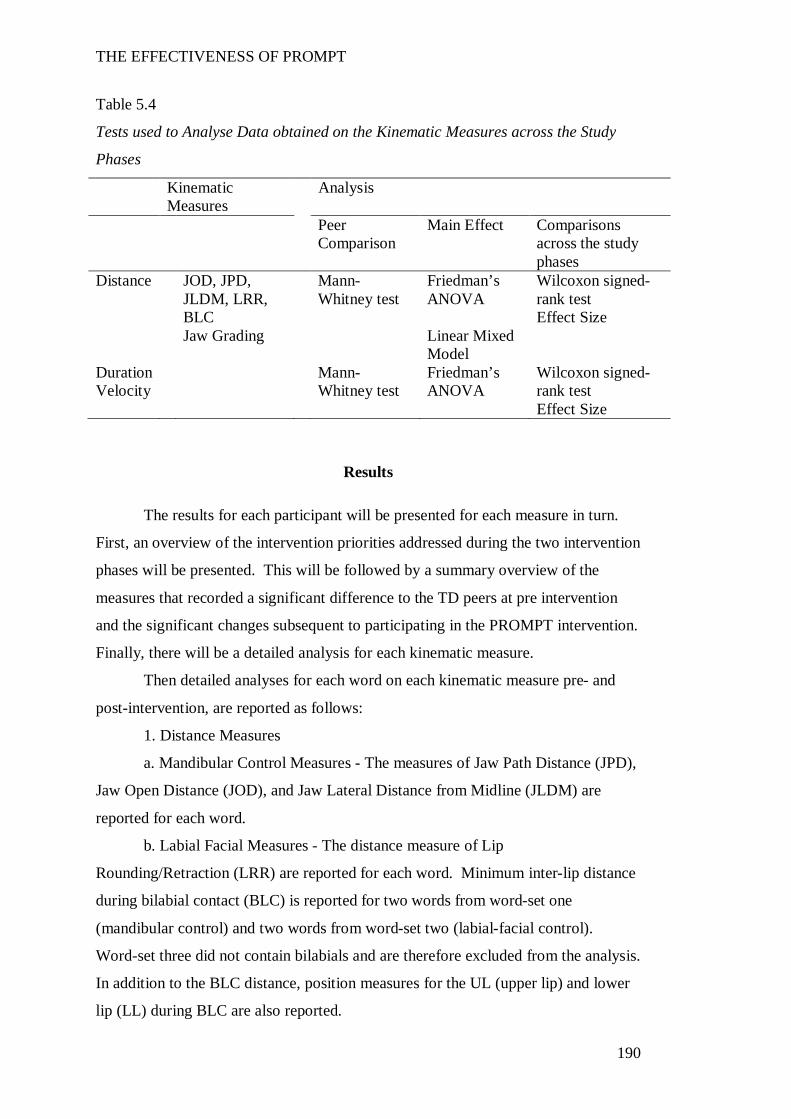
THE EFFECTIVENESS OF PROMPT
190
Table 5.4
Tests used to Analyse Data obtained on the Kinematic Measures across the Study
Phases
Kinematic Measures
Analysis
Peer Comparison
Main Effect Comparisons across the study phases
Distance JOD, JPD, JLDM, LRR, BLC
Mann-Whitney test
Friedman’s ANOVA
Wilcoxon signed-rank test Effect Size
Jaw Grading Linear Mixed Model
Duration Velocity
Mann-Whitney test
Friedman’s ANOVA
Wilcoxon signed-rank test Effect Size
Results
The results for each participant will be presented for each measure in turn.
First, an overview of the intervention priorities addressed during the two intervention
phases will be presented. This will be followed by a summary overview of the
measures that recorded a significant difference to the TD peers at pre intervention
and the significant changes subsequent to participating in the PROMPT intervention.
Finally, there will be a detailed analysis for each kinematic measure.
Then detailed analyses for each word on each kinematic measure pre- and
post-intervention, are reported as follows:
1. Distance Measures
a. Mandibular Control Measures - The measures of Jaw Path Distance (JPD),
Jaw Open Distance (JOD), and Jaw Lateral Distance from Midline (JLDM) are
reported for each word.
b. Labial Facial Measures - The distance measure of Lip
Rounding/Retraction (LRR) are reported for each word. Minimum inter-lip distance
during bilabial contact (BLC) is reported for two words from word-set one
(mandibular control) and two words from word-set two (labial-facial control).
Word-set three did not contain bilabials and are therefore excluded from the analysis.
In addition to the BLC distance, position measures for the UL (upper lip) and lower
lip (LL) during BLC are also reported.
THE EFFECTIVENESS OF PROMPT
191
2. Jaw/ Lip Opening Velocity (J/L Vel) - Peak opening velocity, calculated
on the lower lip (LL) marker, thus representing the combined action of the jaw and
lower lip is reported for each word.
3. Word Duration (WD) – The average word duration calculated for each
word.
Participant 1
The following motor-speech movement patterns were targeted during the
PROMPT Intervention:
Phase B: (Intervention priority one: labial-facial control) – Facilitate jaw
grading through jaw height positions (JHPs) 1 and 2, engage lip to lip contact during
the production of bilabials, timing and duration.
Phase C: (Intervention priority two: lingual control) – intra-oral contact of
alveolar plosives (e.g. /t/) in the mandibular plane. As Peak Motus (9.1) does not
record lingual movements, kinematic data collected during this phase reflects
changes in mandibular and labial-facial measurements subsequent to intervention
that targeted a higher level of motor-speech control.
The words that evidenced significant impairment of the jaw and lip measures
for P1 as compared with the typically developing (TD) peers pre-intervention and
significant changes post-intervention are presented in Table 5.5. Results are based
on five repetitions of each word, with the following exceptions: phase B - 3 trials
only per word as a result of fatigue preventing elicitation of 5 trials, and phase A2 - 4
trials of the word ‘spot’ phase A2, with one trial removed due to missing markers.
The distance data (see Appendix I) at pre-intervention show mandibular
control measures of word-set two and three, inter-lip distance during bilabial contact
(BLC) on 2/4 words and all lip retraction (LRR) values were significantly increased
in comparison to TD peers. Duration values differed across all word-sets, whilst
velocity measures differed for two words in word-sets two and three.
The post-intervention data show a positive treatment effect. Specifically, the
labial-facial distance measures; and the J/L Vel values of word-set three recorded the
most significant change (64% of LRR stimulus words and 100% of BLC stimulus
words).
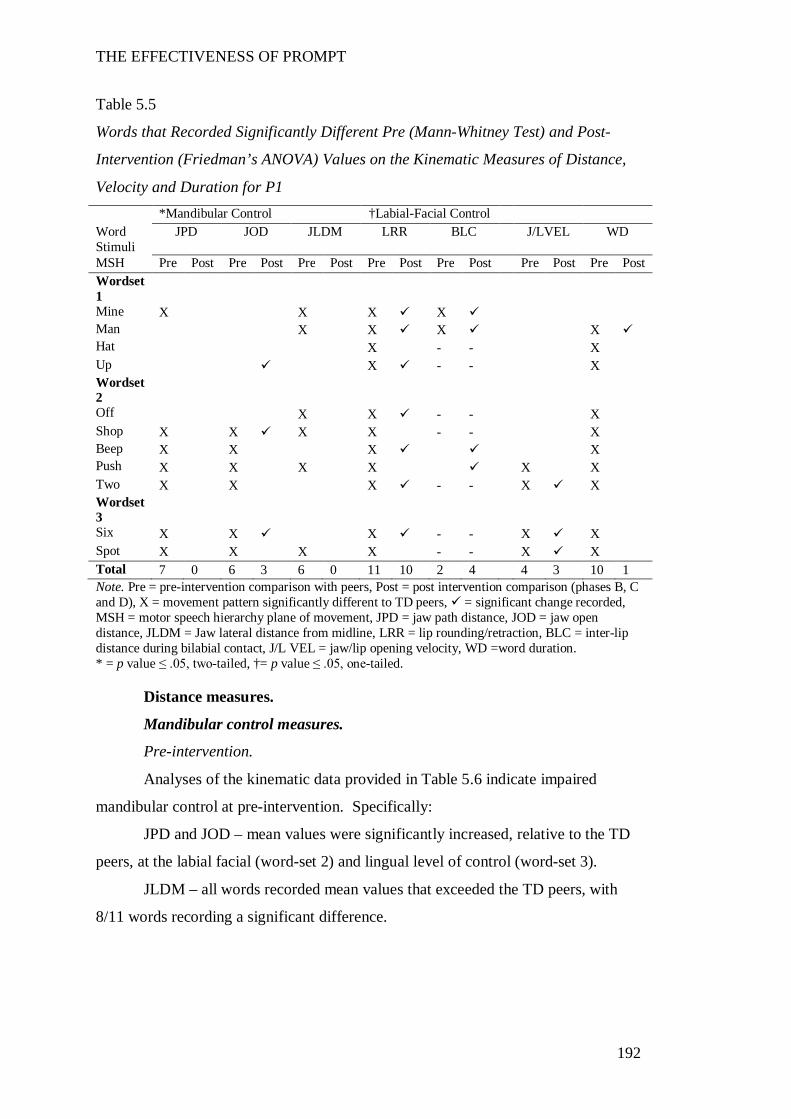
THE EFFECTIVENESS OF PROMPT
192
Table 5.5
Words that Recorded Significantly Different Pre (Mann-Whitney Test) and Post-
Intervention (Friedman’s ANOVA) Values on the Kinematic Measures of Distance,
Velocity and Duration for P1 *Mandibular Control †Labial-Facial Control Word Stimuli
JPD JOD JLDM LRR BLC J/LVEL WD
MSH Pre Post Pre Post Pre Post Pre Post Pre Post Pre Post Pre Post Wordset 1
Mine X X X X Man X X X X Hat X - - X Up X - - X Wordset 2
Off X X - - X Shop X X X X - - X Beep X X X X Push X X X X X X Two X X X - - X X Wordset 3
Six X X X - - X X Spot X X X X - - X X Total 7 0 6 3 6 0 11 10 2 4 4 3 10 1 Note. Pre = pre-intervention comparison with peers, Post = post intervention comparison (phases B, C and D), X = movement pattern significantly different to TD peers, = significant change recorded, MSH = motor speech hierarchy plane of movement, JPD = jaw path distance, JOD = jaw open distance, JLDM = Jaw lateral distance from midline, LRR = lip rounding/retraction, BLC = inter-lip distance during bilabial contact, J/L VEL = jaw/lip opening velocity, WD =word duration. * = p value ≤ .05, two-tailed, †= p value ≤ .05, one-tailed.
Distance measures.
Mandibular control measures.
Pre-intervention.
Analyses of the kinematic data provided in Table 5.6 indicate impaired
mandibular control at pre-intervention. Specifically:
JPD and JOD – mean values were significantly increased, relative to the TD
peers, at the labial facial (word-set 2) and lingual level of control (word-set 3).
JLDM – all words recorded mean values that exceeded the TD peers, with
8/11 words recording a significant difference.
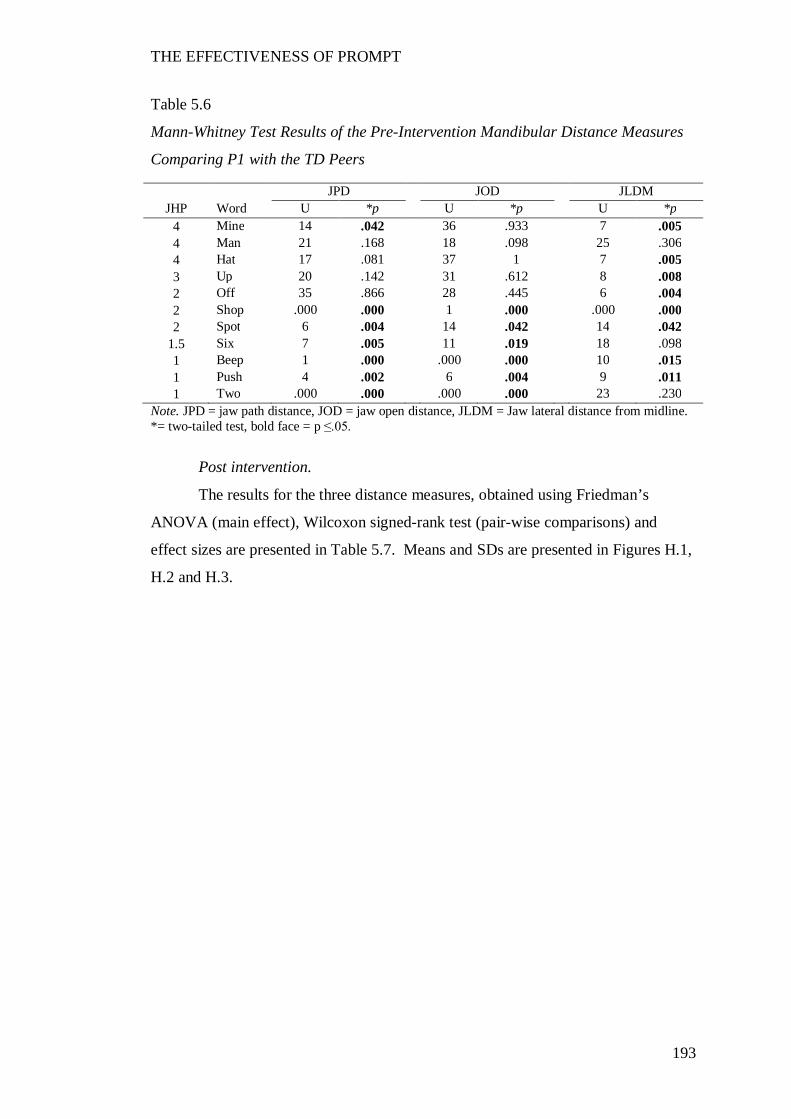
THE EFFECTIVENESS OF PROMPT
193
Table 5.6
Mann-Whitney Test Results of the Pre-Intervention Mandibular Distance Measures
Comparing P1 with the TD Peers
Note. JPD = jaw path distance, JOD = jaw open distance, JLDM = Jaw lateral distance from midline. *= two-tailed test, bold face = p ≤.05.
Post intervention.
The results for the three distance measures, obtained using Friedman’s
ANOVA (main effect), Wilcoxon signed-rank test (pair-wise comparisons) and
effect sizes are presented in Table 5.7. Means and SDs are presented in Figures H.1,
H.2 and H.3.
JPD JOD JLDM JHP Word U *p U *p U *p
4 Mine 14 .042 36 .933 7 .005 4 Man 21 .168 18 .098 25 .306 4 Hat 17 .081 37 1 7 .005 3 Up 20 .142 31 .612 8 .008 2 Off 35 .866 28 .445 6 .004 2 Shop .000 .000 1 .000 .000 .000 2 Spot 6 .004 14 .042 14 .042
1.5 Six 7 .005 11 .019 18 .098 1 Beep 1 .000 .000 .000 10 .015 1 Push 4 .002 6 .004 9 .011 1 Two .000 .000 .000 .000 23 .230
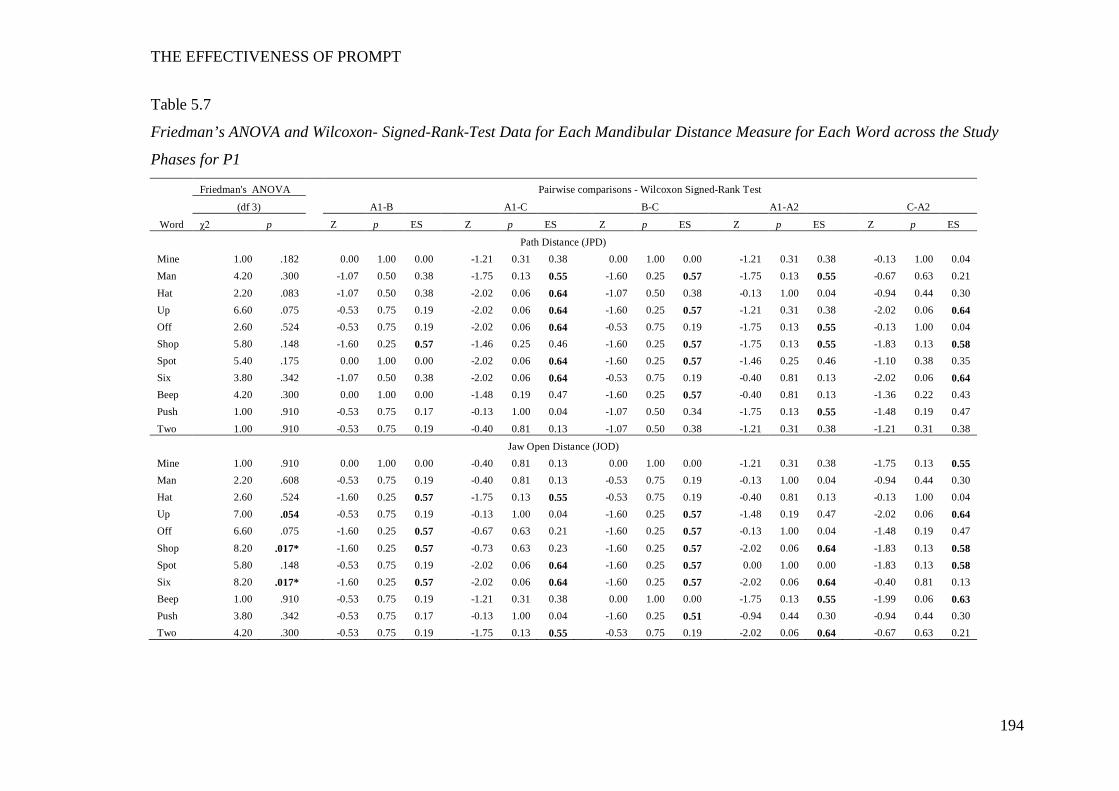
THE EFFECTIVENESS OF PROMPT
194
Table 5.7
Friedman’s ANOVA and Wilcoxon- Signed-Rank-Test Data for Each Mandibular Distance Measure for Each Word across the Study
Phases for P1
Friedman's ANOVA Pairwise comparisons - Wilcoxon Signed-Rank Test
(df 3) A1-B A1-C B-C A1-A2 C-A2
Word χ2 p Z p ES Z p ES Z p ES Z p ES Z p ES
Path Distance (JPD) Mine 1.00 .182 0.00 1.00 0.00 -1.21 0.31 0.38 0.00 1.00 0.00 -1.21 0.31 0.38 -0.13 1.00 0.04 Man 4.20 .300 -1.07 0.50 0.38 -1.75 0.13 0.55 -1.60 0.25 0.57 -1.75 0.13 0.55 -0.67 0.63 0.21 Hat 2.20 .083 -1.07 0.50 0.38 -2.02 0.06 0.64 -1.07 0.50 0.38 -0.13 1.00 0.04 -0.94 0.44 0.30 Up 6.60 .075 -0.53 0.75 0.19 -2.02 0.06 0.64 -1.60 0.25 0.57 -1.21 0.31 0.38 -2.02 0.06 0.64 Off 2.60 .524 -0.53 0.75 0.19 -2.02 0.06 0.64 -0.53 0.75 0.19 -1.75 0.13 0.55 -0.13 1.00 0.04 Shop 5.80 .148 -1.60 0.25 0.57 -1.46 0.25 0.46 -1.60 0.25 0.57 -1.75 0.13 0.55 -1.83 0.13 0.58 Spot 5.40 .175 0.00 1.00 0.00 -2.02 0.06 0.64 -1.60 0.25 0.57 -1.46 0.25 0.46 -1.10 0.38 0.35 Six 3.80 .342 -1.07 0.50 0.38 -2.02 0.06 0.64 -0.53 0.75 0.19 -0.40 0.81 0.13 -2.02 0.06 0.64 Beep 4.20 .300 0.00 1.00 0.00 -1.48 0.19 0.47 -1.60 0.25 0.57 -0.40 0.81 0.13 -1.36 0.22 0.43 Push 1.00 .910 -0.53 0.75 0.17 -0.13 1.00 0.04 -1.07 0.50 0.34 -1.75 0.13 0.55 -1.48 0.19 0.47 Two 1.00 .910 -0.53 0.75 0.19 -0.40 0.81 0.13 -1.07 0.50 0.38 -1.21 0.31 0.38 -1.21 0.31 0.38
Jaw Open Distance (JOD) Mine 1.00 .910 0.00 1.00 0.00 -0.40 0.81 0.13 0.00 1.00 0.00 -1.21 0.31 0.38 -1.75 0.13 0.55 Man 2.20 .608 -0.53 0.75 0.19 -0.40 0.81 0.13 -0.53 0.75 0.19 -0.13 1.00 0.04 -0.94 0.44 0.30 Hat 2.60 .524 -1.60 0.25 0.57 -1.75 0.13 0.55 -0.53 0.75 0.19 -0.40 0.81 0.13 -0.13 1.00 0.04 Up 7.00 .054 -0.53 0.75 0.19 -0.13 1.00 0.04 -1.60 0.25 0.57 -1.48 0.19 0.47 -2.02 0.06 0.64 Off 6.60 .075 -1.60 0.25 0.57 -0.67 0.63 0.21 -1.60 0.25 0.57 -0.13 1.00 0.04 -1.48 0.19 0.47 Shop 8.20 .017* -1.60 0.25 0.57 -0.73 0.63 0.23 -1.60 0.25 0.57 -2.02 0.06 0.64 -1.83 0.13 0.58 Spot 5.80 .148 -0.53 0.75 0.19 -2.02 0.06 0.64 -1.60 0.25 0.57 0.00 1.00 0.00 -1.83 0.13 0.58 Six 8.20 .017* -1.60 0.25 0.57 -2.02 0.06 0.64 -1.60 0.25 0.57 -2.02 0.06 0.64 -0.40 0.81 0.13 Beep 1.00 .910 -0.53 0.75 0.19 -1.21 0.31 0.38 0.00 1.00 0.00 -1.75 0.13 0.55 -1.99 0.06 0.63 Push 3.80 .342 -0.53 0.75 0.17 -0.13 1.00 0.04 -1.60 0.25 0.51 -0.94 0.44 0.30 -0.94 0.44 0.30 Two 4.20 .300 -0.53 0.75 0.19 -1.75 0.13 0.55 -0.53 0.75 0.19 -2.02 0.06 0.64 -0.67 0.63 0.21
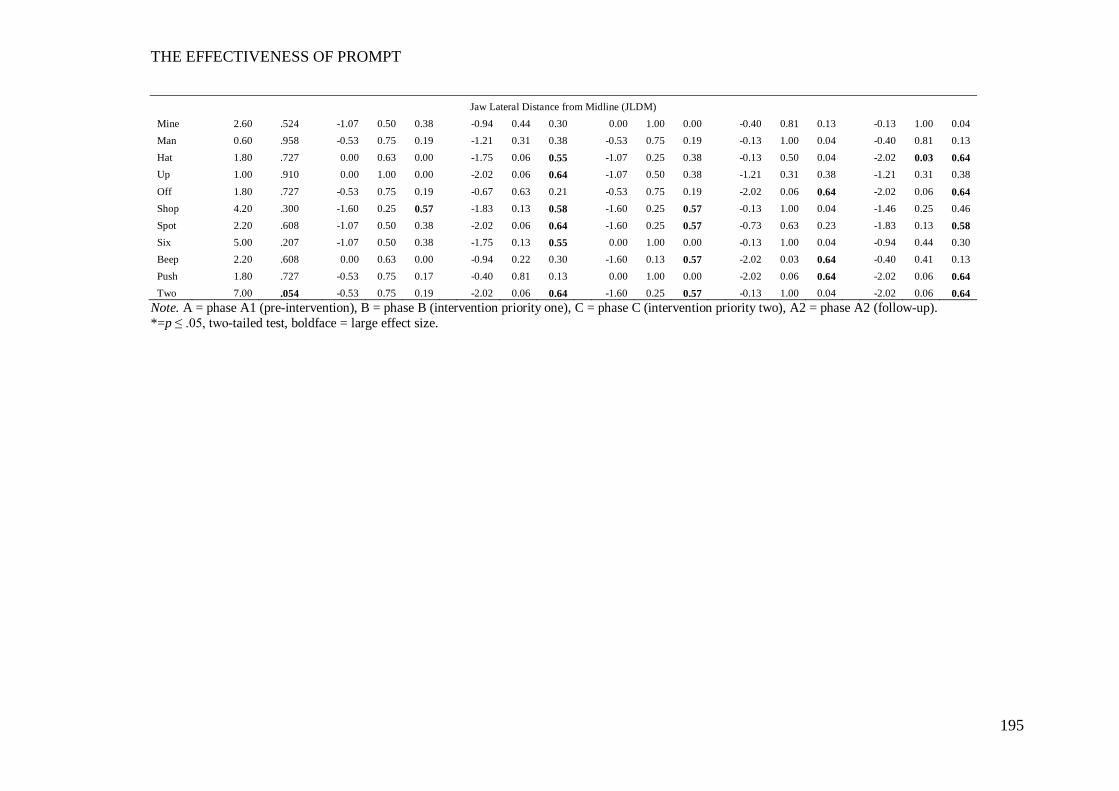
THE EFFECTIVENESS OF PROMPT
195
Jaw Lateral Distance from Midline (JLDM) Mine 2.60 .524 -1.07 0.50 0.38 -0.94 0.44 0.30 0.00 1.00 0.00 -0.40 0.81 0.13 -0.13 1.00 0.04 Man 0.60 .958 -0.53 0.75 0.19 -1.21 0.31 0.38 -0.53 0.75 0.19 -0.13 1.00 0.04 -0.40 0.81 0.13 Hat 1.80 .727 0.00 0.63 0.00 -1.75 0.06 0.55 -1.07 0.25 0.38 -0.13 0.50 0.04 -2.02 0.03 0.64 Up 1.00 .910 0.00 1.00 0.00 -2.02 0.06 0.64 -1.07 0.50 0.38 -1.21 0.31 0.38 -1.21 0.31 0.38 Off 1.80 .727 -0.53 0.75 0.19 -0.67 0.63 0.21 -0.53 0.75 0.19 -2.02 0.06 0.64 -2.02 0.06 0.64 Shop 4.20 .300 -1.60 0.25 0.57 -1.83 0.13 0.58 -1.60 0.25 0.57 -0.13 1.00 0.04 -1.46 0.25 0.46 Spot 2.20 .608 -1.07 0.50 0.38 -2.02 0.06 0.64 -1.60 0.25 0.57 -0.73 0.63 0.23 -1.83 0.13 0.58 Six 5.00 .207 -1.07 0.50 0.38 -1.75 0.13 0.55 0.00 1.00 0.00 -0.13 1.00 0.04 -0.94 0.44 0.30 Beep 2.20 .608 0.00 0.63 0.00 -0.94 0.22 0.30 -1.60 0.13 0.57 -2.02 0.03 0.64 -0.40 0.41 0.13 Push 1.80 .727 -0.53 0.75 0.17 -0.40 0.81 0.13 0.00 1.00 0.00 -2.02 0.06 0.64 -2.02 0.06 0.64 Two 7.00 .054 -0.53 0.75 0.19 -2.02 0.06 0.64 -1.60 0.25 0.57 -0.13 1.00 0.04 -2.02 0.06 0.64
Note. A = phase A1 (pre-intervention), B = phase B (intervention priority one), C = phase C (intervention priority two), A2 = phase A2 (follow-up). *=p ≤ .05, two-tailed test, boldface = large effect size.
THE EFFECTIVENESS OF PROMPT
196
Jaw Path Distance (JPD).
Whilst the results of the Friedman’s ANOVA and Wilcoxon signed-rank tests
indicate no statistically significant change, the effect size data (Table 4.4) and the
descriptive data (Figure H.1) indicate clinically significant changes across the study
phases.
Decreases in mean values, with a trend towards the TD peers were recorded
between phases A-B in 3/5 words of word-set two (beep, push and shop). Phase C
(intervention priority: lingual control) was characterized by an increase in mean
values that exceeded pre-intervention in 10/11 words and indicates a trend away
from the TD peers. However, between phases C-A2, a return to decreasing values
was observed in these same 10 words, with 5/10 (up, shop, push, beep, two) words
recording values lower than pre-intervention (phase A1).
Jaw Open Distance (JOD).
The results obtained using Friedman’s ANOVA indicate the presence of a
main effect on three words (up, shop and six).
Whilst the pairwise comparisons between phases A-B were not significant,
large effect sizes were recorded on four words (hat, off, shop, six). This indicates a
clinically significant effect (intervention priority: labial-facial control) with a trend
towards the TD peers. Phase C (intervention priority: lingual control) yielded a
return to an increase in mean values on these same words, however they remained
below pre-intervention values (Table H.2).
Between phases A1-A2, large effect sizes were recorded in word-sets two
and three, with a trend direction towards the TD peers. This indicates a clinically
significant change.
Jaw Lateral Distance from Midline (JLDM).
The results obtained using Friedman’s ANOVA indicate no presence of a
main effect on any word, thus indicating no statistically significant changes.
However, clinically significant changes were indicated. Moderate effect
sizes were recorded on four words (shop, spot, six and mine). Mean values (see
Table H.3) increased between phases B-C with three words (hat, up, two) recording
values above 3mm. Phase A2 (follow-up) showed a return to decreasing values with
5/11 recording values less than pre-intervention (phase A1).
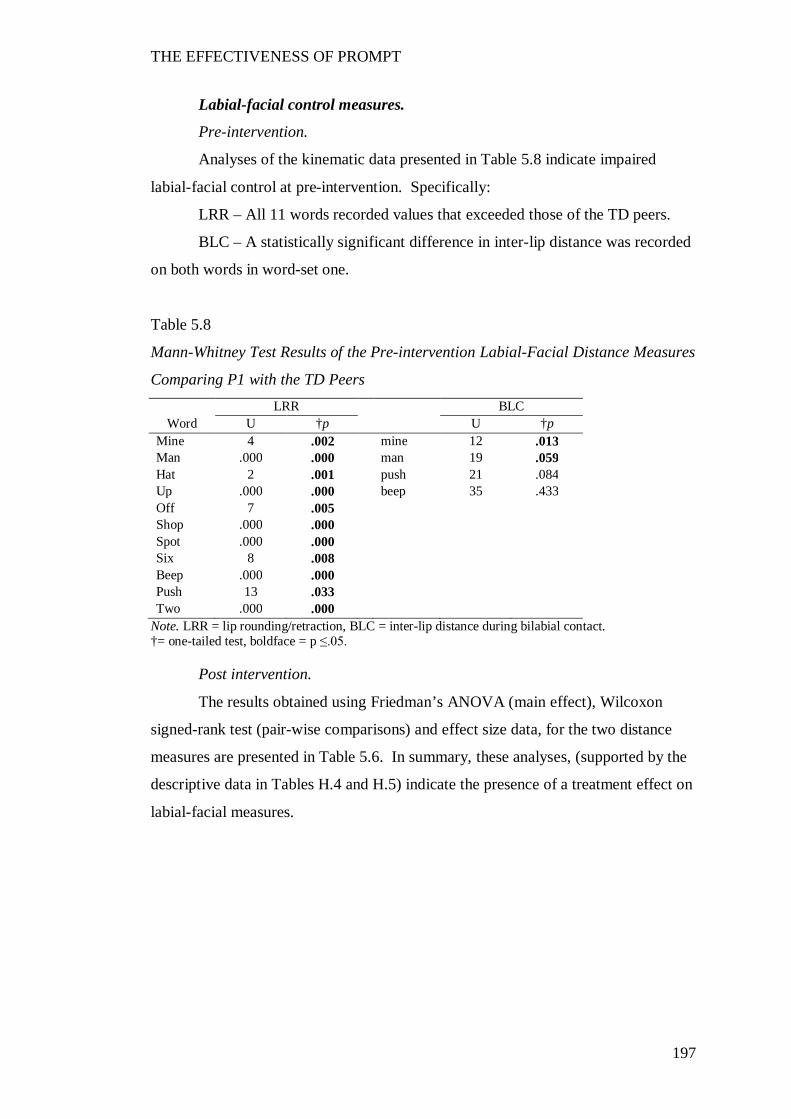
THE EFFECTIVENESS OF PROMPT
197
Labial-facial control measures.
Pre-intervention.
Analyses of the kinematic data presented in Table 5.8 indicate impaired
labial-facial control at pre-intervention. Specifically:
LRR – All 11 words recorded values that exceeded those of the TD peers.
BLC – A statistically significant difference in inter-lip distance was recorded
on both words in word-set one.
Table 5.8
Mann-Whitney Test Results of the Pre-intervention Labial-Facial Distance Measures
Comparing P1 with the TD Peers LRR BLC
Word U †p U †p Mine 4 .002 mine 12 .013 Man .000 .000 man 19 .059 Hat 2 .001 push 21 .084 Up .000 .000 beep 35 .433 Off 7 .005 Shop .000 .000 Spot .000 .000 Six 8 .008 Beep .000 .000 Push 13 .033 Two .000 .000
Note. LRR = lip rounding/retraction, BLC = inter-lip distance during bilabial contact. †= one-tailed test, boldface = p ≤.05.
Post intervention.
The results obtained using Friedman’s ANOVA (main effect), Wilcoxon
signed-rank test (pair-wise comparisons) and effect size data, for the two distance
measures are presented in Table 5.6. In summary, these analyses, (supported by the
descriptive data in Tables H.4 and H.5) indicate the presence of a treatment effect on
labial-facial measures.
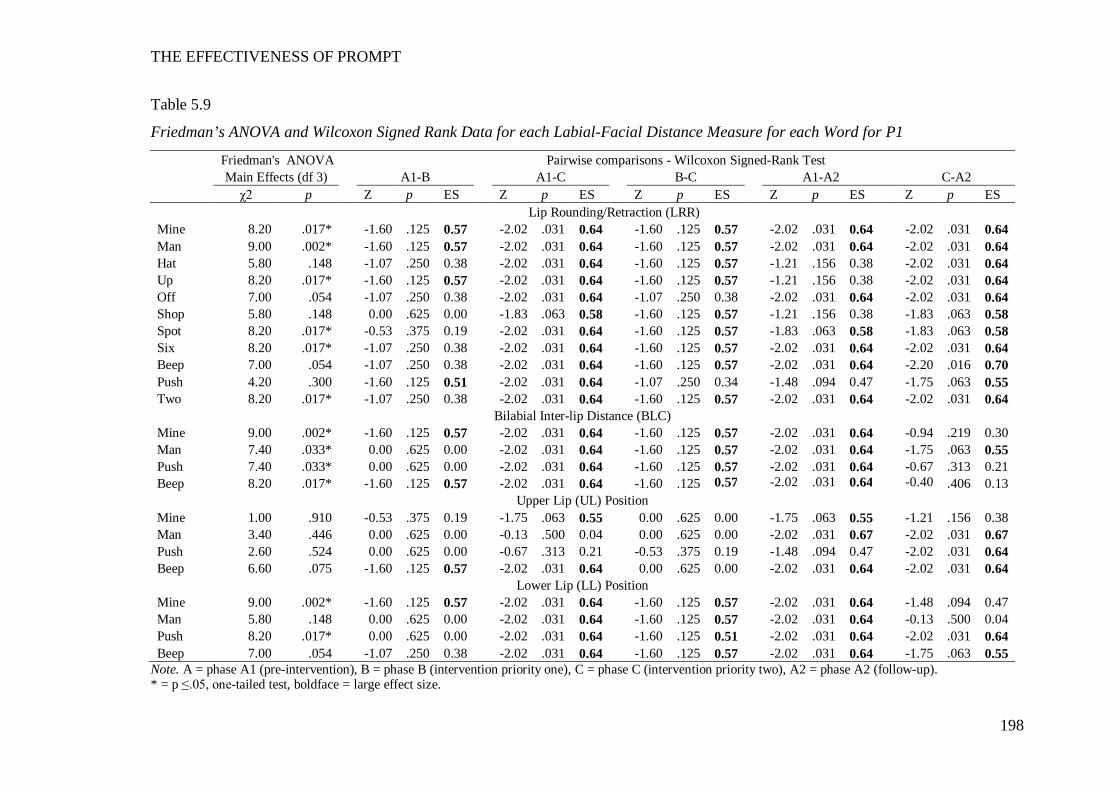
THE EFFECTIVENESS OF PROMPT
198
Table 5.9
Friedman’s ANOVA and Wilcoxon Signed Rank Data for each Labial-Facial Distance Measure for each Word for P1
Friedman's ANOVA Pairwise comparisons - Wilcoxon Signed-Rank Test Main Effects (df 3) A1-B A1-C B-C A1-A2 C-A2 χ2 p Z p ES Z p ES Z p ES Z p ES Z p ES Lip Rounding/Retraction (LRR) Mine 8.20 .017* -1.60 .125 0.57 -2.02 .031 0.64 -1.60 .125 0.57 -2.02 .031 0.64 -2.02 .031 0.64 Man 9.00 .002* -1.60 .125 0.57 -2.02 .031 0.64 -1.60 .125 0.57 -2.02 .031 0.64 -2.02 .031 0.64 Hat 5.80 .148 -1.07 .250 0.38 -2.02 .031 0.64 -1.60 .125 0.57 -1.21 .156 0.38 -2.02 .031 0.64 Up 8.20 .017* -1.60 .125 0.57 -2.02 .031 0.64 -1.60 .125 0.57 -1.21 .156 0.38 -2.02 .031 0.64 Off 7.00 .054 -1.07 .250 0.38 -2.02 .031 0.64 -1.07 .250 0.38 -2.02 .031 0.64 -2.02 .031 0.64 Shop 5.80 .148 0.00 .625 0.00 -1.83 .063 0.58 -1.60 .125 0.57 -1.21 .156 0.38 -1.83 .063 0.58 Spot 8.20 .017* -0.53 .375 0.19 -2.02 .031 0.64 -1.60 .125 0.57 -1.83 .063 0.58 -1.83 .063 0.58 Six 8.20 .017* -1.07 .250 0.38 -2.02 .031 0.64 -1.60 .125 0.57 -2.02 .031 0.64 -2.02 .031 0.64 Beep 7.00 .054 -1.07 .250 0.38 -2.02 .031 0.64 -1.60 .125 0.57 -2.02 .031 0.64 -2.20 .016 0.70 Push 4.20 .300 -1.60 .125 0.51 -2.02 .031 0.64 -1.07 .250 0.34 -1.48 .094 0.47 -1.75 .063 0.55 Two 8.20 .017* -1.07 .250 0.38 -2.02 .031 0.64 -1.60 .125 0.57 -2.02 .031 0.64 -2.02 .031 0.64
Bilabial Inter-lip Distance (BLC) Mine 9.00 .002* -1.60 .125 0.57 -2.02 .031 0.64 -1.60 .125 0.57 -2.02 .031 0.64 -0.94 .219 0.30 Man 7.40 .033* 0.00 .625 0.00 -2.02 .031 0.64 -1.60 .125 0.57 -2.02 .031 0.64 -1.75 .063 0.55 Push 7.40 .033* 0.00 .625 0.00 -2.02 .031 0.64 -1.60 .125 0.57 -2.02 .031 0.64 -0.67 .313 0.21 Beep 8.20 .017* -1.60 .125 0.57 -2.02 .031 0.64 -1.60 .125 0.57 -2.02 .031 0.64 -0.40 .406 0.13
Upper Lip (UL) Position Mine 1.00 .910 -0.53 .375 0.19 -1.75 .063 0.55 0.00 .625 0.00 -1.75 .063 0.55 -1.21 .156 0.38 Man 3.40 .446 0.00 .625 0.00 -0.13 .500 0.04 0.00 .625 0.00 -2.02 .031 0.67 -2.02 .031 0.67 Push 2.60 .524 0.00 .625 0.00 -0.67 .313 0.21 -0.53 .375 0.19 -1.48 .094 0.47 -2.02 .031 0.64 Beep 6.60 .075 -1.60 .125 0.57 -2.02 .031 0.64 0.00 .625 0.00 -2.02 .031 0.64 -2.02 .031 0.64
Lower Lip (LL) Position Mine 9.00 .002* -1.60 .125 0.57 -2.02 .031 0.64 -1.60 .125 0.57 -2.02 .031 0.64 -1.48 .094 0.47 Man 5.80 .148 0.00 .625 0.00 -2.02 .031 0.64 -1.60 .125 0.57 -2.02 .031 0.64 -0.13 .500 0.04 Push 8.20 .017* 0.00 .625 0.00 -2.02 .031 0.64 -1.60 .125 0.51 -2.02 .031 0.64 -2.02 .031 0.64 Beep 7.00 .054 -1.07 .250 0.38 -2.02 .031 0.64 -1.60 .125 0.57 -2.02 .031 0.64 -1.75 .063 0.55
Note. A = phase A1 (pre-intervention), B = phase B (intervention priority one), C = phase C (intervention priority two), A2 = phase A2 (follow-up). * = p ≤.05, one-tailed test, boldface = large effect size.
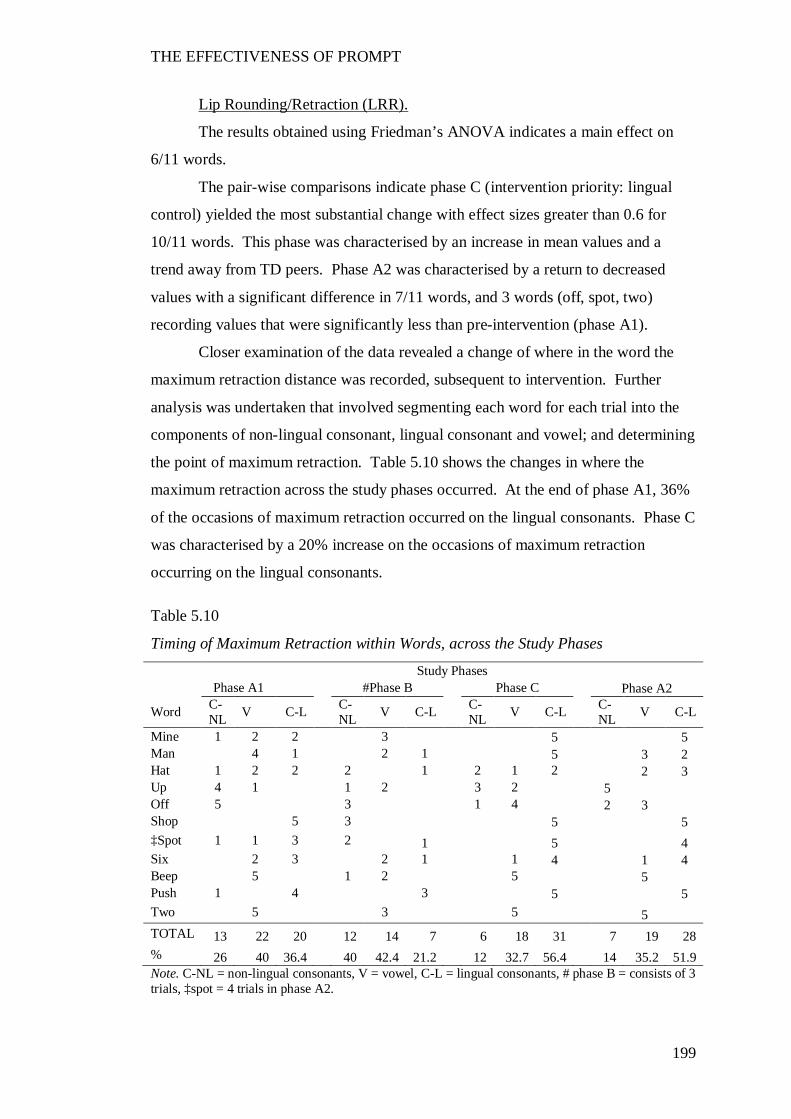
THE EFFECTIVENESS OF PROMPT
199
Lip Rounding/Retraction (LRR).
The results obtained using Friedman’s ANOVA indicates a main effect on
6/11 words.
The pair-wise comparisons indicate phase C (intervention priority: lingual
control) yielded the most substantial change with effect sizes greater than 0.6 for
10/11 words. This phase was characterised by an increase in mean values and a
trend away from TD peers. Phase A2 was characterised by a return to decreased
values with a significant difference in 7/11 words, and 3 words (off, spot, two)
recording values that were significantly less than pre-intervention (phase A1).
Closer examination of the data revealed a change of where in the word the
maximum retraction distance was recorded, subsequent to intervention. Further
analysis was undertaken that involved segmenting each word for each trial into the
components of non-lingual consonant, lingual consonant and vowel; and determining
the point of maximum retraction. Table 5.10 shows the changes in where the
maximum retraction across the study phases occurred. At the end of phase A1, 36%
of the occasions of maximum retraction occurred on the lingual consonants. Phase C
was characterised by a 20% increase on the occasions of maximum retraction
occurring on the lingual consonants.
Table 5.10
Timing of Maximum Retraction within Words, across the Study Phases
Study Phases Phase A1 #Phase B Phase C Phase A2
Word C-NL V C-L C-
NL V C-L C-NL V C-L
C-NL V C-L
Mine 1 2 2 3 5 5 Man 4 1 2 1 5 3 2 Hat 1 2 2 2 1 2 1 2 2 3 Up 4 1 1 2 3 2 5 Off 5 3 1 4 2 3 Shop 5 3 5 5 ‡Spot 1 1 3 2 1 5 4 Six 2 3 2 1 1 4 1 4 Beep 5 1 2 5 5 Push 1 4 3 5 5 Two 5 3 5 5 TOTAL 13 22 20 12 14 7 6 18 31 7 19 28 % 26 40 36.4 40 42.4 21.2 12 32.7 56.4 14 35.2 51.9 Note. C-NL = non-lingual consonants, V = vowel, C-L = lingual consonants, # phase B = consists of 3 trials, ‡spot = 4 trials in phase A2.
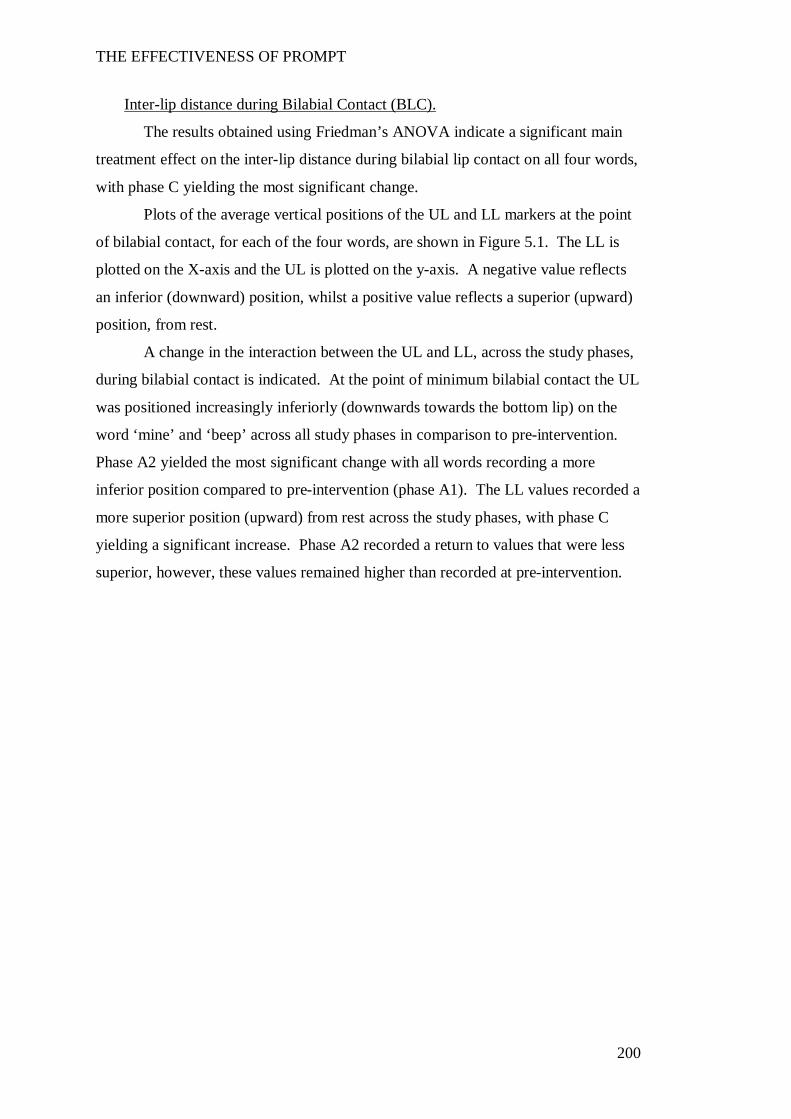
THE EFFECTIVENESS OF PROMPT
200
Inter-lip distance during Bilabial Contact (BLC).
The results obtained using Friedman’s ANOVA indicate a significant main
treatment effect on the inter-lip distance during bilabial lip contact on all four words,
with phase C yielding the most significant change.
Plots of the average vertical positions of the UL and LL markers at the point
of bilabial contact, for each of the four words, are shown in Figure 5.1. The LL is
plotted on the X-axis and the UL is plotted on the y-axis. A negative value reflects
an inferior (downward) position, whilst a positive value reflects a superior (upward)
position, from rest.
A change in the interaction between the UL and LL, across the study phases,
during bilabial contact is indicated. At the point of minimum bilabial contact the UL
was positioned increasingly inferiorly (downwards towards the bottom lip) on the
word ‘mine’ and ‘beep’ across all study phases in comparison to pre-intervention.
Phase A2 yielded the most significant change with all words recording a more
inferior position compared to pre-intervention (phase A1). The LL values recorded a
more superior position (upward) from rest across the study phases, with phase C
yielding a significant increase. Phase A2 recorded a return to values that were less
superior, however, these values remained higher than recorded at pre-intervention.
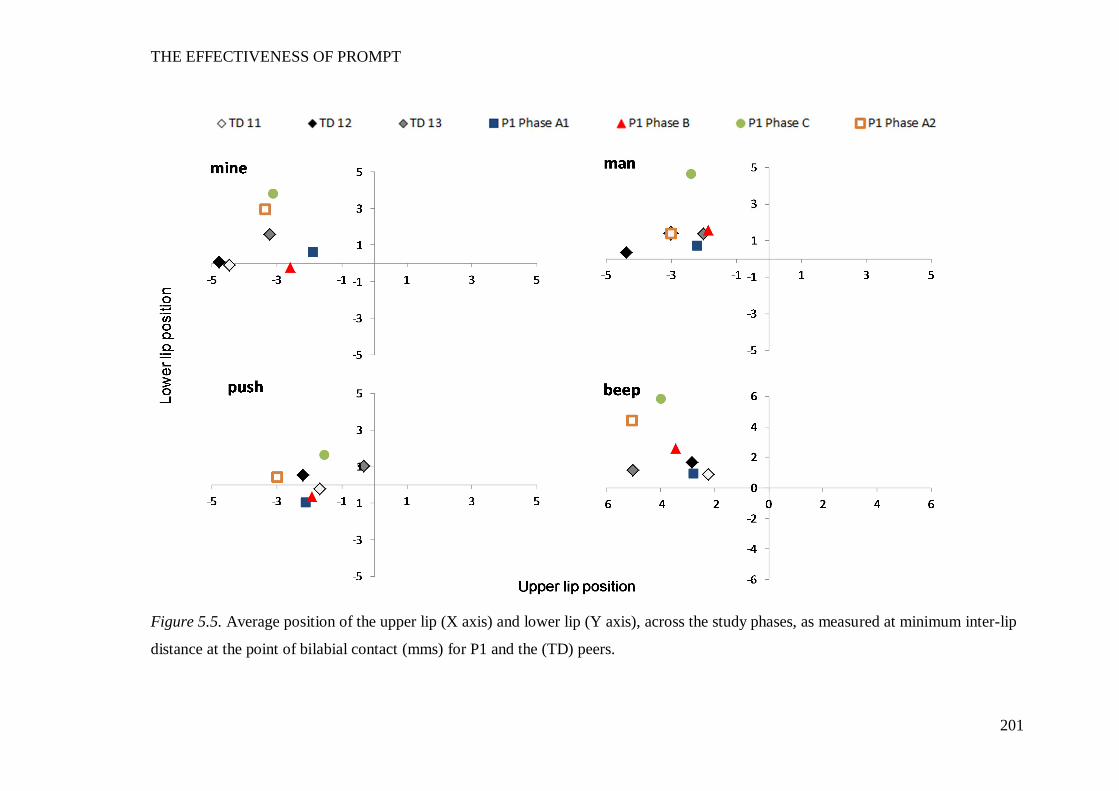
THE EFFECTIVENESS OF PROMPT
201
Figure 5.5. Average position of the upper lip (X axis) and lower lip (Y axis), across the study phases, as measured at minimum inter-lip
distance at the point of bilabial contact (mms) for P1 and the (TD) peers.
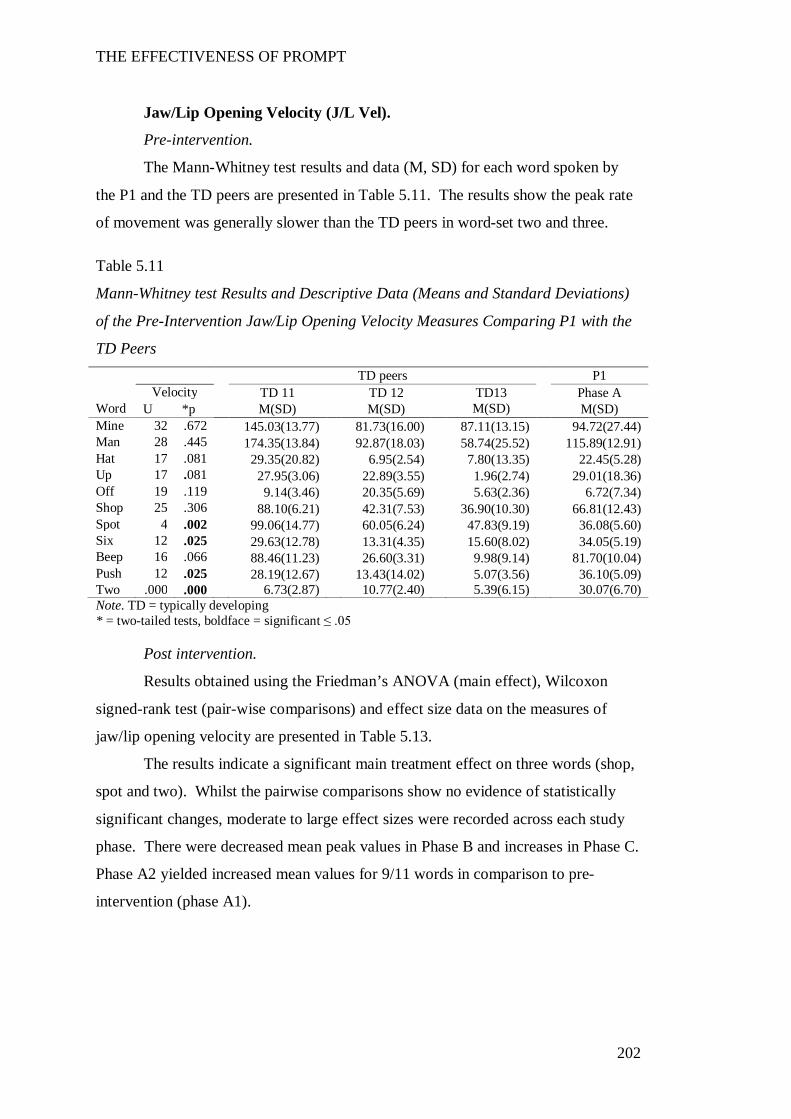
THE EFFECTIVENESS OF PROMPT
202
Jaw/Lip Opening Velocity (J/L Vel).
Pre-intervention.
The Mann-Whitney test results and data (M, SD) for each word spoken by
the P1 and the TD peers are presented in Table 5.11. The results show the peak rate
of movement was generally slower than the TD peers in word-set two and three.
Table 5.11
Mann-Whitney test Results and Descriptive Data (Means and Standard Deviations)
of the Pre-Intervention Jaw/Lip Opening Velocity Measures Comparing P1 with the
TD Peers TD peers P1 Velocity TD 11 TD 12 TD13 Phase A
Word U *p M(SD) M(SD) M(SD) M(SD) Mine 32 .672 145.03(13.77) 81.73(16.00) 87.11(13.15) 94.72(27.44) Man 28 .445 174.35(13.84) 92.87(18.03) 58.74(25.52) 115.89(12.91) Hat 17 .081 29.35(20.82) 6.95(2.54) 7.80(13.35) 22.45(5.28) Up 17 .081 27.95(3.06) 22.89(3.55) 1.96(2.74) 29.01(18.36) Off 19 .119 9.14(3.46) 20.35(5.69) 5.63(2.36) 6.72(7.34) Shop 25 .306 88.10(6.21) 42.31(7.53) 36.90(10.30) 66.81(12.43) Spot 4 .002 99.06(14.77) 60.05(6.24) 47.83(9.19) 36.08(5.60) Six 12 .025 29.63(12.78) 13.31(4.35) 15.60(8.02) 34.05(5.19) Beep 16 .066 88.46(11.23) 26.60(3.31) 9.98(9.14) 81.70(10.04) Push 12 .025 28.19(12.67) 13.43(14.02) 5.07(3.56) 36.10(5.09) Two .000 .000 6.73(2.87) 10.77(2.40) 5.39(6.15) 30.07(6.70) Note. TD = typically developing * = two-tailed tests, boldface = significant ≤ .05
Post intervention.
Results obtained using the Friedman’s ANOVA (main effect), Wilcoxon
signed-rank test (pair-wise comparisons) and effect size data on the measures of
jaw/lip opening velocity are presented in Table 5.13.
The results indicate a significant main treatment effect on three words (shop,
spot and two). Whilst the pairwise comparisons show no evidence of statistically
significant changes, moderate to large effect sizes were recorded across each study
phase. There were decreased mean peak values in Phase B and increases in Phase C.
Phase A2 yielded increased mean values for 9/11 words in comparison to pre-
intervention (phase A1).
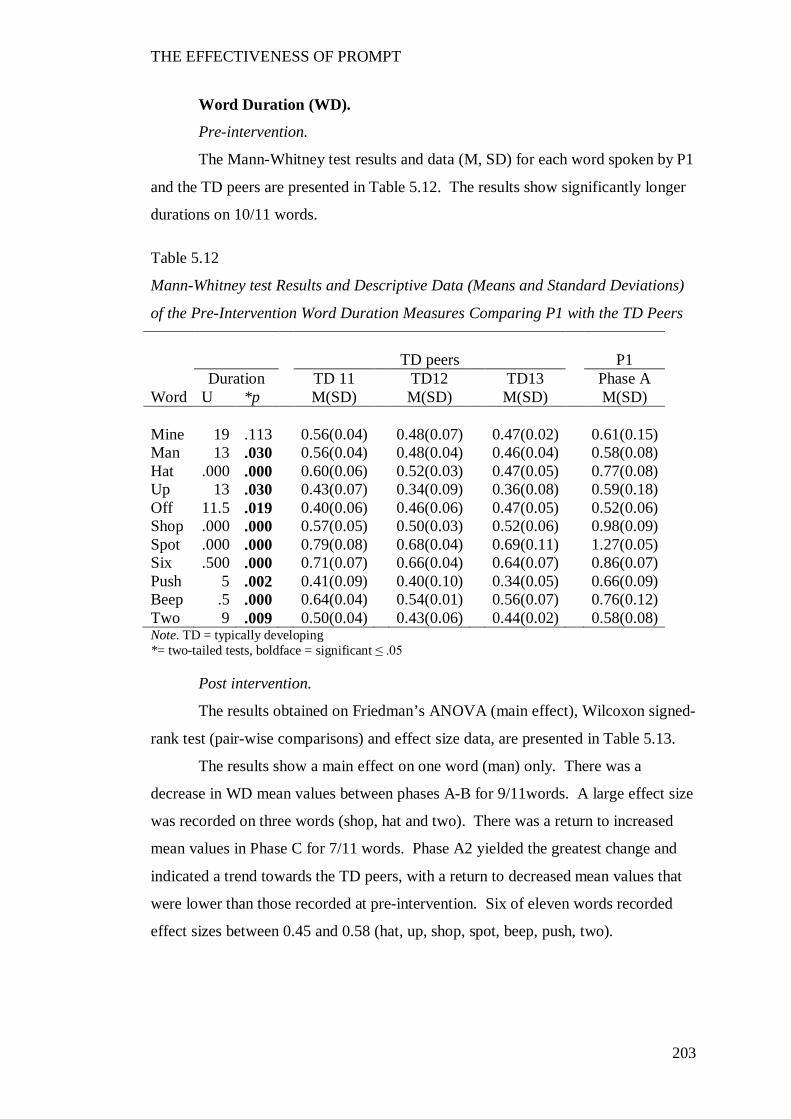
THE EFFECTIVENESS OF PROMPT
203
Word Duration (WD).
Pre-intervention.
The Mann-Whitney test results and data (M, SD) for each word spoken by P1
and the TD peers are presented in Table 5.12. The results show significantly longer
durations on 10/11 words.
Table 5.12
Mann-Whitney test Results and Descriptive Data (Means and Standard Deviations)
of the Pre-Intervention Word Duration Measures Comparing P1 with the TD Peers
TD peers P1
Duration TD 11 TD12 TD13 Phase A Word U *p M(SD) M(SD) M(SD) M(SD) Mine 19 .113 0.56(0.04) 0.48(0.07) 0.47(0.02) 0.61(0.15) Man 13 .030 0.56(0.04) 0.48(0.04) 0.46(0.04) 0.58(0.08) Hat .000 .000 0.60(0.06) 0.52(0.03) 0.47(0.05) 0.77(0.08) Up 13 .030 0.43(0.07) 0.34(0.09) 0.36(0.08) 0.59(0.18) Off 11.5 .019 0.40(0.06) 0.46(0.06) 0.47(0.05) 0.52(0.06) Shop .000 .000 0.57(0.05) 0.50(0.03) 0.52(0.06) 0.98(0.09) Spot .000 .000 0.79(0.08) 0.68(0.04) 0.69(0.11) 1.27(0.05) Six .500 .000 0.71(0.07) 0.66(0.04) 0.64(0.07) 0.86(0.07) Push 5 .002 0.41(0.09) 0.40(0.10) 0.34(0.05) 0.66(0.09) Beep .5 .000 0.64(0.04) 0.54(0.01) 0.56(0.07) 0.76(0.12) Two 9 .009 0.50(0.04) 0.43(0.06) 0.44(0.02) 0.58(0.08) Note. TD = typically developing *= two-tailed tests, boldface = significant ≤ .05
Post intervention.
The results obtained on Friedman’s ANOVA (main effect), Wilcoxon signed-
rank test (pair-wise comparisons) and effect size data, are presented in Table 5.13.
The results show a main effect on one word (man) only. There was a
decrease in WD mean values between phases A-B for 9/11words. A large effect size
was recorded on three words (shop, hat and two). There was a return to increased
mean values in Phase C for 7/11 words. Phase A2 yielded the greatest change and
indicated a trend towards the TD peers, with a return to decreased mean values that
were lower than those recorded at pre-intervention. Six of eleven words recorded
effect sizes between 0.45 and 0.58 (hat, up, shop, spot, beep, push, two).
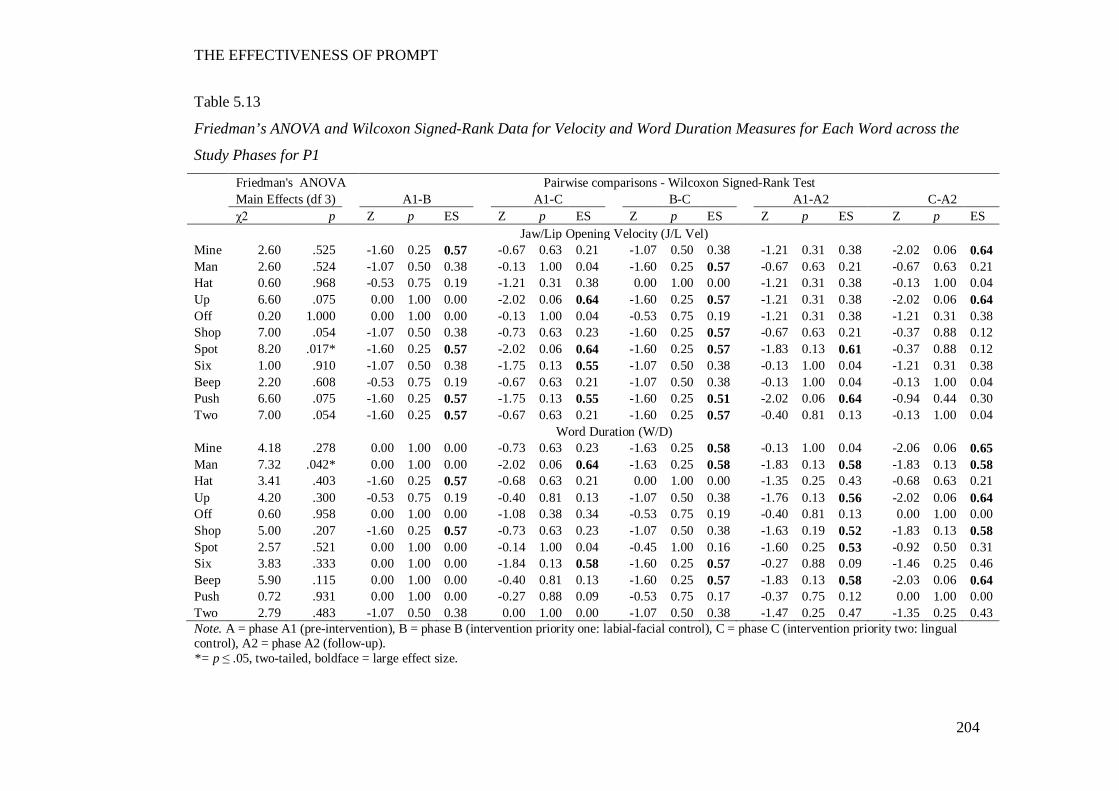
THE EFFECTIVENESS OF PROMPT
204
Table 5.13
Friedman’s ANOVA and Wilcoxon Signed-Rank Data for Velocity and Word Duration Measures for Each Word across the
Study Phases for P1
Friedman's ANOVA Pairwise comparisons - Wilcoxon Signed-Rank Test Main Effects (df 3) A1-B A1-C B-C A1-A2 C-A2 χ2 p Z p ES Z p ES Z p ES Z p ES Z p ES Jaw/Lip Opening Velocity (J/L Vel) Mine 2.60 .525 -1.60 0.25 0.57 -0.67 0.63 0.21 -1.07 0.50 0.38 -1.21 0.31 0.38 -2.02 0.06 0.64 Man 2.60 .524 -1.07 0.50 0.38 -0.13 1.00 0.04 -1.60 0.25 0.57 -0.67 0.63 0.21 -0.67 0.63 0.21 Hat 0.60 .968 -0.53 0.75 0.19 -1.21 0.31 0.38 0.00 1.00 0.00 -1.21 0.31 0.38 -0.13 1.00 0.04 Up 6.60 .075 0.00 1.00 0.00 -2.02 0.06 0.64 -1.60 0.25 0.57 -1.21 0.31 0.38 -2.02 0.06 0.64 Off 0.20 1.000 0.00 1.00 0.00 -0.13 1.00 0.04 -0.53 0.75 0.19 -1.21 0.31 0.38 -1.21 0.31 0.38 Shop 7.00 .054 -1.07 0.50 0.38 -0.73 0.63 0.23 -1.60 0.25 0.57 -0.67 0.63 0.21 -0.37 0.88 0.12 Spot 8.20 .017* -1.60 0.25 0.57 -2.02 0.06 0.64 -1.60 0.25 0.57 -1.83 0.13 0.61 -0.37 0.88 0.12 Six 1.00 .910 -1.07 0.50 0.38 -1.75 0.13 0.55 -1.07 0.50 0.38 -0.13 1.00 0.04 -1.21 0.31 0.38 Beep 2.20 .608 -0.53 0.75 0.19 -0.67 0.63 0.21 -1.07 0.50 0.38 -0.13 1.00 0.04 -0.13 1.00 0.04 Push 6.60 .075 -1.60 0.25 0.57 -1.75 0.13 0.55 -1.60 0.25 0.51 -2.02 0.06 0.64 -0.94 0.44 0.30 Two 7.00 .054 -1.60 0.25 0.57 -0.67 0.63 0.21 -1.60 0.25 0.57 -0.40 0.81 0.13 -0.13 1.00 0.04
Word Duration (W/D) Mine 4.18 .278 0.00 1.00 0.00 -0.73 0.63 0.23 -1.63 0.25 0.58 -0.13 1.00 0.04 -2.06 0.06 0.65 Man 7.32 .042* 0.00 1.00 0.00 -2.02 0.06 0.64 -1.63 0.25 0.58 -1.83 0.13 0.58 -1.83 0.13 0.58 Hat 3.41 .403 -1.60 0.25 0.57 -0.68 0.63 0.21 0.00 1.00 0.00 -1.35 0.25 0.43 -0.68 0.63 0.21 Up 4.20 .300 -0.53 0.75 0.19 -0.40 0.81 0.13 -1.07 0.50 0.38 -1.76 0.13 0.56 -2.02 0.06 0.64 Off 0.60 .958 0.00 1.00 0.00 -1.08 0.38 0.34 -0.53 0.75 0.19 -0.40 0.81 0.13 0.00 1.00 0.00 Shop 5.00 .207 -1.60 0.25 0.57 -0.73 0.63 0.23 -1.07 0.50 0.38 -1.63 0.19 0.52 -1.83 0.13 0.58 Spot 2.57 .521 0.00 1.00 0.00 -0.14 1.00 0.04 -0.45 1.00 0.16 -1.60 0.25 0.53 -0.92 0.50 0.31 Six 3.83 .333 0.00 1.00 0.00 -1.84 0.13 0.58 -1.60 0.25 0.57 -0.27 0.88 0.09 -1.46 0.25 0.46 Beep 5.90 .115 0.00 1.00 0.00 -0.40 0.81 0.13 -1.60 0.25 0.57 -1.83 0.13 0.58 -2.03 0.06 0.64 Push 0.72 .931 0.00 1.00 0.00 -0.27 0.88 0.09 -0.53 0.75 0.17 -0.37 0.75 0.12 0.00 1.00 0.00 Two 2.79 .483 -1.07 0.50 0.38 0.00 1.00 0.00 -1.07 0.50 0.38 -1.47 0.25 0.47 -1.35 0.25 0.43 Note. A = phase A1 (pre-intervention), B = phase B (intervention priority one: labial-facial control), C = phase C (intervention priority two: lingual control), A2 = phase A2 (follow-up). *= p ≤ .05, two-tailed, boldface = large effect size.
THE EFFECTIVENESS OF PROMPT
205
Overall summary of P1’s kinematic measures.
Subsequent to the PROMPT intervention, the following changes were evident
across the study phases:
Phase B – yielded a decrease in mean values across most measures, with a trend
towards the TD peers.
Phase C – was characterised by an increase in mean values, with some measures
(JLDM, JPD and LRR) exceeding the pre-intervention values, thus indicating a trend
away from the TD peers.
Phase A2 – a return in trend direction towards the TD peers was observed, with
words in each word-set recording values less than those recorded at pre-intervention.
The above results indicate P1’s intervention program was successful in
producing changes to the motor-speech movement patterns under investigation.
Participant 2
The following motor-speech movement patterns were targeted during the
PROMPT Intervention:
Phase B: (Intervention priority one: mandibular control) - Facilitate jaw grading
and distance between the jaw height positions of low vowels (i.e., JHPs 3 and 4).
Reduce anterior thrust of the jaw during production of low vowels.
Phase C: (Intervention priority two: labial-facial) – decrease jaw open distance
on high vowels (i.e., JHPs 1 and 2). Facilitate appropriate neutral, rounded and retracted
lip movements.
Table 5.14 summarises the words that recorded significant change in the jaw and
lip measures for P2 as compared with the TD peers pre-intervention and significant
changes post-intervention, for these words. Results are based on five repetitions for all
words.
The distance data (see Appendix J) at pre-intervention show decreased JOD on
the words containing low vowels, and increased JOD on words containing high vowels
in comparison with the TD peers. Lip retraction values also exceeded the TD peers.
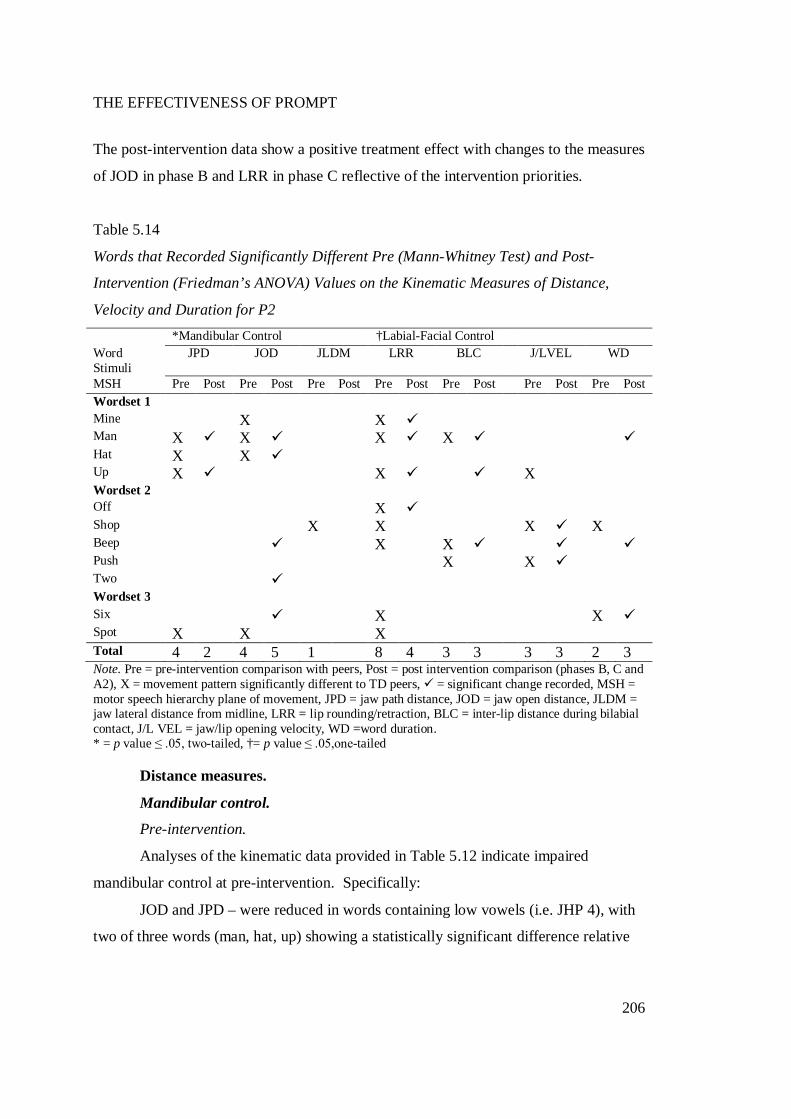
THE EFFECTIVENESS OF PROMPT
206
The post-intervention data show a positive treatment effect with changes to the measures
of JOD in phase B and LRR in phase C reflective of the intervention priorities.
Table 5.14
Words that Recorded Significantly Different Pre (Mann-Whitney Test) and Post-
Intervention (Friedman’s ANOVA) Values on the Kinematic Measures of Distance,
Velocity and Duration for P2 *Mandibular Control †Labial-Facial Control Word Stimuli
JPD JOD JLDM LRR BLC J/LVEL WD
MSH Pre Post Pre Post Pre Post Pre Post Pre Post Pre Post Pre Post Wordset 1 Mine X X Man X X X X Hat X X Up X X X Wordset 2 Off X Shop X X X X Beep X X Push X X Two Wordset 3 Six X X Spot X X X Total 4 2 4 5 1 8 4 3 3 3 3 2 3 Note. Pre = pre-intervention comparison with peers, Post = post intervention comparison (phases B, C and A2), X = movement pattern significantly different to TD peers, = significant change recorded, MSH = motor speech hierarchy plane of movement, JPD = jaw path distance, JOD = jaw open distance, JLDM = jaw lateral distance from midline, LRR = lip rounding/retraction, BLC = inter-lip distance during bilabial contact, J/L VEL = jaw/lip opening velocity, WD =word duration. * = p value ≤ .05, two-tailed, †= p value ≤ .05,one-tailed
Distance measures.
Mandibular control.
Pre-intervention.
Analyses of the kinematic data provided in Table 5.12 indicate impaired
mandibular control at pre-intervention. Specifically:
JOD and JPD – were reduced in words containing low vowels (i.e. JHP 4), with
two of three words (man, hat, up) showing a statistically significant difference relative
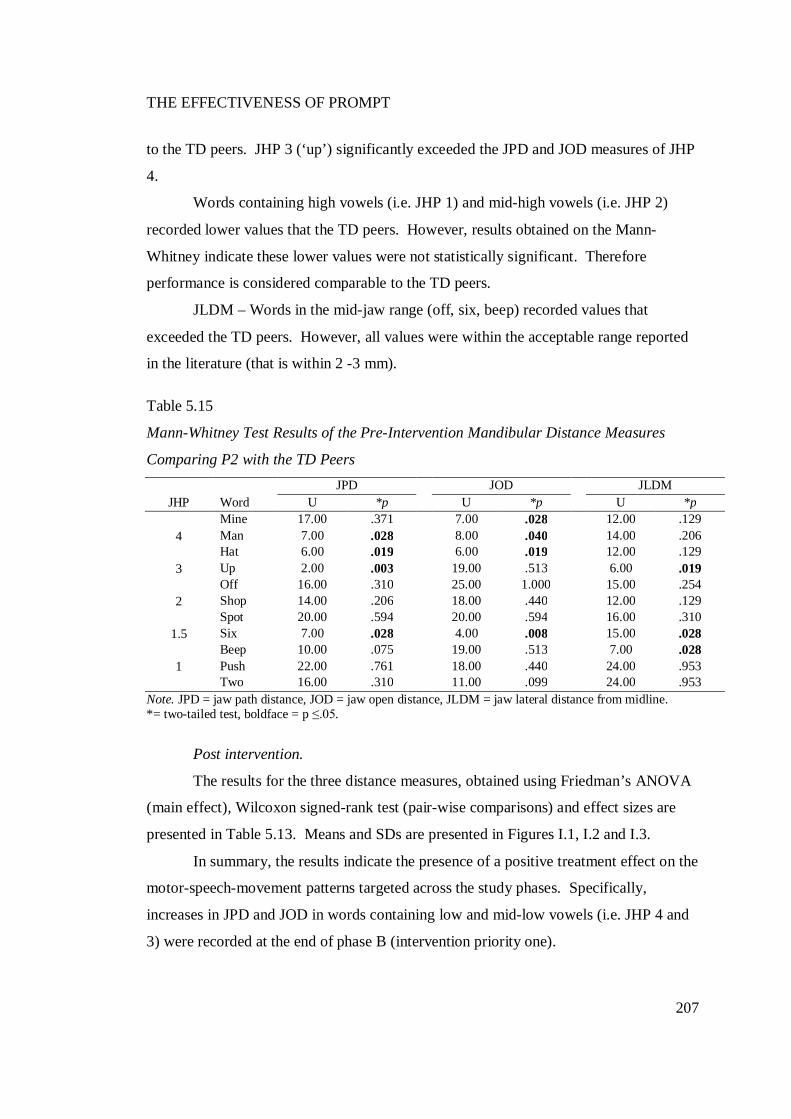
THE EFFECTIVENESS OF PROMPT
207
to the TD peers. JHP 3 (‘up’) significantly exceeded the JPD and JOD measures of JHP
4.
Words containing high vowels (i.e. JHP 1) and mid-high vowels (i.e. JHP 2)
recorded lower values that the TD peers. However, results obtained on the Mann-
Whitney indicate these lower values were not statistically significant. Therefore
performance is considered comparable to the TD peers.
JLDM – Words in the mid-jaw range (off, six, beep) recorded values that
exceeded the TD peers. However, all values were within the acceptable range reported
in the literature (that is within 2 -3 mm).
Table 5.15
Mann-Whitney Test Results of the Pre-Intervention Mandibular Distance Measures
Comparing P2 with the TD Peers JPD JOD JLDM
JHP Word U *p U *p U *p
4 Mine 17.00 .371 7.00 .028 12.00 .129 Man 7.00 .028 8.00 .040 14.00 .206 Hat 6.00 .019 6.00 .019 12.00 .129
3 Up 2.00 .003 19.00 .513 6.00 .019
2 Off 16.00 .310 25.00 1.000 15.00 .254 Shop 14.00 .206 18.00 .440 12.00 .129 Spot 20.00 .594 20.00 .594 16.00 .310
1.5 Six 7.00 .028 4.00 .008 15.00 .028
1 Beep 10.00 .075 19.00 .513 7.00 .028 Push 22.00 .761 18.00 .440 24.00 .953 Two 16.00 .310 11.00 .099 24.00 .953
Note. JPD = jaw path distance, JOD = jaw open distance, JLDM = jaw lateral distance from midline. *= two-tailed test, boldface = p ≤.05.
Post intervention.
The results for the three distance measures, obtained using Friedman’s ANOVA
(main effect), Wilcoxon signed-rank test (pair-wise comparisons) and effect sizes are
presented in Table 5.13. Means and SDs are presented in Figures I.1, I.2 and I.3.
In summary, the results indicate the presence of a positive treatment effect on the
motor-speech-movement patterns targeted across the study phases. Specifically,
increases in JPD and JOD in words containing low and mid-low vowels (i.e. JHP 4 and
3) were recorded at the end of phase B (intervention priority one).
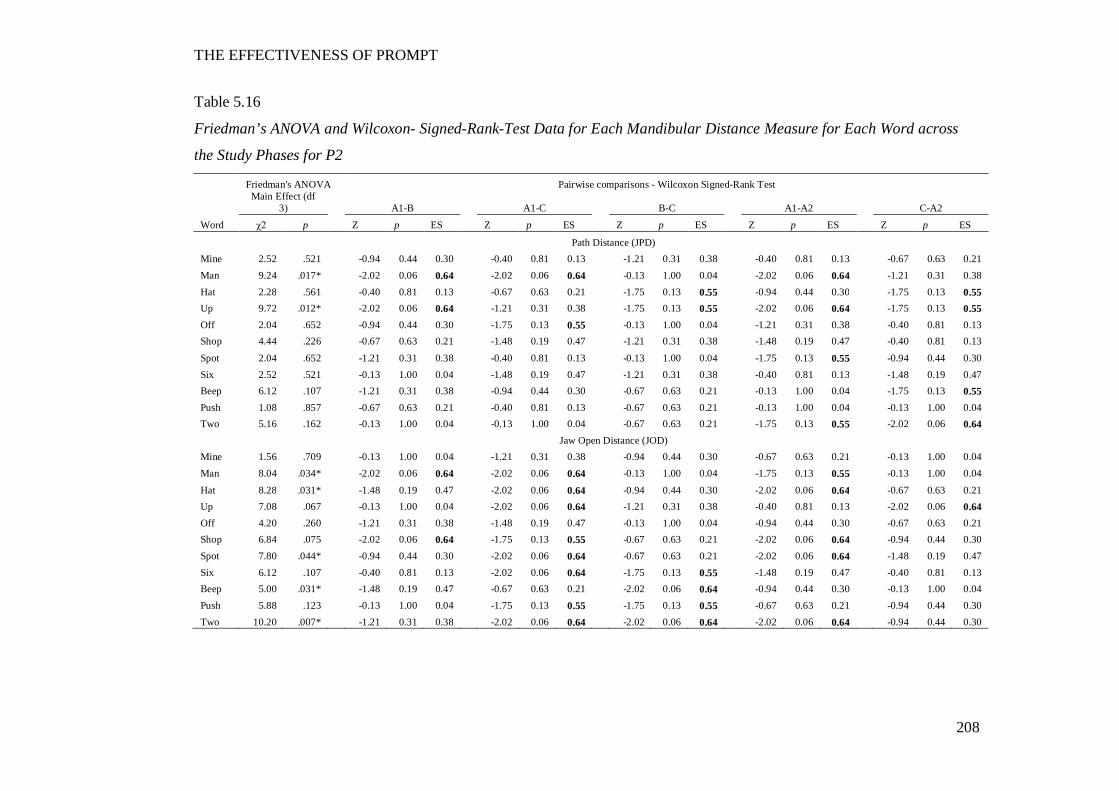
THE EFFECTIVENESS OF PROMPT
208
Table 5.16
Friedman’s ANOVA and Wilcoxon- Signed-Rank-Test Data for Each Mandibular Distance Measure for Each Word across
the Study Phases for P2
Friedman's ANOVA Pairwise comparisons - Wilcoxon Signed-Rank Test
Main Effect (df
3) A1-B A1-C B-C A1-A2 C-A2
Word χ2 p Z p ES Z p ES Z p ES Z p ES Z p ES
Path Distance (JPD) Mine 2.52 .521 -0.94 0.44 0.30 -0.40 0.81 0.13 -1.21 0.31 0.38 -0.40 0.81 0.13 -0.67 0.63 0.21 Man 9.24 .017* -2.02 0.06 0.64 -2.02 0.06 0.64 -0.13 1.00 0.04 -2.02 0.06 0.64 -1.21 0.31 0.38 Hat 2.28 .561 -0.40 0.81 0.13 -0.67 0.63 0.21 -1.75 0.13 0.55 -0.94 0.44 0.30 -1.75 0.13 0.55 Up 9.72 .012* -2.02 0.06 0.64 -1.21 0.31 0.38 -1.75 0.13 0.55 -2.02 0.06 0.64 -1.75 0.13 0.55 Off 2.04 .652 -0.94 0.44 0.30 -1.75 0.13 0.55 -0.13 1.00 0.04 -1.21 0.31 0.38 -0.40 0.81 0.13 Shop 4.44 .226 -0.67 0.63 0.21 -1.48 0.19 0.47 -1.21 0.31 0.38 -1.48 0.19 0.47 -0.40 0.81 0.13
Spot 2.04 .652 -1.21 0.31 0.38 -0.40 0.81 0.13 -0.13 1.00 0.04 -1.75 0.13 0.55 -0.94 0.44 0.30 Six 2.52 .521 -0.13 1.00 0.04 -1.48 0.19 0.47 -1.21 0.31 0.38 -0.40 0.81 0.13 -1.48 0.19 0.47 Beep 6.12 .107 -1.21 0.31 0.38 -0.94 0.44 0.30 -0.67 0.63 0.21 -0.13 1.00 0.04 -1.75 0.13 0.55 Push 1.08 .857 -0.67 0.63 0.21 -0.40 0.81 0.13 -0.67 0.63 0.21 -0.13 1.00 0.04 -0.13 1.00 0.04 Two 5.16 .162 -0.13 1.00 0.04 -0.13 1.00 0.04 -0.67 0.63 0.21 -1.75 0.13 0.55 -2.02 0.06 0.64 Jaw Open Distance (JOD) Mine 1.56 .709 -0.13 1.00 0.04 -1.21 0.31 0.38 -0.94 0.44 0.30 -0.67 0.63 0.21 -0.13 1.00 0.04 Man 8.04 .034* -2.02 0.06 0.64 -2.02 0.06 0.64 -0.13 1.00 0.04 -1.75 0.13 0.55 -0.13 1.00 0.04
Hat 8.28 .031* -1.48 0.19 0.47 -2.02 0.06 0.64 -0.94 0.44 0.30 -2.02 0.06 0.64 -0.67 0.63 0.21 Up 7.08 .067 -0.13 1.00 0.04 -2.02 0.06 0.64 -1.21 0.31 0.38 -0.40 0.81 0.13 -2.02 0.06 0.64 Off 4.20 .260 -1.21 0.31 0.38 -1.48 0.19 0.47 -0.13 1.00 0.04 -0.94 0.44 0.30 -0.67 0.63 0.21 Shop 6.84 .075 -2.02 0.06 0.64 -1.75 0.13 0.55 -0.67 0.63 0.21 -2.02 0.06 0.64 -0.94 0.44 0.30 Spot 7.80 .044* -0.94 0.44 0.30 -2.02 0.06 0.64 -0.67 0.63 0.21 -2.02 0.06 0.64 -1.48 0.19 0.47 Six 6.12 .107 -0.40 0.81 0.13 -2.02 0.06 0.64 -1.75 0.13 0.55 -1.48 0.19 0.47 -0.40 0.81 0.13 Beep 5.00 .031* -1.48 0.19 0.47 -0.67 0.63 0.21 -2.02 0.06 0.64 -0.94 0.44 0.30 -0.13 1.00 0.04 Push 5.88 .123 -0.13 1.00 0.04 -1.75 0.13 0.55 -1.75 0.13 0.55 -0.67 0.63 0.21 -0.94 0.44 0.30 Two 10.20 .007* -1.21 0.31 0.38 -2.02 0.06 0.64 -2.02 0.06 0.64 -2.02 0.06 0.64 -0.94 0.44 0.30
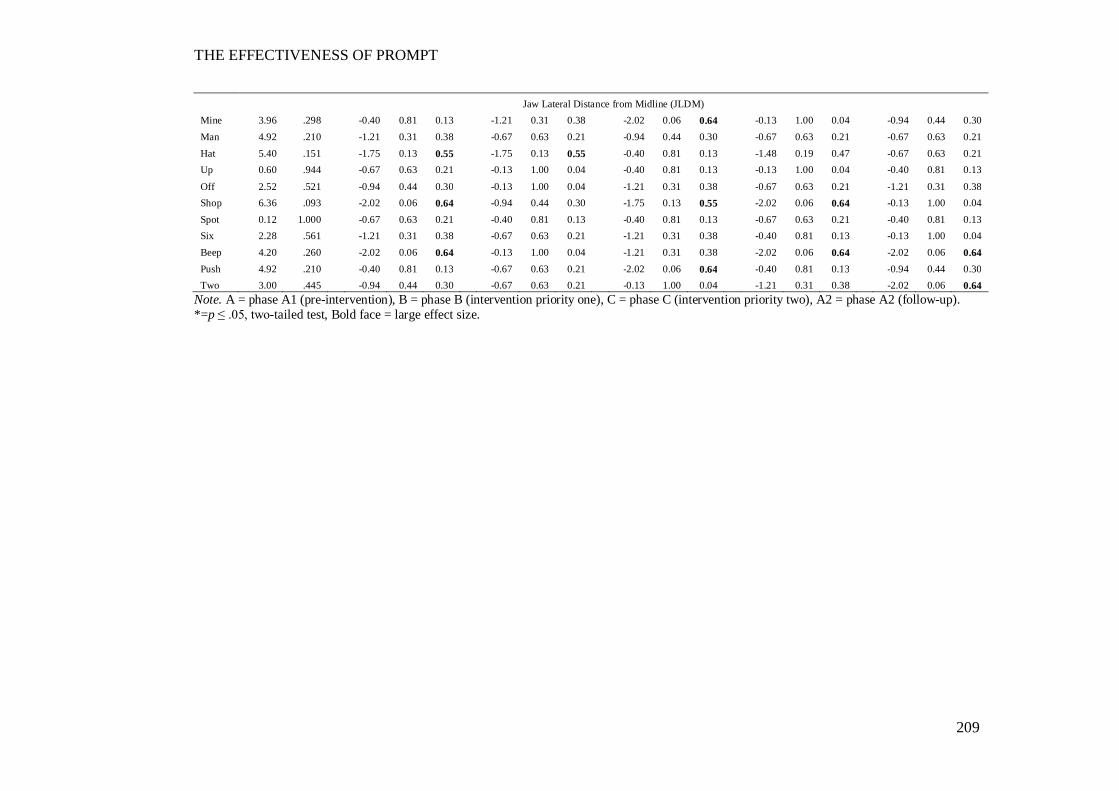
THE EFFECTIVENESS OF PROMPT
209
Jaw Lateral Distance from Midline (JLDM) Mine 3.96 .298 -0.40 0.81 0.13 -1.21 0.31 0.38 -2.02 0.06 0.64 -0.13 1.00 0.04 -0.94 0.44 0.30 Man 4.92 .210 -1.21 0.31 0.38 -0.67 0.63 0.21 -0.94 0.44 0.30 -0.67 0.63 0.21 -0.67 0.63 0.21 Hat 5.40 .151 -1.75 0.13 0.55 -1.75 0.13 0.55 -0.40 0.81 0.13 -1.48 0.19 0.47 -0.67 0.63 0.21 Up 0.60 .944 -0.67 0.63 0.21 -0.13 1.00 0.04 -0.40 0.81 0.13 -0.13 1.00 0.04 -0.40 0.81 0.13
Off 2.52 .521 -0.94 0.44 0.30 -0.13 1.00 0.04 -1.21 0.31 0.38 -0.67 0.63 0.21 -1.21 0.31 0.38 Shop 6.36 .093 -2.02 0.06 0.64 -0.94 0.44 0.30 -1.75 0.13 0.55 -2.02 0.06 0.64 -0.13 1.00 0.04 Spot 0.12 1.000 -0.67 0.63 0.21 -0.40 0.81 0.13 -0.40 0.81 0.13 -0.67 0.63 0.21 -0.40 0.81 0.13 Six 2.28 .561 -1.21 0.31 0.38 -0.67 0.63 0.21 -1.21 0.31 0.38 -0.40 0.81 0.13 -0.13 1.00 0.04 Beep 4.20 .260 -2.02 0.06 0.64 -0.13 1.00 0.04 -1.21 0.31 0.38 -2.02 0.06 0.64 -2.02 0.06 0.64 Push 4.92 .210 -0.40 0.81 0.13 -0.67 0.63 0.21 -2.02 0.06 0.64 -0.40 0.81 0.13 -0.94 0.44 0.30 Two 3.00 .445 -0.94 0.44 0.30 -0.67 0.63 0.21 -0.13 1.00 0.04 -1.21 0.31 0.38 -2.02 0.06 0.64
Note. A = phase A1 (pre-intervention), B = phase B (intervention priority one), C = phase C (intervention priority two), A2 = phase A2 (follow-up). *=p ≤ .05, two-tailed test, Bold face = large effect size.
THE EFFECTIVENESS OF PROMPT
210
Jaw Path Distance (JPD).
The results obtained using Friedman’s ANOVA indicate a positive treatment
effect subsequent to intervention. A main effect was recorded on 2/3 words – ‘man’
at JHP 4 and ‘up’ at JHP 3.
Pair-wise comparisons indicate treatment phase B yielded the most
significant change with evidence of maintenance at follow-up (phases A-A2).
Jaw Open Distance (JOD).
The results obtained using Friedman’s ANOVA indicate a positive main
effect on the 2 words at JHP 4 that differed significantly from the TD peers at pre-
intervention. The pair-wise comparisons indicate the treatment effect occurred in
phase A1-B. Increasing values continued in phase C, with evidence of maintenance
at follow-up (phase A2).
In addition, a significant increase in JOD was also recorded on the words
‘spot’ (JHP2) ‘beep’ and ‘two’ (JHP1). Pair-wise comparisons indicate these
changes were recorded in phase C.
Jaw Lateral Distance from Midline (JLDM).
The results obtained using Friedman’s ANOVA did not indicate the presence
of a main effect on any word. Thus, JLDM remained comparable with the TD peers.
Labial-facial control.
Pre-intervention.
Analyses of the kinematic data provided in Table 5.17 indicate impaired
labial-facial control at pre-intervention. Specifically:
LRR – Eight of 11 words recorded values that exceeded those of the TD
peers. Excessive retraction was recorded on all words (except ‘hat’) at JHPs 4, 3 and
2. The two words containing rounded vowels at JHP 1 (‘push’ and ‘two’) were
comparable to the TD peers.
BLC – A statistically significant difference in inter-lip distance was recorded
on three of the four words containing the bilabial in the word initial position.
Positive values were recorded in both the UL and LL position for all words, except
‘beep’, at pre-intervention. This indicates that, at the point of minimum bilabial lip
contact, the UL and LL were positioned superiorly to the rest position.
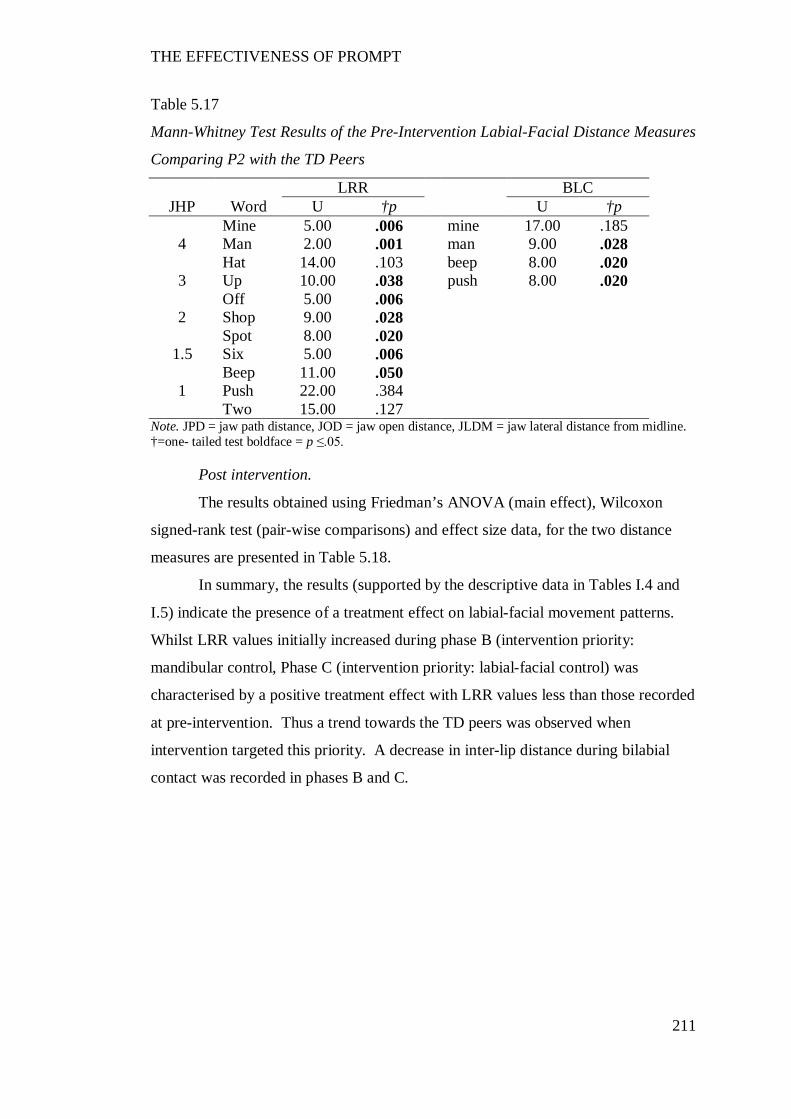
THE EFFECTIVENESS OF PROMPT
211
Table 5.17
Mann-Whitney Test Results of the Pre-Intervention Labial-Facial Distance Measures
Comparing P2 with the TD Peers
LRR BLC JHP Word U †p U †p
4 Mine 5.00 .006 mine 17.00 .185 Man 2.00 .001 man 9.00 .028 Hat 14.00 .103 beep 8.00 .020
3 Up 10.00 .038 push 8.00 .020
2 Off 5.00 .006 Shop 9.00 .028 Spot 8.00 .020
1.5 Six 5.00 .006
1 Beep 11.00 .050 Push 22.00 .384 Two 15.00 .127
Note. JPD = jaw path distance, JOD = jaw open distance, JLDM = jaw lateral distance from midline. †=one- tailed test boldface = p ≤.05.
Post intervention.
The results obtained using Friedman’s ANOVA (main effect), Wilcoxon
signed-rank test (pair-wise comparisons) and effect size data, for the two distance
measures are presented in Table 5.18.
In summary, the results (supported by the descriptive data in Tables I.4 and
I.5) indicate the presence of a treatment effect on labial-facial movement patterns.
Whilst LRR values initially increased during phase B (intervention priority:
mandibular control, Phase C (intervention priority: labial-facial control) was
characterised by a positive treatment effect with LRR values less than those recorded
at pre-intervention. Thus a trend towards the TD peers was observed when
intervention targeted this priority. A decrease in inter-lip distance during bilabial
contact was recorded in phases B and C.
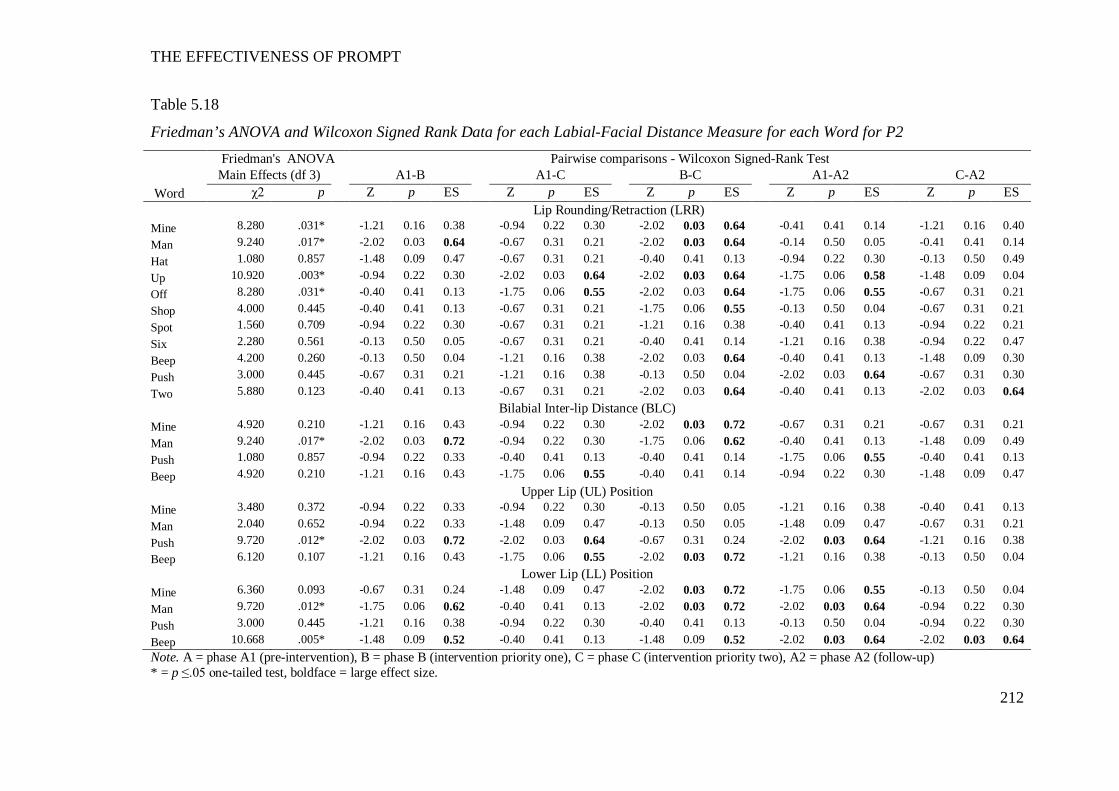
THE EFFECTIVENESS OF PROMPT
212
Table 5.18
Friedman’s ANOVA and Wilcoxon Signed Rank Data for each Labial-Facial Distance Measure for each Word for P2
Friedman's ANOVA Pairwise comparisons - Wilcoxon Signed-Rank Test Main Effects (df 3) A1-B A1-C B-C A1-A2 C-A2 Word χ2 p Z p ES Z p ES Z p ES Z p ES Z p ES Lip Rounding/Retraction (LRR) Mine 8.280 .031* -1.21 0.16 0.38 -0.94 0.22 0.30 -2.02 0.03 0.64 -0.41 0.41 0.14 -1.21 0.16 0.40 Man 9.240 .017* -2.02 0.03 0.64 -0.67 0.31 0.21 -2.02 0.03 0.64 -0.14 0.50 0.05 -0.41 0.41 0.14 Hat 1.080 0.857 -1.48 0.09 0.47 -0.67 0.31 0.21 -0.40 0.41 0.13 -0.94 0.22 0.30 -0.13 0.50 0.49 Up 10.920 .003* -0.94 0.22 0.30 -2.02 0.03 0.64 -2.02 0.03 0.64 -1.75 0.06 0.58 -1.48 0.09 0.04 Off 8.280 .031* -0.40 0.41 0.13 -1.75 0.06 0.55 -2.02 0.03 0.64 -1.75 0.06 0.55 -0.67 0.31 0.21 Shop 4.000 0.445 -0.40 0.41 0.13 -0.67 0.31 0.21 -1.75 0.06 0.55 -0.13 0.50 0.04 -0.67 0.31 0.21 Spot 1.560 0.709 -0.94 0.22 0.30 -0.67 0.31 0.21 -1.21 0.16 0.38 -0.40 0.41 0.13 -0.94 0.22 0.21 Six 2.280 0.561 -0.13 0.50 0.05 -0.67 0.31 0.21 -0.40 0.41 0.14 -1.21 0.16 0.38 -0.94 0.22 0.47 Beep 4.200 0.260 -0.13 0.50 0.04 -1.21 0.16 0.38 -2.02 0.03 0.64 -0.40 0.41 0.13 -1.48 0.09 0.30 Push 3.000 0.445 -0.67 0.31 0.21 -1.21 0.16 0.38 -0.13 0.50 0.04 -2.02 0.03 0.64 -0.67 0.31 0.30 Two 5.880 0.123 -0.40 0.41 0.13 -0.67 0.31 0.21 -2.02 0.03 0.64 -0.40 0.41 0.13 -2.02 0.03 0.64
Bilabial Inter-lip Distance (BLC) Mine 4.920 0.210 -1.21 0.16 0.43 -0.94 0.22 0.30 -2.02 0.03 0.72 -0.67 0.31 0.21 -0.67 0.31 0.21 Man 9.240 .017* -2.02 0.03 0.72 -0.94 0.22 0.30 -1.75 0.06 0.62 -0.40 0.41 0.13 -1.48 0.09 0.49 Push 1.080 0.857 -0.94 0.22 0.33 -0.40 0.41 0.13 -0.40 0.41 0.14 -1.75 0.06 0.55 -0.40 0.41 0.13 Beep 4.920 0.210 -1.21 0.16 0.43 -1.75 0.06 0.55 -0.40 0.41 0.14 -0.94 0.22 0.30 -1.48 0.09 0.47
Upper Lip (UL) Position Mine 3.480 0.372 -0.94 0.22 0.33 -0.94 0.22 0.30 -0.13 0.50 0.05 -1.21 0.16 0.38 -0.40 0.41 0.13 Man 2.040 0.652 -0.94 0.22 0.33 -1.48 0.09 0.47 -0.13 0.50 0.05 -1.48 0.09 0.47 -0.67 0.31 0.21 Push 9.720 .012* -2.02 0.03 0.72 -2.02 0.03 0.64 -0.67 0.31 0.24 -2.02 0.03 0.64 -1.21 0.16 0.38 Beep 6.120 0.107 -1.21 0.16 0.43 -1.75 0.06 0.55 -2.02 0.03 0.72 -1.21 0.16 0.38 -0.13 0.50 0.04
Lower Lip (LL) Position Mine 6.360 0.093 -0.67 0.31 0.24 -1.48 0.09 0.47 -2.02 0.03 0.72 -1.75 0.06 0.55 -0.13 0.50 0.04 Man 9.720 .012* -1.75 0.06 0.62 -0.40 0.41 0.13 -2.02 0.03 0.72 -2.02 0.03 0.64 -0.94 0.22 0.30 Push 3.000 0.445 -1.21 0.16 0.38 -0.94 0.22 0.30 -0.40 0.41 0.13 -0.13 0.50 0.04 -0.94 0.22 0.30 Beep 10.668 .005* -1.48 0.09 0.52 -0.40 0.41 0.13 -1.48 0.09 0.52 -2.02 0.03 0.64 -2.02 0.03 0.64 Note. A = phase A1 (pre-intervention), B = phase B (intervention priority one), C = phase C (intervention priority two), A2 = phase A2 (follow-up) * = p ≤.05 one-tailed test, boldface = large effect size.
THE EFFECTIVENESS OF PROMPT
213
Lip Rounding/Retraction (LRR).
The results obtained using Friedman’s ANOVA indicate a main effect on
four of the eight words - ‘mine’ and ‘man’ (JHP4), ‘up’ (JHP3) and ‘off’ (JHP2).
The pair-wise comparisons indicate phase B-C yielded the most significant
change. This is associated with an increase in LRR values during phase B
(intervention priority: mandibular control). Phase C (intervention priority: labial
facial control) was characterized by a return to a decrease in LRR values, with 8
words yielding values lower than recorded at phase A1 (pre-intervention phase A1).
Treatment effects were maintained on four words at follow-up (phase A2).
Inter-lip distance during Bilabial Contact (BLC).
Whilst the results obtained using Friedman’s ANOVA indicate a significant
main treatment effect on the word ‘man’ only, the pair-wise comparisons indicate
three words (mine, man, push) recorded a positive treatment effect during phase C.
Plots of the average vertical positions of the UL and LL markers at the point
of bilabial contact, for each of the four words, are shown in Figure 5.2. The LL is
plotted on the X-axis and the UL is plotted on the y-axis. A negative value reflects a
downward position, whilst a positive value reflects an upward position, from rest.
UL and LL data show the presence of negative values in the UL and LL in all
words during phases C and A2. This indicates movement, inferior to rest, in both
lips during minimum bilabial lip contact.
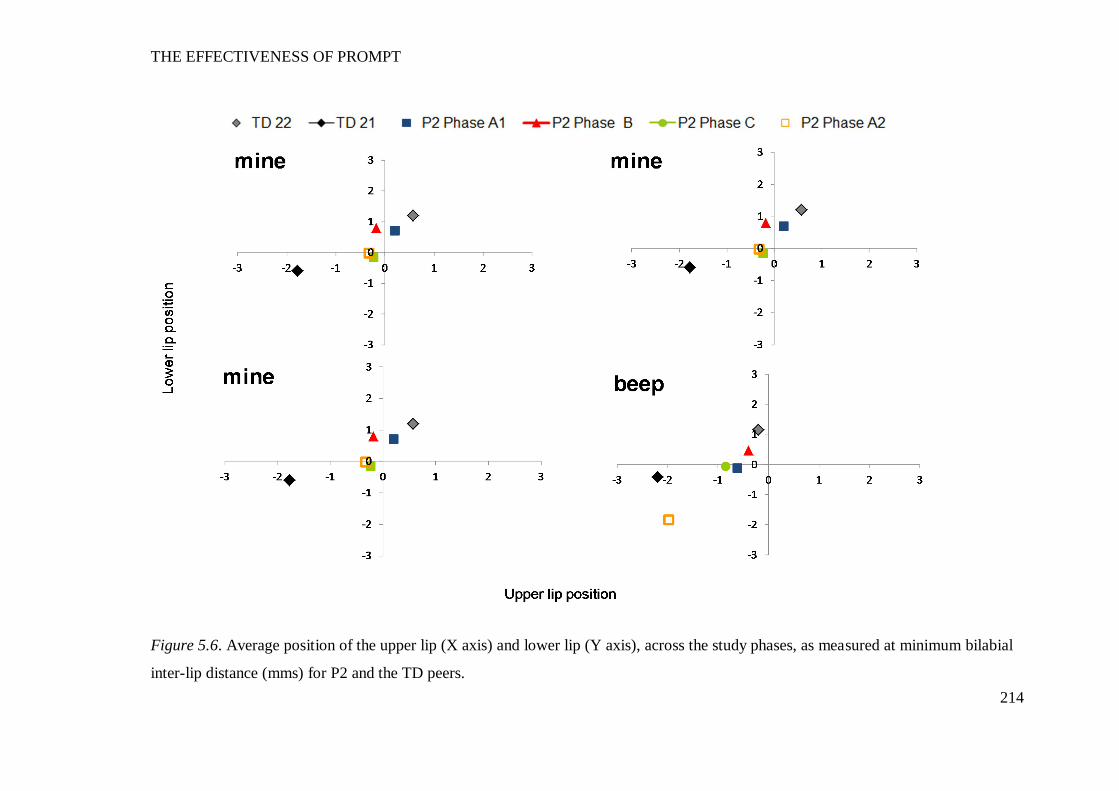
THE EFFECTIVENESS OF PROMPT
214
Figure 5.6. Average position of the upper lip (X axis) and lower lip (Y axis), across the study phases, as measured at minimum bilabial
inter-lip distance (mms) for P2 and the TD peers.
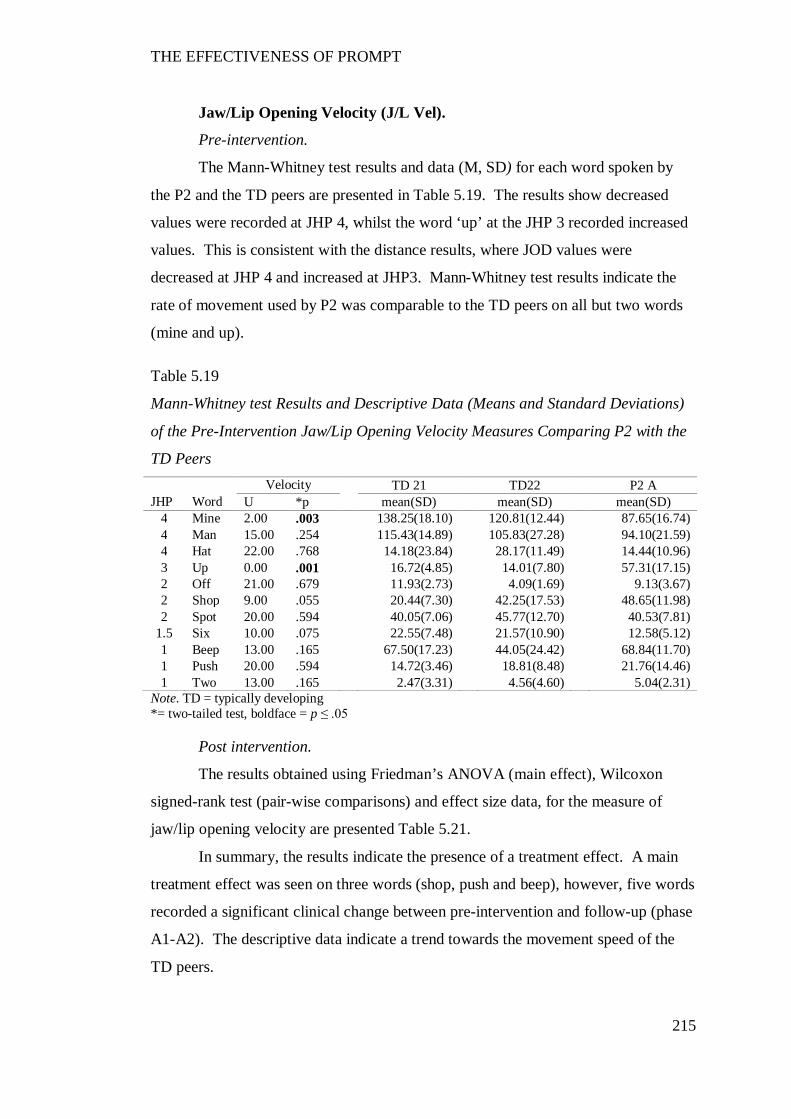
THE EFFECTIVENESS OF PROMPT
215
Jaw/Lip Opening Velocity (J/L Vel).
Pre-intervention.
The Mann-Whitney test results and data (M, SD) for each word spoken by
the P2 and the TD peers are presented in Table 5.19. The results show decreased
values were recorded at JHP 4, whilst the word ‘up’ at the JHP 3 recorded increased
values. This is consistent with the distance results, where JOD values were
decreased at JHP 4 and increased at JHP3. Mann-Whitney test results indicate the
rate of movement used by P2 was comparable to the TD peers on all but two words
(mine and up).
Table 5.19
Mann-Whitney test Results and Descriptive Data (Means and Standard Deviations)
of the Pre-Intervention Jaw/Lip Opening Velocity Measures Comparing P2 with the
TD Peers Velocity TD 21 TD22 P2 A
JHP Word U *p mean(SD) mean(SD) mean(SD) 4 Mine 2.00 .003 138.25(18.10) 120.81(12.44) 87.65(16.74) 4 Man 15.00 .254 115.43(14.89) 105.83(27.28) 94.10(21.59) 4 Hat 22.00 .768 14.18(23.84) 28.17(11.49) 14.44(10.96) 3 Up 0.00 .001 16.72(4.85) 14.01(7.80) 57.31(17.15) 2 Off 21.00 .679 11.93(2.73) 4.09(1.69) 9.13(3.67) 2 Shop 9.00 .055 20.44(7.30) 42.25(17.53) 48.65(11.98) 2 Spot 20.00 .594 40.05(7.06) 45.77(12.70) 40.53(7.81)
1.5 Six 10.00 .075 22.55(7.48) 21.57(10.90) 12.58(5.12) 1 Beep 13.00 .165 67.50(17.23) 44.05(24.42) 68.84(11.70) 1 Push 20.00 .594 14.72(3.46) 18.81(8.48) 21.76(14.46) 1 Two 13.00 .165 2.47(3.31) 4.56(4.60) 5.04(2.31)
Note. TD = typically developing *= two-tailed test, boldface = p ≤ .05
Post intervention.
The results obtained using Friedman’s ANOVA (main effect), Wilcoxon
signed-rank test (pair-wise comparisons) and effect size data, for the measure of
jaw/lip opening velocity are presented Table 5.21.
In summary, the results indicate the presence of a treatment effect. A main
treatment effect was seen on three words (shop, push and beep), however, five words
recorded a significant clinical change between pre-intervention and follow-up (phase
A1-A2). The descriptive data indicate a trend towards the movement speed of the
TD peers.
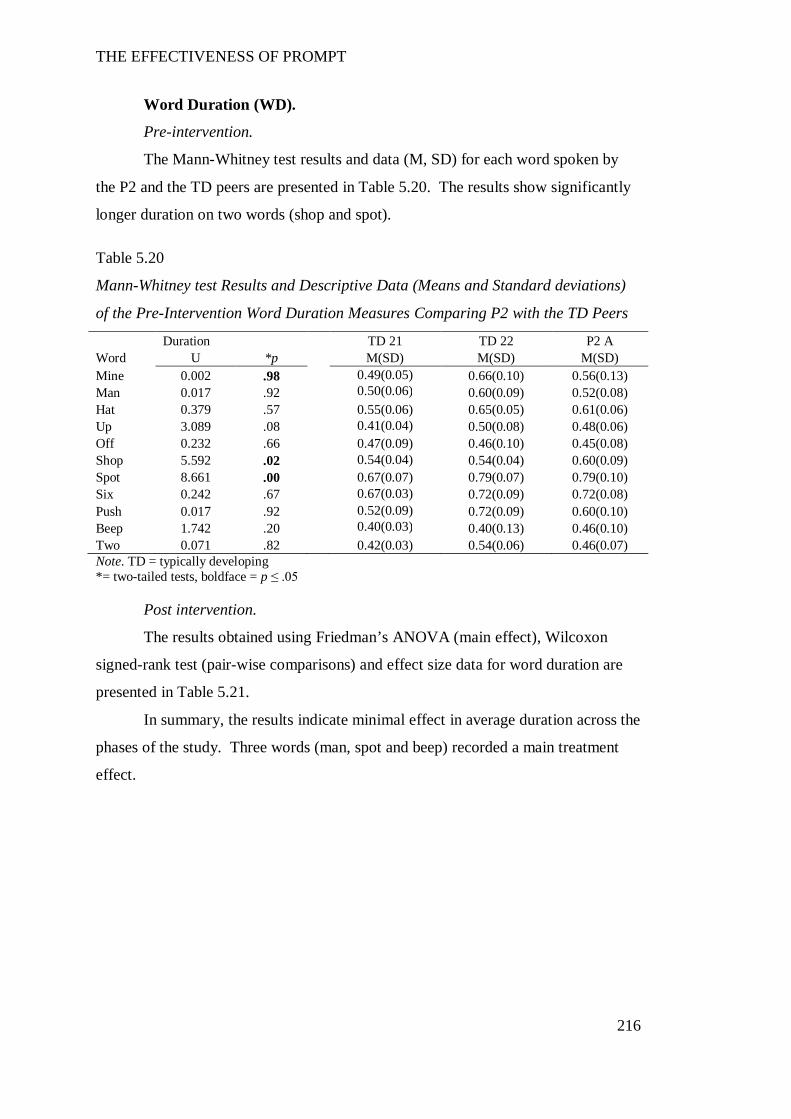
THE EFFECTIVENESS OF PROMPT
216
Word Duration (WD).
Pre-intervention.
The Mann-Whitney test results and data (M, SD) for each word spoken by
the P2 and the TD peers are presented in Table 5.20. The results show significantly
longer duration on two words (shop and spot).
Table 5.20
Mann-Whitney test Results and Descriptive Data (Means and Standard deviations)
of the Pre-Intervention Word Duration Measures Comparing P2 with the TD Peers
Duration TD 21 TD 22 P2 A Word U *p M(SD) M(SD) M(SD) Mine 0.002 .98 0.49(0.05) 0.66(0.10) 0.56(0.13) Man 0.017 .92 0.50(0.06) 0.60(0.09) 0.52(0.08) Hat 0.379 .57 0.55(0.06) 0.65(0.05) 0.61(0.06) Up 3.089 .08 0.41(0.04) 0.50(0.08) 0.48(0.06) Off 0.232 .66 0.47(0.09) 0.46(0.10) 0.45(0.08) Shop 5.592 .02 0.54(0.04) 0.54(0.04) 0.60(0.09) Spot 8.661 .00 0.67(0.07) 0.79(0.07) 0.79(0.10) Six 0.242 .67 0.67(0.03) 0.72(0.09) 0.72(0.08) Push 0.017 .92 0.52(0.09) 0.72(0.09) 0.60(0.10) Beep 1.742 .20 0.40(0.03) 0.40(0.13) 0.46(0.10) Two 0.071 .82 0.42(0.03) 0.54(0.06) 0.46(0.07) Note. TD = typically developing *= two-tailed tests, boldface = p ≤ .05
Post intervention.
The results obtained using Friedman’s ANOVA (main effect), Wilcoxon
signed-rank test (pair-wise comparisons) and effect size data for word duration are
presented in Table 5.21.
In summary, the results indicate minimal effect in average duration across the
phases of the study. Three words (man, spot and beep) recorded a main treatment
effect.
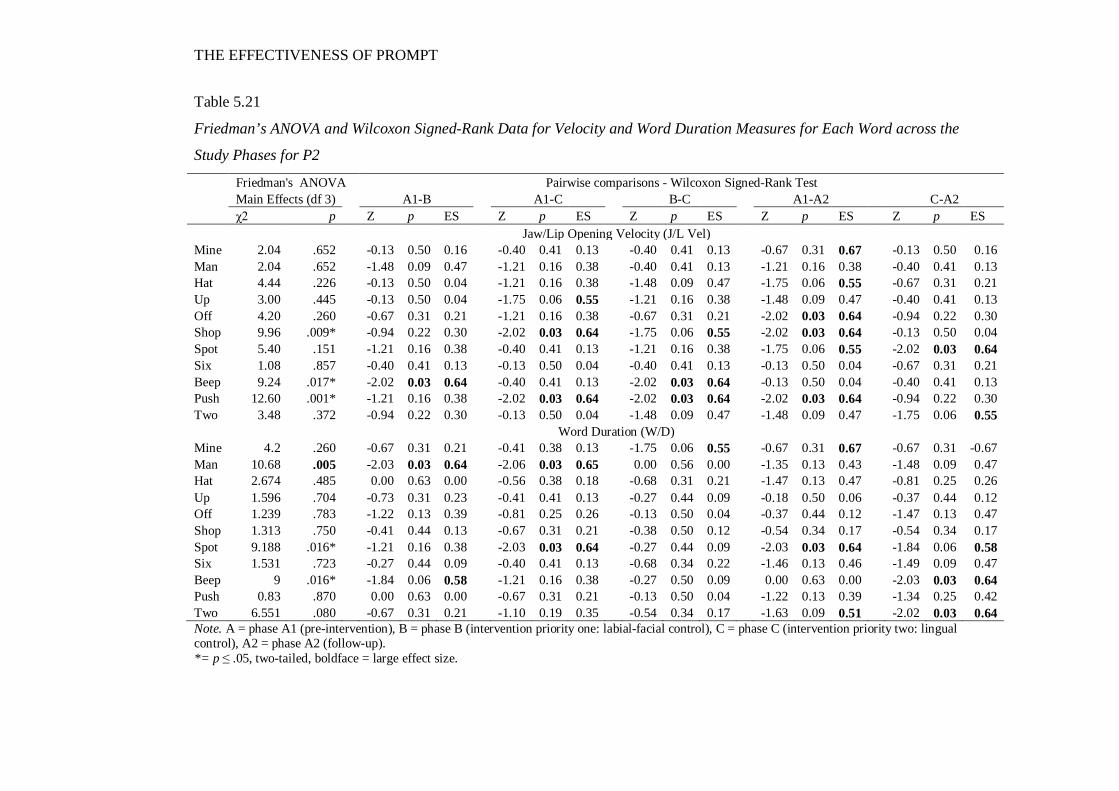
THE EFFECTIVENESS OF PROMPT
Table 5.21
Friedman’s ANOVA and Wilcoxon Signed-Rank Data for Velocity and Word Duration Measures for Each Word across the
Study Phases for P2
Friedman's ANOVA Pairwise comparisons - Wilcoxon Signed-Rank Test Main Effects (df 3) A1-B A1-C B-C A1-A2 C-A2 χ2 p Z p ES Z p ES Z p ES Z p ES Z p ES Jaw/Lip Opening Velocity (J/L Vel) Mine 2.04 .652 -0.13 0.50 0.16 -0.40 0.41 0.13 -0.40 0.41 0.13 -0.67 0.31 0.67 -0.13 0.50 0.16 Man 2.04 .652 -1.48 0.09 0.47 -1.21 0.16 0.38 -0.40 0.41 0.13 -1.21 0.16 0.38 -0.40 0.41 0.13 Hat 4.44 .226 -0.13 0.50 0.04 -1.21 0.16 0.38 -1.48 0.09 0.47 -1.75 0.06 0.55 -0.67 0.31 0.21 Up 3.00 .445 -0.13 0.50 0.04 -1.75 0.06 0.55 -1.21 0.16 0.38 -1.48 0.09 0.47 -0.40 0.41 0.13 Off 4.20 .260 -0.67 0.31 0.21 -1.21 0.16 0.38 -0.67 0.31 0.21 -2.02 0.03 0.64 -0.94 0.22 0.30 Shop 9.96 .009* -0.94 0.22 0.30 -2.02 0.03 0.64 -1.75 0.06 0.55 -2.02 0.03 0.64 -0.13 0.50 0.04 Spot 5.40 .151 -1.21 0.16 0.38 -0.40 0.41 0.13 -1.21 0.16 0.38 -1.75 0.06 0.55 -2.02 0.03 0.64 Six 1.08 .857 -0.40 0.41 0.13 -0.13 0.50 0.04 -0.40 0.41 0.13 -0.13 0.50 0.04 -0.67 0.31 0.21 Beep 9.24 .017* -2.02 0.03 0.64 -0.40 0.41 0.13 -2.02 0.03 0.64 -0.13 0.50 0.04 -0.40 0.41 0.13 Push 12.60 .001* -1.21 0.16 0.38 -2.02 0.03 0.64 -2.02 0.03 0.64 -2.02 0.03 0.64 -0.94 0.22 0.30 Two 3.48 .372 -0.94 0.22 0.30 -0.13 0.50 0.04 -1.48 0.09 0.47 -1.48 0.09 0.47 -1.75 0.06 0.55
Word Duration (W/D) Mine 4.2 .260 -0.67 0.31 0.21 -0.41 0.38 0.13 -1.75 0.06 0.55 -0.67 0.31 0.67 -0.67 0.31 -0.67 Man 10.68 .005 -2.03 0.03 0.64 -2.06 0.03 0.65 0.00 0.56 0.00 -1.35 0.13 0.43 -1.48 0.09 0.47 Hat 2.674 .485 0.00 0.63 0.00 -0.56 0.38 0.18 -0.68 0.31 0.21 -1.47 0.13 0.47 -0.81 0.25 0.26 Up 1.596 .704 -0.73 0.31 0.23 -0.41 0.41 0.13 -0.27 0.44 0.09 -0.18 0.50 0.06 -0.37 0.44 0.12 Off 1.239 .783 -1.22 0.13 0.39 -0.81 0.25 0.26 -0.13 0.50 0.04 -0.37 0.44 0.12 -1.47 0.13 0.47 Shop 1.313 .750 -0.41 0.44 0.13 -0.67 0.31 0.21 -0.38 0.50 0.12 -0.54 0.34 0.17 -0.54 0.34 0.17 Spot 9.188 .016* -1.21 0.16 0.38 -2.03 0.03 0.64 -0.27 0.44 0.09 -2.03 0.03 0.64 -1.84 0.06 0.58 Six 1.531 .723 -0.27 0.44 0.09 -0.40 0.41 0.13 -0.68 0.34 0.22 -1.46 0.13 0.46 -1.49 0.09 0.47 Beep 9 .016* -1.84 0.06 0.58 -1.21 0.16 0.38 -0.27 0.50 0.09 0.00 0.63 0.00 -2.03 0.03 0.64 Push 0.83 .870 0.00 0.63 0.00 -0.67 0.31 0.21 -0.13 0.50 0.04 -1.22 0.13 0.39 -1.34 0.25 0.42 Two 6.551 .080 -0.67 0.31 0.21 -1.10 0.19 0.35 -0.54 0.34 0.17 -1.63 0.09 0.51 -2.02 0.03 0.64 Note. A = phase A1 (pre-intervention), B = phase B (intervention priority one: labial-facial control), C = phase C (intervention priority two: lingual control), A2 = phase A2 (follow-up). *= p ≤ .05, two-tailed, boldface = large effect size.
THE EFFECTIVENESS OF PROMPT
218
Overall summary of P2’s kinematic measures.
Subsequent to the PROMPT Intervention the following changes were
evident:
Phase B - positive changes with a trend towards the TD peers on the
measures of mandibular control.
Phase C –positive changes with a trend towards the TD peers on the
measures of labial-facial control.
These results are consistent with the PROMPT intervention phases.
Phase A2 – post-intervention values differed from the pre-intervention values
indicating the presence of a treatment effect.
The above results indicate P2’s intervention program was successful in
producing changes to the motor-speech movement patterns under investigation.
Participant 3
The following motor-speech movement patterns were targeted during the
phases of the PROMPT intervention:
Phase B: (Intervention priority one: mandibular control) - Decrease range of
jaw height positions 3/4 and excessive anterior jaw thrust, and facilitate control in
jaw grading (i.e., reduce excessive closure as indicated through the lower lip position
thrusting superior to the upper lip position).
Phase C: (Intervention priority two: labial-facial control) – Lip-to-lip contact
on bilabials, inhibit excessive retraction and facilitate broad rounding.
Table 5.22 summarises the words that demonstrated significant impairment
of the jaw and lip measures for P3 as compared with the TD peers at pre-
intervention; and subsequently recorded significant change to these same measures
following PROMPT intervention.
Results are based on five repetitions of each word, with the exception of
TD33 where analysis of the word ‘two’ is based on two repetitions due to
pronunciation errors.
The distance data (see Appendix K) at pre-intervention show substantially
increased mean values in duration and distance measures of the jaw and lips as
compared with the TD peers. The post-intervention data show a positive treatment
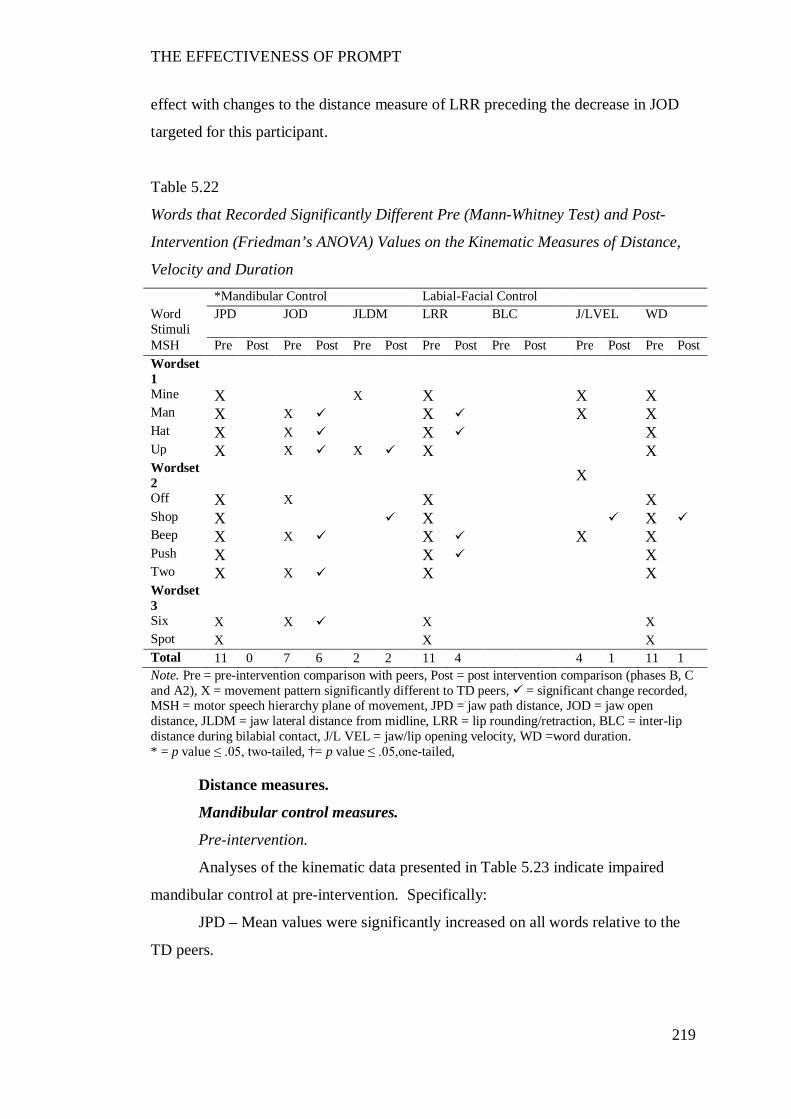
THE EFFECTIVENESS OF PROMPT
219
effect with changes to the distance measure of LRR preceding the decrease in JOD
targeted for this participant.
Table 5.22
Words that Recorded Significantly Different Pre (Mann-Whitney Test) and Post-
Intervention (Friedman’s ANOVA) Values on the Kinematic Measures of Distance,
Velocity and Duration *Mandibular Control Labial-Facial Control Word Stimuli
JPD JOD JLDM LRR BLC J/LVEL WD
MSH Pre Post Pre Post Pre Post Pre Post Pre Post Pre Post Pre Post Wordset 1
Mine X X X X X Man X X X X X Hat X X X X Up X X X X X Wordset 2 X
Off X X X X Shop X X X Beep X X X X X Push X X X Two X X X X Wordset 3
Six X X X X Spot X X X Total 11 0 7 6 2 2 11 4 4 1 11 1 Note. Pre = pre-intervention comparison with peers, Post = post intervention comparison (phases B, C and A2), X = movement pattern significantly different to TD peers, = significant change recorded, MSH = motor speech hierarchy plane of movement, JPD = jaw path distance, JOD = jaw open distance, JLDM = jaw lateral distance from midline, LRR = lip rounding/retraction, BLC = inter-lip distance during bilabial contact, J/L VEL = jaw/lip opening velocity, WD =word duration. * = p value ≤ .05, two-tailed, †= p value ≤ .05,one-tailed,
Distance measures.
Mandibular control measures.
Pre-intervention.
Analyses of the kinematic data presented in Table 5.23 indicate impaired
mandibular control at pre-intervention. Specifically:
JPD – Mean values were significantly increased on all words relative to the
TD peers.

THE EFFECTIVENESS OF PROMPT
220
JOD – Mean values were significantly increased on 3/4 and1/2 words of
word-set one and three, respectively. In contrast, the mean values for word-set two
were reduced relative to the TD peers.
JLDM – The word ‘up’ in word-set one exceeded the values obtained by the
TD peers, with a mean value of 4mm recorded. This value is outside the range of
typical deviation and therefore considered impaired. The word ‘shop’ recorded a
value that was significantly less, but within the typical range (i.e. less than 2-3mm).
Table 5.23
Mann-Whitney Test Results of the Pre-Intervention Mandibular Distance Measures
Comparing P3 with the TD Peers
JPD JOD JLDM JHP Word U *p U *p U *p
4 Mine 4.00 .002 33.00 .735 12.00 .025 4 Man 3.00 .001 8.00 .008 35.00 .866 4 Hat 1.00 .000 3.00 .001 35.00 .866 3 Up 13.00 .033 10.00 .015 5.00 .002
(2) Off 11.00 .019 13.00 .033 31.00 .612 2 Shop 0.00 .000 27.00 .395 17.00 .081 2 Spot 2.00 .001 22.00 .197 31.00 .612
1.5 Six 4.00 .002 1.00 .000 37.00 1.000 1 Beep 0.00 .000 15.00 .053 36.00 .933 1 Push 0.00 .000 33.00 .735 27.00 .395 1 Two 0.00 .000 4.00 .002 21.00 .168
Note. JPD = jaw path distance, JOD = jaw open distance, JLDM = jaw lateral distance from midline. * = two- tailed test, boldface = p ≤.05.
Post intervention.
The results for the three distance measures, obtained using Friedman’s
ANOVA (main effect), Wilcoxon signed-rank test (pair-wise comparisons) and
effect sizes are presented in Table 5.21. Means and SDs are provided in Figures J.1,
J.2 and J.3.
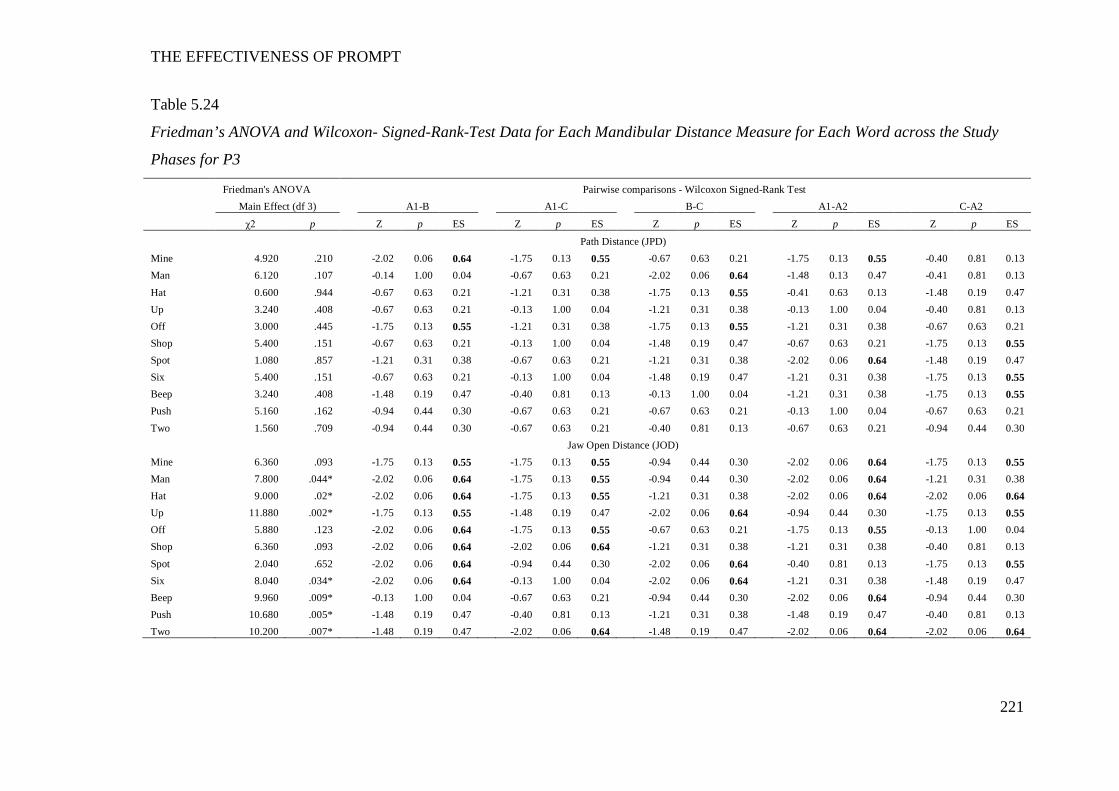
THE EFFECTIVENESS OF PROMPT
221
Table 5.24
Friedman’s ANOVA and Wilcoxon- Signed-Rank-Test Data for Each Mandibular Distance Measure for Each Word across the Study
Phases for P3
Friedman's ANOVA Pairwise comparisons - Wilcoxon Signed-Rank Test Main Effect (df 3) A1-B A1-C B-C A1-A2 C-A2
χ2 p Z p ES Z p ES Z p ES Z p ES Z p ES
Path Distance (JPD) Mine 4.920 .210 -2.02 0.06 0.64 -1.75 0.13 0.55 -0.67 0.63 0.21 -1.75 0.13 0.55 -0.40 0.81 0.13 Man 6.120 .107 -0.14 1.00 0.04 -0.67 0.63 0.21 -2.02 0.06 0.64 -1.48 0.13 0.47 -0.41 0.81 0.13 Hat 0.600 .944 -0.67 0.63 0.21 -1.21 0.31 0.38 -1.75 0.13 0.55 -0.41 0.63 0.13 -1.48 0.19 0.47 Up 3.240 .408 -0.67 0.63 0.21 -0.13 1.00 0.04 -1.21 0.31 0.38 -0.13 1.00 0.04 -0.40 0.81 0.13 Off 3.000 .445 -1.75 0.13 0.55 -1.21 0.31 0.38 -1.75 0.13 0.55 -1.21 0.31 0.38 -0.67 0.63 0.21 Shop 5.400 .151 -0.67 0.63 0.21 -0.13 1.00 0.04 -1.48 0.19 0.47 -0.67 0.63 0.21 -1.75 0.13 0.55 Spot 1.080 .857 -1.21 0.31 0.38 -0.67 0.63 0.21 -1.21 0.31 0.38 -2.02 0.06 0.64 -1.48 0.19 0.47 Six 5.400 .151 -0.67 0.63 0.21 -0.13 1.00 0.04 -1.48 0.19 0.47 -1.21 0.31 0.38 -1.75 0.13 0.55 Beep 3.240 .408 -1.48 0.19 0.47 -0.40 0.81 0.13 -0.13 1.00 0.04 -1.21 0.31 0.38 -1.75 0.13 0.55 Push 5.160 .162 -0.94 0.44 0.30 -0.67 0.63 0.21 -0.67 0.63 0.21 -0.13 1.00 0.04 -0.67 0.63 0.21 Two 1.560 .709 -0.94 0.44 0.30 -0.67 0.63 0.21 -0.40 0.81 0.13 -0.67 0.63 0.21 -0.94 0.44 0.30 Jaw Open Distance (JOD) Mine 6.360 .093 -1.75 0.13 0.55 -1.75 0.13 0.55 -0.94 0.44 0.30 -2.02 0.06 0.64 -1.75 0.13 0.55 Man 7.800 .044* -2.02 0.06 0.64 -1.75 0.13 0.55 -0.94 0.44 0.30 -2.02 0.06 0.64 -1.21 0.31 0.38 Hat 9.000 .02* -2.02 0.06 0.64 -1.75 0.13 0.55 -1.21 0.31 0.38 -2.02 0.06 0.64 -2.02 0.06 0.64 Up 11.880 .002* -1.75 0.13 0.55 -1.48 0.19 0.47 -2.02 0.06 0.64 -0.94 0.44 0.30 -1.75 0.13 0.55 Off 5.880 .123 -2.02 0.06 0.64 -1.75 0.13 0.55 -0.67 0.63 0.21 -1.75 0.13 0.55 -0.13 1.00 0.04 Shop 6.360 .093 -2.02 0.06 0.64 -2.02 0.06 0.64 -1.21 0.31 0.38 -1.21 0.31 0.38 -0.40 0.81 0.13 Spot 2.040 .652 -2.02 0.06 0.64 -0.94 0.44 0.30 -2.02 0.06 0.64 -0.40 0.81 0.13 -1.75 0.13 0.55 Six 8.040 .034* -2.02 0.06 0.64 -0.13 1.00 0.04 -2.02 0.06 0.64 -1.21 0.31 0.38 -1.48 0.19 0.47 Beep 9.960 .009* -0.13 1.00 0.04 -0.67 0.63 0.21 -0.94 0.44 0.30 -2.02 0.06 0.64 -0.94 0.44 0.30 Push 10.680 .005* -1.48 0.19 0.47 -0.40 0.81 0.13 -1.21 0.31 0.38 -1.48 0.19 0.47 -0.40 0.81 0.13 Two 10.200 .007* -1.48 0.19 0.47 -2.02 0.06 0.64 -1.48 0.19 0.47 -2.02 0.06 0.64 -2.02 0.06 0.64
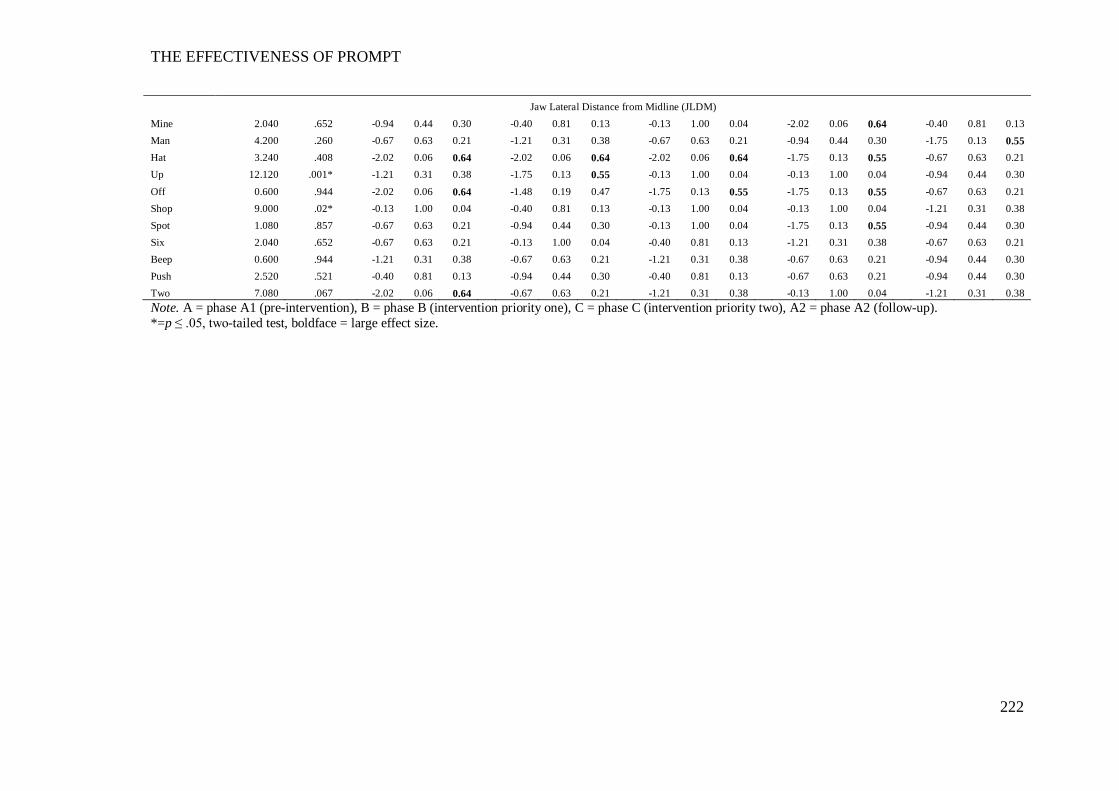
THE EFFECTIVENESS OF PROMPT
222
Jaw Lateral Distance from Midline (JLDM) Mine 2.040 .652 -0.94 0.44 0.30 -0.40 0.81 0.13 -0.13 1.00 0.04 -2.02 0.06 0.64 -0.40 0.81 0.13 Man 4.200 .260 -0.67 0.63 0.21 -1.21 0.31 0.38 -0.67 0.63 0.21 -0.94 0.44 0.30 -1.75 0.13 0.55 Hat 3.240 .408 -2.02 0.06 0.64 -2.02 0.06 0.64 -2.02 0.06 0.64 -1.75 0.13 0.55 -0.67 0.63 0.21 Up 12.120 .001* -1.21 0.31 0.38 -1.75 0.13 0.55 -0.13 1.00 0.04 -0.13 1.00 0.04 -0.94 0.44 0.30 Off 0.600 .944 -2.02 0.06 0.64 -1.48 0.19 0.47 -1.75 0.13 0.55 -1.75 0.13 0.55 -0.67 0.63 0.21 Shop 9.000 .02* -0.13 1.00 0.04 -0.40 0.81 0.13 -0.13 1.00 0.04 -0.13 1.00 0.04 -1.21 0.31 0.38 Spot 1.080 .857 -0.67 0.63 0.21 -0.94 0.44 0.30 -0.13 1.00 0.04 -1.75 0.13 0.55 -0.94 0.44 0.30 Six 2.040 .652 -0.67 0.63 0.21 -0.13 1.00 0.04 -0.40 0.81 0.13 -1.21 0.31 0.38 -0.67 0.63 0.21 Beep 0.600 .944 -1.21 0.31 0.38 -0.67 0.63 0.21 -1.21 0.31 0.38 -0.67 0.63 0.21 -0.94 0.44 0.30 Push 2.520 .521 -0.40 0.81 0.13 -0.94 0.44 0.30 -0.40 0.81 0.13 -0.67 0.63 0.21 -0.94 0.44 0.30 Two 7.080 .067 -2.02 0.06 0.64 -0.67 0.63 0.21 -1.21 0.31 0.38 -0.13 1.00 0.04 -1.21 0.31 0.38 Note. A = phase A1 (pre-intervention), B = phase B (intervention priority one), C = phase C (intervention priority two), A2 = phase A2 (follow-up). *=p ≤ .05, two-tailed test, boldface = large effect size.
THE EFFECTIVENESS OF PROMPT
223
Jaw Path Distance (JPD).
The results obtained using Friedman’s ANOVA indicate no real treatment
effect on any word subsequent to intervention. However, the pairwise-comparisons
indicate a small to moderate treatment effect between phases A-B, with a decrease in
mean values on 7/11 stimulus words.
This trend towards the TD peers was not maintained in phase C. The mean
values increased in this phase, with 4/11 words recording large effect sizes, and a
trend away from the TD peers.
Phase A2 yielded the most significant change. Large effect sizes were
recorded on 8/11 words with the trend direction returning towards the TD peers in
this phase. Pair-wise comparisons between phases A-D indicate 5/11 words
recorded values lower than pre-intervention, thus indicating a clinically significant
effect.
Jaw Open Distance (JOD).
The results obtained using Friedman’s ANOVA indicates a main effect on
6/8 words that differed significantly from the TD peers, at pre-intervention.
The pair-wise comparisons indicate the treatment effect occurred across all
phase of the study. Between phases A-B an increase in mean values was recorded,
whilst between phases B- C a significant decrease in values was recorded. However,
for most words the mean values were higher than the values recorded at pre-
intervention. The data indicate JOD values increased when the JPD decreased and
vice versa.
Jaw Lateral Distance from Midline (JLDM).
The results obtained using Friedman’s ANOVA indicate the presence of a
main effect on the two words (‘up’ and ‘shop’) that differed significantly to the TD
peers at pre-intervention.
The pairwise comparisons show a significant decrease in the mean value of
the word ‘up’ and an increase in the mean value of ‘shop’. Follow-up (phase A2)
data show all words to be within the typical range with performance comparable to
peers.
Labial-facial control.
Pre-intervention.
Analyses of the kinematic data presented in Table 5.25 indicate impaired
labial-facial control at pre-intervention. Specifically:
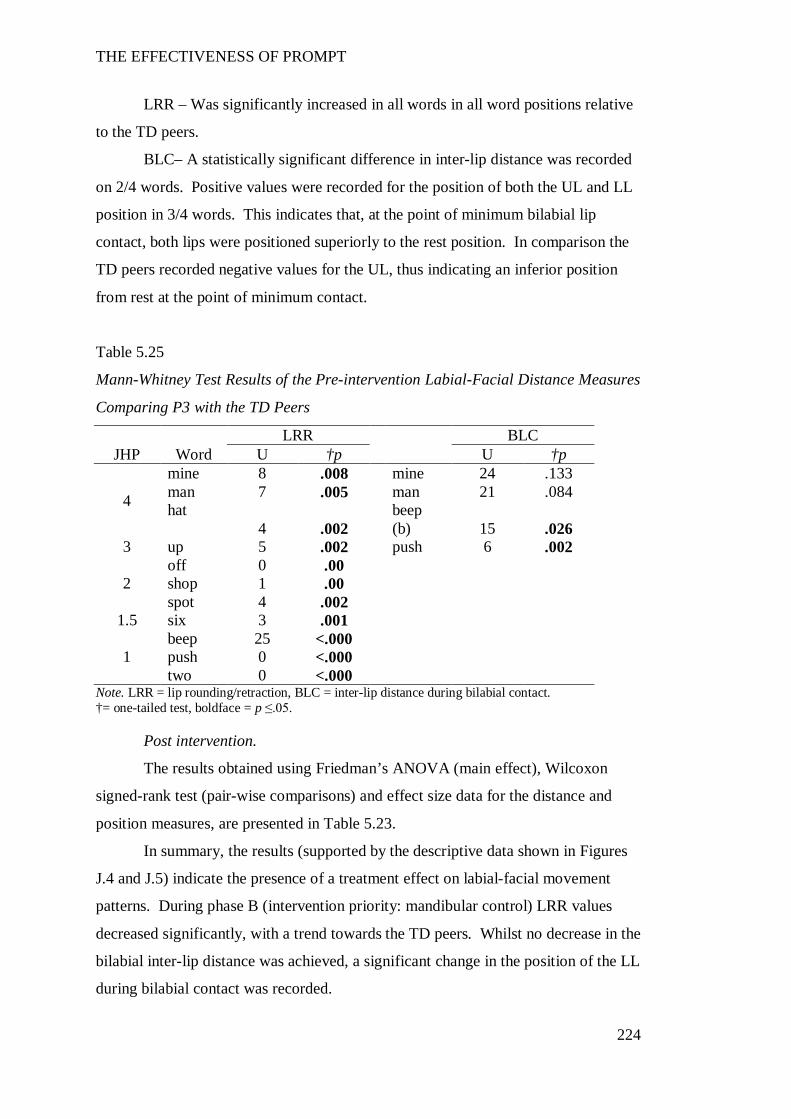
THE EFFECTIVENESS OF PROMPT
224
LRR – Was significantly increased in all words in all word positions relative
to the TD peers.
BLC– A statistically significant difference in inter-lip distance was recorded
on 2/4 words. Positive values were recorded for the position of both the UL and LL
position in 3/4 words. This indicates that, at the point of minimum bilabial lip
contact, both lips were positioned superiorly to the rest position. In comparison the
TD peers recorded negative values for the UL, thus indicating an inferior position
from rest at the point of minimum contact.
Table 5.25
Mann-Whitney Test Results of the Pre-intervention Labial-Facial Distance Measures
Comparing P3 with the TD Peers
LRR BLC JHP Word U †p U †p
4
mine 8 .008 mine 24 .133 man 7 .005 man 21 .084 hat
4 .002 beep
(b) 15 .026 3 up 5 .002 push 6 .002
2 off 0 .00 shop 1 .00 spot 4 .002
1.5 six 3 .001
1 beep 25 <.000 push 0 <.000 two 0 <.000
Note. LRR = lip rounding/retraction, BLC = inter-lip distance during bilabial contact. †= one-tailed test, boldface = p ≤.05.
Post intervention.
The results obtained using Friedman’s ANOVA (main effect), Wilcoxon
signed-rank test (pair-wise comparisons) and effect size data for the distance and
position measures, are presented in Table 5.23.
In summary, the results (supported by the descriptive data shown in Figures
J.4 and J.5) indicate the presence of a treatment effect on labial-facial movement
patterns. During phase B (intervention priority: mandibular control) LRR values
decreased significantly, with a trend towards the TD peers. Whilst no decrease in the
bilabial inter-lip distance was achieved, a significant change in the position of the LL
during bilabial contact was recorded.
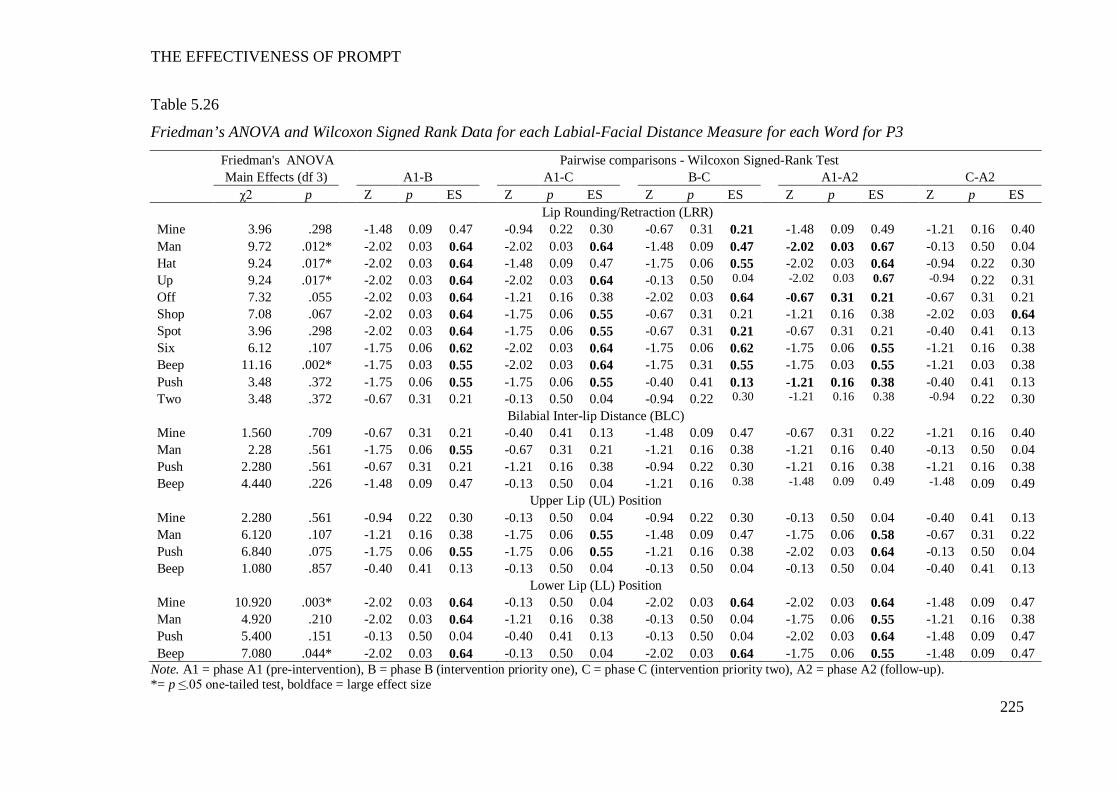
THE EFFECTIVENESS OF PROMPT
225
Table 5.26
Friedman’s ANOVA and Wilcoxon Signed Rank Data for each Labial-Facial Distance Measure for each Word for P3
Friedman's ANOVA Pairwise comparisons - Wilcoxon Signed-Rank Test Main Effects (df 3) A1-B A1-C B-C A1-A2 C-A2 χ2 p Z p ES Z p ES Z p ES Z p ES Z p ES Lip Rounding/Retraction (LRR) Mine 3.96 .298 -1.48 0.09 0.47 -0.94 0.22 0.30 -0.67 0.31 0.21 -1.48 0.09 0.49 -1.21 0.16 0.40 Man 9.72 .012* -2.02 0.03 0.64 -2.02 0.03 0.64 -1.48 0.09 0.47 -2.02 0.03 0.67 -0.13 0.50 0.04 Hat 9.24 .017* -2.02 0.03 0.64 -1.48 0.09 0.47 -1.75 0.06 0.55 -2.02 0.03 0.64 -0.94 0.22 0.30 Up 9.24 .017* -2.02 0.03 0.64 -2.02 0.03 0.64 -0.13 0.50 0.04 -2.02 0.03 0.67 -0.94 0.22 0.31 Off 7.32 .055 -2.02 0.03 0.64 -1.21 0.16 0.38 -2.02 0.03 0.64 -0.67 0.31 0.21 -0.67 0.31 0.21 Shop 7.08 .067 -2.02 0.03 0.64 -1.75 0.06 0.55 -0.67 0.31 0.21 -1.21 0.16 0.38 -2.02 0.03 0.64 Spot 3.96 .298 -2.02 0.03 0.64 -1.75 0.06 0.55 -0.67 0.31 0.21 -0.67 0.31 0.21 -0.40 0.41 0.13 Six 6.12 .107 -1.75 0.06 0.62 -2.02 0.03 0.64 -1.75 0.06 0.62 -1.75 0.06 0.55 -1.21 0.16 0.38 Beep 11.16 .002* -1.75 0.03 0.55 -2.02 0.03 0.64 -1.75 0.31 0.55 -1.75 0.03 0.55 -1.21 0.03 0.38 Push 3.48 .372 -1.75 0.06 0.55 -1.75 0.06 0.55 -0.40 0.41 0.13 -1.21 0.16 0.38 -0.40 0.41 0.13 Two 3.48 .372 -0.67 0.31 0.21 -0.13 0.50 0.04 -0.94 0.22 0.30 -1.21 0.16 0.38 -0.94 0.22 0.30
Bilabial Inter-lip Distance (BLC) Mine 1.560 .709 -0.67 0.31 0.21 -0.40 0.41 0.13 -1.48 0.09 0.47 -0.67 0.31 0.22 -1.21 0.16 0.40 Man 2.28 .561 -1.75 0.06 0.55 -0.67 0.31 0.21 -1.21 0.16 0.38 -1.21 0.16 0.40 -0.13 0.50 0.04 Push 2.280 .561 -0.67 0.31 0.21 -1.21 0.16 0.38 -0.94 0.22 0.30 -1.21 0.16 0.38 -1.21 0.16 0.38 Beep 4.440 .226 -1.48 0.09 0.47 -0.13 0.50 0.04 -1.21 0.16 0.38 -1.48 0.09 0.49 -1.48 0.09 0.49
Upper Lip (UL) Position Mine 2.280 .561 -0.94 0.22 0.30 -0.13 0.50 0.04 -0.94 0.22 0.30 -0.13 0.50 0.04 -0.40 0.41 0.13 Man 6.120 .107 -1.21 0.16 0.38 -1.75 0.06 0.55 -1.48 0.09 0.47 -1.75 0.06 0.58 -0.67 0.31 0.22 Push 6.840 .075 -1.75 0.06 0.55 -1.75 0.06 0.55 -1.21 0.16 0.38 -2.02 0.03 0.64 -0.13 0.50 0.04 Beep 1.080 .857 -0.40 0.41 0.13 -0.13 0.50 0.04 -0.13 0.50 0.04 -0.13 0.50 0.04 -0.40 0.41 0.13
Lower Lip (LL) Position Mine 10.920 .003* -2.02 0.03 0.64 -0.13 0.50 0.04 -2.02 0.03 0.64 -2.02 0.03 0.64 -1.48 0.09 0.47 Man 4.920 .210 -2.02 0.03 0.64 -1.21 0.16 0.38 -0.13 0.50 0.04 -1.75 0.06 0.55 -1.21 0.16 0.38 Push 5.400 .151 -0.13 0.50 0.04 -0.40 0.41 0.13 -0.13 0.50 0.04 -2.02 0.03 0.64 -1.48 0.09 0.47 Beep 7.080 .044* -2.02 0.03 0.64 -0.13 0.50 0.04 -2.02 0.03 0.64 -1.75 0.06 0.55 -1.48 0.09 0.47
Note. A1 = phase A1 (pre-intervention), B = phase B (intervention priority one), C = phase C (intervention priority two), A2 = phase A2 (follow-up). *= p ≤.05 one-tailed test, boldface = large effect size
THE EFFECTIVENESS OF PROMPT
226
Lip Rounding/Retraction (LRR).
The results obtained using Friedman’s ANOVA indicate a main effect on
4/11 words – two words in each of word-sets one and two.
The pair-wise comparisons indicate phases A-B yielded the most significant
change. Phase B (intervention priority: mandibular control) yielded a significant
decrease in LRR values on 9/11 words. Phase C (intervention priority: labial facial
control) was characterized by an increase in LRR values compared with phase B.
However, all mean values remained lower than recorded at phase A1 (pre-
intervention).
At follow-up (phase A2) 7/11 words recorded mean values that were
significantly reduced in comparison to the pre-intervention values.
Inter-lip distance during Bilabial Contact (BLC).
The results obtained using Friedman’s ANOVA indicate no significant main
treatment effect in BLC. However, a significant main effect was recorded in the
lower lip position during BLC for two words.
Plots of the average vertical positions of the upper lip (UL) and lower lip
(LL) markers at the point of bilabial contact, for each of the four words, are shown in
Figure 5.7. The LL is plotted on the X-axis and the UL is plotted on the y-axis. A
negative value reflects a downward position, whilst a positive value reflects an
upward position, from rest. UL and LL data shows a decrease in the positive values
recorded in both the UL and LL across the study phases.
The pair-wise comparisons indicate Phase B yielded the most significant
changes in the LL. The decreasing values recorded in the LL indicate a less superior
position, and the negative values of the UL indicate inferior movement from the rest
position, at the point of minimum BLC. During phase C, a return to increasing
values were recorded on 2/4 words in the position of the LL, however, the UL
continued to assume a more inferior position from rest on 2/4 words.
Phase A2 data shows improved bilabial lip contact as compared with pre-
intervention. This is indicated by the decreased superior position of the LL,
increased inferior position of the UL and the recording of inter-lip distance values
comparable to TD peers on 3/4 words during BLC.
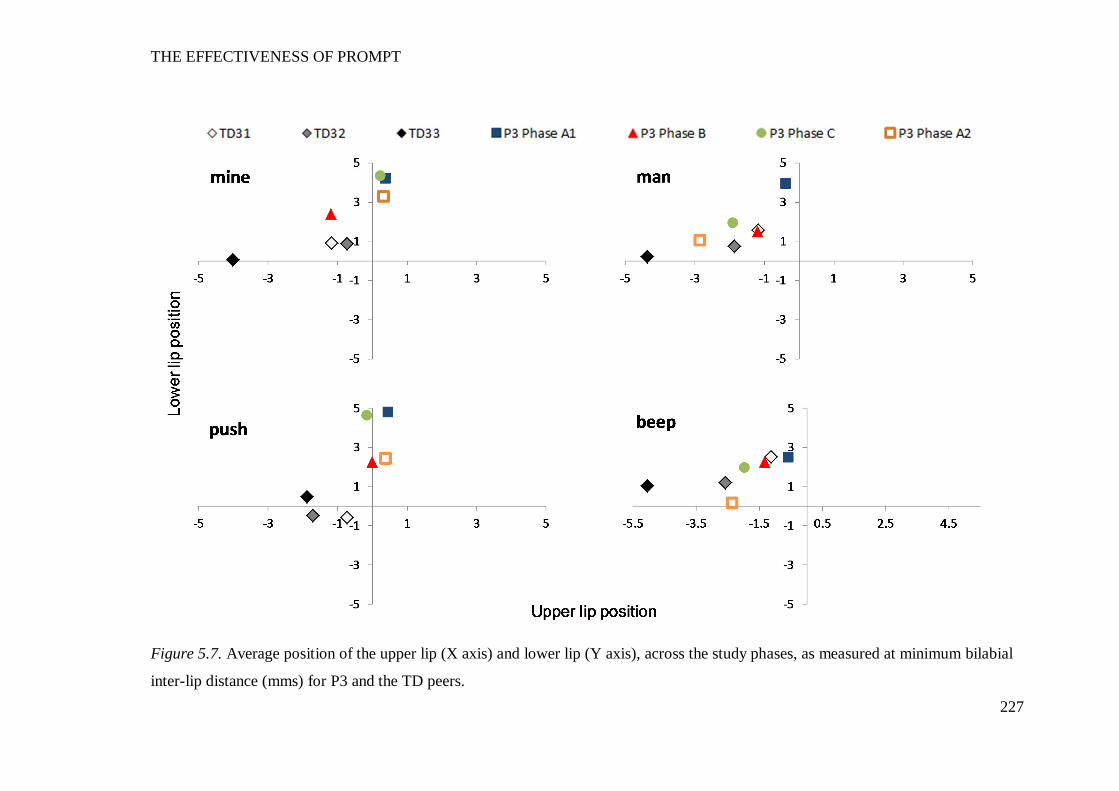
THE EFFECTIVENESS OF PROMPT
227
Figure 5.7. Average position of the upper lip (X axis) and lower lip (Y axis), across the study phases, as measured at minimum bilabial
inter-lip distance (mms) for P3 and the TD peers.
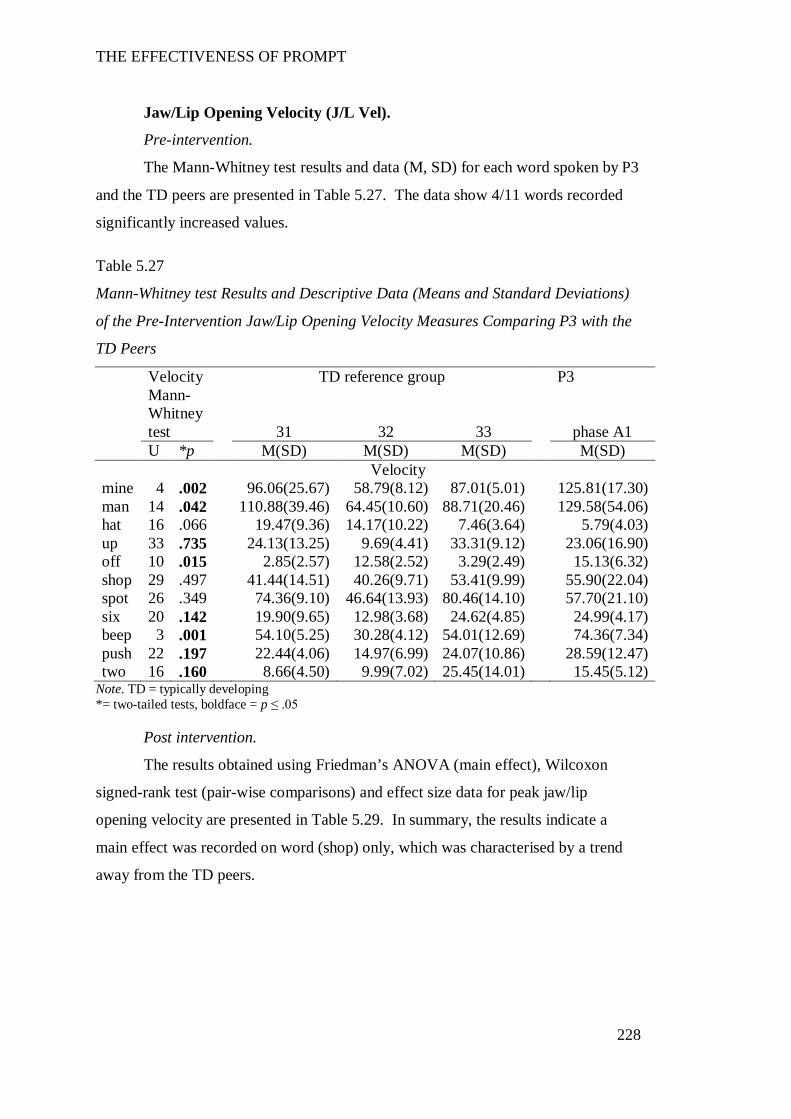
THE EFFECTIVENESS OF PROMPT
228
Jaw/Lip Opening Velocity (J/L Vel).
Pre-intervention.
The Mann-Whitney test results and data (M, SD) for each word spoken by P3
and the TD peers are presented in Table 5.27. The data show 4/11 words recorded
significantly increased values.
Table 5.27
Mann-Whitney test Results and Descriptive Data (Means and Standard Deviations)
of the Pre-Intervention Jaw/Lip Opening Velocity Measures Comparing P3 with the
TD Peers
Velocity TD reference group P3
Mann-Whitney test 31 32 33 phase A1
U *p M(SD) M(SD) M(SD) M(SD) Velocity mine 4 .002 96.06(25.67) 58.79(8.12) 87.01(5.01) 125.81(17.30) man 14 .042 110.88(39.46) 64.45(10.60) 88.71(20.46) 129.58(54.06) hat 16 .066 19.47(9.36) 14.17(10.22) 7.46(3.64) 5.79(4.03) up 33 .735 24.13(13.25) 9.69(4.41) 33.31(9.12) 23.06(16.90) off 10 .015 2.85(2.57) 12.58(2.52) 3.29(2.49) 15.13(6.32) shop 29 .497 41.44(14.51) 40.26(9.71) 53.41(9.99) 55.90(22.04) spot 26 .349 74.36(9.10) 46.64(13.93) 80.46(14.10) 57.70(21.10) six 20 .142 19.90(9.65) 12.98(3.68) 24.62(4.85) 24.99(4.17) beep 3 .001 54.10(5.25) 30.28(4.12) 54.01(12.69) 74.36(7.34) push 22 .197 22.44(4.06) 14.97(6.99) 24.07(10.86) 28.59(12.47) two 16 .160 8.66(4.50) 9.99(7.02) 25.45(14.01) 15.45(5.12)
Note. TD = typically developing *= two-tailed tests, boldface = p ≤ .05
Post intervention.
The results obtained using Friedman’s ANOVA (main effect), Wilcoxon
signed-rank test (pair-wise comparisons) and effect size data for peak jaw/lip
opening velocity are presented in Table 5.29. In summary, the results indicate a
main effect was recorded on word (shop) only, which was characterised by a trend
away from the TD peers.
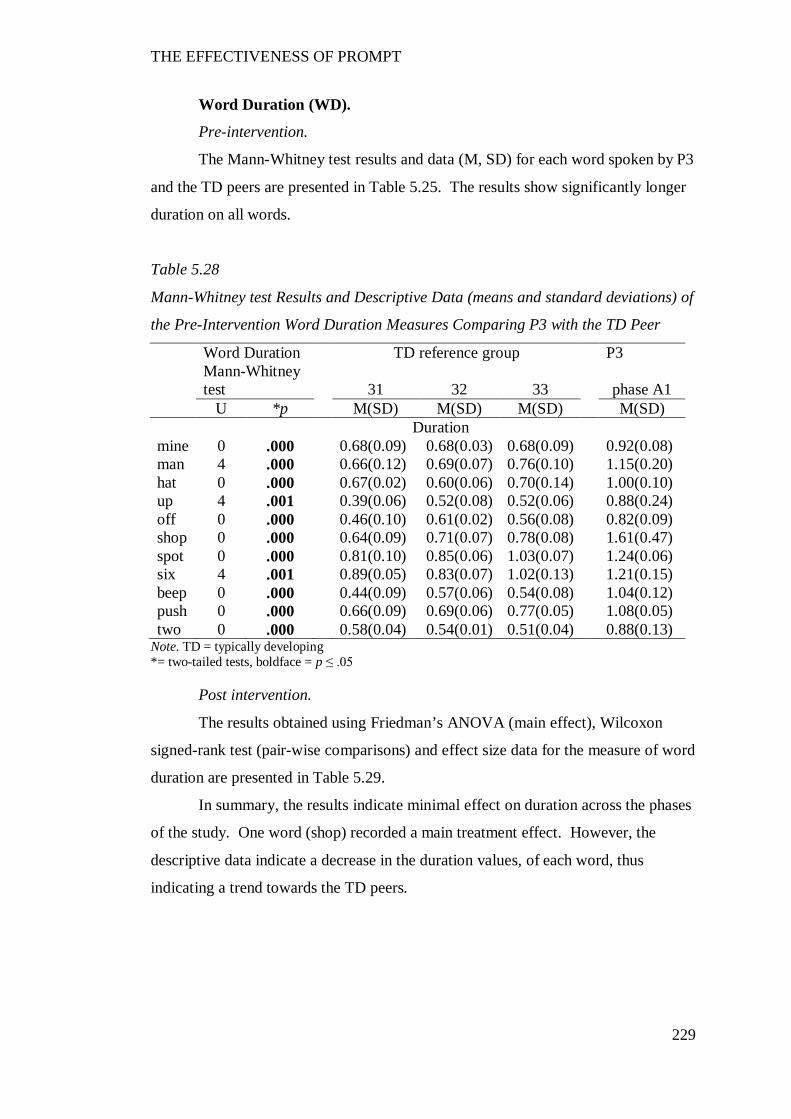
THE EFFECTIVENESS OF PROMPT
229
Word Duration (WD).
Pre-intervention.
The Mann-Whitney test results and data (M, SD) for each word spoken by P3
and the TD peers are presented in Table 5.25. The results show significantly longer
duration on all words.
Table 5.28
Mann-Whitney test Results and Descriptive Data (means and standard deviations) of
the Pre-Intervention Word Duration Measures Comparing P3 with the TD Peer
Word Duration TD reference group P3
Mann-Whitney test 31 32 33 phase A1
U *p M(SD) M(SD) M(SD) M(SD) Duration mine 0 .000 0.68(0.09) 0.68(0.03) 0.68(0.09) 0.92(0.08) man 4 .000 0.66(0.12) 0.69(0.07) 0.76(0.10) 1.15(0.20) hat 0 .000 0.67(0.02) 0.60(0.06) 0.70(0.14) 1.00(0.10) up 4 .001 0.39(0.06) 0.52(0.08) 0.52(0.06) 0.88(0.24) off 0 .000 0.46(0.10) 0.61(0.02) 0.56(0.08) 0.82(0.09) shop 0 .000 0.64(0.09) 0.71(0.07) 0.78(0.08) 1.61(0.47) spot 0 .000 0.81(0.10) 0.85(0.06) 1.03(0.07) 1.24(0.06) six 4 .001 0.89(0.05) 0.83(0.07) 1.02(0.13) 1.21(0.15) beep 0 .000 0.44(0.09) 0.57(0.06) 0.54(0.08) 1.04(0.12) push 0 .000 0.66(0.09) 0.69(0.06) 0.77(0.05) 1.08(0.05) two 0 .000 0.58(0.04) 0.54(0.01) 0.51(0.04) 0.88(0.13)
Note. TD = typically developing *= two-tailed tests, boldface = p ≤ .05
Post intervention.
The results obtained using Friedman’s ANOVA (main effect), Wilcoxon
signed-rank test (pair-wise comparisons) and effect size data for the measure of word
duration are presented in Table 5.29.
In summary, the results indicate minimal effect on duration across the phases
of the study. One word (shop) recorded a main treatment effect. However, the
descriptive data indicate a decrease in the duration values, of each word, thus
indicating a trend towards the TD peers.
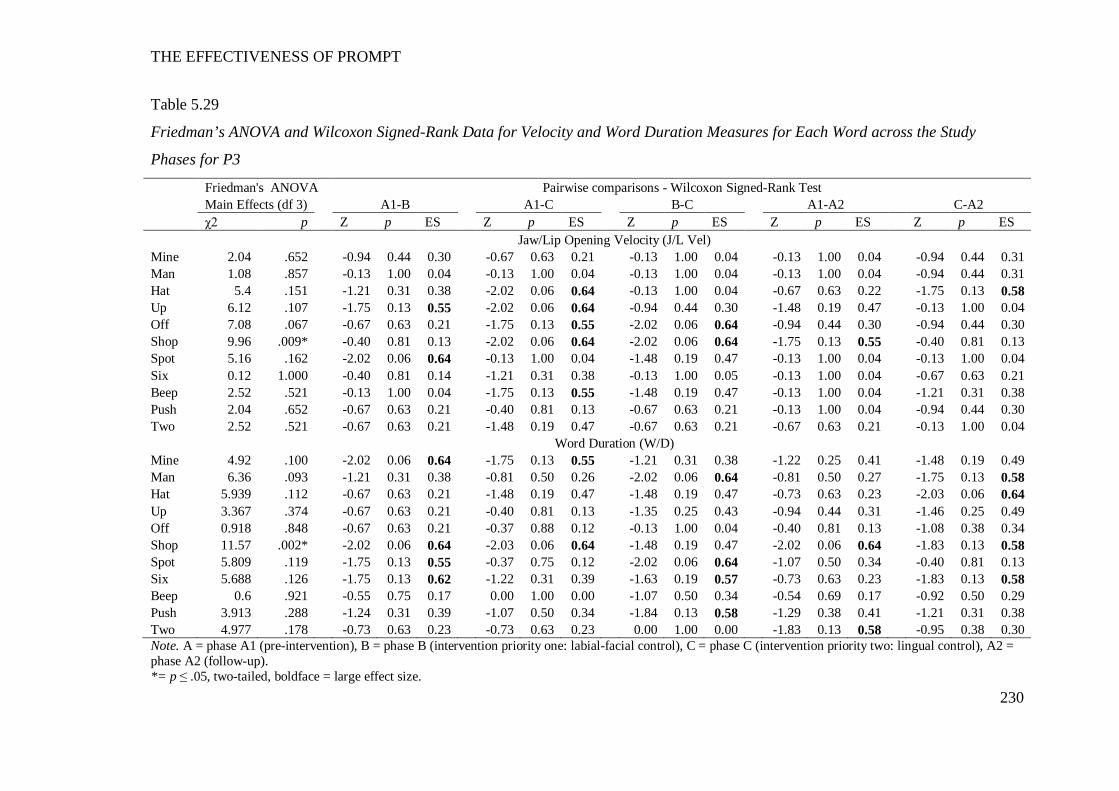
THE EFFECTIVENESS OF PROMPT
230
Table 5.29
Friedman’s ANOVA and Wilcoxon Signed-Rank Data for Velocity and Word Duration Measures for Each Word across the Study
Phases for P3
Friedman's ANOVA Pairwise comparisons - Wilcoxon Signed-Rank Test Main Effects (df 3) A1-B A1-C B-C A1-A2 C-A2 χ2 p Z p ES Z p ES Z p ES Z p ES Z p ES Jaw/Lip Opening Velocity (J/L Vel) Mine 2.04 .652 -0.94 0.44 0.30 -0.67 0.63 0.21 -0.13 1.00 0.04 -0.13 1.00 0.04 -0.94 0.44 0.31 Man 1.08 .857 -0.13 1.00 0.04 -0.13 1.00 0.04 -0.13 1.00 0.04 -0.13 1.00 0.04 -0.94 0.44 0.31 Hat 5.4 .151 -1.21 0.31 0.38 -2.02 0.06 0.64 -0.13 1.00 0.04 -0.67 0.63 0.22 -1.75 0.13 0.58 Up 6.12 .107 -1.75 0.13 0.55 -2.02 0.06 0.64 -0.94 0.44 0.30 -1.48 0.19 0.47 -0.13 1.00 0.04 Off 7.08 .067 -0.67 0.63 0.21 -1.75 0.13 0.55 -2.02 0.06 0.64 -0.94 0.44 0.30 -0.94 0.44 0.30 Shop 9.96 .009* -0.40 0.81 0.13 -2.02 0.06 0.64 -2.02 0.06 0.64 -1.75 0.13 0.55 -0.40 0.81 0.13 Spot 5.16 .162 -2.02 0.06 0.64 -0.13 1.00 0.04 -1.48 0.19 0.47 -0.13 1.00 0.04 -0.13 1.00 0.04 Six 0.12 1.000 -0.40 0.81 0.14 -1.21 0.31 0.38 -0.13 1.00 0.05 -0.13 1.00 0.04 -0.67 0.63 0.21 Beep 2.52 .521 -0.13 1.00 0.04 -1.75 0.13 0.55 -1.48 0.19 0.47 -0.13 1.00 0.04 -1.21 0.31 0.38 Push 2.04 .652 -0.67 0.63 0.21 -0.40 0.81 0.13 -0.67 0.63 0.21 -0.13 1.00 0.04 -0.94 0.44 0.30 Two 2.52 .521 -0.67 0.63 0.21 -1.48 0.19 0.47 -0.67 0.63 0.21 -0.67 0.63 0.21 -0.13 1.00 0.04
Word Duration (W/D) Mine 4.92 .100 -2.02 0.06 0.64 -1.75 0.13 0.55 -1.21 0.31 0.38 -1.22 0.25 0.41 -1.48 0.19 0.49 Man 6.36 .093 -1.21 0.31 0.38 -0.81 0.50 0.26 -2.02 0.06 0.64 -0.81 0.50 0.27 -1.75 0.13 0.58 Hat 5.939 .112 -0.67 0.63 0.21 -1.48 0.19 0.47 -1.48 0.19 0.47 -0.73 0.63 0.23 -2.03 0.06 0.64 Up 3.367 .374 -0.67 0.63 0.21 -0.40 0.81 0.13 -1.35 0.25 0.43 -0.94 0.44 0.31 -1.46 0.25 0.49 Off 0.918 .848 -0.67 0.63 0.21 -0.37 0.88 0.12 -0.13 1.00 0.04 -0.40 0.81 0.13 -1.08 0.38 0.34 Shop 11.57 .002* -2.02 0.06 0.64 -2.03 0.06 0.64 -1.48 0.19 0.47 -2.02 0.06 0.64 -1.83 0.13 0.58 Spot 5.809 .119 -1.75 0.13 0.55 -0.37 0.75 0.12 -2.02 0.06 0.64 -1.07 0.50 0.34 -0.40 0.81 0.13 Six 5.688 .126 -1.75 0.13 0.62 -1.22 0.31 0.39 -1.63 0.19 0.57 -0.73 0.63 0.23 -1.83 0.13 0.58 Beep 0.6 .921 -0.55 0.75 0.17 0.00 1.00 0.00 -1.07 0.50 0.34 -0.54 0.69 0.17 -0.92 0.50 0.29 Push 3.913 .288 -1.24 0.31 0.39 -1.07 0.50 0.34 -1.84 0.13 0.58 -1.29 0.38 0.41 -1.21 0.31 0.38 Two 4.977 .178 -0.73 0.63 0.23 -0.73 0.63 0.23 0.00 1.00 0.00 -1.83 0.13 0.58 -0.95 0.38 0.30 Note. A = phase A1 (pre-intervention), B = phase B (intervention priority one: labial-facial control), C = phase C (intervention priority two: lingual control), A2 = phase A2 (follow-up). *= p ≤ .05, two-tailed, boldface = large effect size.
THE EFFECTIVENESS OF PROMPT
231
Overall summary of P3’s kinematic measures.
Subsequent to the PROMPT intervention, the following changes were evident
across the study phases:
Phase B - was characterised by a significant decrease in the lip
rounding/retraction (LRR) values, indicating a trend towards the TD peers. Changes
to jaw measures included an increase in jaw open distance (JOD), which indicates a
trend away from the TD peers. However, a decrease in jaw path distance (JPD)
values was recorded, although these changes were not statistically significant.
Phase C - LRR values continued to decrease in this phase with some values
moving within the range of the TD peers. A return to decreased mean values was
recorded on the measure of JOD and lateral deviation from midline (JLDM) also
indicating a trend towards the TD peers.
Phase A2 - The results indicate continued improvement on the measures of
duration, lip rounding/retraction LRR and inter-lip distance during bilabial contact
(BLC). However, maintenance of the changes to the mandibular measures was
variable with evidence of some measures recording values higher than pre-
intervention.
The above results indicate P3’s intervention program was successful in
producing changes to the motor-speech movement patterns under investigation.
Participant 4
The following motor-speech movement patterns were targeted during the
phases of the PROMPT Intervention:
Phase B: (Intervention priority one: labial-facial) – inhibit excessive
retraction to promote increased jaw open distance and; increase broad facial
rounding and improve activity of the upper lip.
Phase C: (Intervention priority two: lingual control) – facilitate anterior and
mid-tongue control for the production of: /t/, /d/, /ʃ/ and /ʧ/. As Peak Motus (9.1)
does not record lingual movements, kinematic data collected during this phase
reflects changes in mandibular and labial-facial measurements subsequent to
intervention that targeted a higher level on the motor-speech hierarchy.
THE EFFECTIVENESS OF PROMPT
232
Table 5.30 summarises the words that recorded significant impairment of the
jaw and lip measures for P4 as compared with the typically developing (TD) peers
pre-intervention; and significant changes post-intervention for these words. Results
are based on five repetitions of each word, with the exception of one trial of the word
‘spot’ by TD 41. This word was deleted due to articulation error (the consonant
blend ‘sp’ was produced as a voiced stop ‘b’).
The distance data (Appendix L) at pre-intervention show a predominant
pattern of decreased jaw open distance (JOD) and increased lip rounding/retraction
(LRR) values, in comparison to the TD peers. Data also show a lower peak velocity
and longer mean duration. The post-intervention data show a positive treatment
effect with changes to the measures of JOD and LRR in phase B reflective of the
intervention priorities.
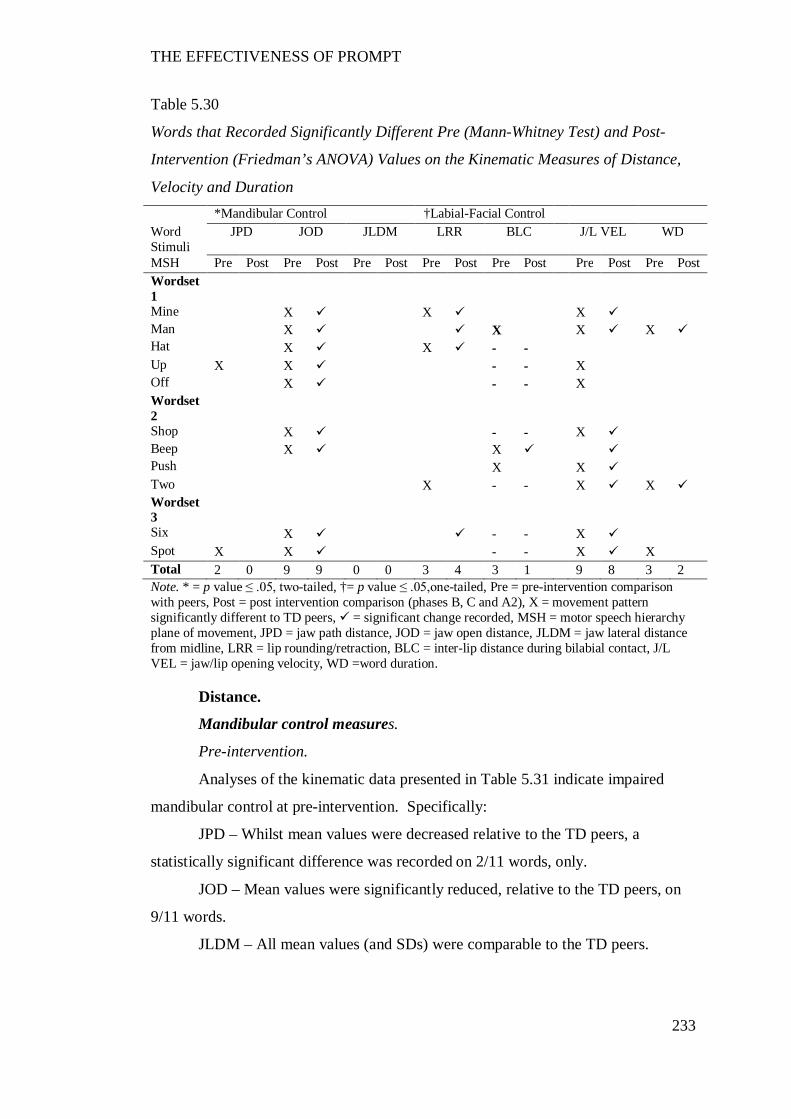
THE EFFECTIVENESS OF PROMPT
233
Table 5.30
Words that Recorded Significantly Different Pre (Mann-Whitney Test) and Post-
Intervention (Friedman’s ANOVA) Values on the Kinematic Measures of Distance,
Velocity and Duration *Mandibular Control †Labial-Facial Control Word Stimuli
JPD JOD JLDM LRR BLC J/L VEL WD
MSH Pre Post Pre Post Pre Post Pre Post Pre Post Pre Post Pre Post Wordset 1
Mine X X X Man X X X X Hat X X - - Up X X - - X Off X - - X Wordset 2
Shop X - - X Beep X X Push X X Two X - - X X Wordset 3
Six X - - X Spot X X - - X X Total 2 0 9 9 0 0 3 4 3 1 9 8 3 2 Note. * = p value ≤ .05, two-tailed, †= p value ≤ .05,one-tailed, Pre = pre-intervention comparison with peers, Post = post intervention comparison (phases B, C and A2), X = movement pattern significantly different to TD peers, = significant change recorded, MSH = motor speech hierarchy plane of movement, JPD = jaw path distance, JOD = jaw open distance, JLDM = jaw lateral distance from midline, LRR = lip rounding/retraction, BLC = inter-lip distance during bilabial contact, J/L VEL = jaw/lip opening velocity, WD =word duration.
Distance.
Mandibular control measures.
Pre-intervention.
Analyses of the kinematic data presented in Table 5.31 indicate impaired
mandibular control at pre-intervention. Specifically:
JPD – Whilst mean values were decreased relative to the TD peers, a
statistically significant difference was recorded on 2/11 words, only.
JOD – Mean values were significantly reduced, relative to the TD peers, on
9/11 words.
JLDM – All mean values (and SDs) were comparable to the TD peers.
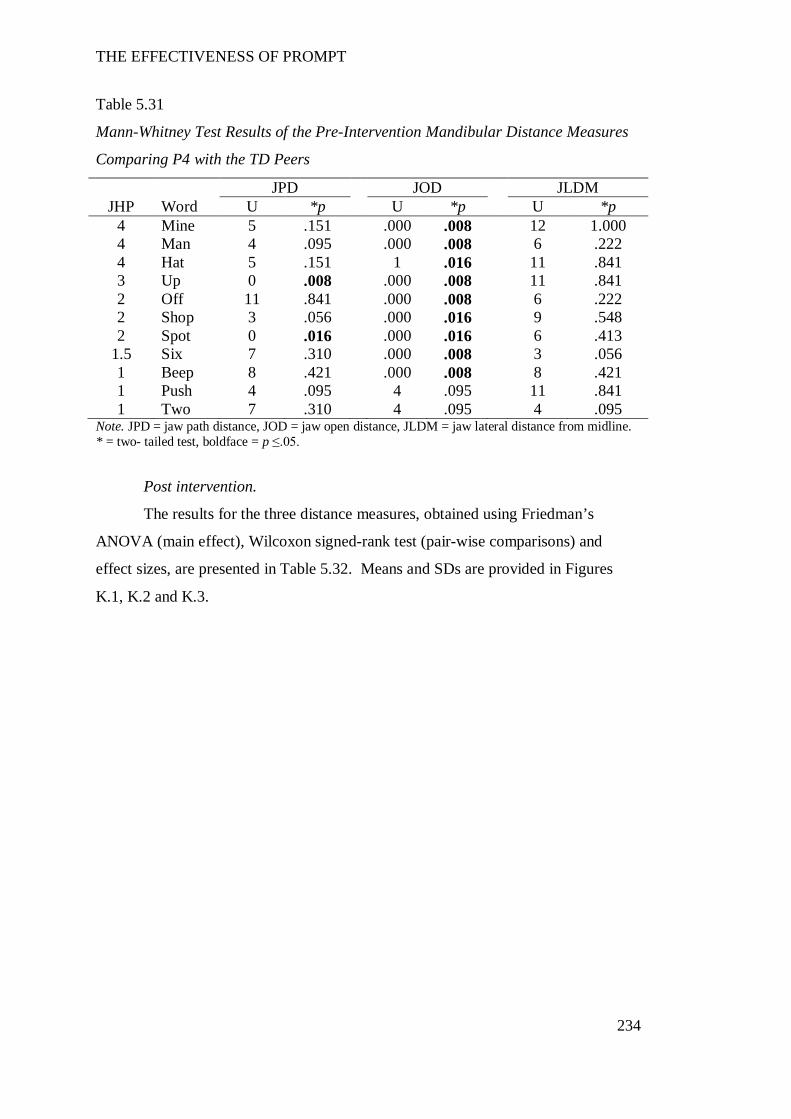
THE EFFECTIVENESS OF PROMPT
234
Table 5.31
Mann-Whitney Test Results of the Pre-Intervention Mandibular Distance Measures
Comparing P4 with the TD Peers
JPD JOD JLDM JHP Word U *p U *p U *p
4 Mine 5 .151 .000 .008 12 1.000 4 Man 4 .095 .000 .008 6 .222 4 Hat 5 .151 1 .016 11 .841 3 Up 0 .008 .000 .008 11 .841 2 Off 11 .841 .000 .008 6 .222 2 Shop 3 .056 .000 .016 9 .548 2 Spot 0 .016 .000 .016 6 .413
1.5 Six 7 .310 .000 .008 3 .056 1 Beep 8 .421 .000 .008 8 .421 1 Push 4 .095 4 .095 11 .841 1 Two 7 .310 4 .095 4 .095
Note. JPD = jaw path distance, JOD = jaw open distance, JLDM = jaw lateral distance from midline. * = two- tailed test, boldface = p ≤.05.
Post intervention.
The results for the three distance measures, obtained using Friedman’s
ANOVA (main effect), Wilcoxon signed-rank test (pair-wise comparisons) and
effect sizes, are presented in Table 5.32. Means and SDs are provided in Figures
K.1, K.2 and K.3.
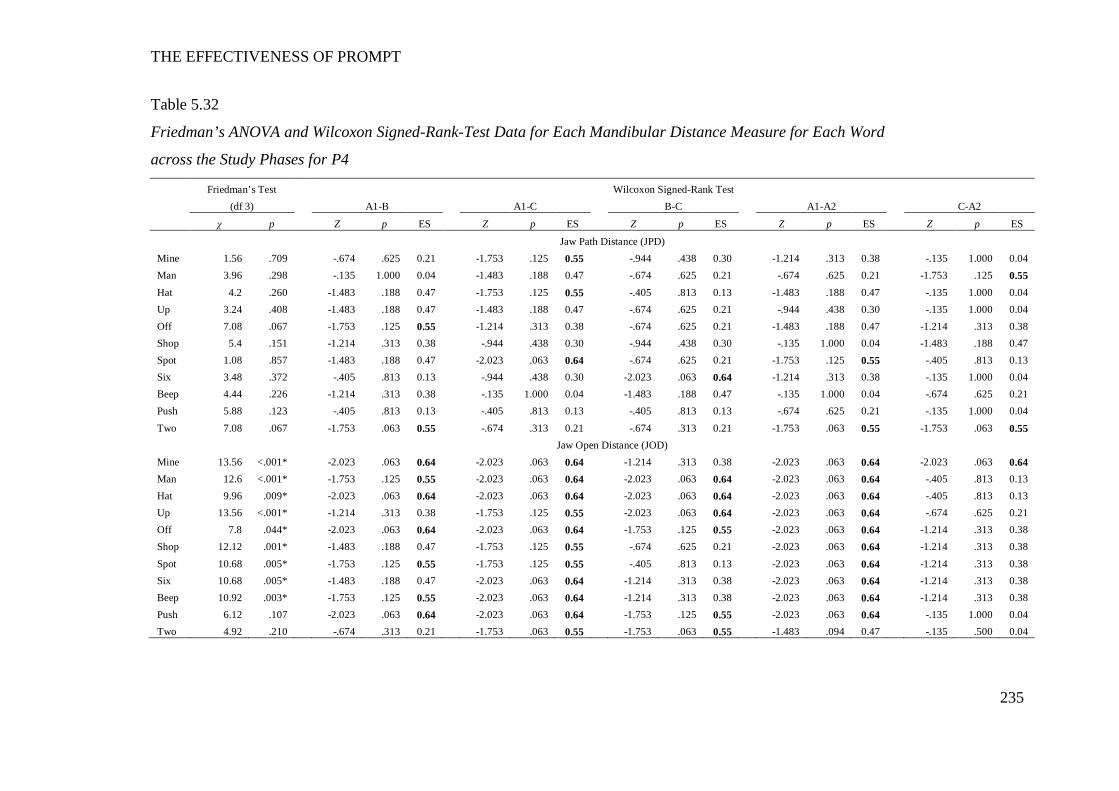
THE EFFECTIVENESS OF PROMPT
235
Table 5.32
Friedman’s ANOVA and Wilcoxon Signed-Rank-Test Data for Each Mandibular Distance Measure for Each Word
across the Study Phases for P4
Friedman’s Test Wilcoxon Signed-Rank Test (df 3) A1-B A1-C B-C A1-A2 C-A2
χ p Z p ES Z p ES Z p ES Z p ES Z p ES
Jaw Path Distance (JPD) Mine 1.56 .709 -.674 .625 0.21 -1.753 .125 0.55 -.944 .438 0.30 -1.214 .313 0.38 -.135 1.000 0.04 Man 3.96 .298 -.135 1.000 0.04 -1.483 .188 0.47 -.674 .625 0.21 -.674 .625 0.21 -1.753 .125 0.55 Hat 4.2 .260 -1.483 .188 0.47 -1.753 .125 0.55 -.405 .813 0.13 -1.483 .188 0.47 -.135 1.000 0.04 Up 3.24 .408 -1.483 .188 0.47 -1.483 .188 0.47 -.674 .625 0.21 -.944 .438 0.30 -.135 1.000 0.04 Off 7.08 .067 -1.753 .125 0.55 -1.214 .313 0.38 -.674 .625 0.21 -1.483 .188 0.47 -1.214 .313 0.38 Shop 5.4 .151 -1.214 .313 0.38 -.944 .438 0.30 -.944 .438 0.30 -.135 1.000 0.04 -1.483 .188 0.47 Spot 1.08 .857 -1.483 .188 0.47 -2.023 .063 0.64 -.674 .625 0.21 -1.753 .125 0.55 -.405 .813 0.13 Six 3.48 .372 -.405 .813 0.13 -.944 .438 0.30 -2.023 .063 0.64 -1.214 .313 0.38 -.135 1.000 0.04 Beep 4.44 .226 -1.214 .313 0.38 -.135 1.000 0.04 -1.483 .188 0.47 -.135 1.000 0.04 -.674 .625 0.21 Push 5.88 .123 -.405 .813 0.13 -.405 .813 0.13 -.405 .813 0.13 -.674 .625 0.21 -.135 1.000 0.04 Two 7.08 .067 -1.753 .063 0.55 -.674 .313 0.21 -.674 .313 0.21 -1.753 .063 0.55 -1.753 .063 0.55 Jaw Open Distance (JOD) Mine 13.56 <.001* -2.023 .063 0.64 -2.023 .063 0.64 -1.214 .313 0.38 -2.023 .063 0.64 -2.023 .063 0.64 Man 12.6 <.001* -1.753 .125 0.55 -2.023 .063 0.64 -2.023 .063 0.64 -2.023 .063 0.64 -.405 .813 0.13 Hat 9.96 .009* -2.023 .063 0.64 -2.023 .063 0.64 -2.023 .063 0.64 -2.023 .063 0.64 -.405 .813 0.13 Up 13.56 <.001* -1.214 .313 0.38 -1.753 .125 0.55 -2.023 .063 0.64 -2.023 .063 0.64 -.674 .625 0.21 Off 7.8 .044* -2.023 .063 0.64 -2.023 .063 0.64 -1.753 .125 0.55 -2.023 .063 0.64 -1.214 .313 0.38 Shop 12.12 .001* -1.483 .188 0.47 -1.753 .125 0.55 -.674 .625 0.21 -2.023 .063 0.64 -1.214 .313 0.38 Spot 10.68 .005* -1.753 .125 0.55 -1.753 .125 0.55 -.405 .813 0.13 -2.023 .063 0.64 -1.214 .313 0.38 Six 10.68 .005* -1.483 .188 0.47 -2.023 .063 0.64 -1.214 .313 0.38 -2.023 .063 0.64 -1.214 .313 0.38 Beep 10.92 .003* -1.753 .125 0.55 -2.023 .063 0.64 -1.214 .313 0.38 -2.023 .063 0.64 -1.214 .313 0.38 Push 6.12 .107 -2.023 .063 0.64 -2.023 .063 0.64 -1.753 .125 0.55 -2.023 .063 0.64 -.135 1.000 0.04 Two 4.92 .210 -.674 .313 0.21 -1.753 .063 0.55 -1.753 .063 0.55 -1.483 .094 0.47 -.135 .500 0.04
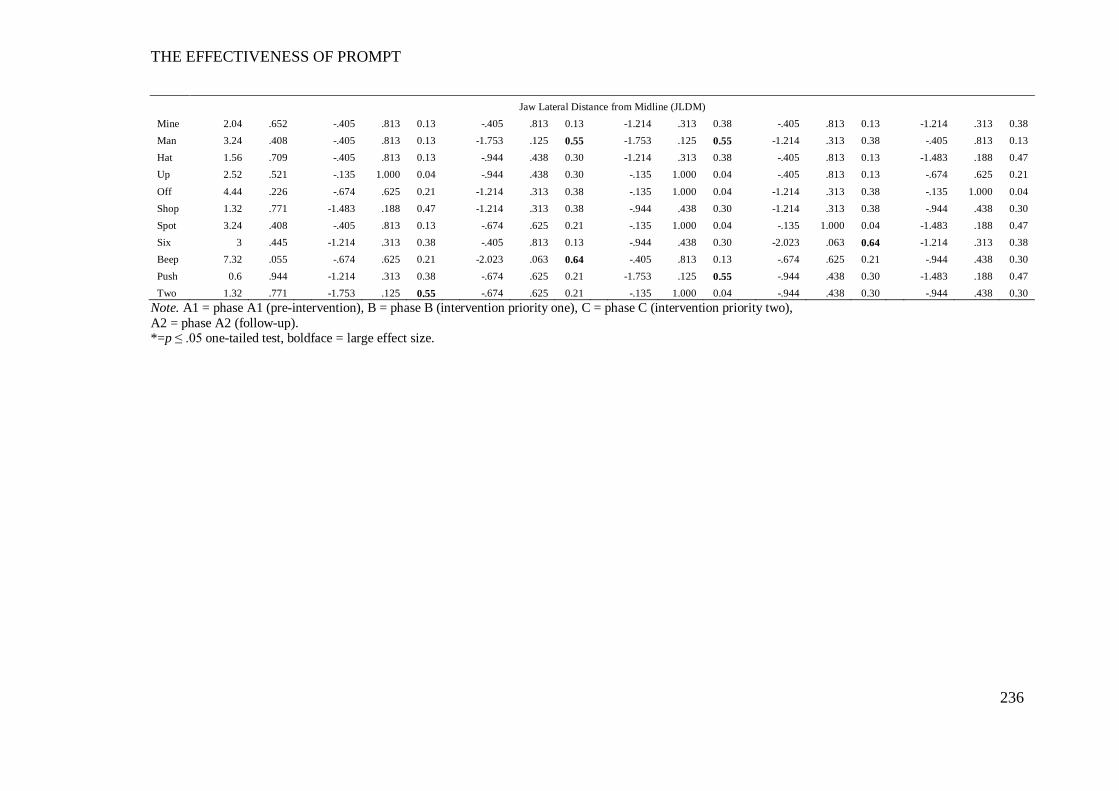
THE EFFECTIVENESS OF PROMPT
236
Jaw Lateral Distance from Midline (JLDM) Mine 2.04 .652 -.405 .813 0.13 -.405 .813 0.13 -1.214 .313 0.38 -.405 .813 0.13 -1.214 .313 0.38 Man 3.24 .408 -.405 .813 0.13 -1.753 .125 0.55 -1.753 .125 0.55 -1.214 .313 0.38 -.405 .813 0.13 Hat 1.56 .709 -.405 .813 0.13 -.944 .438 0.30 -1.214 .313 0.38 -.405 .813 0.13 -1.483 .188 0.47 Up 2.52 .521 -.135 1.000 0.04 -.944 .438 0.30 -.135 1.000 0.04 -.405 .813 0.13 -.674 .625 0.21 Off 4.44 .226 -.674 .625 0.21 -1.214 .313 0.38 -.135 1.000 0.04 -1.214 .313 0.38 -.135 1.000 0.04 Shop 1.32 .771 -1.483 .188 0.47 -1.214 .313 0.38 -.944 .438 0.30 -1.214 .313 0.38 -.944 .438 0.30 Spot 3.24 .408 -.405 .813 0.13 -.674 .625 0.21 -.135 1.000 0.04 -.135 1.000 0.04 -1.483 .188 0.47 Six 3 .445 -1.214 .313 0.38 -.405 .813 0.13 -.944 .438 0.30 -2.023 .063 0.64 -1.214 .313 0.38 Beep 7.32 .055 -.674 .625 0.21 -2.023 .063 0.64 -.405 .813 0.13 -.674 .625 0.21 -.944 .438 0.30 Push 0.6 .944 -1.214 .313 0.38 -.674 .625 0.21 -1.753 .125 0.55 -.944 .438 0.30 -1.483 .188 0.47 Two 1.32 .771 -1.753 .125 0.55 -.674 .625 0.21 -.135 1.000 0.04 -.944 .438 0.30 -.944 .438 0.30
Note. A1 = phase A1 (pre-intervention), B = phase B (intervention priority one), C = phase C (intervention priority two), A2 = phase A2 (follow-up). *=p ≤ .05 one-tailed test, boldface = large effect size.
THE EFFECTIVENESS OF PROMPT
237
Jaw Path Distance (JPD).
The results obtained using Friedman’s ANOVA indicate no presence of a
main effect. However, the pairwise comparisons indicate moderate to large effect
sizes on 8/11 words, with a trend towards increasing mean values between phases A-
C. Six of eleven words maintained these effects sizes between phases A-D. The
descriptive data therefore suggests a trend towards the TD peer across the study
phases. The data therefore indicate the presence of a positive treatment effect, with
phase C yielding the most substantial change.
Jaw Open Distance (JOD).
The results obtained using Friedman’s ANOVA indicate the presence of a
main effect on all nine words that differed significantly from the TD peer, at pre-
intervention.
Results on the pair-wise comparisons indicate an increase in mean JOD
values occurred between phases A-B (intervention priority one: labial-facial control).
Seven of eleven words yielded large effect sizes and a trend towards the TD peers.
This treatment effect continued in phase C with 6/11 words continuing to yield large
effect sizes between phases B-C. All words recorded large effect sizes between
phases A1-A2 indicating the treatment effect was maintained at follow-up.
Jaw Lateral Distance from Midline (JLDM).
The results obtained using Friedman’s ANOVA show no presence of a main
effect on any word. The results indicate comparable performance with the TD peer.
Labial-facial measures.
Pre-intervention.
Analyses of the kinematic data presented in Table 5.33 indicate impaired
labial-facial control at pre-intervention. Specifically:
LRR – A statistically significant increase was recorded on 3/11words in
comparison to the TD peer. Excessive retraction was evidenced on 2/4 words in
word-set one at jaw height position four as well as the word ‘two’ in word-set two.
BLC – A statistically significant increase in inter-lip distance was recorded
on 3/4 words.
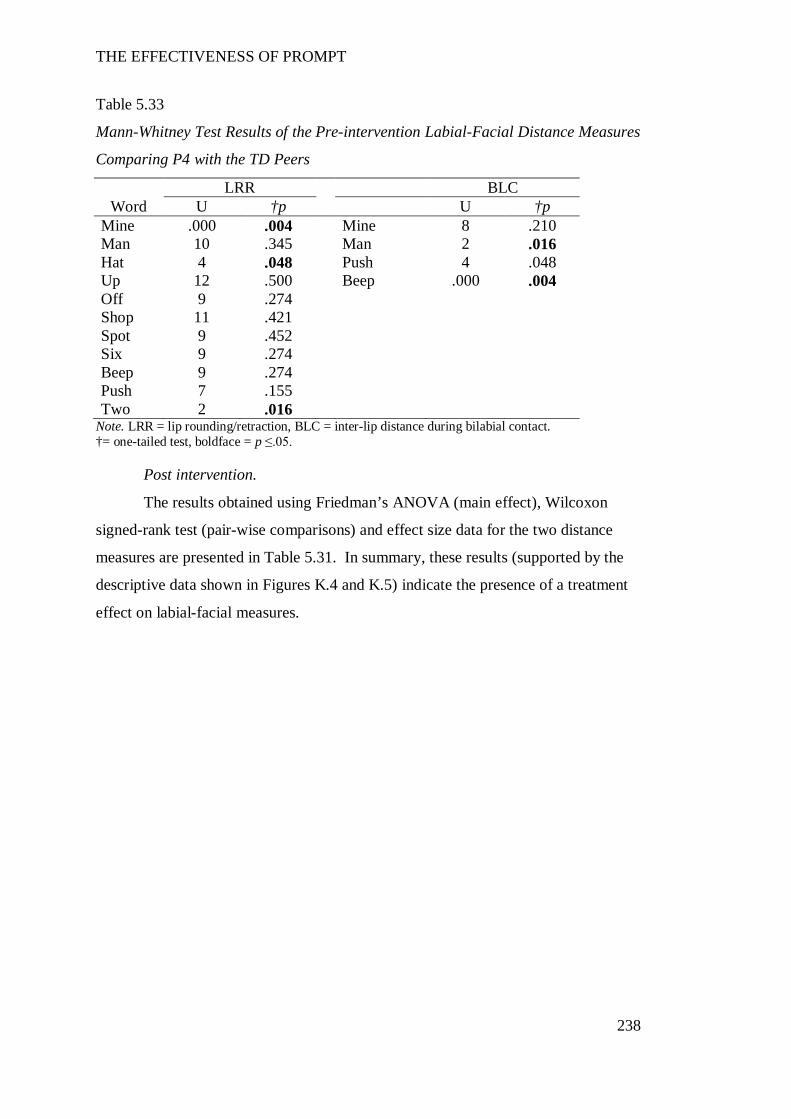
THE EFFECTIVENESS OF PROMPT
238
Table 5.33
Mann-Whitney Test Results of the Pre-intervention Labial-Facial Distance Measures
Comparing P4 with the TD Peers
LRR BLC Word U †p U †p
Mine .000 .004 Mine 8 .210 Man 10 .345 Man 2 .016 Hat 4 .048 Push 4 .048 Up 12 .500 Beep .000 .004 Off 9 .274 Shop 11 .421 Spot 9 .452 Six 9 .274 Beep 9 .274 Push 7 .155 Two 2 .016
Note. LRR = lip rounding/retraction, BLC = inter-lip distance during bilabial contact. †= one-tailed test, boldface = p ≤.05.
Post intervention.
The results obtained using Friedman’s ANOVA (main effect), Wilcoxon
signed-rank test (pair-wise comparisons) and effect size data for the two distance
measures are presented in Table 5.31. In summary, these results (supported by the
descriptive data shown in Figures K.4 and K.5) indicate the presence of a treatment
effect on labial-facial measures.
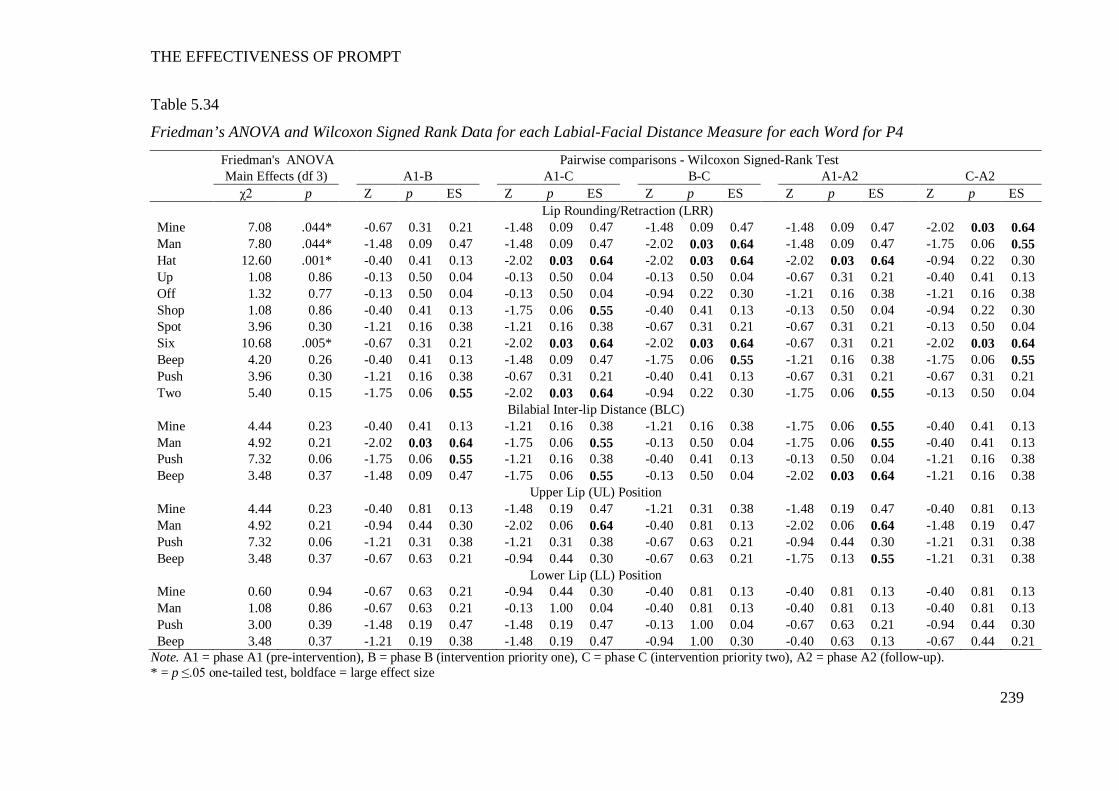
THE EFFECTIVENESS OF PROMPT
239
Table 5.34
Friedman’s ANOVA and Wilcoxon Signed Rank Data for each Labial-Facial Distance Measure for each Word for P4
Friedman's ANOVA Pairwise comparisons - Wilcoxon Signed-Rank Test Main Effects (df 3) A1-B A1-C B-C A1-A2 C-A2 χ2 p Z p ES Z p ES Z p ES Z p ES Z p ES Lip Rounding/Retraction (LRR) Mine 7.08 .044* -0.67 0.31 0.21 -1.48 0.09 0.47 -1.48 0.09 0.47 -1.48 0.09 0.47 -2.02 0.03 0.64 Man 7.80 .044* -1.48 0.09 0.47 -1.48 0.09 0.47 -2.02 0.03 0.64 -1.48 0.09 0.47 -1.75 0.06 0.55 Hat 12.60 .001* -0.40 0.41 0.13 -2.02 0.03 0.64 -2.02 0.03 0.64 -2.02 0.03 0.64 -0.94 0.22 0.30 Up 1.08 0.86 -0.13 0.50 0.04 -0.13 0.50 0.04 -0.13 0.50 0.04 -0.67 0.31 0.21 -0.40 0.41 0.13 Off 1.32 0.77 -0.13 0.50 0.04 -0.13 0.50 0.04 -0.94 0.22 0.30 -1.21 0.16 0.38 -1.21 0.16 0.38 Shop 1.08 0.86 -0.40 0.41 0.13 -1.75 0.06 0.55 -0.40 0.41 0.13 -0.13 0.50 0.04 -0.94 0.22 0.30 Spot 3.96 0.30 -1.21 0.16 0.38 -1.21 0.16 0.38 -0.67 0.31 0.21 -0.67 0.31 0.21 -0.13 0.50 0.04 Six 10.68 .005* -0.67 0.31 0.21 -2.02 0.03 0.64 -2.02 0.03 0.64 -0.67 0.31 0.21 -2.02 0.03 0.64 Beep 4.20 0.26 -0.40 0.41 0.13 -1.48 0.09 0.47 -1.75 0.06 0.55 -1.21 0.16 0.38 -1.75 0.06 0.55 Push 3.96 0.30 -1.21 0.16 0.38 -0.67 0.31 0.21 -0.40 0.41 0.13 -0.67 0.31 0.21 -0.67 0.31 0.21 Two 5.40 0.15 -1.75 0.06 0.55 -2.02 0.03 0.64 -0.94 0.22 0.30 -1.75 0.06 0.55 -0.13 0.50 0.04
Bilabial Inter-lip Distance (BLC) Mine 4.44 0.23 -0.40 0.41 0.13 -1.21 0.16 0.38 -1.21 0.16 0.38 -1.75 0.06 0.55 -0.40 0.41 0.13 Man 4.92 0.21 -2.02 0.03 0.64 -1.75 0.06 0.55 -0.13 0.50 0.04 -1.75 0.06 0.55 -0.40 0.41 0.13 Push 7.32 0.06 -1.75 0.06 0.55 -1.21 0.16 0.38 -0.40 0.41 0.13 -0.13 0.50 0.04 -1.21 0.16 0.38 Beep 3.48 0.37 -1.48 0.09 0.47 -1.75 0.06 0.55 -0.13 0.50 0.04 -2.02 0.03 0.64 -1.21 0.16 0.38
Upper Lip (UL) Position Mine 4.44 0.23 -0.40 0.81 0.13 -1.48 0.19 0.47 -1.21 0.31 0.38 -1.48 0.19 0.47 -0.40 0.81 0.13 Man 4.92 0.21 -0.94 0.44 0.30 -2.02 0.06 0.64 -0.40 0.81 0.13 -2.02 0.06 0.64 -1.48 0.19 0.47 Push 7.32 0.06 -1.21 0.31 0.38 -1.21 0.31 0.38 -0.67 0.63 0.21 -0.94 0.44 0.30 -1.21 0.31 0.38 Beep 3.48 0.37 -0.67 0.63 0.21 -0.94 0.44 0.30 -0.67 0.63 0.21 -1.75 0.13 0.55 -1.21 0.31 0.38
Lower Lip (LL) Position Mine 0.60 0.94 -0.67 0.63 0.21 -0.94 0.44 0.30 -0.40 0.81 0.13 -0.40 0.81 0.13 -0.40 0.81 0.13 Man 1.08 0.86 -0.67 0.63 0.21 -0.13 1.00 0.04 -0.40 0.81 0.13 -0.40 0.81 0.13 -0.40 0.81 0.13 Push 3.00 0.39 -1.48 0.19 0.47 -1.48 0.19 0.47 -0.13 1.00 0.04 -0.67 0.63 0.21 -0.94 0.44 0.30 Beep 3.48 0.37 -1.21 0.19 0.38 -1.48 0.19 0.47 -0.94 1.00 0.30 -0.40 0.63 0.13 -0.67 0.44 0.21
Note. A1 = phase A1 (pre-intervention), B = phase B (intervention priority one), C = phase C (intervention priority two), A2 = phase A2 (follow-up). * = p ≤.05 one-tailed test, boldface = large effect size
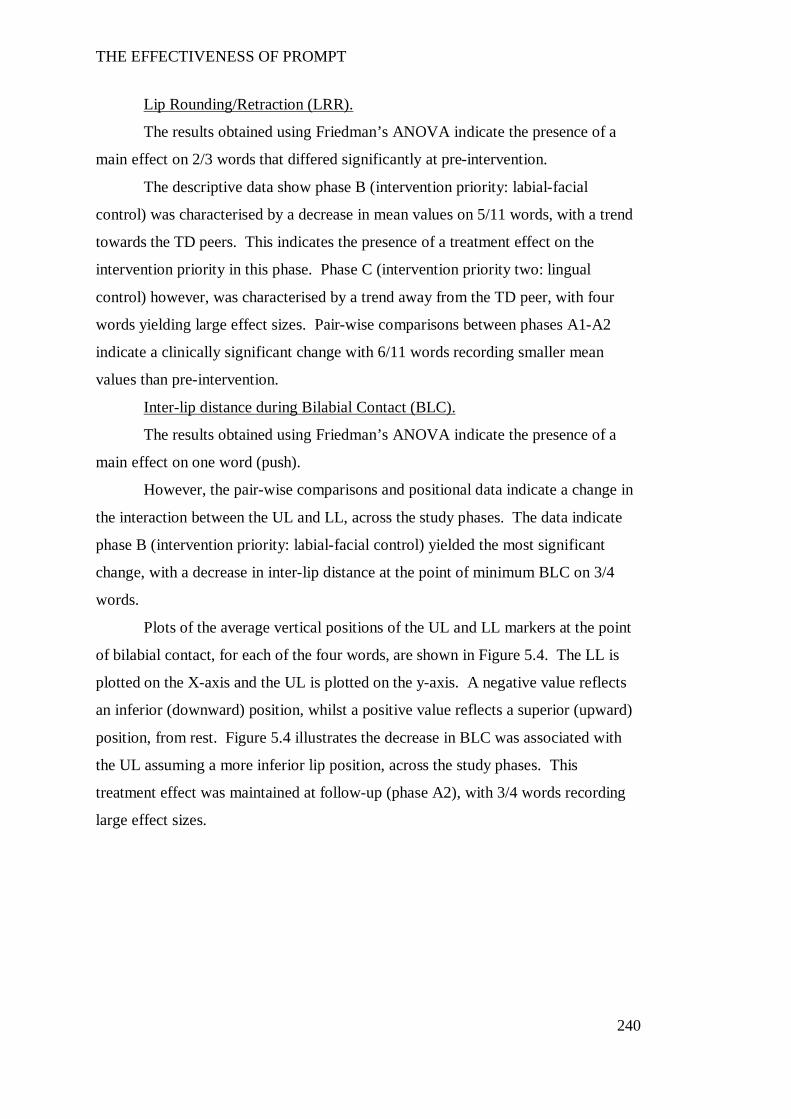
THE EFFECTIVENESS OF PROMPT
240
Lip Rounding/Retraction (LRR).
The results obtained using Friedman’s ANOVA indicate the presence of a
main effect on 2/3 words that differed significantly at pre-intervention.
The descriptive data show phase B (intervention priority: labial-facial
control) was characterised by a decrease in mean values on 5/11 words, with a trend
towards the TD peers. This indicates the presence of a treatment effect on the
intervention priority in this phase. Phase C (intervention priority two: lingual
control) however, was characterised by a trend away from the TD peer, with four
words yielding large effect sizes. Pair-wise comparisons between phases A1-A2
indicate a clinically significant change with 6/11 words recording smaller mean
values than pre-intervention.
Inter-lip distance during Bilabial Contact (BLC).
The results obtained using Friedman’s ANOVA indicate the presence of a
main effect on one word (push).
However, the pair-wise comparisons and positional data indicate a change in
the interaction between the UL and LL, across the study phases. The data indicate
phase B (intervention priority: labial-facial control) yielded the most significant
change, with a decrease in inter-lip distance at the point of minimum BLC on 3/4
words.
Plots of the average vertical positions of the UL and LL markers at the point
of bilabial contact, for each of the four words, are shown in Figure 5.4. The LL is
plotted on the X-axis and the UL is plotted on the y-axis. A negative value reflects
an inferior (downward) position, whilst a positive value reflects a superior (upward)
position, from rest. Figure 5.4 illustrates the decrease in BLC was associated with
the UL assuming a more inferior lip position, across the study phases. This
treatment effect was maintained at follow-up (phase A2), with 3/4 words recording
large effect sizes.
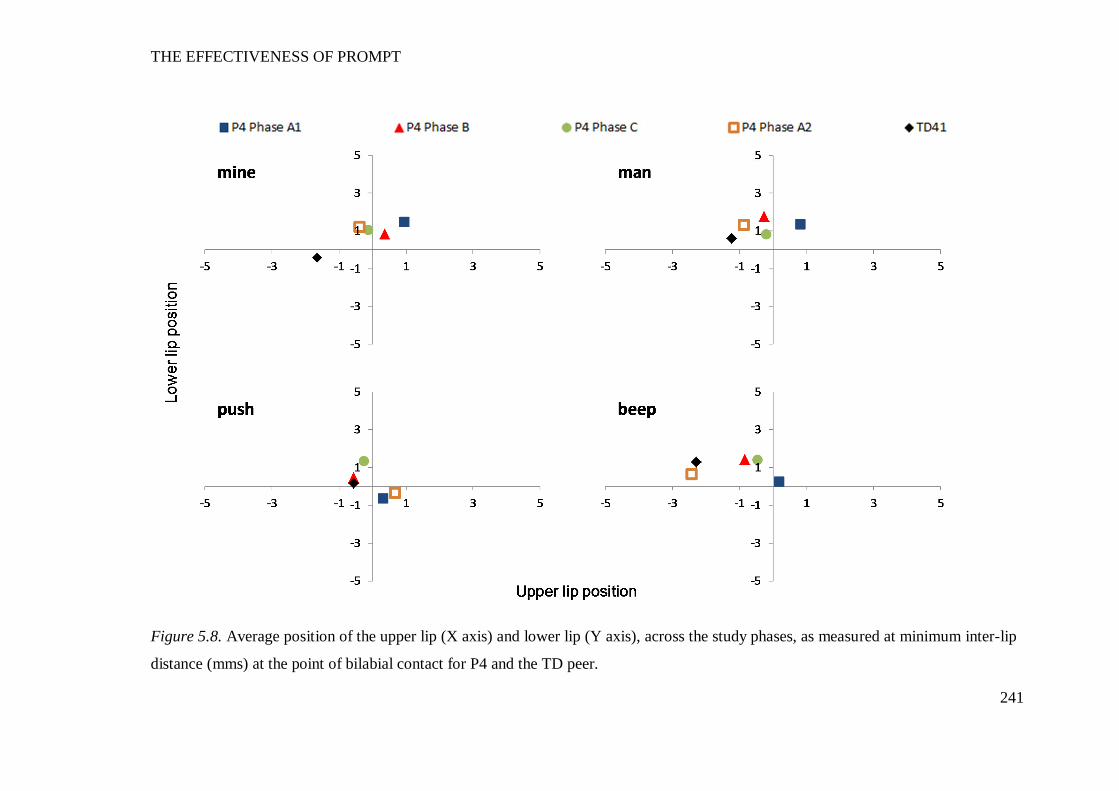
THE EFFECTIVENESS OF PROMPT
241
Figure 5.8. Average position of the upper lip (X axis) and lower lip (Y axis), across the study phases, as measured at minimum inter-lip
distance (mms) at the point of bilabial contact for P4 and the TD peer.
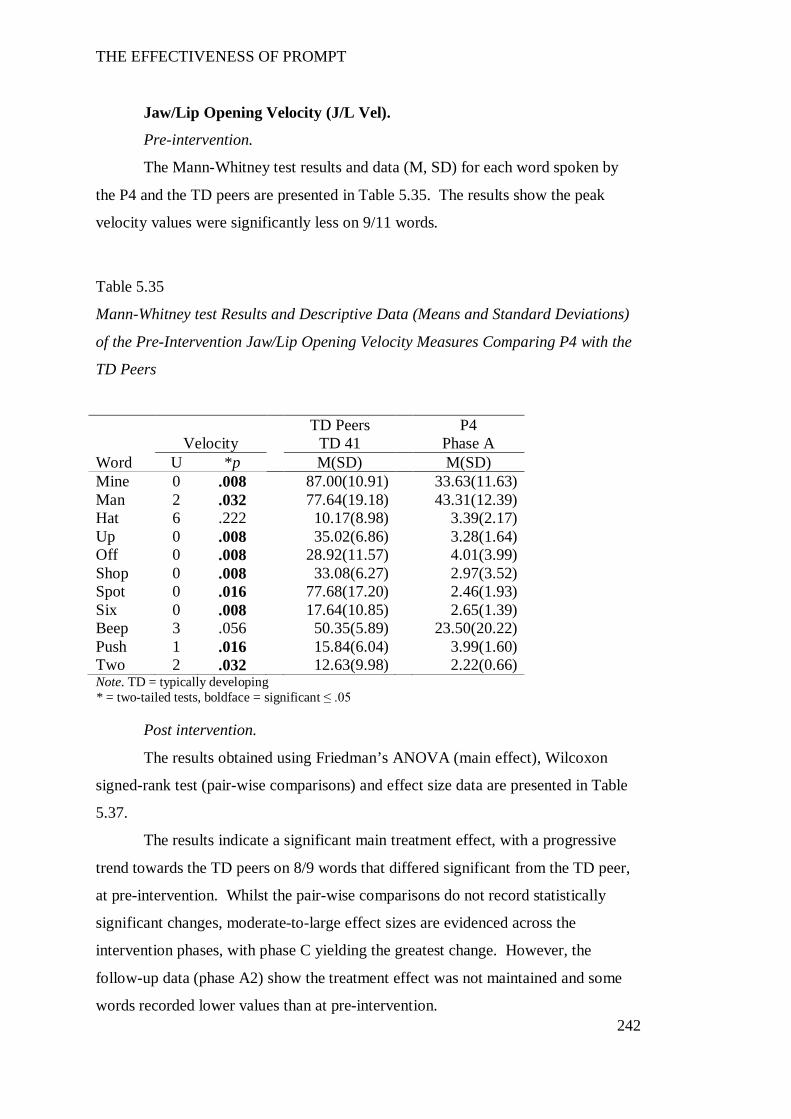
THE EFFECTIVENESS OF PROMPT
242
Jaw/Lip Opening Velocity (J/L Vel).
Pre-intervention.
The Mann-Whitney test results and data (M, SD) for each word spoken by
the P4 and the TD peers are presented in Table 5.35. The results show the peak
velocity values were significantly less on 9/11 words.
Table 5.35
Mann-Whitney test Results and Descriptive Data (Means and Standard Deviations)
of the Pre-Intervention Jaw/Lip Opening Velocity Measures Comparing P4 with the
TD Peers
TD Peers P4 Velocity TD 41 Phase A
Word U *p M(SD) M(SD) Mine 0 .008 87.00(10.91) 33.63(11.63) Man 2 .032 77.64(19.18) 43.31(12.39) Hat 6 .222 10.17(8.98) 3.39(2.17) Up 0 .008 35.02(6.86) 3.28(1.64) Off 0 .008 28.92(11.57) 4.01(3.99) Shop 0 .008 33.08(6.27) 2.97(3.52) Spot 0 .016 77.68(17.20) 2.46(1.93) Six 0 .008 17.64(10.85) 2.65(1.39) Beep 3 .056 50.35(5.89) 23.50(20.22) Push 1 .016 15.84(6.04) 3.99(1.60) Two 2 .032 12.63(9.98) 2.22(0.66) Note. TD = typically developing * = two-tailed tests, boldface = significant ≤ .05
Post intervention.
The results obtained using Friedman’s ANOVA (main effect), Wilcoxon
signed-rank test (pair-wise comparisons) and effect size data are presented in Table
5.37.
The results indicate a significant main treatment effect, with a progressive
trend towards the TD peers on 8/9 words that differed significant from the TD peer,
at pre-intervention. Whilst the pair-wise comparisons do not record statistically
significant changes, moderate-to-large effect sizes are evidenced across the
intervention phases, with phase C yielding the greatest change. However, the
follow-up data (phase A2) show the treatment effect was not maintained and some
words recorded lower values than at pre-intervention.
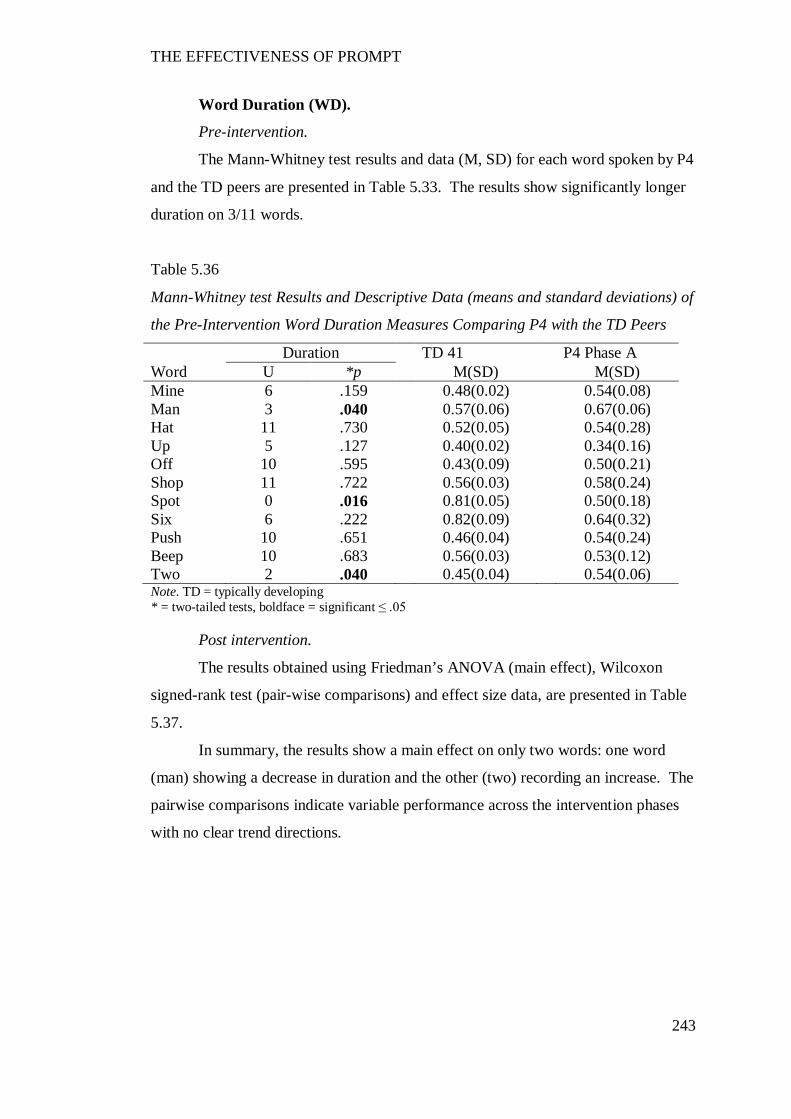
THE EFFECTIVENESS OF PROMPT
243
Word Duration (WD).
Pre-intervention.
The Mann-Whitney test results and data (M, SD) for each word spoken by P4
and the TD peers are presented in Table 5.33. The results show significantly longer
duration on 3/11 words.
Table 5.36
Mann-Whitney test Results and Descriptive Data (means and standard deviations) of
the Pre-Intervention Word Duration Measures Comparing P4 with the TD Peers
Duration TD 41 P4 Phase A Word U *p M(SD) M(SD) Mine 6 .159 0.48(0.02) 0.54(0.08) Man 3 .040 0.57(0.06) 0.67(0.06) Hat 11 .730 0.52(0.05) 0.54(0.28) Up 5 .127 0.40(0.02) 0.34(0.16) Off 10 .595 0.43(0.09) 0.50(0.21) Shop 11 .722 0.56(0.03) 0.58(0.24) Spot 0 .016 0.81(0.05) 0.50(0.18) Six 6 .222 0.82(0.09) 0.64(0.32) Push 10 .651 0.46(0.04) 0.54(0.24) Beep 10 .683 0.56(0.03) 0.53(0.12) Two 2 .040 0.45(0.04) 0.54(0.06) Note. TD = typically developing * = two-tailed tests, boldface = significant ≤ .05
Post intervention.
The results obtained using Friedman’s ANOVA (main effect), Wilcoxon
signed-rank test (pair-wise comparisons) and effect size data, are presented in Table
5.37.
In summary, the results show a main effect on only two words: one word
(man) showing a decrease in duration and the other (two) recording an increase. The
pairwise comparisons indicate variable performance across the intervention phases
with no clear trend directions.
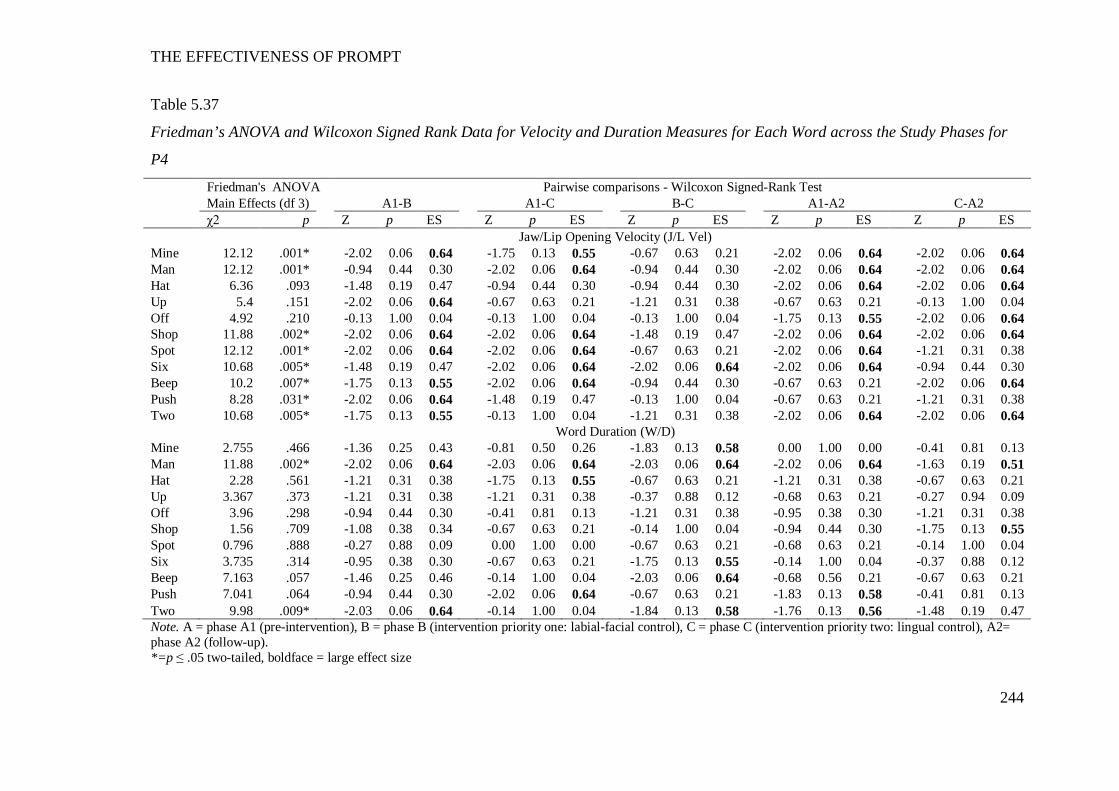
THE EFFECTIVENESS OF PROMPT
244
Table 5.37
Friedman’s ANOVA and Wilcoxon Signed Rank Data for Velocity and Duration Measures for Each Word across the Study Phases for
P4
Friedman's ANOVA Pairwise comparisons - Wilcoxon Signed-Rank Test Main Effects (df 3) A1-B A1-C B-C A1-A2 C-A2 χ2 p Z p ES Z p ES Z p ES Z p ES Z p ES Jaw/Lip Opening Velocity (J/L Vel) Mine 12.12 .001* -2.02 0.06 0.64 -1.75 0.13 0.55 -0.67 0.63 0.21 -2.02 0.06 0.64 -2.02 0.06 0.64 Man 12.12 .001* -0.94 0.44 0.30 -2.02 0.06 0.64 -0.94 0.44 0.30 -2.02 0.06 0.64 -2.02 0.06 0.64 Hat 6.36 .093 -1.48 0.19 0.47 -0.94 0.44 0.30 -0.94 0.44 0.30 -2.02 0.06 0.64 -2.02 0.06 0.64 Up 5.4 .151 -2.02 0.06 0.64 -0.67 0.63 0.21 -1.21 0.31 0.38 -0.67 0.63 0.21 -0.13 1.00 0.04 Off 4.92 .210 -0.13 1.00 0.04 -0.13 1.00 0.04 -0.13 1.00 0.04 -1.75 0.13 0.55 -2.02 0.06 0.64 Shop 11.88 .002* -2.02 0.06 0.64 -2.02 0.06 0.64 -1.48 0.19 0.47 -2.02 0.06 0.64 -2.02 0.06 0.64 Spot 12.12 .001* -2.02 0.06 0.64 -2.02 0.06 0.64 -0.67 0.63 0.21 -2.02 0.06 0.64 -1.21 0.31 0.38 Six 10.68 .005* -1.48 0.19 0.47 -2.02 0.06 0.64 -2.02 0.06 0.64 -2.02 0.06 0.64 -0.94 0.44 0.30 Beep 10.2 .007* -1.75 0.13 0.55 -2.02 0.06 0.64 -0.94 0.44 0.30 -0.67 0.63 0.21 -2.02 0.06 0.64 Push 8.28 .031* -2.02 0.06 0.64 -1.48 0.19 0.47 -0.13 1.00 0.04 -0.67 0.63 0.21 -1.21 0.31 0.38 Two 10.68 .005* -1.75 0.13 0.55 -0.13 1.00 0.04 -1.21 0.31 0.38 -2.02 0.06 0.64 -2.02 0.06 0.64
Word Duration (W/D) Mine 2.755 .466 -1.36 0.25 0.43 -0.81 0.50 0.26 -1.83 0.13 0.58 0.00 1.00 0.00 -0.41 0.81 0.13 Man 11.88 .002* -2.02 0.06 0.64 -2.03 0.06 0.64 -2.03 0.06 0.64 -2.02 0.06 0.64 -1.63 0.19 0.51 Hat 2.28 .561 -1.21 0.31 0.38 -1.75 0.13 0.55 -0.67 0.63 0.21 -1.21 0.31 0.38 -0.67 0.63 0.21 Up 3.367 .373 -1.21 0.31 0.38 -1.21 0.31 0.38 -0.37 0.88 0.12 -0.68 0.63 0.21 -0.27 0.94 0.09 Off 3.96 .298 -0.94 0.44 0.30 -0.41 0.81 0.13 -1.21 0.31 0.38 -0.95 0.38 0.30 -1.21 0.31 0.38 Shop 1.56 .709 -1.08 0.38 0.34 -0.67 0.63 0.21 -0.14 1.00 0.04 -0.94 0.44 0.30 -1.75 0.13 0.55 Spot 0.796 .888 -0.27 0.88 0.09 0.00 1.00 0.00 -0.67 0.63 0.21 -0.68 0.63 0.21 -0.14 1.00 0.04 Six 3.735 .314 -0.95 0.38 0.30 -0.67 0.63 0.21 -1.75 0.13 0.55 -0.14 1.00 0.04 -0.37 0.88 0.12 Beep 7.163 .057 -1.46 0.25 0.46 -0.14 1.00 0.04 -2.03 0.06 0.64 -0.68 0.56 0.21 -0.67 0.63 0.21 Push 7.041 .064 -0.94 0.44 0.30 -2.02 0.06 0.64 -0.67 0.63 0.21 -1.83 0.13 0.58 -0.41 0.81 0.13 Two 9.98 .009* -2.03 0.06 0.64 -0.14 1.00 0.04 -1.84 0.13 0.58 -1.76 0.13 0.56 -1.48 0.19 0.47 Note. A = phase A1 (pre-intervention), B = phase B (intervention priority one: labial-facial control), C = phase C (intervention priority two: lingual control), A2= phase A2 (follow-up). *=p ≤ .05 two-tailed, boldface = large effect size
THE EFFECTIVENESS OF PROMPT
245
Overall summary of P4’s kinematic measures.
Subsequent to the PROMPT intervention, the following changes were evident
across the study phases:
Phase B - A significant increase in JOD and velocity across all word-sets, and
a decrease in LRR and BLC values characterised this intervention phase. These data
indicate a trend towards the TD peers, and the presence of a positive treatment effect
on the intervention priorities.
Phase C – The JOD values and velocity continued to increase this phase, with
a continued trend towards the TD peers. However, an increase in LRR values
indicated a trend away from the TD peers, on this measure.
Phase A2 – Data indicate a return to decreasing LRR values and maintenance
of the treatment effect on JOD.
The above results indicate P4’s intervention program was successful in
producing changes to the motor-speech movement patterns under investigation.
Participant 5
The following motor-speech movement patterns were targeted during the
phases of the PROMPT Intervention:
Phase B: (Intervention priority one: mandibular control) – Increase range of
movement at jaw height positions 3 and 4 (word-set one), increase the distance
between the four jaw height positions, improve midline control (i.e., decrease lateral
movement from midline), increase duration.
Phase C: (Intervention priority two: labial-facial control) – Facilitate
appropriate neutral and rounded lip movements (inhibit excessive retraction); and
independent use of lips (as opposed to through jaw motion) to make bilabial contact.
Table 5.35 summarises the words that recorded significant impairment of the
jaw and lip measures for P5 as compared with the TD peers pre-intervention; and
significant changes post-intervention for these words. Results are based on 5
repetitions of each word, with exceptions in phase C and A2 as detailed as follows:
Phase C required the elicitation of 6 full trials3 to obtain 5 repetitions of each word.
3 One full trial = uninterrupted repetition of the 11 words.
THE EFFECTIVENESS OF PROMPT
246
Trial 3 was removed due to shouting and excessive movement resulting in missing
markers. Further, analysis of the word ‘man’ is based on 4 repetitions only. One
repetition was removed due to production varying substantially from all other
productions (that is, 2/3 phonemes differed from previous productions). In phase
A2, analysis of the word ‘shop’ and ‘push’ are based on 4 repetitions due to a yawn
at the end of the word and excessive movement, respectively resulting in missing
markers.
In addition, analysis of the word ‘shop’ for TD 53 is based on 3 repetitions
due to incorrect pronunciation that differed from the TD peers.
The distance data (Appendix M) at pre-intervention show a predominant
pattern of decreased path distance (JPD). The jaw open distance (JOD) was also
reduced with limited difference in values across the four jaw height positions. In
contrast, deviation from midline (JLDM) and lip rounding/retraction (LRR) values
were increased, in comparison to the TD peers. Data also shows a lower peak
velocity and shorter mean duration. The post-intervention data show a positive
treatment effect with changes to the measures of JOD in phase B and LRR in phase
C reflective of the intervention priorities.
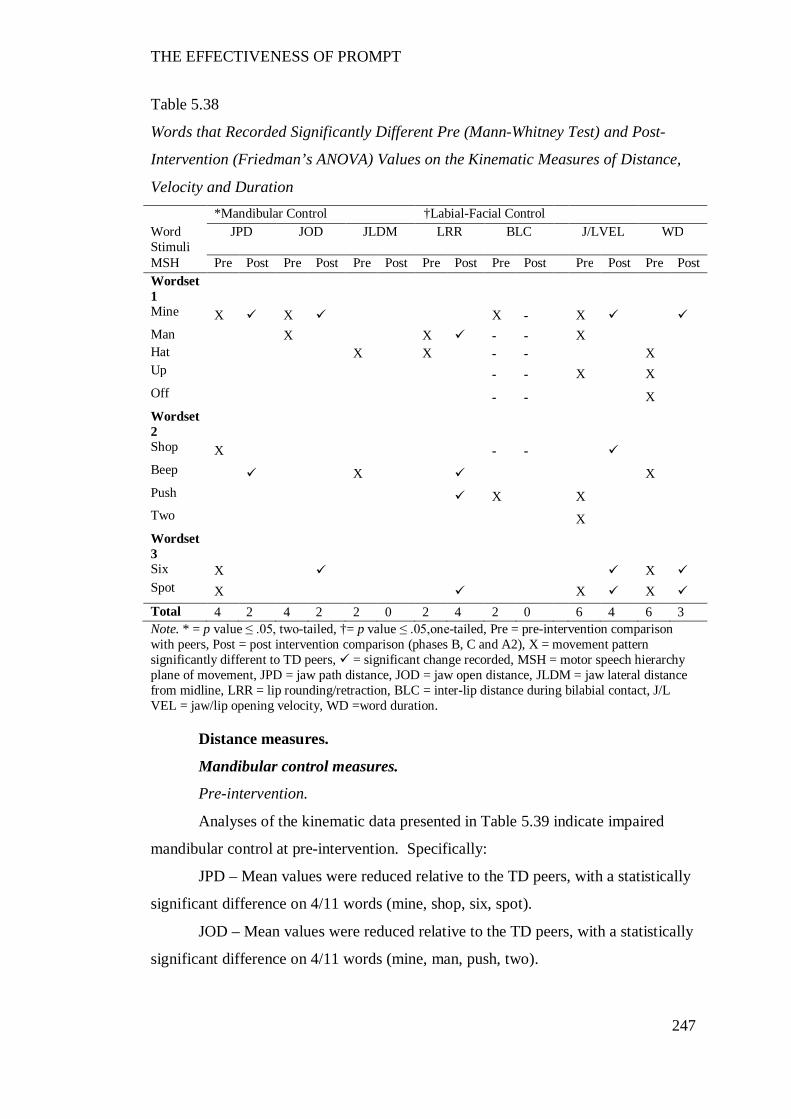
THE EFFECTIVENESS OF PROMPT
247
Table 5.38
Words that Recorded Significantly Different Pre (Mann-Whitney Test) and Post-
Intervention (Friedman’s ANOVA) Values on the Kinematic Measures of Distance,
Velocity and Duration *Mandibular Control †Labial-Facial Control Word Stimuli
JPD JOD JLDM LRR BLC J/LVEL WD
MSH Pre Post Pre Post Pre Post Pre Post Pre Post Pre Post Pre Post Wordset 1
Mine X X X - X Man X X - - X Hat X X - - X Up - - X X Off - - X Wordset 2
Shop X - - Beep X X Push X X Two X Wordset 3
Six X X Spot X X X Total 4 2 4 2 2 0 2 4 2 0 6 4 6 3 Note. * = p value ≤ .05, two-tailed, †= p value ≤ .05,one-tailed, Pre = pre-intervention comparison with peers, Post = post intervention comparison (phases B, C and A2), X = movement pattern significantly different to TD peers, = significant change recorded, MSH = motor speech hierarchy plane of movement, JPD = jaw path distance, JOD = jaw open distance, JLDM = jaw lateral distance from midline, LRR = lip rounding/retraction, BLC = inter-lip distance during bilabial contact, J/L VEL = jaw/lip opening velocity, WD =word duration.
Distance measures.
Mandibular control measures.
Pre-intervention.
Analyses of the kinematic data presented in Table 5.39 indicate impaired
mandibular control at pre-intervention. Specifically:
JPD – Mean values were reduced relative to the TD peers, with a statistically
significant difference on 4/11 words (mine, shop, six, spot).
JOD – Mean values were reduced relative to the TD peers, with a statistically
significant difference on 4/11 words (mine, man, push, two).
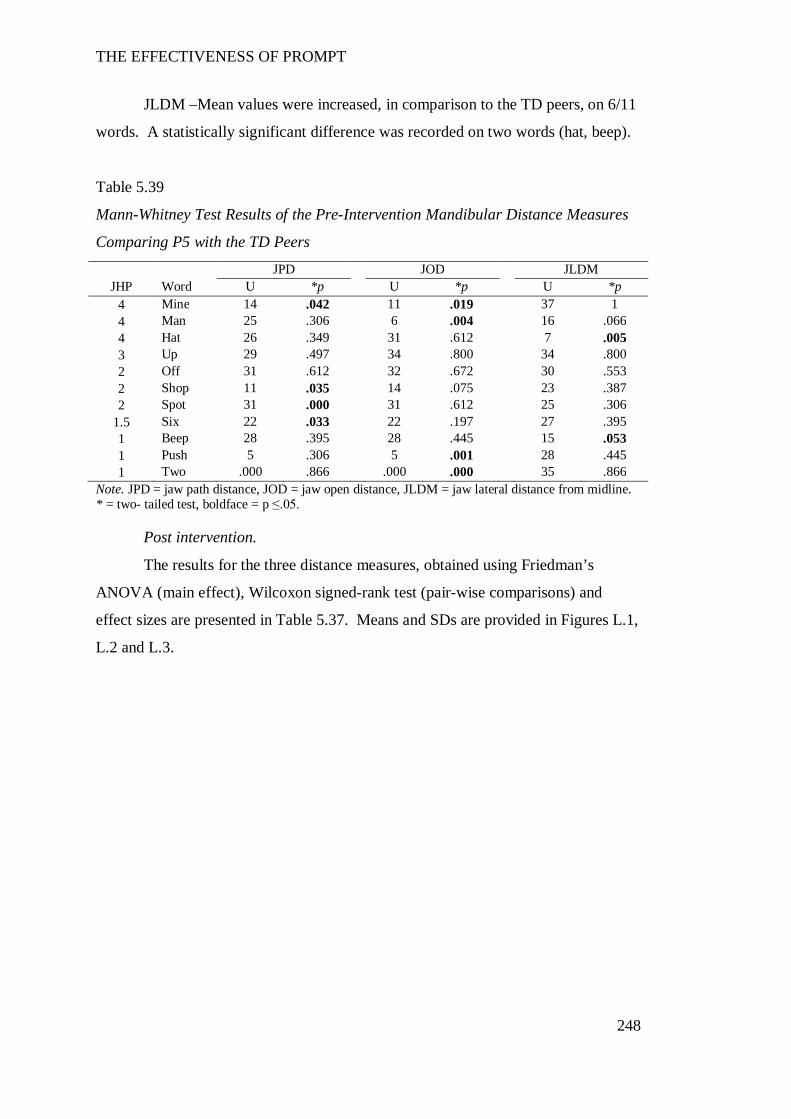
THE EFFECTIVENESS OF PROMPT
248
JLDM –Mean values were increased, in comparison to the TD peers, on 6/11
words. A statistically significant difference was recorded on two words (hat, beep).
Table 5.39
Mann-Whitney Test Results of the Pre-Intervention Mandibular Distance Measures
Comparing P5 with the TD Peers
Note. JPD = jaw path distance, JOD = jaw open distance, JLDM = jaw lateral distance from midline. * = two- tailed test, boldface = p ≤.05.
Post intervention.
The results for the three distance measures, obtained using Friedman’s
ANOVA (main effect), Wilcoxon signed-rank test (pair-wise comparisons) and
effect sizes are presented in Table 5.37. Means and SDs are provided in Figures L.1,
L.2 and L.3.
JPD JOD JLDM JHP Word U *p U *p U *p
4 Mine 14 .042 11 .019 37 1 4 Man 25 .306 6 .004 16 .066 4 Hat 26 .349 31 .612 7 .005 3 Up 29 .497 34 .800 34 .800 2 Off 31 .612 32 .672 30 .553 2 Shop 11 .035 14 .075 23 .387 2 Spot 31 .000 31 .612 25 .306
1.5 Six 22 .033 22 .197 27 .395 1 Beep 28 .395 28 .445 15 .053 1 Push 5 .306 5 .001 28 .445 1 Two .000 .866 .000 .000 35 .866
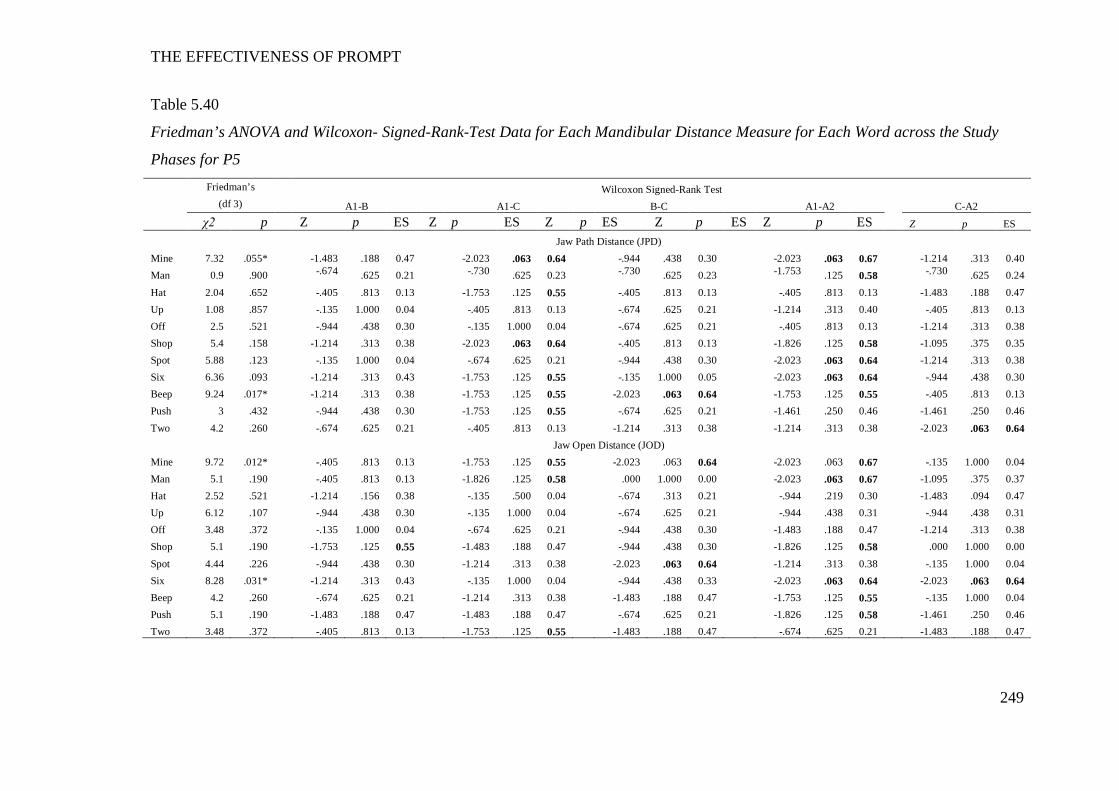
THE EFFECTIVENESS OF PROMPT
249
Table 5.40
Friedman’s ANOVA and Wilcoxon- Signed-Rank-Test Data for Each Mandibular Distance Measure for Each Word across the Study
Phases for P5
Friedman’s Wilcoxon Signed-Rank Test (df 3) A1-B A1-C B-C A1-A2 C-A2
χ2 p Z p ES Z p ES Z p ES Z p ES Z p ES Z p ES
Jaw Path Distance (JPD) Mine 7.32 .055* -1.483 .188 0.47 -2.023 .063 0.64 -.944 .438 0.30 -2.023 .063 0.67 -1.214 .313 0.40 Man 0.9 .900 -.674 .625 0.21 -.730 .625 0.23 -.730 .625 0.23 -1.753 .125 0.58 -.730 .625 0.24 Hat 2.04 .652 -.405 .813 0.13 -1.753 .125 0.55 -.405 .813 0.13 -.405 .813 0.13 -1.483 .188 0.47 Up 1.08 .857 -.135 1.000 0.04 -.405 .813 0.13 -.674 .625 0.21 -1.214 .313 0.40 -.405 .813 0.13 Off 2.5 .521 -.944 .438 0.30 -.135 1.000 0.04 -.674 .625 0.21 -.405 .813 0.13 -1.214 .313 0.38 Shop 5.4 .158 -1.214 .313 0.38 -2.023 .063 0.64 -.405 .813 0.13 -1.826 .125 0.58 -1.095 .375 0.35 Spot 5.88 .123 -.135 1.000 0.04 -.674 .625 0.21 -.944 .438 0.30 -2.023 .063 0.64 -1.214 .313 0.38 Six 6.36 .093 -1.214 .313 0.43 -1.753 .125 0.55 -.135 1.000 0.05 -2.023 .063 0.64 -.944 .438 0.30 Beep 9.24 .017* -1.214 .313 0.38 -1.753 .125 0.55 -2.023 .063 0.64 -1.753 .125 0.55 -.405 .813 0.13 Push 3 .432 -.944 .438 0.30 -1.753 .125 0.55 -.674 .625 0.21 -1.461 .250 0.46 -1.461 .250 0.46 Two 4.2 .260 -.674 .625 0.21 -.405 .813 0.13 -1.214 .313 0.38 -1.214 .313 0.38 -2.023 .063 0.64 Jaw Open Distance (JOD) Mine 9.72 .012* -.405 .813 0.13 -1.753 .125 0.55 -2.023 .063 0.64 -2.023 .063 0.67 -.135 1.000 0.04 Man 5.1 .190 -.405 .813 0.13 -1.826 .125 0.58 .000 1.000 0.00 -2.023 .063 0.67 -1.095 .375 0.37 Hat 2.52 .521 -1.214 .156 0.38 -.135 .500 0.04 -.674 .313 0.21 -.944 .219 0.30 -1.483 .094 0.47 Up 6.12 .107 -.944 .438 0.30 -.135 1.000 0.04 -.674 .625 0.21 -.944 .438 0.31 -.944 .438 0.31 Off 3.48 .372 -.135 1.000 0.04 -.674 .625 0.21 -.944 .438 0.30 -1.483 .188 0.47 -1.214 .313 0.38 Shop 5.1 .190 -1.753 .125 0.55 -1.483 .188 0.47 -.944 .438 0.30 -1.826 .125 0.58 .000 1.000 0.00 Spot 4.44 .226 -.944 .438 0.30 -1.214 .313 0.38 -2.023 .063 0.64 -1.214 .313 0.38 -.135 1.000 0.04 Six 8.28 .031* -1.214 .313 0.43 -.135 1.000 0.04 -.944 .438 0.33 -2.023 .063 0.64 -2.023 .063 0.64 Beep 4.2 .260 -.674 .625 0.21 -1.214 .313 0.38 -1.483 .188 0.47 -1.753 .125 0.55 -.135 1.000 0.04 Push 5.1 .190 -1.483 .188 0.47 -1.483 .188 0.47 -.674 .625 0.21 -1.826 .125 0.58 -1.461 .250 0.46 Two 3.48 .372 -.405 .813 0.13 -1.753 .125 0.55 -1.483 .188 0.47 -.674 .625 0.21 -1.483 .188 0.47
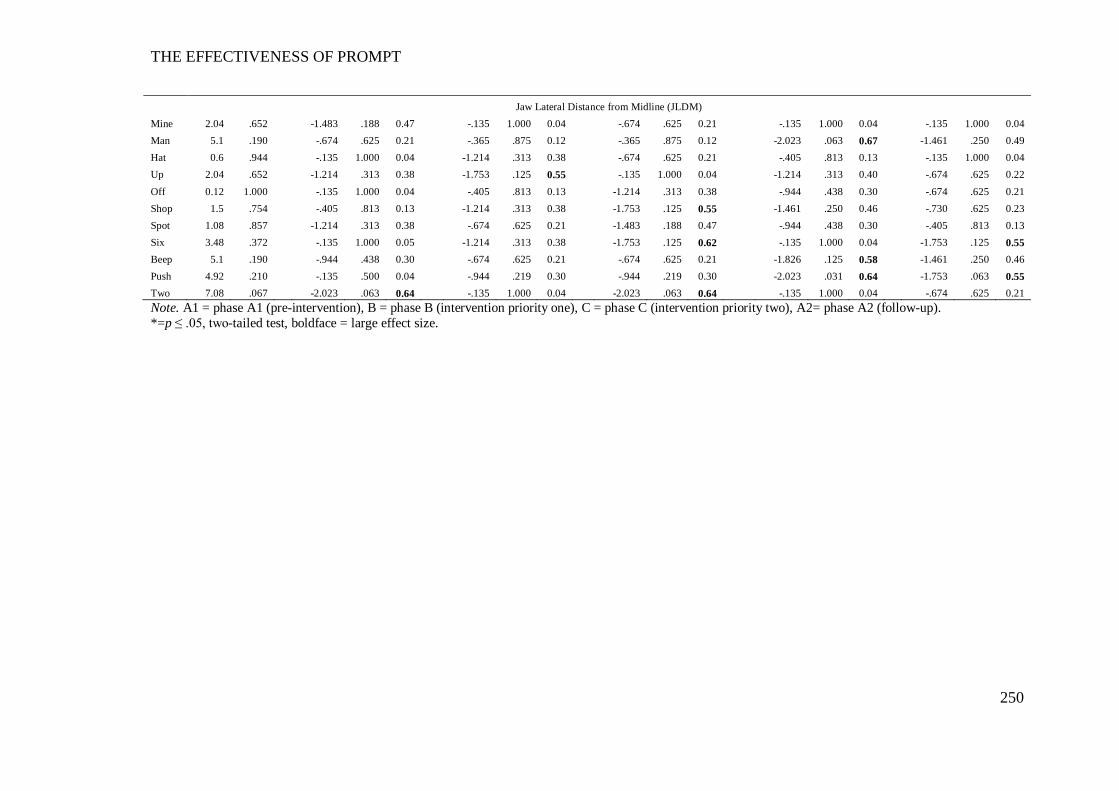
THE EFFECTIVENESS OF PROMPT
250
Jaw Lateral Distance from Midline (JLDM) Mine 2.04 .652 -1.483 .188 0.47 -.135 1.000 0.04 -.674 .625 0.21 -.135 1.000 0.04 -.135 1.000 0.04 Man 5.1 .190 -.674 .625 0.21 -.365 .875 0.12 -.365 .875 0.12 -2.023 .063 0.67 -1.461 .250 0.49 Hat 0.6 .944 -.135 1.000 0.04 -1.214 .313 0.38 -.674 .625 0.21 -.405 .813 0.13 -.135 1.000 0.04 Up 2.04 .652 -1.214 .313 0.38 -1.753 .125 0.55 -.135 1.000 0.04 -1.214 .313 0.40 -.674 .625 0.22 Off 0.12 1.000 -.135 1.000 0.04 -.405 .813 0.13 -1.214 .313 0.38 -.944 .438 0.30 -.674 .625 0.21 Shop 1.5 .754 -.405 .813 0.13 -1.214 .313 0.38 -1.753 .125 0.55 -1.461 .250 0.46 -.730 .625 0.23 Spot 1.08 .857 -1.214 .313 0.38 -.674 .625 0.21 -1.483 .188 0.47 -.944 .438 0.30 -.405 .813 0.13 Six 3.48 .372 -.135 1.000 0.05 -1.214 .313 0.38 -1.753 .125 0.62 -.135 1.000 0.04 -1.753 .125 0.55 Beep 5.1 .190 -.944 .438 0.30 -.674 .625 0.21 -.674 .625 0.21 -1.826 .125 0.58 -1.461 .250 0.46 Push 4.92 .210 -.135 .500 0.04 -.944 .219 0.30 -.944 .219 0.30 -2.023 .031 0.64 -1.753 .063 0.55 Two 7.08 .067 -2.023 .063 0.64 -.135 1.000 0.04 -2.023 .063 0.64 -.135 1.000 0.04 -.674 .625 0.21 Note. A1 = phase A1 (pre-intervention), B = phase B (intervention priority one), C = phase C (intervention priority two), A2= phase A2 (follow-up). *=p ≤ .05, two-tailed test, boldface = large effect size.
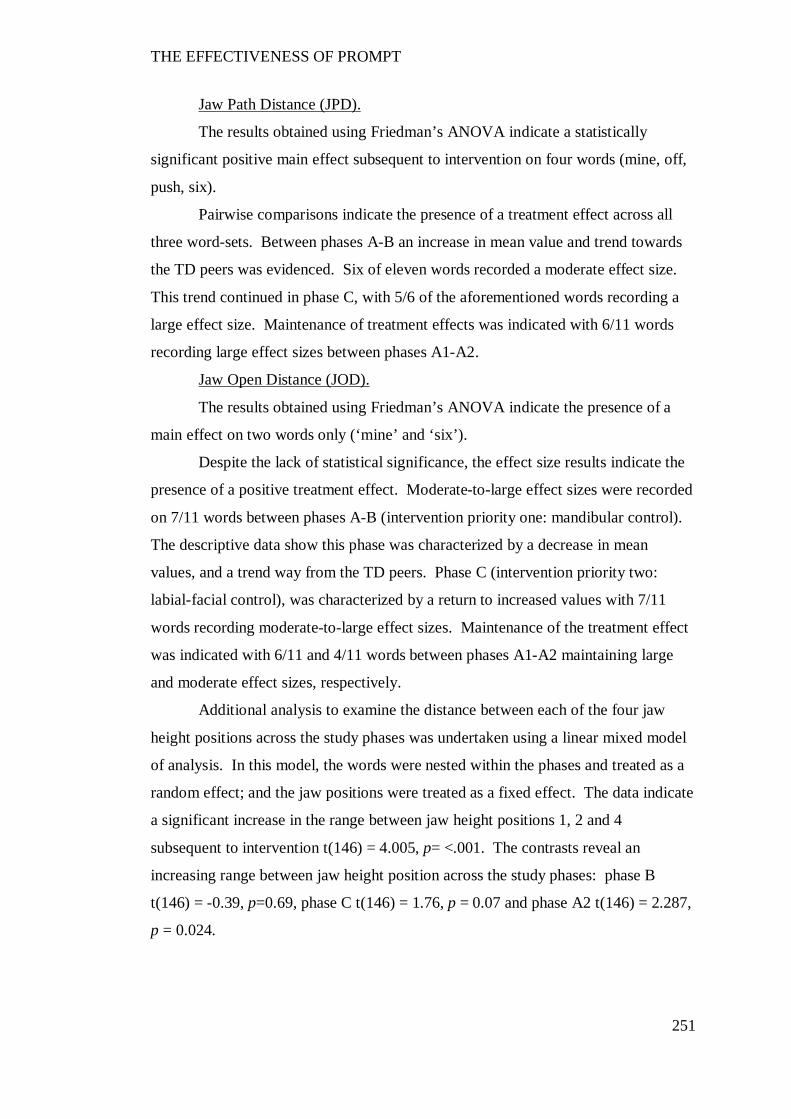
THE EFFECTIVENESS OF PROMPT
251
Jaw Path Distance (JPD).
The results obtained using Friedman’s ANOVA indicate a statistically
significant positive main effect subsequent to intervention on four words (mine, off,
push, six).
Pairwise comparisons indicate the presence of a treatment effect across all
three word-sets. Between phases A-B an increase in mean value and trend towards
the TD peers was evidenced. Six of eleven words recorded a moderate effect size.
This trend continued in phase C, with 5/6 of the aforementioned words recording a
large effect size. Maintenance of treatment effects was indicated with 6/11 words
recording large effect sizes between phases A1-A2.
Jaw Open Distance (JOD).
The results obtained using Friedman’s ANOVA indicate the presence of a
main effect on two words only (‘mine’ and ‘six’).
Despite the lack of statistical significance, the effect size results indicate the
presence of a positive treatment effect. Moderate-to-large effect sizes were recorded
on 7/11 words between phases A-B (intervention priority one: mandibular control).
The descriptive data show this phase was characterized by a decrease in mean
values, and a trend way from the TD peers. Phase C (intervention priority two:
labial-facial control), was characterized by a return to increased values with 7/11
words recording moderate-to-large effect sizes. Maintenance of the treatment effect
was indicated with 6/11 and 4/11 words between phases A1-A2 maintaining large
and moderate effect sizes, respectively.
Additional analysis to examine the distance between each of the four jaw
height positions across the study phases was undertaken using a linear mixed model
of analysis. In this model, the words were nested within the phases and treated as a
random effect; and the jaw positions were treated as a fixed effect. The data indicate
a significant increase in the range between jaw height positions 1, 2 and 4
subsequent to intervention t(146) = 4.005, p= <.001. The contrasts reveal an
increasing range between jaw height position across the study phases: phase B
t(146) = -0.39, p=0.69, phase C t(146) = 1.76, p = 0.07 and phase A2 t(146) = 2.287,
p = 0.024.
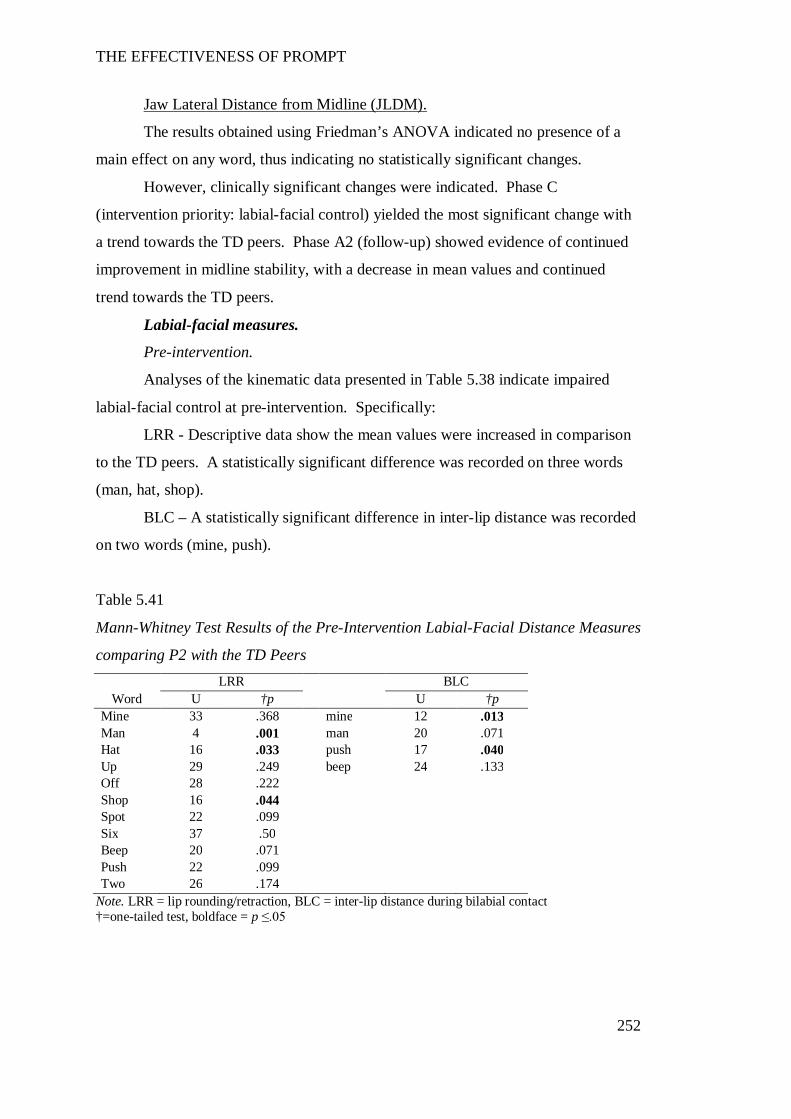
THE EFFECTIVENESS OF PROMPT
252
Jaw Lateral Distance from Midline (JLDM).
The results obtained using Friedman’s ANOVA indicated no presence of a
main effect on any word, thus indicating no statistically significant changes.
However, clinically significant changes were indicated. Phase C
(intervention priority: labial-facial control) yielded the most significant change with
a trend towards the TD peers. Phase A2 (follow-up) showed evidence of continued
improvement in midline stability, with a decrease in mean values and continued
trend towards the TD peers.
Labial-facial measures.
Pre-intervention.
Analyses of the kinematic data presented in Table 5.38 indicate impaired
labial-facial control at pre-intervention. Specifically:
LRR - Descriptive data show the mean values were increased in comparison
to the TD peers. A statistically significant difference was recorded on three words
(man, hat, shop).
BLC – A statistically significant difference in inter-lip distance was recorded
on two words (mine, push).
Table 5.41
Mann-Whitney Test Results of the Pre-Intervention Labial-Facial Distance Measures
comparing P2 with the TD Peers LRR BLC
Word U †p U †p Mine 33 .368 mine 12 .013 Man 4 .001 man 20 .071 Hat 16 .033 push 17 .040 Up 29 .249 beep 24 .133 Off 28 .222 Shop 16 .044 Spot 22 .099 Six 37 .50 Beep 20 .071 Push 22 .099 Two 26 .174
Note. LRR = lip rounding/retraction, BLC = inter-lip distance during bilabial contact †=one-tailed test, boldface = p ≤.05

THE EFFECTIVENESS OF PROMPT
253
Post intervention.
The results obtained using Friedman’s ANOVA (main effect), Wilcoxon
signed-rank test (pair-wise comparisons) and effect size data, for the two distance
measures are presented in Table 5.39. In summary, these results (supported by the
descriptive data figures L.4 and L.5) indicate the presence of a treatment effect on
the labial-facial measures.
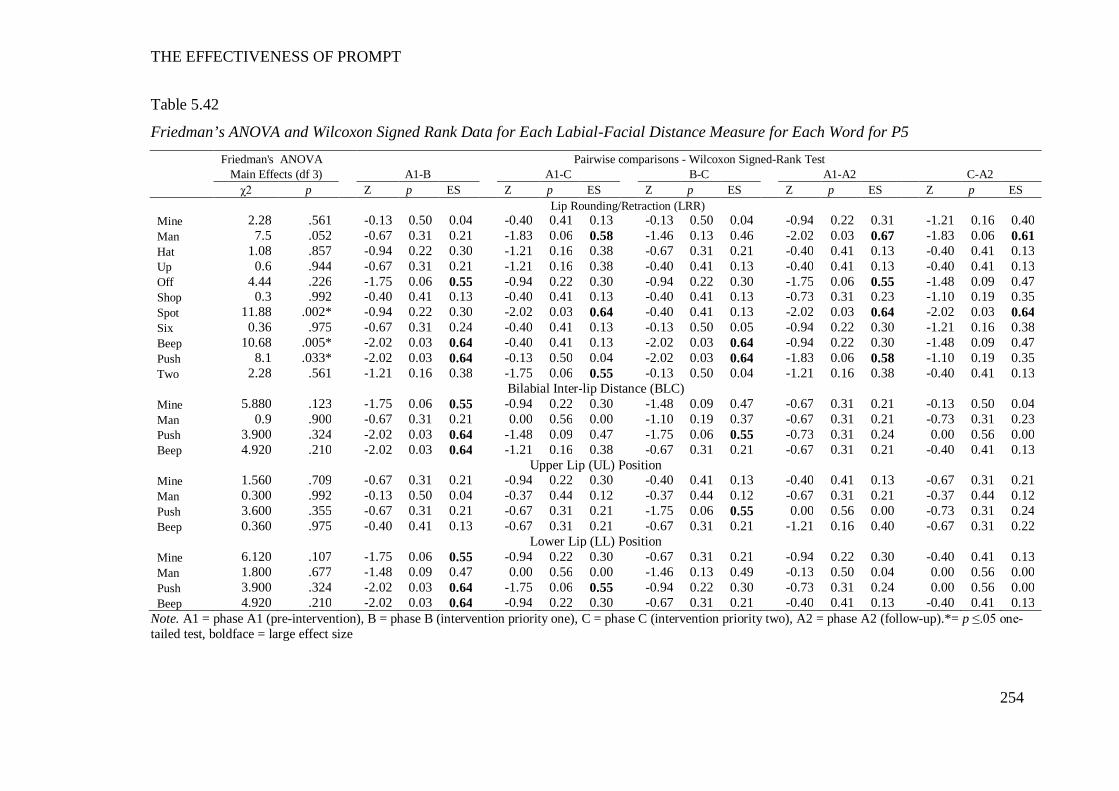
THE EFFECTIVENESS OF PROMPT
254
Table 5.42
Friedman’s ANOVA and Wilcoxon Signed Rank Data for Each Labial-Facial Distance Measure for Each Word for P5 Friedman's ANOVA Pairwise comparisons - Wilcoxon Signed-Rank Test Main Effects (df 3) A1-B A1-C B-C A1-A2 C-A2 χ2 p Z p ES Z p ES Z p ES Z p ES Z p ES Lip Rounding/Retraction (LRR) Mine 2.28 .561 -0.13 0.50 0.04 -0.40 0.41 0.13 -0.13 0.50 0.04 -0.94 0.22 0.31 -1.21 0.16 0.40 Man 7.5 .052 -0.67 0.31 0.21 -1.83 0.06 0.58 -1.46 0.13 0.46 -2.02 0.03 0.67 -1.83 0.06 0.61 Hat 1.08 .857 -0.94 0.22 0.30 -1.21 0.16 0.38 -0.67 0.31 0.21 -0.40 0.41 0.13 -0.40 0.41 0.13 Up 0.6 .944 -0.67 0.31 0.21 -1.21 0.16 0.38 -0.40 0.41 0.13 -0.40 0.41 0.13 -0.40 0.41 0.13 Off 4.44 .226 -1.75 0.06 0.55 -0.94 0.22 0.30 -0.94 0.22 0.30 -1.75 0.06 0.55 -1.48 0.09 0.47 Shop 0.3 .992 -0.40 0.41 0.13 -0.40 0.41 0.13 -0.40 0.41 0.13 -0.73 0.31 0.23 -1.10 0.19 0.35 Spot 11.88 .002* -0.94 0.22 0.30 -2.02 0.03 0.64 -0.40 0.41 0.13 -2.02 0.03 0.64 -2.02 0.03 0.64 Six 0.36 .975 -0.67 0.31 0.24 -0.40 0.41 0.13 -0.13 0.50 0.05 -0.94 0.22 0.30 -1.21 0.16 0.38 Beep 10.68 .005* -2.02 0.03 0.64 -0.40 0.41 0.13 -2.02 0.03 0.64 -0.94 0.22 0.30 -1.48 0.09 0.47 Push 8.1 .033* -2.02 0.03 0.64 -0.13 0.50 0.04 -2.02 0.03 0.64 -1.83 0.06 0.58 -1.10 0.19 0.35 Two 2.28 .561 -1.21 0.16 0.38 -1.75 0.06 0.55 -0.13 0.50 0.04 -1.21 0.16 0.38 -0.40 0.41 0.13
Bilabial Inter-lip Distance (BLC) Mine 5.880 .123 -1.75 0.06 0.55 -0.94 0.22 0.30 -1.48 0.09 0.47 -0.67 0.31 0.21 -0.13 0.50 0.04 Man 0.9 .900 -0.67 0.31 0.21 0.00 0.56 0.00 -1.10 0.19 0.37 -0.67 0.31 0.21 -0.73 0.31 0.23 Push 3.900 .324 -2.02 0.03 0.64 -1.48 0.09 0.47 -1.75 0.06 0.55 -0.73 0.31 0.24 0.00 0.56 0.00 Beep 4.920 .210 -2.02 0.03 0.64 -1.21 0.16 0.38 -0.67 0.31 0.21 -0.67 0.31 0.21 -0.40 0.41 0.13
Upper Lip (UL) Position Mine 1.560 .709 -0.67 0.31 0.21 -0.94 0.22 0.30 -0.40 0.41 0.13 -0.40 0.41 0.13 -0.67 0.31 0.21 Man 0.300 .992 -0.13 0.50 0.04 -0.37 0.44 0.12 -0.37 0.44 0.12 -0.67 0.31 0.21 -0.37 0.44 0.12 Push 3.600 .355 -0.67 0.31 0.21 -0.67 0.31 0.21 -1.75 0.06 0.55 0.00 0.56 0.00 -0.73 0.31 0.24 Beep 0.360 .975 -0.40 0.41 0.13 -0.67 0.31 0.21 -0.67 0.31 0.21 -1.21 0.16 0.40 -0.67 0.31 0.22
Lower Lip (LL) Position Mine 6.120 .107 -1.75 0.06 0.55 -0.94 0.22 0.30 -0.67 0.31 0.21 -0.94 0.22 0.30 -0.40 0.41 0.13 Man 1.800 .677 -1.48 0.09 0.47 0.00 0.56 0.00 -1.46 0.13 0.49 -0.13 0.50 0.04 0.00 0.56 0.00 Push 3.900 .324 -2.02 0.03 0.64 -1.75 0.06 0.55 -0.94 0.22 0.30 -0.73 0.31 0.24 0.00 0.56 0.00 Beep 4.920 .210 -2.02 0.03 0.64 -0.94 0.22 0.30 -0.67 0.31 0.21 -0.40 0.41 0.13 -0.40 0.41 0.13
Note. A1 = phase A1 (pre-intervention), B = phase B (intervention priority one), C = phase C (intervention priority two), A2 = phase A2 (follow-up).*= p ≤.05 one-tailed test, boldface = large effect size
THE EFFECTIVENESS OF PROMPT
255
Lip Rounding/Retraction (LRR).
The results obtained using Friedman’s ANOVA indicate a main effect on
4/11 words.
The descriptive data show phase B (intervention priority: Mandibular
control) was characterised by a decrease in mean values on 7/11 words. Three of
these yielded large effect sizes and indicated a trend towards the TD peers. This
trend continued in phase C (intervention priority two: labial-facial control), with 6/11
words yielding large and moderate effect sizes. Pair-wise comparisons between
phases A1-A2 indicate a clinically significant change in all words:
Word-set one – Increased retraction on the words mine and man that
exceeded pre-intervention values was evidenced. These values accompany
significantly increased JODs.
Word-set two – A trend towards the TD peers was indicated by increased
rounding (as indicated by a decrease in mean values) on the words ‘shop’ and ‘push’,
and increased retraction (as indicated by an increase in mean values) on the word
‘beep’. This indicates an increased contrast between rounded and retracted
movements was evident subsequent to the PROMPT intervention.
Word-set three – Whilst statistically non-significant, an increase in mean
LRR values indicates increased retraction on this word-set, and a trend away from
the TD peers.
Inter-lip distance during Bilabial Contact (BLC).
The results obtained using Friedman’s ANOVA indicate no presence of a
main effect on any word, thus indicating no statistically significant changes.
However, the pair-wise comparisons indicate the presence of a statistically
significant decrease between phases A-B in the words (push and beep), with a trend
towards the TD peers.
The positional data indicate the change in BLC is associated with a change in
the interaction between the UL and LL, across the study phases. Plots of the average
vertical positions of the UL and LL markers at the point of bilabial contact, for each
of the four words, are shown in Figure 5.5. The LL is plotted on the X-axis and the
UL is plotted on the y-axis. A negative value reflects an inferior (downward)
position, whilst a positive value reflects a superior (upward) position, from rest.
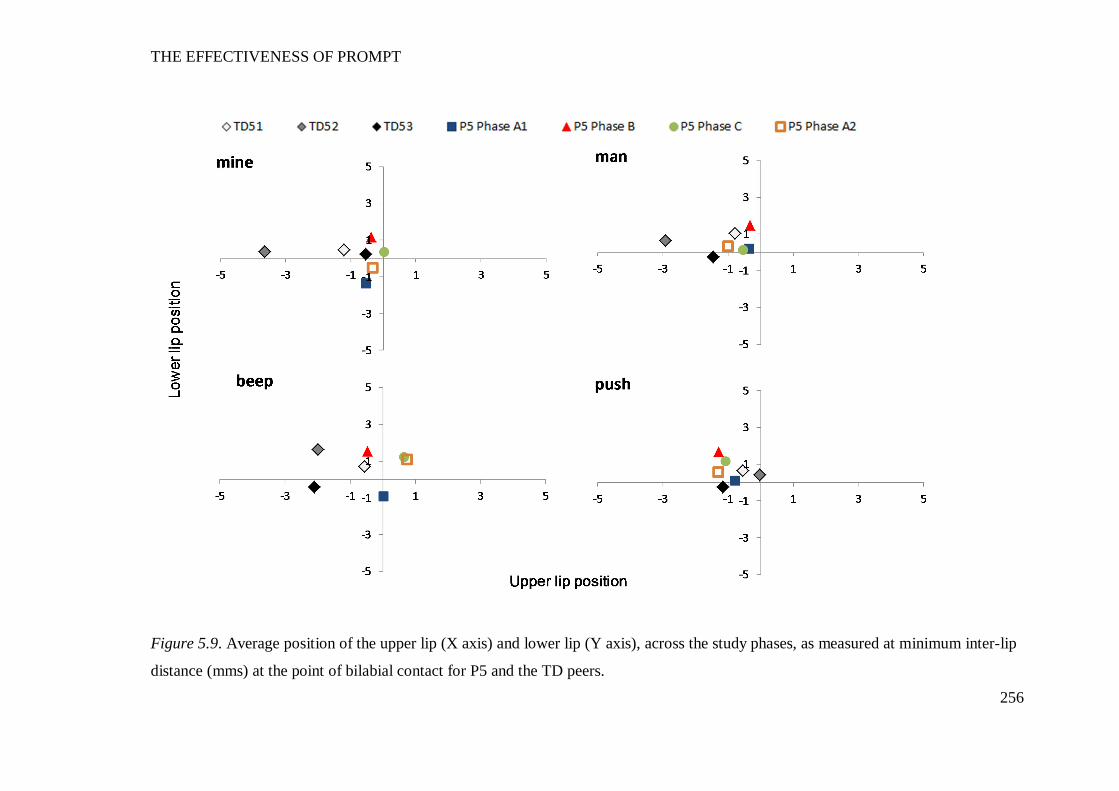
THE EFFECTIVENESS OF PROMPT
256
Figure 5.9. Average position of the upper lip (X axis) and lower lip (Y axis), across the study phases, as measured at minimum inter-lip
distance (mms) at the point of bilabial contact for P5 and the TD peers.
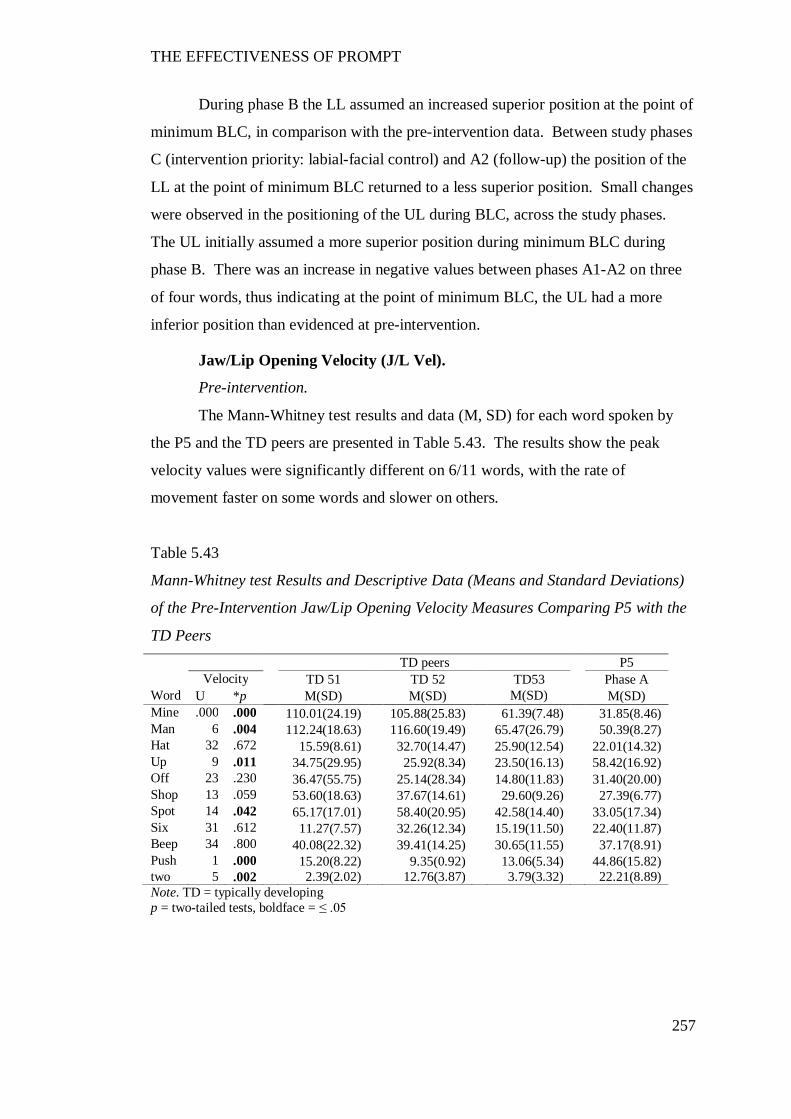
THE EFFECTIVENESS OF PROMPT
257
During phase B the LL assumed an increased superior position at the point of
minimum BLC, in comparison with the pre-intervention data. Between study phases
C (intervention priority: labial-facial control) and A2 (follow-up) the position of the
LL at the point of minimum BLC returned to a less superior position. Small changes
were observed in the positioning of the UL during BLC, across the study phases.
The UL initially assumed a more superior position during minimum BLC during
phase B. There was an increase in negative values between phases A1-A2 on three
of four words, thus indicating at the point of minimum BLC, the UL had a more
inferior position than evidenced at pre-intervention.
Jaw/Lip Opening Velocity (J/L Vel).
Pre-intervention.
The Mann-Whitney test results and data (M, SD) for each word spoken by
the P5 and the TD peers are presented in Table 5.43. The results show the peak
velocity values were significantly different on 6/11 words, with the rate of
movement faster on some words and slower on others.
Table 5.43
Mann-Whitney test Results and Descriptive Data (Means and Standard Deviations)
of the Pre-Intervention Jaw/Lip Opening Velocity Measures Comparing P5 with the
TD Peers TD peers P5 Velocity TD 51 TD 52 TD53 Phase A
Word U *p M(SD) M(SD) M(SD) M(SD) Mine .000 .000 110.01(24.19) 105.88(25.83) 61.39(7.48) 31.85(8.46) Man 6 .004 112.24(18.63) 116.60(19.49) 65.47(26.79) 50.39(8.27) Hat 32 .672 15.59(8.61) 32.70(14.47) 25.90(12.54) 22.01(14.32) Up 9 .011 34.75(29.95) 25.92(8.34) 23.50(16.13) 58.42(16.92) Off 23 .230 36.47(55.75) 25.14(28.34) 14.80(11.83) 31.40(20.00) Shop 13 .059 53.60(18.63) 37.67(14.61) 29.60(9.26) 27.39(6.77) Spot 14 .042 65.17(17.01) 58.40(20.95) 42.58(14.40) 33.05(17.34) Six 31 .612 11.27(7.57) 32.26(12.34) 15.19(11.50) 22.40(11.87) Beep 34 .800 40.08(22.32) 39.41(14.25) 30.65(11.55) 37.17(8.91) Push 1 .000 15.20(8.22) 9.35(0.92) 13.06(5.34) 44.86(15.82) two 5 .002 2.39(2.02) 12.76(3.87) 3.79(3.32) 22.21(8.89) Note. TD = typically developing p = two-tailed tests, boldface = ≤ .05
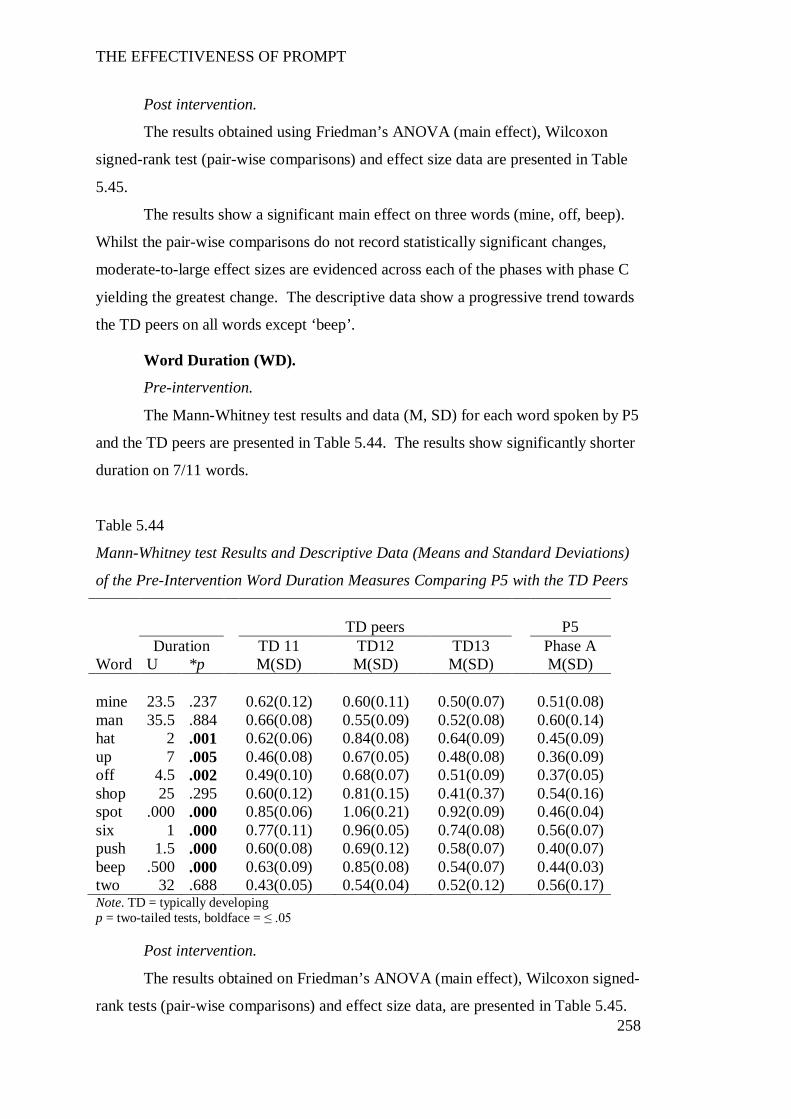
THE EFFECTIVENESS OF PROMPT
258
Post intervention.
The results obtained using Friedman’s ANOVA (main effect), Wilcoxon
signed-rank test (pair-wise comparisons) and effect size data are presented in Table
5.45.
The results show a significant main effect on three words (mine, off, beep).
Whilst the pair-wise comparisons do not record statistically significant changes,
moderate-to-large effect sizes are evidenced across each of the phases with phase C
yielding the greatest change. The descriptive data show a progressive trend towards
the TD peers on all words except ‘beep’.
Word Duration (WD).
Pre-intervention.
The Mann-Whitney test results and data (M, SD) for each word spoken by P5
and the TD peers are presented in Table 5.44. The results show significantly shorter
duration on 7/11 words.
Table 5.44
Mann-Whitney test Results and Descriptive Data (Means and Standard Deviations)
of the Pre-Intervention Word Duration Measures Comparing P5 with the TD Peers
TD peers P5
Duration TD 11 TD12 TD13 Phase A Word U *p M(SD) M(SD) M(SD) M(SD) mine 23.5 .237 0.62(0.12) 0.60(0.11) 0.50(0.07) 0.51(0.08) man 35.5 .884 0.66(0.08) 0.55(0.09) 0.52(0.08) 0.60(0.14) hat 2 .001 0.62(0.06) 0.84(0.08) 0.64(0.09) 0.45(0.09) up 7 .005 0.46(0.08) 0.67(0.05) 0.48(0.08) 0.36(0.09) off 4.5 .002 0.49(0.10) 0.68(0.07) 0.51(0.09) 0.37(0.05) shop 25 .295 0.60(0.12) 0.81(0.15) 0.41(0.37) 0.54(0.16) spot .000 .000 0.85(0.06) 1.06(0.21) 0.92(0.09) 0.46(0.04) six 1 .000 0.77(0.11) 0.96(0.05) 0.74(0.08) 0.56(0.07) push 1.5 .000 0.60(0.08) 0.69(0.12) 0.58(0.07) 0.40(0.07) beep .500 .000 0.63(0.09) 0.85(0.08) 0.54(0.07) 0.44(0.03) two 32 .688 0.43(0.05) 0.54(0.04) 0.52(0.12) 0.56(0.17) Note. TD = typically developing p = two-tailed tests, boldface = ≤ .05
Post intervention.
The results obtained on Friedman’s ANOVA (main effect), Wilcoxon signed-
rank tests (pair-wise comparisons) and effect size data, are presented in Table 5.45.

THE EFFECTIVENESS OF PROMPT
259
The data show a main effect on three words (mine, spot, six). Whilst the pair-wise
comparisons do not show statistically significant changes, moderate-to-large effect
sizes are evident across each of the phases, with phase C yielding the greatest
change. The descriptive data show a progressive trend towards the TD peers on all
words.
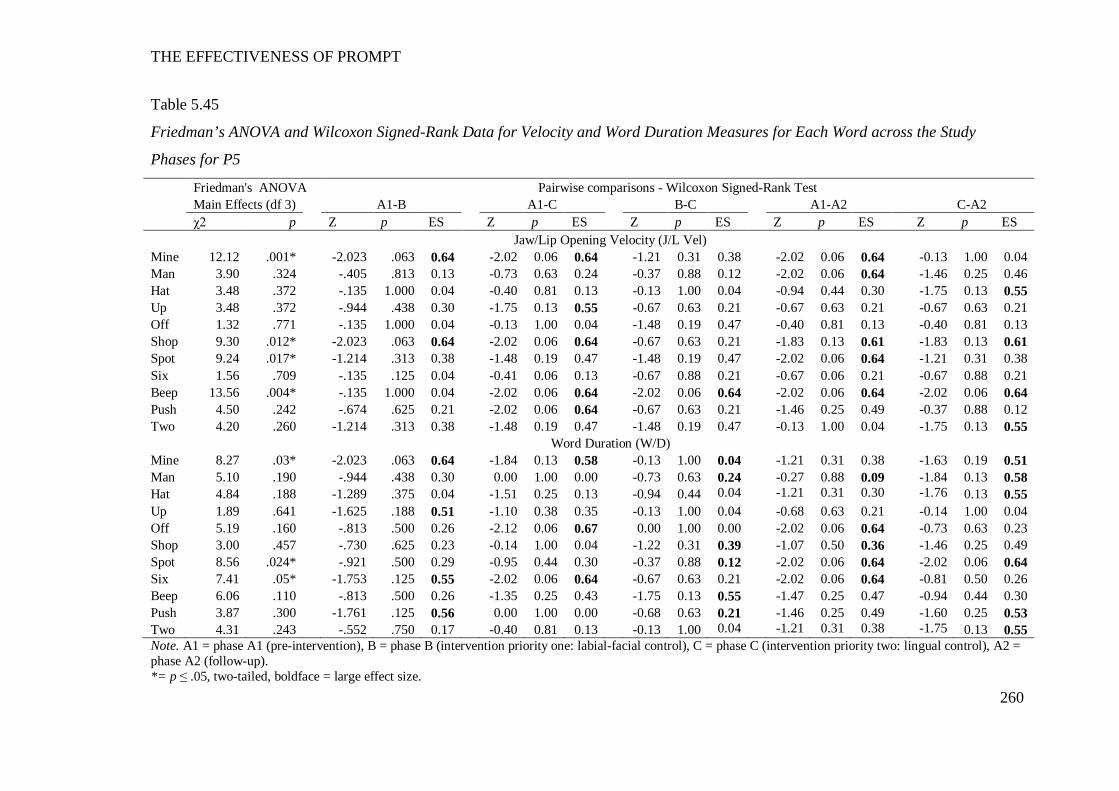
THE EFFECTIVENESS OF PROMPT
260
Table 5.45
Friedman’s ANOVA and Wilcoxon Signed-Rank Data for Velocity and Word Duration Measures for Each Word across the Study
Phases for P5
Friedman's ANOVA Pairwise comparisons - Wilcoxon Signed-Rank Test Main Effects (df 3) A1-B A1-C B-C A1-A2 C-A2 χ2 p Z p ES Z p ES Z p ES Z p ES Z p ES Jaw/Lip Opening Velocity (J/L Vel) Mine 12.12 .001* -2.023 .063 0.64 -2.02 0.06 0.64 -1.21 0.31 0.38 -2.02 0.06 0.64 -0.13 1.00 0.04 Man 3.90 .324 -.405 .813 0.13 -0.73 0.63 0.24 -0.37 0.88 0.12 -2.02 0.06 0.64 -1.46 0.25 0.46 Hat 3.48 .372 -.135 1.000 0.04 -0.40 0.81 0.13 -0.13 1.00 0.04 -0.94 0.44 0.30 -1.75 0.13 0.55 Up 3.48 .372 -.944 .438 0.30 -1.75 0.13 0.55 -0.67 0.63 0.21 -0.67 0.63 0.21 -0.67 0.63 0.21 Off 1.32 .771 -.135 1.000 0.04 -0.13 1.00 0.04 -1.48 0.19 0.47 -0.40 0.81 0.13 -0.40 0.81 0.13 Shop 9.30 .012* -2.023 .063 0.64 -2.02 0.06 0.64 -0.67 0.63 0.21 -1.83 0.13 0.61 -1.83 0.13 0.61 Spot 9.24 .017* -1.214 .313 0.38 -1.48 0.19 0.47 -1.48 0.19 0.47 -2.02 0.06 0.64 -1.21 0.31 0.38 Six 1.56 .709 -.135 .125 0.04 -0.41 0.06 0.13 -0.67 0.88 0.21 -0.67 0.06 0.21 -0.67 0.88 0.21 Beep 13.56 .004* -.135 1.000 0.04 -2.02 0.06 0.64 -2.02 0.06 0.64 -2.02 0.06 0.64 -2.02 0.06 0.64 Push 4.50 .242 -.674 .625 0.21 -2.02 0.06 0.64 -0.67 0.63 0.21 -1.46 0.25 0.49 -0.37 0.88 0.12 Two 4.20 .260 -1.214 .313 0.38 -1.48 0.19 0.47 -1.48 0.19 0.47 -0.13 1.00 0.04 -1.75 0.13 0.55
Word Duration (W/D) Mine 8.27 .03* -2.023 .063 0.64 -1.84 0.13 0.58 -0.13 1.00 0.04 -1.21 0.31 0.38 -1.63 0.19 0.51 Man 5.10 .190 -.944 .438 0.30 0.00 1.00 0.00 -0.73 0.63 0.24 -0.27 0.88 0.09 -1.84 0.13 0.58 Hat 4.84 .188 -1.289 .375 0.04 -1.51 0.25 0.13 -0.94 0.44 0.04 -1.21 0.31 0.30 -1.76 0.13 0.55 Up 1.89 .641 -1.625 .188 0.51 -1.10 0.38 0.35 -0.13 1.00 0.04 -0.68 0.63 0.21 -0.14 1.00 0.04 Off 5.19 .160 -.813 .500 0.26 -2.12 0.06 0.67 0.00 1.00 0.00 -2.02 0.06 0.64 -0.73 0.63 0.23 Shop 3.00 .457 -.730 .625 0.23 -0.14 1.00 0.04 -1.22 0.31 0.39 -1.07 0.50 0.36 -1.46 0.25 0.49 Spot 8.56 .024* -.921 .500 0.29 -0.95 0.44 0.30 -0.37 0.88 0.12 -2.02 0.06 0.64 -2.02 0.06 0.64 Six 7.41 .05* -1.753 .125 0.55 -2.02 0.06 0.64 -0.67 0.63 0.21 -2.02 0.06 0.64 -0.81 0.50 0.26 Beep 6.06 .110 -.813 .500 0.26 -1.35 0.25 0.43 -1.75 0.13 0.55 -1.47 0.25 0.47 -0.94 0.44 0.30 Push 3.87 .300 -1.761 .125 0.56 0.00 1.00 0.00 -0.68 0.63 0.21 -1.46 0.25 0.49 -1.60 0.25 0.53 Two 4.31 .243 -.552 .750 0.17 -0.40 0.81 0.13 -0.13 1.00 0.04 -1.21 0.31 0.38 -1.75 0.13 0.55 Note. A1 = phase A1 (pre-intervention), B = phase B (intervention priority one: labial-facial control), C = phase C (intervention priority two: lingual control), A2 = phase A2 (follow-up). *= p ≤ .05, two-tailed, boldface = large effect size.
THE EFFECTIVENESS OF PROMPT
261
Overall summary of P5’s kinematic measures.
Subsequent to PROMPT intervention, the following changes were evident:
Phase B – Increases to the mean values of duration, velocity and JPD. Whilst
an initial decrease in the mean JOD values was evidenced, distance between the four
jaw-height-positions increased, thus indicating an improvement in jaw grading.
Lateral deviation of the jaw from midline and LRR values decreased.
Phase C – Decreased lateral deviation from midline and an increase in JOD
consistent with a trend toward the TD peer.
Phase A2 – Improvement continued on the measures of JOD and JPD within
word-set one (Mandibular), LRR within word-set two (labial-facial), JLDM (6/11
words), duration (9/11 words) and velocity.
The above results indicate P5’s intervention program was successful in
producing changes to the motor-speech movement patterns under investigation.
The above results indicate P5’s intervention program was successful in
producing changes to the motor-speech movement patterns under investigation.
Participant 6
The following motor-speech movement patterns were targeted during the
phases of the PROMPT Intervention:
Phase B: (Intervention priority one: mandibular control) – Increase the range
of movement at jaw height positions 3 and 4 (word-set one), increase the distance
between the four jaw height positions and decrease excessive labial-facial retraction.
Phase C: (Intervention priority two: labial-facial control) – Active
engagement of the UL and LL, separate from the jaw to achieve bilabial lip contact.
Pre-intervention observations suggested excessive jaw action was used to achieve
bilabial lip contact. Specifically, the LL moved excessively superior, whilst the UL
moved inferiorly and pushed over the LL to achieve bilabial contact.
Table 5.46 summarises the words that evidenced significant impairment of
the jaw and lip measures for P6 as compared with the typically developing (TD)
peers pre-intervention; and significant changes post-intervention for these words.
Results are based on five repetitions of each word, with the exception of TD 53.
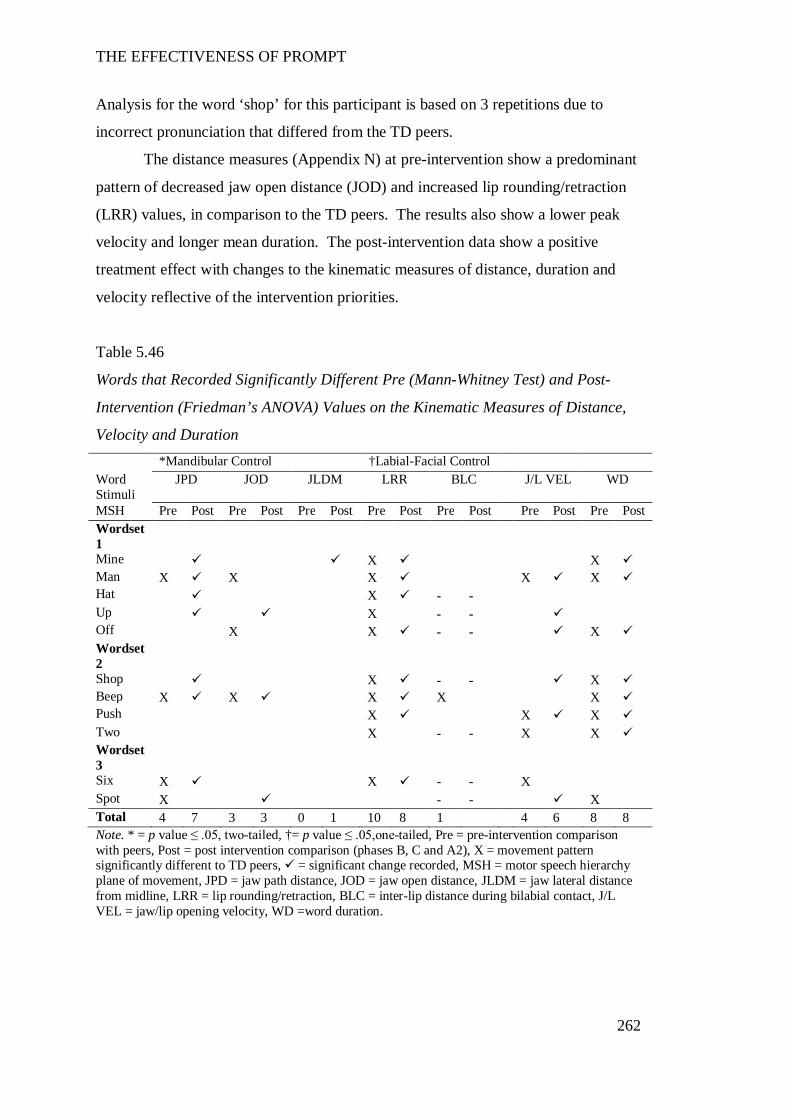
THE EFFECTIVENESS OF PROMPT
262
Analysis for the word ‘shop’ for this participant is based on 3 repetitions due to
incorrect pronunciation that differed from the TD peers.
The distance measures (Appendix N) at pre-intervention show a predominant
pattern of decreased jaw open distance (JOD) and increased lip rounding/retraction
(LRR) values, in comparison to the TD peers. The results also show a lower peak
velocity and longer mean duration. The post-intervention data show a positive
treatment effect with changes to the kinematic measures of distance, duration and
velocity reflective of the intervention priorities.
Table 5.46
Words that Recorded Significantly Different Pre (Mann-Whitney Test) and Post-
Intervention (Friedman’s ANOVA) Values on the Kinematic Measures of Distance,
Velocity and Duration *Mandibular Control †Labial-Facial Control Word Stimuli
JPD JOD JLDM LRR BLC J/L VEL WD
MSH Pre Post Pre Post Pre Post Pre Post Pre Post Pre Post Pre Post Wordset 1
Mine X X Man X X X X X Hat X - - Up X - - Off X X - - X Wordset 2
Shop X - - X Beep X X X X X Push X X X Two X - - X X Wordset 3
Six X X - - X Spot X - - X Total 4 7 3 3 0 1 10 8 1 4 6 8 8 Note. * = p value ≤ .05, two-tailed, †= p value ≤ .05,one-tailed, Pre = pre-intervention comparison with peers, Post = post intervention comparison (phases B, C and A2), X = movement pattern significantly different to TD peers, = significant change recorded, MSH = motor speech hierarchy plane of movement, JPD = jaw path distance, JOD = jaw open distance, JLDM = jaw lateral distance from midline, LRR = lip rounding/retraction, BLC = inter-lip distance during bilabial contact, J/L VEL = jaw/lip opening velocity, WD =word duration.
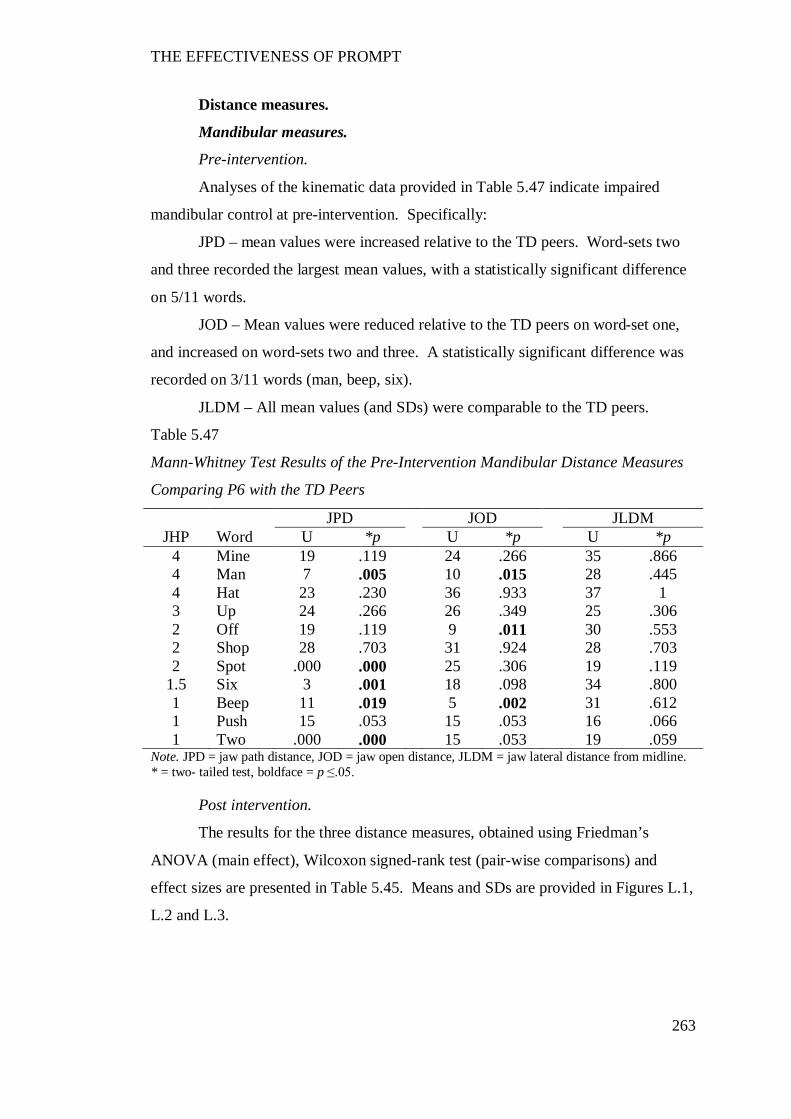
THE EFFECTIVENESS OF PROMPT
263
Distance measures.
Mandibular measures.
Pre-intervention.
Analyses of the kinematic data provided in Table 5.47 indicate impaired
mandibular control at pre-intervention. Specifically:
JPD – mean values were increased relative to the TD peers. Word-sets two
and three recorded the largest mean values, with a statistically significant difference
on 5/11 words.
JOD – Mean values were reduced relative to the TD peers on word-set one,
and increased on word-sets two and three. A statistically significant difference was
recorded on 3/11 words (man, beep, six).
JLDM – All mean values (and SDs) were comparable to the TD peers.
Table 5.47
Mann-Whitney Test Results of the Pre-Intervention Mandibular Distance Measures
Comparing P6 with the TD Peers
JPD JOD JLDM JHP Word U *p U *p U *p
4 Mine 19 .119 24 .266 35 .866 4 Man 7 .005 10 .015 28 .445 4 Hat 23 .230 36 .933 37 1 3 Up 24 .266 26 .349 25 .306 2 Off 19 .119 9 .011 30 .553 2 Shop 28 .703 31 .924 28 .703 2 Spot .000 .000 25 .306 19 .119
1.5 Six 3 .001 18 .098 34 .800 1 Beep 11 .019 5 .002 31 .612 1 Push 15 .053 15 .053 16 .066 1 Two .000 .000 15 .053 19 .059
Note. JPD = jaw path distance, JOD = jaw open distance, JLDM = jaw lateral distance from midline. * = two- tailed test, boldface = p ≤.05.
Post intervention.
The results for the three distance measures, obtained using Friedman’s
ANOVA (main effect), Wilcoxon signed-rank test (pair-wise comparisons) and
effect sizes are presented in Table 5.45. Means and SDs are provided in Figures L.1,
L.2 and L.3.
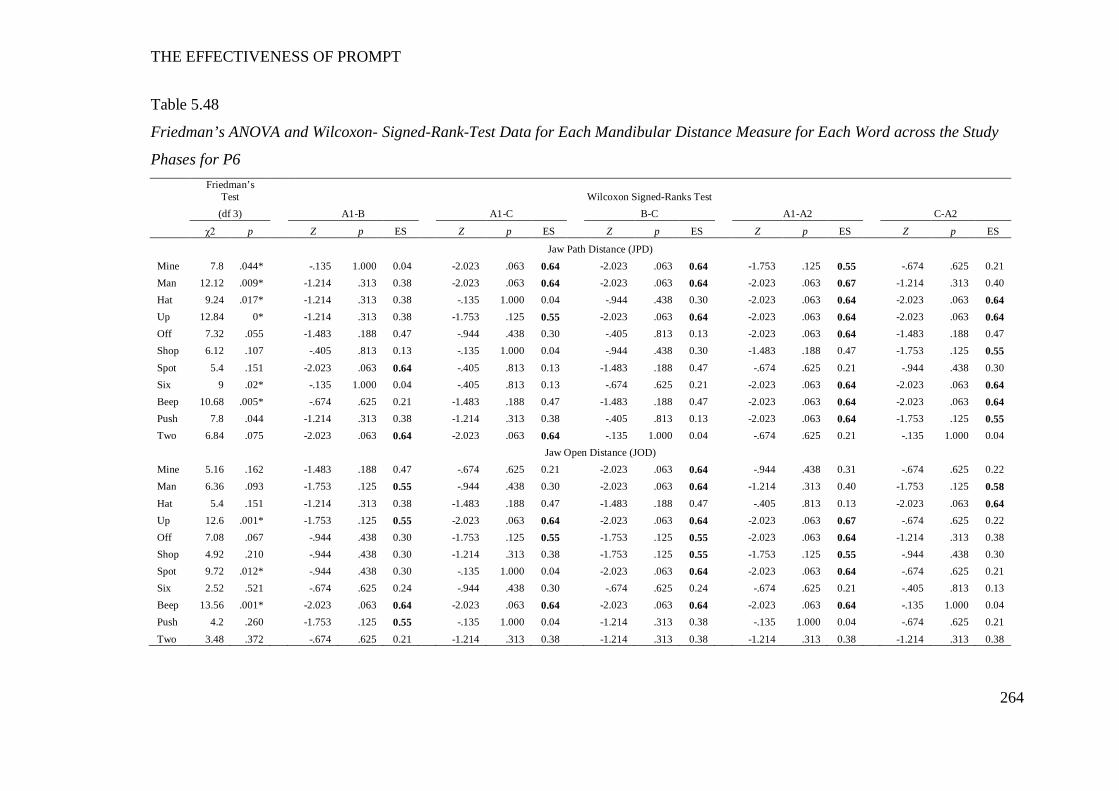
THE EFFECTIVENESS OF PROMPT
264
Table 5.48
Friedman’s ANOVA and Wilcoxon- Signed-Rank-Test Data for Each Mandibular Distance Measure for Each Word across the Study
Phases for P6
Friedman’s
Test Wilcoxon Signed-Ranks Test (df 3) A1-B A1-C B-C A1-A2 C-A2
χ2 p Z p ES Z p ES Z p ES Z p ES Z p ES
Jaw Path Distance (JPD) Mine 7.8 .044* -.135 1.000 0.04 -2.023 .063 0.64 -2.023 .063 0.64 -1.753 .125 0.55 -.674 .625 0.21 Man 12.12 .009* -1.214 .313 0.38 -2.023 .063 0.64 -2.023 .063 0.64 -2.023 .063 0.67 -1.214 .313 0.40 Hat 9.24 .017* -1.214 .313 0.38 -.135 1.000 0.04 -.944 .438 0.30 -2.023 .063 0.64 -2.023 .063 0.64 Up 12.84 0* -1.214 .313 0.38 -1.753 .125 0.55 -2.023 .063 0.64 -2.023 .063 0.64 -2.023 .063 0.64 Off 7.32 .055 -1.483 .188 0.47 -.944 .438 0.30 -.405 .813 0.13 -2.023 .063 0.64 -1.483 .188 0.47 Shop 6.12 .107 -.405 .813 0.13 -.135 1.000 0.04 -.944 .438 0.30 -1.483 .188 0.47 -1.753 .125 0.55 Spot 5.4 .151 -2.023 .063 0.64 -.405 .813 0.13 -1.483 .188 0.47 -.674 .625 0.21 -.944 .438 0.30 Six 9 .02* -.135 1.000 0.04 -.405 .813 0.13 -.674 .625 0.21 -2.023 .063 0.64 -2.023 .063 0.64 Beep 10.68 .005* -.674 .625 0.21 -1.483 .188 0.47 -1.483 .188 0.47 -2.023 .063 0.64 -2.023 .063 0.64 Push 7.8 .044 -1.214 .313 0.38 -1.214 .313 0.38 -.405 .813 0.13 -2.023 .063 0.64 -1.753 .125 0.55 Two 6.84 .075 -2.023 .063 0.64 -2.023 .063 0.64 -.135 1.000 0.04 -.674 .625 0.21 -.135 1.000 0.04 Jaw Open Distance (JOD) Mine 5.16 .162 -1.483 .188 0.47 -.674 .625 0.21 -2.023 .063 0.64 -.944 .438 0.31 -.674 .625 0.22 Man 6.36 .093 -1.753 .125 0.55 -.944 .438 0.30 -2.023 .063 0.64 -1.214 .313 0.40 -1.753 .125 0.58 Hat 5.4 .151 -1.214 .313 0.38 -1.483 .188 0.47 -1.483 .188 0.47 -.405 .813 0.13 -2.023 .063 0.64 Up 12.6 .001* -1.753 .125 0.55 -2.023 .063 0.64 -2.023 .063 0.64 -2.023 .063 0.67 -.674 .625 0.22 Off 7.08 .067 -.944 .438 0.30 -1.753 .125 0.55 -1.753 .125 0.55 -2.023 .063 0.64 -1.214 .313 0.38 Shop 4.92 .210 -.944 .438 0.30 -1.214 .313 0.38 -1.753 .125 0.55 -1.753 .125 0.55 -.944 .438 0.30 Spot 9.72 .012* -.944 .438 0.30 -.135 1.000 0.04 -2.023 .063 0.64 -2.023 .063 0.64 -.674 .625 0.21 Six 2.52 .521 -.674 .625 0.24 -.944 .438 0.30 -.674 .625 0.24 -.674 .625 0.21 -.405 .813 0.13 Beep 13.56 .001* -2.023 .063 0.64 -2.023 .063 0.64 -2.023 .063 0.64 -2.023 .063 0.64 -.135 1.000 0.04 Push 4.2 .260 -1.753 .125 0.55 -.135 1.000 0.04 -1.214 .313 0.38 -.135 1.000 0.04 -.674 .625 0.21 Two 3.48 .372 -.674 .625 0.21 -1.214 .313 0.38 -1.214 .313 0.38 -1.214 .313 0.38 -1.214 .313 0.38
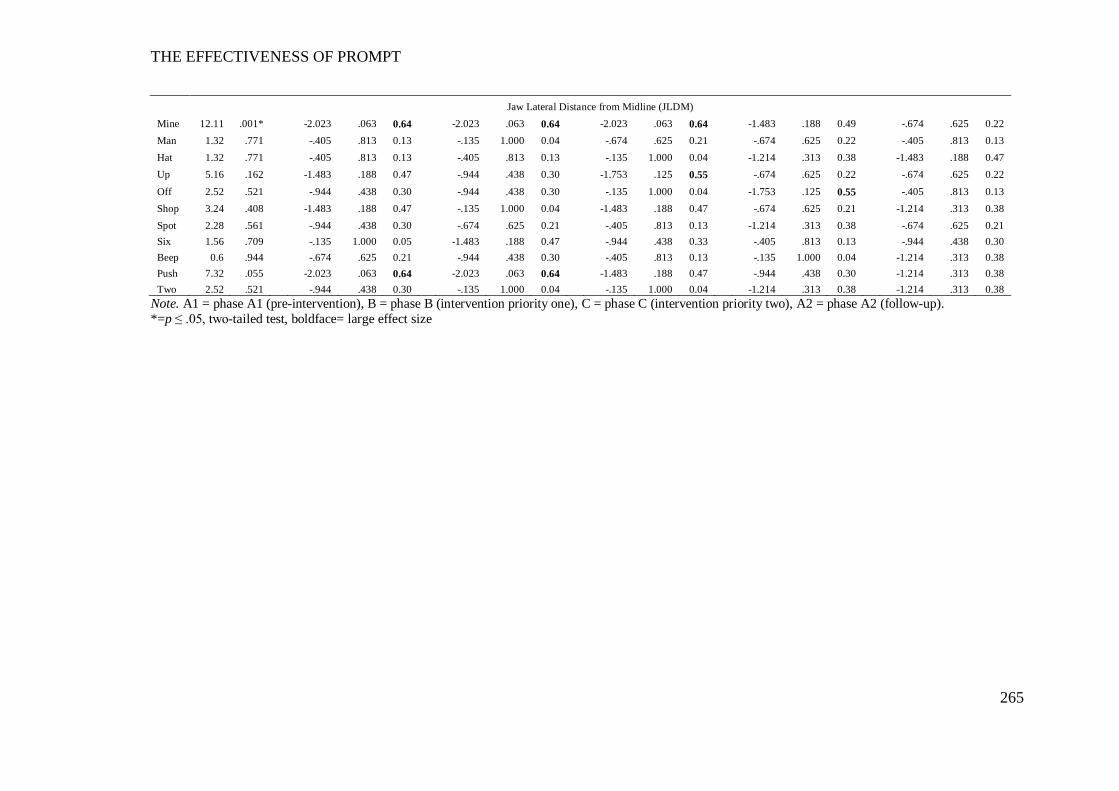
THE EFFECTIVENESS OF PROMPT
265
Jaw Lateral Distance from Midline (JLDM) Mine 12.11 .001* -2.023 .063 0.64 -2.023 .063 0.64 -2.023 .063 0.64 -1.483 .188 0.49 -.674 .625 0.22 Man 1.32 .771 -.405 .813 0.13 -.135 1.000 0.04 -.674 .625 0.21 -.674 .625 0.22 -.405 .813 0.13 Hat 1.32 .771 -.405 .813 0.13 -.405 .813 0.13 -.135 1.000 0.04 -1.214 .313 0.38 -1.483 .188 0.47 Up 5.16 .162 -1.483 .188 0.47 -.944 .438 0.30 -1.753 .125 0.55 -.674 .625 0.22 -.674 .625 0.22 Off 2.52 .521 -.944 .438 0.30 -.944 .438 0.30 -.135 1.000 0.04 -1.753 .125 0.55 -.405 .813 0.13 Shop 3.24 .408 -1.483 .188 0.47 -.135 1.000 0.04 -1.483 .188 0.47 -.674 .625 0.21 -1.214 .313 0.38 Spot 2.28 .561 -.944 .438 0.30 -.674 .625 0.21 -.405 .813 0.13 -1.214 .313 0.38 -.674 .625 0.21 Six 1.56 .709 -.135 1.000 0.05 -1.483 .188 0.47 -.944 .438 0.33 -.405 .813 0.13 -.944 .438 0.30 Beep 0.6 .944 -.674 .625 0.21 -.944 .438 0.30 -.405 .813 0.13 -.135 1.000 0.04 -1.214 .313 0.38 Push 7.32 .055 -2.023 .063 0.64 -2.023 .063 0.64 -1.483 .188 0.47 -.944 .438 0.30 -1.214 .313 0.38 Two 2.52 .521 -.944 .438 0.30 -.135 1.000 0.04 -.135 1.000 0.04 -1.214 .313 0.38 -1.214 .313 0.38
Note. A1 = phase A1 (pre-intervention), B = phase B (intervention priority one), C = phase C (intervention priority two), A2 = phase A2 (follow-up). *=p ≤ .05, two-tailed test, boldface= large effect size
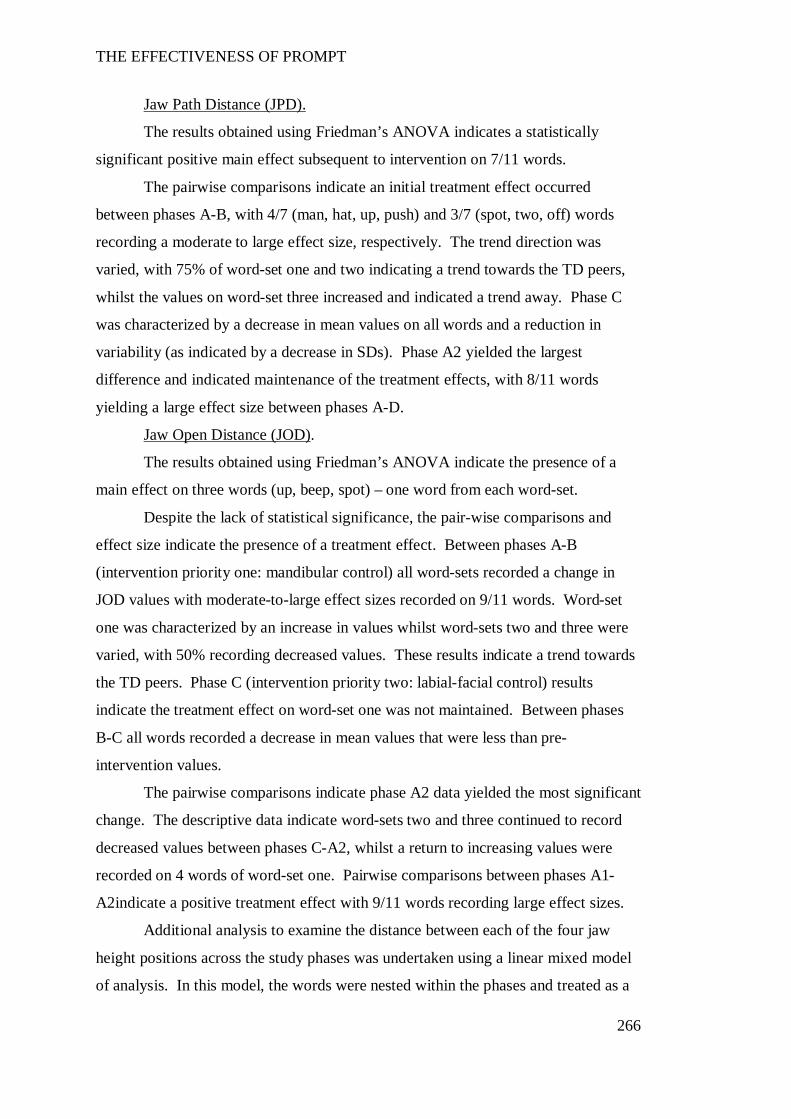
THE EFFECTIVENESS OF PROMPT
266
Jaw Path Distance (JPD).
The results obtained using Friedman’s ANOVA indicates a statistically
significant positive main effect subsequent to intervention on 7/11 words.
The pairwise comparisons indicate an initial treatment effect occurred
between phases A-B, with 4/7 (man, hat, up, push) and 3/7 (spot, two, off) words
recording a moderate to large effect size, respectively. The trend direction was
varied, with 75% of word-set one and two indicating a trend towards the TD peers,
whilst the values on word-set three increased and indicated a trend away. Phase C
was characterized by a decrease in mean values on all words and a reduction in
variability (as indicated by a decrease in SDs). Phase A2 yielded the largest
difference and indicated maintenance of the treatment effects, with 8/11 words
yielding a large effect size between phases A-D.
Jaw Open Distance (JOD).
The results obtained using Friedman’s ANOVA indicate the presence of a
main effect on three words (up, beep, spot) – one word from each word-set.
Despite the lack of statistical significance, the pair-wise comparisons and
effect size indicate the presence of a treatment effect. Between phases A-B
(intervention priority one: mandibular control) all word-sets recorded a change in
JOD values with moderate-to-large effect sizes recorded on 9/11 words. Word-set
one was characterized by an increase in values whilst word-sets two and three were
varied, with 50% recording decreased values. These results indicate a trend towards
the TD peers. Phase C (intervention priority two: labial-facial control) results
indicate the treatment effect on word-set one was not maintained. Between phases
B-C all words recorded a decrease in mean values that were less than pre-
intervention values.
The pairwise comparisons indicate phase A2 data yielded the most significant
change. The descriptive data indicate word-sets two and three continued to record
decreased values between phases C-A2, whilst a return to increasing values were
recorded on 4 words of word-set one. Pairwise comparisons between phases A1-
A2indicate a positive treatment effect with 9/11 words recording large effect sizes.
Additional analysis to examine the distance between each of the four jaw
height positions across the study phases was undertaken using a linear mixed model
of analysis. In this model, the words were nested within the phases and treated as a
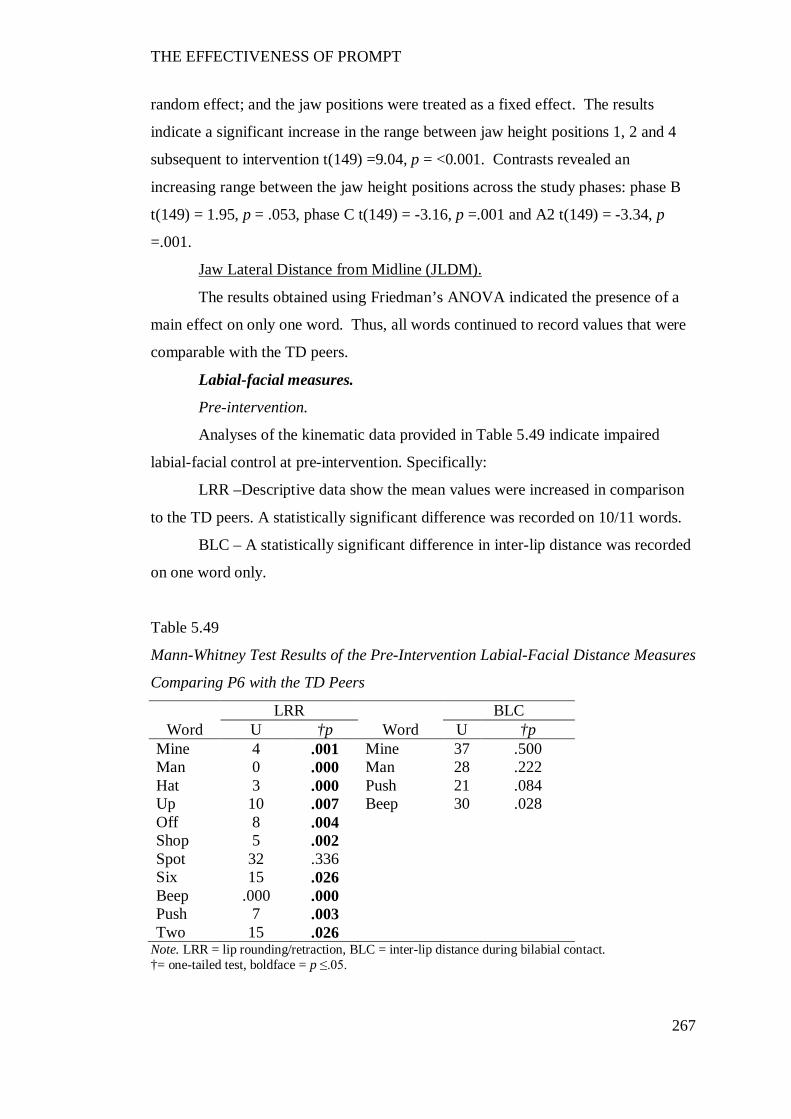
THE EFFECTIVENESS OF PROMPT
267
random effect; and the jaw positions were treated as a fixed effect. The results
indicate a significant increase in the range between jaw height positions 1, 2 and 4
subsequent to intervention t(149) =9.04, p = <0.001. Contrasts revealed an
increasing range between the jaw height positions across the study phases: phase B
t(149) = 1.95, p = .053, phase C t(149) = -3.16, p =.001 and A2 t(149) = -3.34, p
=.001.
Jaw Lateral Distance from Midline (JLDM).
The results obtained using Friedman’s ANOVA indicated the presence of a
main effect on only one word. Thus, all words continued to record values that were
comparable with the TD peers.
Labial-facial measures.
Pre-intervention.
Analyses of the kinematic data provided in Table 5.49 indicate impaired
labial-facial control at pre-intervention. Specifically:
LRR –Descriptive data show the mean values were increased in comparison
to the TD peers. A statistically significant difference was recorded on 10/11 words.
BLC – A statistically significant difference in inter-lip distance was recorded
on one word only.
Table 5.49
Mann-Whitney Test Results of the Pre-Intervention Labial-Facial Distance Measures
Comparing P6 with the TD Peers
LRR BLC Word U †p Word U †p
Mine 4 .001 Mine 37 .500 Man 0 .000 Man 28 .222 Hat 3 .000 Push 21 .084 Up 10 .007 Beep 30 .028 Off 8 .004 Shop 5 .002 Spot 32 .336 Six 15 .026 Beep .000 .000 Push 7 .003 Two 15 .026
Note. LRR = lip rounding/retraction, BLC = inter-lip distance during bilabial contact. †= one-tailed test, boldface = p ≤.05.

THE EFFECTIVENESS OF PROMPT
268
Post intervention.
The results obtained using Friedman’s ANOVA (main effect), Wilcoxon
signed-rank test (pair-wise comparisons) and effect size data, for the two distance
measures are presented in Table 5.50. In summary, these data (supported by the
descriptive data in Figures M.4 and M.5) indicate the presence of a treatment effect
on labial-facial measures.
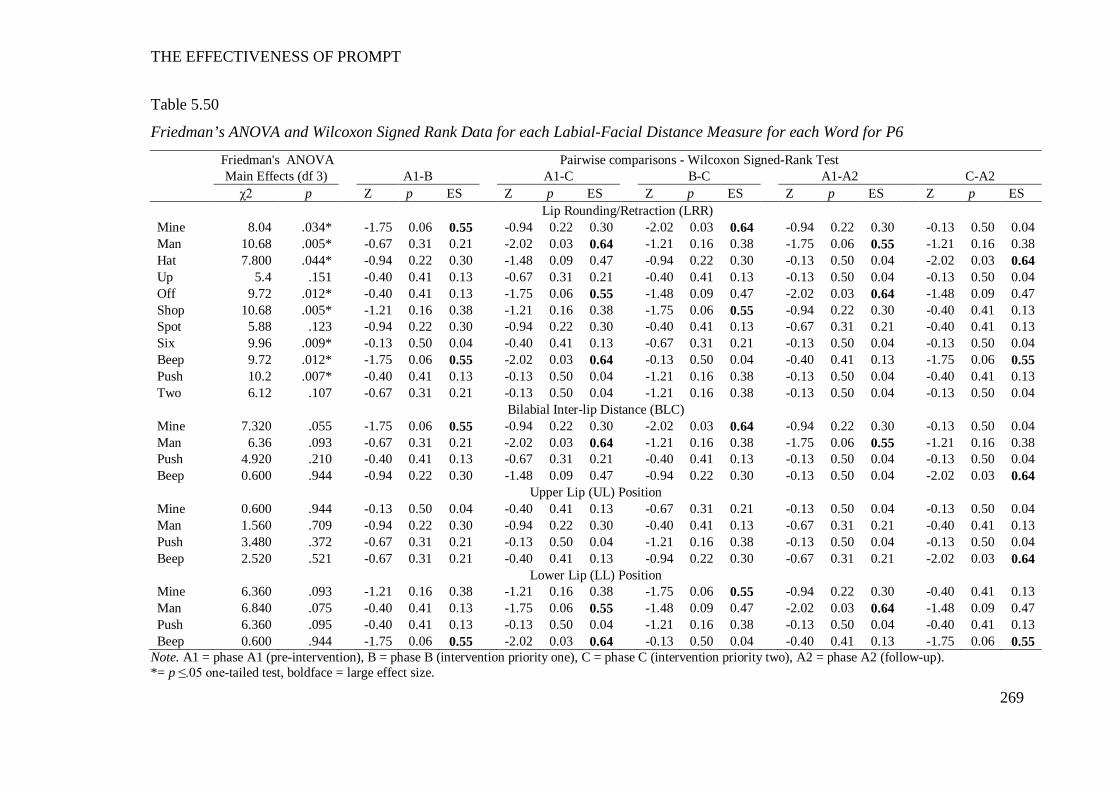
THE EFFECTIVENESS OF PROMPT
269
Table 5.50
Friedman’s ANOVA and Wilcoxon Signed Rank Data for each Labial-Facial Distance Measure for each Word for P6
Friedman's ANOVA Pairwise comparisons - Wilcoxon Signed-Rank Test Main Effects (df 3) A1-B A1-C B-C A1-A2 C-A2 χ2 p Z p ES Z p ES Z p ES Z p ES Z p ES Lip Rounding/Retraction (LRR) Mine 8.04 .034* -1.75 0.06 0.55 -0.94 0.22 0.30 -2.02 0.03 0.64 -0.94 0.22 0.30 -0.13 0.50 0.04 Man 10.68 .005* -0.67 0.31 0.21 -2.02 0.03 0.64 -1.21 0.16 0.38 -1.75 0.06 0.55 -1.21 0.16 0.38 Hat 7.800 .044* -0.94 0.22 0.30 -1.48 0.09 0.47 -0.94 0.22 0.30 -0.13 0.50 0.04 -2.02 0.03 0.64 Up 5.4 .151 -0.40 0.41 0.13 -0.67 0.31 0.21 -0.40 0.41 0.13 -0.13 0.50 0.04 -0.13 0.50 0.04 Off 9.72 .012* -0.40 0.41 0.13 -1.75 0.06 0.55 -1.48 0.09 0.47 -2.02 0.03 0.64 -1.48 0.09 0.47 Shop 10.68 .005* -1.21 0.16 0.38 -1.21 0.16 0.38 -1.75 0.06 0.55 -0.94 0.22 0.30 -0.40 0.41 0.13 Spot 5.88 .123 -0.94 0.22 0.30 -0.94 0.22 0.30 -0.40 0.41 0.13 -0.67 0.31 0.21 -0.40 0.41 0.13 Six 9.96 .009* -0.13 0.50 0.04 -0.40 0.41 0.13 -0.67 0.31 0.21 -0.13 0.50 0.04 -0.13 0.50 0.04 Beep 9.72 .012* -1.75 0.06 0.55 -2.02 0.03 0.64 -0.13 0.50 0.04 -0.40 0.41 0.13 -1.75 0.06 0.55 Push 10.2 .007* -0.40 0.41 0.13 -0.13 0.50 0.04 -1.21 0.16 0.38 -0.13 0.50 0.04 -0.40 0.41 0.13 Two 6.12 .107 -0.67 0.31 0.21 -0.13 0.50 0.04 -1.21 0.16 0.38 -0.13 0.50 0.04 -0.13 0.50 0.04
Bilabial Inter-lip Distance (BLC) Mine 7.320 .055 -1.75 0.06 0.55 -0.94 0.22 0.30 -2.02 0.03 0.64 -0.94 0.22 0.30 -0.13 0.50 0.04 Man 6.36 .093 -0.67 0.31 0.21 -2.02 0.03 0.64 -1.21 0.16 0.38 -1.75 0.06 0.55 -1.21 0.16 0.38 Push 4.920 .210 -0.40 0.41 0.13 -0.67 0.31 0.21 -0.40 0.41 0.13 -0.13 0.50 0.04 -0.13 0.50 0.04 Beep 0.600 .944 -0.94 0.22 0.30 -1.48 0.09 0.47 -0.94 0.22 0.30 -0.13 0.50 0.04 -2.02 0.03 0.64
Upper Lip (UL) Position Mine 0.600 .944 -0.13 0.50 0.04 -0.40 0.41 0.13 -0.67 0.31 0.21 -0.13 0.50 0.04 -0.13 0.50 0.04 Man 1.560 .709 -0.94 0.22 0.30 -0.94 0.22 0.30 -0.40 0.41 0.13 -0.67 0.31 0.21 -0.40 0.41 0.13 Push 3.480 .372 -0.67 0.31 0.21 -0.13 0.50 0.04 -1.21 0.16 0.38 -0.13 0.50 0.04 -0.13 0.50 0.04 Beep 2.520 .521 -0.67 0.31 0.21 -0.40 0.41 0.13 -0.94 0.22 0.30 -0.67 0.31 0.21 -2.02 0.03 0.64
Lower Lip (LL) Position Mine 6.360 .093 -1.21 0.16 0.38 -1.21 0.16 0.38 -1.75 0.06 0.55 -0.94 0.22 0.30 -0.40 0.41 0.13 Man 6.840 .075 -0.40 0.41 0.13 -1.75 0.06 0.55 -1.48 0.09 0.47 -2.02 0.03 0.64 -1.48 0.09 0.47 Push 6.360 .095 -0.40 0.41 0.13 -0.13 0.50 0.04 -1.21 0.16 0.38 -0.13 0.50 0.04 -0.40 0.41 0.13 Beep 0.600 .944 -1.75 0.06 0.55 -2.02 0.03 0.64 -0.13 0.50 0.04 -0.40 0.41 0.13 -1.75 0.06 0.55
Note. A1 = phase A1 (pre-intervention), B = phase B (intervention priority one), C = phase C (intervention priority two), A2 = phase A2 (follow-up). *= p ≤.05 one-tailed test, boldface = large effect size.
THE EFFECTIVENESS OF PROMPT
270
Lip Rounding/Retraction (LRR).
The results obtained using Friedman’s ANOVA indicates a main effect on
8/11 words.
The descriptive data show phase B (intervention priority: Mandibular
control) was characterised by a decrease in mean values on 9/11 words, with a trend
towards the TD peers. This trend continued in phase C (intervention priority two:
labial-facial control), with 6/11 words yielding moderate-to-large effect sizes. The
descriptive data also indicate a decrease in variability (reduced SDs) between phases
B-C. Pair-wise comparisons between phases A1-A2 indicate a clinically significant
change with 10/11 words recording smaller mean values than pre-intervention.
Inter-lip distance during Bilabial Contact (BLC).
The results obtained using Friedman’s ANOVA indicate no presence of a
main effect on any word, thus indicating no statistically significant changes.
However, the pair-wise comparisons and positional data indicate a change in the
interaction between the UL and LL, across the study phases. Plots of the average
vertical positions of the UL and LL markers at the point of bilabial contact, for each
of the four words, are shown in Figure 5.6. The LL is plotted on the X-axis and the
UL is plotted on the y-axis. A negative value reflects an inferior (downward)
position, whilst a positive value reflects a superior (upward) position, from rest.
The data indicate, during phase B at the point of minimum BLC the LL
assumed an increased superior position, in comparison with the pre-intervention
data. Between study phases C (intervention priority: labial-facial control) and A2
(follow-up) the position of the LL at the point of minimum BLC returned to a less
superior position. No real changes were observed in the positioning of the UL
during BLC, across the study phases.
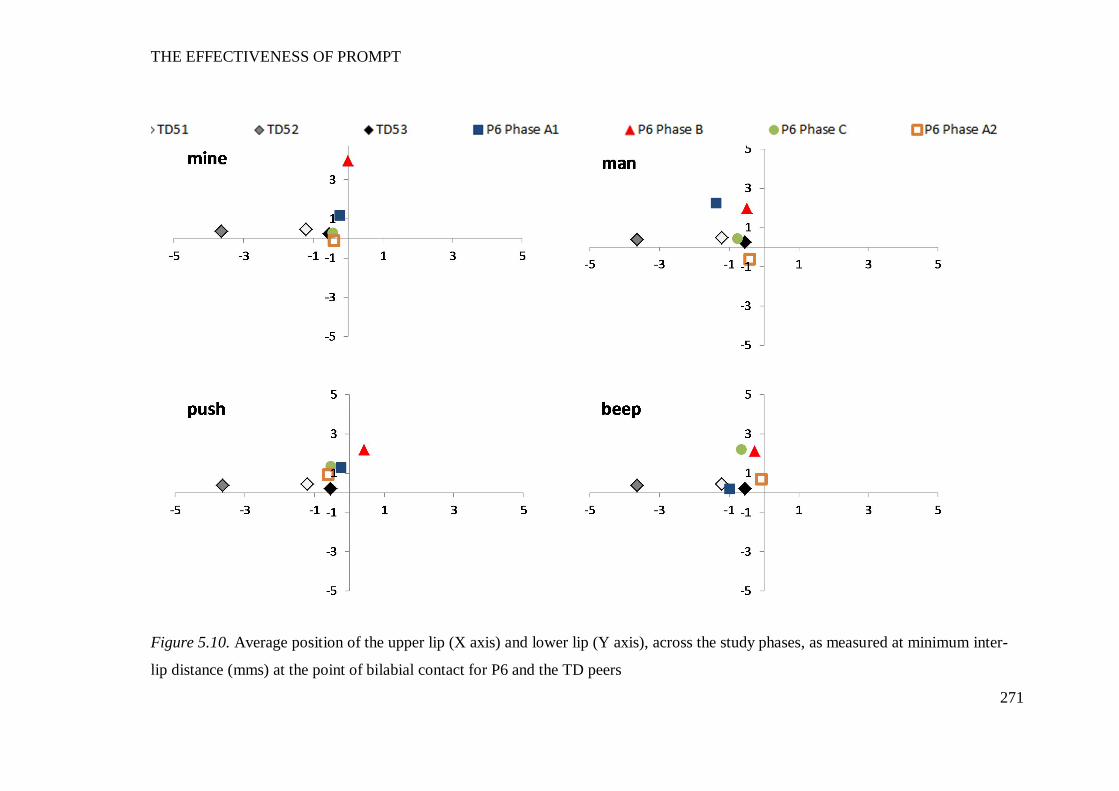
THE EFFECTIVENESS OF PROMPT
271
Figure 5.10. Average position of the upper lip (X axis) and lower lip (Y axis), across the study phases, as measured at minimum inter-
lip distance (mms) at the point of bilabial contact for P6 and the TD peers
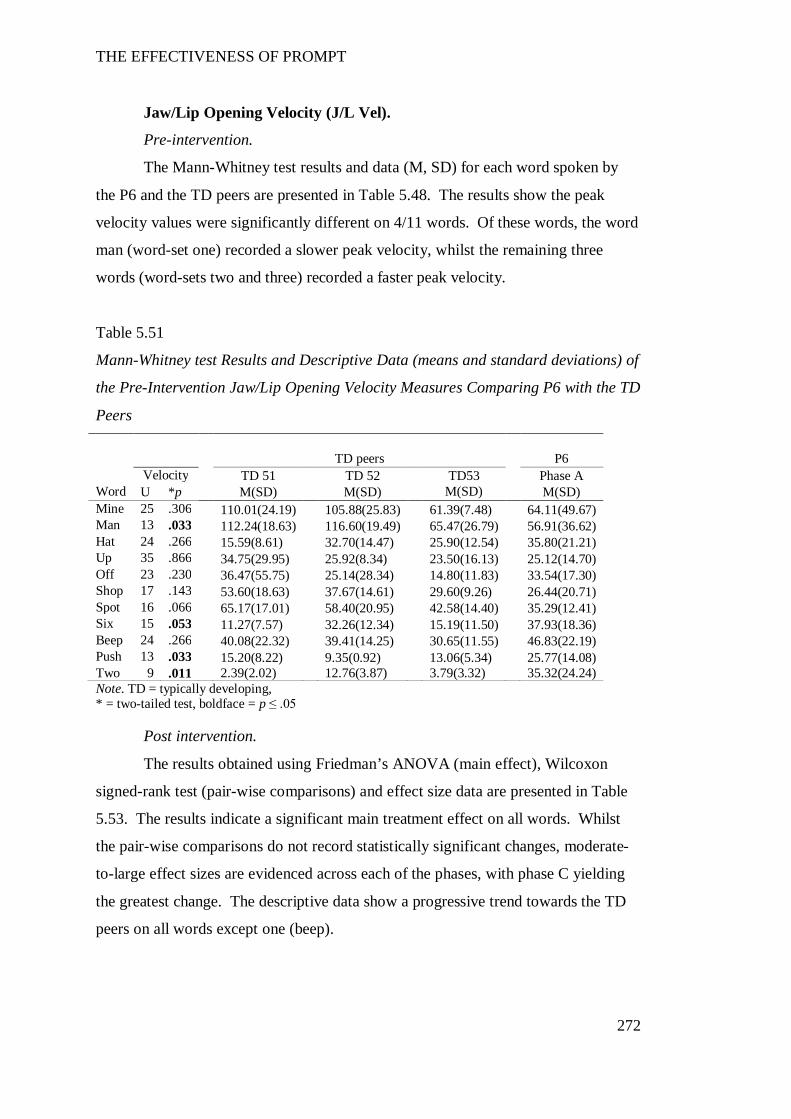
THE EFFECTIVENESS OF PROMPT
272
Jaw/Lip Opening Velocity (J/L Vel).
Pre-intervention.
The Mann-Whitney test results and data (M, SD) for each word spoken by
the P6 and the TD peers are presented in Table 5.48. The results show the peak
velocity values were significantly different on 4/11 words. Of these words, the word
man (word-set one) recorded a slower peak velocity, whilst the remaining three
words (word-sets two and three) recorded a faster peak velocity.
Table 5.51
Mann-Whitney test Results and Descriptive Data (means and standard deviations) of
the Pre-Intervention Jaw/Lip Opening Velocity Measures Comparing P6 with the TD
Peers TD peers P6 Velocity TD 51 TD 52 TD53 Phase A
Word U *p M(SD) M(SD) M(SD) M(SD) Mine 25 .306 110.01(24.19) 105.88(25.83) 61.39(7.48) 64.11(49.67) Man 13 .033 112.24(18.63) 116.60(19.49) 65.47(26.79) 56.91(36.62) Hat 24 .266 15.59(8.61) 32.70(14.47) 25.90(12.54) 35.80(21.21) Up 35 .866 34.75(29.95) 25.92(8.34) 23.50(16.13) 25.12(14.70) Off 23 .230 36.47(55.75) 25.14(28.34) 14.80(11.83) 33.54(17.30) Shop 17 .143 53.60(18.63) 37.67(14.61) 29.60(9.26) 26.44(20.71) Spot 16 .066 65.17(17.01) 58.40(20.95) 42.58(14.40) 35.29(12.41) Six 15 .053 11.27(7.57) 32.26(12.34) 15.19(11.50) 37.93(18.36) Beep 24 .266 40.08(22.32) 39.41(14.25) 30.65(11.55) 46.83(22.19) Push 13 .033 15.20(8.22) 9.35(0.92) 13.06(5.34) 25.77(14.08) Two 9 .011 2.39(2.02) 12.76(3.87) 3.79(3.32) 35.32(24.24) Note. TD = typically developing, * = two-tailed test, boldface = p ≤ .05
Post intervention.
The results obtained using Friedman’s ANOVA (main effect), Wilcoxon
signed-rank test (pair-wise comparisons) and effect size data are presented in Table
5.53. The results indicate a significant main treatment effect on all words. Whilst
the pair-wise comparisons do not record statistically significant changes, moderate-
to-large effect sizes are evidenced across each of the phases, with phase C yielding
the greatest change. The descriptive data show a progressive trend towards the TD
peers on all words except one (beep).
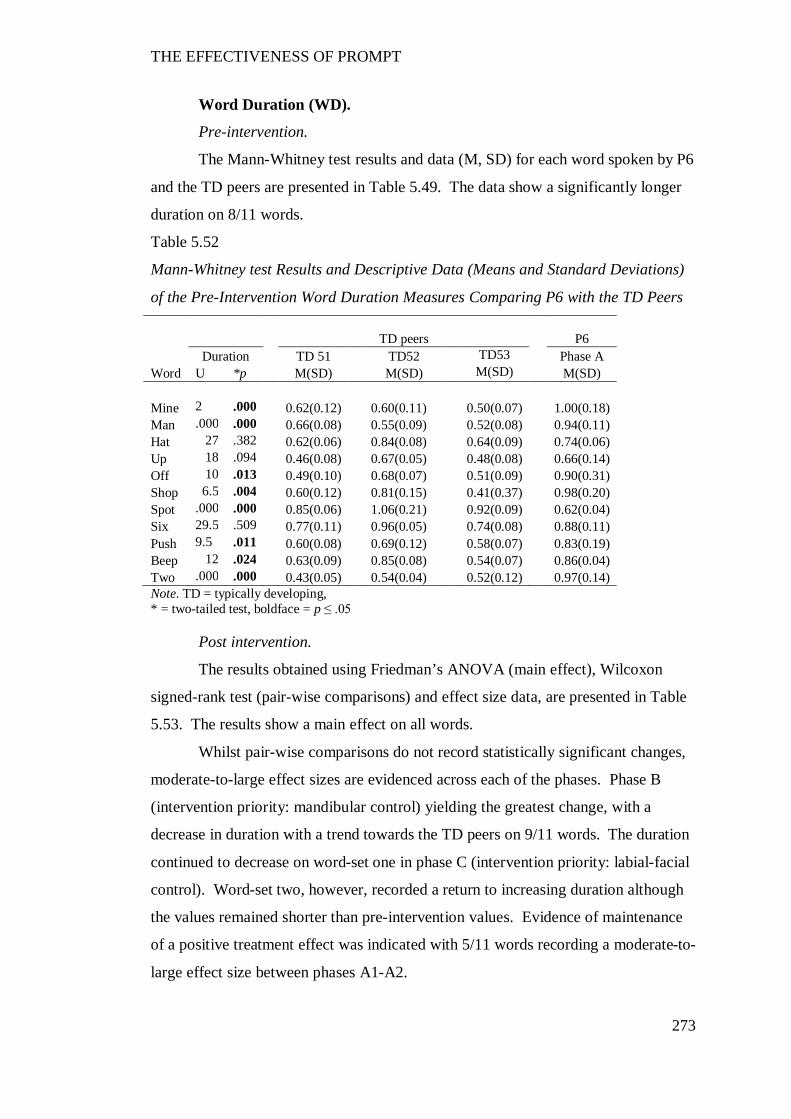
THE EFFECTIVENESS OF PROMPT
273
Word Duration (WD).
Pre-intervention.
The Mann-Whitney test results and data (M, SD) for each word spoken by P6
and the TD peers are presented in Table 5.49. The data show a significantly longer
duration on 8/11 words.
Table 5.52
Mann-Whitney test Results and Descriptive Data (Means and Standard Deviations)
of the Pre-Intervention Word Duration Measures Comparing P6 with the TD Peers
TD peers P6
Duration TD 51 TD52 TD53 Phase A Word U *p M(SD) M(SD) M(SD) M(SD) Mine 2 .000 0.62(0.12) 0.60(0.11) 0.50(0.07) 1.00(0.18) Man .000 .000 0.66(0.08) 0.55(0.09) 0.52(0.08) 0.94(0.11) Hat 27 .382 0.62(0.06) 0.84(0.08) 0.64(0.09) 0.74(0.06) Up 18 .094 0.46(0.08) 0.67(0.05) 0.48(0.08) 0.66(0.14) Off 10 .013 0.49(0.10) 0.68(0.07) 0.51(0.09) 0.90(0.31) Shop 6.5 .004 0.60(0.12) 0.81(0.15) 0.41(0.37) 0.98(0.20) Spot .000 .000 0.85(0.06) 1.06(0.21) 0.92(0.09) 0.62(0.04) Six 29.5 .509 0.77(0.11) 0.96(0.05) 0.74(0.08) 0.88(0.11) Push 9.5 .011 0.60(0.08) 0.69(0.12) 0.58(0.07) 0.83(0.19) Beep 12 .024 0.63(0.09) 0.85(0.08) 0.54(0.07) 0.86(0.04) Two .000 .000 0.43(0.05) 0.54(0.04) 0.52(0.12) 0.97(0.14) Note. TD = typically developing, * = two-tailed test, boldface = p ≤ .05
Post intervention.
The results obtained using Friedman’s ANOVA (main effect), Wilcoxon
signed-rank test (pair-wise comparisons) and effect size data, are presented in Table
5.53. The results show a main effect on all words.
Whilst pair-wise comparisons do not record statistically significant changes,
moderate-to-large effect sizes are evidenced across each of the phases. Phase B
(intervention priority: mandibular control) yielding the greatest change, with a
decrease in duration with a trend towards the TD peers on 9/11 words. The duration
continued to decrease on word-set one in phase C (intervention priority: labial-facial
control). Word-set two, however, recorded a return to increasing duration although
the values remained shorter than pre-intervention values. Evidence of maintenance
of a positive treatment effect was indicated with 5/11 words recording a moderate-to-
large effect size between phases A1-A2.
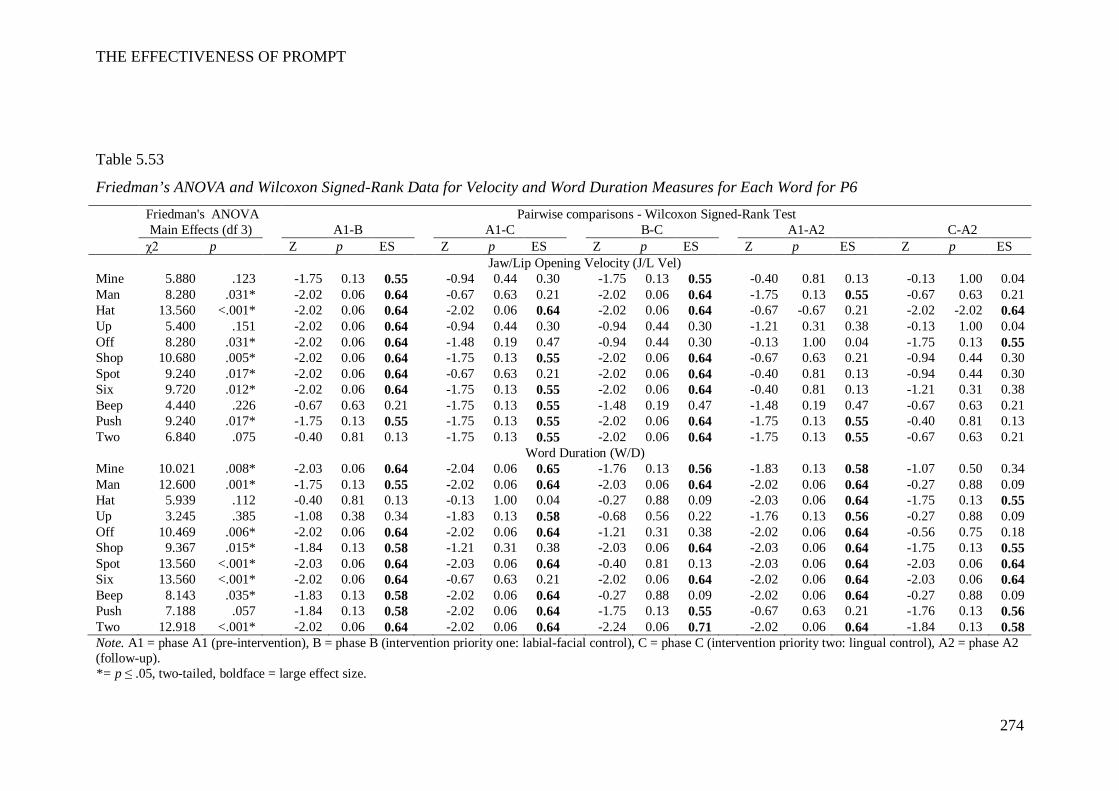
THE EFFECTIVENESS OF PROMPT
274
Table 5.53
Friedman’s ANOVA and Wilcoxon Signed-Rank Data for Velocity and Word Duration Measures for Each Word for P6 Friedman's ANOVA Pairwise comparisons - Wilcoxon Signed-Rank Test Main Effects (df 3) A1-B A1-C B-C A1-A2 C-A2 χ2 p Z p ES Z p ES Z p ES Z p ES Z p ES Jaw/Lip Opening Velocity (J/L Vel) Mine 5.880 .123 -1.75 0.13 0.55 -0.94 0.44 0.30 -1.75 0.13 0.55 -0.40 0.81 0.13 -0.13 1.00 0.04 Man 8.280 .031* -2.02 0.06 0.64 -0.67 0.63 0.21 -2.02 0.06 0.64 -1.75 0.13 0.55 -0.67 0.63 0.21 Hat 13.560 <.001* -2.02 0.06 0.64 -2.02 0.06 0.64 -2.02 0.06 0.64 -0.67 -0.67 0.21 -2.02 -2.02 0.64 Up 5.400 .151 -2.02 0.06 0.64 -0.94 0.44 0.30 -0.94 0.44 0.30 -1.21 0.31 0.38 -0.13 1.00 0.04 Off 8.280 .031* -2.02 0.06 0.64 -1.48 0.19 0.47 -0.94 0.44 0.30 -0.13 1.00 0.04 -1.75 0.13 0.55 Shop 10.680 .005* -2.02 0.06 0.64 -1.75 0.13 0.55 -2.02 0.06 0.64 -0.67 0.63 0.21 -0.94 0.44 0.30 Spot 9.240 .017* -2.02 0.06 0.64 -0.67 0.63 0.21 -2.02 0.06 0.64 -0.40 0.81 0.13 -0.94 0.44 0.30 Six 9.720 .012* -2.02 0.06 0.64 -1.75 0.13 0.55 -2.02 0.06 0.64 -0.40 0.81 0.13 -1.21 0.31 0.38 Beep 4.440 .226 -0.67 0.63 0.21 -1.75 0.13 0.55 -1.48 0.19 0.47 -1.48 0.19 0.47 -0.67 0.63 0.21 Push 9.240 .017* -1.75 0.13 0.55 -1.75 0.13 0.55 -2.02 0.06 0.64 -1.75 0.13 0.55 -0.40 0.81 0.13 Two 6.840 .075 -0.40 0.81 0.13 -1.75 0.13 0.55 -2.02 0.06 0.64 -1.75 0.13 0.55 -0.67 0.63 0.21
Word Duration (W/D) Mine 10.021 .008* -2.03 0.06 0.64 -2.04 0.06 0.65 -1.76 0.13 0.56 -1.83 0.13 0.58 -1.07 0.50 0.34 Man 12.600 .001* -1.75 0.13 0.55 -2.02 0.06 0.64 -2.03 0.06 0.64 -2.02 0.06 0.64 -0.27 0.88 0.09 Hat 5.939 .112 -0.40 0.81 0.13 -0.13 1.00 0.04 -0.27 0.88 0.09 -2.03 0.06 0.64 -1.75 0.13 0.55 Up 3.245 .385 -1.08 0.38 0.34 -1.83 0.13 0.58 -0.68 0.56 0.22 -1.76 0.13 0.56 -0.27 0.88 0.09 Off 10.469 .006* -2.02 0.06 0.64 -2.02 0.06 0.64 -1.21 0.31 0.38 -2.02 0.06 0.64 -0.56 0.75 0.18 Shop 9.367 .015* -1.84 0.13 0.58 -1.21 0.31 0.38 -2.03 0.06 0.64 -2.03 0.06 0.64 -1.75 0.13 0.55 Spot 13.560 <.001* -2.03 0.06 0.64 -2.03 0.06 0.64 -0.40 0.81 0.13 -2.03 0.06 0.64 -2.03 0.06 0.64 Six 13.560 <.001* -2.02 0.06 0.64 -0.67 0.63 0.21 -2.02 0.06 0.64 -2.02 0.06 0.64 -2.03 0.06 0.64 Beep 8.143 .035* -1.83 0.13 0.58 -2.02 0.06 0.64 -0.27 0.88 0.09 -2.02 0.06 0.64 -0.27 0.88 0.09 Push 7.188 .057 -1.84 0.13 0.58 -2.02 0.06 0.64 -1.75 0.13 0.55 -0.67 0.63 0.21 -1.76 0.13 0.56 Two 12.918 <.001* -2.02 0.06 0.64 -2.02 0.06 0.64 -2.24 0.06 0.71 -2.02 0.06 0.64 -1.84 0.13 0.58 Note. A1 = phase A1 (pre-intervention), B = phase B (intervention priority one: labial-facial control), C = phase C (intervention priority two: lingual control), A2 = phase A2 (follow-up). *= p ≤ .05, two-tailed, boldface = large effect size.
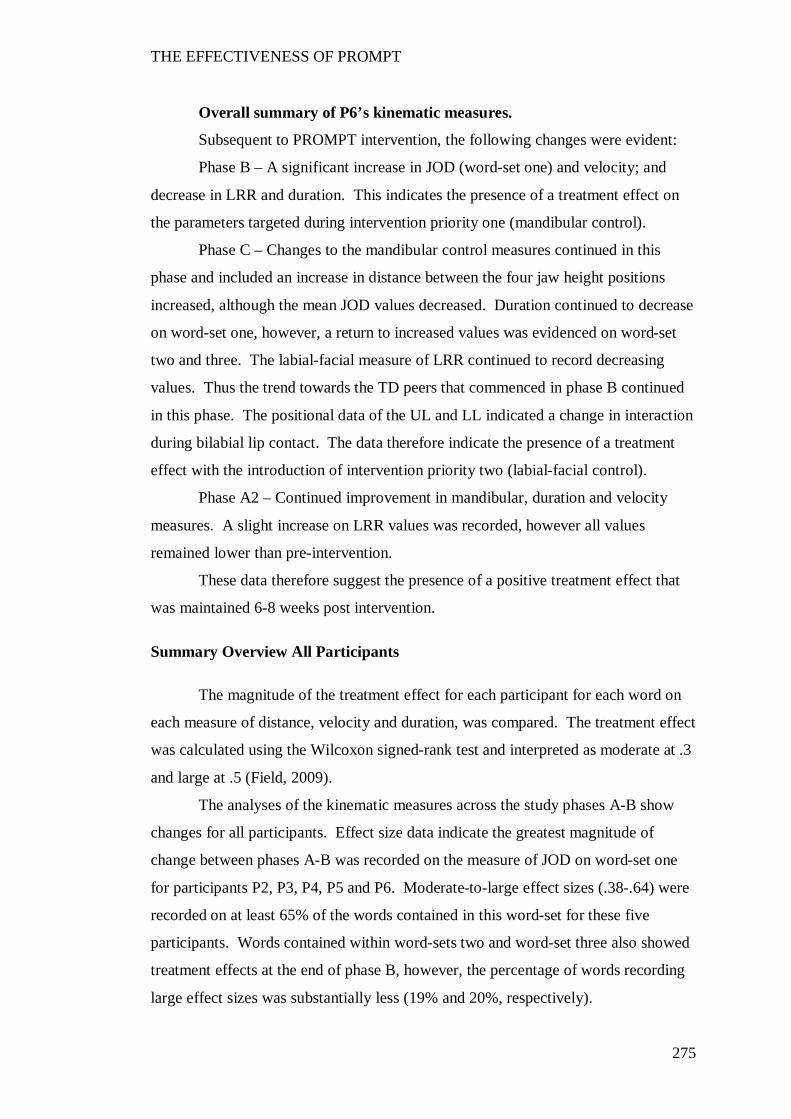
THE EFFECTIVENESS OF PROMPT
275
Overall summary of P6’s kinematic measures.
Subsequent to PROMPT intervention, the following changes were evident:
Phase B – A significant increase in JOD (word-set one) and velocity; and
decrease in LRR and duration. This indicates the presence of a treatment effect on
the parameters targeted during intervention priority one (mandibular control).
Phase C – Changes to the mandibular control measures continued in this
phase and included an increase in distance between the four jaw height positions
increased, although the mean JOD values decreased. Duration continued to decrease
on word-set one, however, a return to increased values was evidenced on word-set
two and three. The labial-facial measure of LRR continued to record decreasing
values. Thus the trend towards the TD peers that commenced in phase B continued
in this phase. The positional data of the UL and LL indicated a change in interaction
during bilabial lip contact. The data therefore indicate the presence of a treatment
effect with the introduction of intervention priority two (labial-facial control).
Phase A2 – Continued improvement in mandibular, duration and velocity
measures. A slight increase on LRR values was recorded, however all values
remained lower than pre-intervention.
These data therefore suggest the presence of a positive treatment effect that
was maintained 6-8 weeks post intervention.
Summary Overview All Participants
The magnitude of the treatment effect for each participant for each word on
each measure of distance, velocity and duration, was compared. The treatment effect
was calculated using the Wilcoxon signed-rank test and interpreted as moderate at .3
and large at .5 (Field, 2009).
The analyses of the kinematic measures across the study phases A-B show
changes for all participants. Effect size data indicate the greatest magnitude of
change between phases A-B was recorded on the measure of JOD on word-set one
for participants P2, P3, P4, P5 and P6. Moderate-to-large effect sizes (.38-.64) were
recorded on at least 65% of the words contained in this word-set for these five
participants. Words contained within word-sets two and word-set three also showed
treatment effects at the end of phase B, however, the percentage of words recording
large effect sizes was substantially less (19% and 20%, respectively).
THE EFFECTIVENESS OF PROMPT
276
The word-set data also show all participants recorded changes to the
kinematic measures across the study phases B-C. Effect size data indicate the
greatest magnitude of change was recorded on the measure of LRR for participants
P1, P2, P4, P5 and P6. Both word-sets one and two recorded moderate-to-large
treatment effects whilst 75% of word-set three recorded small treatment effects.
Discussion
“…clinicians are beginning to appreciate the considerable advantages of
instrumental analysis, which provide quantitative, objective data on a wide range of
different speech parameters far beyond the scope of an auditory-based
impressionistic judgment (Thompson-Ward & Murdoch, 1998, p. 68).
In this section the effectiveness of PROMPT in facilitating changes to the
measures of distance, velocity and duration, of the jaw and lips of children with CP,
was evaluated. It was hypothesised that changes in the movement patterns of the jaw
and lips would be accompanied by improved speech intelligibility. The kinematic
measures of the participants were also compared to a small group of TD peers. This
was for the purposes of interpreting the functional movement synergies in the
participants with CP compared to those exhibited by their TD peers prior to
intervention and the trend direction of the changes subsequent to PROMPT
intervention.
The pre-intervention findings suggested the use of motor-speech movement
patterns indicative of functional impairment to jaw control. These movement
patterns were associated with low levels of speech intelligibility in all participants.
All participants recorded significant changes in the jaw and lip measures that
reflected those targeted across the phases of the study. These changes were
associated with improved speech intelligibility for all participants.
The study results are discussed first by assessing the pre-existing motor-
speech patterns then followed by discussing the changes observed subsequent to
intervention. The use of PROMPT and specifically tactile-kinaesthetic input in the
establishment of new motor-speech-movement patterns is subsequently evaluated.
THE EFFECTIVENESS OF PROMPT
277
Pre-Existing Motor-Speech Movement Patterns
All participants recorded jaw distance values that indicated reduced jaw
movement space and grading (see animation ‘man’: viewable on the accompanying
DVD). That is, four of the six participants (P2, P4, P5 and P6) recorded reduced jaw
movements in words containing low vowels, and five participants (P1, P2, P3, P5
and P6) exhibited increased movements in words containing high vowels. Four
participants also recorded measures that showed increased lateral deviation from
midline, thus indicating jaw instability.
The jaw movement patterns of P3 differed markedly from the other participants.
In contrast to the other participants all jaw movements were excessive across all
words. Thus, there was limited difference between the mean values between words
containing high and low vowels. These results are consistent with the interpretation
of poor jaw grading and reduced movement space.
The use of reduced jaw movement space could be interpreted as either a
compensation strategy aimed at achieving jaw stability or a function of the
neurological damage associated with CP. The literature indicates increased precision
in movement can be achieved through limiting the degrees of freedom of movement
through voluntary increases in stiffness (displacement against resistance) (Nazari,
Perrier, Chabanas, & Payan, 2011). Shiller, Laboissiére and Ostry (2002) found jaw
positions that were closer to occlusion (e.g., high vowels) recorded increased
stiffness whilst jaw movements associated with low vowels recorded lower levels of
stiffness. Given the jaw provides postural support for the lips and tongue, the use of
reduced jaw space observed in the participants in this study could be viewed as an
adaptive strategy in an attempt to increase stability and precision of movement.
Support for this hypothesis can be found in CP gait and upper limb literature (van
Roon, Steenbergen, & Meulenbroek, 2005).
Alternatively, the reduced movement space could be considered a function of
aberrant motor control, as a result of impairment in the central nervous system.
Increased stiffness may be achieved through co-activation of agonist and antagonist
muscles and is a feature of early motor learning (Darainy & Ostry, 2008). However,
the literature reports evidence of excessive co-contraction in children with CP, as
compared with TD peers (Tedroff, Knutson, & Soderberg, 2008). Neilson and
O’Dwyer (1981) also propose the abnormal timing and sequence of muscle activity
THE EFFECTIVENESS OF PROMPT
278
observed in their adult dysarthric speakers may be due to inappropriate contractions
of antagonistic muscles reducing the effectiveness of agonist muscles. Thus, both
interpretations for explaining the reduced movement space are plausible and suggest
the need for further research.
In addition to reduced movement space, five participants demonstrated
impaired interaction between the upper lip (UL) and lower lip (LL) during bilabial
closure (see animation ‘shop’: viewable on the accompanying DVD). The vertical
position of the UL and LL at minimum bilabial contact, as measured in the kinematic
signal, was used to evaluate the interaction between the UL and LL in this study
(Löfqvist & Gracco, 1997). Five participants demonstrated significantly different
inter-lip distance measures on at least 2/4 words. Three participants (P3, P4 and P6)
recorded excessive elevation of the LL in comparison to the age-and-gender-matched
TD peers, with P3 recording values that indicated the LL exceeded the UL during
bilabial closure. All participants recorded values that indicated limited engagement
of the UL. The age-and-gender matched peers in this study recorded mean negative
values between -1and-5mm. This value indicates that at the point of minimum
bilabial contact the UL was positioned inferiorly to rest. The participants with CP
however, recorded positive values that indicated an elevated UL position. Empirical
research has shown that whilst considerable variability exists in individual
movement patterns, the UL displacement is influenced by the position of the LL
(Green et al., 2002; Löfqvist & Gracco, 1997). The results obtained here suggest
either the LL forced the UL superiorly or that lack of bilabial contact resulted in an
absence of compression. These results indicate the jaw was the principle articulator
driving bilabial closure.
In addition to difficulty with bilabial lip contact, all participants used an
excessive pattern of lip retraction across neutral, rounded and retracted phonemes in
comparison to the TD peers. This may suggest difficulty grading lip movements or
possible recruitment of additional muscles to maintain jaw opening and closing
movements. The generation of compensatory labial movements to maintain jaw
control (Folkins & Canty, 1986; Gomi, Honda, Ito, & Murano, 2002) lend support to
this interpretation. The difficulties observed on two measures of lip
rounding/retraction and bilabial closure suggest poor integration of lip and jaw
movements.
THE EFFECTIVENESS OF PROMPT
279
Motor-Speech Movement Patterns Subsequent to PROMPT
The PROMPT intervention protocol was designed to acknowledge the inter-
hierarchical relationship between existing and developing behaviours, and the stages
of motor acquisition and consolidation. When intervention focuses on establishing a
skill that is within an existing coordination synergy, both an increase in performance
accuracy and stabilisation is expected. These newly established behaviours are
vulnerable to competition. Consequently, when intervention focuses on developing a
skill that requires re-organisation of existing co-ordination synergies, competition
between the existing synergies may occur as a result of learning being biased to the
“to-be-learned” behaviour. Consolidation defines the post-training phase where
continued gains in performance may be observed and susceptibility to
interference/competition decreases (Kelso & Zanone, 2002).
The results obtained in Phase B (intervention priority one) of this study are
consistent with the expected early stages of motor learning. The data for all
participants indicate a trend towards the performance patterns of their age-and-
gender-matched TD peers on the targeted intervention priority. These motor-speech
movement changes were accompanied by gains to speech intelligibility between 8%
and 22%. In addition, the kinematic data were collected one week post-intervention,
thus indicating the new functional synergy had been established and retained in the
short-term.
The results obtained in phase C represent not only acquisition of a new
functional synergy but also the impact of training this new behaviour on a recently
acquired skill. All participants recorded a trend direction toward their age-and-
gender-matched typically developing (TD) peers on the behaviour targeted during
intervention priority two, accompanied by changes in speech intelligibility. Again,
the testing was conducted one week-post intervention, similarly suggesting retention
of the newly established behaviours. At the end of phase C, five participants
recorded further gains to speech intelligibility between 4% and 14%. Whilst some
participants continued to record improvement on the first intervention priority, three
participants (P1, P3 and P5) recorded a trend away from the TD peers on some
behaviours targeted in phase B. One participant (P5) also recorded an associated
decrease in speech intelligibility of 10%. These results suggest a change in the
dynamics of the newly established coordination patterns on the earlier trained
THE EFFECTIVENESS OF PROMPT
280
intervention priorities (of phase B) as indicated by the results obtained on
intervention in phase C.
A number of possible processes may be considered as explanation for the
trend away from the TD peers in phase C for skills previously acquired in phase B.
The work of Zanone, Kostrubiec and Temprado (2006) indicates the “empirical
signature” of skill acquisition is the concurrent improvement of both accuracy and
stability. An a priori decision was made to continue to the next intervention phase
regardless of performance. Thus, the newly acquired motor pattern may not have
been sufficiently established or stable and consequently vulnerable to interference.
However, the work of Dorfberger, Adi-Japha and Karni (2007), indicated children
are less susceptible than adolescents and adults, to interference. Given these
findings, a second plausible explanation is that the introduction of the second
intervention priority imposed adaptation or re-calibration by establishing ‘a new
attractive state of the underlying coordination dynamics close to the task
requirement’ (Kelso and Zanone, 2002, p. 782). This adaptation may have been
essential to the process of integration for the development of more functional
movement synergies. Evidence of re-calibration has been reported in the motor
literature in typical development. For example, Chen, Metcalfe, Jeka and Clark
(2007) report disruption in the sitting of posture of infants subsequent to
accommodating the newly emerging behaviour of independent walking.
An additional explanation drawn from neurophysiological research considers
the potential for a relationship to exist between the type of cerebral palsy (and
severity) and potential impact on retention of motor speech learning. Recent brain
imaging studies have indicated a time course of differential plastic changes in the
neural system throughout the process of motor learning. Specifically, the research of
Doyon and Benali (2005) indicates that whilst both the cortico-striatal and cortico-
cerebellar systems play a role in motor skill acquisition, the automatic execution of
motor adaptation tasks produces long term plastic changes in the cortico-cerebellar
system. One of the participants (P1), who recorded a decrease in earlier acquired
behaviours between phase B and C, had a diagnosis of dyskinetic CP. This type of
CP is characterised by impairment to the cerebellum and basal ganglia. This
therefore raises the potential value of research into understanding the role of the
cortico-cerebellar system in long-term retention of newly acquired motor skills in
children with CP.
THE EFFECTIVENESS OF PROMPT
281
The data in this study suggest the potential need to consider the integration of
consolidation periods into the design of intervention programs. Post intervention
data (phase A2) show all participants continued to record changes to the movement
patterns of the jaw and lips. The data indicate a trend towards the age-and-gender-
matched TD peers, including those measures that had moved away during phase C.
Four participants also recorded follow-up measures that indicated continued
improvement in speech intelligibility in the absence of intervention. These data
suggest the non-intervention period that occurred at the end of phase C provided a
period of consolidation that resolved the competition between the motor-speech
behaviours that were targeted across the two intervention priorities. These results
are supported by recent research that found prior to adolescence, continued
improvement during the consolidation phase occurred (Dorfberger et al., 2007).
Continued learning in the rest periods between intervention phases has also
previously been reported in children with CP. Trahan & Malouin (2002)
implemented a multiple-baseline-across-participants (A, Bt1r1, Bt2r2, where t =
treatment, r = rest for 8 weeks) design that manipulated intensity of intervention to
evaluate the effects of both therapy dosage and learning during rest periods. During
the baseline phase neurodevelopmental intervention was provided twice weekly for 8
weeks. During the first intervention phase, the same intervention was offered 4
times a week for 8 weeks. Therapy sessions were 45 minutes in duration. The
authors report 3 of the 5 participants recorded data that indicated continued learning
during the rest period. It is however, this author’s interpretation of the data that one
of these 3 participants showed data consistent with an accelerating baseline (i.e., a
trend direction towards the desired behaviour change), and as a result only two of the
five participants can be considered as having clearly demonstrating continued
learning in the rest periods.
Delayed post testing is recommended as a tool to assess acquisition and
generalisation in treatment (Maas et al., 2008). However, the value of considering
time as a critical piece in the development of an intervention protocol aimed at
establishing new motor speech movement patterns, for children with impaired motor
speech control, is possibly indicated.
THE EFFECTIVENESS OF PROMPT
282
Conclusion
It is concluded that the changes observed in the kinematic measures of distance,
velocity and duration, of the jaw and lips for the six participants of this study, can be
attributed to the PROMPT intervention.
Prior to intervention, all participants presented with speech movement patterns
that showed impaired mandibular control, with reduced movement space. All
participants recorded significant changes in the jaw and lip measures that reflected
those targeted across the phases of the study. In addition, at follow-up these changes
were generally in the direction towards the movement patterns of a cohort of
typically developing peers.
Whilst kinematic analysis was not used to establish intervention priorities, the
value of using instrumental analysis to tailor intervention to the individual needs of
each participant was substantiated. These findings support recommendations in the
literature that clinicians interpret the phonetic inventories and phonological
processes, of children with motor speech disorders associated with CP, within the
context of the movement competencies of the individual articulators (Netsell, 2001).
The outcome measures reported in this and the preceding chapter have
focused at the impairment level of the ICF. The following chapter reports on the
effectiveness of the PROMPT intervention in translating these changes into
functional and meaningful improvements as measured by changes in the Activity and
Participation domains of the ICF (Eadie et al., 2006).
THE EFFECTIVENESS OF PROMPT
283
CHAPTER 6 QUESTION THREE
WILL CHILDREN WITH CP SHOW CHANGES IN THE ACTIVITY AND
PARTICIPATION DOMAINS OF THE ICF SUBSEQUENT TO PROMPT
INTERVENTION?
Introduction
One of the primary goals of intervention for children with motor-speech
disorders associated with CP is to improve communicative function in order to
enhance activity and participation opportunities, and ultimate quality of life
(Enderby, 2000; Hodge & Wellman, 1999; Hustad, 2006; Palmer & Enderby, 2007;
Workinger, 2005). To achieve this objective, clinicians need an integrated holistic
framework for both establishing therapy goals and evaluating therapy outcomes.
The World Health Organisation’s (WHO) International Classification of
Functioning, Disability and Health for Children and Youth (ICF- CY) is the accepted
framework used by speech pathologists in the management of communication
disorders. This acceptance is indicated through the adoption by the American
Association of Speech Language and Hearing (ASHA, 2007) and Speech Pathology
Australia (SPA, 2003) Scope of Practice.
Recognition of the ICF-CY as a framework for structuring and informing
intervention services has highlighted the need for outcome measures to not only
identify changes at the level of the impairment but also positive changes in activity
limitations and participation restrictions (McLeod, 2006; McLeod & Bleile, 2004;
Morris, 2009; Rosenbaum & Stewart, 2004; Threats & Worrall, 2004). Outcome
measures need to be multidimensional with emphasis placed on evaluating the
impact of intervention on each of the ICF domains. As stated by Morris et al.
(2006), the instruments used to assess these changes needs to “adequately cover the
relevant domains, have salience for the children and families, and demonstrated
validity and reliability” (p. 961) of the child’s personal experiences, subsequent to
intervention. Outcome measures therefore need to reflect changes to all domains of
impairment, activity and participation and evaluate the enhancement of an
individual’s life experiences.
THE EFFECTIVENESS OF PROMPT
284
The focus of this chapter of the thesis is to evaluate changes to the ICF
domains of activity and participation for each of the participants, subsequent to
participation in the PROMPT intervention.
Two outcome measures were selected. The first measure focused specifically
on changes to speech intelligibility. This entailed the repeated administration of a
formalised assessment (The Children’s Speech Intelligibility Measure,Wilcox &
Morris, 1999) that utilises a closed set task format scored by an unfamiliar listener.
Recent evidence suggests the use of forced-choice format reduces variability in
listener judgments of speech intelligibility (McHenry, 2011). This is particularly
relevant when assessing the speech of speakers with moderate to severe speech
impairment. In addition, this test has been shown to have an established validity and
sensitivity in detecting changes to speech intelligibility in children with CP
(Pennington et al., 2009; Pennington et al., 2006).
Whilst the use of formalised speech intelligibility measurements, as a means
to assess the activity domain of the ICF, has a long history, the application of
assessment measures relevant to the evaluation of changes in participation is less
established (Eadie et al., 2006; McLeod & Bleile, 2004).
McLeod and Bleile (2004) suggest a viable tool available for speech
pathologists in the evaluation of the participation domain of the ICF is the gathering
of qualitative descriptions of participation in family, school and social situations.
The Canadian Occupational Performance Measure (Law et al., 2005) is one
such tool that has established robustness and validity in the field of CP (De Rezze et
al., 2008). This second measure was utilised to focus more globally on evaluating
changes to activity and participation within the context of a child’s daily routine.
The COPM was designed specifically as an outcome measure using a semi-
structured interview and has 3 main categories that are further divided into a 13
subcategories. The three categories include daily living (self-care, mobility,
communication, and other daily activities), productivity (e.g., education) and leisure
(e.g., play, leisure and social participation. These three sections of the COPM reflect
the 9 subdomains of the Activity and Participation domains of the ICF that include:
learning and applying knowledge, general tasks and demands, communication,
mobility, self-care, domestic life, interpersonal interactions and relationships, major
life areas, and community, social and civic life.
The research questions addressed in this chapter are:
THE EFFECTIVENESS OF PROMPT
285
Will children with CP show changes in the Activity and Participation domains of the
ICF subsequent to intervention? The following two specific questions were posed:
3.1 Will unfamiliar listeners identify improvements in speech intelligibility
subsequent to intervention?
3.2 Will children with CP show improved participation in tasks and actions
of daily life with family members and friends subsequent to the PROMPT
intervention?
Method
Participants
The reader is referred to chapter 4 for a full description of the participants.
Measures
Children’s Speech Intelligibility Measure (CSIM) (Wilcox and Morris,
1999).
The Children’s Speech Intelligibility Measure (CSIM) (Wilcox & Morris,
1999) is a standardised test of speech intelligibility available for children aged 3 to
10 years. The child is required to repeat 50 words modelled by the examiner. Only
the child’s responses are recorded. An independent unfamiliar adult identifies the
word spoken by the child by circling the word on a multi-choice checklist. The test
has 100 different versions of the stimulus list. This allowed the investigator to select
randomly from a number of word lists and prevent practice effects during the study.
The test yields a raw score that is converted to a percentage correct score.
The manual provides a table with 90% confidence intervals across the age groups.
The presence of non-overlapping data between occasions of testing suggests a
significant change in behaviour.
Wilcox and Morris (1999) report same form test-retest reliability correlation
coefficients between .79 and .91; and alternate form correlation coefficients between
.64 and .86. Correlations were weakest for the younger age-groups. Previous
research evaluating treatment effectiveness in children with CP, has found this test to
be sensitive to change in a similar time frame to this study (Pennington et al., 2006)
THE EFFECTIVENESS OF PROMPT
286
The Canadian Occupational Performance Measure (COPM) (Law et al.,
2005).
The COPM is a client-centred outcome measure designed to evaluate an
individual’s perception of “occupational performance” (as described in the literature
review) over the course of a therapeutic intervention. The use of the COPM as a
measure for assessing change to the ICF domains of activity and participation in
children with CP has previously been reported in the literature (A. Martin, Burtner,
Poole, & Phillips, 2008). It is an individualised measure, designed for use with
clients of all ages. The COPM utilises a semi-structured interview format that takes
approximately 15-30 minutes to administer.
Law et al. (2005) identified a four step administration process – client
identification of goals, rating of importance, scoring and reassessment:
Goal identification - Occupational performance is typically categorised under
the areas of self-care (personal, functional mobility and community), productivity
(paid/unpaid work, household management and play/school) and leisure (quiet
recreation, active recreation and socialisation). These categories are not obligatory
and the authors (Law et al., 2005) state the therapist should not be constrained by
them. However, it is important the client is encouraged to identify priority
goals/activities based on what the client needs, wants or is expected to do within
their daily activities.
Importance – The client is asked to use a 10-point evaluation scale to rate
each goal/activity, where 1 = not important at all, and 10 = extremely important.
This rating scale is used to identify intervention priorities.
Scoring – Each goal/activity is scored for both satisfaction and performance
using the 10-point evaluation scale. Law et al. (2005) suggest a maximum of five
goals.
Reassessment – Each goal is re-evaluated for both satisfaction and
performance using the same 10-point scale.
The COPM is not norm-referenced and therefore does not yield standardized
scores. Two scores are obtained – a satisfaction score and a performance score.
Change in performance and change in satisfaction is calculated by subtracting
assessment occasion one from assessment occasion two for each item. The authors
report test-retest reliability of .8.
THE EFFECTIVENESS OF PROMPT
287
Administration of the COPM for the purposes of this study differed in the
following ways:
1. Goal identification – Group goals were identified for this study.
Permission to do so was obtained from the first author (Law, personal
communication, 2009).
Upon establishment of suitability for inclusion in this study, the parents of
each participant were given a copy of what was termed the “parent satisfaction
survey” (Appendix C). This parent satisfaction survey formed the basis of the
interview. During the first interview, parents were asked to rate the importance of 13
items. These 13 items represented five subdomains of the activity and participation
domains of the ICF. All parents rated all items as highly important, with no item
scoring less than 8/10.
2. Occupational Performance Areas – For the purposes of this study the
occupational performance areas were selected to represent the Activity and
Participation domain of the ICF-CY (WHO, 2007) and coded using the three
domains of the PROMPT framework - that is the physical-sensory, cognitive-
linguistic and social-emotional domains. The first four items on the survey were
classified within the physical-sensory domain and directly targeted during the
intervention protocol. These were considered the COPM goals. Items 5 through 13
were not directly targeted in intervention and represented the cognitive-linguistic and
social-emotional domains.
3. Parents as respondents – Law et al. (2005) acknowledge the role of
parents as responders in the “Special applications of the COPM” section of the
manual. Given the age range of the participants in this study (3 – 11 years) parents
were selected as the respondents.
Cusick, Lannin and Lowe (2007) reported on the internal consistency and
construct validity of an adapted COPM. In this study, the occupational performance
domains were modified and parents of children with CP acted as proxies. Using the
Cronbach alpha statistic, internal consistency reliability was .73 and .83 for total
performance and satisfaction, respectively. These results indicate the COPM is a
robust tool that was not negatively affected by the modifications.
THE EFFECTIVENESS OF PROMPT
288
Procedure
The reader is referred to Table 4.4 for a summary of the testing occasions of
these measures throughout the study phases. The chief investigator administered the
speech intelligibility measure and COPM at the end of each study phase as detailed
in chapter 4.
Reliability and Fidelity
Children’s Speech intelligibility Measure (CSIM) (Wilcox & Morris,
1999).
An independent untrained naïve listener scored all the participants on each
testing occasion. The scoreforms were randomly presented to the scorer who was
blinded to the participants, testing occasion and purpose of the study.
Twenty percent of the sample was randomly selected for re-scoring. Intra-
rater agreement was 100%.
The Canadian Occupational Performance Measure (COPM) (Law et al.,
2005).
In order to administer the COPM, a therapist is required to adhere to the
principles of client-centredness (Law et al., 2005).
The chief investigator administered the COPM. In addition to completing the
COPM training manual and video, the chief investigator has also worked within a
family-centred practice model for in excess of 10 years. This has involved attending
a variety of specific family-centred practice workshops.
The chief investigator also required the same parent, for each participant,
complete the questionnaire on each re-assessment occasion.
Data Analysis
The Children’s Speech Intelligibility Measure (CSIM) (Wilcox &
Morris, 1999).
An untrained unfamiliar listener blinded to the purpose and phases of the
study scored all participants performance on the Children’s Speech Intelligibility
Measure (CSIM) (Wilcox and Morris, 1999).
THE EFFECTIVENESS OF PROMPT
289
The test was scored by tallying the number of correctly identified words and
calculating a percentage intelligibility score. A statistically significant change was
determined by the absence of non-overlapping data in the 90% confidence intervals
provided in the examiner manual.
In addition to the confidence intervals, the magnitude of the treatment effect
was calculated using Cohen’s d.
The Canadian Occupational Performance Measure (COPM) (Law et al.,
2005).
Two scores were calculated on the performance and satisfaction items of the
COPM: a “domain change” score and an “item change” score.
To calculate the domain change score the ratings of each of the items within
each of the domains were summed for each participant and divided by the total
number to get a mean total score.
To calculate the item change score, the rating on each of the 13 individual
items for each participant was summed and divided by the total number of items to
get a mean total score.
Friedman’s ANOVA (p ≤.05) was used to test whether changes in both
performance and satisfaction were recorded in each of the domains as well as the
individual items subsequent to the PROMPT intervention. Bonferroni-corrected
pairwise comparisons using the Wilcoxon signed-rank test (p ≤. 016) were used to
evaluate the significance of the differences across the study phases.
Results
Speech Intelligibility
Speech intelligibility was measured at a single word level using the
Children’s Speech Intelligibility Measure (CSIM) (Wilcox & Morris, 1999). The
test was administered on four occasions: pre-baseline (pre Phase-A), end of phases B
and C, and at 6-8 weeks follow-up (phase A2).
Intelligibility scores for each participant are shown in Table 4.33. The test
score and confidence intervals are reported as scored by an independent, untrained
naive listener.
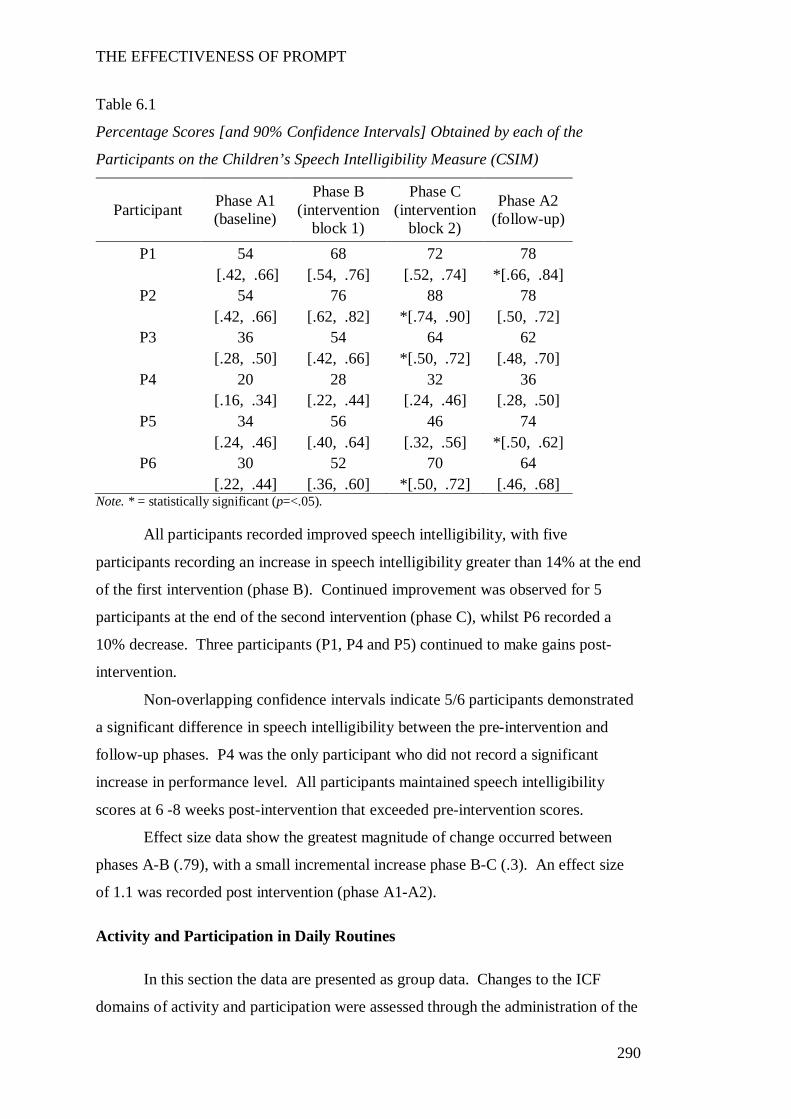
THE EFFECTIVENESS OF PROMPT
290
Table 6.1
Percentage Scores [and 90% Confidence Intervals] Obtained by each of the
Participants on the Children’s Speech Intelligibility Measure (CSIM)
Participant Phase A1 (baseline)
Phase B (intervention
block 1)
Phase C (intervention
block 2)
Phase A2 (follow-up)
P1 54 68 72 78 [.42, .66] [.54, .76] [.52, .74] *[.66, .84]
P2 54 76 88 78 [.42, .66] [.62, .82] *[.74, .90] [.50, .72]
P3 36 54 64 62 [.28, .50] [.42, .66] *[.50, .72] [.48, .70]
P4 20 28 32 36 [.16, .34] [.22, .44] [.24, .46] [.28, .50]
P5 34 56 46 74 [.24, .46] [.40, .64] [.32, .56] *[.50, .62]
P6 30 52 70 64 [.22, .44] [.36, .60] *[.50, .72] [.46, .68]
Note. * = statistically significant (p=<.05).
All participants recorded improved speech intelligibility, with five
participants recording an increase in speech intelligibility greater than 14% at the end
of the first intervention (phase B). Continued improvement was observed for 5
participants at the end of the second intervention (phase C), whilst P6 recorded a
10% decrease. Three participants (P1, P4 and P5) continued to make gains post-
intervention.
Non-overlapping confidence intervals indicate 5/6 participants demonstrated
a significant difference in speech intelligibility between the pre-intervention and
follow-up phases. P4 was the only participant who did not record a significant
increase in performance level. All participants maintained speech intelligibility
scores at 6 -8 weeks post-intervention that exceeded pre-intervention scores.
Effect size data show the greatest magnitude of change occurred between
phases A-B (.79), with a small incremental increase phase B-C (.3). An effect size
of 1.1 was recorded post intervention (phase A1-A2).
Activity and Participation in Daily Routines
In this section the data are presented as group data. Changes to the ICF
domains of activity and participation were assessed through the administration of the
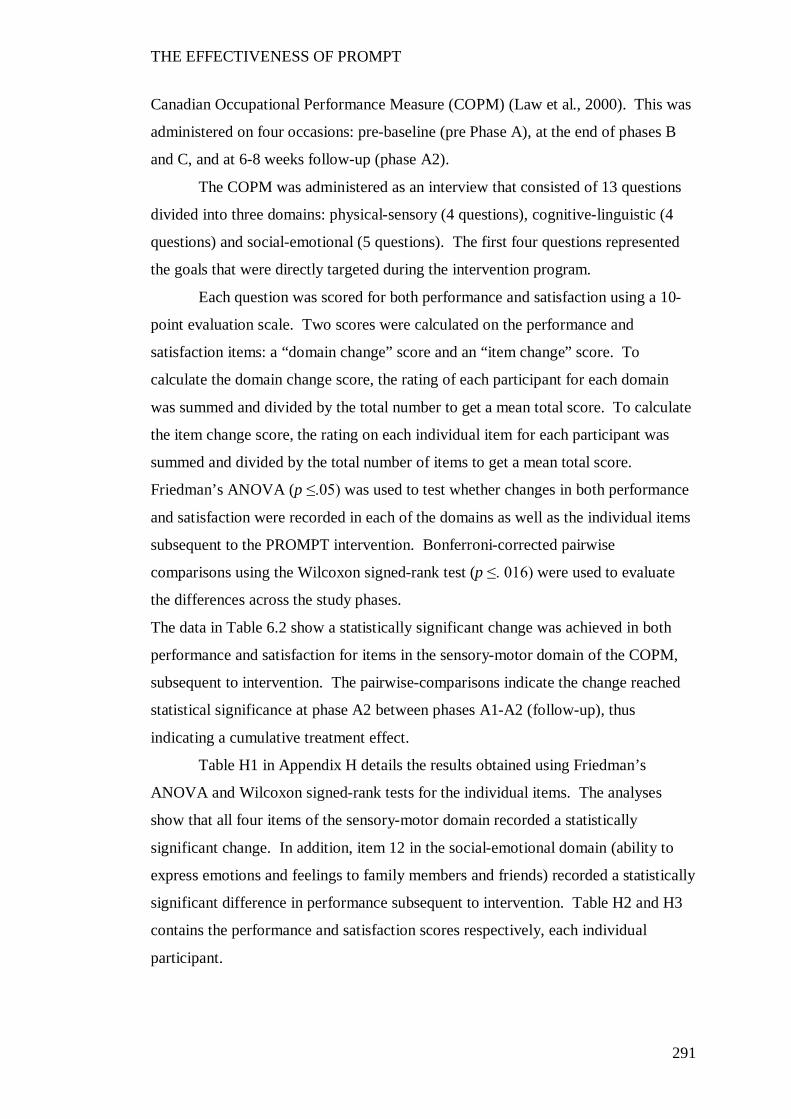
THE EFFECTIVENESS OF PROMPT
291
Canadian Occupational Performance Measure (COPM) (Law et al., 2000). This was
administered on four occasions: pre-baseline (pre Phase A), at the end of phases B
and C, and at 6-8 weeks follow-up (phase A2).
The COPM was administered as an interview that consisted of 13 questions
divided into three domains: physical-sensory (4 questions), cognitive-linguistic (4
questions) and social-emotional (5 questions). The first four questions represented
the goals that were directly targeted during the intervention program.
Each question was scored for both performance and satisfaction using a 10-
point evaluation scale. Two scores were calculated on the performance and
satisfaction items: a “domain change” score and an “item change” score. To
calculate the domain change score, the rating of each participant for each domain
was summed and divided by the total number to get a mean total score. To calculate
the item change score, the rating on each individual item for each participant was
summed and divided by the total number of items to get a mean total score.
Friedman’s ANOVA (p ≤.05) was used to test whether changes in both performance
and satisfaction were recorded in each of the domains as well as the individual items
subsequent to the PROMPT intervention. Bonferroni-corrected pairwise
comparisons using the Wilcoxon signed-rank test (p ≤. 016) were used to evaluate
the differences across the study phases.
The data in Table 6.2 show a statistically significant change was achieved in both
performance and satisfaction for items in the sensory-motor domain of the COPM,
subsequent to intervention. The pairwise-comparisons indicate the change reached
statistical significance at phase A2 between phases A1-A2 (follow-up), thus
indicating a cumulative treatment effect.
Table H1 in Appendix H details the results obtained using Friedman’s
ANOVA and Wilcoxon signed-rank tests for the individual items. The analyses
show that all four items of the sensory-motor domain recorded a statistically
significant change. In addition, item 12 in the social-emotional domain (ability to
express emotions and feelings to family members and friends) recorded a statistically
significant difference in performance subsequent to intervention. Table H2 and H3
contains the performance and satisfaction scores respectively, each individual
participant.
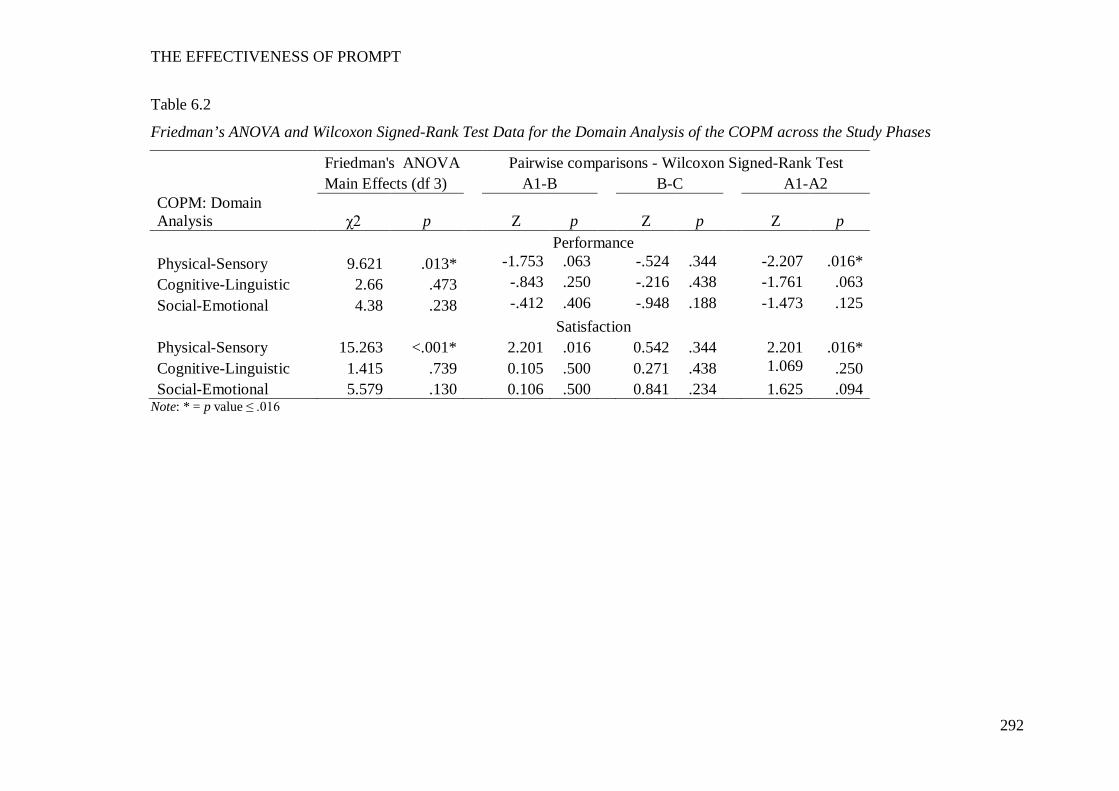
THE EFFECTIVENESS OF PROMPT
292
Table 6.2
Friedman’s ANOVA and Wilcoxon Signed-Rank Test Data for the Domain Analysis of the COPM across the Study Phases
Friedman's ANOVA Pairwise comparisons - Wilcoxon Signed-Rank Test Main Effects (df 3) A1-B B-C A1-A2 COPM: Domain Analysis χ2 p Z p Z p Z p Performance Physical-Sensory 9.621 .013* -1.753 .063 -.524 .344 -2.207 .016* Cognitive-Linguistic 2.66 .473 -.843 .250 -.216 .438 -1.761 .063 Social-Emotional 4.38 .238 -.412 .406 -.948 .188 -1.473 .125 Satisfaction Physical-Sensory 15.263 <.001* 2.201 .016 0.542 .344 2.201 .016* Cognitive-Linguistic 1.415 .739 0.105 .500 0.271 .438 1.069 .250 Social-Emotional 5.579 .130 0.106 .500 0.841 .234 1.625 .094
Note: * = p value ≤ .016
THE EFFECTIVENESS OF PROMPT
293
Further analysis was undertaken to evaluate the differences between the
domains across the study phases.
Figure 6.1 illustrates the mean percentage scores for each of the domains
across the study phases, with the physical-sensory domain weaker than both the
cognitive-linguistic and social-emotional domains. Friedman’s ANOVA show the
difference recorded between the three domains was statistically significant at pre-
intervention χ2 (2) = 9.652, p =.003. The Wilcoxon signed-rank tests, with
Bonferroni correction (p = 0.0167), reveal the physical-sensory domain differed
significantly from the cognitive-linguistic and sensory-emotional domains, Z=-
2.201, p =.016, however the difference between the cognitive-linguistic and social-
emotional domains was not significant.
Subsequent to intervention, the Friedman’s ANOVA show the difference
between the domains is no longer statistically significant: Phase B, χ2 (2) = 5.545, p
=.073, 2. Phase C, χ2 (2) = 2.348, p=.335, and Phase A2, χ2 (2) = 6.333, p=.052.
Note. PS = physical-sensory domain, CL = cognitive-linguistic domain, SE = sensory-emotional domain
Figure 6.1. Mean percentage increase in performance and satisfaction measures
across the study phases for the Canadian Occupational Performance Measure.
0
10
20
30
40
50
60
70
80
90
100
A1 B C A2
Mea
n Pe
rcen
t Sco
re
Study Phases
PS Performance
PS Satisfaction
CL Performance
CL Satisfaction
SE Performance
SE Satisfaction
THE EFFECTIVENESS OF PROMPT
294
Discussion
“Relationships between impairments and function may not be linear” (Abel
et al., 2003, p. 540).
The purpose of this chapter was to investigate changes to the Activity and
Participation domains of the ICF in six children with CP, across the phases of the
PROMPT intervention. It was hypothesised that therapy aimed at maximising
motor-speech control would result in improved speech intelligibility and increased
participation in the actions and tasks of the daily routine.
This section will examine and discuss the results obtained on the two
measures utilized to test this hypothesis.
Speech Intelligibility
“Intelligible speech is a complex product of language formulation, phonological
organisation, and motor execution” (R.D Kent et al., 1994, p. 82).
In this section, the impact of improved motor speech movement precision on
speech intelligibility is discussed. It was hypothesized that changes to the motor
speech movement patterns would result in improved speech intelligibility.
The findings of this study show all participants recorded improved speech
intelligibility, with five participants recording statistically significant changes, as
measured on a closed-set test using an unfamiliar listener. One participant (P4)
recorded improvements to speech intelligibility that did not reach statistical
significance. Mean percentage increases of 15% and 23% between phases A-B and
A-A2 respectively, were recorded. Effect size data indicate the greatest magnitude
of change occurred between phases A-B, with a large effect size of 0.79. A small
incremental increase between phases B-C was achieved, as indicated by the small
effect size (0.3). Overall, post-intervention data indicates the intervention was
effective in improving the speech intelligibility of the participants with a large effect
size of 1.1 recorded between phases A-A2. All participants maintained speech
intelligibility scores at 6-8 weeks post-intervention that exceeded pre-intervention
scores.
THE EFFECTIVENESS OF PROMPT
295
The gains in speech intelligibility in this study are consistent with those
reported in the literature using a more intensive therapy dosage than provided in this
study. For example, Marchant et al. (2008) reported a 9% increase in speech
intelligibility as obtained on a single-word speech intelligibility measure, in a
participant with spastic quadraparesis. Therapy was attended 5x weekly for 2 weeks
and phonetic placement therapy was administered. Pennington, Miller, Robson and
Steen (2009) reported a mean performance increase of approximately 15% in speech
intelligibility post-intervention in 16 children aged between 12 to 18 years-of-age.
Therapy was attended x3 weekly for a period of 6 weeks and focused on phonation
and respiration.
Given the importance of speech intelligibility for day-to-day interaction, the
speech intelligibility gains of the participants in this study are encouraging.
Research indicates that at least 40% of school-aged children with CP have
compromised speech intelligibility (Kennes et al., 2002). Further, speech
impairment in children with CP has been associated with activity limitations and
participation restrictions due to reduced interpersonal interactions and relationships;
and limitations in learning and applying knowledge (McConachie et al., 2006;
McCormack, McLeod, Harrison, & McAllister, 2010). Given these findings, the
importance of improving speech intelligibility cannot be understated.
The intelligibility measure (CSIM) used in this study was selected to reflect
changes in the competency of the speaker, as measured in the auditory mode, based
on a closed-set test using an unfamiliar listener in a quiet setting. The CSIM is a
standardized assessment that has been reported in the literature to be sensitive to
change in children with severe speech impairment associated with CP. However, it
is acknowledged that speech intelligibility is a multifaceted, bi-directional process,
and the role of the listener in understanding the speaker’s execution of the speech
motor act is also a critical component of speech intelligibility (Keintz, Bunton, &
Hoit, 2007; R.D Kent et al., 1994; Lindblom, 1990).
Though not considered in this study, there is evidence to suggest a listener’s
ability to understand spoken words can be facilitated or impaired by the congruency
between the auditory signal and articulatory movements of the speaker (Hustad &
Cahill, 2003; Kamachi, Hill, Lander, & Vatikiotis-Bateson, 2003; Keintz et al., 2007;
McGurk & MacDonald, 1976). The phenomenon of discrepancy between the
auditory and the visual signal is known as the McGurk effect. For example, McGurk
THE EFFECTIVENESS OF PROMPT
296
and MacDonald (1976) illustrated that a listener’s perception of a syllable can be
modified to perceive /da/ by creating an audio-visual discrepancy through the
combination of the auditory signal of /ba/ with the visual movement of /ga/.
There is evidence to suggest that the lack of congruency between the visual
and auditory signals may negatively impact speech intelligibility in children with
speech impairments associated with motor impairment. For example, Nelson and
Hodge (2000) examined the effects of auditory and auditory-visual information on
listeners’ perceptions of bilabial and lingual-alveolar stop items, in a child with
bilateral facial paralysis (BFP) and a typically developing similarly age-matched
peer (TD). The child with BFP was unable to move her lips for speech production.
This would therefore affect the child’s ability to achieve not only lip compression for
bilabials but also rounding and retraction in the production of vowels. Two findings
in the data are particularly relevant to this study. Firstly, the data show that listeners’
perceptions were significantly distorted by the ambiguous presentation of the visual
signal with the auditory information. That is, the perceptual ratings in the auditory
only condition were significantly more accurate than when presented in the
combined auditory-visual condition. Secondly, the child with BFP had adopted a
compensatory gesture to achieve perceptual accuracy. The authors report the
modification entailed using lingual actions in the absence of lip movement, to
achieve bilabial productions. Whilst these modifications were successful in the
acoustic signal, it increased confusion in the auditory-visual signal.
The relationship between speech intelligibility and the audio-visual signal
indicates the need for further research to evaluate the effectiveness of intervention
approaches aimed at speech intelligibility in children with motor speech impairment
using auditory, visual and auditory-visual information. The treatment approach
evaluated in this thesis focuses on facilitating more “normalized” movements to
achieve improved speech intelligibility. The data in the study by Nelson and Hodge
(2000) provide some evidence to suggest that whilst some compensatory behaviours
may be successful in improving the perceptual signal, these same behaviours may in
fact contribute to degrading speech intelligibility in face-to-face interactions.
The literature has identified children with speech impairments are at risk of
reduced participation in age-appropriate activities due to reduced interpersonal
interactions and relationships (McCormack et al., 2010). Given children typically
engage in face-to-face interaction, it is conceivable that an intervention approach
THE EFFECTIVENESS OF PROMPT
297
specifically structured to facilitate improved motor-speech accuracy would result in
improved speech intelligibility at a more functional level than intervention
approaches that focus on the perceptual and acoustic outcomes only.
It is possible that had this study included a multidimensional assessment of
speech intelligibility, and evaluated changes to each participant’s speech
intelligibility across three conditions (i.e., auditory only, auditory-visual and visual
only), a more complete evaluation of the effectiveness of PROMPT in contributing
to functional changes in speech intelligibility could have been undertaken. The data
recorded in this study provide some support for this hypothesis. For example, one
participant (P3) recorded labial-dental movement patterns for the production of
bilabials. The acoustic recordings suggest accurate transcription using APA broad
transcription, however, visual presentation of the same word shows incongruency.
In conclusion the improved speech intelligibility measures pre-and-post-
intervention obtained in this study indicate the intervention was effective at a single
word level.
Activity and Participation
Participant performance.
“Measurement across many domains may be necessary to address the
lingering question of understanding change in CP” (Vargus-Adams & Martin, 2009,
p. 2095).
The Canadian Occupation Performance Measure (COPM) (Law et al., 2005)
was used to examine changes in activity and performance within each participant’s
daily routine, as measured within the physical-sensory (P-S), cognitive-linguistic (C-
L) and social-emotional (S-E) domains, outside the therapy context. The COPM was
scored in terms of the participant’s change in performance as well as parent
satisfaction with that change. The results on participant performance will precede
the discussion on the results obtained for parent satisfaction.
It was hypothesized that the participants would show a positive change in
each of the domains subsequent to the PROMPT Intervention. More specifically, it
was hypothesized that improvements in the P-S would result in positive changes in
the S-E domain. Changes in the C-L domain were recorded to determine whether
THE EFFECTIVENESS OF PROMPT
298
improvements in the ability to follow instructions and increased attention to tasks
would be evidenced subsequent to intervention (McCormack et al, 2010). This was
considered a functionally relevant outcome for the participants of this study that
would contribute to facilitating inclusion in the pre-school/school routine (for the
younger participants particularly), but not an intervention focus.
The results indicate that the therapy aimed at improving speech production
accuracy and motor control had a positive impact on improving the ability of family
members and peers to understand the individual participants. The statistically
significant change recorded on the P-S domain of the COPM indicates that family
members and friends/peers were better able to understand the speech of the
participants subsequent to the PROMPT intervention.
The data recorded on the S-E and C-L domains indicate a trend towards
improvement but the change was not statistically significant. The lack of a
statistically significant change in the S-E domain can be interpreted in a number of
ways. Firstly, it could be suggested that whilst an improvement in speech
intelligibility was achieved, this did not translate into a functional improvement in
participation. That is, there was a poor translation of positive changes at the level of
the impairment to the activity/participation domains of the ICF. This outcome has
been reported in the literature for children with CP with physical therapy
intervention approaches that have been grounded in developmental theory and paid
limited attention to functional impact (Butler & Darrah, 2001).
Another interpretation is that the time frame given to observe the change was
too short. The literature documents the finding that children with CP experience
slower growth and development than their TD peers (Siebes et al., 2002). Given
this, it may be that the timeframe of this study was too short to demonstrate any
change in the C-L and S-E domains. It may be that with a longer time frame,
changes in these domains would have been observed.
A further alternative interpretation considers the readiness of the participants
to undergo change as explored within the construct of dynamic systems theory
(systems, self-organisation, and emergence). Within the construct of DST, growth
and development is driven by continuous change within the inter-dependent
domains/subsystems that are both within and external to an individual. In order for a
new behaviour to develop there must be a state of disequilibrium that functions to
move the system to reorganise.
THE EFFECTIVENESS OF PROMPT
299
This re-organisation results in the emergence of new behaviours at a higher
level of complexity and moves the system back to a new level of equilibrium. This
process of self-organisation evolves in a hierarchical manner, building on lower
levels of organisation (Fidler, Lunkenheimer, & Hahn, 2011; Howe & Lewis, 2005;
Newman & Newman, 2007; Schore, 1997; Thelen & Smith, 2003). As stated by
Howe and Lewis (2005) “all developmental outcomes are a result of the spontaneous
emergence of higher order structures from the recursive interaction among simpler
components” (p. 248). Within the construct of DST it is possible that a child with a
neurological impairment such as CP could present with an extreme state of
disequilibrium that results in poor integration and coordination between the
subsystems/domains. Thus, in order for the system to move to a higher level of
complexity a level of integration between the subsystems needs to be established.
It could be argued that the focus on building development within the P-S
domains contributed to redressing that imbalance between the P-S, C-L and S-E
domains. Examination of the data offers some support to this hypothesis. For
example, the pre-intervention data show the mean values of the P-S domains were
significantly less than the C-L and S-E domains. Post intervention block 1 (phase B)
data recorded a substantial increase in the P-S values, thus resulting in a decrease in
the disparity between the three domains. Post intervention block 2 (phase C) data
recorded a trend towards improvement in both the C-L and S-E domains. An
accelerating trend is observed in the follow-up data (phase A2) with near parity in
mean performance between each of the domain.
Parent satisfaction with performance.
The data show a statistically significant change in satisfaction with the
participants’ performance within the P-S domain. No significant change was
recorded in the C-L or S-E domain. Despite the speech impairment, a low level of
concern regarding participation and activity was expressed. These findings are
consistent with the findings of McCormack et al. (2010) who reported that although
parents identified speaking and conversation as an area of difficulty, only 5% of
respondents on their survey identified family relationships and 11% identified
informal social relationships as difficult.
Examination of the satisfaction data in the S-E domain seems to suggest the
possibility of a ceiling effect that resulted in the lack of significant change being
THE EFFECTIVENESS OF PROMPT
300
recorded across the intervention phases. Whilst all parents reported dissatisfaction at
pre-intervention in the P-S domain, most parents recorded a satisfaction rating higher
than 8/10 within the S-E domain. Thus, at pre-intervention, parents were satisfied
with the level of activity and participation for their children. This finding is
consistent with data reported by McCormack et al. (2010). In a survey completed by
parents of children with speech and language impairment, 98.8% of the parents
reported satisfaction with the level of recreation and leisure in which their children
participated.
Conclusion
The findings of this study show all participants recorded improved speech
intelligibility, with five participants recording statistically significant changes, as
measured on a closed-set test using an unfamiliar listener. Further, the results
indicate that the therapy had functional and meaningful outcomes. This was
indicated by the improvements in the ability of family members and peers to
understand the individual participants. The follow-up data also suggested a trend
towards improvements in the ability to express emotions/frustrations and problem
solving.
These outcomes support the implementation of intervention protocols that
address all domains (body function and structure, activity and participation, and
environmental factors) of the ICF. A current trend in the literature advocates
therapists focus on functional outcomes as opposed to impairment (Duchan, 2001;
Gibson et al., 2009; Ibragimova et al., 2007; Rosenbaum & Stewart, 2004). This call
for intervention approaches to focus on function not impairment and the use of terms
such as ‘contemporary’ versus ‘traditional’ assigned to the respective approaches
suggests an intervention aimed at addressing impairment is no longer appropriate
(Duchan, 2001; Gibson et al., 2009; Ibragimova et al., 2007; Rosenbaum & Stewart,
2004). As stated by Gibson et al. (2009) “Rehabilitation goals of improving well-
being and maximizing children’s participation can potentially be met by combining
both approaches”. That is, therapy aimed at targeting both the impairment as well as
activity and impairment may equally be appropriate. The data in this study raise the
possibility of considering a differential time line for focusing on the different aspects

THE EFFECTIVENESS OF PROMPT
301
of the ICF dependent on critical periods (e.g., transitions with life events) that are
unique for each individual.
THE EFFECTIVENESS OF PROMPT
302
CHAPTER 7 GENERAL DISCUSSION
Overview
The purpose of this thesis was to investigate the effectiveness of PROMPT
therapy in six children with moderate-to-severe speech disorder associated with
Cerebral Palsy (CP).
Three main research questions were posed:
1. Is PROMPT effective in making changes to speech production accuracy in
children with CP with moderate-to-severe speech impairment? The following two
specific questions were posed:
1.1 Will speech production accuracy improve subsequent to intervention?
1.2 Will phonetic accuracy increase?
2. Will children with moderate-to-severe speech impairments associated with CP
show changes in distance, velocity and duration measures of the jaw and lips
subsequent to PROMPT intervention?
3. Will children with CP show changes in the Activity and Participation domains of
the ICF subsequent to intervention? The following two specific questions were
posed:
3.1 Will unfamiliar listeners identify improvements in speech intelligibility
subsequent to intervention?
3.2 Will children with CP show improved participation in tasks and actions
of daily life with family members and friends subsequent to the PROMPT
intervention?
The outcome measures, selected to evaluate the three main research questions
were framed to reflect part 1 of the ICF framework as follows:
Structure/Function
1. Speech Production Accuracy
2. Phonetic Accuracy
3. Kinematic Measures
Activity/Participation
4. Speech Intelligibility
5. Activity and Participation within daily routines.
THE EFFECTIVENESS OF PROMPT
303
The results of this thesis show that all participants recorded positive changes
within each of the domains of part 1 of the ICF, subsequent to participation in the
PROMPT intervention. Specifically, the data from the perceptual measures show all
participants recorded improvements in speech production accuracy and speech
intelligibility, with five of the six participants recording statistically significant
changes subsequent to PROMPT intervention.
The gains recorded on the perceptual measures were further supported by the
findings of the kinematic data. The results obtained show that although participants
were heterogeneous in presentation, changes to the distance, velocity and duration
measures of the jaw and lips reflected the intervention priorities for the individual
participants.
Further, all participants showed learning profiles that were consistent with
two phases of motor learning: skill acquisition phase and consolidation. In
particular, the data show all six participants were able to acquire and consolidate
motor learning in a manner consistent with motor learning reported in the literature
for typical development. Five of the six participants in this study showed a rapid
acquisition phase on the first intervention priority that was followed by a
consolidation phase. In addition, the level of skill mastery on the first intervention
priority at approximately 65% was adequate for introducing a second intervention
priority. Whilst one participant (P1) demonstrated a slower acquisition phase to the
other participants on the first intervention priority, the consolidation pattern was
similar.
Finally, the data show all participants recorded changes in their level of
activity and participation, within their daily routine. The results obtained on the
COPM indicate that the therapy, aimed at improving speech production accuracy and
motor control had a positive impact on improving the ability of family members and
peers to understand the individual participants. The statistically significant change
recorded on the Physical-Sensory domain of the COPM indicates that family
members and friends/peers were better able to understand the speech of the
participants subsequent to the PROMPT intervention, thus indicating improved
functional outcomes were achieved.
In this chapter, the results reported in this thesis are considered within the
theoretical framework of the PROMPT approach. First, the alignment of this
THE EFFECTIVENESS OF PROMPT
304
approach with the tenets of DST and framed within the ICF is discussed. This is
followed by an interpretation of the role of the tactile-kinaesthetic input in
facilitating change in the motor-speech movement patterns.
The chapter concludes with a discussion on the limitation and strengths of the
study, clinical implications, directions for future research and conclusion.
A Systems Approach to Intervention
Within the constructs of Dynamic Systems Theory (DST), impairments in
body structure and function associated with CP have the potential to prevent
integration between interdependent domains/subsystems and prevent a system to
emerge to a higher level behaviour (Juarrero, 1999). This may result in children with
CP continuing to select the same inefficient motor solution as compared to typically
developing children (Hadders-Algra, 2000). The continued and persistent use of
inefficient behaviour can create rate-limiting systems that maintain deep stable
attractor states resistant to change.
Based on this theory, it was hypothesised that intervention focused on
strengthening the weakest subsystem, with consideration given to individual,
environmental and task constraints, would result in the emergence of new higher
level functional behaviours. This would occur as a result of the establishment of a
new set of boundary conditions enhancing the search for stable and adaptive
coordination solutions to task demands (Newell & Valvano, 1998).
As previously stated, the core principles of DST acknowledge that:
Growth and development is driven by continuous change within the inter-
dependent domains/subsystems that are both within and external to an individual. In
order for a new behaviour to develop there must be a state of disequilibrium that
functions to move the system to reorganise.
Sub-system re-organisation results in the emergence of new behaviours at a
higher level of complexity and moves the system back to a new level of equilibrium.
This process of self-organisation evolves in a hierarchical manner, building on lower
levels of organisation (Fidler et al., 2011; Howe & Lewis, 2005; Newman &
Newman, 2007; Schore, 1997; Thelen & Smith, 2003).
Individual, task and environmental constraints function as a means to
(re)structure the system and guide emerging behaviours.
THE EFFECTIVENESS OF PROMPT
305
The PROMPT intervention approach is aligned with the tenets of DST and
provides a PROMPT trained clinician with the practical tools to:
Assess the influence of the interdependent relationships operating between the
cognitive-linguistic, social-emotional, physical-sensory domains and the
environment on communication; and
Act as an agent of change to influence the selection of more efficient motor
solutions by acting on three major sources of constraints (e.g., individual, task and
environmental).
Intervention focuses on strengthening the weakest domain and re-structuring
the domains/subsystems, with the ultimate goal of achieving integration between and
within the subsystems (i.e., physical-sensory (P-S), cognitive-linguistic (C-L),
social-emotional (S-E) and environmental) for functional communication. To
achieve this end the clinician works to identify and manipulate the
constraints/solutions to effect positive functional change.
The subsystem of articulation within the P-S domain was identified as the
weakest domain for each of the participants in this thesis. When the subsystem of
articulation is identified as the weakest, the PROMPT therapist works to facilitate
appropriate degrees of freedom of movement and inhibit maladaptive attractor states
in order to improve articulatory accuracy. For example, for P3 the PROMPT trained
therapist inhibited hyper-extension of the jaw and facilitated grading of jaw
movements. Phonetic targets used to achieve this articulatory goal included the
bilabials /p/, /b/ and/ m/. Initially lip contact was targeted through the mechanical
action of the jaw. During the second intervention priority the therapist subsequently
focused on achieving bilabial closure through active engagement of the upper and
lower lip. Thus the therapist worked to systematically refine motor speech control
and decrease the constraints operating within that participant’s motor speech system.
The literature pertaining to the management of motor speech disorders
associated with CP, has long advocated for a subsystems approach to intervention
(Dworkin, 1991; Hodge & Wellman, 1999; Pennington et al., 2009). The
recommendation for a hierarchical subsystems approach was proposed and detailed
by Dworkin (1991). He advocated for a bottom-up approach in which respiration,
phonation and articulation were proposed as the first, second and third intervention
priorities, respectively. He further recommended that intervention should establish a
THE EFFECTIVENESS OF PROMPT
306
suitable level of control at the lower level priority before targeting a higher level
priority.
Support for this approach has recently been provided by Pennington (2006;
2009) in the management of phonation and respiration to support speech
intelligibility in children with CP. The findings of this thesis provide further
evidence to support a systems approach to intervention; and in particular the need to
address the subsystems of mandibular, labial-facial and lingual within an inter-
hierarchical framework when targeting impaired articulation.
The premise of DST that positive changes in one domain (i.e., physical-
sensory) would translate to a higher level subsystem re-organisation, was also
supported. This was demonstrated by the changes measured on the COPM. For
example, at pre-intervention the P-S domain recorded performance values that were
significantly poorer than the C-L and S-E domains, thus indicating poor integration
between these domains. At the end of the intervention phases (B and C), all three
domains recorded values that indicated the difference between the domains was not
significant and therefore indicative of a new level of integration/equilibrium.
However, during the follow-up phase, the P-S domain recorded values that exceeded
the S-E and C-L domains, thus suggesting the system had moved to a new state of
disequilibrium.
The tenets of DST state these patterns of behaviour (equilibrium and
disequilibrium) are necessary for growth and development to occur; and as such
suggest this is an optimal time for intervention protocols to effect change (Darrah &
Bartlett, 1995). The findings reported above therefore suggest a therapy approach
grounded in principles of DST has not only the potential to inform immediate
intervention priorities, but also enables clinicians to identify periods of transition and
change, thus providing a context for determining future priorities.
Tactile Kinaesthetic Input
“The mouth’s sensory experiences are generated principally by its own actions, and
its actions are responsive to sensory experiences” (Bosma (1970) as cited by
Barlow, 1999 p. 144).
The results of this study demonstrate the use of tactile-kinaesthetic input,
applied systematically and actively during speech, contributed to modifying the
THE EFFECTIVENESS OF PROMPT
307
speech-movement patterns of the participants and led to increased intelligibility.
These findings are consistent with other studies that have targeted increased
somatosensory-input in the management of motor speech disorders. For example,
Katz and McNeil (2010) report on studies that have augmented attention to
somatosensory feedback through the use of instrumentation (e.g., EMA) in adults
with acquired apraxia of speech. They report that effect sizes pooled for the
participants across these studies exceed those of other treatment approaches that
have not augmented somato-sensory feedback. Similarly, Strand et al. (2006)
reported positive treatment outcomes in three of four children diagnosed with
childhood apraxia of speech, subsequent to participation in an intervention approach
that also augmented somatosensory feedback. These studies therefore lend support
to the effectiveness of tactile information for active postural shaping during speech.
The difference between the intervention approach evaluated in this study and
that of other approaches that augment somatosensory input is the development of
specific types of PROMPTs that are used to target 1. joint receptors and muscle
spindles for postural stabilisation and 2. cutaneous afferents to stimulate specific
motor speech postures. A PROMPT trained clinician uses specific tactile-
kinaesthetic input during active speech directed to specific orofacial regions that are
richly innervated with slowly adapting, cutaneous mechanoreceptors that are
responsive to external low level inputs during motor activity (Andreatta & Barlow,
2009; Feng et al., 2011; Trulsson & Johansson, 2002).
Whilst the role of cutaneous afferents in providing an abundant supply of
kinaesthetic information is clearly recognised, more current research has examined
the explicit role of the facial mechanoreceptors in motor speech learning. For
example, Ito and Ostry (2010) conducted a series of experiments that applied a
constant force load to stretch the skin at the corners of the mouth to examine the
contribution of cutaneous inputs and muscle receptors in response to facial skin
perturbation. They provide evidence that articulatory motion is influenced by
changes in somatosensory input; and that learning of a newly acquired movement
pattern generalised to another speech task. Wong, Wilson and Gribble (2011) also
provide empirical data that indicates proprioception can be modulated to provide
greater acuity for limb positions when the information is paired with a functionally
relevant and active motor task.
THE EFFECTIVENESS OF PROMPT
308
Further, it is possible that the use of tactile-kinaesthetic input facilitated
learning by imposing constraints that aided learning of the “perceptual/motor
workspace” (Newell, 1991a; Shumway-Cook & Woollacott, 2012). The savings
experiments conducted by Huang et al. (2011) offer some support toward this
hypothesis. Huang et al. (2011) examined use-dependent plasticity and concluded
that repetition of a task that resulted in reduced error, in the presence of perturbation,
may “in itself generate reward that modulated use-dependent plasticity” (p. 795).
It is plausible to consider that the proprioceptive input, coupled to specific
movements in active speech, may have provided additional somato-sensory
representation that facilitated change to the motor speech output (Kelso et al., 2001).
Though data pertaining to speech kinematics and muscle activation patterns in
children with CP is limited, researchers have hypothesised that the differing patterns
of muscle activity observed in individuals with cerebral palsy may be a result of
impaired sensory-motor feedback (R.D Kent & Netsell, 1978; Milloy & Morgan-
Barry, 1990; Neilson & O'Dwyer, 1981). Recent research using diffusion tensor
imaging (DTI) studies support this by revealing children with CP show deficits in
proprioception as a result of abnormalities in thalamocortical pathways (Hoon et al.,
2009).
Other interventions that do not provide tactile-kinaesthetic input have also
reported changes to the displacement of the jaw, lips and tongue. For example, the
Lee Silverman Voice Treatment (LSVT®) is also a treatment technique framed
within the principles of DST. Whilst the focus of this treatment approach is
increased loudness, changes to movements of the jaw, lips and tongue have been
inferred from acoustic measures. Further research is required to understand the
contribution of the different approaches into modifying the speech motor behaviours.
Kinematic Analysis to Support Perceptual Analysis as an Outcome Measure
The results obtained through kinematic analysis further supported the
findings of the perceptual outcomes measures, thus reinforcing the appropriateness
of the therapy strategies implemented for each of the participants.
In the absence of kinematic data, intervention strategies aimed at improving
speech intelligibility through the modification of motor-speech behaviours, have
been based on inferences drawn from data obtained through acoustic measures. For
THE EFFECTIVENESS OF PROMPT
309
example, a significant body of data show individuals with CP use a reduced vowel
space area (VSA) in comparison with controls. A reduced VSA is associated with
reduced speech intelligibility whilst a larger vowel working space is correlated with
improved speech intelligibility. For example a restricted VSA in F1 has been
associated with restricted jaw/tongue movements, whilst a narrower F1-F2 range has
been associated with restricted anterior-posterior movements. Typically, the VSA is
identified in the first two formants and “constructed as the Euclidian distances
between the first formant (F1) and the second formant (F2) coordinates of the corner
vowels in the F1-F2 plane (C. Higgins & Hodge, 2002; H. M. Liu, Tsao, & Kuhl,
2005; Tjaden, Rivera, Wilding, & Turner, 2005; Wenke et al., 2010; Yunusova et al.,
2010).
Researchers have hypothesised (Wenke, Cornwell and Theodoros, 2010) that
increasing displacement of the jaw and lips, and retraction of the tongue could be
used to increase the VSA. Whilst all participants in this study showed reduced
articulatory space, the kinematic measures of distance indicated that for some
participants the movement space was reduced due to excessive jaw open distance
across the jaw height positions; and poor grading. Thus, further increasing the jaw
open distance could potentially exacerbate the use of a maladaptive compensatory
pattern further impairing timing and coordination in the articulatory subsystems.
In summary, these findings highlight the benefit of using kinematic data to
support perceptual data for the ultimate selection of intervention priorities. Further,
the kinematic data also provide evidence that the tactile-kinaesthetic input facilitated
change to the jaw and lip movements of the participants in this study; and highlights
the value of therapists being trained to systematically observe and evaluate the
potential impact of these movement patterns on speech intelligibility.
Study Limitations
Experimental Control
The SCED scale (Tate et al., 2008) and guidelines for rating the quality of
SSRD proposed by Logan et al. (2008) were used to evaluate the methodological
controls in this thesis.
THE EFFECTIVENESS OF PROMPT
310
Whilst nine of the ten scored items of the SCED scale were adequately
addressed in this thesis, aspects within some of these items could be strengthened
and are discussed below.
Design (Items 3, 4, 5 and 6). Experimental controls were used to manage threats
to the internal validity through the use of a multiple base-line design across
participants and behaviours, repeated testing conducted in the same environment at
the same time and continuous sampling of speech probes that contained a
generalization and control word set, across all phases of the study. The analyses of
skill acquisition and consolidation data could however, have been strengthened
through the administration of a larger word-set and multiple repetitions of the same
word.
In addition, the evaluation of the effectiveness of the PROMPT approach
could have been further strengthened through the use of a randomized alternating
treatment with concurrent multiple baseline design. The use of a randomized
alternating design where the PROMPT approach was applied using tactile input in
one condition only would have provided the opportunity to specifically evaluate the
effectiveness of the tactile-kinaesthetic input (i.e., tactile/ no tactile input phases).
Statistical Analysis (Item 9). Visual inspection of results was supported by the
use of statistical analyses. This included the establishment of a stable baseline using
statistical process control, prior to participation in the intervention phases of the
study. Continuous weekly measures of trained, untrained and control goals were
collected throughout all study phases.
This study could have been further strengthened with additional follow-up
data points. Additional data points for the follow-up phases would have increased
the robustness of the effect size data calculations. Whilst there currently appears to
be no consensus regarding the method used, and one data collection point is
sufficient for the calculation of an effect size using a modified Cohen’s d calculated
using the pooled standard deviation (Dunst, Hamby & Trivette, 2004), analysis of
the data are considered more robust with an equal number of data points in the
baseline and follow-up phases (Beeson & Robey, 2006; Logan et al., 2008).
Replication (Item 10). This study was completed on six participants with the
therapy protocols administered by four therapists.
THE EFFECTIVENESS OF PROMPT
311
Despite this, it is acknowledged that assessment of the effectiveness of the
intervention could have been further enhanced had six therapists (as opposed to four)
administered the intervention to a single participant each.
Treatment fidelity could have been further strengthened by evaluating the
quality of adherence to the therapy protocol. For example, whilst clinicians were
required to adhere to a minimum number of productions per word, this requirement
was not part of the fidelity measure. Further, measures regarding the amount of
tactile prompting required to elicit an accurate target could also have been gathered.
In addition, whilst the provision of home practice was integrated into the
treatment protocol there was no formal monitoring of this component of the
treatment protocol. This therefore limits the ability to determine how this
component of the protocol contributed to observed changes.
Generalization (Item 11). The diversity in the range of ages, level of
impairment on the GMFCS and disability type/severity make it difficult to generalize
the results outside the group of children who participated in this study.
The following item of the SCED scale indicated a potential threat to internal
validity:
Target behaviours (Item 2). Single word measures were used in this study due
to the severity of the speech impairment in the participants. However, speech
intelligibility is a multi-dimensional construct influenced by factors that include
linguistic complexity. For example, Hustad (2012, in press) reports data that
indicates children with CP experience decreased speech intelligibility with
increasing sentence length. This study could have been strengthened through the use
of an outcome measure designed to enable the systematic evaluation of changes to
speech intelligibility with increasing linguistic complexity.
Despite this, the literature also identifies that whilst different contexts,
listeners and tasks impact speech intelligibility differently, it is also important that
the measurement used needs to be appropriately matched to the competency of the
speaker (Hodge & Whitehall, 2010).
In conclusion, based on the level of evidence guidelines proposed by Logan
et al. (2008), this thesis is consistent with SSRD level II non-randomised,
controlled, concurrent multiple baseline across participants design. This thesis could
THE EFFECTIVENESS OF PROMPT
312
have been strengthened using a randomized alternating treatment with concurrent
multiple baseline design, a larger sample size and inclusion of a control group.
Kinematics
Limitations of the motion analysis system.
The motion analysis system used to evaluate the kinematic measures in this
system does not record lingual motion. Further analysis using a system that records
tongue measures in addition to lip and jaw changes, would have allowed for clearer
interpretation of the data for the participants that targeted lingual control. Two
participants commenced at the labial-facial level of control and moved to the lingual
level of control as measured on the PROMPT motor speech hierarchy. Direct
measurement of changes to the targeted intervention priority (lingual control) was
not possible. Thus, the phase C data reflected changes in mandibular and labial-
facial control subsequent to intervention targeting lingual control.
Limitations of the speech sample.
The inability to embed stimulus words in carrier phrases limited possible
analysis of the data. For example, the literature identifies the importance of
evaluating variability - not only as a measure of the process of skill acquisition but
also in terms of stability of motor skills. The repetition of this study with children
with less severe speech impairment would enable such an analysis.
Strengths of the Study
Experimental Control
The experimental control of this SSRD study was strengthened by the
extended concurrent multiple-baseline-design across the following two key aspects:
1. A multiple-baseline-across participants design.
Portney and Watkins (2009) state a minimum of three concurrent data points
are required, before intervention is applied to the first data series. In this study a
minimum of five concurrent data points were collected before the first participant
commenced the intervention phase. Participants 2 to 6 were subsequently staggered
to the intervention phase to a maximum of 8 baseline data points for the last
participant.
THE EFFECTIVENESS OF PROMPT
313
The data show no change occurred in the baseline periods for any of the
participants until the commencement of the intervention phase. This systematic
change in behaviour for each of the participants across the different baseline periods
suggests the treatment effect can be attributed to the intervention.
2. A multiple-baseline-across-behaviours design.
In this study, the continuous assessment of the two intervention priorities and
a control priority further strengthened the study design. The results indicate no
significant change in the control behaviour was observed across the study phases.
This again indicates the intervention was responsible for the change in behaviours.
Visual inspection supported by statistical analysis.
Visual inspection of the speech probe data was supported by statistical
analysis to evaluate change in variability, trend, slope and level. In addition, effect
size data were calculated to determine the clinical significance of the magnitude of
change. The literature is increasingly requiring statistical measures accompany
visual inspection (Logan et al., 2008; Olive & Smith, 2005; Portney & Watkins,
2009; Zhan & Ottenbacher, 2001). Conservative statistical measures were used in
this study, and included the conservative dual-criteria (CDC) method for the split
middle binomial (Fisher et al., 2003), and three consecutive data points on the 2SD
band. Agreement between the visual inspection and statistics strengthens data
interpretation.
Demonstrated fidelity to the intervention approach.
“… treatment research is not informative to the field if one does not know
what treatment was tested; nor can researchers replicate undefined treatment
intervention. For this reason, research projects for which a treatment manual was
not written and followed are of limited utility in terms of assessment of treatment
efficacy” (Chambless & Hollon, p.11).
Four different clinicians administered the treatment approach and were
frequently and randomly assessed for fidelity to the intervention by an independent
PROMPT Instructor blinded to the intervention phases. This therefore strengthens
the findings that the intervention was responsible for causing the change.
THE EFFECTIVENESS OF PROMPT
314
The field of speech-language pathology is increasingly acknowledging the
need for researchers to both demonstrate and document fidelity to a therapy
approach, as a critical component of evidence-based practice (Kaderavek and Justice
(2010, McCauley, Willams and McLeod, 2010 others). Kaderavek and Justice
(2010) state that in order to achieve treatment fidelity, intervention approaches
should be manualised. Specifically they declare “the treatment manual describes the
gold standard of treatment implementation against which fidelity can be assessed”
(p. 372).
To achieve fidelity to PROMPT clinicians are required to undertake
significant training. This requires participation in both formal training courses
conducted by the PROMPT Institute, and informal mentoring. Three formal training
courses are provided by the PROMPT Institute and include: Introduction to
Technique (3 days), PROMPT Bridging to Intervention (3 days) and PROMPT
Certification (case study project).
Upon completion of the 3-day Introduction to Technique course, a clinician is
considered suitably skilled to administer the technique, but in the absence of ongoing
mentoring would not meet requirements for fidelity to the approach. Participants of
the Introduction to Technique course are therefore encouraged to undertake the
Bridging to Intervention course.
Whilst it is possible for a clinician to meet fidelity upon completion of the
PROMPT Bridging to intervention, successful completion of PROMPT Certification
course (3 months in duration) signifies the PROMPT Institute has assessed and
determined that the clinician has demonstrated fidelity to the intervention approach.
The results of this study confirm adherence to fidelity and supports the
attribution of the treatment effects to the intervention and not maturation or chance.
Repeated and varied measures.
Measurements of target behaviours were taken repeatedly both across and
between study phases. Thus, trends in data could be explored. In addition,
kinematic measures were used to support the perceptual measures. This is the first
study to evaluate changes in kinematic measures subsequent to intervention in
children with CP.
THE EFFECTIVENESS OF PROMPT
315
Clinical Implications
“Further research is needed to describe this client group… Research is also
needed to investigate the effectiveness of new and established interventions and their
acceptability to families” (Pennington, 2009, p.2).
The findings of this study have implications for clinicians, service provider
funding bodies and clinical researchers. The implications will be discussed in terms
of the contribution this study makes to the current evidence base for clinicians
working in the field, consideration for the potential change to therapy protocols to
integrate principles of motor learning and the potential impost on therapist time to
complete specialist training.
A Contribution to the Evidence-Base
The findings of this study make a contribution to the limited evidence base
currently available to clinicians for evaluating and planning treatment options for the
effective management of motor speech disorders associated with cerebral palsy. In
2011, Pennington, Goldbart and Marshall updated a clinical review of the literature
evaluating the effectiveness of speech and language intervention for children with
cerebral palsy. Their findings supported the conclusion reached in 2003, that there
was insufficient data available to confirm or refute the effectiveness of speech-
language rehabilitation in children with CP.
The results of this study support the PROMPT intervention approach for the
participants in this study. At the start of the research, all participants presented with
moderate-to-severe motor speech impairment. Two of the older participants were no
longer receiving therapy focused on articulatory changes due to the intransigence of
the articulatory errors. The results show that all participants made changes
subsequent to an intervention protocol offered on a once-weekly basis for 10 weeks.
This study is also the first to describe the motor-speech- movement patterns
in children with CP using kinematic analysis pre and post-intervention. The pre-
intervention data made a further contribution to the evidence base by describing pre-
intervention movement patterns of the jaw and lips, in six participants of varying
age. The data showed all participants were able to make changes in their speech-
movement patterns that resulted in improved speech intelligibility.
THE EFFECTIVENESS OF PROMPT
316
Implications for the Design of Intervention Protocols
Consolidation phases.
The findings of this study support the need for therapy protocols to be
designed to accommodate different phases of motor-learning when targeting motor-
speech strategies in children with CP. The application of the principles of motor
learning in speech-language intervention protocols is strongly recommended
(Ludlow et al., 2008; Maas et al., 2008). However, there are limited data available to
support the application of these principles in children with CP. The results of this
study show that participants not only exhibited the two phases of skill acquisition
and consolidation consistent with the general motor control literature, but that they
also continued to record improvements during the non-intervention follow-up phase.
This phenomenon has been documented in the motor learning literature for adults
(Huang & Shadmehr, 2007), typically developing children learning a new motor skill
(Liu, Luo, Mayer-Kress and Newell, 2011), and children with CP subsequent to
physiotherapy intervention (Trahan & Malouin, 2002).
Thus, further research aimed at understanding motor-speech development in
between the intervention periods would potentially influence the design of
intervention protocols for possibly more efficient treatment outcomes (i.e.,
scheduling of consolidation phases that are separate to follow-up phases).
Data collection and the determination of intervention success.
Therapists need to assess not only change in performance level but also
change in stability when evaluating the processes of skill acquisition in children with
CP. Contemporary empirical data indicates clinicians need to develop procedures
that are designed to evaluate change in stability/variability over the course of the
intervention. Typically intervention studies focused on improving speech production
and intelligibility emphasise change in performance level with a criterion of between
80% and 90% accuracy required. However, the work of Zanone, Kostrubiec and
Temprado (2006) indicates the “empirical signature” of skill acquisition is the
concurrent improvement of both accuracy and stability. The data obtained in this
study seem to suggest that for the four participants who commenced intervention
(phase B) at the mandibular level of control and moved to the labial-facial level of
control (phase C), a success criterion of 60% or above was adequate for the first
intervention priority, provided the behavior stabilised early in the subsequent phase
THE EFFECTIVENESS OF PROMPT
317
that addresses the second priority. This assumption is based on the data that show
during phase C improvement occurred on the second intervention priority when
stability was recorded in the data of the first intervention priority.
The collection of speech probe data at both the beginning and end of an
intervention session, with more than one repetition per target, would allow a
clinician to not only track changes in performance level but also track changes in
performance stability within and between therapy sessions.
The use of tactile-kinaesthetic input.
The kinematic data obtained in this study supports the hypothesis that
changes to the speech-movement patterns of the participants would occur subsequent
to intervention. This is an encouraging finding for three reasons:
1. The effectiveness of reducing excessive mouth opening movement. Excessive
mouth opening has been identified with lateral jaw slide (Miyamoto et al., 1999;
Ortega et al., 2008) which places individuals with CP at increased risk of
temperomandibular joint disorder.
2. The ability to improve perception of speech by increasing the degree of
congruency between the auditory and visual stimuli. The use of tactile-kinaesthetic
input to facilitate changes in the motor-speech patterns of the participants in this
study raises the possibility of improving speech intelligibility in individuals with CP.
3. The results show that even the oldest participant, who had been prescribed a
communication device (that she refused to use) and was no longer considered a
candidate for therapy aimed at improving speech production, made positive gains
subsequent to intervention. All but the younger participants in this study had been
the recipients of traditional intervention approaches.
Therapist Training
The findings of this study provide some justification for the time and costs
incurred by individual clinicians and organisations in providing specialist training.
The development and provision of specialist intervention training programs
suggests an enhanced awareness of the need to ensure a clinician is equipped to
administer an intervention with integrity and fidelity to the approach. This should
ultimately result in a strengthening of the evidence available regarding treatment
approaches.
THE EFFECTIVENESS OF PROMPT
318
PROMPT has been criticised in the literature for being an “exclusive”
approach. Bowen (2009) states “…qualified, certified speech and language
professionals must pay to gain additional basic and advanced training and
accreditation in order to own ‘the knowledge’ in the form of special techniques (the
prompts), therapy administration manuals, and material” (p. xviii).
However, to be eligible to use the title of “Certified Practicing Speech
Pathologist in Australia”, speech-language pathologists must demonstrate the active
pursuit of professional development. This includes, but is not limited to, attendance
at workshops, conferences and seminars. A review of the “upcoming events”
calendar 2012 for Speech Pathology Australia
(http://clearspeechalbury.com.au/upcoming-cpd-events/) indicates fee-paying
attendance at workshops that run over the course of 2-3 days is an established and
accepted standard of practice within the profession. Examples of intervention
approaches that require 2-3 days for training include the The Hanen Approach
(Hanen, 2011), and LSVT® (LSVT®, 2011).
Service providers and clinicians need to make informed evidence-based
decisions when giving consideration to the time and financial commitments required
for specialist training (Reilly, 2004). Further research aimed at evaluating the longer
term maintenance and gains to speech intelligibility using this approach as compared
with the outcome (and training expectations) with another intervention would further
provide information regarding the efficacy of this approach.
Translation of Research into the Clinic
“Policy makers and the academic research community must come to a
clearer understanding of the distinction between inventing treatments and getting
them used in practice (Woolf, 2008, p. 212).
Many barriers have been identified for the poor translation of current
scientific research and evidence-based practice into the clinical setting (Elliot, 2004;
Nakaya, Shimizu, Tanaka, & Shigetaka, 2005; Zipoli & Kennnedy, 2005). However,
a study by Zippoli and Kennedy (2005) found exposure to research was a highly
significant positive predictor to clinicians engaging in evidence-based practice.
THE EFFECTIVENESS OF PROMPT
319
Despite this finding, Sullivan and Goldmann (2011) report the implementation of
SSRDs in the clinical field still appears to be an under-utilised opportunity.
The implementation of this intervention study in the clinical setting therefore
made a contribution towards facilitating the translation of current research principles
and theory into the clinical setting in a number of ways:
1. Training. The clinicians who participated in this study were required to undertake
specialised training that focused on (a) teaching contemporary constructs in motor
control and principles of motor learning, (b) a specialised technique, and (c) efficient
data collection principles.
2. Management support. The management and the board of TCCP during the time
of this study demonstrated a commitment to engaging in evidence-based practice
through the provision of additional funding to purchase equipment and extra staff
hours for training and therapy time. Without this additional funding this study would
not have been possible.
3. Appropriate environment. Space was made available and equipment purchased
for data to be collected on site. Specifically, the collection of the kinematic data in
the clinical setting was successful due to:
3.1. The familiarity of the participant with the surroundings. This had the
added benefit of removing any potential anxiety/fear factor.
3.2. Decreased travel time for family. There was no loss to follow-up which
may have been facilitated by the fact the parents did not need to undertake an
additional journey to the University Lab (which for one participant would have
exceeded 1 hour, one-way).
Future Research
There is a need for much more good clinical research based on well-
established principles founded in basic research in motor control and learning
(Winstein, Wing and Whitall, 2003, p.81).
Treatment Efficacy
The participants.
Further research using a larger sample size and varying level of motor speech
impairment would improve generalisation of the results obtained in this study. The
THE EFFECTIVENESS OF PROMPT
320
results of this study demonstrate the PROMPT intervention approach was effective
in facilitating positive changes to speech intelligibility in six children with moderate-
to-severe motor speech impairment associated with CP.
Further research to determine whether this intervention approach results in
the most change over the shortest period of time as compared with another
intervention approach is warranted. For example, the literature indicates the LSVT
approach, that focuses on rate and loudness manipulations, has also been found to
have successful impact on speech intelligibility in children with CP (Fox, 2002;
Tjaden et al., 2005).
The Clinicians.
There is a need for further research to evaluate the viability of this treatment
approach with respect to intervention gains and therapist training. Typically
effectiveness studies focus on the evaluation of outcome measures directed at the
study participants. However, the increasing trend that requires therapist’s commit to
post-graduate training for the development of specialist skills [e.g., Relationship
Development Intervention (Gutstein, 2009), The Hanen Approach (Hanen, 2011),
LSVT® (LSVT®, 2011) ] indicate the need for researchers to also evaluate therapy
effectiveness not only in terms of participant gains but also participant gains in
association with the cost of therapist training requirements.
In order to participate in this study, therapists were required to complete both
the Introduction to Technique and Bridging to Intervention courses as well as
complete a mentoring day with Deborah Hayden. The therapist’s fidelity to the
PROMPT intervention approach was assessed by an independent senior PROMPT
Instructor through completion of a PROMPT technique practicum on a client that
was not a participant in the study. The data show that one clinician who expressed
interest to participate in the study, required additional mentoring and completed a
second technique practicum in order to achieve fidelity. During the study one
clinician also recorded a fidelity measure slightly below the required 80%. These
measures attest to the complexity of this intervention approach. Wambaugh, Duffy,
McNeil, Robin and Rogers (2006) described PROMPT as “possibly the most
sophisticated of the stimulation techniques for providing direct instruction for speech
production …” (p. xliv).
THE EFFECTIVENESS OF PROMPT
321
In conclusion, a clinician who embarks upon training in the PROMPT
approach needs a high level of commitment to achieve competency. In addition,
access to mentoring seems to be necessary to facilitate the process of achieving
fidelity. Thus, further research to evaluate therapist training and participant gain
with different treatment approaches is required.
The Visual Aspect of Speech Intelligibility
Further analysis of the current data could be undertaken to evaluate the
impact of the visual changes to speech motor production and speech intelligibility.
The literature concerning the benefit of audiovisual versus audio only is unclear.
The literature suggests the need for further research to evaluate what aspects of the
visible movement characteristics contribute to speech intelligibility. In addition,
research aimed at evaluating this in young children is warranted. It is expected that
the audiovisual signal may detract from speech intelligibility in young children with
motor impairment given the dominance of bilabials in the phonemic repertoire
(Green & Nip, 2010).
Further, additional analysis of the data using acoustic analysis would provide
the opportunity to explore whether changes that were not perceived perceptually had
occurred acoustically.
Principles of Motor Learning
The results obtained for both the perceptual and kinematic data in this study
show that the participants in this study were are able to acquire and consolidate
motor learning in a manner consistent with that reported in the literature for typical
development. The PROMPT intervention approach was selected because it is
aligned with current thinking regarding principles of motor control and motor
learning. Whilst the principles of motor learning (PML) are considered essential
components of intervention approaches focused on the development of motor skills,
research of these principles has been largely limited to the typically developing
population.
Whilst the results of this study were encouraging, the evaluation of the PML
was outside the scope of this study. Further research aimed at evaluating the
THE EFFECTIVENESS OF PROMPT
322
significance of distributed versus massed practice and feedback schedule and type is
indicated.
Therapy protocols.
Further research aimed at evaluating skill acquisition on the basis of both
performance success and change in variability is indicated. Therapy protocols are
currently aimed at evaluating success predominantly on the basis of performance. It
is suggested that the reporting of data that demonstrate rate of change and
variability/stability has the potential to offer further insights into the acquisition of
motor speech skills in children with neurological impairment. Increasingly, the
literature that advocates for a dynamic systems approach to the management of
motor disorders associated with CP, suggests identification of transition periods may
be an indicator of readiness to learn a new skill (Darrah & Bartlett, 1995).
Additionally, it is also possible that establishing an intervention protocol to track
changes not only in performance accuracy but also performance stability may
facilitate improved skill maintenance.
Further research for comparative evidence to determine whether increased
frequency and intensity would have resulted in greater gains is required. The
variability in the current literature regarding therapy intensity confounds
interpretation of intervention outcomes.
The Role of Tactile-Kinaesthetic Input
The importance of sensorimotor feedback for speech and the task specific
role of sensorimotor adaptation in motor learning, coupled with the findings of this
study, indicate the need for further research. The findings of this study show six
participants responded to the tactile kinaesthetic input. Further research on a larger
sample size is required. In addition, further evaluation (possible using MRI) would
facilitate our understanding of how the tactile-kinaesthetic input promoted change in
the motor speech systems of the participants in this study.
Conclusion
The aim of this thesis was to make a further contribution to the evidence-base
pertaining to motor-speech disorders in children with cerebral palsy.
The significance of the data detailed in this thesis are summarised as follows:
THE EFFECTIVENESS OF PROMPT
323
1. This thesis makes a contribution to the emerging literature regarding the
speech-movement patterns of children with CP.
The motor speech disorder most commonly associated with cerebral palsy is
that of dysarthria. Whilst the literature identifies “changes in articulatory
movements associated with dysarthria lead to aberrant speech acoustics and a
perceptually recognisable disorder”, empirical data describing these movement
patterns is lacking.
The data from this thesis enabled a description of the jaw and lip movement
patterns, based on objective measures of distance, velocity and duration, in 6
children with CP. The findings add further support to the earlier work of researchers
who considered the patterns of articulatory imprecision in speakers with CP to be
related to physiological complexity (Byrne, 1959; R.D Kent & Netsell, 1978; H. Kim
et al., 2010; Love, 1992). The kinematic data suggest impaired control of a lower
order synergy (such as the mandible/lower lip) prevents refinement and control of
higher order synergies. This is consistent with the developmental motor-speech
literature.
2. This is the first study to describe kinematic changes in the movement
patterns of the jaw and lips before, during and after participation in a motor-speech
intervention program.
Typically, therapy recommendations to modify motor-speech patterns are
based on perceptual and acoustic outcome measures. The kinematic data provided
here suggest a valuable source of information that has the potential to more fully
inform therapy recommendations. For example:
2.1. The finding that some children may use an increased jaw open distance
to achieve mandibular stability suggests the therapeutic recommendation to increase
jaw open distance for improving speech intelligibility, may in fact contribute to
increased timing and coordination difficulties for some children. The compensatory
strategies used to achieve stability varied amongst the participants, and therapeutic
recommendations aimed at modifying the motor-speech movement patterns need to
be aimed at improving timing and coordination specific to the needs of each
individual.
2.2. Clinicians need to be encouraged to not only make judgements about
perceptual accuracy but also movement quality. For example, production of /p/
through the ballistic motion of the jaw may result in the achievement of the
THE EFFECTIVENESS OF PROMPT
324
perceptual target for some words (e.g., “up”) but would be inadequate for more
refined production requiring lip-to-lip contact independent of the jaw (e.g., “push”).
3. The data from this thesis show that therapy aimed at reintegrating and re-
organising the subsystems of motor-speech control can be successful in achieving
improvements to speech intelligibility, at a single word level. The outcomes
obtained on the perceptual and kinematic measures of this thesis are supported by the
principles of dynamic systems theory that indicate development occurs in the
direction of increasing hierarchical structure, with order maintained through the
presence of specific boundary conditions (Newell et al., 2001; Newman & Newman,
2007; Thelen & Smith, 2006).
4. The data from this thesis provide some insight into the learning patterns of
the six participants. Whilst it has been previously reported that children with CP do
not engage in off-line learning (Garvey, 2007), the participants of the PROMPT
intervention not only demonstrated patterns of learning and consolidation consistent
with the typically developing population but also showed off-line learning during the
follow-up phase. The findings therefore support a subsystems approach to
intervention within an integrated inter-hierarchical framework.
In conclusion, the data from this study provide evidence to support the
effectiveness of the PROMPT intervention approach in supporting changes to the
motor speech movement patterns of 6 children with CP.
THE EFFECTIVENESS OF PROMPT
325
References
Abel, T., & Lattal, M. (2001). Molecular mechanisms of memory acquisition,
consolidation and retrieval. Current Opinion in Neurobiology, 11, 180-187.
Andreatta, R. D., & Barlow, S. M. (2009). Somatosensory gating is dependent on the
rate of force recruitment in the human orofacial system. Journal of Speech,
Language and Hearing Research, 52, 1566-1578.
Araújo, D., & Davids, K. (2011). What exactly is acquired during skill acquisition?
Journal of Consciousness Studies, 18(3-4), 7-23.
America Speech-Language Hearing Association (ASHA). (2007). Scope of practice
in speech-language pathology. Rockville.
Ashwal, S., Russman, B. S., Blasco, P. A., Miller, G., Sandler, A., Shevell, M., &
Stevenson, R. (2004). Practice parameter: Diagnostic assessment of cerebral
palsy. Neurology, 62(2), 851-863.
Atchy-Dalama, P., Peper, C. E., Zanone, P., & Beek, P. J. (2005). Movement-related
sensory feedback mediates the learning of a new bimanual relative phase
pattern. Journal of Motor Behavior, 37(3), 186-196.
Baas, B., Strand, E.A., Elmer, L. M., & Barbaresi, W. J. (2008). Treatment of severe
childhood apraxia of speech in a 12-year-old male with CHARGE
association. Journal of Medical Speech-Language Pathology, 16(4), 181-190.
Balas, M., Roitenberg, N., Giladi, N., & Karni, A. (2007). When practice does not
make perfect: well-practiced handwriting interferes with the consolidation
phase gains in learning a movement sequence. Experimental Brain Research,
178, 499-508.
Balkom, H. V., & Verhoeven, L. (2010). Literacy Learning in Users of AAC: A
neurocognitive perspective. Augmentative and Alternative Communication,
26(3), 149-157.
Ball, M. J., Müller, M. J., Klopfenstein, M., & Rutter, B. (2009). The importance of
narrow phonetic transcription for highly unintelligible speech: Some
examples. Logopedics Phoniatrics Vocology, 34(3), 84-90.
Ballard, K., Granier, J., & Robin, D. (2000). Understanding the nature of apraxia of
speech: Theory, analysis and treatment. Aphasiology, 14(10), 969-995.
THE EFFECTIVENESS OF PROMPT
326
Bar-Haim, S., Harries, N., Nammourah, I., Oraibi, S., Malhees, W., Loeppky, J., . . .
Lahat, E. (2010). Effectiveness of motor learning coaching in children with
cerebral palsy: a randomized controlled trial. Clinical Rehabilitation, 24,
1009-1020.
Barlow, S. (1999). Handbook of clinical speech physiology. San Diego: Singular
Publishing Group.
Barnes, E., Roberts, J., Long, S. H., Martin, M. A., Berni, M. C., Mandulak, K. C., &
Sideris, J. (2009). Phonological accuracy and intelligibility in connected
speech of boys with fragile X syndrome or Down Syndrome. Journal of
Speech, Language and Hearing Research, 52(4), 1048-1061.
Barnes, S. B., & Whinnery, K. W. (2002). Effects of functional mobility skills
training for young students with physical disabilities. Council for Exceptional
Children, 68(3), 313-324.
Barreiros, J., Figueiredo, T., & Godinho, M. (2007). The contextual interference in
applied settings. European Physical Education Review, 13(2), 195-208.
Bartle-Meyer, C., Goozée, J. V., Murdoch, B. E., & Green, J. R. (2009). Kinematic
analysis of articulatory coupling in acquired apraxia of speech post-stroke.
Brain Injury, 23(2), 133-145.
Bashir, A., Grahamjones, R., & Bostwick, R. (1984). A touch-cue method for
developmental verbal apraxia. Seminars in Speech and Language, 5(2), 127-
137.
Bax, M. (1964). Terminology and classification of cerebral palsy. Developmental
Medicine and Child Neurology, 6, 295-307.
Bax, M., Goldstein, M., Rosenbaum, P., & Paneth, N. (2005). Proposed definition
and classification of cerebral palsy, April 2005. Developmental Medicine and
Child Neurology, 47(8), 571-576.
Beeson, P. M., & Robey, R. R. (2006). Evaluating single-subject treatment research:
lessons learned from aphasia literature. Neuropsychological Review, 16(4),
161-169.
Bleile, K. M. (Ed.). (2004). Manual of Articulation and phonological disorders:
Infancy through adulthood (2nd edition). New York: Thomson Delmar
Learning.
Booth, A. (2010). On hierarchies, malarkeys and anarchies of evidence. Health
Information & Libraries Journal, 27(1), 84-88.
THE EFFECTIVENESS OF PROMPT
327
Bose, A., Square, P., Schlosser, R., & Lieshout, P. (2001). Effects of PROMPT
therapy on speech motor function in a person with aphasia and apraxia of
speech. Aphasiology, 15(8), 767-785.
Boudreau, S. A., Farina, D., & Falla, D. (2010). The role of motor learning and
neuroplasticity in designing rehabilitation approaches for musculoskeletal
pain disorders. Manual Therapy, 15, 410-414.
Brien, M., & Sveistrup, H. (2011). An intensive virtual reality program improves
functional balance and mobility of adolescents with cerebral palsy. Pediatric
Physical Therapy, 23, 258-266.
Bronnikov, V. A., & Kravtsov, Y. I. (2006). Non-specific brain systems and the
rehabilitation of children with cerebral palsy. Neuroscience and Behavioral
Physiology, 36(9), 1003-1008.
Brossard-Racine, M., Hall, N., Majnemer, A., Shevell, M. I., Law, M., & Poulin, C.,
& Rosenbaum, P. (2012). Behavioural problems in school age children with
cerebral palsy. European Journal of Paediatric Neurology, 16(1), 35-41
Bukowska, M., Essick, G. K., & Trulsson, M. (2010). Functional properties of low-
threshold mechanoreceptive afferents in the human labial mucosa.
Experimental Brain Research, 201(1), 59-64.
Bult, M. K., Verschuren, O., Jongmans, M. J., Lindeman, E., & Ketelaar, M. (2011).
What influences participation in leisure activities of children and youth with
physical disabilities? A systematic review. Research in Developmental
Disabilities, 32(5), 1521-1529.
Butler, C., & Darrah, J. (2001). Effects of neurodevelopmental treatment (NDT) for
cerebral palsy: an AACDM evidence report. Developmental Medicine and
Child Neurology, 43(11), 778-790.
Byrne, M. (1959). Speech and language development of athetoid and spastic
children. Journal of Speech and Hearing Disorders, 24, 231-240.
Cahill, L., Murdoch, B., & Theodorus, D. (2005). Articulatory functioning following
traumatic brain injury. Brain Injury, 19(1), 41-58.
Caldognetto, E. M., Cosi, P., Drioli, C., Tisato, G., & Cavicchio, F. (2004).
Modifications of phonetic labial targets in emotive speech: effects of the co-
production of speech and emotions. Speech Communication, 44, 173-185.
THE EFFECTIVENESS OF PROMPT
328
Campbell, J. M., & Herzinger, C. V. (2010). Statistics and single subject research
methodology. In D. L. Gast (Ed.), Single subject research methodology in
behavioral sciences. New York Routledge.
Caruso, A., & Strand, E.A. (Eds.). (1999). Motor speech disorders in children:
Definitions, background and a theoretical framework. New York: Thieme
Medical Publishers Inc.
Castro, J., Medina-Carnicer, R., & Galisteo, A. (2006). Design and evaluation of a
new three-dimensional motion capture system based on video. Gait and
Posture, 24, 126-129.
Chambless, D. L., & Hollon, S. D. (1998). Defining empirically supported therapies.
Journal of Consulting & Clinical Psychology, 66(1), 7-18.
Chen, L.-C., Metcalfe, J. S., Jeka, J. J., & Clark, J. E. (2007). Two steps forward and
one back: learning to walk affects infants' sitting posture. Infants Behavior
and Development, 30, 16-25.
Chenery, H. J. (1998). Perceptual analysis of dysarthric speech. Cheltenham:
Stanley Thornes.
Cheng, H. Y., Mudoch, B. E., Goozée, J. V., & Scott, D. (2007).
Electropalatographic assessment of tongue-to-palate contact patterns and
variability in children, adolescents, and adults. Journal of Speech, Language
and Hearing Research, 50, 375-392.
Chumpelik, D. (1984). The PROMPT system of therapy: Theoretical framework and
applications for developmental apraxia of speech. Seminars in Speech and
Language, 5(2), 139-155.
Clarke, W. M., & Hoops, H. R. (1980). Predictive measures of speech proficiency in
cerebral palsied speakers. Journal of Communication Disorders, 13, 385-394.
Clement, M., & Twitchell, T. E. (1959). Dysarthria in cerebral palsy. Journal of
Speech and Hearing Disorders, 24, 118-122.
Connor, N., & Abbs, J. (1998). Movement-related skin strain associated with goal
oriented lip actions. Experimental Brain Research, 123(3), 235-241.
Corbetta, D., & Bojczyk, K. E. (2002). Infants return to two-handed reaching when
they are learning to walk. Journal of Motor Behavior, 31(1), 83-95.
Costa, R. M., Cohen, D., & Nicholelis, M. A. L. (2004). Differential corticostriatal
plasticity during fast and slow motor skill learning in mice. Current Biology,
14, 1124-1134.
THE EFFECTIVENESS OF PROMPT
329
Cowry, G. J. (2007). The dependence of spinal cord development on corticospinal
input and its signficance in understanding and treating spastic cerebral palsy.
Neuroscience and Behavioral Reviews, 18, 1114-1124.
Cox, F. (2008). Vowel transcripton systems: An Australian perspective.
International Journal of Speech-Language Pathology, 10(327-333).
Cox, F., & Palethorpe, S. (2007). An illustration of the IPA: Australian English.
Journal of the International Phonetic Association, 37(3), 341-350.
Crickmay, M. C. (1966). Speech therapy and the bobath approach to cerebral palsy.
Springfield: Charles C Thomas.
Cusick, A., Lannin, N. A., & Lowe, K. (2007). Adapting the Canadian Occupational
Performance Measure for use in a paediatric clinical trial. Disability and
Rehabilitation, 29(10), 761-766.
Darainy, M., & Ostry, D. J. (2008). Muscle co-contraction following dynamics
learning. Experimental Brain Research, 190, 153-163.
Darrah, J., & Bartlett, D. (1995). Dynamic systems theory and management of
children with cerebral palsy: Unresolved issues. Infants and Young Children,
8(1), 52-59.
Darrah, J., Wiart, L., & Magill-Evans, J. (2008). Do therapists' goals and
interventions for children with cerebral palsy reflect principles in
contemporary literature? Paediatric Physical Therapy, 20, 334-339.
Davids, K., Savelsbergh, G. J. P., & Miyahara, M. (2010). Identifying constraints on
children with movement difficulties: implications for pedagogues and
clinicians. In I. Reshaw, K. Davids & G. J. P. Savelsbergh (Eds.), Motor
learning in practice: a constraints led approach. London: Routledge.
Davis, B. L., Jacks, A., & Marquardt, T. P. (2005). Vowel patterns in developmental
apraxia of speech: three longitudinal studies. Clinical Linguistics and
Phonetics, 19(4), 249-274.
De Boor, C. (2001). A practical guide to splines (revised edition). New York:
Springer-Verlag.
De Leon, R. D., Hodgson, J. A., Roy, R. R., & Edgerton, V. R. (1999). Retention of
hindlimb stepping ability in adult spinal cats after the cessation of step
training. Journal Neurophysiology, 81, 85-94.
De Rezze, B., Wright, V., Curran, C. J., Campbell, K. A., & Macarthur, C. (2008).
Individualized outcome measures for evaluating life skill groups for children
THE EFFECTIVENESS OF PROMPT
330
with disabilities. Canadian Journal of Occupational Therapy, 75(5), 282-
287.
Deffeyes, J. E., Harbourne, R. T., Kyvelidou, A., Stuberg, W. A., & Stergiou, N.
(2009). Nonlinear analysis of sitting postural sway indicates developmental
delay in infants. Clinical Biomechanics, 24(7), 564-570.
Dodd, B., & Bradford, A. (2000). A Comparison of three therapy methods for
children with different types of developmental phonological disorder.
International Journal of Language and Communication Disorders, 35(2),
180-209.
Dorfberger, S., Adi-Japha, E., & Karni, A. (2007). Reduced susceptibility to
interference in the consolidation of motor memory before adolescence. PLoS
ONE, 2(2), e240.
Doyon, J. (2008). Motor sequence learning and movement disorders. Current
Opinion in Neurobiology, 21, 478-483.
Doyon, J., & Benali, H. (2005). Reorganization and plasticity in the adult brain
during the learning of motor skills. Current Opinion in Neurobiology,
15(161-167).
Duchan, J. F. (2001). Impairment and social views of speech-language pathology:
clinical practices re-examined. Advances in Speech-Language Pathology,
3(1), 37-45.
Dunst, C. J., Hamby, D. W., & Trivette, C. (2004). Guidelines for calculating effect
sizes for practice-based research syntheses. Centrescope: Evidence-based
approaches to early childhood development, 3(1), 1-10.
Dworkin, J. P. (1991). Motor speech disorders: a treatment guide. St Louis: Mosby
Inc.
Eadie, T. L., Yorkston, K. M., Klasner, E. R., Dudgeon, B. J., Deitz, J.C., . . .
Amtmann, D. (2006). Measuring Communicative Participation: A Review of
Self-Report Instruments in Speech-Language Pathology. American Journal of
Speech - Language Pathology, 15(4), 307.
Ehrich, J. F. (2006). Vygotskian inner speech and the reading process. Australian
Journal of Educational and Developmental Psychology, 6, 12-25.
Elliot, E. J. (2004). Evidence-based speech pathology: barriers and benefits.
International Journal of Speech-Language Pathology, 6(2), 127-130.
THE EFFECTIVENESS OF PROMPT
331
Enderby, P. M. (2000). Assessment and treatment of functional communication in
dysarthria. In L. E. Worrall & C. M. Frattali (Eds.), Neurogenic
communication disorders: a functional approach. New York: Thieme.
Estep, M. (2009). Modulation, adaptation, and control of orofacial pathways in
healthy adults. Journal of Communication Disorders, 42, 280-285.
Estep, M., & Barlow, S. M. (2007). Modulation of the trigeminofacial pathway
during syllabic speech. Brain Research, 1171, 67-74.
Eyre, J. A. (2007). Corticospinal tract development and its plasticity after perinatal
injury. Neuroscience and Biobehavioral Reviews, 31(8), 1136-1149.
Eyre, J. A., Smith, M., Dabydeen, L., Clowry, G. J., Petacchi, E., Battini, R., . . .
Cioni, G. (2007). Is hemiplegic cerebral palsy equivalent to amblyopia of the
corticospinal system? Annals of Neurology, 62(5), 493-503.
Faraway, J. J. (2004). Modelling continuous change for facial animation. Statistics
and Computing, 14, 357-363.
Feng, Y., Gracco, V. L., & Max, L. (2011). Integration of auditory and
somatosensory error signals in the neural control of speech movements.
Journal of Neurophysiology, 106(2), 667-679.
Fetters, L. (2010). Perspective on variability in the development of human action.
Physical Therapy, 90(12), 1860-1867.
Fidler, D., Lunkenheimer, E., & Hahn, L. (2011). Emerging behavioral phenotypes
and dynamic systems theory. In D. J. Fidler (Ed.), International Review of
Research into developmental disabilities: Development in genetic disorders
associated with intellectual disabilities. San Diego: Elsevier.
Field, A. (2009). Discovering statistics using SPSS. London: SAGE Publications
Ltd.
Finan, D. S., & Smith, A. (2005). Jaw stretch reflexes in children. Experimental
Brain Research, 164(1), 58-66.
Fisher, W. W., Kelley, M. E., & Lomas, J. E. (2003). Visual aids and structured
criteria for improving visual inspection and interpretation of single-case
designs. Journal of Applied Behaviour Analysis, 36, 387-406.
Folkins, J., & Canty, J. (1986). Movements of the upper and lower lips during
speech: interactions between lips with the jaw fixed at different positions.
Journal of Speech and Hearing Research, 29, 348-356.
THE EFFECTIVENESS OF PROMPT
332
Foran, J., Stienman, S., Barash, I., Chambers, H., & Lieber, R. (2005). Structural and
mechanical alterations in spastic skeletal muscle. Developmental Medicine
and Child Neurology, 47(10), 713-717.
Fox, C. M. (2002). Intensive voice treatment for children with spastic cerebral palsy
(Doctoral Dissertation). Retrieved from ProQuest Dissertations and Theses
database. (UMI 3073219).
Francis, A. L., Ciocca, V., & Yu, J. M. C. (2003). Accuracy and variability of
acoustic measures of voicing onset. Journal of the Acoustical Society of
America, 113(2), 1025-1032.
Freed, D., Marshall, R., & Frazier, K. (1997). Long-term effectiveness of PROMPT
treatment in a severely apractic-aphasic speaker. Aphasiology, 11(4-5), 365-
372.
Frood, T. T. (2011). The use of treadmill training to recover locomotor ability in
patients with spinal cord injury. Bioscience Horizons, 4(1), 108-117.
Fudala, J. (2001). Arizona Articulation Proficiency Scale, Third Revision. Los
Angeles: Western Psychological Services.
Gagliardi, C., Tavano, A., Turconi, A. C., Pozzoli, U., & Borgatti, R. (2011).
Sequence learning in cerebral palsy. Pediatric Neurology, 44, 207-213.
Garvey, M. A., Giannetti, M. L., Alter, K. E., & Lum, P. S. (2007). Cerebral palsy:
new approaches to therapy. Current Neurology and Neuroscience Reports, 7,
147-155.
Ghilardi, M. F., Moisello, C., Silvestri, G., Ghez, C., & Krakauer, J. W. (2009).
Learning of a sequential motor skill comprises explicit and implicit
components that consolidate differently. Journal of Neurophysiology, 101,
2218-2229.
Gibson, B. E., Darrah, J., Cameron, D., Hashemi, G., Kingsnorth, S., Lepage, C., &
Menna-Dack, D. (2009). Revisiting therapy assumptions in children's
rehabilitation: clinical and research assumptions. Disability and Research,
31(7), 1446-1453.
Gick, B., Ikegami, Y., & Derrick, D. (2010). The temporal window of audio-tactile
integration in speech perception. Journal of the Acoustical Society of
America, 125(5), EL342-EL346.
Gierut, J. (1998). Treatment efficacy: functional phonological disorders in children.
Journal of Speech, Language and Hearing Research, 41(1), S85-S100.
THE EFFECTIVENESS OF PROMPT
333
Gilman, S. (2002). Joint position sense and vibration sense: anatomical organisation
and assessment. Journal of Neurology, Neurosurgery & Psychiatry, 73(5),
473-477.
Glasziou, P., & Vandernbroucke, J. P. (2004). Assessing the quality of research.
British Medical Journal, 328, 39-41.
Goffman, L., & Smith, A. (1999). Development of phonetic differentiation of speech
movement patterns. Journal of Experimental Psychology: Human Perception
and Performance, 25(3), 649-660.
Gomi, H., Honda, M., Ito, T., & Murano, E. Z. (2002). Compensatory articulation
during bilabial fricative production by regulating muscle stiffness. Journal of
Phonetics, 30, 261-279.
Gordon-Brannan, M. E., & Hodson, B. W. (2000). Intelligibility/Severity
Measurements of Prekindergarten Children's Speech. American Journal of
Speech-Language Pathology, 9(2), 141-150.
Gordon-Brannan, M. E., & Weiss, C. E. (2007). Clinical management of articulatory
and phonologic disorders (3rd ed.). Baltimore: Lippincott Williams and
Wilkins.
Gracco, V. L. (1992). Analysis of speech movements: practical considerations and
clinical applications. Haskins Laboratories Status Report on Speech
Research, 110, 45-58.
Green, J. R., Moore, C., Higashikawa, M., & Steeve, R. (2000). The physiologic
development of speech motor control: lip and jaw coordination. Journal of
Speech, Language and Hearing Research, 43, 239-255.
Green, J. R., Moore, C., & Reilly, K. (2002). The sequential development of jaw and
lip control. Journal of Speech, Language and Hearing Research, 45, 66-79.
Green, J. R., & Nip, I. S. B. (2010). Some organising priniciples in early speech
development: Catalysts, constraints and synergy. In B. Massen & P. H. H. M.
Van Lieshout (Eds.), Speech motor control: New developments in basic and
applied research. New York: Oxford University Press.
Green, J. R., & Wilson, E. (2006). Spontaneous facial motility in infancy: A 3D
kinematic analysis. Developmental Psychobiology, 48, 16-28.
Grigos, M., Hayden, D., & Eigen, J. (2010). Perceptual and articulatory changes in
speech production following PROMPT treatment. Journal of Medical
Speech-Language Pathology, 18(4), 46-53.
THE EFFECTIVENESS OF PROMPT
334
Grigos, M., & Patel, R. (2007). Articulator movement associated with the
development of prosodic control in children. Journal of Speech Language
and Hearing Research, 50, 119-130.
Grigos, M., Saxman, J., & Gordan, A. (2005). Speech motor development during
acquisition of the voicing contrast. Journal of Speech Language and Hearing
Research, 48(4), 739-752.
Grossman, J., & Mackenzie, F. J. (2005). The randomized controlled trial: gold
standard, or merely standard? Perspectives in Biology and Medicine, 48(4),
516-534.
Guadagnoli, M. A., & Lee, T. D. (2004). Challenge point: a framework for
conceptualizing the effects of various practice conditions in motor learning.
Journal of Motor Behavior (36), 2.
Gutstein, S. E. (2009). Empowering families through relationship development
intervention: an important part of the biopsychosocial management of autism
spectrum disorders. Annals of Clinical Psychiatry, 21(3), 174-182.
Hadders-Algra, M. (2000). The neuronal group selection theory: promising
principles for understanding and treating developmental motor disorders.
Developmental Medicine and Child Neurology, 42, 707-715.
Hadders-Algra, M. (2001). Early brain damage and the development of motor
behaviour in children: Clues for therapeutic intervention? Neural Plasticity,
8(1-2), 31-49.
Hadders-Algra, M. (2008). Reduced variability in motor behaviour: an indicator of
impaired cerebral connectivity? Early Human Development, 84, 787-789
Hadders-Algra, M. (2010). ariation and variability: key words in human
development. Physical Therapy, 90(12), 1823-1837.
Havstam, C., Buchholz, M., & Hartelius, L. (2003). Speech recognition and
dysarthria: a single subject study of two individuals with profound
impairment of speech and motor control. Logopedics Phoniatrics Vocology,
28(2), 81-90.
Hayden, D. (2003). PROMPT introduction to technique manual. Sante Fe: The
PROMPT Institute.
Hayden, D., & Square, P. (1994). Motor speech treatment hierarchy: A systems
approach. Clinics in Communication Disorders., 4(3), 162-174.
THE EFFECTIVENESS OF PROMPT
335
Hayden, D., & Square, P. (1999). Verbal Motor Production Assessment for Children.
Examiner's Manual. United States of America: The Psychological
Corporation.
Heriza, C. B. (1991). Motor development: traditional and contemporary theories.
Alexandria: Foundation for Physical Therapy.
Higgins, C., & Hodge, M. (2002). Reduced vowel area and intelligibility in children
with and without dysarthria. Journal of Medical Speech-Language
Pathology, 10, 271-277.
Higgins, J. P. T., & Green, S. (2011). Cochrane handbook for systematic reviews of
interventions version 5.1.0: The Cochrane Collaboration.
Hixon, T., & Hardy, J. (1964). Restricted motility of the speech articulators in
cerebral palsy. Journal of Speech and Hearing Disorders, 29(3), 293-306.
Hodge, M. (2010). Stability of intelligibility measures for children with dysarthria
and cerebral palsy. Journal of Medical Speech-Language Pathology, 18(4),
61.
Hodge, M., & Wellman, L. (1999). Management of children with dysarthria. In E.A.
Strand & A. Caruso (Eds.), Clinical management of motor speech disorders
in children (pp. 209-280). New York: Thieme.
Hodge, M., & Whitehall, T. (Eds.). (2010). Intelligibility impairments: Wiley-
Blackwell.
Hodson, B. (2004). Hodson assessment of phonological patterns. Third Edition.
Austin, Texas: Pro-Ed.
Hodson, B., Scherz, J., & Strattman, K. (2002). Evaluating communicative abilities
of a highly unintelligible preschooler. American Journal of Speech Language
Pathology, 11, 232-242.
Hojem, M. A., & Ottenbacher, K. J. (1988). Empirical investigation of visual-
inspection versus trend-line analysis of single-subject data. Physical Therapy,
68(6), 983-988.
Hollenstein, T. (2007). State space grids: analyzing dynamics across development.
International Journal of Behavioral Development, 3(4), 384-396.
Holmstrom, L., Vollmer, B., Tedroff, K., Islam, M., Ke Persson, J., Forssberg, H., &
Eliasson, A.-C. (2010). Hand function in relation to brain lesions and
corticomotor-projection pattern in children with unilateral cerebral palsy.
Developmental Medicine and Child Neurology, 52(2), 145-152.
THE EFFECTIVENESS OF PROMPT
336
Honda, K. T., S, & Takemoto, H. (2010). Effects of side cavities and tongue
stabilization: possible extensions of the quantal theory. Journal of Phonetics,
38, 33-43.
Hong, W.-H., Chen, H.-C., Yang, F.-P., Wu, C.-Y., Cheng, C.-L., & Wong, A. M.
(2011). Speech-associated labiomandibular movement in Mandarin-speaking
children with quadriplegic cerebral palsy: A kinematic study. Research in
Developmental Disabilities, 32(6), 2595-2601.
Hoon, A. H., Stashinko, E. E., Nagae, L. M., Lin, D. D., Keller, J., Bastian, A., . . .
Johnson, M. V. (2009). Sensory and motor deficits in children with cerebral
palsy born preterm correlate with diffusion tensor imaging abnormalities in
thalamocortical pathways. Developmental Medicine and Child Neurology,
51(9), 697-704.
Houghton, M. (2003). The effect of the PROMPT system of therapy on a group of
children with severe persistent sound system disorders. (Master’s thesis).
University of Queensland, Brisbane.
Howe, M. L., & Lewis, M. D. (2005). The importance of dynamic systems
approaches for understanding development. Developmental Review, 25, 247-
251.
Howell, P., Anderson, A. J., Bartrip, J., & Bailey, E. (2009). Comparison of acoustic
and kinematic approaches to measuring utterance-level speech variability.
Journal of Speech, Language and Hearing Research, 52, 1088-1096.
Huang, V. S., Haith, A., Mazzoni, P., & Krakauer, J. W. (2011). Rethinking motor
learning and savings in adaptation paradigms: Model-free memory for
successful actions combines wiht internal models. Neuron, 70, 787-801.
Hustad, K. (2006). Estimating the intelligibility of speakers with dysarthria. Folia
Phoniatrica et Logopaedica, 58, 217-228.
Hustad, K., & Cahill, M. (2003). Effects of presentation mode and repeated
familiarization on intelligibility of dysarthric speech. American Journal of
Speech-Language Pathology, 12(2), 198-208.
Hustad, K., Gorton, K., & Lee, J. (2010). Classification of speech and language
profiles in 4-year-old children with cerebral palsy: A prospective preliminary
study. Journal of Speech, Language and Hearing Research, 53, 1496-1513.
Hustad, K. C., Schueler, B., Schultz, L., & DuHadway, C. (2012, in press).
Intelligibility of 4 year old children with and without cerebral palsy. Journal
THE EFFECTIVENESS OF PROMPT
337
of Speech Language and Hearing Research, 1092-4388_2011_1011-0083.
doi: 10.1044/1092-4388(2011/11-0083).
Ibragimova, N., Lillvist, A., Pless, M., & Granlund, M. (2007). The utility of ICF for
describing interaction in non-speaking children with disabilities - caregiver
ratings and perceptions. Disability and Rehabilitation, 1, 1-12.
Imms, C., Reilly, S., Carlin, J., & Dodd, K. J. (2009). Characteristics influencing
participation of Australian children with cerebral palsy. Disability and
Rehabilitation, 31(26), 2204-2215.
Ingram, T. T. S., & Barn, J. (1961). A description and classification of common
speech disorders associated with cerebral palsy. Cerebral Palsy Bulletin,
3(1), 57-69.
Iskarous, K., Shadle, C. H., & Proctor, M. I. (2011). Articulatory-acoustic
kinematics: the production of American english /s/. Journal of the Acoustical
Society of America, 129(2), 944-954.
Ito, T., & Ostry, D. J. (2010). Somatosensory contribution of motor learning due to
facial skin deformation. Journal of Neurophysiology, 104, 1230-1238.
Iverson, J. M., & Thelen, E. (1999). Hand, mouth and brain: The dynamic
emergence of speech and gesture. Journal of Consciousness Studies, 6(11-
12), 19-40.
Johnston, M. V., Ishida, A., Ishida, W. N., Matsushista, H. B., Nishimura, A., &
Tsuji, M. (2009). Plasticity and injury in the developing brain. Brain and
Development, 31, 1-10.
Juarrero, A. (1999). Dynamics in action: intentional behavior as a complex system.
Cambridge: MIT Press.
Kaderavek, J. N., & Justice, L. M. (2010). Fidelity: An essential component of
evidence-based practice in speech-language pathology. American Journal of
Speech-Language Pathology, 19(4), 369-379.
Kamachi, M., Hill, H., Lander, K., & Vatikiotis-Bateson, E. (2003). Putting the face
to the voice: Matching identify across modality. Current Biology, 13(19),
1709-1714.
Katz, W. F., & McNeil, M. R. (2010). Studies of articulatory feedback treatment for
apraxia of speech based electromagnetic articulatography. Perspectives on
Neurophysiology and Neurogenic Speech and Language Disorders, 20, 73-
79.
THE EFFECTIVENESS OF PROMPT
338
Kearns, K. P., & Simmons, N. N. (1988). Interobserver reliability and perceptual
ratings: more than meets the ear. Journal of Speech and Hearing Research,
31, 131-136.
Keintz, C. K., Bunton, K., & Hoit, D. (2007). Influence of visual information on the
intelligibility of dysarthric speech. American Journal of Speech Language
Pathology, 16(3), 224-234.
Kelso, J. A. S. (1984). Phase transitions and critical behavior in human bimanual
coordination. The American Journal of Physiology, 246(6), R1000-R1004.
Kelso, J. A. S. (2003). Cognitive coordination dynamics. In W. Tschacher & J.-P.
Dauwalder (Eds.), The dynamical systems approach to cognition: concepts
and empirical paradigms based on self-organisation, embodiment, and
coordination dynamics: Toh Tuck Link: World Scientific Publishing.
Kelso, J. A. S., Fink, P. W., DeLaplain, C. R., & Carson, R. G. (2001). Haptic
information stabilizes and destabilizes coordination dynamics. Proceedings
of the Royal Society of London, 268, 1207-1213.
Kelso, J. A. S., Tuller, B., Vatikiotis-Bateson, E., & Fowler, C. (1984). Functionally
specific articulatory cooperation following jaw perturbations druing speech:
evidence for coordinative structures. Journal of Experimental Psychology:
Human Perception and Performance, 10(6), 812-832.
Kelso, J. A. S., & Zanone, P. (2002). Coordination dynamics of learning and transfer
across different effector systems. Journal of Experimental Psychology:
Human Perception and Performance, 28(4), 776-797.
Kennes, J., Rosenbaum, P., Hanna, S. E., Walter, S., Russell, D., Raina, P., . . .
Galuppi, B. (2002). Health status of school-aged children with cerebral palsy:
information from a population-based sample. Developmental Medicine and
Child Neurology, 44(4), 240-247.
Kent, R. D. (1992). The biology of phonological development. In C. Ferguson, L.
Menn & C. Stoel-Gammon (Eds.), Phonological development: Models,
research, implications: Timonium, MD: York Press.
Kent, R. D., & Kent, J. (2000). Task-based profiles of the dysarthrias. Folia
Phoniatrica et Logopaedica, 52(1-3), 48-53.
Kent, R. D., & Kim, Y. (2003). Toward an acoustic typology of motor speech
disorders. Clinical Linguistics and Phonetics, 17(6), 427-445.
THE EFFECTIVENESS OF PROMPT
339
Kent, R. D., Miolo, G., & Bloedel, S. (1994). The intelligibility of children's speech.
American Journal of Speech Language Pathology, 3, 81-95.
Kent, R. D., & Netsell, R. (1978). Articulatory abnormalities in athetoid cerebral
palsy. Journal of Speech and Hearing Disorders, 43, 353-373.
Kent, R. D., Weismer, G., Kent, F. J., Vorperian, H., & Duffy, J. (1999). Acoustic
studies of dysarthric speech: methods, progress, and potential. Journal of
Communication Disorders, 32(141-186).
Kim, H., Martin, K., & Hasegawa-Johnson, M. P., A. (2010). Frequency of
consonant articulation errors in dysarthric speech. Clinical Linguistics and
Phonetics, 24(10), 759-770.
Kim, Y., Kent, R. D., & Weismer, G. (2011). An acoustic study of the relationships
among neurologic disease, dysarthria type, and severity of dysarthria. Journal
of Speech, Language and Hearing Research, 54(417-429).
King, S., Teplicky, R., King, G., & Rosenbaum, P. (2004). Family-centered service
for children with cerebral palsy and their families: a review of the literature.
Seminars in Pediatric Neurology, 11(1), 78-86.
Kleim, J. A., & Jones, T. A. (2008). Principles of experience-dependent plasticity:
implications for rehabilitation after brain damage. Journal of Speech,
Language and Hearing Research, S51, S225-S239.
Klein, E., & Flint, C. (2006). Measurement of intelligibility in disordered speech.
Language Speech and Hearing Services in Schools, 37(3), 191-199.
Kleinow, J., & Smith, A. (2006). Potential interaction among linguistic, autonomic,
and motor speech factors in speech. Developmental Psychobiology, 48, 275-
287.
Kolb, B., & Whishaw, I. Q. (1996). Brain plasticity and behavior. Annual Review of
Psychology, 49(43-46).
Korzeniewski, S. J., Birbeck, G., Delano, M. C., Potchen, M. J., & Paneth, N.
(2008). A systematic review of neuroimaging for cerebral palsy. Journal of
Child Neurology, 23(2), 216-227.
Kostrubiec, V., Tallet, J., & Zanone, P. (2006). How a new behavioral pattern is
stabilized with learning determines its persistence and flexibility in memory.
Experimental Brain Research, 170, 238-244.
Krakauer, J. W. (2006). Motor learning: its relevance to stroke recovery and
neurorehabilitation. Current Opinion in Neurobiology, 19, 84-90.
THE EFFECTIVENESS OF PROMPT
340
Krakauer, J. W., Mazzoni, P., Ghazisadeh, A., Ravindran, R., & Shadmehr, R.
(2006). Generalization of motor learning depends on the history of prior
action. PLoS Biology, 4(10), e316.
Krigger, K. (2006). Cerebral Palsy: An overview. American Family Physician, 73(1),
91-100.
Landi, S. M., Baguear, F., & Della-Maggiore, V. (2011). One week of motor
adaptation induces structural changes in primary motor cortex that predict
long-term memory one year later. The Journal of Neuroscience, 31(33),
11808-11813.
Latash, M. L., Levin, M. F., Scholz, J. P., & Schöner, G. (2010). Motor control
theories and their applications. Medicina (Kaunas), 46(6), 382-392.
Law, M., Baptiste, S., Carswell, A., McColl, M. A., Polatajko, H., & Pollock, N.
(2005). Canadian Occupational Peformance Meausure. Ottawa: CAOT
Publications, ACE.
Lee, T. D., Wulf, G., & Schmidt, R. A. (1992). Contextual interference in motor
learning: dissociated effects due to the nature of task variations. The
Quarterly Journal of Experimental Psychology Section A, 44(4), 627-644.
Lewis, M. D. (2011). Dynamic systems approaches: Cool enough? Hot enough?
Child Development Perspectives, 5(4), 279-285.
Lin, E. L., Chen, C. L., & Lee, C. C. (2007). Speech motor deficits in cerebral
palsied children: An acoustic-perceptual approach. Paper presented at the
The 5th Asia Pacific Conference on Speech, Language and Hearing,
Brisbane.
Lin, J. (2003). The cerebral palsies: A physiological approach. Journal of Neurology,
Neurosurgery and Psychiatry, 74(Supplement 1), i23-29.
Lindblom, B. (1990). On the communication process: speaker-listener interaction
and the development of speech. Augmentative and Alternative
Communication, 6, 220-230.
Lindstrom, C. (2002). Objective facial motion analysis in patients with facial nerve
dysfunction. The Laryngoscope, 112, 1129 -1147.
Liu, H. M., Tsao, F. M., & Kuhl, P. K. (2005). The effect of reduced vowel working
space on speech intelligibility in Mandarin-speaking young adults with
cerebral palsy. Journal of the Acoustical Society of America, 117(6), 3879-
3889.
THE EFFECTIVENESS OF PROMPT
341
Liu, Y.-T., Mayer-Kress, G., & Newell, K. M. (2010). Bi-stability of movement
coordination as a function of skill level and task difficulty. Journal of
Experimental Psychology: Human Perception and Performance, 36(6), 1515-
1524.
Löfqvist, A., & Gracco, V. L. (1997). Lip and jaw kinematics in bilabial stop
production. Journal of Speech, Language and Hearing Research, 40(4), 877-
893.
Logan, L. R., Hickman, R. R., Harris, S. R., & Heriza, C. B. (2008). Single-subject
research design: recommendations for levels of evidence and quality rating.
Developmental Medicine and Child Neurology, 50, 99-103.
Loucks, T., & De Nil, L. (2001). The effects of massester tendon vibration on
nonspeech movements and vowel gestures. Journal of Speech, Language and
Hearing Research, 44(2), 306-316.
Love, R. (1992). Childhood speech disability. New York: Macmillan Publishing
Company.
LSVT®. (2011). LSVT Workshops Retrieved 29.12.2011, from
http://www.lsvtglobal.com/index.php?action=schedule
Ludlow, C. L., Hoit, J., Kent, R., Ramig, L. O., Shrivastav, R., Strand, E., . . .
Sapienza, C. M. (2008). Translating principles of neural plasticity into
research on speech motor control recovery and rehabilitation. Journal of
Speech, Language and Hearing Research, 51, S240-S258.
Luft, A. R., & Buitrago, M. M. (2005). Stages of motor skill learning. Molecular
Neurobiology, 32(3), 205-216.
Maas, E., Robin, D. A., Austermann Hula, S., N, Wulf, G., Ballard, K. J., &
Schmidt, R. A. (2008). Principles of motor learning in treatment of motor
speech disorders. American Journal of Speech Language Pathology, 17, 277-
298.
Macefield, V. (2005). Physiological characteristics of low-threshold
mechanoreceptors in joints, muscle and skin in human subjects. Clinical and
Experimental Pharmacology and Physiology, 32, 135-144.
Majnemer, A., & Mazer, B. (2004). New directions in the outcome evaluation of
children with cerebral palsy. Seminars in Pediatric Neurology, 11(1), 11-17.
Majnemer, A., Shevell, M., Law, M., Birnbaum, R., Chilingaryan, G., Rosenbaum,
P., & Poulin, C. (2008). Participation and enjoyment of leisure activities in
THE EFFECTIVENESS OF PROMPT
342
school-aged children with cerebral palsy. Developmental Medicine and Child
Neurology, 50(10), 751-758.
Maner, K., Smith, A., & Grayson, L. (2000). Influence of utterance length and
complexity on speech motor performance in children and adults. Journal of
Speech Language and Hearing Research, 43(2), 560-573.
Marchant, J., McCauliffe, M., & Huckabee, M. (2008). Treatment of articulatory
impairment in a child with spastic dysarthria associated with cerebral palsy.
Developmental Neurorehabilitation, 11(1), 81-90.
Martikainen, A.-L., & Korpilahti, P. (2011). Intervention for childhood apraxia of
speech: A single-case study. Child Language Teaching & Therapy, 27(1), 9-
20.
Martin, A., Burtner, P. A., Poole, J., & Phillips, J. (2008). Case Report: ICF-Level
changes in a preschooler after constraint-induced movement therapy.
American Journal of Occupational Therapy, 62(3), 282-288.
Martin, J. H. (2005). The corticospinal system: from development to motor control.
The Neuroscientist, 11, 161-173.
Martin, J. H., Friel, K. M., Salimi, I., & Chakrabarty, S. (2007). Activity- and use-
dependent plasticity of the developing corticospinal system. Neuroscience
and Biobehavioral Reviews, 31(1125-1135).
Marx, N. (2008). Using goal attainment scaling as an outcome measure for
PROMPT therapy. ACQuiring Knowledge in Speech, Language and Hearing,
10(2), 56-59.
Mattar, A. G., & Ostry, D. J. (2007). Modificability of generalization in dynamics
learning. Journal of Neurophysiology, 98, 3321-3329.
McCauley, R. J., & Strand, E. A. (1999). Treatment of children exhibiting
phonological disorder with motor speech involvement. In A. Caruso & E. A.
Strand (Eds.), Clinical management of motor speech disorders in children.
New York: Thieme Medical Publishers.
McClean, M. D., & Tasko, S. M. (2003). Association of orofacial muscle activity
and movement during changes in speech rate and intensity. Journal of
Speech, Language and Hearing Research, 46, 1387-1400.
McConachie, H., Colver, A. F., Forsyth, R. J., Jarvis, S. N., & Parkinson, K. N.
(2006). Participation of disabled children: how should it be characterised and
measured? Disability and Rehabilitation, 18, 1157-1164.
THE EFFECTIVENESS OF PROMPT
343
McCormack, J., McLeod, S., Harrison, L. J., & McAllister, L. (2010). The impact of
speech impairment in early childhood: investigating parents' and speech-
language pathologists' persepctives using the ICF-CY. Journal of
Communication Disorders, 43, 378-396.
McDougall, J., Wright, V., & Rosenbaum, P. (2010). The ICF model of functioning
and disability: Incorporating quality of life and human development.
Developmental Rehabilitation, 13(3), 204-211.
McGurk, H., & MacDonald, J. (1976). Hearing lips and seeing voices. Nature, 264,
364-748.
McHenry, M. (2011). An exploration of listener variability in intelligibility
judgments. American Journal of Speech-Language Pathology, 20(2), 119-
123.
McLeod, S. (2004). Speech pathologists' application of the ICF to children with
speech impairment. Advances in Speech Language Pathology, 6(1), 75-81.
McLeod, S. (2006). An holistic view of a child with unintelligible speech: Insights
from the ICF and ICF-CY. Advances in Speech Language Pathology, 8(3),
293-315.
McLeod, S., & Bleile, K. (2004). The ICF: A framework for setting goals for
children with severe speech impairment. Child Language Teaching and
Therapy, 20(3), 199-219.
McLeod, S., van Doorn, J., & Reed, V. A. (2001). Consonant cluster development in
two-year-olds: General trends and individual differences. Journal of Speech,
Language and Hearing Research, 44, 1141-1171.
Mefferd, A. S., & Green, J. R. (2010). Articulatory-to-acoustic relations in response
to speaking rate and loudness manipulations. Journal of Speech, Language
and Hearing Research, 53(5), 1206-1219.
Ménard, L., Perrier, P., Aubin, J., Savariaux, C., & Thibeault, M. (2008).
Compensation strategies for a lip-tube pertubration of French [u]: an acoustic
and perceptual study of 4-year-old children. The Journal of the Acoustical
Society of America, 12(2), 1192-1206.
Milloy, N., & Morgan-Barry, R. (1990). Developmental neurological disorders. In P.
Grunwell (Ed.), Developmental Speech Disorders. Edinburgh: Wiley
Publishers.
THE EFFECTIVENESS OF PROMPT
344
Miyamoto, K., Ishizuka, Y., Ueda, M., Saifuddin, M., Shikata, N., & Tanne, K.
(1999). Masseter muscle activity during the whole day in children and young
adults. Journal of Oral Rehabilitation, 26, 858-864.
Moher, D., Schulz, K. F., Altman, D., & Group, f. t. C. (2001). The CONSORT
Statement: Revised recommendations for improving the quality of reports of
parallel-group randomized trials. The Journal of the American Medical
Association, 285(15), 1987-1991.
Monfils, M. H., Plautz, E. J., & Kleim, J. A. (2005). In search of the motor engram:
motor map plasticity as a mechanism for encoding motor experience. The
Neuroscientist, 11(5), 471-483.
Moore, C. A. (2004). Physiological development of speech production. In B.
Maassen, R. D. Kent, H. F. M. Peters, P. H. H. M. van Lieshout & W.
Hulstijn (Eds.), Speech motor control in normal and disordered speech.
Oxford: Oxford University Press.
Morgan, A. T., & Vogel, A. P. (2008). Intervention for childhood apraxia of speech.
Cochrane Database of Systematic Reviews, 3, 1-19.
Morris, C. (2009). Measuring participation in childhood disability: how does the
capability approach improve our understanding? Developmental Medicine
and Child Neurology, 51(2), 92-94.
Morris, C., Kurinczuk, J. J., Fitzpatrick, R., & Rosenbaum, P. (2006). Do the
abilities of children with cerebral palsy explain their activities and
participation. Developmental Medicine & Child Neurology, 48(12), 954-961.
Muchisky, M., Gershkoff-Stowe, L., Cole, E., & Thelen, E. (1996). The epigenetic
landscape revisited: a dynamic interpretation. In C. Rovee-Collier & L. P.
Lipsitt (Eds.), Advances in Infancy Research (Vol. 10). New Jersey: Ablex
Publishing Corporation.
Murdoch, B. (2011). Physiological investigation of dysarthria: recent advances.
International Journal of Speech-Language Pathology, 13, 28-35.
Murdoch, B., & Horton, S. K. (Eds.). (1998). Acquired and developmental
dysarthria in childhood. Cheltenham: Stanley Thornes.
Murray, G. M., & Klineberg, I. J. (1984). Electromyographic recordings of human
jaw-jerk reflex characteristics evoked under standardized conditions.
Archives of Oral Biology, 29(7), 537-549.
THE EFFECTIVENESS OF PROMPT
345
Mutlu, A., Akmese, P. P., Gunel, M. K., Karahn, S., & Livanelioglu, A. (2010). The
importance of motor functional levels from the activity limitation perspective
of ICF in children with cerebral palsy. International Journal of
Rehabilitation Research, 33(4), 319-324.
Nadeau, L., & Tessier, R. (2009). Social adjustment at school: are children with
cerebral palsy perceived more negatively by peers than other at-risk children?
Disability and Rehabilitation, 31(4), 302-308.
Nakaya, J., Shimizu, T., Tanaka, H., & Shigetaka, A. (2005). Current translational
research in Australia and national translational research supporting center in
Japan. Chiem-Bio Informatics Journal, 5(2), 27-38.
Nazari, M. A., Perrier, P., Chabanas, M., & Payan, Y. (2011). Shaping by stiffening:
a modeling study for lips. Motor Control, 15(1), 141-168.
Neilson, P. D., & O'Dwyer, N. J. (1981). Pathophysiology of dysarthria in cerebral
palsy. Journal of Neurology, Neurosurgery, and Psychiatry, 44, 1013-1019.
Nelson, M. A., & Hodge, M. M. (2000). Effects of facial paralysis and audiovisual
information on stop placement identification. Journal of Speech, Language
and Hearing Research, 43, 158-172.
Netsell, R. (2001). Speech aeromechanics and the dysarthrias: implications for
children with brain injury. The Journal of Head Trauma Rehabilitation,
16(5), 415-425.
Newell, K. M. (1991a). Motor learning in practice: a constraints led approach.
Annual Review of Psychology, 42, 213-237.
Newell, K. M. (1991b). Motor skill acqusition. Annual Review of Psychology, 42,
213-237.
Newell, K. M. (2003). Changes in motor learning: a coordination and control
perspective. Motriz, Rio Claro, 9(1), 1-6.
Newell, K. M., Broderick, M. P. D., K.M, & Slifkin, A. B. (2003). Task goals and
change in dynamical degrees of freedom with motor learning. Journal of
Experimental Psychology: Human Perception and Performance, 29(2), 379-
387.
Newell, K. M., Deutsch, K. M., Sosnoff, J. J., & Mayer-Kress, G. (2006). Variability
in motor output as noise: a default and erroneous proposition? In K. Davids,
S. Bennett & K. M. Newell (Eds.), Movement System Variability.
Champaign: Human Kinetics.
THE EFFECTIVENESS OF PROMPT
346
Newell, K. M., Liu, Y.-T., & Mayer-Kress, G. (2001). Time scales in motor learning
and development. Psychological Review, 108(1), 57-82.
Newell, K. M., & Valvano, J. (1998). Therapeutic intervention as a constraint in
learning and relearning movement skills. Scandinavian Journal of
Occupational Therapy, 5(3), 51-57.
Newman, B. M., & Newman, P. R. (2007). Theories of human development. New
Jersey: Lawrence-Erlbaum Associates, Inc.
NHMRC. (2009). NHMRC levels of evidence and grades for recommendations for
developers of guidelines. Canberra: Retrieved from
http://www.nhmrc.gov.au/_files_nhmrc/file/guidelines/evidence_statement_f
orm.pdf.
Nip, I. S. B., Green, J. R., & Marx, D. B. (2009). Early speech motor development:
cognitive and linguistic considerations. Journal of Communication
Disorders, 42, 286-298.
Nip, I. S. B., Green, J. R., & Marx, D. B. (2011). The co-emergence of cognition,
language and speech motor control in early development: a longitudinal
correlation study. Journal of Communication Disorders, 44, 149-160.
Nourbakhsh, M. R., & Ottenbacher, K. J. (1994). The statisitcal analysis of single-
subject data: a comparative examination. Physical Therapy, 74(8), 768-776.
Olive, M. L., & Smith, B. W. (2005). Effect size calculations and single subject
designs. Educational Psychology, 25(2-3), 313-324.
Orme, J. G., & Cox, M. E. (2001). Analyzing single-subject design data using
statistical process control charts. Social Work Research, 25(2), 115-127.
Ortega, A. O. L., Guimarães, A. S., Ciamponi, L., & Marie, S. K. N. (2008).
Frequency of temporomandibular disorder signs in individuals with cerebral
palsy. Journal of Oral Rehabilitation, 35(5), 191-195.
Ostry, D. J., Vatikiotis-Bateson, E., & Gribble, P. L. (1997). An examination of the
degrees of freedom of human jaw motion in speech and mastication. Journal
of Speech, Language and Hearing Research, 40, 1341-1351.
Ozsancak, C., Auzou, P., Jan, M., Defebvre, L., Derambure, P., & Destee, A. (2006).
The place of perceptual analysis of dysarthria in the differential diagnosis of
corticobasal degeneration and Parkinson's disease. Journal of Neurology,
253(1), 92-97.
THE EFFECTIVENESS OF PROMPT
347
Paatsch, L. E., Blamey, P. J., Sarant, J. Z., & Bow, C. P. (2006). The effects of
speech production and vocabulary training on different components of
spoken language performance. Journal of Deaf Studies and Deaf Education,
11(1), 39-55.
Palisano, R. J., Orlin, M., Chiarello, L. A., Oeffinger, D., Polansky, M., Maggs, J., . .
. Stevenson, R. (2011). Determinants of Intensity of Participation in Leisure
and Recreational Activities by Youth With Cerebral Palsy. Archives of
Physical Medicine and Rehabilitation, 92(9), 1468-1476.
Palmer, M., & Enderby, P. M. (2007). Methods of speech therapy treatment for
stable dysarthria: A review. Advances in Speech-Language Pathology, 9(2),
140-153.
Pannbacker, M. (1988). Management strategies for developmental apraxia of speech:
A review of the literature. Journal of Communication Disorders, 21(5), 363-
371.
Papavasiliou, A. S. (2009). Management of motor problems in cerebral palsy: a
critical update for the clinician. European Journal of Paediatric Neurology,
13, 387-396.
Pascual-Leone, A., Amedi, A., Fregni, F., & Merabet, L. B. (2005). The plastic
human cortex. Annual Review of Neuroscience, 28, 377-401.
Patel, R., & Campellone, P. (2009). Acoustic and perceptual cues to contrastive
stress in dysarthria. Journal of Speech, Language & Hearing Research,
52(1), 206-222.
Peeters, R., Verhoeven, L., de Moor, J., & van Balkom, H. (2009). Importance of
speech production for phonological awareness and word decoding: the case
of children with cerebral palsy. Research in Developmental Disabilities, 30,
712-726.
Pennington, L., Goldbart, J., & Marshall, J. (2005). Direct speech and language
therapy for children with cerebral palsy: Findings from a systematic review.
Developmental Medicine and Child Neurology, 47(1), 57-63.
Pennington, L., Miller, N., & Robson, S. (2009). Speech therapy for children with
dysarthria acquired before three years of age. Cochrane Database of
Systematic Reviews(4).
THE EFFECTIVENESS OF PROMPT
348
Pennington, L., Smallman, C., & Farrier, F. (2006). Intensive dysarthria therapy for
older children with cerebral palsy: findings from six cases. Child Language
Teaching and Therapy, 22(3), 255 - 273.
Peters, H., Hulstijn, W., & Van Leishout, P. (2000). Recent developments in speech
motor research into stuttering. Folia Phoniatrica et Logopaedica, 52(1-3),
103-119.
Piek, J. P. (2002). The role of variability in early motor development. Infant
Behavior and Development, 25, 452-465.
Pinto-Zipp, G., & Gentile, A. M. (2010). Practice schedule and the learning of motor
skills in children and adults: teaching implications. Journal of College
Teaching and Learning, 7(2), 35-42.
Pirila, S., van der Meere, J., Pentikainen, T., Ruusu-Niemi, P., Korpela, R., Kilpinen,
J., & Nieminen, P. (2007). Language and motor speech skills in children with
cerebral palsy. Journal of Communication Disorders, 40, 116-128.
Platt, L., Andrews, G., Young, M., & Quinn, P. (1980). Dysarthria of adult cerebral
palsy: 1. Intelligibility and articulatory impairment. Journal of Speech and
Hearing Research, 23, 28-40.
Porter, R. J., & Hogue, D. M. (1998). Nonlinear dynamical systems in speech
perception and production. Nonlinear Dyhamics, Psychology, and Life
Sciences, 2(2), 95-131.
Portney, L., & Watkins, M. (2009). Foundations of clinical research. Applications to
practice. (3rd ed.). Prentice Hall Health: New Jersey.
Powell, T. W., Elbert, M., Miccio, A. W., Strike-Roussos, C., & Brasseur, J. (1998).
Facilitating [s] production in young children: an experimental evalaluation of
motoric and conceptual treatment approaches. Clinical Linguistics and
Phonetics, 12(2), 127-146.
Quené, H., & van den Bergh, H. (2004). On multi-level modeling of data from
repeated measures designs: A tutorial. Speech Communication, 43(1-2), 103-
121.
Reilly, S. (2004). The challenges in making speech pathology practice evidence
based. Advances in Speech-Language Pathology, 6(2), 113-124.
Repp, B. H. (2005). Sensorimotor synchronization: A review of the tapping
literature. Psychonomic Bulletin and Review, 12(6), 969-992.
THE EFFECTIVENESS OF PROMPT
349
Riely, R. R., & Smith, A. (2003). Speech movements do not scale by orofacial
structure size. Journal of Applied Physiology, 94, 2119-2126.
Robey, R. R. (2004). A five-phase model for clinical-outcome research. Journal of
Communication Disorders, 37(5), 401-411.
Robey, R. R., & Schultz, M. C. (1998). A model for conducting clinical-outcome
research: An adaptation of the standard protocol for use in aphasiology.
Aphasiology, 12(9), 787-810.
Rogers, S., Hayden, D., Hepburn, S., Charlifue-Smith, R., Hall, T., & Hayes, A.
(2006). Teaching young nonverbal children with autism useful speech: A
pilot study of the Denver Model and PROMPT interventions. Journal of
Autism and Developmental Disorders, 36, 1007-1024.
Roid, G., & Miller, L. (1997). Leiter International Performance Scale-Revised.
Wood Dale, IL: Stoelting Company.
Rosenbaum, D. A. (2010). Human Motor Control (2nd edition). San Diego: Elsevier
Inc.
Rosenbaum, P. (2010). The randomized controlled trial: an excellent design, but can
it address the big questions in neurodisability. Developmental Medicine and
Child Neurology, 52(2), 111.
Rosenbaum, P., & Stewart, D. (2004). The World Health Organization International
classification of functioning, disability and research: A model to guide
clinical thinking, practice and research in the field of cerebral palsy.
Seminars in Pediatric Neurology, 11(1), 5-10.
Roy, N., Leeper, H., Blomgren, H., & Cameron, R. (2001). A description of
phonetic, acoustic and physiological changes associated with improved
Intelligibility in a speaker with spastic dysarthria. American Journal of
Speech Language Pathology, 10(3), 274-290.
Ruark, J. L., & Moore, C. A. (1997). Coordination of lip muscle activity by 2-year-
old children during speech and non-speech tasks. Journal of Speech,
Language and Hearing Research, 40(6), 1373-1385.
Rvachew, S., Rafaat, S., & Martin, M. (1999). Stimulability, speech perception
skills, and the treatment of phonological disorders. American Journal of
Speech Language Pahtology, 8, 33-43.
THE EFFECTIVENESS OF PROMPT
350
Sackett, D., Rosenberg, W., Gray, J., Haynes, R., & Richardson, S. (1996). Evidence
based medicine: What it is and what it isn't. British Medical Journal, 312, 71-
72.
Sanes, J. (2003). Neocortical mechanisms in motor learning. Current Opinion in
Neurobiology, 13, 225-231.
Sanger, T. D., & Kukke, S. N. (2007). Abnormalities of tactile sensory function in
children with dystonic and diplegic cerebral palsy. Journal of Child
Neurology, 22(3), 289-293.
Satake, E., Jagaroo, V., & Maxwell, D. L. (2008). Handbook of statistical methods:
single subject design. San Diego: Plural Publishing.
Savion-Lemieux, T., & Penhume, V. B. (2010). The effect of practice pattern on the
acquisition, consolidation and transfer fo visual-motor sequences.
Experimental Brain Research, 204, 271-281.
Schmidt, R. A., & Lee, D. (2005). Motor control and learning: a behavioural
emphasis. Champaign: Human Kinetics.
Schore, A. N. (1997). Early organization of the nonlinear right brain and
development of a predisposition to psychiatric disorders. Development and
Psychopathology, 9, 595-631.
Seidler, R. D., & Noll, D. C. (2008). Neuroanatomical correlates of motor
acquisition and motor transfer. Journal of Neurophysiology, 99(4), 1836-
1845.
Seidler, R. D., Noll, D. C., & Chintalapati, P. (2006). Bilateral basal ganglia
activation associated with sensorimotor adaptation. Experimental Brain
Research, 175(3), 544-555.
Sellars, C., Hughes, T., & Langhorne, P. (2005). Speech and language therapy due to
non-progressive brain damage. Cochrane Database of Systematic Reviews(3).
Semel, E., Wiig, E., & Secord, W. (1995). Clinical Evaluation of Language
Fundamentals. Fourth edition San Antonio, Tx: The Psychological
Corporation.
Serrien, D. (2009). Interactions between new and pre-existing dynamics in bimanual
movement control. Experimental Brain Research, 197, 269-278.
Sessle, B., Yao, D., Nishiura, H., Yoshinok, K., Lee, J., Martin, R., & Murray, G.
(2005). Properties of plasticity of the primate somatosensory motor cortex
THE EFFECTIVENESS OF PROMPT
351
related to orofacial sensory motor function. Clinical and experimental
pharmacology and physiology, 32, 109-114.
Shiller, D. M., Gracco, V. L., & Rvachews, S. (2010). Auditory-motor learning
during speech production in 9-11-year-old children. PLoS ONE, 59, e12975.
Shiller, D. M., Laboissiére, R., & J, O. D. (2002). Relationship between jaw stiffness
and kinematic variability in speech. Journal of Neurophysiology, 88, 2329-
2340.
Shriberg, L. D., Fourakis, M., Hall, S. D., Karlsson, H. B., Lohmeier, H. L.,
McSweeney, J. L., . . . Wilson, D. L. (2010). Perceptual and acoustic
reliability estimates for the speech disorders classification system (SDCS).
Clinical Linguistics and Phonetics, 24(10), 825-846.
Shriberg, L. D., & Kwiatkowski, J. (1982). Phonological disorders III: A procedure
for assessing severity of involvement. Journal of Speech and Hearing
Disorders, 47, 256-270.
Shriberg, L. D., Lewis, B., McSweeny, J., & Wilson, P. (1997). The percentage of
consonants correct (PCC) metric: Extensions and reliability data. Journal of
Speech, Language and Hearing Research, 40, 708-722.
Shumway-Cook, A., Hutchinson, S., Kartin, D., Price, R., & Woollacott, M. (2003).
Effect of balance recovery of stability in children with cerebral palsy.
Developmental Medicine and Child Neurology, 45(9), 591-602.
Shumway-Cook, A., & Woollacott, M. (2012). Motor control: translating research
into clinical practice (4th ed.). Philadelphia: Lippincott Williams and
Wilkins.
Siebes, R., Wijnroks, L., & Vermeer, A. (2002). Qualitative analysis of therapeutic
motor intervention programmes for children with cerebral palsy: an update.
Developmental Medicine and Child Neurology, 44(9), 593-603.
Sing, G. C., & Smith, A. M. (2010). Reduction in learning rates associated with
anterograde interference results from interactions between different
timescales in motor adaptation. PLoS Computation Bioloby, 6(8), e1000893.
Singh, L., & Singh, N. C. (2008). The development of articulatory signatures in
children. Developmental Science, 11(4), 467-473.
Smith, A. (1992). The control of orofacial movements in speech. Critical Reviews in
Oral Biology and Medicine, 3(3), 233-267.
THE EFFECTIVENESS OF PROMPT
352
Smith, A. (Ed.). (2010). Development of neural control of orofacial movements for
speech. West Sussex: John Wiley and Sons Ltd.
Smith, A., & Goffman, L. (Eds.). (2004). Interactions of motor and language factors
in the development of speech production. New York: Oxford University
Press.
Smith, A., & Zelaznik, H. N. (2004). Development of functional synergies for
speech motor coordination in childhood and adolescence. Developmental
Psychobiology, 45, 22-33.
Smith, M. A., Ghazisadeh, A., & Shadmehr, R. (2006). Interacting adapative
processes with different timescales underlie short-term motor learning. PLoS
Biology, 4(6), e179.
Solanas, A., Manolov, R., & Onghena, P. (2010). Estimating slope and level change
in N=1 designs. Behavior Modification, 34(3), 195-218.
Soloman, N., & Charron. (1998). Speech breathing in able-bodied and children with
cerebral palsy: A review of the literature and implications for clinical
intervention. Journal of Speech Language Pathology, 7(2), 61-78.
Speech Pathology Association of Australia (SPA). (2003). Scope of practice in
speech pathology. Melbourne, Victoria. Retrieved from
http://www.speechpathologyaustralia.org.au/library/Core_Assoc_Doc/Scope
_of_Practice.pdf.
Spencer, J., & Perone, S. (2008). Defending Qualitative Change: The view from
dynamical systems theory. Child Development, 79(6), 1639-1647.
Square, P. A. (1999). Treatment of developmental apraxia of speech: tactile-
kinesthetic, rhythmic, and gestural approaches. In A. J. Caruso & E. A.
Strand (Eds.), Clinical management of motor speech disorders in children.
New York: Thieme.
Square, P. A., Chumpelik (Hayden), D., Morningstar, D., & Adams, S. G. (1986).
Efficacy of the PROMPT system of therapy for the treatment of apraxia of
speech: A follow-up intestigation. Paper presented at the Clincial
aphasiology: conference proceedings, Minneapolis.
Stamer, M. (2000). Posture and movement of the child with cerebral palsy. United
States of America: Therapy Skill Builders.
THE EFFECTIVENESS OF PROMPT
353
Steeve, R. W., & Moore, C. A. (2009). Mandibular motor control during the early
development of speech and nonspeech behaviours. Journal of Speech,
Language and Hearing Research, 52, 1530-1554.
Steeve, R. W., Moore, C. A., Green, J. R., Reilly, K. J., & McMurtrey, J. (2008).
Babbling, chewing, and sucking: Oromandibular coordination at 9 months.
Journal of Speech, Language and Hearing Research, 51, 1390-1404
Stein, B. E., Wallace, M. T., & Stanford, T. R. (1999). Development of multisensory
integration: transforming sensory input into motor output. Mental
Retardation and Developmental Disabilities Research Reviews, 5, 72-85.
Stergiou, N., Harbourne, R., & Cavanaugh, J. (2006). Optimal Movement
Variability: A new theoretical perspective for neurologic physical therapy.
Journal of Neurological Physical Therapy, 30(3), 120-129.
Stinchfield, S. M., & Young, E. H. (1938). Children with delayed or defective
speech:Motor-kinesthetic factors in their training. Stanford, California:
Stanford University Press.
Stone, M., & Murano, E. Z. (2007). Speech patterns in a muscular hydrostat: Lip,
tongue and glossectomy movement. Paper presented at the Proceedings of the
Third B-J-K Symposium on Biomechanics, Healthcare and Information
Science, Kanazawa, Japan.
Strand, E.A., Stoekel, R., & Baas, B. (2006). Treatment of severe childhood apraxia
of speech: a treatment efficacy study. Journal of Medical Speech-Language
Pathology, 14(4), 297-307.
Strand, E. A., & Skinder, A. (1999). Treatment of developmental apraxia of speech:
integral stimulation methods. In A. J. Caruso & E. A. Strand (Eds.), Clinical
management of motor speech disorders in children. New York: Thiemes
Sullivan, P., & Goldmann, D. (2011). The promise of comparative effectiveness
research. Journal of the American Medical Association, 305(4), 400-401.
Tasko, S., & McClean, M. (2004). Variations in articulatory movement with changes
in speech tasks. Journal of Speech Language and Hearing Research, 47, 85-
100.
Tate, R. L., McDonald, S., Perdices, M., Togher, L., Schultz, R., & Savage, S.
(2008). Rating the methodological quality of single-subject designs and n-of-
1 trials: Introducing the single-case experimental design (SCED) scale.
Neuropsychological Rehabilitation, 18(4), 385-401.
THE EFFECTIVENESS OF PROMPT
354
Tedroff, K., Knutson, L., & Soderberg, G. (2008). Co-activity during maximum
voluntary contraction: a study of four lower-extremity muscles in children
with and without cerebral palsy. Developmental Medicine and Child
Neurology, 50, 377-381.
Temprado, J., Zanone, P. G., Monno, A., & Laurent, M. (2001). A dynamical
framework to understand performance trade-offs and interference in dual
tasks. Journal of Experimental Psychology: Human Perception and
Performance, 27(6), 1303-1313.
Terband, H., Maassen, B., Van Lieshout, P. H. H. M., & Nijland, L. (2010). Stability
and composition of functional synergies for speech movements in children
with developmental speech disorders. Journal of Communication Disorders,
44(1), 59-74.
The Hanen Centre ®. (2011). Hanen Programs Retrieved 29.12.2011, from
http://www.hanen.org/About-Hanen.aspx
Thelen, E., & Smith, A. (2003). Development as a dynamic system. Trends in
Cognitive Sciences, 7(8), 343-348.
Thelen, E., & Smith, L. B. (Eds.). (2006). Dynamic Systems Theories: John Wiley
and Sons.
Theodorus, D., Murdoch, B., & Horton, S. (1999). Assessment of dysarthric speech:
A case for combined perceptual and physiological approach. Language
Testing, 16(3), 315-351.
Thomas, B., Eyssen, M., Peeters, R., Molenaers, G., Van Hecke, P., De Cock, P., &
Sunaert, S. (2005). Quantitative diffusion tensor imaging in cerebral palsy
due to periventricular white matter injury. Brain, 128, 2562-2577.
Thompson-Ward, E. C., & Murdoch, B. E. (1998). Instrumental assessment of the
speech mechanism. In B. E. Murdoch (Ed.), Dysarthria: a physiological
approach to assessment and treatment. Cheltenham: Stanley Thornes.
Threats, T., & Worrall, L. (2004). Classifying communication disability using the
ICF. Advances in Speech Language Pathology, 6, 53-62.
Timoszyk, W. K., deLeon, R. D., London, N., Roy, R. R., Edgerton, V. R., &
Reinkensmeyer, D. J. (2002). The rat lumbosacral spinal cord adapts to
robotic loading applied during stance. Journal of Neurophysiology, 88(6),
3108-3117.
THE EFFECTIVENESS OF PROMPT
355
Tjaden, K., Rivera, D., Wilding, G., & Turner, G. S. (2005). Characteristics of the
lax vowel space in dysarthria. Journal of Speech, Language and Hearing
Research, 48, 554-466.
Trahan, J., & Malouin, F. (2002). Intermittent intensive physiotherapy in children
with cerebral palsy: a pilot study. Developmental Medicine and Child
Neurology, 44(4), 233-239.
Trivedi, R., Gupta, R. K., Shah, V., Tripathi, M. R., Rathore, R. K. S., Kumar, M., . .
. Narayana, P. A. (2008). Treatment-induced plasticity in cerebral palsy: a
diffusion tensor imaging study. Pediatric Neurology, 39(5), 341-349.
Trulsson, M., & Essick, G. K. (2010). Sensations evoked by microstimulation of
single mechanoreceptive afferents innervating the human face and mouth.
Journal of Neurophysiology, 103, 1741-1747.
Trulsson, M., & Johansson, R. (2002). Orofacial mechanoreceptors in humans:
encoding characteristics and responses during natural orofacial behaviors.
Behavioural Brain Research, 135, 227-233.
Tsatanis, K., Dartnall, N., Cicchetti, D., Sparrow, S., Klin, A., & Vokmar, F. (2003).
Concurrent validity and classification accuracy of the Leiter and Leiter-R in
low functioning children with autism. Journal of Autism and Developmental
Disorders, 33, 23-30.
Tsutsui, S., Lee, D. L., & Hodges, N. J. (1998). Contextual interference in learning
new patterns of bimanual coordination. Journal of Motor Behavior, 30(2),
151-157.
Türker, K. S. (2002). Reflex Control of Human Jaw Muscles. Critical Reviews in
Oral Biology & Medicine, 13(1), 85-104.
Türker, K. S., Johnsen, S. E., Sowman, P. F., & Trulsson, M. (2006). A study on
synaptic coupling between single orofacial mechanoreceptors and human
masseter muscle. Experimental Brain Research, 170(4), 488-500.
Ungerleider, L. G., Doyon, J., & Karni, A. (2002). Imaging brain plasticity during
motor skill learning. Neurobiology of Learning and Memory, 78(553-564).
Van Agt, H., Verhoeven, L., Van Den Brink, G., & De Koning, H. (2010). The
impact on socio-emotional development and qulaity of life of language
impairment in 8-year-old children. Developmental Medicine and Child
Neurology, 53, 81-88.
THE EFFECTIVENESS OF PROMPT
356
van der Merwe, A. (2009). A theoretical framework for the characterisation of
pathological speech sensorimotor control. In M. R. McNeil (Ed.), Clinical
management of sensorimotor speech disorders. New York: Thieme.
Van Lieshout, P. H. H. M. (2004). Dynamical systems theory and its application in
speech. In B. Maassen, R. D. Kent, H. F. M. Peters, P. H. H. M. Van
Lieshout & W. Hulstijn (Eds.), Speech motor control in normal and
disordered speech. Oxford: Oxford University Press.
van Roon, D., Steenbergen, B., & Meulenbroek, R. G. J. (2005). Trunk use and co-
contraction in cerebral palsy as regulatory mechanisms for accuracy control.
Neuropsychologica, 43, 497-508.
Vargus-Adams, J. N., & Martin, L. K. (2009). Measuring what matters in cerebral
palsy: a breadth of important domains and outcome measures. Archives of
Physical Medicine and Rehabilitation, 90, 2089-2095.
Vereijken, B. (2010). The complexity of childhood development: variability in
perspective. PHysical Therapy, 90(12), 1850-1859.
Vereijken, B., van Emmerik, R. E., Whiting, H. T. A., & Newell, K. M. (1992).
Free(z)ing Degrees of Freedom in Skill Acquisition. Journal of Motor
Behavior, 24(1), 133-142.
Voorman, J. M., Dallmeijer, A. J., Van Eck, M., & Schuengel, C. (2010). Social
functioning and communication in children with cerebral palsy: association
with disease characteristics and personal and environmental factors.
Developmental Medicine and Child Neurology, 52, 441-447.
Walsh, B., Smith, A., & Weber-Fox. (2006). Short-term plasticity in children's
speech motor systems. Developmental Psychobiology, 48(8), 660-674.
Wambaugh, J. L., Duffy, R., McNeil, M., Robin, D., & Rogers, S. (2006). Treatment
guidelines for acquired apraxia of speech: Treatment descriptions and
recommendations. Journal of Medical Speech Language Pathology, 14(2),
xxxxv-lxvii.
Wambaugh, J. L., & Ferguson, M. (2007). Application of semantic feature analysis
to retrieval of action names in aphasia. Journal of Rehabilitation Research
and Development, 44(5), 381-394.
Wambaugh, J. L., & Mauszycki, S. (2010). Sound treatment: Application with severe
apraxia of speech. Aphasiology, 24, 814-825.
THE EFFECTIVENESS OF PROMPT
357
Warren, W. H. (2006). The dynamics of perception and action. Psychological
Review, 113(2), 358-389.
Watson, L., Blair, E., & Stanley, F. (2006). Report of the Western Australian
Cerebral Palsy Register to birth year 1999. Perth: Telethon Institute for Child
Health Research.
Weismer, G. (2006). Philosophy of research in motor speech disorders. Clinical
Linguistics and Phonetics, 20(5), 315-349.
Wenke, R., Cornwell, P., & Theodoros, D. (2010). Changes to articulation following
LSVT® and traditional dysarthria therapy in non-progressive dysarthria.
International Journal of Speech-Language Pathology, 12(3), 203-220.
Whinnery, K. W., & Whinnery, S. B. (2007). MOVE systematic programming for
early motor intervention. Infants and Young Children, 20(2), 102-198.
Whitehall, T. L. (2009). Spastic cerebral palsy. In M. R. McNeil (Ed.), Clinical
Management of sensorimotor speech disorders (2nd edition). New York:
Thieme.
WHO. (2002). Towards a common language for functioning, disability and health:
ICF. World Health Organization (Ed.), Retrieved from
http://www.who.int/classifications/icf/site/beginners/bg.pdf
WHO. (2007). International classification of functioning, disability and health:
children and youth version (ICF-CY). Geneva: WHO Press.
Wichers, M., Hilbrink, S., Roebroeck, M. E., van Nieuwhuizen, O., & Stam, H. J.
(2009). Motor impairments and activity limitations in children with spastic
cerebral palsy: a dutch population-based study. Journal of Rehabilitation
Medicine, 41(367-374).
Wiig, E., Secord, W., & Semel, E. (1992). Clinical evaluation of language
fundamentals - Preschool (CELF-P). San Antonio, Texas: The Psychological
Corporation.
Wilcox, K., & Morris, S. (1999). Children's Speech Intelligibility Measure. San
Antonio: The Psychological Corporation.
Williams, A. L. (2000). Multiple oppositions: Case studies of variables in
phonological intervention. American Journal of Speech Language Pathology,
9(9), 289-299.
THE EFFECTIVENESS OF PROMPT
358
Wilston, E. C., Reed, C. M., & Braida, L. D. (2010). Integration of auditory and
vibrotactile stimuli: effects of frequency. Journal of the Acoustical Society of
America, 127(5), 3044-3059.
Wittenberg, G. F. (2009). Neural plasticity and treatment across the lifespan for
motor deficits in cerebral palsy. Developmental Medicine and Child
Neurology, 51(S4), 130-133.
Wong, J., Wilson, E. T., & Gribble, P. L. (2011). Spatially selective enhancement of
proprioceptive acuity following motor learning. Journal of Neurophysiology,
105, 2512-2521.
Woolf, S. H. (2008). The meaning of translational research and why it matters.
American Medical Association, 299(2), 211-213.
Workinger, M. (2005). Cerebral palsy resource guide for speech-language
pathologists. New York: Thomson Delmar Learning.
Workinger, M., & Kent, R. (1991). Perceptual analysis of the dysarthrias in children
with athetoid and spastic cerebral palsy. In C. A. Moore, K. M. Yorkston &
D. R. Beukelman (Eds.), Dysarthria and apraxia of speech. Perspectives on
management. Baltimore: Paul H Brookes Publishing Co.
Wright, F. V., Rosenbaum, P., Goldsmith, C. H., Law, M., & Fehlings, D. L. (2008).
How do changes in body functions and structures, activity, and participation
relate in children with cerebral palsy? Developmental Medicine and Child
Neurology, 50(4), 283-289.
Wu, P.-Y., & Jeng, J.-Y. (2004). Efficacy comparison between two articulatory
intervention approaches for dysarthric cerebral palsy (CP) children. Asia
Pacific Journal of Speech, Language and Hearing, 9, 28-32.
Wu, W. F. W., Young, D. E., Schandler, S. L., Meir, G., Judy, R. L. M., Perez, J., &
Cohen, M. J. (2011). Contextual interference and augmented feedback: Is
there an additive effect on motor learning? Human Movement Science, 30(6),
1092-1101.
Wulf, G., & Shea, C. H. (2002). Principles derived from the study of simple skills do
not generalize to complex skill learning. Psychonomic Bulletin and Review,
9(2), 185-211.
Yorkston, K., & Beukelman, D. (1978). A comparison of techniques for measuring
intelligibility of dysarthric speech. Journal of Communication Disorders, 11,
499-512.
THE EFFECTIVENESS OF PROMPT
359
Yorkston, K., Beukelman, D., & Bell, K. (1988). Clinical management of dysarthric
speakers. Austin: PRO-ED.
Yoshida, S., Hayakawa, K., Yamamoto, A., Okano, S., Kanda, T., Yamori, Y., . . .
Hirota, H. (2010). Quantitative diffusion tensor tractography of the motor and
sensory tract in children with cerebral palsy. Developmental Medicine and
Child Neurology, 52(10), 935-940.
Yunusova, Y., Green, J. R., Lindstrom, M. J., Ball, L. J., Pattee, G. L., & Zinman, L.
(2010). Kinematics of disease progression in bulbar ALS. Journal of
Communication Disorders, 43(1), 6-20.
Yunusova, Y., Weismer, G., Westbury, J. R., & Lindstrom, M. J. (2008).
Articulatory movements during vowels in speakers with dysarthria and
healthy controls. Journal of Speech, Language & Hearing Research, 51, 596-
611.
Zanone, P. G., & Kelso, J. A. S. (1997). Coordination dynamics of learning and
transfer: collective and component levels. Journal of Experimental
Psychology: Human Perception and Performance, 23(5), 1454-1480.
Zhan, S., & Ottenbacher, K. J. (2001). Single subject research designs for disability
research. Disability and Rehabilitation, 23(1), 1-8.
Zhou, X., Epsy-Wilson, C. Y., Boyce, S., Tiede, M., Holland, C., & Choe, A. (2008).
A magnetic resonace imaging-based articulatory and acoustic study of
"retroflex" and "bunched" american english /r/. Journal of the Acoustical
Society of America, 123(6), 4466-4481.
Zipoli, R. P., & Kennnedy, M. (2005). Evidence-based practice among speech-
language pathologists: attitudes, utilization, and barriers. American Journal
of Speech Language Pathology, 14(3), 208-220.
Zwicker, J. G., & Harris, S. R. (2009). A reflection on motor learning theory in
pediatric occupational therapy practice. Canadian Journal of Occupational
Therapy, 76(1), 29-37.
Every reasonable effort has been made to acknowledge the owners of copyright
material. I would be pleased to hear from any copyright owner who has been
omitted or incorrectly acknowledged.
THE EFFECTIVENESS OF PROMPT
360
APPENDICES
Appendix A Therapy History Questionnaire ............................................... 361
Appendix B Systems Analysis Observation ................................................ 366
Appendix C Canadian Occupational Performance Measure ....................... 368
Appendix D Speech Probe Wordlists .......................................................... 371
Appendix E Calculations used to Derive the Kinematic Measures .............. 378
Appendix F Position and Anatomical Location of the Facial Markers ......... 379
Appendix G Performance on the Motor Speech Movement Patterns and
Perceptual Accuracy across the Intervention Priorities and Study Phases
for the Participants .......................................................................... 380
Appendix H Results obtained on the Friedman’s ANOVA and Wilcoxon
Signed- Rank Test for the Individual Items of the Canadian
Occupational Performance Measure ................................................. 387
Appendix I Descriptive Statistics for the Kinematic Measures of Distance,
Jaw/Lip Opening Velocity and Word Duration for P1 ...................... 392
Appendix J Descriptive Statistics for the Kinematic Measures of Distance,
Jaw/Lip Opening Velocity and Word Duration for P2 ...................... 399
Appendix K Descriptive Statistics for the Kinematic Measures of Distance,
Jaw/Lip Opening Velocity and Word Duration for P3 ...................... 406
Appendix L Descriptive Statistics for the Kinematic Measures of Distance,
Jaw/Lip Opening Velocity and Word Duration for P4 ...................... 413
Appendix M Descriptive Statistics for the Kinematic Measures of Distance,
Jaw/Lip Opening Velocity and Word Duration for P5 ...................... 420
Appendix N Descriptive Statistics for the Kinematic Measures of Distance,
Jaw/Lip Opening Velocity and Word Duration for P6 ...................... 427
Appendix O Copyright Release PROMPT Institute ..................................... 434
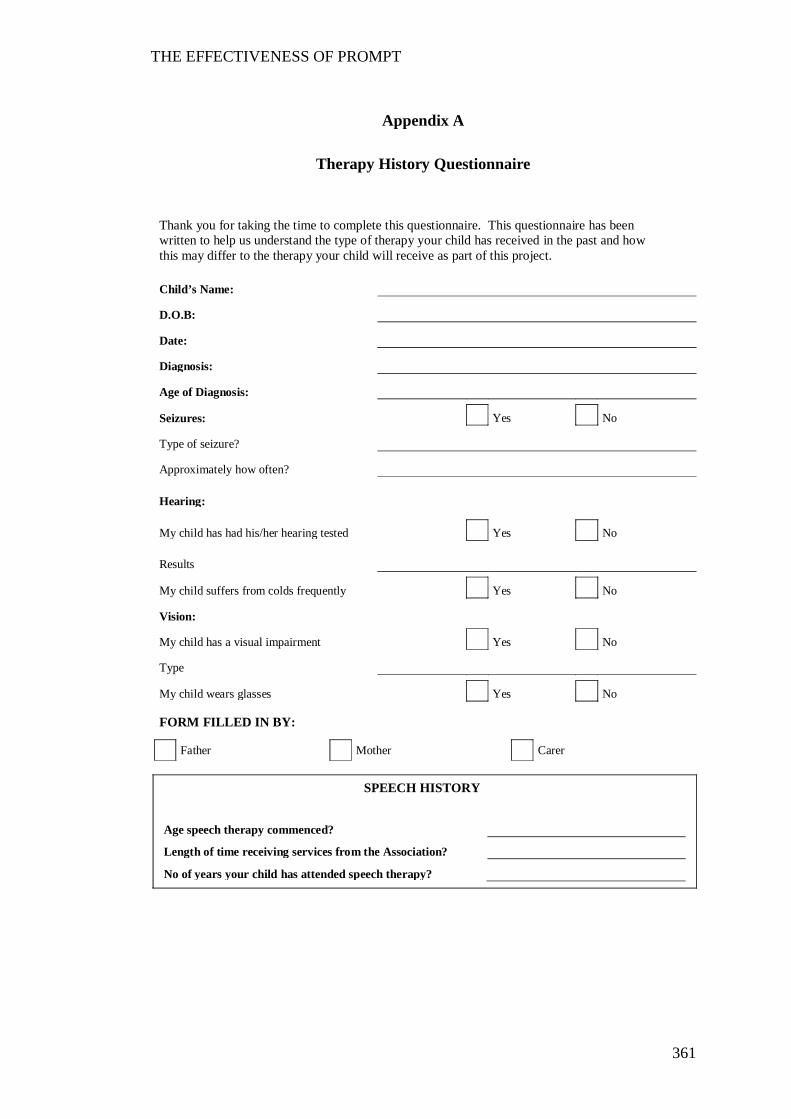
THE EFFECTIVENESS OF PROMPT
361
Appendix A
Therapy History Questionnaire
Thank you for taking the time to complete this questionnaire. This questionnaire has been written to help us understand the type of therapy your child has received in the past and how this may differ to the therapy your child will receive as part of this project.
Child’s Name:
D.O.B:
Date:
Diagnosis:
Age of Diagnosis:
Seizures: Yes No
Type of seizure?
Approximately how often?
Hearing:
My child has had his/her hearing tested Yes No
Results
My child suffers from colds frequently Yes No
Vision:
My child has a visual impairment Yes No
Type
My child wears glasses Yes No
FORM FILLED IN BY:
Father Mother Carer
SPEECH HISTORY
Age speech therapy commenced?
Length of time receiving services from the Association?
No of years your child has attended speech therapy?
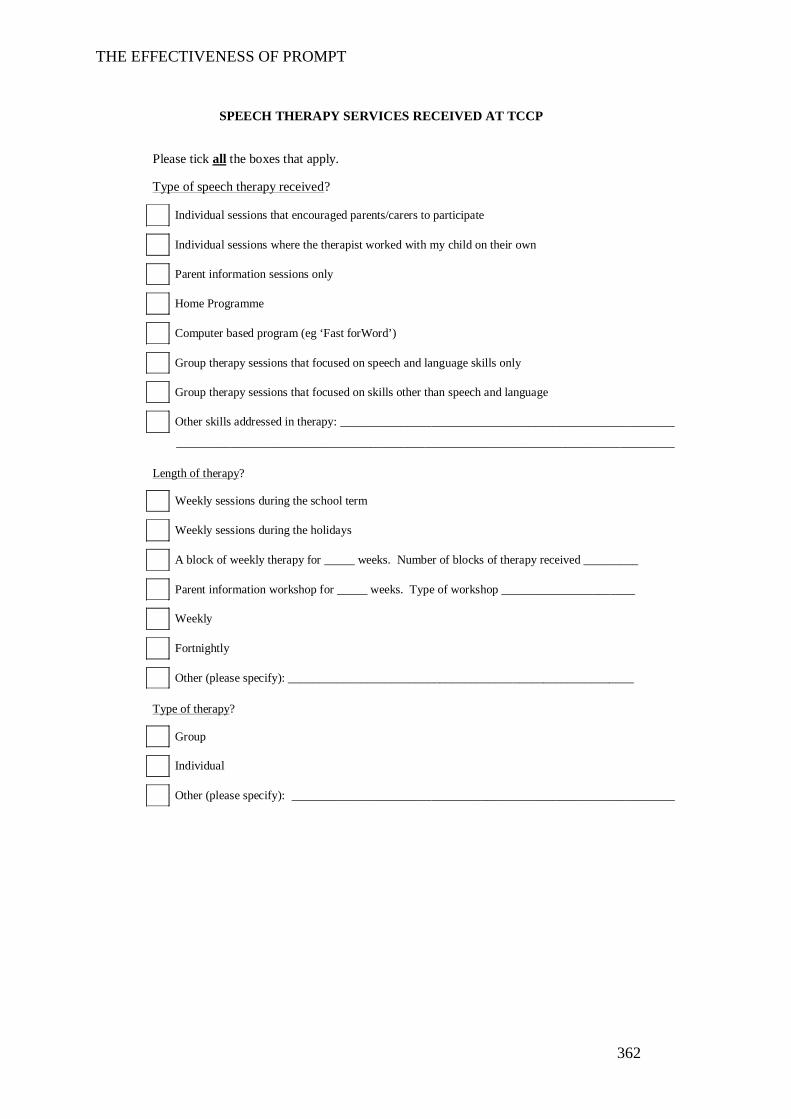
THE EFFECTIVENESS OF PROMPT
362
SPEECH THERAPY SERVICES RECEIVED AT TCCP
Please tick all the boxes that apply.
Type of speech therapy received?
Individual sessions that encouraged parents/carers to participate
Individual sessions where the therapist worked with my child on their own
Parent information sessions only
Home Programme
Computer based program (eg ‘Fast forWord’)
Group therapy sessions that focused on speech and language skills only
Group therapy sessions that focused on skills other than speech and language
Other skills addressed in therapy: _______________________________________________________
__________________________________________________________________________________
Length of therapy?
Weekly sessions during the school term
Weekly sessions during the holidays
A block of weekly therapy for _____ weeks. Number of blocks of therapy received _________
Parent information workshop for _____ weeks. Type of workshop ______________________
Weekly
Fortnightly
Other (please specify): _________________________________________________________
Type of therapy?
Group
Individual
Other (please specify): _______________________________________________________________
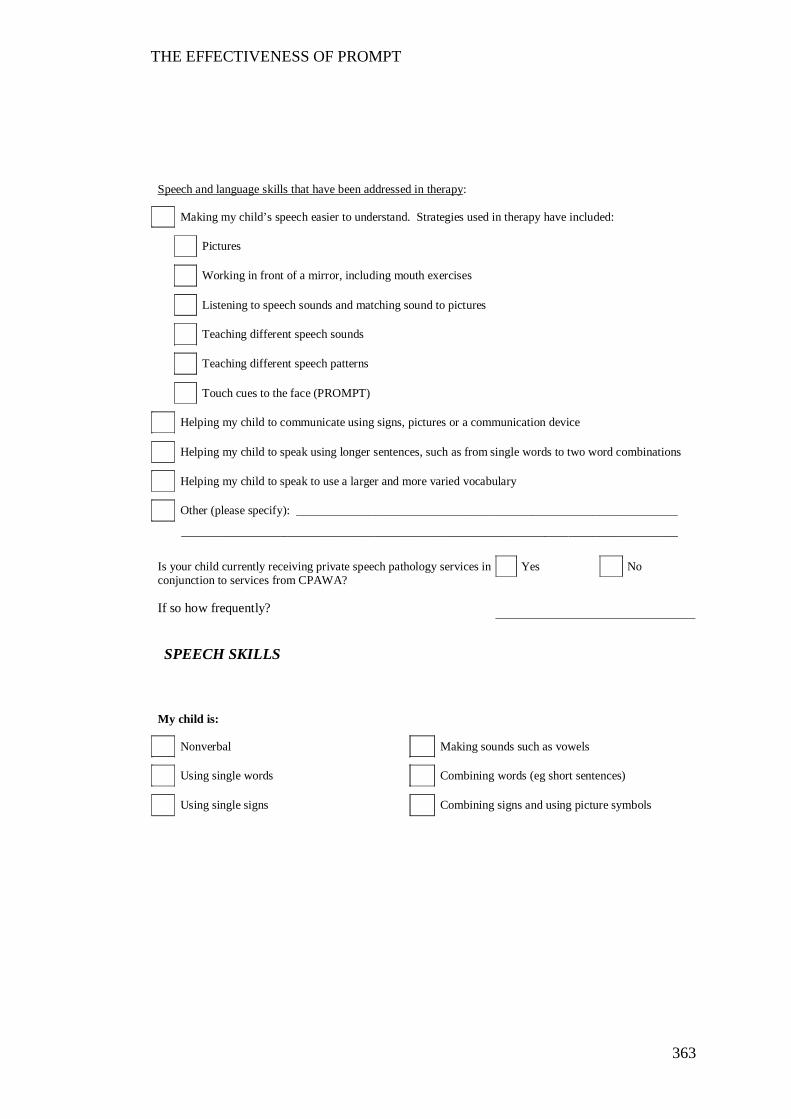
THE EFFECTIVENESS OF PROMPT
363
Speech and language skills that have been addressed in therapy:
Making my child’s speech easier to understand. Strategies used in therapy have included:
Pictures
Working in front of a mirror, including mouth exercises
Listening to speech sounds and matching sound to pictures
Teaching different speech sounds
Teaching different speech patterns
Touch cues to the face (PROMPT)
Helping my child to communicate using signs, pictures or a communication device
Helping my child to speak using longer sentences, such as from single words to two word combinations
Helping my child to speak to use a larger and more varied vocabulary
Other (please specify): _______________________________________________________________
__________________________________________________________________________________ Is your child currently receiving private speech pathology services in conjunction to services from CPAWA?
Yes No
If so how frequently?
SPEECH SKILLS
My child is:
Nonverbal Making sounds such as vowels
Using single words Combining words (eg short sentences)
Using single signs Combining signs and using picture symbols

THE EFFECTIVENESS OF PROMPT
364
My child’s speech is:
Unintelligible to unfamiliar listeners
Intelligible to familiar listeners
Intelligible when I know what my child is talking about
Intelligible when supported with gestures and other visual clues
Totally unintelligible
If your child did not receive speech therapy services prior to
attending TCCP thank you for completing this form. There is no
need to proceed any further.
SPEECH THERAPY SERVICES PRIOR TO ATTENDING TCCP
Did your child receive therapy services from elsewhere? Yes No
If yes, please tick all the boxes that apply:
Type of speech therapy received?
Individual sessions that encouraged parents/carers to participate
Individual sessions where the therapist worked with my child on their own
Parent information sessions only
Home Programme
Computer based program (eg ‘Fast forWord’)
Group therapy sessions that focused on speech and language skills only
Group therapy sessions that focused on skills other than speech and language
Other skills addressed in therapy: _______________________________________________________
__________________________________________________________________________________
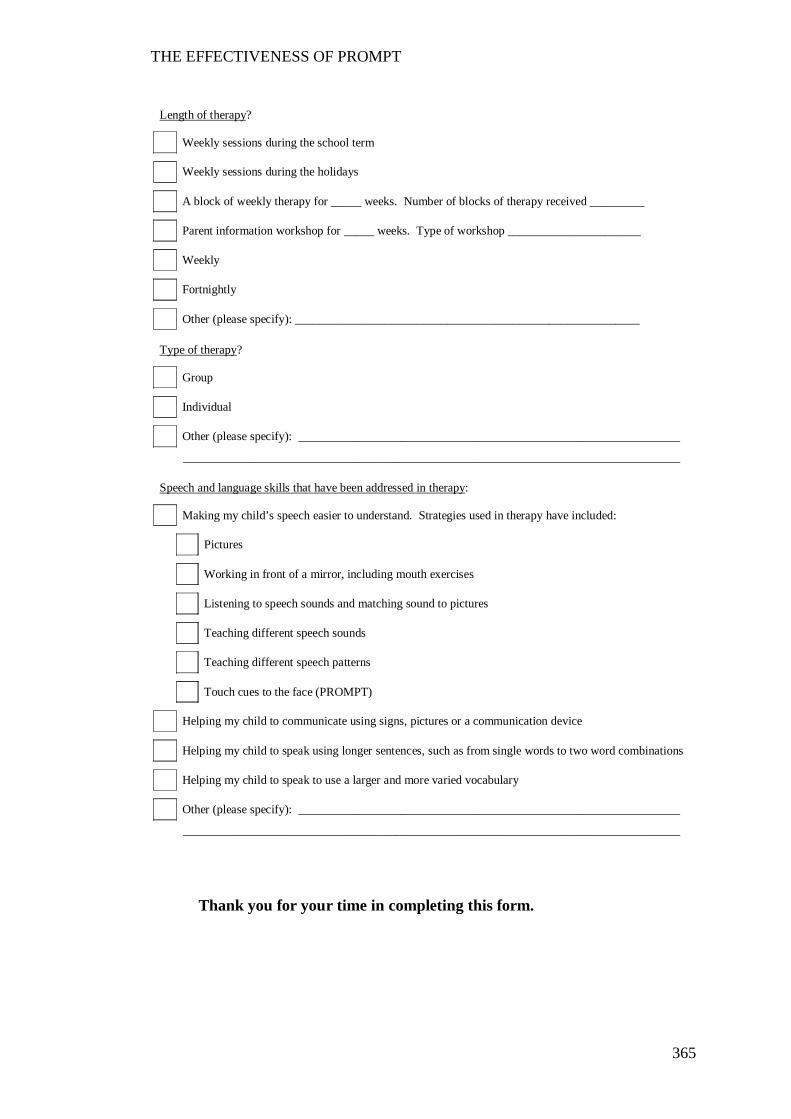
THE EFFECTIVENESS OF PROMPT
365
Thank you for your time in completing this form.
Length of therapy?
Weekly sessions during the school term
Weekly sessions during the holidays
A block of weekly therapy for _____ weeks. Number of blocks of therapy received _________
Parent information workshop for _____ weeks. Type of workshop ______________________
Weekly
Fortnightly
Other (please specify): _________________________________________________________
Type of therapy?
Group
Individual
Other (please specify): _______________________________________________________________
__________________________________________________________________________________
Speech and language skills that have been addressed in therapy:
Making my child’s speech easier to understand. Strategies used in therapy have included:
Pictures
Working in front of a mirror, including mouth exercises
Listening to speech sounds and matching sound to pictures
Teaching different speech sounds
Teaching different speech patterns
Touch cues to the face (PROMPT)
Helping my child to communicate using signs, pictures or a communication device
Helping my child to speak using longer sentences, such as from single words to two word combinations
Helping my child to speak to use a larger and more varied vocabulary
Other (please specify): _______________________________________________________________
__________________________________________________________________________________
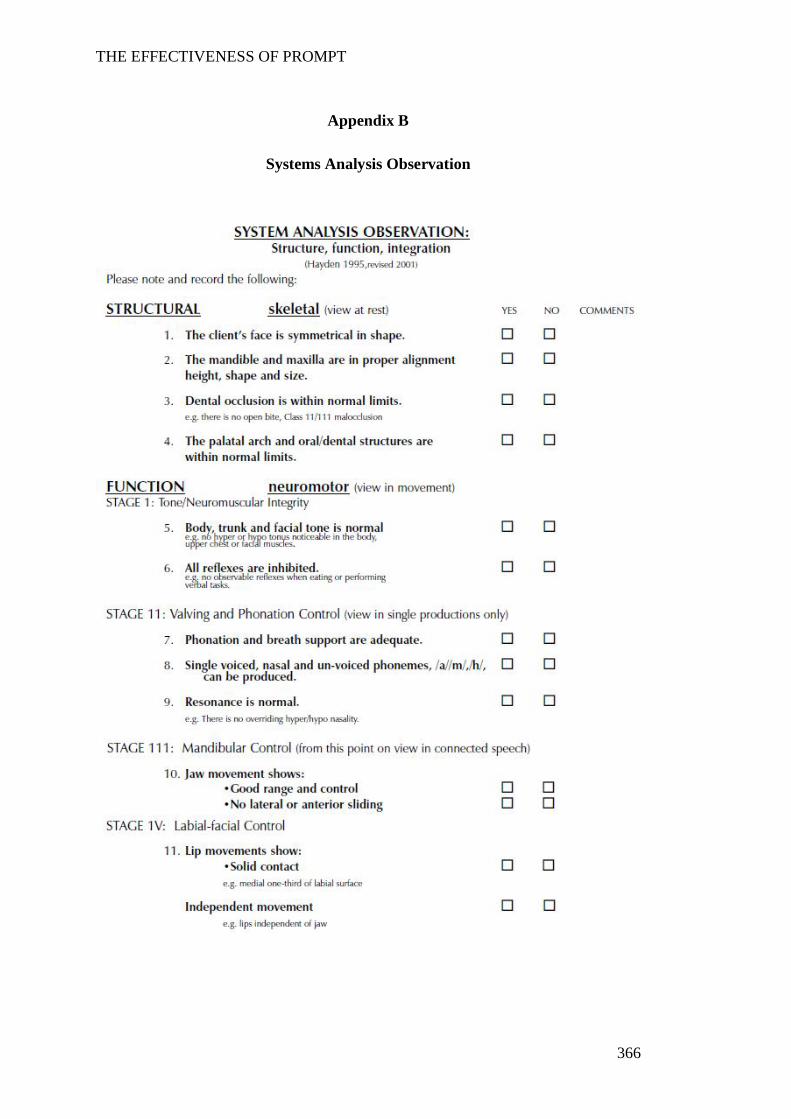
THE EFFECTIVENESS OF PROMPT
366
Appendix B
Systems Analysis Observation
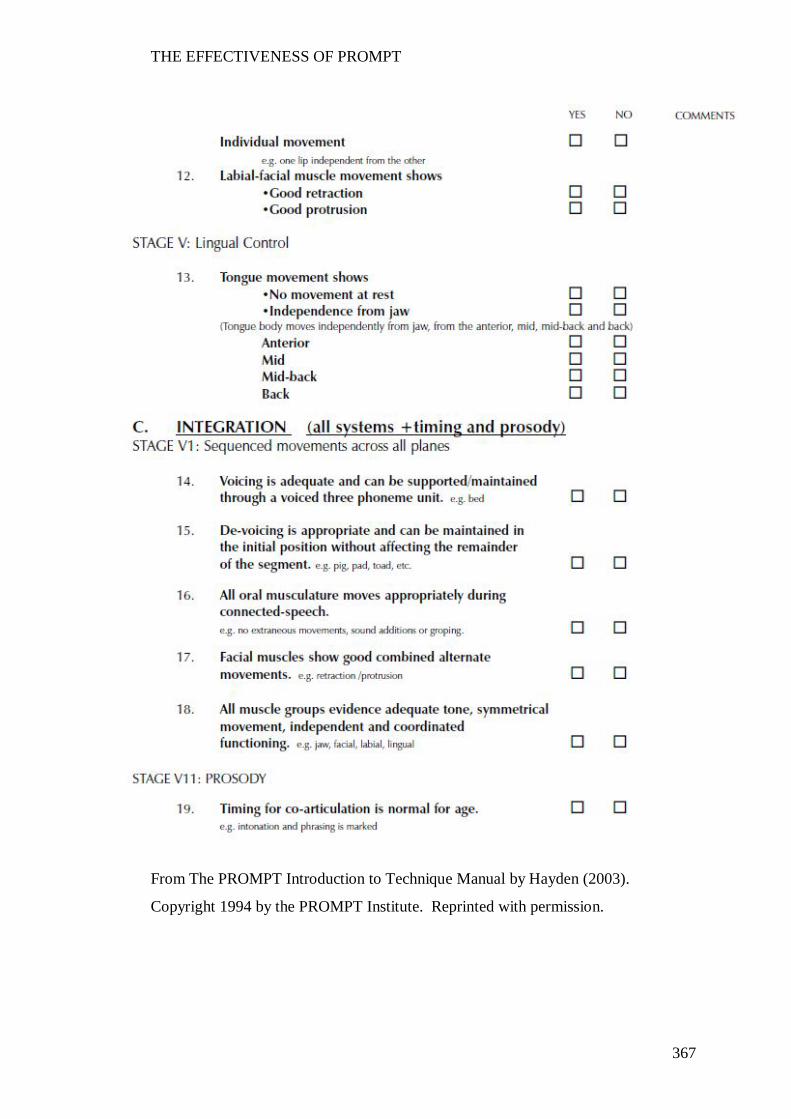
THE EFFECTIVENESS OF PROMPT
367
From The PROMPT Introduction to Technique Manual by Hayden (2003).
Copyright 1994 by the PROMPT Institute. Reprinted with permission.

THE EFFECTIVENESS OF PROMPT
368
Appendix C
Canadian Occupational Performance Measure
PARENT SATISFACTION SURVEY
Name:
Date:
Circle the relevant evaluation period:
1. Pre-treatment 3. End of second treatment cycle 2. End of first treatment cycle 4. Follow-up appointment
1. Ability to be understood by immediate family members, using words:
Importance Performance Satisfaction
2. Ability to be understood by extended family members, using words:
Importance Performance Satisfaction
3. Ability to be understood by friends/ peers:
Importance Performance Satisfaction
4. Normality of facial movements during speech:
Importance Performance Satisfaction
5. Able to follow routine instructions at home:
Importance Performance Satisfaction
6. Able to follow routine instructions at school:
Importance Performance Satisfaction
7. Play opportunities outside of the family home with friends:
Importance Performance Satisfaction
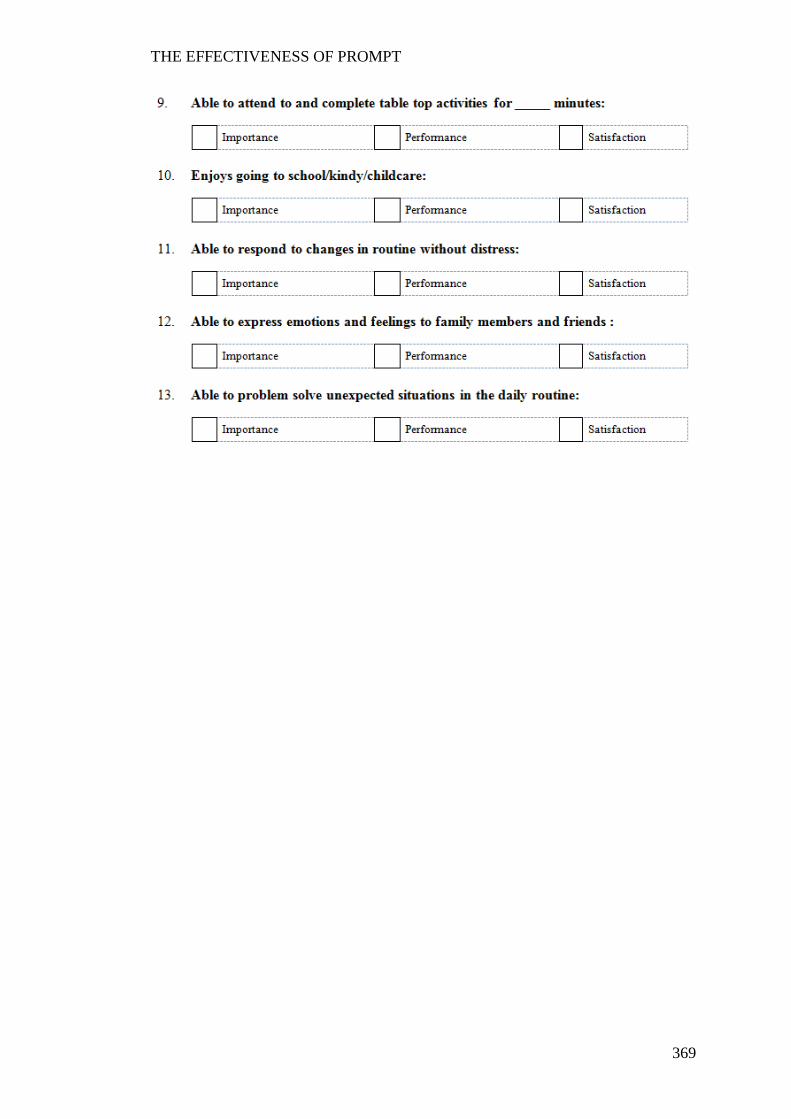
THE EFFECTIVENESS OF PROMPT
369
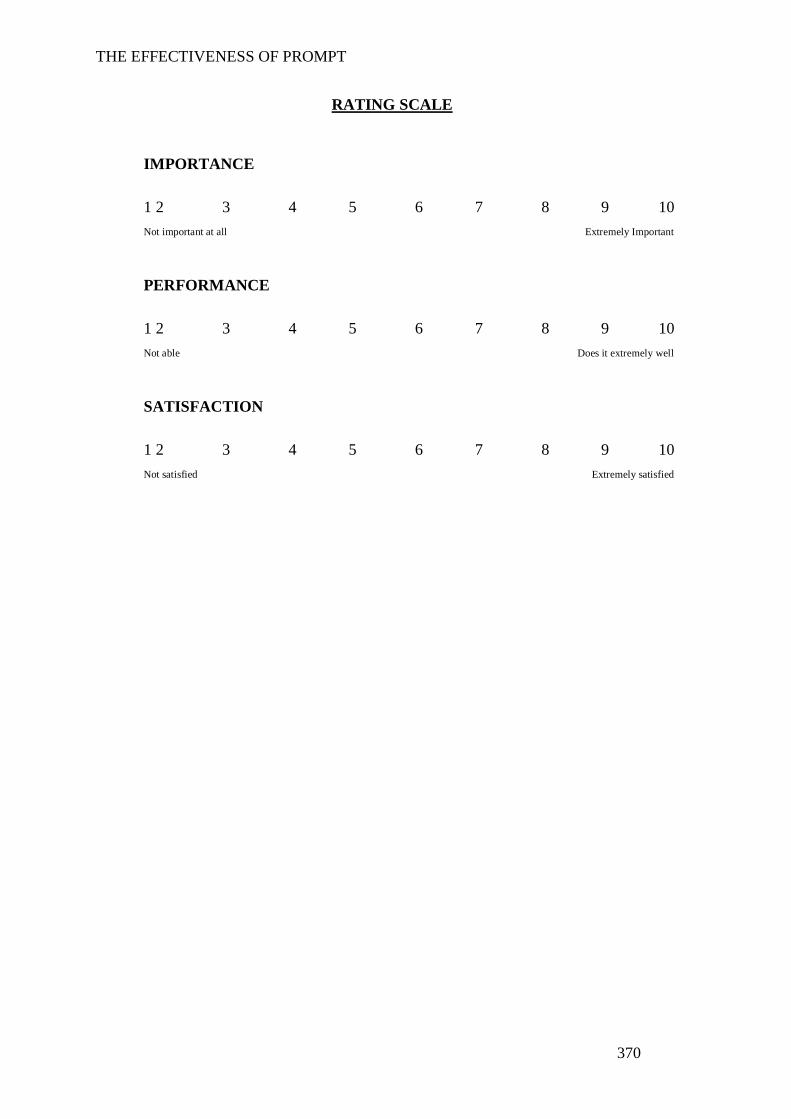
THE EFFECTIVENESS OF PROMPT
370
RATING SCALE
IMPORTANCE
1 2 3 4 5 6 7 8 9 10 Not important at all Extremely Important
PERFORMANCE
1 2 3 4 5 6 7 8 9 10 Not able Does it extremely well
SATISFACTION
1 2 3 4 5 6 7 8 9 10 Not satisfied Extremely satisfied

THE EFFECTIVENESS OF PROMPT
371
Appendix D
Speech Probe Wordlists
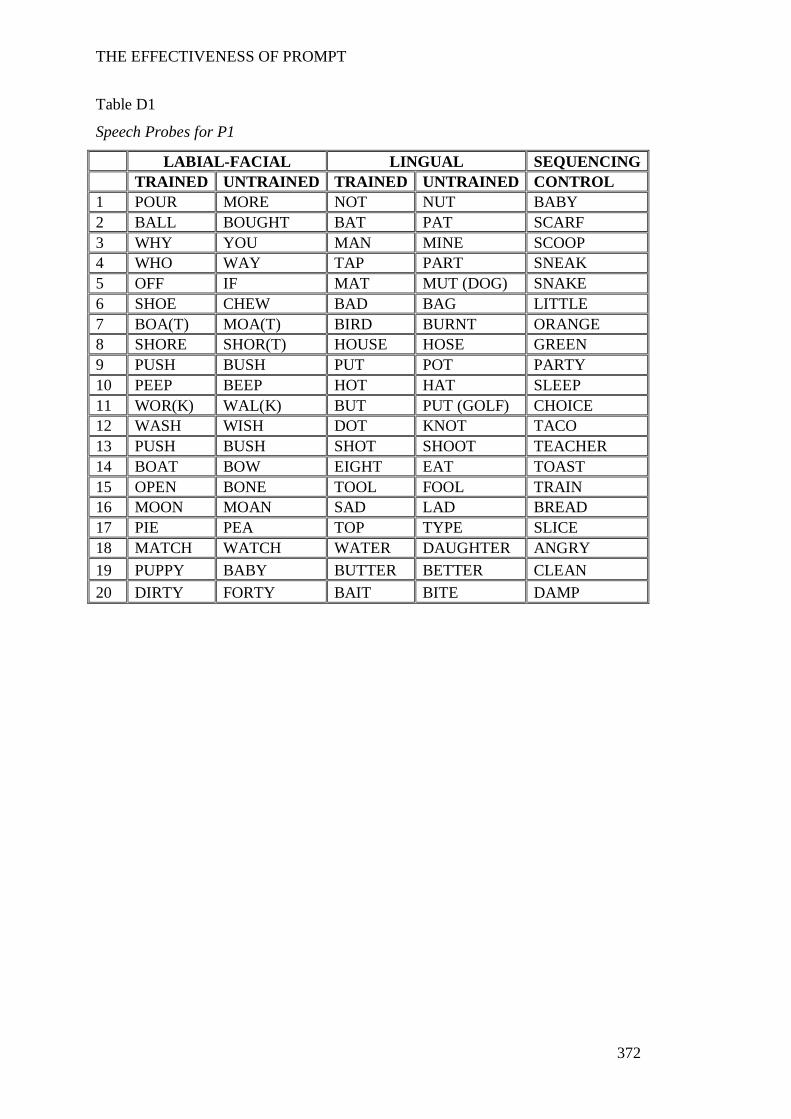
THE EFFECTIVENESS OF PROMPT
372
Table D1
Speech Probes for P1
LABIAL-FACIAL LINGUAL SEQUENCING TRAINED UNTRAINED TRAINED UNTRAINED CONTROL 1 POUR MORE NOT NUT BABY 2 BALL BOUGHT BAT PAT SCARF 3 WHY YOU MAN MINE SCOOP 4 WHO WAY TAP PART SNEAK 5 OFF IF MAT MUT (DOG) SNAKE 6 SHOE CHEW BAD BAG LITTLE 7 BOA(T) MOA(T) BIRD BURNT ORANGE 8 SHORE SHOR(T) HOUSE HOSE GREEN 9 PUSH BUSH PUT POT PARTY 10 PEEP BEEP HOT HAT SLEEP 11 WOR(K) WAL(K) BUT PUT (GOLF) CHOICE 12 WASH WISH DOT KNOT TACO 13 PUSH BUSH SHOT SHOOT TEACHER 14 BOAT BOW EIGHT EAT TOAST 15 OPEN BONE TOOL FOOL TRAIN 16 MOON MOAN SAD LAD BREAD 17 PIE PEA TOP TYPE SLICE 18 MATCH WATCH WATER DAUGHTER ANGRY 19 PUPPY BABY BUTTER BETTER CLEAN 20 DIRTY FORTY BAIT BITE DAMP
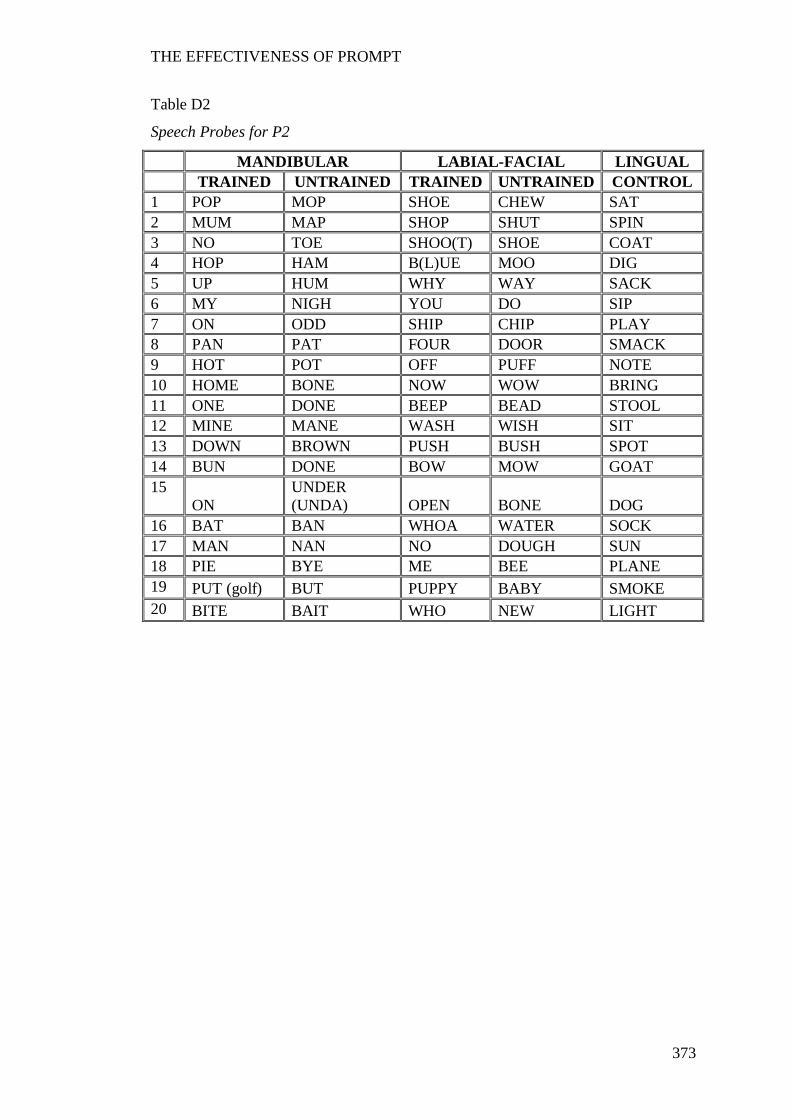
THE EFFECTIVENESS OF PROMPT
373
Table D2
Speech Probes for P2
MANDIBULAR LABIAL-FACIAL LINGUAL TRAINED UNTRAINED TRAINED UNTRAINED CONTROL
1 POP MOP SHOE CHEW SAT 2 MUM MAP SHOP SHUT SPIN 3 NO TOE SHOO(T) SHOE COAT 4 HOP HAM B(L)UE MOO DIG 5 UP HUM WHY WAY SACK 6 MY NIGH YOU DO SIP 7 ON ODD SHIP CHIP PLAY 8 PAN PAT FOUR DOOR SMACK 9 HOT POT OFF PUFF NOTE 10 HOME BONE NOW WOW BRING 11 ONE DONE BEEP BEAD STOOL 12 MINE MANE WASH WISH SIT 13 DOWN BROWN PUSH BUSH SPOT 14 BUN DONE BOW MOW GOAT 15
ON UNDER (UNDA) OPEN BONE DOG
16 BAT BAN WHOA WATER SOCK 17 MAN NAN NO DOUGH SUN 18 PIE BYE ME BEE PLANE 19 PUT (golf) BUT PUPPY BABY SMOKE 20 BITE BAIT WHO NEW LIGHT
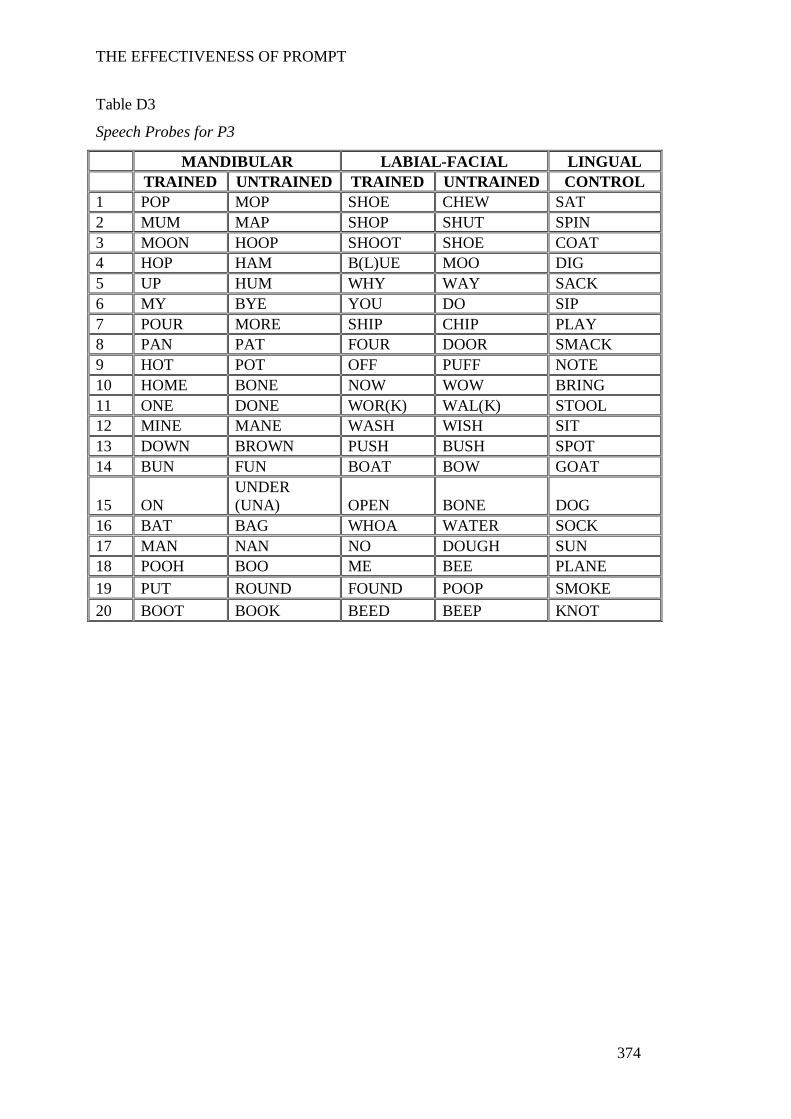
THE EFFECTIVENESS OF PROMPT
374
Table D3
Speech Probes for P3
MANDIBULAR LABIAL-FACIAL LINGUAL TRAINED UNTRAINED TRAINED UNTRAINED CONTROL
1 POP MOP SHOE CHEW SAT 2 MUM MAP SHOP SHUT SPIN 3 MOON HOOP SHOOT SHOE COAT 4 HOP HAM B(L)UE MOO DIG 5 UP HUM WHY WAY SACK 6 MY BYE YOU DO SIP 7 POUR MORE SHIP CHIP PLAY 8 PAN PAT FOUR DOOR SMACK 9 HOT POT OFF PUFF NOTE 10 HOME BONE NOW WOW BRING 11 ONE DONE WOR(K) WAL(K) STOOL 12 MINE MANE WASH WISH SIT 13 DOWN BROWN PUSH BUSH SPOT 14 BUN FUN BOAT BOW GOAT
15 ON UNDER (UNA) OPEN BONE DOG
16 BAT BAG WHOA WATER SOCK 17 MAN NAN NO DOUGH SUN 18 POOH BOO ME BEE PLANE 19 PUT ROUND FOUND POOP SMOKE 20 BOOT BOOK BEED BEEP KNOT
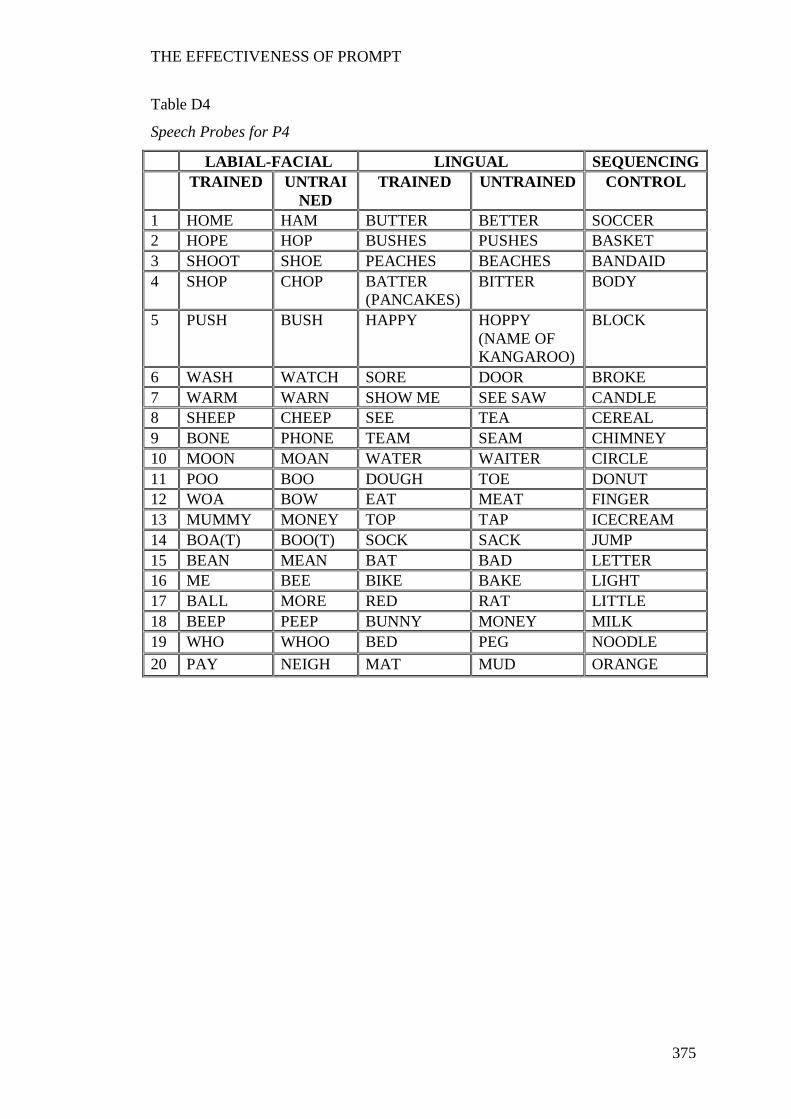
THE EFFECTIVENESS OF PROMPT
375
Table D4
Speech Probes for P4
LABIAL-FACIAL LINGUAL SEQUENCING TRAINED UNTRAI
NED TRAINED UNTRAINED CONTROL
1 HOME HAM BUTTER BETTER SOCCER 2 HOPE HOP BUSHES PUSHES BASKET 3 SHOOT SHOE PEACHES BEACHES BANDAID 4 SHOP CHOP BATTER
(PANCAKES) BITTER BODY
5 PUSH BUSH HAPPY HOPPY (NAME OF KANGAROO)
BLOCK
6 WASH WATCH SORE DOOR BROKE 7 WARM WARN SHOW ME SEE SAW CANDLE 8 SHEEP CHEEP SEE TEA CEREAL 9 BONE PHONE TEAM SEAM CHIMNEY 10 MOON MOAN WATER WAITER CIRCLE 11 POO BOO DOUGH TOE DONUT 12 WOA BOW EAT MEAT FINGER 13 MUMMY MONEY TOP TAP ICECREAM 14 BOA(T) BOO(T) SOCK SACK JUMP 15 BEAN MEAN BAT BAD LETTER 16 ME BEE BIKE BAKE LIGHT 17 BALL MORE RED RAT LITTLE 18 BEEP PEEP BUNNY MONEY MILK 19 WHO WHOO BED PEG NOODLE 20 PAY NEIGH MAT MUD ORANGE
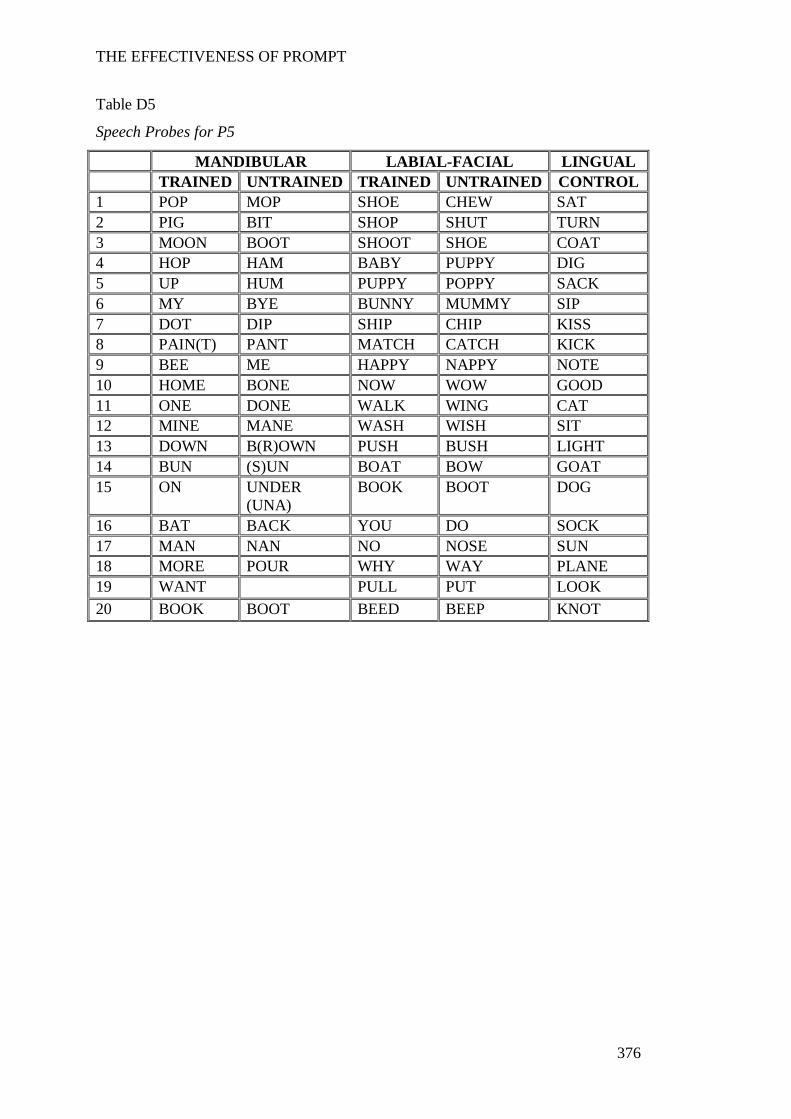
THE EFFECTIVENESS OF PROMPT
376
Table D5
Speech Probes for P5
MANDIBULAR LABIAL-FACIAL LINGUAL TRAINED UNTRAINED TRAINED UNTRAINED CONTROL
1 POP MOP SHOE CHEW SAT 2 PIG BIT SHOP SHUT TURN 3 MOON BOOT SHOOT SHOE COAT 4 HOP HAM BABY PUPPY DIG 5 UP HUM PUPPY POPPY SACK 6 MY BYE BUNNY MUMMY SIP 7 DOT DIP SHIP CHIP KISS 8 PAIN(T) PANT MATCH CATCH KICK 9 BEE ME HAPPY NAPPY NOTE 10 HOME BONE NOW WOW GOOD 11 ONE DONE WALK WING CAT 12 MINE MANE WASH WISH SIT 13 DOWN B(R)OWN PUSH BUSH LIGHT 14 BUN (S)UN BOAT BOW GOAT 15 ON UNDER
(UNA) BOOK BOOT DOG
16 BAT BACK YOU DO SOCK 17 MAN NAN NO NOSE SUN 18 MORE POUR WHY WAY PLANE 19 WANT PULL PUT LOOK 20 BOOK BOOT BEED BEEP KNOT
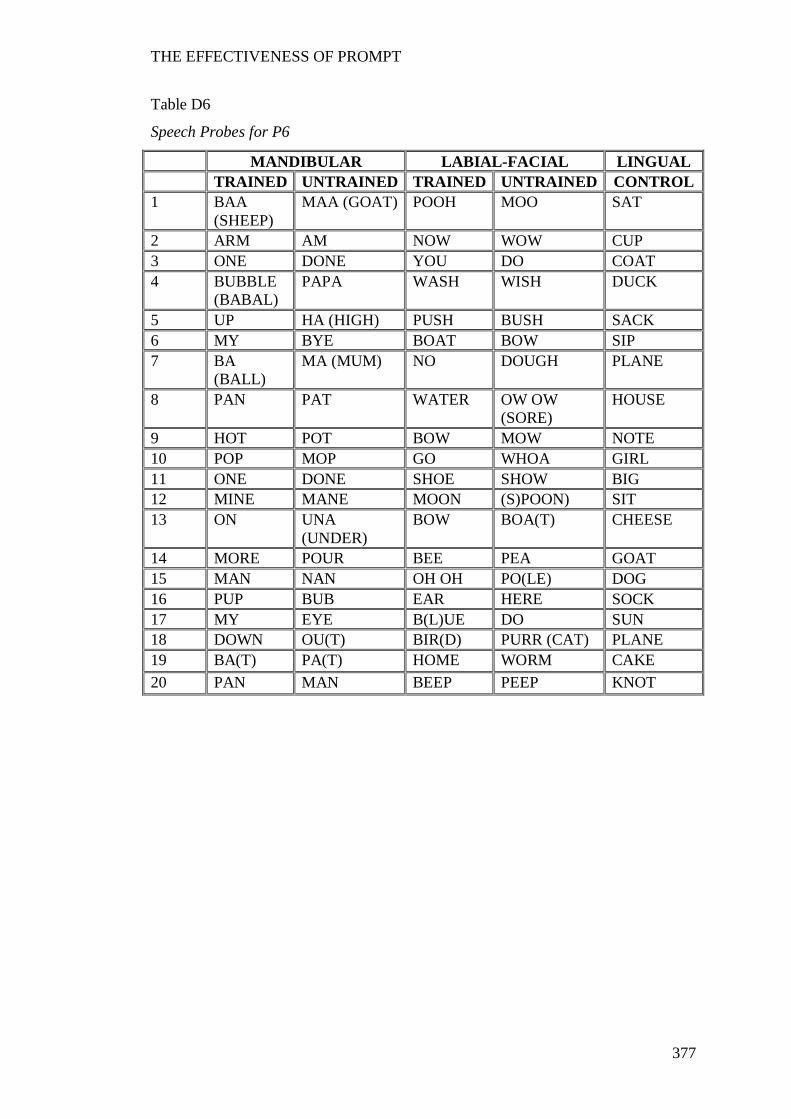
THE EFFECTIVENESS OF PROMPT
377
Table D6
Speech Probes for P6
MANDIBULAR LABIAL-FACIAL LINGUAL TRAINED UNTRAINED TRAINED UNTRAINED CONTROL
1 BAA (SHEEP)
MAA (GOAT) POOH MOO SAT
2 ARM AM NOW WOW CUP 3 ONE DONE YOU DO COAT 4 BUBBLE
(BABAL) PAPA WASH WISH DUCK
5 UP HA (HIGH) PUSH BUSH SACK 6 MY BYE BOAT BOW SIP 7 BA
(BALL) MA (MUM) NO DOUGH PLANE
8 PAN PAT WATER OW OW (SORE)
HOUSE
9 HOT POT BOW MOW NOTE 10 POP MOP GO WHOA GIRL 11 ONE DONE SHOE SHOW BIG 12 MINE MANE MOON (S)POON) SIT 13 ON UNA
(UNDER) BOW BOA(T) CHEESE
14 MORE POUR BEE PEA GOAT 15 MAN NAN OH OH PO(LE) DOG 16 PUP BUB EAR HERE SOCK 17 MY EYE B(L)UE DO SUN 18 DOWN OU(T) BIR(D) PURR (CAT) PLANE 19 BA(T) PA(T) HOME WORM CAKE 20 PAN MAN BEEP PEEP KNOT
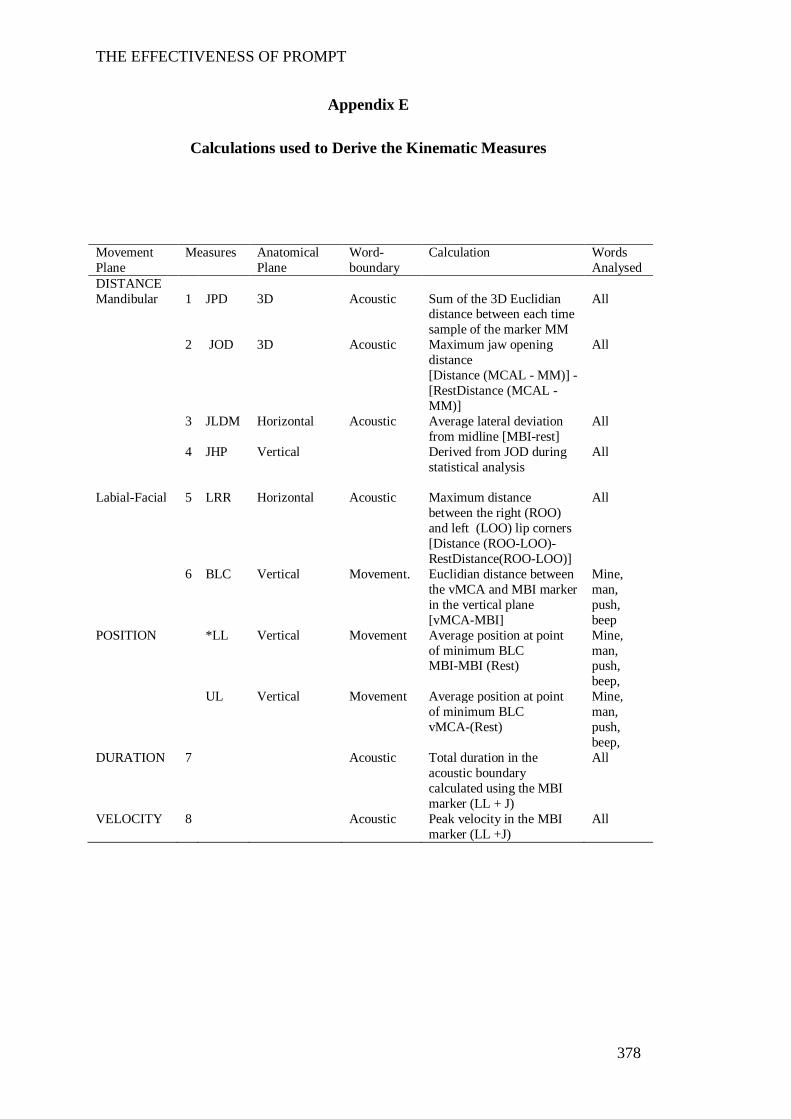
THE EFFECTIVENESS OF PROMPT
378
Appendix E
Calculations used to Derive the Kinematic Measures
Movement Plane
Measures Anatomical Plane
Word-boundary
Calculation Words Analysed
DISTANCE Mandibular 1 JPD 3D Acoustic Sum of the 3D Euclidian
distance between each time sample of the marker MM
All
2 JOD 3D Acoustic Maximum jaw opening distance [Distance (MCAL - MM)] - [RestDistance (MCAL - MM)]
All
3 JLDM Horizontal Acoustic Average lateral deviation from midline [MBI-rest]
All
4 JHP Vertical Derived from JOD during statistical analysis
All
Labial-Facial 5 LRR Horizontal Acoustic Maximum distance
between the right (ROO) and left (LOO) lip corners [Distance (ROO-LOO)-RestDistance(ROO-LOO)]
All
6 BLC Vertical Movement. Euclidian distance between the vMCA and MBI marker in the vertical plane [vMCA-MBI]
Mine, man, push, beep
POSITION *LL Vertical Movement Average position at point of minimum BLC MBI-MBI (Rest)
Mine, man, push, beep,
UL Vertical Movement Average position at point of minimum BLC vMCA-(Rest)
Mine, man, push, beep,
DURATION 7 Acoustic Total duration in the acoustic boundary calculated using the MBI marker (LL + J)
All
VELOCITY 8 Acoustic Peak velocity in the MBI marker (LL +J)
All
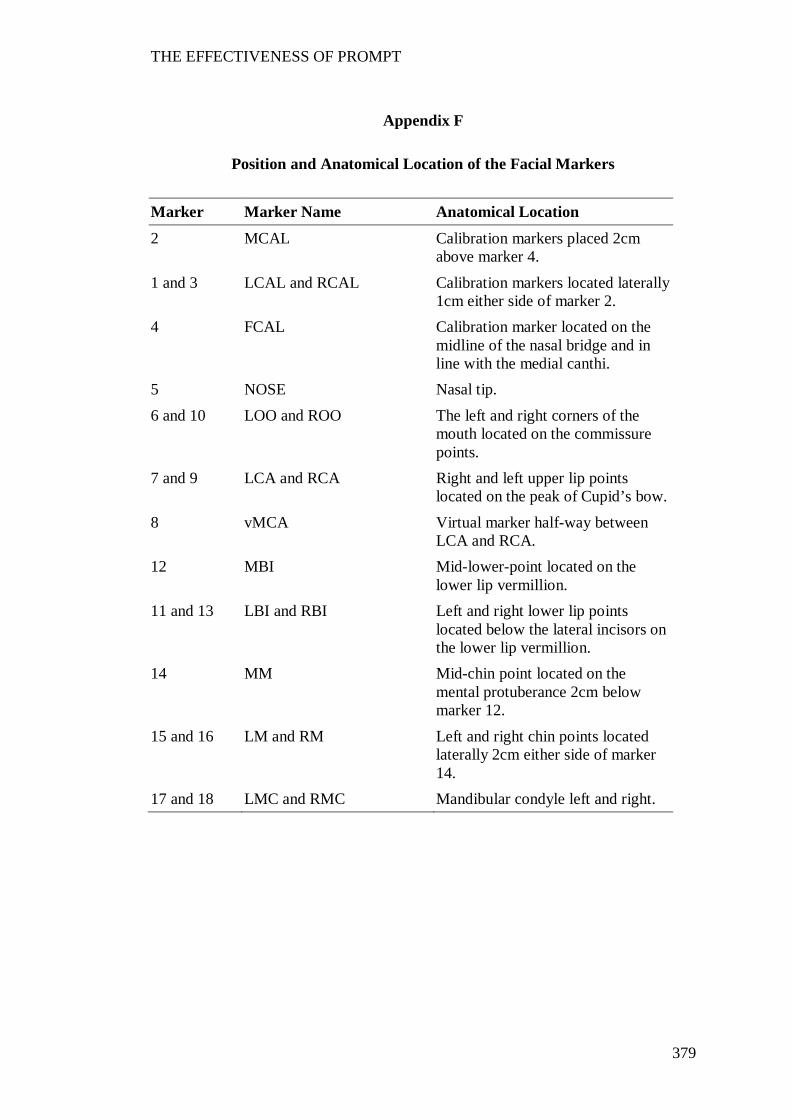
THE EFFECTIVENESS OF PROMPT
379
Appendix F
Position and Anatomical Location of the Facial Markers
Marker Marker Name Anatomical Location
2 MCAL Calibration markers placed 2cm above marker 4.
1 and 3 LCAL and RCAL Calibration markers located laterally 1cm either side of marker 2.
4 FCAL Calibration marker located on the midline of the nasal bridge and in line with the medial canthi.
5 NOSE Nasal tip. 6 and 10 LOO and ROO The left and right corners of the
mouth located on the commissure points.
7 and 9 LCA and RCA Right and left upper lip points located on the peak of Cupid’s bow.
8 vMCA Virtual marker half-way between LCA and RCA.
12 MBI Mid-lower-point located on the lower lip vermillion.
11 and 13 LBI and RBI Left and right lower lip points located below the lateral incisors on the lower lip vermillion.
14 MM Mid-chin point located on the mental protuberance 2cm below marker 12.
15 and 16 LM and RM Left and right chin points located laterally 2cm either side of marker 14.
17 and 18 LMC and RMC Mandibular condyle left and right.

THE EFFECTIVENESS OF PROMPT
380
Appendix G
Performance on the Motor Speech Movement Patterns and Perceptual
Accuracy across the Intervention Priorities and Study Phases for the
Participants
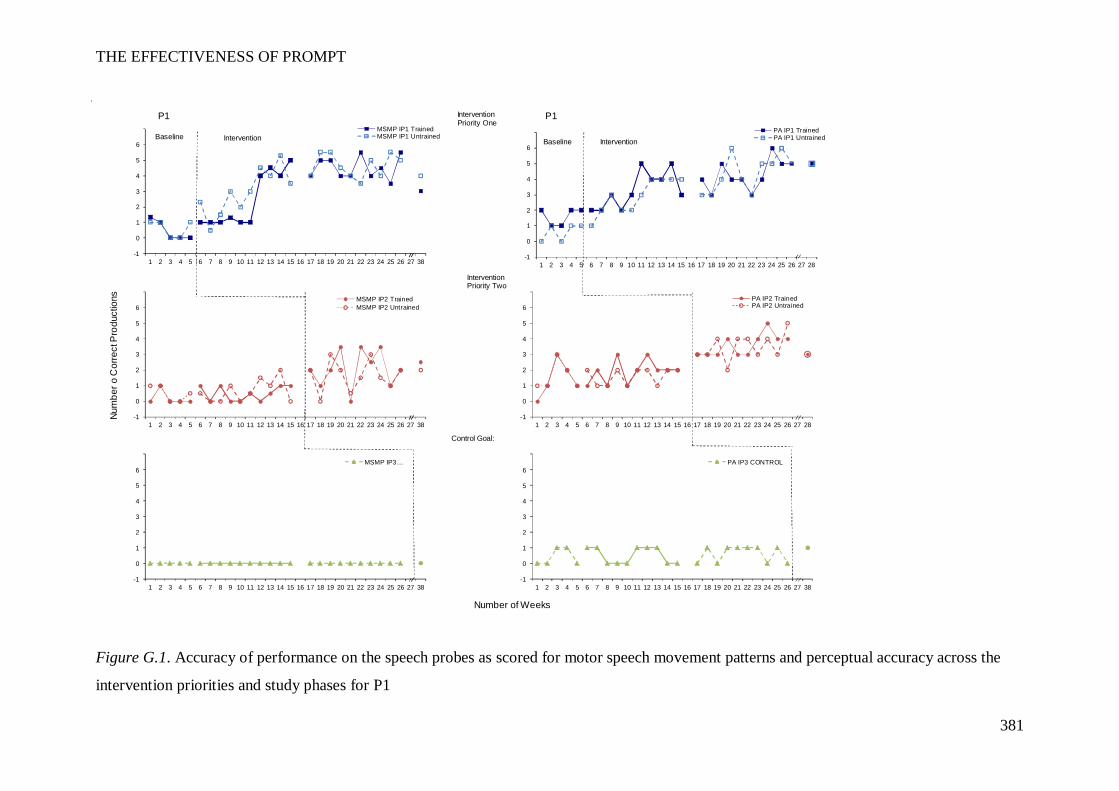
THE EFFECTIVENESS OF PROMPT
381
Figure G.1. Accuracy of performance on the speech probes as scored for motor speech movement patterns and perceptual accuracy across the
intervention priorities and study phases for P1
P1 P1
-1
0
1
2
3
4
5
6
7
1 2 3 4 5 6 7 8 9 10 11 12 13 14 15 16 17 18 19 20 21 22 23 24 25 26 27 28
PA IP1 TrainedPA IP1 Untrained
-1
0
1
2
3
4
5
6
7
1 2 3 4 5 6 7 8 9 10 11 12 13 14 15 16 17 18 19 20 21 22 23 24 25 26 27 28
PA IP2 TrainedPA IP2 Untrained
-1
0
1
2
3
4
5
6
7
1 2 3 4 5 6 7 8 9 10 11 12 13 14 15 16 17 18 19 20 21 22 23 24 25 26 27 38
PA IP3 CONTROL
-1
0
1
2
3
4
5
6
7
1 2 3 4 5 6 7 8 9 10 11 12 13 14 15 16 17 18 19 20 21 22 23 24 25 26 27 38
MSMP IP1 TrainedMSMP IP1 Untrained
-1
0
1
2
3
4
5
6
7
1 2 3 4 5 6 7 8 9 10 11 12 13 14 15 16 17 18 19 20 21 22 23 24 25 26 27 38
MSMP IP2 TrainedMSMP IP2 Untrained
-1
0
1
2
3
4
5
6
7
1 2 3 4 5 6 7 8 9 10 11 12 13 14 15 16 17 18 19 20 21 22 23 24 25 26 27 38
MSMP IP3…
InterventionPriority One
Num
ber o
Cor
rect
Pro
duct
ions
Number of Weeks
InterventionPriority Two
Control Goal:
InterventionIntervention BaselineBaseline
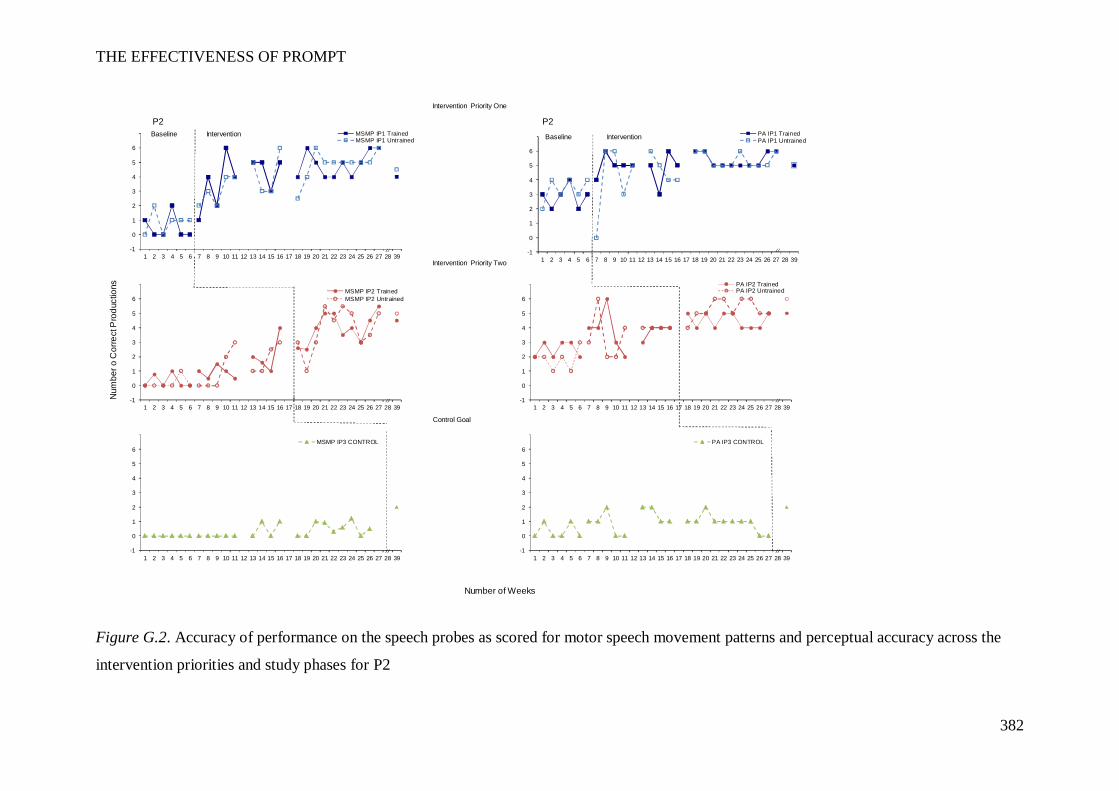
THE EFFECTIVENESS OF PROMPT
382
Figure G.2. Accuracy of performance on the speech probes as scored for motor speech movement patterns and perceptual accuracy across the
intervention priorities and study phases for P2
P2 P2
-1
0
1
2
3
4
5
6
7
1 2 3 4 5 6 7 8 9 10 11 12 13 14 15 16 17 18 19 20 21 22 23 24 25 26 27 28 39
PA IP1 TrainedPA IP1 Untrained
-1
0
1
2
3
4
5
6
7
1 2 3 4 5 6 7 8 9 10 11 12 13 14 15 16 17 18 19 20 21 22 23 24 25 26 27 28 39
PA IP2 TrainedPA IP2 Untrained
-1
0
1
2
3
4
5
6
7
1 2 3 4 5 6 7 8 9 10 11 12 13 14 15 16 17 18 19 20 21 22 23 24 25 26 27 28 39
PA IP3 CONTROL
InterventionBaseline
-1
0
1
2
3
4
5
6
7
1 2 3 4 5 6 7 8 9 10 11 12 13 14 15 16 17 18 19 20 21 22 23 24 25 26 27 28 39
MSMP IP1 TrainedMSMP IP1 Untrained
-1
0
1
2
3
4
5
6
7
1 2 3 4 5 6 7 8 9 10 11 12 13 14 15 16 17 18 19 20 21 22 23 24 25 26 27 28 39
MSMP IP2 TrainedMSMP IP2 Untrained
-1
0
1
2
3
4
5
6
7
1 2 3 4 5 6 7 8 9 10 11 12 13 14 15 16 17 18 19 20 21 22 23 24 25 26 27 28 39
MSMP IP3 CONTROL
Intervention Priority One
Baseline
Intervention Priority Two
Number of Weeks
Num
ber o
Cor
rect
Pro
duct
ions
Control Goal
Intervention
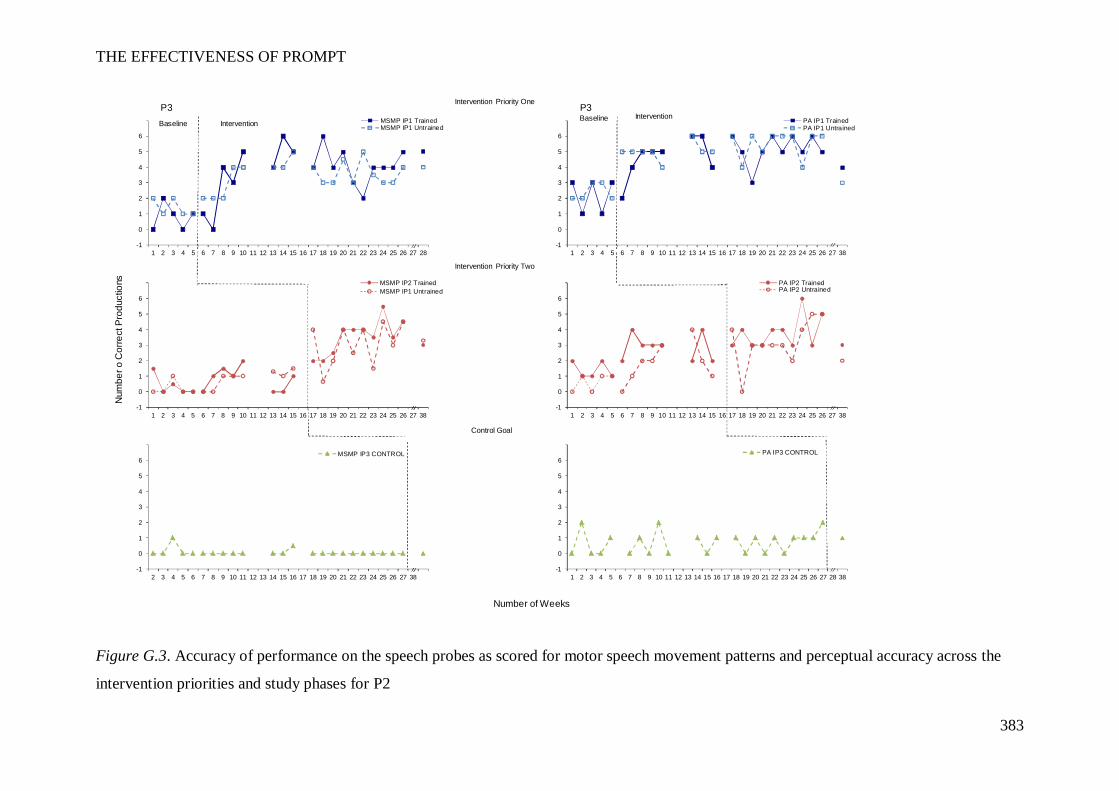
THE EFFECTIVENESS OF PROMPT
383
Figure G.3. Accuracy of performance on the speech probes as scored for motor speech movement patterns and perceptual accuracy across the
intervention priorities and study phases for P2
P3 P3
-1
0
1
2
3
4
5
6
7
1 2 3 4 5 6 7 8 9 10 11 12 13 14 15 16 17 18 19 20 21 22 23 24 25 26 27 28
MSMP IP1 TrainedMSMP IP1 Untrained
-1
0
1
2
3
4
5
6
7
1 2 3 4 5 6 7 8 9 10 11 12 13 14 15 16 17 18 19 20 21 22 23 24 25 26 27 38
MSMP IP2 TrainedMSMP IP1 Untrained
-1
0
1
2
3
4
5
6
7
2 3 4 5 6 7 8 9 10 11 12 13 14 15 16 17 18 19 20 21 22 23 24 25 26 27 38
MSMP IP3 CONTROL
InterventionBaseline
-1
0
1
2
3
4
5
6
7
1 2 3 4 5 6 7 8 9 10 11 12 13 14 15 16 17 18 19 20 21 22 23 24 25 26 27 38
PA IP1 TrainedPA IP1 Untrained
-1
0
1
2
3
4
5
6
7
1 2 3 4 5 6 7 8 9 10 11 12 13 14 15 16 17 18 19 20 21 22 23 24 25 26 27 38
PA IP2 TrainedPA IP2 Untrained
-1
0
1
2
3
4
5
6
7
1 2 3 4 5 6 7 8 9 10 11 12 13 14 15 16 17 18 19 20 21 22 23 24 25 26 27 28 38
PA IP3 CONTROL
InterventionBaseline
Number of Weeks
Num
ber o
Cor
rect
Pro
duct
ions
Intervention Priority One
Intervention Priority Two
Control Goal
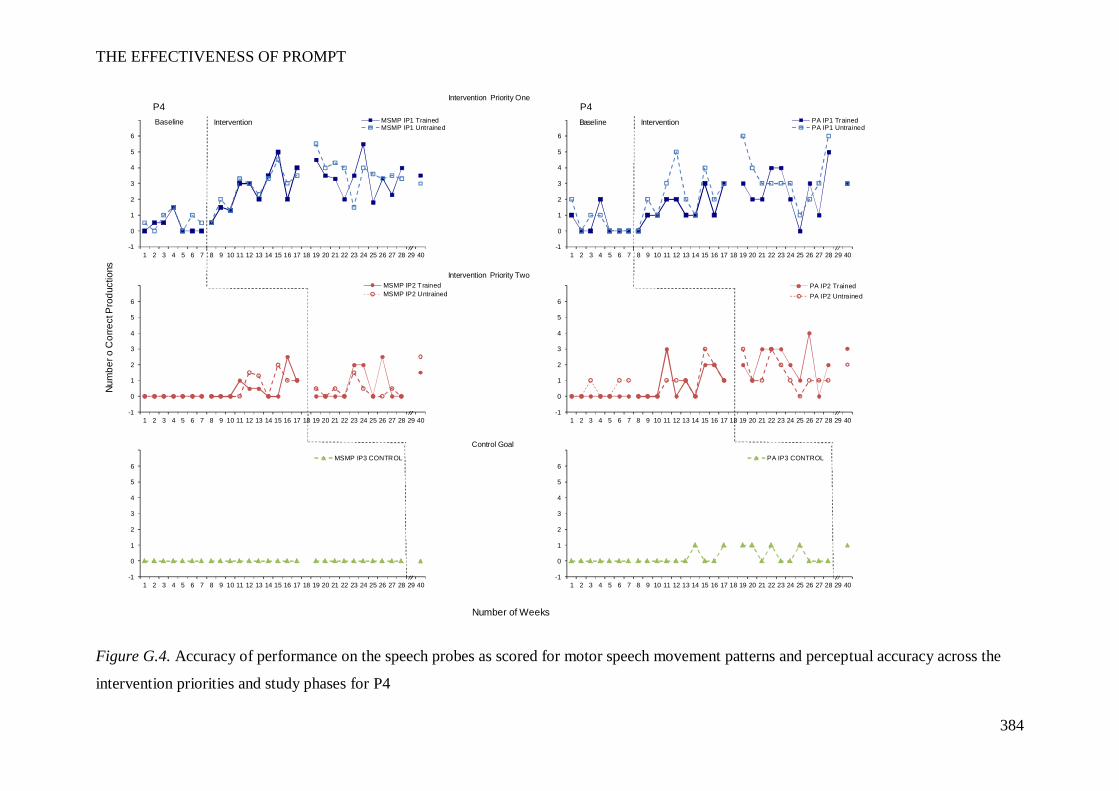
THE EFFECTIVENESS OF PROMPT
384
Figure G.4. Accuracy of performance on the speech probes as scored for motor speech movement patterns and perceptual accuracy across the
intervention priorities and study phases for P4
P4 P4
-1
0
1
2
3
4
5
6
7
1 2 3 4 5 6 7 8 9 10 11 12 13 14 15 16 17 18 19 20 21 22 23 24 25 26 27 28 29 40
MSMP IP1 TrainedMSMP IP1 Untrained
-1
0
1
2
3
4
5
6
7
1 2 3 4 5 6 7 8 9 10 11 12 13 14 15 16 17 18 19 20 21 22 23 24 25 26 27 28 29 40
MSMP IP2 TrainedMSMP IP2 Untrained
-1
0
1
2
3
4
5
6
7
1 2 3 4 5 6 7 8 9 10 11 12 13 14 15 16 17 18 19 20 21 22 23 24 25 26 27 28 29 40
MSMP IP3 CONTROL
InterventionBaseline
-1
0
1
2
3
4
5
6
7
1 2 3 4 5 6 7 8 9 10 11 12 13 14 15 16 17 18 19 20 21 22 23 24 25 26 27 28 29 40
PA IP1 TrainedPA IP1 Untrained
-1
0
1
2
3
4
5
6
7
1 2 3 4 5 6 7 8 9 10 11 12 13 14 15 16 17 18 19 20 21 22 23 24 25 26 27 28 29 40
PA IP2 TrainedPA IP2 Untrained
-1
0
1
2
3
4
5
6
7
1 2 3 4 5 6 7 8 9 10 11 12 13 14 15 16 17 18 19 20 21 22 23 24 25 26 27 28 29 40
PA IP3 CONTROL
InterventionBaseline
Num
ber o
Cor
rect
Pro
duct
ions
Number of Weeks
Intervention Priority Two
Intervention Priority One
Control Goal
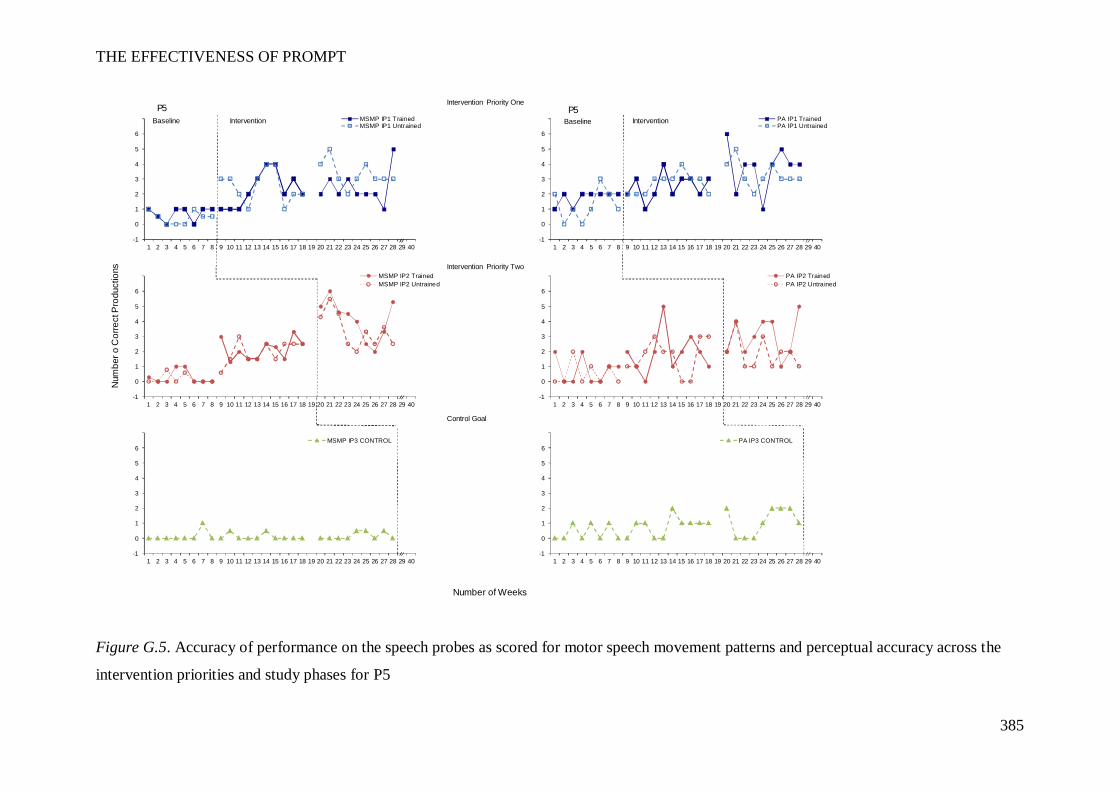
THE EFFECTIVENESS OF PROMPT
385
Figure G.5. Accuracy of performance on the speech probes as scored for motor speech movement patterns and perceptual accuracy across the
intervention priorities and study phases for P5
-1
0
1
2
3
4
5
6
7
1 2 3 4 5 6 7 8 9 10 11 12 13 14 15 16 17 18 19 20 21 22 23 24 25 26 27 28 29 40
MSMP IP1 TrainedMSMP IP1 Untrained
-1
0
1
2
3
4
5
6
7
1 2 3 4 5 6 7 8 9 10 11 12 13 14 15 16 17 18 19 20 21 22 23 24 25 26 27 28 29 40
MSMP IP2 TrainedMSMP IP2 Untrained
-1
0
1
2
3
4
5
6
7
1 2 3 4 5 6 7 8 9 10 11 12 13 14 15 16 17 18 19 20 21 22 23 24 25 26 27 28 29 40
MSMP IP3 CONTROL
InterventionP5
-1
0
1
2
3
4
5
6
7
1 2 3 4 5 6 7 8 9 10 11 12 13 14 15 16 17 18 19 20 21 22 23 24 25 26 27 28 29 40
PA IP1 TrainedPA IP1 UntrainedBaseline
-1
0
1
2
3
4
5
6
7
1 2 3 4 5 6 7 8 9 10 11 12 13 14 15 16 17 18 19 20 21 22 23 24 25 26 27 28 29 40
PA IP2 TrainedPA IP2 Untrained
-1
0
1
2
3
4
5
6
7
1 2 3 4 5 6 7 8 9 10 11 12 13 14 15 16 17 18 19 20 21 22 23 24 25 26 27 28 29 40
PA IP3 CONTROL
InterventionP5
Num
ber o
Cor
rect
Pro
duct
ions
Number of Weeks
Baseline
Intervention Priority Two
Intervention Priority One
Control Goal
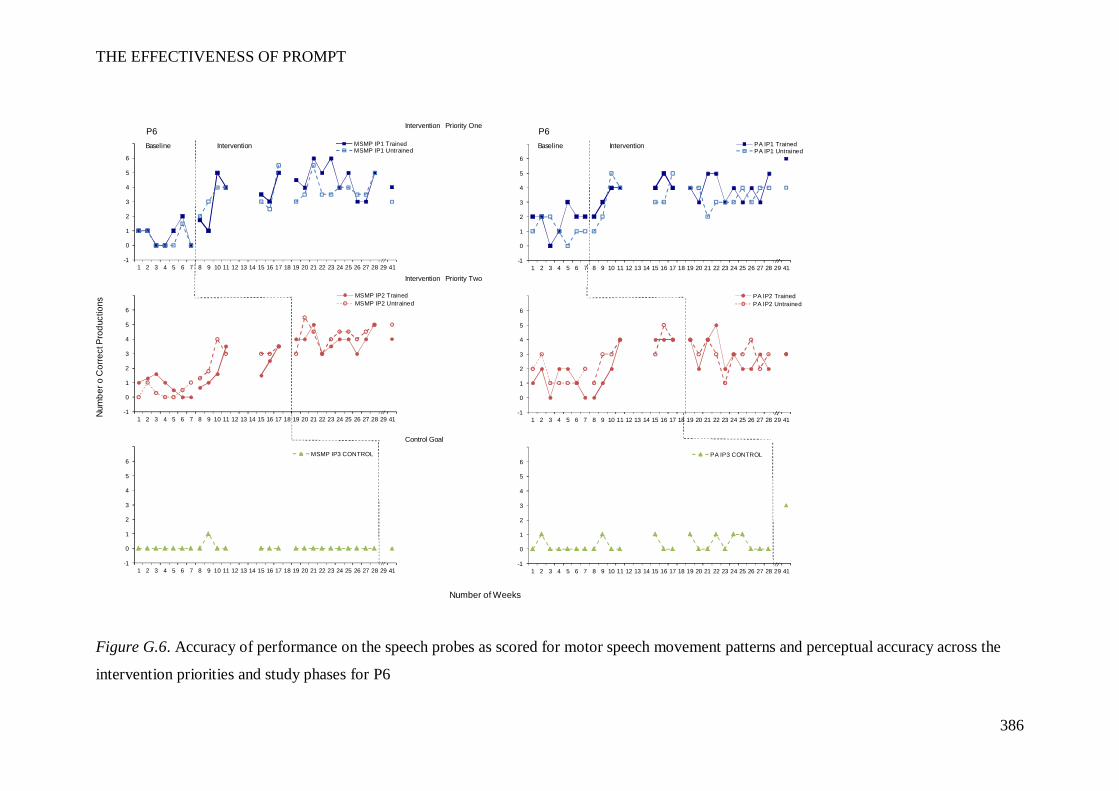
THE EFFECTIVENESS OF PROMPT
386
Figure G.6. Accuracy of performance on the speech probes as scored for motor speech movement patterns and perceptual accuracy across the
intervention priorities and study phases for P6
P6 P6
-1
0
1
2
3
4
5
6
7
1 2 3 4 5 6 7 8 9 10 11 12 13 14 15 16 17 18 19 20 21 22 23 24 25 26 27 28 29 41
MSMP IP1 TrainedMSMP IP1 Untrained
-1
0
1
2
3
4
5
6
7
1 2 3 4 5 6 7 8 9 10 11 12 13 14 15 16 17 18 19 20 21 22 23 24 25 26 27 28 29 41
MSMP IP2 TrainedMSMP IP2 Untrained
-1
0
1
2
3
4
5
6
7
1 2 3 4 5 6 7 8 9 10 11 12 13 14 15 16 17 18 19 20 21 22 23 24 25 26 27 28 29 41
MSMP IP3 CONTROL
InterventionBaseline
-1
0
1
2
3
4
5
6
7
1 2 3 4 5 6 7 8 9 10 11 12 13 14 15 16 17 18 19 20 21 22 23 24 25 26 27 28 29 41
PA IP1 TrainedPA IP1 Untrained
-1
0
1
2
3
4
5
6
7
1 2 3 4 5 6 7 8 9 10 11 12 13 14 15 16 17 18 19 20 21 22 23 24 25 26 27 28 29 41
PA IP2 TrainedPA IP2 Untrained
-1
0
1
2
3
4
5
6
7
1 2 3 4 5 6 7 8 9 10 11 12 13 14 15 16 17 18 19 20 21 22 23 24 25 26 27 28 29 41
PA IP3 CONTROL
InterventionBaseline
Num
ber o
Cor
rect
Pro
duct
ions
Number of Weeks
Intervention Priority One
Intervention Priority Two
Control Goal

THE EFFECTIVENESS OF PROMPT
387
Appendix H
Results obtained on the Canadian Occupational Performance Measure
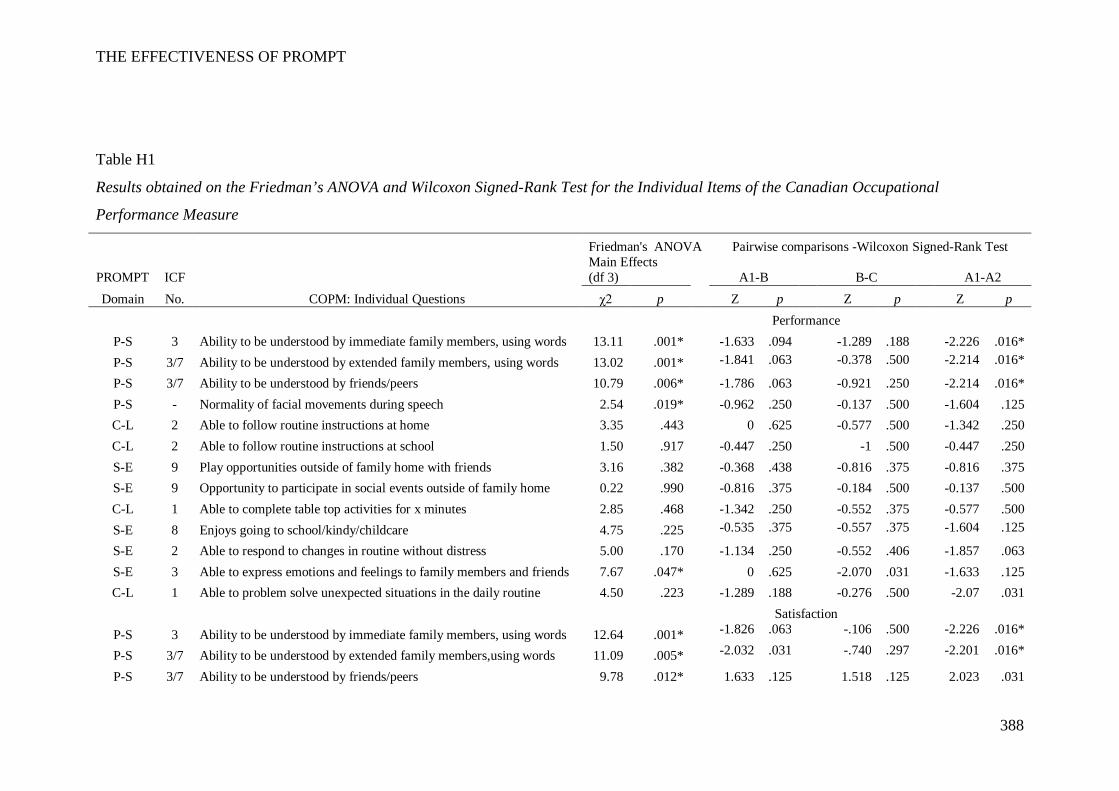
THE EFFECTIVENESS OF PROMPT
388
Table H1
Results obtained on the Friedman’s ANOVA and Wilcoxon Signed-Rank Test for the Individual Items of the Canadian Occupational
Performance Measure
Friedman's ANOVA Pairwise comparisons -Wilcoxon Signed-Rank Test
PROMPT ICF
Main Effects (df 3)
A1-B B-C A1-A2
Domain No. COPM: Individual Questions χ2 p Z p Z p Z p
Performance
P-S 3 Ability to be understood by immediate family members, using words 13.11 .001*
-1.633 .094
-1.289 .188
-2.226 .016* P-S 3/7 Ability to be understood by extended family members, using words 13.02 .001*
-1.841 .063
-0.378 .500
-2.214 .016*
P-S 3/7 Ability to be understood by friends/peers 10.79 .006*
-1.786 .063
-0.921 .250
-2.214 .016* P-S - Normality of facial movements during speech 2.54 .019*
-0.962 .250
-0.137 .500
-1.604 .125
C-L 2 Able to follow routine instructions at home 3.35 .443
0 .625
-0.577 .500
-1.342 .250 C-L 2 Able to follow routine instructions at school 1.50 .917
-0.447 .250
-1 .500
-0.447 .250
S-E 9 Play opportunities outside of family home with friends 3.16 .382
-0.368 .438
-0.816 .375
-0.816 .375 S-E 9 Opportunity to participate in social events outside of family home 0.22 .990
-0.816 .375
-0.184 .500
-0.137 .500
C-L 1 Able to complete table top activities for x minutes 2.85 .468
-1.342 .250
-0.552 .375
-0.577 .500 S-E 8 Enjoys going to school/kindy/childcare 4.75 .225
-0.535 .375
-0.557 .375
-1.604 .125
S-E 2 Able to respond to changes in routine without distress 5.00 .170
-1.134 .250
-0.552 .406
-1.857 .063 S-E 3 Able to express emotions and feelings to family members and friends 7.67 .047*
0 .625
-2.070 .031
-1.633 .125
C-L 1 Able to problem solve unexpected situations in the daily routine 4.50 .223
-1.289 .188
-0.276 .500
-2.07 .031
Satisfaction
P-S 3 Ability to be understood by immediate family members, using words 12.64 .001*
-1.826 .063
-.106 .500
-2.226 .016*
P-S 3/7 Ability to be understood by extended family members,using words 11.09 .005*
-2.032 .031
-.740 .297
-2.201 .016*
P-S 3/7 Ability to be understood by friends/peers 9.78 .012*
1.633 .125
1.518 .125
2.023 .031
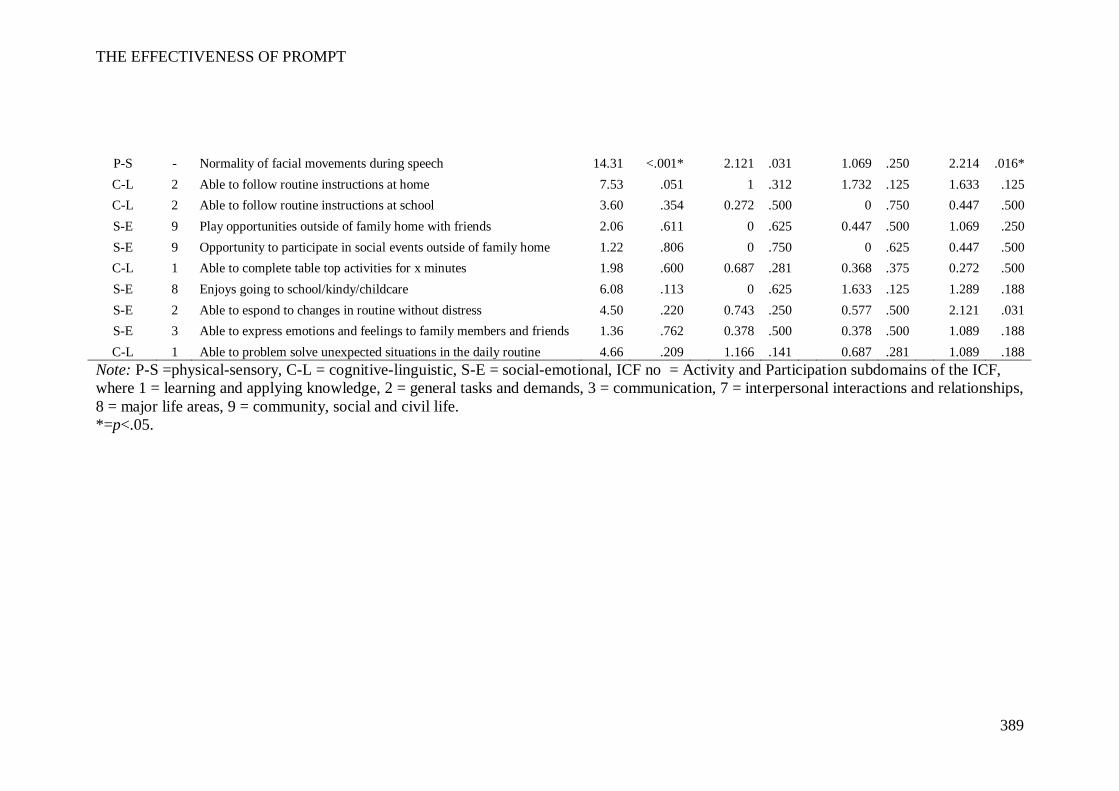
THE EFFECTIVENESS OF PROMPT
389
P-S - Normality of facial movements during speech 14.31 <.001*
2.121 .031
1.069 .250
2.214 .016* C-L 2 Able to follow routine instructions at home 7.53 .051
1 .312
1.732 .125
1.633 .125
C-L 2 Able to follow routine instructions at school 3.60 .354
0.272 .500
0 .750
0.447 .500 S-E 9 Play opportunities outside of family home with friends 2.06 .611
0 .625
0.447 .500
1.069 .250
S-E 9 Opportunity to participate in social events outside of family home 1.22 .806
0 .750
0 .625
0.447 .500 C-L 1 Able to complete table top activities for x minutes 1.98 .600
0.687 .281
0.368 .375
0.272 .500
S-E 8 Enjoys going to school/kindy/childcare 6.08 .113
0 .625
1.633 .125
1.289 .188 S-E 2 Able to espond to changes in routine without distress 4.50 .220
0.743 .250
0.577 .500
2.121 .031
S-E 3 Able to express emotions and feelings to family members and friends 1.36 .762
0.378 .500
0.378 .500
1.089 .188 C-L 1 Able to problem solve unexpected situations in the daily routine 4.66 .209 1.166 .141 0.687 .281 1.089 .188
Note: P-S =physical-sensory, C-L = cognitive-linguistic, S-E = social-emotional, ICF no = Activity and Participation subdomains of the ICF, where 1 = learning and applying knowledge, 2 = general tasks and demands, 3 = communication, 7 = interpersonal interactions and relationships, 8 = major life areas, 9 = community, social and civil life. *=p<.05.
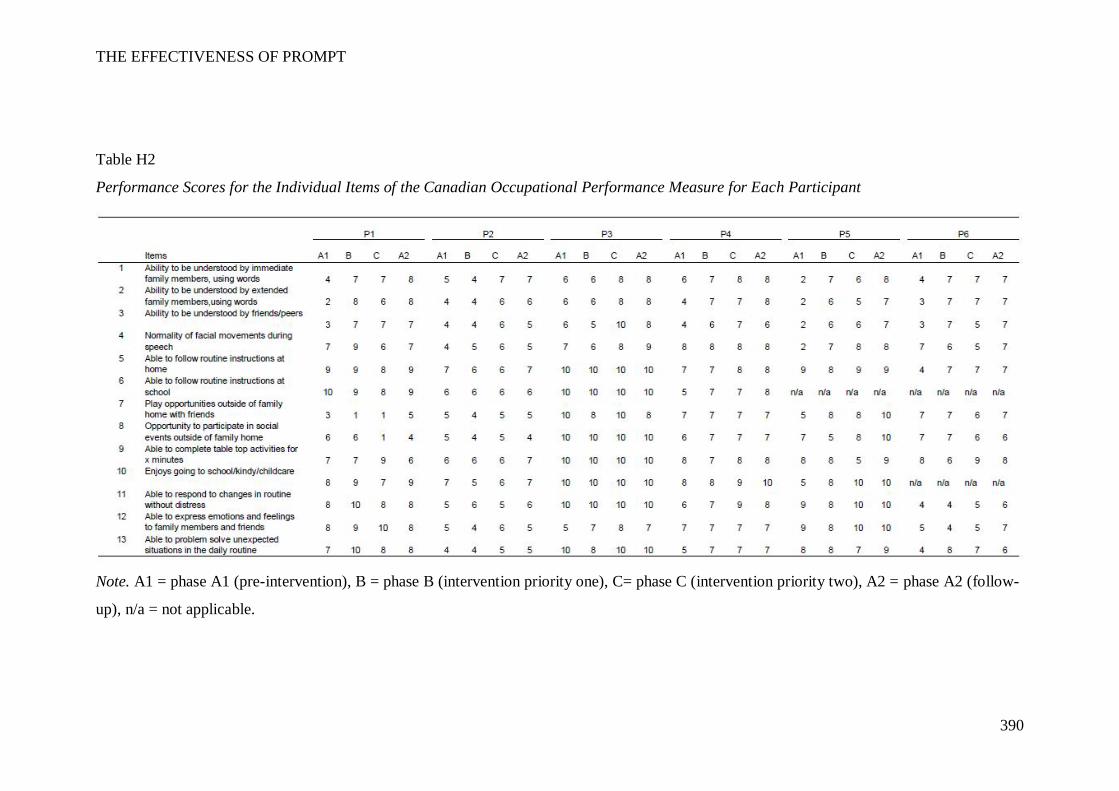
THE EFFECTIVENESS OF PROMPT
390
Table H2
Performance Scores for the Individual Items of the Canadian Occupational Performance Measure for Each Participant
Note. A1 = phase A1 (pre-intervention), B = phase B (intervention priority one), C= phase C (intervention priority two), A2 = phase A2 (follow-
up), n/a = not applicable.
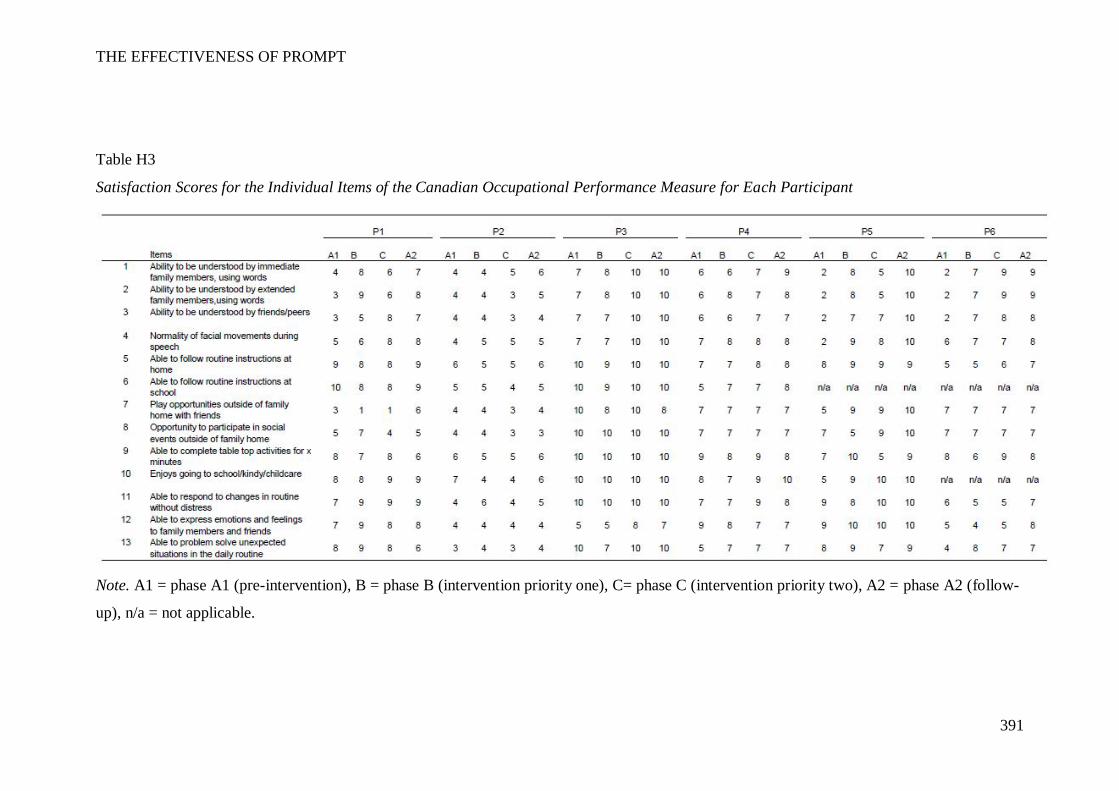
THE EFFECTIVENESS OF PROMPT
391
Table H3
Satisfaction Scores for the Individual Items of the Canadian Occupational Performance Measure for Each Participant
Note. A1 = phase A1 (pre-intervention), B = phase B (intervention priority one), C= phase C (intervention priority two), A2 = phase A2 (follow-
up), n/a = not applicable.
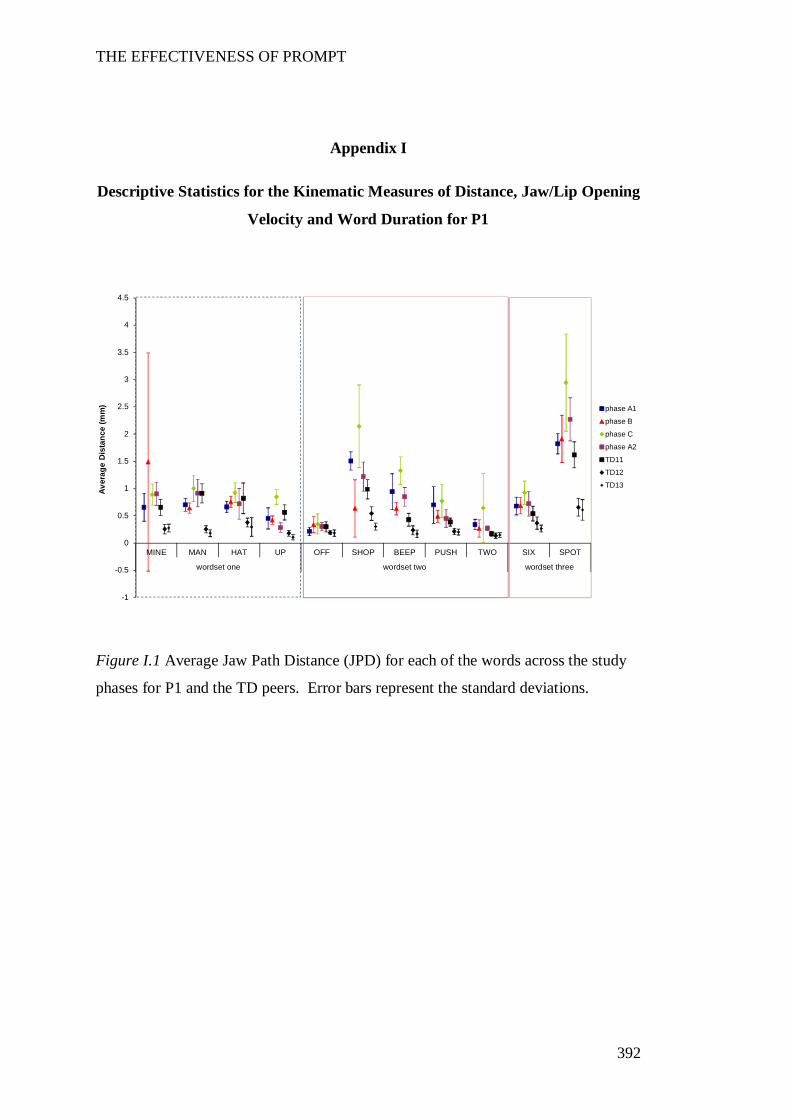
THE EFFECTIVENESS OF PROMPT
392
Appendix I
Descriptive Statistics for the Kinematic Measures of Distance, Jaw/Lip Opening
Velocity and Word Duration for P1
Figure I.1 Average Jaw Path Distance (JPD) for each of the words across the study
phases for P1 and the TD peers. Error bars represent the standard deviations.
-1
-0.5
0
0.5
1
1.5
2
2.5
3
3.5
4
4.5
MINE MAN HAT UP OFF SHOP BEEP PUSH TWO SIX SPOT
wordset one wordset two wordset three
Aver
age
Dis
tanc
e (m
m) phase A1
phase B
phase C
phase A2
TD11
TD12
TD13
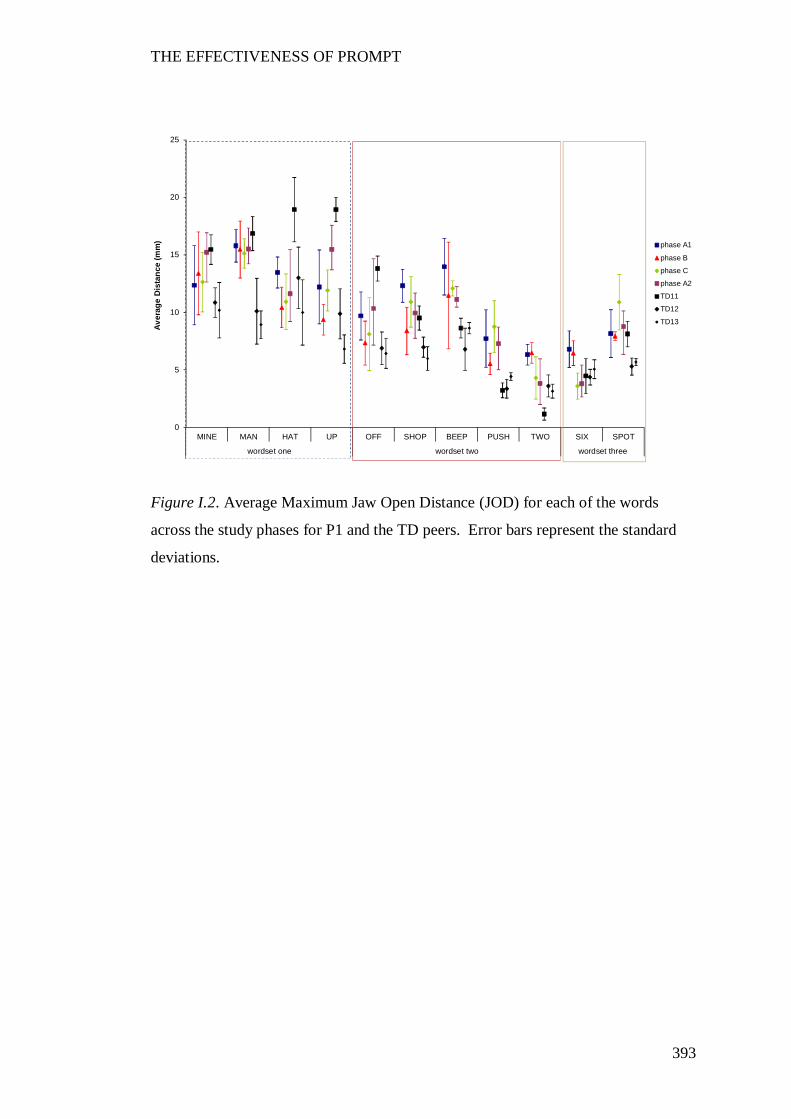
THE EFFECTIVENESS OF PROMPT
393
Figure I.2. Average Maximum Jaw Open Distance (JOD) for each of the words
across the study phases for P1 and the TD peers. Error bars represent the standard
deviations.
0
5
10
15
20
25
MINE MAN HAT UP OFF SHOP BEEP PUSH TWO SIX SPOT
wordset one wordset two wordset three
Aver
age
Dis
tanc
e (m
m) phase A1
phase B
phase C
phase A2
TD11
TD12
TD13
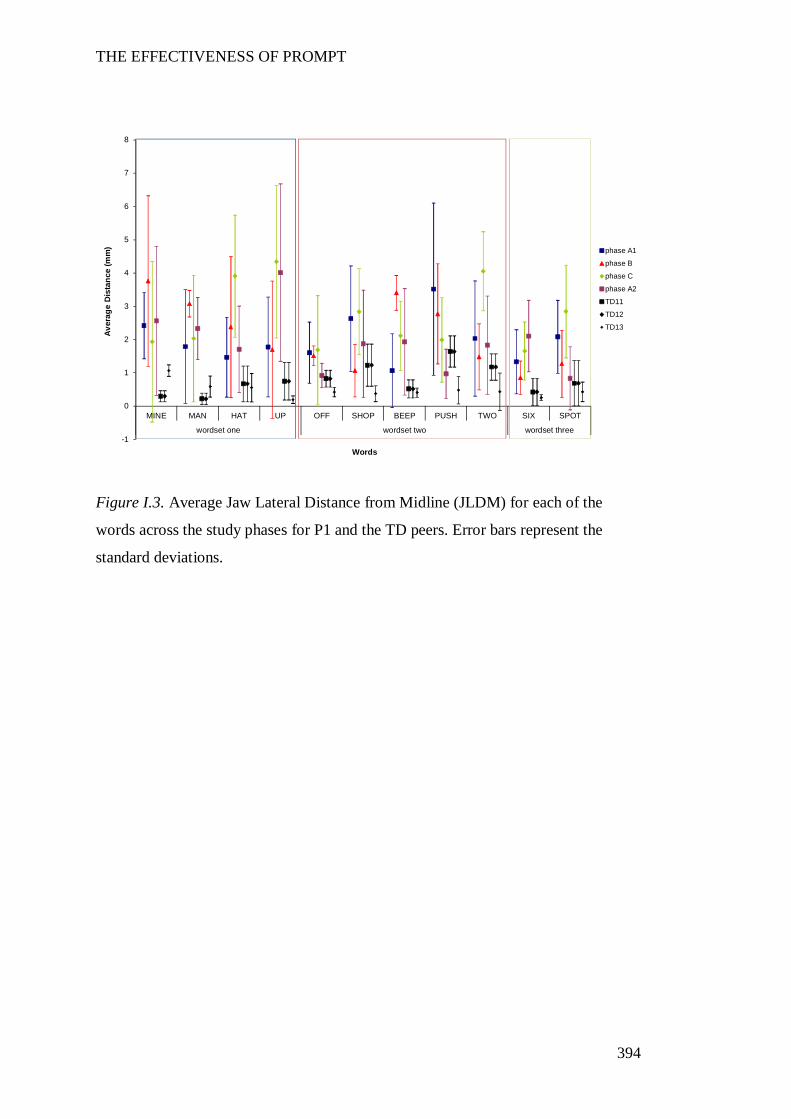
THE EFFECTIVENESS OF PROMPT
394
Figure I.3. Average Jaw Lateral Distance from Midline (JLDM) for each of the
words across the study phases for P1 and the TD peers. Error bars represent the
standard deviations.
-1
0
1
2
3
4
5
6
7
8
MINE MAN HAT UP OFF SHOP BEEP PUSH TWO SIX SPOT
wordset one wordset two wordset three
Aver
age
Dis
tanc
e (m
m)
Words
phase A1
phase B
phase C
phase A2
TD11
TD12
TD13
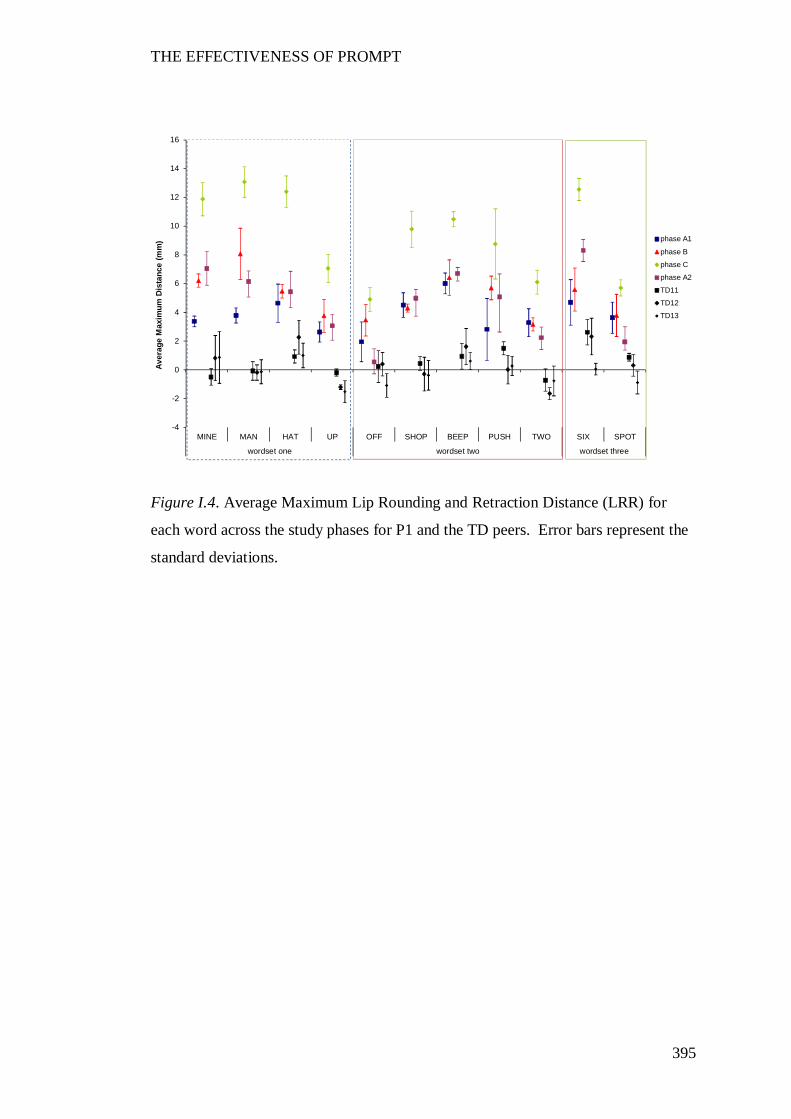
THE EFFECTIVENESS OF PROMPT
395
Figure I.4. Average Maximum Lip Rounding and Retraction Distance (LRR) for
each word across the study phases for P1 and the TD peers. Error bars represent the
standard deviations.
-4
-2
0
2
4
6
8
10
12
14
16
MINE MAN HAT UP OFF SHOP BEEP PUSH TWO SIX SPOT
wordset one wordset two wordset three
Aver
age
Max
imum
Dis
tanc
e (m
m) phase A1
phase B
phase C
phase A2
TD11
TD12
TD13
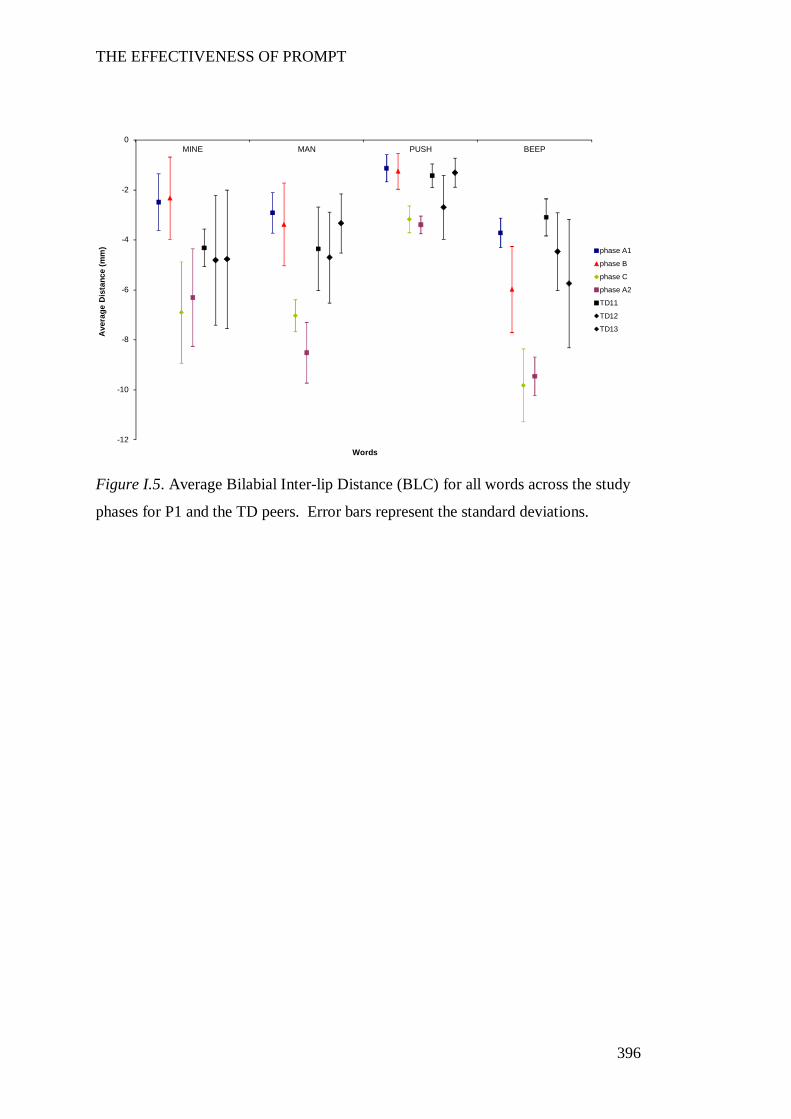
THE EFFECTIVENESS OF PROMPT
396
Figure I.5. Average Bilabial Inter-lip Distance (BLC) for all words across the study
phases for P1 and the TD peers. Error bars represent the standard deviations.
-12
-10
-8
-6
-4
-2
0MINE MAN PUSH BEEP
Ave
rage
Dis
tanc
e (m
m)
Words
phase A1
phase B
phase C
phase A2
TD11
TD12
TD13
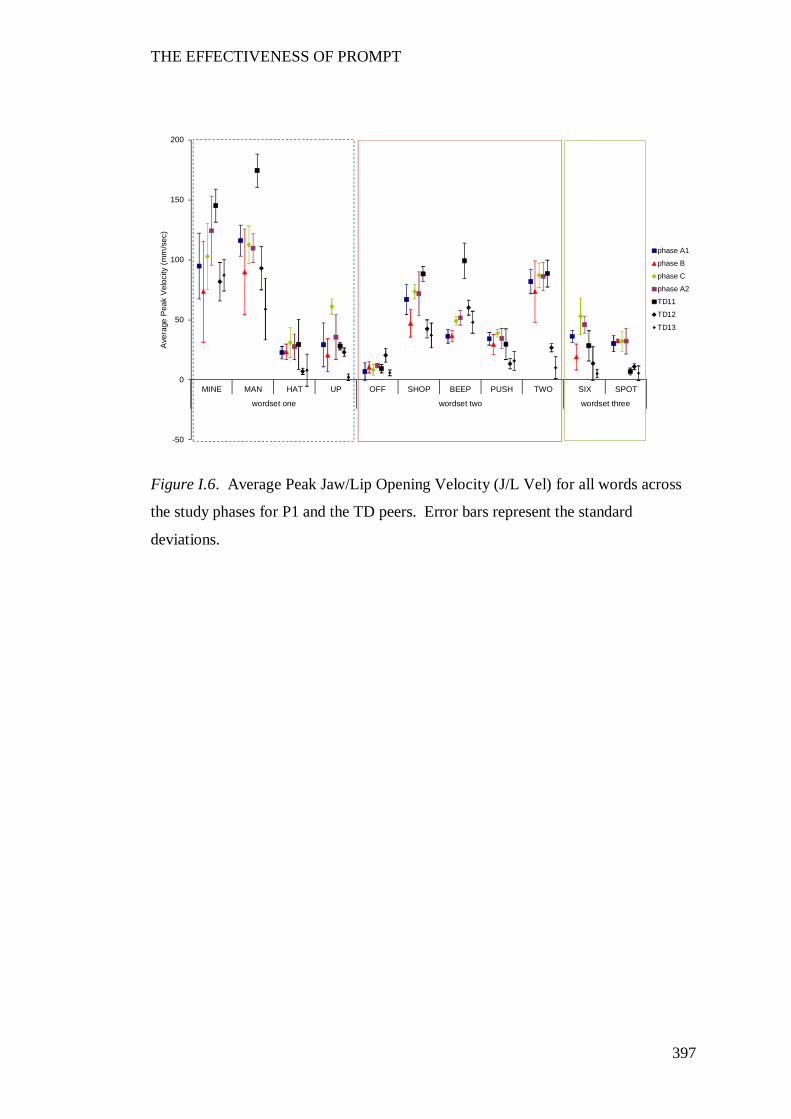
THE EFFECTIVENESS OF PROMPT
397
Figure I.6. Average Peak Jaw/Lip Opening Velocity (J/L Vel) for all words across
the study phases for P1 and the TD peers. Error bars represent the standard
deviations.
-50
0
50
100
150
200
MINE MAN HAT UP OFF SHOP BEEP PUSH TWO SIX SPOT
wordset one wordset two wordset three
Ave
rage
Pea
k V
eloc
ity (
mm
/sec
)
phase A1
phase B
phase C
phase A2
TD11
TD12
TD13
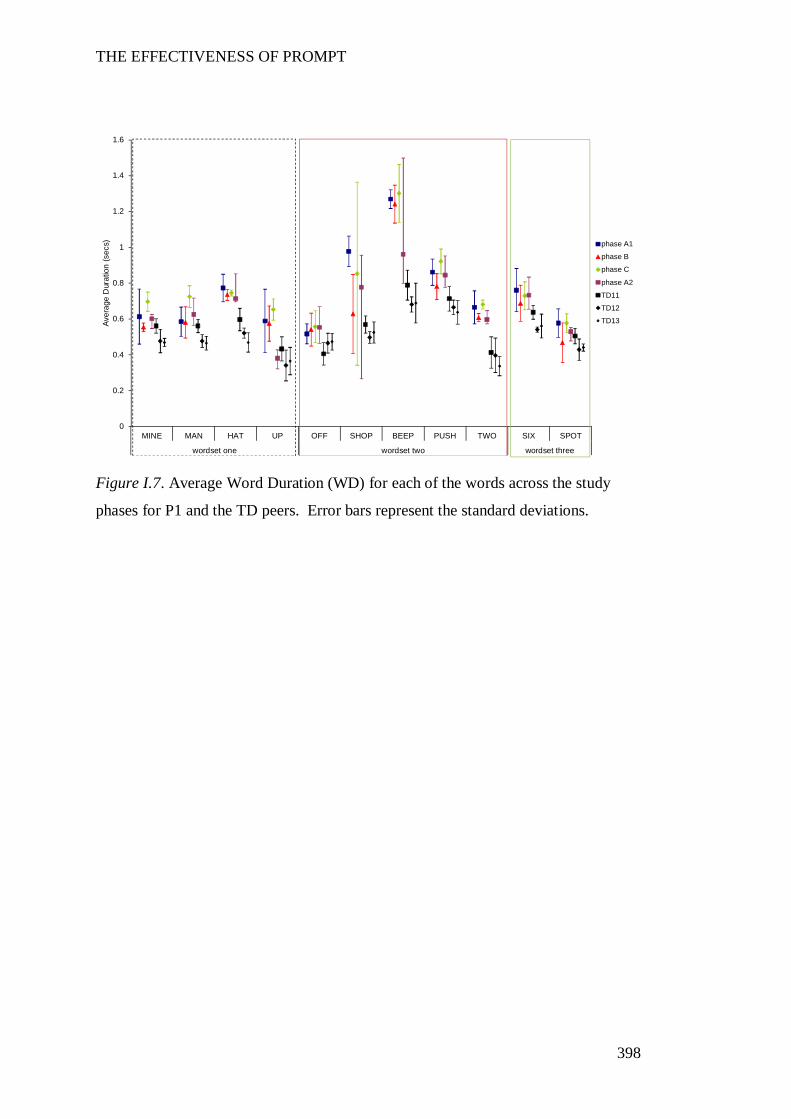
THE EFFECTIVENESS OF PROMPT
398
Figure I.7. Average Word Duration (WD) for each of the words across the study
phases for P1 and the TD peers. Error bars represent the standard deviations.
0
0.2
0.4
0.6
0.8
1
1.2
1.4
1.6
MINE MAN HAT UP OFF SHOP BEEP PUSH TWO SIX SPOT
wordset one wordset two wordset three
Aver
age
Dur
atio
n (s
ecs) phase A1
phase B
phase C
phase A2
TD11
TD12
TD13
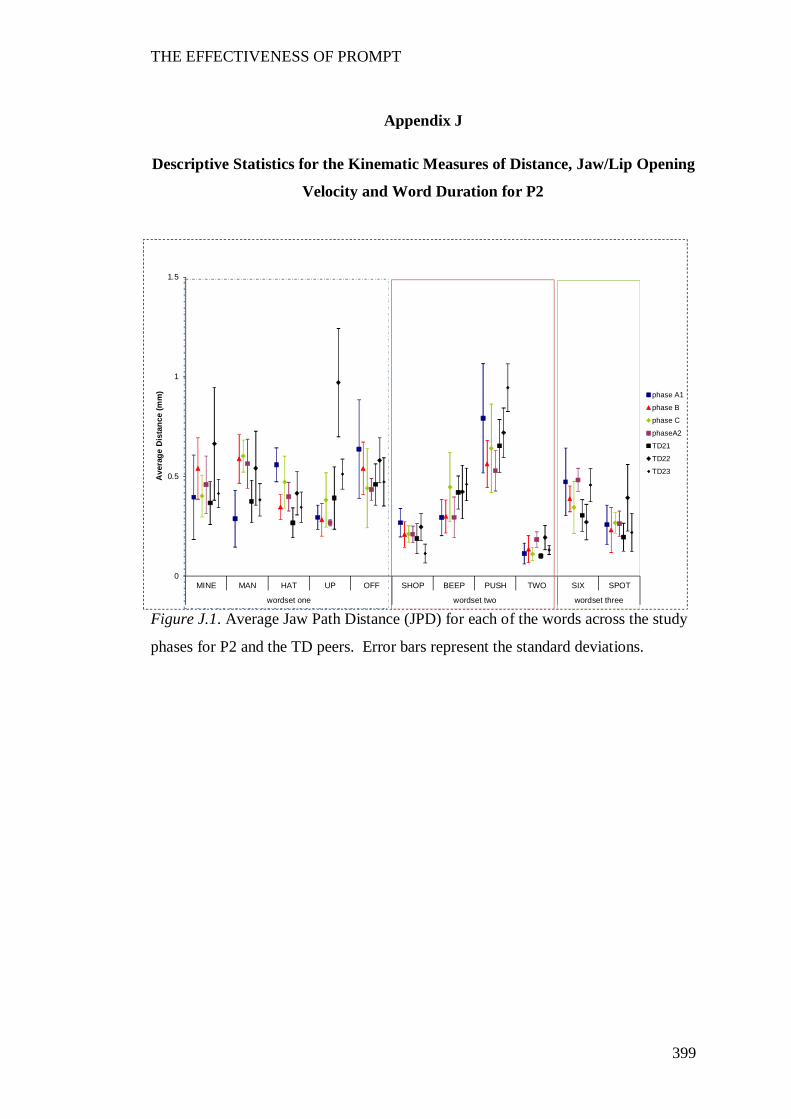
THE EFFECTIVENESS OF PROMPT
399
Appendix J
Descriptive Statistics for the Kinematic Measures of Distance, Jaw/Lip Opening
Velocity and Word Duration for P2
Figure J.1. Average Jaw Path Distance (JPD) for each of the words across the study
phases for P2 and the TD peers. Error bars represent the standard deviations.
0
0.5
1
1.5
MINE MAN HAT UP OFF SHOP BEEP PUSH TWO SIX SPOT
wordset one wordset two wordset three
Ave
rage
Dis
tanc
e (m
m) phase A1
phase B
phase C
phaseA2
TD21
TD22
TD23
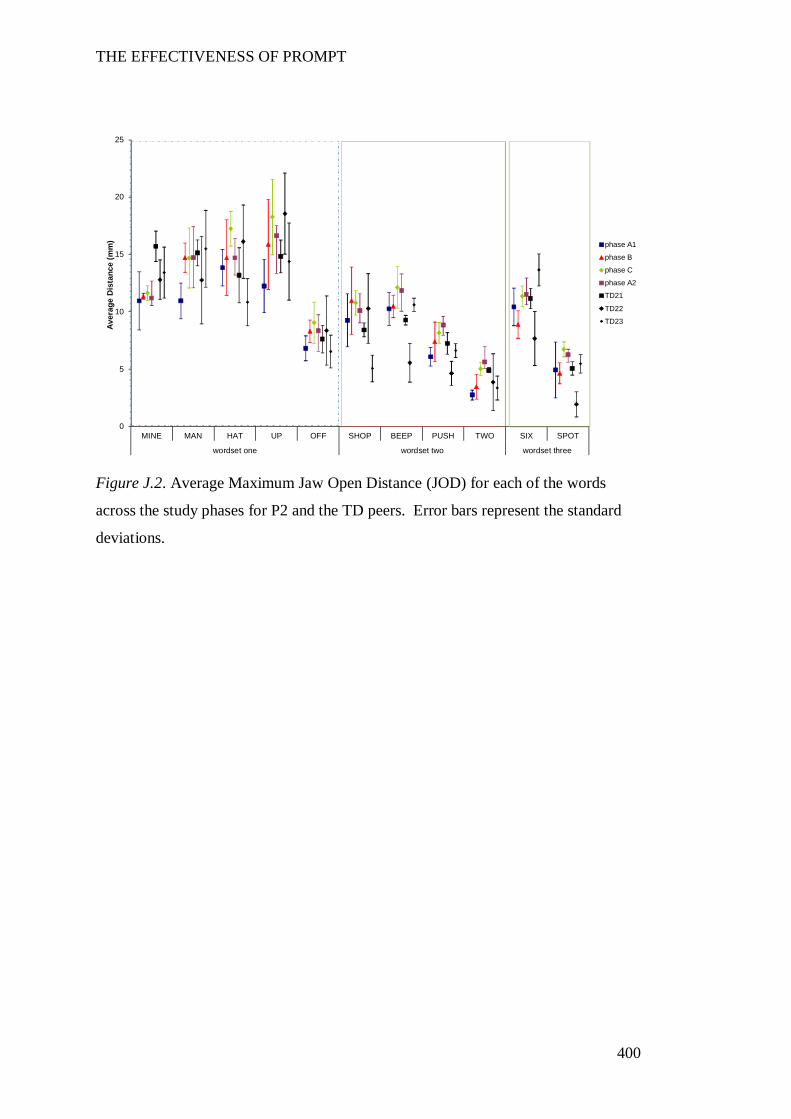
THE EFFECTIVENESS OF PROMPT
400
Figure J.2. Average Maximum Jaw Open Distance (JOD) for each of the words
across the study phases for P2 and the TD peers. Error bars represent the standard
deviations.
0
5
10
15
20
25
MINE MAN HAT UP OFF SHOP BEEP PUSH TWO SIX SPOT
wordset one wordset two wordset three
Aver
age
Dis
tanc
e (m
m) phase A1
phase B
phase C
phase A2
TD21
TD22
TD23
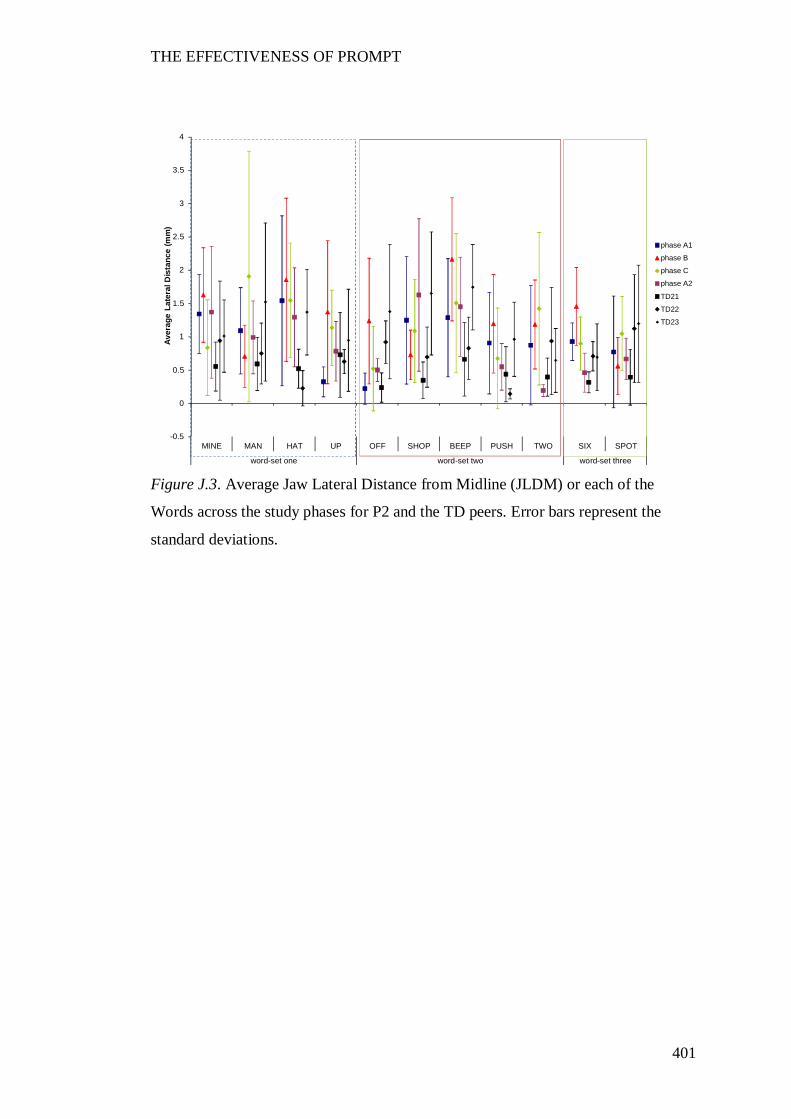
THE EFFECTIVENESS OF PROMPT
401
Figure J.3. Average Jaw Lateral Distance from Midline (JLDM) or each of the
Words across the study phases for P2 and the TD peers. Error bars represent the
standard deviations.
-0.5
0
0.5
1
1.5
2
2.5
3
3.5
4
MINE MAN HAT UP OFF SHOP BEEP PUSH TWO SIX SPOT
word-set one word-set two word-set three
Aver
age
Late
ral D
ista
nce
(mm
)
phase A1
phase B
phase C
phase A2
TD21
TD22
TD23
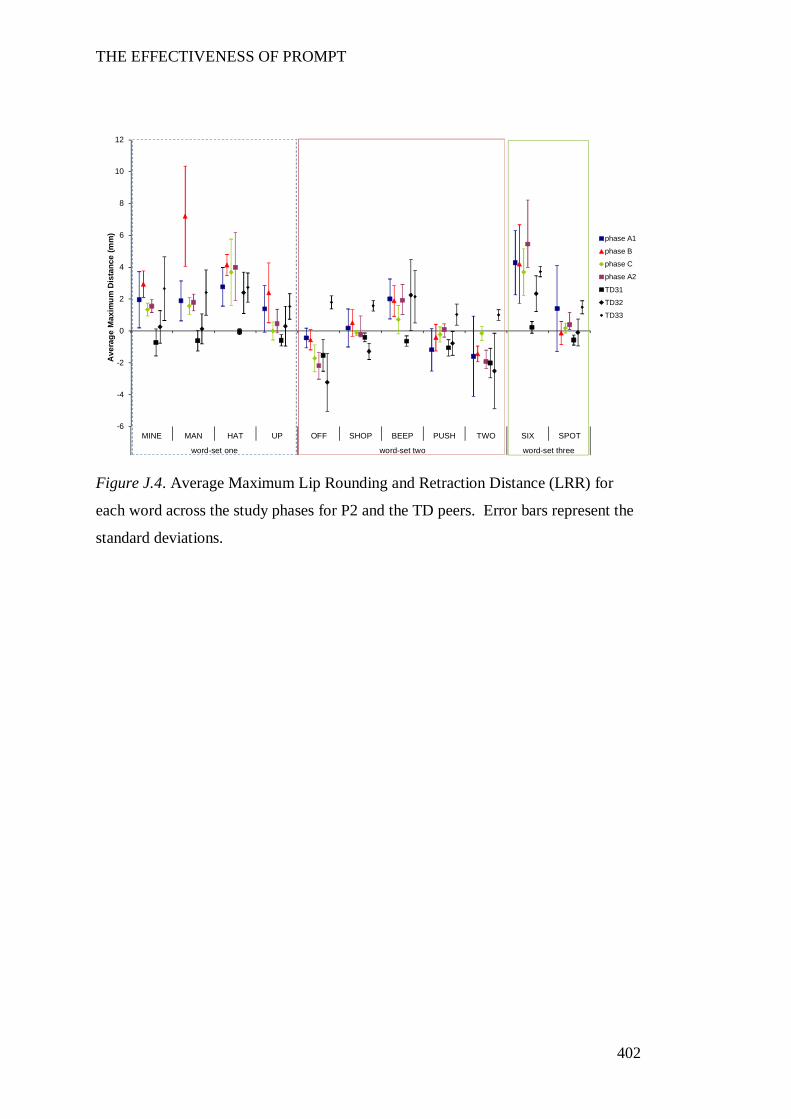
THE EFFECTIVENESS OF PROMPT
402
Figure J.4. Average Maximum Lip Rounding and Retraction Distance (LRR) for
each word across the study phases for P2 and the TD peers. Error bars represent the
standard deviations.
-6
-4
-2
0
2
4
6
8
10
12
MINE MAN HAT UP OFF SHOP BEEP PUSH TWO SIX SPOT
word-set one word-set two word-set three
Ave
rage
Max
imum
Dis
tanc
e (m
m)
phase A1
phase B
phase C
phase A2
TD31
TD32
TD33
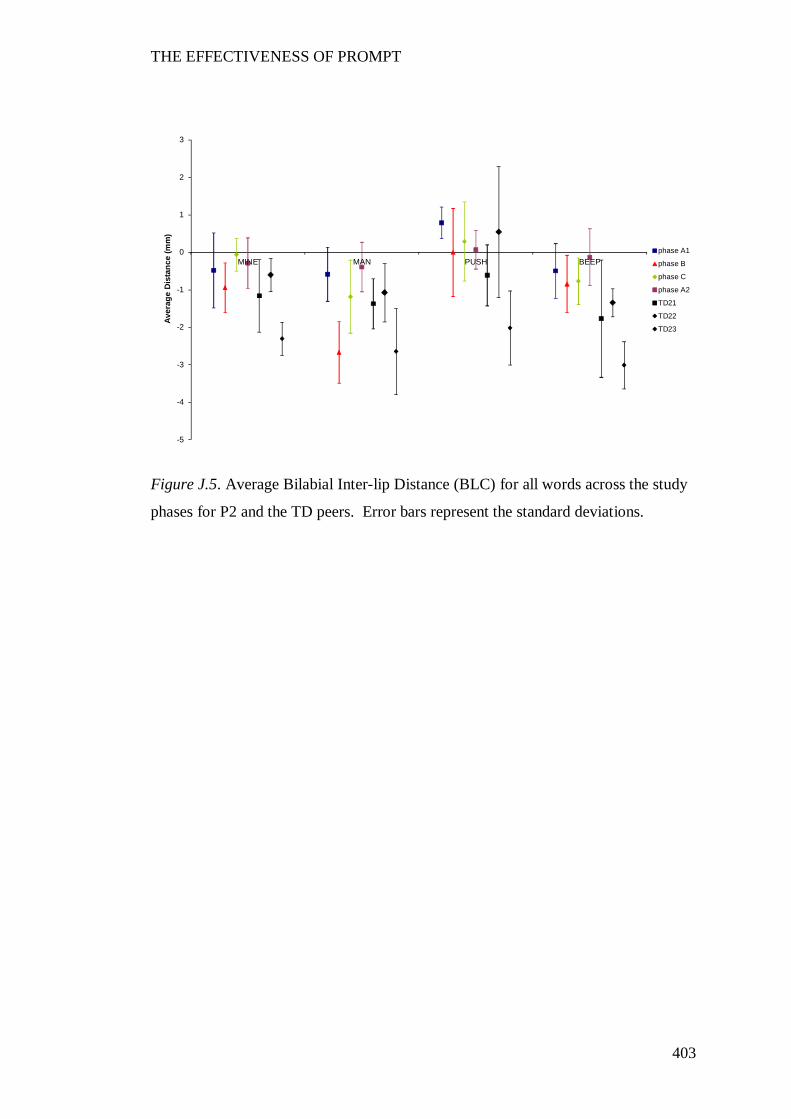
THE EFFECTIVENESS OF PROMPT
403
Figure J.5. Average Bilabial Inter-lip Distance (BLC) for all words across the study
phases for P2 and the TD peers. Error bars represent the standard deviations.
-5
-4
-3
-2
-1
0
1
2
3
MINE MAN PUSH BEEP
Aver
age
Dis
tanc
e (m
m)
phase A1
phase B
phase C
phase A2
TD21
TD22
TD23
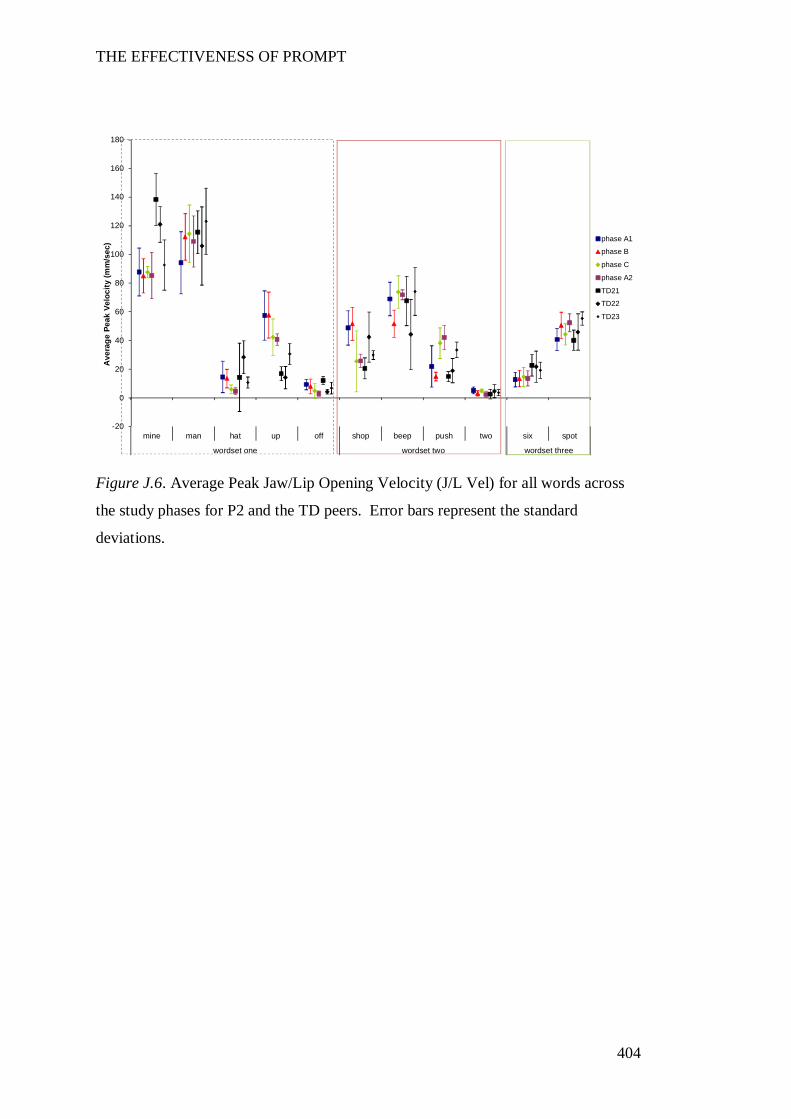
THE EFFECTIVENESS OF PROMPT
404
Figure J.6. Average Peak Jaw/Lip Opening Velocity (J/L Vel) for all words across
the study phases for P2 and the TD peers. Error bars represent the standard
deviations.
-20
0
20
40
60
80
100
120
140
160
180
mine man hat up off shop beep push two six spot
wordset one wordset two wordset three
Ave
rage
Pea
k Ve
loci
ty (m
m/s
ec) phase A1
phase B
phase C
phase A2
TD21
TD22
TD23
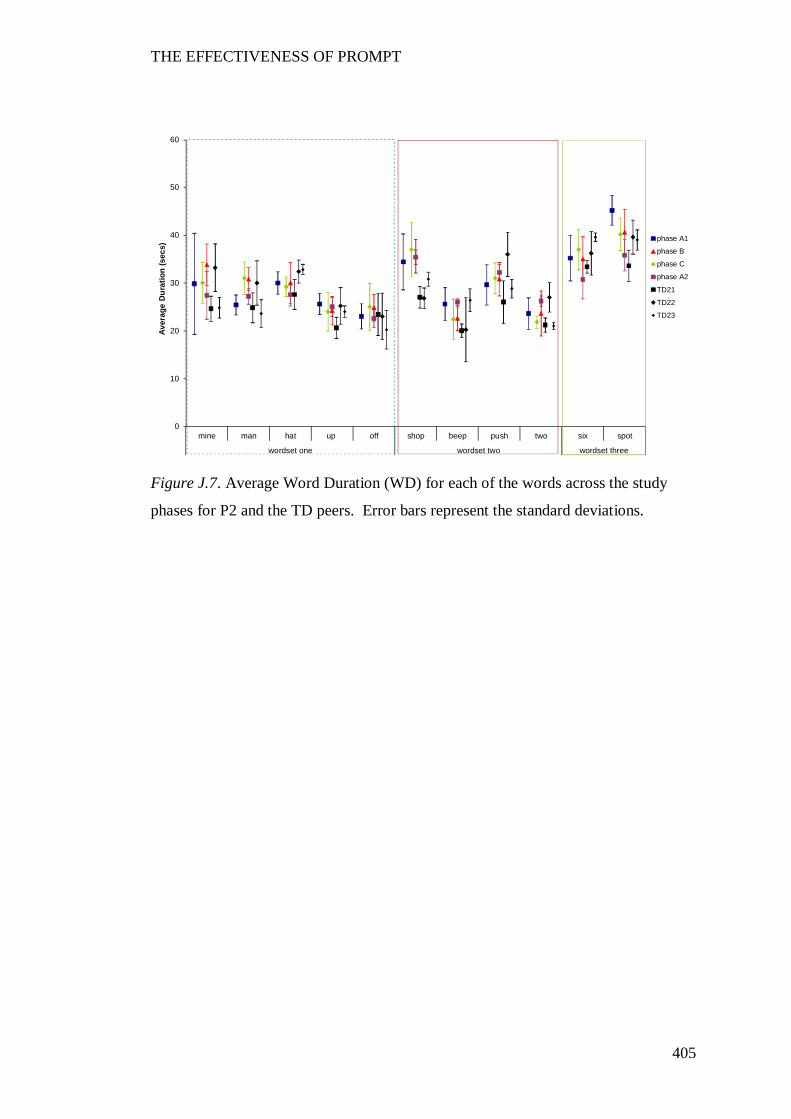
THE EFFECTIVENESS OF PROMPT
405
Figure J.7. Average Word Duration (WD) for each of the words across the study
phases for P2 and the TD peers. Error bars represent the standard deviations.
0
10
20
30
40
50
60
mine man hat up off shop beep push two six spot
wordset one wordset two wordset three
Aver
age
Dur
atio
n (s
ecs)
phase A1
phase B
phase C
phase A2
TD21
TD22
TD23
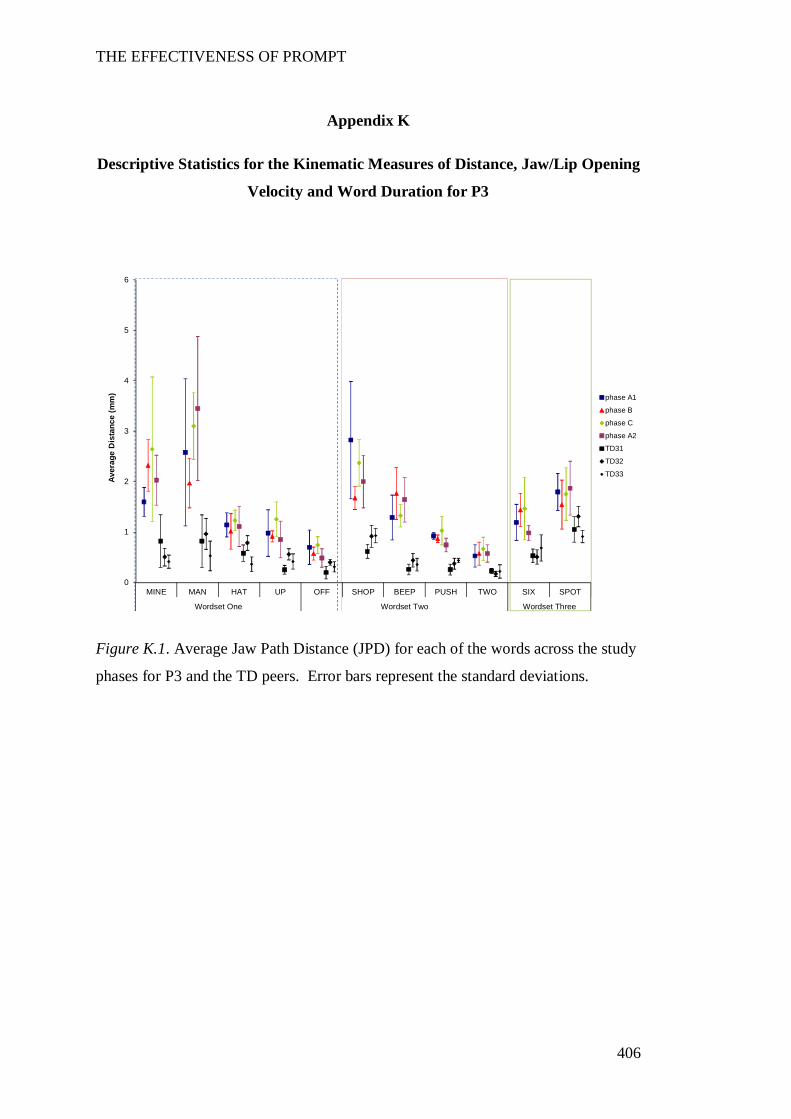
THE EFFECTIVENESS OF PROMPT
406
Appendix K
Descriptive Statistics for the Kinematic Measures of Distance, Jaw/Lip Opening
Velocity and Word Duration for P3
Figure K.1. Average Jaw Path Distance (JPD) for each of the words across the study
phases for P3 and the TD peers. Error bars represent the standard deviations.
0
1
2
3
4
5
6
MINE MAN HAT UP OFF SHOP BEEP PUSH TWO SIX SPOT
Wordset One Wordset Two Wordset Three
Aver
age
Dis
tanc
e (m
m) phase A1
phase B
phase C
phase A2
TD31
TD32
TD33
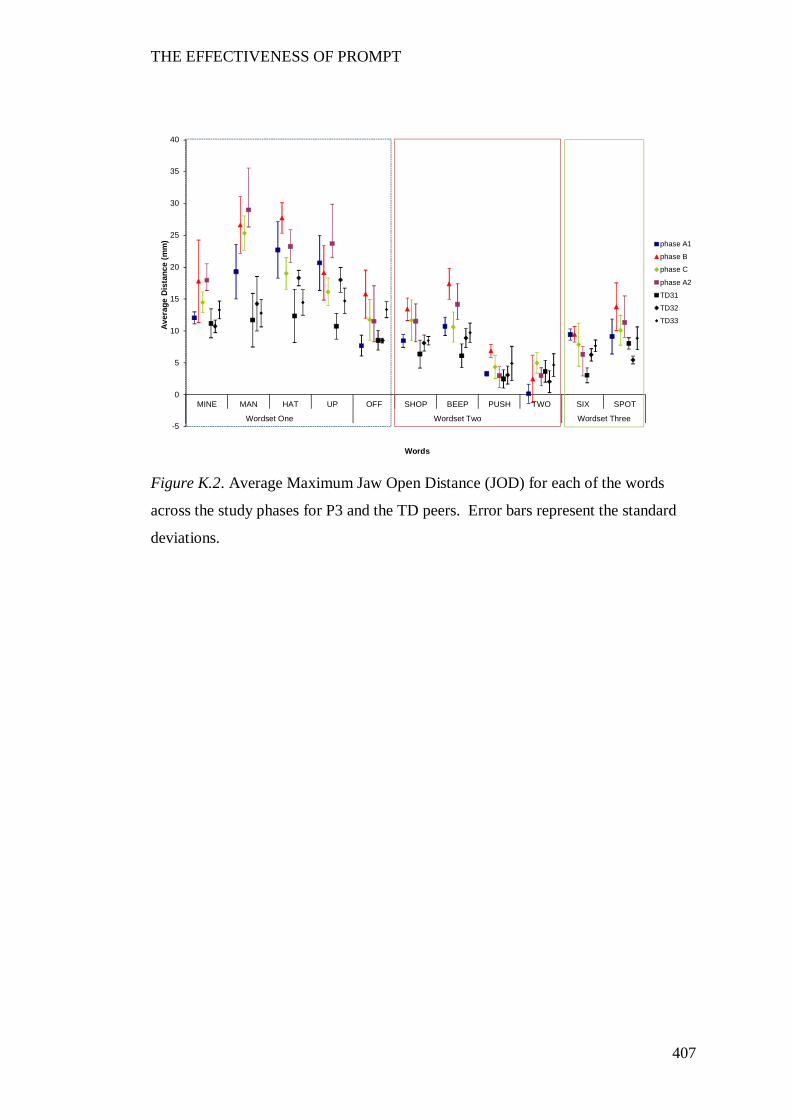
THE EFFECTIVENESS OF PROMPT
407
Figure K.2. Average Maximum Jaw Open Distance (JOD) for each of the words
across the study phases for P3 and the TD peers. Error bars represent the standard
deviations.
-5
0
5
10
15
20
25
30
35
40
MINE MAN HAT UP OFF SHOP BEEP PUSH TWO SIX SPOT
Wordset One Wordset Two Wordset Three
Aver
age
Dis
tanc
e (m
m)
Words
phase A1
phase B
phase C
phase A2
TD31
TD32
TD33
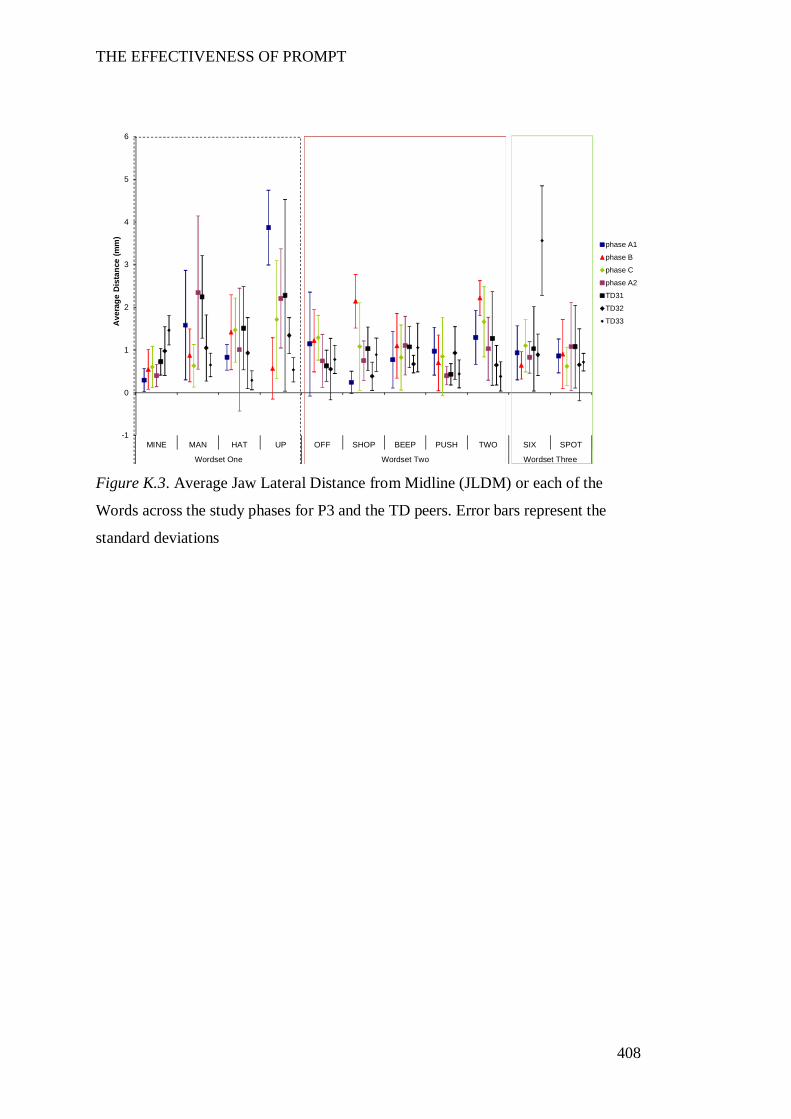
THE EFFECTIVENESS OF PROMPT
408
Figure K.3. Average Jaw Lateral Distance from Midline (JLDM) or each of the
Words across the study phases for P3 and the TD peers. Error bars represent the
standard deviations
-1
0
1
2
3
4
5
6
MINE MAN HAT UP OFF SHOP BEEP PUSH TWO SIX SPOT
Wordset One Wordset Two Wordset Three
Ave
rage
Dis
tanc
e (m
m)
phase A1
phase B
phase C
phase A2
TD31
TD32
TD33
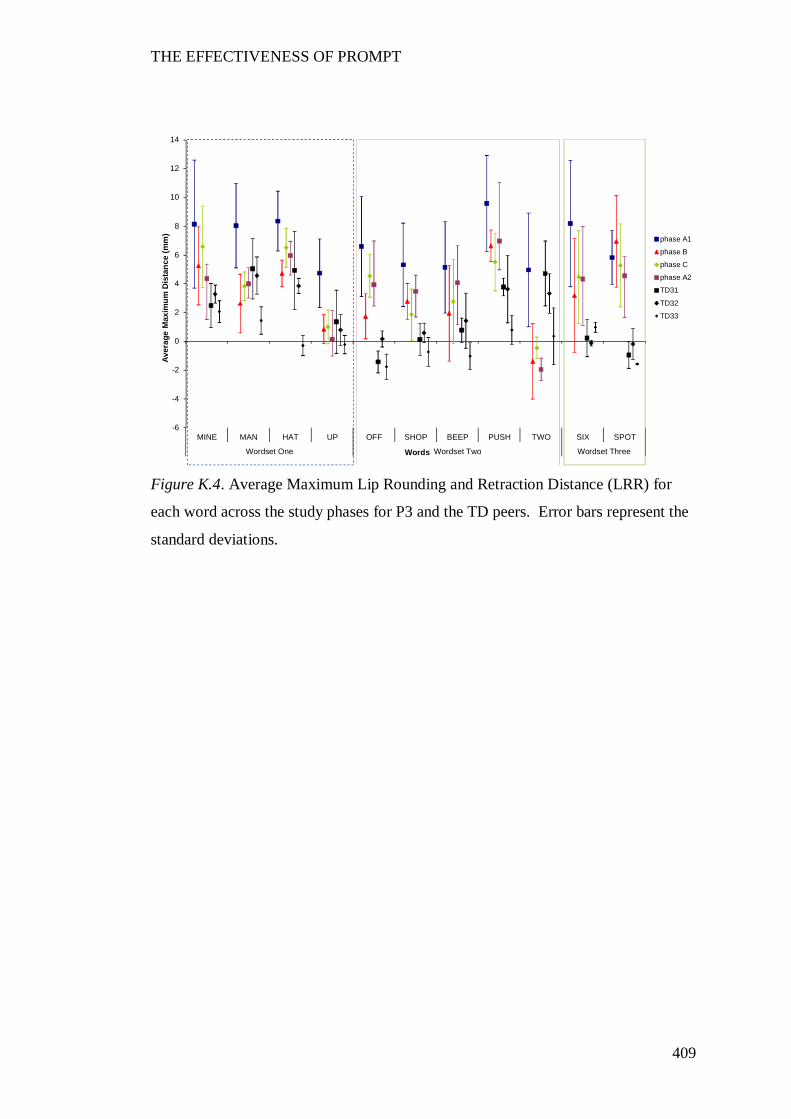
THE EFFECTIVENESS OF PROMPT
409
Figure K.4. Average Maximum Lip Rounding and Retraction Distance (LRR) for
each word across the study phases for P3 and the TD peers. Error bars represent the
standard deviations.
-6
-4
-2
0
2
4
6
8
10
12
14
MINE MAN HAT UP OFF SHOP BEEP PUSH TWO SIX SPOT
Wordset One Wordset Two Wordset Three
Aver
age
Max
imum
Dis
tanc
e (m
m)
Words
phase A1
phase B
phase C
phase A2
TD31
TD32
TD33
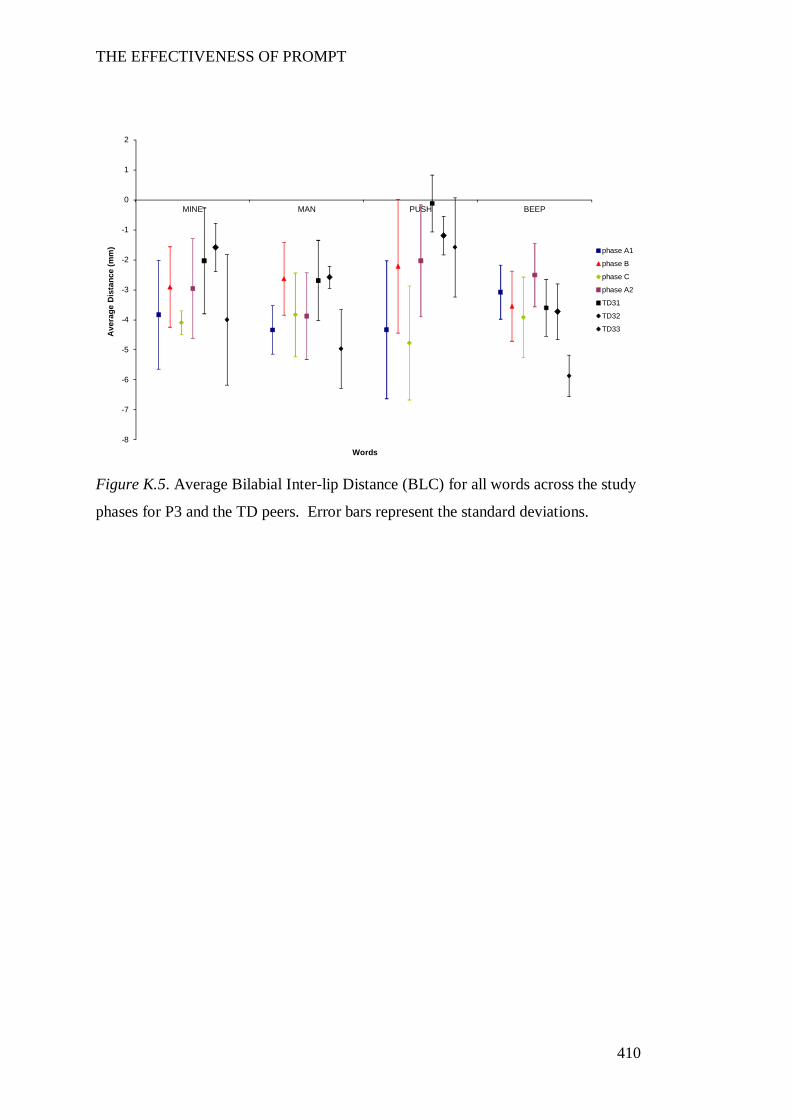
THE EFFECTIVENESS OF PROMPT
410
Figure K.5. Average Bilabial Inter-lip Distance (BLC) for all words across the study
phases for P3 and the TD peers. Error bars represent the standard deviations.
-8
-7
-6
-5
-4
-3
-2
-1
0
1
2
MINE MAN PUSH BEEP
Ave
rage
Dis
tanc
e (m
m)
Words
phase A1
phase B
phase C
phase A2
TD31
TD32
TD33
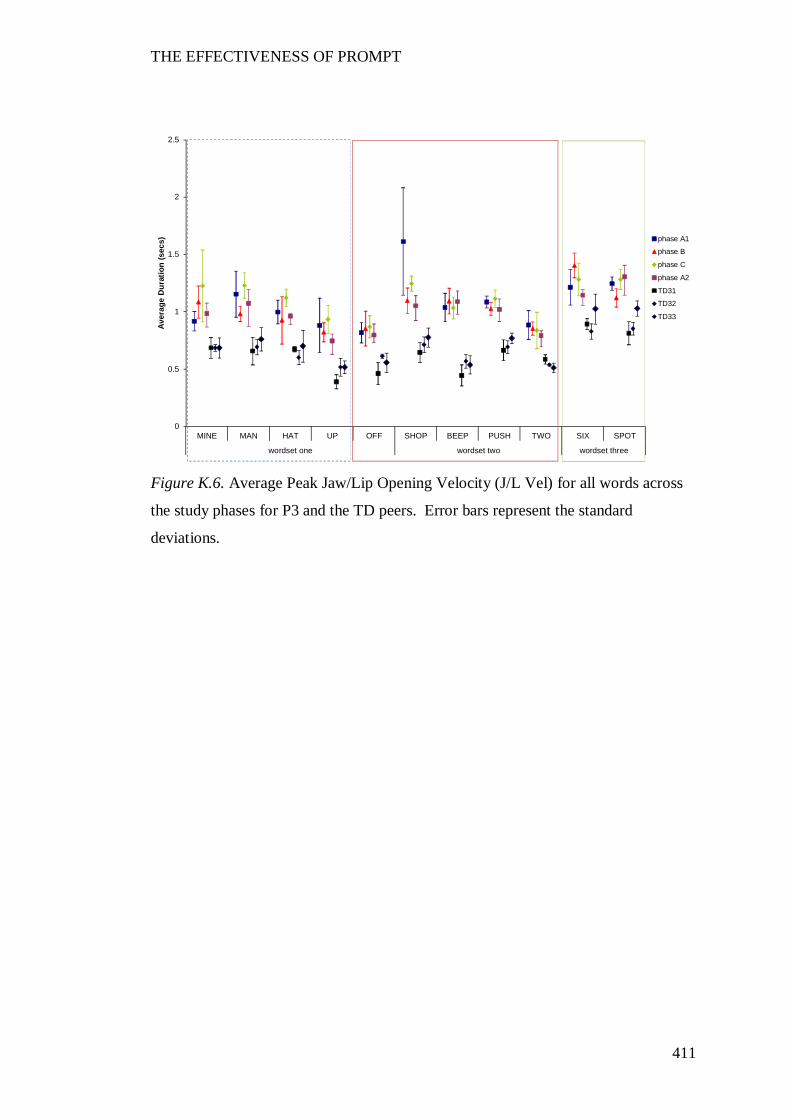
THE EFFECTIVENESS OF PROMPT
411
Figure K.6. Average Peak Jaw/Lip Opening Velocity (J/L Vel) for all words across
the study phases for P3 and the TD peers. Error bars represent the standard
deviations.
0
0.5
1
1.5
2
2.5
MINE MAN HAT UP OFF SHOP BEEP PUSH TWO SIX SPOT
wordset one wordset two wordset three
Aver
age
Dur
atio
n (s
ecs) phase A1
phase B
phase C
phase A2
TD31
TD32
TD33
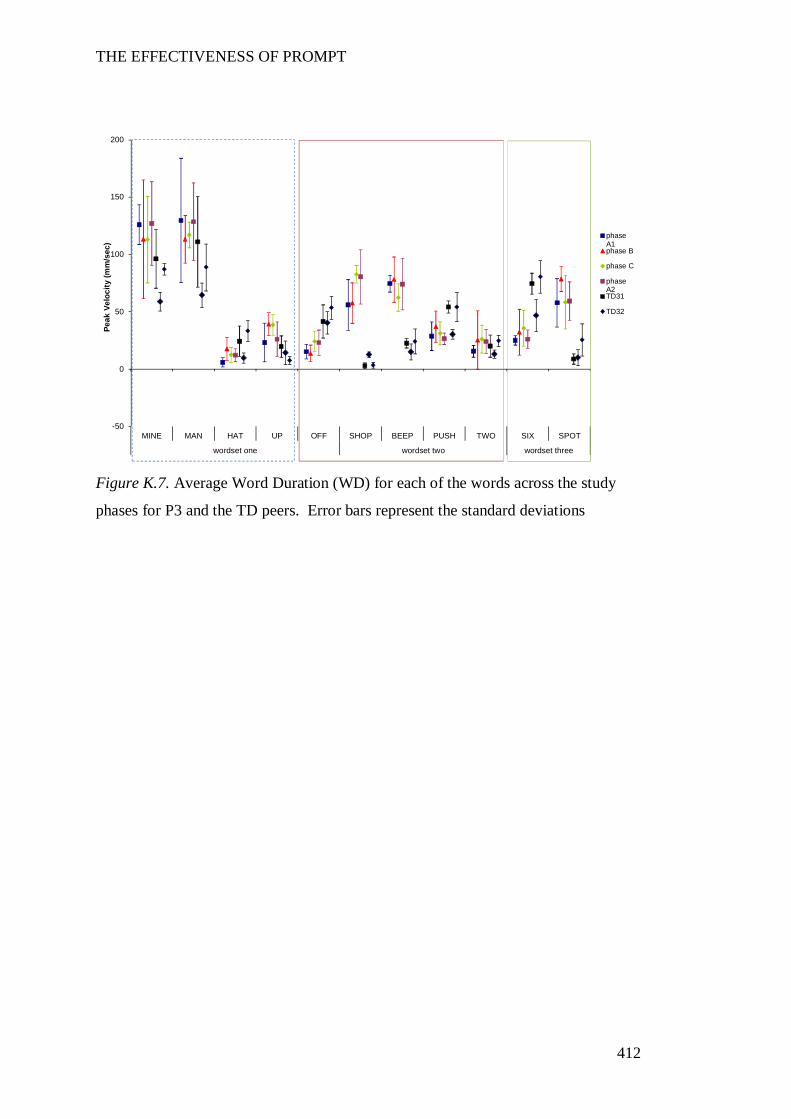
THE EFFECTIVENESS OF PROMPT
412
Figure K.7. Average Word Duration (WD) for each of the words across the study
phases for P3 and the TD peers. Error bars represent the standard deviations
-50
0
50
100
150
200
MINE MAN HAT UP OFF SHOP BEEP PUSH TWO SIX SPOT
wordset one wordset two wordset three
Peak
Vel
ocity
(mm
/sec
)
phaseA1phase B
phase C
phaseA2TD31
TD32
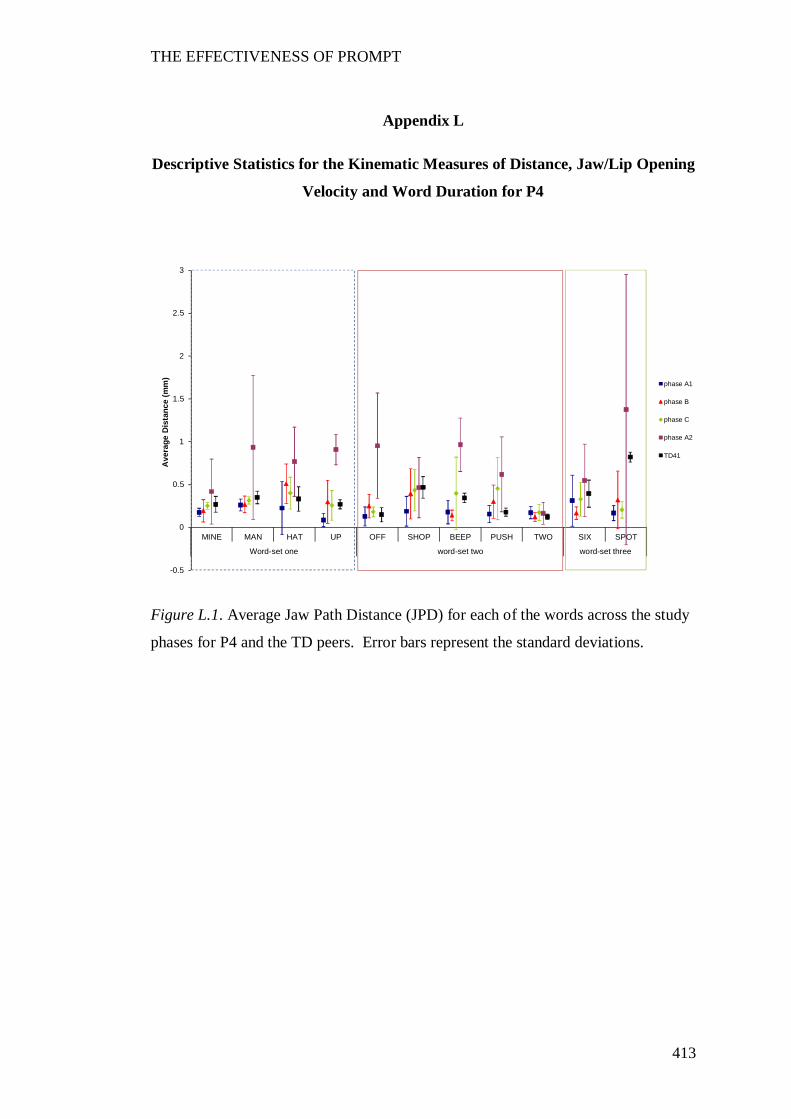
THE EFFECTIVENESS OF PROMPT
413
Appendix L
Descriptive Statistics for the Kinematic Measures of Distance, Jaw/Lip Opening
Velocity and Word Duration for P4
Figure L.1. Average Jaw Path Distance (JPD) for each of the words across the study
phases for P4 and the TD peers. Error bars represent the standard deviations.
-0.5
0
0.5
1
1.5
2
2.5
3
MINE MAN HAT UP OFF SHOP BEEP PUSH TWO SIX SPOT
Word-set one word-set two word-set three
Ave
rage
Dis
tanc
e (m
m)
phase A1
phase B
phase C
phase A2
TD41
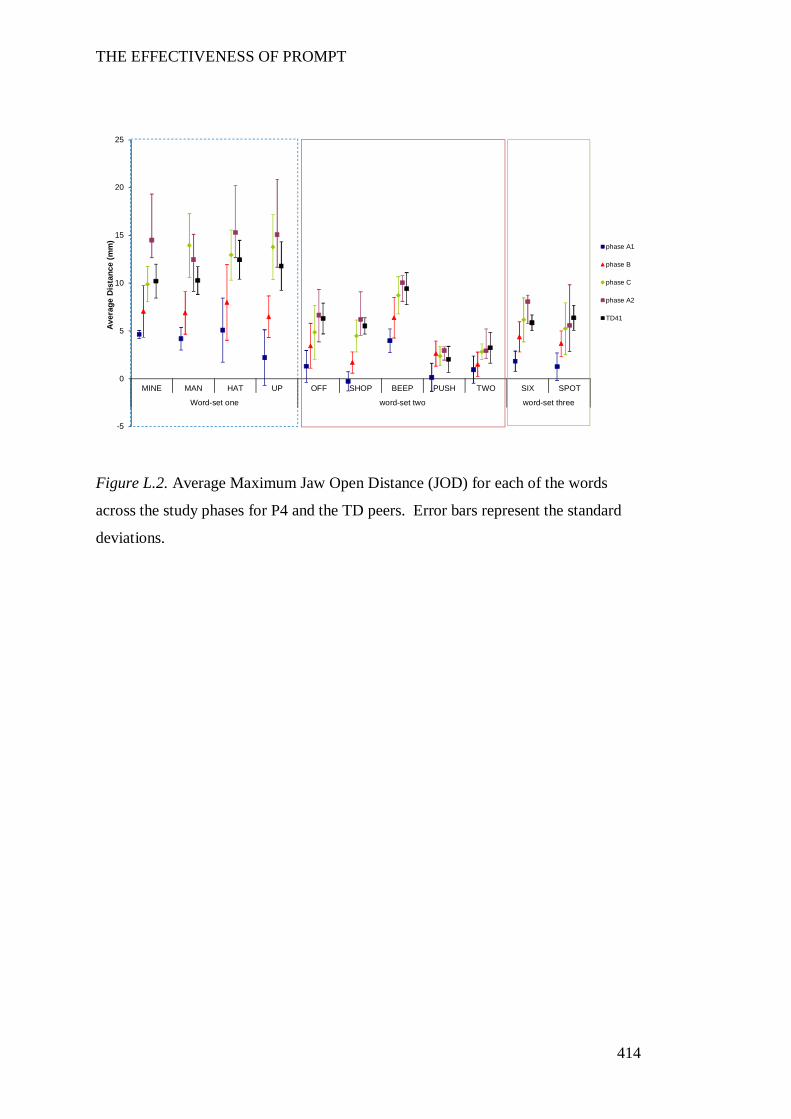
THE EFFECTIVENESS OF PROMPT
414
Figure L.2. Average Maximum Jaw Open Distance (JOD) for each of the words
across the study phases for P4 and the TD peers. Error bars represent the standard
deviations.
-5
0
5
10
15
20
25
MINE MAN HAT UP OFF SHOP BEEP PUSH TWO SIX SPOT
Word-set one word-set two word-set three
Aver
age
Dis
tanc
e (m
m)
phase A1
phase B
phase C
phase A2
TD41
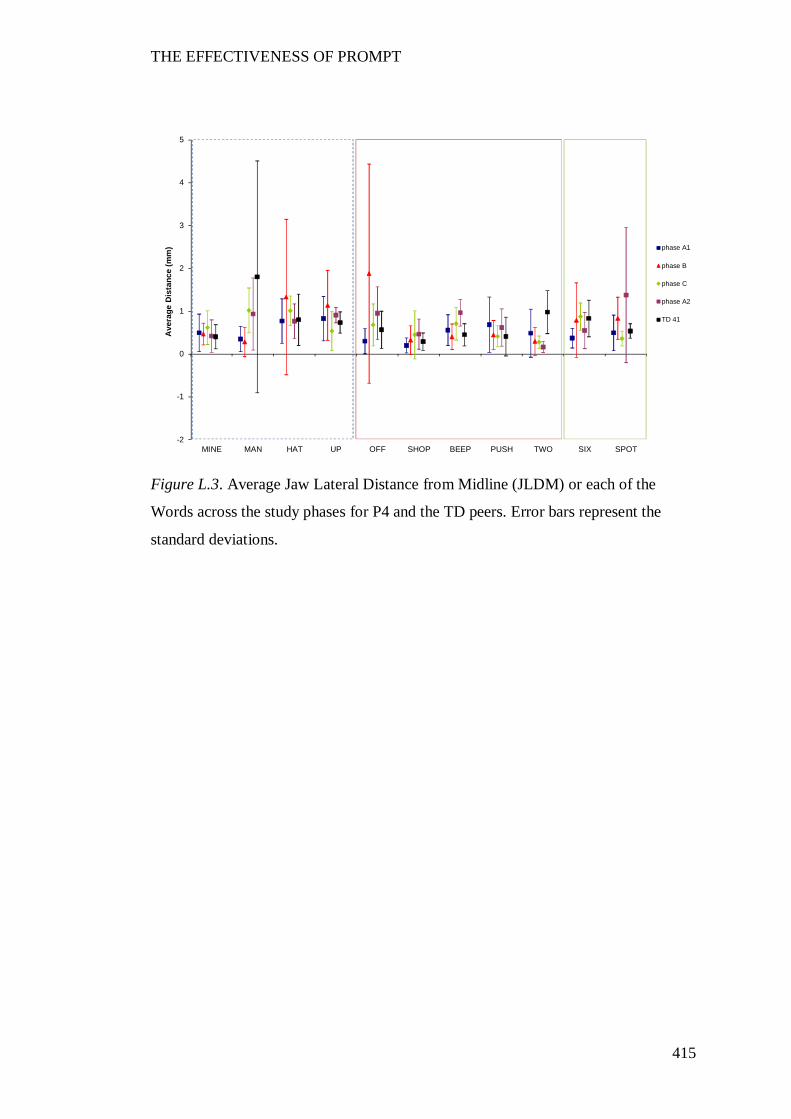
THE EFFECTIVENESS OF PROMPT
415
Figure L.3. Average Jaw Lateral Distance from Midline (JLDM) or each of the
Words across the study phases for P4 and the TD peers. Error bars represent the
standard deviations.
-2
-1
0
1
2
3
4
5
MINE MAN HAT UP OFF SHOP BEEP PUSH TWO SIX SPOT
Ave
rage
Dis
tanc
e (m
m) phase A1
phase B
phase C
phase A2
TD 41
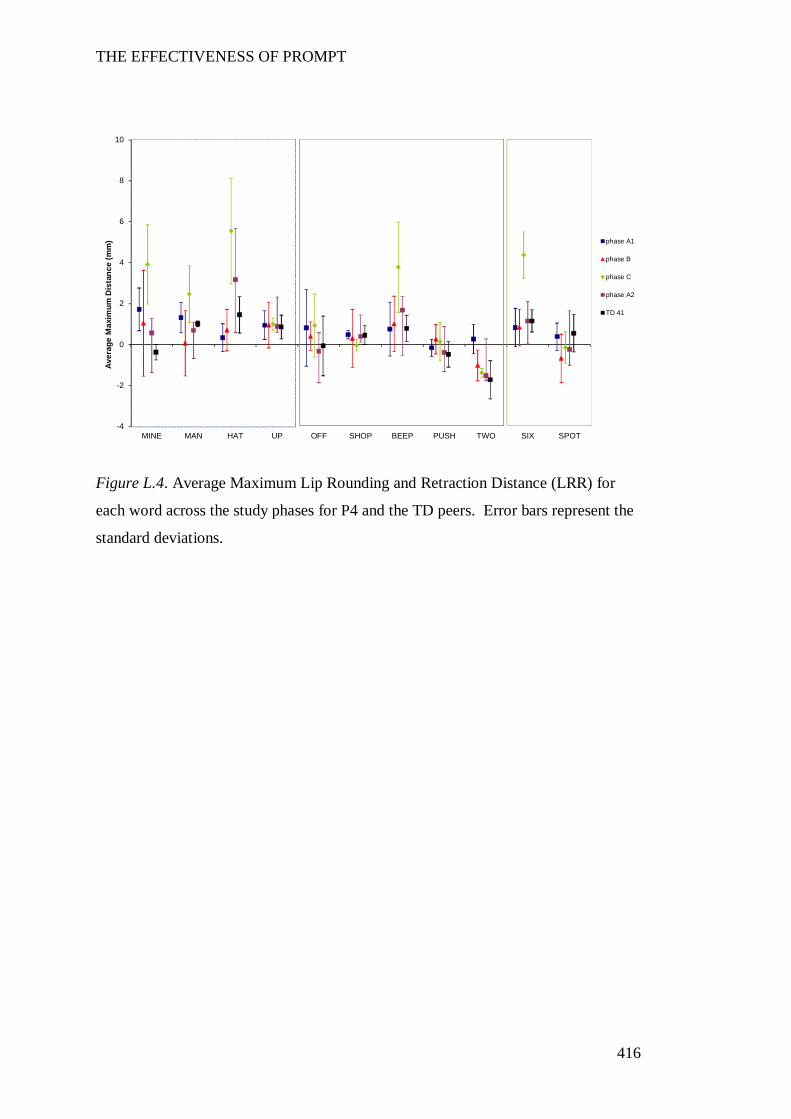
THE EFFECTIVENESS OF PROMPT
416
Figure L.4. Average Maximum Lip Rounding and Retraction Distance (LRR) for
each word across the study phases for P4 and the TD peers. Error bars represent the
standard deviations.
-4
-2
0
2
4
6
8
10
MINE MAN HAT UP OFF SHOP BEEP PUSH TWO SIX SPOT
Aver
age
Max
imum
Dis
tanc
e (m
m) phase A1
phase B
phase C
phase A2
TD 41
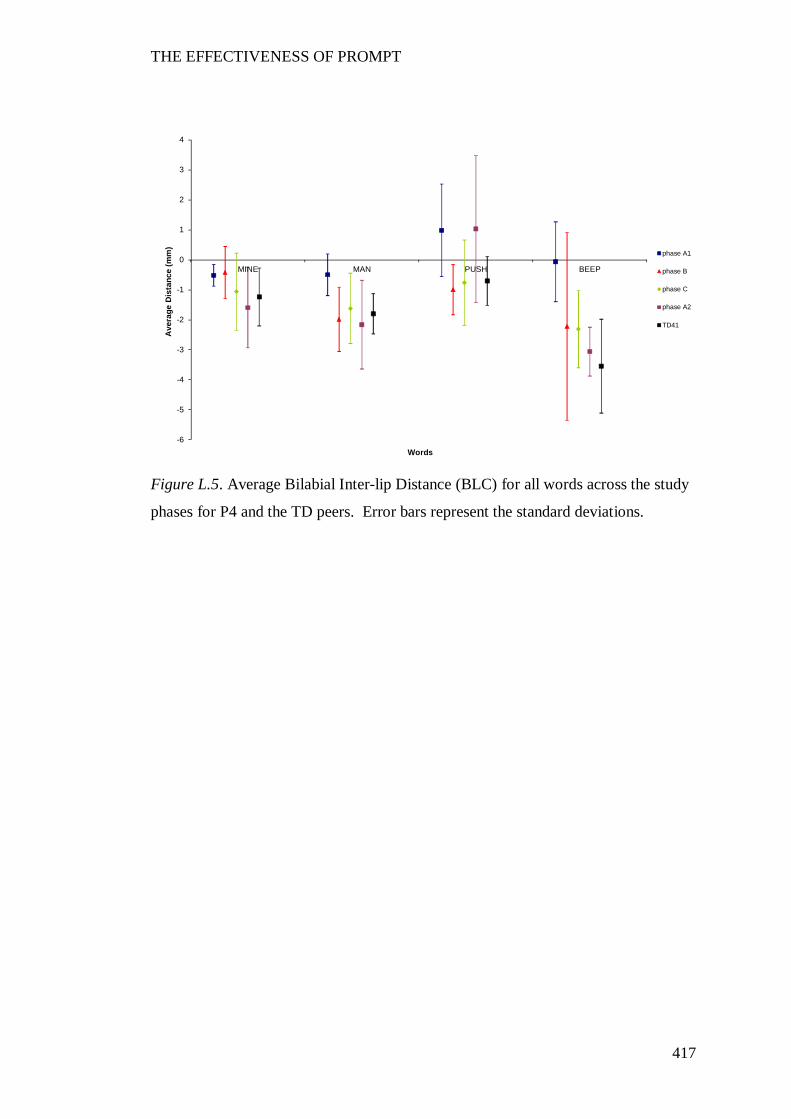
THE EFFECTIVENESS OF PROMPT
417
Figure L.5. Average Bilabial Inter-lip Distance (BLC) for all words across the study
phases for P4 and the TD peers. Error bars represent the standard deviations.
-6
-5
-4
-3
-2
-1
0
1
2
3
4
MINE MAN PUSH BEEP
Ave
rage
Dis
tanc
e (m
m)
Words
phase A1
phase B
phase C
phase A2
TD41
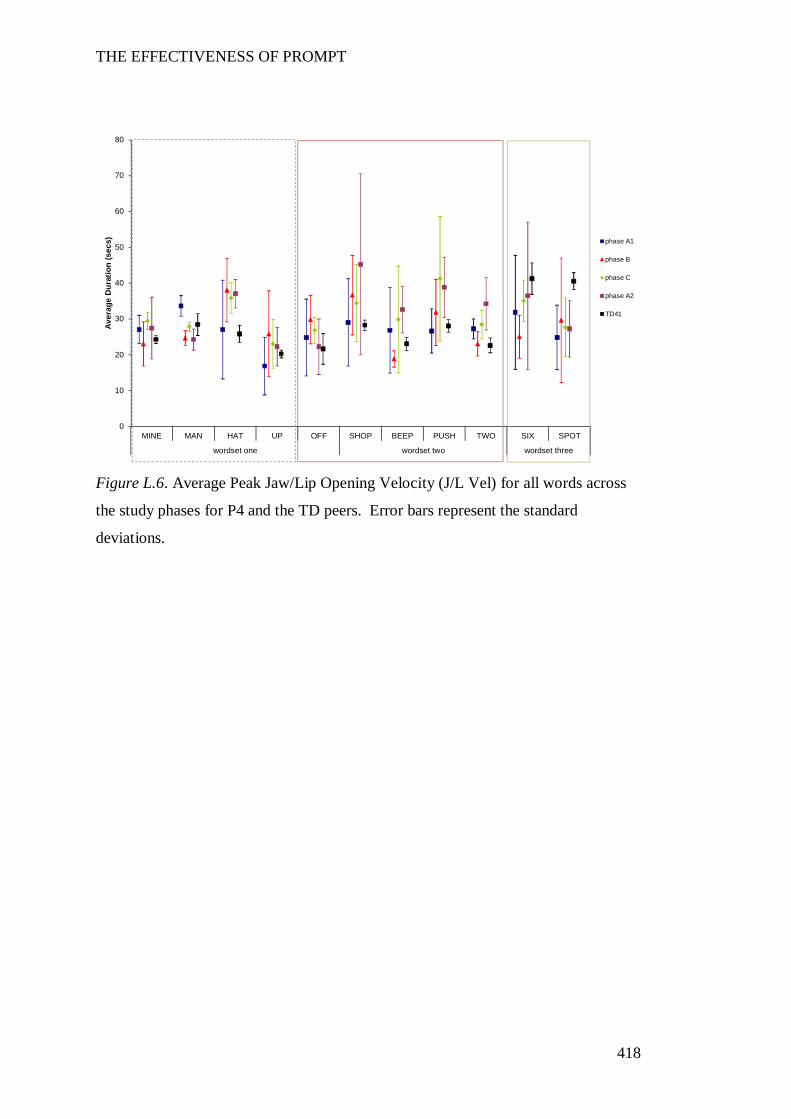
THE EFFECTIVENESS OF PROMPT
418
Figure L.6. Average Peak Jaw/Lip Opening Velocity (J/L Vel) for all words across
the study phases for P4 and the TD peers. Error bars represent the standard
deviations.
0
10
20
30
40
50
60
70
80
MINE MAN HAT UP OFF SHOP BEEP PUSH TWO SIX SPOT
wordset one wordset two wordset three
Aver
age
Dur
atio
n (s
ecs) phase A1
phase B
phase C
phase A2
TD41
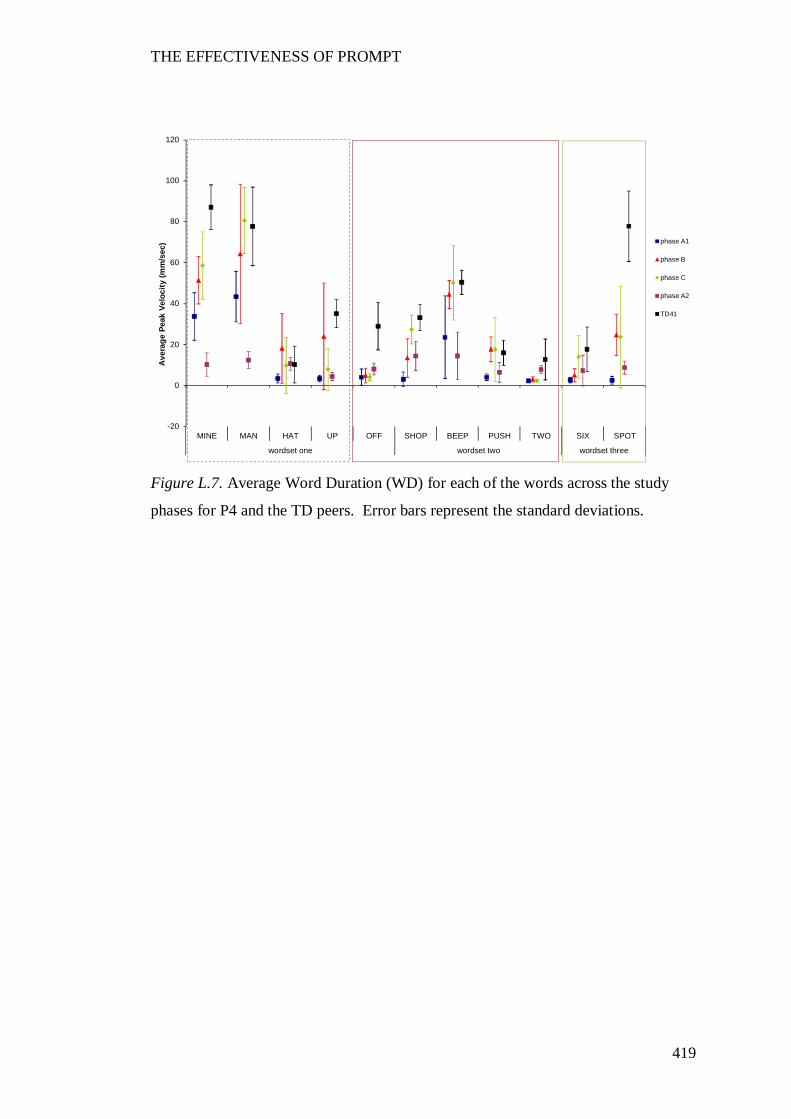
THE EFFECTIVENESS OF PROMPT
419
Figure L.7. Average Word Duration (WD) for each of the words across the study
phases for P4 and the TD peers. Error bars represent the standard deviations.
-20
0
20
40
60
80
100
120
MINE MAN HAT UP OFF SHOP BEEP PUSH TWO SIX SPOT
wordset one wordset two wordset three
Ave
rage
Pea
k Ve
loci
ty (m
m/s
ec) phase A1
phase B
phase C
phase A2
TD41
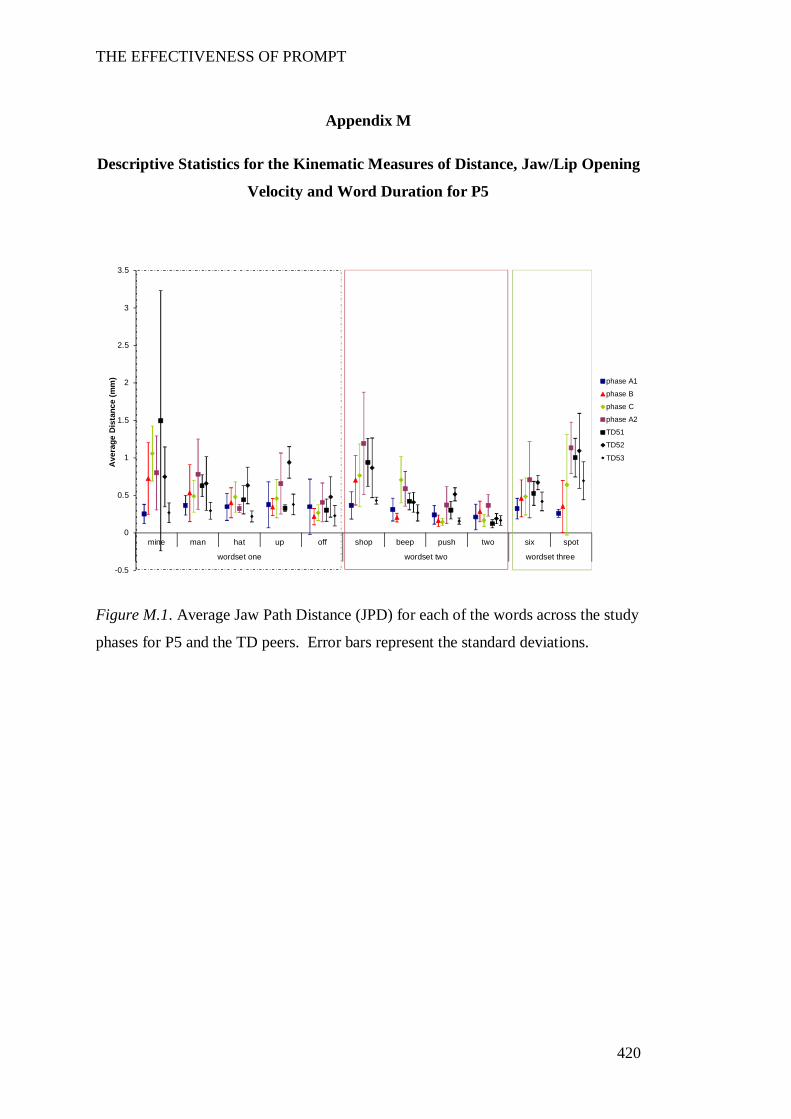
THE EFFECTIVENESS OF PROMPT
420
Appendix M
Descriptive Statistics for the Kinematic Measures of Distance, Jaw/Lip Opening
Velocity and Word Duration for P5
Figure M.1. Average Jaw Path Distance (JPD) for each of the words across the study
phases for P5 and the TD peers. Error bars represent the standard deviations.
-0.5
0
0.5
1
1.5
2
2.5
3
3.5
mine man hat up off shop beep push two six spot
wordset one wordset two wordset three
Ave
rage
Dis
tanc
e (m
m) phase A1
phase B
phase C
phase A2
TD51
TD52
TD53
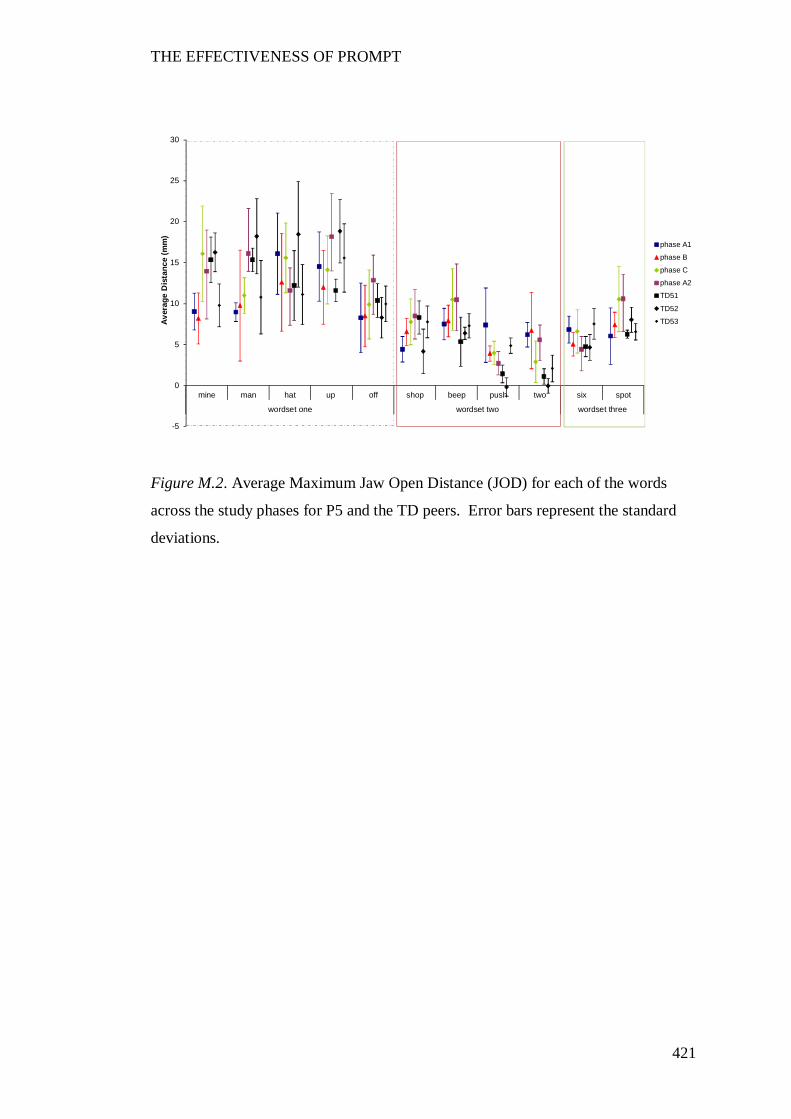
THE EFFECTIVENESS OF PROMPT
421
Figure M.2. Average Maximum Jaw Open Distance (JOD) for each of the words
across the study phases for P5 and the TD peers. Error bars represent the standard
deviations.
-5
0
5
10
15
20
25
30
mine man hat up off shop beep push two six spot
wordset one wordset two wordset three
Aver
age
Dis
tanc
e (m
m)
phase A1
phase B
phase C
phase A2
TD51
TD52
TD53
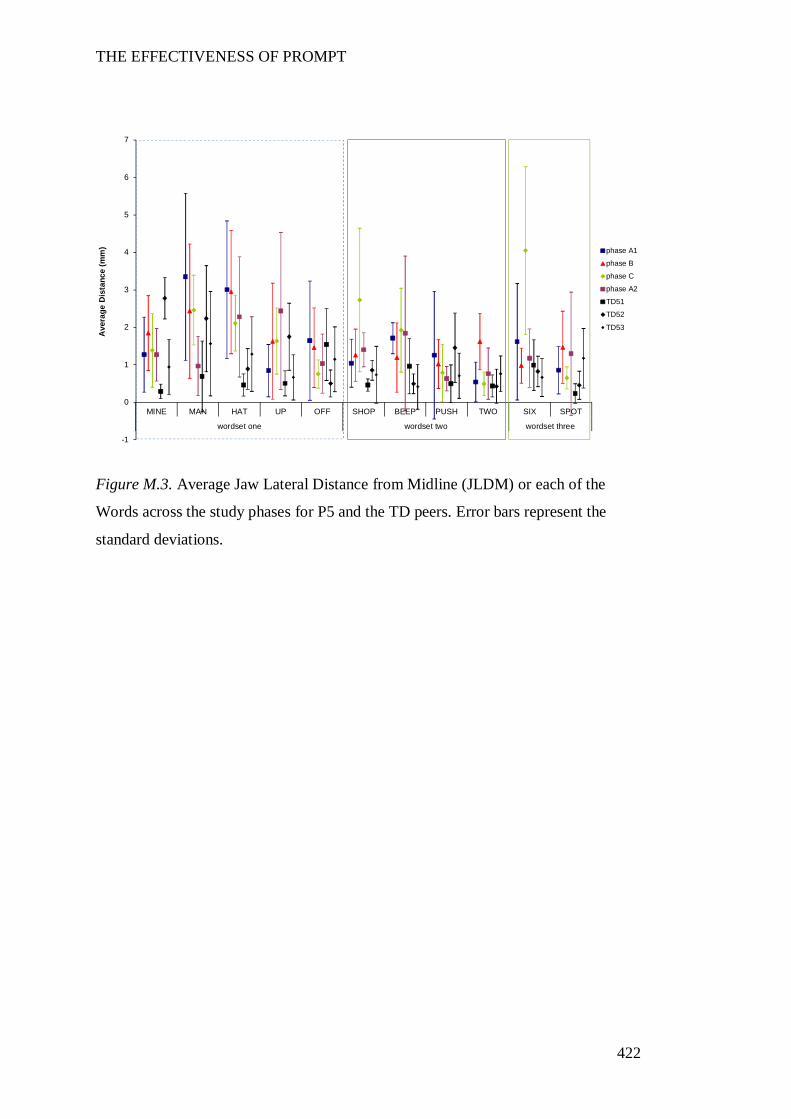
THE EFFECTIVENESS OF PROMPT
422
Figure M.3. Average Jaw Lateral Distance from Midline (JLDM) or each of the
Words across the study phases for P5 and the TD peers. Error bars represent the
standard deviations.
-1
0
1
2
3
4
5
6
7
MINE MAN HAT UP OFF SHOP BEEP PUSH TWO SIX SPOT
wordset one wordset two wordset three
Ave
rage
Dis
tanc
e (m
m) phase A1
phase B
phase C
phase A2
TD51
TD52
TD53
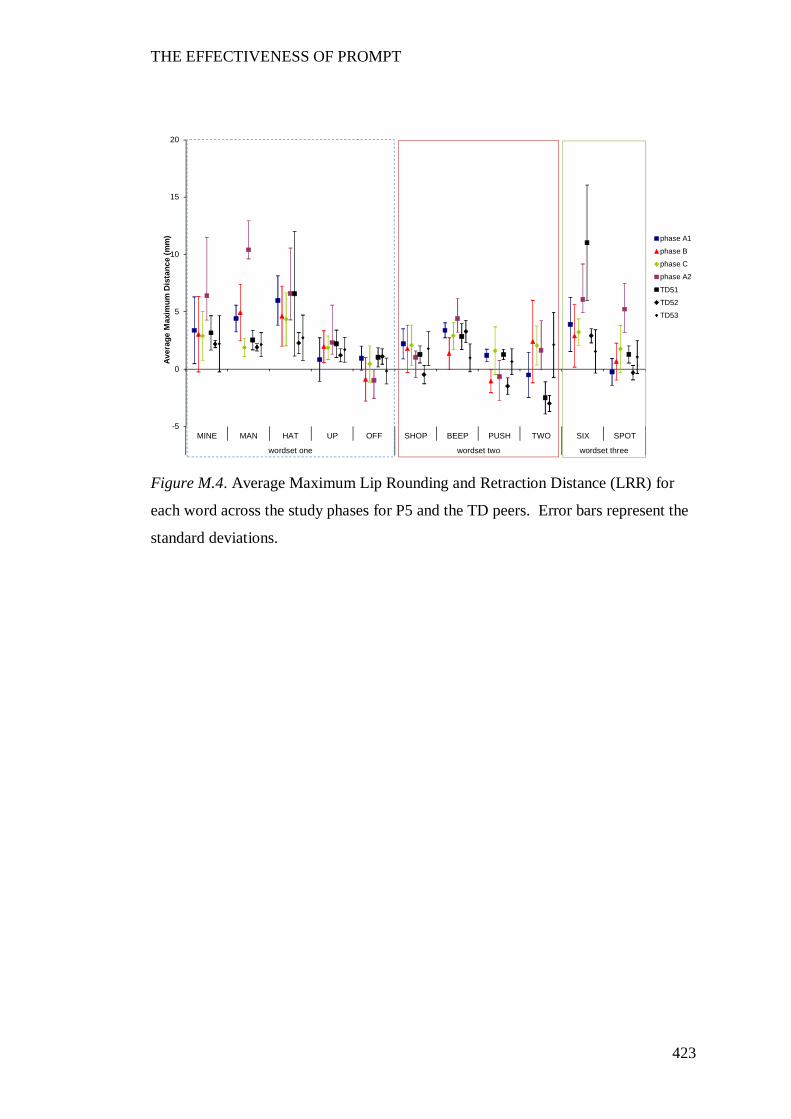
THE EFFECTIVENESS OF PROMPT
423
Figure M.4. Average Maximum Lip Rounding and Retraction Distance (LRR) for
each word across the study phases for P5 and the TD peers. Error bars represent the
standard deviations.
-5
0
5
10
15
20
MINE MAN HAT UP OFF SHOP BEEP PUSH TWO SIX SPOT
wordset one wordset two wordset three
Aver
age
Max
imum
Dis
tanc
e (m
m) phase A1
phase B
phase C
phase A2
TD51
TD52
TD53
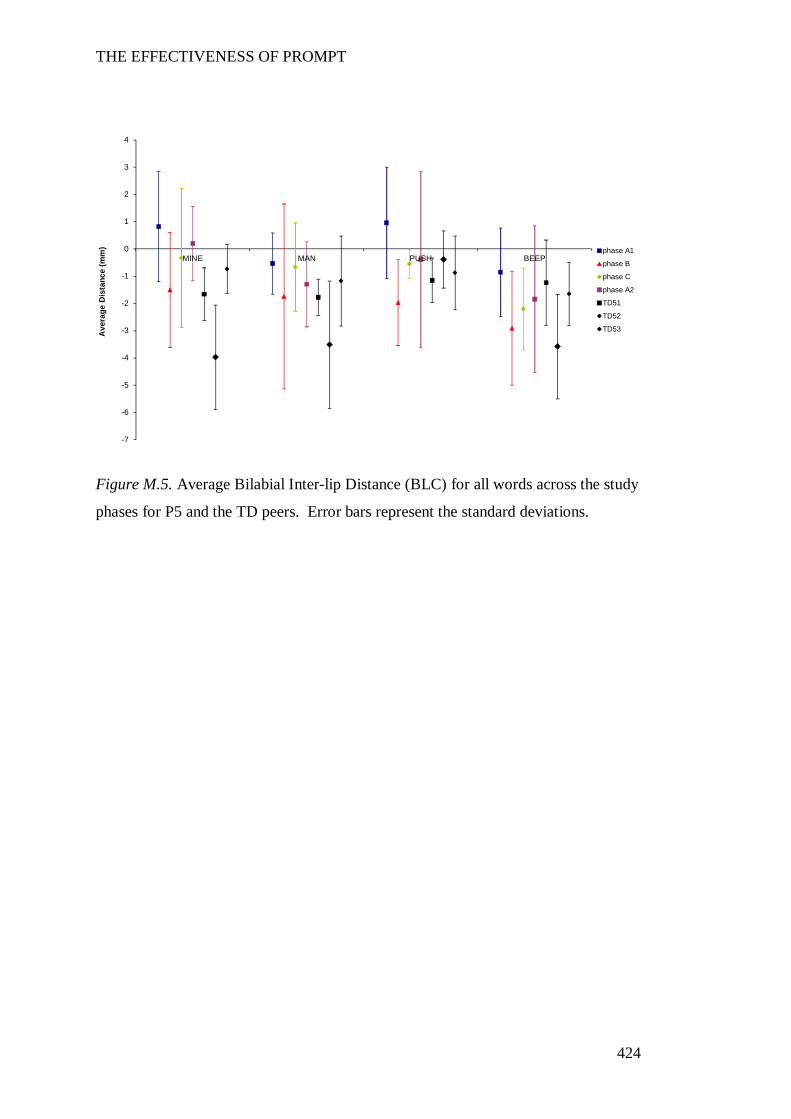
THE EFFECTIVENESS OF PROMPT
424
Figure M.5. Average Bilabial Inter-lip Distance (BLC) for all words across the study
phases for P5 and the TD peers. Error bars represent the standard deviations.
-7
-6
-5
-4
-3
-2
-1
0
1
2
3
4
MINE MAN PUSH BEEP
Ave
rage
Dis
tanc
e (m
m) phase A1
phase B
phase C
phase A2
TD51
TD52
TD53
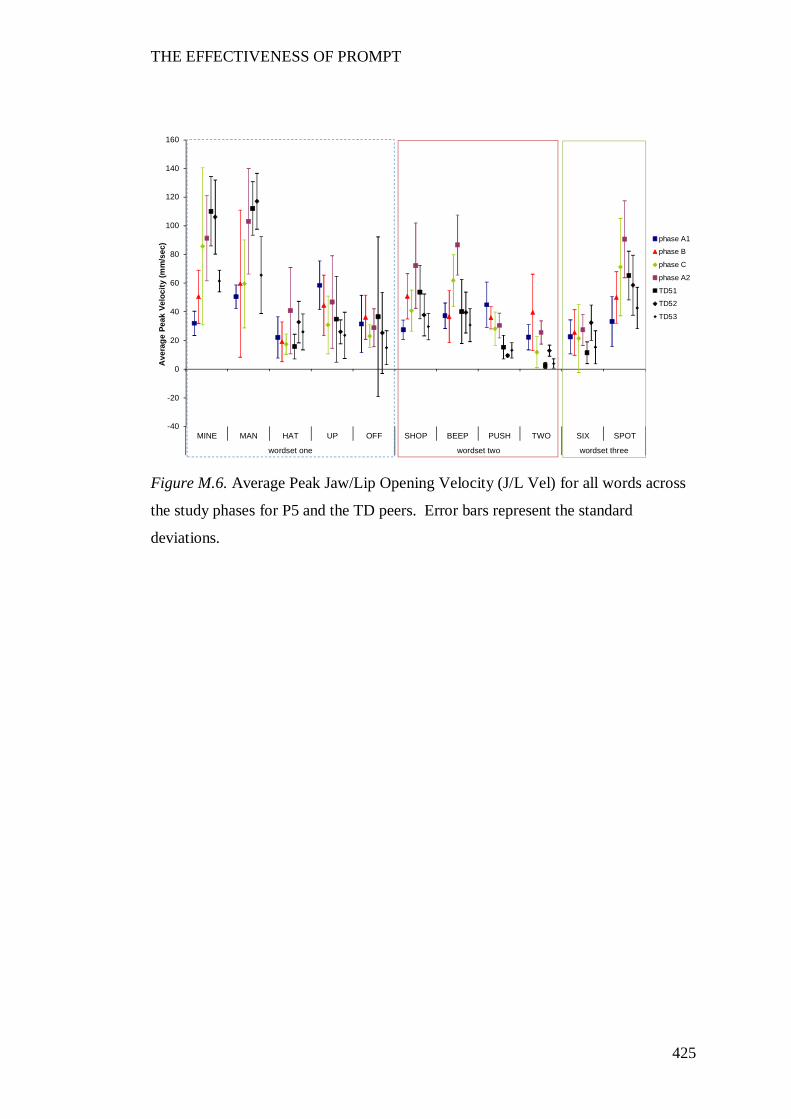
THE EFFECTIVENESS OF PROMPT
425
Figure M.6. Average Peak Jaw/Lip Opening Velocity (J/L Vel) for all words across
the study phases for P5 and the TD peers. Error bars represent the standard
deviations.
-40
-20
0
20
40
60
80
100
120
140
160
MINE MAN HAT UP OFF SHOP BEEP PUSH TWO SIX SPOT
wordset one wordset two wordset three
Ave
rage
Pea
k Ve
loci
ty (m
m/s
ec) phase A1
phase B
phase C
phase A2
TD51
TD52
TD53
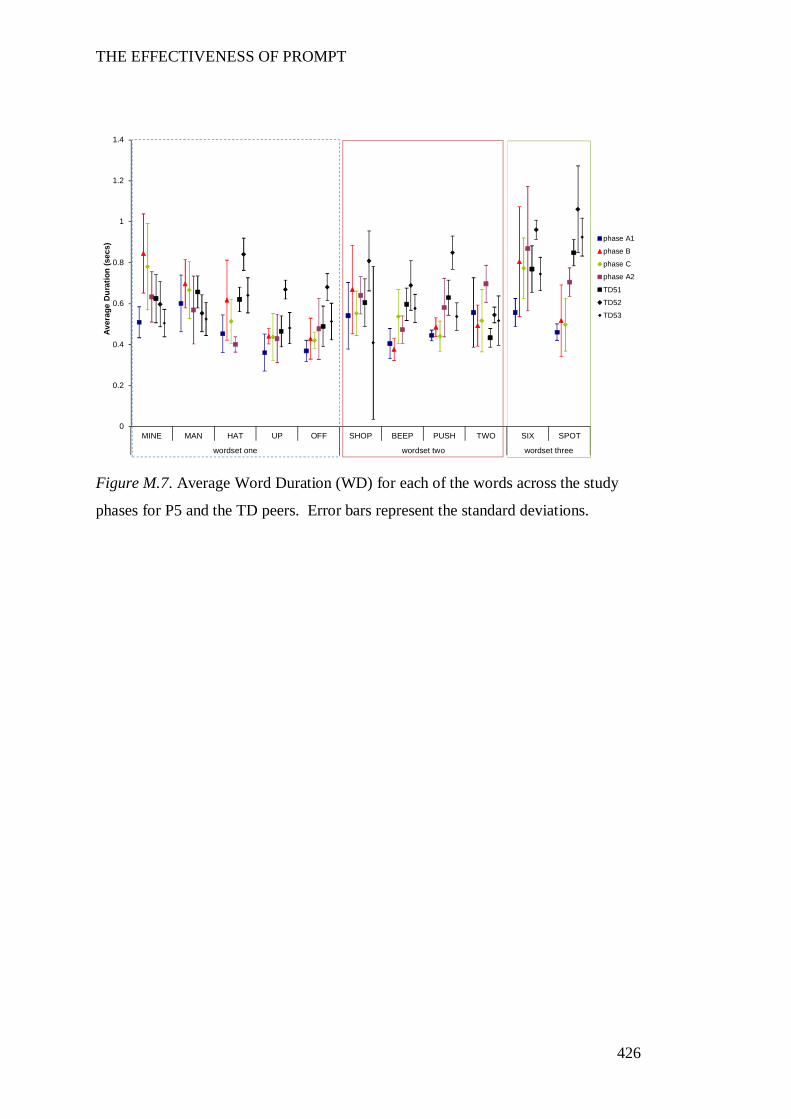
THE EFFECTIVENESS OF PROMPT
426
Figure M.7. Average Word Duration (WD) for each of the words across the study
phases for P5 and the TD peers. Error bars represent the standard deviations.
0
0.2
0.4
0.6
0.8
1
1.2
1.4
MINE MAN HAT UP OFF SHOP BEEP PUSH TWO SIX SPOT
wordset one wordset two wordset three
Aver
age
Dur
atio
n (s
ecs)
phase A1
phase B
phase C
phase A2
TD51
TD52
TD53
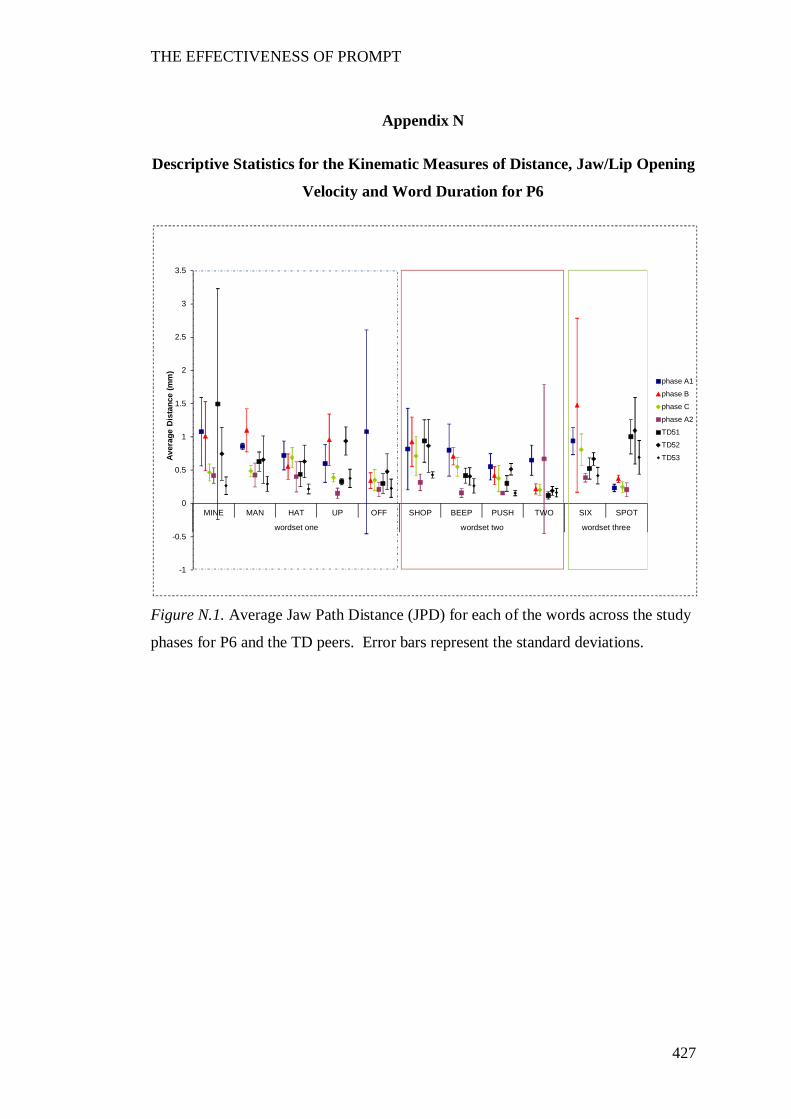
THE EFFECTIVENESS OF PROMPT
427
Appendix N
Descriptive Statistics for the Kinematic Measures of Distance, Jaw/Lip Opening
Velocity and Word Duration for P6
Figure N.1. Average Jaw Path Distance (JPD) for each of the words across the study
phases for P6 and the TD peers. Error bars represent the standard deviations.
-1
-0.5
0
0.5
1
1.5
2
2.5
3
3.5
MINE MAN HAT UP OFF SHOP BEEP PUSH TWO SIX SPOT
wordset one wordset two wordset three
Aver
age
Dis
tanc
e (m
m)
phase A1
phase B
phase C
phase A2
TD51
TD52
TD53
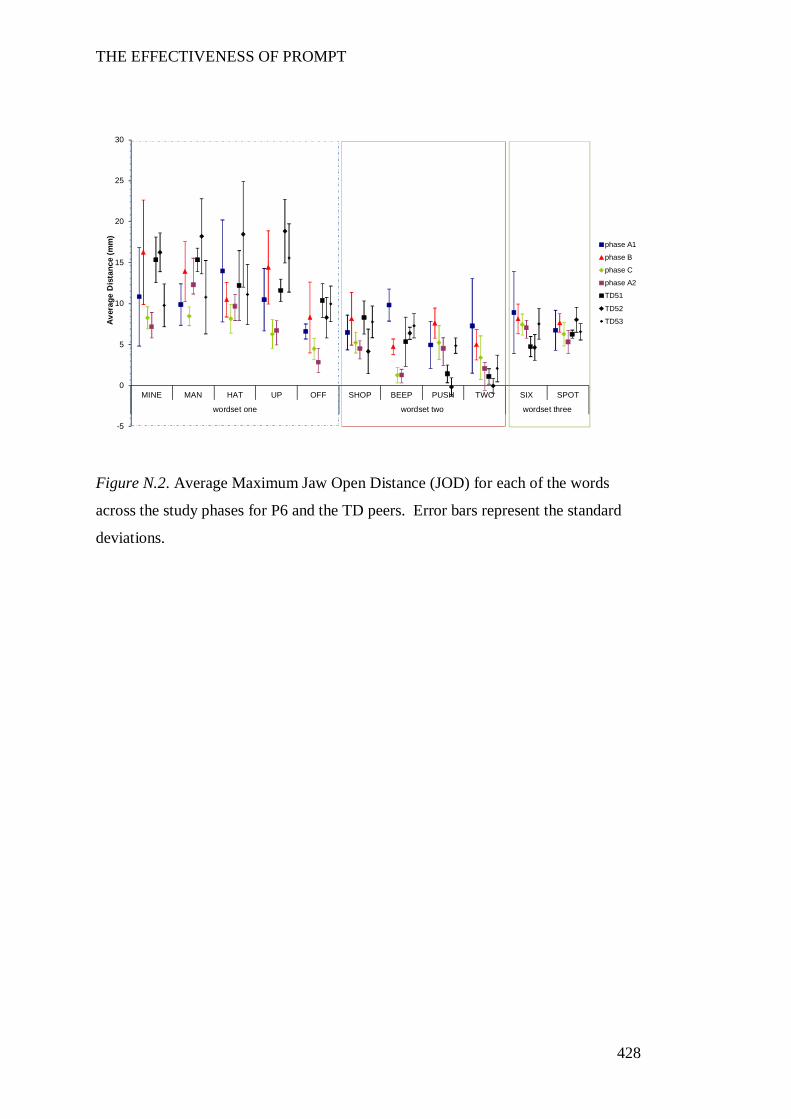
THE EFFECTIVENESS OF PROMPT
428
Figure N.2. Average Maximum Jaw Open Distance (JOD) for each of the words
across the study phases for P6 and the TD peers. Error bars represent the standard
deviations.
-5
0
5
10
15
20
25
30
MINE MAN HAT UP OFF SHOP BEEP PUSH TWO SIX SPOT
wordset one wordset two wordset three
Aver
age
Dis
tanc
e (m
m)
phase A1
phase B
phase C
phase A2
TD51
TD52
TD53
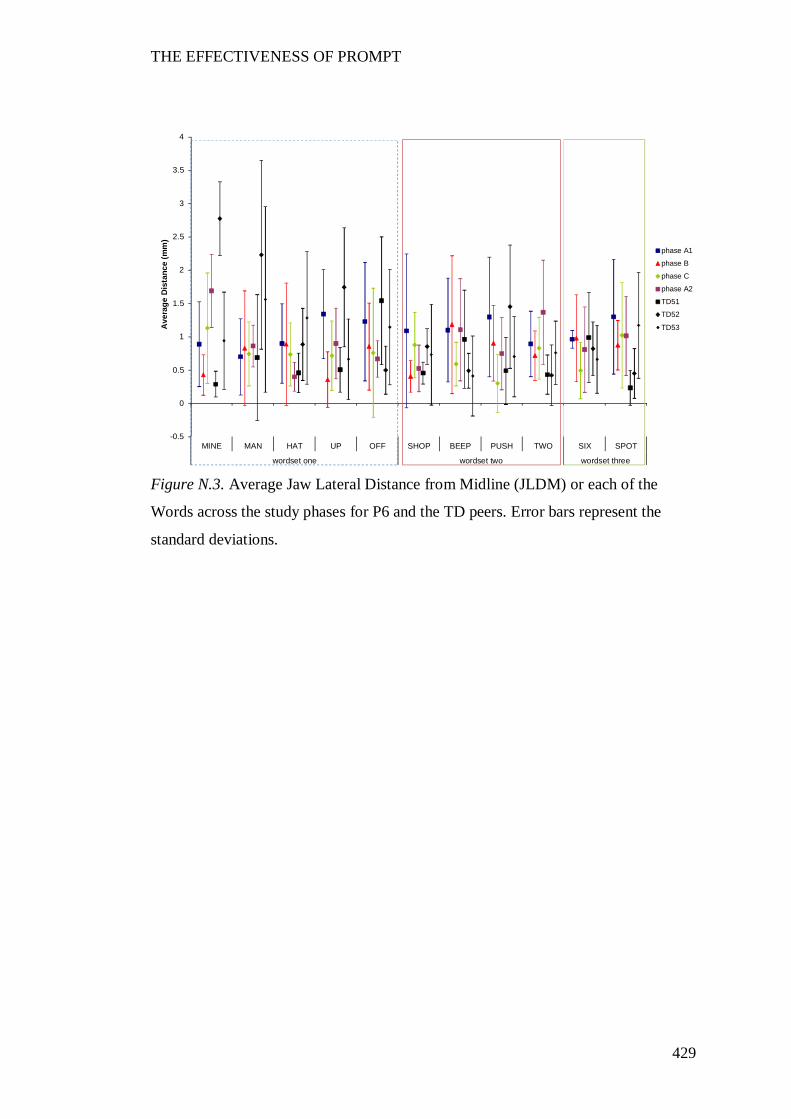
THE EFFECTIVENESS OF PROMPT
429
Figure N.3. Average Jaw Lateral Distance from Midline (JLDM) or each of the
Words across the study phases for P6 and the TD peers. Error bars represent the
standard deviations.
-0.5
0
0.5
1
1.5
2
2.5
3
3.5
4
MINE MAN HAT UP OFF SHOP BEEP PUSH TWO SIX SPOT
wordset one wordset two wordset three
Ave
rage
Dis
tanc
e (m
m)
phase A1
phase B
phase C
phase A2
TD51
TD52
TD53
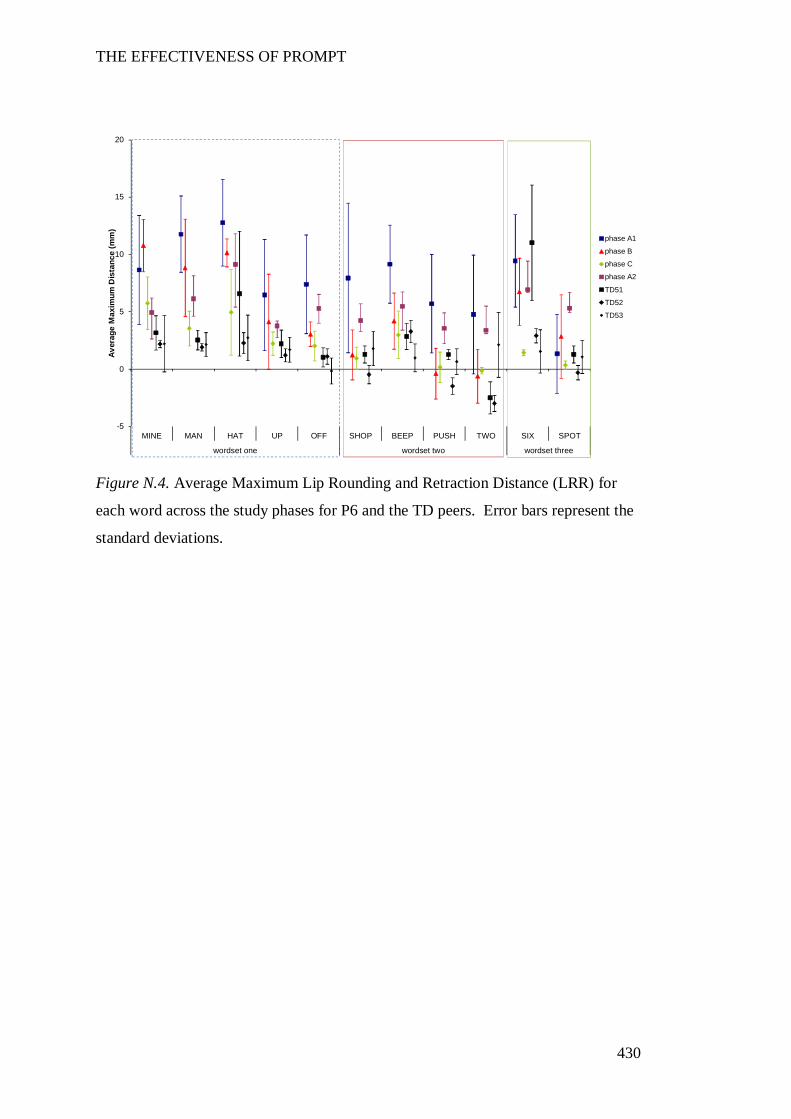
THE EFFECTIVENESS OF PROMPT
430
Figure N.4. Average Maximum Lip Rounding and Retraction Distance (LRR) for
each word across the study phases for P6 and the TD peers. Error bars represent the
standard deviations.
-5
0
5
10
15
20
MINE MAN HAT UP OFF SHOP BEEP PUSH TWO SIX SPOT
wordset one wordset two wordset three
Aver
age
Max
imum
Dis
tanc
e (m
m)
phase A1
phase B
phase C
phase A2
TD51
TD52
TD53
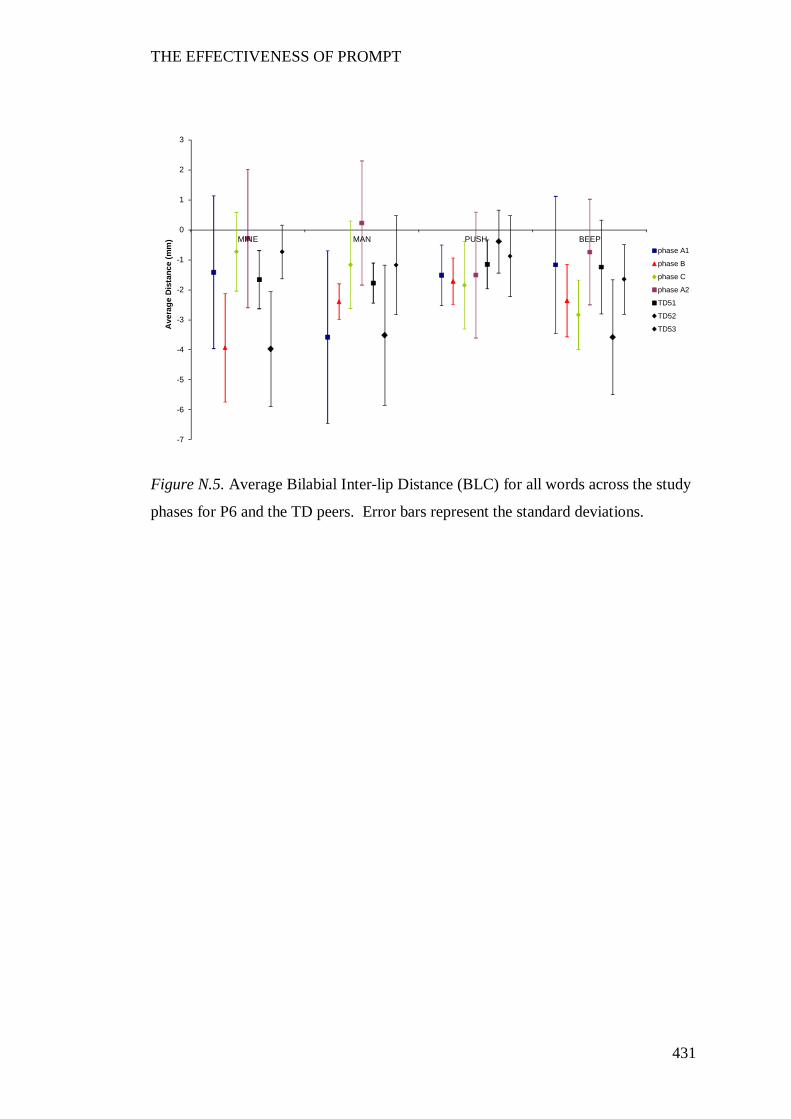
THE EFFECTIVENESS OF PROMPT
431
Figure N.5. Average Bilabial Inter-lip Distance (BLC) for all words across the study
phases for P6 and the TD peers. Error bars represent the standard deviations.
-7
-6
-5
-4
-3
-2
-1
0
1
2
3
MINE MAN PUSH BEEP
Ave
rage
Dis
tanc
e (m
m)
phase A1
phase B
phase C
phase A2
TD51
TD52
TD53
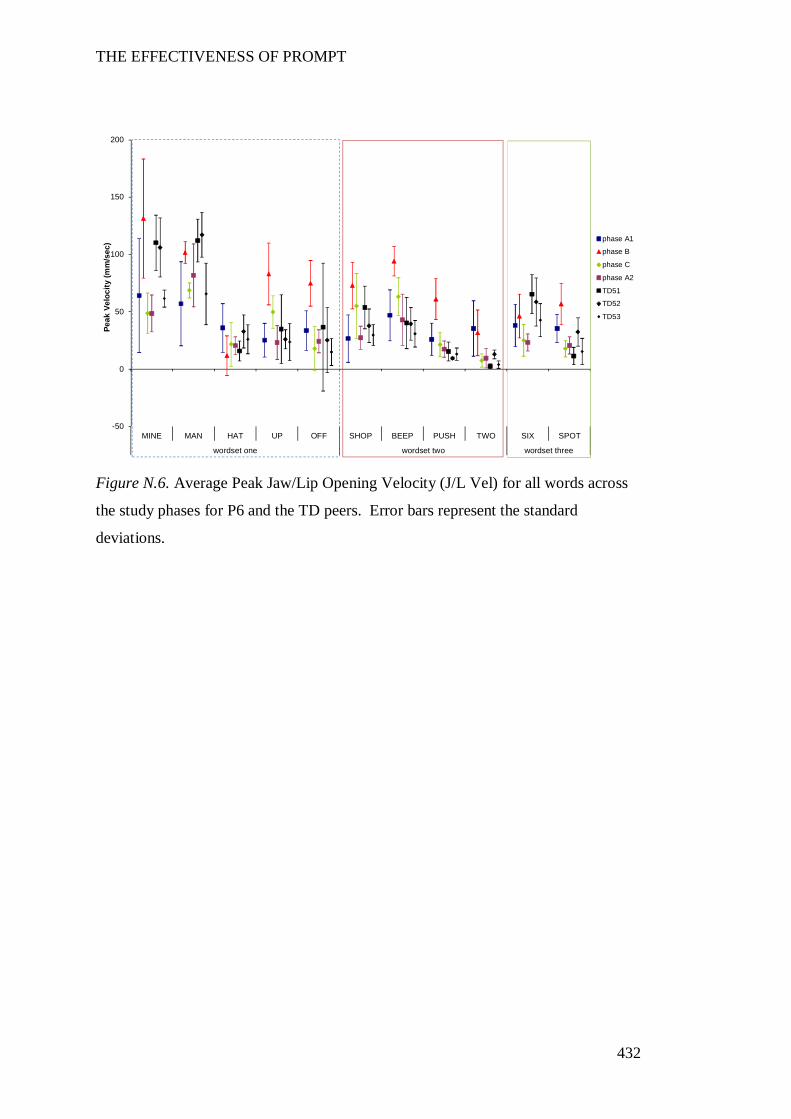
THE EFFECTIVENESS OF PROMPT
432
Figure N.6. Average Peak Jaw/Lip Opening Velocity (J/L Vel) for all words across
the study phases for P6 and the TD peers. Error bars represent the standard
deviations.
-50
0
50
100
150
200
MINE MAN HAT UP OFF SHOP BEEP PUSH TWO SIX SPOT
wordset one wordset two wordset three
Peak
Vel
ocity
(mm
/sec
) phase A1
phase B
phase C
phase A2
TD51
TD52
TD53
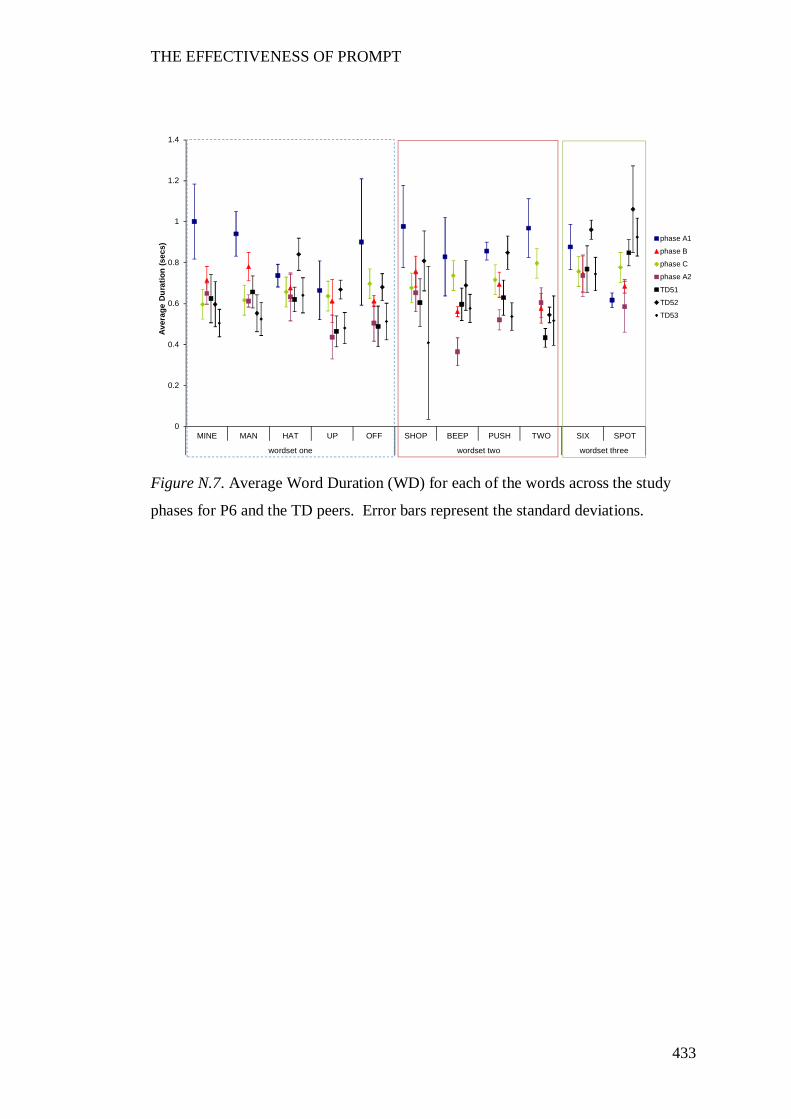
THE EFFECTIVENESS OF PROMPT
433
Figure N.7. Average Word Duration (WD) for each of the words across the study
phases for P6 and the TD peers. Error bars represent the standard deviations.
0
0.2
0.4
0.6
0.8
1
1.2
1.4
MINE MAN HAT UP OFF SHOP BEEP PUSH TWO SIX SPOT
wordset one wordset two wordset three
Aver
age
Dur
atio
n (s
ecs)
phase A1
phase B
phase C
phase A2
TD51
TD52
TD53
THE EFFECTIVENESS OF PROMPT
434
Appendix O
Copyright Release PROMPT Institute
19th March, 2012 Ms Deborah Hayden Executive Director The Prompt Institute 4001 Office Court Drive, Suite 305 Sante Fe, New Mexico 87507 USA
Dear Ms Hayden,
It is my understanding that you/your organisation hold copyrights in the following materials:
1. The PROMPT conceptual framework; 2. The Motor Speech Hierarchy; 3. The Systems Analysis Observation; and 4. Illustration of the Facial PROMPTS (page 40) as illustrated in the PROMPT Introduction to Technique Manual (2003). I would like to reproduce an extract of this work in a doctoral thesis which I am currently undertaking at Curtin University of Technology in Perth, Western Australia. The subject of my research is the evaluation of the effectiveness of PROMPT in children with cerebral palsy. I am carrying out this research in my own right and have no association with any commercial organisation or sponsor.
The specific materials that I would like to use for the purposes of the thesis are the four illustrations listed above.
Once completed, the thesis will be made available in hard-copy form in the Curtin Library and in digital form on the Internet via the Australasian Digital Thesis Program. The material will be provided strictly for educational purposes and on a non-commercial basis. Further information on the ADT program can be found at http://adt.caul.edu.au.
I would be most grateful for your consent to the copying and communication of the work as proposed. If you are willing to grant this consent, please complete and sign the attached approval slip and return it to me at the address shown.
Full acknowledgement of the ownership of the copyright and the source of the material will be provided with the material. I would be willing to use a specific form of acknowledgement that you may require and to communicate any conditions relating to its use.
If you are not the copyright owner of the material in question, I would be grateful for any information you can provide as to who is likely to hold the copyright.

THE EFFECTIVENESS OF PROMPT
435
I look forward to hearing from you and thank you in advance for your consideration of my request.
Yours sincerely,
Roslyn Ward
PERMISSION TO USE COPYRIGHT MATERIAL AS SPECIFIED BELOW:
1. The PROMPT conceptual framework; 2. The Motor Speech Hierarchy; 3. The Systems Analysis Observation; and 4. Illustration of the Facial PROMPTS (page 40) as detailed in the PROMPT Introduction to Technique Manual (2003).
I hereby give permission for Roslyn Ward to include the above-mentioned material(s) in her higher degree thesis for the Curtin University of Technology, and to communicate this material via the Australasian Digital Thesis Program. This permission is granted on a non-exclusive basis and for an indefinite period.
I confirm that I am the copyright owner of the specified material.
Permission to use this material is subject to the following conditions: [Delete if not
applicable]
Signed:
Name:
Position:
Date:
Please return signed form to my email address:
THE EFFECTIVENESS OF PROMPT
436