Embed Size (px)
Citation preview
Tectonophysics, 225 (1993) 457-476
Elsevier Science Publishers B.V., Amsterdam
457
The effective viscosity of rocksalt: implementation of steady-state creep laws in numerical models of salt diapirism
P.E. van Keken a, C.J. Spiers b, A.P. van den Berg a and E.J. Muyzert a
a Department of Theoretical Geophysics, Faculty of Earth Sciences, University of Utrecht, P.O. Box 80.021, 3508 TA Utrecht, The Netherlands
h HPT-laboratory, Department of Geology, Faculty of Earth Sciences, University of Utrecht, P.O. Box 80.021, 3508 TA Utrecht, The Netherlands
(Received December 11, 1992; revised version accepted April 26, 1993)
ABSTRACT
A steady-state creep law for rocksalt, describing the two parallel mechanisms of dislocation creep and fluid-enhanced grain-boundary diffusion creep, has been used in numerical models of salt diapirism, to study the effective viscosity of rocksalt. Typical models included a 3-km-thick sedimentary layer on top of 1 km of rocksalt. The grain size of the salt has been varied between 0.5 and 3 cm and the geothermal gradient between 25 and 35 K/km. For strain rates of 10-‘2-10-‘5 s-‘, typical of salt diapirism driven by buoyancy alone, the diffusion creep mechanism dominates at the fine grain sizes, with dislocation creep becoming important in coarsely grained salt. The effective viscosity ranges from 10” Pa s for small grain size and high-temperature salt to lo*’ Pa s for large grain size and low-temperature salt. The viscosity is strongly dependent on grain size and moderately dependent on temperature. For the larger grain sizes, the dislocation creep mechanism is most effective during the diapiric stage, but the non-Newtonian effects in the salt are not important in determining the growth rate and geometry of the diapirs. The estimates for the Newtonian viscosity of salt that have traditionally been used in modelling of salt dynamics are at the lower end of the range that we find from these numerical experiments.
Introduction
Dynamical studies of salt tectonics have re- ceived renewed attention in the last few years. This has been stimulated by research into the question of radioactive waste disposal in salt for- mations, and by interest in modelling the role of halokinesis in controlling the migration and trap- ping of hydrocarbons in rapidly subsiding basins of the type exemplified by the Gulf of Mexico.
Traditionally, salt diapirism has been studied numerically using Rayleigh-Taylor type models, describing the gravitational instability of fluid lay- ers (Woidt, 1978; Schmeling, 1987; Roemer and Neugebauer, 1991). These models have been ex- tended to include several factors and relevant mechanisms, such as the effects of topography (Poliakov and Podladchikov, 19921, erosion and sedimentation (Poliakov et al., 19931, and tectonic extension and compression (DaudrC et al., 1992). However, in almost all of these studies, a Newto-
nian rheology, with a temperature-independent viscosity ranging between 10” and lOi Pa s, was used to model the behaviour of the salt. Thus, the complicated rheological behaviour observed in deformation experiments on salt has been largely neglected hitherto, as has the brittle/ frictional rheology, characteristic of most sedimentary over- burden (Kirby and Kronenberg, 1987).
An extensive body of experimental data avail- able on salt indicates that both dislocation (e.g., Carter and Hansen, 1983; Wawersik and Zeuch, 1986) and diffusional creep mechanisms (Urai et al., 1986; Spiers et al., 1990) can be important in salt under geological conditions. In this paper, we follow the approach used by Spiers et al. (1989, 19901, to develop a steady-state creep equation for natural rocksalt, based on parallel operation of dislocation creep plus fluid-enhanced grain- boundary diffusional or “pressure-solution” creep. We have used this creep law to conduct a systematic study of the dependence of the viscos-
0040-1951/93/$06.00 0 1993 - Elsevier Science Publishers B.V. All rights reserved
458 P.E. VAN KEKEN ET AL.
ity of rocksalt on variables such as temperature and grain size, and we have implemented the creep law in numerical, Rayleigh-Taylor type models of salt diapirism. For computational sim- plicity and for purposes of comparison, we follow previous numerical studies in assuming a Newto- nian rheology for the sediments overlying the salt. The present paper thus represents only a first step towards incorporating realistic rheologies into the numerical modelling of salt diapirism.
Creep hehaviour of rocksalt at 20-200°C
Deformation mechanisms observed in experiments
Natural salt flow or halokinesis generally oc- curs at shallow crustal levels where temperatures are relatively low, i.e., less than 150-200°C (e.g., Heard, 1972; Jackson and Talbot, 1986). In order to understand the steady-state creep behaviour of rocksalt under such conditions, numerous experi- ments have been conducted in recent years, on a wide variety of natural salts (e.g., Carter and Hansen, 1983; Wawersik and Zeuch, 1986; Horseman and Handin, 1990). Conditions investi- gated cover temperatures in the range 20-200°C strain rates down to 10-i’ s-i and confining pressures typically up to 30 MPa. At experimen- tal flow stresses below N 15 MPa and strain rates
below - lo-’ s-l (i.e., at conditions most closely approaching nature), it is generally agreed that these experiments show flow by dislocation creep (see Carter and Hansen, 1983; Wawersik and Zeuch, 1986). With regard to the rate-controlling mechanism, Wawersik and Zeuch (1986) and Skrotzki and Haasen (1988) use mechanical and microstructural data to argue that the main rate- controlling process at 20-200°C is probably cross-slip of screw dislocations. On the other hand, Carter and Hansen (1983) observed sub- grain development at lOO-200°C suggesting that dislocation climb might be rate-controlling in this range. Most recently, Carter and co-workers (Horseman et al., 1993; Carter et al., 1993) have presented mechanical and microstructural data for Avery Island salt, which suggest that creep at 50-200°C may by controlled by cross-slip at high strain rates (> 10-7-10-9 s-l> and by climb at
lower rates. Thus, the question of detailed rate- controlling mechanism remains unclear. Fortu- nately, however, most salts show rather similar creep behaviour in the range 20-200°C and a variety of empirical power law and other creep equations are available which adequately describe the observed flow behaviour (see Carter and Hansen, 1983; Wawersik and Zeuch, 1986; Carter et al., 1993). These have been widely adopted to model the creep of salt in nature (Carter et al., 1990, 1993).
In addition to the dislocation mechanism(s) discussed above, recent experiments on fine- grained (dynamically recrystallized), natural rock- salt and fine-grained, synthetic salt have demon- strated that when trace amounts (e.g. > 0.05 wt%) of water are present at grain boundaries (as is almost always the case in natural rocksalt), defor- mation can occur by fluid-assisted grain-boundary diffusional creep or pressure solution (see Urai et al., 1986: Spiers et al., 1986, 1988). This grain size sensitive, Newtonian creep mechanism involves dissolution of material at grain boundaries under high mean normal stress, diffusion through the grain-boundary fluid, and precipitation at grain boundaries under low mean normal stress. The constitutive behaviour associated with the mecha- nism has been investigated in detail by Spiers et al. (1990) and suggests that for the water contents and coarse grain sizes characteristic of most rock- salts, the mechanism will not be observed in laboratory experiments, but may contribute signif- icantly to natural deformation.
Two-mechanism creep law for salt
We now follow the approach adopted by Spiers et al. (1989, 1990) (see also Carter et al., 1990, 1993) to develop a creep “law” and deformation map for the flow of rocksalt under natural condi- tions. Assuming that the relevant mechanisms are those discussed above, and noting that dislocation and diffusion creep processes are parallel mecha- nisms, we can write the total steady-state creep rate for rocksalt as:
i = ips + i,, (1)
where EPs and Gdc are the strain rate contribu- tions provided by pressure solution and disloca-
THE EFFECTIVE VISCOSITY OF ROCKSALT: NUMERICAL MODELS OF SALT DIAPIRISM 459
tion creep, respectively. For the strain rate due to pressure solution we use the constitutive equation determined by Spiers et al. (1990). This is written:
iPs,, = 6.95V, x lo-l5 exp( - 24530/RT) u,
T d3
(2)
where the various terms appearing are defined in Table 1.
For the strain rate due to dislocation creep we use the cross-slip based creep equation of Wa- wersik and Zeuch (1986) fitted to creep data for rocksalts from both West Hackberry (USA) and Asse (FRG). This is written:
id=,, =D exp[ -Q-(lnz -lnz)] where the terms appearing are again defined in Table 1, and where the constitutive parameters
Q -r,Jp,, and D for the West Hackberry and Ge salts are listed in Table 2.
Note that our choice of the latter creep Eq. (3) is not based on any particular view regarding the rate-controlling mechanism for dislocation creep in rocksalt at 20-200°C since this is clearly still open to question. Rather, we chose the Wawersik and Zeuch law because: (1) the range of parame- ters given for the West Hackberry and Asse salts
TABLE 1
Definition of physical quantities occurring in eqns. (2) and (3)
Symbol Definition Units
d R
G
T
(JI
QCS
P
70 PO
Edc,I
Grain size Gas constant (8.314) Molar volume of solid phase
(2.693 x 10⁻⁵) Absolute temperature Differential stress Activation energy for cross-slip
controlled creep Average shear modulus Flow stress at absolute zero Average shear modulus at absolute
zero (14 X 10’) Axial strain rate associated with
dislocation creep Axial strain rate associated with
pressure-solution creep Axial differential stress
m J mol-‘K-’
m3 mol-’ K Pa
J mol-’ Pa Pa
Pa
s-1
s-1
Pa
TABLE 2
Dislocation creep parameters for Asse and West Hackberry salt (after Wawersik and Zeuch, 1986)
File Origin Jn D Q,, TO/PO (s-l) &J mol-‘)
BGRCl Asse (FRG) 7.92 18.96 0.074
WH2 West Hackberry
(USA) 1.63 14.02 0.060
encompasses the behaviour of most salts tested in the range 20-200°C; and (2) the parameters given for W. Hackberry salt yield a creep law which is closely similar to the widely used power law creep equation obtained by Carter and Hansen (1983). Thus, the Wawersik and Zeuch law provides a convenient empirical description expected to em- body the main elements of the dislocation creep behaviour exhibited by salt at temperatures below 200°C. Some uncertainty exists in extrapolating the law to slow natural strain rates, but the same criticism applies to all creep equations presently available.
Deformation map
The above creep law given by Eqs. (0, (2) and (3) now enables us to construct a deformation map for natural salt (grain size 1 cm), incorporat- ing the two mechanisms considered. The result is identical to that obtained by Spiers et al. (1990) and is shown in Figure 1. From this diagram, and taking into account the variability of grain size in natural salts, it can be expected that deformation at natural rates should be dominated by pressure solution in fine-grained salts and dislocation creep in coarse-grained salts, thus spanning the transi- tion.
The effective shear viscosity of rocksalt
We now derive expressions for the shear vis- cosity of rocksalt associated with pure dislocation creep, pure pressure solution, and simultaneous operation of the two mechanisms. The influence of strain rate, grain size, temperature and salt type on total viscosity is then considered.

P.E. VAN KEKEN El‘ Al..
Fig. 1. Deformation map for rocksalt (grain size d = 1 cm)
constructed using the creep law (refer eqn. 1) combining
pressure-solution creep and cross-slip controlled dislocation
creep (Wawersik and Zeuch, 1986) for the Asse (A) and West
Hackberry (WH) salts. Reconstruction of fig. 10 of Spiers et
al. (1990).
Viscosity associated with dislocation creep
We begin by rewriting Eq. (3) as:
Edc,l = EO,( T)cqT
where:
(4)
QCS n(T) = RT and
EO,(T) =D exp( - $ln~)/_PUCs1R7
For Asse salt (file BCGRl, Table 21, Q,, = 19 kJ mol-‘. For the temperature range 20-200°C this gives an effective “power law” exponent n(T) = 7.8-4.8. For West Hackberry salt (WH2, Table 2), the same temperature range yields n(T) = 5.8-3.7.
Now, the parameters D, rO/pLo, and Q,, in Eq. (4) are determined from axi-symmetric com- pression experiments, and &, and (T, represent axial strain rate and differential stress. To obtain a generalized expression for shear viscosity, Eq. (4) must be rewritten in terms of effective devia- toric stress and strain rate (Ranalli, 1987, p. 78). For the effective strain rate due to dislocation creep, this yields:
‘dc =
. I
3(n(T)+ 1)/Z
2 ~a,( T) 1 ~9~~) = l O( T)u”(~)
(5)
with the corresponding shear viscosity then given:
where:
1 ~ I /II
TO QC,
“icl and FZ = - RT
Viscosity associated with pressure-solution creep
Once again, the parameters in Eq. (2) are determined from axi-symmetric experiments. Fol- lowing the above approach (Ranalli, 1987) and noting that Eq. (2) can be viewed as a power law with n = 1, we can write the shear viscosity due to pressure solution as:
u u TIPS = 2i = -
PS 3i
PSJ
Td’
= 3 x 6.95 V, . lo- I5 . exp( - 24530/RT)
(7)
Total effective shear viscosity of salt
Following Eq. (0, the total strain rate due to the above mechanisms can now be written: . . E = eps + id, = fS( T,d)o + E,& (8)
where f, describes the temperature and grain size dependence of the pressure-solution creep rate [ f,(T,d) = 1/(2~7~~)], and e0 and n are de- fined in Eq. (6). Re-expressing this in the form:
i = (f,( T,d) + E:,“P- ‘)‘n)u (9)
then leads to the total effective shear viscosity, given:
U 1
n = .i = 2f,(T,d) + 2#“jn-‘/”
= (10)
This geometric mean of the viscosities, derived for the parallel operation of two creep mecha- nisms, is equivalent to the Ellis model, discussed
THE EFFECTIVE VISCOSITY OF ROCKSALT: NUMERICAL MODELS OF SALT DlAPIRfSM 461
by Bird et al. (1960). The same method of ex- pressing the shear viscosity as a function of two different creep mechanisms has been used in mantle convection modelling by Parmentier et al. (1976) and Van den Berg et al. (1993).
Influence of strain rate, grain size, temperature and
salt type on total viscosity
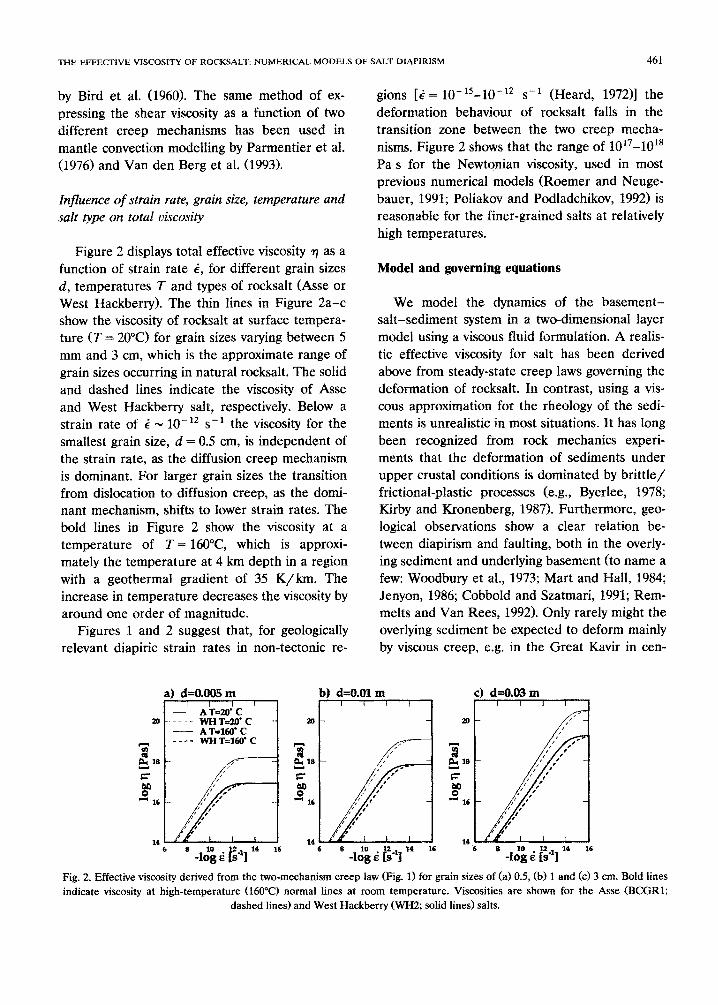
Figure 2 displays total effective viscosity 9 as a function of strain rate 2, for different grain sizes d, temperatures T and types of rocksalt (Asse or West Hackberry). The thin lines in Figure 2a-c show the viscosity of rocksalt at surface tempera- ture (T = 20°C) for grain sizes varying between 5 mm and 3 cm, which is the approximate range of grain sizes occurring in natural rocksalt. The solid and dashed lines indicate the viscosity of Asse and West Hackberry salt, respectively. Below a strain rate of E * lo-i2 s-i the viscosity for the smallest grain size, d = 0.5 cm, is independent of the strain rate, as the diffusion creep mechanism is dominant. For larger grain sizes the transition from dislocation to diffusion creep, as the domi- nant mechanism, shifts to lower strain rates. The bold lines in Figure 2 show the viscosity at a temperature of T = 16O”C, which is approxi- mately the temperature at 4 km depth in a region with a geothermal gradient of 35 K/km. The increase in temperature decreases the viscosity by around one order of magnitude.
Figures 1 and 2 suggest that, for geologically relevant diapiric strain rates in non-tectonic re-
a) d=O.OOEi m
---- wHT=‘J,O’C - A T=160’ C ---- wNT=16o’C
gions [ti = 10-15-10-12 s-l (Heard, 197211 the deformation behaviour of rocksalt falls in the transition zone between the two creep mecha- nisms. Figure 2 shows that the range of 10”-10’s Pa s for the Newtonian viscosity, used in most previous numerical models (Roemer and Neuge- bauer, 1991; Poliakov and Podladchikov, 1992) is reasonable for the finer-grained salts at relatively high temperatures.
Model and governing equations
We mode1 the dynamics of the basement- salt-sed~ent system in a ho-dimensional layer model using a viscous fluid formulation. A realis- tic effective viscosity for salt has been derived above from steady-state creep laws governing the deformation of rocksalt. In contrast, using a vis- cous appro~mation for the rheology of the sedi- ments is unrealistic in most situations. It has long been recognized from rock mechanics experi- ments that the deformation of sediments under upper crustal conditions is dominated by brittle/ frictional-plastic processes (e.g., Byerlee, 1978; Kirby and Kronenberg, 1987). Furthermore, geo- logical observations show a clear relation be- tween diapirism and faulting, both in the overly- ing sediment and underlying basement (to name a few: Woodbury et al., 1973; Mart and Hall, 1984; Jenyon, 1986; Cobbold and Szatmari, 1991; Rem- melts and Van Rees, 1992). Only rarely might the overlying sediment be expected to deform mainly by viscous creep, e.g. in the Great Kavir in cen-
) d=O.Ol m I f / ,
Fig. 2. Effective viscosity derived from the two-mechanism creep law (Fig. 1) for grain sizes of (a) 0.5, (b) 1 and (c) 3 cm. Bold lines indicate viscosity at high-temperature (160°C) normal lines at room temperature. Viscosities are shown for the Asse (BCGRl;
dashed lines) and West Hackberry (WH2; solid lines) salts.
462 P.E. VAN KEKEN ET AL.
tral Iran (Jackson et al., 1990). In that particular region, the elastic redbeds overlying the salt show a complete lack of diapir-related faulting, proba- bly because of significant weakening and perva- sive flow caused by disseminated halite. Hence, in the general situation a constitutive description that uses ductile creep for the rocksalt and a brittle/ frictional-plastic deformation mechanism for the sediments is most appropriate for mod- elling salt diapirism.
Unfortunately, incorporation of this type of compound constitutive description into numerical models is hampered by technical difficulties in- duced by the distinct nature of the time-inde- pendent (brittle) versus time-dependent (creep) mechanisms, and the discontinous change across the sediment-salt interface. Only very recently, efforts to resolve this problem in numerical mod- els have started appearing in literature (Bobineau, 1992; Schultz-Ela and Bobineau, 19921. In the present paper, however, we use a simple linear viscous rheological model for the overlying sedi- ment, taking a viscosity that gives geologically reasonable values for ascent velocities and strain rates. This is clearly not appropriate for mod- elling the structural evolution which generally accompanies salt diapirism, but it allows us to determine an estimate of the temporal and spa- tial variability of the effective viscosity within diapiric rocksalt, and can be used for comparison with previously published Rayleigh-Taylor mod- els, describing salt diapirism.
Having decided on the rheological description to be used, the dynamics of the salt structure can now be described by the Stokes equation:
-vp + V(?+) = -pg (11)
where p is the dynamical pressure, 7 the viscos- ity, E the deviatoric strain rate tensor, with com- ponents 5, = i(auj/axi + &,/ax,>, and g the grav- ity vector. The second invariant of the strain rate tensor, used in calculating the effective viscosity (10) is defined by i = <&<.j.i>‘/2, where the Ein- stein convention for summation is used.
The flow is assumed incompressible. Pressure is eliminated from Eq. (11) by the introduction of the stream function rC, as a velocity potential
V= G+/ay, - &)/ax)]. Subsequent equations
are given in dimensionless form, following the scaling given by Christensen (1984).
First, the equation of motion for a N-layer model with thermal and chemical buoyancy forces is given by:
(Christensen and Yuen, 1984). Here Ra is the thermal Rayleigh number, defined:
Ra = apgATh3
K770 (13)
and Rb, are the so-called boundary Rayleigh numbers:
Rb,= (Pi-Pi+dgh3 I
‘-to (14)
where pi is the density in the i-th layer. The layers and the interfaces are numbered sequen- tially from the top down. The function IZf,Ir describes the N-layer composition. We take each I; to be 0 in the layers above in the interface i, and 1 in the layers below. The functions Ii are discontinuous across the interface i.
For the thermal regime, we impose an average geothermal gradient (dT/dz) by keeping the temperature constant at the top (To = 20°C) and bottom [T,, = To + (dT/dz) X h]. The thermal dif- fusivity of the salt is much higher (approximately five times) than the diffusivity of the surrounding sediment, and this will have a strong influence on the temperature distribution in and around the salt (Selig and Wallick, 1966). For models of salt diapirism with a typical vertical length scale of 4 km, the thermal Rayleigh number is around unity, much smaller than the critical Rayleigh number (Busse, 19891, and thermal buoyancy forces can be neglected. In addition, the thermal diffusion time h2/K, (where h is the depth of the layer and K is the thermal diffusivity) is much shorter than the turn-over time of the system. For example, taking h = 4 km, and the accepted thermal diffu- sivity for salt (K = 5 X low6 m2 s-i) the diffusion time scale is 100,000 a, compared with lo-100
THE EFFECTIVE VISCOSITY OF ROCKSALT: NUMERICAL MODELS OF SALT DIAPIRISM 463
yf=o qJ,=o
Y=’
V=O Sediments
Y=O Ll V=O
Salt V&X=0 Q&=0
X=0
Basement
yf=o w,=o
x=x
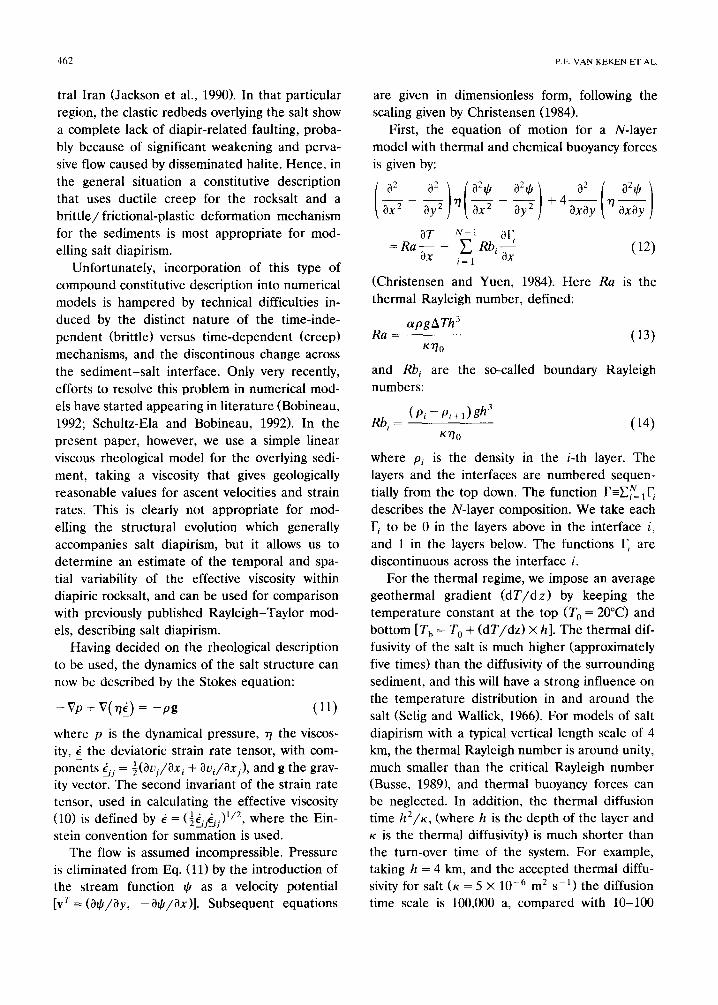
Fig. 3. Geometry and boundary conditions used in the present model. The salt diapirism is modelled in a rectangular box with aspect ratio A with stress free boundaries. Top and bottom are kept at constant temperature, side walls are re-
flective. No material can flow in or out of the box.
Ma for a diapir to reach its mature stage (Jackson and Talbot, 1986). This implies that thermal ad- vection can be neglected and the temperature in and around the salt can be calculated from the steady-state heat diffusion equation. We ignore here possible effects of convection in groundwa- ter surrounding the salt.
As shown in Figure 3, the present fluid layers are contained in a rectangular box with aspect ratio (length-to-depth ratio) A. The side bound- aries are reflective, the top boundary is free-slip, the bottom boundary is either free-slip or rigid (stick-slip). The temperature is kept constant at the top and bottom. The dynamics of this N-layer model are then governed by the equation of mo- tion (121, the temperature equation:
VkVT = 0 (15)
(where k is the thermal conductivity), the trans- port equation for the layer composition, given:
; +(v.V)F=O (16)
(where t is time), and the viscosity law (given for the salt by Eq. 10).
Numerical method
The equation of motion and the heat equation are solved here using the method of Galerkin, applying a finite element method to construct the basis functions (Cuvelier et al., 1986). Using this type of numerical method, it is possible to con-
struct a full solution to the non-linear and time- dependent problem for given initial and boundary conditions and given physical parameters. The method also allows for a well-controlled experi- mental search for solutions in a given parameter space. Although the solution obtained is approxi- mate, the accuracy can be very high. With good numerical analysis and a careful implementation of the method, it is well possible to constrain the errors in the solution to be small. A carefully controlled numerical method is to be preferred to methods of linear stability analysis, since the lat- ter degrade the full problem via the linearizations introduced to allow analytical solutions. Thus, stability analysis gives only a very limited subset of solutions to the full problem contained in the solutions from the numerical method. A much more important problem than the finite accuracy of the numerical solution, is the applicability of the description of the physics of the model to the geological situation, but this holds equally for numerical, analytical and experimental methods.
For solving the equation of motion, we have used two different finite element methods. The first employs a type of non-conforming element that stems from plate bending problems (Zienkewicz, 1977) and which has found applica- tion in mantle convection modelling also (Hansen and Ebel, 1984). The second method was the method of splines, that has been used by several authors in mantle convection modelling (Kopitz- ke, 1979; Christensen and Yuen, 1984), and in studies of salt diapirism (Woidt, 1978; Schmeling, 1987; Roemer and Neugebauer, 1991). The buoy- ancy forces are determined by the position of the composition function F alone. Here, the interface between fluids is modelled by a chain of markers that advect with the flow. We followed Chris- tensen and Yuen (1984) in the implementation of the buoyancy forces and the advection of the markers, using a predictor-corrector method. Both finite element methods were tested against a variety of analytical models, and against pub- lished numerical models for Rayleigh-Taylor in- stabilities (e.g., Poliakov and Podladchikov, 1992) and showed good agreement, The method using the non-conforming element has also been exten- sively tested for mantle convection problems and
464
it compares well with Hansen’s implementation in the European mantle convection benchmark (Blankenbach et al., 1989). The codes were checked against a non-Newtonian benchmark published in Malevsky and Yuen (19921, that made a comparison between the independent spline methods of both Christensen and Malevsky, and the primitive variable method published in Van Keken et al. (1992) and Van den Berg et al. (1993).
The equation of motion (12) is non-linear through the strain rate dependence of the viscos-
Streamfunction I
m
t=lO Ma
Streamfunction y.f I
t=5 Ma
AT,,,,, = 10 K
P.&VAN KEKkN EXAL.
ity. The equation is solved at each step by Picard sub-iteration (Van den Berg et al., 1993) until:
i+i&l-!J+~l~ <6
I *j ICC (17)
where 1 I++~ I oc is the maximum of the stream func- tion at the i-th iteration. The convergence crite- rion 6 was taken to be 6 = 5 X 10e4. Typically 2-5 iterations were necessary for the cases with the largest strain rate dependence.
We used a relatively high resolution in both time and space. The speed of present day work-
Viscosi T . . +).<YL:::..,:: :‘..:.:..; .:,(- i4. ” .’ : :I ;> _:.:_:.: ,.,. ,, ,,.. ::‘: ” :::::‘:‘::::~::::~;:.:.i.~:~~:~~~~:~: i ::::. .>.... .A.... “:p . . . . . . . . . . . . . . . . . . . ‘. .:.,.: :.:.:<i’:j: ):,:ji::::~.~ ij:e~ ‘.‘.: z’“:.:. .>; ..,.....,.,..,,\
nil :::, ii’ %’ i. . . . . . .,,:: :...: ,,, . . ..,.
I JA
log q (Pas)
Strainrate 6
Strainrate 6
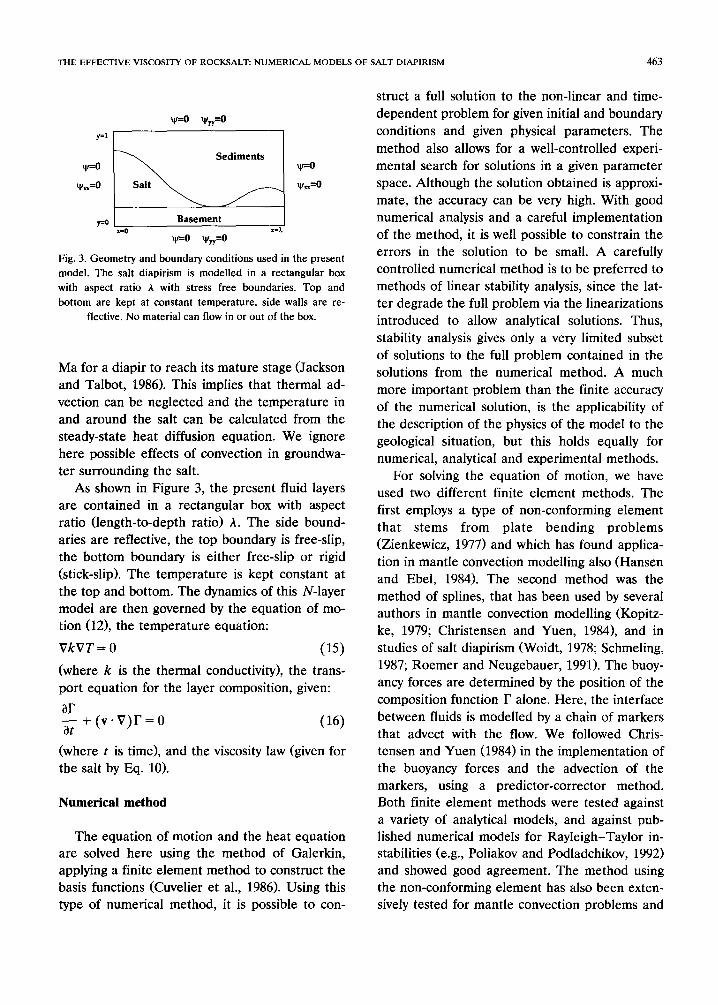
Fig. 4. Time evolution of a model with dimensions 8 x 4 km with grain size 3 cm and temperature gradient 35 K/km. Sediment has
constant density 2300 kg m3 and viscosity 3 x 10¹⁹ Pa s. Isolines are shown of stream function JI, temperature T, salt viscosity 7,
and strain rate i.
THE EFFECTIVE VISCOSI’IY OF ROCKSALT: NUMERICAL MODELS OF SALT DIAPIRISM 465
stations is sufficient to allow for a systematic, high-resolution study of 2-D time-dependent and non-linear models in a reasonable amount of time. For the spline method, we used 30 elements in the vertical direction; the number of elements in the horizontal direction was dependent of the aspect ratio of the model. For the method with the non-conforming type of element somewhat more elements (40 in the vertical direction) were used. The time step was limited to less than 0.5 of the Courant-Friedrichs-Levy criterion (Schmel- ing, 1987). The calculations were started by in- ducing a variety of small perturbations into the initial horizontal stratification of the basement- salt-sediment system. Harmonic perturbations have been shown to grow exponentially with a specific growth rate (e.g. Biot and Ode, 1965). Therefore, in the initial stages of the calculations the time step was reduced using a criterion based on growth rate (Schmeling, 1987) to be able to follow the exponential growth of the interface amplitude.
The accuracy of several runs has been checked against runs using a higher or lower resolution in time and space. The models with lower resolution (down to fifteen elements in the vertical direc- tion) showed no major quantitative differences in
t=7.5 Ma Viscositv ratio
the evolution of the models. Only minor changes were found in the spatial character of the viscos- ity field. Typical runs took between 15 minutes for the most simple cases to several hours for the larger aspect ratio models.
Results
First, we will look at simple two-layer models in which a sediment layer with uniform properties lies over a rocksalt layer in a rectangular cross- section with dimensions 8 X 4 km (aspect ratio A = 2). Next, we will consider the influence of the basement, larger aspect ratios and varying sedi- ment properties. Finally, models including sedi- mentation will be considered. In each case, we will assess the influence of the variable rocksalt viscosity on the dynamics of the system, in a comparison with models similar to those pub- lished previously.
Two-layer models with uniform sediment properties
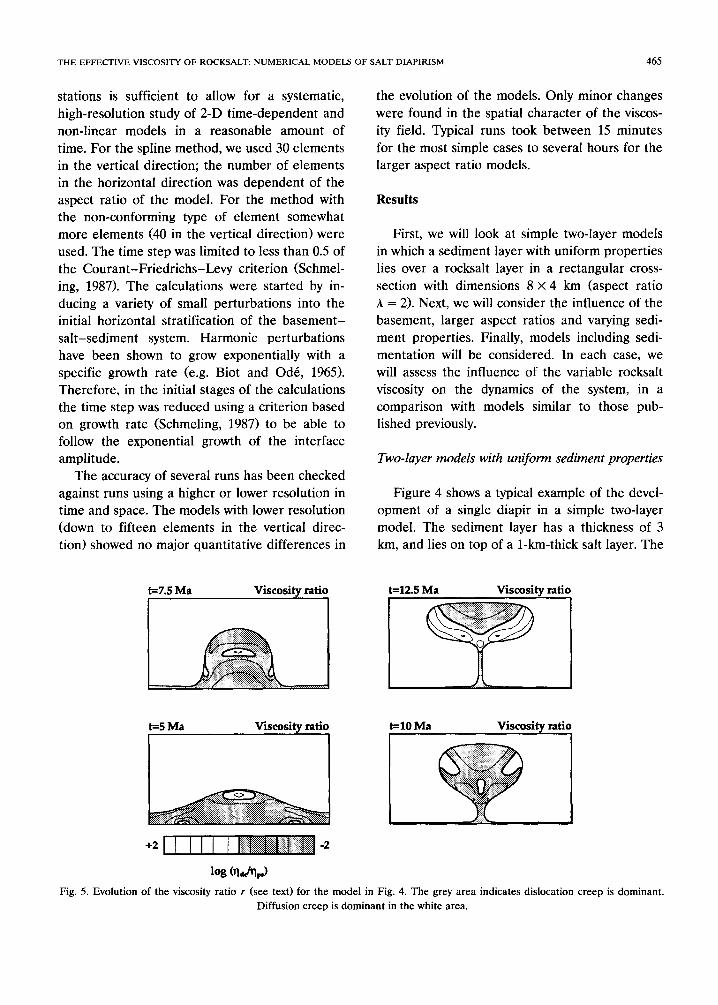
Figure 4 shows a typical example of the devel- opment of a single diapir in a simple two-layer model. The sediment layer has a thickness of 3 km, and lies on top of a l-km-thick salt layer. The
t=12.5 Ma Viscosihr ratio
Viscosity ratio t=lO Ma Viscositv ratio
Fig. 5. Evolution of the viscosity ratio r (see text) for the model in Fig. 4. The grey area indicates dislocation creep is dominant.
Diffusion creep is dominant in the white area.
466
interface between the salt and sediment layers was perturbed at time 0 by a harmonic perturba- tion with a wavelength of 8 km and an amplitude of 40 m. Note that, as a consequence of the negligible strength of the salt and sediments, this small perturbation is sufficient to start the devel- opment of the diapir. The boundaries are free-slip and the bottom boundary is kept at 160°C imply- ing an average geothermal gradient of 35 K/km. The salt has the dislocation creep properties of West Hackberry rocksalt (WH2; see Table 21, a grain size of d = 3 cm, and density psalt = 2160 kg rnm3, which lies midway in the range recorded for natural salt (Gevantman, 1981; Hatheway and Kiersch, 1982). The sediments are isoviscous with
qsediment = 3 x 10¹⁹ Pa s. The density of the sedi-
ments is Psediment = 2300 kg m3. Figure 4 shows snapshots of (from left to right) the isolines of the stream function 4, temperature T, viscosity 77, and strain rate 6 at 5, 7.5, 10 and 12.5 Ma. The corresponding ranges are indicated below the fig- ures. The snapshots for temperature clearly show the effects of the five times higher thermal con- ductivity of the rocksalt compared with the sedi- ments; the isotherms diverge around the salt. The viscosity of the rocksalt varies nearly two orders of magnitude as the diapir travels through the sediment. Also, the effects of variations in strain rate (higher viscosity near the stagnation zone in the centre of the diapir) and temperature (in-
P.E. VAN KEKEN ET AL.
crease in viscosity as the diapir moves into the colder, upper regions) are clearly visible.
For the same model, we can compare the relative contributions of the two creep mecha- nisms to the effective viscosity (lo), by calculating the ratio I = r]dc/qpS where the effective viscosi- ties derived for the two creep laws are defined in Eqs. (6) and (7). For r > 1, dislocation creep gives a larger effective viscosity than pressure-solution creep, indicating that the latter (Newtonian) mechanism is dominant. Figure 5 displays this ratio for the above model with grain size d = 3 cm. In the grey region, the dislocation creep mechanism is dominant. In stagnation zones, where the strain rate is low, Newtonian creep is dominant. In areas with large deformation rates dislocation creep yields a lower viscosity and be- comes the dominant mechanism. At the begin- ning and end of the diapiric evolution the strain rates are low and the pressure-solution creep mechanism is dominant throughout the salt.
In the following we will consider the influence of variations in grain size, overburden viscosity, and geotherm on the evolution of the diapir and the effective viscosity distribution in the rocksalt.
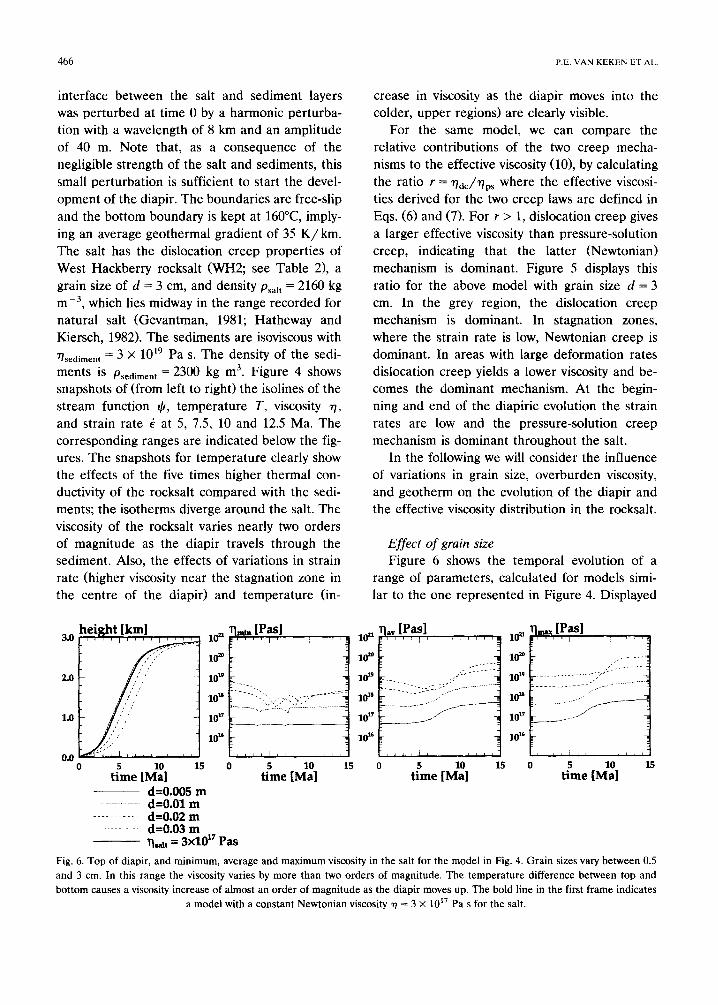
Effect of grain size Figure 6 shows the temporal evolution of a
range of parameters, calculated for models simi- lar to the one represented in Figure 4. Displayed
3.0
___ d=0.005 m _._~ ..-.. d=O.-)l m
~~_._~ . . . . +0.-Q m -.- -. d=0.03 m
ljdt = 3x10” Pas
Fig. 6. Top of diapir, and minimum, average and maximum viscosity in the salt for the model in Fig. 4. Grain sizes vary between 0.5 and 3 cm. In this range the viscosity varies by more than two orders of magnitude. The temperature difference between top and bottom causes a viscosity increase of almost an order of magnitude as the diapir moves up. The bold line in the first frame indicates
a model with a constant Newtonian viscosity n = 3 X 10” Pa s for the salt.
THE EFFECTIVE VISCOSITY OF ROCKSALT: NUMERICAL MODELS OF SALT DIAPIRISM 467
are the height of the diapir (h) and the minimum
(q,,,), maximum (qmax), and volume averaged (7,) viscosities within the rocksalt for d = 0.5, 1, 2 and 3 cm. For the models with the largest grain size, a clear influence of the strain rate depen- dent dislocation creep mechanism is visible: both
V7min and qav show minima around t = 5 Ma and t = 7.5 Ma, where the strain rate peaks at nearly lo-‘* s-l. The average (rms) velocity peaks here too, at about 600 m/Ma. These peaks are associ- ated with reorganizations in the flow field, as the interface between salt and sediment feels first the bottom boundary (the basement), and next the side boundary (just before the necking stage). For the case with the smallest grain size (d = 0.005 m), T,,,~,, is largely uniform throughout the evolu- tion; the strain rate thinning effect is minimal. As seen for all grain sizes, the average viscosity in- creases by nearly an order of magnitude as the diapir moves into the colder parts of the section.
Although the effective average viscosity of the rocksalt varies by more than two orders of magni- tude in these models, the speed with which the diapir travels is hardly affected. For all cases, the viscosity of the sediment (3 x 10¹⁹ Pa s) is higher than the salt viscosity. As has been mentioned previously (Jackson and Talbot, 19861, the layer with the highest viscosity controls the uplift rate of the diapir. This is illustrated by taking a model with constant salt viscosity. In the plot of the height of the diapir [h(t) in Fig. 6), the thick solid line represents the evolution of the model with a uniform salt viscosity of 3 X 10¹⁷ Pa s and a sedi-
2.0
1.0
0.0
r ,,,,,,,, 1~~~~~~~~ 0 10 20 30 40 so 0 10 20 30 40
time [Ma] 50
time [Ma]
ment viscosity of 3 X 10¹⁹ Pa s, the values used by Woidt (1978) and Roemer and Neugebauer (1991). The model description is comparable to model A of Roemer and Neugebauer (1991, p. 2392), but not exactly the same. This results in that in our case the diapir travels faster because of the thicker source layer (1 km, cf. 500 m) and the higher density contrast with the sediment (140 kg rne3, cf. 100 kg mp3>.
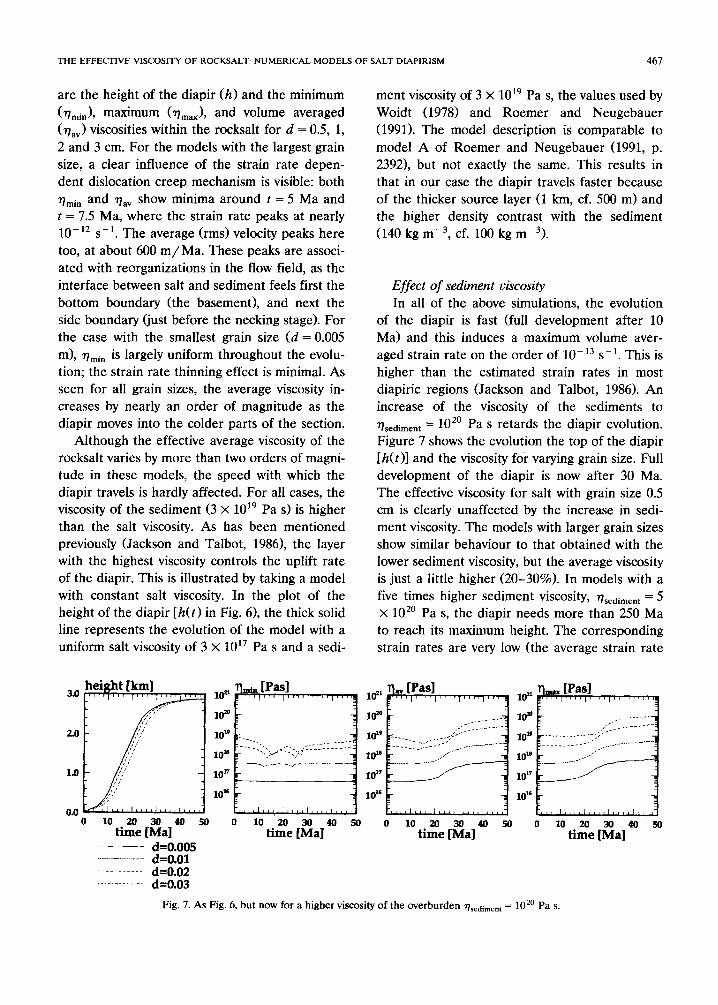
Effect of sediment viscosity In all of the above simulations, the evolution
of the diapir is fast (full development after 10 Ma) and this induces a maximum volume aver- aged strain rate on the order of lo-l3 s-l. This is higher than the estimated strain rates in most diapiric regions (Jackson and Talbot, 1986). An increase of the viscosity of the sediments to
~sediment = lo *’ Pa s retards the diapir evolution. Figure 7 shows the evolution the top of the diapir [h(t)] and the viscosity foi varying grain size. Full development of the diapir is now after 30 Ma. The effective viscosity for salt with grain size 0.5 cm is clearly unaffected by the increase in sedi- ment viscosity. The models with larger grain sizes show similar behaviour to that obtained with the lower sediment viscosity, but the average viscosity is just a little higher (20-30%). In models with a five times higher sediment viscosity, vsediment = 5 X lo*’ Pa s, the diapir needs more than 250 Ma to reach its maximum height. The corresponding strain rates are very low (the average strain rate
0 10 20 30 40 50 0 10 20 30 40 50 time [Ma1 time [Ma]
___ d=0.005 ..__. __ _....._ __... d=0.01
.._..__. __. d=0,02
._.._..._ _.__ d=O_03
Fig. 7. As Fig. 6, but now for a higher viscosity of the overburden ~sedimen, = 10” Pa s.
468 P.E. VAN KEKEN ETAL.
0 10 20 30 40 50 0 10 20 30 40 50 0 10 20 30 40 50 0 10 20 30 40 50
time [Ma] time [Ma] time [Ma] time [Ma] - AT=14OK d=O.O05m ----------- AT=l@JK d=OQl)5m ~-- AT=lQOK d=OMm --~~~---~~- AT=lOOK d=O.mm
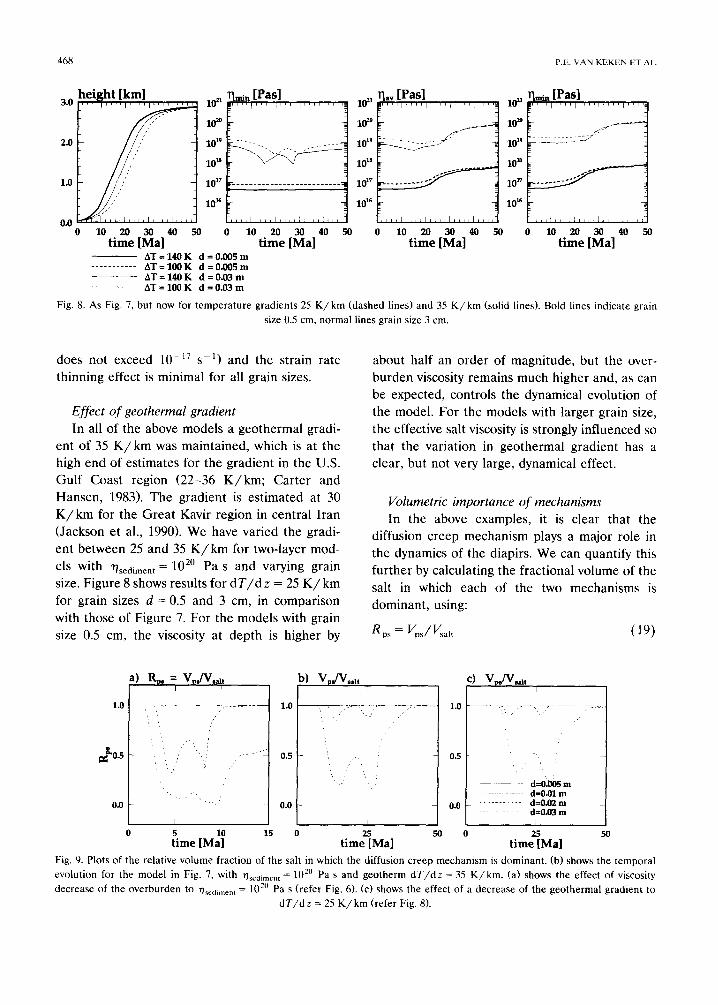
Fig. 8. AS Fig. 7, but now for temperature gradients 25 K/km (dashed lines) and 35 K/km (solid lines). Bold lines indicate grain
size 0.5 cm, normal lines grain size 3 cm.
does not exceed lo-” s-‘1 and the strain rate thinning effect is minimal for all grain sizes.
Effect of geothermal gradient In all of the above models a geothermal gradi-
ent of 35 K/km was maintained, which is at the high end of estimates for the gradient in the U.S. Gulf Coast region (22-36 K/km; Carter and Hansen, 1983). The gradient is estimated at 30 K/km for the Great Kavir region in central Iran (Jackson et al., 1990). We have varied the gradi- ent between 25 and 35 K/km for two-layer mod- els with 77sediment = lo*” Pa s and varying grain size. Figure 8 shows results for dT/d z = 25 K/km for grain sizes d = 0.5 and 3 cm, in comparison with those of Figure 7. For the models with grain size 0.5 cm, the viscosity at depth is higher by
1.0
$05
0.0
about half an order of magnitude, but the over- burden viscosity remains much higher and, as can be expected, controls the dynamical evolution of the model. For the models with larger grain size, the effective salt viscosity is strongly influenced so that the variation in geothermal gradient has a clear, but not very large, dynamical effect.
Volumetric importance of mechanisms
In the above examples, it is clear that the diffusion creep mechanism plays a major role in the dynamics of the diapirs. We can quantify this further by calculating the fractional volume of the salt in which each of the two mechanisms is dominant, using:
a
1.0
0.5
0.0
(19)
‘,
-__ d=O.Ob5m d=O.Olm
...~~...~~~ d=Omm
-.- d=O.O3m /
0 15 0 tin$Ma]
50 0 time&a]
50
Fig. 9. Plots of the relative volume fraction of the salt in which the diffusion creep mechanism is dominant. (b) shows the temporal
evolution for the model in Fig. 7, with TJ~_,~,,,~~~ = 10” Pa s and geotherm dT/dz = 35 K/km. (a) shows the effect of viscosity
decrease of the overburden to qscdimcn, = 10” Pa s (refer Fig. 6). (c) shows the effect of a decrease of the geothermal gradient to
dT/d z = 25 K/km (refer Fig. 8).
THE EFFECTIVE VISCOSITY OF ROCKSALT: NUMERICAL MODELS OF SALT DIAPIRISM 469
Figure 9a shows the relative volume R,, for grain sizes ranging from 0.5 to 3 cm for the model
with ~sediment = 3 x 10¹⁹ Pa s (Fig. 6). For d Q 1
cm, the influence of the dislocation creep mecha- nism is minimal. For larger grain sizes, this mech- anism becomes important and R,, shows a mini- mum around the two peaks in the strain rate, as discussed already. Increasing the sediment viscos- ity strongly decreases the importance of the dislo- cation creep mechanism (Fig. 9b). Decreasing the geothermal gradient has a similar but less pro- found effect (Fig. SC).
Models with large aspect ratio
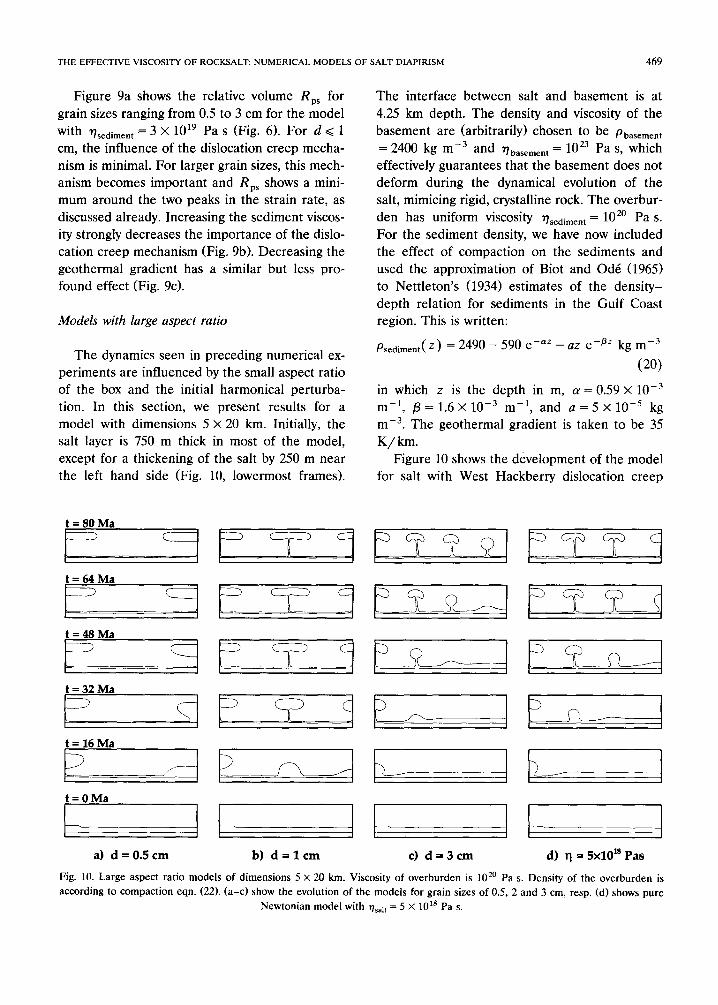
The dynamics seen in preceding numerical ex- periments are influenced by the small aspect ratio of the box and the initial harmonica1 perturba- tion. In this section, we present results for a model with dimensions 5 X 20 km. Initially, the salt layer is 750 m thick in most of the model, except for a thickening of the salt by 250 m near the left hand side (Fig. 10, lowermost frames),
t=80Ma
t=64Ma
E t=48Ma
t=32Ma
t=16Ma
t=OMa
a) d = 0.5 cm
d
b) d=lcm
The interface between salt and basement is at 4.25 km depth. The density and viscosity of the basement are (arbitrarily) chosen to be pbasement = 2400 kg m-3 and qbasement = 1O23 Pa s, which effectively guarantees that the basement does not deform during the dynamical evolution of the salt, mimicing rigid, crystalline rock. The overbur- den has uniform viscosity v,,diment = lo*’ Pa s. For the sediment density, we have now included the effect of compaction on the sediments and used the approximation of Biot and Ode (1965) to Nettleton’s (1934) estimates of the density- depth relation for sediments in the Gulf Coast region. This is written:
psediment( z) = 2490 - 590 eenr - az ePPZ kg rnp3
(20)
in which z is the depth in m, cx = 0.59 X lo-” m-‘, /3 = 1.6 X 10e3 m-‘, and a = 5 X 10m5 kg mp3. The geothermal gradient is taken to be 35 K/km.
Figure 10 shows the development of the model for salt with West Hackberry dislocation creep
3
c) d=3cm d) q = 5x10’* Pas
Fig. 10. Large aspect ratio models of dimensions 5 x 20 km. Viscosity of overburden is 10 ” Pa s. Density of the overburden is according to compaction eqn. (22). (a-c) show the evolution of the models for grain sizes of 0.5, 2 and 3 cm, resp. Cd) shows pure
Newtonian model with ~~~~~ = 5 x 10’s Pa s.
470 P.E. VAN KEKEN ET AI.
properties and with grain sizes d = 0.5, 1 and 3 cm. The simulations show the development of a diapir from the thickened portion of the salt at the left, followed by the later appearance of one or more secondary diapirs. The diapirs do not reach the surface because of the lower density of the uppermost sediments. There is an effect of grain size on development of the secondary di- apirs. In the case with the smallest grain size Cd = 0.5 cm, Fig. lOa), the salt behaves mostly in a Newtonian manner and has a low effective viscosity compared with that of the sediment (average viscosity of the salt at 4 km depth = 3 X
1016 Pa s). The sediments control the evolution of the diapirs, resulting in two widely spaced diapirs.
Postdepositional CSOMa I 7 r
We have calculated the development of models with a pure Newtonian viscosity for the sediment. It was observed that increasing the viscosity of the salt decreases the spacing between the di- apirs. Figure lob and c illustrates this with the the evolution of the model for d = 1 and 3 cm. In these cases, the average viscosity in the salt at the 4 km depth is around 3 x 10” Pa s, and 5 x 10” Pa s, respectively. Figure 10d shows the develop- ment of a pure Newtonian model with qsalt = 5 x
10’s Pa s. There are minor differences in compar- ison with the large grain size model; the diapirs evolve faster and the spacing between them is larger. This can be partly attributed to the non- Newtonian character of the salt in the large grain
Syndepositioml
Syndepositional t= 64Ma
Syndepositional I .
t=OMa I
3 a) d = 0.5 cm
S ndepositional
b)d=3cm
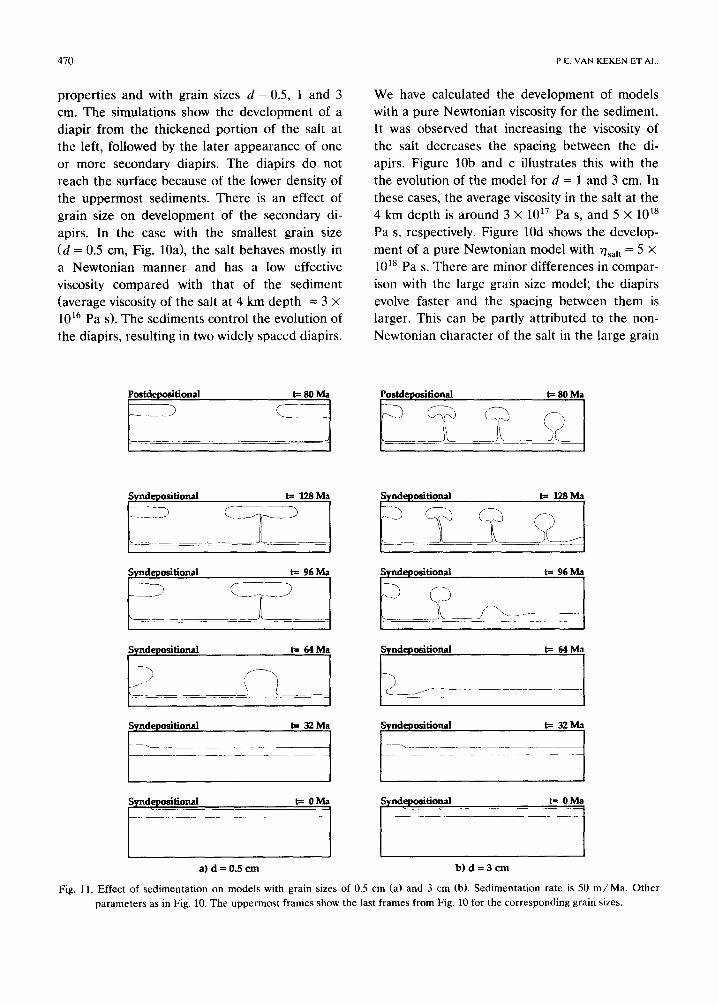
Fig. 11. Effect of sedimentation on models with grain sizes of 0.5 cm (a) and 3 cm (b). Sedimentation rate is 50 m/Ma. Other parameters as in Fig. 10. The uppermost frames show the last frames from Fig. 10 for the corresponding grain sizes.
THE EFFECTIVE VISCOSITY OF ROCKSALT: NUMERICAL MODELS OF SALT DIAPIRISM 471
size model, causing localization of flow (smaller wavelengths) and a viscosity that can be locally higher than the average viscosity (slower evolu- tion). However, these non-Newtonian effects do not seem to have a major influence.
Syndepositional diapirism
The above simulations do not include the ef- fects of sedimentation and erosion, but model dynamic evolution after instantaneous burial of the salt beneath a thick layer of sediments. This is clearly an oversimplification (Roemer and Neugebauer, 1991). We have addressed this by extending the present approach to models in which diapirism can occur during sedimentation. The lowermost frames of Figure 11 show the initial configuration used; the base of the salt layer (with similar geometry as in Fig. 10) is at a depth of 1 km. Sedimentation is slow, at a rate of 50 m/Ma, and continues until the base of the salt reaches a depth of 4.25 km. The density of the sediments is given by Eq. (19). The viscosity of the sediments is taken as 7sediment = 102’ Pa s.
Figure lla shows the development of the model for grain size d = 0.5 cm. Diapirism starts only after the sediments on top have compacted and the density has become higher than the salt den- sity. The top frame of Figure lla shows the final stage of the postdepositional evolution as in Fig- ure 10. In the syndepositional case the diapirs start evolving with less overburden than in the postdepositional case, which results in a smaller diapir spacing (Jackson et al., 1990). The synde- positional model with the larger grain size d = 3 cm (Fig. lib) behaves differently. The salt has to be buried deeper for diapirism to set in as a consequence of the higher viscosity (both grain size and temperature dependent), and the diapir spacing is approximately equal to that in the postdepositional case.
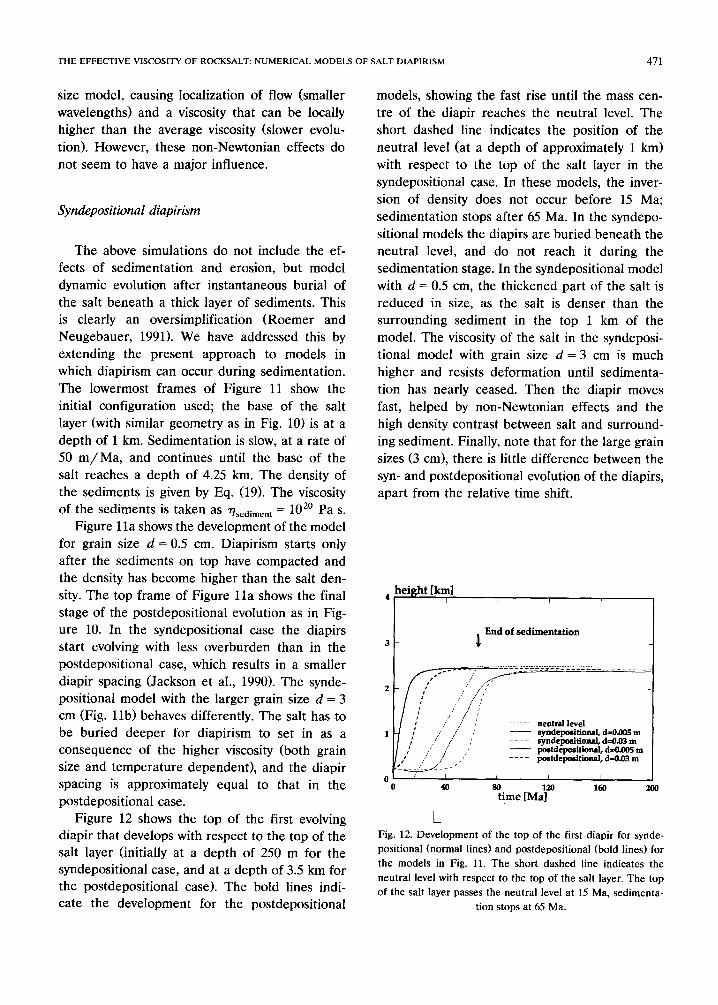
Figure 12 shows the top of the first evolving diapir that develops with respect to the top of the salt layer (initially at a depth of 250 m for the syndepositional case, and at a depth of 3.5 km for the postdepositional case). The bold lines indi- cate the development for the postdepositional
models, showing the fast rise until the mass cen- tre of the diapir reaches the neutral level. The short dashed line indicates the position of the neutral level (at a depth of approximately 1 km) with respect to the top of the salt layer in the syndepositional case. In these models, the inver- sion of density does not occur before 15 Ma; sedimentation stops after 65 Ma. In the syndepo- sitional models the diapirs are buried beneath the neutral level, and do not reach it during the sedimentation stage. In the syndepositional model with d = 0.5 cm, the thickened part of the salt is reduced in size, as the salt is denser than the surrounding sediment in the top 1 km of the model. The viscosity of the salt in the syndeposi- tional model with grain size d = 3 cm is much higher and resists deformation until sedimenta- tion has nearly ceased. Then the diapir moves fast, helped by non-Newtonian effects and the high density contrast between salt and surround- ing sediment. Finally, note that for the large grain sizes (3 cm), there is little difference between the syn- and postdepositional evolution of the diapirs, apart from the relative time shift.
( height [km] / I I I
I _ End of sedimentation I 3
t
4 1
--~~---- ne0tr.d level __ syndepositional,d=OM)5m _ - - - - syndepositional, d=OM m - postdepsitiolul, d=&OO5 m ---- postdepo&imal,d=O.mm
o- I I / I 0 40 SO
time [May 160 200
L Fig. 12. Development of the top of the first diapir for synde-
positional (normal lines) and postdepositional (bold lines) for
the models in Fig. 11. The short dashed line indicates the
neutral level with respect to the top of the salt layer. The top
of the salt layer passes the neutral level at 15 Ma, sedimenta-
tion stops at 65 Ma.
372 P.C. VAN KtKEN ET Al..
Discussion
Sensitiviry of results to variability in constitutive parameters
The results presented above have been ob- tained using the creep parameters of West Hack- berry salt (WH2; see Table 2) to describe the dislocation creep contribution to total strain rate. For comparison we have calculated the develop- ment of models using the dislocation creep pa- rameters for salt from the Asse mine in Germany (BGRCI). Most other types of salt quoted in table 2 of Wawersik and Zeuch (1986) show dislo- cation creep behaviour that is intermediate be- tween these two, at least in the strain rate region of interest (see Carter and Hansen, 1983; Wawer- sik and Zeuch, 1986). As expected from Figure 1, the Asse salt parameters lead to a lower contribu- tion by dislocation creep to the total strain rate, in comparison to the creep parameters of the West Hackberry salt. A larger volume of the salt is in the Newtonian pressure-solution field and for the larger grain sizes the effective average viscosity is higher.
Turning to the pressure-solution creep law (21, used in present study, uncertainties in the pre-ex- ponential factor and activation energy reported by Spiers et al. (19901, imply uncertainties in the effective viscosity qps of a factor of around 3. However, this is negligible in comparison to vari- ations in qps as a consequence of grain size and temperature changes (2-3 orders of magnitude), and the uncertainties in question have a negligi- ble effect on the evolution of the models.
In the present paper, the temperature distribu- tion in the salt has been calculated assuming that the thermal conductivity of the salt is 5 x higher than that of the surrounding sediment. Thermal conductivity data for some typical sediments is given by Clark (1966): k = l-2.3 W m-‘K-’ for sandstone (depending on porosity), and k = 1.75 W m -’ K- ’ for shale. The thermal conductivity of rocksalt has been measured as 5.7 W m-‘K-’ (Schoen, 19831, giving a range of 2.5-5.7 for the thermal conductivity ratio. Varying this ratio in the models changes the lateral temperature dis- tribution, which is important during the the di-
apiric stage, but even then no clear effect on the rheology can be observed. The primary effect is the decrease of temperature as the salt moves up along the geotherm. The present results have shown that it is important to take this into ac- count when calculating the effective viscosity.
In our models, we have ignored thermal con- vection. This is valid at least for thin (- 1 km) layers. For salt layers with a thickness above 2 km, thermal convection has been suggested as a feasible mechanism for the internal deformation of the salt. For example, Jackson et al. (1990) used linear stability analysis to study thermal convection within the salt of the Great Kavir region. (Note the erroneously high thermal ex- pansion coefficient (Y printed in Jackon et al. (1990, their table 3.2): (Y = lo-“ K-’ should be used to reconstruct their figure 3.8. This agrees better with the quoted value of LY from Gevant- man (1981): (Y = 4.25 x lops K-‘). For a viscosity lower than - 10u’ Pa s the thermal Rayleigh number in a layer > 2 km thick is larger than the critical Rayleigh number, Ra, = O(lO”), and low-amplitude thermal convection might be possi- ble. Jackson et al. (19901 have used this effective viscosity of lOI Pa s to scale both laboratory and analytical models of the Great Kavir salt diapirs. It is not clear to us how they obtained this low value of < 1OL6 Pa s for pressure-solution creep in salt with grain size d = 5 mm (Jackson et al., 1990; their fig. 2.11, since most of the results published by Urai et al. (1986) to which they refer, are consistent with the creep law of Spiers et al. (1990, see fig. 9), used in the present study (Eq. 7). For T = 70°C and d = 0.005 m, this creep law gives an effective viscosity (for pressure-solu- tion creep alone) qps = 4 X lOi’ Pa s, which is almost two orders of magnitude higher than the value used by Jackson et al. (1990). Such a value rules out thermal convection within the salt. To obtain thermal convection in salt using present rheology, a thickness of the salt layer of more than 30 km is required.
In addition to the above, Jackson et al. (1990) used the same low value of 10” Pa s for the viscosity of the sediments, to scale the results obtained from the centrifuge models and linear stability analyses. Inserting this value for T,,~~,,_~
THE EFFECTIVE VISCOSITY OF ROCKSALT: NUMERICAL MODELS OF SALT DIAPIRISM 473
in our models gave an unrealistically fast develop- ment of the diapirs. In models with the same initial geometry as in Figure 10, and with T,,,~ =
~sediment = 10lh Pa s, the first diapir reached ma- turity in approximately 12,000 years. A complete turn-over of the salt was observed within 50,000 years. This short time scale is confirmed by figure 3.10 in Jackson et al. (19901, where for some models of the Kavir region a characteristic time on the order of 5,000 years is given. This fast evolution contradicts geological evidence (see Jackson and Talbot, 1986; Jackson et al., 1990, p. 92). As already shown by several authors (e.g., Woidt, 1978; Roemer and Neugebauer, 1991; this paper) the effective viscosity of the overburden should be at least 1019 Pa s to obtain evolution of the diapiric system on a geologically reasonable time scale of l-10 Ma.
Comments on tectonic effects and sediment rheol-
ogY
The average strain rates in the models shown in this paper are typical of salt diapirism driven by buoyancy alone. Higher strain rates can occur in cases with differential loading, extrusion of the salt (Jackson and Talbot, 19861, and active com- pressional tectonics (Daudrt et al., 1992). For these higher strain rates, the dislocation creep mechanism might play a role even for salt with smaller grain sizes.
In most analytical, laboratory and numerical studies of salt diapirism, the rheology of the sediment has been modelled as a Newtonian fluid. The conclusions drawn in this paper with regard to diapir spacing, rise rate and overburden con- trol can be compared with these previous models. For most geological situations the approximation of Newtonian viscous flow in the overburden is clearly not appropriate, and it emerges that the dynamics of salt diapirism is strongly, if not com- pletely, governed by the brittle behaviour of the sediments. Recently, more realistic approxima- tions of the brittle/ frictional-plastic behaviour of the sediments have been used in physical mod- elling of salt diapirism by employing sand as an overburden, resting on silicone putty to simulate salt (e.g., Vendeville and Cobbold, 1987; Vende-
ville and Jackson, 1992). Incorporation of a real- istic deformation law for the overburden is the most important subject for future numerical mod- elling work on salt dynamics.
Microstructural evolution implied by models
The present buoyancy-driven models, in which the rheology of salt is described using Eqs. (l)-(3), predict that the creep behaviour of the rocksalt during diapirism is dominated by the pressure- solution mechanism when the salt is fine-grained (d G 1 cm), with dislocation creep becoming im- portant at coarser grain sizes. For the range of grain size perhaps most frequently seen in natural salts (- l-3 cm), both mechanisms are predicted to occur, operating either simultaneously, se- quentially or even in cyclic alternation in differ- ent regions of the salt. Often, pressure solution is predicted to dominate in the early and late stages of diapirism, with dislocation creep featuring in the main stage of upwelling. The present models thus imply that coarse natural diapiric salts (d > 1 cm) should show microstructural evidence for both mechanisms, whereas finer salts should show pressure-solution microstructures only.
As pointed out by Spiers et al. (1990), some natural domal/anticlinal salts do indeed show microstructural evidence for both dislocation and solution-transfer processes. For example, the Asse (Speisesalz) rocksalt (d N 0.5-2 cm) shows nu- merous overgrowth features indicative of solution transfer, as well as a lattice preferred orientation and subgrain structures indicative of dislocation creep @piers et al., 1986; Urai et al., 1987).
On the other hand, the microstructure of most domal/anticlinal salts, both coarse- and fine- grained, seems to be more or less entirely domi- nated by dislocation creep features such as sub- grain development (Carter et al., 1990). In such cases, it is possible that water loss during the natural diapiric process may have inhibited pres- sure-solution creep in the later stages of up- welling; there is a great deal of evidence in the literature for water loss during diapirism [e.g., from 1 to 2% in bedded salt to < 0.01% in some salt domes (Carter and Hansen, 198311. An alter- native explanation lies in the point made above
474 P.E VAN KEKEN ET Al..
regarding the possible occurrence of driving forces other than buoyancy. The concomitant increase in the importance of dislocation creep could then effectively eliminate pressure solution and/ or ev- idence for its the microstructural signature. Lastly, we cannot rule out the possibility that pressure solution may be more or less precluded at natural strain rates by a transition from the dislocation creep behaviour described by Eq. (3) to disloca- tion creep with a lower stress sensitivity of strain rate, such as the climb-controlled mechanism re- ported recently by Carter et al. (1993).
Conclusions
(1) The effective viscosity of salt at strain rates typical of diapirism driven by buoyancy alone is influenced by the two assumed parallel mecha- nisms of dislocation creep and fluid-enhanced grain-boundary diffusional creep, thought to best describe the behaviour of salt in nature. In most of the models that were considered, the diffu- sional creep mechanism was found to be domi- nant. However, the efficiency of the diffusional creep mechanism is strongly dependent on the grain size, and for larger grain sizes (> 1 cm> the dislocation creep mechanism is important during the most vigorous diapiric stage, effectively reduc- ing the viscosity.
(2) For the assumed dislocation and diffu- sional creep laws, changing the grain size from 0.5 cm to 3 cm increases the effective viscosity by more than two orders of magnitude. Typical val- ues obtained for the viscosity of salt at 70°C and low strain rates (E < lo-l5 s-l) are 3 X lOI Pa s for a grain size of 0.5 cm and 9 X 10¹⁹ Pa s for a grain size of 3 cm.
(3) Similarly, a temperature decrease of 150 K from 200 to 50°C increases the viscosity by one order of magnitude. The lateral variation of tem- perature as a consequence of the higher diffusiv- ity of the salt has a negligible effect on the effective viscosity. Varying the geotherm in the range typical for diapiric regions (25-35 K/km), has only a minor effect.
(4) The rheology of the sediment controls the diapiric rate. In the present models, which use a Newtonian viscous rheology for the sediments,
the ratio between the viscosity of the salt and the sediment is an important factor in determining the geometry. The dislocation creep mechanism in the salt is found to have little influence on diapiric rate or geometry.
(5) For salt with small grain sizes (d < 1 cm>, a difference is found between post- and syndeposi- tional models of diapirism. In the syndepositional case, the small-grained salt is weak enough to start diapirism during sedimentation and a smaller spacing between the diapirs is observed, as com- pared to the postdepositional models. For the larger grain sizes, the rocksalt is more viscous and the amount of deformation during sedimentation is negligible.
(6) The implication of the present models for microstructural development in salt diapirs is consistent with microstructural evidence found in some coarser natural salts for the operation of both dislocation and fluid-assisted diffusional processes. However, the dominance of dislocation microstructures reported for many other salts, even fine-grained ones, suggests that the relative importance of the pressure-solution mechanism can be suppressed during natural diapirism. This could be brought about through (a) water loss, (b) increased deformation rates caused by other driv- ing forces in addition to buoyancy, or (c) the operation, at natural strain rates, of some rela- tively easy dislocation mechanism not accounted for in the creep equation used in this study.
Acknowledgements
This research was partly sponsored by the Dutch Ministry of Economic Affairs in connec- tion with the OPLA research program on ra- dioactive waste management. We thank Gijs Remmelts, Bertrand DaudrC, and Roberto Fer- rez Weinberg for stimulating discussions. N.L. Carter is also thanked for discussions. These were made possible by NATO Collaborative Research Grant No. 900591. M.P.A. Jackson and B. Ven- deville are thanked for constructive reviews that improved the manuscript significantly. Wim Spakman is gratefully acknowledged for providing his graphical software.
THE EFFECIWE VISCOSITY OF ROCKSALT: NUMERICAL MODELS OF SALT DIAPIRISM 475
References
Blankenbach, B., Busse, F., Christensen, U., Cserepes, L., Gunkel, D., Hansen, U., Harder, H., Jarvis, G., Koch, M.,
Marquart, G., Moore, D., Olson, P., Schmeling, H. and Scbnaubelt, T., 1989. A benchmark comparison for mantle convection codes. Geophys. J. Int., 98: 23-38.
Biot, M.A. and Ode, H., 1965. Theory of gravity instability with variable overburden and compaction. Geophysics, 30: 213-221.
Bird, R.B., Stewart, W.E. and Lightfoot, E.N., 1960. Trans- port Phenomena. Wiley, New York, NY.
Bobineau, J.P., 1992. Simulations numeriques de phenomenes tectoniques. Ph.D. Thesis, Ecole Centrale de Paris.
Busse, F.H., 1989. Fundamentals of thermal convection. In: W.R. Peltier (Editor), Mantle convection, Plate Tectonics and Global Dynamics. Gordon and Breach, New York, NY, pp. 23-95.
Byerlee, J.D., 1978. Friction of rocks. Pure Appl. Geophys., 116: 615-626.
Carter, N.L. and Hansen, F.D., 1983. Creep of rocksalt. Tectonophysics, 92: 275-333.
Carter, N.L., Kronenberg, A.K., Ross, J.V. and Wiltschko, D.V., 1990. Control of fluids on deformation of rocks. In: R.J. Knipe and E.H. Rutter (Editors), Deformation Mech- anisms, Rheology and Tectonics. Geol. Sot. Spec. Pub]., 54: 1-13.
Carter, N.L., Handin, J., Russell, J.E. and Horseman, ST., 1993. Rheology of rocksalt. J. Struct. Geol., J.M. Christie Festschr. (in press).
Clark, S.P., 1966. Thermal conductivity. In: S.P. Clark (Editor), Handbook of Physical Constants. Geol. Sot. Am. Mem., 97: 459-482.
Christensen, U., 1984. Convection with pressure- and temper- ature-dependent non-Newtonian rheology. Geophys. J.R. Astron. Sot., 77: 343-384.
Christensen, U., 1992. An Eulerian technique for thermome- chanical modelling of lithospheric extension. J. Geophys. Res., 97: 2015-2036.
Christensen, U. and Yuen, D.A., 1984. The interaction of a subducting lithospheric slab with a chemical or phase boundary. J. Geophys. Res., 89: 438994402.
Cuvelier, C., Segal, A. and Van Steenhoven, A.A., 1986. Finite Element Methods and Navier-Stokes Equations. Reidel, Dordrecht, 483 pp.
Cobbold, P.R. and Szatmari, P., 1991. Radial gravitational gliding on passive margins. Tectonophysics, 188: 249-289.
DaudrC, B., Poliakov, A., Van Balen, R., Cloetingh, S. and Stephenson, R., 1992. Salt diapirism and mechanics of sedimentary basins. Ann. Geophys., Suppl. to 10: C91.
Gevantman, L.H. (Editor), 1981. Physical properties data for rocksalt. U.S. Dep. Commerc., Natl. Bur. of Standards Mon., 167.
Hansen, U. and Ebel, A., 1984. Experiments with a numerical model related to mantle convection: boundary layer be-
haviour of small- and large scale flows. Phys. Earth Planet.
Inter., 36: 374-390. Hatheway, A.W. and Kiersch, G.A., 1982. Engineering prop-
erties of rock. In: R.S. Carmichael (Editor), Handbook of Physical Properties of Rocks. CRC Press, Boca Raton, FL, Vol. II, pp. 289-331.
Heard, H.C., 1972, Steady-state flow in polycrystalline halite at pressure of 2 kilobars. In: H.C. Heard et al. (Editors), Flow and Fracture of Rock. Geophys. Monogr., Am. Geo- phys. Union, 16: 191-210.
Horseman, S.T. and Handin, J., 1990. Triaxial compression tests on rocksalt at temperatures from 50°C to 200°C and strain rates from 1O-4 to 10e9/s. Geophys. Monogr., Am. Geophys. Union, 56: 103-110.
Horseman, S.T., Russel, J.E., Hardin, J. and Carter, N.L., 1993. Slow experimental deformation of Avery Island Salt. In: H. Kakihana, H.R. Hardy Jr., T. Hoshi and K. Toyokura (Editors), Proc. Seventh Int. Symp. on Salt, April 6-9 1992, Kyoto, Japan. Elsevier, Amsterdam, Vol. I, pp. 67- 74.
Hunsche, U., 1977. Modellrechnungen zur Entstehung von Salzstockfamilien. Diss. Techn. Univ. Braunschweig, 102
PP. Jackson, M.P.A. and Talbot, C.J., 1986. External shapes,
strain rates, and dynamics of salt structures. Geol. Sot. Am. Bull., 97: 305-323.
Jackson, M.P.A., Cornelius, R.R., Craig, C.H., Gansser, A., Stoecklin, J. and Talbot, C.J., 1990. Salt diapirs of the Great Kavir, Central Iran. Geol. Sot. Am., Mem. 177.
Jenyon, M.K., 1986. Salt Tectonics. Elsevier, Amsterdam. Kirby, S.H. and Kronenberg, A.K., 1987. Rheology of the
lithosphere: selected topics. Rev. Geophys., 25: 1219-1244. Kopitzke, U., 1979. Finite element convection models: com-
parison of shallow and deep mantle convection, and tem- peratures in the mantle. J. Geophys., 46: 97-121.
Malevsky, A.V. and Yuen, D.A., 1992. Strongly chaotic non- Newtonian mantle convection. Geophys. Astrophys. Fluid Dyn., 65: 149-171.
Mart, Y. and Hall, J.K., 1984. Structural trends in the north- ern Red Sea. J. Geophys. Res., 89: 352-364.
Nettleton, L.L., 1934. Fluid mechanics of salt domes. Bull. Am. Assoc. Pet. Geol., 18: 1175-1204.
Parmentier, E.M., Turcotte, D.L. and Torrance, K.E., 1976. Studies of finite amplitude non-Newtonian thermal con- vection with application to convection in the earth’s man- tle. J. Geophys. Res., 81: 1839-1846.
Poliakov, A. and Podladchikov, Y., 1992. Diapirism and to- pography. Geophys. J. Int., 109: 553-564.
Poliakov, A., Van Balen, R., Podladchikov, Y., Daudre, B., Cloething, S. and Talbot, C.J., 1993. Numerical analysis of how sedimentation and redistribution of surficial sedi- ments affects salt diapirism. submitted to Tectonophysics.
Ranalli, G., 1987. Rheology of the Earth. Allen and Unwin, Boston.
Remmelts, G. and Van Rees, D.J., 1992. Structureel-geo-
476 P.E VAN KEKEN El Al..
logische ontwikkeling van zoutstructuren in noord-Neder-
land en het Nederlands deel van het continentaal plat.
Dutch Geol. Surv., Rep. 30105/TRB2.
Roemer, M. and Neugebauer, H., 1991. The salt dome prob-
lem: a multilayered approach. J. Geophys. Res., 96: 2389-
2396.
Schmeling, H., 1987. On the relation between initial condi-
tions and late stages of Rayleigh-Taylor instabilities.
Tectonophysics, 133: 6.5-80.
Schoen, J., 1983. Petrophysik. Ferdinand Enke Verlag.
Stuttgart, 405 pp. Schultz-Ela, D.D. and Bobineau, J.P., 1992. Extension of a
brittle layer over a ductile substratum. AGU fall meeting
1992, EOS Trans. AGU, 73: 561.
Selig, F. and Wallick, G.C., 1966. Temperature distribution in
salt domes and surrounding sediments. Geophysics, 2:
346-361
Skrotzki, W. and Haasen, P., 1988. The role of cross slip in
the steady-state creep of salt. In: H.R. Hardy and M.
Langer (Editors), The Mechanical Behaviour of Salt: Pro-
ceedings of the Second Conference. Tram Tech Publica-
tions, Clausthal-Zellerfeld, pp. 69-81.
Spiers, C.J., Urai, J.L., Lister, G.S., Boland, J.N. and Zwart,
H.J., 1986. The influence and fluid-rock interaction on
the rheology of salt rock. Nuclear Science and Technology,
EUR 10399 EN. Office for Official publications of the
European Communities, Luxembourg.
Spiers, C.J., Urai, J.L. and Lister, G.S., 1988. The effect of
brine (inherent or added) on rheology and deformation
mechanisms in salt rock. In: H.R. Hardy and M. Langer
(Editors), The Mechanical Behaviour of Salt: Proceedings
of the Second Conference. Trans Tech Publications,
Clausthal-Zellerfeld, pp. 89-102.
Spiers, C.J., Peach, C.J., Brzesowsky, R.H., Schutjens,
P.M.T.M., Liezenberg, J.L. and Zwart, H.J., 1989. Long-
term rheological and transport properties of dry and wet
salt rocks. Nuclear Science and Technology, EUR 11848
EN. Office for Official publications of the European Com-
munities, Luxembourg.
Spiers, C.J., Schutjens, P.M.T.M., Brzesowksy, R.H., Peach,
C.J., Liezenberg, J.L. and Zwart, H.J.. 1990. Experimental
determination of constitutive parameters governing creep
of rocksalt by pressure solution. In: R.J. Knipe and E.H.
Rutter (Editors), Deformation Mechanisms, Rheology and
Tectonics. Geol. Sot. Spec. Publ., 54: 215-227.
Urai, J.L., Spiers, C.J., Zwart, H.J. and Lister, G.S., 1986.
Water weakening effects in rocksalt during long term
creep. Nature, 324: 554-557.
Urai, J.L., Spiers, C.J., Peach, C.J., Franssen, R.C.M.W. and
Liezenberg, J.L., 1987. Deformation mechanisms operat-
ing in naturally deformed halite as deduced from mi-
crostructural investigations. Geol. Mijnbouw, 66: 165-176.
Van den Berg, A.P., Van Keken, P.E. and Yuen, D.A., 1993.
The effects of a composite non-Newtonian and Newtonian
rheology on mantle convection. Geophys. J. Int., 115:
62-78.
Van Keken, P.E., Yuen, D.A. and Van den Berg, A.P., 1991.
Pulsating diapiric flows: Consequences of vertical varia-
tions in mantle creep laws. Earth Planet. Sci. Lett., 112:
179-194.
Vendeville, B.C. and Cobbold, P.R., 1987. Glissements gravi-
taires synsedimentaires et failles normales listriques:
modiles experimentaux. C.R. Acad. Sci., Paris, Ser. II,
305: 1313-1319.
Vendeville, B.C. and Jackson, M.P.A., 1992. The rise of
diapirs during thin-skinned extension. Mar. Pet. Geol. 9:
331-353.
Wawersik, W.R. and Zeuch, D.H., 1986. Modeling and mech-
anistic interpretation of creep of rocksalt below 200°C.
Tectonophysics, 121: 125-152.
Woodbury, H.O., Murray, I.B., Jr., Pickford, P.J. and Akers,
W.H., 1973. Pliocene and Pleistocene depocenters, outer
continental shelf, Louisiana and Texas, Am. Assoc. Pet.
Geol. Bull., 57: 2428-2439.
Woidt, W.D., 1978. Finite element calculations applied to salt
dome analysis. Tectonophysics, 50: 369-386.
Zienkewicz, O.C., 1977. The Finite Element Method. Mc-
Graw-Hill, London, 787 pp.


![Zwick testXpo 2017 · Zwick testXpo 2017 © 2017 Malvern Instruments Limited Outline ... Unit: [ ] = 1 Pas * Isothermal, isobaric, steady state dynamic shear viscosity of an incompressible,](https://img.pdfslide.us/doc/110x75/5b94165809d3f2a65f8c3535/zwick-testxpo-2017-zwick-testxpo-2017-2017-malvern-instruments-limited-outline.jpg)