Embed Size (px)
Citation preview

The Effect of Wildfires on Water Quality
from Watershed Systems of
Southern California
Carolina B. Mendez
CE 394K.3 GIS in Water Resources
Term Project
Fall 2010

1
Table of Contents
Summary
Introduction
Finding and filtering fire and water quality data for San Diego County
Fire severity and fire burn history in San Diego County
Water quality data in San Diego County
Copper and lead concentrations in San Diego County (2005-2010)
Correlation of copper and lead concentrations to fire events in San Diego County
Comparison of copper and lead concentrations to USEPA standards
Limitations in study and recommendations
Conclusions
References

2
Summary
The objective of this project was to determine the effect of wildfires on water
quality from watershed systems of Southern California. Specifically, the purpose of this
project was to use the tools that we learned in our GIS class to determine the influence of
wildfires.
Using Arc Hydro Desktop, Arc View, Arc GIS online, and topographic basemaps,
this project investigated the effects of wildfires on water quality from San Diego County.
Two sites were investigated within the San Diego watershed: Sweetwater Res Nr Pump
Tower Upper (burned during the 2007 San Diego fires) and Loveland Res Nr Dam Site 1
Upper (not burned by the 2007 San Diego fires).
From the limited dataset of copper and lead concentrations in a burned and
unburned sites, it was determined that the 2007 fires increased metals concentrations in
burned areas. In addition, metals concentrations gradually increased overtime in
unburned areas indicating that air deposition allows the accumulation of metals into
watershed systems. Overall, this project showed that GIS tools are important to
investigate how wildfires influence the surrounding environment.
Introduction
The objective of this project is to determine the effect of wildfires on water
quality from watershed systems of Southern California. Wildfires can negatively affect

3
the environment by destroying vegetation, increasing particle erosion, and contributing to
pollutants in water bodies (Burke et al., 2010).
Burke et al. 2010 showed that wildfires negatively affect watershed systems by
increasing the mobilization of particle-bound mercury into the water column. The same
study showed that sediments had a decrease in mercury and organic concentrations due
volatilization from high temperatures during wildfires. Years after the fire, watersheds
also showed a recovery trend with higher mercury and organic concentrations found in
post-fire sediments; this was attributed to cumulative air-particle deposition on the
watershed over time. Following the conclusions made from Burke et al. 2010, the current
GIS project is meant to investigate how wildfires affect other water quality parameters in
watershed systems. Specifically, the purpose of this project is to use the tools that we
learned in our GIS class to determine the influence of wildfires on the surrounding
environment.
To investigate the effects of wildfires on watershed systems, it was first proposed
to collect data from one of the following watersheds; Arroyo Seco, Piru Creek, and
Malibu. These watersheds are located in Los Angeles and they suffered from multiple fire
events that showed destruction of vegetation, increased erosion, and increased mercury
concentrations in post-fire areas (Burke et al., 2010). After reviewing and analyzing the
available United States Geological Survey (USGS) and United States Environmental
Protection Agency (EPA) water quality data form Arc Hydro Desktop, Arc View, Arc
GIS online, and topographic basemaps, it was determined that watersheds in San Diego
County had a larger dataset on both wildfires and water quality data. As a result, this
project attempts to correlate wildfire events to water quality data in San Diego County.

4
The acquisition and interpretation of wildfire and water quality data is discussed in the
following sections.
Finding and filtering fire and water quality data for San Diego County
Fire severity and fire burn history in San Diego County
San Diego County is located in Southern California. The first step in this project
was to identify the fire data available in San Diego County, including fire severity zones
and fire burn history. The identification of fire severity zones in San Diego County is
useful to interpret water quality data; for example, if high metals concentrations are
detected in high fire severity zones, then this might be an indication that multiple fires in
the area could have mobilized particle-bound contaminants. In addition, the fire burn
history is also useful to interpret the data by determining where and when the fire events
occurred. As a result, fire severity zones and fire burn history were identified in San
Diego County by using NAD1983 Datum, Arc View, Arc GIS online, and topographic
basemaps. As shown by Figure 1, San Diego County contains fire severity zone data and
fire burn history from 1910 to 2007.

5
Figure 1. Map of study area showing fire severity zones and fire burn history in San Diego
County, California.
The classification of “very high” severity zone shows that San Diego County is
prone to suffer from multiple wildfires (illustrated by the various sections shown in red
[Figure 1]). As expected, the fire severity zone also corresponds directly to the fire burn
history. Specifically, the 1992 to 2007 fire burn history shows that fires were
significantly centered in the “very high” severity zone of San Diego County. Now that
the fire severity zones and fire burn history have been identified, the next step is to relate
this fire data to USGS and USEPA water quality data.
Water quality data in San Diego County
USEPA regulates various water quality parameters to insure public health
(USEPA [2010]). To analyze how wildfires affect water quality, each water quality

6
parameter was selected based on whether or not it appeared on the USEPA regulation
website and accessibility to the data from Arc Hydro Desktop for San Diego County. The
water quality parameters that were selected are as follows: atrazine, mercury, lead,
copper, arsenic, total organic carbon, and turbidity.
According to the USEPA website (USEPA, 2010), atrazine is an organic
compound used as an herbicide for agricultural purposes; it is also a source of
contamination in urban runoff that causes cardiovascular and reproductive problems in
humans; at elevated metals concentrations, mercury, lead, copper, and arsenic can be
toxic and cause internal tissue damage in humans; turbidity is attributed to soil runoff and
it is regulated to decrease bacteria and metals concentrations that are adsorbed onto
particle surfaces.
Although total organic carbon is not regulated by USEPA, it was included in this
study to make temperature correlations. For example, Stronach and McNaughton (1989)
reported temperatures of 407 to 830 °C in fire-burned soils; since TOC is volatile at
550°C (APHA, 1998), a decrease in total organic carbon concentrations in watershed
systems could be linked to the fire burn severity. As a result, a total of 7 water quality
parameters were selected.
Using Arc Hydro desktop and topographic basemaps, the water quality data for
the 7 water quality parameters was searched on the database from 1920 to 2010 to
correlate to the fire burn history data available in San Diego County. Based on the
database, the range of dates that had data were from 1980 to 2010 (Figure 2; turbidity not
shown). All water quality parameters were characterized as sporadic observations in San
Diego County from the Arc Hydro Desktop archive; that is, the observations were not
7
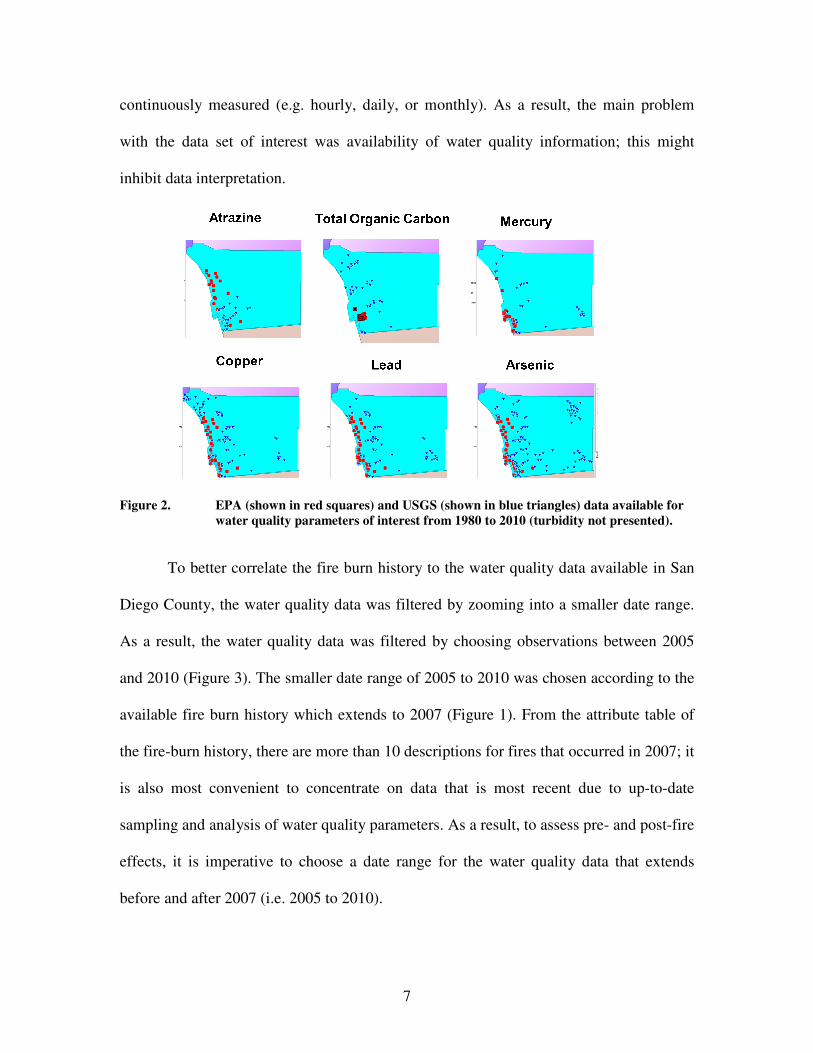
continuously measured (e.g. hourly, daily, or monthly). As a result, the main problem
with the data set of interest was availability of water quality information; this might
inhibit data interpretation.
Figure 2. EPA (shown in red squares) and USGS (shown in blue triangles) data available for
water quality parameters of interest from 1980 to 2010 (turbidity not presented).
To better correlate the fire burn history to the water quality data available in San
Diego County, the water quality data was filtered by zooming into a smaller date range.
As a result, the water quality data was filtered by choosing observations between 2005
and 2010 (Figure 3). The smaller date range of 2005 to 2010 was chosen according to the
available fire burn history which extends to 2007 (Figure 1). From the attribute table of
the fire-burn history, there are more than 10 descriptions for fires that occurred in 2007; it
is also most convenient to concentrate on data that is most recent due to up-to-date
sampling and analysis of water quality parameters. As a result, to assess pre- and post-fire
effects, it is imperative to choose a date range for the water quality data that extends
before and after 2007 (i.e. 2005 to 2010).

8
Figure 3. EPA (shown in red squares) and USGS (shown in blue triangles) data available for
atrazine, mercury, lead, copper, arsenic, total organic carbon, and turbidity
between 2005 to 2010.
Once all of the 2005 to 2010 water quality data was collected for San Diego
County, the next step was to use the attribute table of “Search Results” to choose the sites
of interest. There were many observations at various locations within San Diego County,
however, the consistency of the observations also was limited. For example, atrazine,
mercury, arsenic, and total organic carbon data only was available between 2008 to 2009.
The data that extended from 2005 to 2010 only belonged to copper and lead. Therefore,
the data was filtered by the choosing those sites that had observations for lead and copper
between the years of 2005 to 2010. In doing so, 4 sites were chosen within San Diego
County (Figure 4). The 4 sites chosen were 1) Loveland Res Nr Dam Site 1 Upper, 2)
Sweetwater R A Low Flow Div Dam ABV Sweetwater, 3) Sweetwater Res E End Res
Fill Bndry Upper, and 4) Sweetwater Res Nr Pump Tower Upper.

9
Figure 4. The 4 observation sites containing copper and lead data between 2005 to 2010.
Once the water quality data and sites were chosen for 2005 to 2010, the next step
was to plot the copper and lead data at the four sites (Figures 5 and 6). Notice that these
data plots show that there is paucity in copper and lead observations for two of the four
sites: Sweetwater Res E End Res Fill Bndry Upper and Sweetwater R A Low Flow Div
Dam ABV Sweetwater only show 3 copper and 3 lead observations between 2005 to
2010. For the two other sites, Loveland Res Nr Dam Site 1 Upper and Sweetwater Res
Nr Pump Tower Upper, more than 10 copper and lead observations are shown between
2005 to 2010.

10
Figure 5. Copper concentrations between 2005 to 2010 for the 4 observations sites in San
Diego County.
Figure 6. Lead concentrations between 2005 to 2010 for the 4 observations sites in San Diego
County.
Copper and lead concentrations in San Diego County (2005-2010)
Water quality data was assessed by choosing two of the four sites that had a larger
range of copper and lead observations in San Diego County. The two sites selected,

11
Loveland Res Nr Dam Site 1 Upper and Sweetwater Res Nr Pump Tower Upper, were
plotted on San Diego County and both locations are located within the San Diego
watershed (Figure 7).
Figure 7. San Diego watershed (shown in green) and 2 observation sites (highlighted in
yellow) selected for water quality analysis. Note: The other 2 observations sites
(highlighted in blue) were not chosen due to limited copper and lead data.
The copper and lead data for Loveland Res Nr Dam Site 1 Upper and Sweetwater
Res Nr Pump Tower Upper are summarized in Figures 8 and 9. The Sweetwater Res Nr
Pump Tower Upper site shows the highest concentration of copper in October 2007 and
the highest concentration of lead in January 2008; the site also shows multiple spikes for
copper and lead between 2005 and 2010. The Loveland Res Nr Dam Site 1 Upper site
shows a slight increase in lead concentration in January 2008 and an increasing trend of

12
copper and lead concentrations after June 2008; the highest copper and lead
concentrations were observed after January 2009.
Figure 8. Copper concentrations between 2005 to 2010 at 2 observations sites in San Diego
County.
Figure 9. Lead concentrations between 2005 to 2010 at 2 observations sites in San Diego
County.

13
Based on the copper and lead data of the two sites selected, it can be concluded
that the Sweetwater Res Nr Pump Tower Upper site is more susceptible to increases in
copper and lead concentrations as compared to the Loveland Res Nr Dam Site 1 Upper
site; this is shown by the multiple copper and lead spikes observed in the Sweetwater Res
Nr Pump Tower Upper site between 2005 to 2010. Also, it is apparent that water quality
was most affected in October 2007 and January 2008 for the Sweetwater Res Nr Pump
Tower Upper site, as shown by the highest copper and lead concentrations. In addition,
the Loveland Res Nr Dam Site 1 Upper site shows that the water quality was most
affected after June 2008, as shown by the increasing copper and lead trends. To
determine whether wildfires might have influenced these water quality observations, it is
important to go back to the fire history data to investigate possible correlations to the
water quality data.
Correlation of copper and lead concentrations to fire events in San Diego County
Since the copper and lead data show that the concentrations are affected in early
2008, it is apparent that a fire event in 2007 might have affected the water quality
parameters. As a result, the fire burn history in San Diego County was investigated
further for 2007. Using the attribute table of the copper and lead data from ArcHydro
Desktop (Table 1), the highlighted sites were used to export the latitude and longitude
information into ArcGIS.

14
Table 1. Attribute table for copper and lead data acquired from ArcHydro Desktop. Note:
The 2 highlighted rows represent information for the 2 sites in San Diego County,
including latitude, longitude, data type, and begin and end date times.
Latitude and longitude information for the two sites were imported into ArcGIS
and plotted on top of the 2007 fire data (Figure 8); the copper and lead data file was
projected on the NAD 1983 Datum. As shown by the 2007 fires, it is evident that the
Sweetwater Res Nr Pump Tower Upper site was directly affected by the fires because its
location was in the proximity of the fires. On the other hand, the Loveland Res Nr Dam
Site 1 Upper site was not affected by the fires because its location was not in the
proximity of the fires.
Figure 10. The 2 observations sites (yellow triangles) projected onto the 2007 fire burn data of
San Diego County (shown in red).
In 2007, the wildfire season in Southern California was responsible for the
destruction of more than 500,000 acres (Palen, 2008). The severity of the fires was
intensified by the 2006-2007 droughts which yielded high loads of dead fuel throughout

15
Southern California; the Santa Ana winds also contributed to the rapid spread of the fires
throughout San Diego County (Keeley et al, 2009). The fire started on October 20 2007,
lasted 19 days, and resulted in the destruction of more than 1500 homes (Palen, 2009).
The projection of the observations sites onto the 2007 fire burn data from San
Diego County is in accordance with the water quality data observed for copper and lead
(Figure 8 and 9). As previously mentioned, the Sweetwater Res Nr Pump Tower Upper
site had the highest concentrations of copper and lead in October 2007 and January 2008,
indicating that the 2007 October to November fires influenced the water quality by
increasing the metals concentrations immediately or within a couple of months after the
fire. This was expected since particle bound metals can be mobilized in watershed
systems after a fire event (Burke et al., 2010); in this case, the spike in copper and lead
concentrations was seen after the 2007 fire event in January 2008 for the Sweetwater Res
Nr Pump Tower Upper site, which is consistent with the mobilization of particle-bound
metals into watershed systems. The Sweetwater Res Nr Pump Tower Upper site did show
multiple spikes in copper and lead concentrations. This might be attributed to the close
proximity to the 2007 fires which could have drastically destroyed soil and vegetation. As
a result, the consistent spikes in metals concentrations are an indication that fires do
increase particle mobilization and concentrations of particle-bound metals.
The fire burn data is also consistent with the observations seen for the Loveland
Res Nr Dam Site 1 Upper site. As shown in Figure 10, the Loveland Res Nr Dam Site 1
Upper site was not in the proximity of the 2007 fires, which is consistent with the water
quality data that showed no drastic spikes in the proceeding months after the 2007 fires
(e.g. January 2008). However, after June 2008, the Loveland Res Nr Dam Site 1 Upper

16
site did show an increasing trend in copper and lead concentrations, indicating that
airborne metals could have deposited back onto the watershed; this is probable because
the 2007 fires might have volatilized metals into the air which could have deposited back
onto the watershed overtime. This is in accordance with Burke et al. 2010, which showed
that air deposition increased metal concentrations on watershed systems 1 to 2 years after
the fires occurred.
Comparison of copper and lead concentrations to USEPA standards
According to the USEPA drinking water standards, copper concentrations should
be less than 1.3 mg/L and lead concentrations should be less than 0.015 mg/L (USEPA,
2010). Figures 8 and 9 show that copper and lead concentrations were exceeded at both
burned and unburned sites between 2005 to 2010, with copper concentrations ranging
between 0.8 to 7.3 mg/L and lead concentrations ranging from 0.04 to 0.33 mg/L. In
particular, the USEPA standards were most often exceeded by the burned site, indicating
that wildfires have a negative effect on water quality parameters. As a result, this is an
indication that water quality should be stringently monitoring during and after a fire event
to protect drinking water sources.
Limitations in study and recommendations
The main limitation of this project was the accessibility to water quality data. As
previously mentioned, out of the initial 7 water quality parameters that were considered,

17
only two of the parameters had data ranging from 2005 to 2010. In addition, the
observations were sporadic, with inconsistency in sampling time of hourly or daily
values. As a result, the interpretation of the water quality data in this project was limited
to the data that was available online.
To make the water quality dataset more robust, it is recommended that ARC
Hydro Desktop should be more accessible to other users. Although government agencies
like USEPA and USGS provide water quality data, it might be more helpful to include
observations done by universities or consulting firms. This might be an option that is
already provided by ARC Hudro Desktop, but it is apparent that a better incentive should
be advertised to publish water quality data from other users. This could reduce the
paucity of observations by allowing the uploading and sharing of various water quality
data.
Although not assessed in this study, non-point and point sources could be
included to show how they influence water quality before, during, and after a fire event;
industries might be destroyed during a fire and could decrease the discharge of metals
into streams. Vegetation maps also could help to interpret the extent of the fire severity; if
less vegetation is seen, then this could be an indication of a destructive fire. Lastly, it is
recommended that air quality data should be analyzed to show how fire events affect the
transfer of pollutants from watersheds to air, and vise versa.
Conclusions
This project correlated wildfire events to water quality data in San Diego County.
From the limited dataset of copper and lead concentrations in a burned and unburned site,

18
it was determined that the 2007 fires increased metals concentrations in burned areas.
This was consistent with previous studies which showed that particle mobilization during
and after a fire event increases metals concentrations in watershed systems. In addition,
metals concentrations increased gradually overtime in the unburned area indicating that
air deposition allows the accumulation of metals into watershed systems. To further
investigate the effects of wildfires on water quality from watershed systems, it is
imperative to collect more fire burn and water quality data. The main limitation in this
project was the non-continuous water quality data; this limited the amount of water
quality parameters that could be correlated to the fire burn data. Overall, this project
showed that GIS tools are important to investigate how wildfires influence the
surrounding environment.
References
American Public Health Association (APHA). 1998. Standard Methods for the
Examination of Water and Wastewater. American Public Health Association, 20th
Edition, Washington, DC.
Burke M.P., Hogue T.S., Ferreira M., Mendez C.B., Navarro B.I., Lopez S. Jay J.A.
2010. “The Effect of Wildfire on Soil Mercury Concentrations in Southern
California Watersheds.” Water, Air, and Soil Pollution 212(1-4): 369-385.
Keeley, J.E., Safford, H., Fotheringham, C.J., Franklin J., Moritz M. 2009. “The 2007
Southern California Wildfires: Lessons in Complexity.” Journal of Forestry
107(6): 287-296.
Palen, L. 2008. “Online Social Media in Crisis Events.” Research in Brief: 76-78.
United States Environmental Protection Agency (USEPA). 2010. “Drinking water
contaminants.” Accessed 10 November 2010.
http://www.epa.gov/safewater/contaminants/index.html

19
Stronach N.R.H. and McNaughton S.J. 1989. Grassland fire dynamics in the Serengeti
ecosystem, and a potential method of retrospectively estimating fire energy.
Journal of Applied Ecology 26: 1025-1033.