Embed Size (px)
Citation preview
Eliza SzczEpańSka-RoSiak*, DaRiuSz HEim*
THE EffEcT of wall THicknESS anD winDow poSiTion on EfficiEnT DayligHT uTiliSaTion in
builDing inTERioRS
wpływ gRubości ściany i położEnia okna na wyDajnE wykoRzySTaniE świaTła DziEnnEgo
wE wnęTRzacH buDynkuA b s t r a c t
This paper presents a numerical analysis of the daylighting of exemplary office interiors. Simulation results were obtained using a radiance model. The following indexes: uDi, Df, Da, DSp were calculated and ana-lysed for different solutions of building façade. The construction differs in the total thickness of the wall. Two cases were considered: 25 cm and 50 cm opaque sections. additionally, window magnitude changes from 0.36 m2 to 1.44 m2, with different shapes and locations relative to the centre of the wall. The idea of the work was to find out the architectural solution of the transparent element (geometry and magnitude) taking into account two criteria: decreasing solar heat gains; increasing the daylight utilisation factor. The results are presented in the form of a diagram of daylight distribution as well as average values of visual comfort indexes. The highest values of each indicator (Df, Da and DSp) were obtained for a centrally placed win-dow 1.44 m2. However, the results of useful daylight index uDi depend on the assumed range and it is not easy to identify a relationship between window size and daylight efficiency.
Keywords: daylighting, façade, solar, efficiency, office
S t r e s z c z e n i e
w pracy przedstawiono analizę numeryczną dziennego naświetlenia wnętrza pomieszczenia biurowego. wy-niki uzyskano za pomocą modelu radiacyjnego. Dla różnych rozwiązań fasady budynku obliczono i analizo-wano następujące wskaźniki uDi, Df, Da, DSp. założone konstrukcje różnią się całkowitą grubością ściany. Rozważono dwa przypadki: 25 cm i 50 cm nieprzezroczystych przekrojów. wielkość okna zmienia się od 0.36 m2 do 1.44 m2. okno ma różne kształty i położenie względem środka ściany. ideą pracy było wskazanie rozwiązania architektonicznego elementu przezroczystego (wielkości i geometrii), przy przyjęciu dwóch kry-teriów: zmniejszenie słonecznego gromadzenia ciepła, zwiększenie czynnika wykorzystania nasłonecznienia dziennego. wyniki przedstawiono w formie rozkładów światła dziennego i średnich wartości wskaźników komfortu wizualnego. największe wartości wszystkich wskaźników (Df, Da and DSp) otrzymano w przy-padku centralnego położenia okna 1.44 m2. jednakże, wyniki dotyczące wskaźnika uDi zależą od założonego zakresu i nie łatwo jest wskazać zależność między rozmiarami okna i sprawnością światła dziennego.
Słowa kluczowe: oświetlenie dzienne, elewacja, słoneczność, sprawność, biuro
DOI: 10.4467/2353737XCT.15.141.4178* Department of Environmental Engineering, lodz university of Technology, poland.
332
1. Introduction
Daylight utilisation in the design of healthy buildings is a crucial point, not only with regard to indoor environment quality but also from an energy efficiency point of view. in selected types of non-residential buildings, e.g. offices, people spend a majority of time during the day. Therefore, it is necessary to provide high indoor comfort parameters including the lighting quality.
Daylight distribution and directionality of light determine the main parameters of visual comfort and comfort indexes. The main visual comfort indexes are based on two parameters: luminance and illuminance. Horizontal illuminance at work plane should be well adapted to the needs of the occupants e.g. the type of activity performed in the workplace. additionally, daylight illuminance inside the building is changeable and depends on external parameters like weather, time of day, season and urban development. Similarly, the amount of light inside the building strongly depends on architectural design, geometry, size of windows and surface properties (transmission and reflection characteristics).
nowadays, the starting point for daylight design is a collection simple guidelines – this initial guidance is imprecise and provides only an approximation. This approximation is based on the percentage of glazing, the ratio of glazed area to floor area or the maximum depth of the room that should not be exceeded. This is relatively easy but fails to be precise enough.
2. Visual comfort
The use of daylight for lighting building interiors is a prerequisite to ensure a comfortable and healthy working environment, Heim et al. (2007). Daylight colour temperature is recognized by the human eye as comfortable, because its spectrum is continuous; therefore, this kind of light is the healthiest for humans. lighting conditions have an impact on speed, accuracy and effort associated with activity, it has also a great influence on health, well-being and quality of life. Therefore, it is important to create a visually comfortable interior by providing suitable qualitative and quantitative characteristic of lighting. it should be emphasized that comfort depends on many parameters, it is also very subjective in nature.
according to [1, 6] ensuring an appropriate internal daylight environment providing visual comfort and visual effectiveness as well as security, is mainly associated with the following values: lighting intensity, luminance distribution, glare. providing an adequate level of illuminance with sufficient spatial distribution affects how quickly and easily visual tasks can be executed. insufficient lighting causes tiredness, sleepiness and worsening moods of workers and may additionally be the cause of accidents. The required illuminance average in the field of work and on the immediate surroundings of the workspace are given in standard En 12464-1 light and lighting, lighting jobs, part i, indoor work places. in most cases, the illuminance on the work area should be in the range of 20 lux (noticeable human traits) to 2000 lux. in the immediate surroundings of the workspace, the illuminance value might be slightly lower. another important parameter is the uniformity of illumination. for
333
continuous operations, it is assumed that the uniformity of illuminance on the work plane (ratio of the smallest measured illuminance on a given surface to the average illuminance on the plane) should be at least 0.7 and 0.5 on the immediate surroundings. a lack of uniformity of illumination causes ocular muscle fatigue, this is related to the need to adapt to changing light intensity.
moreover, certain visual comfort indexes exist which are useful in creation of an appropriate lighting environment. in the following paper, only few of these are consider. The most popular that represents the amount of illumination available indoors relative to the illumination present outdoors at the same time under overcast skies is called the daylight factor (Df). This is a metric used to quantify the amount of diffused daylight in a space. The mean daylight factor, according to literature CISBE, should be in the range of between 2% and 5%. This ensures a well lit space requiring little or no additional lighting during the daytime. Early versions of the uSgbc, lEED rating system originally required a Df ≥ 2 for at least 75% of the critical visual task zones [4].
new climatically and temporally sensitive metrics, categorized as dynamic daylight metrics, have been developed to cope with ever-increasing demands for daylight design. The most significant of these are daylight autonomy, useful daylight illuminance, and the daylight saturation percentage.
Daylight autonomy (Da) is represented as a percentage of annual daytime hours that a given point in a space is above a specified illumination level. its modification conceived by mardaljevic and nabil in 2005 is useful daylight illuminance (uDi). This metric bins hourly time values based upon three illumination ranges, 0-100 lux, 100-2000 lux (the so-called useful range), and over 2000 lux (unwanted due to potential glare or overheating). There is significant debate regarding the selection of 2000 lux as an upper limit of useful range; therefore, in 2006, the lighting and Daylighting committee for the collaborative for High performance Schools program developed the daylight saturation percentage (DSp). This is a modification of useful daylight illuminance that increases the lower limit to 150 lux and decreases the upper to 1500 lux.
3. Case study
in this paper, visual comfort, taking into account Df, Da, uDi, DSp indexes and the illuminance level for the combination of size and geometry of vertical windows was analysed. The calculated values include luminance distribution along a room, mean values and spatial distributions of all comfort indexes. The numerical calculation has been done using Daysim software program RaDiancE – the calculation methodology originating from the well-known ‘backward Ray Tracing method’, larson and Shakespeare (1998), taking into consideration the geometry, materials, time, date and sky conditions.
The building under study was located in central Europe climatic conditions (longitude, latitude, meridian 52.25n, 21.0E, –15.0 respectively). The external boundary condition was assumed as a typical meteorological year (Tmy). The test cell analysed here was 2.4 m high, 2.4 m wide and 6 m deep. The transparent part of the external wall was orientated to the west. The transparent element was defined in software as a glass pane with a thickness of 4 mm
334
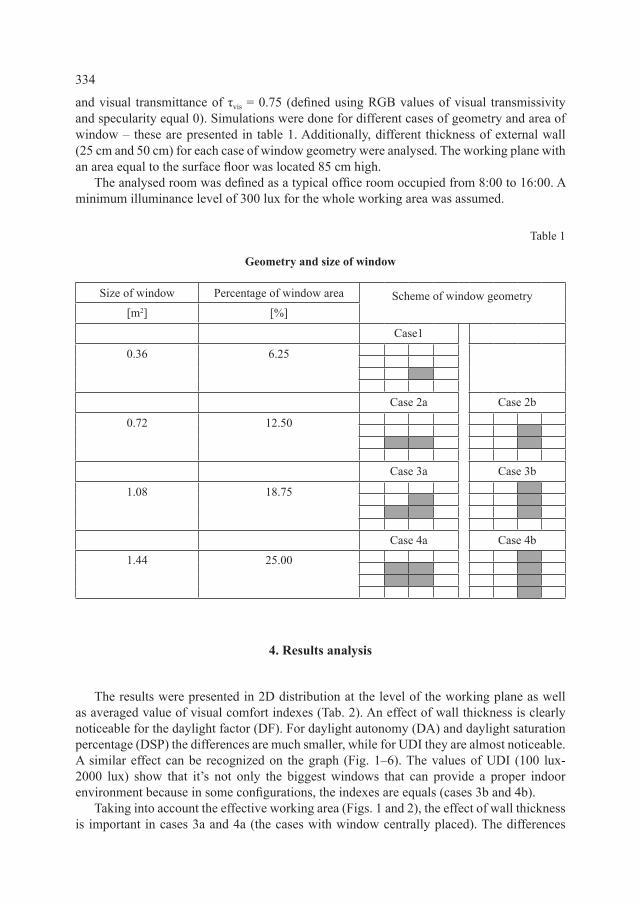
and visual transmittance of τvis = 0.75 (defined using Rgb values of visual transmissivity and specularity equal 0). Simulations were done for different cases of geometry and area of window – these are presented in table 1. additionally, different thickness of external wall (25 cm and 50 cm) for each case of window geometry were analysed. The working plane with an area equal to the surface floor was located 85 cm high.
The analysed room was defined as a typical office room occupied from 8:00 to 16:00. a minimum illuminance level of 300 lux for the whole working area was assumed.
Table 1
Geometry and size of window
Size of window Percentage of window area Scheme of window geometry[m2] [%]
Case1
0.36 6.25
case 2a case 2b
0.72 12.50
case 3a case 3b
1.08 18.75
case 4a case 4b
1.44 25.00
4. Results analysis
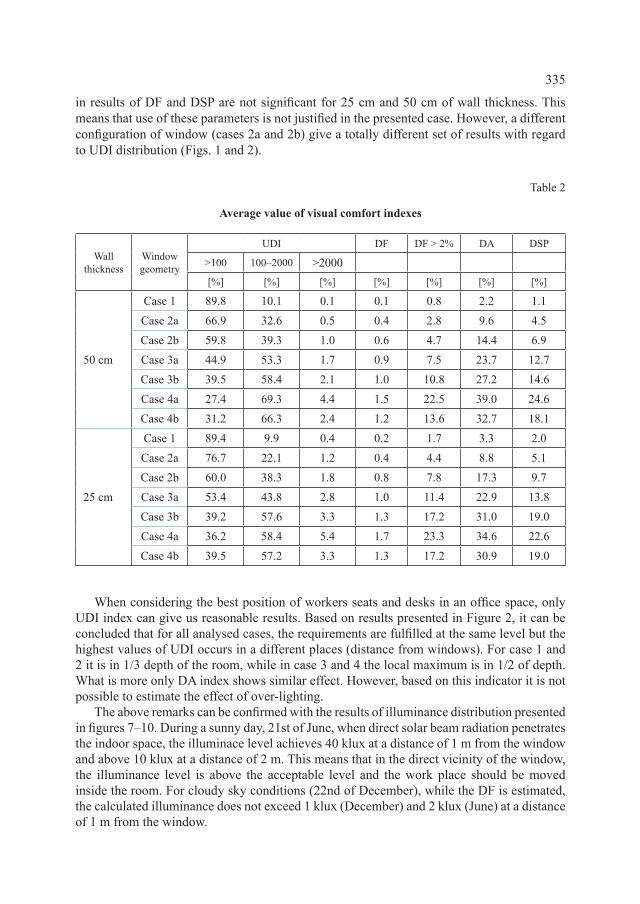
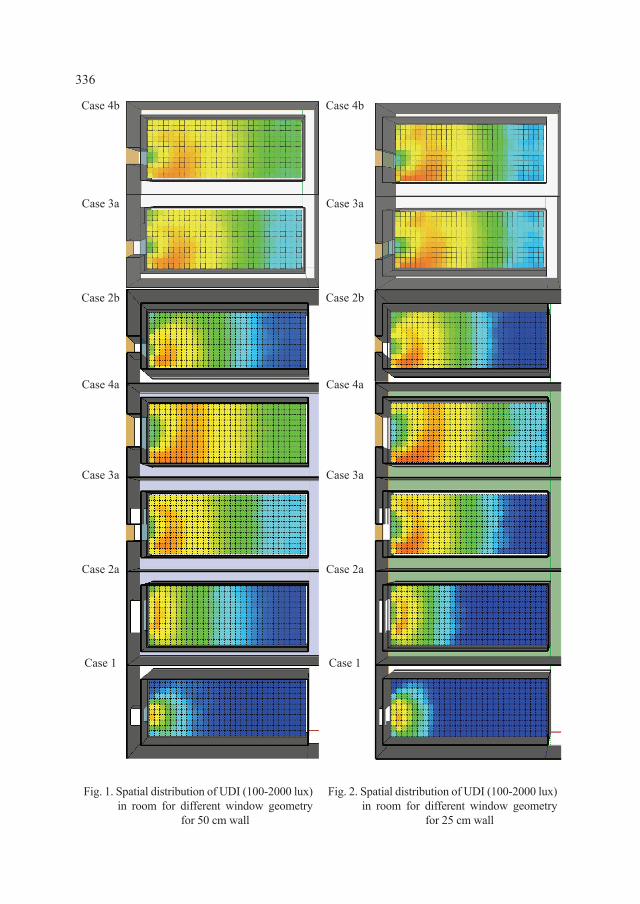
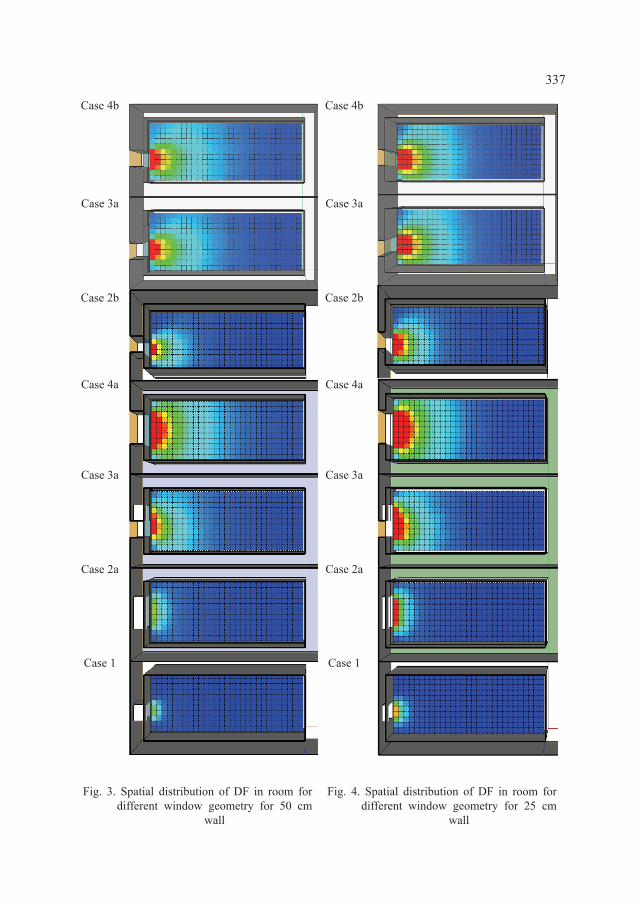
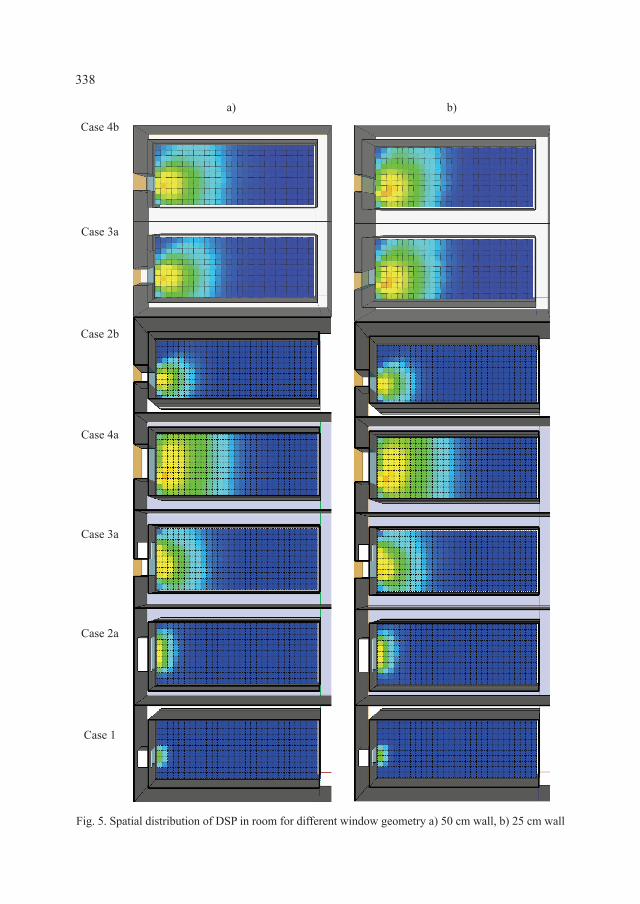
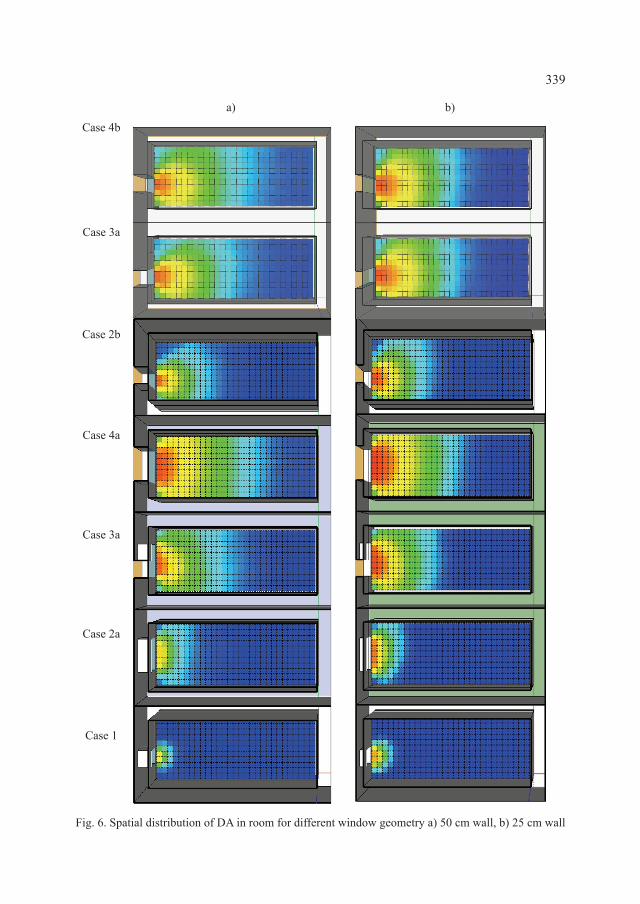
The results were presented in 2D distribution at the level of the working plane as well as averaged value of visual comfort indexes (Tab. 2). an effect of wall thickness is clearly noticeable for the daylight factor (Df). for daylight autonomy (Da) and daylight saturation percentage (DSp) the differences are much smaller, while for uDi they are almost noticeable. a similar effect can be recognized on the graph (fig. 1–6). The values of uDi (100 lux-2000 lux) show that it’s not only the biggest windows that can provide a proper indoor environment because in some configurations, the indexes are equals (cases 3b and 4b).
Taking into account the effective working area (figs. 1 and 2), the effect of wall thickness is important in cases 3a and 4a (the cases with window centrally placed). The differences
335
in results of Df and DSp are not significant for 25 cm and 50 cm of wall thickness. This means that use of these parameters is not justified in the presented case. However, a different configuration of window (cases 2a and 2b) give a totally different set of results with regard to uDi distribution (figs. 1 and 2).
Table 2
Average value of visual comfort indexes
wall thickness
window geometry
uDi Df Df > 2% DA DSP
>100 100–2000 >2000[%] [%] [%] [%] [%] [%] [%]
50 cm
Case 1 89.8 10.1 0.1 0.1 0.8 2.2 1.1case 2a 66.9 32.6 0.5 0.4 2.8 9.6 4.5case 2b 59.8 39.3 1.0 0.6 4.7 14.4 6.9case 3a 44.9 53.3 1.7 0.9 7.5 23.7 12.7case 3b 39.5 58.4 2.1 1.0 10.8 27.2 14.6case 4a 27.4 69.3 4.4 1.5 22.5 39.0 24.6case 4b 31.2 66.3 2.4 1.2 13.6 32.7 18.1
25 cm
Case 1 89.4 9.9 0.4 0.2 1.7 3.3 2.0case 2a 76.7 22.1 1.2 0.4 4.4 8.8 5.1case 2b 60.0 38.3 1.8 0.8 7.8 17.3 9.7case 3a 53.4 43.8 2.8 1.0 11.4 22.9 13.8case 3b 39.2 57.6 3.3 1.3 17.2 31.0 19.0case 4a 36.2 58.4 5.4 1.7 23.3 34.6 22.6case 4b 39.5 57.2 3.3 1.3 17.2 30.9 19.0
when considering the best position of workers seats and desks in an office space, only uDi index can give us reasonable results. based on results presented in figure 2, it can be concluded that for all analysed cases, the requirements are fulfilled at the same level but the highest values of uDi occurs in a different places (distance from windows). for case 1 and 2 it is in 1/3 depth of the room, while in case 3 and 4 the local maximum is in 1/2 of depth. what is more only Da index shows similar effect. However, based on this indicator it is not possible to estimate the effect of over-lighting.
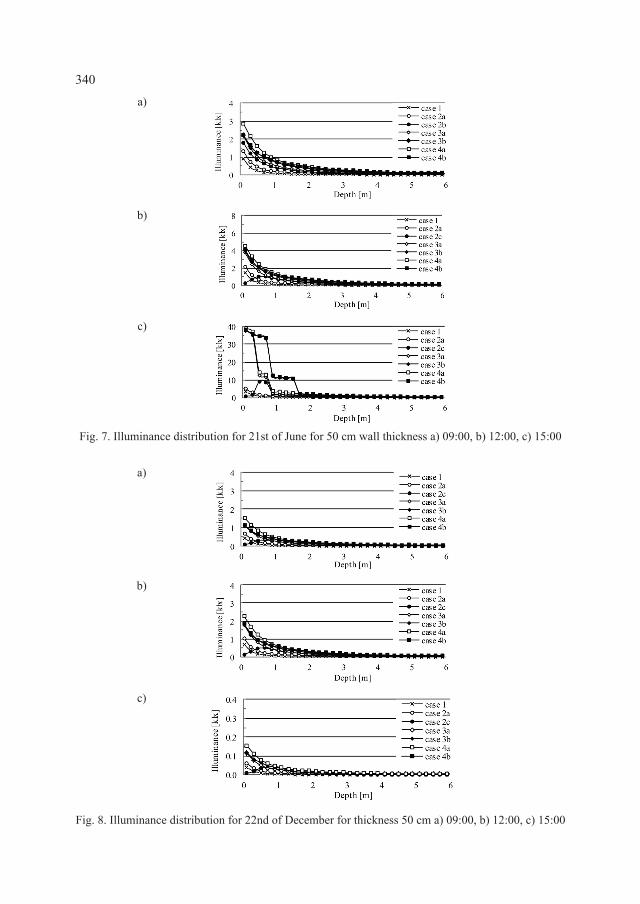
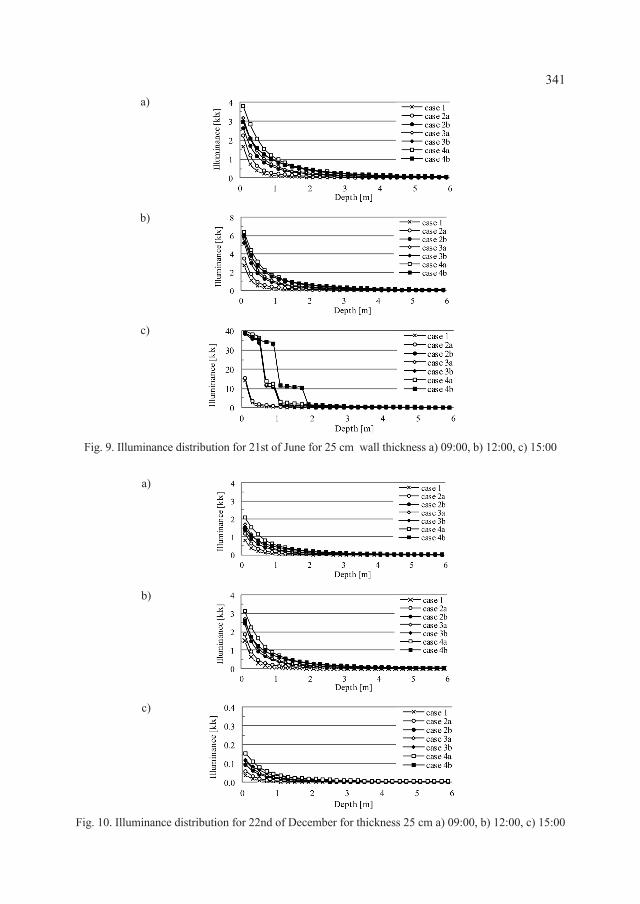
The above remarks can be confirmed with the results of illuminance distribution presented in figures 7–10. During a sunny day, 21st of june, when direct solar beam radiation penetrates the indoor space, the illuminace level achieves 40 klux at a distance of 1 m from the window and above 10 klux at a distance of 2 m. This means that in the direct vicinity of the window, the illuminance level is above the acceptable level and the work place should be moved inside the room. for cloudy sky conditions (22nd of December), while the Df is estimated, the calculated illuminance does not exceed 1 klux (December) and 2 klux (june) at a distance of 1 m from the window.
336
case 4b case 4b
case 3a case 3a
case 2b case 2b
case 4a case 4a
case 3a case 3a
case 2a case 2a
Case 1 Case 1
fig. 1. Spatial distribution of uDi (100-2000 lux) in room for different window geometry
for 50 cm wall
fig. 2. Spatial distribution of uDi (100-2000 lux) in room for different window geometry
for 25 cm wall
337
case 4b case 4b
case 3a case 3a
case 2b case 2b
case 4a case 4a
case 3a case 3a
case 2a case 2a
Case 1 Case 1
fig. 3. Spatial distribution of Df in room for different window geometry for 50 cm
wall
fig. 4. Spatial distribution of Df in room for different window geometry for 25 cm
wall
338
a) b)case 4b
case 3a
case 2b
case 4a
case 3a
case 2a
Case 1
fig. 5. Spatial distribution of DSp in room for different window geometry a) 50 cm wall, b) 25 cm wall
339
a) b)
case 4b
case 3a
case 2b
case 4a
case 3a
case 2a
Case 1
fig. 6. Spatial distribution of Da in room for different window geometry a) 50 cm wall, b) 25 cm wall
340a)
b)
c)
fig. 7. illuminance distribution for 21st of june for 50 cm wall thickness a) 09:00, b) 12:00, c) 15:00
a)
b)
c)
fig. 8. illuminance distribution for 22nd of December for thickness 50 cm a) 09:00, b) 12:00, c) 15:00
341a)
b)
c)
fig. 9. illuminance distribution for 21st of june for 25 cm wall thickness a) 09:00, b) 12:00, c) 15:00
a)
b)
c)
fig. 10. illuminance distribution for 22nd of December for thickness 25 cm a) 09:00, b) 12:00, c) 15:00
342
5. Conclusions
The main goal of the presented analysis was a comparison between different daylighting indexes and its effect on final decisions. The general remark concerns the choosing of the most useful indicator for daylight analysis in typical office space. considering the upper and lower limit of illuminance at the working plane, the most useful parameter is the uDi index for the required range of illuminance.
Taking into account the uDi index, it could be concluded that the effect of wall thickness is noticeable, while different configurations can give considerably different results.
The proper analysis of uDi can also be effective in the better positioning of workers desk in an office area. This means that for different window sizes and geometries, a different section of the floor area should be recommended as the best position to work.
This work was funded by The National Centre for Research and Development as part of the project entitled: ‘Promoting Sustainable Approaches Towards Energy Efficiency in Buildings as Tools Towards Climate Protection in German and Polish Cities: developing facade technology for zero-emission buildings’ (acronym: GPEE).
R e f e r e n c e s
[1] bąk j., pabjańczyk w., Podstawy techniki świetlnej, wydawnictwo politechniki łódzkiej, łódź 1994.
[2] Heim D., klemm p., narowski p., Szczepańska E., Komputerowa analiza oświetlenia dziennego i ocena parametrów komfortu wizualnego w pomieszczeniach, red. D. Heim, katedra fizyki budowli i materiałów budowlanych, politechnika łódzka, łódź. 2007.
[3] larson g.w., Shakespeare R., Rendering with radiance – the art and science of lighting visualization, morgan kaufman publishers inc., california, San francisco 1998.
[4] Reinhard c., Daylighting handbook I, Fundamentals and designing with the sun, 2014.
[5] The british Standards institution, bS 8206 part 2 cibSE.[6] Tragenza p., loe D., The design of lighting, 2nd edition, Routledge 2014.