Embed Size (px)
Citation preview

Desalination and Water Treatmentwww.deswater.com1944-3994 / 1944-3986 © 2011 Desalination Publications. All rights reserved.doi: 10.5004/dwt.2011.2377
31 (2011) 151–163 July
* Corresponding author.
Presented at EuroMed 2010 — Desalination for Clean Water and Energy: Cooperation among Mediterranean Countries of Europe and MENA Region, 3–7 October 2010, David Intercontinental Hotel, Tel Aviv, Israel. Organized by the European Desalination Society.
The effect of UV pre-treatment on biofouling of BWRO membranes: A field study
Tali Harifa*, Hila Elifantzb, Eli Margalita, Moshe Herzbergc, Tovit Lichia, Dror Minzd
aAtlantium Technologies Ltd. Beit Shemesh, 99100, IsraelTel. +972 (2) 9925001 ext. 229, +972 (54) 6490227; Fax +972 (2) 9925005; email: [email protected] of Plant and Environmental Sciences, The Institute of Life Sciences, The Hebrew University of Jerusalem, Givat Ram, Jerusalem, 91904 IsraelcBen Gurion University of the Negev, The Zuckerberg Institute for Water Research, Sede Boqer Campus, Midreshet Ben-Gurion, 84990 IsraeldInstitute for Soil, Water and Environmental Sciences ARO, Volcani Research Center P.O. Box 6, Beit Dagan, 50250 Israel
Received 2 August 2010; Accepted 24 March 2011
abstractThe use of biocides, particularly chlorine, in reverse osmosis (RO) desalination is widely practiced despite documented evidence that although biocides may be advantageous in controlling micro-bial counts in the water, in some cases they can actually exacerbate biofouling of the membranes. The adverse effects, associated with widespread biocide use, have spurred the need for finding alternative RO pre-treatment disinfection methods. Ultraviolet (UV) disinfection, and specifically medium pressure ultraviolet (MP-UV) disinfection has been considered a possible alternative and is now gaining recognition as a viable disinfection method applicable to RO desalination; however documentation on the effects of UV pre-treatment on RO membrane biofouling is scarce. This paper reports the findings from a four month field study conducted at a brackish water reverse osmosis (BWRO) desalination plant, treating groundwater, in the north of Israel, in which MP-UV was applied as a pre-treatment disinfection step prior to RO desalination. The plant contains two double stage desalination trains that operate in parallel — one train served as a reference, while in the other an Atlantium HOD™ MP-UV system was installed. Both trains were run in parallel, and for the duration of the study, all normalized performance parameters were collected and microbial counts monitored. At the end of the run previously replaced sacrificial membranes, situated in the front of the first stages, were autopsied and various biofilm analyses were conducted to elucidate cell/extracellular polymeric substances (EPS) content and microbial speciation. The overall results suggest that MP-UV pre-treatment prolonged the train performance, which manifested itself in a lower relative normalized permeate flux decline vs. the train which received water without MP-UV pre-treatment (11% vs. 17%, respectively). Significantly less EPS was found on the RO membrane which received MP-UV treated water. The differences in biofilm thickness and cell density counts (cells/cm2) between the two membranes were notable, in favor of UV pre-treatment, yet less signifi-cant. The MP-UV pre-treatment also had a substantial effect on biofilm community composition; the RO membrane that received MP-UV disinfected water exhibited a biofilm in which the diversity was reduced by 30% and more, and did not contain certain phylogenetic groups that were detected on the RO membrane that received water without MP-UV pre-treatment. It can be concluded that

152 T. Harif et al. / Desalination and Water Treatment 31 (2011) 151–163
pre-treatment disinfection using MP-UV may be a promising option for combating biofouling of RO membranes and prolonging operation of the trains between cleaning regimes.
Keywords: Ultraviolet; Reverse osmosis; Membranes; Biofouling; EPS; Flux
1. Introduction
1.1. Biofouling of RO membranes
Desalination has gained popularity as a technology for drinking water production, in an era where depletion of fresh water sources is on the global agenda. The advances in membrane technology which include development of membrane materials and membrane elements that are able to produce potable water cost effectively have made desalination a viable solution [1]. Nonetheless, reverse os-mosis (RO) desalination is prone to operational challenges which include fouling of the membrane elements. Among the types of fouling existing in RO desalination, biofoul-ing is a major topic of concern due to its crippling effect on operation of RO plants and the poor understanding of the mechanisms leading to its formation [2–4]. Para-doxically, the operational protocols implemented by RO plants to address mineral fouling, by using antiscalants, may actually exacerbate biofouling of the membranes [5]. The adverse effects biofouling causes include membrane flux decline, increased differential pressure and feed pres-sure, membrane biodegradation, increased salt passage, and decrease in boron rejection [3,4,6–9]. These lead to a decrease in module lifetime due to cleaning procedures and more frequent replacement costs, production loss, product quality loss, and increased energy costs.
RO plants that implement microbial monitoring would use viable microbial counts in the feed water as indicators of the biofouling potential of the water [10] although it has been hypothesized that only a few initial colonies on the membrane surface suffice to initiate a mature biofilm [9]. This highlights the complexity of biofouling mecha-nisms, as viable microbial counts in the feed water cannot indicate the susceptibility of RO desalination systems to undergo biofouling, and to what severity. Initial cell at-tachment and micro-colony formation occurs in two major stages — the first stage, transport and attachment, takes minutes to hours and is governed by physicochemical interactions deriving from operating conditions, water chemistry/quality, temperature, membrane properties and membrane module type. The second stage, takes days to weeks, depending on nutrient availability, hydrody-namic conditions and initially deposited cells [11,12]. The classical Derjaguin–Landau–Verwey–Overbeek (DLVO) theory has been applied to explain initial bacterial attach-ment onto the membrane surface, with attachment found to be most favorable on hydrophobic, non-polar surfaces [13]. However, the DLVO theory fails to support deposi-tion on hydrophilic surfaces, which are representative
of many RO membranes. It does not take into account permeation velocity influences and additional factors relevant to bacterial deposition, such as extracellular polymeric substances (EPS), excreted by bacteria, which are known to play a primary role in bacterial adhesion to surfaces [12,14]. Following initial attachment, EPS secretion is increased, enabling the formation of a robust polymeric matrix binding the bacteria to the surface and shielding them from exterior dangers such as shear forces and biocides. In effect, the EPS determines the immediate conditions of life of biofilm cells, enabling the sustainment of a highly organized micro-environment [15]. It has been suggested that the components of the biofilm layer, each induce permeate flux decline differently. The EPS matrix in which the cells are embedded increases hydraulic re-sistance to permeate flow while deposited bacterial cells, exhibiting a more porous structure, hinder back diffusion of salt from the membrane surface, a phenomenon termed “biofilm-enhanced osmotic pressure” [8,14,16]. Hence, a biofilm exhibiting less EPS should maintain a higher permeate flux.
1.2. Microbial communities in environmental biofilm
The microbial communities comprising biofilm have been determined in recent years in a variety of environ-ments. In the marine environment, bacteria affiliated with Alphaproteobacteria are the dominant bacterial group followed by Gammaproteobacteria and Bacteroidetes [17–20]. In freshwater biofilm the dominant group is Bacteroide-tes, followed by various members of the Proteobacteria [21,22]. Biofilm that formed on MBR membranes and on RO membranes in wastewater treatment facilities is composed of Bacteroidetes and various members of the Proteobacteria also, and their relative abundance is depended on the flux rate, duration time and membrane type [23,24]. The most dominant bacterial group in the biofilm formed on an RO membrane, treating fresh sur-face water, is affiliated with the Sphingomonas genus of the Alphaproteobacteria [25] while additional bacteria in that biofilm are affiliated with Beta- and Gammaproteobacteria, Bacteroidetes, Planctomycetes and Verrucomicrobia [26].
1.3. Biocide application in RO desalination plants
Combating biofilm formation in RO plants is based primarily upon oxidizing agents that are injected prior to the membrane modules. Biocidal efficacy is measured in terms of percentage kill where 99.9% is considered a guideline [10]. The most common biocides include chlo-
T. Harif et al. / Desalination and Water Treatment 31 (2011) 151–163 153
rine, chloramines, chlorine dioxide and ozone [27]. Being oxidizing agents, these must be scavenged prior to the RO membranes as the polyamide matrix that comprises the membrane is sensitive to oxidation, moreover, most thin-film composite spiral wound membranes are also sensitive to certain chlorinated by-products that may form in the treated water. Therefore, in practice, a re-sidual is not maintained in proximity to the membrane surface hence after-growth cannot really be inhibited at the membrane surface. The use of biocides, specifically chlorine, is controversial, from a process perspective, for various reasons, including 1) the formation of by-product carcinogenic compounds such as trihalomethanes and halo-acetic acids 2) the need to introduce reducing agents into the system, i.e. sodium bisulphite, that both serves as a nutrient and creates anaerobic conditions on the membrane surface ideal for supporting specific bacterial communities 3) the increase in assimilable organic carbon (AOC) that occurs due to oxidation of refractory organic substances rendering them biodegradable [10]. Despite the wide use of biocides, RO biofouling is common in operation of RO desalination plants as after-growth can easily occur while only a few bacteria that reach the membrane can initiate colonization and rapidly develop into micro-colonies, depending on nutrient availability and temperature [9,28].
1.4. Ultraviolet irradiation as a pre-treatment option to de-salination
The use of ultraviolet (UV) irradiation as a biocide in RO desalination processes has scarcely been documented. Although UV is mentioned as an alternative biocide that can be introduced in a pre-treatment scheme [27], it is still not implemented as a widespread anti-biofouling tech-nology most likely because it does not provide a residual effect. However, research has shown that UV irradiation has an adverse effect on bacterial recovery and after growth on RO membranes [29]. Other authors reported positive results when using UV prior to microfiltration (MF) membranes [30].
Exposure to UV results in damage to the nucleic acids of the microorganisms [31], which subsequently damages their ability to replicate. The use of MP-UV lamps, vs. traditional low pressure UV (LP-UV) lamps, has become in recent years more popular, due to the superior degree of photo-inactivation attainable for equivalent germicidal doses [32,33]. MP-UV lamps emit polychromatic light comprising UV-A (320-400 nm), UV-B (290–320 nm) and UV-C (190–290 nm) wavelength ranges, while the LP-UV lamps emit only a monochromatic light at 254 nm. It is thought that the additional wavelengths emitted affect other biological molecules, not only nucleic acids, hence leading to a greater inactivation impact [31,33,34] More-over, the sensitivity of microorganisms can be wavelength dependent and using monochromatic light, assuming
that microorganism spectral sensitivity peaks at 254 nm, may actually be erroneous [35]. The superiority of MP-UV lamps has also been proven in repressing repair mechanisms [33,36,37]. In certain circumstances repair mechanisms have been found to exist leading to reactiva-tion of the microorganisms. In general, it is thought that photo-reactivation utilizes the enzyme photolyase by us-ing the energy of near-UV light (310–480 nm) [38] while another reactivation mechanism occurs independent of a light source [33]. In essence, the ability of a microorgan-ism to undergo reactivation will depend on the amount of irradiation the microorganisms were exposed to and on the type of UV lamp used [36]. A successful design of a UV pre-treatment system, like any other biocide appli-cation design, must consider both dosage requirements and pre-treatment location.
This paper presents the results from a full scale field study in which the effect of MP-UV was evaluated as a viable technology for reducing biofilm formation in BWRO membranes. Both membrane performance and biofilm characteristics, including microbial community speciation, were analyzed to form an assessment of the application of MP-UV prior to RO desalination. To date, to the authors’ knowledge, this has never been conducted, hence the findings can be considered novel. Nonetheless, the authors are aware that the study is preliminary and further work is required to acquire a deeper understand-ing of this subject.
2. Materials and methods
2.1. The BWRO desalination pilot site
The site used for this study is a small scale brackish groundwater desalination plant that produces approxi-mately 90 m3/h desalinated water, situated in the north of Israel. The water quality is moderately saline with TDS values between 3000–4000 mg/l. Basic chemical param-eters of the water are summarized in Table 1.
The plant operates at constant feed pressure (varying permeate production) and contains two identical desali-nation trains in parallel — each train contains two stages. The first stage is comprised of seven pressure vessels, each housing six membranes and the second stage is comprised of two pressure vessels, each housing six membranes. The membrane elements installed are 8” FILMTEC RO membranes type BW30-400. Each train receives 65 m3/h (the plant consumes a total of 130 m3/h). Train 1 (RO1) produces approximately 46 m3/h and train 2 (RO2) pro-duces approximately 50 m3/h. The total recovery rate of the plant is approximately 70%. Table 2 summarizes the operating values of the two desalination trains.
The source brackish water undergoes pre-treatment that incorporates sand filtration following 5 mm cartridge filtration. An antiscalant is injected prior to the RO mem-

154 T. Harif et al. / Desalination and Water Treatment 31 (2011) 151–163
Table 1Chemical analysis of BWRO plant source water
Chemical parameter Concentration (mg/l)
Boron 0.428Calcium 184Magnesium 138Iron 0.8Manganese 0.04Potassium 41Sodium 757Silica 8.73Chlorides 1906Total dissolved solids 3740Total alkalinity 315Total organic carbon 0.7pH 7.88
Table 2Basic operating values of RO1 and RO2
Parameters RO1 RO2
Operating pressure, m (Atm) 195 (19) 215 (21)Permeate conductivity, ms/cm 150 200Permeate flow rate, m3/h 46 50 Minimal permeate flow rate, m3/h 42 40
Multimedia Filter
Micron Filter5 µm
F
F- PI F
Stage 2 Membranes
Stage 1 Membranes
S1-BPI S2-PPI S2-BPI
Drain
S1-PPI
F
Atlantium HODTM
UV MP system
Normally Open Pneumatic Valve
Normally Closed Pneumatic Valve
Diaphragm Proportional Valve
Normally Open Ball Valve
Normally Closed Ball Valve
Sampling Valve
Check Valve
Peristaltic Pump
I-42Indicator Transmitter Device
FFlow Meter
Pressure Gauge
Fig. 1. The layout of RO2, including the HOD MP-UV system. The light blue membrane represents the position of the sacrificial membrane in the train.
branes; biocides are not used in the daily operation of the plant.
2.1.1. Preparation of the BRWO plant for the study
Two new 8” RO membrane elements, FILMTEC type BW30-400, were replaced in the first desalination stage, one in each train — at the front of the central pressure vessel, in identical parallel locations. These membrane elements were intended to serve the biofilm analyses, thereby termed “sacrificial” and designated to be re-moved at the end of the run.
An Atlantium HODTM MP-UV system, type R-200 DL, was installed in RO2 prior to the high pressure pump, while RO1 served as a reference and received feed water without disinfection. Fig. 1 shows the layout of RO2. Various components were installed to enable manual
T. Harif et al. / Desalination and Water Treatment 31 (2011) 151–163 155
monitoring and calculation of the train normalized per-formance. Aseptic sampling valves were installed before and after the MP-UV system for microbial sampling of the feed water. RO1 exhibits a similar layout, excluding the MP-UV system and sampling valves.
To clean the RO trains prior to the run, two cleaning cycles were implemented (Table 3). The first comprised of a caustic wash, including chelating agents, the second consisted of a 24-h mild acidic soak (permeate was used-for the wash cycles).
Prior to the run, the trains were operated to wash the residual chemicals from the membrane surface.
2.1.2. Data acquisition and RO train performance analysis
The BWRO plant selected for this study was not fully automated, hence manual readings were conducted ap-proximately four times a week, to enable close monitoring of the trains performance. Table 4 summarizes all the data collected manually from both trains required for perfor-mance normalization. The normalization software used was FTNORM by DOW.
In addition, every two weeks, RO1 inlet, RO2 inlet and MP-UV system outlet water samples were taken for microbial count analysis to evaluate heterotrophic plate counts (HPC) and Pseudomonas spp. counts, and to moni-tor the MP-UV system’s performance integrity. The run was conducted over a period of four months (with no additional cleaning performed for its entire duration), at the end of which the sacrificial RO membrane elements were dismantled and autopsied.
Table 3Cleaning regimes and materials
Cleaning regime Materials pH
Basic EDTA, NaOH, detergent, sodium lauryl sulphate
12
Acidic Citric acid 2% 2
Table 4Data collected for performance normalization from RO1 and RO2
1st stage data collection 2nd stage data collection
Feed pressure Permeate flow rateFeed temperature Permeate pressureFeed conductivity/TDS Permeate conductivity/TDSPermeate flow rate Brine flow ratePermeate pressure Brine pressurePermeate conductivity/TDSBrine pressure (2nd stage feed pressure)
2.2. UV system operation and dose settings
To establish the applied dose of the MP-UV system (also referred to as fluence), biodosimetry tests on the source water were conducted using HPC and Pseudomo-nas spp. counts as microbial indicators of inactivation efficiency. UV exposure tests were performed according to the standard Collimated Beam Apparatus (CBA) test protocol, as described by [39]. The CBA was constructed by Atlantium Technologies and is shown in Fig. 2. The methodology is based on the Ultraviolet Disinfection Guidance Manual for the Final Long Term 2 Enhanced Surface Water Treatment Rule [40].
2.2.1. Preparation of microbial cultures for biodosimetry testing
Water samples were collected from the desalination plant, at the inlet to the RO trains, after pre-treatment fil-tration, in laboratory grade sampling bottles under aseptic conditions and stored on ice. Prior to the CBA procedure all samples were filtered through 0.45 mm nitrocellulose membranes (Millipore, EZ Pac, white gridded 0.45 mm, 47 mm), using a Pall Gellman 47 mm magnetic filter funnel (300 ml). Filters were washed with sterile saline solution (0.9% w/v NaCl) prior to the sample filtration. Following filtration of the samples, the filters were placed into Petri dishes containing Standard Methods agar or Cetrimide agar — for selection of HPC, and Pseudomonas spp. cultures respectively. The Petri dishes were incubated for 72 h at 30°C, for both selected cultures. Following incubation the colonies on each filter were counted and the microbial concentration was calculated as CFU/ml or CFU/100 ml (CFU-colony forming unit). Mixed cultures of the select “wild type” microorganisms were prepared by re-growing in LB broth (Neogen Corporation; Acumedia) (30°C, 72 h) and then re-suspending in phosphate buffer saline (PBS) (Na2HPO4 1.15 g; KH2PO4 0.2 g; KCl 0.2 g; NaCl 8 g; pH 7.4 in 1 L of RO water) solution.
2.2.2. Biodosimetry testing using the collimated beam apparatus
The CBA used for all biodosimetry testing at Atlan-tium was constructed according to the EPA guidelines [40] Fig. 2 shows the basic concept of a CBA unit.
The microbial indicators that were chosen for the CBA procedure were HPC and Pseudomonas spp. Aliquots of mixed cultures were placed in a Petri dish and exposed to UV light from an LP-UV lamp for pre-defined peri-ods of time. The LP-UV dose delivered to each aliquot was calculated as the product of the intensity of the incident UV light, the UV absorbance of the water, and the exposure time. The dose response curve of the tar-get microorganisms was constructed by measuring the microbial concentration after each LP-UV exposure, Nt, calculating the log inactivation of the microorganism

156 T. Harif et al. / Desalination and Water Treatment 31 (2011) 151–163
(log (Nt/No)), and plotting this value against the respec-tive dose.
The biodosimetry curves obtained from HPC bacteria and Pseudomonas spp. cultures isolated from the BWRO inlet water appear in Fig. 3. The point where the graph deviates from the log-linear relationship marked the minimum LP-UV dose that was applicable. In practice, a safety margin was applied and the MP-UV dose of the full-scale system was set at higher values than the mini-mum, at approximately 80 mJ/cm2.
2.2.3. Microbial concentration analysis
Water samples were collected from the desalination plant, at the inlet to the RO trains, and after the MP-UV system, in laboratory grade sampling bottles under aseptic conditions and stored on ice. All samples were filtered according to the procedure described in section 2.2.1. Following filtration of the samples, the filters were placed into Petri dishes containing Standard Methods agar, Cetrimide agar or Vinogradov agar — for selection of HPC, and Pseudomonas spp. or iron bacteria cultures respectively. The Petri dishes were incubated for 72 h at 30°C, for HPC and Pseudomonas spp. and for 5 days at 30°C for iron bacteria. Following incubation the colonies on each filter were counted and the microbial concentra-tion was calculated as CFU/ml or CFU/100 ml (CFU-colony forming unit).
2.3. Molecular analysis of microbial community composition
Three RO membrane coupons that were carefully cut from the center of each sacrificial membrane element were placed in separate 2 ml centrifuge tubes containing sterile glass beads and the DNA extraction was performed using the UltraClean soil DNA isolation kit (MoBio Labo-
Fig. 2. Collimated beam apparatus (USEPA, 2006).
ratories, Inc., CA). The 16S rRNA gene fragments were amplified with the DreamTaq kit (Fermentas, Burlington, Canada) and the general primers 11F [41] and 1392R [42]. The PCR products were resolved on 1% agarose gel and the samples with apparent band at the 1400bp were used for cloning. PCR products were directly cloned into the pCR2.1 TOPO TA cloning vector (Invitrogen, Inc, Carls-bad, CA) according to the manufacture instruction. Liga-tion products were sent to the Genome Sequencing Center at Washington University, St. Louis, MO, USA for further processing (transformation into E. coli, clones picking, and sequencing). A total of 148 and 172 sequences were obtained for the biofilm obtained with and without UV pre-treatment, respectively using the 907R primer [43] for the sequencing reaction.
2.3.1. Microbial community composition data analysis
A base calling analysis was performed on all sequences retrieved using BioEdit (http://www.mbio.ncsu.edu/BioEdit/bioedit.html). The sequences were aligned and affiliation was determined based on the closest phyloge-netic group using the Arb software [44]. A UniFrac analy-sis [45] of the 6 different libraries determined that there was no difference within each treatment and therefore the data was compiled into two datasets; community of biofilm formed in UV pre-treated water and non-treated water. Diversity indexes were calculated with Mothur [46] and the coverage for each library was calculated as follows: 1 – (n/N) where n is the number of singletons and N is the total number of clones per library.
2.4. Fluorescent in situ hybridization analysis
Fluorescent in situ hybridization (FISH) analysis was performed as described previously [47] using the follow-ing phylogenetic probes: Alf968 for Alphaproteobacteria [48], CF319a for Bacteroidetes [49], Bet42a combined with a competitive unlabeled probe Gam42a for Betaproteo-bacteria [50], Ntspa662 for Nitrospira (Daims et. al, 2001) Pla46 and Pla886 for Planctomycetes [51]. RO membranes sections were hybridized with the probes for 5 h at 46°C in 35% formamide, and then washed in wash buffer (20 mM Tris-HCl pH 7.2, 10 mM EDTA, 0.01% SDS, 80 mM NaCl) for 1 h at 48°C to remove residual probes. The samples were then counterstained with 0.5 ng/ml 4’,6’-diamidino-2-phenylindole (DAPI) and kept at –20°C until data collection. Confocal laser scanning microscopy (CLSM) was performed using the Leica SP5 (Leica, Microsystems CMS GmbH, Mannheim Germany) with 4 channels. A 405 diode, UV laser for the DAPI, Argon laser for the Alexa 488 or 6Fam labeled probes, 516 laser for the Cy3 labeled probes, and 633 laser for the Cy5 probes. Twenty fields of view were collected for each sample and the absolute number of cells per cm2 was calculated and averaged.

T. Harif et al. / Desalination and Water Treatment 31 (2011) 151–163 157
2.5. Cells and EPS biovolume by CLSM
RO membrane sections, cut from the center of the sac-rificial membrane elements, into pieces of approximately 5 mm × 5 mm, were fixed in 4% (w/v) para-formaldehyde (PFA) for 1 h and subsequently stored in 50% ethanol/PBS (v/v). Prior to microscopic observation the fouled mem-brane coupons were stained with concanavalin A (ConA) conjugated to Alexa fluor 633 and propidium iodide (PI) (Invitrogen Co.), for probing extracellular polymeric sub-stances (EPS) and microorganisms, respectively. Briefly, frozen (–20°C) 100 μl aliquots of 1 mg/ml labeled ConA stock solution were prepared and diluted to 100 μg/ml prior to use in 10 mM phosphate buffer (pH 7.5). An excess electrolyte solution was carefully drawn off from the fouled membrane by gently touching the edge of the specimens with an adsorbing paper (Kimwipes). Then, 100 μl of ConA staining solution were added to cover the samples, which were then incubated in the dark at room temperature for 20 min. Unbound ConA was drawn off the specimens using a three-step wash of 10 mM phosphate buffer. The unbound ConA solution and the washing solutions were carefully removed by gently touching the edge of the specimen with an adsorbing paper. Probing the microorganisms in the fouling layer was performed with 30 μM PI solution that was added to cover the samples, which were then incubated in the dark at room temperature for 20 min (prepared in 10 mM phosphate buffer, pH 7.5). Excess electrolyte solution was carefully drawn off from a piece of a fouled membrane in the same manner used for ConA staining.
Microscopic observation and image acquisition were performed using Zeiss-Meta 510, a confocal scanning laser microscope (CLSM), equipped with Zeiss dry objective LCI Plan-NeoFluar (10X magnification and numerical aperture of 0.3). The CLSM was equipped with detec-tors and filter sets for monitoring PI stained cells and the Alexa fluor 633 dye (excitation wavelengths of 488 and 633 nm, respectively). CLSM images were generated
using the Zeiss LSM Image Browser. Gray scale images were analyzed, and the specific biovolume (μm3/μm2) in the biofouling layer was determined by COMSTAT, an image-processing software [52], written as a script in Matlab 6.5 (The MathWorks) and equipped with an image processing toolbox. Thresholding was fixed for all image stacks. For every sample between 4–6 positions on the membrane were chosen and microscopically observed, acquired, and analyzed.
3. Results
3.1. Biodosimetry curves
The biodosimetry curves (Fig. 3) show the inactivation kinetics of microorganisms that represent communities typically found in water and also include known primary biofilm colonizers [53]; therefore, they are commonly used as indicators for sizing UV applications. Both graphs exhibit typical inactivation behavior [31]: a log-linear re-lationship, and then deviation from this relationship. The HPC inactivation kinetics depicts a “worst case scenario” in the UV resistance of a wide variety of microorganisms is examined. As previously mentioned, different microbi-al communities boast different resistance characteristics, thus the average resistance observed is higher and the tailing effect begins at 5 log inactivation corresponding to a LP-UV dose of 20 mJ/cm2. This effect is observed with Pesudomonas spp. at barely 10 mJ/cm2. Hence, the MP-UV dose applied throughout the study was maintained above 20 mJ/cm2, and included a safety margin that accounted for changes in UV water transmittance and reduction of lamp efficiency; primary factors that affect the effective UV dose. In practice, the applied MP-UV dose throughout the run was approximately 80 mJ/cm2.
3.2. Microbial counts
Microbial counts in the BWRO plant inlet water in
Fig. 3. The curves obtained from CBA biodosimetry tests performed on HPC (left) and Pseudomonas spp. (right) isolated from the BWRO plant inlet water.
0 20 40 60 80 100 120
0
1
2
3
4
5
6
Biodosimetry Curve of Heterotrophic Plate Count
Log
Inac
tivat
ion
UV Dose (mJ/cm2)0 5 10 15 20 25 30
0
1
2
3
4
5
6
Biodosimetry Curve of Pseudomonas spp.
Log
Inac
tivat
ion
UV Dose (mJ/cm2)

158 T. Harif et al. / Desalination and Water Treatment 31 (2011) 151–163
both trains and in the outlet of the MP-UV system were performed every two weeks to ensure the integrity of the MP-UV system and to provide an image of the microbial concentration of the MP-UV treated water entering RO2 vs. the un-treated water entering RO1, for the entire dura-tion of the run. These analyses consisted of HPC, Pseu-domonas spp. and iron bacteria. Results appear in Fig. 4.
The results show that for the duration of the run, the MP-UV system produced a microbial baseline in the water entering RO2, containing no more than a few hundred
14/08/09 27/08/09 10/09/09 08/11/09 22/11/09 03/12/0910
100
1000
10000
100000
1000000 aHeterotrophic Plate Count
RO1 inlet RO2 inlet UV (RO2) outlet
CFU/
ml
Date
14/08/09 27/08/09 10/09/09 08/11/09 22/11/09 03/12/09
10
100
1000
10000 bIron Bacteria Count
CFU/
100
ml
Date
RO1 inlet RO2 inlet UV (RO2) outlet
14/08/09 27/08/09 10/09/09 08/11/09 22/11/09 03/12/0910
100
1000
10000
100000 cPseudomonas spp. Count
CFU/
100 m
l
Date
RO1 inlet RO2 inlet UV (RO2) outlet
Fig. 4. Microbial counts in the BWRO plant inlet water to both trains, and after UV pre-treatment. a. HPC (CFU/ml); b. Iron bacteria (CFU/100ml); c. Pseudomonas spp. (CFU/100ml).
CFU/ml of HPC bacteria, no iron bacteria and hardly any Pseudomonas spp. — although at the inlet to the MP-UV system, the counts heavily fluctuated. These fluctuations are representative of the microbial quality of the water entering RO1, and we can assume that in the microbial load entering RO1 was higher in comparison to RO2 due to implementation of the MP-UV system.
3.3. RO train performance
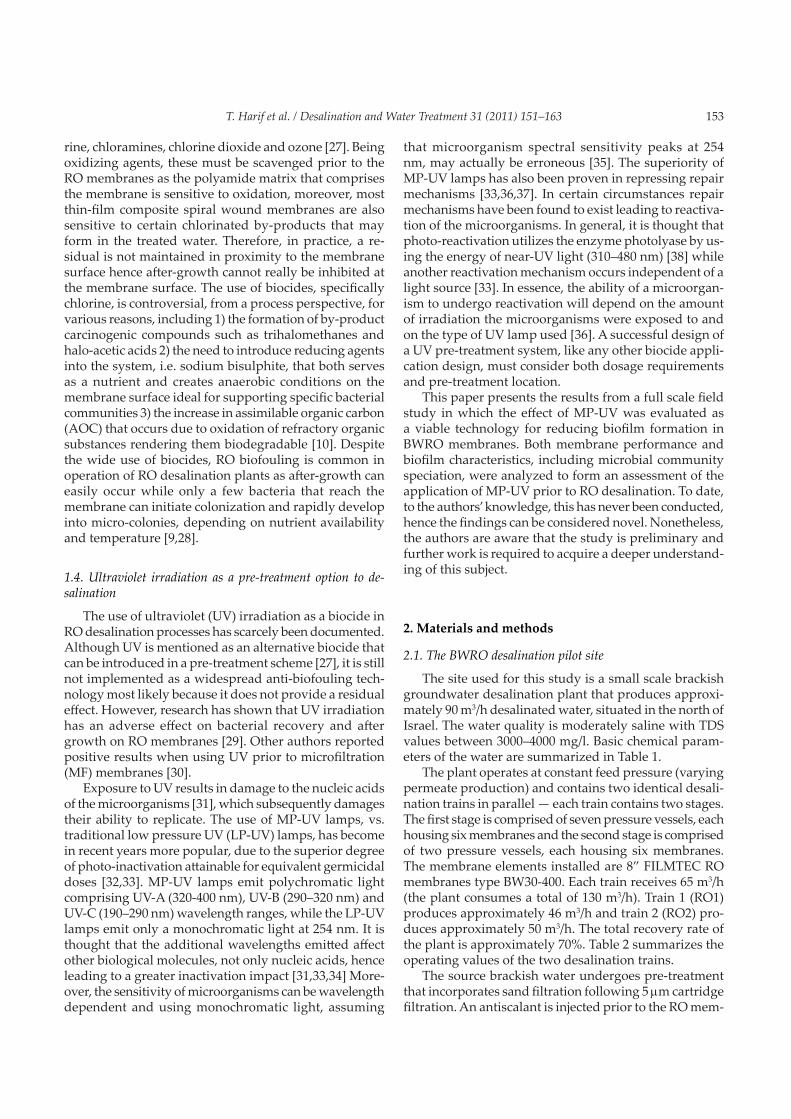
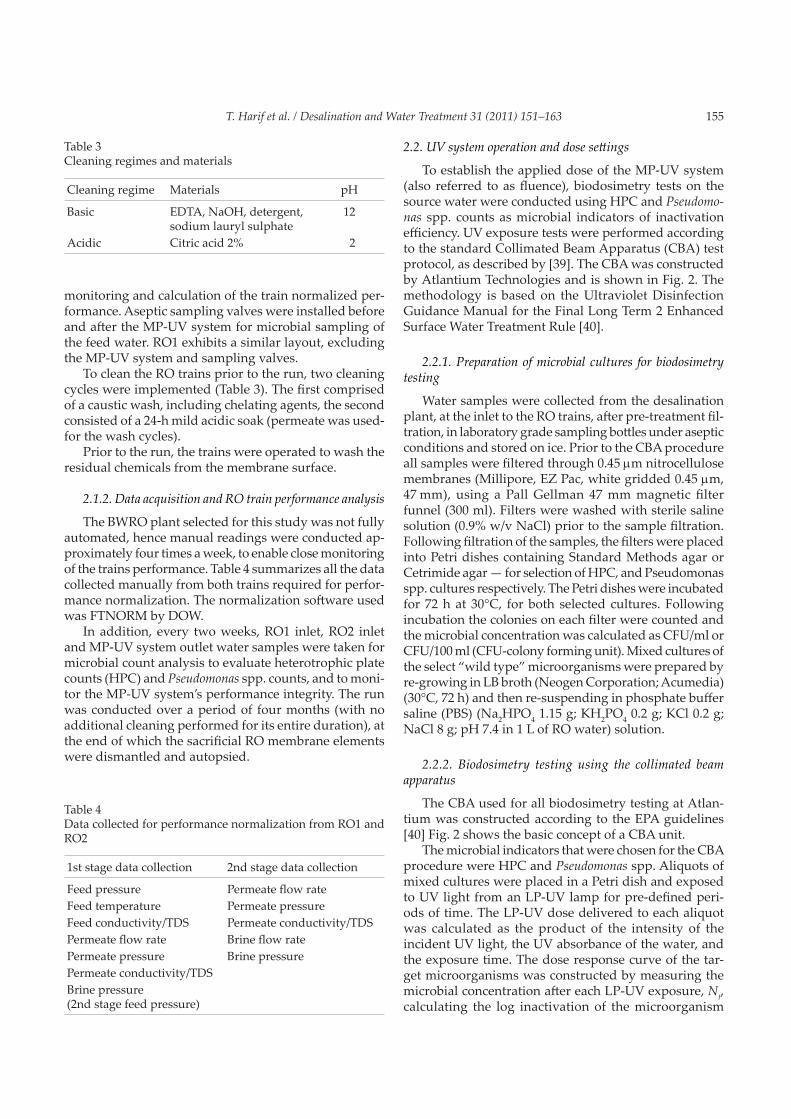
Biofouling phenomena is more prevalent in the first stage of an RO train, thus the normalized flux of stage 1 was calculated for RO1 and RO2 (Fig. 5). A normalized permeate relative flux was obtained by additionally normalizing the permeate flux according to the maxi-mum flux obtained in each train, following the recovery of the membranes after the cleaning procedure (Fig. 6). Membrane surface properties are highly susceptible to changes while exposed to various cleaning agents [11], and require a recovery period after cleaning, until they regain initial permeability. In this case the recovery pe-riod lasted 3 and 5 days for RO1 and RO2, respectively. Therefore, the graphs show an increase in normalized permeate flux during the initial days of the run, however, after reaching a maximum value at full recovery, start to exhibit a decline.
For the first six weeks of the run, both trains showed similar performance, however from this point, the nor-malized permeate flux decline became more significant in RO1. At the end of the run, a 6% difference existed between both trains, with RO1 at 83% of the initial nor-malized permeate flux, and RO2 at 89%.
3.4. Community composition of the biofilm
The microbial community composition and diversity was assessed using a culture-independent technique. The diversity of the community that formed the biofilm on RO membrane from MP-UV pre-treated water was significantly less diverse than that from the untreated water (Table 5). While some phylogenetic groups were completely absent from the biofilm formed in the MP-UV pre-treated water, there were a few groups present in both biofilm, but with varying relative abundance (Table 5). The alphaproteobacterial group Parvularcula was only a minor (4%) component of the community in the biofilm of the untreated water, but was the most dominant group (22%) in the biofilm formed after MP-UV application. Similarly, Betaproteobacteria and Chloroflexi were more dominant in the biofilm formed on RO membranes after MP-UV pre-treatment, but not in the biofilm formed from untreated water. Two phylogenetic groups seemed to be most affected by the MP-UV pre-treatment were affiliated with Nitrospirae and Bacteroidetes as their fraction in the community was reduced from 33 and 8% to 15 and less than 1%, respectively (Table 5).
T. Harif et al. / Desalination and Water Treatment 31 (2011) 151–163 159
Fig. 5. Normalized permeate flux of stage 1 with (RO2) and without (RO1) MP-UV pretreatment.
Fig. 6. Relative normalized permeate flux of stage 1 with (RO2) and without (RO1) MP-UV pre-treatment.
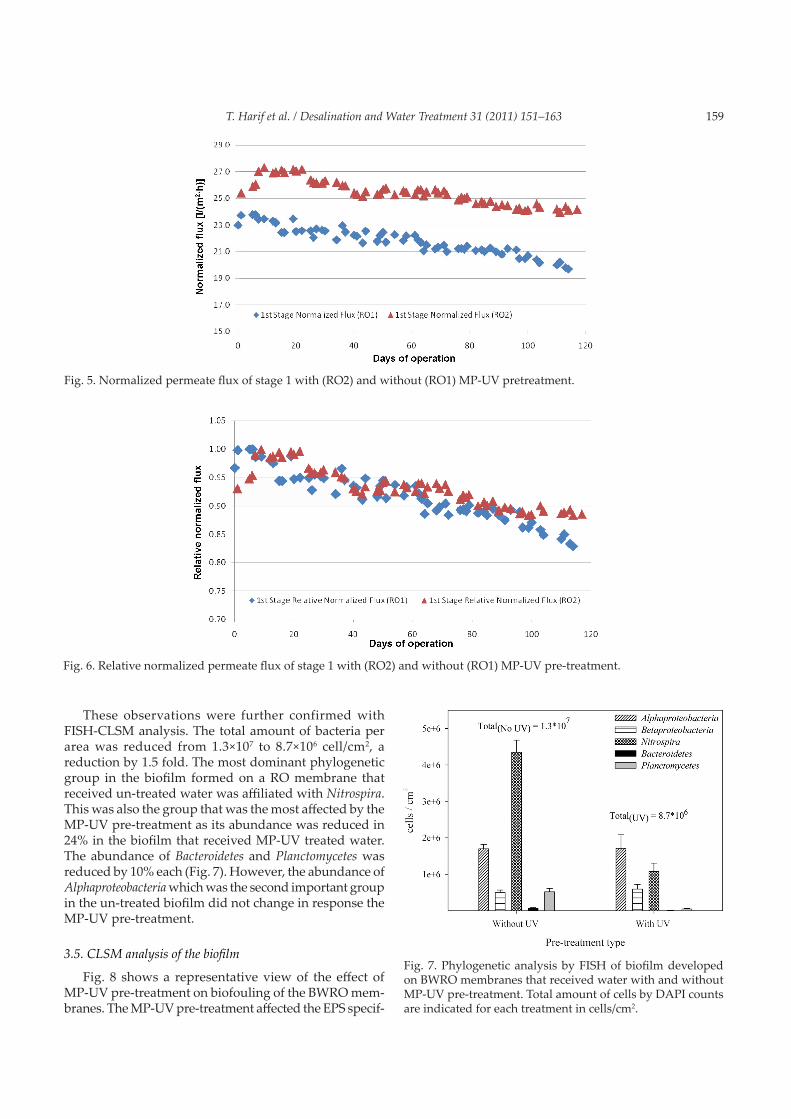
These observations were further confirmed with FISH-CLSM analysis. The total amount of bacteria per area was reduced from 1.3×10⁷ to 8.7×10⁶ cell/cm2, a reduction by 1.5 fold. The most dominant phylogenetic group in the biofilm formed on a RO membrane that received un-treated water was affiliated with Nitrospira. This was also the group that was the most affected by the MP-UV pre-treatment as its abundance was reduced in 24% in the biofilm that received MP-UV treated water. The abundance of Bacteroidetes and Planctomycetes was reduced by 10% each (Fig. 7). However, the abundance of Alphaproteobacteria which was the second important group in the un-treated biofilm did not change in response the MP-UV pre-treatment.
3.5. CLSM analysis of the biofilm
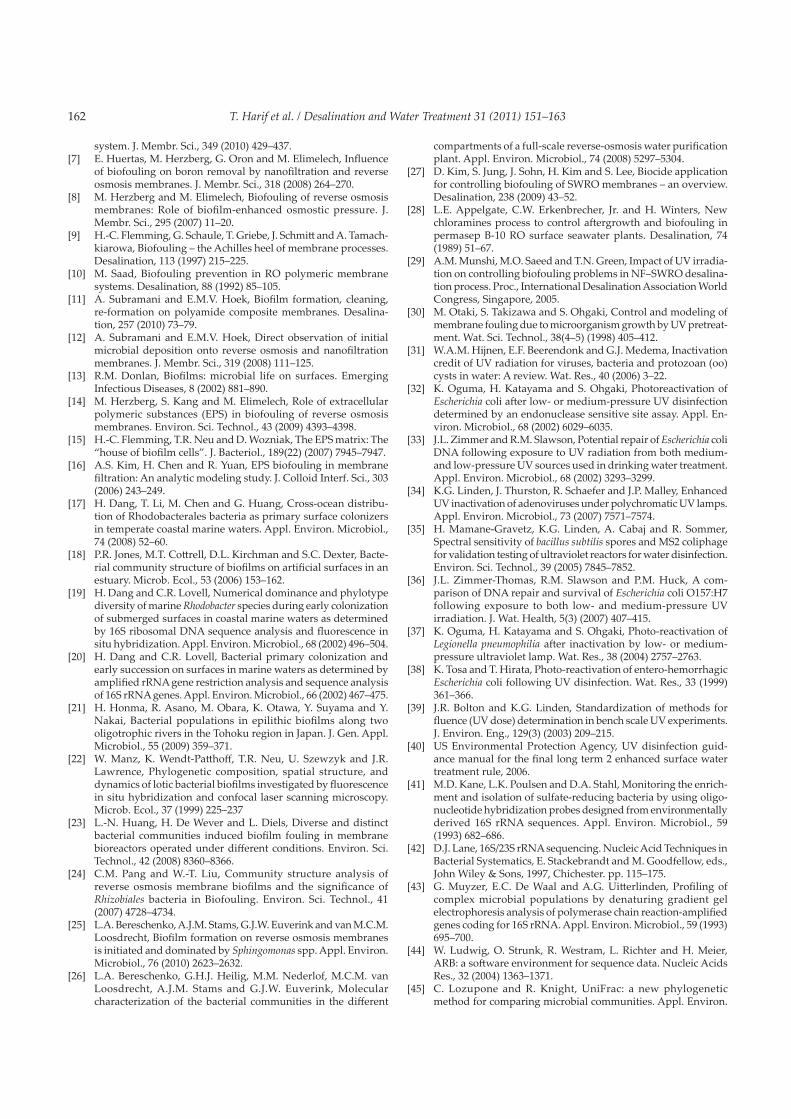
Fig. 8 shows a representative view of the effect of MP-UV pre-treatment on biofouling of the BWRO mem-branes. The MP-UV pre-treatment affected the EPS specif-
Fig. 7. Phylogenetic analysis by FISH of biofilm developed on BWRO membranes that received water with and without MP-UV pre-treatment. Total amount of cells by DAPI counts are indicated for each treatment in cells/cm2.

160 T. Harif et al. / Desalination and Water Treatment 31 (2011) 151–163
Fig. 8. (A) Biofouling layer without MP-UV pre-treatment (B) Biofouling layer with MP-UV pre-treatment. Total biomass of EPS (transparent light blue) and microorganisms (red) was analyzed using COMSTAT biofilm software (C). The images are perspectives of 900 μm × 900 μm after 3-D reconstruction of the CLSM image stack with IMARIS software.
Table 5Microbial community composition of biofilm formed on BWRO membrane that received water with and without MP-UV pre-treatment
Phylogenetic group Train
RO2 (UV) RO1 (No UV)
AlphaproteobacteriaSphingomonadaceae 4.73 1.16Parvularcula 22.97 4.07Other Alphaproteobacteria 14.86 11.63
Betaproteobacteria 16.22 5.23Gammaproteobacteria 2.03 3.49Deltaproteobacteria 2.03 3.49Nitrospirae 14.86 33.14Chloroflexi 12.16 1.74Bacteroidetes 0.68 7.56Verrucomicrobia 0.68 1.16Cyanobacteria 8.11 5.23Actinobacteria 0.68 2.91Planctomycetes 0 9.88Candidate division OP3 0 5.81Acidobacteria 0 0.58Fibrobacter 0 0.58Candidate division TM6 0 0.58Firmicutes 0 0.58Other bacteria 0 1.16OTU 42 86Shannon index 3.73 ± 0.21 4.45 ± 0.14Coverage 85% 62%
ic biovolume in the biofilm which was approximately half (120 mm3/mm2) of that found on the membrane that received water without MP-UV pre-treatment (230 mm3/mm2). Ad-ditionally, a minor difference in the cell specific biovolume was observed between the membranes, where a lower specific biovolume was observed on the membrane that received water with MP-UV pre-treatment. The CLSM analysis of the biofouling layer coincides with the normal-ized permeate flux decline in the trains with and without MP-UV pre-treatment. With MP-UV pre-treatment, sig-nificantly less biofilm growth, as well as a lower decline rate in membrane performance were observed.
4. Discussion
The results suggest that MP-UV pre-treatment heav-ily impacts the characteristics of biofilm that forms on RO membranes — in terms of specific biovolume, EPS content and microbial community composition. The biofilm analyzed by CLSM (Figs. 7 and 8) correlates to the normalized permeate flux behavior with and without MP-UV pre-treatment: significantly lower EPS specific biovolumes (Fig. 8) were found on the membrane from RO2 that received MP-UV pre-treated water, and also exhibited a lower normalized permeate flux decline (Fig. 5). Moreover, RO2 operated at a higher normalized permeate flux, rendering it more susceptible to fouling, and despite this, still maintained a higher normalized permeate flux over time.
Although the amount of EPS was found to be drasti-cally different between the membranes, the cell specific biovolumes were not found to differ substantially with marginally less cells found on the membrane that received MP-UV pre-treated water. However, total cell counts de-creased significantly on the membrane (t-test, p < 0.05). This can be explained by the inclusive mutagenic effect that MP-UV has on the bacteria in the feed solution [54,55] UV, as opposed to conventional biocides, does not oxidize the cell membrane, but damages the reproduction abili-ties of the bacteria, rendering them intact, but unable to reproduce [56–58]. MP-UV additionally has enhanced ability to target proteins and lipids and may promote cell injury to an extent that additional basic cellular functions become damaged [59]. In this case, deposition of inactivated bacteria can occur on the membrane sur-face, the most reasonable explanation for the relatively small difference in the cell specific biovolumes between the membranes (Fig. 7) and in comparison to the FISH enumeration.
The significantly less content of EPS in the biofilm on the membrane that received MP-UV pre-treated water, is most likely connected to the inability of the inactivated/damaged bacteria, to excrete normal amounts of EPS, which is produced at a later stage of the biofilm evolu-tion [60]. A number of studies have shown that mutants unable to synthesize EPS are unable to form biofilms,

T. Harif et al. / Desalination and Water Treatment 31 (2011) 151–163 161
although they may still attach to surfaces and form micro-colonies to a limited extent [61,62]. Biofilm forma-tion stages include microbial deposition and attachment and then, production and secretion of macromolecules that are responsible for creating a three dimensional mechanically stable visco-elastic structure. This structure has been shown to reduce significantly RO permeate flux by increasing hydraulic resistance of the RO membrane [14], hence the apparent effect of MP-UV pre-treatment on EPS production could indeed have ramifications in main-taining flux in RO filtration. Consequently, this would increase the interval between cleaning procedures and may even affect the type of cleaning regime implemented, diminishing the need for certain types of chemicals and thereby improving the membrane recovery properties and lifetime.
Another explanation for the reduction in EPS amounts could indeed be the change in the microbial community composition due to MP-UV treatment. Nitrospira was the most affected group by the UV pre-treatment. This chem-lithoautotrophic nitrite-oxidizing group [63] is common in various environments, including wastewater treatment facilities [64] and in water distribution systems [65]. It is possible that the MP-UV caused enough damage to the DNA of this bacteria with no capability of recovery and hence, their low abundance in the biofilm. Some nitrite-oxidizing bacteria are known to be sensitive to light [66] and it is possible that Nitrospira share this trait. Bacteria affiliated with Nitrospira were found to produce large amount of extracellular polymers [67], and therefore the reduction in their abundance in the biofilm also could explain the reduction in the EPS content. The fraction of Alpha-, Betaproteobacteria and Chloroflexi in the biofilm increased following the MP-UV pre-treatment. Isolates of Chloroflexi have the capabilities to form spores [68,69] that may protect them from UV damage while in the planktonic phase. These spores may germinate to become active bacteria in the biofilm. In contrast, marine isolates that affiliates with Parvularcula and Sphingomonadaceae do not have this ability [70–72] and they may have an alternative mechanism for protection. However, a dif-ferent MP-UV dose may be affective in eliminating these bacteria also from the biofilm, but laboratory experiments on appropriate model organisms should be performed to confirm this.
Although EPS may promote adherence to the RO membrane, the initial adhesion of the cells to the mem-branes is highly affected by adhesion forces dictated by the physical and chemical properties of the membrane and of the cells [6,8,12,73,74]. It has been hypothesized by the authors that MP-UV pre-treatment, due to its mutagenic effects, may also impact the attachment properties of the cells. For preliminary evaluation of this hypothesis, experiments have been conducted, the results of which suggest that bacterial deposition is significantly affected by MP-UV. The impact of MP-UV on the physico-
chemical surface characteristics of the model strain are to be further explored as well as the related physiological changes (changes in motility and other adhesion factors). Coupling these findings with further investigation into optimization of the operational parameters and location of the MP-UV system could offer a sustainable solution for combating biofouling in RO processes.
5. Concluding remarks
The results from this study show that pre-treatment using MP-UV substantially impacts the characteristics of biofilm formed on RO membranes; in terms of micro-bial community composition, specific biovolume and EPS content. The diminished EPS content found on the biofilm that formed following MP-UV pre-treatment has operational ramifications: EPS is not only the “cement” of the biofilm that facilitates adhesion to the membrane surface, but has been found to contribute significantly to the RO permeate flux decline by increasing the hydraulic resistance to permeate flow. Its reduction by adequate pre-treatment may actually reduce the need for certain cleaning regimes and consequently improve the mem-brane’s recovery properties and lifetime.
These preliminary results open avenues for further investigation into the abilities of MP-UV to target the biofouling potential of microorganisms on RO mem-branes, one of these is its ability to affect microorganism attachment properties. An understanding of the com-prehensive effect of MP-UV on the biofouling potential of microorganisms on commercial RO membranes could enable efficient tailoring of MP-UV as a viable technology for combating biofouling in RO plants.
Acknowledgements
The authors gratefully acknowledge Mr. Shaul Oren, who enabled this work at the desalination plant. This study was supported by the Israel Ministry of Industry Trade and Labor within the Magnet funding program.
References[1] L.F. Greenlee, D.F. Lawler, B.D. Freeman, B. Marrot and P. Mou-
lin, Reverse osmosis desalination: Water sources, technology and today’s challenges. Wat. Res., 43 (2009) 2317–2348.
[2] K.L. Chen, L. Song, S.L. Ong and J.N. Wun, The development of membrane fouling in full-scale RO processes. J. Membr. Sci., 232 (2004) 63–72.
[3] L.Y. Dudley and J.S. Baker, Biofouling in membrane systems – a review. Desalination, 118 (1998) 81–90.
[4] H.-C. Flemming, Reverse osmosis membrane biofouling. Ex-perim. Thermal Fluid Sci., 14 (1997) 382–391.
[5] J.S. Vrouwenvelder, S.A. Manolarakis, H.R. Veenendaal and D. van der Kooij, Biofouling of chemicals used for scale control in RO and NF membranes. Desalination, 132 (2000) 1–10.
[6] M.M.T. Khan, P.S. Stewart, D.J. Moll, W.E. Mickols, M.D. Burr, S.E. Nelson and A.K. Camper, Assessing biofouling on poly-amide reverse osmosis (RO) membrane surfaces in a laboratory
162 T. Harif et al. / Desalination and Water Treatment 31 (2011) 151–163
system. J. Membr. Sci., 349 (2010) 429–437.[7] E. Huertas, M. Herzberg, G. Oron and M. Elimelech, Influence
of biofouling on boron removal by nanofiltration and reverse osmosis membranes. J. Membr. Sci., 318 (2008) 264–270.
[8] M. Herzberg and M. Elimelech, Biofouling of reverse osmosis membranes: Role of biofilm-enhanced osmostic pressure. J. Membr. Sci., 295 (2007) 11–20.
[9] H.-C. Flemming, G. Schaule, T. Griebe, J. Schmitt and A. Tamach-kiarowa, Biofouling – the Achilles heel of membrane processes. Desalination, 113 (1997) 215–225.
[10] M. Saad, Biofouling prevention in RO polymeric membrane systems. Desalination, 88 (1992) 85–105.
[11] A. Subramani and E.M.V. Hoek, Biofilm formation, cleaning, re-formation on polyamide composite membranes. Desalina-tion, 257 (2010) 73–79.
[12] A. Subramani and E.M.V. Hoek, Direct observation of initial microbial deposition onto reverse osmosis and nanofiltration membranes. J. Membr. Sci., 319 (2008) 111–125.
[13] R.M. Donlan, Biofilms: microbial life on surfaces. Emerging Infectious Diseases, 8 (2002) 881–890.
[14] M. Herzberg, S. Kang and M. Elimelech, Role of extracellular polymeric substances (EPS) in biofouling of reverse osmosis membranes. Environ. Sci. Technol., 43 (2009) 4393–4398.
[15] H.-C. Flemming, T.R. Neu and D. Wozniak, The EPS matrix: The “house of biofilm cells”. J. Bacteriol., 189(22) (2007) 7945–7947.
[16] A.S. Kim, H. Chen and R. Yuan, EPS biofouling in membrane filtration: An analytic modeling study. J. Colloid Interf. Sci., 303 (2006) 243–249.
[17] H. Dang, T. Li, M. Chen and G. Huang, Cross-ocean distribu-tion of Rhodobacterales bacteria as primary surface colonizers in temperate coastal marine waters. Appl. Environ. Microbiol., 74 (2008) 52–60.
[18] P.R. Jones, M.T. Cottrell, D.L. Kirchman and S.C. Dexter, Bacte-rial community structure of biofilms on artificial surfaces in an estuary. Microb. Ecol., 53 (2006) 153–162.
[19] H. Dang and C.R. Lovell, Numerical dominance and phylotype diversity of marine Rhodobacter species during early colonization of submerged surfaces in coastal marine waters as determined by 16S ribosomal DNA sequence analysis and fluorescence in situ hybridization. Appl. Environ. Microbiol., 68 (2002) 496–504.
[20] H. Dang and C.R. Lovell, Bacterial primary colonization and early succession on surfaces in marine waters as determined by amplified rRNA gene restriction analysis and sequence analysis of 16S rRNA genes. Appl. Environ. Microbiol., 66 (2002) 467–475.
[21] H. Honma, R. Asano, M. Obara, K. Otawa, Y. Suyama and Y. Nakai, Bacterial populations in epilithic biofilms along two oligotrophic rivers in the Tohoku region in Japan. J. Gen. Appl. Microbiol., 55 (2009) 359–371.
[22] W. Manz, K. Wendt-Patthoff, T.R. Neu, U. Szewzyk and J.R. Lawrence, Phylogenetic composition, spatial structure, and dynamics of lotic bacterial biofilms investigated by fluorescence in situ hybridization and confocal laser scanning microscopy. Microb. Ecol., 37 (1999) 225–237
[23] L.-N. Huang, H. De Wever and L. Diels, Diverse and distinct bacterial communities induced biofilm fouling in membrane bioreactors operated under different conditions. Environ. Sci. Technol., 42 (2008) 8360–8366.
[24] C.M. Pang and W.-T. Liu, Community structure analysis of reverse osmosis membrane biofilms and the significance of Rhizobiales bacteria in Biofouling. Environ. Sci. Technol., 41 (2007) 4728–4734.
[25] L.A. Bereschenko, A.J.M. Stams, G.J.W. Euverink and van M.C.M. Loosdrecht, Biofilm formation on reverse osmosis membranes is initiated and dominated by Sphingomonas spp. Appl. Environ. Microbiol., 76 (2010) 2623–2632.
[26] L.A. Bereschenko, G.H.J. Heilig, M.M. Nederlof, M.C.M. van Loosdrecht, A.J.M. Stams and G.J.W. Euverink, Molecular characterization of the bacterial communities in the different
compartments of a full-scale reverse-osmosis water purification plant. Appl. Environ. Microbiol., 74 (2008) 5297–5304.
[27] D. Kim, S. Jung, J. Sohn, H. Kim and S. Lee, Biocide application for controlling biofouling of SWRO membranes – an overview. Desalination, 238 (2009) 43–52.
[28] L.E. Appelgate, C.W. Erkenbrecher, Jr. and H. Winters, New chloramines process to control aftergrowth and biofouling in permasep B-10 RO surface seawater plants. Desalination, 74 (1989) 51–67.
[29] A.M. Munshi, M.O. Saeed and T.N. Green, Impact of UV irradia-tion on controlling biofouling problems in NF–SWRO desalina-tion process. Proc., International Desalination Association World Congress, Singapore, 2005.
[30] M. Otaki, S. Takizawa and S. Ohgaki, Control and modeling of membrane fouling due to microorganism growth by UV pretreat-ment. Wat. Sci. Technol., 38(4–5) (1998) 405–412.
[31] W.A.M. Hijnen, E.F. Beerendonk and G.J. Medema, Inactivation credit of UV radiation for viruses, bacteria and protozoan (oo)cysts in water: A review. Wat. Res., 40 (2006) 3–22.
[32] K. Oguma, H. Katayama and S. Ohgaki, Photoreactivation of Escherichia coli after low- or medium-pressure UV disinfection determined by an endonuclease sensitive site assay. Appl. En-viron. Microbiol., 68 (2002) 6029–6035.
[33] J.L. Zimmer and R.M. Slawson, Potential repair of Escherichia coli DNA following exposure to UV radiation from both medium- and low-pressure UV sources used in drinking water treatment. Appl. Environ. Microbiol., 68 (2002) 3293–3299.
[34] K.G. Linden, J. Thurston, R. Schaefer and J.P. Malley, Enhanced UV inactivation of adenoviruses under polychromatic UV lamps. Appl. Environ. Microbiol., 73 (2007) 7571–7574.
[35] H. Mamane-Gravetz, K.G. Linden, A. Cabaj and R. Sommer, Spectral sensitivity of bacillus subtilis spores and MS2 coliphage for validation testing of ultraviolet reactors for water disinfection. Environ. Sci. Technol., 39 (2005) 7845–7852.
[36] J.L. Zimmer-Thomas, R.M. Slawson and P.M. Huck, A com-parison of DNA repair and survival of Escherichia coli O157:H7 following exposure to both low- and medium-pressure UV irradiation. J. Wat. Health, 5(3) (2007) 407–415.
[37] K. Oguma, H. Katayama and S. Ohgaki, Photo-reactivation of Legionella pneumophilia after inactivation by low- or medium-pressure ultraviolet lamp. Wat. Res., 38 (2004) 2757–2763.
[38] K. Tosa and T. Hirata, Photo-reactivation of entero-hemorrhagic Escherichia coli following UV disinfection. Wat. Res., 33 (1999) 361–366.
[39] J.R. Bolton and K.G. Linden, Standardization of methods for fluence (UV dose) determination in bench scale UV experiments. J. Environ. Eng., 129(3) (2003) 209–215.
[40] US Environmental Protection Agency, UV disinfection guid-ance manual for the final long term 2 enhanced surface water treatment rule, 2006.
[41] M.D. Kane, L.K. Poulsen and D.A. Stahl, Monitoring the enrich-ment and isolation of sulfate-reducing bacteria by using oligo-nucleotide hybridization probes designed from environmentally derived 16S rRNA sequences. Appl. Environ. Microbiol., 59 (1993) 682–686.
[42] D.J. Lane, 16S/23S rRNA sequencing. Nucleic Acid Techniques in Bacterial Systematics, E. Stackebrandt and M. Goodfellow, eds., John Wiley & Sons, 1997, Chichester. pp. 115–175.
[43] G. Muyzer, E.C. De Waal and A.G. Uitterlinden, Profiling of complex microbial populations by denaturing gradient gel electrophoresis analysis of polymerase chain reaction-amplified genes coding for 16S rRNA. Appl. Environ. Microbiol., 59 (1993) 695–700.
[44] W. Ludwig, O. Strunk, R. Westram, L. Richter and H. Meier, ARB: a software environment for sequence data. Nucleic Acids Res., 32 (2004) 1363–1371.
[45] C. Lozupone and R. Knight, UniFrac: a new phylogenetic method for comparing microbial communities. Appl. Environ.

T. Harif et al. / Desalination and Water Treatment 31 (2011) 151–163 163
Microbiol., 71 (2005) 8228–8235.[46] P.D. Schloss, S.L. Westcott, T. Ryabin, J.R. Hall, M. Hartmann,
E.B. Hollister, R.A. Lesniewski, B.B. Oakley, D.H. Parks, C.J. Robinson, J.W. Sahl, B. Stres, G.G. Thallinger, D.J. Van Horn and C.F. Weber, Introducing mothur: open-source, platform-independent, community-supported software for describing and comparing microbial communities. Appl. Environ. Microbiol., 75 (2009) 7537–7541.
[47] W. Manz, R. Amann, W. Ludwig, M. Wagner and K.H. Schleifer, Phylogenetic oligodeoxynucleotide probes for the major sub-classes of Proteobacteria — Problems and solutions. Syst. Appl. Microbiol., 15 (1992) 593–600.
[48] F.O. Glöckner, B.M. Fuchs and R. Amann, Bacterioplankton compositions of lakes and oceans: a first comparison based on fluorescence in situ hybridization. Appl. Environ. Microbiol., 65 (1999) 3721–3726.
[49] W. Manz, R. Amann, W. Ludwig, M. Vancanneyt and K.H. Schleifer, Application of a suite of 16S rRNA-specific oligonucle-otide probes designed to investigate bacteria of the phylum Cytophaga–Flavobacter–Bacteroides in the natural environment. Microbiol., 142 (1996) 1097–1106.
[50] H. Daims, J.L. Nielsen, P.H. Nielsen, K.H. Schleifer and M. Wag-ner, In situ characterization of Nitrospira-like nitrite-oxidizing bacteria active in wastewater treatment plants. Appl. Environ. Microbiol., 67 (2001) 5273–5284.
[51] A. Neef, R. Amann, H. Schlesner and K.-H. Schleifer. Monitoring a widespread bacterial group: in situ detection of planctomy-cetes with 16S rRNA-targeted probes. Microbiol., 144 (1998) 3257–3266.
[52] A. Heydorn, A.T. Nielsen, M. Hentzer, C. Sternberg, M. Givskov, B.K. Ersboll and S. Molin, Quantification of biofilm structures by the novel computer program COMSTAT, Microbiol.– UK, 146 (2000) 2395–2407.
[53] N. Doğruöz, D. Göskay, E. Ilhan-Sungur and A. Cotuk, Pioneer colonizer microorganisms in biofilm formation on galvanized steel in a simulated recirculating cooling water system. J. Basic Microbiol., 49(S1) (2009) S5–S12.
[54] W. Zhou, X. Tang, H. Xiao, Y. Wang and R. Wang, Response of marine microalgae, heterotrophic bacteria and their relation-ship to enhanced UV-B radiation. J. Ocean Univ. China, 8(1) (2009) 35–38.
[55] V.F. Zenoff, F. Siñeriz and M.E. Farías, Diverse responses to UV-B radiation and repair mechanisms of bacteria isolated from high altitude aquatic environments. Appl. Environ. Microbiol., 72(12) (2006) 7857–7863.
[56] G.P. Pfeifer, Formation and processing of UV photoproducts: Ef-fects of DNA sequence and chromatin environment. Photochem. Photobiol., 65 (1997) 270–283.
[57] J.K. Setlow, The Effects of Ultraviolet Radiation and Photoreacti-vation. Comprehensive Biochemistry, Chap. 5, 27 (1997) 157–209.
[58] A.M. Rauth, The physical state of viral nucleic acid and the sensi-tivity of viruses to ultraviolet light. Biophys. J., 5 (1965) 257–273.
[59] P. Mondon and M.M. Shahin, Comparative studies on the lethal, mutagenic, and recombinogenic effects of ultraviolet –A, –B, –C and visible light with and without 8-Methoxypsoralen in Sac-charomyces cerevisiae. Photochem. Photobiol., 55(5) (1992) 713–721.
[60] M. Herzberg and M. Elimelech, Physiology and genetic traits of reverse osmosis biofilms: a case study with pseusomonas aeruginosa. Intern. Soc. Microb. Ecol., 2 (2008) 180–194.
[61] P.I. Watnick and R. Kolter, Steps in the development of a Vibrio cholera El Tor biofilm. Molec. Microbiol., 34 (1999) 586–595.
[62] D.G. Allison and I.W. Sutherland, Role of exopolysaccharides in adhesion of freshwater bacteria. J. Genet. Microbiol., 133 (1987) 1319–1327.
[63] F. Maixner, D.R. Noguera, B. Anneser, K. Stoecker, G. Wegl, M. Wagner and H. Daims, Nitrite concentration influences the population structure of Nitrospira-like bacteria. Environ. Micro-biol., 8 (2006) 1487–1495.
[64] H. Daims, J.L. Nielsen, P.H. Nielsen, K.-H. Schleifer and M. Wag-ner, In situ characterization of Nitrospira-like nitrite-oxidizing bacteria active in wastewater treatment plants. Appl. Environ. Microbiol., 67 (2001) 5273–5284.
[65] A.C. Martiny, H.-J. Albrechtsen, E. Arvin and S. Molin, Iden-tification of bacteria in biofilm and bulk water samples from a nonchlorinated model drinking water distribution system: detection of a large nitrite-oxidizing population associated with Nitrospira spp. Appl. Environ. Microbiol., 71 (2005) 8611–8617.
[66] E. Bock and M. Wagner, Oxidation of inorganic nitrogen com-pounds as an energy source. In The Prokaryotes: Ecophysiology and Biochemistry, M. Dworkin, S. Falkow, E. Rosenberg, K-H. Schleifer and E. Stackebrandt, eds., Springer, vol. 2, 2007, p. 463.
[67] S. Ehrich, D. Behrens, E. Lebedeva, W. Ludwig and E. Bock, A new obligately chemolithoautotrophic, nitrite-oxidizing bac-terium, Nitrospira moscoviensis sp. nov. and its phylogenetic relationship. Arch. Microbiol., 164 (1995) 16–23.
[68] S. Yabe, Y. Aiba, Y. Sakai, M. Hazaka and A. Yokota, A life cycle of branched aerial mycelium- and multiple budding spore-forming bacterium Thermosporothrix hazakensis belonging to the phylum Chloroflexi. J. Gen. Appl. Microbiol., 56 (2010) 137–141.
[69] M.B. Stott, M.A. Crowe, B.W. Mountain, A.V. Smirnova, S. Hou, M. Alam and P.F. Dunfield, Isolation of novel bacteria, including a candidate division, from geothermal soils in New Zealand. Environl. Microbiol., 10 (2008) 2030–2041.
[70] C. Chen, Q. Zheng, Y.-N. Wang, X.-J. Yan, L.-K., Hao, X. Du and N.-Z. Jiao, Stakelama pacifica gen. nov., sp. nov., a novel member of the family Sphingomonadaceae isolated from the Pacific Ocean. Intern. J. Syst. Evolut. Microbiol., 2010; doi 10.1099/ijs.0.018945-0.
[71] A.B. Arun, W.-M. Chen, W-A. Lai, J.-H. Chou, P.D. Rekha, F.-T. Shen, S. Singh and C.-C. Young, Parvularcula lutaonensis sp. nov., a moderately thermotolerant marine bacterium isolated from a coastal hot spring. Intern. J. Syst. Evolut. Microbiol., 59 (2009) 998–1001.
[72] J.-C. Cho and S.J. Giovannoni, Parvularcula bermudensis gen. nov., sp. nov., a marine bacterium that forms a deep branch in the a-Proteobacteria. Intern. J. System. Evolut. Microbio., 53 (2003) 1031–1036.
[73] W. Lee, C.-H. Ahn, S. Hong, S. Lee, Y. Baek and J. Yoon, Evalua-tion of surface properties of reverse osmosis membranes on the initial biofouling stages under no filtration conditions. J. Membr. Sci., 351 (2010) 112–122.
[74] S. Kang, E.M.V. Hoek, H. Choi and H. Shin, Effect of membrane surface properties during the fast evaluation of cell attachment. Separ. Sci. Technol., 41 (2006) 1475–1487.